MOLECULAR ECOLOGY Molecular Ecology (2012) 21, 3610-3624 dot: 10.1111/j.l365-294X.2012.05621.x Reconstruction of caribou evolutionary history in Western North America and its implications for conservation BYRON V. WECKWORTH,^ MARCO MUSIANI,^ ALLAN D. McDEVITT,M MARK HLBBLLWHITLJ and STEEANO MARIANIt§ ^Faculty of Environmental Design, University of Calgary, Calgary, Alberta, Canada T2N 1N4, f School of Biology and Environmental Science, University College Dublin, Belfield, Dublin 4, Ireland, ~f.Wildlife Biology Program, Department of Ecosystem and Conservation Sciences, College of Forestry and Conservation, University of Montana, M T 59812, USA, §School of Environment and Eife Sciences, University of Salford, Salford MS 4WF, UK Abstract The role of Beringia as a refugium and route for trans-continental exchange of fauna during glacial cycles of the past 2 million years are well documented; less apparent is its contribution as a significant reservoir of genetic diversity. Using mitochondrial DNA sequences and 14 microsatellite loci, we investigate the phylogeographic history of caribou (Rangifer tarandus) in western North America. Patterns of genetic diversity reveal two distinct groups of caribou. Caribou classified as a Northern group, of Beringian origin, exhibited greater number and variability in mtDNA haplotypes compared to a Southern group originating from refugia south of glacial ice. Results indicate that subspecies R. t. granti of Alaska and R. t. groenlandicus of northern Canada do not constitute distinguishable units at mtDNA or microsatellites, belying their current status as separate subspecies. Additionally, the Northern Mountain ecotype of woodland caribou (presently R. t. caribou) has closer kinship to caribou classified as granti or groenlandicus. Comparisons of mtDNA and microsatellite data suggest that behavioural and ecological specialization is a more recently derived life history characteristic. Notably, microsatellite differentiation among Southern herds is significantly greater, most likely as a result of human-induced landscape fragmentation and genetic drift due to smaller population sizes. These results not only provide important insight into the evolutionary history of northern species such as caribou, but also are important indicators for managers evaluating conservation measures for this threatened species. Keywords: ecotypes, endangered species, genetic markers, phylogeography, Rangifer tarandus, subspecies Received 14 December 2011; revision received 7 March 2012; accepted 28 March 2012 Introduction The biogeographical histories of North American biota are intertwined with late Quaternary climate change. Glaciation was particularly pervasive at high latitudes during the last glacial maximum (LGM, '^21 bp , Glark & Mix 2002; Dyke et al. 2002) covering northern North America. However, glacial refugia have been proposed Correspondence: Byron Weckworth, Fax: 403 284 4399; E-mail: [email protected] based on biogeographical and fossil evidence, particu larly in Beringia, the ice-free refugium stretching from eastern Siberia to the Northwest Territories of Ganada (Abbott & Brochmann 2003). Eollowing deglaciation, recolonization likely occurred from several refugia, including Beringia, unglaciated regions of the Ganadian high arctic (Waltari & Gook 2005) and south of the ice sheets (Runck & Gook 2005; Weckworth et al. 2010). Post glacial expansion dynamics are suggested as an important basis for the geographic distribution of con temporary genomes (Avise 2000; Hewitt 2000; Lessa >2012 Blackwell Publishing Ltd

Welcome message from author
This document is posted to help you gain knowledge. Please leave a comment to let me know what you think about it! Share it to your friends and learn new things together.
Transcript

MOLECULAR ECOLOGYM olecular Ecology (2012) 21, 3610-3624 dot: 10.1111/j.l365-294X.2012.05621.x
Reconstruction of caribou evolutionary history in Western North America and its implications for conservationBYRON V. W EC K W O R TH ,^ M A RCO M U SIA N I,^ A LLA N D. M cD E V IT T ,M M ARK H LB B LLW H ITLJ and STEEA N O M A R IA N It§^Faculty of Environmental Design, University of Calgary, Calgary, Alberta, Canada T2N 1N4, f School of Biology and Environmental Science, University College Dublin, Belfield, Dublin 4, Ireland, ~f.Wildlife Biology Program, Department of Ecosystem and Conservation Sciences, College of Forestry and Conservation, University of Montana, M T 59812, USA, §School of Environment and Eife Sciences, University of Salford, Salford MS 4WF, UK
Abstract
The role of Beringia as a refugium and route for trans-continental exchange of fauna during glacial cycles of the past 2 million years are well documented; less apparent is its contribution as a significant reservoir of genetic diversity. Using mitochondrial DNA sequences and 14 microsatellite loci, we investigate the phylogeographic history of caribou (Rangifer tarandus) in western North America. Patterns of genetic diversity reveal two distinct groups of caribou. Caribou classified as a Northern group, of Beringian origin, exhibited greater number and variability in mtDNA haplotypes compared to a Southern group originating from refugia south of glacial ice. Results indicate that subspecies R. t. granti of Alaska and R. t. groenlandicus of northern Canada do not constitute distinguishable units at mtDNA or microsatellites, belying their current status as separate subspecies. Additionally, the Northern Mountain ecotype of woodland caribou (presently R. t. caribou) has closer kinship to caribou classified as granti or groenlandicus. Comparisons of mtDNA and microsatellite data suggest that behavioural and ecological specialization is a more recently derived life history characteristic.Notably, microsatellite differentiation among Southern herds is significantly greater, most likely as a result of human-induced landscape fragmentation and genetic drift due to smaller population sizes. These results not only provide important insight into the evolutionary history of northern species such as caribou, but also are important indicators for managers evaluating conservation measures for this threatened species.
Keywords: ecotypes, endangered species, genetic markers, phylogeography, Rangifer tarandus, subspecies
Received 14 December 2011; revision received 7 March 2012; accepted 28 March 2012
Introduction
The biogeographical histories of North American biota are intertwined with late Quaternary climate change. Glaciation was particularly pervasive at high latitudes during the last glacial maximum (LGM, '^21 b p , Glark & Mix 2002; Dyke et al. 2002) covering northern North America. However, glacial refugia have been proposed
Correspondence: Byron W eckworth, Fax: 403 284 4399;E-mail: byweck@ gmail.com
based on biogeographical and fossil evidence, particularly in Beringia, the ice-free refugium stretching from eastern Siberia to the Northwest Territories of Ganada (Abbott & Brochmann 2003). Eollowing deglaciation, recolonization likely occurred from several refugia, including Beringia, unglaciated regions of the Ganadian high arctic (Waltari & Gook 2005) and south of the ice sheets (Runck & Gook 2005; Weckworth et al. 2010). Post glacial expansion dynamics are suggested as an important basis for the geographic distribution of contemporary genomes (Avise 2000; Hewitt 2000; Lessa
>2012 Blackwell Publishing Ltd

C A R IB O U GE N E T IC S IN WEST ERN N O R T H A M E R IC A 3611
et al. 2003). Therefore, understanding the relationship between climate changes and phylogeography is necessary to describe intra- and inter-species diversity, current population genetic structure and the potential for local adaptation (Dynesius & Jansson 2000).
The caribou (Rangifer tarandus-, known as reindeer in Eurasia) is a circumpolar New World ungulate (family Cervidae), with the oldest fossils found in eastern Beringia (Eort Selkirk, Yukon) and dated to 1.6 Ma (Harington1999), implying a Beringian origin of the genus. In a statistically rigorous review of Rangifer taxonomy in North America (Banfield 1961) results from morphological analysis indicated two distinct groups, tundra and forest caribou, with three extant subspecies in western North America (Eig. 1). The tundra form is represented by the Alaskan caribou (Rangifer tarandus granti) and the Canadian barren-ground caribou (R, t. groenlandicus), and the forest form includes the remaining North American woodland caribou (R. t. caribou). Genetic evaluations have generally supported the ice age isolation and significant divergence of the tundra subspecies, R. t. granti and R. t. groenlandicus from the woodland R. t. caribou (Elagstad & Roed 2003). McDevitt et al. (2009) confirmed tundra versus woodland split, but also demonstrated
historic interbreeding of the two clades along the eastern front of the Canadian Rockies. However, the pattern of expansion into deglaciated regions and the phylogenetic backdrop of contemporary populations remain uncertain.
In western Canada, federal classification of woodland caribou further divides them into three ecotypes based upon geography and life history characteristics rather than morphology or genetics (Eig. 1; COSEWIC 2002). The federal listing of these ecotypes by COSEWIC and the Species at Risk Act (SARA) identify the Southern Mountain and Boreal as threatened and the Northern Mountain as a population of concern (COSEWIC 2002). Many provinces have also listed woodland caribou ecotypes and have specific mandates for their recovery. However, provincial ecotype designations do not necessarily match, in name or criteria, those described federally or in neighbouring provinces. Little to no genetic analysis has been carried out to support ecotype designations of western caribou populations (McDevitt et al. 2009).
Ecotypes are defined as populations within a species that have evolved particular life history and behavioural adaptations in response to specific environmental
I I R. t. granti
I I R. t. groenlandicus
I I R. t. caribou
BorealI' *' *1 Northern Mountain
:~'J Southern Mountain Historic Extent
Banff2. Coiumbia North3. Jasper4. A La Peche5. Little Smoky
14. Caribou Mountain15. South Nahanni le .A tiin *^3- 17. Retdstone
6. Retdrock-Prairie G reek/18. Tay River Narraway/Re(d W illow 19. Biuenose East
7. Quintette/Kenne(dy/ 20. Bathurst Moberiy/Scott/Parsnip 21. Forty-m iie/Macomb
8. Coi(d Lake 22. Neichina9. Slave Lake 23. Denali10. East Si(de Athabasca 24. W hite Mountain11. W est Si(de Athabasca 25. Gaiena/W oif Mountain12. Re(d Earth 26. W estern Arctic13. Chinchaga 27. Teshekpuk
Fig. 1 M ap show ing sam pling design. Black num bered circles indicate sam ple locations. The grey-scale polygons show a generalized d istribution for each subspecies; dark grey represents the barren-ground subspecies {Rangifer tarandus groenlandicus), m edium -grey indicates A laska subspecies {R. t. granti) and light-grey show s the w oodland subspecies {R. t. caribou). The three different federally designated ecotypes of w oodland caribou are indicated w ith patterned polygons as indicated.
© 2012 Blackwell Publishing Ltd

3612 B. V. W E C K W O R T H E T AL .
constraints (Courtois et al. 2003). This definition does not associate concordant genealogical relationships, yet abrupt transitions from one habitat type to another have been implicated as a mechanism of genetic divergence in otherwise continuously distributed species (e.g. Munoz-Fuentes et al. 2009; Weckworth et al. 2011). In caribou, Courtois et al. (2003) found genetic concordance of eastern Canadian mountain, boreal and barren-ground ecotypes. An understanding of the genetic dynamics of ecotypes has implications for species of conservation concern to aid in recognizing appropriate legal status and range management (Courtois et al. 2003).
The threatened status of most woodland caribou reflects a general decline in their numbers since the early 20th century (Bergerud 1974). The reasons for their decline are attributed to the fragmentation and alteration of their primary habitat and ecosystem function through human land-use activities, including natural resource extraction (Bergerud 1974; James & Stuart-Smith 2000). Their threatened conservation status has resulted in much ecological research aimed at improving recovery planning (McLoughlin et al. 2003; Weclaw & Hudson 2004; Whittington et al. 2011). While ecological information is important for identifying how and why caribou populations are in decline on a contemporary scale, molecular data are essential for elucidating evolutionary history, cryptic population structure, genetic parameters and conservation units important for long-term survival.
Here, we employ mtDNA sequencing and microsatellite genotyping to provide a large-scale assessment of genetic variability of caribou in western North America. We synthesize, using the largest caribou molecular data set to date, a comprehensive molecular perspective on the evolutionary relationships of caribou in western North America. We test the null hypotheses that a priori subspecies and ecotypes currently accepted reflect evolutionary patterns of genetic diversity in caribou. We then explore alternative hypotheses, a posteriori, that reconstruct the evolutionary history of caribou as presented by mtDNA and microsatellites. These results have the potential for far-reaching impacts on current caribou management policy. Furthermore, we provide insight into the post glacial patterns of expansion from ice age refugia that laid the foundation for current patterns of biodiversity at northern latitudes.
Methods
Sam pling
Archived samples of blood, muscle, skin or hair were obtained for 854 individual caribou from capture and
hunting activities across western North America over the past decade (Table 1; Fig. 1). Of the 854, 223 were from individuals previously analysed in McDevitt et al. (2009). Furthermore, we added 34 barren-ground and woodland caribou sequences from GenBank to augment the geographic distribution of our sampling (Supporting Information). Sequences from GenBank were used only in phylogenetic analyses, but not in population-level analysis.
Our samples include caribou that represent a variety of currently recognized taxonomic identities. Individuals from Alaska represent the subspecies Rangifer tarandus granti. Samples from eastern Northwest Territories are classified as the barren-ground subspeciesR. t. groenlandicus. Finally, samples from British Columbia, Alberta, Yukon Territories, western Northwest Territories and GenBank sequences from central and eastern Canada fall into the woodland subspecies R. t. caribou. However, woodland caribou have been further classified into Northern Mountain, Southern Mountain and Boreal ecotypes (Fig. 1). Given the complexity and lack of understanding of these taxonomic labels, we will simply refer to the five different 'types' of caribou examined as: Alaska, Barren-ground, Boreal, Northern Mountain and Southern Mountain.
Genetic analysis
DNA extractions from blood were carried out using the DNeasy Blood and Tissue Kit (QIAGEN) following the manufacturer's protocol or using a standard salt extraction protocol (Miller et al. 1988).
We examined a ~496-bp fragment of maternally inherited mtDNA control region. This fragment was amplified in 711 individuals using the primer pair L15394 and H15947 following Hagstad & Roed (2003). Sequences were created by Macrogen Inc. (Seoul, Korea). Chromatogram images were assembled and aligned manually using BioFdit v7.0.5. All individuals were also PGR amplified and genotyped at 14 polymorphic microsatellite loci, which include 10 markers used by McDevitt et al. (2009), RTl, RT5, RT6, RT9, RT13, RT24, RT27 (Wilson et al. 1997), BL42, BM4513 and BM6506 (Bishop et al. 1994); and four additional ungulate dinucleotide loci which were found to be polymorphic in caribou, BM757 and BM848 (Bishop et al. 1994), Fthl52 (Steffen et al. 1993) and Oarl93 (Buchanan & Crawford 1993). PGR amplifications were carried out in a final volume of lO-pL in multiplex reactions using 1 pL of DNA extract and Ix Multiplex PGR Mastermix (QIAGFN). Primer concentrations ranged from 0.15 to 0.5 p M . Amplification reactions typically began with 95 °C for 15 min; 35 cycles of 94 °C for 45 s, 54—58 °C for 90 s, 72 °C for 1 min and a final extension at 72 °C
' 2012 Blackwell Publishing Ltd

C A R IB O U GE N E T IC S IN WEST ERN N O R T H A M E R IC A 3613
T able 1 Descriptive statistics for Rangifer tarandus herds and types in w estern N orth Am erica
# Populations Abbr. n Alleles Richness H e Ho H aps h 71
Southern M ountain 190/247 12.36 9.98 0.83 0.76 21 0.790 0.01561 Banff National Park BNP 5/5 2.29 1.98 0.45 0.60 1 0.000 0.00002 Columbia N orth CN 24/24 7.71 2.97 0.78 0.75 6 0.761 0.01593 Jasper N ational Park JNP 28/29 6.14 2.72 0.72 0.70 3 0.593 0.01304 A La Peche ALP 27/34 8.57 3.04 0.80 0.82 4 0.604 0.01496 N arraw ay NAR 26/46 9.00 3.04 0.80 0.76 6 0.354 0.00686 Redrock-Prairie Creek RPC 28/55 8.93 3.04 0.80 0.76 9 0.849 0.01736 Red W illow RWR 2/2 2.86 2.86 0.56 0.75 1 0.000 0.00007 Kennedy KEN 15/18 8.36 3.10 0.80 0.81 4 0.657 0.00537 Moberly MOB 3/3 4.07 3.12 0.69 0.76 3 1.000 0.00297 Parsnip PAR 16/17 7.93 3.02 0.78 0.75 6 0.808 0.00657 Q uintette QUI 11/9 6.57 3.15 0.79 0.74 5 0.764 0.01927 Scott SC 5/5 5.00 3.00 0.72 0.81 3 0.800 0.0177
Boreal 194/213 14.14 10.86 0.80 0.76 18 0.900 0.01715 Little Smoky LSM 25/38 7.00 2.77 0.73 0.75 2 0.500 0.01518 Cold Lake CL 26/26 9.21 3.08 0.80 0.81 7 0.840 0.01569 Slave Lake SL 10/11 3.71 2.35 0.59 0.60 2 0.200 0.005610 Past-side A thabasca ESAR 17/17 6.93 2.87 0.74 0.79 5 0.772 0.012011 W est-side Athabasca WSAR 28/32 7.93 2.86 0.75 0.75 6 0.799 0.003112 Red Earth RE 30/30 7.43 2.77 0.73 0.75 5 0.800 0.002613 Chinchaga CH 30/31 8.57 2.95 0.77 0.78 4 0.717 0.009614 Caribou M ountain CM 28/28 10.43 3.12 0.81 0.80 13 0.929 0.0199
N orthern M ountain 141/151 15.50 12.48 0.86 0.82 34 0.873 0.008815 South N ahanni SNH 22/22 10.36 3.22 0.83 0.81 8 0.853 0.018116 Atlin AT 28/30 8.50 3.08 0.81 0.78 4 0.643 0.012417 Redstone RED 86/93 14.86 3.29 0.86 0.83 30 0.917 0.018118 Tay River TR 5/6 6.21 3.19 0.77 0.82 2 0.400 0.0097
Barren-ground 40/40 13.79 13.73 0.87 0.84 30 0.981 0.013519 Biuenose East BE 20/20 11.21 3.31 0.85 0.83 16 0.974 0.012120 Bathurst BA 20/20 12.21 3.39 0.86 0.86 17 0.984 0.0148
Alaska 144/151 16.14 13.10 0.87 0.85 66 0.975 0.018221 Forty-mile PM 34/34 12.57 3.34 0.86 0.87 21 0.961 0.017421 Macomb M B6/7 6.71 3.25 0.80 0.84 5 0.933 0.009022 Neichina NEL 19/19 10.07 3.26 0.84 0.87 12 0.942 0.016123 Denali DEN 22/23 10.29 3.26 0.84 0.85 12 0.948 0.016124 W hite M ountains W hM 5/5 5.86 3.26 0.77 0.84 3 0.700 0.010125 Galena M ountain CM 6/8 5.21 2.68 0.66 0.68 3 0.600 0.011025 Wolf M ountains WoM 8/9 6.71 3.07 0.77 0.82 4 0.643 0.011926 W estern Arctic WA 24/26 12.36 3.35 0.86 0.86 18 0.971 0.019327 Teshekpuk TK 20/20 11.14 3.34 0.86 0.86 17 0.984 0.0210
All 709/802 20.14 20.13 0.86 0.79 151 0.959 0.0237
#, H erd location on Fig. 1; Abbr., abbreviation; n, sam ple size for m tD N A /m icrosatellites; Alleles, m ean num ber of alleles per locus; richness, allelic richness; H e, expected heterozygosity; H o, observed heterozygosity; H aps, num ber of haplotypes; h, haplotype diversity; n, nucleotide diversity.
for 45 min. PCR products were the run on an ABI 3130x/ Genetic Analyser 16 capillary system (Applied Biosystems) and sized with internal lane standard (600 LIZ; Applied Biosystems) using the program GeneMap- per v4.0 (Applied Biosystems). An average of 114 individuals per locus were randomly selected and independently re-amplified. The resulting error rate due to allelic drop-out and scoring errors was 0.38% per allele, which is considered negligible in studies evaluating population structure (Bonin et al. 2004). The
program Micro-Checker (van Oosterhout et al. 2004) was used to check all herds for the presence of null alleles, large allelic dropout and possible scoring errors.
M itochondrial D N A phylogenetic analysis
Phylogenetic relationships among mitochondrial haplotypes were examined using Bayesian methods. The program jMODELTEST 0.1.1 (Guindon & Gascuel 2003; Posada2008) identified TPMluf + I + G as the best model
© 2012 Blackwell Publishing Ltd
3614 B. V. W E C K W O R T H E T AL .
according to the Bayesian Information Criterion. TPMluf is the Kimura 3-parameter model (K81, Kimura 1981) with unequal base frequencies (uf), invariant sites (I) and gamma distributed rates (G). Parameters from this model were used in subsequent analyses where such inputs are permitted. Bayesian trees were examined using MrBayes v.3.1 (Ronquist & Huelsenbeck 2003); initiated with a random tree, three independent chains were run for 25 million iterations sampled every 5000 generations. Log-likelihood values for each sampled generation were evaluated, and those preceding stationarity (plotting -InL over generation time) was discarded. Data collected post stationarity were used to estimate posterior probability nodal support. Another Cervid species, moose (Alces alces), was used as an outgroup. Net divergence (D«) between the mtDNA lineages in the study area was calculated in m e g a version 5 (Tamura et al. 2011).
A RLEQ uiN 3.5 (Excoffier & Lischer 2010) was used to calculate haplotype diversity (h) and nucleotide diversity (ti), as well as to calculate population pairwise estimates of <I>sT values, taking into consideration differences in both haplotype frequency and differences in sequences. In mtDNA, (hgx uses information on allelic relationships as a measurement of how isolation among populations increases time of coalescence for genes drawn randomly from different populations relative to genes within a single population (Slatkin 1991). The resulting matrix of pairwise <I>st estimates was then analysed using spss Statistics 17.0 (SPSS Inc., Chicago, IE, USA) to create a multidimensional scaling plot (MDS) to visualize the genetic relationships among populations, and a corresponding stress value for the MDS that evaluates the fit on two dimensions. To test for a pattern of isolation by distance, we compared (hgx values against straight-line geographic distance among sampled populations (using centre point of each population's home range). We assessed the significance of this comparison using a Mantel test as implemented in IBD (Bohonak 2002).
To evaluate significant geographic divisions of hypothesized a priori subspecies and ecotype groups, we used hierarchical analyses of molecular variance
(a m o v a , Excoffier et al. 1992) in a r l e q u in (Excoffier & Lischer 2010). This analysis divides total variance into variance components via differences among groups (fl>cT)r among populations within groups (fl>gc) and within populations ((hgx). Spatial a m o v a designs based on a priori subspecies and ecotype hypotheses were contrasted to various a posteriori groups implied from the results of the above phylogenetic analyses (Table 2). We assumed that the best geographic subdivisions were significantly different from random distributions and had maximum among group variance (<I>ct values). We expected that the optimal genetic subdivisions of subspecies/ecotypes will maximize the between-group variance (<I>ct) compared to the within-group component (<I>gc).
Einally, population expansion was examined using multiple methods. Demographic events such as rapid population expansion and growth leads to low levels of diversity among haplotypes over large areas and results in phytogenies that are diverse at external nodes and compressed near the root (i.e. star-like phytogenies; Avise 2000). Examining mtDNA genealogies (Avise2000) and analysis of the raggedness index of mismatch distributions (Rogers & Harpending 1992) provide a method for inferring such demographic events, a r l e q u in
was used to calculate mismatch distribution of observed differences between pairs of haplotypes in the two genetic groups (Northern and Southern) identified in above phylogenetic analyses. We also calculated in ARLEQUIN Tajima's D (Tajima 1989) and Eu's Eg (Eu 1997) tests of neutrality, where significantly negative values may indicate recent population expansion. Eu & Li's (1993) D* and F* statistics (calculated in DnaSP 5.1; Lib- rado & Rozas 2009) help distinguish background selection from population growth or range expansion when compared with Eu's Eg- If Eg is significant and D* and F* statistics are not, population growth or range expansion is supported. The reverse combination suggests selection (Eu 1997).
M icrosatellite population genetic analysis
Hardy-W einberg equilibrium (HWE) and microsatellite allele number and heterozygosity (observed and
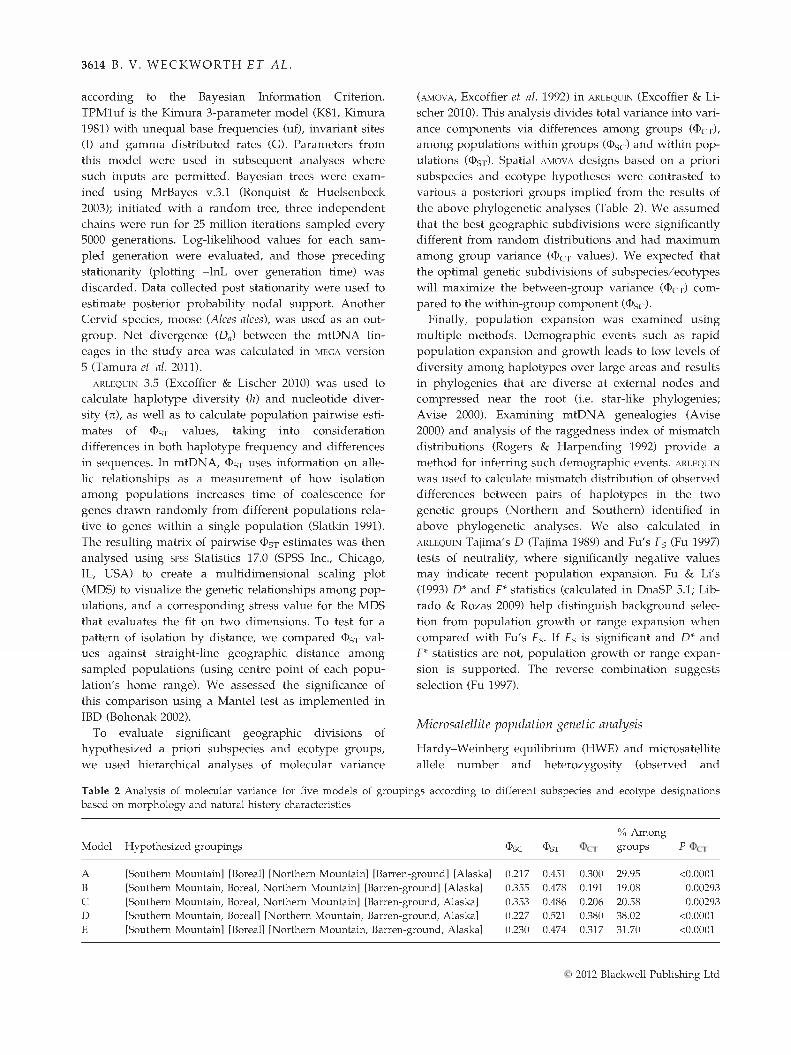
T able 2 Analysis of m olecular variance for five m odels of groupings according to different subspecies and ecotype designations based on m orphology and natural history characteristics
M odel H ypothesized groupings 4>sc 4>st
% Am ong groups P
A [Southern M ountain] [Boreal] [N orthern M ountain] [Barren-ground] [Alaska] 0.217 0.451 0.300 29.95 <0.0001B [Southern M ountain, Boreal, N orthern M ountain] [Barren-ground] [Alaska] 0.355 0.478 0.191 19.08 0.00293C [Southern M ountain, Boreal, N orthern M ountain] [Barren-ground, Alaska] 0.353 0.486 0.206 20.58 0.00293D [Southern M ountain, Boreal] [N orthern M ountain, Barren-ground, Alaska] 0.227 0.521 0.380 38.02 <0.0001E [Southern M ountain] [Boreal] [N orthern M ountain, B arren-ground, Alaska] 0.230 0.474 0.317 31.70 <0.0001
' 2012 Blackwell Publishing Ltd

C A R IB O U GE N E T IC S IN WEST ERN N O R T H A M E R IC A 3615
expected) for each locus across populations were calculated using G e n A lE x 6.4 (Peakall & Smouse 2006). fstat
2.9.3 (Goudet 2001) was used to calculate Allelic richness and linkage disequilibrium (LD). Deviations from HWE and LD were tested per locus and between each pair of loci for each population, respectively. Estimated P values were calculated under a Markov chain method using 10 000 simulations. P values for tests were corrected using a strict Bonferroni adjustment (initial a = 0.01) for multiple comparisons.
We analysed population structure at two distinct levels. Eirst, the Bayesian-clustering program, structure
v2.3 was used to conduct admixture and assignment tests to evaluate inferred population clusters based on multi-locus genotype data (Pritchard et al. 2000; Ealush et al. 2003). Eive independent runs were performed for each K value (1-20) using 2 million iterations with a burn-in period of 500 000. Assignment tests were run under the default settings with the admixture model. The standard procedure to determine the probability of how the data best fit into each number of K clusters is by calculating the mean posterior probability of the data [log probability of data; L(K)]. Individuals are assigned probabilistically to a single cluster or to multiple d u sters if their genotypic profile indicates admixture. Evan- no et al. (2005) used an ad hoc quantity based on the second order rate of change of the likelihood function with respect to K (AJQ. Evaluation of assignment test functions (Waples & Gaggiotti 2006) indicates that both methods work well when genetic differentiation is strong, but under moderate genetic differentiation the standard procedure performed better. Here, we apply both approaches to allow not only for the identification of the uppermost level of population hierarchy, but also clusters that may indicate sublevels of structuring (Evanno et al. 2005).
Einally, we used conventional Fst population pairwise comparisons (Weir & Cockerham 1984) to assess the genetic relationships among currently recognized herds and their associated ecotype designations, m sa 3.0 (Dieringer & Schlotterer 2003) was used to estimate these Fst values and significance was calculated using 10 000 randomizations, correcting for type 1 errors using sequential Bonferroni adjustment. The resulting distance matrix was visualized, similar to mtDNA data, through an MDS plot. As with mtDNA, we assessed the significance of isolation by distance using ibd (Bohonak 2002).
Results
M itochondrial D N A
A total of 709 individuals were sequenced for mtDNA control region. This yielded 85 polymorphic sites that
included 89 different mutations which totalled 151 haplotypes (17 from McDevitt et al. 2009, GenBank accession numbers EU915191-EU915207; and 134 unique haplotypes, GenBank accession numbers JQ743347- JQ743480). There was a tendency for most haplotypes to be endemic to one of the specific caribou types; 15, 10, 24, 29 and 56 haplotypes were unique to the Southern Mountain, Boreal, Northern Mountain, Barren- ground and Alaska caribou types, respectively. The remaining 17 haplotypes were shared by at least two caribou types, but no haplotype was found among more than three types.
The haplotype phytogeny (Eig. 2) reflects a high level of variation in caribou of North America. As in previous studies, the phytogeny can be organized approximately into two primary groups (net divergence between groups was 2.5%, 95% Cl: 1.8-3.2%); a Southern group consisting of mostly woodland caribou that presumably originated from southern refugia (net divergence within South was 0.8%, 95% Cl: 0.6-1.0%), and a Northern group that has a Beringian origin (net divergence within North was 2.1%, 95% Cl: 1.7-2.5%). The Southern group is almost entirely made up of Southern Mountain and Boreal individuals, while the Northern group includes Northern Mountain, Barren-ground and Alaska individuals. As described in McDevitt et al. (2009), a number of woodland caribou individuals from Boreal and Southern Mountain herds have haplotypes that fall within the Northern group, conversely only a single haplotype from the Northern Mountain, Barren- ground or Alaska herds (rtl05, from BA) was found in the Southern group.
Population pairwise <I>st comparisons tended to support significant differentiation between herds (Table SI, Supporting information). Most non significant relationships were in intra-type comparisons and between Boreal and Southern Mountain types, a pattern further supported by a significant correlation of pairwise <I>st
and geographic distance (F = 0.001; Eig. SI, Supporting information). The MDS plot of the <I>st distance matrix (Eig. 3) distinguishes two primary clusters, one containing herds from Boreal and Southern Mountain types (Southern Group) and the other from Northern Mountain, Barren-ground and Alaska types (Northern Group). Within the Southern Group, Boreal and Southern Mountain types scatter indiscriminately, while in the Northern Group, the three different types segregate from one another. The low measure of stress (0.019) indicated a good fit of the data in two dimensions.
When populations are organized according to three a priori (as currently accepted) and two a posteriori (as for our study) hypothesized models of hierarchical grouping, a m o v a results support better performance of a posteriori models (Table 2). Model A tests the five
© 2012 Blackwell Publishing Ltd

3616 B. V. W E C K W O R T H E T AL .
TK,WA
1.00
S o u th e rn M o u n ta in
- A F 01 6 9 5 1 A lc es
CH, CL, CM, CN, NWT, QUI
I N o rth e rn M o u n ta in
I B a rre n -g ro u n d
I Boreal
I Alaska
ALR BA, BE, BNR CN, DEN, ESAR EM, GM, JNR, KEN, MB, NAR, NEL, NWT, RAR, QUI, RRC, SC, SL,TK,WA,WhM,WoM, AY178710 (Barren-ground)AT, BA, BE, NAR, NWT, RRC
ALR CN, LSM
CL, CM, EM, TK
CH, CM
AT, NWT, SNH, AF096425 (Cariboo Herd BC)
NWTTREM, GM, NWT, SNH
BE, WA, AY178696 and AY178699 (Barren-ground)
DEN, GM,NEL,TK,WA
AY178698 (Barren-ground)BE, NWT, SNH
BA,NWT,SNH,TK,AF0%431 (BE), AY178697 (Barren-ground)
BA, AY178706 (Barren-ground)
EM, NWT, TK
BE, NWT, SNH, WA
EM, TK,WoM
DEN, NWT BE
AF094633 (Baffin Island)
AF096412 (BA), AF0% 416 (BA)
AT, NWT
NWT
BA, NWT
NWT DEN, NEL
BE, EM, NEL, NWT, WhM
NWT,TK
AT,NWT,SNH,TaWA
EM, NEL, NWT,TK,WA
BA, BE, AF096434 (Baffin Island), AF096432 (BE), AY178694 (Quebec)
BE
SNH,WA
BA, AY178707 (Barren-ground)
DEN,TK,AF096423 (Beverly Herd)
WA,TKDEN, MB, NEL, WhM
DEN, EM, MB, NEL, WoM
EM
BA, AY178690-91 (Quebec)
AF096420 (N ew foundland)
Eastern Canada (Labrador, Q u eb e c Southern Q ntarlo)AF096419 (New foundland), AY178692 (Quebec)
AY178711 (Quebec)
AY178712, AY178722 (Quebec)
CL, CM, CN, ESAR, KEN, MQB, NAR RAR RE, RRC, SC, SL,WSAR
CL, CM, KEN, RARALR CH, CL, CM, CN, ESAR, HW40, JNR, KEN, LSM, MQB, NAR RAR QUI, RE, RRC, RW a SC, WSAR, AF096417 (Cariboo Herd)
Northern Group
Southern Group
Fig. 2 Bayesian phylogeny of 151 caribou haplotypes and 34 GenBank sequences. O utgroup is moose (Alces alces). Support values >0.50 are p rovided below branches. Triangles at term inal nodes indicate w here structure <0.50 and unresolved polytom ies were collapsed into a single branch for clarity. A t the end of each branch a coloured bar represents proportion of individuals of each caribou 'type ' that had haplotype(s) at that branch (colour legend in lower left). Also indicated are from w hich herds those individuals originated (abbreviations as in Table 1).
hypothesized caribou types, and indicates this level of organization explains 30.0% of all genetic variation. Model B tests the subspecies designations currently accepted (i.e. R. t. granti, R. t. groenlandicus and R. t. caribou) and Model C tests the Beringian group that combines Alaska and Barren-ground and a Southern group that includes all herds currently classified as R. t. caribou (Boreal, Northern Mountain and Southern Mountain ecotypes). Although both groupings are significant, they do not perform as well as Model A,
explaining 19.1% and 20.6% of genetic variability, respectively. Model D tests the Northern and Southern groups as identified in Fig. 3, which reassigns the Northern Mountain ecotype of woodland caribou as having a Beringian origin, and explains 38.0% of between-group variation. Model E tests the new Northern group and separates Boreal and Southern Mountain ecotypes into distinct groups, explaining 31.7% of group variance. Consequently, our analysis supports currently accepted 'ecotypes', but not subspecies.
' 2012 Blackwell Publishing Ltd

C A R IB O U GE N E T IC S IN WEST ERN N O R T H A M E R IC A 3617
1.0
0.5
0.0
-0 .5
□ TR
□ AT
1—1 CMNn^ n RED
Northern Group
/A FM T fc WA+ WhM*''’̂
//
Southern Group
O RE
O NAR
O PAR
A b e^ e
O WSAR
O ESAR O KEN
/ CL/ QUI - O JN P
+ NEL / C ^ ^ O > S c O ^ P ^
O RPC
O CN o LSM
//
+ GM //
O SL/ O BNP O S M o u n t
/ □ N M o u n t/ O C H A B a rre n
O B o re a l A A la s k a
-I.OJ— - 1.0 -0 .5 0.0 0.5 1.0 1.5
Fig. 3 The m ulti-dim ensional scaling (MDS) plot visualizing, in tw o-dim ensional space, a population pairw ise (Fst distance m atrix (Table SI, Supporting information) that reflects evolutionary relationships betw een populations. All herds w ith less than five individuals have been d ropped from the analysis.
Tajima's D was not significantly negative for either the North or South group (D = -1.11, P = 0.13; D = 0.60, P = 0.79, respectively), however significant Eu's Fs values (Eg = -24.43, P < 0.01; Eg = -24.72, P < 0.01, respectively) and non-significant D* and F* (P > 0.05) for both North and South groups indicate demographic expansion. Additionally, non significant (a = 0.01) raggedness indices from mismatch distributions for both North and South groups (r = 0.007, P = 0.049; r = 0.024, P = 0.207, respectively) fail to reject the null model of historically expanding populations (Rogers & Harpending 1992). In aggregate, tests for population expansion support expansion in both the North and South groups.
M icrosatellites
A total of 802 individuals provided reliable microsatellite amplification (Table 1). Each locus, except for BM6506, deviated from HWE in one or more herds, but no locus deviated significantly from HWE in all herds. Similarly, every herd showed LD at one or more pairs of loci, but none of the loci had a significant pattern of LD at all pairs of loci. There was no evidence of systematic allelic dropout, null alleles or possible scoring errors. At the coarse scale, different indices of microsatellite variability revealed some differences across caribou groups. Allelic richness per population varied from 1.98 to 3.39, and per caribou type from 9.98 to 13.73,
700
600
500
400
O 300
200
100
01 2 3 4 5 6 7 8 9 1011 1 2 1 3 1 4 1 5 1 6 1 7 1 8 1 9 20
^ 8 000 S !o
^ 9 000 S oL_Q.-50 000 c
K
Fig. 4 Bayesian clustering analysis for 808 individuals analysed at 14 m icrosatellite loci using s t r u c t u r e (Pritchard et al. 2000). Ln probability (right y-axis; Pritchard et al. 2000) and Delta K (left y-axis; Evanno et al. 2005) indicate the m ost probable num ber of distinct population clusters (K, x-axis).
and was marginally significantly different among the five caribou types (E = 0.043). The Northern Group (comprising Northern Mountain, Barren-ground and Alaska types, see above) exhibited significantly greater allelic richness and observed heterozygosity (E = 0.001 for both) from the Southern Group (comprising Southern Mountain and Boreal, see above), while the Southern Group had significantly higher Egx (E = 0.002) from the Northern Group.
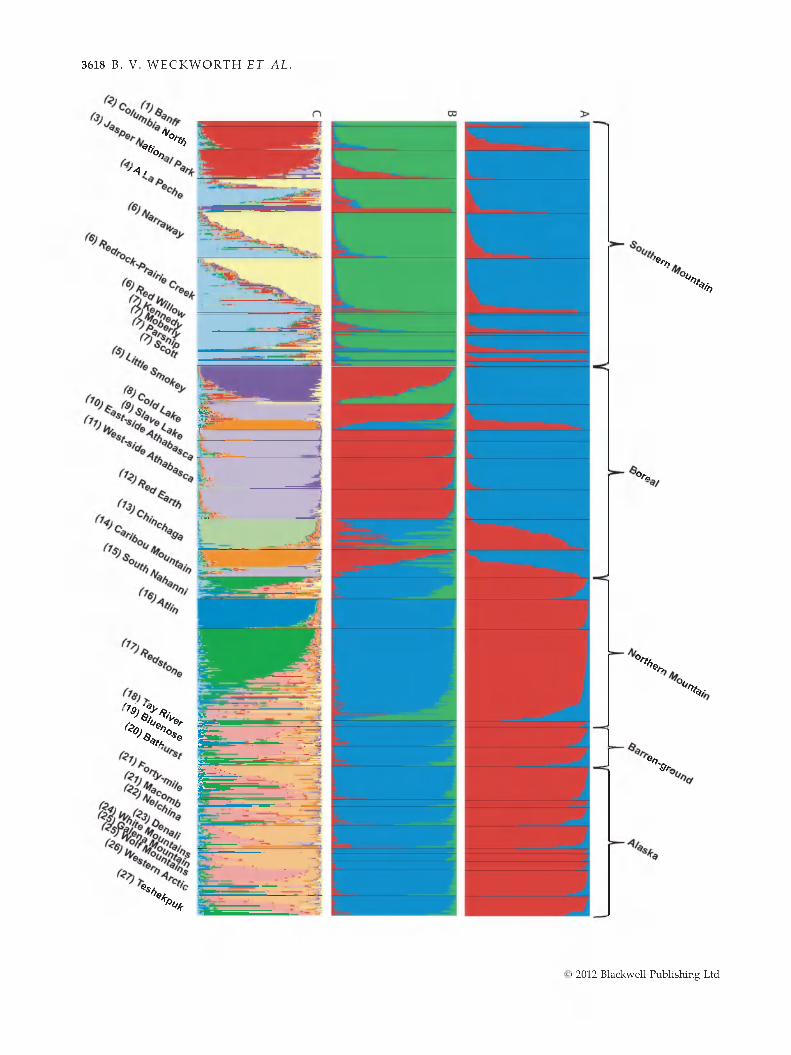
Calculation of L(JQ and AK revealed some discordant results (Eig. 4). Using the standard procedure (Pritchard et al. 2000) of calculating L(JQ, results support K = 11 (Eig. 4). Eollowing the Evanno method (Evanno et al. 2005), K was optimized at three values (2, 3 and 11). A histogram of individual assignment at JC = 2 (Eig. 5A) displays a clear delineation of the same Southern and Northern groups defined in the mtDNA MDS plot (Eig. 4). The histogram of R = 3 (Eig. 5B) further distinguishes the Southern Group into Boreal and Southern Mountain types, whereas the Northern Group retains fidelity to assignment within a single group. Notably, admixture of Boreal and Southern Mountain individual genotypic signatures is apparent in a number of herds that are at the boundary between different ecotypes, such as ALP and LSM. Other herds (i.e. CL, CH and CM) are also admixed, indicating either gene flow in the recent past, or the lack of precision at R = 3 to fully describe the genetic variability in all herds. Einally, the histogram at K = 11 (Eig. 5C) describes the fine scale relationships among herds. Here BNP, JNP and CN herds form a single group in the central Canadian Rockies whereas other Southern Mountain herds appear to be admixtures of two different genetic signatures. Boreal herds tend to separate into four groups with the LSM, CH and CM herds largely showing discrete signatures and the remaining Boreal herds grouping into a single
© 2012 Blackwell Publishing Ltd
3618 B. V. W E C K W O R T H E T AL .
% %
M / ;
r
2'< V S-X > i
t
®«/iX
X
V-.%
X
% ®/>
V
X 'S>>
' 2012 Blackwell Publishing Ltd

C A R IB O U GE N E T IC S IN WEST ERN N O R T H A M E R IC A 3619
2.0
1.0
0.0
- 1.0
- 2.0
O S M ount □ N M ount A B arren O B o rea l ♦ A la sk a
LSMq O J N P
O CNPARo o K E N
RPCNAR
• yO W SAR CL A A
■*T1RED DEN
□ AT
-4.0 -3.0 - 2.0 - 1.0 0.0 1.0 2.0
Fig. 6 M ulti-dim ensional scaling (MDS) of microsatellite population Fst distances (Table S2, Supporting information). Populations w ith fewer than 10 individuals have been dropped from this analysis.
cluster. AT and RED herds of the Northern Mountain type also show relatively endemic assignment, whereas the rest of the Northern Mountain and Alaska herds show no dear delineation of clusters, but rather an admixture of 2-3 different genotypic signatures.
Fst values between caribou herds ranged from 0.01 to 0.32 (Table S2, Supporting information). As with the mtDNA pairwise (tsx comparisons, most significant genetic distances were in inter-type comparisons. Controlling for the number of herds analysed, a Mantel test shows significant correlation between the Fst and (hsx matrices (P < 0.0001). Notably, with just one exception, no comparisons between two Barren-ground and the five Alaska herds analysed showed significant differentiation. The MDS plot (Eig. 6) demonstrates a tightly clustered, often overlapping, relationship among the Barren-ground, Alaska and most Northern Mountain herds (except geographically distant AT). In contrast to what was observed for mtDNA, microsatellite data unambiguously distinguish Boreal and Southern Mountain types from each other, as well as detect strong divergence within these types (Eig. 6). Pairwise Fst distances were not significantly correlated with geographic distance (P = 0.199; Eig. SI, Supporting information).
D iscussion
Phylogeography and evolutionary history
Isolation and expansion from refugia during Pleistocene glacial cycles have left a genetic legacy across many taxa (Eontanella et al. 2008; Latch et al. 2009) and is often apparent in the phylogenetic discontinuities sometimes reflected in subspecific taxonomic classifications. These patterns are evident even in large, vagile mammals including wolves (Weckworth et al. 2010), black bears (Peacock et al. 2007) and mule deer (Latch et al. 2009). A similar pattern appears to also describe the phylogeographic history of caribou. Phylogenetic patterns in mtDNA diversity followed previous work (Elagstad & Roed 2003; Cronin et al. 2005; McDevitt et al. 2009) by revealing that two distinct phylogenetic assemblages of caribou are diverged into Northern and Southern groups. However, here we demonstrate for the first time that the Northern Mountain ecotype of woodland caribou shows a dear genealogical heritage with that of the Northern group (Eigs 2 and 3) and as such its taxonomical status has up until now been grossly misperceived.
Generally, herds identified as belonging to the Northern group show genetic levels of variability and haplotype divergence that would be expected under a model of repeated demographic expansion and contraction from Beringian refugia through multiple glacial- interglacial cycles. The polytomy of the Northern group mtDNA phylogeny (Eig. 2) corresponds to the extensive geographic range to which Beringian caribou have subsequently expanded to following the LGM. It is possible that we were unable to resolve the polytomy due to incomplete lineage sorting, or due to insufficient data with a 497 bp fragment of mtDNA. However, this is consistent with other studies on caribou (Elagstad & Roed 2003; McDevitt et al. 2009). Additionally, tests of expansion for the Northern group appear to corroborate a pattern of rapid population expansion. Herds in the Northern group tended to demonstrate greater number and variability in mtDNA haplotypes as compared to the Southern group (Table 1), strengthening the view that caribou originated in eastern Beringia during the
Fig. 5 Taxonomic subdivision and individual assignm ent test of 808 individuals using microsatellites in the program s t r u c t u r e (Pritchard et al. 2000). Results illustrate each indiv idual's herd (below figure) w ith its putative ecotype (above figure). Each bar represents an ind iv idual's assignm ent into K clusters. Statistical results based on both the standard calculation of L(K) and Evanno's AK indicate that the best R is 2, 3 a n d /o r 11. A t R = 2 (A), this analysis dem onstrates a test of the hypothesis of the N orthern G roup (red), of Beringian origin, and the Southern G roup (blue), of conterm inous US origin. (B) Assignm ent of individuals at K - 3, and can be evalu a ted as a test of the hypothesis of three distinct subspecies; Rangifer tarandus granti (Alaska), R. t. groenlandicus (Barren-ground) and R. t. caribou (woodland; Southern M ountain, N orthern M ountain and Boreal). (C) A ssignm ent of individuals at K = 11, and likely reflects contem porary patterns of gene flow am ong the current herd designations. N um bers adjacent to herd nam es coincide w ith herd location on Eig. 1.
© 2012 Blackwell Publishing Ltd

3620 B. V. W E C K W O R T H E T AL .
early Pleistocene (~1.6 Ma) as species diversity tends to be the greatest in regions of their origin (Tishkoff et al.2009). That introgression of haplotypes is not reciprocal, with only Northern haplotypes found in Southern populations, suggests that population expansion and admixture were fostered from a north to south direction. Although analysis also tended to support demographic expansion in the Southern group, the life history characteristics of woodland caribou may have limited the extent of their expansion to tracking mature forests as it became available post glaciation. The lack of distinction between Southern Mountain and Boreal herds at the phylogenetic level of mtDNA (Figs 2 and 3) versus their divergence at microsateiiites (Figs 5b and 6), suggests that specialization into mountain vs. boreal habitats is a more recent life history characteristic.
Microsateiiite assignment tests also reflect the geographic split of the Northern and Southern groups (Fig. 5a). A t K = 2 there is still a very dear distinction of the two groups identified with mtDNA sequences. This suggests limited contemporary gene flow between herds of the two groups, in spite of contact zones across their distributions. This apparent lack of genetic connectivity may be related to landscape features that discourage or prevent caribou dispersal, or to behavioural and/or ecological mechanisms that reinforce divergence and reproductive isolation (e.g. migratory vs. non migratory behaviour). Alternatively, contact zones may exist where intermixing between groups produces individuals with mixed microsateiiite genotypic signatures, and we have simply not sampled them in this study. Most herds in Fig. 5a demonstrate some admixture, in most cases, a direct migrant is unlikely due to the geographic distance that would be required, in herds with only a few admixed or miss-assigned individuals, this may reflect a signature of historic gene flow, an idea supported in a previous study that has identified an apparent hybrid swarm of the Northern and Southern groups in Alberta (McDevitt et al. 2009). Conversely, the apparent admixture may simply reflect a level of genetic variability of individuals that cannot be dearly distinguished at the coarse scale imposed at K = 2.
Phylogenetic diversity among populations in the Southern group is much lower than in the Northern group (Table 1; Fig. 2). in our study, the major phylogenetic pattern in the Southern group is an apparent divergence of western and eastern North American haplotypes (Fig. 2). This suggests that post glacial expansion of woodland caribou may have been initiated from two distinct refugiai sources. Given the ecological variability within Beringia (Lozhkin et al. 2011), the relative distinction of the three different types of caribou in the Northern group (i.e. Northern Mountain, Barren- ground and Alaska) may indicate differentiation of
caribou during glacial maxima, and/or may reflect different waves of expansion during interglaciais (Waltari et al. 2007). The latest expansion following the LGM appears to have also resulted in the mixing of the two dades of woodland and tundra refugiai groups within Alberta. This region was some of the first terrestrial habitat to be vacated by glacial ice as the Cordilleran and Laurentide ice sheets began to recede (Catto et al. 1996; Shapiro et al. 2004). Our findings confirm the previously detailed hybrid swarm within the Canadian Rockies of Alberta (McDevitt et al. 2009), but here extended sampling also reveals boreal herds in Alberta with similarly mixed origins (Fig. 2).
Population structure and m anagem ent implications
Large mammals are often typified by high dispersal capability and having distributions that range across multiple habitat types, if these species are also structured genetically as a result of different ecological specializations, then calculating the degree to which ecological variation drives genetic differentiation is important. A number of studies have begun to emerge that demonstrate an association of genetic differentiation of populations and ecological differences. These include studies of other mammals with similar distributions as caribou, such as wolves (Canis lupus-, Musiani et al. 2007; Munoz-Fuentes et al. 2009) and lynx {Lynx lynx} Rueness et al. 2003).
in the caribou populations analysed here, microsateiiite analyses dearly separate Boreal and Southern Mountain 'ecotypes'. These two groups are primarily distinguished based on different migratory (Southern Mountain) vs. non migratory (Boreal) behaviours (COSEWIC 2002). Our sampling scheme does not provide for the comparison of geographically contiguous populations of different behavioural types, with the exception of Little Smoky (Boreal) and A La Peche (Southern Mountain). These herds are directly adjacent to each other on the landscape (Fig. 1) and appear to exchange some migrants (Fig. 5c). Nonetheless, gene flow between the two herds does not appear to be sufficient to prevent distinctive genotypic signatures. This suggests that Boreal and Southern Mountain caribou may have reached a stage whereby interbreeding would be disfavoured. However, it remains unclear as to whether this level of genetic distinction parallels other ecological, behavioural and life history characteristics, and whether adaptive genomic regions also reveal distinctiveness between groups. Additional analysis, emphasizing sampling of geographically adjacent populations of different putative ecotypes and the use of genome-wide approaches, will provide the framework to address these outstanding questions.
' 2012 Blackwell Publishing Ltd

C A R IB O U GE N E T IC S IN WEST ERN N O R T H A M E R IC A 3621
The premise of conservation efforts on individual species is to not only preserve the species itself, but also the evolutionary potential and processes that have created that diversity (Moritz 2002). A prerequisite to this is a dear understanding of the distribution and patterns of diversity across a species' distribution. Our results develop a new understanding of caribou diversity and call for a restructuring of current caribou classification that acknowledges the division of two main clades in western North America and the distinction of Northern Mountain woodland caribou from Boreal and Southern types. This revised classification should similarly be reflected in both federal and provincial jurisdiction recovery plans as well as COSEWIC's re-evaluation of caribou designatable units.
Our results also have important implications for recovery planning within the subspecies level. Eor example, in the draft boreal woodland caribou recovery plan (Environment Canada 2011), the functional conservation unit is considered the individual local population (i.e. herd) with little consideration of meta-population genetic structure at a higher level than the local population. Our results suggest that indeed, some intermediate level of meta-population structure may be worthy of consideration as a conservation unit rather than or in addition to the local population level. The seeming correspondence between some of the potential conservation units (e.g., Alberta boreal) and ecozones (Boreal plain; Ecological Stratification Working Group 1995) is striking, and suggests the hypothesis that caribou meta- populations may be a functional conservation unit. In other cases, however, specific local populations may be the functional conservation unit (e.g. Little Smoky). However, interpretation of microsateiiite data warrants some caution because of the lag-time in genetic signatures and the confounding patterns of modern habitat fragmentation, and because of the greater potential for genetic drift in small populations (Landguth et al.2010). Eor example, although Eig. 5c could exemplify meta-population dynamics in woodland caribou, these genetic patterns may largely be reflective of long-term population dynamics established in caribou generations of the recent past, but not necessarily current levels of gene flow. This is exemplified in comparing van Oort et al. (2011), who show little successful dispersal of radiocollared individuals among Southern Mountain caribou herds, to Serrouya et al. (2012), who show genetic clustering of the same herds using microsateiiite data.
The disparity in telemetry data versus patterns of genetic variability is paramount towards conservation and management policy. Eigure 6 shows threatened Boreal and Southern Mountain herds scattered across the graph in contrast to the tight clustering of herds
from the Northern Group. This pattern likely reflects the declining numbers of the southern herds and the subsequent genetic isolation and drift. A lack of dispersal accompanied by small population size can lead to rapid genetic drift (i.e. phenomena documented for caribou in this region; van Oort et al. 2011; Serrouya et al. 2012). As a result, the fragmentation of the metapopulations that we described might preclude gene flow or a rescue effect for locally extirpated populations as predicted in meta-population theory (Pannell & Charlesworth 2000; Hanski & Gaggiotti 2004). This alarming effect is most clearly illustrated with the Banff herd of the Canadian Rockies, with their persistent bottleneck over the past several decades (and demonstrated low genetic variability; Table 1) and their eventual extirpation in an avalanche in 2009 (Hebblewhite et al. 2010). Clearly, conservation and management strategies should emphasize fostering connectivity among caribou populations and maintaining demo- graphically viable population sizes.
Acknowledgements
W e w ould like to thank M atthew C ronin and two anonym ous reviewers for their com m ents on im proving this m anuscript. Support was p rovided by the A lberta D epartm ent of Sustainable Resource Developm ent, British Coiumbia M inistry of the Environm ent, BC M inistry of Forests, C anadian Association of Petroleum Producers, Conoco-Philips, NSERC, Parks Canada, Petroleum Technology Alliance of Canada, Royal D utch Shell, UCD SEED funding, W eyerhaueser Com pany, Alberta Innovates, A lberta Conservation Association and the Y2Y Conservation Initiative. We also thank Alaska D epartm ent of Eish and Game, K Beckmen, M Bradley, S Cote, N DeCesare, A Dibb, K Heinem eyer, D Hervieux, N McCutchen, L Neufieid, R Popko, J Poifus, C Sacchi, E Schmiegeiow, R Serrouya, M Sherrington, J Skilnick, S Slater, K Smith, D Stepnisky,Taku River Tlingit Eirst Nation, A Veitch, J W ittington and G Yannic. Research w as conducted u n d e r Alberta, BC, and Parks Canada, Universities of M ontana, Calgary and A lberta research and collection permits.
References
Abbott RJ, Brochmann C (2003) H istory and evolution of the arctic flora: in the footsteps of Eric Hulten. Molecular Ecology, 12, 299-313.
Avise JC (2000) Phylogeography: The History and Formation of Species. H arvard University Press, Cambridge, M assachusetts.
Banfield AWE (1961) A revision of the reindeer and caribou, genus Rangifer. National Museum of Canada Bulletin, 177, 1-137.
Bergerud AT (1974) Decline of caribou in N orth Am erica following settlement, fournal of Wildlife Management, 38, 757- 770.
Bishop MD, Kappes SM, Keeie KW et al. (1994) A genetic linkage m ap for cattle. Genetics, 136, 619-639.
© 2012 Blackwell Publishing Ltd
3622 B. V. W E C K W O R T H E T AL .
Bohonak AJ (2002) IBD (Isolation By Distance): a program for analyses of isolation by distance. Journal of Heredity, 93, 153- 154.
Bonin A, Belleman E, Bronken Eidesen P et al. (2004) H ow to track and assess genotyping errors in population genetics studies. Molecular Ecology, 13, 3261-3273.
Buchanan EC, C raw ford AM (1993) Ovine microsatellites at the O arEC B ll, GarECB128, OarECB193, OarECB266 and OarECB304. Animal Genetics, 24, 145.
Catto N, Liverm an DGE, Bobrowsky B, Rutter N (1996) Laurentide, Cordilleran and m ontane glaciation in the w estern Peace River—G rand Prairie region, Alberta and British Columbia, Canada. Quaternary International, 32, 21-32.
Clark PU, Mix AC (2002) Ice sheets and sea level of the Last Glacial M aximum. Quaternary Science Reviews, 21, 1-7.
COSEWIC (2002) COSEWIC Assessment and Update Status Report on the Woodland Caribou Rangifer tarandus Caribou in Canada, pp. xi + 98. Com mittee on the Status of E ndangered Wildlife in Canada, Ottawa.
Courtois R, Bernatchez L, Ouellet JP, Breton L (2003) Significance of caribou (Rangifer tarandus) ecotypes from a m olecular genetics viewpoint. Conservation Genetics, 4, 393- 404.
Cronin MA, MacNeil MD, Patton JC (2005) Variation in m itochondrial DNA and m icrosateiiite DNA in caribou (Rangifer tarandus) in N orth America. Journal of Mammalogy, 86, 495-505.
D ieringer D, Schlotterer C (2003) M icrosateiiite analyser (MSA): a platform independent analysis tool for large m icrosateiiite data sets. Molecular Ecology Notes, 3, 167-169.
Dyke AS, A ndrew s JT, Clark PU et al. (2002) The Laurentide and Innuitian ice sheets du ring the last glacial m axim um. Quaternary Science Reviews, 21, 9-31.
Dynesius M, Jansson R (2000) Evolutionary consequences of changes in species' geographical distributions d riven by M ilankovitch climate oscillations. Proceedings of the National Academy of Sciences of the United States of America, 97, 9115- 9120.
Ecological Stratification W orking G roup (1995) A National Ecological Framework for Canada. O ttaw a/H ull, report and national m ap, 132 pp. Available from h ttp :/ /re s .a g r .c a / cansis/references/1996ew _a.htm l.
Environm ent C anada (2011) Recovery Strategy for the Woodland Caribou, Boreal Population (Rangifer tarandus caribou) in C anada [Proposed]. Species at Risk Act Recovery Strategy Series, pp. vi + 55. Environm ent C anada, Ottawa.
Evanno G, Regnaut S, Goudet J (2005) Detecting the num ber of clusters of individuals using the software STRUCTURE: a sim ulation study. Molecular Ecology, 14, 2611-2620.
Excoffier L, Lischer HEL (2010) A rlequin suite ver 3.5: a new series of program s to perform population genetics analyses u n d e r Linux and W indow s. Molecular Ecology Resources, 10, 564-567.
Excoffier L, Smouse PE, Q uattro JM (1992) Analysis of m olecular variance inferred from m etric distances am ong DNA haplotypes: application to hum an m itochondrial DNA restriction data. Genetics, 131, 479-491.
Ealush D, Stephens M, Pritchard JK (2003) Inference of population structure using m ultilocus genotype data: linked
loci and correlated allele frequencies. Genetics, 164, 1567- 1587.
Elagstad O, Roed KH (2003) Refugiai origins of reindeer (Rangifer tarandus) inferred from m itochondrial DNA sequences. Evolution, 57, 658-670.
Eontanella EM, Eeldm an CR, Siddall ME, B urbrink ET (2008) Phylogeography of D iadophis punctatus: extensive lineage diversity and repeated patterns of historical dem ography in a trans-continental snake. Molecular Phylogenetics and Evolution, 46, 1049-1070.
Eu Y (1997) Statistical tests of neutrality of m utations against population grow th, hitchhiking and background selection. Genetics, 147, 915-925.
Eu Y, Li W H (1993) Statistical tests of neutrality of m utations. Genetics, 133, 693-709.
Goudet J (2001) FSTAT 2.9.3: A Program to Estimate and Test Gene Diversities and Fixation Indices. Laussane, Switzerland. Available at http: / / w w w 2.unil.ch /p o p g en /so ftw ares/fstat.htm .
G uindon S, Gascuel O (2003) A sim ple, fast, and accurate algorithm to estim ate large phylogenies by m axim um likelihood. Systematic Biology, 52, 696-704.
Hanski I, Gaggiotti OE (2004) Ecology, Genetics, and Evolution of Metapopulations. Elsevier-Academic Press, San Diego, California.
H arington CR (1999) Caribou. Beringian Research Notes, 12, 1-4.Hebblewhite M, W hite C, M usiani M (2010) Revisiting
extinction in national parks: m ountain caribou in Banff. Conservation Biology, 24, 341-344.
H ew itt GM (2000) The genetic legacy of the Q uaternary ice ages. Nature, 405, 907-913.
James ARC, Stuart-Smith AK (2000) D istribution of caribou and wolves in relation to linear corridors. Journal of Wildlife Management, 64, 154-159.
Kim ura M (1981) Estim ation of evolutionary distances betw een hom ologous nucleotide sequences. Proceedings of the National Academy of Sciences of the United States of America, 78, 454-458.
Landguth EL, C ushm an SA, Schwartz MK et al. (2010) Quantifying the lag tim e to detect barriers in landscape genetics. Molecular Ecology, 19, 4179Hrl91.
Latch EK, Heffelfinger JR, Like JA, Rhodes Jr QE (2009) Species-wide phylogeography of N orth Am erican m ule deer (Odocoileus hemionus): cryptic glacial refugia and postglacial recolonization. Molecular Ecology, 18, 1730-1745.
Lessa HP, Cook JA, Patton JL (2003) Genetic footprints of dem ographic expansion in N orth America, bu t not Am azonia, during the late Q uaternary. Proceedings of the National Academy of Sciences of the United States of America, 100, 10331-10334.
Librado P, Rozas J (2009) DnaSP v5: a software for com prehensive analysis of DNA polym orphism data. Bioinformatics, 25, 1451-1452.
Lozhkin AV, A nderson P, Eisner WR, Solomatkina TB (2011) Late glacial and Holocene landscapes of central Beringia. Quaternary Research, 76, 383-392.
McDevitt AD, M ariani S, H ebblewhite M et al. (2009) Survival in the Rockies of an endangered hybrid sw arm from diverged caribou (Rangifer tarandus) lineages. Molecular Ecology, 18, 665-679.
' 2012 Blackwell Publishing Ltd

C A R IB O U GE N E T IC S IN WEST ERN N O R T H A M E R IC A 3623
M cLoughlin PD, Dzus E, W ynes B, Boutin S (2003) Declines in populations of w oodland caribou. Journal of Wildlife Management, 67, 755-761.
M iller SA, Dykes DD, Polesky HP (1988) A sim ple salting out procedure for extracting DNA from hum an nucleated cells. Nucleic Acids Research, 16, 1.
M oritz C (2002) Strategies to protect biological diversity and the evolutionary processes that sustain it. Systematic Biology, 51, 238-254.
M unoz-Fuentes V, D arim ont CT, W ayne RK et al. (2009) Ecological factors drive differentiation in wolves from British Columbia. Journal of Biogeography, 36, 1516-1531.
M usiani M, Leonard JA, Cluff HD et al. (2007) Differentiation of tu n d ra /ta ig a and boreal coniferous forest wolves: genetics, coat colour and association w ith m igratory caribou. Molecular Ecology, 16, 4149Hrl70.
van Oort H, McLellan BN, Serrouya R (2011) Fragm entation, dispersal and m etapopulation function in rem nant populations of endangered m ountain caribou. Animal Conservation, 14, 215-224.
van O osterhout C, H utchinson WE, Wills DPM, Shipley P (2004) Micro-Checker: software for identifying and correcting genotyping errors in microsateiiite data. Molecular Ecology Notes, 4, 535-538.
Pannell JR, Charlesw orth B (2000) Effects of m etapopulation processes on m easures of genetic diversity. Philosophical Transactions of the Royal Society of London Series B, 355, 1851- 1864.
Peacock E, Peacock MM, Titus K (2007) Black bears in Southeast Alaska: the fate of tw o ancient lineages in the face of contem porary m ovem ent. Journal of Zoology, 271, 445-154.
Peakall R, Smouse PE (2006) GENALEX 6: genetic analysis in Excel. Population genetic software for teaching and research. Molecular Ecology Notes, 6, 288-295.
Posada D (2008) jModelTest: phylogenetic m odel averaging. Molecular Biology and Evolution, 25, 1253-1256.
Pritchard JK, Stephens M, Donnelly P (2000) Inference of population structure using m ultilocus genotype data. Genetics, 155, 945-959.
Rogers AR, H arpending H (1992) Population grow th makes waves in the d istribution of pairw ise genetic differences. Molecular Biology and Evolution, 9, 552-569.
Ronquist E, H uelsenbeck JP (2003) MRBAYES 3: bayesian phylogenetic inference u n d e r m ixed m odels. Bioinformatics, 19, 1572-1574.
Rueness EK, Stenseth NC, O 'D onoghue M et al. (2003) Ecological and genetic spatial structuring in the C anadian lynx. Nature, 425, 69-72.
Runck AM, Cook JA (2005) Postglacial expansion of the southern red-back vole (Clethrionomys gapperi) in N orth America. Molecular Ecology, 14, 1445-1456.
Serrouya R, Paetkau D, McLellan BN et al. (2012) Population size and m ajor valleys explain m icrosateiiite variation better than taxonom ic units for caribou in w estern Canada. Molecular Ecology, doi: 10.1111/j.l365-294X.2012.05570.x.
Shapiro B, D rum m ond AJ, Ram baut A et al. (2004) Rise and fall of the Beringian steppe bison. Science, 306, 1561- 1565.
Slatkin M (1991) Inbreeding coefficients and coalescence times. Genetical Research, 58, 167-175.
Steffen P, Eggen A, Stranzinger G et al. (1993) Isolation and m apping of polym orphic microsatellites in cattle. Animal Genetics, 24, 121-124.
Tajima E (1989) Stastical m ethod for testing the neutral m utation hypothesis by DNA polym orphism . Genetics, 123, 585-595.
Tam ura K, Peterson D, Peterson N et al. (2011) MECA5: m olecular evolutionary genetics analysis using m axim um likelihood, evolutionary distance, and m axim um parsim ony m ethods. Molecular Biology and Evolution, 28, 2731-2739.
Tishkoff SA, Reed EA, Eriedlaender ER et al. (2009) The genetic structure and history of Africans and African Americans. Science, 5930, 1035-1044.
W altari E, Cook JA (2005) H ares on Ice: phylogeography and historical dem ographics of Lepus arcticus, L. othus, and L. timidus (Mammalia: Lagomorpha). Molecular Ecology, 14, 3005-3016.
W altari E, H oberg HP, Lessa HP, Cook JA (2007) Eastw ard Ho: phylogeographical perspectives on colonization of hosts and parasites across the Beringian nexus. Journal of Biogeography, 34, 561-574.
W aples RS, Gaggiotti O (2006) W hat is a population? An em piracal evaluation of som e genetic m ethods for identifying the num ber of gene pools and their degree of connectivity. Molecular Ecology, 15, 1419-1439.
W eckworth BW, Talbot SL, Cook JA (2010) Phylogeography of wolves (Canis lupus) in the Pacific N orthw est. Journal of Mammalogy, 91, 363-375.
W eckworth BW, Daw son N C , Talbot SL et al. (2011) Going coastal: shared evolutionary history betw een coastal British Columbia and Southeast A laska wolves (Canis lupus). PLoS ONE, 6, e l 9582.
W eclaw P, H udson RJ (2004) Sim ulation of conservation and m anagem ent of w oodland caribou. Ecological Modeling, 177, 75-94.
W eir BS, Cockerham CC (1984) Estim ating F-statistics for the analysis of population structure. Evolution, 38, 1358-1370.
W hittington J, H ebblewhite M, DeCesare NJ et al. (2011) Caribou encounters w ith wolves increase near roads and trails: a tim e-to-event approach. Journal of Applied Ecology, 48, 1535-1542.
W ilson GA, Strobeck C, W u L, Coffin JW (1997) Characterization of microsateiiite loci in caribou Rangifer tarandus, and their use in other artiodactyls. Molecular Ecology, 6, 697-699.
B.W.'s research focuses on using m olecular ecology and phylogenetics tools to inform policy and m anagem ent efforts on species of conservation concern. M.M. is a biologist who uses both spatial and m olecular ecology m ethods to address species evolution, m anagem ent and conservation issues internationally. A.D.M. is interested in applying genetic techniques to exam ine dispersal, range expansions and colonization histories of m am m als. M.H. studies the interrelationships betw een habitat, populations, and conservation of terrestrial carnivores and ungulates. S.M. is a population biologist interested in the application of evolutionary theory and interdisciplinary approaches to resolve practical issues relevant to conservation and exploitation m anagem ent.
© 2012 Blackwell Publishing Ltd

3624 B. V. W E C K W O R T H E T AL .
Data accessibility
DNA sequences: Genbank accessions JQ743347-JQ743480.
M icrosateiiite data: DRYAD entry doi:10.5061/dryad.gn22271h.
Supporting information
A dditional supporting inform ation m ay be found in the online version of this article.
Data S I M ethods.
T able S I Pairwise estim ates of m tD NA (bsx for all population pairs for herds w ith m ore than four individuals sam pled.
Table S2 Pairwise estim ates of nuclear m icrosateiiite F st values for all populations pairs for herds w ith m ore than 10 ind iv iduals sam pled.
Fig. S I Relationships betw een pairw ise geographic distances and pairw ise Fst (triangles) and (Fst (squares) comparisons.
Please note: W iley-Blackwell are not responsible for the content or functionality of any supporting inform ation supplied by the authors. A ny queries (other than m issing m aterial) should be directed to the corresponding au thor for the article.
' 2012 Blackwell Publishing Ltd
Related Documents