The Pennsylvania State University The Graduate School College of Engineering RECONSTRUCTION AND ANALYSIS OF GENOME-SCALE METABOLIC MODELS OF PHOTOSYNTHETIC ORGANISMS A Dissertation in Chemical Engineering by Rajib Saha © 2014 Rajib Saha Submitted in Partial Fulfillment of the Requirements for the Degree of Doctor of Philosophy August 2014

Welcome message from author
This document is posted to help you gain knowledge. Please leave a comment to let me know what you think about it! Share it to your friends and learn new things together.
Transcript

The Pennsylvania State University
The Graduate School
College of Engineering
RECONSTRUCTION AND ANALYSIS OF GENOME-SCALE METABOLIC
MODELS OF PHOTOSYNTHETIC ORGANISMS
A Dissertation in
Chemical Engineering
by
Rajib Saha
© 2014 Rajib Saha
Submitted in Partial Fulfillment
of the Requirements
for the Degree of
Doctor of Philosophy
August 2014

The dissertation of Rajib Saha was reviewed and approved* by the following: Costas D. Maranas Donald B. Broughton Professor of Chemical Engineering Dissertation Advisor Chair of Committee Reka Albert Professor of Physics and Biology Howard M. Salis Assistant Professor in Chemical Engineering and Agricultural and Biological Engineering Andrew Zydney Walter L. Robb Chair and Professor of Chemical Engineering Head of the department of Chemical Engineering *Signatures are on file in the Graduate School

iii
ABSTRACT
The scope and breadth of genome-scale metabolic reconstructions has continued to expand over the last decade. However, only a limited number of efforts exist on photosynthetic metabolism reconstruction. Cyanobacteria are an important group of photoautotrophic organisms that can synthesize valuable bio-products by harnessing solar energy. They are endowed with high photosynthetic efficiencies and diverse metabolic capabilities that confer the ability to convert solar energy into a variety of biofuels and their precursors. However, less well studied are the similarities and differences in metabolism of different species of cyanobacteria as they pertain to their suitability as microbial production chassis. Here we assemble, update and compare genome-scale models (iCyt773 and iSyn731) for two phylogenetically related cyanobacterial species, namely Cyanothece sp. ATCC 51142 and Synechocystis sp. PCC 6803. Comparisons of model predictions against gene essentiality data reveal a specificity of 0.94 (94/100) and a sensitivity of 1 (19/19) for the Synechocystis iSyn731 model. The diurnal rhythm of Cyanothece 51142 metabolism is modeled by constructing separate (light/dark) biomass equations and introducing regulatory restrictions over light and dark phases. Specific metabolic pathway differences between the two cyanobacteria alluding to different bio-production potentials are reflected in both models. In addition to these cyanobacterial species we also develop a genome-scale model for a plant with direct applications to food and bioenergy production (i.e., maize). The metabolic model Zea mays i1563 contains 1,563 genes and 1,825 metabolites involved in 1,985 reactions from primary and secondary maize metabolism. For approximately 42% of the reactions direct evidence for the participation of the reaction in maize was found. We describe results from performing flux balance analysis under different physiological conditions, (i.e., photosynthesis, photorespiration and respiration) of a C4 plant and also explore model predictions against experimental observations for two naturally occurring mutants (i.e., bm1 and bm3). Recently, we develop a second-generation genome-scale metabolic model for the maize leaf to capture C4 carbon fixation by modeling the interactions between the bundle sheath and mesophyll cells. Condition-specific biomass descriptions are introduced that account for amino acids, fatty acids, soluble sugars, proteins, chlorophyll, lingo-cellulose, and nucleic acids as experimentally measured biomass constituents. Compartmentalization of the model is based on proteomic/transcriptomic data and literature evidence. With the incorporation of the information from MetaCrop and MaizeCyc databases, this updated model spans 5824 genes, 8484 reactions, and 8918 metabolites, an increase of approximately five times the size of the earlier iRS1563 model. Transcriptomic and proteomic data is also used to introduce regulatory constraints in the model to simulate the limited nitrogen condition and glutamine synthetase gln1-3 and gln1-4 mutants. In silico results have achieved over 62% accuracy in predicting the direction of change in the metabolite pool under each of the mutant conditions compared to the wild-type condition with 82% accuracy determined in the limited nitrogen condition. The developed model corresponds to the largest and more complete to-date effort at cataloguing metabolism for any plant tissue-type.

iv
TABLE OF CONTENTS
LIST OF FIGURES .......................................................................................................... x
LIST OF TABLES .......................................................................................................... xii
ACKNOWLEDGEMENTS .......................................................................................... xiii
Chapter 1 RECENT ADVANCES IN THE RECONSTRUCTION OF
METABOLIC MODELS AND INTEGRATION OF OMICS DATA ........................ 1
1.1 Introduction ................................................................................................ 1
1.2 Metabolic model reconstruction approaches .............................................. 3
1.3 Integration of omics data in metabolic models .......................................... 6
1.4 Concluding remarks ................................................................................. 10
Chapter 2 RECONSTRUCTION AND COMPARISON OF THE METABOLIC
POTENTIAL OF CYANOBACTERIA CYANOTHECE SP. ATCC 51142 AND
SYNECHOCYSTIS SP. PCC 6803 ................................................................................. 11
2.1 Introduction .............................................................................................. 11
2.2 Materials and methods ............................................................................. 14
2.2.1 Measurement of biomass precursors .................................................. 14
2.2.1.1 Growth conditions ....................................................................... 14
2.2.1.2 Pigments ...................................................................................... 14
2.2.1.3 Amino Acids ................................................................................ 15
2.2.1.4 Other cellular components ........................................................... 15
2.2.2 Model simulations .............................................................................. 16

v
2.3 Results and Discussion ............................................................................. 19
2.3.1 Model components ............................................................................. 19
2.3.1.1 Biomass composition and diurnal cycle ...................................... 19
2.3.1.2 Identification and correction of network gaps ............................. 20
2.3.2 GPR associations and elemental and charge balancing ..................... 23
2.3.3 Comparison of iSyn731 model predicted flux ranges against
experimental measurements .............................................................. 23
2.3.4 iSyn731 model testing using in vivo gene essentiality data ............... 28
2.3.5 Model comparisons ............................................................................ 32
2.3.5.1 Synechocystis 6803 model comparisons ..................................... 32
2.3.5.2 Cyanothece 51142 model comparisons ....................................... 35
2.3.5.3 iSyn731 and iCyt773 models comparison .................................. 37
2.3.6 Using iSyn731 and iCyt773 to estimate production yields ................ 42
2.4 Conclusion ............................................................................................... 43
Chapter 3 SYNTHETIC BIOLOGY OF CYANOBACTERIA: UNIQUE
CHALLENGES AND OPPORTUNITIES ................................................................... 46
3.1 Introduction .............................................................................................. 46
3.2 Genetic modification of cyanobacteria .................................................... 47
3.3 Genetic modification in cis: chromosome editing ................................... 49
3.4 Genetic modification in trans: foreign plasmids ...................................... 52
3.5 Unique challenges of the cyanobacterial lifestyle .................................... 54
3.5.1 Life in a diurnal environment ............................................................ 54

vi
3.5.2 Redirecting Carbon Flux by decoupling growth from production ..... 56
3.5.3 RNA-based regulation ....................................................................... 56
3.6 Parts for Cyanobacterial Synthetic Biology ............................................. 57
3.6.1 Inducible Promoter ............................................................................. 58
3.6.2 Reporters ............................................................................................ 66
3.6.3 Cultivation systems ............................................................................ 68
3.7 Genome-scale modeling and fluxomics of cyanobacteria ....................... 68
3.7.1 Challenges .......................................................................................... 70
3.7.1.1 Incorporating photoautotrophy into metabolic models ................ 70
3.7.1.2 Incompleteness of genome annotation ......................................... 71
3.7.1.3 Fewer mutant resources to test model accuracy .......................... 72
3.7.2 Recent advances ................................................................................. 73
3.7.2.1 Detailed genome-scale models .................................................... 73
3.7.2.2 13C MFA analysis ........................................................................ 74
3.8 Conclusions .............................................................................................. 75
Chapter 4 ZEA MAYS iRS1563: A COMPREHENSIVE GENOME-SCALE
METABOLIC RECONSTRUCTION OF MAIZE METABOLISM ........................ 76
4.1 Introduction .............................................................................................. 76
4.2 Results ...................................................................................................... 79
4.2.1 Construction of Auto & Draft models ............................................... 79
4.2.2 Generation of computations-ready model .......................................... 81
4.2.3 Network connectivity analysis and restoration .................................. 86
vii
4.2.4 Zea mays iRS1563 model .................................................................. 88
4.2.5 Light reactions, carbon fixation and secondary metabolism ............. 91
4.2.6 Comparing Zea mays iRS1563 with Arabidopsis thaliana and maize
C4GEM models ................................................................................. 94
4.2.7 Zea mays iRS 1563 model testing ..................................................... 96
4.3 Discussion .............................................................................................. 100
4.4 Materials and Methods ........................................................................... 102
4.4.1 Model reconstruction ....................................................................... 102
4.4.2 Model simulations ............................................................................ 102
Chapter 5 NITROGEN USE EFFICIENCY IN MAIZE (ZEA MAYS L.): FROM
“OMICS” STUDIES TO METABOLIC MODELING ............................................ 105
5.1 Introduction ............................................................................................ 105
5.2 Why improve nitrogen use efficiency in a crop such as maize? ............ 106
5.3 Nitrogen use efficiency: from “omics” studies to systems biology
approaches ............................................................................................... 108
5.4 Transcriptome studies ............................................................................ 109
5.5 Proteome studies .................................................................................... 114
5.6 Metabolome studies ............................................................................... 115
5.7 Integrating “omics” data ........................................................................ 117
5.8 Metabolic modeling as a tool to unravel the limiting steps in NUE ...... 120
5.9 Incorporating transcriptome, proteome, and metabolome data into models
............................................................................................................... 125

viii
5.10 Concluding remarks ............................................................................. 127
Chapter 6 ASSESSING THE METABOLIC IMPACT OF NITROGEN
AVAILABILITY USING A COMPARTMENTALIZED MAIZE LEAF GENOME-
SCALE MODEL ........................................................................................................... 129
6.1 Introduction ............................................................................................ 129
6.2 Results and Discussion ........................................................................... 133
6.2.1 Effect of Nitrogen Conditions on Biomass Components ................. 133
6.2.2 Development of the second-generation maize leaf model ............... 134
6.2.3 Incorporation of ‘omics’ data in the model ...................................... 136
6.2.4 Flux range variations among conditions .......................................... 140
6.3 Concluding remarks ............................................................................... 142
6.4 Materials and Methods ........................................................................... 143
6.4.1 Plant Material ................................................................................... 143
6.4.2 Yield Components Analysis ............................................................ 144
6.4.3 RNA and DNA Preparation ............................................................. 145
6.4.4 Gene Expression Profiles using Maize cDNA Microarrays ............ 145
6.4.5 Statistical Analysis of Maize cDNA Microarray Data .................... 147
6.4.6 Total Protein Extraction, Solubilization, and Quantification ........... 147
6.4.7 Two-dimensional Electrophoresis, Gel Staining, and Image Analysis
148
6.4.8 Protein Identification by LC-MS/MS .............................................. 149
6.4.9 Metabolite Extraction and Analyses ................................................ 149

ix
6.4.10 Metabolome Analysis .................................................................... 151
6.4.11 Model Development and Curation ................................................. 153
6.4.12 Incorporation of Transcriptomic, Proteomic and Metabolomic Data
158
References .......................................................................................................... 161
Appendix ............................................................................................................ 190

x
LIST OF FIGURES
FIGURE 1-1: OUTLINE FOR THE DEVELOPMENT OF A HIGH-QUALITY METABOLIC MODEL. .... 4
FIGURE 2-1: COMPARISON OF MODEL DERIVED AND EXPERIMENTALLY MEASURED [112]
FLUX RANGES FOR SYNECHOCYSTIS 6803 UNDER THE MAXIMUM BIOMASS CONDITION.24
FIGURE 2-2: COMPARISON OF GENE ESSENTIALITY/VIABILITY DATA WITH PREDICTIONS BY A
NUMBER OF SYNECHOCYSTIS 6803 MODELS. ............................................................... 31
FIGURE 2-3: VENN DIAGRAM DEPICTING (COMMON AND UNIQUE) REACTIONS AND
METABOLITES BETWEEN: (A) IJN678 [109] AND ISYN731, (B) ICCE806 [102] AND
ICYT773, AND (C) ISYN731 AND ICYT773 MODELS. ................................................... 34
FIGURE 2-4: SCHEMATICS THAT ILLUSTRATE THE THERMODYNAMICALLY INFEASIBLE
CYCLES AND SUBSEQUENT RESOLUTION STRATEGIES. ................................................. 35
FIGURE 2-5: LIST OF ADDED REACTIONS ACROSS PATHWAYS. (A) ISYN731 COMPARED TO
IJN678 [109], AND (B) ICYT773 COMPARED TO ICCE806 [102]. ................................ 39
FIGURE 2-6: EXAMPLES OF PATHWAYS THAT DIFFER BETWEEN THE TWO CYANOBACTERIA.
................................................................................................................................... 41
FIGURE 3-1: DIFFERENT METHODS FOR CONSTRUCTING CYANOBACTERIAL MUTANTS. ...... 49
FIGURE 3-2: DNA ASSEMBLY METHODS. ........................................................................... 53
FIGURE 3-3: USING FLUXOMICS AND GENOME SCLAE MODELS TO LINK GENOTYPE TO
METABOLIC PHENOTYPE. ............................................................................................ 69
FIGURE 4-1: SPECIES ORIGIN OF NEWLY ADDED REACTIONS IN THE DRAFT MODEL. .......... 81
FIGURE 4-2: EXAMPLE OF CONNECTIVITY RESTORATION FOR PHENYLACETALDEHYDE. .... 88

xi
FIGURE 4-3: DISTRIBUTION OF METABOLITES BASED ON THEIR NUMBER OF APPEARANCE IN
DIFFERENT ORGANELLES. ............................................................................................ 90
FIGURE 4-4: COMPARTMENT AND LOCALIZATION INFORMATION FOR ZEA MAYS IRS1563. . 93
FIGURE 4-5: VENN DIAGRAM FOR GENES, REACTIONS AND METABOLITES. (A) BETWEEN ZEA
MAYS IRS1563 AND ARAGEM, (B) BETWEEN ZEA MAYS IRS1563 AND ARABIDOPSIS
THALIANA IRS1597, AND (C) BETWEEN ZEA MAYS IRS1563 AND MAIZE C4GEM. ....... 95
FIGURE 4-6: MAXIMUM THEORETICAL YIELDS OF (A) GLUCOSE AND (B) GALACTOSE FOR
WILD-TYPE VS BM1 MUTANT AND WILD-TYPE VS BM3 MUTANT, RESPECTIVELY. ......... 99
FIGURE 5-1: CHANGES IN METABOLITE CONTENT, ENZYME ACTIVITIES AND BIOMASS-
RELATED COMPONENTS IN LEAVES OF NINETEEN SELECTED MAIZE LINES COVERING
THEIR GENETIC DIVERSITY (CAMUS-KULANDAIVELU ET AL., 2006) AT TWO KEY STAGES
OF PLANT DEVELOPMENT. ......................................................................................... 119
FIGURE 5-2: ITERATIVE PROCESS OF GENOME-SCALE MODEL BUILDING. .......................... 122
FIGURE 5-3: FLUX BALANCE ANALYSIS USING A METABOLIC MODEL. .............................. 124
FIGURE 6-1: NUMBER OF METABOLIC AND TRANSPORT REACTIONS DISTRIBUTED BETWEEN
COMPARTMENTS IN THE BUNDLE-SHEATH AND MESOPHYLL CELL TYPES. ................. 135
FIGURE 6-2: NUMBER OF METABOLITES IN EACH CONDITION THAT STATISTICALLY VARY
FROM THE WT CONDITION AT THE VEGETATIVE STAGE. ........................................... 140
FIGURE 6-3: EFFECT OF “OMICS” BASED REGULATION ON THE FLUX-SUM PREDICTION
COMPARED TO THE EXPERIMENTAL TREND IN METABOLITE CONCENTRATION. ......... 141
FIGURE 6-4: MODEL DEVELOPMENT AND CURATION SCHEMATIC. ................................... 154

xii
LIST OF TABLES
TABLE 2-1: SYNECHOCYSTIS 6803 ISYN731 AND CYANOTHECE 51142 ICYT773 MODEL
STATISTICS .................................................................................................................. 18
TABLE 2-2: SUMMARY OF CONNECTIVITY RESTORATION IN SYNECHOCYSTIS 6803 ISYN731
AND CYANOTHECE 51142 ICYT773 MODELS ............................................................... 22
TABLE 2-3: COMPARISON OF 13C MFA FLUX MEASUREMENTS [112] VS. MODEL-PREDICTED
FLUX RANGES ............................................................................................................. 25
TABLE 3-1: MODEL STRAINS OF CYANOBACTERIA FOR SYNTHETIC BIOLOGY ..................... 48
TABLE 3-2: INDUCIBLE PROMOTERS USED IN CYANOBACTERIAL HOSTS ............................. 59
TABLE 4-1: MODEL SIZE AFTER EACH RECONSTRUCTION STEP ........................................... 81
TABLE 4-2: MAIZE GENE ANNOTATION VIA BIDIRECTIONAL BLASTP HOMOLOGY SEARCHES
AGAINST NCBI NON-REDUNDANT PROTEIN DATABASE .............................................. 83
TABLE 4-3: BIOMASS COMPONENT LIST IN IRS1563 .......................................................... 85
TABLE 4-4: DEFINITION OF THREE DIFFERENT PHYSIOLOGICAL STATES ............................. 86
TABLE 4-5: RESTORATION OF NETWORK CONNECTIVITY USING GAPFILL [36] ................... 87
TABLE 4-6: CHANGE IN CONTENT OF CELL WALL COMPONENTS IN BM1 AND BM3 MAIZE
MUTANTS .................................................................................................................... 97
TABLE 5-1: TRANSCRIPTS EXHIBITING SIGNIFICANT INCREASE FOLLOWING TRANSFER FROM
LIMITING TO NON-LIMITING N FEEDING CONDITIONS IN DIFFERENT STUDIES AND
ACROSS DIFFERENT SPECIES ...................................................................................... 111
TABLE 6-1: NUMBER OF REACTIONS AFTER EACH MODEL CREATION AND CURATION STEP.
................................................................................................................................. 137

xiii
ACKNOWLEDGEMENTS
I would like to thank my advisor Dr. Costas Maranas for all his guidance. The vision for
the current project, the context of the research and the content of this dissertation have, in
large part, been possible thanks to him. His broad and deep scientific knowledge
combined with his scholarly way of student advising has been exceptionally inspiring
which is why I am, indeed, indebted to him for teaching me how to perform high quality
research. In addition, his incessant emphasis on improving presentation and
communication skills as well as technical writing has played an important role towards
achieving my academic and professional career goals. I would also like to thank to Drs.
Andrew Zydney, Howard Salis and Reka Albert for agreeing to serve on my doctoral
committee. Also I would like to extend special thanks to past and present members of
Costas Maranas’ group specially Dr. Ali Zomorrodi for invaluable guidance as well as
Anupam Chowdhury, Akhil Kumar, Dr. Anthony Burgard, Ali Khodayari and Satyakam
Dash for insightful discussions. I would like to convey my sincere gratitude to my wife
Dr. Shudipto Dishari whose love, encouragement and persistent confidence in me helped
me to stick to my goal. Last but not least, I must thank my parents Bela and Debdash for
their sacrifice, love and continuous support throughout my life and in all my pursuits.

1
1 Chapter 1
RECENT ADVANCES IN THE RECONSTRUCTION OF METABOLIC MODELS AND INTEGRATION OF OMICS DATA
This chapter has been previously published in modified form in Current Opinions in Biology (Saha, R.*, Chowdhury, A.* and C.D. Maranas (2014), "Recent advances in the reconstruction of metabolic models and integration of omics data", Current Opinion in Biotechnology, 29, 39-45) (*Authors contributed equally).
1.1 Introduction
A metabolic network captures the inter-conversion of metabolites through chemical
transformations catalyzed by enzymes. To this end, a metabolic model describes reaction
stoichiometry and directionality, gene to protein to reaction associations (GPRs),
organelle-specific reaction localization, transporter/exchange reaction information,
transcriptional/translational regulation and biomass composition [1]. By defining the
metabolic space, a metabolic model can assess allowable cellular phenotypes under
specific environmental and/or genetic conditions [2, 3]. The number of metabolic models
developed in the past several years is a testament to their increasing usefulness and
penetration in many areas of biotechnology and biomedicine [4-6]. Initially, metabolic
models have been used to characterize biological systems and develop non-intuitive
strategies to reengineer them for enhanced production of valuable bioproducts [7]. More
recently, models have been developed and applied for a variety of goals ranging from
metabolic disease drug target identification, study of microbial pathogenicity and
parasitism (as highlighted in [5]).

2
The validation of high-quality [8] models is critical for not only recapitulating known
physiological properties but also improving their prediction accuracy. Towards this end,
strategies have been developed to incorporate other cellular processes such as
gene/protein expression to better understand the emergence of complex cellular
phenotypes [9, 10]. For example, genome-scale metabolic models of pathogens have been
reconstructed to develop novel drugs for combating infections and also minimize side
effects in the host [11]. An integrated model [12] of E. coli has been developed by
combining Metabolism with gene Expression (i.e., ME model) to increase the scope and
accuracy of model-computable phenotypes corresponding to the optimal growth
condition. In addition, by combining all of the molecular components as well as their
interactions, a whole-cell model [13] has been developed for Mycoplasma genitalium, a
human pathogen, to study previously unexplored cellular behaviors including protein-
DNA association and correlation between DNA replication initiation and replication
itself. Tissue specific models have also been developed for eukaryotic organisms, such as
Homo sapiens [14] and Zea mays [2], to scope out novel therapeutic targets and
characterize metabolic capabilities, respectively. Moving beyond the single cell/tissue
level, multi-cell/multi-tissue type metabolic models have been reconstructed for higher
organisms. For example, Homo sapiens [14, 15] models have been employed for
biomedicine applications and a Hordeum vulgare [16] model has been deployed for
studying crop improvement and yield stability.
With rapid improvements in sequencing (and annotating) tools and techniques, the
number of complete genomes (and annotations) is increasing at an exponential pace [17].
Metabolic models can greatly facilitate the assessment of the potential metabolic
phenotypes attainable by these organisms. Therefore, rapid development of high-quality
metabolic models and algorithms for analyzing their content are of critical importance.
The recent genome-scale metabolic models, their automated generation, improvements
and applications have been reviewed elsewhere [4, 18-20] and will not be covered in
detail in this review. Rather, in this mini-review we will critically evaluate the available

3
repositories, model-building and data integration techniques and existing challenges
related to rapid reconstruction of high-quality metabolic models.
1.2 Metabolic model reconstruction approaches
Metabolic network/model reconstruction process follows three major steps (as
highlighted in Figure 1-1). Initially, upon sequencing and annotating a genome of
interest, literature sources and/or homology searches are used to assign function to all the
Open Reading Frames (i.e., ORFs). For every function with a metabolic fingerprint a
specific chemical transformation is assigned. Therefore, by iteratively marching along the
entire genome, a compilation of reactions encompassing the entire chemistry repertoire of
the organism can be achieved. It must be noted that these models are not necessarily
predictive but instead have a scoping nature by allowing us to assess what is
metabolically feasible. Regulatory constraints on reaction fluxes are incorporated based
on the thermodynamic (i.e., reaction reversibility) and omics (i.e.,
transcriptomic/proteomic) data that can further sharpen predictions.
One of the most critical steps of metabolic model building is to establish GPR
information of a specific organism from biological databases and/or literature sources. To
this end, biological databases (as highlighted in [1]) such as KEGG, SEED, Metacyc,
BKM-react, Brenda, Uniprot, Expasy, PubChem, ChEBI and ChemSpider provide
information about reactions/metabolites and associated enzymes and genes. However, as
illustrated by Kumar et al.[1], incompatibilities in data representation such as metabolites
with multiple names/chemical formulae across databases, stoichiometric errors (i.e.,
elemental or charge imbalances) and incomplete atomistic detail (e.g. absence of stereo-
specificity, and presence of R-group(s)) are key bottlenecks for rapid reconstruction of
new high-quality metabolic models by combining information from these databases.
Recently, databases such as MetRxn [1] have been developed to address these issues by
integrating information (of metabolites and reactions) from eight such databases and 90

4
published metabolic models. Overall, MetRxn (as of Dec, 2013) contains over 44,000
unique metabolites and 35,000 unique reactions that are charge and elementally balanced.
Figure 1-1: Outline for the development of a high-quality metabolic model.
The first step involves retrieving data from different biological databases, physiology and
biochemistry of the organism as well as published literature. In the next step, GPR
associations are established, the biomass equation is described based on experimental
measurement and the model is represented in the form of a stoichiometric matrix.
Furthermore, gaps in the model are identified and reconciled based on established gap
filling techniques. Finally, in the third step high-throughput experimental measurements
such as transcriptomic, proteomic and fluxomic,data are utilized to improve the model
accuracy.

5
In addition to the GPR information, subcellular localization of metabolic
enzymes/reactions is critical to develop the metabolic model of any eukaryotic organism.
In this regard, there exist protein localization databases such as PPDB [21] and SUBA
[22] for plant species (e.g., Arabiopsis thaliana and Zea mays). There are also
computational algorithms [23] to predict enzyme/reaction localization (when limited
amount of localization data is available) by utilizing the embedded metabolic network
and parsimony principal to minimize the number of transporters. However, none of these
databases or algorithms is complete or error-proof, which necessitates manual scrutiny
before making any final reaction assignments in one or multiple intracellular organelle(s).
In addition to databases of metabolic functionalities, there exists a number of
knowledgebases of regulation (e.g., RegulonDB [24] (for E. coli) and Grassius [25] (for
grasses)) and kinetic parameters (e.g., Sabio-RK [26], Ecocyc [27] and Brenda [28] for
E. coli). Nevertheless, such information is largely incomplete and unavailable for all but a
few model organisms, which emphasizes the need to thoroughly refer to primary
published literature sources.
By making use of data from different biological databases, draft metabolic models can be
reconstructed in an automated [18, 29-33] or semi-automated [34-37] fashion. Automated
methods are fast and require minimal user input while semi-automated methods are
slower and require user feedback and inspection. Automated methods such as SEED [29],
BioNetBuilder [30] and ReMatch [31] can integrate data from several databases.
However, the user is responsible for assessing the accuracy of the network gap filling
step, removing thermodynamically infeasible cycles (e.g. using loopless FBA method
[38]) and customizing the biomass composition to the organism of interest. Semi-
automated methods (e.g., RAVEN [34], MicrobeFlux [35] and other works, as
highlighted in [2, 3, 36]), make use of not only available databases but also published
models of closely related species. These methods allow for user-driven gap filling and
growth-discrepancy reconciliation measures and use biomass compositions based on
experimental measurements whenever available. However, the existing semi-automated
algorithms often create thermodynamically infeasible cycles while reconciling any

6
network gaps [39] or fixing growth inconsistencies [40, 41]. Overall, the automated
methods are very useful for developing initial draft models, whereas semi-automated
methods can refine these draft models to bring them to a required completion level.
Free energy reaction change estimates are frequently used to impose thermodynamic
constraints on reaction fluxes, metabolite concentrations and kinetic parameters as
highlighted elsewhere [42, 43]. The group contribution method [44] or recently improved
group contribution method [45] can be utilized to estimate the reaction Gibbs free energy
and ultimately predict the reaction direction. Furthermore, Hamilton et al. have developed
TMFA [46] (Thermodynamics-based Metabolic Flux Analysis) to quantify metabolite
concentrations and reaction free energy ranges and examine the effect of thermodynamic
constraints on the allowable flux space (of the iJR904 E. coli model) that improve model
performance such as gene essentiality prediction. Although TMFA provides some idea
about directionality, the thermodynamic constraints can be too wide. Therefore, as shown
in iAF1260 [47] E. coli model, literature survey still remains the best source for assigning
reaction directionality.
1.3 Integration of omics data in metabolic models
In this section we review recent developments in integrating high-throughput omics data
with metabolic models and critically analyze their contribution towards improving the
genotype-phenotype prediction and metabolic network properties. Due to the
underdetermined nature of genome-scale metabolic models, a lot of effort has been
expended at improving the accuracy of estimation for the reaction fluxes. Metabolic Flux
Analysis (MFA) [48] is a unique resource for quantifying internal metabolic fluxes by
using relative enrichment of substrate labels from isotope labeling experiments (ILE) as
additional information [49-51]. Detailed atom-transition information for each reaction
involved in the MFA network is collected either from literature (for well-studied
pathways), databases [52, 53], or from motif-searching optimization algorithms [54, 55].
Subsequently, the fluxes and their confidence intervals in the network are estimated by
7
minimizing the sum-squared error between experimental and simulated mass isotopomer
distribution (MID) data using different optimization frameworks. Recent advances in the
systematic identification of the input substrate labels [56] and the design of labeling
experiments (e.g. [57]) has improved the accuracy and scope of flux estimation. The
inferred flux data could then be integrated into metabolic models for further sharpening
the allowable flux ranges of the remaining reactions in the model (using Flux Variability
Analysis). A key impediment of MFA is that it is generally applied to core models of
metabolism [58] spanning less than 5% [59] of a genome-scale metabolic model. As a
result, flux information is generally available for the central carbon metabolism of the
organism with limited information on flux redirections in other parts of metabolic
network in response to genetic or environmental perturbations. In addition, the results are
sensitive to the selection of the metabolic network used to fit the labeling data [59]. Even
though recent attempts have been made at constructing large-scale MFA networks using
the flux coupling method [60] and the elementary carbon modes approach [61], flux
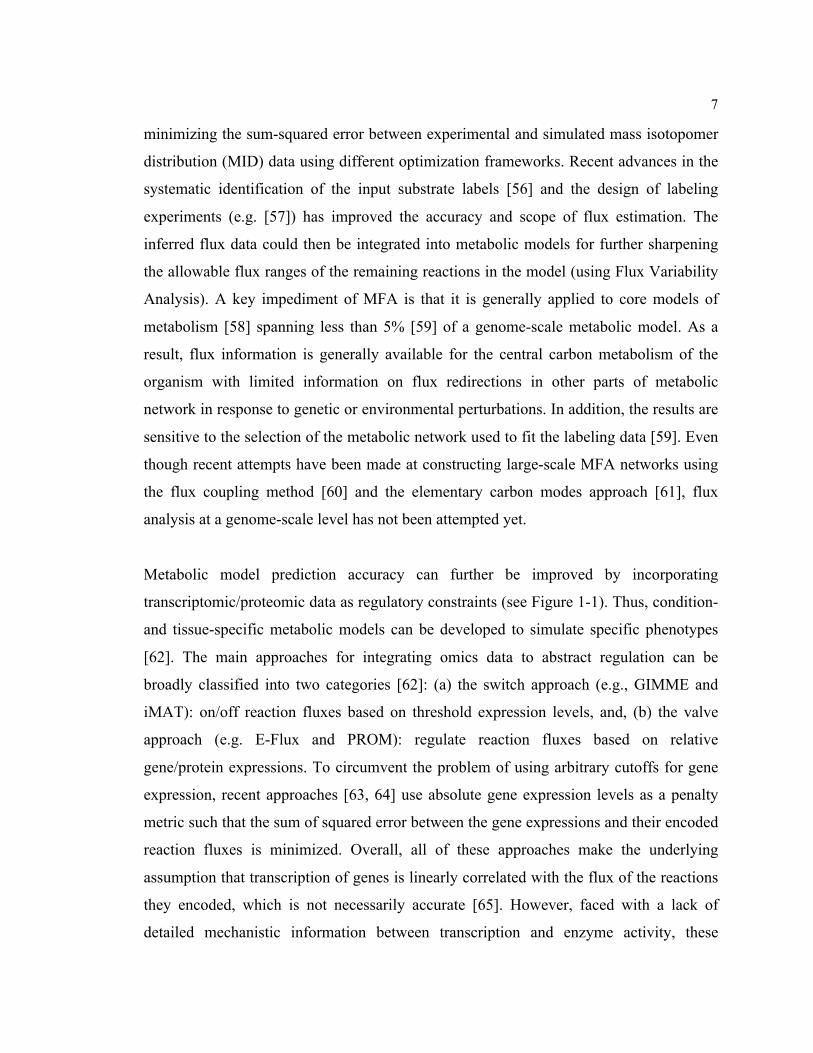
analysis at a genome-scale level has not been attempted yet.
Metabolic model prediction accuracy can further be improved by incorporating
transcriptomic/proteomic data as regulatory constraints (see Figure 1-1). Thus, condition-
and tissue-specific metabolic models can be developed to simulate specific phenotypes
[62]. The main approaches for integrating omics data to abstract regulation can be
broadly classified into two categories [62]: (a) the switch approach (e.g., GIMME and
iMAT): on/off reaction fluxes based on threshold expression levels, and, (b) the valve
approach (e.g. E-Flux and PROM): regulate reaction fluxes based on relative
gene/protein expressions. To circumvent the problem of using arbitrary cutoffs for gene
expression, recent approaches [63, 64] use absolute gene expression levels as a penalty
metric such that the sum of squared error between the gene expressions and their encoded
reaction fluxes is minimized. Overall, all of these approaches make the underlying
assumption that transcription of genes is linearly correlated with the flux of the reactions
they encoded, which is not necessarily accurate [65]. However, faced with a lack of
detailed mechanistic information between transcription and enzyme activity, these

8
frameworks provide a “first-guess” type estimate for correlating genotype with
phenotype.
Regulatory signaling and transcription networks have been integrated as separate
modules with metabolic networks [66, 67]. Generally, these are simulated as boolean
networks where information from signaling molecules and transcription factors is carried
as on-off signals to target proteins. Similar frameworks have also been constructed for
translation and post-translational regulation [68, 69]. Besides providing a mechanistic
basis for correlating the genotype with the observed phenotype, these integrated
frameworks have the added advantage of being dynamic in nature. Each module is
assumed to be in an independent quasi-steady state during a specific time interval, and is
updated for the next interval by solving a system of ordinary differential equations
(ODEs) of the variables (e.g. enzyme and metabolite concentrations, transcription factors,
and mRNA abundances) interacting at the interface of two modules. More recently, this
framework has been extended to construct the first whole-cell model of M. genitalium
[13], where 28 cellular functions designed as distinct modular networks have been
integrated into a whole-cell dynamic framework interacting at the edges with ODEs of
eight types of common variables. The whole-cell network couples metabolic and non-
metabolic functions, as well as temporal information of protein localization and cell
replication. However, it requires a detailed mechanistic approach to accurately describe
transcription, translation and regulation of the enzyme activities, which is seldom
available. In addition, the assumption that each module is at a quasi-steady state within
the same time interval may not be universally applicable. Nevertheless, the whole-cell
model framework is a major landmark in the reconstruction of integrated metabolic
networks.
Integrated frameworks for metabolic model development discussed so far do not use
detailed mechanistic relations to link gene expressions with reaction fluxes. The ME
model framework [12, 70] has been developed to provide a detailed mechanistic basis to
quantify transcription of mRNA, translation of proteins, formation of protein complexes,

9
catalysis of reactions and formation of macromolecules. Similar to flux balance analysis
(FBA), simulations using ME models minimize the cellular machinery required to sustain
an experimentally observed growth rate, where protein dilution is coupled with the
growth of the organism. This framework can predict gene and protein expressions with
reasonable accuracy along with an improved prediction for reaction fluxes. The ME
model is also able to drive discovery of protein regulation. Despite not accounting for any
post-transcriptional regulation, the ME framework provides a significant step towards a
systems-wide quantitative description of biological processes.
Several attempts have also been made to link the enzyme activity and metabolite
concentrations with the reaction fluxes of detailed mechanistic networks. Detailed kinetic
models have been constructed using steady-state phenotype information for the wild-type
organism and several of its mutants. For example, Cotton et al. [71] have constructed the
kinetic model of central metabolism for E. coli, where the kinetic parameters are
identified by minimizing the error between the experimental and model-predicted values
of metabolite concentrations and enzyme activity for the wild-type and several of its
single gene mutants [72]. The kinetic expressions are imported from an earlier kinetic
model for E. coli [73]. Likewise, Vital Lopez et al. [74] have constructed a kinetic
network for E. coli central metabolism spanning over 100 reactions using mass action
kinetic expressions derived from transcriptomic and fluxomic data. The major restrictions
in these models are either the size of the network (for the first one [71]), or the accuracy
of the kinetic expressions (for the latter one [74]). Such limitations could be resolved by
using the ensemble modeling approach [75] where each reaction is decomposed into its
elementary steps (with detailed regulations, available from databases (e.g. BRENDA
[28]), and the ensemble of kinetic models is filtered using fluxomic data for mutants.
Genome-scale kinetic models using approximate mass action [76] or lin-log kinetics [77]
have also been developed. In the latter approach [77], the kinetic parameters are
estimated from metabolomic information and FBA. While these methods require
significantly more refinement, especially in the construction of the kinetic expressions,

10
they delineate a strategy for future construction of high confidence, integrated metabolic
networks linking the genome to the observable phenotypes.
1.4 Concluding remarks
Metabolic network models play an important role in quantitatively assessing the
allowable metabolic phenotype of an organism and thereby can be deployed to guide
metabolic engineering, synthetic biology and/or drug targeting interventions. Through the
coordinated use of biological databases, model building strategies and high-throughput
omics-data integration techniques both the quality and scope of metabolic models is
increasing. However, significant knowledge gaps and a lack of best-practice
methodologies require additional scrutiny. For example, delineating the effect of different
levels of regulation (transcriptional, translational and/or post-translational) on metabolic
flux would help establish the connectivity and directionality of regulation in metabolic
models. In addition, the design of labeling protocols that will enable the elucidation of
metabolic fluxes beyond core metabolism in a high-throughput manner for a number of
genetic and/or environmental perturbations will provide the basis for the parameterization
and construction of more predictive metabolic models. Finally, the adoption of common
standards in metabolite and reaction description will speed up sharing of information
across database resources. By integrating “best-practice” lessons learned from model
organisms the development of systematic workflows will facilitate the construction of
high-quality metabolic models for less studied organisms.

11
2 Chapter 2 RECONSTRUCTION AND COMPARISON OF THE METABOLIC POTENTIAL OF CYANOBACTERIA CYANOTHECE SP. ATCC 51142 AND SYNECHOCYSTIS SP. PCC 6803
This chapter has been previously published in modified form PLoS One (Saha, R., A.T. Verseput, B.M. Berla, T.J.Mueller, H.B. Pakrasi and C.D.Maranas (2012), "Reconstruction and comparison of the metabolic potential of cyanobacteria Cyanothece sp. ATCC 51142 and Synechocystis sp. PCC 6803," PLoS ONE, 7(10):e48285).
2.1 Introduction
Cyanobacteria represent a widespread group of photosynthetic prokaryotes [78]. By
contributing oxygen to the atmosphere, they played an important role in the precambrian
phase [79]. Cyanobacteria are primary producers in aquatic environments and contribute
significantly to biological carbon sequestration, O2 production and the nitrogen cycle [80-
82]. Their inherent photosynthetic capability and ease in genetic modifications are two
significant advantages over other microbes in the industrial production of valuable
bioproducts [83]. In contrast to other microbial production processes requiring regionally
limited cellulosic feedstocks, cyanobacteria only need CO2, sunlight, water and a few
mineral nutrients to grow [83]. Sunlight is the most abundant source of energy on earth.
The incident solar flux onto the USA alone is approximately 23,000 terawatts which
dwarfs the global energy usage of 3.16 terawatts [84]. Cyanobacteria perform
photosynthesis more efficiently than terrestrial plants (3-9% vs. 2.4-3.7%) [85]. The short
life cycle and transformability of cyanobacteria combined with a detailed understanding
of their biochemical pathways are significant advantages of cyanobacteria as efficient
platforms for harvesting solar energy and producing bio-products such as short chain
alcohols, hydrogen and alkanes [83].

12
The genus Cyanothece includes unicellular cyanobacteria that can fix atmospheric
nitrogen. Cyanothece sp. ATCC 51142 (hereafter Cyanothece 51142) is one of the most
potent diazotrophs characterized and the first to be completely sequenced [86]. Studies
show that it can fix atmospheric nitrogen at rates higher than many filamentous
cyanobacteria and also accommodate the biochemically incompatible processes of
photosynthesis and nitrogen fixation within the same cell by temporally separating them
[87]. Synechocystis sp. PCC 6803 (hereafter Synechocystis 6803), the first photosynthetic
organism with a completely sequenced genome [88], is probably the most extensively
studied model organism for photosynthetic processes [89]. It is also closely related to
Cyanothece 51142 and shares many characteristics with all Cyanothece [86]. The genome
of Cyanothece 51142 is about 35% larger than that of Synechocystis 6803 mostly due to
the presence of nitrogen fixation and temporal regulation related genes in Cyanothece
51142 [86]. Synechocystis 6803 has been the subject of many targeted genetic
manipulations (e.g., expression of heterologous gene products) as a photo-biological
platform for the production of valuable chemicals such as poly-beta-hydroxybutyrate,
isoprene, hydrogen and biofuels [89-97]. However, genetic tools for Cyanothece 51142
are still lacking thus hampering its wide use as a bio-production strain even though it has
many attractive native pathways. For example, Cyanothece 51142 can produce (in small
amounts) pentadecane and other hydrocarbons while containing a novel (though
incomplete) non-fermentative pathway for producing butanol [98, 99].
A breakthrough in solar biofuel production will require following one of two strategies:
1) obtaining photosynthetic strains that naturally have high-throughput pathways
analogous to those in known biofuel producers, or 2) creating cellular environments
conducive for heterologous enzyme function. Despite its attractive capabilities including
nitrogen fixation and H2 production [96], unfortunately genetic tools are not currently
available to efficiently test engineering interventions directly for Cyanothece 51142.
Therefore, a promising path forward may be to use Synechocystis 6803 as a “proxy” (for
which a comprehensive genetic toolkit is available) and subsequently transfer knowledge
gained during experimentation with Synechocystis 6803 to Cyanothece 51142. This
requires high quality metabolic models for both organisms. Comprehensive genome-wide

13
metabolic reconstructions include the complete inventory of metabolic transformations of
a given cyanobacterial system. Comparison of the metabolic capabilities of Cyanothece
51142 and Synechocystis 6803 derived from their corresponding genome-scale models
will provide valuable insights into their niche biological functions and also open up new
avenues for economical biofuel production.
Genome-scale models (GSM) contain gene to protein to reaction associations (GPRs)
along with a stoichiometric representation of all possible biotransformations known to
occur in an organism combined with a set of appropriate regulatory constraints on each
reaction flux [100, 101]. By defining the global metabolic space and flux distribution
potential, GSMs can assess allowable cellular phenotypes under specific environmental
conditions [100, 101]. The first genome-scale model for Cyanothece 51142 was recently
published [102]. The authors addressed the complexity of the electron transport chain
(ETC) and explored further the specific roles of photosystem I (PSI) and photosystem II
(PSII). In contrast, Synechocystis 6803 has been the target for metabolic model
reconstruction for quite some time [89, 103-109]. Most of these earlier efforts for
Synechocystis 6803 focused on only central metabolism [103-105]. Knoop et al. [89] and
Montagud et al. [107, 108] developed genome-scale models for Synechocystis 6803,
analyzed growth under different conditions, identified gene knock-out candidates for
enhanced succinate production and performed flux coupling analysis to detect potential
bottlenecks in ethanol and hydrogen production. A more recent model describes in detail
the photosynthetic apparatus, identifies alternate electron flow pathways and highlights
the high photosynthetic robustness of Synechocystis 6803 during photoautotrophic
metabolism [109]. All these efforts have brought about an improved understanding of the
metabolic capabilities of Synechocystis 6803 and cyanobacterial systems in general.
This paper introduces high-quality genome-scale models for Cyanothece 51142 iCyt773
and Synechocystis 6803 iSyn731 (as shown in Table 2-1) that integrate all recent
developments [102, 109], supplements them with additional literature evidence and
highlights their similarities and differences. As many as 322 unique reactions are
introduced in the Synechocystis iSyn731 model and 266 in Cyanothece iCyt773. New

14
pathways include, among many, a TCA bypass [110], heptadecane biosynthesis [98] and
detailed fatty acid biosynthesis in iSyn731 and comprehensive lipid and pigment
biosynthesis and pentadecane biosynthesis [98] in iCyt773. For the first time, not only
extensive gene essentiality data [111] is used to assess the quality of the developed model
(i.e., iSyn731) but also the allowable model metabolic phenotypes are contrasted against
MFA flux data [112]. The diurnal rhythm of Cyanothece metabolism is modeled for the
first time via developing separate (light/dark) biomass equations and regulating metabolic
fluxes based on available protein expression data over light and dark phases [113].
2.2 Materials and methods
2.2.1 Measurement of biomass precursors
2.2.1.1 Growth conditions
Wild-type Synechocystis 6803 and Cyanothece 51142 were grown for several days from
an initial OD730 of ~0.05 to ~0.4. Synechocystis 6803 was grown in BG-11 medium [114]
and Cyanothece 51142 in ASP2 medium [115] with (+N) or without (-N) nitrate. All
cultures were grown in shake flasks with continuous illumination of ~100 µmol
photons/m2/sec provided from cool white fluorescent tubes. Synechocystis was
maintained at 30°C and Cyanothece at 25°C. For Synechocystis, the illumination was
constant and doubling time was ~24 hours. Cyanothece alternated between 12 hours of
light and 12 hours of darkness, with a doubling time of ~48 hours.
2.2.1.2 Pigments
1 mL of cells of both Synechocystis 6803 and Cyanothece 51142 (from light and dark
phases) was pelleted and extracted twice with 5 mL 80% aqueous acetone and the
extracts pooled. Spectra of this extract and of a sample of whole cells were taken on a

15
DW2000 spectrophotometer (Olis, GA, USA) against 80% acetone or BG-11 media as a
reference. Chlorophyll a contents were calculated as reported [116] from the acetone
extract. Total carotenoid concentrations were also calculated from the acetone extract
according to a published method [117]. The relative amounts of different carotenoids
included in the biomass equation were estimated according to known ratios [118].
Concentrations of phycocyanin were estimated from the spectra of intact cells [119]. All
measurements were taken in triplicate.
2.2.1.3 Amino Acids
Total protein contents were measured using a Pierce BCA Assay kit. Amino acid
proportions were determined according to published shotgun proteomics data for both
Cyanothece 51142 and Synechocystis 6803 across a range of conditions [120] according
to the following procedure: From peptide-level data, each mass spectral observation of a
peptide was taken as an instance of a particular protein. The amino acid composition of
each protein was taken from data in Cyanobase (http://genome.kazusa.or.jp/cyanobase)
and thus the ‘proteome’ was taken to include all of the proteins whose peptides were
observed in our data set, in proportion according to how often their peptides were
observed. Amino acid frequencies were averaged across the proteome by a weighting
factor of number of observations divided by the number of amino acids in the protein,
similar to RPKM normalization for next-gen sequencing [121].
2.2.1.4 Other cellular components
The compositions of other cellular components of Synechocystis 6803 and Cyanothece
51142 were estimated based on values in the literature. DNA and RNA contents for
Synechocystis 6803 were reported by Shastri and Morgan [104]. The remaining biomass
components of Synechocystis 6803 (i.e., lipid, soluble pool and inorganic ions) were
extracted from the measurements carried out by Nogales et al.[109]. For Cyanothece
51142, biochemical compositions of macromolecules such as lipids, RNA, DNA and

16
soluble pool were extracted from the measurements reported by Vu et al. [102].
2.2.2 Model simulations
Flux balance analysis (FBA) [122] was employed in both the model validation and model
testing phases. Cyanothece iCyt773 and Synechocystis iSyn731 models were evaluated in
terms of biomass production under several scenarios: light and dark phases, heterotrophic
and mixotrophic conditions. Flux distributions for each one of these states were inferred
using FBA:
Maximize vbiomass
Subject to
Sijvj = 0 ! i " 1,....., nj=1
m
# (1)
vj ,min ! v
j ! v
j ,max " j # 1, ....., m (2)
Here, Sij is the stoichiometric coefficient of metabolite i in reaction j and vj is the flux
value of reaction j. Parameters vj,min and vj,max denote the minimum and maximum
allowable fluxes for reaction j, respectively. Light and dark phases in Cyanothece 51142
are represented via modifying the minimum or maximum allowable fluxes with the
following constraints, respectively:
vGlytr = 0 and
vGlyctr = 0 (3)
vCO
2tr
= 0 , vGlytr = 0 ,
vlight = 0 and vcf = 0 (4)
Here, vBiomass is the flux of biomass reaction and vGlytr, vGlyctr and vCO2tr are the fluxes of
glycerol, glycogen and carbon dioxide transport reactions and vlight and vcf are the fluxes
of light reactions and carbon fixation reactions. For light phase, constraint (3) was
included in the linear model, whereas for dark phase constraint (4) was included.
Once the Synechocystis iSyn731 model was validated, it was further tested for in silico
gene essentiality. The following constraint(s) was included individually in the linear
model to represent any mutant:

17
v
mutant = 0 (5)
Here, vmutant represents flux of reaction(s) associated with any genetic mutation.
Flux variability analysis [123] for the reactions (for which photoautotrophic 13C MFA
measurements [112] were available) was performed based on the following formulation:
Maximize/Minimize vj
Subject to
Sijvj = 0 ! i " 1,....., nj=1
m
# (1)
vj ,min ! v
j ! v
j ,max " j # 1, ....., m (2)
vBiomass
! vmin
Biomass (8)
Here, 𝑣!"#!"#$%&& is the minimum level of biomass production. In this case we fixed it to be
the optimal value obtained under light condition for the Synechocystis iSyn731 model.
CPLEX solver (version 12.1, IBM ILOG) was used in the GAMS (version 23.3.3, GAMS
Development Corporation) environment for implementing GapFind and GapFill [39] and
solving the aforementioned optimization models. All computations were carried out on
Intel Xeon E5450 Quad-Core 3.0 GH and Intel Xeon E5472 Quad-Core 3.0 GH
processors that are the part of the lionxj cluster (Intel Xeon E type processors and 96 GB
memory) of High Performance Computing Group of The Pennsylvania State University.

18
Table 2-1: Synechocystis 6803 iSyn731 and Cyanothece 51142 iCyt773 model statistics
aOthers include proteins involve in complex relationships, e.g. multiple proteins act as protein complex which is one of the isozymes for any specific reaction. bSpontaneous reactions are those without any enzyme as well as gene association. cMetabolites represent total number of metabolites with considering their compartmental specificity.
Synechocystis 6803
iSyn731 model
Cyanothece 51142
iCyt773 model
Included genes 731 773
Proteins 511 465
Single functional proteins 348 336
Multifunctional proteins 91 83
Isozymes 4 1
Multimeric proteins
32 22
Othersa
36 23
Reactions
1,156 946
Metabolic reactions 972 761
Transport reactions 127 128
GPR associations
Gene associated (metabolic/transport) 827 686
Spontaneousb
180 158
Nongene associated
(metabolic/transport) 59 16
No protein associated 90 86
Exchange reactions 57 57
Metabolitesc
996 811
Cytosolic 862 675
Carboxisomic 8 8
Thylakoidic 10 9
Periplasmic 59 62
Extracellular 57 57

19
2.3 Results and Discussion
2.3.1 Model components
2.3.1.1 Biomass composition and diurnal cycle
The biomass equation approximates the dry biomass composition by draining all building
blocks or precursor molecules in their physiologically relevant ratios. Most of the earlier
genome-scale modeling efforts [89, 106, 107] of Synechocystis 6803 contain approximate
biomass equations completely or partially adopted from other species without direct
measurements. This can adversely affect the accuracy of maximum biomass yield
calculations, gene essentiality predictions and knockouts for overproduction.
Biomass composition for Synechocystis iSyn731 and Cyanothece iCyt773 models were
generated by defining all essential cellular biomass content values by experimental
measurement or collection from existing literature (see ‘Materials and Methods’ for
detail). Macromolecules present in both cyanobacteria such as protein, carbohydrates,
lipids, DNA, RNA, pigments, soluble pool and inorganic ions were assigned to their
corresponding metabolic precursors (e.g., L-glycine, glucose, 16C-lipid, ATP, dGTP,
beta-carotene, coenzyme A and potassium respectively). Based on the experimental
measurements of precursor molecules needed to form a gram of the biomass,
stoichiometric coefficients were assigned. For Synechocystis 6803 we measured
compositions of proteins and pigments and extracted compositions of the remaining
biomass macromolecules from the model by Nogales et al. [109]. Thereby we developed
biomass equations for three different conditions: photoautotrophic, mixotrophic and
heterotrophic. Experimental measurements (described in the Materials and Methods
section) showed that biomass composition (i.e., mainly pigments) varies for Cyanothece
51142 between light and dark conditions and nitrogen supplementation. Since pigments
such as chlorophyll, carotenoids and phycocyanobilin play important roles in
photosynthetic processes their quantities are consequently higher under light conditions.
In the presence of light Cyanothece 51142 uses photosynthesis to store solar energy in the

20
form of carbohydrates (i.e., glycogen), while in dark it expends that energy to fix
nitrogen. Surprisingly, no significant change was measured in the carbohydrate pool
between light and dark phases due to infinitesimal contribution of photosynthetically
stored carbohydrates to total carbohydrate content in the biomass of Cyanothece 51142.
Aggregate quantities of the remaining biomass macromolecules for Cyanothece 51142
such as lipids, RNA, DNA and soluble pool were extracted from the most recent
Cyanothece 51142 model by Vu et al. [102] to develop biomass equations for light and
dark phases.
An earlier characterization study for Cyanothece 51142 revealed that 113 proteins are
expressed in higher abundance in the light phase while 137 are expressed in higher
abundance in dark conditions [113]. The constructed model spans 26 light-specific
proteins, associated with 36 reactions mainly involved in fatty acid, pigment, and amino
acid metabolism and 11 dark-specific proteins accounting for 16 reactions from
glycolysis, purine, pyrimidine, pyruvate, and amino acid metabolism. Separate biomass
equations as well as two regulatory structures for the model were derived in order to
represent diurnal metabolic differences for Cyanothece 51142. In contrast, diurnal
differences observed in Synechocystis 6803 [124] are less pronounced (i.e., observed for
only 54 genes) and less well functionally annotated (i.e., 32 genes with ‘unassigned’
functions). When compared to existing biomass equations of Synechocystis 6803 [89,
107] we found significantly lower values for the percent weight contribution of proteins
towards the biomass pool (i.e., 52% for Synechocystis 6803 and 53% for Cyanothece
51142 vs. 84% [89] and 66% [107], respectively). The new protein biomass contribution
is in better agreement with the previously reported value of 55% for Cyanothece 51142
[125].
2.3.1.2 Identification and correction of network gaps
Upon ensuring biomass formation, GapFind [39] was applied to assess network
connectivity and blocked metabolites. By applying Gapfill [39] putative reconnection
hypotheses were identified for blocked metabolites. Only the suggested modifications

21
that were independently corroborated using literature sources and also did not lead to the
introduction of thermodynamically infeasible cycle were included in the model. For
Synechocystis iSyn731 model, GapFind [39] identified 207 blocked metabolites. Note
that there exist 125 blocked metabolites in the iJN678 model [109]. GapFill [39]
identified unblocking hypotheses for 138 blocked metabolites. However, 88 of them led
to the generation of infeasible thermodynamic cycles and thus were excluded. For only 5
blocked metabolites corroborating evidence for reconnection was obtained by adding 10
reactions (i.e., 2 metabolic, 4 transport and 4 exchange reactions). The added metabolic
reactions have unknown gene associations while all 4 added transport reactions involve
passive diffusion and thus are not associated with any specific gene(s) or protein(s).
Ultimately, the 45 remaining blocked metabolites with GapFill suggested (but
unconfirmed) reconnection mechanisms along with 69 blocked metabolites with no
reconnection hypotheses were retained in the model iSyn731, while metabolites such as
ubiquinone, which was proposed as an alternate substrate for succinate dehydrogenase
[32] was excluded from iSyn731.
For the Cyanothece iCyt773 model, 74 blocked metabolites were found after applying
GapFind [39]. Note that there are 66 blocked metabolites in iCce806 [102]. Two
exchange reactions were added to allow the uptake of glucose and thyaminose ensuring
biomass production under heterotrophic or mixotrophic conditions. Four blocked
metabolites directly adopted from iCce806 (during the draft model creation phase) were
linked to five reactions with spurious gene associations and thus both metabolites and
reactions were removed from iCyt773. GapFill [39] suggested re-connection
mechanisms for 52 blocked metaboloites (out of a total of 70). However, for 12 blocked
metabolites the re-connection model modifications led to the creation of
thermodynamically infeasible cycles and thus were discarded. Corroborating evidence for
the reconnection of 30 blocked metabolites was identified through the addition of 19
GapFill suggested reactions (i.e., 8 metabolic, 7 transport and 4 exchange reactions). Of
the eight added metabolic reactions we found direct literature evidence for five,
homology-based evidence for one while two reactions are spontaneous. All seven added
transport reactions are through passive diffusion and thus are not connected with any

22
specific gene(s) or protein(s). Ten remaining blocked metabolites with GapFill suggested
reconnection hypotheses (along with 22 with no reconnection hypotheses) were left
blocked in iCyt773 as no information to corroborate the GapFill suggested changes was
found in the published literature and databases. For example, biotin is produced in
Cyanothece 51142; however, there is no literature evidence to support the presence of the
initial step of the primary production pathway (i.e., conversion of pimeloyl-CoA from
pimelate) and the intermediate step (i.e., biotransformation of 7,8-diamino-nonanoate
from 8-amino-7-oxononanoate). This indicates that Cyanothece 51142 may utilize a
currently unknown pathway for producing biotin. The six other blocked metabolites are
involved in the nonfermentative alcohol production pathway (as explained in model
comparison section) known to be incomplete in Cyanothece 51142. Table 2-2
summarizes the results related to connectivity restoration of Synechocystis iSyn731 and
Cyanothece iCyt773 models.
Table 2-2: Summary of connectivity restoration in Synechocystis 6803 iSyn731 and
Cyanothece 51142 iCyt773 models
Synechocystis
6803 iSyn731
Cyanothece
51142 iCyt773
Number of blocked metabolites 207 74
Number of metabolites with GapFill [39]
suggested reconnection strategies 138 52
Number of metabolites whose reconnection
forms a cycle 88 12
Number of metabolites with validated
reconnection mechanisms 5 30
Number of added reactions to the model 10 19
23
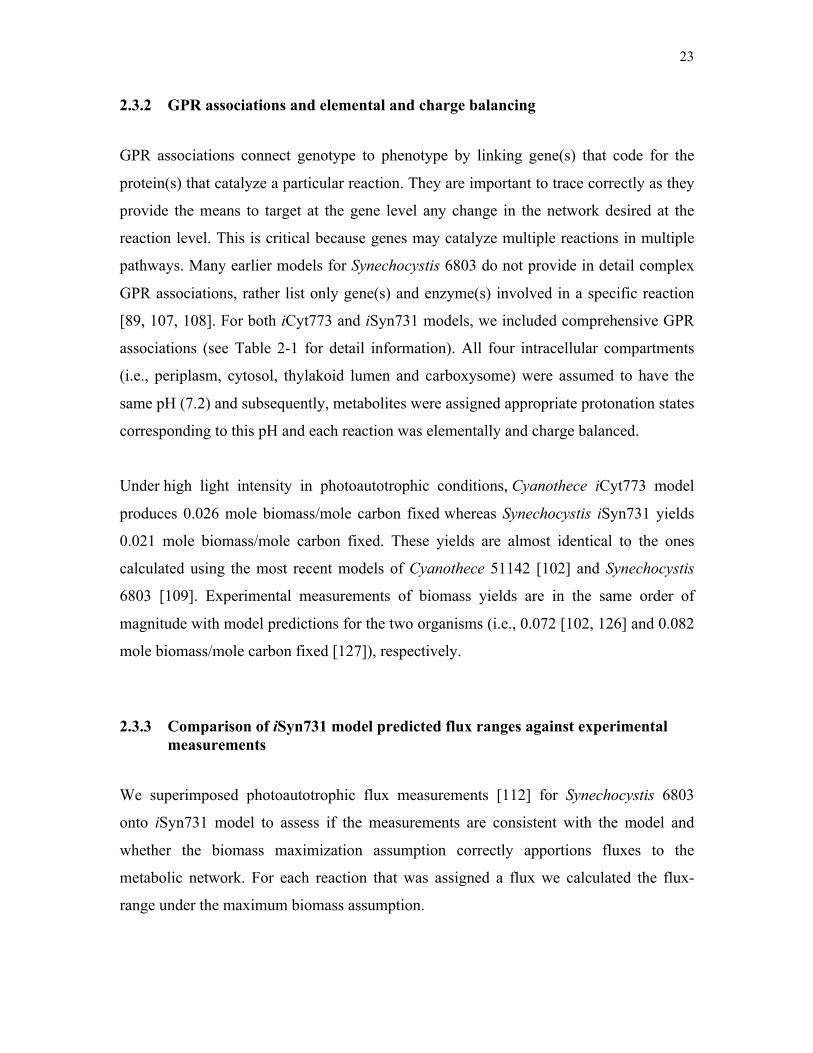
2.3.2 GPR associations and elemental and charge balancing
GPR associations connect genotype to phenotype by linking gene(s) that code for the
protein(s) that catalyze a particular reaction. They are important to trace correctly as they
provide the means to target at the gene level any change in the network desired at the
reaction level. This is critical because genes may catalyze multiple reactions in multiple
pathways. Many earlier models for Synechocystis 6803 do not provide in detail complex
GPR associations, rather list only gene(s) and enzyme(s) involved in a specific reaction
[89, 107, 108]. For both iCyt773 and iSyn731 models, we included comprehensive GPR
associations (see Table 2-1 for detail information). All four intracellular compartments
(i.e., periplasm, cytosol, thylakoid lumen and carboxysome) were assumed to have the
same pH (7.2) and subsequently, metabolites were assigned appropriate protonation states
corresponding to this pH and each reaction was elementally and charge balanced.
Under high light intensity in photoautotrophic conditions, Cyanothece iCyt773 model
produces 0.026 mole biomass/mole carbon fixed whereas Synechocystis iSyn731 yields
0.021 mole biomass/mole carbon fixed. These yields are almost identical to the ones
calculated using the most recent models of Cyanothece 51142 [102] and Synechocystis
6803 [109]. Experimental measurements of biomass yields are in the same order of
magnitude with model predictions for the two organisms (i.e., 0.072 [102, 126] and 0.082
mole biomass/mole carbon fixed [127]), respectively.
2.3.3 Comparison of iSyn731 model predicted flux ranges against experimental measurements
We superimposed photoautotrophic flux measurements [112] for Synechocystis 6803
onto iSyn731 model to assess if the measurements are consistent with the model and
whether the biomass maximization assumption correctly apportions fluxes to the
metabolic network. For each reaction that was assigned a flux we calculated the flux-
range under the maximum biomass assumption.

24
Figure 2-1: Comparison of model derived and experimentally measured [112] flux
ranges for Synechocystis 6803 under the maximum biomass condition.
Basis is 100 millimole of CO2 plus H2CO3.
Perhaps the most informative discrepancy is for the CO2 fixing RuBisCO (RBC) reaction,
which has a measured flux range of (123.00 to 132.00) vs. the model-calculated range of
(102.49 to 106.33). In both cases the increased RBC flux (in comparison to the basis of
100 millimole of CO2 plus H2CO3 uptake) is needed to counteract the carbon loss due to
the CO2 releasing reactions such as isocitrate dehydrogenase (ICD) and pyruvate
dehydrogenase (PDH).

25
Table 2-3: Comparison of 13C MFA flux measurements [112] vs. model-predicted flux
ranges
Table 2-3 and Figure 2-1 summarize the obtained results for a basis of 100 millimole of
CO2 plus H2CO3 uptake [112]. In seven (out of thirty one) cases the measured flux is
fully contained within the model predicted ranges obtained upon maximizing biomass
formation implying model consistency with MFA measurements. In contrast, under the
Reaction
Flux measurements
by Young et al., 2011 [35]
Flux ranges predicted by
iJN678 model (With max biomass)
Flux ranges predicted by
iSyn731 model (With max biomass)
95% LB 95% UB LB UB LB UB
RBC 123.00 132.00 109.02 109.10 102.49 106.33
PGK 219.00 237.00 187.11 187.25 182.70 182.92
13PDG 219.00 237.00 187.11 196.36 182.70 201.96
GAPDH 90.00 99.00 74.98 75.07 73.40 73.50
FBA 53.00 66.00 -0.17 74.85 -0.08 73.17
FBP 53.00 66.00 0.00 74.85 0.00 73.17
PGI 15.00 24.00 0.68 0.73 0.82 0.84
G6PD 12.00 21.00 0.00 0.05 0.00 0.03
6PGL 12.00 21.00 0.00 0.05 0.00 0.03
6PGD 12.00 21.00 0.00 0.05 0.00 0.03
PRK 123.00 132.00 109.02 109.10 106.24 106.32
SBGPL 29.00 43.00 -0.17 74.85 -0.08 73.17
SBP 29.00 43.00 0.00 74.85 0.00 73.17
TAL -6.00 9.00 -36.74 38.28 -35.93 37.32
TKT1 37.20 37.50 36.57 36.60 36.66 36.79
RPI 35.40 35.70 35.18 35.21 35.82 35.86
TKT2 35.40 35.70 37.25 37.28 36.18 36.23
RPE 75.50 76.20 73.83 73.88 72.01 72.10
PGM 22.90 23.60 26.83 26.95 25.92 29.79
ENO 23.40 23.80 26.84 26.95 25.92 29.79
PYK 7.90 11.10 0.00 13.88 0.00 16.72
PDH 11.50 12.00 0.00 8.97 0.00 13.46
CS 3.00 3.40 2.15 2.21 1.35 1.37
ACONT 3.00 3.40 2.15 2.21 1.35 1.37
ICD 3.00 3.00 2.15 2.21 1.32 1.37
SUCD 0.00 0.40 0.00 0.00 0.00 0.00
FUM 1.70 2.00 -5.44 1.55 -7.26 1.49
MDH 1.90 5.20 5.35 5.61 7.15 7.32
ME1 3.70 6.90 0.00 0.17 0.00 0.08
ME2 3.70 6.90 - - 0.00 0.08
PPC 9.90 13.20 11.74 11.98 12.25 12.37

26
maximum biomass assumption for thirteen fluxes the ranges underestimate and for four
fluxes the ranges overestimate the experimentally deduced flux ranges while for seven
fluxes the model derived flux ranges partially overlap with the experimental ones.
We find that flux ranges, under the maximum biomass production assumption, of
reactions such as glucose 6-phosphate dehydrogenase (G6PD), 6-
phosphogluconolactonase (6PGL) and phosphogluconate dehydrogenase (6PGD) in
oxidative pentose phosphate (OPP) pathway are negligible (0.00 to 0.03). In contrast, the
experimentally derived range for OPP is (12 to 21). This is approximately equal to the
difference between the model-predicted vs. experimentally deduced RBC reaction range
implying the persistence of OPP flux even under the photoautotrophic condition [112]
despite the presence of a more efficient NADPH production route through photosynthesis
as predicted by the model (under max biomass). The high values Young et al. [112]
obtained for the OPP fluxes were surprising as OPP is not a very efficient route for
cyanobacteria to generate reducing power. This may reflect some inherent biological
constraint that is not captured by the optimality assumption.
Model predicted lower flux ranges for RBC are propagated to seven other reactions in the
Calvin cycle (i.e., phosphoglycerate kinase (PGK), glyceraldehyde-3-phosphate
dehydrogenase (13PDG), triose-phosphate isomerase (TPI), transketolase (TKT1),
ribose-5-phosphate isomerase (RPI), ribulose 5-phosphate 3-epimerase (RPE) and
phosphoribulokinase (PRK). The remaining six reaction fluxes with lower model
predicted fluxes compared to measurements [112] are all in the TCA cycle (i.e., citrate
synthase (CS), aconitase (ACONT), isocitrate dehydrogenase (ICD), succinate
dehydrogenase (SUCD) and malic enzyme (ME1 and ME2) reactions). Even under the
max biomass assumption, SUCD is not required to carry any flux due to the presence of
other succinate dehydrogenases (as part of respiratory chain) in the iSyn731 model.
Furthermore, in contrast with experimental observations, under the maximum biomass
assumption, the model predicts no flux through the malic enzyme (ME) reactions
presumably because it is a less energy-efficient route (i.e., phosphoenolpyruvate

27
oxaloacetate malate pyruvate) for pyruvate generation than the pyruvate kinase
(PYK) reaction [112].
There are nine reactions with experimentally derived ranges completely subsumed within
the ones derived under the maximum biomass assumption. Five of them are in the Calvin
cycle (i.e., fructose-bisphosphate aldolase (FBA), fructose-bisphosphatase (FBP),
Sedoheptulose 1,7-bisphosphate D-glyceraldehyde-3-phosphate-lyase (SBGPL),
sedoheptulose-bisphosphatase (SBP) and bidirectional transaldolase (TAL)). The first
four reactions are essential with experimentally deduced flux ranges of (53.00 to 66.00)
for FBA and FBP and (29.00 to 43.00) for SBGPL and SBP. In contrast, the calculated
flux ranges (-0.08 to 73.17) for FBA and SBGPL and (0.00 to 73.17) for FBP and SBP
imply that they are in silico non-essential. As depicted in Figure 2-1, these reactions are
involved in the production of sedoheptulose 7-phosphate (S7P) from fructose 1,6-
bisphosphate (FDP). An alternative production route for S7P is afforded in the model
through the bidirectional transaldolase (TAL) reaction from fructose 6-phosphate (F6P)
alluding to an explanation for the wider flux ranges derived using the model.
Experimental and model predicted flux ranges for TAL are (-6.00 to 9.00) and (-35.93
and 37.32), respectively. Upon restricting the TAL flux ranges in the calculations to the
ones found experimentally, the flux variability analysis shrinks the flux ranges for FBA
and FBP to (28.22 to 43.27) and (28.22 to 43.33) and for SBGPL and SBP to (29.82 to
44.87) and (29.82 to 44.87), respectively which are very close to the experimentally
measured ranges. This is indicative that in addition to the maximization of biomass
formation, additional restrictions (e.g., photosynthetic efficiency and relative selectivity
of RuBISCO for carboxylation over oxidation) limit the range of fluxes that the
aforementioned glycolytic fluxes may span in vivo. Note that the presence of
experimentally measured fluxes is important to test the model and the adopted
maximization principle. We were fortunate in this case to have access to such data as for
most organisms they are absent.
Phosphoglycerate mutase (PGM) and enolase (ENO) reactions have very similar model
derived and experimentally obtained flux ranges. Model-predicted flux values of the

28
remaining two reactions, pyruvate kinase (PYK) and pyruvate dehydrogenase (PDH),
could reach as low as zero due to the metabolic flexibility that the iSyn731 model
possesses by having alternate enzymes with different cofactor specificities. The max
biomass flux range of fumarase (FUM) is found to be (-7.26 to 1.49), compared to the
experimentally measured (1.70 to 2.00). Therefore, it appears that under the
photoautotrophic condition, the forward direction is kinetically favorable. By restricting
the reaction to be irreversible the model predicted a FUM flux range of (0.00 to 1.49)
which is close to the experimentally derived one (see Figure 2-1). However, contrary to
MFA measurements these reactions (FUM and ME) are dispensable for in silico biomass
production.
2.3.4 iSyn731 model testing using in vivo gene essentiality data
The quality of model iSyn731 for Synechocystis 6803 was tested using experimental data
on the viability (or lack thereof) of single gene knockouts. We used the CyanoMutants
database [111, 128] that includes in vivo gene essentiality data for 119 genes (i.e., 19
essential and 100 nonessential) with metabolic functions in iSyn731 model. Cases that
were flagged with incomplete segregation in the database were omitted in iSyn731 model
comparisons. We examined the feasibility of biomass production for the model iSyn731
by comparing the maximum biomass formation upon imposing the gene knockout with
the maximum theoretical yield of the wild-type organism. A threshold of 10% of the
maximum theoretical yield was used as a cutoff [41]. Comparisons between in vivo and
in silico results led to four possible outcomes, as previously delineated by Kumar et al.,
GG, GNG, NGG and NGNG [41]. Initially, the model correctly predicted 18 out of 19
essential genes (i.e., 18 NGNG and 1 GNG) and 74 out of 100 non-essential genes (i.e.,
73 GG and 27 NGG). We next explored the causes of these discrepancies and attempted
to mitigate them whenever possible.
The single GNG case corresponds to mutant ∆chlAI exhibiting no growth under aerobic
conditions [129]. The ChlAI system is a Mg-protoporphyrin IX monomethylester (MPE)

29
cyclase system that is responsible for forming the isocyclic ring (E-ring) in chlorophylls
under aerobic conditions [129]. The model allowed for the BchE and ChlAII systems
(alternate cyclase systems) to complement for the loss of the ChlAI system leading to an
in silico viable mutant. However, the same literature source [129] suggested that both
BchE and ChlAII systems are unlikely to be active under aerobic conditions and thus
rescue mutant ∆chlAI. This prompted the introduction of a regulatory restriction in
iSyn731 model where only ChlAI reactions were active under aerobic conditions as MPE
while ChlAII and BchE system reactions were deactivated. Using these regulatory
restrictions resolves the single GNG inconsistency.
Twenty (out of 27) NGG cases were associated with Photosystem I (PSI), Photosystem II
(PSII) and other photosynthesis reactions. While reconstructing the model, we assumed
that all genes involved in photosynthetic reaction system were essential to the functioning
of the overall system. Published literature [130-134] suggests that genes involved in
photosynthetic reactions form complex interdependencies. We used NCBI COBALT
multiple sequence alignment tool [135] to construct a phylogenetic tree of the genes
associated with each photosystem along with BLASTp searches to identify putative
complementation relationships between genes to explain the inconsistencies between the
predicted in silico and in vivo growth. Genes deemed homologous (i.e., lie adjacent in
the phylogenetic tree) were linked with “OR” GPR relations implying that the loss of one
gene can be complemented by the other. Seven out of twenty NGG cases (i.e., psaD, psaI
and psbA2 for PSI and PSII and cpcC2, cpcC1, cpcD, and apcD for other photosynthesis
reactions) were resolved by modifying the corresponding GPR using an OR relation [131,
132, 136-139]. However, no phylogenetically adjacent or related (or homologous) genes
were found for the remaining 13 NGG cases (psaE, psbD2, psbO, psbU, psbV, psb28,
psbX, psb27, petE, cpcA, cpcB, apcE, apcF) [133, 134, 136, 139-143]. For these cases,
the genes were deemed nonessential to the functioning of the reactions in question (i.e.,
photosynthesis reactions) and thereby the corresponding GPRs were modified to show an
OR relation between each of these genes and an ‘unknown gene’, similar to what was
previously performed in the refinement of the iMM904 model [144].

30
The remaining seven NGG cases are associated with a variety of metabolic functions.
One such case is the ΔmodBC mutant corresponding to the sole ABC molybdate
transporter in the model. Literature evidence [145] revealed that a related
cyanobacterium, Anabaena variabilis ATCC 29413, could continue to grow despite the
loss of its molybdate ABC transporter due to the presence of another low affinity
molybdate transporter or an inducible sulfate transport system that can serve as a low
affinity molybdate transporter when required. We found the same gene coding for the
sulfate transporter in A. variabilis (cysA) in the iSyn731 model allowing the resolution of
the discrepancy by adding a cysA-linked alternate molybdate transporter. Another NGG
case is mutant ΔcrtO that cannot produce echinenone (a biomass component) in iSyn731
with no effect on observed growth. Therefore, it appears that iSyn731 cannot capture the
flexibility of Synechocystis 6803 metabolism [146] when echinenone production is
restricted. The remaining five NGG cases are spread across many metabolic pathways.
The ΔctaA mutant eliminates the copper ABC transporter without affecting growth,
which alludes to the existence of another unknown mode of copper uptake not present in
iSyn731 [147, 148]. The ΔmenG mutant eliminates a reaction for the production of
phylloquinone while mutant Δppd affects the production of homogentisate, a precursor
for both tocopherols and plastoquinone. Finally, the Δvte3 mutant affects the production
of both plastoquinone and α-tocopherol [149] and the viable ΔccmA mutant restricts the
production of chorismate (a precursor to aromatic amino acids) and also restricts
carboxysome formation [150-152]. These six inconsistencies between the model
predictions and growth data imply that the cyanobacterium can co-opt another metabolic
process to (partially) complement for the gene loss. Unlike the case of the ΔmodBC
mutant, we have found no plausible mechanism for the six remaining mutants.
After resolving the discrepancies, as described above, iSyn731 correctly predicted all 19
essential genes (i.e., 19 NGNG and 0 GNG) and 94 (out of 100) non-essential genes (i.e.,
94 GG and 6 NGG). Figure 2-2 shows our results and comparisons against two other
available Synechocystis 6803 models by Knoop et al. [89] and Nogales et al. [109]. We
used the CyanoMutants database [111] to identify 114 genes (i.e., 19 essential and 95
nonessential) having metabolic functions in the iJN678 model by Nogales et al. [109].

31
Out of 114 genes the iJN678 model correctly predicted 18 essential genes (i.e., 18 NGNG
and 1 GNG) and 69 non-essential genes (i.e., 69 GG and 26 NGG). The model by Knoop
et al. [89] was tested for 51 mutants but we found that only 43 (i.e., 7 essential and 36
non-essential) of them were reported to have complete segregation [111]. Of these 43,
Knoop et al.’s [89] model correctly predicted 5 essential genes (i.e., 5 NGNG and 2
GNG) and 32 nonessential genes (i.e., 32 GG and 4 NGG). The specificity and sensitivity
of each of these three models were also calculated and displayed at the bottom of Figure
2-2.
Figure 2-2: Comparison of gene essentiality/viability data with predictions by a number
of Synechocystis 6803 models.
(A) Tabulated growth (i.e., G) or non-growth (i.e., NG) predictions and experimental
data. The first number denotes the number of GG, GNG, NGG and NGNG combinations

32
whereas the second number signifies the number of experimentally observed lethal (or
viable) mutants, and (B) Definition and comparison of specificity and sensitivity of all
three models. Note that GG denotes both in silico and in vivo growth, NGG represents no
growth in silico but in vivo growth. NGNG implies no growth for either in silico or in
vivo, whereas GNG marks growth in silico but no growth in vivo.
All 114 genes tested for iJN678 were also present in the iSyn731 model. 26 NGG and
one GNG cases present in iJN678 model correspond to NGG and GNG cases that were
either fixed or still present in iSyn731 as discussed before. Lethal mutant ∆ppa is
correctly predicted as NGNG in iSyn731 but deemed GNG in Knoop et al. [89] model.
This was because ppa in iSyn731 codes for the degradation of both triphosphate into
diphosphate and diphosphate to phosphate. Only the latter activity is linked to ppa in the
Knoop et al’s model. Out of 4 NGG cases in [89], two involve ∆cmpA and ∆cmpB
mutants. Both these genes are involved in the ABC transporter system for bicarbonate
from periplasm to cytosol. iSyn731 avoids this inconsistency as it contains an alternate
sodium and bicarbonate co-transport system.
2.3.5 Model comparisons
2.3.5.1 Synechocystis 6803 model comparisons
The iSyn731 model integrates the description in the photosystems of the model presented
by Nogales et al. [109] and adds additional detail. One notable difference is that iSyn731
uses a separate photon for each reaction center (i.e., PSI and PSII) as they are optimized
for different ranges of wavelength [153], whereas iJN678 [109] uses a single photon
shared by both photosystem reactions. As many as 322 new reactions (see Figure 2-3A),
are added in iSyn731 distributed across many pathways. Most of the additions are in the
lipid and fatty acid metabolism to support the synthesis of measured fatty acids and lipids
present in the biomass equation. This list includes myristic acid (14-carbon saturated

33
fatty acid) and lauric acid (12-carbon saturated fatty acid). iJN678 [109] contained four
reactions exhibiting unbounded flux (i.e., two duplicate glycine cleavage reactions and
two duplicate leucine transaminase reactions). They form a thermodynamically infeasible
cycle (see Figure 2-4A for leucine transaminase reactions) that was resolved in iSyn731
by eliminating redundant functions. In addition, the glycine cleavage system was recast in
detail by abstracting the separate action of the four enzymes (named the T-, P-, L-, and
H-proteins) that ultimately catalyze the demethylamination of glycine.
iSyn731 improves upon iJN678 [109] by eliminating lumped reactions whenever a multi-
step description is available and expands the range of functions carried out with alternate
cofactors. As many as twelve reactions with an enoyl-[acyl-carrier-protein] reductase
function were linked with not only NADP but also with the more rare NAD cofactor
specificity. Another important difference between iSyn731 and iJN678 [109] is the
cellular location of the CO2 fixation (i.e., ribulose-1,5-bisphosphate
carboxylase/oxygenase (RuBisCO) enzyme). Literature [154, 155] shows that
cyanobacteria possess a micro-compartment (i.e., carboxysome) encapsulating RuBisCO
and carbonic anhydrase (CA) enzymes. iSyn731 adds carboxysome as a cellular
compartment and also all necessary transport reactions [154, 155].
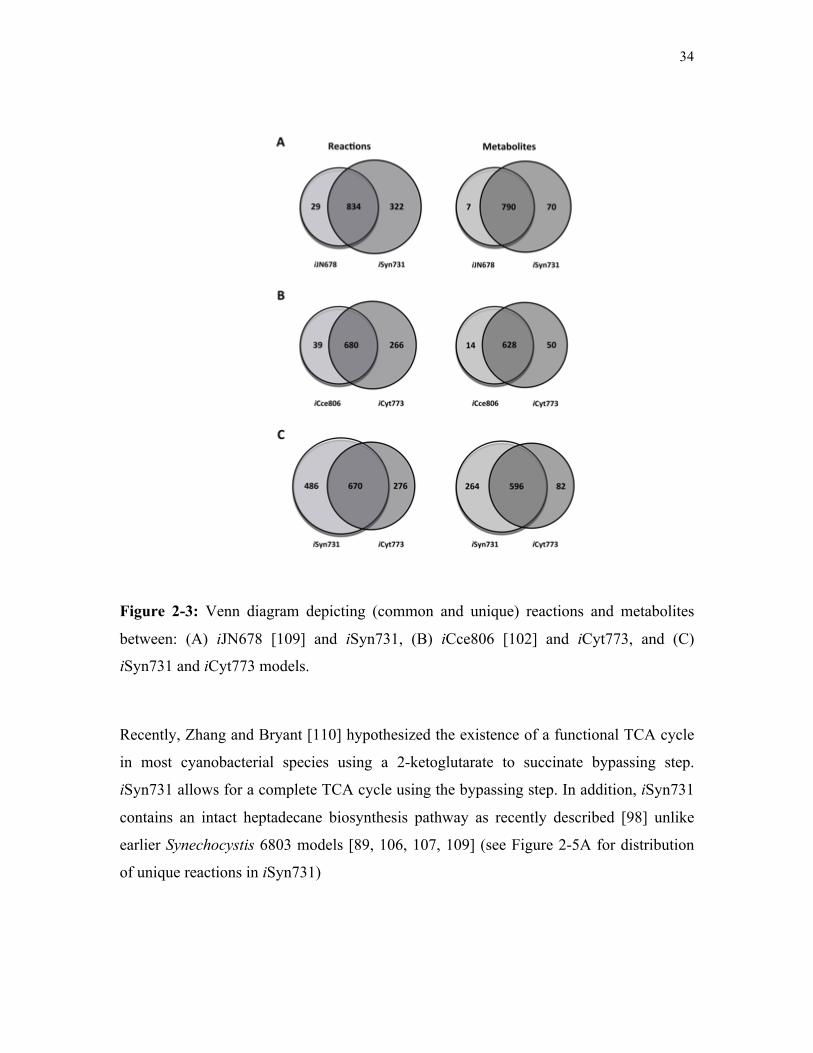
34
Figure 2-3: Venn diagram depicting (common and unique) reactions and metabolites
between: (A) iJN678 [109] and iSyn731, (B) iCce806 [102] and iCyt773, and (C)
iSyn731 and iCyt773 models.
Recently, Zhang and Bryant [110] hypothesized the existence of a functional TCA cycle
in most cyanobacterial species using a 2-ketoglutarate to succinate bypassing step.
iSyn731 allows for a complete TCA cycle using the bypassing step. In addition, iSyn731
contains an intact heptadecane biosynthesis pathway as recently described [98] unlike
earlier Synechocystis 6803 models [89, 106, 107, 109] (see Figure 2-5A for distribution
of unique reactions in iSyn731)

35
2.3.5.2 Cyanothece 51142 model comparisons
The iCyt773 model for Cyanothece 51142 improves upon the iCce806 model [102].
iCyt773 segregates reactions into the periplasm, thylakoid lumen, carboxysome, and
cytoplasm compartments thus introducing an additional 60 transport reactions compared
to iCce806 [102]. Unlike iCce806 [102], iCyt773 does not track macromolecule synthesis
for DNA, RNA, and proteins to maintain consistency with the Synechocystis 6803 model.
Figure 2-4: Schematics that illustrate the thermodynamically infeasible cycles and
subsequent resolution strategies.
(A) Cycles present in iJN678 [109], and (B) Cycles present in iCce805 [102]. Blue
colored lines represent the original reaction directionality whereas green ones denote
modified directionality to eliminate cycle.
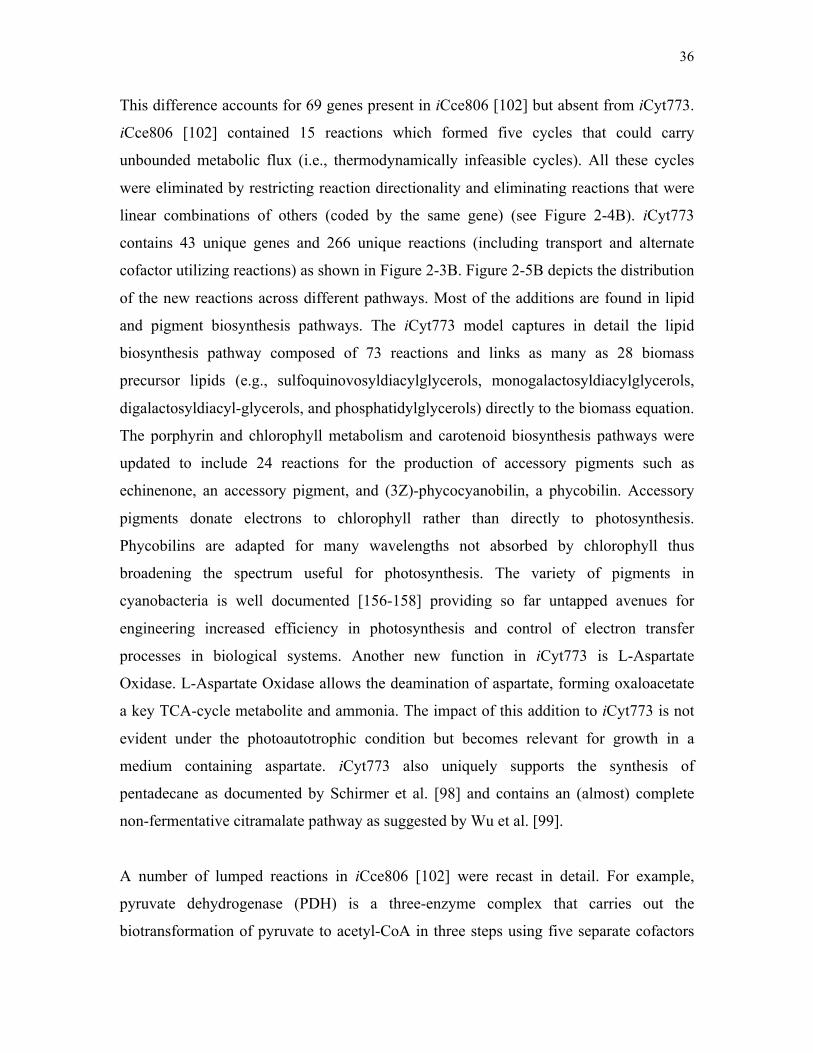
36
This difference accounts for 69 genes present in iCce806 [102] but absent from iCyt773.
iCce806 [102] contained 15 reactions which formed five cycles that could carry
unbounded metabolic flux (i.e., thermodynamically infeasible cycles). All these cycles
were eliminated by restricting reaction directionality and eliminating reactions that were
linear combinations of others (coded by the same gene) (see Figure 2-4B). iCyt773
contains 43 unique genes and 266 unique reactions (including transport and alternate
cofactor utilizing reactions) as shown in Figure 2-3B. Figure 2-5B depicts the distribution
of the new reactions across different pathways. Most of the additions are found in lipid
and pigment biosynthesis pathways. The iCyt773 model captures in detail the lipid
biosynthesis pathway composed of 73 reactions and links as many as 28 biomass
precursor lipids (e.g., sulfoquinovosyldiacylglycerols, monogalactosyldiacylglycerols,
digalactosyldiacyl-glycerols, and phosphatidylglycerols) directly to the biomass equation.
The porphyrin and chlorophyll metabolism and carotenoid biosynthesis pathways were
updated to include 24 reactions for the production of accessory pigments such as
echinenone, an accessory pigment, and (3Z)-phycocyanobilin, a phycobilin. Accessory
pigments donate electrons to chlorophyll rather than directly to photosynthesis.
Phycobilins are adapted for many wavelengths not absorbed by chlorophyll thus
broadening the spectrum useful for photosynthesis. The variety of pigments in
cyanobacteria is well documented [156-158] providing so far untapped avenues for
engineering increased efficiency in photosynthesis and control of electron transfer
processes in biological systems. Another new function in iCyt773 is L-Aspartate
Oxidase. L-Aspartate Oxidase allows the deamination of aspartate, forming oxaloacetate
a key TCA-cycle metabolite and ammonia. The impact of this addition to iCyt773 is not
evident under the photoautotrophic condition but becomes relevant for growth in a
medium containing aspartate. iCyt773 also uniquely supports the synthesis of
pentadecane as documented by Schirmer et al. [98] and contains an (almost) complete
non-fermentative citramalate pathway as suggested by Wu et al. [99].
A number of lumped reactions in iCce806 [102] were recast in detail. For example,
pyruvate dehydrogenase (PDH) is a three-enzyme complex that carries out the
biotransformation of pyruvate to acetyl-CoA in three steps using five separate cofactors

37
(i.e., TPP, CoA, FAD, lipoate, and NAD). Similar detail was used for lumped steps in the
metabolism of glycine, histidine, and serine. All additions to the list of reactions in
iCyt773 were corroborated using genome annotations [86] or published literature [97-99,
159] with the exception of ten enzymes, whose function in the lipid and pigment
biosynthesis pathways was required for biomass production.
A shift in biomass composition was observed under light, dark, and nitrate supplemented
(light and dark) conditions. These differences were captured in four separate biomass
descriptions present in iCyt773. In addition, we used data from Stockel et al. [160] on the
diurnal oscillations for approximately 20% of proteins in Cyanothece 51142 to identify
regulatory reaction shutdowns in our metabolic model. Supplementary File S4 (which can
be found in the online version of the published paper) lists the reactions that were
inactivated under light and dark conditions, respectively. As expected, the nitrogenase
genes cce_0559 and cce_0560, known to be active in the absence of light, exhibited low
spectral counts under light conditions. In contrast, photosystem II gene cce_1526, showed
no spectral count under dark conditions. Unexpectedly, the data suggested that the
Mehler reactions associated gene (cce_2580), known to be active in Synechocystis 6803
[161] and expected to be active in Cyanothece 51142, exhibited lower expression in light
than in dark conditions.
2.3.5.3 iSyn731 and iCyt773 models comparison
Figure 2-3C illustrates the total number of common and unique reactions and metabolites
between iSyn731 and iCyt773 models. The Cyanothece 51142 genome [86, 162] is 1.5
times larger than the one for Synechocystis 6803 [88], nevertheless iCyt773 is smaller
than iSyn731 due to differences in the level of detail of annotation and biochemical
characterization. As many as 670 reactions and 596 metabolites are shared by both
models corresponding to 47% and 63% of the total reactome and metabolome,
respectively (see Figure 2-3C). The higher degree of conservation of metabolites (as
opposed to reactions) across the two cyanobacteria suggests that lifestyle adaptations tend
to usher new enzymatic activities that most of the time make use of the same metabolite

38
pool without introducing new metabolites. There are 486 reactions that are unique to
iSyn731 with no counterpart in iCyt773. These reactions are not preferentially allotted to
a handful of specific pathways. Instead they are spread over tens of different pathways.
Primary metabolism reactions dispersed throughout fatty acid biosynthesis, lipid
metabolism, oxidative phosphorylation, purine and pyrimidine metabolism, transport and
exchange reactions account for 295 reactions. Secondary metabolism including
chlorophyll and cyanophycin metabolism, folate, terpenoid, phenylpropanoid and
flavonoid biosynthesis accounts for the remaining 191 iSyn731-specific reactions.
Interestingly, the 276 iCyt773-specific reactions span the same set of diverse pathways
implying that the two organisms have adopted unique/divergent biosynthetic capabilities
for similar metabolic needs. Fifty-eight span primary metabolism pathways such as
purine and pyrimidine metabolism, fatty acid and lipid biosynthesis, amino acid
biosynthesis. The remaining 218 reactions describe secondary metabolism such as
terpenoid biosynthesis, chlorophyll and cyanophycin biosynthesis, plastoquinone and
phyloquinone biosynthesis. The much larger set of unique iSyn731-specific reactions
compared to iCyt773 reflect more complete genome annotation and biochemical
characterization rather than augmented metabolic versatility.

39
Figure 2-5: List of added reactions across pathways. (A) iSyn731 compared to iJN678
[109], and (B) iCyt773 compared to iCce806 [102].
A number of distinct differences in metabolism between the two organisms have been
accounted for in the two models. For example, iCyt773 does not have the enzyme
threonine ammonia-lyase, which catalyzes the conversion of threonine to 2-ketobutyrate
and as a consequence lacks the traditional route for isoleucine synthesis. Instead it
employs part of the alternative citramalate pathway for isoleucine synthesis with pyruvate

40
and acetyl-CoA as precursors. Follow up literature queries revealed the existence of this
alternative pathway in Cyanothece 51142 [99]. Ketobutyrate, an intermediate in the
citramalate pathway, can be readily converted to higher alcohols, such as propanol and
butanol, via a non-fermentative alcohol production pathway. Using the iCyt773 model,
we determined that only 2-ketoacid decarboxylase is missing from these three-step
processes. In contrast, iSyn731 was found to have only the traditional route for isoleucine
production with the citramalate pathway completely absent (see Figure 2-6A). In another
example, the fermentative 1-butanol pathway is known to be incomplete in both
organisms. By querying the developed models we can pinpoint exactly which steps are
absent. Specifically, the conversion between 3-hydroxybutanoyl-CoA and butanal is
missing in both models. In addition to higher alcohols, higher alkanes (C13 and above)
are important biofuel molecules as the main constituents of diesel and jet fuel [98].
Recently reported [98] novel genes involved in the biosynthesis of alkanes in several
cyanobacterial strains were incorporated in the models. Metabolic differences in
Cyanothece 51142 and Synechocystis 6803 lead to the production of different alkanes
(e.g., pentadecane in Cyanothece 51142 and heptadecane in Synechocystis 6803) (see
Figure 2-6B).
Model iCyt773, in contrast to iSyn731, does not have a complete urea cycle as it lacks the
enzyme L-arginine aminohydrolase catalyzing the production of urea from L-arginine.
Literature sources [162, 163] support this finding and explain the absence of a functional
urea cycle as a consequence of the nitrogen-fixation ability of Cyanothece 51142 [164,
165]. Because Cyanothece 51142 can fix nitrogen directly from the atmosphere and
produce ammonium via the enzyme nitrogenase, genes corresponding to the activity of L-
arginine aminohydrolase and urease (for breaking down urea) become redundant,
explaining why they are not present in its genome [165]. In addition to nitrogen
metabolism, iCyt773 and iSyn731 models reveal marked differences in anaerobic
metabolic capabilities. Unlike iSyn731, iCyt773 includes a L-lactate dehydrogenase
activity that enables the complete fermentative lactate production pathway. On the other
hand, iSyn731 contains the anaerobic chlorophyll biosynthetic pathway using enzyme
protoporphyrin IX cyclase (BchE) that is absent in iCyt773. Other differences in

41
metabolism include lipid and fatty acid synthesis, fructose-6-phosphate shunt and
nitrogen fixation. Model iSyn731 traces the location of the double bond for unsaturated
fatty acid synthesis pathways, as two separate isomers of unsaturated C18 fatty acids are
part of the biomass description. iCyt773 allows for the shunting of fructose-6-phosphate
into erythrose-4-phosphate along with acetate and ATP using the fructose-6-phosphate
phosphoketolase activity. Finally, both iSyn731 and iCyt773 contain multiple
hydrogenases allowing both to produce hydrogen. However, only the latter has a
nitrogenase activity that can fix nitrogen while simultaneously producing hydrogen.
Figure 2-6: Examples of pathways that differ between the two cyanobacteria.
(A) Nonfermentative alcohol production pathway highlighting the present and absent
enzymes in Cyanothece 51142 and Synechocystis 6803, and (B) Alkane biosynthesis
pathways in Cyanothece 51142 and Synechocystis 6803.
42
2.3.6 Using iSyn731 and iCyt773 to estimate production yields
We tested the recently developed models iSyn731 and iCyt773 by comparing the
predicted maximum theoretical product yields with experimentally measured values for
two very different metabolic products: isoprene and hydrogen. Isoprene, a volatile
hydrocarbon and potential feedstock for biofuel, is mostly produced in plants under heat
stress [90]. Cyanobacteria offer promising production alternatives as they can grow to
high densities in bioreactors and produce isoprene directly from photosynthesis
intermediates [90]. It was reported [90] that Synechocystis 6803 has all but one gene
(encoding isoprene synthase) in the methyl-erythritol-4-phosphate (MEP) pathway for
isoprene synthesis from dimethylallyl phosphate (DMAPP). Upon cloning the isoprene
synthase from kudzu vine (Pueraria montana) into Synechocystis 6803 isoprene
production was demonstrated using sunlight and atmospheric CO2 of 4.3x 10⁻⁴ mole
isoprene/mole carbon fixed [166]. We calculated the maximum isoprene yield using
iSyn731 to be 3.63 x 10⁻⁵ mole isoprene/ mole carbon fixed upon adding the isoprene
synthase activity to the model and simulating the conditions described in [127] under
maximum biomass production. Similar isoprene yields were obtained with iJN678 [109]
while earlier models of Synechocystis 6803 [89, 106-108] lack the MEP pathway
(partially or completely) and thus do not support isoprene production. The
underestimation of the experimentally observed isoprene yield by the model predicted
maximum yield may be due to sub-optimal growth of the production strain, differences in
the list of measured biomass components, missing isoprene-relevant reactions from the
model or more likely a combination of the above factors.
Both Cyanothece 51142 and Synechocystis 6803 produce hydrogen by utilizing
nitrogenase and hydrogenase activities, respectively [96]. Under subjective dark
conditions [96] whereby (i) stored glycogen acts as a carbon source, (ii) photosynthesis
harnesses light energy, and (iii) nitrogenase activity is not restricted, hydrogen production
yield for Cyanothece 51142 was measured at 49.67 mole/mole glycogen consumed.
Simulating the same conditions in iCyt773 and iCce806 [102] leads to maximum

43
theoretical yields for hydrogen production of 48.43 mole/ mole glycogen and 102.4
mole/mole glycogen, respectively. The entire amount of hydrogen produced in iCyt773 is
due to the nitrogenase activity. In contrast, the predicted doubling of the maximum
hydrogen yield in iCce806 is due to the utilization of the reverse direction of two
hydrogen dehydrogenase reactions without any nitrogenase activity. Utilization of the
nitrogenase reaction requires the use and recycling of more ATP than simply running the
dehydrogenase reactions in reverse. However, it has been reported that hydrogen
production in Cyanothece 51142 is primarily mediated by the nitrogenase enzyme [96] in
the dark phase. This lends support to the irreversibility of the dehydrogenase reactions
(under dark condition) as present in the iCyt773 model. Experimental results for
Synechocystis 6803 support up to 4.24 mole/mole glycogen consumed [96, 167] of
hydrogen production. iSyn731 predicts a maximum hydrogen theoretical yield of 2.28
mole/mole glycogen consumed while iJN678 [109] yields a value of 2.00 mole/mole
glycogen consumed. Again the factors outlined for isoprene production may explain the
lower theoretical yields predicted by the two models. The small difference between the
model predicted yields is due to the presence of one step lumped biotransformation
between isocitrate and oxoglutarate via isocitrate dehydrogenase in iJN678 [109].
iSyn731 describes this biotransformation in two steps (isocitrate oxalosuccinate
oxoglutarate) [168] generating an additional NADPH and subsequently more hydrogen
via the hydrogenase reaction.
2.4 Conclusion
In this chapter, we expanded upon existing models to develop two genome-scale
metabolic models (Synechocystis iSyn731 and Cyanothece iCyt773) for cyanobacterial
metabolism by integrating all available knowledge available from public databases and
published literature. All metabolite and reaction naming conventions are consistent
between the two models allowing for direct comparisons. Systematic gap filling analyses
led to the bridging of a number of network gaps in the two models and the elimination of
orphan metabolites. Two separate biomass equations as well as two different versions of
Cyanothece iCyt773 models were developed for light and dark phases to represent

44
diurnal regulation. The development of two separate models for Cyanothece 51142 (i.e.,
light and dark) provides the two “end-points” for the future development of dynamic
metabolic models capturing the temporal evolution [113, 120, 169, 170] of fluxes during
the transition phases DFBA [171]. Comparisons against available 13C MFA
measurements for Synechocystis 6803 [112] revealed that the iSyn731 model upon
biomass maximization yields flux ranges that are generally consistent with experimental
data. Discrepancies between the two identify metabolic nodes where regulatory
constraints are needed in addition to biomass maximization to recapitulate physiological
behavior. The ability of iSyn731 to predict the fate of single gene knock-outs was further
improved (specificity of 0.94 and sensitivity of 1.00) by reconciling in silico growth
predictions with in vivo gene essentiality data [111]. Similar analyses could also be
carried out for Cyanothece iCyt773 model once such flux measurements and in vivo gene
essentiality data become available.
It is becoming widely accepted that focusing on a single pathway at a time without
quantitatively assessing the system-wide implications of genetic manipulations may be
responsible for suboptimal production levels. By accounting for both primary and some
secondary metabolism pathways, the Cyanothece iCyt773 model can be used to explore
in silico the effect of genetic modifications aimed at increased production of useful
biofuel molecules. By taking full inventory of Cyanothece 51142 metabolism (as
abstracted in iCyt773), and applying available strain optimization techniques [172, 173]
optimal gene modifications could be pursued for a variety of targets in coordination with
experimental techniques. In particular, the availability of a microaerobic environment in
Cyanothece 51142 at certain times during the diurnal cycle can be exploited for the
expression of novel pathways that are not usually found in oxygenic cyanobacterial
strains that largely maintain an aerobic environment. However, the use of Cyanothece
51142 as a bio-production platform is currently hampered by the inability to efficiently
carry out genetic modifications.
By systematically cataloguing the shared (and unique) metabolic content in iSyn731 and
iCyt773, successful genetic interventions assessed experimentally for Synechocystis 6803

45
can be “translated” to Cyanothece 51142. For example, it has been reported [174, 175]
that overproduction of fatty alcohols can be achieved in Synechocystis 6803 upon cloning
a fatty acyl-CoA reductase (far) from Jojoba (Simmondsia chinensis) and the over-
expression of gene slr1609 coding for an acyl-ACP synthetase. By using models iSyn731
and iCyt773 we can infer that in addition to cloning far from Jojoba, over-expression of
gene cce_1133 coding for a native acyl-ACP synthetase would be needed to bring about
the same overproduction in Cyanothece 51142.

46
3 Chapter 3 SYNTHETIC BIOLOGY OF CYANOBACTERIA: UNIQUE CHALLENGES AND OPPORTUNITIES
This chapter has been previously published in modified form in Frontiers in Microbiology. The author has mainly contributed to the modeling section of the paper (Berla, B.M., Saha, R., Immethun, C.D., Maranas, C.D., Moon, T.S. and Pakrasi, H.B. (2013), "Synthetic biology of cyanobacteria: unique challenges and opportunities", Frontiers in Microbiology, 4).
3.1 Introduction
Cyanobacteria have garnered a great deal of attention recently as biofuel-producing
organisms. Their key advantage over other bacteria is their ability to use photosynthesis
to capture energy from sunlight and convert CO2 into products of interest. As compared
with eukaryotic algae and plants, cyanobacteria are much easier to manipulate genetically
and grow much faster. They have been engineered to produce a wide and ever-expanding
range of products including fatty acids, long-chain alcohols, alkanes, ethylene,
polyhydroxybutyrate, 2,3-Butanediol, ethanol, and hydrogen. These processes have been
reviewed recently [176] and will not be covered in detail in this review. Rather, we will
look towards how the techniques of the emerging field of synthetic biology might bear
fruit in improving the output of such engineered strains. Due to the low price of
commodity goods like fuels and platform chemicals, it is critical to maximize the
productivity of engineered strains to make them economically competitive. We believe
that the tools of synthetic biology can help with this challenge.
Specifically, this review will cover systems, parts, and methods of analysis for synthetic
biology systems. Synthetic biology requires a well-characterized host or ‘chassis’ strain
that can be genetically manipulated with ease and predictability. Ideally, the host should
grow quickly and tolerate a range of environmental conditions. The host should be simple
to cultivate using readily available laboratory equipment and inexpensive growth media.

47
Simple, rapid, and high-throughput techniques should be available for procedures like
DNA/RNA isolation, metabolomics, and proteomics. To achieve modular, ‘plug-and-
play’ modification of the host strain, its metabolism and regulatory systems must be well-
characterized under a wide variety of relevant conditions. Since cyanobacterial biofuel
production processes will need to use sunlight as an energy source to be economically
and environmentally useful, the day/night cycle will be particularly relevant; The
intermittent nature of this energy source will be a key engineering challenge. We will
discuss which cyanobacterial chassis have been used and their relative merits and unique
traits. Ultimately, the hope is that one of these strains might be developed to become a
‘green E. coli’ for which a wide variety of genetic parts and systems are available for
easy modification. Next, we will discuss the critical issue of how gene expression can be
controlled in cyanobacteria. Compared with other systems, there are few examples of
simple and effective controllable promoters in cyanobacteria. We will also discuss
methods for analysis of gene expression using light-emitting reporters and for global
analysis of metabolism using either constraint-based modeling or measurement of 13C
labeling.
3.2 Genetic modification of cyanobacteria
Several strains of cyanobacteria are known which are readily amenable to genetic
modification (See Table 3-1). Such modifications can be performed either in cis (through
choromosome editing) or in trans (through plasmid addition) and synthetic biology
experiments have used both approaches. We discuss advantages and disadvantages of
each approach, as well as recent technical developments below. While even the best
cyanobacterial model systems are still far from being a ‘green E. coli’, many tools are
already available and more are being developed. The future holds great promise for this
field.

48
Table 3-1: Model strains of cyanobacteria for synthetic biology
Strain Genetic Methods
Ideal
Growth
Temp (C)
Doubling
Time
(hours) Metabolisms
Genome-
Scale
models? Notes
Selected
Reference
Synechocystis
sp. PCC 6803
conjugation, natural
transformation, Tn5
mutagenesis, fusion PCR 30 6-12
mixotrophic,
autotrophic Yes
Extensive systems
biology datasets are
available [177]
Synechococcus
elongatus PCC
7942
conjugation, natural
transformation, Tn5
mutagenesis 38 12-24 autotrophic No
A model strain for the
study of circadian
clocks [178]
Synechococcus
sp. PCC 7002
conjugation, natural
transformation 38 3.5
mixotrophic,
autotrophic Yes
Among the fastest-
growing strains known [179]
Anabaena
variabilis PCC
7120
conjugation, natural
transformation 30 >24
mixotrophic,
autotrophic No
Nitrogen-fixing,
Filamentous [180]
Leptolyngbya sp.
Strain BL0902
conjugation, Tn5
mutagenesis 30 ~20 autotrophic No
Filamentous, Grows
well in outdoor photo-
bioreactors in a broad
range of conditions [181]

49
3.3 Genetic modification in cis: chromosome editing
Cis genetic modification is the most common approach in cyanobacterial synthetic
biology. This approach takes advantage of the capability of many cyanobacterial strains
for natural transformation and homologous recombination (see Table 3-1) to create
insertion, deletion, or replacement mutations in cyanobacterial chromosomes.
Traditionally, strains have been transformed with selectable markers linked to any
sequence of interest and flanked by sequences homologous to any non-essential sequence
on the chromosome (See Figure 3-1).
Figure 3-1: Different methods for constructing cyanobacterial mutants.
(A) shows the traditional method using double homologous recombination to insert a
suicide vector into the genome at a neutral site (NS, gold) with upstream (US, orange)
and downstream (DS, magenta) flanking regions in the vector. The insert contains an
arbitrary sequence of interest (ATGCATG, green) and a selectable marker (SM, blue).
(B) shows 2 methods of creating markerless mutants, either by selection-counterselection
or by using a recombinase system such as FLP/FRT, The counter-selection method’s first
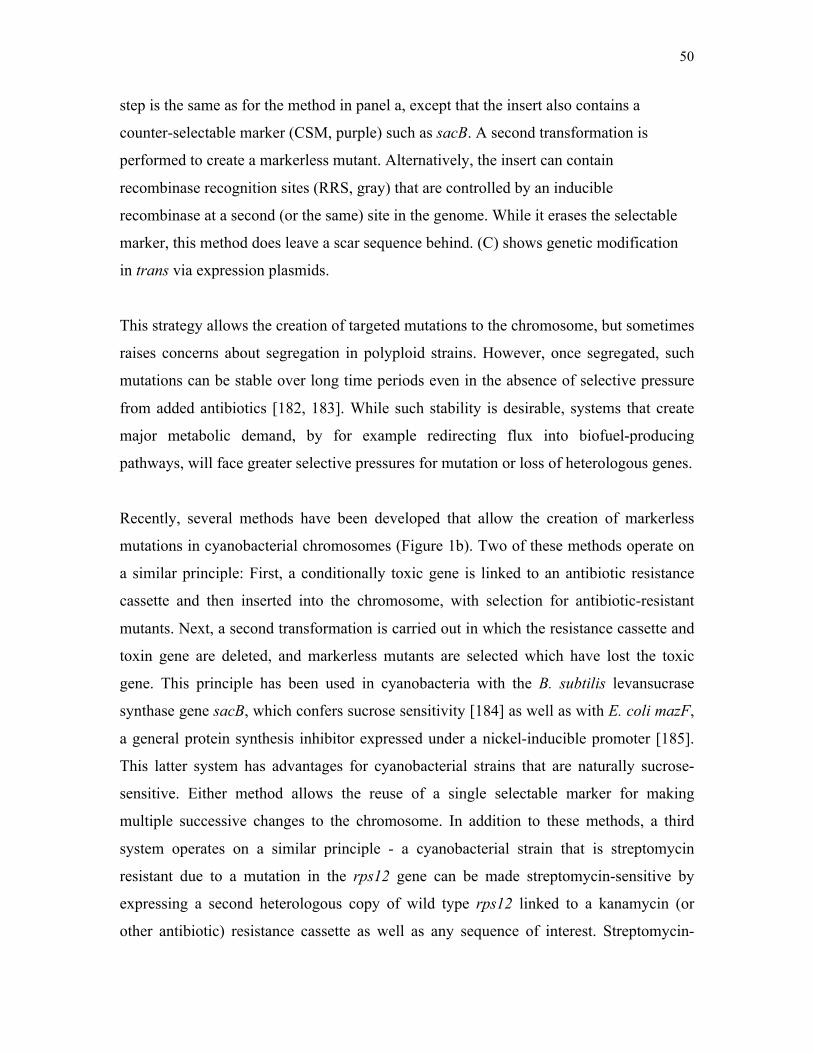
50
step is the same as for the method in panel a, except that the insert also contains a
counter-selectable marker (CSM, purple) such as sacB. A second transformation is
performed to create a markerless mutant. Alternatively, the insert can contain
recombinase recognition sites (RRS, gray) that are controlled by an inducible
recombinase at a second (or the same) site in the genome. While it erases the selectable
marker, this method does leave a scar sequence behind. (C) shows genetic modification
in trans via expression plasmids.
This strategy allows the creation of targeted mutations to the chromosome, but sometimes
raises concerns about segregation in polyploid strains. However, once segregated, such
mutations can be stable over long time periods even in the absence of selective pressure
from added antibiotics [182, 183]. While such stability is desirable, systems that create
major metabolic demand, by for example redirecting flux into biofuel-producing
pathways, will face greater selective pressures for mutation or loss of heterologous genes.
Recently, several methods have been developed that allow the creation of markerless
mutations in cyanobacterial chromosomes (Figure 1b). Two of these methods operate on
a similar principle: First, a conditionally toxic gene is linked to an antibiotic resistance
cassette and then inserted into the chromosome, with selection for antibiotic-resistant
mutants. Next, a second transformation is carried out in which the resistance cassette and
toxin gene are deleted, and markerless mutants are selected which have lost the toxic
gene. This principle has been used in cyanobacteria with the B. subtilis levansucrase
synthase gene sacB, which confers sucrose sensitivity [184] as well as with E. coli mazF,
a general protein synthesis inhibitor expressed under a nickel-inducible promoter [185].
This latter system has advantages for cyanobacterial strains that are naturally sucrose-
sensitive. Either method allows the reuse of a single selectable marker for making
multiple successive changes to the chromosome. In addition to these methods, a third
system operates on a similar principle - a cyanobacterial strain that is streptomycin
resistant due to a mutation in the rps12 gene can be made streptomycin-sensitive by
expressing a second heterologous copy of wild type rps12 linked to a kanamycin (or
other antibiotic) resistance cassette as well as any sequence of interest. Streptomycin-

51
resistant, kanamycin-sensitive markerless mutants can be recovered in a second
transformation [186]. Although this method can also be used to make successive
markerless mutants, it requires a background strain that is streptomycin-resistant due to
an altered ribosome. Thus, it may not be an ideal method for synthetic biology studies
that seek to draw conclusions about translation in wild-type systems. For the ability to
transfer any translated genetic parts or parts involved in translation (such as ribosome
binding sites) to other strains, this mutation could be problematic. A possible advantage
of this system is that both selections are positive selections, whereas the sacB or mazF
systems require a negative selection in their second transformation. Care must be taken to
ensure that sucrose resistance is due to loss, as opposed to mutation, of the counter-
selectable marker. Recombinase-based systems including Cre-LoxP (in Anabaena sp.
PCC7120, [180]) or FLP/FRT (in Synechocystis sp. PCC6803 and Synechococcus
elongatus PCC7942, [187]) have also been used to engineer mutants that lack a selectable
marker. However, these methods leave a scar sequence, meaning that the final
chromosomal sequence is not completely user-specifiable and also that multiple
mutations using this technique in the same cell line may potentially lead to undesirable
crossover events or other unexpected results.
Until recently, it has been difficult to create mutants at high throughput in cyanobacterial
strains, as transposon-based methods developed for use in other strains can work poorly
in cyanobacterial hosts. However, libraries can be created in other strains and
subsequently transferred to a cyanobacterial host via homologous recombination. A Tn7-
based library containing ~10,000 lines was recently created to screen for strains with
increased polyhydroxybutyrate (PHB) production [188] and a similar approach has been
taken for finding mutants in circadian clock function in Synechococcus 7942 [189] and
later extended to include insertions into nearly 90% of open reading frames in that strain
[178]. Chromosomal DNA fragments were first cloned into a plasmid library in E. coli
and then the library was mutagenized with Tn7 before homologous recombination back
into the cyanobacterial host strain. This could be an especially valuable approach for the
validation of genome-scale models of cyanobacterial metabolism (see below).

52
3.4 Genetic modification in trans: foreign plasmids
Although transgene expression in cis is the most common approach in cyanobacterial
research, genes are also routinely expressed in cyanobacteria in trans [190-192]. In
synthetic biology and metabolic engineering of other prokaryotes, this is by far the more
common approach, and has led to such standardized approaches as “Bio-Brick” assembly
in which standardized genetic ‘parts’ such as promoters, ribosome binding sites, genes,
and terminators can be readily swapped in and out of standard plasmids
(http://partsregistry.org). This move towards standardization of genetic parts is a critical
aim for synthetic biology, independent of the chassis organism or method of
transformation. However, a limited number of plasmids are available for expression in
cyanobacterial hosts. Plasmid assembly for expression in cis or in trans in cyanobacterial
hosts has generally been performed in E. coli because of the longer growth times that
would be associated with assembling vectors in cyanobacterial hosts (Figure 3-2a). This
requires broad host range plasmids. However, with the rise of in vitro assembly methods
such as SLIC [193], Gibson assembly [194], CPEC [195], fusion PCR [196], and Golden
Gate [197], this limitation may become less important over time (Figure 3-2b). These
next-generation cloning methods have been reviewed elsewhere [198] and will not be
covered here. Fusion PCR has been used to construct linear DNA fragments for
homologous recombination in cyanobacterial chromosomes [199], but to our knowledge
replicative vectors for cyanobacteria have so far not been constructed without the use of a
helper heterotrophic strain. Techniques for in vivo assembly of plasmids that have been
developed for yeast [200] may be adaptable to cyanobacteria because of their facility for
homologous recombination (Figure 3-2c). Such an improvement could greatly speed up
the process of making cyanobacterial mutant strains, either for modification in cis or in
trans. The major technical challenge for such an approach is that the long time after
transformation required to isolate cyanobacterial mutants (typically 1 week or more)
means it is critical to have high-fidelity assembly methods to avoid a time-consuming
screening process.

53
Although shuttle vectors do exist for cyanobacteria, there has been little characterization
of their copy numbers in cyanobacterial hosts, and the lack of replicative vectors with
varied copy numbers limits the valuable ability to control the expression level of
heterologous genes by selecting their copy number [201, 202]. Plasmids derived from
RSF1010 appear to have a copy number of 10-30 (or ~1-3 per chromosome) in
Synechocystis sp. PCC 6803 [190, 203], but copy numbers of other broad host-range
plasmids have not been quantified to date. Endogenous plasmids of cyanobacteria have
also been used as target sites for expression of heterologous genes in Synechococcus sp.
PCC 7002 [179]. This strain harbors several endogenous plasmids whose copy numbers
range from ~1-8 per chromosome, with an approximate chromosome copy number of 6
per cell. Synechocystis sp. PCC 6803 also has plasmids whose copy numbers span a
similar range (from ~0.4-8 per chromosome [204]).
Figure 3-2: DNA assembly methods.
Traditionally in cyanobacterial synthetic biology, plasmids are assembled in vitro and
then propagated in E. coli before being transformed into cyanobacteria (a). More
recently, methods have been developed for in vitro assembly and direct transformation
via fusion PCR (b). In just the last year, a method has been developed for in vivo plasmid

54
assembly via homologous recombination in yeast which may also be applicable in certain
cyanobacterial strains.
The origins of replication from these plasmids constitute a source of genetic parts that
could be used to generate cyanobacterial expression plasmids having a range of copy
numbers, and which could potentially be modified to create higher or lower-copy
plasmids that are compatible with existing plasmids in various cyanobacterial systems.
The range of shuttle vectors that have been used in cyanobacterial hosts has been recently
reviewed [205]. While many tools are available for genetic modification of these
biotechnologically promising strains, opportunities abound to develop new and improved
tools that will allow research to proceed faster.
3.5 Unique challenges of the cyanobacterial lifestyle
Organisms that survive using sunlight as a primary nutrient face unique challenges. These
must be better understood and addressed to fulfill the biotechnological promise of
cyanobacteria through synthetic biology.
3.5.1 Life in a diurnal environment
A primary goal of synthetic biology in cyanobacteria is to use photosynthesis to convert
CO2 into higher-value products such as biofuels and chemical precursors. To make such a
process economically and environmentally feasible will require using sunlight as a
primary energy source. While some cyanobacteria are facultative heterotrophs, their key
advantage over obligate heterotrophic bacteria is photosynthesis. Unlike heterotrophic
growth environments where carbon and energy sources can be provided more uniformly
both in space and time, sunlight will only be available during the day and will be
attenuated as it passes through the culture. Under certain conditions, cultures may be able
to take advantage of a ‘flashing light effect’ to integrate spatially uneven illumination by
storing chemical energy when in bright light near the reactor surface and using that

55
energy to conduct biochemistry during time spent in the dark away from the reactor
surface. This ability will depend on light intensity, mixing rates, reactor geometry, and
likely other factors. Certain diazotrophic cyanobacteria can even use daylight to continue
growth during the night. Cyanothece sp. ATCC 51142 (and several other strains [206-
208]) is a unicellular diazotrophic cyanobacterium that performs photosynthesis and
accumulates glycogen during the day, and then during the night breaks down its glycogen
reserves to supply energy for nitrogen fixation. Thus, these strains spread out the energy
available from sunlight over a 24-hour period. This process involves a genome-wide
oscillation in transcription, with more than 30% of genes oscillating in expression
between day and night [209]. To take full advantage of sunlight, synthetic systems must
be created that are capable of responding appropriately to this challenging dynamic
environment. It has recently been shown that biofuel-producing strains that dynamically
tune the expression of heterologous pathways in response to their own intracellular
conditions produce more biofuel and exhibit greater stability of heterologous pathways
[210]. As challenging as the design of such a system was for batch heterotrophic cultures,
it will be even more challenging in production environments that include a diurnal light
cycle.
While not all strains exhibit as complete a physiological change between day and night as
Cyanothece 51142, all cyanobacteria do have a circadian clock that adapts them to their
autotrophic lifestyle. The cyanobacterial circadian clock is anchored by master regulators
KaiA, KaiB, and KaiC, which act by cyclically phosphorylating and dephosphorylating
each other [211]. While the circadian rhythm can be reconstituted in vitro using the three
Kai proteins in the presence of ATP [212], the accurate maintenance of this clock in vivo
depends on proper protein turnover [189], on codon selection in the kaiBC transcript
[213], on transcriptional feedback [214], and on the controlled response of the entire
program of cellular transcription to the output of the KaiABC oscillator. While disturbing
rhythmicity can lead to strains that grow better under constant light, the circadian clock is
adaptive for strains living in a dynamic environment [213, 215]. Therefore, integrating
synthetic gene circuits such as biofuel production processes into the circadian rhythm of

56
cyanobacterial hosts will likely lead to both improved production and improved strain
stability in outdoor production environments.
3.5.2 Redirecting Carbon Flux by decoupling growth from production
While redirecting carbon flux is a challenge in all metabolic engineering efforts, it has
been suggested that stringent control of fixed carbon partitioning among central
metabolic pathways poses a major limitation to chemical production especially in
photosynthetic organisms [216]. During the growth phase, it may be true that carbon
partitioning is tightly controlled by any number of mechanisms including metabolite
channeling or simply high demand for metabolic intermediates. However, biofuel
production during non-growth phases [182, 183, 217] demonstrates that under
appropriate conditions, cyanobacterial hosts can produce biofuel compounds with higher
selectivity, since biofuel can be produced by metabolically active cells even in the
absence of growth. Enhancing their productivity in this phase is a major opportunity for
cyanobacterial synthetic biologists to overcome these limits on carbon partitioning.
Capturing this opportunity will require designing complete metabolic circuits that remain
highly active during stationary phase.
3.5.3 RNA-based regulation
Recently, regulation of gene expression through RNA mechanisms has received great
attention across bacterial clades [218-220]. While these mechanisms of regulation may be
important in all bacteria, their prominence is perhaps the greatest in the cyanobacteria and
may help these diurnal organisms adapt to their highly dynamic environment: in a recent
dRNA-seq study, many of the most highly expressed RNAs belonged to families of non-
coding RNAs which are present in nearly all sequenced cyanobacteria, but not in any
other organisms [220, 221]. While their high expression in Synechocystis 6803 suggests
functional importance for non-coding RNAs, few have clearly elucidated functions to
date. syr1 overexpression has been shown to lead to a severe growth defect in
57
Synechocystis 6803 [220]. Another small RNA, isiR, has a critical function in stress
response in Synechocystis 6803. isiR binds to the mRNA (isiA) for the iron-stress
inducible protein, which when translated, forms a ring around trimers of photosystem I,
preventing their activity and thus oxidative stress in the absence of sufficient iron [222].
The binding of isiR to isiA appears to result in rapid degradation. This particular
arrangement allows a very rapid and emphatic response to iron repletion in
cyanobacteria, since a large pool of isiA transcripts can be quickly silenced and marked
for degradation by transcription of the antisense isiR. Although little is so far known
about the generality of this type of regulation, the dynamics of this response might also
be effective to use for synthetic systems in cyanobacteria that live in the presence of light
as an intermittently available but critical nutrient.
While non-coding RNA has received a lot of recent attention, two-component systems
make up the most widely studied family of environmental response regulators in
cyanobacteria. Many of these systems have known functions in response to diverse
environmental stimuli such as nitrogen, phosphorous, CO2, temperature, salt, and light
intensity and quality [223, 224]. Many of the most widely-used systems in the
construction of synthetic biological devices (such as the ara and lux clusters) use 2-
component systems, and even combine 2-component systems with non-coding RNA to
control system dynamics [225]. As synthetic biology advances into the construction of
more and more complex systems, there will be a growing need to understand and use all
of the different mechanisms available for control of gene expression and enzyme activity
in cyanobacteria.
3.6 Parts for Cyanobacterial Synthetic Biology
While cyanobacteria are promising organisms for biotechnology, synthetic biology tools
for these organisms lag behind what has been developed for E. coli and yeast [177].
Furthermore, synthetic biology tools developed in E. coli or yeast often do not function as
designed in cyanobacteria [190]. Here, we discuss inducible promoters and reporters in
cyanobacteria, and cultivation systems that will allow their testing at increased

58
throughput. Refining such systems will make cyanobacterial synthetic biology more user-
friendly, a central goal for developing the ‘green E. coli.
3.6.1 Inducible Promoter
Creation of synthetic biology systems that predictably respond to a specific signal often
depends upon inducible promoters for transcriptional control. An ideal inducible
promoter will have the following properties: (1) It will not be activated in the absence of
inducer. (2) It will produce a predictable response to a given concentration of inducer or
repressor. This response may be digital (i.e., on/off) or graded change with different
concentrations of inducer/repressor. (3) The inducer at saturating concentrations should
have no harmful effect on the host organism. (4) The inducer should be cheap and stable
under the growth conditions of the host. Finally, (5) the inducible system should act
orthogonally to the host cell’s transcriptional program. Ideal transcriptional repressors
should not bind to native promoters and if non-native transcriptional machinery is used
(such as T7 RNA polymerase) it should not initiate transcription from native promoters.
Promoters must perform as ideally as possible in order to be used in the construction of
more complex genetic circuits [226].
Many common inducible promoters in cyanobacteria respond to transition metals. These
have often been the basis of metal detection systems [227-231]. Cyanobacteria balance
metal intake for the organisms’ needs against potential oxidative stress and protein
denaturation [230, 232] via tightly regulated systems. As shown in Table 3-2,
cyanobacteria’s metal-responsive promoters frequently show greater than 100-fold
dynamic range. For example, the promoter for the Synechocystis sp. PCC 6803 gene,
coaA, was induced 500 fold by 6 µM Co2+ [233], and Psmt from Synechococcus elongatus
PCC 7942 was induced 300-fold by 2 µM Zn2+ [227]. The most responsive
cyanobacterial promoters reported were PnrsB from Synechocystis sp. PCC 6803,
responding 1000-fold to 0.5 µM Ni2+[231], and PisiAB also from Synechocystis sp. PCC
6803, repressed 5000-fold by 30 µM Fe3+ following depletion [234].

59
Table 3-2: Inducible promoters used in cyanobacterial hosts
Promoter Source Inducer/ Repressor & Concentration
Expression Host Expressed Gene
Dynamic Range
Measure of Expression Reference
Metal-Inducible promoters:
arsB Synechocystis sp. PCC 6803
Inducer AsO2- 720 µM
Synechocystis sp. PCC 6803 arsB 100 fold RT-PCR Blasi et al., 2012
ziaA Synechocystis sp. PCC 6803
Inducer Cd2+ 2 µM
Synechocystis sp. PCC 6803 ziaA 10 fold RT-PCR Blasi et al., 2012
coat Synechocystis sp. PCC 6803
Inducer Co2+ 6 µM
Synechocystis sp. PCC 6803
gene encoding EFE from Pseudomonas syringae
500 fold 48 nl ethylene/ml h
Guerrero et al., 2012
coat Synechocystis sp. PCC 6803
Inducer Co2+ 6.4 µM
Synechocystis sp. PCC 6803 coaR+luxAB 70 fold
70 (relative luminescence)
Peca et al., 2008
coat Synechocystis sp. PCC 6803
Inducer Co2+ 3 µM
Synechocystis sp. PCC 6803 coaT 10 fold RT-PCR Peca et al., 2007
nrsB Synechocystis sp. PCC 6803
Inducer Co2+ 3 µM
Synechocystis sp. PCC 6803 nrsB 10 fold RT-PCR Peca et al., 2007
coat Synechocystis sp. PCC 6803
Inducer Co2+ 1 µM
Synechocystis sp. PCC 6803 coaT 10 fold RT-PCR Blasi et al., 2012
petE Synechocystis sp. PCC
Inducer Cu2+
Synechocystis sp. PCC 6803
gene encoding EFE from 5 fold 28 nl
ethylene/ml h Guerrero et al., 2012

60
6803 0.5 µM Pseudomonas syringae
petE Synechocystis sp. PCC 6803
Inducer Cu2+ 3µM
Anabaena sp. PCC 7120 hetP 4.5 fold
8% heterocyst frequency
Higa and Callahan, 2010
petE Synechocystis sp. PCC 6803
Inducer Cu2+ 0.3µM
Anabaena sp. PCC 7120
hetN (prevents heterocyst formation)
qualified but not quantified
0% heterocysts from 10% uninduced
Callahan and Buikema, 2001
isiAB Synechocystis sp. PCC 6803
Repressor Fe3+ 30 µM
Synechocystis sp. PCC 6803 isiAB+gfp 5000 fold
From 5000 GFP fluorescence (relative units)
Kunert et al., 2003
idiA Synechococcus elongatus PCC 7942
Repressor Fe2+ 0.043mM
Synechococcus elongatus PCC 7942
luxAB 170 fold Luminescence 5.3 x 10^6 cpm
Michel et al., 2001
isiAB Synechococcus sp. strain PCC 7002
Repressor Fe3+ 100 nM
Synechococcus sp. strain PCC 7002
luxAB from Vibrio harveyi 2 fold
From 1200 relative luminescence units cell-1 x 10^5 s-1
Boyanapalli et al., 2007
nrsB Synechocystis sp. PCC 6803
Inducer Ni2+ 0.5 µM
Synechocystis sp. PCC 6803 nrsB 1000 fold RT-PCR Peca et al., 2007
nrsB Synechocystis sp. PCC 6803
Inducer Ni2+ 5 µM
Synechocystis sp. PCC 6803 nrsB 400 fold RT-PCR Blasi et al., 2012
nrsB Synechocystis sp. PCC
Inducer Ni2+
Synechocystis sp. PCC 6803 nrsR+luxAB 50 fold 50 (relative
luminescence Peca et al., 2008

61
6803 6.4 µM )
Smt Synechococcus elongatus PCC 7942
Inducer Zn2+ 2 µM
Synechococcus elongatus PCC 7942
luxCDABE from Vibrio fisheri
300 fold 325,000 cps luminescence Erbe et al., 1996
ziaA Synechocystis sp. PCC 6803
Inducer Zn2+ 5 µM
Synechocystis sp. PCC 6803 ziaA 40 fold RT-PCR Peca et al., 2007
ziaA Synechocystis sp. PCC 6803
Inducer Zn2+ 4 µM
Synechocystis sp. PCC 6803 ziaA 40 fold RT-PCR Blasi et al., 2012
coat Synechocystis sp. PCC 6803
Inducer Zn2+ 3.2 µM
Synechocystis sp. PCC 6803 coaR+luxAB 25 fold
25 (relative luminescence)
Peca et al., 2008
coat Synechocystis sp. PCC 6803
Inducer Zn2+ 5 µM
Synechocystis sp. PCC 6803 coaT 10 fold RT-PCR Peca et al., 2007
coat Synechocystis sp. PCC 6803
Inducer Zn2+ 4 µM
Synechocystis sp. PCC 6803 coaT 8 fold RT-PCR Blasi et al., 2012
Smt Synechococcus elongatus PCC 7002
Inducer Zn2+ 2 µM
Synechocystis sp. PCC 6803
gene encoding EFE from Pseudomonas syringae
2 fold 2 nl ethylene/ml h
Guerrero et al., 2012
ziaA5 Synechocystis sp. PCC 6803
Inducer Zn2+ 3.5 µM
Synechocystis sp. PCC 6803
hydA1 from Chlamydomonas reinhardtii
qualified but not quantified
109 nmol H2 mg Chl-1 min-1
Berto 2011

62
Metabolite-Inducible Promoters
tetR3 E. coli Inducer aTc 10^3 ng/ml
Synechocystis sp. strain ATCC27184
EYFP 290 fold over 10,000 emission/cell (a.u.)
Huang and Lindblad, 2013
trp-lac E. coli Inducer IPTG 100 µM
Synechococcus elongatus PCC 7942
invA and glf genes from Zymomonas mobilis
160 fold for fructose + 30 fold for glucose
160 µM fructose + 30 µM glucose
Niederholtmeyer et al., 2010
trc E. coli Inducer IPTG 1mM
Synechococcus elongatus PCC 7942
uidA from E. coli 36 fold
340 nmol MU min-1 (mg protein)-1 (β-Glucuronidase activity)
Geerts et al., 1995
A1lacO-1 E. coli Inducer IPTG 1 mM
Synechocystis sp. PCC 6803
gene encoding EFE from Pseudomonas syringae
8 fold 170 nl ethylene/ml h
Guerrero et al., 2012
trc20 E. coli Inducer IPTG 2 mM
Synechocystis sp. PCC 6803
gene encoding GFPmut3B 4 fold
12 (units relative to promoter activity for lacI)
Huang et al., 2010
trc10 E. coli Inducer IPTG 2 mM
Synechocystis sp. PCC 6803
gene encoding GFPmut3B 1.6 fold
101 (units relative to promoter activity for
Huang et al., 2010

63
lacI)
LlacO12 E. coli Inducer IPTG 1mM
Synechococcus elongatus PCC7942
alsS (B. subtilis), alsD (A. hydrophila), and adh (C. beijerinckii)
1.6 fold
1.6 (relative activity of sADH and ALS)
Oliver et al., 2013
Trc4 E. coli Inducer IPTG 1 mM
Synechocystis sp. PCC 6803
gene encoding EFE from Pseudomonas syringae
no significant difference
170 nl ethylene/ml h
Guerrero et al., 2012
Macronutrient-Inducible Promoters
psbA2 Synechocystis sp. PCC6803
Inducer light 500 µmol photons m-2 s-1
Synechocystis sp. PCC6803
ispS from Pueraria montana (kudzu)
qualified but not quantified
~50 mg isoprene per g dry cell weight per day
Lindberg et al., 2010
psbA21 Synechocystis sp. PCC 6803
Inducer light 50 µEm-2sec-1
Synechocystis sp. PCC 6803
hydA1 from Chlamydomonas reinhardtii
qualified but not quantified
130 nmol H2 mg Chl-1 min-1
Berto et al., 2011
psbA1 Anabaena sp. PCC 7120
Inducer light 30 µEm-2s-1
Anabaena sp. PCC 7120
hetR from E. coli
17% heterocyst frequency
Chaurasia and Apte, 2011
nirA Synechococcus elongatus
Inducer/Repressor NO3-/NH4+
Synechocystis sp. PCC 6803
gene encoding p- 25 fold 250 ng
tocopherol/m Qi et al., 2005

64
1: In the presence of 5 µM DCMU, which inhibits the PSII-dependent oxygen evolution.
2: Leaky production of 2,3-butanediol, no IPTG and 1 mM IPTG similar.
3: Grown in the dark on 5 mM glucose.
4: Plac variants had differential expression early in growth phase but dynamic range was reduced as growth proceeded.
5: in the presence of 5 µM DCMU, which inhibits the PSII-dependent oxygen evolution.
PCC 7942 17.6 mM/17.6 mM hydroxyphenylpyruvate dioxygenase from Arabidopsis thaliana
g dcw
nirA Synechococcus elongatus PCC 7942
Inducer/Repressor NO3-/NH4+ 15.0 mM/3.75 mM
Synechococcus elongatus PCC 7942
cmpABCD 5 fold 260 nmol HCO3-/mg Chl
Omata et al., 1999
Nir Anabaena sp. PCC 7120
Inducer/Repressor NO3-/NH4+ 5.9 mM/10.0 mM
Anabaena sp. PCC 7120 nir
qualified but not quantified
250 mg labeled proteins for NMR/L of culture
Desplancq et al., 2005

65
While the sensitivity of these promoters to low concentrations of ions may seem like an
advantage, in practice it can make them difficult to use. Glassware must be thoroughly
cleaned according to special protocols to remove trace metals and cells often have to be
starved for extended periods, inducing stress responses, to use such inducible systems.
Additionally, promoters endogenous to a chassis strain are woven into a complex,
incompletely understood regulatory system. In this system, promoters are activated by
multiple inducers, such as PcoaT (Co2+ and Zn2+) and PziaA (Cd2+ and Zn2+), both from
Synechocystis sp. PCC 6803 and inducers can also activate multiple promoters, such as
Cd2+ inducing ziaA and isiA [229]. Thus, these promoters fall short according to criteria
2, 3, and 5 described above.
While few good choices have so far been available for inducible promoters in
cyanobacteria, it will be helpful to understand the differences in the cellular machinery of
E. coli and cyanobacteria in order to adapt existing systems for use in a cyanobacterial
‘green E. coli’. First, RNA polymerase (RNAP) is structurally different between E. coli
and cyanobacteria. In cyanobacteria the β’ subunit of the RNAP holoenzyme is split into
two parts, as opposed to one in most eubacteria, creating a different DNA binding domain
[235]. Being photosynthetic, circadian, and sometimes nitrogen-fixing, cyanobacteria
also employ three sets of interconnected σ factors that are different than those used by E.
coli [235]. Guererro et al. (2012) looked at the variation in the -35 and -10 regions of
PA1lacO-1 and Ptrc. Ptrc is not inducible in Synechocystis sp PCC 6803 and had the
“standard” bacterial structure in these regions while PA1lacO-1, which produced an eight
fold response to IPTG in the same host, had a different structure in both regions. They
postulated that Synechocystis 6803’s sigma factors had different selectivity for these two
regions. In fact, by systematically altering the bases between -10 and the transcription
start site, a library of TetR-regulated promoters with improved inducibility were created
in Synechocystis sp. strain ATCC27184 (a glucose-tolerant derivative of Synechocystis
6803). The best performing promoter induced a 290-fold change in response to 1 ug/ml
aTc [192]. This work demonstrates the improvements that can be seen when modifying
parts to work in a particular chassis. However, the light-sensitivity of the inducer aTc

66
required the use of special growth lights that may have had other effects on
photoautotrophic metabolism. Further studies that follow in this vein of using well-
characterized synthetic biology parts and modifying them to function optimally in a
particular cyanobacterial chassis are likely to bear fruit.
The lack of inducibility seen in lac-derived promoters in cyanobacteria could also be a
function of inadequate transport of IPTG into cells. Concentrations of IPTG above 1 mM
have been shown to induce lac-derived promoters in organisms without an active lactose
permease, like many cyanobacteria. By introducing an active lactose permease into
Pseudomonas fluorescens, inducibility was boosted 5 times at 0.1 mM IPTG [236].
Evolving the Lac repressor for improved inducibility is another strategy. Gene
expression improved ten times with 1 µM IPTG through rounds of error prone PCR and
DNA shuffling [237]. Strength of expression and inducibility may also vary between
different cyanobacterial strains. IPTG caused as much as a 36-fold response using the trc
promoter in Synechococcus elongatus PCC 7942, but little or no response in
Synechocystis sp. PCC 6803 (See Table 3-2). Phylogenetic analysis of σ factors from six
different cyanobacterial strains, including Synechocystis 6803, showed S. elongatus 7942
to be distinctive. S. elongatus 7942 has σ factors that are unique to marine cyanobacteria
as well as a group 3 σ factor similar to those from the heterocyst-forming Anabaena sp.
PCC 7120 [235]. Understanding these strain-specific differences will enhance the
synthetic biologist’s ability to design promoters with ideal characteristics in their chassis
of choice. This relates to the ability to take up inducers as well as the optimal
characteristics of inducers (as in the light-sensitivity of aTc) as described above.
3.6.2 Reporters
Characterization of synthetic biological circuits depends on a reporting method to track
the expression, interaction and position of proteins. Preferably the reporter should be
detected without destruction of the organisms or additional inputs. Bacterial luciferase
and fluorescent proteins are the most common non-invasive reporters. The lux operon is

67
frequently used for reporting in cyanobacteria [230, 232, 238] and is well suited for real
time reporting of gene expression due to the short half-life of the relevant enzymes [239].
The superior brightness of fluorescent proteins makes them more ideal for subcellular
localization via microscopy or for cell-sorting methods. Fluorescent proteins are
produced in an array of colors and also do not require additional substrates. Their use in
cyanobacteria is somewhat complicated by the fluorescence of the organism’s
photosynthetic pigments, but Cerulean, GFPmut3B (a mutant of green fluorescent
protein) and EYFP (enhanced yellow fluorescent protein) have all been used successfully
in cyanobacteria as reporters of gene expression [177, 190-192].
Bacterial luciferase luminesces upon oxidation of reduced flavin mononucleotide [240].
Fluorescent proteins also require oxygen to correctly fold and fluoresce [241]. The light-
dark cycle of nitrogen-fixing cyanobacteria provides temporal separation of the oxygen-
sensitive nitrogenase from oxyegen-evolving photosynthesis [242]. During the dark
cycle, respiration reduces intra-cellular oxygen levels so that nitrogenase can function.
Therefore, neither bacterial luciferase nor traditional fluorescent proteins can likely be
used to study cyanobacteria in their dark cycle or to report on synthetic biology systems
that operate in these oxygen-depleted conditions. Using blue light photoreceptors from
Bacillus subtilis and Pseudomonas putida, oxygen-independent flavin mononucleotide-
binding florescent proteins have been devised [243]. With an excitation wavelength of
450 nm and an emission wavelength of 495 nm, they should perform well in
cyanobacteria, although no data supporting this has been published yet. Functionality of
these new fluorescent proteins was also improved by replacing a phenylalanine suspected
of quenching with serine or threonine, resulting in a doubling of the brightness [244].
This expanding variety of easily readable reporter systems will be extremely valuable for
cyanobacterial synthetic biology.

68
3.6.3 Cultivation systems
To date, most synthetic biology and metabolic engineering work in cyanobacteria has
been performed using simple, low-tech cultivation methods such as shake flasks or
bubbling tubes grown under standard fluorescent light sources. Often, laboratory
incubators have simply been retrofitted by the addition of fluorescent light sources
available in home improvement stores. However, as light and CO2 are major nutrients for
cyanobacteria, it is critical to properly standardize the inputs of these resources to reliably
characterize biological parts. It is also critical to increase the throughput of
cyanobacterial growth systems to be able to screen the large numbers of variants that can
be generated by combinatorial methods, as is routinely performed by growing
heterotrophic bacterial cultures in 96-well plate format. Growth of cyanobacteria in 6-
well plates can be routinely performed in our lab and by others [192] along with 24-well
plates [245], but growth in 96-well plates is poor, limiting assay throughput and requiring
more space in lighted chambers under consistent illumination, which is often a limitation.
Simple, low-cost systems to reproducibly grow many cyanobacterial cultures in parallel
are necessary.
3.7 Genome-scale modeling and fluxomics of cyanobacteria
A primary aim of cyanobacterial synthetic biology is the production of particular
metabolites as biofuels or platform chemicals. As such, better understanding the
metabolic phenotypes of wild-type and synthetic strains is a critical aim. While
cyanobacterial metabolomics have been recently reviewed [246], here we describe recent
progress in genome-scale modeling and fluxomics of cyanobacteria. These approaches
can help guide the creation of synthetic strains with desirable metabolic phenotypes such
as biofuel overproduction via in silico prediction or in vivo measurement of metabolic
fluxes (See Figure 3-3). Specific to cyanobacterial systems, we highlight a number of
challenges including complexity of modeling the photosynthetic metabolism and
performing flux balance analysis, poor annotations of important metabolic pathways, and

69
unavailability of in vivo gene essentiality information for most cyanobacteria. Finally, we
focus on recent advancements in this area.
Figure 3-3: Using fluxomics and genome sclae models to link genotype to metabolic
phenotype.
From an annotated genome sequence, a stoichiometric model of metabolism can be
constructed. That model can be solved via either prediction of an optimal flux phenotype
(FBA) or measurement of actual flux phenotype (13C-MFA). These results can help
suggest modifications for altering the phenotype of the cell in a desired manner. In this
way, a synthetic biologist can design new strains, build them using genetic modification

70
methods, and test their phenotypes before designing new modifications in an iterative
fashion.
3.7.1 Challenges
3.7.1.1 Incorporating photoautotrophy into metabolic models
Flux balance analysis (FBA) is a tool to make quantitative in silico predictions about
metabolism [247-250]. An FBA model incorporates the stoichiometry of all genome-
encoded metabolic reactions and assumes steady-state growth, such as during exponential
phase. This assumption leads to a model that consists of a system of algebraic equations,
which state that the rate of producing any given metabolite is equal to the rate of
consuming that metabolite. A solution to this system of equations is a possible answer to
the question “what are all the metabolic fluxes in this system?” Since there are usually
more reactions than metabolites, this system of equations is underdetermined and has
many possible solutions. Therefore, one has to pick a solution that satisfies a biological
objective, such as maximal growth, energy production, or byproduct formation [251]. For
this purpose, a model will also include upper and lower bounds of fluxes that constrain
the model to produce physically and biologically reasonable solutions.
Success of FBA greatly depends on the quality of the metabolic network reconstruction
as well as the availability of regulatory constraints under a given environmental or
growth condition. For instance, constraints can be added that disable or limit fluxes due
to known regulatory constraints or substrate availability [20]. For cyanobacteria, the
major challenges to develop a genome-scale metabolic model and subsequently perform
FBA are the same ones faced by these organisms in their diurnal environment: how to
incorporate light and how to differentiate light and dark metabolisms. Although it has
been nearly a decade since publication of the first study applying flux balance analysis to
cyanobacteria, it is only recently that models have incorporated complete descriptions of

71
the light reactions of photosynthesis [109]. In so doing, these authors were able to
highlight the critical importance of alternate electron flow pathways to growth under
diverse environmental conditions, and to identify differences in metabolism during
carbon-limited and light-limited growth. However, debate remains among photosynthesis
researchers about the exact form of the light reactions [252, 253]. This uncertainty about
the exact stoichiometry of metabolism is a challenge for the predictive power of FBA in
photosynthetic systems. While FBA requires the assumption of a pseudo-steady state, all
cyanobacteria must alternate between day and night metabolisms during a diurnal cycle.
A recent model [3] of Cyanothece sp. ATCC 51142 utilizes proteomic data to model the
diurnal rhythm of this strain, which fixes carbon during the day and nitrogen during the
night (see section 4 above).
3.7.1.2 Incompleteness of genome annotation
Genome scale models are built starting with an annotated genome sequence (see Figure
3), which allows prediction of which metabolic reactions are available in a given strain.
However, genome annotation is constantly evolving, and open questions remain about
important metabolic reactions in cyanobacteria.
The understanding of several key pathways in cyanobacteria has been recently revised.
Zhang and Bryant [110] identified enzymes from Synechococcus 7002 that can complete
the TCA cycle in vitro and have homologues in most cyanobacterial species, which were
previously thought to possess an incomplete TCA cycle. Based on this information,
Synechocystis 6803 model iSyn731 [3] allows for a complete TCA cycle including these
reactions. However, using flux variability analysis [254, 255] it was determined that this
alternate pathway is not essential for maximal biomass production (unpublished results,
[3]). Fatty acid metabolism in cyanobacteria has unique properties that have been
recently uncovered due to increased interest in these pathways for biofuel production.
Both Synechocystis sp. PCC 6803 and Synechococcus elongatus sp. PCC 7942 contain a
single candidate gene annotated for fatty acid activation. While in both organisms the

72
gene is annotated as acyl-CoA synthetase, it shows only acyl-ACP synthetase activity
instead [256]. Further analysis also shows the importance of acyl-ACP synthetase in
enabling the transfer of fatty acids across the membrane [257]. Quinone synthesis is
another pathway with conflicting annotations. Cyanobacteria contain neither ubiquinone
nor menaquinone [258]. Despite the lack of ubiquinone within cyanobacteria, a number
of cyanobacterial genomes contain homologs for six E. coli genes involved in ubiquinone
biosynthesis [259]. Given these homologous genes it is probable that plastoquinone, a
quinone molecule participating in the electron transport chain, is produced in
cyanobacteria using a pathway very similar to that of ubiquinone production in
proteobacteria. Wu et al. [99] showed that Cyanothece 51142 contains an alternative
pathway for isoleucine biosynthesis. Threonine ammonia-lyase, catalyzing the conversion
of threonine to 2-ketobutyrate, is absent in Cyanothece 51142. Instead, this organism uses
a citramalate pathway with pyruvate and acetyl-CoA as precursors for isoleucine
synthesis. An intermediate in this pathway, namely ketobutyrate, can be converted to
higher alcohols (propanol and butanol) via this non-fermentative alcohol production
pathway. These active areas of research will help to better define cyanobacterial
metabolism and allow the generation of models that can more accurately predict cellular
phenotypes. While newer fluxomics techniques can yield powerful results in well-
characterized strains, developing a ‘green E. coli’ will also require expanded knowledge
of biochemistry that to date can only come from older methods of single gene or single
protein analysis.
3.7.1.3 Fewer mutant resources to test model accuracy
The quality or accuracy of any genome-scale metabolic model can be tested by
contrasting the in silico growth phenotype with available experimental data on the
viability of single or multiple gene knockouts [8]. Any discrepancies between model
predictions and observed results can aid in model refinement [41]. For model strains
besies cyanobacteria, concerted efforts to create complete mutant libraries have led to
improvements in metabolic modeling. To the best of our knowledge, extensive in vivo

73
gene essentiality data are available only for Synechocystis 6803 among the cyanobacteria
in the CyanoMutants database [111, 128], but only for ~119 genes, compared with 731
genes associated with metabolic reactions in a recent genome-scale model [3]. Thus, only
a small subset of the model predictions on gene essentiality can be evaluated using
available data for Synechocystis 6803, and the proportion is much less for any other
strain. While a genome-wide library of knockout mutants has been created in
Synechococcus 7942 [178] segregation (and thus essentiality) has only been checked for a
small selection of these mutants and its not available in any large-scale public database to
date. Unavailability of such mutant information limits model validation and in turn hurts
the value of computational predictions from FBA. Efforts to create complete mutant
libraries in model cyanobacterial strains would improve the fidelity of genome-scale
metabolic models, leading to testable hypotheses about how to alter metabolism for
metabolite overproduction.
3.7.2 Recent advances
3.7.2.1 Detailed genome-scale models
Genome-scale models contain detailed Gene-Protein-Reaction associations, a
stoichiometric representation of all possible reactions occurring in an organism, and a set
of appropriate regulatory constraints on each reaction flux. They are differentiated from
more basic FBA models simply by their completeness – they span all or nearly all of the
metabolic reactions encoded in a genome. Thus, these models can have greater predictive
value than those of only central metabolism. Cyanothece 51142 is one of the most
potently diazotrophic unicellular cyanobacteria characterized and the first diazotrophic
cyanobacterium to be completely sequenced [86]. The first genome-scale model for
Cyanothece 51142, iCce806, is recently developed [102], while another more recent
genome-scale model iCyt773 contains an additional 266 unique reactions spanning
pathways such as lipid, pigment and alkane biosynthesis [3]. iCyt773 also models diurnal

74
metabolism by including flux regulation based on available day/night protein expression
data [160] and developing separate (light/dark) biomass equations. These models greatly
enhance the ability to make computational predictions about this unique and promising
diazotrophic organism.
Since Synechocystis 6803 is a model cyanobacterial strain, it has long been the target for
modeling of photosynthetic central metabolism [104, 105]. More recent models [89, 108]
analyze growth under different conditions and detect bottlenecks and gene knock-out
candidates to enhance metabolite production (e.g., ethanol, succinate, and hydrogen). A
recent model represents the photosynthetic apparatus in detail, detects alternate flow
pathways of electrons and also pinpoints photosynthetic robustness during
photoautotrophic metabolism [109]. iSyn731, the latest of all Synechocystis 6803
models, integrates all recent developments and supplements them with improved
metabolic capability and additional literature evidence. As many as 322 unique reactions
are introduced in iSyn731 including reactions distributed in pathways such as
heptadecane and fatty acid biosynthesis [3]. Furthermore, iSyn731 is the first model for
which both gene essentiality data [111] and MFA flux data [112] are utilized to assess the
predictive quality. Additionally, genome scale modeling has been extended to include
another model cyanobacterium, Synechococcus sp. PCC 7002 [260]. Other model strains
highlighted in Table 3-1 have not yet had genome-scale models generated for their
metabolism. Thus, stoichiometric models are emerging as a valuable tool for use across
model cyanobacterial systems.
3.7.2.2 13C MFA analysis
While in silico models are great tools for generating hypotheses on how to use synthetic
biology interventions to alter metabolism, they need to be complemented by fluxomics
methods that allow in vivo measurement of metabolic fluxes to assess these interventions.
Such a suite of tools allows the closure of the design-build-test engineering cycle in
synthetic biology. To this end, Young et al. (2011) have developed a method to measure

75
fluxes in autotrophic metabolism via dynamic isotope labeling measurements. In this
approach, cultures are fed with a step-change from naturally labeled bicarbonate to
NaH13CO3 and the labeling patterns of metabolic intermediates are followed over a time-
coures to determine relative rates of metabolic flux. Previous studies [105] have also
assessed metabolic fluxes under mixotrophic growth conditions, using a pseudo-steady-
state approach in which cells are fed with 13C labeled glucose and metabolic fluxes are
inferred from labeling patterns of proteinogenic amino acids. These studies have been
extremely useful in identifying fluxes that exist in vivo, but have previously been
regarded as wasteful or futile cycles, such as the oxidative pentose phosphate pathway
and RuBP oxygenation. Comparisons between flux measurements [112] and flux
predictions [3] for Synechocystis 6803 have revealed the necessity of additional
regulatory information for accurate in silico predictions of phenotype. These modeling
and fluxomics efforts have resulted in deeper understanding of the metabolic capabilities
of the modeled strains and of cyanobacteria in general.
3.8 Conclusions
Cyanobacterial synthetic biology offers great promise for enhancing efforts to produce
biofuels and chemicals in photoautotrophic hosts. While several cyanobacterial chassis
strains have been used in synthetic biology efforts, the tools for their manipulation and
analysis need greater development to unlock this potential and develop a ‘green E. coli’.
Metabolic modeling is a complementary tool that can help guide the creation of synthetic
strains with desirable phenotypes. By developing the tools for strain manipulation and
control, synthetic biologists can unlock a bright future for the biotechnological use of
abundant light and CO2.

76
4 Chapter 4 ZEA MAYS iRS1563: A COMPREHENSIVE GENOME-SCALE METABOLIC RECONSTRUCTION OF MAIZE METABOLISM
This chapter has been previously published in modified form in PLoS One (Saha, R., P.F. Suthers and C.D. Maranas (2011), "Zea mays iRS1563: A Comprehensive Genome-Scale Metabolic Reconstruction of Maize Metabolism.," PLoS ONE, 6(7): e21784).
4.1 Introduction
Zea mays, commonly known as maize or corn, is a plant organism of paramount
importance as a food crop, biofuel production platform and a model for studying plant
genetics [261]. Maize accounts for 31% of the world production of cereals occupying
almost one-fifth of the worldwide land dedicated for cereal production [262]. Maize
cultivation led to 12 billion bushels of grain in the USA alone in 2008 worth $47 billion
[263]. Maize is the second largest crop, after soybean, used for biotech applications
[262]. In addition to its importance as a food crop, 3.4 billion gallons of ethanol was
produced from maize in 2004 [263]. Maize derived ethanol accounts for 99% of all
biofuels produced in the United States [263]. However, currently nearly all of this
bioethanol is produced from corn seed [264]. Ongoing efforts are focused on developing
and commercializing technologies that will allow for the efficient utilization of plant fiber
or cellulosic materials (e.g. maize stover and cereal straws) for biofuel production. Maize
is the most studied species among all grasses with respect to cell wall lignification and
digestibility, which are critical for the efficient production of cellulosic biofuels [265]. A
thorough evaluation of the metabolic capabilities of maize would be an important
resource to address challenges associated with its dual role as a food (e.g., starch storage)
and biofuel crop (e.g., cell wall deconstruction).
This decade we witnessed significant advancements towards mapping plant genes to
metabolic functions culminating with the complete genome sequencing and partial

77
annotation of a number of plant species, namely, Arabidopsis thaliana [266], Oryza
Sativa [267, 268], Sorghum bicolor [269], Zea mays [270] and Theobroma cacao [271].
Nevertheless, attempts to engineer plant metabolism for desired overproductions have
been met with only limited success [272]. Genetic modifications seldom bring about the
expected/desired effect in plant metabolism primarily due to the built-in metabolic
redundancy circumventing the imposed genetic changes [273, 274]. This necessitates the
development of genome-wide comprehensive metabolic reconstructions capable of taking
account of the complete inventory of metabolic transformations of a given plant
organism.
Genome-scale metabolic reconstructions are available for an increasing number of
organisms [275, 276]. At least 40 bacterial, 2 archaeal and 15 eukaryotic reconstructions
are available to-date [272, 275, 277, 278] while many others are under development.
Recently Poolman et al (2009) and Dal’Molin et al (2010) independently constructed the
first two genome-scale metabolic reconstructions for a plant organism (i.e., Arabidopsis
thaliana). The model by Dal’Molin et al identifies the set of essential reactions, accounts
for the classical photorespiratory cycle and highlights the significant differences between
photosynthetic and non-photosynthetic metabolism. The model by Poolman et al includes
ATP demand constraints for biomass production and maintenance and suggests strategies
for the construction of metabolic modules as a consequence of variation in ATP
requirement. Both models make a significant step forward towards assessing the
metabolic capabilities of plants establishing production routes for key biomass precursors
and major pathways of Arabidopsis primary metabolism. In addition, two recent efforts
involved the reconstruction of plant models with an emphasis on specific physiological
conditions or tissue types [279, 280]. Model C4GEM [280] focused on C4 plants such as
maize, sugarcane and sorghum and investigated flux distributions in mesophyll and
bundle sheath cells during C4 photosynthesis. Grafahrend-Belau et al developed a
metabolic network of only primary metabolism in barley seeds and studied grain yield
and metabolic fluxes under a variety of oxygen availability scenarios and genetic
manipulations [279]. Pilalis et al. reconstructed a multi-compartmental model of the

78
central metabolism of Brassica napus (Rapeseed) and simulated seed growth during the
stage of oil accumulation and subsequently studied network properties of seed
metabolism via Flux Balance Analysis, Principal Component Analysis and reaction
deletion studies [281].
In this chapter, we describe the construction of a genome-scale in silico model of maize
metabolism (i.e., Zea mays iRS1563). This is, to the best of our knowledge, the first
attempt of globally characterizing the metabolic capabilities (both primary and secondary
metabolism) using a compartmentalized photosynthetic model of an important crop and
energy plant species. The development of a genome-scale model for maize is a significant
challenge due to its genome size which is 14 times larger [270] than that of Arabidopsis
thaliana (157 million base pairs) [282]. The constructed model contains 1,563 genes and
1,825 metabolites participating in 1,985 reactions from both primary and secondary
metabolism of maize. For 42% of the reaction entries direct literature evidence in
addition to homology criteria for their inclusion to the model was identified. We found
that as many as 676 reactions and 441 metabolites are unique to Zea mays iRS1563 in
comparison to the AraGEM model by Dal’Molin et al. We chose the AraGEM model as a
basis of comparisons as at the onset of this study it was the most comprehensive genome-
scale compartmentalized model of a plant species capable of recapitulating basic plant
physiological states. In order to deduce the genuine differences between maize and
Arabidopsis irrespective of annotation chronology we also reconstructed an up-to-date
model of Arabidopsis, A. thaliana iRS1597. A. thaliana iRS1597 contains 1597 genes,
1798 reactions and 1820 metabolites. In comparison to A. thaliana iRS1597, Zea mays
iRS1563 has 445 new reactions and 369 new metabolites. Notably, 893 reactions and 674
metabolites are included in Zea mays iRS1563 that are absent from the maize C4GEM
model. All reactions present in Zea mays iRS1563 are elementally and charged balanced
and localized into six compartments including cytoplasm, mitochondrion, plastid,
peroxisome, vacuole and extracellular space. Provisions for accounting that
photosynthesis in maize (i.e., a C4 plant) occurs in two separate cell types (i.e.,
mesophyll cell and bundle sheath cell) are included in the model. GPR associations are

79
delineated from the available functional annotation information and homology prediction
accounting for monofunctional, multifunctional and multimeric proteins, isozymes and
protein complexes. A biomass equation is established that quantifies the relative
abundance of different constituents of dry plant cell biomass. Biomass production under
three different physiological states (i.e., photosynthesis, photorespiration and respiration)
is demonstrated and the model is tested against experimental data for two naturally
occurring maize mutants (i.e., bm1 and bm3).
4.2 Results
The metabolic model reconstruction process follows three major steps: (1)
Reconstruction of draft model via automated homology searches for the identification of
native biotransformations; (2) Generation of a computations-ready model after defining
biomass equation and system boundary and establishing GPR; (3) Model refinement via
GapFind and GapFill [39] to unblock biomass precursors as well as reconnect
unreachable metabolites. Upon construction of the model, key features such as
physiological constraints, network connectivity, light reactions, carbon fixation and
secondary metabolism and uniqueness compared to AraGEM and maize C4GEM are
described. In addition, model predictions are contrasted against experimental
observations.
4.2.1 Construction of Auto & Draft models
The B73 maize genome [270] has 32,540 genes and 53,764 transcripts in the Filtered
Gene Set (FGS). Out of 32,540 genes, 30,599 (93%) are evidence-based [283], while the
remaining 2,141 (7%) are predicted by the Fgenesh program [284]. 13,726 genes (42%
of total) do not have any functional annotation information or are identified as proteins
with no or hypothetical/putative functions. Of the remainder, 1,361 (7%) genes encode
proteins that do not participate in specific metabolic transformations but rather are

80
involved in transcription, signal transduction, DNA repair, DNA binding, DNA/RNA
polymerization, protein folding and adhesion. Because the B73 maize genome is not
completely annotated we first established Gene-Protein-Reaction (GPR) mappings for the
AraGEM genome-scale model of A. thaliana [272] to be used as a proxy. Using these
GPRs as a point of comparison we next identified Arabidopsis gene orthologs in maize
and transferred the corresponding GPRs via the AUTOGRAPH method [285]. This step
was followed by annotation of the remainder maize genes by bidirectional protein
BLAST (i.e., BLASTp) searches against the NCBI non-redundant (nr) database. Out of a
total of 1,567 metabolic or transport reactions of AraGEM, GPRs were established for
1,254 reactions via 1,467 genes and 653 enzymes by making use of information from
several online databases such as AraCyc, KEGG, Uniprot and Brenda. Bidirectional
BLASTp searches for each one of the 1,467 genes included in AraGEM model were
carried out against the B73 maize genome using a stringent cutoff value of 10-30. This
fully automated process generated an initial model, termed as ‘Automodel’, containing
946 genes and 1,365 unique metabolites participating in 1,186 reactions (see Table 4-1)
exclusively derived from AraGEM. Out of 1,186 reactions, 32 are inter-organelle
transport reactions for which homologs were found in maize.
Genes not included in the automodel were scrutinized further by comparing them against
the NCBI non-redundant protein database using the same BLASTp cut-off. This
increased the model size to 1,485 genes and 1,703 unique metabolites involved in 1,667
reactions by pulling functionalities absent in AraGEM. This is referred to as the ‘Draft
model’ (see Table 4-1). As described in Table 4-2, orthologous genes were found in
Oryza Sativa (Rice), Arabidopsis thaliana (Arabidopsis), Sorghum bicolor (Sorghum)
and less frequently in other plant species such as wheat, tobacco, spinach, soya bean, etc.
Notably, 802 orthologous genes from A. thaliana were added in the model Zea mays
iRS1563 that were absent from AraGEM primarily due to recent annotation updates.
Reactions associated with these genes were subsequently extracted from on-line
databases such as KEGG and BRENDA. Table 4-2 shows the total number of reactions
as well as the number of new reactions included in the draft model. Seven reactions

81
having KEGG reaction IDs R00379, R00381, R06023, R06049, R06082, R06138 and
R06209 were excluded since they involve generic groups and were not elementally fully
defined. Figure 4-1 shows the distribution of the newly added reactions in the draft model
based on their orthologous gene of origin.
Figure 4-1: Species origin of newly added reactions in the Draft model.
4.2.2 Generation of computations-ready model
A computations-ready model requires a fully characterized biomass equation, assignment
of metabolites to reactions, establishment of GPR associations, localization of reactions
in compartment(s), and inclusion of intra- and extracellular transport reactions [36].
(i) Establishing a fully characterized biomass equation: A biomass equation that drains
all necessary precursors present in maize was derived (see Table 4-3). We used the

82
Table 4-1: Model size after each reconstruction step
aOthers include proteins involve in complex relationships, e.g. multiple proteins act as
protein complex which is one of the isozymes for any specific reaction.
bSpontaneous reactions are those without any enzyme as well as gene association. cUnique metabolites irrespective of their compartmental location.
biomass composition of young and vegetative maize plants as measured by Penningd et
al. and expressed on a dry weight basis [286]. The amino acid and lignin composition
were derived based on the data from [287, 288]. The composition of hemicellulose was
approximated using data for Orchard Grass [289], another monocot grass species, as no
Auto
model
Draft
model
Functional
model
Final
model
Included genes 946 1,485 1,552 1,563
Proteins 472 714 774 876
Single functional proteins 178 322 381 463
Multifunctional proteins 92 150 153 170
Protein complexes 0 4 4 4
Isozymes 21 36 36 36
Multimeric proteins
87 140 148 148
Othersa
94 62 62 55
Reactions
1,186 1,667 1,821 1,985
Metabolic reactions 1,154 1,635 1,739 1,900
Transport reactions 32 32 67 70
GPR associations
Gene associated (metabolic/transport) 1,100 1,581 1,635 1,668
Nonenzyme associated
(metabolic/transport) 86 86 86 86
Spontaneousb
0 0 7 41
Nongene associated (metabolic/transport) 0 0 78 175
Exchange reactions 0 0 15 15
Metabolitesc
1,365 1,703 1,769 1,825
Cytoplasmic 1,309 1,643 1,689 1,744
Plastidic 91 102 114 115
Peroxisomic 67 69 92 93
Mitochondrial 60 82 86 86
Vaccuolic 5 5 5 5
Extracellular 0 0 15 15

83
corresponding information was found for maize. Based on these compositions we also
defined aggregate reactions such as ‘Amino acid synthesis’, ‘Protein synthesis’,
‘Carbohydrate synthesis’, ‘Hemicellulose synthesis’, ‘Lignin synthesis’, ‘Lipid
synthesis’, ‘Material synthesis’, ‘Nitrogenous compound synthesis’, ‘Nucleic acid
synthesis’ and ‘Organic acid synthesis’ to produce necessary biomass precursors (i.e.,
amino acids, protein, carbohydrates, hemicellulose, lignin, lipids, materials, nitrogenous
compounds, nucleic acids and organic acids respectively). The biomass equation also
contains a non-growth associated ATP maintenance as in the latest Arabidopsis model
AraGEM [272].
Table 4-2: Maize gene annotation via bidirectional BLASTp homology searches against
NCBI non-redundant protein database
(ii) Assignments of genes, reactions, metabolites and compartments. All metabolic and
inter-organelle transport reactions in the draft model have full gene associations. During
this step all reactions were elementally balanced and metabolites were assigned
appropriate protonation states corresponding to a physiological pH of 7.2. We included
an additional 86 reactions to the model without enzyme association information based on
direct literature evidence [272]. For example, reactions with KEGG IDs R08053, R08054
and R08055 involved in chlorophyll metabolism are included in the model. Reaction
localization information for maize can in some cases be found in database PPDB (a plant
proteome database of maize and Arabidopsis) [290]. Because only limited reaction
Species Number of orthologs
Number of associated
reactions
Number of newly
added reactions in draft
model
Oryza Sativa (Rice) 4,109 312 145
Other plant species 833 214 185
Arabidopsis Thaliana (Arabidopsis)
802 258 193
Sorghum Bicolor (sorghum)
47 20 11

84
localization information exists for maize, we adopted the compartment or organelle
reaction location of the corresponding orthologous gene/enzyme in Arabidopsis using the
Arabidopsis Subcellular Database, SUBA [291] and also PPDB [290]. As in AraGEM,
reactions for which no such information is available we assumed that they are present
only in the cytoplasm.
(iii) Identification of system boundary. The entire reaction network (i.e., system
boundary) was distributed across five different intracellular organelles enveloped by the
cytoplasmic membrane. Exchange reactions were added in the model to ensure that
gaseous metabolites (i.e., carbon dioxide and oxygen), inorganic nutrient metabolites
(i.e., nitrate, ammonia, hydrogen sulfide, sulfate, phosphate, potassium and chloride),
sugar metabolites (i.e., glucose, fructose, maltose and sucrose), water and photons could
enter and leave the system whenever necessary depending on the physiological state. As
shown in Table 4-4, constraints on these exchange reactions as well as reactions involved
with enzyme RuBisCO (Ribulose-1, 5-bisphosphate carboxylase oxygenase) were
established to define three different physiological states (i.e., photosynthesis,
photorespiration and respiration) by allowing the selective uptake/release of certain
metabolites. Even though photorespiration is limited in C4 plants (i.e., maize, sorghum,
etc.), literature evidence [292-294] alludes that it is still present. Therefore, we made sure
that the model is capable of simulating this condition.

85
Table 4-3: Biomass component list in iRS1563
The stoichiometric matrix of the draft model (see Table 4-1) contains 1,901 rows (i.e.,
total metabolites after taking account of their compartmental appearance) and 1,682
columns (i.e., metabolic reactions, inter-organelle transport reactions and exchange
reactions). 970 reactions have one-to-one GPR associations whereas 712 map to more
than one gene. 532 reactions map to both isozymes and protein complexes while 4 of
them map to only protein complexes, 36 to only isozymes, and 140 to only multimeric
proteins.
Major components
Protein
Carbohydrates Lipids Ions Nitrogenous
compounds L-alanine ribose glyceroltripalmitate potassium
Carbohydrates L-arginine glucose gleceroltristearate chloride
Lipids L-aspartic acid fructose glyceroltrioleate Lignin L-cystine mannose glyceroltrilinolate RNA
Organic acids L-glutamic acid galactose glyceroltrilinoleate ATP
Ions L-glycine sucrose GTP
L-histidine cellulose Lignin
CTP
L-isoleucine hemicellulose 4-coumaryl alcohol UTP Nitrogenous
compounds L-leucine pectin coniferyl alcohol
amino acids L-lysine sinapyl alcohol DNA
protein L-methionine dATP
nucleic acids L-phenylalanine Hemicellulose
Organic acids dGTP L-proline arabinose oxalic acid dCTP
L-serine xylose glyoxalic acid dUTP
L-threonine mannose Oxalo-acetic acid
L-tryptophan galactose Malic acid
L-tyrosine glucose Citric acid L-valine uronic acids aconitic acid

86
Table 4-4: Definition of three different physiological states
4.2.3 Network connectivity analysis and restoration
The draft metabolic model inherently contained gaps, unreachable metabolites, omitted
transport mechanisms and missing biomass components. We used the procedures termed
GapFind and GapFill [295] to correct for these pathologies. We first concentrated on
resolving problems with the participation of components in the biomass equation
followed by network connectivity.
We found that 723 out of the 1,683 reactions in the draft model could not carry any flux
(i.e., blocked reactions) under any of the relevant three physiological states (e.g.
photosynthesis (PS), photorespiration (PR) and respiration (R)). As a result, these
blocked reactions prevented the formation of some of biomass precursors. GapFind [295]
revealed that only 21 out of 64 biomass components could be synthesized using the draft
model. GapFill [295] was applied for bridging the gaps through the addition of metabolic
and inter-organelle transport reactions and the relaxing of irreversible of existing
reactions in the model. GapFill suggested the addition of 94 metabolic and 35 inter-
organelle transport reactions in the model to unblock the production of all 64 biomass
components. These putative additions to the model were tested by performing an
additional round of BLASTp searches for the corresponding genes against the maize
genome. We found that 54 (out of 93) metabolic reactions could be assigned to maize
Constraints Photosynthesis (PS)
Photorespiration (PR)
Respiration (R)
CO2 transport Uptake Uptake Release
Sucrose transport Disabled Disabled Uptake
Photon transport Uptake Uptake Disabled
H2O transport Uptake Uptake
Uptake
Inorganic nutrient transport Uptake Uptake Uptake
O2 transport Release Unconstrained
Uptake
RUBISCO: EC 4.1.1.39 Carboxylation Carboxylation:
Oxygenation = 3:1
Both
disabled

87
gene(s) if the expectation value cut-off for BLASTp was lowered to 10-5. In light of the
critical need of restoring biomass formation the less stringent cut-off for inclusion was
accepted for these genes. Addition of these reactions ensured the production of biomass
under all relevant physiological states validating the use of the term ‘Functional’ for the
updated model (see Table 4-1).
Table 4-5: Restoration of network connectivity using GapFill [36]
Upon ensuring biomass formation GapFind was also applied to assess network
connectivity and 715 blocked metabolites were found in the functional model. By
applying GapFill connectivity of 322 (45%) blocked metabolites was restored through the
addition of 159 metabolic and 3 inter-organelle transport reactions. Table 4-5 shows the
distribution of blocked metabolites into four intracellular organelles before and after
applying GapFill. BLASTp searches allowed us to assign 31 (20% of GapFill
suggestions) metabolic reactions with specific maize genes. Biological evidence of the
occurrence of such additional reactions in maize or other plant species was sought
whenever possible. For example, as shown in Figure 4-2 phenylacetaldehyde appears to
be a “no-consumption” [295] metabolite in the functional model as no reaction can
consume it. Using GapFill we found a homolog in maize (i.e., BLASTp score of 10-24)
and also literature evidence [296] that Arabidopsis thaliana has a aldehyde
dehydrogenase activity that catalyzes the conversion of phenylacetaldehyde to
phenylacetic acid. Hence, by adding this chemical transformation to Zea mays iRS1563 a
Number of
metabolites
Number of blocked
metabolites: before applying
GapFill
Number of blocked
metabolites: after applying
GapFill
Cytosolic (1744) 680 382
Plastidic (115) 28 11
Peroxisomic (93) 5 0
Mitochondrial (86) 2 0

88
consumption pathway for phenylacetaldehyde is established. After adding these reactions
to the functional model and following charge and elemental balancing and GPR
association checking the ‘Final’ Zea mays iRS1563 model (see Table 4-1) is derived.
Figure 4-2: Example of connectivity restoration for phenylacetaldehyde.
4.2.4 Zea mays iRS1563 model
The Zea mays iRS1563 metabolic reconstruction contains 1,825 unique metabolites and
1,985 reactions associated with 1,563 genes and 876 proteins. Of these reactions 1,898
are metabolic reactions, 70 are inter-organelle transport reactions and 15 are exchange
reactions between intra- and extracellular environments. GPR associations are established
for all entries (see Table 4-1). Notably, we identified that the fraction of multifunctional
proteins (19% of the total number of proteins) in Zea mays iRS1563 is similar to the ratio
found in E. coli [297]. Zea mays iRS1563 accounts for the metabolic functions for all
three physiological states. Photosynthetic as well as photorespiration metabolism was
modelled by including light mediated ATP and NADPH production via separate charged
balanced reactions in the electron transfer system of the thylakoid membrane [103].

89
Furthermore, the ratio of fluxes for the carboxylation and oxidation reactions associated
with enzyme RuBisCO was kept at 1:0 thus ensuring complete carbon fixation during
photosynthesis. This ratio was shifted to 3:1 during photorespiration to model
simultaneous carbon fixation and oxidation [298]. Because sucrose is the main growth
substrate during respiration for higher plants [299], the aforementioned reactions were
inactivated and the exchange reaction for sucrose uptake was activated. Under all these
three conditions, inorganic nutrients required for plant growth, e.g. sulfate, nitrate,
ammonia, hydrogen sulfide, phosphate, potassium and chloride, were allowed to be freely
taken up from the environment via extracellular exchange reactions.
The participation of Zea mays iRS1563 metabolites across different compartments is
shown in Figure 4-3. The five intracellular organelles differ notably in terms of mutual
connectivity, metabolite uniqueness and number of metabolites. As shown in Figure 4-3a,
approximately 90% of these metabolites are unique to cytoplasm. In addition, cytoplasm
contains all metabolites shared between any two organelles because any metabolite needs
to be transported through cytoplasm in order to be exchanged between organelles.

90
Figure 4-3: Distribution of metabolites based on their number of appearance in different
organelles.
(a) cytoplasmic Zea mays iRS1563 metabolites in cytoplasm and other organelles, and,
(b) non-cytoplasmic Zea mays iRS1563 metabolite-organelle participation.
Among the remaining metabolites, cytoplasm shares the highest number with the plastid
(i.e., 63) where photosynthesis and photorespiration occur. It also shares a significant
number of metabolites with mitochondrion (i.e., 27) and peroxisome (i.e., 22) that are
involved in energy production and fatty acid biosynthesis, respectively. Figure 4-3b

91
shows the distribution of other non-cytoplasmic Zea mays iRS1563 metabolites in terms
of how many organelles they participate.
4.2.5 Light reactions, carbon fixation and secondary metabolism
In plants photosynthesis reactions include light dependent and light independent or
carbon fixation reactions [153]. Zea mays iRS1563 includes charged balanced light
reactions culled from a number of literature sources [103, 300-302]. The overall
photosynthesis reaction cascade produces two NADPH, three ATP and one O2 whenever
nine photons are absorbed and fourteen H+ are transferred via the electron-transport
system. This defines the following overall balance equations:
12 H+[c] + 2 H2O[c] + 2 NADP[c] + 9 hvi[c] → 14 H+[p] + 2 NADPH[c] + O2[c] + 9
hvo[c]
3 ADP[c] + 14 H+[p] + 3 Pi[c] → 3 ATP[c] + 14 H+[c]
Here, [c] and [p] represent cytoplasm and plastid and hvi and hvo signify input and
output photons respectively. Carbon fixation in maize (C4 plant) is more complex
compared to Arabidopsis or other C3 plants [153]. Zea mays iRS1563 captures these
differences by accounting for (i) direct carboxylation of phosphoenol pyruvate and CO2
fixation to form C4 acids such as oxaloacetic acid [ATP: oxaloacetate carboxy-lyase
(ocl)] and malic acid [Oxaloacetate: NADPH hydrogenase (oha)] in mesophyll cells, (ii)
transport of malic acid from mesophyll cell to bundle-sheath cells, (iii) decarboxylation
of malic acid [Malate:NADP+ oxidoreductase (mor)] in bundle-sheath cells to produce
pyruvic acid and CO2, which enters the Calvin cycle, (iv) transport of pyruvic acid from
bundle-sheath cells to mesophyll cells, and (v) production of phosphoenol pyruvic (i.e.,
C3) acid [ATP:pyruvate,phosphate phosphotransferase (ppt)] from pyruvic acid [153].
Figure 4-4, pictorially shows the localization of reactions and organelles between
mesophyll and bundle sheath cells. In addition, to differences in carbon fixation
reactions, the peroxisome activity is primarily present in bundle-sheath cells and largely

92
absent from mesophyll cells [303]. Based on this localization information a standalone
metabolic model can be developed for the photosynthetic tissue of maize. Because
RuBisCO that operates in the Calvin cycle cannot come in direct contact with
atmospheric oxygen during day time (see Figure 4-4), photorespiration is restricted
providing an advantage for survival in hot and arid environments for maize and other C4
plants. This comes at the expense of higher (ATP) requirements as C4 carbon fixation
involves additional steps [153].
In addition to photosynthesis, secondary metabolism plays a key role in the physiology of
maize. For example, phenylpropanoid metabolism produces monolignols (i.e., p-
coumaroyl alcohol, coniferyl alcohol and sinapyl alcohol) that are used in the generation
of three major lignin subunits H-lignin, G-lignin and S-lignin, respectively [304].

93
Figure 4-4: Compartment and localization information for Zea mays iRS1563.
Mitochondrion and vacuole compartments are present in both cell types whereas
peroxisome is only present in bundle-sheath cell [40]. Plastidic reactions are distributed
between mesophyll and bundle-sheath cells.
Many of these enzymes such as hydroxycinnamoyl transferase (HCT), ferulate 5-
hydroxylase (F5H) and caffeic acid 3-O-methyltranferase (COMT) along with their
associated reactions are unique to C4 plants and are not present in the lignin biosynthesis
pathways of A. thaliana [304]. HCT is involved in the early stages of lignin biosynthesis
by controlling the flux from p-coumaroyl-CoA towards caffeoyl-CoA while F5H and
COMT regulate fluxes from coniferaldehyde and coniferyl alcohol to sinapaldehyde and
sinapyl alcohol, respectively [304]. Zea mays iRS1563 contains all these enzymes and
associated reactions thus providing a comprehensive lignin biosynthesis pathway for a C4
plant.
In addition to phenylpropanoid metabolism, Zea mays iRS1563 provides a detailed
description of flavonoid biosynthesis pathways. Flavonoids are pigments occurring in
plant as secondary metabolites and mostly function in the recruitment of pollinators
and/or seed dispersers [305]. For example, maize is known to produce 3-
deoxyanthocyanins, which are a specialized class of flavonoids [306, 307]. Zea mays
iRS1563 contains the dihydroflavonol 4-reductase (DFR) enzyme that catalyzes the
reaction for flavan-4-ols biosynthesis that channels flux towards 3-deoxyanthocyanins
production [307]. The model also accounts for isoflavone 7-O-glucosyltransferase
(IF7GT) and associated reactions that are involved in the production of necessary
intermediates for pterocarpin phytoalexin conjugates such as medicarpin 3-O-glucoside-
6’-O-malonate (MeGM) and maackain 3-O-glucoside-6’-O-malonate (MaGM) involved
in plant defense against fungal elicitation [308].

94
4.2.6 Comparing Zea mays iRS1563 with Arabidopsis thaliana and maize C4GEM models
Figure 4-5a compares the total number of genes, reactions and metabolites between Zea
mays iRS1563 and the A. thaliana AraGEM genome-scale-models [272]. Approximately,
only 61% of genes in Zea mays iRS1563 are present in AraGEM. This yields a
surprisingly low degree of matching between these two models of 64% and 76%,
respectively in terms of reactions and metabolites. In the interest of elucidating the true
differences between maize and Arabidopsis irrespective of annotation chronology we
constructed a more up-to-date genome-scale model for Arabidopsis by appending onto
AraGEM newly annotated genes as well as full GPR annotations. We refer to this
updated model containing 1,597 genes, 1,798 reactions and 1,820 metabolites as A.
thaliana iRS1597. The newly added 228 reactions (absent from AraGEM) are involved in
various pathways in primary (i.e., glycolysis, TCA, fatty acid and amino acid
biosynthesis, starch and sucrose metabolism) and secondary (i.e., biosynthesis of steroid,
ubiquionone, streptomycin, thiamin, riboflavin, terpenoid, brassinosteroid,
phenylpropanoid, etc.) metabolism of Arabidopsis.

95
Figure 4-5: Venn diagram for genes, reactions and metabolites. (a) between Zea mays
iRS1563 and AraGEM, (b) between Zea mays iRS1563 and Arabidopsis thaliana
iRS1597, and (c) between Zea mays iRS1563 and maize C4GEM.
A direct comparison of Zea mays iRS1563 with A. thaliana iRS1597 reveals, as expected,
an increased degree of matching of 72%, 76% and 80% in terms of genes, reactions and
metabolites, respectively (see Figure 4-5b). We find that 445 reactions are unique to
maize with no counterpart in A. thaliana. Secondary plant metabolism including

96
flavonoid, mono- and diterpenoid, brassinosteroid, phenylpropanoid, anthocyanin, zeatin
biosynthesis, riboflavin and caffeine metabolism account for 185 of the maize-specific
reactions. In addition, a variety of primary metabolism reactions dispersed throughout
central metabolism, photosynthesis, amino acid and fatty acid biosynthesis account for
the remaining 260 reactions. This comparison implies that about one third of the
differences between Zea mays iRS1563 and AraGEM are caused by the incompleteness
of AraGEM model especially in terms of secondary metabolism while the remaining two
third reflect genuine differences between C3 (i.e., Arabidopsis) and C4 (i.e., maize) plant
metabolism.
Figure 4-5c shows a similar comparison between Zea mays iRS1563 and maize C4GEM
genome-scale-models. Degrees of matching between these two models are 39%, 53% and
63% in terms of genes, reactions and metabolites, respectively. This surprisingly low
degree of matching is caused primarily due to the fact that maize C4GEM includes only
metabolites and reactions in leaves during photosynthesis. Therefore, there are 893
reactions in Zea mays iRS1563 absent from maize C4GEM. 343 of these reactions
describe secondary plant metabolism such as brassinosteroid, phenylpropanoid,
carotenoid, flavonoid, mono- and diterpenoid, and glucosinolate metabolism. The
remaining 550 reactions are found in a wide range of primary metabolism pathways such
as central metabolism, photosynthesis, benjoate degradtion, starch and sucrose
metabolism, lipid metabolism, nitrogen metabolism amino acid and fatty acid
biosynthesis. Conversely, 116 (out of 149) new reactions in maize C4GEM have
untraceable EC numbers and gene loci.
4.2.7 Zea mays iRS 1563 model testing
Zea mays iRS1563 allows for the production of biomass under all three different
physiological states. Due to limited photorespiration C4 plants usually have higher

97
photosynthetic efficiency [153]. Under higher light intensity and photosynthetic
condition, Zea mays iRS1563 produces 0.0008 mole biomass/mole CO2 whereas A.
thaliana iRS1597 yields 0.0006 mole biomass/mole CO2. Thus, the model predictions
match with findings reported in literature [153]. We also investigated the model’s ability
to predict the effect of suppressing genes in the lignin biosynthesis pathway observed in
naturally occurring brown midrib (bm) maize mutants (i.e., bm1, bm2, bm3 and bm4)
[304, 309-311]. These maize mutants are Mendelian recessives that are characterized by
brown vascular tissue in leaves and stems due to a changed lignin content and/or
composition [312]. The specific genetic background for two of these mutants (bm1 and
bm3) was elucidated based on the analysis of cell wall composition [311]. Mutants bm1
and bm3 were found to have disrupted enzymatic activity for cinnamyl alcohol
dehydrogenase (CAD) and caffeic acid 3-O-methyltranferase (COMT). Both of these
enzymes are involved in the last stages of the monolignol pathway [311] that controls
lignin synthesis and composition (i.e., the ratio of three major subunits, H-lignin, G-
lignin and S-lignin) [313].
Table 4-6: Change in content of cell wall components in bm1 and bm3 Maize mutants
Cell wall components include lignin subunits, total lignin, S-lignin/G-lignin ratio, sugars,
starch and protein. List of used symbols include ‘↓’: decrease in quantity; ‘↑’: increase in
quantity; ‘=’: no change in quantity, with respect to wild Maize plant; ‘/’: comparison of
model findings with actual observations, and ‘-’: no experimental observation found.
Model findings vs Experimental
observations
bm1 mutant bm3 mutant
H-lignin ! / = ! / !
G-lignin ! / ! ! / !
S-lignin ! / ! ! / !
Total lignin ! / ! ! / !
S-lignin/G-lignin ratio = / = = / =
Glucose ! / ! ! / "
Mannose ! / ! ! / !
Arabinose ! / ! ! / !
Galactose ! / ! ! / !
Xylose ! / " ! / "
Crude protein - ! / !

98
We simulated mutants bm1 and bm3 using Zea mays iRS1563 under photosynthetic
conditions by restricting the flux of the reactions catalyzed by enzymes CAD and COMT
to 10% of the wild-type values. It is expected that the disruption of the activity for these
genes will directly affect lignin content and composition. We were interested to see
whether the Zea mays iRS1563 metabolic model will be able to correctly propagate this
disruption across the metabolic pathways and correctly predict the effect on other key
metabolites. Table 4-6 contrasts experimental results by (Marita et al (2003), Vanholme
et al (2008) and Sattler et al (2010)) with in silico predictions for the maximum
theoretical yield of lignins, sugars and crude protein in terms of whether they increased,
decreased, or remained the same in the mutant strains. Out of 21 compared components
Zea mays iRS1563 correctly predicted the direction (or absence) of change for 17 cases.

99
Figure 4-6: Maximum theoretical yields of (a) glucose and (b) galactose for wild-type vs
bm1 mutant and wild-type vs bm3 mutant, respectively.
Here the numeric values represent reaction fluxes and have the unit of mM/gDW-h.
In Figure 4-6 we highlight two cases that describe the availability of glucose and
galactose to cell wall for mutants bm1 and bm3, respectively. ‘Carbohydrate synthesis’
and ‘Hemicellulose synthesis’ are aggregate reactions that describe the utilization ratios
of sugar molecules such as arabinose, fructose, galactose, glucose ribose, mannose,
sucrose, and xylose for the production of carbohydrate and hemicellulose present in the
plant cell wall. For simplicity, we have simulated the model under the photosynthetic
condition where CO2 can be uptaken with a maximum allowable rate of 1000 mM/gDW-
h along with photons in excess. In Figure 4-6a, wild-type and bm1 mutant flux values for
reactions involving glucose as reactant including ‘Carbohydrate synthesis’,
‘Hemicellulose synthesis’, ‘Alpha,alpha-trehalose glucohydrolase’ [R00010], ‘Sucrose
glucohydrolase’ [R00801], ‘Sn-Glycerol-3-phosphate: D-glucose 6-phosphotransferase’
[R00850] and ‘Cellobiose glucohydrolase’ [R00306], are highlighted. For the wild-type
case, the maximum theoretical yield of glucose is predicted to be 1.66 moles/mole of CO2
but it is reduced to 0.93 moles/moles of CO2 for the bm1 mutant. The reduced capability
of the bm1 mutant to direct flux towards ‘Carbohydrate synthesis’ and ‘Hemicellulose
synthesis’ implies that less glucose is available for the formation of cell wall components
which is consistent with the experimental finding of Table 4-6.
Figure 4-6b contrasts the wild-type and bm3 mutant maximum theoretical yields for all
reactions involving galactose including ‘Hemicellulose synthesis’, ‘ATP: D-galactose 1-
phosphotransferase’ [R01092] and ‘Galactosylglycerol galactohydrolase’ [R01104], ‘3-
O-alpha-D-Galactosyl-1D-myo-inositol galactohydrolase’ [R01194] and ‘alpha-
galactosidase’ [R03634]. A reduction of the maximum theoretical yield of galactose from
0.81 to 0.65 moles/mole of CO2 for the bm3 mutant is observed. In addition, the
maximum theoretical yield for reaction ‘Hemicellulose synthesis’ decreases by 4-fold

100
compared to wild-type in line with the experimental finding. However, the
experimentally observed increase of glucose availability in mutant bm3 and xylose
availability for both bm1 and bm3 mutants are in contrast with the model predictions (see
Table 4-6). As reported by Guillaumie et al (2007) several gene expression levels were
changed during bm1 and bm3 mutations implying that additional regulatory constraints
may be needed to capture these changes.
4.3 Discussion
Maize, apart from its central role a food crop, is also a promising plant biomass target for
cellulosic biofuels production. Plant cell wall cellulose, hemicellulose and lignin
polymers are major contributors of plant biomass [304, 314]. Therefore, controlling the
amount and composition of cell wall polymers is important in developing cellulosic
maize for biofuel production. In cell wall, lignin provides rigidity by forming a matrix
where cellulose and hemicellulose are imbedded via cross-linking bonds [309, 315]. This
makes digestion of cellulose and hemicellulose by microbial enzymes (i.e., cellulases)
difficult during dilignification, one of the critical steps in cellulosic biofuel production
[316]. Many genetic modification strategies have been explored to improve maize food
crop and/or biofuel characteristics. For example, cellulosic biomass yield improvements
have been pursued before by altering the lignin content and composition [317, 318],
genetically manipulating the cellulose biosynthetic pathway [319] and over-expressing
the gene encoding phosphoenolpyruvate carboxylase (PEPC) to improve CO2 fixation
rate [320]. At the same time, grain yield enhancements have been attempted by up-
regulating ADP-glucose pyrophosphorylase (AGP) that catalyzes the rate limiting step in
starch synthesis [321].
Unfortunately, existing genetic engineering strategies to reduce lignin content are
problematic as lignin reductions are usually achieved at the expense of plant viability and
fitness [316]. It is becoming widely accepted that focusing on a single pathway at a time
without quantitatively assessing the system-wide implications of the genetic disruptions

101
may be responsible for not preserving the agronomic properties of the plant. By
accounting for both primary and some secondary metabolism pathways of maize, Zea
mays iRS1563 can be used to explore in silico the effect of genetic modifications aimed
at plant cell wall modification and/or starch storage on the overall metabolic state of the
plant (e.g., biomass precursor availability, cofactor balancing, redox state, etc.). Moving a
step further, the use of computational strain optimization techniques [7, 322] can be
customized for engineering plant metabolism. By taking full inventory of plant
metabolism optimal gene modifications could be pursued for a variety of targets in
coordination with experimental techniques. These may include (i) increase cellulose and
hemicellulose production, (ii) starch yield, (iii) tolerance against biotic stress (e.g., fungal
elicitation), or (iv) disruption of the production of lignin subunits (H/G/S) while
enhancing the production of easily digestible lignin precursor (e.g., rosmarinic acid,
conferyl ferulate, tyramine conjugates, etc).
In this chapter, we introduced the first comprehensive genome-scale metabolic model
(Zea mays iRS1563) for maize metabolism. The model meets (or exceeds) the quality and
completeness criteria set out [323, 324] for genome-scale reconstructions. In analogy to
the human genome-scale model Recon 1 [325], Zea mays iRS1563 can be viewed as a
mathematically structured database enabling systematic studies of maize metabolism.185
of unique to maize reactions accounting for a fraction of secondary metabolism were
delineated. As a by product of this effort a more up-to-date version of AraGEM [272]
was constructed including GPR associations. Comparisons between Zea mays iRS1563
and maize C4GEM also revealed the detail in description of primary and secondary
metabolism. Model predictions of Zea mays iRS1563 for two widely occurring maize
Mendelian mutants were tested against experimental observations with very good
agreement in the direction of changes. By making use of high throughput enzymatic
assays, proteomic and transcriptomic data across different parts of the maize plant, Zea
mays iRS1563 could serve as the starting point for the development of tissue-specific
maize models [280, 326, 327]. Furthermore, Zea mays iRS1563 could also serve as the
stepping stone for the development of genome-scale models for other important C4 plants

102
such as Sorghum and switch grass.
4.4 Materials and Methods
A number of recent publications [36, 275, 323] have outlined the general steps necessary
for the metabolic reconstruction process. In the following section, we highlight the
specific methods used in the reconstruction of Zea mays iRS1563 and subsequent model
simulations in more detail.
4.4.1 Model reconstruction
The maizesequence database [270] provided the filtered gene set (FGS) which has been
generated from the working gene set upon removing pseudogenes and low confidence
hypothetical models. The FGS of B73 maize genome (release 4a.53) was downloaded
from maizesequence database on February 17, 2010. Once maize genes were obtained,
we used sequence comparison tools [328] such as stand-alone BLAST (version 2.2.22,
NIH) and BLAST+ (version 2.2.22, NIH) for performing homology comparisons. Marvin
(version 5.3.3, ChemAxon Kft) was used to calculate the average micro-species charge to
determine the net charge of individual metabolites at pH 7.2 assumed for all organelles.
In the final step of the model reconstruction, we implemented GapFind and GapFill [295]
for analyzing and subsequently restoring metabolic network connectivity.
4.4.2 Model simulations
Flux balance analysis (FBA) [122] was employed both in model validation and model
testing phases. Zea mays iRS1563 was evaluated in terms of biomass production under

103
three standard physiological scenarios: photosynthesis, photorespiration, and respiration.
Flux distributions for each one of these states were approximated using FBA:
Maximize
vBiomass
Subject to
Sijv j = 0 !i " 1,....., n
j=1
m
# (1)
vj,min ! v
j ! v
j,max " j # 1,.....,m (2)
Here, Sij is the stoichiometric coefficient of metabolite i in reaction j and vj is the flux
value of reaction j. Parameters vj,min and vj,max denote the minimum and maximum
allowable fluxes for reaction j, respectively. As mentioned in Table 4-4, the three
physiological states were represented via modifying the relevant minimum or maximum
allowable fluxes and the following constraints:
voxi
= 0 (3)
vcarboxi
! 3voxi
(4)
vcarboxi
= 0 (5)
where vBiomass is the flux of biomass reaction and voxi and vcarboxi are the fluxes of
carboxylation and oxidation reactions associated with enzyme RUBISCO. For
photosynthesis and photorespiration, constraints (3) and (4) were respectively included in
the linear model, whereas for respiration both constraints (3) and (5) were included.
Once the model was validated, it was further tested for two maize mutants (i.e., bm1 and
bm3) under the photosynthetic condition. The following two constraints were included
individually in the linear model to represent the mutants:
vbm1
! w "WFbm1
(6)
vbm3
! w "WFbm3
(7)
Here, w represents the percent of residual activity of 10%. vbm1 and vbm3 are the fluxes of
reactions catalyzed by CAD and COMT, respectively and WFbm1 and WFbm3 are the
corresponding wild-type flux values under the photosynthetic condition.

104
CPLEX solver (version 12.1, IBM ILOG) was used in the GAMS (version 23.3.3, GAMS
Development Corporation) environment for implementing GapFind and GapFill [295]
and solving the aforementioned optimization models. All computations were carried out
on Intel Xeon E5450 Quad-Core 3.0 GH and Intel Xeon E5472 Quad-Core 3.0 GH
processors that are the part of the lionxj cluster (Intel Xeon E type processors and 96 GB
memory) of High Performance Computing Group of The Pennsylvania State University.
105
5 Chapter 5 NITROGEN USE EFFICIENCY IN MAIZE (ZEA MAYS L.): FROM “OMICS” STUDIES TO METABOLIC MODELING
This chapter has been previously published in modified form in Journal of Experimental Botanyv. The author has contributed to the modeling section of the paper (Simons, M, Saha, R., Guillard, L., Clement, G., Armengaud, P., Canas, R, Maranas, C.D., Lea, P.J. and B. Hirel (2014), “Nitrogen-use efficiency in maize (Zea mays L.): from ‘omics’studies to metabolic modelling”, Journal of Experimental Botany, doi: 10.1093/jxb/eru227).
5.1 Introduction
Over the last decade, it has become possible to construct complete plant genome
annotations for a wide variety of model and crop species (Jackson et al., 2011), and to
use new high-throughput tools such as the transcriptomics, proteomics and metabolomics,
to unravel the processes controlling plant productivity (Fukushima et al., 2009; Kusano
and Fukushima, 2013). These processes have been shown to be a multitude of complex
networks and interdependent pathways involving many genes, proteins, enzymes and
metabolites, rather than distinct linear pathways (Fernie and Stitt, 2012). As in a large
number of cases, this nonlinear complexity has hindered plant metabolic manipulation
experiments focused on the original agronomic target of improving water use efficiency
(WUE) (Ashraf, 2010) or nitrogen use efficiency (NUE) (Pathak et al., 2011; McAllister
et al., 2012). Hence, the need to associate a biological function to a gene, the
corresponding translation product, and finally the synthesis of a desired metabolite has
led to the development of various systems biology approaches based on integrated
“omics” studies. These studies have taken advantage of an increasing number of gene
expression and metabolic databases
(http://www.hsls.pitt.edu/obrc/index.php?page=metabolic_pathway). In particular, a
comprehensive data collection called OPTIMAS Data Warehouse (OPTIMAS-DW) that
includes transcriptomes, metabolomes, ionomes, proteomes and phenomes has recently

106
been released to support systems biology research in maize (Colmsee et al., 2012). The
resource is available at http://www.optimas-bioenergy.org/optimas_dw.
One of these systems biology approaches consists of linking genes and metabolic
functions to physiological or agronomic traits through the construction of whole genome-
scale metabolic models (Ruppin et al., 2010). Such metabolic models at the interface
between computation, biology, genetics and agronomy, are currently being developed to
advance our ability to maximize phenotypic and agronomic traits in a rational manner.
Construction of such metabolic models is generally conducted using as a working basis
the most prominent models built from unicellular organisms such as bacteria and yeast
and expanded in a stepwise manner to make them applicable to model plants such as
Arabidopsis thaliana and then to crops (Seaver et al., 2012). The ultimate goal of
developing such models is to provide a new tool for predicting crop yields, that will allow
the selection of crops adapted to lower inputs and to particular environmental conditions.
The knowledge gained from such modeling approaches could ultimately allow the
identification of key developmental and metabolic components involved in the
elaboration of complex agronomic trait such as NUE or WUE (Baldazzi et al., 2012;
Shachar-Hill, 2013). The identification of such components and a better understanding of
their regulation should provide additional tools for developing marker-assisted selection
strategies for breeders, and for exploiting the possibilities offered by genetics, including
natural variability, mutagenesis and genetic manipulation (Hirel et al., 2007).
5.2 Why improve nitrogen use efficiency in a crop such as maize?
Both from an agronomic and economic point of view, the main driver for crop
improvement over the last century has been yield (Conant et al., 2013). During this
period, the rate of yield improvement has accelerated due primarily to the introduction of
an increasingly scientific approach to plant breeding, but also through the extensive use
of fertilizers (Tilman et al., 2011; Andrews and Lea, 2013). Among these fertilizers,

107
nitrogen (N) is a major factor in agricultural production, where it can be supplied through
chemical synthesis (Andrews et al., 2013), organic rotation (Tuomisto et al., 2012), or
biological N fixation (Vitousek et al., 2013). However, this extensive use of N fertilizers
has caused major detrimental impacts on the diversity and functioning of non-agricultural
bacterial, animal and plant ecosystems (Erisman et al., 2013; Galloway et al., 2013). In
addition, fertilizer-derived N oxide emissions into the atmosphere contribute to the
depletion of the ozone layer, whilst volatilised ammonia is returned as wet or dry
deposition, which can cause acidification and eutrophication (Cameron et al. 2013;
Fowler et al. 2013). An excellent overview of the different possible strategies to optimize
the use of N fertilizers worldwide for both economic and environmental benefits has
recently been published by Good and Beatty (2011). This review emphasizes that
implementing the best N management practices together with crop genetic improvement
adapted for each country, can substantiality reduce excess N fertilizer applications
without compromising crop yields.
At present, a mixture of converging global factors is putting unprecedented pressure on
agricultural productivity. These factors include increasing demand for human food and
animal feed in developing nations with large populations, diminishing supplies and the
rising cost of fossil fuel energy that is required for fertilizer production. Since cereals
such as maize, wheat and rice are the basis of most human food in the world, improving
their NUE is a major challenge for a sustainable agriculture (Hirel et al., 2007; Kant et
al., 2011; McAllister et al., 2012). It is therefore necessary to select or release new
varieties requiring less N-based fertilizer, whilst maintaining high yields and grain quality
(protein content, in particular). For this reason, several public institutions and all major
seed breeding companies are investing in crop genome research, and applying molecular
marker and transgenic techniques to identify genes that can be used to improve NUE
further (Edgerton, 2009; Xu et al., 2012; Fischer et al., 2013).
Improving NUE is particularly relevant for maize, as large amounts of N fertilizer are
required to obtain the maximum yield and for which global NUE, as with other crops, has

108
been estimated on average to be less than 50% (Raun and Johnson, 1999). Recent studies
have demonstrated that there are large differences in maize lines and hybrids in their
ability to grow and yield well on soils with low mineral nutrient availability, which
depends on both N uptake efficiency (NupE) and N utilization efficiency (NutE) (Hirel
and Gallais, 2011). Maize is recognised, not only as a major crop, but also as a model
species that is well adapted for fundamental research, especially for understanding the
genetic basis of yield performance. Many tools are available in maize such as mutant
collections, a wide genetic diversity, recombinant inbred lines (RILs), straightforward
transformation protocols, physiological, biochemical and “omics” data as well as its
genome sequence (Hirel and Lea, 2011) and more recently genome-scale metabolic
models (Saha et al., 2011).
5.3 Nitrogen use efficiency: from “omics” studies to systems biology approaches
Due to the complexity of the biological systems involved in the control of NUE at the
cellular, organ or whole plant levels, the emerging research field of systems biology was
developed for both model and crop species. This allowed the researcher to focus on a
holistic understanding of N-regulatory networks from the genomic to agronomic traits
such as biomass production or yield. Such an approach consists of taking advantage of
the various transcriptome, proteome, metabolome and fluxome data sets that can be
further analysed in an integrated manner through the utilization of various mathematical,
bioinformatic and computational tools (Gutiérrez, 2012). Ultimately such integrated
analyses, possibly combined with whole plant physiology and quantitative genetic
studies, may allow the identification of key individual or common regulatory elements
that are involved in the control of complex biological processes (Saito and Matsuda,
2010).

109
5.4 Transcriptome studies
To identify some of the regulatory and structural elements representing the physiological
changes associated with NUE, several studies have been carried out to evaluate
modifications in gene expression under low and high N conditions. In an increasing
number of model and crop species, transcriptome studies have highlighted the complexity
of the regulatory mechanisms involved in the control of leaf or root gene expression
under N limiting and non-limiting conditions (Wang et al., 2003; Krapp et al., 2011;
Amiour et al., 2012; Wei et al., 2013). In mutants, transcriptome studies have also
revealed deficiencies in key reactions or key regulatory proteins involved in primary N
metabolism (Castaings et al., 2009, Beatty et al., 2009; Wang et al., 2009; Kissen et al.,
2010). Several classes of N responsive genes have been identified, including those
involved in a variety of metabolic and regulatory pathways. It is hoped that such a
transcriptome approach could ultimately help to identify the genes and proteins required
for a N-use-efficient phenotype under different environmental soil conditions (Ruzicka et
al., 2010) up to the agronomic level (Tenea et al., 2012). For example, protein kinases
such as AtCIPK8 (Hu et al., 2009) or transcription factors such as NLP7 (Marchive et al.,
2013) identified following whole genome/transcriptome approaches, were shown to be
key players in nitrate sensing and signalling in Arabidopsis. The TOR (Target of
Rapamycin) signalling pathway seems also to be involved in the regulation of N
assimilation in proliferating and conductive tissues, thus playing an important role in
controlling long-distance and short-distance nutrient exchanges (Robaglia et al., 2012).
Improved NUE was obtained, when OsENOD93-1, a gene encoding another N-
responsive transcription factor was overexpressed in rice (Bi et al., 2009), strengthening
the finding that regulatory proteins are as important as enzymes in the control of N
metabolism. In line with this finding, maize Dof1 (DNA-binding with One Finger) was
expressed in Arabidopsis under the control of a maize pyruvate phosphate dikinase
(PPDK) promoter. The transformed plants exhibited a considerable elevation in the
concentration of soluble amino acids, especially glutamine, and increased growth under
low N conditions (Yanagisawa et al., 2004). When the same maize ZmDof1 gene was

110
expressed in rice under the control of the ubiquitin promoter, increases in photosynthesis,
N assimilation and growth were detected under low N conditions (Kurai et al., 2011).
The latest advances in our understanding of N signalling in plants have been reviewed by
Castaings et al. (2011), highlighting the roles of transcription factors, nitrate transporters
and kinases in their interactions with hormones or N containing molecules in the
regulation of N assimilation.
Plants are able to use both nitrate and ammonium ions as N sources as well as various
organic sources (Andrews et al., 2013). Distinct signalling pathways and transcriptome
response signatures for ammonium- and nitrate-supplied Arabidopsis have been
identified. The data indicated that there is an ammonium- and a nitrate-specific pattern of
gene expression, as well as a general inorganic N gene response (Patterson et al., 2010).
Such observations suggest that the regulation of gene expression under agronomic
conditions, when the two sources of inorganic N will be present in variable proportions,
depending on the type of fertilizer used, is probably more complex than that occurring in
plants grown under controlled conditions on a single N source.
Considering the agronomic importance and economic value of maize worldwide, an
increasing number of whole genome transcriptome approaches have also been developed
to identify genome-wide transcriptional circuits in various organs and tissues during
maize development (Sekhon et al., 2011; Downs et al., 2013) and particularly those
related to N-responsive genes. Depending both on the duration and intensity of the N-
limiting stress applied, most of the studies in maize have ended up with a portfolio of
genes involved in a variety of developmental, metabolic and regulatory functions
(Amiour et al., 2013; Humbert et al., 2013). In some cases, a number of these N-
responsive genes were also found in dicot species, but their level of response to the N
feeding conditions appeared to be largely dependent on both the genotype and the
experimental conditions (Table 5-1). Nevertheless among these genes, those encoding
carbonic anhydrase, which plays an important role in the delivery of CO2 for carbon
assimilation (Moroney et al., 2001) and plastidic glutamine synthetase (GS2), which

111
assimilates or reassimilates ammonium (Hirel and Lea, 2001) were found to be down-
regulated under N-deficient conditions. Those encoding germin-like proteins which are
involved in various developmental and stress responses (Bernier and Berna, 2001; Wang
et al., 2013) and those encoding peroxiredoxins which are known to play a major role in
controlling organelle redox metabolism (König et al., 2012) were also found to be N-
responsive. The developmental stage of the plant appears to be very important in some
circumstances, since genes that responded to N-limiting stress at the vegetative stage of
maize, were different from those that were responsive to N at the late grain filling stage
(Amiour et al., 2012). Interestingly, a number of these genes were found to respond
Table 5-1: Transcripts exhibiting significant increase following transfer from limiting to
non-limiting N feeding conditions in different studies and across different species
The numbers on the right side of the panel correspond to : 1 (Wang et al., 2003 in
Arabidopsis); 2 (Scheible et al. 2004 in Arabidopsis); 3 (Bi et al., 2007 in Arabidopsis); 4
(Peng et al., 2007 in Arabidopsis); 5 (Krapp et al., 2011 in Arabidopsis), 6 (Cai et al.,
2012 in rice); 7 (Amiour et al., 2012 in maize). ID, gene identification number. A cross
(x) indicates that the gene was identified in the majority of the seven studies. A number
of transcripts for ribosomal proteins were also found in the different studies but did not
exactly correspond to the gene annotation in Arabidopsis and in maize.
similarly to varying N nutrition conditions in different genotypes and under both
controlled or field-growth conditions. This finding led Yang et al., (2011) to propose that
Arabidopsis ID Maize ID Gene annotation 1 2 3 4 5 6 7
At3g01500 TC259341 CA1 (CARBONIC ANHYDRASE 1); carbonate dehydratase/ zinc ion binding x x x x x x
At5g20630 TC259932 GLP3 (GERMIN-LIKE PROTEIN 3); manganese ion binding / nutrient reservoir x x x x x
At5g35630 TC271006 GS2 (GLUTAMINE SYNTHETASE 2); glutamate-ammonia ligase x x x x x
At1g03600 TC216153 Photosystem II family protein x x x x x
At4g09650 TC249593 ATP synthase delta chain, chloroplast, putative / H(+)-transporting two-sector ATPase x x x x
At4g28660 BM381938 PSB28,photosystem II reaction centre W (PsbW) family protein x x x x x
At3g11630 TC262220 2-cys peroxiredoxin, chloroplast (BAS1) x x x x
At5g15350 BG319827 Plastocyanin-like domain-containing protein x x x x
At5g62720 TC265222 Integral membrane HPP (Human Proteome Project) family protein x x x x x x x

112
a small set of N-responsive genes could be used as biomarkers to monitor the in planta
status of maize N. A number of these genes were also found in the study of Amiour et al.
(2012), thus strengthening the idea that they could be used as agronomic tools for both
breeding purposes and for optimizing fertilizer usage.
More recently, evidence showing the importance of microRNAs (miRNAs) in the
regulation of a number of abiotic stresses has rekindled the interest of a number of
research groups in the epigenetic regulation of NUE and its potential use for NUE
improvement (Fischer et al., 2013). As revealed in studies performed on maize, the
occurrence of miRNA-mediated control of gene expression could represent an important
biological component of NUE that has hitherto been overlooked using standard
transcriptome approaches (Trevisan et al., 2011; Zhao et al., 2013). Such a putative
regulatory function mediated by the action of miRNAs was highlighted by the finding
that significant differences in their accumulation were observed according to the level of
N nutrition, as well as their spatiotemporal expression pattern in root tissues (Trevisan et
al., 2012; Zhao et al., 2012). Although the genes targeted by miRNAs had various and
ubiquitous functions, encompassing a variety of developmental and metabolic processes
that were not necessarily directly linked to NUE (Xu et al., 2011), the genetic
manipulation of the expression of miRNAs could be an alternative method of improving
NUE in crops (Fischer et al., 2013).
In order to shed light on the dynamics of transcription in response to various
environmental stimuli or stresses such as N limitation, tools such as MapMan were
originally developed to visualize large gene expression data sets in Arabidopsis in order
to search for similar global responses across large numbers of microarrays (Usadel et al.,
2005). Such a tool, that has now been adapted for maize (Usadel et al., 2009) and
solanaceous species (Urbanczyk-Wochniak et al., 2006; Ling et al., 2013), will provide
information about the response of the expression of the whole genome to N nutrition, in
relation to other cellular and metabolic processes. Several software and visualization
tools have been developed to interpret more easily, large “omics” data sets and also to

113
identify genes, gene networks and regulatory hubs that control plant growth and
development. For example, VirtualPlant (Katari et al., 2010), Geneinvestigator (Hruz et
al., 2008) or Cytoscape (Killcoyne et al., 2009) have been used in an increasing number
of studies, aimed at identifying gene regulatory networks involved in N metabolism in
both model and crop species. These visualization tools have been extensively used to
decipher the relationship between N responsive gene networks and other biological
processes linked to C availability (Krouk et al., 2010; McIntyre et al., 2011), external
signals such as light (Krouk et al., 2009), or internal signals such as hormones (Nero et
al., 2009, Krouk et al., 2010). They have also proved particularly useful for investigating
the natural variation of the response of Arabidopsis to N availability (Ikram et al., 2012).
An excellent review presenting the current knowledge of the regulatory components
controlling the response of Arabidopsis to N, together with the response networks
corresponding to metabolic, physiological, growth and development pathways has
recently been published (Gutiérrez, 2012; Canales 2014). This review article highlights
the function of receptors, transcription factors and other putative signalling components
of N signalling pathways, deciphered by means of the integrated systems biology
approach described above.
Although much more informative than conventional transcriptome studies, such whole
genome expression approaches have remained confined to deciphering regulatory circuits
at the transcriptional level, since only the steady state of transcripts has been considered.
Such an approach, originally developed for Arabidopsis by virtue of the wealth of
information available, when transferred to crops may help in identifying key master genes
involved in the control of NUE (Gutiérrez, 2012). Nevertheless, transcriptome,
metabolome and even fluxome coexpression network analyses will certainly be necessary
in order to enhance our knowledge of the genes and metabolic pathways linked to NUE in
crops such as maize (Saito and Matsuda, 2010).

114
5.5 Proteome studies
Although a number of proteome databases are now available on the world wide web
(Jorrín-Novo et al., 2009), in comparison to the numerous transcriptome studies, there is
much less information available on the proteome concerning NUE both in model and
crop species, as time-consuming and difficult techniques are required. Moreover at best,
less than a thousand proteins can usually be separated by two-dimensional (2-D) gel
electrophoresis and identified using either the available databases, or mass spectrometry
techniques (Jorrín et al., 2007). However, with second-generation quantitative proteome
techniques, the coverage of the plant cell proteome has increased considerably (Jorrín-
Novo et al., 2009). Under abiotic stress conditions, proteome studies are able to provide
additional information on the quantity of expressed proteins and posttranslational
modifications such as phosphorylation and glycosylation that cannot be identified by only
determining mRNA transcription. Analysis of the proteome has identified protein
response pathways shared by different plant species, as well as pathways that are unique
to a given stress (Kosovà et al., 2011). With the improvements in MS-based proteome
and phosphoproteome analyses, it is now possible to explore various areas of maize
biology including the impact of N-deficiency stress on the plant proteome (Facette et al.,
2013; Pechanova et al., 2013). The first proteome studies performed on wheat grown
under N-deficiency stress conditions showed that the concentrations of enzymes and
proteins involved in C metabolism were the most strongly reduced (Bahrman et al.,
2004). Later on, changes in the protein profile were also examined in the roots and shoots
of maize (Prinsi et al., 2009; Amiour et al., 2012), rice (Kim et al., 2009), barley (Møller
et al., 2011) and Arabidopsis (Wang et al., 2012), when the plants were grown under a
low or a high N supply. Results from these studies showed that the amounts of enzyme
proteins that have a pivotal role in N assimilation such as GS and in C metabolism such
as phosphoenolpyruvate carboxylase (PEPC) were higher when plants were fed with
nitrate, in agreement with a previous study (Sugiharto and Sugiyama, 1992). Many other
proteins involved in a number of photosynthetic reactions, in maintaining the energy and
redox status of the cell, and signal transduction were also shown to be N-responsive.

115
Such data confirms the tight relationship that exists between N and other metabolism
found at the transcriptional level (Gutiérrez, 2012). In the vast majority of the proteome
investigations into the response of a plant to N-limitation, there was no direct relationship
with transcriptome or metabolome studies. It was therefore difficult to tell if the
regulation of protein synthesis occurred at the translational or post-translational level, or
if the amount of protein was correlated with the amount of corresponding mRNA. In the
study of Amiour et al. (2012) on maize, no simple and direct relationship between among
transcript, protein and metabolite accumulation was found. In a similar manner to wheat,
this finding suggests that posttranscriptional modifications may be positively or
negatively regulated by the N metabolite concentration in the plant (Bahrman et al.,
2005). In addition complex and still uncharacterized network interactions are probably
occurring between gene transcription and protein and metabolite accumulation (Stitt and
Fernie, 2012). It is likely that advanced proteome tools will be used more widely in the
analysis of signalling and developmental processes in plants, as they are in medical
research (Choudhary and Mann, 2010). When integrated with other “omics” data and
with information from quantitative genetics, proteomes will be able to contribute to our
understanding of complex regulatory networks underlying important phenotypic traits
such as yield and nutrient perception and utilization (Kaufmann et al., 2011; Verma et al.,
2013).
5.6 Metabolome studies
Over the last five years an increasing number of metabolome studies have been carried
out for both model and crop plants, with the aim of identifying changes in metabolite
concentrations under various biotic (Balmer et al., 2013) and abiotic stresses including N
deficiency (Kusano et al., 2011; Obata and Fernie, 2012). These have also been valuable
in improving our understanding of the interactions between C and N metabolism (Fait et
al., 2011). Such approaches have allowed the identification of new compounds that
accumulate in response to a given stress, as well as those sharing a common pattern of
accumulation across various stress conditions. In addition, a number of plant metabolic

116
databases are now available that will facilitate the development of plant systems biology
approaches (Fukushima and Kusano, 2013).
Up until now, the vast majority of metabolome studies have been carried out using
Arabidopsis, but more recently these have been extended to a wider range of plants
including cereals such as rice and maize (Kusano et al., 2011; Lisec et al., 2011; Amiour
et al., 2012; Riedelsheimer et al., 2012a). Exhaustive metabolic profiling using Gas
Chromatography coupled to Mass Spectrometry (GC/MS) based separation techniques
provides information for plant phenotyping and the exploitation of genetic variability
(Saito and Matsuda, 2010). Liquid chromatography coupled to mass spectrometry (LC-
MS) has also been used frequently for metabolome analysis (Rohrmann et al., 2011;
Tohge et al., 2011). In parallel, 1H-NMR (Nuclear Magnetic Resonnance) spectroscopy
approaches have been developed, which are less sensitive but non-invasive, compared to
those requiring the extraction of plant material (Kim et al., 2010). 1H-NMR
metabolomics appears to be an attractive technique for the development of mapping
approaches (Graham et al., 2009) that could support breeding for improved NUE through
the establishment of metabolite databases. 1H-NMR has also been used successfully to
improve the characterization of GS deficient mutants of maize, indicating that in addition
to the glutamine-derived amino acid biosynthetic pathways, lignin biosynthesis was also
altered (Broyard et al., 2009). Such techniques have also been used to demonstrate that in
tobacco, the enzyme glutamate dehydrogenase (GDH) does not assimilate ammonia, even
when it is overexpressed several fold (Labboun et al., 2009).
The effect of N starvation on the plant metabolic profile has been examined in a few
studies using Arabidopsis as a model species (Krapp et al., 2011), or maize as a crop
(Amiour et al., 2012; Schlüter et al., 2012; 2013). In all these studies it was observed that
in leaves, N deprivation caused a general decrease in most of the metabolites involved in
both C and N primary assimilation, thus impacting on either biomass or grain production.
An accumulation of starch and of a variety of stress-related carbohydrates was also a
characteristic metabolic symptom induced by N deficiency. Interestingly, in the three
117
studies performed on maize it was observed that the accumulation of secondary
metabolites, particularly those used as precursors for cell wall synthesis was strongly
reduced in line with the work on the maize GS-deficient mutants (Broyard et al., 2009).
This observation partly explains why N deficiency, or a perturbation of primary N
assimilation, has a strong impact on maize growth and development through an altered
synthesis of metabolites used as the precursors required for lignin and cellulose
production. Moreover, Amiour et al. (2012) showed that the response of the leaf
metabolite content of maize to N deficiency, varied according to the plant developmental
stage. Thus it is essential that changes in the metabolome must be followed over a long
developmental period, when studying environmental effects in field trials with genotypes,
or transgenic plants with varied NUE (Asiago et al., 2012).
5.7 Integrating “omics” data
Although the main metabolic functions that were altered as a result of N deficiency were
conserved across the different “omics”, there was very little correlation between among
mRNA transcript, protein and metabolite content. This would suggest that other
regulatory elements such as uncharacterized genes or metabolites may have an important
functions within the biological networks involved (Urano et al., 2010). Moreover, it is
generally admitted that “omics” studies only provide a narrow and static picture of the
physiological status of a given organ, at a particular stage of plant development (Fernie
and Stitt, 2012). Thus, additional fluxomics studies based on the use of 15N- and 13C-
labelled compounds may represent an interesting complementary approach to
metabolomics, since these techniques can provide additional information on the
metabolic fluxes occurring in mutants, genetically modified crops or genotypes
exhibiting contrasting NUE (Kruger and Ratcliffe, 2012; Masakapalli et al., 2013).
Moreover such fluxomics techniques are potentially able to provide additional
information on the turnover and remobilization of metabolites in a given cellular
compartment during the day/night cycle and at critical periods of plant development
when N is required for optimal plant growth and development (Gauthier et al., 2010;

118
O’Grady et al., 2012).
In addition to examining the impact of N deficiency, metabolome studies are becoming
more and more extensively used for the high throughput phenotyping necessary for large
scale molecular and quantitative genetic studies aimed at identifying candidate genes
involved in the control of plant productivity (Kliebenstein, 2009), even when these
studies are not necessarily focused on NUE (Meyer et al., 2007; Lisec et al., 2008).
Figure 5-1, illustrates the genetic variability of leaf metabolite content, enzyme activities
and biomass components in nineteen selected maize lines, which are representative of
American and European plant diversity and used as a core collection for association
genetic studies (Camus-Kulandaivelu et al., 2006). Such a large genetic variability could
!"
#!"
$!"
%!"
&!"'()*+,,"
-./0*1,"
2(134"
567+.(8"
+8(4,"
961+"
:.().,"
:*(.)"
+8(4,"
;(<(4,"
=18).4+60"
*1>+?)3(>1
9.@.)A."
B)30+*(.1,"
C+6?)D046
+>1,"
!"
#!"
$!"
%!"
&!"'()*+,,"
-./0*1,"
2(134"
567+.(8"
+8(4,"
961+"
:.().,"
:*(.)"
+8(4,"
;(<(4,"
=18).4+60"
*1>+?)3(>1
9.@.)A."
B)30+*(.1,"
C+6?)D046+
>1,"
E+6(+F)."
8)1G8(1.>,"HIJ"
E171>+FK1",>+71" L6+(."M3(.7",>+71"
!"
N!"
O!!"
P!!"
#!!"
CQ"RQ"SCQ"!"!#$
%&'$!!()'$*(+Q"""""#T!LQ"C(>Q",-.,/Q"
=U8"
%(+'$01'$
%2%,/Q"B06Q"L3UQ"L3."
"V6U8"
"B6)Q"BD1.03<6)<+.)(4,"
:,.Q"9.@.)A.Q"->D+.)3+*(.1"
CQ"SCQ"!"!#$
R"
%(+'$%&Q"2(134"
,-.,/'$*(+Q"%2%,/Q"L3UQ"BBWXQ"=U8"
"01$
#T5L"
9.@.)A.Q""
"L3U8Q"V6U8Q"BD1.03<6)<+.)(4,"
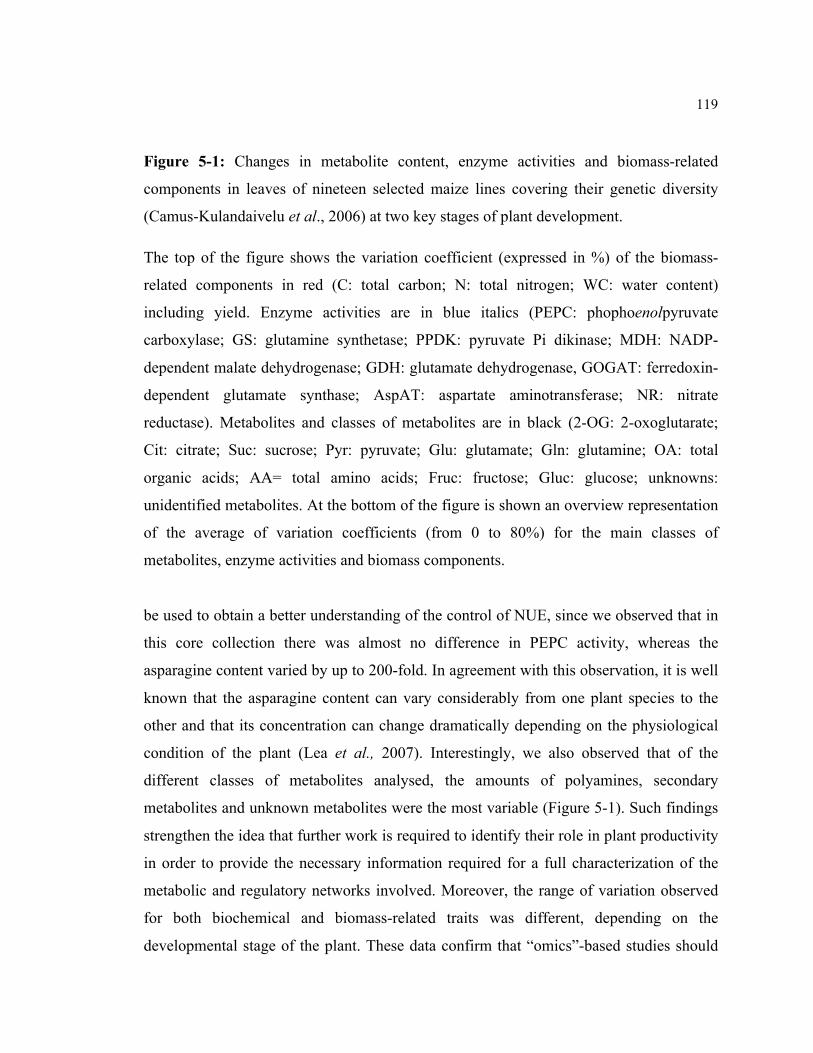
119
Figure 5-1: Changes in metabolite content, enzyme activities and biomass-related
components in leaves of nineteen selected maize lines covering their genetic diversity
(Camus-Kulandaivelu et al., 2006) at two key stages of plant development.
The top of the figure shows the variation coefficient (expressed in %) of the biomass-
related components in red (C: total carbon; N: total nitrogen; WC: water content)
including yield. Enzyme activities are in blue italics (PEPC: phophoenolpyruvate
carboxylase; GS: glutamine synthetase; PPDK: pyruvate Pi dikinase; MDH: NADP-
dependent malate dehydrogenase; GDH: glutamate dehydrogenase, GOGAT: ferredoxin-
dependent glutamate synthase; AspAT: aspartate aminotransferase; NR: nitrate
reductase). Metabolites and classes of metabolites are in black (2-OG: 2-oxoglutarate;
Cit: citrate; Suc: sucrose; Pyr: pyruvate; Glu: glutamate; Gln: glutamine; OA: total
organic acids; AA= total amino acids; Fruc: fructose; Gluc: glucose; unknowns:
unidentified metabolites. At the bottom of the figure is shown an overview representation
of the average of variation coefficients (from 0 to 80%) for the main classes of
metabolites, enzyme activities and biomass components.
be used to obtain a better understanding of the control of NUE, since we observed that in
this core collection there was almost no difference in PEPC activity, whereas the
asparagine content varied by up to 200-fold. In agreement with this observation, it is well
known that the asparagine content can vary considerably from one plant species to the
other and that its concentration can change dramatically depending on the physiological
condition of the plant (Lea et al., 2007). Interestingly, we also observed that of the
different classes of metabolites analysed, the amounts of polyamines, secondary
metabolites and unknown metabolites were the most variable (Figure 5-1). Such findings
strengthen the idea that further work is required to identify their role in plant productivity
in order to provide the necessary information required for a full characterization of the
metabolic and regulatory networks involved. Moreover, the range of variation observed
for both biochemical and biomass-related traits was different, depending on the
developmental stage of the plant. These data confirm that “omics”-based studies should

120
be performed over a sufficiently long developmental period, to identify the critical
physiological stages during which there is a progressive switch between N assimilation
and N remobilization are included (Hirel et al., 2007). In addition, environment-
dependent changes of the underlying metabolic networks need to be taken into account
when investigating the relationship between plant metabolism and plant biomass
production (Sulpice et al., 2013). Leaf metabolite profiling techniques have recently been
successfully used to dissect complex traits in maize through the use of genome-wide
association mapping both in maize lines (Riedelsheimer et al., 2012a) and hybrids
(Riedelsheimer et al., 2012b). Thus, metabolome-assisted breeding techniques, in
addition to genome-assisted selection of superior hybrids, are promising for narrowing
the genotype/phenotype gap of complex traits such as NUE (DellaPenna and Last, 2008;
Fernie and Shauer, 2008; Lisec et al., 2011).
5.8 Metabolic modeling as a tool to unravel the limiting steps in NUE
Due to the ever-accelerating pace of genome sequencing and annotation in the past few
years, researchers have made significant advances in mapping plant genes to metabolic
functions. Nevertheless, efforts to engineer plant metabolism, in general and N
metabolism in particular, have on most occasions been met with limited success (Good et
al., 2004; Hirel et al., 2007). Due to the built-in metabolic redundancy, genetic
interventions often do not bring about the desired effect in plant metabolism (Gutiérrez et
al., 2005; Sweetlove et al., 2003). Therefore, by taking into account the complete
inventory of metabolic transformations of a given plant species, a genome-scale
metabolic reconstruction has the potential to make valuable advances, such as
improvement of yield, NUE, and nutritional quality in crops.
Unlike gene and protein regulatory networks that denote putative interactions (Cho et al.,
2007), metabolic network models capture the inter-conversion of metabolites through
chemical transformations catalyzed by enzymes. Therefore, their topology is generally
better characterized than the one of regulatory networks. A genome-scale metabolic

121
model is constructed by encompassing the widest possible list of biotransformations
present in the organism as supported by annotation and homology evidence. Thus these
models attempt to map the entire chemical repertoire of a specific organism (see Figure
5-3).
Large amounts of data relating to metabolites, reactions and their associated
enzymes/genes are currently available through generic databases such as Kyoto
Encyclopedia of Genes and Genomes (KEGG) (Kanehisa et al., 2012), SEED (Devoid et
al., 2013), Metacyc (Karp and Caspi, 2011), Brenda (Schomburg et al., 2013), Universal
Protein Resource (Uniprot) (Consortium, 2012), PubChem (Wang et al., 2013),
ChemSpider (Pence and Williams, 2010) and plant specific databases such as: MaizeCyc
(Monaco et al., 2013), MetaCrop (Schreiber et al., 2012), Corncyc (Dreher, 2014) (for
maize) and Plant Metabolic Network (PMN) (Dreher, 2014), which is a combination of
18 plant databases. However, incompatibilities of representation (e.g., metabolites with
multiple names/chemical formulae across databases), stoichiometric errors (i.e.,
elemental or charge imbalances) and generic metabolite descriptions (e.g., absence of
stereospecificity or use of generic side chains) are key bottlenecks for the rapid
reconstruction of new high-quality metabolic models by combining information from
these databases. Of late, a database called MetRxn was developed to address these issues
by integrating information (of metabolites and reactions) from 8 such databases and 44
published metabolic models (Kumar et al., 2012). In addition to gene/protein/reaction
information, knowledge of the subcellular localization of enzymes is critical for the
development of plant metabolic models. Towards this end, there exists protein
localization databases such as Plant Proteome DataBase (PPDB) (Hieno et al., 2014) and
SUBcellular localization database for Arabidopsis proteins (SUBA) (Tanz et al., 2013)
for the two plant species Arabidopsis and maize. As displayed in Figure 5-2, the
combination of biological databases, localization databases, and literature evidence
comprise the initial information required to create a genome-scale model.

122
Figure 5-2: Iterative process of genome-scale model building.
A combination of biological and localization databases with published literature provides
information for the initial genome-scale model. This gene, protein, and reaction
information is combined with a biomass equation, which contains user-specified
stoichiometries, to give the stoichiometric matrix. Using flux balance analysis with an
objective function, typically maximizing biomass, a set of simulated reaction fluxes is
determined. Transcriptome, proteome, and metabolome data constrain the model either
by turning on or off reactions in a “switch” approach or by modifying the allowable flux
through a reaction in a “valve” approach. The model is validated using knockout data or
fluxomics data and depending on these results, iterations continue until a high quality
genome-scale model is developed.
High Quality Genome-Scale Model!
!"
Incorporation of Regulatory!Information!
“Switch” Approaches! “Valve” Approaches!
-! E-FLUX!-! PROM!
-! IOMA!-! Algorithm by!
Lee et al. (2012) !
-! GIMME!-! iMAT!
-! MADE!
!" !"
Model Development!Biomass !Equation!
Stoichiometric !Matrix!
1 2 -1 0!
0 0 -1 2!
-1 -1 0 0!
1 0 1 -1!
Reactions"
Meta
bolit
es"
Biomass"
Gene"
Protein"
Reaction"
x AA + y Lipids +"z RNA + a DNA + "b Pigments + …"
Data Sources!•! Biological Databases!
-! KEGG!-! SEED!
-! MetaCyc!-! PMN!
-! MetaCrop!
-! Brenda!-! UniProt!
-! PubChem!-! ChemSpider!
-! MetRxn!
-! PPDB! -! SUBA!
•! Localization Databases!
•! Published Literature!
Model Evaluation!
Knock-out Data! Fluxomics Data!
!
!"#
!$#!%#
Optimization!
Optimum "Solution"
Feasible Solution "
Space"

123
Encouragingly, an increasing number of genome-scale metabolic models of
microorganisms and multicellular organisms are emerging, and the applications of these
models are expanding (de Oliveira Dal'Molin and Nielsen, 2013; McCloskey et al.,
2013). These models are being developed in an iterative manner using literature evidence
in tandem with genome, transcriptome, proteome, and metabolome data. By using flux
balance analysis (FBA), combined with the pseudo-steady state assumption (Orth et al.,
2010), metabolic fluxes (or feasible ranges thereof) can be calculated using a fitness
optimization proxy, such as biomass yield maximization. Under the pseudo-steady state
assumption, FBA assumes that each metabolite that is produced must be consumed at an
identical rate. To investigate the growth phenotype of the cell via FBA, a reaction that
contains all required precursors for cell growth in experimentally measured proportions is
generated and added to the model. This reaction is known as the “biomass” reaction and
its flux is an abstraction of the cell biomass composition. Constraints in FBA are
represented: (i) as equations balancing metabolite production to consumption via all
possible reactions in the model, and (ii) as inequalities imposing bounds (i.e. the
maximum or minimum allowable fluxes) in the system, such as uptake or secretion of
specific metabolites, or upper and lower bounds of reaction fluxes (based on reaction
thermodynamics). All these balances and bounds determine the feasible solution space
i.e. allowable flux distributions of the model and an optimal solution is found under the
specific objective (e.g., biomass yield maximization), as displayed in Figure 5-3.
Genome-scale models can be tested by comparing the in vivo growth of knockout strains
to in silico growth under corresponding conditions, or by comparing fluxome data to
simulated fluxes (McCloskey et al., 2013). Saha et al. (2011) compared experimental
results to in silico model predictions in 17 of 21 cases by comparing the directional
change of the maximum theoretical yield of lignins, sugars and crude protein between the
wild type and two mutant strains. The C4GEM model quantitatively showed a strong
correlation between the differential expression of proteins or protein complexes and
predicted flux differences between the bundle sheath and mesophyll cell types in 50 of
66 cases (de Oliveira Dal'Molin et al., 2010b). These models can then guide

124
physiological characterization, metabolic engineering and discovery (Oberhardt et al.,
2009). Mintz-Oron et al. (2012) demonstrated the use of genome-scale models by
suggesting the knockout of 71 target enzymes to increase vitamin E accumulation in
Arabidopsis. Furthermore, tissue-specific (Jerby et al., 2010) and multi-tissue (Jerby et
al., 2010; Thiele et al., 2013) type models have also been developed for Homo sapiens
and employed for studying metabolic interactions and therapeutic applications.
Figure 5-3: Flux balance analysis
using a metabolic model.
A simplified metabolic model is displayed encompassing multiple tissue types, cell
types, and compartments, as well as the transporters between them. Flux balance analysis
assumes that each metabolite is produced and consumed at equal rates, as required by the
pseudo-steady state assumption. This constraint is imposed for every metabolite and,
along with the flux bounds of each reaction determined by reaction thermodynamics,
creates the feasible solution space. By optimizing an objective function, typically
biomass production, a flux value is predicted for each reaction within the model.
!"#$%&'"()*'+,*-().#/"(
)*'+,*-(&#$"0(*-(*.,1%2%-3((
#-(*&4"/,5"(6+-/,*-(
57(
58(
59(
:((
;**<(
=>'*?*.'#$<(=@<*.'#$1(
A"$*.>@''((
="''(
B@'"1( C>'*"1(D+-0'"()>"#<>((
="''(
A%<*/>*-0?%#(
=>'*?*.'#$<(
=@<*.'#$1(
EF/>#-3"(;"#/,*-(
G-<"?/"''+'#?(H?#-$.*?<"?(
G-<?#/"''+'#?(
H?#-$.*?<"?(

125
Metabolic modeling of plants is a rapidly developing field. Models of Arabidopsis
(Poolman et al., 2009; de Oliveira Dal'Molin et al., 2010a; Radrich et al., 2010; Mintz-
Oron et al., 2012), rice (Poolman et al., 2013), barley (Grafahrend-Belau et al., 2009;
Grafahrend-Belau et al., 2013), rapeseed (Pilalis et al., 2011), sorghum (de Oliveira
Dal'Molin et al., 2010b), sugarcane (de Oliveira Dal'Molin et al., 2010b), and maize (de
Oliveira Dal'Molin et al., 2010b; Saha et al., 2011) have already been developed.
Although the majority of these available models focus on a single tissue, whole-plant
models are beginning to emerge. For instance, Grafahrend-Belau et al. (2013) developed
a whole-plant model of barley, including specific models for the leaf, stem, and seed
tissues, to analyze seed development, crop improvement and yield stability. To this end,
a whole-plant metabolic model of maize would also be useful to not only characterize
metabolism, but also to highlight the limiting steps in NUE. Integration of high
throughput “omic” information with metabolic models contributes towards improving
the genotype-phenotype relationship and prediction accuracy. Plant genome-scale
metabolic model development is currently exploring ways of incorporating such
experimental data by adopting approaches developed for microbial organisms (Töpfer et
al., 2013).
5.9 Incorporating transcriptome, proteome, and metabolome data into models
Incorporating transcriptome, proteome and metabolome data can increase the predictive
accuracy of genome-scale models. Utilizing such high-throughput “omics” information
not only provides regulation (for tissue-specific models) but also ensures that the correct
reactions and metabolites are represented within specific tissue-types (for multiple
tissue/whole plant models). To this end, Jerby et al. (2010) developed the Model-
Building Algorithm (MBA) to reconstruct a tissue-specific model from a generic model
by combining “omics” (i.e., transcriptome, proteome, and metabolome) information with
the published literature. Furthermore, many other approaches have been developed for
capturing “omics” data in the form of regulation on the model (Blazier and Papin, 2012;

126
Hyduke et al., 2013). Two main modeling philosophies, that abstract regulation as either
an on/off “switch” or a continuous flow “valve” have been put forth, as shown in Figure
5-2. The Gene Inactivity Moderated by Metabolism and Expression (GIMME) (Becker
and Palsson, 2008), integrative Metabolic Analysis Tool (iMAT) (Shlomi et al., 2008;
Zur et al., 2010), and Metabolic Adjustment by Differential Expression (MADE) (Jensen
and Papin, 2011) algorithms use a “switch” approach to turn the reactions on or off,
based on differential expression changes. The GIMME approach simply turns off
reactions based on a user-specified threshold for expression data. The iMAT approach
discretises the expression data into lowly, moderately, and highly expressed genes, and
then utilizes an algorithm to turn on the smallest number of lowly expressed genes
required to achieve a specified metabolic function (i.e. a user specified biomass objection
function). The MADE algorithm employs multiple data sets from two or more related
conditions to activate or repress appropriate reactions for simulating the progression of
experimental conditions. Only statistically significant changes in expression levels will
convert an activated reaction to a repressed state, or vice-versa, when comparing one
experimental condition to another. All “switch” approaches require essential reactions to
remain active in the model, regardless of their expression level, to ensure biomass is
produced. Contrary to these “switch” approaches, E-FLUX (a combination of flux and
expression data) (Colijn et al., 2009) and Probabilistic Regulation Of Metabolism
(PROM) (Chandrasekaran and Price, 2010) algorithms adopt a “valve” approach, via
modifying the allowable range of the flux of any reaction (i.e. the upper and lower flux
bounds of the reaction) based on gene/protein expression data. The E-FLUX algorithm
incorporates a single data set (i.e., one experimental condition) and requires a user-
specified function to convert expression levels to flux constraints. The PROM algorithm
incorporates multiple data sets to set maximum reaction flux levels based on the
probability that the gene is active among all experimental data sets. Recently Lee et al.
(2012) developed another “valve” approach by using absolute gene expression levels to
regulate reaction fluxes. The integration of metabolome data with transcriptome or
proteome data can further increase the accuracy of the genome-scale metabolic models.
The Integrative Omics-Metabolome Analysis (IOMA) algorithm uses a Michaelis-

127
Menten-type rate equation to calculate an empirical reaction flux using metabolome and
proteome data. Each empirical reaction flux includes an error correction that is used to
account for missing experimental metabolite concentrations and errors in experimental
measurements. An algorithm is then used to minimize the error in reaction flux
predictions with an additional biomass constraint (Yizhak et al., 2010). Overall, these
advancements to integrate “omics” data into microbial models have resulted in a
collection of data integration techniques that have set the stage for similar
implementations in plant models.
While many of these algorithms have not yet been applied to plants, Töpfer et al. (2013)
applied the E-FLUX algorithm to the Arabidopsis model developed by Mintz-Oron et al.
(2012) to predict the maximum flux through metabolic pathways altered under eight
varying light and temperature conditions. Of the 167 metabolic functions or pathways
studied, 37 functions resulted in a differential capacity in at least one of the eight
conditions modelled, meaning that the flux through the pathway changed more than the
expected flux variations from random chance. With the successful incorporation of E-
FLUX in Arabidopsis, more plant models employing transcriptome, proteome, and
metabolome data are expected to emerge. For a more in-depth review of integrating
“omics” data with genome-scale models of model organism, see the recent review paper
by Saha et al. (2014).
5.10 Concluding remarks
Understanding the complexity of the control of NUE of model crop species such as
maize, requires a holistic understanding of N-flow and associated regulation at the
cellular, organ, and whole-plant levels. In this review, we have highlighted the current
status of plant “omics” and critically analyzed the importance of metabolic modeling in
the study of NUE and other agronomic traits such as biomass and grain yield. While the
integration of several biological databases, model-building strategies and high-throughput

128
“omics” procedures are already available, there is still no whole-plant model that has
been developed for maize. Therefore, by applying a combinatorial semi-automated
(Suthers et al., 2009; Jerby et al., 2010) model building workflow, a high quality whole-
plant model could be developed for maize. Then, the “omics” data obtained by growing
plants under varying N conditions and by analysing genetically modified plants and
mutants altered for the expression of structural or regulatory genes for N uptake,
assimilation and remobilisation can be incorporated in the model. They could provide a
more accurate simulation of the effect of N on the metabolic interactions and flow
throughout the plant and subsequently could identify the key reactions (i.e., genes)
controlling NUE. Ultimately, an integrated model combined with quantitative genetic
studies may identify possible genetic interventions to improve NUE. Exploiting natural
and created genetic variability could then be experimentally tested to either verify the
model or provide new information to resolve discrepancies of model predictions, thereby
increasing the model fidelity in the future.
In addition, genome-wide association studies combined with metabolic and gene
expression analyses are becoming more commonly implemented for screening large
collections of genotypes and hybrids for their potential productivity (Riedelsheimer et al.,
2012b). Such studies also focus on the effect of the environment on plant phenotypic
plasticity under various N regimes and environmental conditions (Brunetti et al., 2013;
Gifford, 2013). In a similar manner to gene expression studies, it is also now possible to
study the relationship between measured metabolite contents, in order to interpret
complex data sets and identify key network components for further practical metabolic
engineering (Yonekura-Sakakibara et al., 2013; Toubiana et al., 2013). Thus, the next
major challenge for plant biologists and breeders will consist of integrating full “omics”
data sets into the modeling, population structure and selection strategies (Langridge and
Fleury, 2011).

129
6 Chapter 6 ASSESSING THE METABOLIC IMPACT OF NITROGEN AVAILABILITY USING A COMPARTMENTALIZED MAIZE LEAF GENOME-SCALE MODEL
This chapter has been just submitted in modified form in Plant Physiology (Simons, M.*, Saha, R.*, Amiour, N., Kumar, A., Guillard, L, Clément, G., Miquel, M., Zheni, L., Mouille, G., Hirel, B. and Costas D. Maranas (submitted), “Assessing the Metabolic Impact of Nitrogen Availability using a Compartmentalized Maize Leaf Genome-Scale Model”) (*Authors contributed equally).
6.1 Introduction
Zea mays L., commonly known as maize or corn, is an essential dual use food and energy
crop. Maize production is increasing at the greatest rate among all cereals with a
worldwide trend of 0.06 t/ha/year (tons/hectare/year) [329], and a record 877 million tons
produced in 2011-2012 fiscal year [330]. With the recent completion of the maize
genome in 2009 along with the creation and curation of databases such as MaizeGDB in
2011 [331], MaizeCyc in 2013 [332], and MetaCrop 2.0 in 2012 [333], there is a need for
an updated genome-scale metabolic (GSM) model [334] that will integrate all newly
available information from diverse sources. The integration of this information with
experimental transcriptomic data, proteomic data, and biomass composition
measurements in a excess nitrogen (N+ WT) condition, limited nitrogen (N- WT)
condition and two glutamine synthetase (GS) mutants, gln1-3 and gln1-4 mutants, [335]
allows for more accurate assessment of the nitrogen (N) metabolism within the maize
leaf.
Maize is a C4 plant that overcomes the inefficiencies of RuBisCO, to capture oxygen over
the preferred CO2, by separating the carbon (C) fixation process into two cell types: the
bundle sheath and mesophyll cell. In comparison to C3 plants, this separation causes C4
plants to decrease in photorespiration rate [336], increase in the photosynthetic nitrogen

130
use efficiency (NUE) [337], and increase in the net photosynthesis at high light intensities
(under standard air and temperature conditions) [338]. A C4 specific maize GSM can
yield insight into N metabolism and provide cues for improving NUE (i.e. the vegetative
biomass or grain yield produced per unit of N present in the soil). Since N is the major
limiting factor in agricultural production among mineral fertilizers [339, 340], improving
the NUE is essential in improving overall productivity in maize [341]. Amiour et al.
(2012) experimentally determined 150 gene transcripts, 40 proteins, and 89 metabolites
that are significantly different between the N+ WT and N- WT conditions during the
vegetative stage of growth. N utilization is strongly linked to the GS enzyme [335]
because all N, either in the form of nitrate or ammonium ions, are channeled through the
reaction catalyzed by the GS enzyme [335, 342]. The mesophyll cell specific GS1-3
isozyme is involved in synthesizing glutamine after nitrate reduction from the vegetative
state until the plant reaches maturity. Leaf aging induces the bundle sheath specific GS1-
4 isozyme. Consequently, Martin et al. hypothesizes that this isoform is used in the
reassimilation of ammonium during protein degradation in senescing leaves [335].
During vegetative growth in the leaf tissue, DNA microarray data reveal that 243 gene
transcripts, 46 proteins, and 48 metabolites exhibit significant differences in the gln1-3
mutants and 107 gene transcripts, 14 proteins, and 18 metabolites display substantial
differences in the gln1-4 mutants (Table S1). In this second-generation maize model, we
explore the effect of the computational knockout of genes encoding for GS1-3 and GS1-4
isozymes using flux balance analysis (FBA) to elucidate the role of GS in N metabolism.
FBA of GSMs is used to model organism specific metabolism by simulating the internal
flow of metabolites. The number of GSMs for plant organisms is quickly increasing with
models for Arabidopsis [343, 344], barley seed [345], maize [334, 346], sorghum [346],
sugarcane [346], rapeseed [347], and rice [348]. These models rely on annotation
information to assemble comprehensive compilations of all reactions and metabolites
known to occur within the organism. Currently, whole-genome sequencing is completed
for approximately 40 vascular plants including Arabidopsis thaliana [349], Arabidopsis
lyrata [350], Glycine max [351], Oryza Sativa [352, 353], Populus trichocarpa [354],

131
Sorghum bicolor [355], Theobroma cacao [354], and Zea mays [356]. Gene annotations
of the whole-genome sequences are used to determine the reactions within an organism
and therefore build a GSM. FBA calculates all reaction fluxes in a metabolic network
based on the optimization of an objective function (typically the maximization of the
biomass yield). A quasi-steady state is assumed and flux constraints are set based on the
specific media or the reversibility of reactions derived from thermodynamics.
Incorporation of ‘omics’ data into GSMs is achieved through appropriate constraints on
fluxes that restrict metabolic flows to only condition-relevant phenotypes.
Within the last few years, multiple methods have been developed to integrate ‘omics’
data into GSMs. Proteomic and transcriptomic data have been used to apply flux
constraints on corresponding reactions determined by gene-protein-reaction (GPR)
associations. The GIMME [357], iMAT [358], and MADE [359] algorithms use a
“switch” approach to turn on/off reactions based on expression levels. The GIMME
algorithm turns off reactions based on a user-specified threshold of the expression level.
The iMAT algorithm turns on a minimal set of reactions associated with low expression
data in order to achieve a user-specified metabolic function. The MADE algorithm
incorporates related experimental datasets into the model to activate or repress reactions
based on the progression of the experimental conditions. A different class of algorithms,
known as the “valve” approach, was developed to incorporate proteomic and
transcriptomic data by constraining the allowable flux ranges of reactions. The E-Flux
method incorporates a user-specified function to convert gene expression data to flux
constraints [360]. Finally, the PROM [361] algorithm uses multiple datasets to constrain
flux bounds based on the probabilities associated with gene activity among all datasets.
These advancements pertaining to the integration of ‘omics’ data with GSMs has allowed
for more accurate flux predictions.
In this work, we describe the reconstruction of a second-generation maize leaf model and
incorporation of ‘omics’ data to the model with the goal of improving the understanding
of N metabolism. Both primary and secondary metabolism of maize are captured by

132
combining information from Metacrop [333], MaizeCyc [332], and the earlier iRS1563
[334] model. In comparison to the iRS1563 model, this second-generation model spans
an additional 4,261 genes and 6,498 reactions. The increased number of accounted genes
and reactions enables the inclusion of additional pathways such as fructan biosynthesis,
siroheme biosynthesis, and ubiquniol-9 biosynthesis. The model accounts for two major
cell types in the leaf (i.e., the bundle sheath and mesophyll cells). The bundle sheath cell
contains seven compartments: the cytosol, mitochondrion, peroxisome, plastid, plasma
membrane, thylakoid membrane, and vacuole. The mesophyll cell contains six
compartments: the cytosol, mitochondrion, plastid, plasma membrane, thylakoid
membrane, and vacuole. Compartmentalization is based on maize specific experimental
proteomic and transcriptomic measurements [362-365] as opposed to the Arabidopsis-
based compartmentalization adopted in the previous iRS1563 maize model [334]. Light
reactions have been expanded from an aggregate reaction (as described in the iRS1563
model) to multiple reactions for each complex with the inclusion of a thylakoid
membrane compartment. In contrast to the C4GEM maize model [346], which focuses
exclusively on primary metabolism in maize, the developed model also spans secondary
metabolism by including all reactions known to occur within the maize leaf tissue. The
model includes as many as 763 secondary metabolism reactions (without including
duplicate counting due to compartmentalization). Through the incorporation of ‘omics’
data, regulatory restrictions are introduced in the model to switch-off/on reactions under
the N+ WT, N- WT condition and two GS knockout mutants (gln1-3 and gln1-4) (Martin
et al., 2006). Reactions linked to genes or proteins with significantly different expression
levels between N+ WT and N- WT condition, as well as the gln1-3 and gln1-4 mutants
versus the N+ WT are conditionally turned on or off accordingly. The metabolite pool is
simulated by maximizing the total flux through a metabolite (i.e. flux-sum) as a proxy for
the metabolite turnover rate [366]. The directional change of flux-sum levels between the
N- WT condition and the N+ WT condition, as well as the GS mutant conditions and the
N+ WT condition are qualitatively compared to the directional change in experimentally
measured concentration levels. This analysis reveals similar trends as the recently
developed Flux Imbalance Analysis [367] that makes use of dual variable values

133
associated with metabolite balances to infer the effect of concentration changes on the
objective function value.
6.2 Results and Discussion
6.2.1 Effect of Nitrogen Conditions on Biomass Components
Biomass components were measured in N+ conditions, as well as in each N stress
condition (N-, gln1.3 and gln1.4 mutants). As expected, in the majority of cases, the N-
condition produces a smaller quantity of biomass components than the WT, gln1-3, and
gln1-4 mutant conditions. However, the amount of amino acids produced is about 5 times
higher in the gln1-4 mutant than the gln1-3 mutant, resulting in comparable amino acid
measurements between the gln1-4 mutant and the WT conditions, as well as between the
gln1-3 mutant and N- condition. The similar amino acid quantities between the gln1-4
mutant and WT condition in the vegetative stage help to confirm that the GS1-4 isozyme
is essential in plant maturity and has a smaller effect compared to the GS1-3 isozyme in
the vegetative stage. As expected, the amount of starch increases from the WT condition
to the N- condition. With the light conditions remaining constant for all conditions, we
expect the photosynthesis rate to also remain constant producing a similar amount of
starch. Under N- conditions, the breakdown of starch is limited by the amount of N
available (Tercé-Laforgue et al., 2004; Amiour et al., 2012). Due to the limited N
available, the starch is stored rather than broken down to produce other biomass
components as expected. The condition-specific biomass measurements have been
incorporated in the maize leaf model to more accurately represent metabolism under each
condition.

134
6.2.2 Development of the second-generation maize leaf model
The second-generation maize leaf model was developed using a combination of gene,
protein, and reaction information from our previously developed maize model iRS1563,
biological databases such as KEGG, MaizeCyc, and Metacrop, as well as published
literature sources. The model contains 5,824 genes and 8,484 reactions, a significant
increase to the iRS1563 model, which contained 1,563 genes and 1,985 reactions. The
second-generation maize model is split into two cell types, (i.e. the bundle sheath and
mesophyll cells). The bundle sheath cell is further divided into seven compartments,
while the mesophyll cell contains six compartments, as displayed in Figure 6-1. Of the
8,484 reactions in the model, 3,997 reactions are unique, meaning duplicated counts due
to compartmentalization are disregarded. Of these 3,997 unique reactions, 1,012 reactions
were assigned localization information based on transcriptomic and proteomic data [362-
365]. Light reactions were adjusted to model the flow of protons between the thylakoid
membrane and chloroplast, represent the pH differential between compartments, and
describe the conversion of light to energy [368]. The mitochondrial electron transport
chain was similarly updated to include the proton exchange of ATP synthase between the
intermembrane space and the mitochondrial matrix [369]. Finally, 303 specific reactions
were added to model glycerolipid synthesis [370-376]. To the best of our knowledge, this
is the first plant model to include specific glycerolipid synthesis. Aggregate reactions
were then included to link specific two-tailed glycerolipids to the experimentally
measured single lipids (see Table S3). Compiling transcriptomic and proteomic
compartmentalization data with literature-based pathways yielded a model of 3,524
reactions leaving 2,985 unique reactions with unknown localization.

135
Figure 6-1: Number of metabolic and transport reactions distributed between
compartments in the bundle-sheath and mesophyll cell types.
The number of metabolic and transport reactions are shown for each compartment.
Integral membrane proteins are considered in metabolic reaction counts in the
compartment in which the main biotransformations occur. For example the ATP
synthase associated with the mitochondrial electron transport chain is counted as a
metabolic reaction in the mitochondria, not the inner mitochondrial membrane (IMM).
Once reactions were compartmentalized based on transcriptomic data, proteomic data,
and published literature, the reactions were divided into two groups. The first group

136
(core set) includes reactions with known localization, while the second group (non-core
set) spans reactions known to occur within the maize leaf but with no localization
evidence. Whenever possible, core reactions were unblocked by first adding reaction(s)
from the non-core set to one or multiple compartment(s) and second by appending inter-
or intra-cellular transporter(s) (see Materials and Methods section). By following this
approach, 1,032 unique reactions with previously unknown localization were assigned to
compartments and 732 transporters were added. The remaining 1,953 unique reactions
were assigned to compartments based on available pathway information or assigned to
the cytosol of both the bundle sheath and mesophyll cells.
With all reactions assigned to specific compartments, thermodynamically infeasible
cycles that were generated due to the overly permissive inclusion of reactions in the
model as well as lack of reaction directionality information were subsequently identified
and eliminated. By first restricting the directionality of reactions and second removing
reactions, we were able to eliminate all thermodynamically infeasible cycles in the
model. In this process we restricted the directionality of 36 reactions and removed 665
reactions from the model (Table 6-1). Upon the resolution of thermodynamically
infeasible cycles, we attempted to unblock the remaining blocked core reactions by
adding reactions from similar organisms and model organisms (i.e. Orzya sativa
japonica, Brachypodium distachyon, Sorghum bicolor, and Arabidopsis thaliana).
6.2.3 Incorporation of ‘omics’ data in the model
In order to more accurately model the N+ WT, N- WT, and GS mutant conditions in
maize, GPR associations mapped the gene transcripts and proteins that are statistically
expressed at a low level to reactions that were turned-off in the model. However, no
essential reactions were altered. In this manner, the fluxes through 85 reactions in the N+
WT condition, 20 in the N- WT condition, 100 in the gln1-3 mutant, and 9 reactions in
the gln1-4 mutant were restricted. The reactions restricted in the N+ WT mainly
correspond to reactions known to only occur under stress. Nitrogen perturbations within

137
the leaf tissue were modeled by combining the incorporation of transcriptomic and
proteomic data with the unique biomass compositions for each condition.
Table 6-1: Number of reactions after each model creation and curation step.
The original two data sets are the core set and gapfill set which combine to form the final
model statistics. The total number of metabolic, transport, exchange, and biomass
reactions are displayed after each process during model curation. Metabolic reaction
totals include duplication from compartmentalization.
The minimal set of reactions, whose regulation causes a decrease in the biomass yield,
was determined for the N+ WT, N- WT, gln1-3 mutant, and gln1-4 mutant conditions. Of
the 85 reactions with restricted flux in the N+ WT condition, only 5 reactions (3 unique
reactions irrespective of compartmentalization) were identified to affect the biomass
yield. These reactions include ferredoxin oxidoreductase, GTP phosphohydrolase, and
ethanol oxidoreductase. The GTP phosphohydrolase reaction is a contributing reaction to
Metabolic Reactions
Transport Reactions
Exchange Reactions
Biomass Reactions
Init
ial
Dat
a
Core Set 3002 418 82 85
Core Set + Manually
Created Pathways 3264 469 290 85
Non-core Set 18951 0 0 0
Pro
cess
es
Per
form
ed
Modified Gapfill
Compartmentalization 3971 1198 290 85
Manually Determined
Compartmentalization 9005 1198 290 85
Thermodynamically infeasible cycles
7362 742 290 85
Similar Organism Gapfill 7367 742 290 0
Fin
al
Model
Second-generation GSM
model 7367 742 290 85
!

138
purine metabolism in maize, but is not essential as GTP can be synthesized by other
reactions, such as the ATP-GDP phosphotransferase reaction. In the N- WT condition,
none of the reactions have an effect on the biomass yield suggesting, as expected, that the
decreased amount of nitrogen is the main limiting factor in biomass yield. In the gln1-3
mutant condition 12 of the 100 reactions, which are switched off based on “omics” data,
affect the biomass yield. Of the 12 reactions 6 are unique, in regards to
compartmentalization, including the ferredoxin oxidoreductase, GTP phosphohydrolase,
ribose-5-phosphate isomerase, glyceraldehyde-3-phosphate dehydrogenase, fructose-
bisphosphate aldolase, and ATP 6-phoshphofructokinase reactions. The ribose-5-
phosphate isomerase reaction loss can be rescued by the ATP dependent ribose-5-
phosphate diphosphotransferase reaction. The gyceraldehyde-3-phosphate dehydrogenase
reaction is not essential because glyceraldehyde-3-phosphate is synthesized during
carbon fixation in photosynthesis and 3-phospho-D-glycerol phosphate can be
synthesized through the 3-phospho-D-glycerate 1-phosphotransferase reaction using
ATP. The additional ATP required in 3-phospho-D-glycerate 1-phosphotransferase
results in a decrease in the biomass yield. The fructose-bisphosphate aldolase reaction,
which is involved in the Calvin-Benson-Bassham cycle and glycolysis pathway, can be
bypassed using the sedoheptulose 1,7-bisphosphate D-glyceraldehyde-3-phosphate-lyase
reaction. The conversion of fructose 6-phosphate to fructose 1,6 bisphosphate can be
completed with either ATP or UTP. With the conversion involving ATP restricted based
on “omics” data, the UTP dependent conversion results in a decrease in biomass yield,
suggesting UTP is more energetically expensive in the gln1-3 mutant case than ATP.
Finally, the gln1-4 mutant condition involves only 9 reactions, of which 4 affect the
biomass. These 4 reactions, however, are the ribose-5-phosphate isomerase reaction in
multiple compartments. While only a subset of reactions affect the biomass levels in the
N+ WT, gln1-3 mutant, and gln1-4 mutant conditions, the additional regulation will have
an effect of the flux predictions within the model.
The metabolomic data was compared to flux predictions within the model in each of the
various N background conditions. The increasing or decreasing trend of the metabolite

139
concentration, displayed in Figure 6-2, was qualitatively compared to the change in the
maximum flux-sum determined by the model, as displayed in Figure 6-3. Therefore, an
increase/decrease in the flux-sum (i.e. often interpreted as the maximum metabolite pool)
of a metabolite between the N- WT condition and the N+ WT condition and between the
two GS mutants and the N+ WT condition were contrasted against metabolite level
changes. Figure 6-3 demonstrates the importance of restricting fluxes based on
transcriptomic and proteomic data. In the N- condition the accuracy changes from 57%
when the fluxes are not constrained to 80% when the flux constraints are incorporated.
Similarly, the accuracy increases from 50% to 67% in the gln1-3 mutant and from 41% to
62% in the gln1-4 mutant. The identified flux-sum levels are included in Supplemental
S4 (which can be found in the on-line version of the published paper). The flux-sum level
is affected by the “omics” based constraints for all metabolites in all conditions with the
exception of only four metabolites in the N- WT condition. This suggests that limiting the
amount of nitrogen is the primary factor in correctly predicting the metabolite pool
decrease in galacturonate, phophethanolamine, and isoleucine. The final metabolite not
affected by the “omics” based constraints is rhamnose, which is simulated as decreasing
using the flux-sum concept, but is experimentally shown to increase in concentration,
suggesting possibly a missing regulation in the N+ WT condition. An overall 62%
accuracy in reproducing the experimental trends in three different N conditions is
assessed for the model.

140
Figure 6-2: Number of metabolites in each condition that statistically vary from the WT
condition at the vegetative stage.
The number of metabolites that experimentally significantly increase and decrease in
comparison to the WT condition are displayed for each of the N conditions tested.
6.2.4 Flux range variations among conditions
The flux range of each reaction was determined under maximum biomass in the N+ WT,
N- WT, gln1-3 mutant, and gln1-4 mutant conditions. The reaction’s flux range in the N-
WT, gln1-3 mutant, and gln1-4 mutant conditions was compared to the flux range in the
N+ WT reference condition to determine reactions whose flux ranges do not overlap. This
indicates that the flux

141
Figure 6-3: Effect of “omics” based regulation on the flux-sum prediction compared to
the experimental trend in metabolite concentration.
By restricting the reaction flux based on the transcriptomic and proteomic data, the
accuracy of the qualitative trend in metabolite pool size between the N- WT to N+ WT,
gln1-3 mutant to N+ WT, and gln1-4 mutant to N+ WT increases. Before adding “omics”
based constraints, the model was able to correctly predict the direction of change in 57%
of the metabolites measured in the N- WT compared to the N+ WT condition. By
including the “omics” based constraints, the accuracy increased to 80%. The gln1-3
mutant condition compared to the N+ WT condition and the gln1-4 mutant compared to
the N+ WT condition increases from 50% to 67% accuracy and 41% to 62%, respectively,
in predicting the metabolite pool size with the inclusion of flux restrictions based on
“omics” data.
through the reaction must change as a result of the limited nitrogen or mutant condition.
Overall, the flux through 139 reactions must change between the N- WT and N+ WT

142
condition, 665 reaction fluxes must change between the gln1-3 mutant and N+ WT, and
649 reaction fluxes must change between the gln1-4 mutant and N+ WT conditions. In all
three nitrogen backgrounds (i.e. the N- WT condition, gln1-3 mutant, and gln1-4 mutant
conditions) the flux compared to the N+ WT reference condition decreases under
maximum biomass through leucine biosynthesis in the bundle sheath cell, hexadecanoic
acid metabolism, homoserine biosynthesis, and vitamin K biosynthesis pathways. In
addition, the flux through adenosine nucleotide degradation, serine biosynthesis,
stachyose biosynthesis, and guanine and guanosine salvage pathway must decrease in
both of the GS mutant conditions compared to the N+ WT condition. However, the flux
through alanine biosynthesis, γ-glutamyl cycle, histidine biosynthesis, xylose
degradation, and glutathione degradation increase in the GS mutant conditions compared
to the N+ WT condition. The flux through the γ-glutamyl cycle increases to synthesize
glutamate through the consumption of two ATP. The increase in xylose degradation
causes an increase in the formation of glyceraldehyde 3-phosphate. The change in the
majority of these pathways is directly related to the differences in the proportion of the
biomass components between the modeled conditions. For example, the glutathione
degradation pathway yields glycine, which experimentally increases in proportion in both
the GS mutant conditions compared to N+ WT.
6.3 Concluding remarks
We have introduced a second-generation model that is specific to the leaf tissue with
specificity between the bundle sheath and mesophyll cell types. This model with the
addition of other maize tissue-specific models can be integrated into a whole-plant
genome-scale model for maize. By determining a required metabolic function that is
specific to each tissue, tissue-specific models can be created ensuring that only functional
reactions are included in each tissue. Future efforts will focus on tissue-specific models
for the seed, stalk, tassel, and root tissues. These tissue-specific models can then be
linked using inter-tissue transport reactions with the stalk tissue acting as the central
transporter among the various tissues. A whole-plant genome-scale model of maize will

143
help to elucidate the flow of nitrogen from the root to the other tissues in the plant. By
modeling the entire plant, non-intuitive bottlenecks in nitrogen metabolism can be
determined, which then can be used to suggest genetic interventions to increase the
nitrogen use efficiency in maize. In addition, the flow of sugars to the seed tissue can be
analyzed to suggest genetic interventions to increase the carbohydrate/sugar content of
maize seed. Apart from its crucial role as a food crop, maize is also used for cellulosic
biofuels. To this end, the amount and composition of cell wall polymers is important in
developing cellulosic maize. Lignin not only provides rigidity to the maize plant [309,
315], but also makes digestion of cellulosic and hemicellulosic sugars difficult during
dilignification [316]. The available genetic engineering strategies are not suitable since
plant viability and fitness are affected upon lignin reductions [316]. Therefore, by
utilizing the whole-plant genome-scale model a system-wide implication of these genetic
disruptions can be quantitatively assessed, thus facilitating new strategies for reducing
lignin content without affecting the mechanical integrity of the maize plant.
6.4 Materials and Methods
6.4.1 Plant Material
Maize (Zea mays L., genotype B73), wild-type (WT), gln1-3 and gln1-4 mutant seeds
were first sown on coarse sand and after one week, when two to three leaves had
emerged, individual plants were transferred to pots (diameter and height of 30 cm)
containing clay loam soil with one plant per pot and 12 pots in total. Clay loam soil is
composed of a mixture of loam (washed fine pit with no minerals) and loam balls of
about 0.5 cm diameter that ensure sufficient aeration of the roots and allow growing the
plant until maturity without lodging. Clay loam soil also allows a constant flow of the
nutrient solution that is provided several times a day. Pots were placed in a glasshouse at
the Institut National de la Recherche Agronomique, Versailles, France and grown from
May to September 2004. Pots were moved every week to avoid shading and position

144
effects. Three individual plants of similar size and of similar developmental stage were
randomly selected. They correspond to the three replicates used for the three different
‘omics’ experiments. At the 10 to 11 leaf stage, the three youngest fully expanded leaves
were harvested and pooled for the vegetative stage (V) samples to obtain enough
homogenous plant material representative of this plant developmental stage. The leaf
below the ear was harvested at 55 days after silking and named the mature leaf
developmental stage (M). The M stage corresponds to the end of the grain-filling period,
during which under our experimental conditions, leaves did not show any visible
symptoms of yellowing. The leaf, below the ear, was selected since it has been shown to
provide a good indication of the source sink transition during kernel filling [377-379].
Leaf samples were harvested between 9 a.m. and noon and frozen in liquid N2, ground to
a homogenous powder, and stored at -80°C. Choosing a single time point during the
middle of the light period, is commonly used in a large number of physiological and
molecular studies and was successfully used both in our previous quantitative genetic and
‘omics’ studies [377, 380]. In the glasshouse, WT, gln1-3, and gln1-4 mutant plants were
watered daily with a complete nutrient solution containing 10 mM KNO3 as the sole N
source[381]. The complete nutrient solution contained 1.25 mM K+, 0.25 mM Ca2+, 0.25
mM Mg2+, 1.25 mM H2PO4-, 0.75 mM SO4
2-, 21.5 mM Fe2+(Sequestrene; Ciba-Geigy),
23 mM B3+, 9 mM Mn2+, 0.3 mM Mo2+, 0.95 mM Cu2+, and 3.5 mM Zn2+. For growing
WT plants under low N-deficient conditions (N-), NO3- was supplied as 0.1mM KNO3, a
N concentration that has previously been shown to provide N-deficiency stress for most
plant species [377, 378, 382].
6.4.2 Yield Components Analysis
Kernel yield, its components, and the N content of different parts of the plant at stages of
development from silking to maturity were determined according to the method described
by Martin et al. (2005) and corresponded to the data described in Martin et al., 2006 and
Amiour et al., 2012.

145
6.4.3 RNA and DNA Preparation
Total RNA was extracted as described by Verwoerd et al. (1989) [383] from leaves that
had been stored at -80°C. 50 mg of total RNA were incubated at 37°C for 30 min with
40U RNase inhibitor and 25U RNase-free DNase (Promega, Charbonnieres, France) in 6
ml 10X buffer (Promega) with DEPC treated water added to a final volume of 60 ml. The
DNase was removed by phenol/chloroform/iosamyl alcohol (25:24:1) extraction and total
RNA was precipitated overnight at -20°C in 0.1 volume ammonium acetate (3M) and 2.5
volume ethanol (100%) and resuspended in DEPC treated water. Purification of mRNA
from total RNA was performed using the Dynabeads mRNA Direct Kit
(Dynal/Invitrogen, Cergy Pontoise, France). Genomic DNA was isolated from frozen
leaves according to the micro-scale procedure [384]. Leaf dNTP and NTP concentrations
were calculated using the maize genome sequence and the abundance of leaf maize
transcript available at www.maizesequence.org. For the unidentified deoxynucleotides
and nucleotides calculations were performed using the average composition of the
identified ones.
6.4.4 Gene Expression Profiles using Maize cDNA Microarrays
Starting with 3 µg of total RNA, non-modified amplified antisense RNA (aRNA)
products were prepared using the Amino Allyl MessageAmp™ aRNA Kit (Ambion,
Foster City, CA, USA), according to the manufacturer’s instructions. Briefly, RNA was
transcribed into cDNA using reverse transcriptase with a T7 primer that contains a
promoter for DNA-dependent RNA polymerase[385]. After RNase H-mediated second-
strand cDNA synthesis, the double-stranded cDNA (dscDNA) was purified and served as
a template in the subsequent in vitro transcription (IVT) reaction. Following this, 2 µg-
aliquots of aRNA were labeled using the SuperSript™ Indirect cDNA Labeling System
Kit (Invitrogen, Carlsbad, CA, USA) as described by the manufacturer’s protocol, except
that the purification steps were carried out using QIAquick® PCR columns (QIAGEN,

146
Hilden, Germany). The quantity and quality of each intermediate product, including total
RNA, dscDNA, aRNA and labeled targets, were evaluated using a Nanodrop ND-1000
spectrophotometer and an Agilent Technologies 2100 Bioanalyzer [386, 387]. Whole-
genome leaf transcript profiling was performed using the maize 46K arrays obtained from
the maize oligonucleotide array project (http://www.maizearray.org/index.shtml).
Transcript abundance in each of the three replicates for V and M leaves at low (N-) and
high (N+) N supply was determined using a mixture of all the samples (12 in total, each
with the same mRNA concentration) as a reference. Hybridizations between the maize
oligonucleotide microarrays and fluorescently labeled samples were performed in
MICROMAX Hybridization Buffer III (Perkin Elmer) using the manufacturer's
hybridization and wash conditions and a GeneTac™ HybStation (Genomic Solutions,
Ann Arbor, NI, USA). Before hybridization, 50 pmol Cy3- and 50 pmol Cy5-labelled
targets were mixed, dried using compressed air, and reconstituted with 115 µl of
hybridization buffer, followed by denaturing at 90°C for 3 min. Each hybridization
mixture was placed on the maize 45K array slides mounted in the hybridization station
and the hybridizations were performed for 3 h at 65°C, followed by 3 h at 55°C, then 12
h at 50°C with gentle agitation. Thereafter, the arrays were automatically washed with the
GeneTac™ washing solutions (Genomic Solutions, Ann Arbor, NI, USA) using the
program for multiple automatic washes, with a flow time of 40 s. Immediately after the
completion of the final washing step, the arrays were removed from the station, briefly
immersed in distilled water and air-dried with ozone-safe dry air. Hybridized microarrays
were scanned using a GenePix 4000B Microarray Scanner (Molecular Devices,
Sunnyvale, CA, USA) at 10-µm resolution and variable photomultiplier (PMT) voltage to
obtain maximal signal intensities with <0.05% probe saturation. Subsequent image
analysis was performed with the GenePix Pro (v6.0.1.26) software. Analysis included
defining the spots, measuring the intensities, flagging spots when inadequate quality
control parameters were found, and evaluating local background. The resulting files,
containing all the scan data, were further processed using the statistical programming
language R (http://www.r-project.org) together with the packages of the MAnGO project
(Version 0.9.7, MicroArray Normalisation tool of GODMAP, CNRS BioInfome Team

147
[http://bioinfome.cgm.cnrs-gif.fr/], [388]). The background level was calculated using
morphological operators (a short closing followed by a large opening) and subtracted.
Raw data were normalized using a global loess method [389]. Gene annotation was
provided by the maize oligonucleotide array project mentioned above
(http://www.maizearray.org/index.shtml).
6.4.5 Statistical Analysis of Maize cDNA Microarray Data
Statistical group comparisons were performed using multiple testing procedures to
evaluate statistical significance for differentially expressed genes. Two gene selection
approaches were applied, including the Significance Analysis of Microarrays
(SAM;[390]) permutation algorithm, and a p-value ranking strategy using both z-
statistics in ArrayStat 1.0 software (Imaging Research Inc.) and moderated t-statistics
using a moderated t-test available in MAnGO tools [http://bioinfome.cgm.cnrs-gif.fr] and
BRBArrayTools v3.2.3 packages [391]. For multiple testing corrections, the false
discovery rate (FDR) procedure was used [392]. Statistical tests were computed and
combined for each probe set using the log-transformed data and a probe set was declared
to be significant when the adjusted p-value was less than the effective α-level (α=0.05) in
at least one of these tests. A filtering procedure additionally excluded those data points
considered biologically unreliable due to low signal intensities (Amean < 7.0).
6.4.6 Total Protein Extraction, Solubilization, and Quantification
A TCA/acetone protein precipitation was performed as described by Méchin et al.
(2007)[393], from the leaves of N+ and N- plants harvested at the V and M stage of
development. The frozen leaf powder was resuspended in acetone with 0.07% (v/v) 2-
mercaptoethanol and 10% (w/v) TCA. Proteins were allowed to precipitate for 1 h at -
20°C. The pellet was then washed overnight with acetone containing 0.07% (v/v) 2-
mercaptoethanol. The supernatant was discarded and the pellet dried under vacuum.
148
Protein resolubilization was performed according to Méchin et al. (2007) using 60 µL/mg
of R2D2 buffer (5 M urea, 2 M thiourea, 2% CHAPS, 2% SB3-10, 20 mM dithiothreitol,
5 mM Tris(2-carboxyethyl)phosphine hydrochloride, 0.75% carrier ampholytes). After
resolubilization, samples were centrifuged and the supernatant was transferred to an
Eppendorf tube prior to protein quantification. Total protein content of each sample was
evaluated using the 2-D Quant kit (Amersham Biosciences).
6.4.7 Two-dimensional Electrophoresis, Gel Staining, and Image Analysis
Solubilized proteins (300 µg) were separated on a pH 4–7 gradient Immobilized pH
Gradient (IPG) strip (Amersham Biosciences) using a Protean Isoelectrofocusing (IEF)
cell (Bio-Rad), as follows: Active rehydration was performed at 20°C for 13 h at 50 V;
then the focusing itself was carried out. For improved sample entry, the voltage was
increased step by step from 50 to 10,000 V (0.5 h at 200 V, 0.5 h at 500 V, 1 h at 1,000
V, then 10,000 V for a total of 84,000 Vh). After IEF, strips were equilibrated to improve
protein transfer to the two-dimensional gel (2-D gel). The second separation was
performed in an 11% SDS–PAGE gel. Separation was carried out at 20 V for 1 h and
subsequently at a maximum of 30 mA/gel and 120 V overnight, until the bromophenol
blue front had reached the end of the gel. After SDS-PAGE, the gels were subsequently
stained with colloidal Coomassie blue. Scanning was carried out at 300 dpi with a 16-bit
greyscale pixel depth using an image scanner (Amersham Biosciences), and then gel
images were analyzed using the Progenesis and SameSpot software packages (Nonlinear
Dynamics Ltd). The SAS package (specifically, the GLM procedure for one way
ANOVA analysis) was used to examine modifications of individual protein spot volumes.
For each protein spot, the mean normalized volume was then computed separately at the
V and M plant developmental stages. A protein spot was selected if its variation had a p-
value < 0.05.

149
6.4.8 Protein Identification by LC-MS/MS
Spot digestion and LC-MS/MS were performed as described by Martin et al., 2006. In-
gel digestion was performed with the Progest system (Genomic Solution). Gel pieces
were washed twice by successive separate baths of 10% acetic acid, 40% ethanol, and
acetonitrile (ACN). The pieces were then washed twice with successive baths of 25 mM
NH4CO3 and ACN. Digestion was subsequently performed for 6 h at 37°C with 125 ng of
modified trypsin (Promega) dissolved in 20% methanol and 20 mM NH4CO3. The
peptides were extracted successively with 2% trifluoroacetic acid (TFA) and 50% ACN
and then with ACN. Peptide extracts were dried in a vacuum centrifuge and suspended in
20 mL of 0.05% TFA, 0.05% formic acid, and 2% ACN. HPLC was performed on an
Ultimate LC system combined with a Famos Autosampler, and a Switchos II
microcolumn switch system (Dionex). Trypsin digestion was declared with one possible
cleavage. Cys carboxyamidomethylation and Met oxidation were set to static and variable
modifications, respectively. A multiple-threshold filter was applied at the peptide level:
Xcorr magnitude were up to 1.7, 2.2, 3.3, and 4.3 for peptides with one, two, three, and
four isotopic charges, respectively; peptide probability lower than 0.05, ΔCn > 0.1 with a
minimum of two different peptides for an identified protein. A database search was
performed with Bioworks 3.3.1 (Thermo Electron). The TIGR maize gene index database
v 16, 72047*6 EST sequences (http://compbio.dfci.harvard.edu/tgi/plant.html) was used.
6.4.9 Metabolite Extraction and Analyses
Lyophilized leaf material was used for metabolite extraction. Approximately 20 mg of
the powder was extracted in 1ml of 80% ethanol/20% distilled water for an hour at 4°C.
During extraction, the samples were continuously agitated and then centrifuged for 5 min
at 15,000 rpm. The supernatant was removed and the pellet was subjected to a further
extraction in 60% ethanol and finally in water at 4°C, as described above. All
supernatants were combined to form the aqueous alcoholic extract.

150
Nitrate was determined by the method of Cataldo et al. (1975) [394]. Total free amino
acids were determined by the Rosen colorimetric method with leucine as a standard
[395]. Chlorophyll was estimated using 10 mg of fresh leaf material [396]. The total N
content of 2 mg of lyophilized material was determined in a N elemental analyzer using
the combustion method of Dumas (Flash 2000, Thermo Scientific, Cergy-Pontoise,
France). Starch content was determined as described by Ferrario-Méry et al. (1998)
[397].
Total lipids were extracted from frozen leaf material according to Miquel and Browse
(1992) [398]. Individual lipids were purified from the extracts by one-dimensional thin
layer chromatography on silica gel 60 [399]. Silica gel 60 plates were from Merck
(Merck-Millipore, Molsheim, France). Lipids were located by spraying the plates with
solution of 0.001% primuline (Sigma, Saint-Quentin Fallavier, France) in 80% acetone,
followed by visualization under ultraviolet light. To determine the fatty acid composition
and relative amounts of individual lipids, the silica gel from each lipid was transferred to
a screw-capped tube with 1 ml of 2.5% (v/v) H2SO4 in methanol and an appropriate
amount of C17:0 fatty acid (Sigma, Saint-Quentin Fallavier, France), as an internal
standard. After heating for 90 minutes at 80°C, 1 ml of hexane and 1.5 ml of 0.9% NaCl2
were added. Fatty acids were extracted in the upper organic phase by shaking and low-
speed centrifugation. Samples (1 µl) of the organic phase were separated by gas
chromatography on a 30-m x 0.53-mm ECTM-WAX column (Alltech Associates Inc.,
Deerfield, USA) and quantified using a flame ionization detector. The gas chromatograph
was programmed for an initial temperature of 160°C for 1 min, followed by an increase
of 20°C min-1 to 190°C and a ramp of 4°C min-1 to 230°C, with a 9 min hold of the final
temperature.
Monosaccharide composition and linkage analysis of polysaccharides were performed on
an alcohol insoluble material prepared as follows. Hundred mg (FW) of grounded leaf
were washed twice in 4 volumes of absolute ethanol for 15 min, then rinsed twice in 4
volumes of acetone at room temperature for 10 min and left to dry under a fume hood

151
overnight at room temperature. Neutral monosaccharide composition was measured on 5
mg of dried alcohol insoluble material after hydrolysis in 2.5 M trifluoroacetic acid for
1.5 h at 100 °C as described by Harholt et al. (2006) [400]. To determine the cellulose
content, the residual pellet obtained after the monosaccharide analysis was rinsed twice
with ten volumes of water and hydrolysed with H2SO4 as described [401]. The released
glucose was diluted 500 times and then quantified using an HPAEC-PAD
chromatography as described by Harholt et al (2006) [402].
For lignin quantification, 100mg (FW) of grounded leaf were washed twice in 4 volumes
of absolute ethanol for 15 min, twice with 4 volumes of water at room temperature then
rinsed twice in 4 volumes of acetone at room temperature for 10 min and left to dry under
a fume hood overnight at room temperature. The following protocol is adapted from
Fukushima and Hatfield (2001) [403]. Lignins from the prepared cell wall residue was
solubilized in 1mL of acetyl bromide solution [acetyl bromide/acetic acid (1/3, V/V)] in a
glass vial at 55°C for 2.5 hours under shaking. Samples were then let to cool down at
room temperature and 1.2 mL of NaOH 2M/Acetic acid (9/50 V/V) was added in the vial.
Hundred µL of this sample was transferred in 300 µL of 0.5M Hydroxylamine
Chlorhydrate and mixed with 1.4 mL of Acetic Acid. The A280 absorbance of the
samples was measured. Lignin content was calculated using the following formula:
%lignin = 100 ! (A280 ! Vreaction ! Vdilution )
20 ! Vsample solution ! msample mg
6.4.10 Metabolome Analysis
All steps were adapted from the original protocol described by Fiehn (2006) [404]. All
extraction steps were performed in 2 ml Safelock Eppendorf tubes. The ground frozen
leaf samples were resuspended in 1 ml of frozen (-20°C) Water:Chloroform:Methanol
(1:1:2.5) and extracted for 10 min at 4°C with shaking at 1400 rpm in an Eppendorf
Thermomixer. Insoluble material was removed by centrifugation and 900 µl of the

152
supernatant were mixed with 20 µl of 200 µg/ml ribitol in methanol. Water (360 µl) was
then added and after mixing and centrifugation, 50 µl of the upper polar phase were
collected and dried for 3h in a Speed-Vac and stored at -80°C. Four blank tubes were
subjected to the same steps as the samples. For derivatization, samples were removed
from -80°C storage, warmed 15 min before opening and Speed-Vac dried for 1 h before
the addition of 10 µl of 20 mg/ml methoxyamine in pyridine. The reactions with the
individual samples, blanks and amino acid standards were performed for 90 min at 28°C
with continuous shaking in an Eppendorf thermomixer. 90 µl of N-methyl-N-
trimethylsilyl-trifluoroacetamide (MSTFA) were then added and the reaction continued
for 30 min at 37°C. After cooling, 50 µl of the reaction mixture were transferred to an
Agilent vial for injection. For the analysis, 3 h and 20 min after derivatization, 1 µl of the
derivatized samples were injected in the Splitless mode onto an Agilent 7890A gas
chromatograph (GC) coupled to an Agilent 5975C mass spectrometer (MS). The column
used was an Rxi-5SilMS from Restek (30 m with 10 m Integra-Guard column). The liner
(Restek # 20994) was changed before each series of analyses and 10 cm of the column
were removed. The oven temperature ramp was 70°C for 7 min, then increased to
10°C/min until 325°C, which was maintained for 4 min. Overall the total run time was
36.5 min. A constant flow of helium was maintained at 1.5231 mL/min. Temperatures in
the GC were the following: injector: 250°C, transfer line: 290°C, source: 250°C and
quadripole 150°C. Samples and blanks were randomized. Amino acid standards were
injected at the beginning and end of the analyses for monitoring of the derivatization
stability. An alkane mix (C10, C12, C15, C19, C22, C28, C32, C36) was injected in the
middle of the analyses for external RI calibration. Five scans per second were acquired.
For data processing, Raw Agilent data files were converted into the NetCDF format and
analyzed with AMDIS http://chemdata.nist.gov/mass-spc/amdis/. A home retention
indices/mass spectra library built from the NIST, Golm, and Fiehn databases and standard
compounds, was used for metabolite identification. Peak areas were then determined
using the quanlynx software (Waters) after conversion of the NetCDF file into the
masslynx format. Statistical analyses were carried out with TMEV
http://www.tm4.org/mev.html. Univariate analyses by permutation (1-way ANOVA and

153
2-way ANOVA) were first used to select the metabolites exhibiting significant changes in
their concentration. An order of magnitude for metabolite concentration on a fresh weight
basis was calculated by a one point external calibration comparatively to a set of
standards.
6.4.11 Model Development and Curation
Figure 6-4 outlines the workflow used for model development. Our previously developed
maize model, iRS1563 [334] and biological databases such as MetaCrop (downloaded in
December 2012) [333] and MaizeCyc (version 2.0.2) [332] provided information
pertaining to the genes, proteins, reactions, and metabolites used to reconstruct the
second-generation maize leaf genome-scale model. In addition, available proteomic and
transcriptomic data, maize-specific biological databases, namely Metacrop and Maizecyc
and published literature were used to assign cellular (i.e., bundle-sheath or mesophyll)
and intra-cellular organelle specificity to the curated reactions.
When the gene expression level is reported in reads per kilobase per million mapped
reads (RPKM) [363, 364] the cell specificity of any gene i can be calculated as:
Here, mi and bi are the RPKM abundance of gene i in the mesophyll and bundle sheath
cells, respectively [364]. A gene that is only expressed in one cell type will have a Ri of 1,
while a gene that is equally expressed in both cell types will have a Ri of 0. As suggested
by Chang et al., a threshold of 0.8 or a 5-fold abundance difference is adopted to assign
gene cell type specificity. In the absence of RPKM information, an adjusted spectral
count (adjSPC) along with the fold change difference between the mesophyll and bundle
sheath cells was used to determine gene cell type specificity [362]. adjSPC is the number
of mass spectra identified for a protein normalized by the number of unique spectral
counts. Since low counts are not statistically informative, a cutoff of 10 was used for
adjSPC [405, 406]. Similar to the threshold used for RPKM data, a 5-fold difference
Ri=mi-bi
max mi, bi

154
between the mesophyll and bundle sheath cell type normalized spectral abundance factor
(nSAF) was used to determine cellular specificity of any gene [362]. nSAF is a weighted
adjSPC based on the number of theoretical tryptic peptides with a relevant length [362,
407]. Additional intracellular compartmentalization was carried out based on the
MetaCrop database [333], MaizeCyc database [332], and primary literature sources [364,
408].
Figure 6-4: Model development and curation schematic.
The workflow for the second-generation genome-scale metabolic model of the maize leaf
is displayed. The data sources give three types of retrieved data (i.e. the raw reaction
data, reaction directionality, and compartmentalization) that are then manipulated as
shown to create the final model.

155
The intracellular compartmentalization was determined based first on the MetaCrop
database [333], literature sources [362, 364], compartmentalization information in the
MaizeCyc database, and finally the Plant Proteome DataBase (PPDB) [290]. An original
set of intercellular and intracellular transporters was determined based on literature
evidence [362, 409-417]. In the subsequent standardization step, the MetRxn
knowledgebase [1] as well as manual curation was used to standardize the description of
metabolites and reactions such as fixing stoichiometric errors (i.e., elemental or charge
imbalances) and incomplete atomistic detail (e.g. absence of stereo-specificity, and
presence of R-group(s)). Reactions and metabolites were given KEGG identifiers where
available or were otherwise given new identifiers (in the form of MR or MC,
respectively). Reaction directionality was adopted from the manually curated MetaCrop
database, as available, and from the MaizeCyc database for the remaining reactions.
In the next step of model development, all reactions (including metabolic, intra- and
extra-cellular transport reactions) were divided into two categories based on the evidence
of their inter- and intra-cellular compartmental specificity. The core set contains all
metabolic reactions with experimental or literature-backed evidence of intracellular or
intercellular compartmentalization, as well as known intracellular and intercellular
transporters. The non-core set contains reactions with partial or completely absent
localization information. Barring any conflicting evidence, these reactions were
provisionally placed in all compartments. An optimization formulation (as shown below)
was developed by imposing flow though the maximal number of core reactions while
including minimal intra- and inter-cellular transporters and minimal participation of non-
core reactions in various compartments. A parsimony criterion was used to apportion
non-core functions so as core functions could be restored. Furthermore, in order to restore
a core function the resolution strategy was prioritized in the following order: (i) apportion
non-core reaction(s) in one/multiple compartment(s), (ii) add intra-cellular transporter(s)
and (iii) add inter-cellular transporter(s). To this end, an objective function was
formulated by taking the weighted sum of number of non-core reactions, intra- and inter-

156
cellular transporters by providing weights of 1, 104 and 106, respectively for these three
groups of reactions. However, it is important to ensure that any resolution strategy does
not cause thermodynamically infeasible cycles. Therefore, each of these solutions was
further checked and only those that do not form such cycles were accepted. This
approach is analogous to the one proposed by Mintz-Oron et al. (2012) [418] but does not
rely on a complicated scoring system. It is also computationally less taxing as it activates
one core reaction at a time. Furthermore, in contrast to the Mintz-Oron et al. approach,
the method proposed here allows for the minimal number of transporters added, rather
than potentially minimizing the flux through many transporters.
In order to allow flux through all reactions in the core set C={1,…,c} we minimize the
addition of reactions from the non-core set NC={c+1,…,g}, intracellular transporter set
T={g+1,…,t}, and intercellular transporter set IC={t+1,…,m}. This encompasses an
overall set of reactions M={1,…,m} and a set of metabolites N={1,…,n}. In addition,
binary variable yj is defined as:
The task of identifying the minimal set of additional reactions that enable flux through a
core reaction j* is posed as the following mixed integer linear programming problem.
Subject to:
Here, Sij is the stoichiometric coefficient of metabolite i in reaction j and vj is the flux
value of reaction j. Parameters vj,min and vj,max denote the minimum and maximum
!! = !"#$"%&'"(')*%#+,"#-")..'."%+"%&'"/+.'0"$(+/"123"43"+("42"-'%-""""""""""""!!"#$%&'()*&"""""""""""""""""""""""""""""""""""""""""""""""""""""""""""""""""""""""""""""""""""""""!!!!!!!!!!!!!!!!
Minimize c1
yj j!NC
" + c2 yj j!I
" + c3 yj j!IC
" #j ! C (1)
Sijvj = 0 ! i " 1,....., nj=1
m
# (2)
vj* $ ! ! j " C (3)
vj,max
$ vj $ v
j,min ! j " C (4)
vj,max
yj $ v
j $ v
j,minyj ! j " NC or T or I or IC (5)

157
allowable fluxes for reaction j, respectively. vj* represents the core reaction flux that is
currently being unblocked and ε is a small value to ensure a threshold amount of flux
through each core reaction. c1, c2, and c3 represent weights associated with each set of
reactions (i.e., non-core set, intracellular transporters set, and intercellular transporters
set, respectively). In this formulation, the objective function (1) minimizes the number of
added reactions (from three reaction sets as mentioned earlier) so as to restore flux flow
through reaction j*. We chose values of 1, 104, and 106 for c1, c2, and c3, respectively, so
metabolic reactions without experimental or literature evidence for compartmental
specificity are added to specific compartment(s) before including additional transport
reactions with no literature evidence. Constraint set (2) represents the pseudo-steady state
assumption, while constraint (3) determines the threshold amount of flux necessary
through j*. Bounds on core reaction fluxes are imposed by constraint set (4), while
constraint set (5) ensures that only reactions from those three sets having non-zero flow
are added to the model. This algorithm is repeated for each core reaction j* to ensure flux
and, hence, provides compartmentalization assignments for 431 metabolic reactions by
assigning them to at least one compartment, adding 1,032 total metabolic reactions to the
model as shown in Table 6-1.
The reactions identified by the above-mentioned algorithm plus the reactions from the
core set constituted two new sets, a set of reactions with resolved compartmental
information and a set whose location still needs resolution as shown in Figure 6-4.
Reactions from the latter set that are known to occur within the maize leaf tissue, but
were not in the initial model were added to intra/inter-cellular compartments manually
based on pathway localization or simply added to cytosol of bundle sheath and/or
mesophyll cells. Thermodynamically infeasible cycles were resolved _ENREF_51by
changing the minimum number of reaction directionalities as possible and eliminating the
smallest number of reactions from the model [419] while conserving biomass formation.
An optimization procedure was iteratively run for each reaction in a thermodynamically
infeasible cycle to determine the minimum number of directionality changes or removal
of reactions required to fix the cycle. These results were then compared for each reaction

158
to determine the changes that resolve the largest number of reactions participating in
thermodynamically infeasible cycles. The solutions found were manually inspected
before the changes were applied to the model. The application of this optimization
procedure led to restricting the directionality for 507 reactions that prevented 889
reactions from carrying unbounded fluxes thus eliminating the corresponding
thermodynamically infeasible cycles.
In the final step, as shown in Figure 6-4, the GapFind/GapFill [295] procedure was
applied to identify blocked/dead-end metabolites and subsequently restore their
connectivity. A gapfilling database of reactions was created by combining reactions from
phylogenetically close/model plant species (i.e. Orzya sativa japonica, Brachypodium
distachyon, Sorghum bicolor, and Arabidopsis thaliana), non-core reactions without
compartmental specificity (not identified by our aforementioned algorithm), and all
possible intra/inter-cellular transporters. The gapfilling procedure was modified by
prioritizing the addition of reactions from closely related/model plant species or non-core
reactions over transporters to unblock the flow through metabolites while ensuring no
new thermodynamically infeasible cycles are created. After completing this step, we
added 5 reactions from closely related/model plant species, changed the directionality of
14 reactions and added 8 intracellular transporters.
6.4.12 Incorporation of Transcriptomic, Proteomic and Metabolomic Data
Significantly different gene transcripts and proteins were incorporated into the model by
switching off corresponding reactions under a uniform WT condition, a limited N
condition [377], gln1-3 mutant, and gln1-4 mutant [335] cases. The number of proteins,
gene transcripts, and metabolites with abundances that are statistically differentially
expressed in the various conditions are listed in Table 6-2. Reactions with GPRs
associated with significantly lowered transcriptomic and proteomic expression are
switched off under the corresponding conditions. Metabolite turnover rates were
determined based on the flux-sum analysis method [366] and compared to the

159
metabolomic data. A minimum biomass level of 90% of optimal biomass under the N-
WT condition was used in all conditions. The flux-sum or the flow through each
metabolite with experimental measurements was maximized as follows:
Subject to
Here set E represents the set of metabolites with experimental measurements and set LE
represents reactions with statistically lower expression of gene transcripts and/or proteins.
The formulation was run for each individual condition ensuring the proper nutrients and
simulated knockouts were considered. By linearizing the objective function the resulting
formulation is a mixed integer linear programming problem similar to the description by
Chung and Lee [366]. Therefore, the basic idea is to maximize the flux-sum of a
metabolite (for which metabolomic data is available) under a given condition by
switching off reaction fluxes corresponding to gene transcripts and/or proteins with lower
expression levels. The flux-sum levels in the N- WT, gln1-3 mutant, and gln1-4 mutant
condition were compared to the reference N+ WT condition to find the qualitative trend in
the change of metabolite pool size between the conditions.
The WT condition for each study was combined to create one uniform WT condition.
The number of gene transcripts, proteins, and metabolites that statistically vary are
displayed below.
Maximize 0.5 Sijvj ! i " E i
# (6)
Sijvj = 0 ! i " 1,....., nj=1
m
# (2)
vj ,max $ vj $ vj ,min ! j " 1,....., m (4)
vj = 0 ! j " LE (7)

160
Flux variability analysis (FVA) was used to determine the flux range of each reaction
under maximum biomass by subsequently maximizing and minimizing the flux through
each reaction. The flux range of each reaction for the N- WT, gln1-3 mutant, and gln1-4
mutant conditions were compared to the reference N+ WT condition. Flux ranges that do
not overlap between one of the N background conditions and the reference condition
were further analyzed. These are reactions that must change in response to the limited
amount of nitrogen or the mutant conditions. Finally, for each condition, the minimum
number of reactions which, when not regulated, will restore the biomass to the yield
obtained when no “omics” based regulation is applied were determined. This was done
by identifying the minimal set of reactions, which are included in the “omics” based
regulation, that when active would allow for a biomass yield equivalent to the yield under
no “omics” based regulation. This set of reactions represent the reactions whose
restriction affects the biomass yield.
The CPLEX solver (version 12.3 IBM ILOG) is used in the GAMS (version 23.3.3,
GAMS Development Corporation) environment to solve the optimization problems. The
Python programming language is also used during model development (mainly for
scripting and data analysis). All computations are carried out on Intel Xeon X5675 Six-
Core 3.06 GHz processors constituting the lionxf cluster, which was built and operated
by the Research Computing and Cyberinfrastructure Group of The Pennsylvania State
University.
!
Type Of Data WT
Condition
N-
Condition
gln1-3
Mutant
gln1-4
Mutant
Transcriptomic 256 76 102 53
Proteomic 38 14 29 -
Metabolomic 83 20 31 13
Table 6-2: Number of gene transcripts, proteins, and metabolites that significantly vary.

161
References
1. Kumar A, Suthers PF, Maranas CD: MetRxn: a knowledgebase of metabolites
and reactions spanning metabolic models and databases. BMC bioinformatics 2012, 13:6.
2. Saha R, Suthers PF, Maranas CD: Zea mays iRS1563: a comprehensive genome-scale metabolic reconstruction of maize metabolism. PloS one 2011, 6(7):e21784.
3. Saha R, Verseput AT, Berla BM, Mueller TJ, Pakrasi HB, Maranas CD: Reconstruction and comparison of the metabolic potential of cyanobacteria Cyanothece sp. ATCC 51142 and Synechocystis sp. PCC 6803. PloS one 2012, 7(10):e48285.
4. Kim TY, Sohn SB, Kim YB, Kim WJ, Lee SY: Recent advances in reconstruction and applications of genome-scale metabolic models. Current opinion in biotechnology 2012, 23(4):617-623.
5. Pitkanen E, Rousu J, Ukkonen E: Computational methods for metabolic reconstruction. Current opinion in biotechnology 2010, 21(1):70-77.
6. Esvelt KM, Wang HH: Genome-scale engineering for systems and synthetic biology. Mol Syst Biol 2013, 9:641.
7. Ranganathan S, Suthers PF, Maranas CD: OptForce: an optimization procedure for identifying all genetic manipulations leading to targeted overproductions. PLoS Comput Biol 2010, 6(4):e1000744.
8. Thiele I, Palsson BO: A protocol for generating a high-quality genome-scale metabolic reconstruction. Nature protocols 2010, 5(1):93-121.
9. Blazier AS, Papin JA: Integration of expression data in genome-scale metabolic network reconstructions. Frontiers in physiology 2012, 3:299.
10. Reed JL: Shrinking the Metabolic Solution Space Using Experimental Datasets. PLoS computational biology 2012, 8(8).
11. Kim HU, Kim SY, Jeong H, Kim TY, Kim JJ, Choy HE, Yi KY, Rhee JH, Lee SY: Integrative genome-scale metabolic analysis of Vibrio vulnificus for drug targeting and discovery. Mol Syst Biol 2011, 7:460.
12. Lerman JA, Hyduke DR, Latif H, Portnoy VA, Lewis NE, Orth JD, Schrimpe-Rutledge AC, Smith RD, Adkins JN, Zengler K et al: In silico method for modelling metabolism and gene product expression at genome scale. Nat Commun 2012, 3.
13. Karr JR, Sanghvi JC, Macklin DN, Gutschow MV, Jacobs JM, Bolival B, Assad-Garcia N, Glass JI, Covert MW: A Whole-Cell Computational Model Predicts Phenotype from Genotype. Cell 2012, 150(2):389-401.
14. Jerby L, Shlomi T, Ruppin E: Computational reconstruction of tissue-specific metabolic models: application to human liver metabolism. Molecular Systems Biology 2010, 6.
15. Thiele I, Swainston N, Fleming RM, Hoppe A, Sahoo S, Aurich MK, Haraldsdottir H, Mo ML, Rolfsson O, Stobbe MD et al: A community-driven

162
global reconstruction of human metabolism. Nature biotechnology 2013, 31(5):419-425.
16. Grafahrend-Belau E, Junker A, Eschenroder A, Muller J, Schreiber F, Junker BH: Multiscale metabolic modeling: dynamic flux balance analysis on a whole-plant scale. Plant physiology 2013, 163(2):637-647.
17. Pagani I, Liolios K, Jansson J, Chen IMA, Smirnova T, Nosrat B, Markowitz VM, Kyrpides NC: The Genomes OnLine Database (GOLD) v.4: status of genomic and metagenomic projects and their associated metadata. Nucleic acids research 2012, 40(D1):D571-D579.
18. Zhou T: Computational reconstruction of metabolic networks from KEGG. Methods Mol Biol 2013, 930:235-249.
19. Chen N, del Val IJ, Kyriakopoulos S, Polizzi KM, Kontoravdi C: Metabolic network reconstruction: advances in in silico interpretation of analytical information. Current opinion in biotechnology 2012, 23(1):77-82.
20. Zomorrodi AR, Suthers PF, Ranganathan S, Maranas CD: Mathematical optimization applications in metabolic networks. Metabolic engineering 2012, 14(6):672-686.
21. Hieno A, Naznin HA, Hyakumachi M, Sakurai T, Tokizawa M, Koyama H, Sato N, Nishiyama T, Hasebe M, Zimmer AD et al: ppdb: plant promoter database version 3.0. Nucleic Acids Res 2013.
22. Tanz SK, Castleden I, Hooper CM, Vacher M, Small I, Millar HA: SUBA3: a database for integrating experimentation and prediction to define the SUBcellular location of proteins in Arabidopsis. Nucleic Acids Res 2013, 41(Database issue):D1185-1191.
23. Mintz-Oron S, Aharoni A, Ruppin E, Shlomi T: Network-based prediction of metabolic enzymes' subcellular localization. Bioinformatics 2009, 25(12):i247-252.
24. Salgado H, Peralta-Gil M, Gama-Castro S, Santos-Zavaleta A, Muniz-Rascado L, Garcia-Sotelo JS, Weiss V, Solano-Lira H, Martinez-Flores I, Medina-Rivera A et al: RegulonDB v8.0: omics data sets, evolutionary conservation, regulatory phrases, cross-validated gold standards and more. Nucleic Acids Res 2013, 41(Database issue):D203-213.
25. Yilmaz A, Nishiyama MY, Jr., Fuentes BG, Souza GM, Janies D, Gray J, Grotewold E: GRASSIUS: a platform for comparative regulatory genomics across the grasses. Plant physiology 2009, 149(1):171-180.
26. Wittig U, Kania R, Golebiewski M, Rey M, Shi L, Jong L, Algaa E, Weidemann A, Sauer-Danzwith H, Mir S et al: SABIO-RK--database for biochemical reaction kinetics. Nucleic Acids Res 2012, 40(Database issue):D790-796.
27. Keseler IM, Mackie A, Peralta-Gil M, Santos-Zavaleta A, Gama-Castro S, Bonavides-Martinez C, Fulcher C, Huerta AM, Kothari A, Krummenacker M et al: EcoCyc: fusing model organism databases with systems biology. Nucleic Acids Res 2013, 41(Database issue):D605-612.
28. Schomburg I, Chang A, Placzek S, Sohngen C, Rother M, Lang M, Munaretto C, Ulas S, Stelzer M, Grote A et al: BRENDA in 2013: integrated reactions, kinetic data, enzyme function data, improved disease classification: new

163
options and contents in BRENDA. Nucleic acids research 2013, 41(D1):D764-D772.
29. Devoid S, Overbeek R, DeJongh M, Vonstein V, Best AA, Henry C: Automated genome annotation and metabolic model reconstruction in the SEED and Model SEED. Methods Mol Biol 2013, 985:17-45.
30. Avila-Campillo I, Drew K, Lin J, Reiss DJ, Bonneau R: BioNetBuilder: automatic integration of biological networks. Bioinformatics 2007, 23(3):392-393.
31. Pitkanen E, Akerlund A, Rantanen A, Jouhten P, Ukkonen E: ReMatch: a web-based tool to construct, store and share stoichiometric metabolic models with carbon maps for metabolic flux analysis. Journal of integrative bioinformatics 2008, 5(2).
32. Dale JM, Popescu L, Karp PD: Machine learning methods for metabolic pathway prediction. BMC bioinformatics 2010, 11.
33. Reyes R, Gamermann D, Montagud A, Fuente D, Triana J, Urchueguia JF, de Cordoba PF: Automation on the generation of genome-scale metabolic models. Journal of computational biology : a journal of computational molecular cell biology 2012, 19(12):1295-1306.
34. Agren R, Liu LM, Shoaie S, Vongsangnak W, Nookaew I, Nielsen J: The RAVEN Toolbox and Its Use for Generating a Genome-scale Metabolic Model for Penicillium chrysogenum. PLoS computational biology 2013, 9(3).
35. Feng X, Xu Y, Chen Y, Tang YJ: MicrobesFlux: a web platform for drafting metabolic models from the KEGG database. BMC Syst Biol 2012, 6:94.
36. Suthers PF, Dasika MS, Kumar VS, Denisov G, Glass JI, Maranas CD: A genome-scale metabolic reconstruction of Mycoplasma genitalium, iPS189. PLoS Comput Biol 2009, 5(2):e1000285.
37. Mueller TJ, Berla BM, Pakrasi HB, Maranas CD: Rapid construction of metabolic models for a family of Cyanobacteria using a multiple source annotation workflow. BMC Syst Biol 2013, 7:142.
38. Schellenberger J, Lewis NE, Palsson BO: Elimination of thermodynamically infeasible loops in steady-state metabolic models. Biophys J 2011, 100(3):544-553.
39. Satish Kumar V, Dasika MS, Maranas CD: Optimization based automated curation of metabolic reconstructions. BMC Bioinformatics 2007, 8:212.
40. Zomorrodi AR, Maranas CD: Improving the iMM904 S. cerevisiae metabolic model using essentiality and synthetic lethality data. BMC Systems Biology 2010, 4.
41. Kumar VS, Maranas CD: GrowMatch: an automated method for reconciling in silico/in vivo growth predictions. PLoS Comput Biol 2009, 5(3):e1000308.
42. Soh KC, Miskovic L, Hatzimanikatis V: From network models to network responses: integration of thermodynamic and kinetic properties of yeast genome-scale metabolic networks. FEMS yeast research 2012, 12:129-143.
43. Soh KC, Hatzimanikatis V: Network thermodynamics in the post-genomic era. Current opinion in microbiology 2010, 13:350-357.

164
44. Jankowski M, Henry C: Group Contribution Method for Thermodynamic Analysis of Complex Metabolic Networks. Biophysical journal 2008.
45. Noor E, Bar-Even A, Flamholz A, Lubling Y, Davidi D, Milo R: An integrated open framework for thermodynamics of reactions that combines accuracy and coverage. Bioinformatics (Oxford, England) 2012, 28:2037-2044.
46. Hamilton JJ, Dwivedi V, Reed JL: Quantitative assessment of thermodynamic constraints on the solution space of genome-scale metabolic models. Biophysical journal 2013, 105:512-522.
47. Feist AM, Henry CS, Reed JL, Krummenacker M, Joyce AR, Karp PD, Broadbelt LJ, Hatzimanikatis V, Palsson BO: A genome-scale metabolic reconstruction for Escherichia coli K-12 MG1655 that accounts for 1260 ORFs and thermodynamic information. Molecular Systems Biology 2007, 3.
48. Wiechert W: 13C metabolic flux analysis. Metabolic engineering 2001, 3(3):195-206.
49. Antoniewicz MR, Kelleher JK, Stephanopoulos G: Elementary metabolite units (EMU): a novel framework for modeling isotopic distributions. Metabolic engineering 2007, 9(1):68-86.
50. Weitzel M, Noh K, Dalman T, Niedenfuhr S, Stute B, Wiechert W: 13CFLUX2--high-performance software suite for (13)C-metabolic flux analysis. Bioinformatics 2013, 29(1):143-145.
51. Nargund S, Sriram G: Mathematical modeling of isotope labeling experiments for metabolic flux analysis. Methods Mol Biol 2014, 1083:109-131.
52. Blum T, Kohlbacher O: MetaRoute: fast search for relevant metabolic routes for interactive network navigation and visualization. Bioinformatics 2008, 24(18):2108-2109.
53. Kanehisa M, Goto S, Hattori M, Aoki-Kinoshita KF, Itoh M, Kawashima S, Katayama T, Araki M, Hirakawa M: From genomics to chemical genomics: new developments in KEGG. Nucleic Acids Res 2006, 34(Database issue):D354-357.
54. Ravikirthi P, Suthers PF, Maranas CD: Construction of an E. Coli genome-scale atom mapping model for MFA calculations. Biotechnol Bioeng 2011, 108(6):1372-1382.
55. Latendresse M, Malerich JP, Travers M, Karp PD: Accurate atom-mapping computation for biochemical reactions. Journal of chemical information and modeling 2012, 52(11):2970-2982.
56. Antoniewicz MR: (13)C metabolic flux analysis: optimal design of isotopic labeling experiments. Current opinion in biotechnology 2013, 24(6):1116-1121.
57. Leighty RW, Antoniewicz MR: COMPLETE-MFA: Complementary parallel labeling experiments technique for metabolic flux analysis. Metabolic engineering 2013, 20:49-55.
58. Crown SB, Antoniewicz MR: Publishing (13)C metabolic flux analysis studies: A review and future perspectives. Metabolic engineering 2013, 20:42-48.
59. Leighty RW, Antoniewicz MR: Parallel labeling experiments with [U-13C]glucose validate E. coli metabolic network model for 13C metabolic flux analysis. Metabolic engineering 2012, 14(5):533-541.

165
60. Suthers PF, Chang YJ, Maranas CD: Improved computational performance of MFA using elementary metabolite units and flux coupling. Metabolic engineering 2010, 12(2):123-128.
61. Pey J, Rubio A, Theodoropoulos C, Cascante M, Planes FJ: Integrating tracer-based metabolomics data and metabolic fluxes in a linear fashion via Elementary Carbon Modes. Metabolic engineering 2012, 14(4):344-353.
62. Hyduke DR, Lewis NE, Palsson BO: Analysis of omics data with genome-scale models of metabolism. Molecular bioSystems 2013, 9(2):167-174.
63. Schmidt BJ, Ebrahim A, Metz TO, Adkins JN, Palsson BO, Hyduke DR: GIM3E: condition-specific models of cellular metabolism developed from metabolomics and expression data. Bioinformatics 2013, 29(22):2900-2908.
64. Lee D, Smallbone K, Dunn WB, Murabito E, Winder CL, Kell DB, Mendes P, Swainston N: Improving metabolic flux predictions using absolute gene expression data. BMC Syst Biol 2012, 6:73.
65. Hoppe A: What mRNA Abundances Can Tell us about Metabolism. Metabolites 2012, 2:614-631.
66. Covert MW, Xiao N, Chen TJ, Karr JR: Integrating metabolic, transcriptional regulatory and signal transduction models in Escherichia coli. Bioinformatics 2008, 24(18):2044-2050.
67. Berestovsky N, Zhou W, Nagrath D, Nakhleh L: Modeling integrated cellular machinery using hybrid Petri-Boolean networks. PLoS computational biology 2013, 9(11):e1003306.
68. Wang YC, Chen BS: Integrated cellular network of transcription regulations and protein-protein interactions. BMC Syst Biol 2010, 4:20.
69. Fisher CP, Plant NJ, Moore JB, Kierzek AM: QSSPN: dynamic simulation of molecular interaction networks describing gene regulation, signalling and whole-cell metabolism in human cells. Bioinformatics 2013, 29(24):3181-3190.
70. O'Brien EJ, Lerman JA, Chang RL, Hyduke DR, Palsson BO: Genome-scale models of metabolism and gene expression extend and refine growth phenotype prediction. Mol Syst Biol 2013, 9:693.
71. Cotten C, Reed JL: Mechanistic analysis of multi-omics datasets to generate kinetic parameters for constraint-based metabolic models. BMC bioinformatics 2013, 14:32.
72. Ishii N, Nakahigashi K, Baba T, Robert M, Soga T, Kanai A, Hirasawa T, Naba M, Hirai K, Hoque A et al: Multiple high-throughput analyses monitor the response of E. coli to perturbations. Science 2007, 316(5824):593-597.
73. Chassagnole C, Noisommit-Rizzi N, Schmid JW, Mauch K, Reuss M: Dynamic modeling of the central carbon metabolism of Escherichia coli. Biotechnol Bioeng 2002, 79(1):53-73.
74. Vital-Lopez FG, Wallqvist A, Reifman J: Bridging the gap between gene expression and metabolic phenotype via kinetic models. BMC Syst Biol 2013, 7:63.
75. Zomorrodi AR, Lafontaine Rivera JG, Liao JC, Maranas CD: Optimization-driven identification of genetic perturbations accelerates the convergence of

166
model parameters in ensemble modeling of metabolic networks. Biotechnol J 2013, 8(9):1090-1104.
76. Jamshidi N, Palsson BØ: Mass action stoichiometric simulation models: incorporating kinetics and regulation into stoichiometric models. Biophysical journal 2010, 98:175-185.
77. Smallbone K, Mendes P: Large-scale metabolic models: from reconstruction to differential equations. Industrial Biotechnology 2013, 9(4):179-184.
78. Tamagnini P, Axelsson R, Lindberg P, Oxelfelt F, Wunschiers R, Lindblad P: Hydrogenases and hydrogen metabolism of cyanobacteria. Microbiol Mol Biol Rev 2002, 66(1):1-20, table of contents.
79. Schopf J: The Fossil Record: Tracing the Roots of the Cyanobacterial Lineage. In: The ecology of cyanobacteria. Edited by B. W, Dordrecht PM: Kluwer Academic Publishers; 2000: 13-35.
80. Moisander PH, Beinart RA, Hewson I, White AE, Johnson KS, Carlson CA, Montoya JP, Zehr JP: Unicellular cyanobacterial distributions broaden the oceanic N2 fixation domain. Science, 327(5972):1512-1514.
81. Bryant DA, Frigaard NU: Prokaryotic photosynthesis and phototrophy illuminated. Trends Microbiol 2006, 14(11):488-496.
82. Popa R, Weber PK, Pett-Ridge J, Finzi JA, Fallon SJ, Hutcheon ID, Nealson KH, Capone DG: Carbon and nitrogen fixation and metabolite exchange in and between individual cells of Anabaena oscillarioides. Isme Journal 2007, 1(4):354-360.
83. Ducat DC, Way JC, Silver PA: Engineering cyanobacteria to generate high-value products. Trends Biotechnol, 29(2):95-103.
84. Savage DF, Way J, Silver PA: Defossiling fuel: How synthetic biology can transform biofuel production. Acs Chemical Biology 2008, 3(1):13-16.
85. Dismukes GC, Carrieri D, Bennette N, Ananyev GM, Posewitz MC: Aquatic phototrophs: efficient alternatives to land-based crops for biofuels. Current Opinion in Biotechnology 2008, 19(3):235-240.
86. Welsh EA, Liberton M, Stockel J, Loh T, Elvitigala T, Wang C, Wollam A, Fulton RS, Clifton SW, Jacobs JM et al: The genome of Cyanothece 51142, a unicellular diazotrophic cyanobacterium important in the marine nitrogen cycle. Proc Natl Acad Sci U S A 2008, 105(39):15094-15099.
87. Zehr JP, Church, M.J., and Moisander, P.H. : Diversity, distribution and biogeochemical significance of nitrogen-fixing microorganisms in anoxic and suboxic ocean environments. In: NATO Series book on past and present water column anoxia. Springer; 2005: 337-369.
88. Kaneko T, Sato S, Kotani H, Tanaka A, Asamizu E, Nakamura Y, Miyajima N, Hirosawa M, Sugiura M, Sasamoto S et al: Sequence analysis of the genome of the unicellular cyanobacterium Synechocystis sp. strain PCC6803. II. Sequence determination of the entire genome and assignment of potential protein-coding regions. DNA Res 1996, 3(3):109-136.
89. Knoop H, Zilliges Y, Lockau W, Steuer R: The Metabolic Network of Synechocystis sp. PCC 6803: Systemic Properties of Autotrophic Growth. Plant Physiology 2010, 154(1):410-422.

167
90. Lindberg P, Park S, Melis A: Engineering a platform for photosynthetic isoprene production in cyanobacteria, using Synechocystis as the model organism. Metabolic Engineering 2010, 12(1):70-79.
91. Wu GF, Shen ZY, Wu QY: Possibility to improve the cyanobacterial poly-beta-hydroxybutyrate biosynthesis level. Journal of Chemical Engineering of Japan 2001, 34(9):1187-1190.
92. Liu XY, Curtiss R: Nickel-inducible lysis system in Synechocystis sp PCC 6803. Proceedings of the National Academy of Sciences of the United States of America 2009, 106(51):21550-21554.
93. Navarro E, Montagud A, de Cordoba PF, Urchueguia JF: Metabolic flux analysis of the hydrogen production potential in Synechocystis sp PCC6803. International Journal of Hydrogen Energy 2009, 34(21):8828-8838.
94. McHugh K: Hydrogen production methods. Virginia: MPR Associates, Inc; 2005.
95. Turner J, Sverdrup G, Mann MK, Maness PC, Kroposki B, Ghirardi M, Evans RJ, Blake D: Renewable hydrogen production. International Journal of Energy Research 2008, 32(5):379-407.
96. Bandyopadhyay A, Stockel J, Min H, Sherman LA, Pakrasi HB: High rates of photobiological H2 production by a cyanobacterium under aerobic conditions. Nat Commun 2010, 1:139.
97. Min H, Sherman LA: Hydrogen production by the unicellular, diazotrophic cyanobacterium Cyanothece sp. strain ATCC 51142 under conditions of continuous light. Appl Environ Microbiol 2010, 76(13):4293-4301.
98. Schirmer A, Rude MA, Li XZ, Popova E, del Cardayre SB: Microbial Biosynthesis of Alkanes. Science 2010, 329(5991):559-562.
99. Wu B, Zhang BC, Feng XY, Rubens JR, Huang R, Hicks LM, Pakrasi HB, Tang YJJ: Alternative isoleucine synthesis pathway in cyanobacterial species. Microbiology-Sgm 2010, 156:596-602.
100. Reed JL, Patel TR, Chen KH, Joyce AR, Applebee MK, Herring CD, Bui OT, Knight EM, Fong SS, Palsson BO: Systems approach to refining genome annotation. Proc Natl Acad Sci U S A 2006, 103(46):17480-17484.
101. Puchalka J, Oberhardt MA, Godinho M, Bielecka A, Regenhardt D, Timmis KN, Papin JA, Martins dos Santos VA: Genome-scale reconstruction and analysis of the Pseudomonas putida KT2440 metabolic network facilitates applications in biotechnology. PLoS Comput Biol 2008, 4(10):e1000210.
102. Vu TT, Stolyar SM, Pinchuk GE, Hill EA, Kucek LA, Brown RN, Lipton MS, Osterman A, Fredrickson JK, Konopka AE et al: Genome-scale modeling of light-driven reductant partitioning and carbon fluxes in diazotrophic unicellular cyanobacterium Cyanothece sp. ATCC 51142. PLoS Comput Biol 2012, 8(4):e1002460.
103. Hong SJ, Lee CG: Evaluation of central metabolism based on a genomic database of Synechocystis PCC6803. Biotechnology and Bioprocess Engineering 2007, 12(2):165-173.
104. Shastri AA, Morgan JA: Flux balance analysis of photoautotrophic metabolism. Biotechnology Progress 2005, 21(6):1617-1626.
168
105. Yang C, Hua Q, Shimizu K: Metabolic flux analysis in Synechocystis using isotope distribution from 13C-labeled glucose. Metabolic engineering 2002, 4(3):202-216.
106. Fu PC: Genome-scale modeling of Synechocystis sp PCC 6803 and prediction of pathway insertion. Journal of Chemical Technology and Biotechnology 2009, 84(4):473-483.
107. Montagud A, Navarro E, de Cordoba PF, Urchueguia JF, Patil KR: Reconstruction and analysis of genome-scale metabolic model of a photosynthetic bacterium. Bmc Systems Biology 2010, 4:-.
108. Montagud A, Zelezniak A, Navarro E, de Cordoba P, Urchueguia JF, Patil KR: Flux coupling and transcriptional regulation within the metabolic network of the photosynthetic bacterium Synechocystis sp PCC6803. Biotechnology Journal 2011, 6(3):330-342.
109. Nogales J, Gudmundsson S, Knight EM, Palsson BO, Thiele I: Detailing the optimality of photosynthesis in cyanobacteria through systems biology analysis. Proc Natl Acad Sci U S A 2012, 109(7):2678-2683.
110. Zhang SY, Bryant DA: The Tricarboxylic Acid Cycle in Cyanobacteria. Science 2011, 334(6062):1551-1553.
111. Nakamura Y, Kaneko T, Miyajima N, Tabata S: Extension of CyanoBase. CyanoMutants: repository of mutant information on Synechocystis sp. strain PCC6803. Nucleic Acids Res 1999, 27(1):66-68.
112. Young JD, Shastri AA, Stephanopoulos G, Morgan JA: Mapping photoautotrophic metabolism with isotopically nonstationary (13)C flux analysis. Metabolic Engineering 2011, 13(6):656-665.
113. Stockel J, Jacobs JM, Elvitigala TR, Liberton M, Welsh EA, Polpitiya AD, Gritsenko MA, Nicora CD, Koppenaal DW, Smith RD et al: Diurnal rhythms result in significant changes in the cellular protein complement in the cyanobacterium Cyanothece 51142. PLoS One, 6(2):e16680.
114. Allen MM: Simple Conditions for Growth of Unicellular Blue-Green Algae on Plates. Journal of Phycology 1968, 4(1):1-&.
115. Reddy KJ, Haskell JB, Sherman DM, Sherman LA: Unicellular, Aerobic Nitrogen-Fixing Cyanobacteria of the Genus Cyanothece. Journal of Bacteriology 1993, 175(5):1284-1292.
116. Porra RJ, Thompson WA, Kriedemann PE: Determination of accurate extinction coefficients and simultaneous equations for assaying chlorophylls a and b extracted with four different solvents: verification of the concentration of chlorophyll standards by atomic absorption spectroscopy. Biochim Biophys Acta 1989, 975:384-394.
117. Lichtenthaler HK: Chlorophylls and Carotenoids - Pigments of Photosynthetic Biomembranes. Methods in Enzymology 1987, 148:350-382.
118. Steiger S, Schafer L, Sandmann G: High-light-dependent upregulation of carotenoids and their antioxidative properties in the cyanobacterium Synechocystis PCC 6803. Journal of Photochemistry and Photobiology B-Biology 1999, 52(1-3):14-18.

169
119. Arnon DI, Mcswain BD, Tsujimot.Hy, Wada K: Photochemical Activity and Components of Membrane Preparations from Blue-Green-Algae .1. Coexistence of 2 Photosystems in Relation to Chlorophyll Alpha and Removal of Phycocyanin. Biochimica Et Biophysica Acta 1974, 357(2):231-245.
120. Stoeckel J, Welsh EA, Liberton M, Kunnvakkam R, Aurora R, Pakrasi HB: Global transcriptomic analysis of Cyanothece 51142 reveals robust diurnal oscillation of central metabolic processes. Proceedings of the National Academy of Sciences of the United States of America 2008, 105(16):6156-6161.
121. Mortazavi AW, BA; McCue, K; Schaeffer, L; Wold, B: Mapping and quantifying mammalian transcripts by RNA-Seq. Nature Methods 2008, 5(7):621-628.
122. Varma A, Palsson BO: Metabolic Flux Balancing - Basic Concepts, Scientific and Practical Use. Bio-Technology 1994, 12(10):994-998.
123. Kumar VS, Ferry JG, Maranas CD: Metabolic reconstruction of the archaeon methanogen Methanosarcina Acetivorans. Bmc Systems Biology 2011, 5.
124. Kucho K, Okamoto K, Tsuchiya Y, Nomura S, Nango M, Kanehisa M, Ishiura M: Global analysis of circadian expression in the cyanobacterium Synechocystis sp. strain PCC 6803. J Bacteriol 2005, 187(6):2190-2199.
125. Tredici MR, Margheri MC, Philippis RD, Materass R, Bocci F, Tomaselli: Conversion of solar energy into the energy of biomass by culture of marine cyanobacteria. Proceedings of the 1986 International Congress on Renewable Energy Sources 1986, 1:191-199.
126. Reddy KJ, Haskell JB, Sherman DM, Sherman LA: Unicellular, aerobic nitrogen-fixing cyanobacteria of the genus Cyanothece. J Bacteriol 1993, 175(5):1284-1292.
127. Bentley FK, Melis A: Diffusion-based process for carbon dioxide uptake and isoprene emission in gaseous/aqueous two-phase photobioreactors by photosynthetic microorganisms. Biotechnol Bioeng 2012, 109(1):100-109.
128. Nakao M, Okamoto S, Kohara M, Fujishiro T, Fujisawa T, Sato S, Tabata S, Kaneko T, Nakamura Y: CyanoBase: the cyanobacteria genome database update 2010. Nucleic Acids Res 2010, 38(Database issue):D379-381.
129. Minamizaki K, Mizoguchi T, Goto T, Tamiaki H, Fujita Y: Identification of two homologous genes, chlAI and chlAII, that are differentially involved in isocyclic ring formation of chlorophyll a in the cyanobacterium Synechocystis sp. PCC 6803. The Journal of biological chemistry 2008, 283(5):2684-2692.
130. Jansson C, Debus RJ, Osiewacz HD, Gurevitz M, McIntosh L: Construction of an Obligate Photoheterotrophic Mutant of the Cyanobacterium Synechocystis 6803 : Inactivation of the psbA Gene Family. Plant Physiol 1987, 85(4):1021-1025.
131. Chitnis PR, Reilly PA, Nelson N: Insertional Inactivation of the Gene Encoding Subunit-Ii of Photosystem-I from the Cyanobacterium Synechocystis Sp Pcc-6803. Journal of Biological Chemistry 1989, 264(31):18381-18385.

170
132. Nakamoto H: Targeted inactivation of the gene psaI encoding a subunit of photosystem I of the cyanobacterium Synechocystis sp PCC 6803. Plant Cell Physiol 1995, 36(8):1579-1587.
133. Burnap RL, Sherman LA: Deletion Mutagenesis in Synechocystis Sp Pcc6803 Indicates That the Mn-Stabilizing Protein of Photosystem-Ii Is Not Essential for O2 Evolution. Biochemistry-Us 1991, 30(2):440-446.
134. Shen JR, Ikeuchi M, Inoue Y: Analysis of the psbU gene encoding the 12-kDa extrinsic protein of photosystem II and studies on its role by deletion mutagenesis in Synechocystis sp. PCC 6803. Journal of Biological Chemistry 1997, 272(28):17821-17826.
135. Papadopoulos JS, Agarwala R: COBALT: constraint-based alignment tool for multiple protein sequences. Bioinformatics 2007, 23(9):1073-1079.
136. Chitnis PR, Reilly PA, Miedel MC, Nelson N: Structure and Targeted Mutagenesis of the Gene Encoding 8-Kda Subunit of Photosystem-I from the Cyanobacterium Synechocystis Sp Pcc-6803. Journal of Biological Chemistry 1989, 264(31):18374-18380.
137. Ughy B, Ajlani G: Phycobilisome rod mutants in Synechocystis sp strain PCC6803. Microbiology-Sgm 2004, 150:4147-4156.
138. Delorimier R, Bryant DA, Stevens SE: Genetic-Analysis of a 9 Kda Phycocyanin-Associated Linker Polypeptide. Biochimica Et Biophysica Acta 1990, 1019(1):29-41.
139. Jallet D, Gwizdala M, Kirilovsky D: ApcD, ApcF and ApcE are not required for the Orange Carotenoid Protein related phycobilisome fluorescence quenching in the cyanobacterium Synechocystis PCC 6803. Biochim Biophys Acta 2012, 1817(8):1418-1427.
140. Shen JR, Vermaas W, Inoue Y: The Role of Cytochrome C-550 as Studied through Reverse Genetics and Mutant Characterization in Synechocystis Sp Pcc-6803. Journal of Biological Chemistry 1995, 270(12):6901-6907.
141. Shen JR, Qian M, Inoue Y, Burnap RL: Functional characterization of Synechocystis sp. PCC 6803 Delta psbU and Delta psbV mutants reveals important roles of cytochrome c-550 in cyanobacterial oxygen evolution. Biochemistry-Us 1998, 37(6):1551-1558.
142. Manna P, Vermaas W: Lumenal proteins involved in respiratory electron transport in the cyanobacterium Synechocystis sp. PCC6803. Plant Molecular Biology 1997, 35(4):407-416.
143. Shen GZ, Boussiba S, Vermaas WFJ: Synechocystis Sp Pcc-6803 Strains Lacking Photosystem-I and Phycobilisome Function. Plant Cell 1993, 5(12):1853-1863.
144. Mo ML, Palsson BO, Herrgard MJ: Connecting extracellular metabolomic measurements to intracellular flux states in yeast. BMC Syst Biol 2009, 3:37.
145. Zahalak M, Pratte B, Werth KJ, Thiel T: Molybdate transport and its effect on nitrogen utilization in the cyanobacterium Anabaena variabilis ATCC 29413. Mol Microbiol 2004, 51(2):539-549.
146. Fernandez-Gonzalez B, Sandmann G, Vioque A: A new type of asymmetrically acting beta-carotene ketolase is required for the synthesis of echinenone in

171
the cyanobacterium Synechocystis sp. PCC 6803. J Biol Chem 1997, 272(15):9728-9733.
147. Tottey S, Rich PR, Rondet SA, Robinson NJ: Two Menkes-type atpases supply copper for photosynthesis in Synechocystis PCC 6803. J Biol Chem 2001, 276(23):19999-20004.
148. Tottey S, Rondet SA, Borrelly GP, Robinson PJ, Rich PR, Robinson NJ: A copper metallochaperone for photosynthesis and respiration reveals metal-specific targets, interaction with an importer, and alternative sites for copper acquisition. J Biol Chem 2002, 277(7):5490-5497.
149. Cheng Z, Sattler S, Maeda H, Sakuragi Y, Bryant DA, DellaPenna D: Highly divergent methyltransferases catalyze a conserved reaction in tocopherol and plastoquinone synthesis in cyanobacteria and photosynthetic eukaryotes. Plant Cell 2003, 15(10):2343-2356.
150. Sakuragi Y, Zybailov B, Shen G, Jones AD, Chitnis PR, van der Est A, Bittl R, Zech S, Stehlik D, Golbeck JH et al: Insertional inactivation of the menG gene, encoding 2-phytyl-1,4-naphthoquinone methyltransferase of Synechocystis sp. PCC 6803, results in the incorporation of 2-phytyl-1,4-naphthoquinone into the A(1) site and alteration of the equilibrium constant between A(1) and F(X) in photosystem I. Biochemistry-Us 2002, 41(1):394-405.
151. Dahnhardt D, Falk J, Appel J, van der Kooij TA, Schulz-Friedrich R, Krupinska K: The hydroxyphenylpyruvate dioxygenase from Synechocystis sp. PCC 6803 is not required for plastoquinone biosynthesis. FEBS letters 2002, 523(1-3):177-181.
152. Ogawa T, Marco E, Orus MI: A gene (ccmA) required for carboxysome formation in the cyanobacterium Synechocystis sp. strain PCC6803. J Bacteriol 1994, 176(8):2374-2378.
153. Taiz L, Zeiger E: Plant Physilogy, Third edn. Massachusetts: Sinauer Associates, Inc., Publishers; 2002.
154. Yeates TO, Kerfeld CA, Heinhorst S, Cannon GC, Shively JM: Protein-based organelles in bacteria: carboxysomes and related microcompartments. Nat Rev Microbiol 2008, 6(9):681-691.
155. Badger MR, Price GD: CO2 concentrating mechanisms in cyanobacteria: molecular components, their diversity and evolution. Journal of experimental botany 2003, 54(383):609-622.
156. Paerl HW: Cyanobacterial Carotenoids - Their Roles in Maintaining Optimal Photosynthetic Production among Aquatic Bloom Forming Genera. Oecologia 1984, 61(2):143-149.
157. Glazer AN: Structure and molecular organization of the photosynthetic accessory pigments of cyanobacteria and red algae. Molecular and cellular biochemistry 1977, 18(2-3):125-140.
158. Poutanen EL, Nikkila K: Carotenoid pigments as tracers of cyanobacterial blooms in recent and postglacial sediments of the Baltic Sea. Ambio 2001, 30(4-5):179-183.

172
159. Collins MD, Jones D: Distribution of isoprenoid quinone structural types in bacteria and their taxonomic implication. Microbiological reviews 1981, 45(2):316-354.
160. Stockel J, Jacobs JM, Elvitigala TR, Liberton M, Welsh EA, Polpitiya AD, Gritsenko MA, Nicora CD, Koppenaal DW, Smith RD et al: Diurnal rhythms result in significant changes in the cellular protein complement in the cyanobacterium Cyanothece 51142. PLoS One 2011, 6(2):e16680.
161. Allahverdiyeva Y, Ermakova M, Eisenhut M, Zhang P, Richaud P, Hagemann M, Cournac L, Aro EM: Interplay between flavodiiron proteins and photorespiration in Synechocystis sp. PCC 6803. The Journal of biological chemistry 2011, 286(27):24007-24014.
162. Bandyopadhyay A, Elvitigala T, Welsh E, Stockel J, Liberton M, Min H, Sherman LA, Pakrasi HB: Novel metabolic attributes of the genus cyanothece, comprising a group of unicellular nitrogen-fixing Cyanothece. Mbio 2011, 2(5).
163. Quintero MJ, Muro-Pastor AM, Herrero A, Flores E: Arginine catabolism in the cyanobacterium Synechocystis sp. Strain PCC 6803 involves the urea cycle and arginase pathway. J Bacteriol 2000, 182(4):1008-1015.
164. Solomon CM, Collier JL, Berg GM, Glibert PM: Role of urea in microbial metabolism in aquatic systems: a biochemical and molecular review. Aquatic Microbial Ecology 2010, 59(1):67-88.
165. Tripp HJ, Bench SR, Turk KA, Foster RA, Desany BA, Niazi F, Affourtit JP, Zehr JP: Metabolic streamlining in an open-ocean nitrogen-fixing cyanobacterium. Nature 2010, 464(7285):90-94.
166. Connor MR, Atsumi S: Synthetic Biology Guides Biofuel Production. J Biomed Biotechnol 2010.
167. Antal TK, Lindblad P: Production of H2 by sulphur-deprived cells of the unicellular cyanobacteria Gloeocapsa alpicola and Synechocystis sp. PCC 6803 during dark incubation with methane or at various extracellular pH. J Appl Microbiol 2005, 98(1):114-120.
168. Muro-Pastor MI, Reyes JC, Florencio FJ: The NADP+-isocitrate dehydrogenase gene (icd) is nitrogen regulated in cyanobacteria. J Bacteriol 1996, 178(14):4070-4076.
169. Jensen PA, Lutz KA, Papin JA: TIGER: Toolbox for integrating genome-scale metabolic models, expression data, and transcriptional regulatory networks. Bmc Systems Biology 2011, 5.
170. Colijn C, Brandes A, Zucker J, Lun DS, Weiner B, Farhat MR, Cheng TY, Moody DB, Murray M, Galagan JE: Interpreting Expression Data with Metabolic Flux Models: Predicting Mycobacterium tuberculosis Mycolic Acid Production. Plos Computational Biology 2009, 5(8).
171. Mahadevan RE, JS; Doyle, FJ: Dynamic Flux Analysis of diauxic growth in Escherichia coli. Biophys J 2003, 83:1331-1340.
172. Kim J, Reed JL: OptORF: Optimal metabolic and regulatory perturbations for metabolic engineering of microbial strains. Bmc Systems Biology 2010, 4.

173
173. Ranganathan S, Suthers PF, Maranas CD: OptForce: An Optimization Procedure for Identifying All Genetic Manipulations Leading to Targeted Overproductions. Plos Computational Biology 2010, 6(4).
174. Gao Q, Wang W, Zhao H, Lu X: Effects of fatty acid activation on photosynthetic production of fatty acid-based biofuels in Synechocystis sp. PCC6803. Biotechnology for biofuels 2012, 5(1):17.
175. Tan X, Yao L, Gao Q, Wang W, Qi F, Lu X: Photosynthesis driven conversion of carbon dioxide to fatty alcohols and hydrocarbons in cyanobacteria. Metab Eng 2011, 13(2):169-176.
176. Gronenberg LS, Marcheschi RJ, Liao JC: Next generation biofuel engineering in prokaryotes. Curr Opin Chem Biol 2013.
177. Heidorn T, Camsund D, Huang HH, Lindberg P, Oliveira P, Stensjo K, Lindblad P: Synthetic biology in cyanobacteria engineering and analyzing novel functions. Methods in enzymology 2011, 497:539-579.
178. Chen Y, Holtman CK, Taton A, Golden SS: Functional Analysis of the Synechococcus elongatus PCC 7942 Genome. In: Functional Genomics and Evolution of Photosynthetic Systems. Edited by Burnap R, Vermaas W, vol. 33: Springer; 2012: 119-137.
179. Xu Y, Alvey RM, Byrne PO, Graham JE, Shen G, Bryant DA: Expression of genes in cyanobacteria: adaptation of endogenous plasmids as platforms for high-level gene expression in Synechococcus sp. PCC 7002. Methods in molecular biology (Clifton, NJ) 2011, 684:273-293.
180. Zhang Y, Pu H, Wang Q, Cheng S, Zhao W, Zhang Y, Zhao J: PII is important in regulation of nitrogen metabolism but not required for heterocyst formation in the Cyanobacterium Anabaena sp. PCC 7120. The Journal of biological chemistry 2007, 282(46):33641-33648.
181. Taton A, Lis E, Adin DM, Dong G, Cookson S, Kay SA, Golden SS, Golden JW: Gene transfer in Leptolyngbya sp. strain BL0902, a cyanobacterium suitable for production of biomass and bioproducts. PloS one 2012, 7(1):e30901.
182. Liu X, Sheng J, Curtiss R, 3rd: Fatty acid production in genetically modified cyanobacteria. Proceedings of the National Academy of Sciences of the United States of America 2011, 108(17):6899-6904.
183. Wang B, Pugh S, Nielsen DR, Zhang W, Meldrum DR: Engineering cyanobacteria for photosynthetic production of 3-hydroxybutyrate directly from CO. Metabolic engineering 2013, 16C:68-77.
184. Lagarde D, Beuf L, Vermaas W: Increased Production of Zeaxanthin and Other Pigments by Application of Genetic Engineering Techniques to Synechocystis sp. Strain PCC 6803. Applied and Environmental Microbiology 2000, 66(1):64-72.
185. Cheah YE, Albers SC, Peebles CA: A novel counter-selection method for markerless genetic modification in Synechocystis sp. PCC 6803. Biotechnology progress 2013, 29(1):23-30.
186. Takahama K, Matsuoka M, Nagahama K, Ogawa T: High-Frequency Gene Replacement in Cyanobacteria Using a Heterologous rps12 Gene. Plant Cell Physiology 2004, 45(3):333-339.

174
187. Tan X, Liang F, Cai K, Lu X: Application of the FLP/FRT recombination system in cyanobacteria for construction of markerless mutants. Applied microbiology and biotechnology 2013.
188. Tyo KE, Jin YS, Espinoza FA, Stephanopoulos G: Identification of gene disruptions for increased poly-3-hydroxybutyrate accumulation in Synechocystis PCC 6803. Biotechnology progress 2009, 25(5):1236-1243.
189. Holtman C, Chen Y, Sandoval P, Gonzales A, Nalty M, Thomas T, Youderian P, Golden S: High-Throughput Functional Analysis of the Synechococcus elongatus PCC 7942 Genome. DNA Research 2005, 12:103-115.
190. Huang HH, Camsund D, Lindblad P, Heidorn T: Design and characterization of molecular tools for a Synthetic Biology approach towards developing cyanobacterial biotechnology. Nucleic acids research 2010, 38(8):2577-2593.
191. Landry B, Stockel J, Pakrasi H: Use of Degradation Tags to Control Protein Levels in the Cyanobacterium Synechocystis sp. Strain PCC 6803. Applied and Environmental Microbiology 2012, 70(8):2833-2835.
192. Huang HH, Lindblad P: Wide-dynamic-range promoters engineered for cyanobacteria. Journal of biological engineering 2013, 7(1):10.
193. Li MZ, Elledge SJ: Harnessing homologous recombination in vitro to generate recombinant DNA via SLIC. Nature methods 2007, 4(3):251-256.
194. Gibson DG, Young L, Chuang RY, Venter JC, Hutchison CA, 3rd, Smith HO: Enzymatic assembly of DNA molecules up to several hundred kilobases. Nature methods 2009, 6(5):343-345.
195. Quan J, Tian J: Circular polymerase extension cloning of complex gene libraries and pathways. PloS one 2009, 4(7):e6441.
196. Szewczyk E, Nayak T, Oakley CE, Edgerton H, Xiong Y, Taheri-Talesh N, Osmani SA, Oakley BR: Fusion PCR and gene targeting in Aspergillus nidulans. Nature protocols 2007, 1(6):3111-3120.
197. Engler C, Marillonnet S: Generation of families of construct variants using golden gate shuffling. Methods in molecular biology (Clifton, NJ) 2011, 729:167-181.
198. Hilson N, Rosengarten R, Keasling J: j5 DNA Assembly Design Automation Software. ACS Synthetic Biology 2012, 1(1):14-21.
199. Nagarajan A, Winter R, Eaton-Rye J, Burnap R: A synthetic DNA and fusion PCR approach to the ectopic expression of high levels of the D1 protein of photosystem II in Synechocystis sp. PCC 6803. Journal of photochemistry and photobiology B, Biology 2011, 104(1-2):212-219.
200. Shao Z, Zhao H: DNA assembler, an in vivo genetic method for rapid construction of biochemical pathways. Nucleic acids research 2009, 37(2):e16.
201. Jones KL, Kim SW, Keasling JD: Low-copy plasmids can perform as well as or better than high-copy plasmids for metabolic engineering of bacteria. Metabolic engineering 2000, 2(4):328-338.
202. Dunlop MJ, Dossani ZY, Szmidt HL, Chu HC, Lee TS, Keasling JD, Hadi MZ, Mukhopadhyay A: Engineering microbial biofuel tolerance and export using efflux pumps. Molecular systems biology 2011, 7:487.

175
203. Ng WO, Zentella R, Wang Y, Taylor JS, Pakrasi HB: PhrA, the major photoreactivating factor in the cyanobacterium Synechocystis sp. strain PCC 6803 codes for a cyclobutane-pyrimidine-dimer-specific DNA photolyase. Archives of microbiology 2000, 173(5-6):412-417.
204. Berla BM, Pakrasi HB: Upregulation of plasmid genes during stationary phase in Synechocystis sp. strain PCC 6803, a cyanobacterium. Appl Environ Microbiol 2012, 78(15):5448-5451.
205. Wang B, Wang J, Zhang W, Meldrum DR: Application of synthetic biology in cyanobacteria and algae. Frontiers in microbiology 2012, 3:344.
206. Taniuchi Y, Yoshikawa S, Maeda S, Omata T, Ohki K: Diazotrophy under continuous light in a marine unicellular diazotrophic cyanobacterium, Gloeothece sp. 68DGA. Microbiology 2008, 154(Pt 7):1859-1865.
207. Latysheva N, Junker VL, Palmer WJ, Codd GA, Barker D: The evolution of nitrogen fixation in cyanobacteria. Bioinformatics 2012, 28(5):603-606.
208. Pfreundt U, Stal LJ, Voss B, Hess WR: Dinitrogen fixation in a unicellular chlorophyll d-containing cyanobacterium. The ISME journal 2012, 6(7):1367-1377.
209. Stockel J, Welsh EA, Liberton M, Kunnvakkam R, Aurora R, Pakrasi HB: Global transcriptomic analysis of Cyanothece 51142 reveals robust diurnal oscillation of central metabolic processes. Proceedings of the National Academy of Sciences of the United States of America 2008, 105(16):6156-6161.
210. Zhang F, Carothers JM, Keasling JD: Design of a dynamic sensor-regulator system for production of chemicals and fuels derived from fatty acids. Nature biotechnology 2012, 30(4):354-359.
211. Akiyama S: Structural and dynamic aspects of protein clocks: how can they be so slow and stable? Cellular and molecular life sciences : CMLS 2012, 69(13):2147-2160.
212. Nakajima M, Imai K, Ito H, Nishiwaki T, Murayama Y, Iwasaki H, Oyama T, Kondo T: Reconstitution of circadian oscillation of cyanobacterial KaiC phosphorylation in vitro. Science 2005, 308(5720):414-415.
213. Xu Y, Ma P, Shah P, Rokas A, Liu Y, Johnson CH: Non-optimal codon usage is a mechanism to achieve circadian clock conditionality. Nature 2013, 495(7439):116-120.
214. Teng SW, Mukherji S, Moffitt JR, de Buyl S, O'Shea EK: Robust circadian oscillations in growing cyanobacteria require transcriptional feedback. Science 2013, 340(6133):737-740.
215. Woelfle MA, Ouyang Y, Phanvijhitsiri K, Johnson CH: The adaptive value of circadian clocks: an experimental assessment in cyanobacteria. Current biology : CB 2004, 14(16):1481-1486.
216. Melis A: Carbon partitioning in photosynthesis. Curr Opin Chem Biol 2013. 217. Atsumi S, Higashide W, Liao JC: Direct photosynthetic recycling of carbon
dioxide to isobutyraldehyde. Nature biotechnology 2009, 27(12):1177-1180. 218. Selinger DW, Cheung KJ, Mei R, Johansson EM, Richmond CS, Blattner FR,
Lockhart DJ, Church GM: RNA expression analysis using a 30 base pair

176
resolution Escherichia coli genome array. Nature biotechnology 2000, 18(12):1262-1268.
219. Sharma CM, Hoffmann S, Darfeuille F, Reignier J, Findeiss S, Sittka A, Chabas S, Reiche K, Hackermuller J, Reinhardt R et al: The primary transcriptome of the major human pathogen Helicobacter pylori. Nature 2010, 464(7286):250-255.
220. Mitschke J, Georg J, Scholz I, Sharma CM, Dienst D, Bantscheff J, Voss B, Steglich C, Wilde A, Vogel J et al: An experimentally anchored map of transcriptional start sites in the model cyanobacterium Synechocystis sp. PCC6803. Proceedings of the National Academy of Sciences of the United States of America 2011, 108(5):2124-2129.
221. Gierga G, Voss B, Hess WR: The Yfr2 ncRNA family, a group of abundant RNA molecules widely conserved in cyanobacteria. RNA biology 2009, 6(3):222-227.
222. Duhring U, Axmann IM, Hess WR, Wilde A: An internal antisense RNA regulates expression of the photosynthesis gene isiA. Proceedings of the National Academy of Sciences of the United States of America 2006, 103(18):7054-7058.
223. Ashby MK, Houmard J: Cyanobacterial two-component proteins: structure, diversity, distribution, and evolution. Microbiol Mol Biol Rev 2006, 70(2):472-509.
224. Montgomery BL: Sensing the light: photoreceptive systems and signal transduction in cyanobacteria. Mol Microbiol 2007, 64(1):16-27.
225. Waters CM, Bassler BL: The Vibrio harveyi quorum-sensing system uses shared regulatory components to discriminate between multiple autoinducers. Genes Dev 2006, 20(19):2754-2767.
226. Moon TS, Lou C, Tamsir A, Stanton BC, Voigt CA: Genetic programs constructed from layered logic gates in single cells. Nature 2012, 491(7423):249-253.
227. Erbe JL, Adams AC, Taylor KB, Hall LM: Cyanobacteria carrying an smt-lux transcriptional fusion as biosensors for the detection of heavy metal cations. Journal of industrial microbiology 1996, 17(2):80-83.
228. Boyanapalli R, Bullerjahn GS, Pohl C, Croot PL, Boyd PW, McKay RM: Luminescent whole-cell cyanobacterial bioreporter for measuring Fe availability in diverse marine environments. Appl Environ Microbiol 2007, 73(3):1019-1024.
229. Blasi B, Peca L, Vass I, Kos PB: Characterization of stress responses of heavy metal and metalloid inducible promoters in synechocystis PCC6803. Journal of microbiology and biotechnology 2012, 22(2):166-169.
230. Peca L, Kos PB, Mate Z, Farsang A, Vass I: Construction of bioluminescent cyanobacterial reporter strains for detection of nickel, cobalt and zinc. FEMS microbiology letters 2008, 289(2):258-264.
231. Peca L, Kos PB, Vass I: Characterization of the activity of heavy metal-responsive promoters in the cyanobacterium Synechocystis PCC 6803. Acta biologica Hungarica 2007, 58 Suppl:11-22.

177
232. Michel KP, Pistorius EK, Golden SS: Unusual regulatory elements for iron deficiency induction of the idiA gene of Synechococcus elongatus PCC 7942. Journal of bacteriology 2001, 183(17):5015-5024.
233. Guerrero F, Carbonell V, Cossu M, Correddu D, Jones PR: Ethylene synthesis and regulated expression of recombinant protein in Synechocystis sp. PCC 6803. PloS one 2012, 7(11):e50470.
234. Kunert A, Vinnemeier J, Erdmann N, Hagemann M: Repression by Fur is not the main mechanism controlling the iron-inducible isiAB operon in the cyanobacterium Synechocystis sp. PCC 6803. FEMS microbiology letters 2003, 227(2):255-262.
235. Imamura S, Asayama M: Sigma factors for cyanobacterial transcription. Gene regulation and systems biology 2009, 3:65-87.
236. Hansen LH, Knudsen S, Sorensen SJ: The effect of the lacY gene on the induction of IPTG inducible promoters, studied in Escherichia coli and Pseudomonas fluorescens. Current microbiology 1998, 36(6):341-347.
237. Satya Lakshmi O, Rao NM: Evolving Lac repressor for enhanced inducibility. Protein engineering, design & selection : PEDS 2009, 22(2):53-58.
238. Mackey SR, Ditty JL, Clerico EM, Golden SS: Detection of rhythmic bioluminescence from luciferase reporters in cyanobacteria. Methods in molecular biology (Clifton, NJ) 2007, 362:115-129.
239. Ghim CM, Lee SK, Takayama S, Mitchell RJ: The art of reporter proteins in science: past, present and future applications. BMB reports 2010, 43(7):451-460.
240. Meighen EA: Bacterial bioluminescence: organization, regulation, and application of the lux genes. FASEB journal : official publication of the Federation of American Societies for Experimental Biology 1993, 7(11):1016-1022.
241. Hansen MC, Palmer RJ, Jr., Udsen C, White DC, Molin S: Assessment of GFP fluorescence in cells of Streptococcus gordonii under conditions of low pH and low oxygen concentration. Microbiology 2001, 147(Pt 5):1383-1391.
242. Golden SS, Ishiura M, Johnson CH, Kondo T: Cyanobacterial Circadian Rhythms. Annual review of plant physiology and plant molecular biology 1997, 48:327-354.
243. Drepper T, Eggert T, Circolone F, Heck A, Krauss U, Guterl JK, Wendorff M, Losi A, Gartner W, Jaeger KE: Reporter proteins for in vivo fluorescence without oxygen. Nature biotechnology 2007, 25(4):443-445.
244. Mukherjee A, Weyant KB, Walker J, Schroeder CM: Directed evolution of bright mutants of an oxygen-independent flavin-binding fluorescent protein from Pseudomonas putida. Journal of biological engineering 2012, 6(1):20.
245. Simkovsky R, Daniels EF, Tang K, Huynh SC, Golden SS, Brahamsha B: Impairment of O-antigen production confers resistance to grazing in a model amoeba-cyanobacterium predator-prey system. Proceedings of the National Academy of Sciences of the United States of America 2012, 109(41):16678-16683.
246. Schwarz D, Orf I, Kopka J, Hagemann M: Recent Applications of Metabolomics Toward Cyanobacteria. Metabolites 2013, 3(1):72-100.

178
247. Fell DA, Small JR: Fat synthesis in adipose tissue. An examination of stoichiometric constraints. Biochem J 1986, 238(3):781-786.
248. Savinell JM, Palsson BO: Network analysis of intermediary metabolism using linear optimization. I. Development of mathematical formalism. J Theor Biol 1992, 154(4):421-454.
249. Varma A, Boesch BW, Palsson BO: Stoichiometric Interpretation of Escherichia-Coli Glucose Catabolism under Various Oxygenation Rates. Applied and Environmental Microbiology 1993, 59(8):2465-2473.
250. Orth JD, Thiele I, Palsson BO: What is flux balance analysis? Nature biotechnology 2010, 28(3):245-248.
251. Varma A, Palsson BO: Stoichiometric flux balance models quantitatively predict growth and metabolic by-product secretion in wild-type Escherichia coli W3110. Appl Environ Microbiol 1994, 60(10):3724-3731.
252. Heyes DJ, Hunter CN: Making light work of enzyme catalysis: protochlorophyllide oxidoreductase. Trends Biochem Sci 2005, 30(11):642-649.
253. Kopecna J, Sobotka R, Komenda J: Inhibition of chlorophyll biosynthesis at the protochlorophyllide reduction step results in the parallel depletion of Photosystem I and Photosystem II in the cyanobacterium Synechocystis PCC 6803. Planta 2013, 237(2):497-508.
254. Mahadevan R, Edwards JS, Doyle FJ: Dynamic flux balance analysis of diauxic growth in Escherichia coli. Biophys J 2002, 83(3):1331-1340.
255. Mahadevan R, Schilling CH: The effects of alternate optimal solutions in constraint-based genome-scale metabolic models. Metabolic engineering 2003, 5:264-276.
256. Kaczmarzyk D, Fulda M: Fatty acid activation in cyanobacteria mediated by acyl-acyl carrier protein synthetase enables fatty acid recycling. Plant physiology 2010, 152(3):1598-1610.
257. von Berlepsch S, Kunz HH, Brodesser S, Fink P, Marin K, Flugge UI, Gierth M: The acyl-acyl carrier protein synthetase from Synechocystis sp. PCC 6803 mediates fatty acid import. Plant physiology 2012, 159(2):606-617.
258. Collins MD, Jones D: Distribution of Isoprenoid Quinone Structural Types in Bacteria and Their Taxonomic Implications. Microbiol Rev 1981, 45(2):316-354.
259. Sakuragi Y: Studies of Quinones in Cyanobacteria. The Pennsylvania State University; 2004.
260. Hamilton JJ, Reed JL: Identification of Functional Differences in Metabolic Networks Using Comparative Genomics and Constraint-Based Models. PloS one 2012, 7(4).
261. Bennetzen JL, Hake S, SpringerLink (Online service): Handbook of Maize Genetics and Genomics. In. New York, NY: Springer New York; 2009.
262. Sanchez OJ, Cardona CA: Trends in biotechnological production of fuel ethanol from different feedstocks. Bioresource Technology 2008, 99(13):5270-5295.

179
263. Farrell AE, Plevin RJ, Turner BT, Jones AD, O'Hare M, Kammen DM: Ethanol can contribute to energy and environmental goals. Science 2006, 311(5760):506-508.
264. Stewart CN, Jr.: Biofuels and biocontainment. Nat Biotechnol 2007, 25(3):283-284.
265. Mechin V, Argillier O, Rocher F, Hebert Y, Mila I, Pollet B, Barriere Y, Lapierre C: In search of a maize ideotype for cell wall enzymatic degradability using histological and biochemical lignin characterization. J Agric Food Chem 2005, 53(15):5872-5881.
266. Dennis C, Surridge C: A. thaliana genome. Nature 2000, 408(6814):791-791. 267. Yu J, Hu SN, Wang J, Wong GKS, Li SG, et al: A draft sequence of the rice
genome (Oryza sativa L. ssp indica). Science 2002, 296(5565):79-92. 268. Goff SA, Ricke D, Lan TH, Presting G, Wang RL, et al: A draft sequence of the
rice genome (Oryza sativa L. ssp japonica). Science 2002, 296(5565):92-100. 269. Paterson AH, Bowers JE, Bruggmann R, Dubchak I, Grimwood J, et al: The
Sorghum bicolor genome and the diversification of grasses. Nature 2009, 457(7229):551-556.
270. Schnable PS, Ware D, Fulton RS, Stein JC, Wei F, et al: The B73 maize genome: complexity, diversity, and dynamics. Science 2009, 326(5956):1112-1115.
271. Xavier Argout JS, Jean Marc Aury, Gaetan Droc, Jerome Gouzy, et al: Deciphering the genome structure and paleohistory of Theobroma cacao. Nature Proceedings 2010.
272. Dal'Molin CGD, Quek LE, Palfreyman RW, Brumbley SM, Nielsen LK: AraGEM, a Genome-Scale Reconstruction of the Primary Metabolic Network in Arabidopsis. Plant Physiology 2010, 152(2):579-589.
273. Sweetlove LJ, Last RL, Fernie AR: Predictive metabolic engineering: A goal for systems biology. Plant Physiology 2003, 132(2):420-425.
274. Gutierrez RA, Shasha DE, Coruzzi GM: Systems biology for the virtual plant. Plant Physiology 2005, 138(2):550-554.
275. Feist AM, Herrgard MJ, Thiele I, Reed JL, Palsson BO: Reconstruction of biochemical networks in microorganisms. Nature Reviews Microbiology 2009, 7(2):129-143.
276. Park JM, Kim TY, Lee SY: Constraints-based genome-scale metabolic simulation for systems metabolic engineering. Biotechnology Advances 2009, 27(6):979-988.
277. Milne CB, Kim PJ, Eddy JA, Price ND: Accomplishments in genome-scale in silico modeling for industrial and medical biotechnology. Biotechnol J 2009, 4(12):1653-1670.
278. Poolman MG, Miguet L, Sweetlove LJ, Fell DA: A Genome-Scale Metabolic Model of Arabidopsis and Some of Its Properties. Plant Physiology 2009, 151(3):1570-1581.
279. Grafahrend-Belau E, Schreiber F, Koschutzki D, Junker BH: Flux Balance Analysis of Barley Seeds: A Computational Approach to Study Systemic Properties of Central Metabolism. Plant Physiology 2009, 149(1):585-598.

180
280. Dal'Molin CGD, Quek LE, Palfreyman RW, Brumbley SM, Nielsen LK: C4GEM, a Genome-Scale Metabolic Model to Study C-4 Plant Metabolism. Plant Physiology 2010, 154(4):1871-1885.
281. Pilalis E, Chatziioannou A, Thomasset B, Kolisis F: An in silico compartmentalized metabolic model of Brassica napus enables the systemic study of regulatory aspects of plant central metabolism. Biotechnol Bioeng.
282. Bennett MD, Leitch IJ, Price HJ, Johnston JS: Comparisons with Caenorhabditis (approximately 100 Mb) and Drosophila (approximately 175 Mb) using flow cytometry show genome size in Arabidopsis to be approximately 157 Mb and thus approximately 25% larger than the Arabidopsis genome initiative estimate of approximately 125 Mb. Ann Bot 2003, 91(5):547-557.
283. Liang C, Mao L, Ware D, Stein L: Evidence-based gene predictions in plant genomes. Genome Res 2009, 19(10):1912-1923.
284. Salamov AA, Solovyev VV: Ab initio gene finding in Drosophila genomic DNA. Genome Res 2000, 10(4):516-522.
285. Notebaart RA, van Enckevort FH, Francke C, Siezen RJ, Teusink B: Accelerating the reconstruction of genome-scale metabolic networks. BMC Bioinformatics 2006, 7:296.
286. Penningd FW, Brunstin AH, Vanlaar HH: Products, Requirements and Efficiency of Biosynthesis - Quantitative Approach. Journal of Theoretical Biology 1974, 45(2):339-377.
287. Spector WS: Handbook of biological data. Philadelphia,: Saunders; 1956. 288. Muller F, Dijkhuis, DJ, Heida, YS: On the relationship between chemical
composition and digestibility in vivo of roughages. Agricultural Research Report 1970, 736:1-27.
289. Wedig C, Jaster, EH, Moore, KJ: Hemicellulose monosaccharide composition and in vitro disappearance of orchard grass and alfalfa hay. Journal of Agricultaral and Food Chemistry 1987, 35(2):23-27.
290. Sun Q, Zybailov B, Majeran W, Friso G, Olinares PDB, van Wijk KJ: PPDB, the Plant Proteomics Database at Cornell. Nucleic Acids Res 2009, 37:D969-D974.
291. Heazlewood JL, Verboom RE, Tonti-Filippini J, Small I, Millar AH: SUBA: the Arabidopsis Subcellular Database. Nucleic Acids Res 2007, 35(Database issue):D213-218.
292. Volk RJ, Jackson WA: Photorespiratory Phenomena in Maize - Oxygen-Uptake, Isotope Discrimination, and Carbon-Dioxide Efflux. Plant Physiology 1972, 49(2):218-&.
293. Dai ZY, Ku MSB, Edwards GE: C-4 Photosynthesis - the Effects of Leaf Development on the Co2-Concentrating Mechanism and Photorespiration in Maize. Plant Physiology 1995, 107(3):815-825.
294. Jolivettournier P, Gerster R: Incorporation of Oxygen into Glycolate, Glycine, and Serine during Photorespiration in Maize Leaves. Plant Physiology 1984, 74(1):108-111.
295. Kumar VS, Dasika MS, Maranas CD: Optimization based automated curation of metabolic reconstructions. BMC bioinformatics 2007, 8:212.

181
296. Wei Y, Lin M, Oliver DJ, Schnable PS: The roles of aldehyde dehydrogenases (ALDHs) in the PDH bypass of Arabidopsis. BMC Biochem 2009, 10:7.
297. Ouzounis CA, Karp PD: Global properties of the metabolic map of Escherichia coli. Genome Res 2000, 10(4):568-576.
298. Wise RR HJ: Synthesis, export and partitioning of end products of photosynthesis., vol. 23. Dordrecht, The Netherlands: Springer; 2007.
299. Dennis DT, Miernyk JA: Compartmentation of Non-Photosynthetic Carbohydrate-Metabolism. Annual Review of Plant Physiology and Plant Molecular Biology 1982, 33:27-50.
300. Allen JF: Photosynthesis of ATP - Electrons, proton pumps, rotors, and poise. Cell 2002, 110(3):273-276.
301. Hervas M, Navarro JA, De La Rosa MA: Electron transfer between membrane complexes and soluble proteins in photosynthesis. Accounts of Chemical Research 2003, 36(10):798-805.
302. Gregory R: Biochemistry of Photosynthesis. Chichester, NY, USA: John Wiley & Sons; 1989.
303. Tsaftaris AS, Bosabalidis AM, Scandalios JG: Cell-Type-Specific Gene-Expression and Acatalasemic Peroxisomes in a Null Cat2 Catalase Mutant of Maize. Proceedings of the National Academy of Sciences of the United States of America-Biological Sciences 1983, 80(14):4455-4459.
304. Hisano H, Nandakumar R, Wang ZY: Genetic modification of lignin biosynthesis for improved biofuel production. In Vitro Cellular & Developmental Biology-Plant 2009, 45(3):306-313.
305. Winkel-Shirley B: Flavonoid biosynthesis. A colorful model for genetics, biochemistry, cell biology, and biotechnology. Plant Physiology 2001, 126(2):485-493.
306. Styles ED, Ceska O: Genetic-Control of 3-Hydroxy-Flavonoids and 3-Deoxy-Flavonoids in Zea-Mays. Phytochemistry 1975, 14(2):413-415.
307. Winkel-Shirley B: Flavonoid biosynthesis. A colorful model for genetics, biochemistry, cell biology, and biotechnology. Plant Physiol 2001, 126(2):485-493.
308. Weidemann C, Tenhaken R, Hohl U, Barz W: Medicarpin and Maackiain 3-O-Glucoside-6'-O-Malonate Conjugates Are Constitutive Compounds in Chickpea (Cicer-Arietinum L) Cell-Cultures. Plant Cell Reports 1991, 10(6-7):371-374.
309. Vanholme R, Morreel K, Ralph J, Boerjan W: Lignin engineering. Current Opinion in Plant Biology 2008, 11(3):278-285.
310. Sattler SE, Funnell-Harris DL, Pedersen JF: Brown midrib mutations and their importance to the utilization of maize, sorghum, and pearl millet lignocellulosic tissues. Plant Science 2010, 178(3):229-238.
311. Marita JM, Vermerris W, Ralph J, Hatfield RD: Variations in the cell wall composition of maize brown midrib mutants. Journal of Agricultural and Food Chemistry 2003, 51(5):1313-1321.

182
312. Kuc J, Nelson OE: Abnormal Lignins Produced by Brown-Midrib Mutants of Maize .I. Brown-Midrib-1 Mutant. Archives of Biochemistry and Biophysics 1964, 105(1):103-&.
313. Guillaumie S, Pichon M, Martinant JP, Bosio M, Goffner D, Barriere Y: Differential expression of phenylpropanoid and related genes in brown-midrib bm1, bm2, bm3, and bm4 young near-isogenic maize plants. Planta 2007, 226(1):235-250.
314. Sticklen MB: Expediting the biofuels agenda via genetic manipulations of cellulosic bioenergy crops. Biofuels Bioproducts & Biorefining-Biofpr 2009, 3(4):448-455.
315. Sticklen MB: Plant genetic engineering for biofuel production: towards affordable cellulosic ethanol. Nat Rev Genet 2008, 9(6):433-443.
316. Li X, Weng JK, Chapple C: Improvement of biomass through lignin modification. Plant Journal 2008, 54(4):569-581.
317. Vega-Sanchez ME, Ronald PC: Genetic and biotechnological approaches for biofuel crop improvement. Current Opinion in Biotechnology 2010, 21(2):218-224.
318. Grabber JH, Schatz PF, Kim H, Lu FC, Ralph J: Identifying new lignin bioengineering targets: 1. Monolignol-substitute impacts on lignin formation and cell wall fermentability. Bmc Plant Biology 2010, 10:-.
319. Abramson M, Shoseyov O, Shani Z: Plant cell wall reconstruction toward improved lignocellulosic production and processability. Plant Science 2010, 178(2):61-72.
320. Torney F, Moeller L, Scarpa A, Wang K: Genetic engineering approaches to improve bioethanol production from maize. Current Opinion in Biotechnology 2007, 18(3):193-199.
321. Smidansky ED, Martin JM, Hannah LC, Fischer AM, Giroux MJ: Seed yield and plant biomass increases in rice are conferred by deregulation of endosperm ADP-glucose pyrophosphorylase. Planta 2003, 216(4):656-664.
322. Kim J, Reed JL: OptORF: Optimal metabolic and regulatory perturbations for metabolic engineering of microbial strains. BMC Syst Biol 2010, 4:53.
323. Thiele I, Palsson BO: A protocol for generating a high-quality genome-scale metabolic reconstruction. Nature Protocols 2010, 5(1):93-121.
324. Feist AM, Palsson BO: The growing scope of applications of genome-scale metabolic reconstructions using Escherichia coli. Nature Biotechnology 2008, 26(6):659-667.
325. Duarte NC, Becker SA, Jamshidi N, Thiele I, Mo ML, Vo TD, Srivas R, Palsson BO: Global reconstruction of the human metabolic network based on genomic and bibliomic data. Proceedings of the National Academy of Sciences of the United States of America 2007, 104(6):1777-1782.
326. Shlomi T, Cabili MN, Herrgard MJ, Palsson BO, Ruppin E: Network-based prediction of human tissue-specific metabolism. Nature Biotechnology 2008, 26(9):1003-1010.

183
327. Jerby L, Shlomi T, Ruppin E: Computational reconstruction of tissue-specific metabolic models: application to human liver metabolism. Molecular Systems Biology 2010, 6:-.
328. Altschul SF, Gish W, Miller W, Myers EW, Lipman DJ: Basic Local Alignment Search Tool. Journal of Molecular Biology 1990, 215(3):403-410.
329. Leveau V, Lorgeou J, Prioul J-L: Maize in the world economy: a challenge for scientific research - how to produce more cheaper! In: Advances in Maize. Edited by Prioul JLT, C.; Molnar, T., vol. 3. UK: Society for Experimental Biology; 2011.
330. International Grains Council: International Grains Council: Report for Fiscal Year 2011/12. In.: International Grains Council; 2013.
331. Schaeffer ML, Harper LC, Gardiner JM, Andorf CM, Campbell DA, Cannon EK, Sen TZ, Lawrence CJ: MaizeGDB: curation and outreach go hand-in-hand. Database : the journal of biological databases and curation 2011, 2011:bar022.
332. Monaco MK, Sen TZ, Dharmawardhana PD, Ren L, Schaeffer M, Naithani S, Amarasinghe V, Thomason J, Harper L, Gardiner J et al: Maize Metabolic Network Construction and Transcriptome Analysis. Plant Gen 2013, 6(1):-.
333. Schreiber F, Colmsee C, Czauderna T, Grafahrend-Belau E, Hartmann A, Junker A, Junker BH, Klapperstuck M, Scholz U, Weise S: MetaCrop 2.0: managing and exploring information about crop plant metabolism. Nucleic Acids Res 2012, 40(Database issue):D1173-1177.
334. Saha R, Suthers PF, Maranas CD: Zea mays iRS1563: A Comprehensive Genome-Scale Metabolic Reconstruction of Maize Metabolism. Plos One 2011, 6(7).
335. Martin A, Lee J, Kichey T, Gerentes D, Zivy M, Tatout C, Dubois F, Balliau T, Valot B, Davanture M et al: Two cytosolic glutamine synthetase isoforms of maize are specifically involved in the control of grain production. The Plant cell 2006, 18(11):3252-3274.
336. Kennedy RA: Photorespiration in c(3) and c(4) plant tissue cultures: significance of kranz anatomy to low photorespiration in c(4) plants. Plant Physiol 1976, 58(4):573-575.
337. Brown RH: A Difference in N Use Efficiency in C3 and C4 Plants and its Implications in Adaptation and Evolution1. Crop Sci 1978, 18(1):93-98.
338. Zelitch I: Pathways of Carbon Fixation in Green Plants. Annual Review of Biochemistry 1975, 44(1):123-145.
339. Vitousek PM, Aber JD, Howarth RW, Likens GE, Matson PA, Schindler DW, Schlesinger WH, Tilman DG: HUMAN ALTERATION OF THE GLOBAL NITROGEN CYCLE: SOURCES AND CONSEQUENCES. Ecological Applications 1997, 7(3):737-750.
340. Hirel B, Le Gouis J, Ney B, Gallais A: The challenge of improving nitrogen use efficiency in crop plants: towards a more central role for genetic variability and quantitative genetics within integrated approaches. J Exp Bot 2007, 58(9):2369-2387.

184
341. Hirel B, Gallais A: Nitrogen use efficiency – Physiological, molecular and genetic investigations towards crop improvement. In: Advances in Maize. vol. 3. UK: Society for Experimental Biology; 2011: 285-310.
342. Miflin BJ, Habash DZ: The role of glutamine synthetase and glutamate dehydrogenase in nitrogen assimilation and possibilities for improvement in the nitrogen utilization of crops. J Exp Bot 2002, 53(370):979-987.
343. de Oliveira Dal'Molin CG, Quek LE, Palfreyman RW, Brumbley SM, Nielsen LK: AraGEM, a genome-scale reconstruction of the primary metabolic network in Arabidopsis. Plant Physiol 2010, 152(2):579-589.
344. Poolman MG, Miguet L, Sweetlove LJ, Fell DA: A genome-scale metabolic model of Arabidopsis and some of its properties. Plant Physiol 2009, 151(3):1570-1581.
345. Grafahrend-Belau E, Schreiber F, Koschutzki D, Junker BH: Flux balance analysis of barley seeds: a computational approach to study systemic properties of central metabolism. Plant Physiol 2009, 149(1):585-598.
346. de Oliveira Dal'Molin CG, Quek LE, Palfreyman RW, Brumbley SM, Nielsen LK: C4GEM, a genome-scale metabolic model to study C4 plant metabolism. Plant Physiol 2010, 154(4):1871-1885.
347. Pilalis E, Chatziioannou A, Thomasset B, Kolisis F: An in silico compartmentalized metabolic model of Brassica napus enables the systemic study of regulatory aspects of plant central metabolism. Biotechnology and bioengineering 2011, 108(7):1673-1682.
348. Poolman MG, Kundu S, Shaw R, Fell DA: Responses to light intensity in a genome-scale model of rice metabolism. Plant Physiol 2013, 162(2):1060-1072.
349. The Arabidopsis Initiative: Analysis of the genome sequence of the flowering plant Arabidopsis thaliana. Nature 2000, 408(6814):796-815.
350. Hu TT, Pattyn P, Bakker EG, Cao J, Cheng JF, Clark RM, Fahlgren N, Fawcett JA, Grimwood J, Gundlach H et al: The Arabidopsis lyrata genome sequence and the basis of rapid genome size change. Nat Genet 2011, 43(5):476-481.
351. Schmutz J, Cannon SB, Schlueter J, Ma J, Mitros T, Nelson W, Hyten DL, Song Q, Thelen JJ, Cheng J et al: Genome sequence of the palaeopolyploid soybean. Nature 2010, 463(7278):178-183.
352. Goff SA, Ricke D, Lan TH, Presting G, Wang R, Dunn M, Glazebrook J, Sessions A, Oeller P, Varma H et al: A draft sequence of the rice genome (Oryza sativa L. ssp. japonica). Science 2002, 296(5565):92-100.
353. Yu J, Hu S, Wang J, Wong GK, Li S, Liu B, Deng Y, Dai L, Zhou Y, Zhang X et al: A draft sequence of the rice genome (Oryza sativa L. ssp. indica). Science 2002, 296(5565):79-92.
354. Tuskan GA, Difazio S, Jansson S, Bohlmann J, Grigoriev I, Hellsten U, Putnam N, Ralph S, Rombauts S, Salamov A et al: The genome of black cottonwood, Populus trichocarpa (Torr. & Gray). Science 2006, 313(5793):1596-1604.
355. Paterson AH, Bowers JE, Bruggmann R, Dubchak I, Grimwood J, Gundlach H, Haberer G, Hellsten U, Mitros T, Poliakov A et al: The Sorghum bicolor genome and the diversification of grasses. Nature 2009, 457(7229):551-556.

185
356. Schnable PS, Ware D, Fulton RS, Stein JC, Wei F, Pasternak S, Liang C, Zhang J, Fulton L, Graves TA et al: The B73 maize genome: complexity, diversity, and dynamics. Science 2009, 326(5956):1112-1115.
357. Becker SA, Palsson BO: Context-specific metabolic networks are consistent with experiments. PLoS computational biology 2008, 4(5):e1000082.
358. Shlomi T, Cabili MN, Herrgard MJ, Palsson BO, Ruppin E: Network-based prediction of human tissue-specific metabolism. Nature biotechnology 2008, 26(9):1003-1010.
359. Jensen PA, Papin JA: Functional integration of a metabolic network model and expression data without arbitrary thresholding. Bioinformatics 2011, 27(4):541-547.
360. Colijn C, Brandes A, Zucker J, Lun DS, Weiner B, Farhat MR, Cheng TY, Moody DB, Murray M, Galagan JE: Interpreting expression data with metabolic flux models: predicting Mycobacterium tuberculosis mycolic acid production. PLoS computational biology 2009, 5(8):e1000489.
361. Chandrasekaran S, Price ND: Probabilistic integrative modeling of genome-scale metabolic and regulatory networks in Escherichia coli and Mycobacterium tuberculosis. Proceedings of the National Academy of Sciences of the United States of America 2010, 107(41):17845-17850.
362. Friso G, Majeran W, Huang MS, Sun Q, van Wijk KJ: Reconstruction of Metabolic Pathways, Protein Expression, and Homeostasis Machineries across Maize Bundle Sheath and Mesophyll Chloroplasts: Large-Scale Quantitative Proteomics Using the First Maize Genome Assembly. Plant Physiol 2010, 152(3):1219-1250.
363. Li PH, Ponnala L, Gandotra N, Wang L, Si YQ, Tausta SL, Kebrom TH, Provart N, Patel R, Myers CR et al: The developmental dynamics of the maize leaf transcriptome. Nat Genet 2010, 42(12):1060-U1051.
364. Chang YM, Liu WY, Shih ACC, Shen MN, Lu CH, Lu MYJ, Yang HW, Wang TY, Chen SCC, Chen SM et al: Characterizing Regulatory and Functional Differentiation between Maize Mesophyll and Bundle Sheath Cells by Transcriptomic Analysis. Plant Physiol 2012, 160(1):165-177.
365. Majeran W, Cai Y, Sun Q, van Wijk KJ: Functional differentiation of bundle sheath and mesophyll maize chloroplasts determined by comparative proteomics. The Plant cell 2005, 17(11):3111-3140.
366. Chung BK, Lee DY: Flux-sum analysis: a metabolite-centric approach for understanding the metabolic network. BMC systems biology 2009, 3:117.
367. Reznik E, Mehta P, Segre D: Flux imbalance analysis and the sensitivity of cellular growth to changes in metabolite pools. PLoS computational biology 2013, 9(8):e1003195.
368. Nelson DL, Cox MM: Oxidative Phosphorylation and Photophosphorylation. In: Lehninger Principles of Biochemsitry. Fifth edn. New York: W.H.Freeman & Co.; 2009: 707-772.
369. Taiz LaZ, E.: Plant Physiology, Fifth edn. Sunderland, Massachusetts: Sinauer Associates Inc.; 2010.

186
370. Bachlava E, Dewey R, Burton J, Cardinal AJ: Mapping candidate genes for oleate biosynthesis and their association with unsaturated fatty acid seed content in soybean. Mol Breeding 2009, 23(2):337-347.
371. Li-Beisson Y, Shorrosh B, Beisson F, Andersson MX, Arondel V, Bates PD, Baud S, Bird D, Debono A, Durrett TP et al: Acyl-lipid metabolism. The Arabidopsis book / American Society of Plant Biologists 2010, 8:e0133.
372. Mekhedov S, de Ilarduya OM, Ohlrogge J: Toward a functional catalog of the plant genome. A survey of genes for lipid biosynthesis. Plant Physiol 2000, 122(2):389-402.
373. Murata N: Molecular-Species Composition of Phosphatidylglycerols from Chilling-Sensitive and Chilling-Resistant Plants. Plant and Cell Physiology 1983, 24(1):81-86.
374. Moore TS: Phospholipid Biosynthesis. Annu Rev Plant Phys 1982, 33:235-259. 375. Rolland N, Curien G, Finazzi G, Kuntz M, Marechal E, Matringe M, Ravanel S,
Seigneurin-Berny D: The biosynthetic capacities of the plastids and integration between cytoplasmic and chloroplast processes. Annual review of genetics 2012, 46:233-264.
376. Murata N, Tasaka Y: Glycerol-3-phosphate acyltransferase in plants. Bba-Lipid Lipid Met 1997, 1348(1-2):10-16.
377. Amiour N, Imbaud S, Clement G, Agier N, Zivy M, Valot B, Balliau T, Armengaud P, Quillere I, Canas R et al: The use of metabolomics integrated with transcriptomic and proteomic studies for identifying key steps involved in the control of nitrogen metabolism in crops such as maize. J Exp Bot 2012, 63(14):5017-5033.
378. Hirel B, Martin A, Terce-Laforgue T, Gonzalez-Moro MB, Estavillo JM: Physiology of maize I: A comprehensive and integrated view of nitrogen metabolism in a C4 plant. Physiol Plantarum 2005, 124(2):167-177.
379. Martin A, Belastegui-Macadam X, Quillere I, Floriot M, Valadier MH, Pommel B, Andrieu B, Donnison I, Hirel B: Nitrogen management and senescence in two maize hybrids differing in the persistence of leaf greenness: agronomic, physiological and molecular aspects. New Phytologist 2005, 167(2):483-492.
380. Gallais A, Hirel B: An approach to the genetics of nitrogen use efficiency in maize. J Exp Bot 2004, 55(396):295-306.
381. Coïc Y, Lesaint C: Comment assurer une bonne nutrition en eau et en ions minéraux en horticulture. Hortic Française 1971, 8:11-14.
382. Terce-Laforgue T, Mack G, Hirel B: New insights towards the function of glutamate dehydrogenase revealed during source-sink transition of tobacco (Nicotiana tabacum) plants grown under different nitrogen regimes. Physiol Plant 2004, 120(2):220-228.
383. Verwoerd TC, Dekker BMM, Hoekema A: A Small-Scale Procedure for the Rapid Isolation of Plant Rnas. Nucleic Acids Res 1989, 17(6):2362-2362.
384. Dellaporta S, Wood J, Hicks J: A plant DNA minipreparation: Version II. Plant Mol Biol Rep 1983, 1(4):19-21.
385. Eberwine J: Amplification of mRNA populations using aRNA generated from immobilized oligo(dT)-T7 primed cDNA. Biotechniques 1996, 20(4):584-&.

187
386. Imbeaud S, Graudens E, Boulanger V, Barlet X, Zaborski P, Eveno E, Mueller O, Schroeder A, Auffray C: Towards standardization of RNA quality assessment using user-independent classifiers of microcapillary electrophoresis traces. Nucleic Acids Res 2005, 33(6):e56.
387. Graudens E, Boulanger V, Mollard C, Mariage-Samson R, Barlet X, Gremy G, Couillault C, Lajemi M, Piatier-Tonneau D, Zaborski P et al: Deciphering cellular states of innate tumor drug responses. Genome biology 2006, 7(3):R19.
388. Marisa L, Ichante JL, Reymond N, Aggerbeck L, Delacroix H, Mucchielli-Giorgi MH: MAnGO: an interactive R-based tool for two-colour microarray analysis. Bioinformatics 2007, 23(17):2339-2341.
389. Smyth GK, Speed T: Normalization of cDNA microarray data. Methods 2003, 31(4):265-273.
390. Tusher VG, Tibshirani R, Chu G: Significance analysis of microarrays applied to the ionizing radiation response. Proceedings of the National Academy of Sciences of the United States of America 2001, 98(9):5116-5121.
391. Korn EL, McShane LM, Troendle JF, Rosenwald A, Simon R: Identifying pre-post chemotherapy differences in gene expression in breast tumours: a statistical method appropriate for this aim. British journal of cancer 2002, 86(7):1093-1096.
392. Benjamini Y, Hochberg Y: Controlling the False Discovery Rate - a Practical and Powerful Approach to Multiple Testing. J Roy Stat Soc B Met 1995, 57(1):289-300.
393. Mechin V, Thevenot C, Le Guilloux M, Prioul JL, Damerval C: Developmental analysis of maize endosperm proteome suggests a pivotal role for pyruvate orthophosphate dikinase. Plant Physiol 2007, 143(3):1203-1219.
394. Cataldo DA, Haroon M, Schrader LE, Youngs VL: Rapid Colorimetric Determination of Nitrate in Plant-Tissue by Nitration of Salicylic-Acid. Commun Soil Sci Plan 1975, 6(1):71-80.
395. Rosen H: A Modified Ninhydrin Colorimetric Analysis for Amino Acids. Arch Biochem Biophys 1957, 67(1):10-15.
396. Arnon DI: Copper Enzymes in Isolated Chloroplasts - Polyphenoloxidase in Beta-Vulgaris. Plant Physiol 1949, 24(1):1-15.
397. Ferrario-Mery S, Valadier MH, Foyer CH: Overexpression of nitrate reductase in tobacco delays drought-induced decreases in nitrate reductase activity and mRNA. Plant Physiol 1998, 117(1):293-302.
398. Miquel M, Browse J: Arabidopsis Mutants Deficient in Polyunsaturated Fatty-Acid Synthesis - Biochemical and Genetic-Characterization of a Plant Oleoyl-Phosphatidylcholine Desaturase. J Biol Chem 1992, 267(3):1502-1509.
399. Ohnishi J, Yamada M: Glycerolipid Synthesis in Avena Leaves during Greening of Etiolated Seedlings .2. Alpha-Linolenic Acid Synthesis. Plant and Cell Physiology 1980, 21(8):1607-1618.
400. Harholt J, Jensen JK, Sorensen SO, Orfila C, Pauly M, Scheller HV: ARABINAN DEFICIENT 1 is a putative arabinosyltransferase involved in

188
biosynthesis of Pectic Arabinan in Arabidopsis. Plant Physiol 2006, 140(1):49-58.
401. Updegraff DM: Semimicro determination of cellulose in biological materials. Analytical biochemistry 1969, 32(3):420-424.
402. Harholt J, Jensen JK, Sorensen SO, Orfila C, Pauly M, Scheller HV: ARABINAN DEFICIENT 1 is a putative arabinosyltransferase involved in biosynthesis of pectic arabinan in Arabidopsis. Plant Physiol 2006, 140(1):49-58.
403. Fukushima RS, Hatfield RD: Extraction and isolation of lignin for utilization as a standard to determine lignin concentration using the acetyl bromide spectrophotometric method. J Agr Food Chem 2001, 49(7):3133-3139.
404. Fiehn O: Metabolite profiling in Arabidopsis. Methods Mol Biol 2006, 323:439-447.
405. Zybailov B, Rutschow H, Friso G, Rudella A, Emanuelsson O, Sun Q, van Wijk KJ: Sorting Signals, N-Terminal Modifications and Abundance of the Chloroplast Proteome. Plos One 2008, 3(4).
406. Kim J, Rudella A, Rodriguez VR, Zybailov B, Olinares PDB, van Wijk KJ: Subunits of the Plastid ClpPR Protease Complex Have Differential Contributions to Embryogenesis, Plastid Biogenesis, and Plant Development in Arabidopsis. The Plant cell 2009, 21(6):1669-1692.
407. Ehleringer JR, Cerling TE, Helliker BR: C₄ Photosynthesis, Atmospheric CO₂ , and Climate. Oecologia 1997, 112(3):285-299.
408. Zhao Q, Chen S, Dai S: C4 photosynthetic machinery: insights from maize chloroplast proteomics. Frontiers in plant science 2013, 4:85.
409. Leegood RC: The Intercellular Compartmentation of Metabolites in Leaves of Zea-Mays-L. Planta 1985, 164(2):163-171.
410. Weiner H, Heldt HW: Inter- and intracellular distribution of amino acids and other metabolites in maize (Zea mays L.) leaves. Planta 1992, 187:242-246.
411. Stitt M, Heldt HW: Generation and Maintenance of Concentration Gradients between the Mesophyll and Bundle Sheath in Maize Leaves. Biochim Biophys Acta 1985, 808(3):400-414.
412. Sowiński P, Szczepanik J, Minchin PEH: On the mechanism of C4 photosynthesis intermediate exchange between Kranz mesophyll and bundle sheath cells in grasses. J Exp Bot 2008, 59(6):1137-1147.
413. Taniguchi Y, Nagasaki J, Kawasaki M, Miyake H, Sugiyama T, Taniguchi M: Differentiation of dicarboxylate transporters in mesophyll and bundle sheath chloroplasts of maize. Plant & cell physiology 2004, 45(2):187-200.
414. Doulis AG, Debian N, KingstonSmith AH, Foyer CH: Differential localization of antioxidants in maize leaves. Plant Physiol 1997, 114(3):1031-1037.
415. Burgener M, Suter M, Jones S, Brunold C: Cyst(e)ine is the transport metabolite of assimilated sulfur from bundle-sheath to mesophyll cells in maize leaves. Plant Physiol 1998, 116(4):1315-1322.
416. Furbank RT, Jenkins CLD, Hatch MD: Co2 Concentrating Mechanism of C4 Photosynthesis - Permeability of Isolated Bundle Sheath-Cells to Inorganic Carbon. Plant Physiol 1989, 91(4):1364-1371.

189
417. Alberte RS, Thornber JP: Water stress effects on the content and organization of chlorophyll in mesophyll and bundle sheath chloroplasts of maize. Plant Physiol 1977, 59(3):351-353.
418. Mintz-Oron S, Meir S, Malitsky S, Ruppin E, Aharoni A, Shlomi T: Reconstruction of Arabidopsis metabolic network models accounting for subcellular compartmentalization and tissue-specificity. Proceedings of the National Academy of Sciences of the United States of America 2012, 109(1):339-344.
419. Schellenberger J, Lewis NE, Palsson BO: Elimination of thermodynamically infeasible loops in steady-state metabolic models (vol 100, pg 544, 2010). Biophys J 2011, 100(5):1381-1381.

190
Appendix
SBML files of all the genome-scale metabolic models (as presented in this dissertation) could be
accessible via the web page of Maranas lab (http://maranas.che.psu.edu/models.htm). In addition,
the supplementary files/info of each of the publications (related to this dissertation) can be
obtained via each of these journals’ individual web pages.

191
VITA
Rajib Saha
Education
Institute Field of study Degree Year Penn State University Chemical Engineering PhD 2009-2014 Penn State University Chemical Engineering MS 2009-2011 Bangladesh University
of Engineering & Technology
Chemical Engineering BS 2000-2005
Honors and Awards
2012 Genomic Sciences Meeting Student Travel Grant, Department of Energy
(DOE), Bethesda, MD 2014 NSF N2 Meeting (PI retreat) Student Travel Grant, San Francisco, CA
Publications
i. Saha, R., P.F. Suthers and C.D. Maranas (2011), "Zea mays iRS1563: A Comprehensive Genome-Scale Metabolic Reconstruction of Maize Metabolism.," PLoS ONE, 6(7): e21784.
ii. Saha, R., A.T. Verseput, B.M. Berla, T.J.Mueller, H.B. Pakrasi and C.D.Maranas (2012), "Reconstruction and comparison of the metabolic potential of cyanobacteria Cyanothece sp. ATCC 51142 and Synechocystis sp. PCC 6803," PLoS ONE, 7(10):e48285.
iii. Berla, B.M., Saha, R., Immethun, C.D., Maranas, C.D., Moon, T.S. and Pakrasi, H.B. (2013), "Synthetic biology of cyanobacteria: unique challenges and opportunities", Frontiers in Microbiology, 4.
iv. Saha, R.*, Chowdhury, A.* and C.D. Maranas (2014), "Recent advances in the reconstruction of metabolic models and integration of omics data", Current Opinion in Biotechnology, 29, 39-45.
v. Simons, M, Saha, R., Guillard, L., Clement, G., Armengaud, P., Canas, R, Maranas, C.D., Lea, P.J. and B. Hirel (2014), “Nitrogen-use efficiency in maize (Zea mays L.): from ‘omics’studies to metabolic modelling”, Journal of Experimental Botany, doi: 10.1093/jxb/eru227.
vi. Simons, M.*, Saha, R.*, Amiour, N., Kumar, A., Guillard, L, Clément, G., Miquel, M., Zheni, L., Mouille, G., Hirel, B. and Costas D. Maranas (submitted), “Assessing the Metabolic Impact of Nitrogen Availability using a Compartmentalized Maize Leaf Genome-Scale Model”. * These authors contributed equally.
Related Documents