Reconstructing the Population Genetic History of the Caribbean Andre ´ s Moreno-Estrada 1 , Simon Gravel 1,2 , Fouad Zakharia 1 , Jacob L. McCauley 3 , Jake K. Byrnes 1,4 , Christopher R. Gignoux 5 , Patricia A. Ortiz-Tello 1 , Ricardo J. Martı´nez 3 , Dale J. Hedges 3 , Richard W. Morris 3 , Celeste Eng 5 , Karla Sandoval 1 , Suehelay Acevedo-Acevedo 6 , Paul J. Norman 7 , Zulay Layrisse 8 , Peter Parham 7 , Juan Carlos Martı´nez-Cruzado 6 , Esteban Gonza ´ lez Burchard 5 , Michael L. Cuccaro 3 , Eden R. Martin "3 *, Carlos D. Bustamante "1 * 1 Department of Genetics, Stanford University School of Medicine, Stanford, California, United States of America, 2 Department of Human Genetics and Genome Quebec Innovation Centre, McGill University, Montreal, Que ´ bec, Canada, 3 Center for Genetic Epidemiology and Statistical Genetics, John P. Hussman Institute for Human Genomics, University of Miami Miller School of Medicine, Miami, Florida, United States of America, 4 Ancestry.com DNA, LLC, San Francisco, California, United States of America, 5 Department of Bioengineering and Therapeutic Sciences, University of California San Francisco, California, United States of America, 6 Department of Biology, University of Puerto Rico at Mayaguez, Mayaguez, Puerto Rico, 7 Department of Structural Biology, Stanford University School of Medicine, Stanford, California, United States of America, 8 Center of Experimental Medicine ‘‘Miguel Layrisse’’, IVIC, Caracas, Venezuela Abstract The Caribbean basin is home to some of the most complex interactions in recent history among previously diverged human populations. Here, we investigate the population genetic history of this region by characterizing patterns of genome-wide variation among 330 individuals from three of the Greater Antilles (Cuba, Puerto Rico, Hispaniola), two mainland (Honduras, Colombia), and three Native South American (Yukpa, Bari, and Warao) populations. We combine these data with a unique database of genomic variation in over 3,000 individuals from diverse European, African, and Native American populations. We use local ancestry inference and tract length distributions to test different demographic scenarios for the pre- and post- colonial history of the region. We develop a novel ancestry-specific PCA (ASPCA) method to reconstruct the sub-continental origin of Native American, European, and African haplotypes from admixed genomes. We find that the most likely source of the indigenous ancestry in Caribbean islanders is a Native South American component shared among inland Amazonian tribes, Central America, and the Yucatan peninsula, suggesting extensive gene flow across the Caribbean in pre-Columbian times. We find evidence of two pulses of African migration. The first pulse—which today is reflected by shorter, older ancestry tracts—consists of a genetic component more similar to coastal West African regions involved in early stages of the trans-Atlantic slave trade. The second pulse—reflected by longer, younger tracts—is more similar to present-day West- Central African populations, supporting historical records of later transatlantic deportation. Surprisingly, we also identify a Latino-specific European component that has significantly diverged from its parental Iberian source populations, presumably as a result of small European founder population size. We demonstrate that the ancestral components in admixed genomes can be traced back to distinct sub-continental source populations with far greater resolution than previously thought, even when limited pre-Columbian Caribbean haplotypes have survived. Citation: Moreno-Estrada A, Gravel S, Zakharia F, McCauley JL, Byrnes JK, et al. (2013) Reconstructing the Population Genetic History of the Caribbean. PLoS Genet 9(11): e1003925. doi:10.1371/journal.pgen.1003925 Editor: Eduardo Tarazona-Santos, Universidade Federal de Minas Gerais, Brazil Received May 7, 2013; Accepted September 5, 2013; Published November 14, 2013 Copyright: ß 2013 Moreno-Estrada et al. This is an open-access article distributed under the terms of the Creative Commons Attribution License, which permits unrestricted use, distribution, and reproduction in any medium, provided the original author and source are credited. Funding: This project was supported by NIH grant 1R01GM090087 to ERM and CDB, NSF grant DMS-1201234 to CDB, the National Institute on Minority Health and Health Disparities (P60MD006902) to EGB, and NIH Training Grant T32 GM007175 to CRG. This work was also partially supported by an award from the Stanley J. Glaser Foundation to JLM and ERM, and by the George Rosenkranz Prize for Health Care Research in Developing Countries awarded to AME. The funders had no role in study design, data collection and analysis, decision to publish, or preparation of the manuscript. Competing Interests: JKB is an employee of Ancestry.com. CDB is on the Scientific Advisory Board of Ancestry.com, 23andMe’s ‘‘Roots into the Future’’ project, and Personalis, Inc. He is on the medical advisory board of Invitae and Med-tek. None of these entities played any role in the project or research results reported here. * E-mail: [email protected] (EM); [email protected] (CDB) " ERM and CDB are joint senior authors on this work. Introduction Genomic characterization of diverse human populations is critical for enabling multi-ethnic genome-wide studies of complex traits [1]. Genome-wide data also affords reconstruction of population history at finer scales, shedding light on evolutionary processes shaping the genetic composition of peoples with complex demographic histories. This genetic reconstruction is especially relevant in recently admixed populations from the Americas. Native peoples throughout the American continent experienced a dramatic demographic change triggered by the arrival of Europeans and the subsequent African slave trade. Important progress has been made to characterize genome-wide patterns of these three continental-level ancestral components in admixed populations from the continental landmass [2] and other Hispanic/Latino populations [3], including recent genotyping PLOS Genetics | www.plosgenetics.org 1 November 2013 | Volume 9 | Issue 11 | e1003925

Welcome message from author
This document is posted to help you gain knowledge. Please leave a comment to let me know what you think about it! Share it to your friends and learn new things together.
Transcript
Reconstructing the Population Genetic History of theCaribbeanAndres Moreno-Estrada1, Simon Gravel1,2, Fouad Zakharia1, Jacob L. McCauley3, Jake K. Byrnes1,4,
Christopher R. Gignoux5, Patricia A. Ortiz-Tello1, Ricardo J. Martınez3, Dale J. Hedges3,
Richard W. Morris3, Celeste Eng5, Karla Sandoval1, Suehelay Acevedo-Acevedo6, Paul J. Norman7,
Zulay Layrisse8, Peter Parham7, Juan Carlos Martınez-Cruzado6, Esteban Gonzalez Burchard5,
Michael L. Cuccaro3, Eden R. Martin"3*, Carlos D. Bustamante"1*
1 Department of Genetics, Stanford University School of Medicine, Stanford, California, United States of America, 2 Department of Human Genetics and Genome Quebec
Innovation Centre, McGill University, Montreal, Quebec, Canada, 3 Center for Genetic Epidemiology and Statistical Genetics, John P. Hussman Institute for Human
Genomics, University of Miami Miller School of Medicine, Miami, Florida, United States of America, 4 Ancestry.com DNA, LLC, San Francisco, California, United States of
America, 5 Department of Bioengineering and Therapeutic Sciences, University of California San Francisco, California, United States of America, 6 Department of Biology,
University of Puerto Rico at Mayaguez, Mayaguez, Puerto Rico, 7 Department of Structural Biology, Stanford University School of Medicine, Stanford, California, United
States of America, 8 Center of Experimental Medicine ‘‘Miguel Layrisse’’, IVIC, Caracas, Venezuela
Abstract
The Caribbean basin is home to some of the most complex interactions in recent history among previously diverged humanpopulations. Here, we investigate the population genetic history of this region by characterizing patterns of genome-widevariation among 330 individuals from three of the Greater Antilles (Cuba, Puerto Rico, Hispaniola), two mainland (Honduras,Colombia), and three Native South American (Yukpa, Bari, and Warao) populations. We combine these data with a uniquedatabase of genomic variation in over 3,000 individuals from diverse European, African, and Native American populations.We use local ancestry inference and tract length distributions to test different demographic scenarios for the pre- and post-colonial history of the region. We develop a novel ancestry-specific PCA (ASPCA) method to reconstruct the sub-continentalorigin of Native American, European, and African haplotypes from admixed genomes. We find that the most likely source ofthe indigenous ancestry in Caribbean islanders is a Native South American component shared among inland Amazoniantribes, Central America, and the Yucatan peninsula, suggesting extensive gene flow across the Caribbean in pre-Columbiantimes. We find evidence of two pulses of African migration. The first pulse—which today is reflected by shorter, olderancestry tracts—consists of a genetic component more similar to coastal West African regions involved in early stages of thetrans-Atlantic slave trade. The second pulse—reflected by longer, younger tracts—is more similar to present-day West-Central African populations, supporting historical records of later transatlantic deportation. Surprisingly, we also identify aLatino-specific European component that has significantly diverged from its parental Iberian source populations,presumably as a result of small European founder population size. We demonstrate that the ancestral components inadmixed genomes can be traced back to distinct sub-continental source populations with far greater resolution thanpreviously thought, even when limited pre-Columbian Caribbean haplotypes have survived.
Citation: Moreno-Estrada A, Gravel S, Zakharia F, McCauley JL, Byrnes JK, et al. (2013) Reconstructing the Population Genetic History of the Caribbean. PLoSGenet 9(11): e1003925. doi:10.1371/journal.pgen.1003925
Editor: Eduardo Tarazona-Santos, Universidade Federal de Minas Gerais, Brazil
Received May 7, 2013; Accepted September 5, 2013; Published November 14, 2013
Copyright: � 2013 Moreno-Estrada et al. This is an open-access article distributed under the terms of the Creative Commons Attribution License, which permitsunrestricted use, distribution, and reproduction in any medium, provided the original author and source are credited.
Funding: This project was supported by NIH grant 1R01GM090087 to ERM and CDB, NSF grant DMS-1201234 to CDB, the National Institute on Minority Healthand Health Disparities (P60MD006902) to EGB, and NIH Training Grant T32 GM007175 to CRG. This work was also partially supported by an award from the StanleyJ. Glaser Foundation to JLM and ERM, and by the George Rosenkranz Prize for Health Care Research in Developing Countries awarded to AME. The funders had norole in study design, data collection and analysis, decision to publish, or preparation of the manuscript.
Competing Interests: JKB is an employee of Ancestry.com. CDB is on the Scientific Advisory Board of Ancestry.com, 23andMe’s ‘‘Roots into the Future’’ project,and Personalis, Inc. He is on the medical advisory board of Invitae and Med-tek. None of these entities played any role in the project or research results reportedhere.
* E-mail: [email protected] (EM); [email protected] (CDB)
" ERM and CDB are joint senior authors on this work.
Introduction
Genomic characterization of diverse human populations is
critical for enabling multi-ethnic genome-wide studies of complex
traits [1]. Genome-wide data also affords reconstruction of
population history at finer scales, shedding light on evolutionary
processes shaping the genetic composition of peoples with complex
demographic histories. This genetic reconstruction is especially
relevant in recently admixed populations from the Americas.
Native peoples throughout the American continent experienced a
dramatic demographic change triggered by the arrival of
Europeans and the subsequent African slave trade. Important
progress has been made to characterize genome-wide patterns of
these three continental-level ancestral components in admixed
populations from the continental landmass [2] and other
Hispanic/Latino populations [3], including recent genotyping
PLOS Genetics | www.plosgenetics.org 1 November 2013 | Volume 9 | Issue 11 | e1003925
and sequencing studies involving Puerto Rican samples [4,5,6].
However, no genomic survey has focused on multiple populations
of Caribbean descent, and critical questions remain regarding
their recent demographic history and fine-scale population
structure. Several factors distinguish the Antilles and the broader
Caribbean basin from the rest of North, Central, and South
America, resulting in a unique territory with particular dynamics
impacting each of its ancestral components.
First, native pre-Columbian populations suffered dramatic
population bottlenecks soon after contact. This poses a challenge
for reconstructing population genetic history because extant
admixed populations have retained a limited proportion of the
native genetic lineages [7]. Second, it is widely documented that
the initial encounter between Europeans and Native Americans,
such as the first voyages of Columbus, took place in the Caribbean
before involving mainland populations. However it remains
unclear whether the earlier onset of admixture in the Caribbean
translates into substantial differences in the European genetic
component of present-day admixed Caribbean genomes, com-
pared to other Hispanic/Latino populations impacted by later,
and probably more numerous, waves of European migrants.
Third, the Antilles and surrounding mainland of the Caribbean
were the initial destination for much of the trans-Atlantic slave
trade, resulting in admixed populations with higher levels of
African ancestry compared to most inland populations across the
continent. However, the sub-continental origins of African
populations that contributed to present-day Caribbean genomes
remain greatly under-characterized.
Disentangling the origin and interplay among ancestral
components during the process of admixture enhances our
knowledge of Caribbean populations and populations of Carib-
bean descent, informing the design of next-generation medical
genomic studies involving these groups. Here, we present SNP
array data for 251 individuals of Caribbean descent sampled in
South Florida using a parent-offspring trio design and 79 native
Venezuelans sampled along the Caribbean coast. The family-
based samples include individuals with grandparents of either
Cuban, Haitian, Dominican, Puerto Rican, Colombian, or
Honduran descent. The 79 native Venezuelan samples are of
Yukpa, Warao, and Bari tribal affiliation. We construct a unique
database which includes public and data access committee-
controlled data on genomic variation from over 3,000 individuals
including HapMap [8], 1000 Genomes [6], and POPRES [9]
populations, and African [10] and Native American [11] SNP data
from diverse sub-continental populations employed as reference
panels. We apply admixture deconvolution methods and develop a
novel ancestry-specific PCA method (ASPCA) to infer the sub-
continental origin of haplotypes along the genome, yielding a
finer-resolution picture of the ancestral components of present-day
Caribbean and surrounding mainland populations. Additionally,
by analyzing the tract length distribution of genomic segments
attributable to distinct ancestries, we test demographic models of
the recent population history of the Greater Antilles and mainland
populations since the onset of inter-continental admixture.
Results
Population structure of the CaribbeanTo characterize population structure across the Antilles and
neighboring mainland populations, we combined our genotype
data for the six Latino populations with continental population
samples from western Africa, Europe, and the Americas, as well as
additional admixed Latino populations (see Table S1). To
maximize SNP density, we initially restricted our reference panels
to representative subsets of populations with available Affymetrix
SNP array data (Figure 1A). Using a common set of ,390 K
SNPs, we applied both principal component analysis (PCA) and an
unsupervised clustering algorithm, ADMIXTURE [12], to
explore patterns of population structure. Figure 1B shows the
distribution in PCA space of each individual, recapitulating
clustering patterns previously observed in Hispanic/Latino pop-
ulations [3]: Mexicans cluster largely between European and
Native American components, Colombians and Puerto Ricans
show three-way admixture, and Dominicans principally cluster
between the African and European components. Ours is the first
study to characterize genomic patterns of variation from (1)
Hondurans, which we show have a higher proportion of African
ancestry than Mexicans, (2) Cubans, which show extreme
variation in ancestry proportions ranging from 2% to 78% West
African ancestry, and (3) Haitians, which showed the largest
average proportion of West African ancestry (84%). Additional
clustering patterns obtained from higher PCs are shown in Figure
S1.
We used the program ADMIXTURE to fit a model of
admixture in which an individual’s genome is composed of sites
from up to K ancestral populations. We explored K = 2 through 15
ancestral populations (Figure S2) to investigate how assumptions
regarding K impact the inference of population structure.
Assuming a K = 3 admixture model, population admixture
patterns are driven by continental reference samples with no
continental subdivision (Figure 1C, top panel). However, higher Ks
show substantial substructure in all three continental components.
Log likelihoods for successively increasing levels of K continue to
increase substantially as K increases (Figure S3a), which is not
unexpected since higher values of K add more parameters to the
model (thereby improving the fit). Using cross-validation we found
that K = 7 and K = 8 have the lowest predicted error (Figure S3b);
thus, we focused on these two models.
The first sub-continental components that emerge are repre-
sented by South American population isolates, namely the three
Author Summary
Latinos are often regarded as a single heterogeneousgroup, whose complex variation is not fully appreciated inseveral social, demographic, and biomedical contexts. Bymaking use of genomic data, we characterize ancestralcomponents of Caribbean populations on a sub-continen-tal level and unveil fine-scale patterns of populationstructure distinguishing insular from mainland Caribbeanpopulations as well as from other Hispanic/Latino groups.We provide genetic evidence for an inland South Americanorigin of the Native American component in islandpopulations and for extensive pre-Columbian gene flowacross the Caribbean basin. The Caribbean-derived Euro-pean component shows significant differentiation fromparental Iberian populations, presumably as a result offounder effects during the colonization of the New World.Based on demographic models, we reconstruct thecomplex population history of the Caribbean since theonset of continental admixture. We find that insularpopulations are best modeled as mixtures absorbing twopulses of African migrants, coinciding with the early andmaximum activity stages of the transatlantic slave trade.These two pulses appear to have originated in differentregions within West Africa, imprinting two distinguishablesignatures on present-day Afro-Caribbean genomes andshedding light on the genetic impact of the slave trade inthe Caribbean.
Ancestral Components of the Caribbean
PLOS Genetics | www.plosgenetics.org 2 November 2013 | Volume 9 | Issue 11 | e1003925
Venezuelan tribes of Yukpa, Warao, and Bari. At higher-order Ks,
we recapitulate the well-documented North-to-South American
axis of clinal genetic variation described by us [13] and others
[11,14], as Mesoamerican (Maya/Nahua) and Andean (Quechua/
Aymara) populations are assigned to different clusters (Figure S2).
Interestingly, Mayans are the only group showing substantially
higher contributions from the native Venezuelan components
(Figure 1C, bottom panel). Both Mesoamerican and Andean
Native American samples contain considerable amounts of
European ancestry, due to post-Columbian admixture. Above
K = 7, we observe a North-to-South European differentiation,
which is consistent with previous analyses [15,16]. Surprisingly, we
observe another European-specific component emerge as early as
K = 5 and remain constant through K = 15 (Figure S2). This
component accounts for the majority of the Caribbean Latinos’
European ancestry, and it only appears in Mediterranean
populations, including Italy, Greece, Portugal, and Spain at
intermediate proportions. Throughout this paper, we refer to this
component as the ‘‘Latino European’’ component, and it can be
seen clearly in Figure 1C (‘‘black’’ bars represent the Latino
European component, ‘‘Red’’ bars represent the ‘‘Northern
European’’, and pink the ‘‘Mediterranean’’ or ‘‘Southern Euro-
pean’’ component). At K = 8, when the clinal gradient of
differentiation between Southern and Northern Europeans
appears, the Latino European component is seen only in low
proportions in individuals from Portugal and Spain, whereas it is
the major European component among Latinos (Figure 1C,
bottom panel).
To identify possible sex-biased gene flow in Caribbean
populations, we compared the ancestry proportions of the X
chromosome vs. the autosomes in each population. We observe
a significant skew towards a higher proportion of Native
American ancestry on the X chromosome than on the
autosomes (p-value,1025, Figure S4), consistent with previous
reports on Hispanic/Latino populations [3]. Interestingly,
whereas some insular populations such as Cubans and Puerto
Ricans also showed a significant increase of African ancestry on
the X chromosome (p-value,0.01), the average difference in
mainland populations was not significant (p-value.0.05, Figure
S4). Overall, we find evidence of a high Native American, and
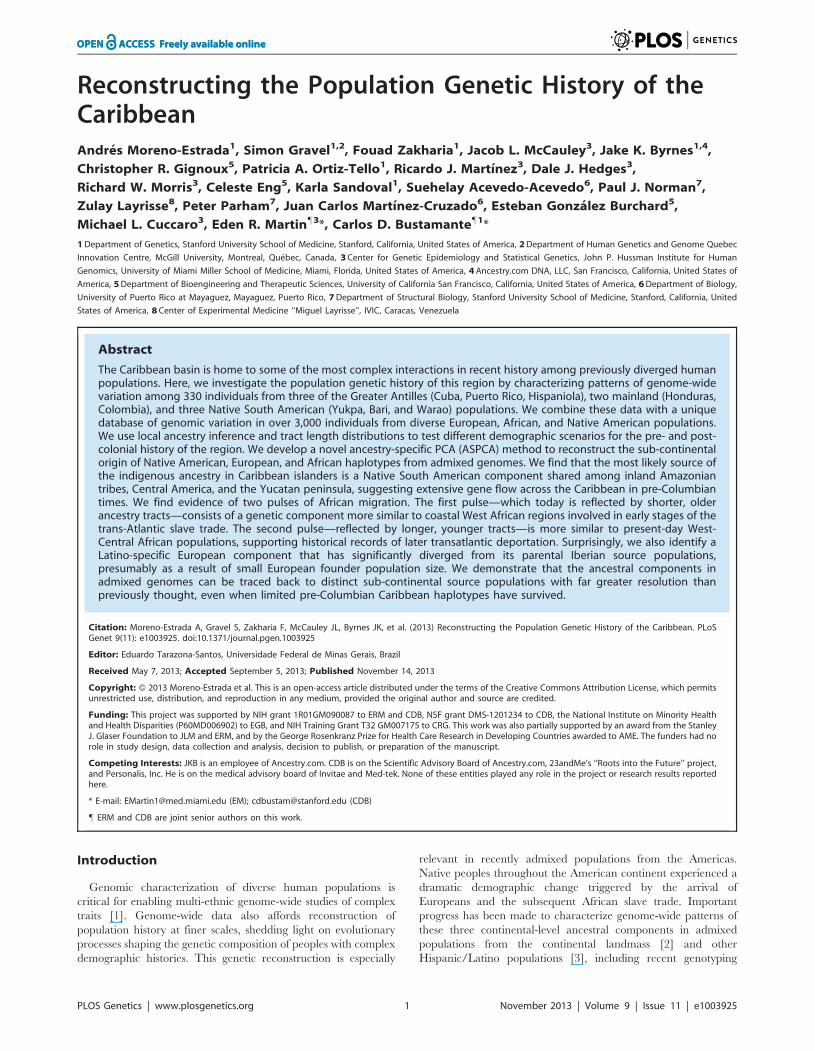
Figure 1. Population structure of Caribbean and neighboring populations. A) Areas in red indicate countries of origin of newly genotypedadmixed population samples and blue circles indicate new Venezuelan (underlined) and other previously published Native American samples. B)Principal Component Analysis and C) ADMIXTURE [12] clustering analysis using the high-density dataset containing approximately 390 K autosomalSNP loci in common across admixed and reference panel populations. Unsupervised models assuming K = 3 and K = 8 ancestral clusters are shown. AtK = 3, Caribbean admixed populations show extensive variation in continental ancestry proportions among and within groups. At K = 8, sub-continental components show differential proportions in recently admixed individuals. A Latino-specific European component accounts for themajority of the European ancestry among Caribbean Latinos and is exclusively shared with Iberian populations within Europe. Notably, thiscomponent is different from the two main gradients of ancestry differentiating southern from northern Europeans. Native Venezuelan componentsare present in higher proportions in admixed Colombians, Hondurans, and native Mayans.doi:10.1371/journal.pgen.1003925.g001
Ancestral Components of the Caribbean
PLOS Genetics | www.plosgenetics.org 3 November 2013 | Volume 9 | Issue 11 | e1003925
to a lesser extent African, female contribution in Caribbean
populations.
Additionally, our data show a strong signature of assortative
mating based on genetic ancestry among Caribbean Latinos, as
suggested by previous studies [17]. In particular, we see a strong
correlation between maternal and paternal ancestry proportions
(Figure S5). To assess significance, we compared correlation of
ancestry assignments among parent pairs to 100,000 permuted
male-female pairs for each continental ancestry. All p-values were
highly significant (p,0.00001, Table S2). It should be noted that
these tests are not independent since the three components of
ancestry by definition must sum to one. Further, apparent
assortative mating could be due to random mating within
structured sub-populations. To control for this, we performed
permutations within countries of origin, and found significant
correlations among individuals from every single population (p-
value,0.05), except for Haiti. Although Haitians do show the
same trend, with only two parent pairs, it is nearly impossible to
assess significance (Table S2).
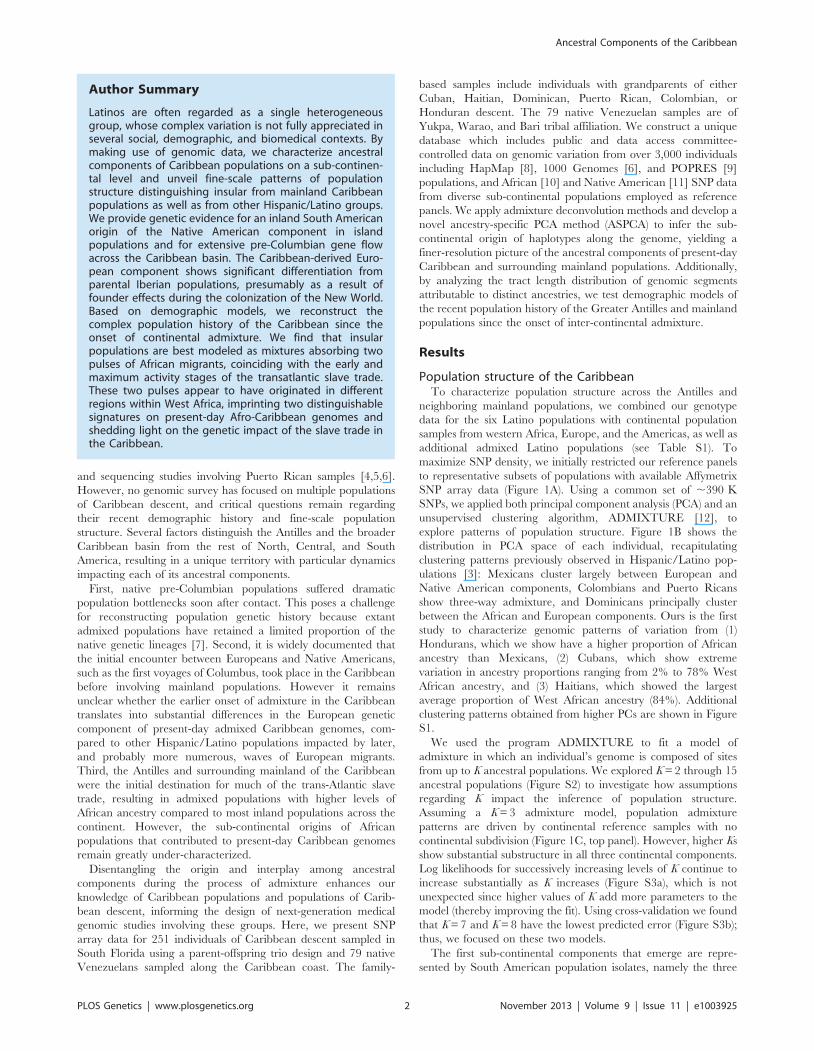
Demographic inference since the onset of admixtureAn overview of our analytic strategy for characterizing admixed
genomes is presented in Figure 2. Due to meiotic recombination,
the correlation in ancestry among founder chromosomes is broken
down over time. As a consequence, the length of tracts assigned to
distinct ancestries in admixed genomes is informative of the time
and mode of migration [18]. To explore the population genetic
history of the Caribbean since European colonization, we
considered the length distribution of continuous ancestry tracts
in each of the six population samples. First, we estimated local
ancestry along the genome using an updated version of PCAdmix
[19] which was trained using trio-phased data from the admixed
individuals and three continental reference populations. Next, we
characterized the length distribution of unbroken African,
European, and Native American ancestry tracts along each
chromosome for each population. Finally, we applied the extended
space Markov model implemented in Tracts [20] to compare the
observed data with predictions from different demographic models
considering various migration scenarios.
Figure 2. Diagram of the analytical strategy used for reconstructing migration history and sub-continental ancestry in admixedgenomes. The starting point consists of genome-wide SNP data from family trios. Unrelated individuals are used to estimate global ancestryproportions with ADMIXTURE, whereas full trios are selected for BEAGLE phasing and PCA-based local ancestry estimation using continentalreference samples. From here, two orthogonal analyses are performed: 1) Ancestry-specific regions of the genome are masked to separately applyPCA to European, African, and Native American haplotypes combined with large sub-continental reference panels of putative ancestral populations.We refer to this methodology as ancestry-specific PCA (ASPCA) and the code is packaged into the software PCAmask. 2) Continental-level localancestry calls are used to estimate the tract length distribution per ancestry and population, which is then leveraged to test different demographicmodels of migration using Tracts software.doi:10.1371/journal.pgen.1003925.g002
Ancestral Components of the Caribbean
PLOS Genetics | www.plosgenetics.org 4 November 2013 | Volume 9 | Issue 11 | e1003925
The simplest model considers a single pulse of migration from
each source population, allowing the admixture process to begin
with Native American and European chromosomes, followed by
the introduction of African chromosomes. In such a scenario, each
population contributes migrants at a discrete period in time, and
the average length of ancestry tracts is expected to decrease with
time after admixture, resulting in an exponential decay in the
abundance of tracts as a function of tract length. Alternative
models include a second pulse of either European or African
segments migrating into the already-admixed gene pool. Allowing
for continuous or repeated migration typically results in a concave
log-scale distribution, caused by the increase of longer tracts after
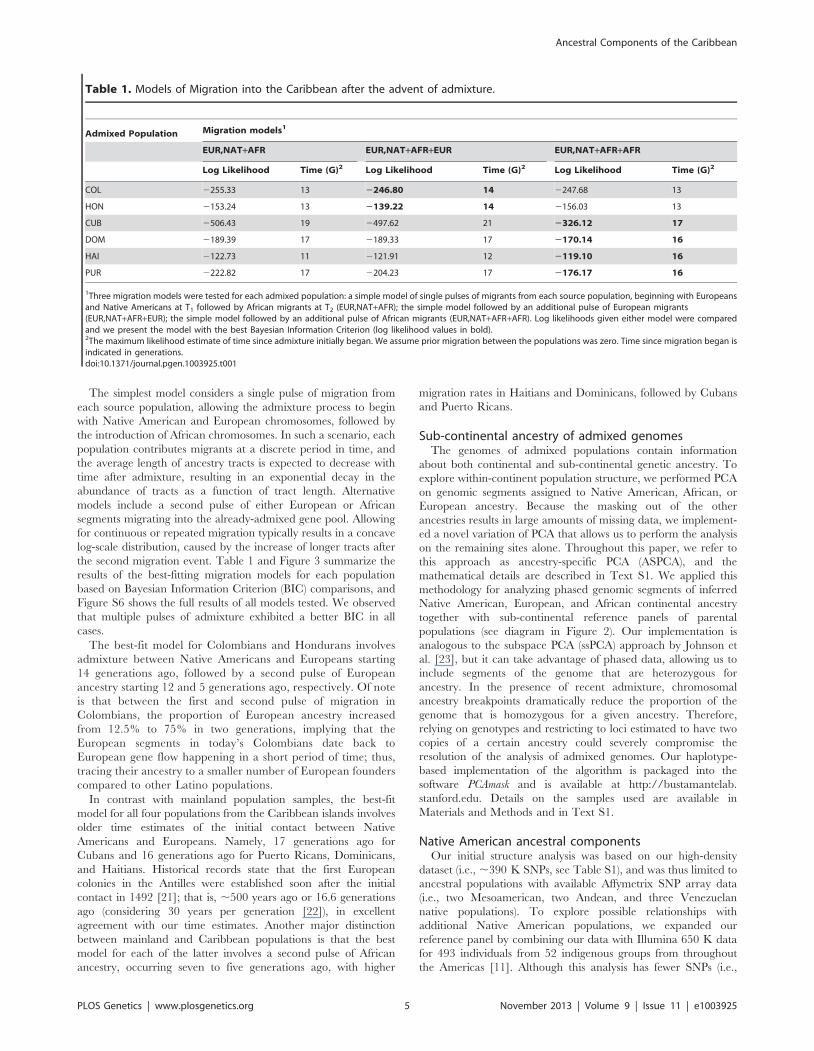
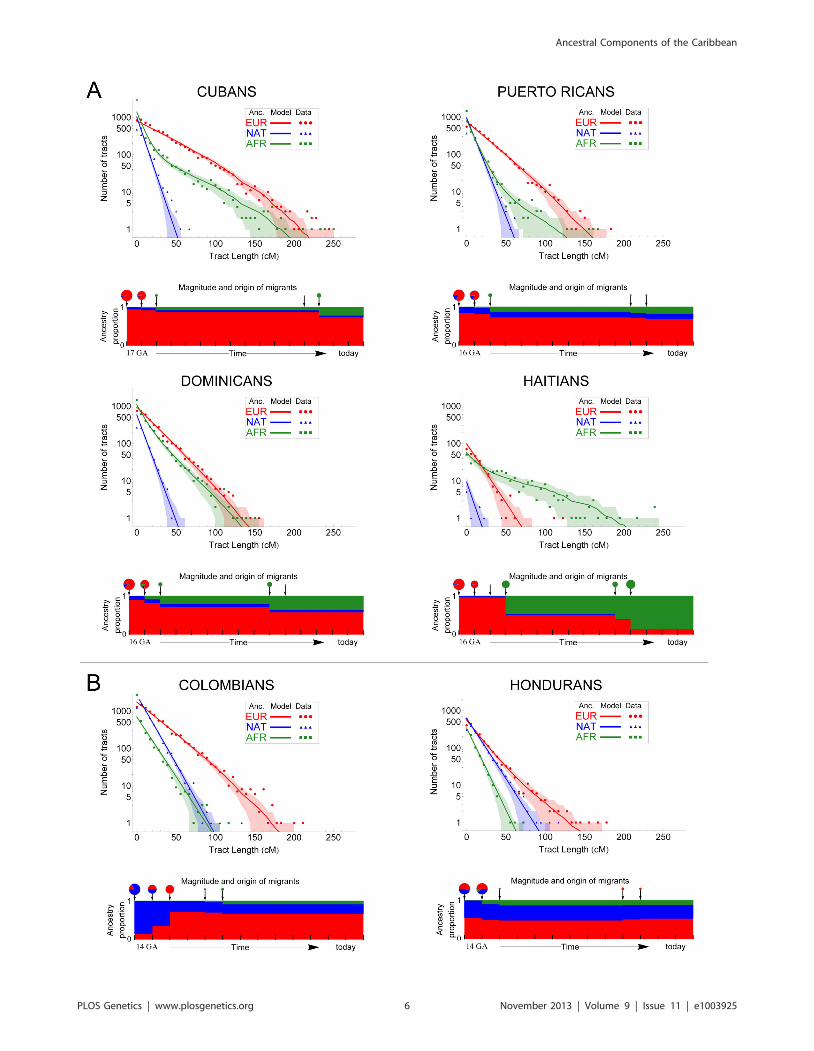
the second migration event. Table 1 and Figure 3 summarize the
results of the best-fitting migration models for each population
based on Bayesian Information Criterion (BIC) comparisons, and
Figure S6 shows the full results of all models tested. We observed
that multiple pulses of admixture exhibited a better BIC in all
cases.
The best-fit model for Colombians and Hondurans involves
admixture between Native Americans and Europeans starting
14 generations ago, followed by a second pulse of European
ancestry starting 12 and 5 generations ago, respectively. Of note
is that between the first and second pulse of migration in
Colombians, the proportion of European ancestry increased
from 12.5% to 75% in two generations, implying that the
European segments in today’s Colombians date back to
European gene flow happening in a short period of time; thus,
tracing their ancestry to a smaller number of European founders
compared to other Latino populations.
In contrast with mainland population samples, the best-fit
model for all four populations from the Caribbean islands involves
older time estimates of the initial contact between Native
Americans and Europeans. Namely, 17 generations ago for
Cubans and 16 generations ago for Puerto Ricans, Dominicans,
and Haitians. Historical records state that the first European
colonies in the Antilles were established soon after the initial
contact in 1492 [21]; that is, ,500 years ago or 16.6 generations
ago (considering 30 years per generation [22]), in excellent
agreement with our time estimates. Another major distinction
between mainland and Caribbean populations is that the best
model for each of the latter involves a second pulse of African
ancestry, occurring seven to five generations ago, with higher
migration rates in Haitians and Dominicans, followed by Cubans
and Puerto Ricans.
Sub-continental ancestry of admixed genomesThe genomes of admixed populations contain information
about both continental and sub-continental genetic ancestry. To
explore within-continent population structure, we performed PCA
on genomic segments assigned to Native American, African, or
European ancestry. Because the masking out of the other
ancestries results in large amounts of missing data, we implement-
ed a novel variation of PCA that allows us to perform the analysis
on the remaining sites alone. Throughout this paper, we refer to
this approach as ancestry-specific PCA (ASPCA), and the
mathematical details are described in Text S1. We applied this
methodology for analyzing phased genomic segments of inferred
Native American, European, and African continental ancestry
together with sub-continental reference panels of parental
populations (see diagram in Figure 2). Our implementation is
analogous to the subspace PCA (ssPCA) approach by Johnson et
al. [23], but it can take advantage of phased data, allowing us to
include segments of the genome that are heterozygous for
ancestry. In the presence of recent admixture, chromosomal
ancestry breakpoints dramatically reduce the proportion of the
genome that is homozygous for a given ancestry. Therefore,
relying on genotypes and restricting to loci estimated to have two
copies of a certain ancestry could severely compromise the
resolution of the analysis of admixed genomes. Our haplotype-
based implementation of the algorithm is packaged into the
software PCAmask and is available at http://bustamantelab.
stanford.edu. Details on the samples used are available in
Materials and Methods and in Text S1.
Native American ancestral componentsOur initial structure analysis was based on our high-density
dataset (i.e., ,390 K SNPs, see Table S1), and was thus limited to
ancestral populations with available Affymetrix SNP array data
(i.e., two Mesoamerican, two Andean, and three Venezuelan
native populations). To explore possible relationships with
additional Native American populations, we expanded our
reference panel by combining our data with Illumina 650 K data
for 493 individuals from 52 indigenous groups from throughout
the Americas [11]. Although this analysis has fewer SNPs (i.e.,
Table 1. Models of Migration into the Caribbean after the advent of admixture.
Admixed Population Migration models1
EUR,NAT+AFR EUR,NAT+AFR+EUR EUR,NAT+AFR+AFR
Log Likelihood Time (G)2 Log Likelihood Time (G)2 Log Likelihood Time (G)2
COL 2255.33 13 2246.80 14 2247.68 13
HON 2153.24 13 2139.22 14 2156.03 13
CUB 2506.43 19 2497.62 21 2326.12 17
DOM 2189.39 17 2189.33 17 2170.14 16
HAI 2122.73 11 2121.91 12 2119.10 16
PUR 2222.82 17 2204.23 17 2176.17 16
1Three migration models were tested for each admixed population: a simple model of single pulses of migrants from each source population, beginning with Europeansand Native Americans at T1 followed by African migrants at T2 (EUR,NAT+AFR); the simple model followed by an additional pulse of European migrants(EUR,NAT+AFR+EUR); the simple model followed by an additional pulse of African migrants (EUR,NAT+AFR+AFR). Log likelihoods given either model were comparedand we present the model with the best Bayesian Information Criterion (log likelihood values in bold).2The maximum likelihood estimate of time since admixture initially began. We assume prior migration between the populations was zero. Time since migration began isindicated in generations.doi:10.1371/journal.pgen.1003925.t001
Ancestral Components of the Caribbean
PLOS Genetics | www.plosgenetics.org 5 November 2013 | Volume 9 | Issue 11 | e1003925
Ancestral Components of the Caribbean
PLOS Genetics | www.plosgenetics.org 6 November 2013 | Volume 9 | Issue 11 | e1003925
,30 K SNPs), it allows us to resolve within-continent population
structure around the Caribbean in much greater geographic detail.
We applied the ASPCA approach described above to the Native
American segments of admixed individuals with .3% global
Native American ancestry together with the full reference panel of
ancestral populations (Figure S7). ASPC1 separates the northern-
most populations of the continent from the rest, while the Brazilian
Surui and Central American Cabecar define the extremes of
ASPC2. Most Native American haplotypes from the admixed
genomes fall along this second axis of variation, forming two
overlapping population clusters: one represented primarily by
Colombians and Hondurans, and the other by Cubans, Domin-
icans, and Puerto Ricans (no Haitian haplotypes were included
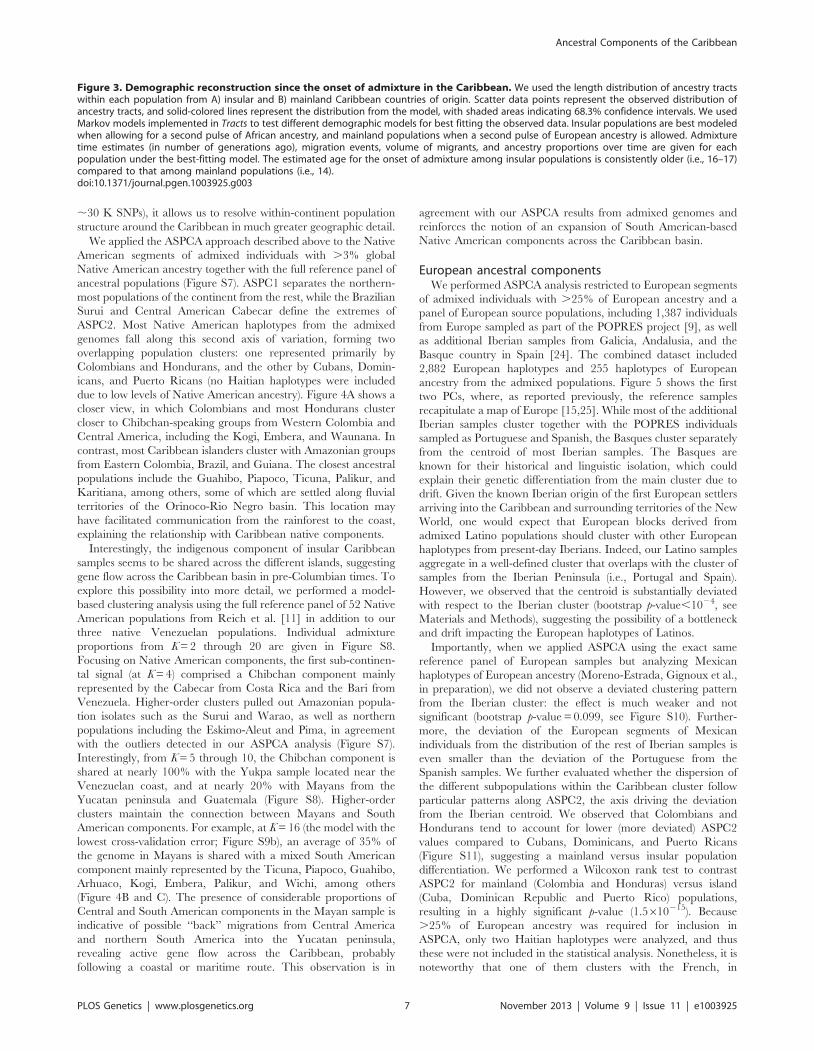
due to low levels of Native American ancestry). Figure 4A shows a
closer view, in which Colombians and most Hondurans cluster
closer to Chibchan-speaking groups from Western Colombia and
Central America, including the Kogi, Embera, and Waunana. In
contrast, most Caribbean islanders cluster with Amazonian groups
from Eastern Colombia, Brazil, and Guiana. The closest ancestral
populations include the Guahibo, Piapoco, Ticuna, Palikur, and
Karitiana, among others, some of which are settled along fluvial
territories of the Orinoco-Rio Negro basin. This location may
have facilitated communication from the rainforest to the coast,
explaining the relationship with Caribbean native components.
Interestingly, the indigenous component of insular Caribbean
samples seems to be shared across the different islands, suggesting
gene flow across the Caribbean basin in pre-Columbian times. To
explore this possibility into more detail, we performed a model-
based clustering analysis using the full reference panel of 52 Native
American populations from Reich et al. [11] in addition to our
three native Venezuelan populations. Individual admixture
proportions from K = 2 through 20 are given in Figure S8.
Focusing on Native American components, the first sub-continen-
tal signal (at K = 4) comprised a Chibchan component mainly
represented by the Cabecar from Costa Rica and the Bari from
Venezuela. Higher-order clusters pulled out Amazonian popula-
tion isolates such as the Surui and Warao, as well as northern
populations including the Eskimo-Aleut and Pima, in agreement
with the outliers detected in our ASPCA analysis (Figure S7).
Interestingly, from K = 5 through 10, the Chibchan component is
shared at nearly 100% with the Yukpa sample located near the
Venezuelan coast, and at nearly 20% with Mayans from the
Yucatan peninsula and Guatemala (Figure S8). Higher-order
clusters maintain the connection between Mayans and South
American components. For example, at K = 16 (the model with the
lowest cross-validation error; Figure S9b), an average of 35% of
the genome in Mayans is shared with a mixed South American
component mainly represented by the Ticuna, Piapoco, Guahibo,
Arhuaco, Kogi, Embera, Palikur, and Wichi, among others
(Figure 4B and C). The presence of considerable proportions of
Central and South American components in the Mayan sample is
indicative of possible ‘‘back’’ migrations from Central America
and northern South America into the Yucatan peninsula,
revealing active gene flow across the Caribbean, probably
following a coastal or maritime route. This observation is in
agreement with our ASPCA results from admixed genomes and
reinforces the notion of an expansion of South American-based
Native American components across the Caribbean basin.
European ancestral componentsWe performed ASPCA analysis restricted to European segments
of admixed individuals with .25% of European ancestry and a
panel of European source populations, including 1,387 individuals
from Europe sampled as part of the POPRES project [9], as well
as additional Iberian samples from Galicia, Andalusia, and the
Basque country in Spain [24]. The combined dataset included
2,882 European haplotypes and 255 haplotypes of European
ancestry from the admixed populations. Figure 5 shows the first
two PCs, where, as reported previously, the reference samples
recapitulate a map of Europe [15,25]. While most of the additional
Iberian samples cluster together with the POPRES individuals
sampled as Portuguese and Spanish, the Basques cluster separately
from the centroid of most Iberian samples. The Basques are
known for their historical and linguistic isolation, which could
explain their genetic differentiation from the main cluster due to
drift. Given the known Iberian origin of the first European settlers
arriving into the Caribbean and surrounding territories of the New
World, one would expect that European blocks derived from
admixed Latino populations should cluster with other European
haplotypes from present-day Iberians. Indeed, our Latino samples
aggregate in a well-defined cluster that overlaps with the cluster of
samples from the Iberian Peninsula (i.e., Portugal and Spain).
However, we observed that the centroid is substantially deviated
with respect to the Iberian cluster (bootstrap p-value,1024, see
Materials and Methods), suggesting the possibility of a bottleneck
and drift impacting the European haplotypes of Latinos.
Importantly, when we applied ASPCA using the exact same
reference panel of European samples but analyzing Mexican
haplotypes of European ancestry (Moreno-Estrada, Gignoux et al.,
in preparation), we did not observe a deviated clustering pattern
from the Iberian cluster: the effect is much weaker and not
significant (bootstrap p-value = 0.099, see Figure S10). Further-
more, the deviation of the European segments of Mexican
individuals from the distribution of the rest of Iberian samples is
even smaller than the deviation of the Portuguese from the
Spanish samples. We further evaluated whether the dispersion of
the different subpopulations within the Caribbean cluster follow
particular patterns along ASPC2, the axis driving the deviation
from the Iberian centroid. We observed that Colombians and
Hondurans tend to account for lower (more deviated) ASPC2
values compared to Cubans, Dominicans, and Puerto Ricans
(Figure S11), suggesting a mainland versus insular population
differentiation. We performed a Wilcoxon rank test to contrast
ASPC2 for mainland (Colombia and Honduras) versus island
(Cuba, Dominican Republic and Puerto Rico) populations,
resulting in a highly significant p-value (1.5610215). Because
.25% of European ancestry was required for inclusion in
ASPCA, only two Haitian haplotypes were analyzed, and thus
these were not included in the statistical analysis. Nonetheless, it is
noteworthy that one of them clusters with the French, in
Figure 3. Demographic reconstruction since the onset of admixture in the Caribbean. We used the length distribution of ancestry tractswithin each population from A) insular and B) mainland Caribbean countries of origin. Scatter data points represent the observed distribution ofancestry tracts, and solid-colored lines represent the distribution from the model, with shaded areas indicating 68.3% confidence intervals. We usedMarkov models implemented in Tracts to test different demographic models for best fitting the observed data. Insular populations are best modeledwhen allowing for a second pulse of African ancestry, and mainland populations when a second pulse of European ancestry is allowed. Admixturetime estimates (in number of generations ago), migration events, volume of migrants, and ancestry proportions over time are given for eachpopulation under the best-fitting model. The estimated age for the onset of admixture among insular populations is consistently older (i.e., 16–17)compared to that among mainland populations (i.e., 14).doi:10.1371/journal.pgen.1003925.g003
Ancestral Components of the Caribbean
PLOS Genetics | www.plosgenetics.org 7 November 2013 | Volume 9 | Issue 11 | e1003925
Figure 4. Sub-continental origin of Native American components in the Caribbean. A) Ancestry-specific PCA analysis restricted to NativeAmerican segments from admixed Caribbean individuals (colored circles) and a reference panel of indigenous populations (gray symbols) from [11],grouped by sampling location. Darker symbols denote countries of origin with populations clustering closer to our Caribbean samples. IndigenousColombian populations were classified into East and West of the Andes to ease the interpretation of their differential clustering in ASPCA. Populationlabels are shown for samples defining PC axes and representative clusters within locations. B) ADMIXTURE model for K = 16 ancestral clustersconsidering additional Latino samples, a representative subset of African and European source populations, and 52 Native American populationsfrom [11], plus three additional Native Venezuelan tribes genotyped for this project. Vertical thin bars represent individuals and white spaces separatepopulations. Native American populations from [11] are grouped according to linguistic families reported therein. Labels are shown for thepopulations representing the 12 Native American clusters identified at K = 16. Clusters involving multiple populations are identified by those with thehighest membership values. C) Map showing the major indigenous components shared across the Caribbean basin as revealed by ADMIXTURE atK = 16 from B). Namely, Mesoamerican (blue), Chibchan (yellow), and South American (green). Colored bars represent individuals and theirapproximate sampling locations. Bars pooling genetically similar individuals from more than one population are plotted from left to right following
Ancestral Components of the Caribbean
PLOS Genetics | www.plosgenetics.org 8 November 2013 | Volume 9 | Issue 11 | e1003925
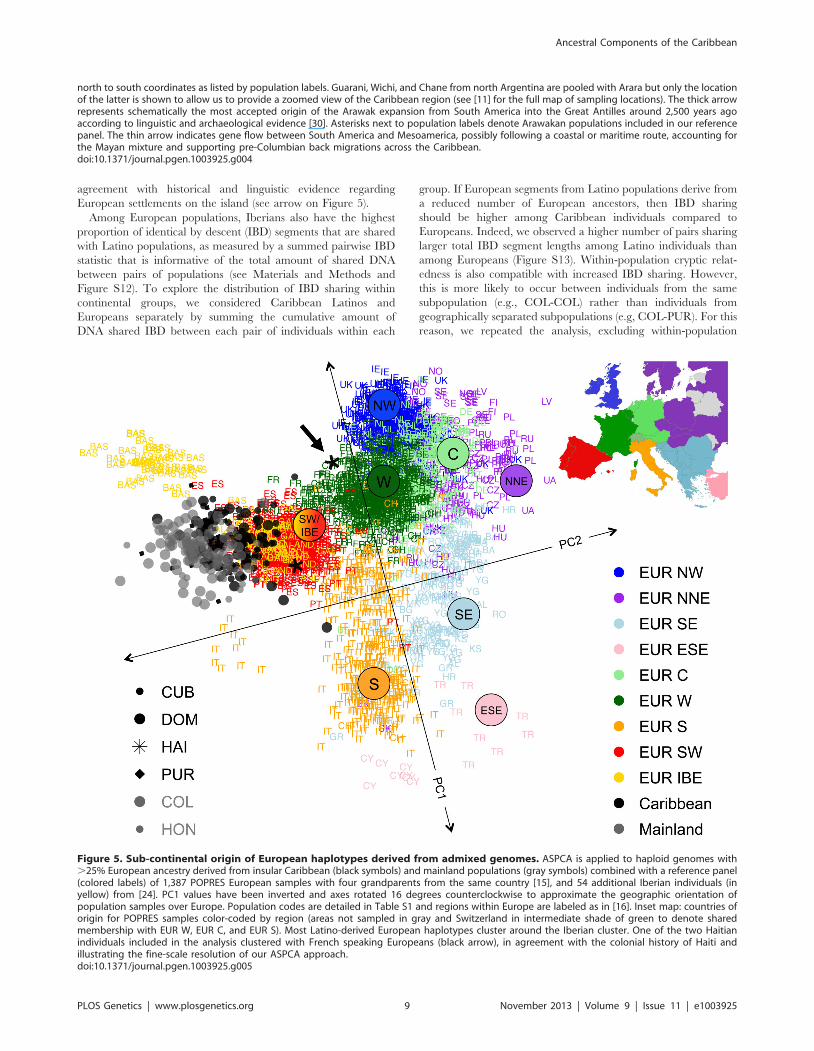
agreement with historical and linguistic evidence regarding
European settlements on the island (see arrow on Figure 5).
Among European populations, Iberians also have the highest
proportion of identical by descent (IBD) segments that are shared
with Latino populations, as measured by a summed pairwise IBD
statistic that is informative of the total amount of shared DNA
between pairs of populations (see Materials and Methods and
Figure S12). To explore the distribution of IBD sharing within
continental groups, we considered Caribbean Latinos and
Europeans separately by summing the cumulative amount of
DNA shared IBD between each pair of individuals within each
group. If European segments from Latino populations derive from
a reduced number of European ancestors, then IBD sharing
should be higher among Caribbean individuals compared to
Europeans. Indeed, we observed a higher number of pairs sharing
larger total IBD segment lengths among Latino individuals than
among Europeans (Figure S13). Within-population cryptic relat-
edness is also compatible with increased IBD sharing. However,
this is more likely to occur between individuals from the same
subpopulation (e.g., COL-COL) rather than individuals from
geographically separated subpopulations (e.g, COL-PUR). For this
reason, we repeated the analysis, excluding within-population
north to south coordinates as listed by population labels. Guarani, Wichi, and Chane from north Argentina are pooled with Arara but only the locationof the latter is shown to allow us to provide a zoomed view of the Caribbean region (see [11] for the full map of sampling locations). The thick arrowrepresents schematically the most accepted origin of the Arawak expansion from South America into the Great Antilles around 2,500 years agoaccording to linguistic and archaeological evidence [30]. Asterisks next to population labels denote Arawakan populations included in our referencepanel. The thin arrow indicates gene flow between South America and Mesoamerica, possibly following a coastal or maritime route, accounting forthe Mayan mixture and supporting pre-Columbian back migrations across the Caribbean.doi:10.1371/journal.pgen.1003925.g004
Figure 5. Sub-continental origin of European haplotypes derived from admixed genomes. ASPCA is applied to haploid genomes with.25% European ancestry derived from insular Caribbean (black symbols) and mainland populations (gray symbols) combined with a reference panel(colored labels) of 1,387 POPRES European samples with four grandparents from the same country [15], and 54 additional Iberian individuals (inyellow) from [24]. PC1 values have been inverted and axes rotated 16 degrees counterclockwise to approximate the geographic orientation ofpopulation samples over Europe. Population codes are detailed in Table S1 and regions within Europe are labeled as in [16]. Inset map: countries oforigin for POPRES samples color-coded by region (areas not sampled in gray and Switzerland in intermediate shade of green to denote sharedmembership with EUR W, EUR C, and EUR S). Most Latino-derived European haplotypes cluster around the Iberian cluster. One of the two Haitianindividuals included in the analysis clustered with French speaking Europeans (black arrow), in agreement with the colonial history of Haiti andillustrating the fine-scale resolution of our ASPCA approach.doi:10.1371/journal.pgen.1003925.g005
Ancestral Components of the Caribbean
PLOS Genetics | www.plosgenetics.org 9 November 2013 | Volume 9 | Issue 11 | e1003925
pairs of Latino individuals, and compared the IBD distribution to
that of Iberian source populations (i.e., Spanish and Portuguese).
Once again, we observed an increased proportion of IBD sharing
among Latinos, arguing for a shared founder effect (Figure S13).
These results are in agreement with our cluster-based analysis
focused on global ancestry proportions, where the European
ancestry of Latinos is dominated by a shared Latino-specific
component differentiated from both southern and northern
European components, although shared to some extent with
Spanish and Portuguese (Figure 1C). Bottlenecked populations
may exhibit differentiation from their parental gene pool due to
loss of genetic diversity and stochastic shifts in allele frequencies.
One way of quantifying the extent of genetic drift is to compare
FST estimates among the K = 8 ancestral clusters from Figure 1C.
In the absence of drift, we would expect the southern-derived
Latino component and the southern European component to
show a very low level of FST. However, we observe an FST = 0.021
(Table S3). To put this into perspective, the FST of southern vs.
northern Europe is FST = 0.02, meaning that the differentiation of
the Latino-specific component with respect to southern Europeans
is at least as high as the north-south differentiation within Europe.
This observation was replicated when including additional Latino
and ancestral populations (Figure S8). Given the increased number
of divergent clusters, we focused on K = 18 through 20, in which all
sub-continental European components were jointly detected. In
this case, the Latino-specific component shows further fragmen-
tation into two components: one predominantly shared among
insular Caribbean samples and the other among mainland
Latinos. The FST value for southern versus northern European
differentiation was 0.039, while values for southern versus insular
(0.041) or mainland Latinos (0.04) were slightly inflated (Table S4),
supporting the notion of additional differentiation impacting the
European component of present-day admixed Latinos.
African ancestral componentsThe Caribbean region has a complex history of population
exchange with the African continent as a result of slave trade
practices during European colonialism. Its proximity to the North
Atlantic Ocean facilitated nautical contact with the West African
coast, increasing the exposure of the local population to slave trade
routes and ultimately resulting in genetic admixture between
Caribbean and African individuals. We found the proportion of
African ancestry to be higher in Caribbean populations compared
to those from the mainland (Figure 1C), a finding that is consistent
across studies [3,6,26]. To explore the sub-continental composi-
tion of African segments derived from Caribbean admixed
genomes, we performed ASPCA analysis on individuals with
more than 25% of African ancestry using a diverse panel of
African populations as potential sources (see Table S1). Our first
approximation showed no dispersion of Afro-Caribbean haplo-
types over PCA space. Instead, they form a relatively tight cluster
that overlaps with that of the Yoruba sample from southwestern
Nigeria (Figure S14). This is a plausible result, given the extensive
historical record supporting a West African origin for the African
lineages in the Americas.
However, according to our tract length analysis, there is strong
genetic evidence for the occurrence of at least two pulses of African
migrants imprinting different genomic signatures in present day
admixed Caribbean populations. This result raises the question of
whether both pulses involved the same source population during
the admixture process. If this were the case, it would easily explain
our ASPCA results, where all African haplotypes point to a single
source.
Alternatively, if more than one source were involved and if
enough mixing occurred since the two pulses, it is possible that
what we see in ASPCA is the midpoint of the two source
populations, causing the difference to remain undetected by our
standard approach (which gives a point estimate averaging the
signature of all African blocks along the genome). Hence, we
applied a different strategy, in which ASPCA is performed
separately for short (thus older) and long (younger) ancestry tracts.
For this purpose, we split the African segments of each haploid
genome into two categories based on a 50-cM length cutoff and
intersected the data with a reference panel of West African
populations (Figure 6A). Then, for each individual, we computed
assignment probabilities of coming from each of the putative
parental populations based on bivariate normal distributions fitted
around each PCA cluster (see Materials and Methods, Figure S15).
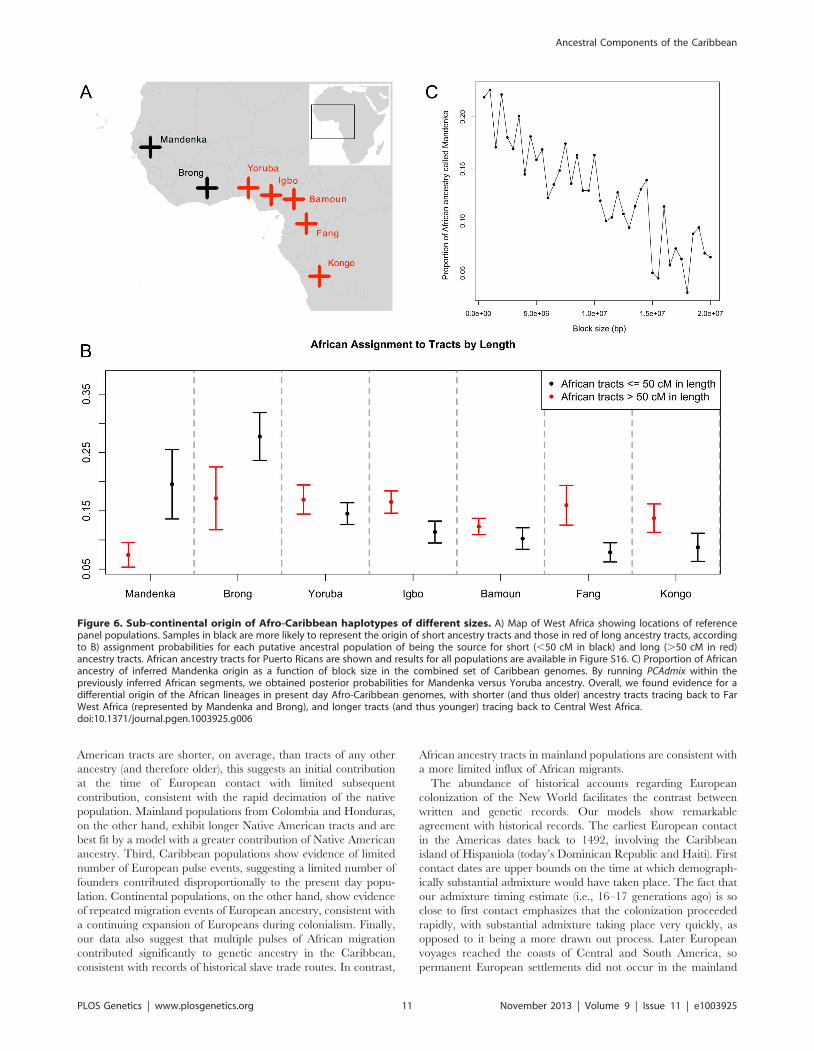
In Figure 6B we present the scaled mean probabilities for long
(.50 cM) versus short (,50 cM) African tracts in Puerto Rican
individuals. The pattern that emerges reveals that African
haplotypes shorter than 50 cM are more likely to have originated
from populations in the coastal Northwest region, such as the
Mandenka and Brong; whereas longer haplotypes show higher
probabilities of coming from populations closer to the Gulf of
Guinea and Equatorial West Africa, including Yoruba, Igbo,
Bamoun, Fang, and Kongo (see map on Figure 6A). The
significant increase in old, short Mandenka tracts when compared
to longer, more recent tracts was replicated in other insular
Caribbean populations, including Cubans and Dominicans. The
Brong also seem to have had a greater contribution deeper in the
past, not only in Puerto Ricans, but also in Dominicans,
Hondurans, and to a lesser extent in Colombians. In Cubans,
the trend is reversed, and the Brong seem to have contributed
more to long tracts than to short ones (Figure S16).
One caveat of this analysis is that short ancestry tracts are more
likely to be misassigned. To rule this out as a source of the signal,
we added an intermediate block size category (.5 cM and
,50 cM) and repeated the size-based ASPCA analysis. We
observed that, despite the signal being somewhat weaker due to
less data, a similar trend was observed after excluding extremely
short tracts (Figure S16). Finally, we gathered additional evidence
by running local ancestry estimation on the African blocks alone to
distinguish Mandenka vs. Yoruba ancestry tracts (see Materials
and Methods). We then binned all segments of inferred Mandenka
ancestry into different block sizes and observed that the proportion
of the African ancestry called Mandenka is higher within shorter
block sizes and decreases as block size increases (Figure 6C). This
result gives additional support for the differential origin of African
segments and argues that the signal is not driven by the shortest
genomic segments alone; rather, the signal is characterized by a
progressive decay of haplotype length from older migrations, as
younger segments (of different ancestry) account for the majority
of longer African tracts in Caribbean genomes.
Discussion
Models of admixture for Caribbean and mainlandpopulations
Our results reveal consistent differences in the admixture
processes occurring on Caribbean islands as compared to
neighboring mainland populations. First, admixture timing
estimates are consistently different between these two groups,
with admixture starting around 16–17 generations ago in the
islands and 14 generations ago in mainland populations. Second,
in the Caribbean, we find evidence of a single pulse of Native
American ancestry into admixed populations. Since Native
Ancestral Components of the Caribbean
PLOS Genetics | www.plosgenetics.org 10 November 2013 | Volume 9 | Issue 11 | e1003925
American tracts are shorter, on average, than tracts of any other
ancestry (and therefore older), this suggests an initial contribution
at the time of European contact with limited subsequent
contribution, consistent with the rapid decimation of the native
population. Mainland populations from Colombia and Honduras,
on the other hand, exhibit longer Native American tracts and are
best fit by a model with a greater contribution of Native American
ancestry. Third, Caribbean populations show evidence of limited
number of European pulse events, suggesting a limited number of
founders contributed disproportionally to the present day popu-
lation. Continental populations, on the other hand, show evidence
of repeated migration events of European ancestry, consistent with
a continuing expansion of Europeans during colonialism. Finally,
our data also suggest that multiple pulses of African migration
contributed significantly to genetic ancestry in the Caribbean,
consistent with records of historical slave trade routes. In contrast,
African ancestry tracts in mainland populations are consistent with
a more limited influx of African migrants.
The abundance of historical accounts regarding European
colonization of the New World facilitates the contrast between
written and genetic records. Our models show remarkable
agreement with historical records. The earliest European contact
in the Americas dates back to 1492, involving the Caribbean
island of Hispaniola (today’s Dominican Republic and Haiti). First
contact dates are upper bounds on the time at which demograph-
ically substantial admixture would have taken place. The fact that
our admixture timing estimate (i.e., 16–17 generations ago) is so
close to first contact emphasizes that the colonization proceeded
rapidly, with substantial admixture taking place very quickly, as
opposed to it being a more drawn out process. Later European
voyages reached the coasts of Central and South America, so
permanent European settlements did not occur in the mainland
Figure 6. Sub-continental origin of Afro-Caribbean haplotypes of different sizes. A) Map of West Africa showing locations of referencepanel populations. Samples in black are more likely to represent the origin of short ancestry tracts and those in red of long ancestry tracts, accordingto B) assignment probabilities for each putative ancestral population of being the source for short (,50 cM in black) and long (.50 cM in red)ancestry tracts. African ancestry tracts for Puerto Ricans are shown and results for all populations are available in Figure S16. C) Proportion of Africanancestry of inferred Mandenka origin as a function of block size in the combined set of Caribbean genomes. By running PCAdmix within thepreviously inferred African segments, we obtained posterior probabilities for Mandenka versus Yoruba ancestry. Overall, we found evidence for adifferential origin of the African lineages in present day Afro-Caribbean genomes, with shorter (and thus older) ancestry tracts tracing back to FarWest Africa (represented by Mandenka and Brong), and longer tracts (and thus younger) tracing back to Central West Africa.doi:10.1371/journal.pgen.1003925.g006
Ancestral Components of the Caribbean
PLOS Genetics | www.plosgenetics.org 11 November 2013 | Volume 9 | Issue 11 | e1003925
until the first half of the 16th century, consistent with an
approximate difference of two generations between the estimated
onset of admixture according to our island and mainland models.
Here we have focused on Colombians and Hondurans as
population samples from mainland territories with coastal access
to the Caribbean, but we have previously reported admixture
timing estimates for Mexicans as well, starting 15 generations ago
[5]. The settlement of Europeans in mainland Mexican territory is
documented to have occurred between 1519 and 1521 (i.e., 27–29
years apart from the first contact in 1492 in the Caribbean);
consistent with this, there is one generation between our average
estimate for the onset of admixture in the Caribbean compared to
our model based on Mexican data (16 vs. 15 generations,
respectively).
South American origin of indigenous components in theCaribbean
In contrast to other regions in the Americas where indigenous
peoples are numerous, the genetic characterization of Native
American components in the Caribbean required indirect
reconstruction via genomic assembly of indigenous ancestry tracts
transmitted to extant admixed individuals. By applying ancestry-
specific PCA and cluster-based analyses integrating a large
number of indigenous groups throughout the Americas, we found
that Amazonian populations from South America show the closest
relationship with Caribbean indigenous components. This was
also observed in a different sample set from the 1000 Genomes
Project (Gravel et al., submitted). Despite covering a large
geographic area of South America (ranging from eastern
Colombia to central Brazil and Guiana), most Amazonian
sampled populations cluster together in PCA space, suggesting a
common origin. Logical candidates for the origin of the ancestors
of Caribbean populations include indigenous coastal groups south
of the Lesser Antilles. Here, therefore, we have included three
additional tribes from the Venezuelan coast. However, despite
their closer geographic location, none of these groups primarily
accounted for the indigenous ancestry of the insular Caribbean
samples, pointing to an inland origin rather than a coastal one.
Nonetheless, our cluster-based analysis revealed that native
Venezuelan components do share membership with several
Central American indigenous populations, such as the Costa
Rican Cabecar, and, to a lesser extent, with Mayan groups from
Guatemala and the Yucatan peninsula of present day Mexico,
suggesting substantial gene flow across the Caribbean Sea in pre-
Columbian times. Archaeological evidence, including the distri-
bution of jade, obsidian, pottery, and other commodities, supports
the existence of maritime-based interaction networks between
central Mesoamerica, the Isthmo-Colombian area, and northern
Venezuela [27]. Our results demonstrate that such long-distance
negotiations were accompanied by genetic exchange between
previously diverged native populations and give new insight into
the dynamics between the inhabitants of the Caribbean basin prior
to European contact.
In a recent genomic survey of the relationships between Native
American peoples, Reich and colleagues [11] described the
Chibchan speakers on both sides of the Panama isthmus as an
exception to the simple model of continental colonization
involving a southward expansion with sequential population splits
and little subsequent gene flow. Instead, Central Americans, such
as the Cabecar from Costa Rica, were modeled as a mixture of
South and North American ancestry, which the authors reported
as evidence for a back-migration from South into Central
America. Our findings support these interpretations and also
suggest a distant connection between Caribbean Mesoamerica and
South American inland territories. Specifically, the fact that
Mayans from the Yucatan peninsula share 35% of their genome
with the Amazonian Ticuna, Guahibo, and Piapoco, and even
with the more distant Paraguayan Guarani and north Argentinian
Wichi, supports the expansion of an inland South American
component across the Caribbean. For context, it is noteworthy
that in ASPCA, the native ancestry tracts of Colombians and
Hondurans cluster with geographically closer indigenous tribes,
such as Chibchan speakers from western Colombia and Central
America.
How do we account, then, for a shared clustering between more
distant tribes, mostly of Amazonian origin, and insular Caribbean
haplotypes? One possible explanation is that the fluvial nature of
most of these settlements (across the Amazon and Orinoco basins)
may have facilitated the movement of people to the coast, from
which they migrated north through the Lesser Antilles and
eventually contributed to Caribbean native components. Our
results are consistent with archaeological records suggesting that
the ancestors of the indigenous people that Columbus encountered
might have come from populations that migrated from the Lower
Orinoco Valley around 2.5 to 3 kya [28,29,30].
Additionally, our results align with the classification of
languages spoken by pre-Columbian inhabitants of the Caribbean.
The Taınos were the major group living in the Greater Antilles
and surrounding islands at the moment of European contact.
Taınos and insular Caribs spoke Arawakan languages [31], whose
geographic distribution across northern South America resembles
the distribution of the genetic component shared across multiple
Amazonian individuals (Figure 4C). Arawakan-speaking groups in
our reference panel include the Piapoco from eastern Colombia,
the Palikur from Guiana, and the Chane from northern Argentina,
all of which show primary ancestral membership to the
Amazonian genetic component (Figure 4C) and cluster together
with Native American haplotypes from admixed Caribbean
individuals (Figure 4A), supporting a South American origin of
the Arawakan expansion into the Caribbean. Although now
located far from Amazonia, the Chane are believed to have
historically migrated from the Amazon rainforest to the Argen-
tinian Gran Chaco [32]. Neighboring Wichi individuals also show
similar genetic memberships and ASPCA clustering patterns,
despite belonging to a different linguistic family. Previous genetic
studies have also pointed to a South American origin for Taınos
[7,33]. Based on mitochondrial haplogroups ascertained from pre-
Columbian Taıno remains, Lalueza-Fox and colleagues [33]
found that only two of the major mtDNA lineages, namely C and
D, were present in their sample (N = 27). Given that high
frequencies of C and D haplogroups are more common in South
American populations, the authors argued for that sub-continent
as the homeland of the Taıno ancestors.
Overall, our analysis of indigenous ancestry tracts from extant
admixed genomes supports previous linguistic, archaeological,
and ancient DNA evidence about the peopling of the
Caribbean; furthermore, it points to a greater involvement of
inland Amazonian populations during the last migration into
the Antilles prior to European contact. Earlier migrations may
have occurred (e.g., from Mesoamerica or the Florida penin-
sula), as pre-ceramic archaeological evidence of human presence
in the Greater Antilles dates back more than 7,000 years ago
[28]. However, the fact that the Amazonian component is
shared among the indigenous haplotypes from different insular
and continental populations supports either a single South
American origin of Caribbean settlers or a major population
replacement involving a more recent migration of agricultural-
ists from inland South America.
Ancestral Components of the Caribbean
PLOS Genetics | www.plosgenetics.org 12 November 2013 | Volume 9 | Issue 11 | e1003925
Founder effect in the European lineage of admixedLatinos
We find genomic patterns compatible with the effect of a
founder event in the ancestral European population of present-
day admixed Latinos. Supporting evidence includes the follow-
ing: 1) a Latino-specific European component revealed by
clustering algorithms, which is not assigned to source popula-
tions within Europe except Spain and Portugal, and detected at
lower-order clusters compared to other European and Native
American sub-continental components; 2) inflated FST values
between the Latino-specific and southern European compo-
nents, compared to southern versus northern Europe differen-
tiation; 3) significant deviation of the distribution of European
haplotypes from the main cluster of Iberian samples in ASPCA
space; and 4) increased IBD sharing among Latino individuals
compared with Europeans. Additionally, a similar signature was
observed in an independent dataset of Latino samples from
the1000 Genomes Project using a combined approach that
integrates IBD and local ancestry tracts (Gravel et al.,
submitted). These findings suggest that early European waves
of migration into the New World involved a reduced ancestral
population size, mainly composed of Iberians, bearing a subset
of the diversity present within the source population and causing
the derived admixed populations to diverge from current
European populations. Furthermore, we find differences be-
tween mainland and insular Caribbean populations including 1)
different time estimates for the onset of admixture as revealed by
ancestry tract length analysis (Figure 3); 2) separate member-
ships in cluster-based analyses (Figure 4B, Figure S8); and 3)
significantly shifted distributions of European haplotypes within
the Latino cluster in ASPCA space (Figure 5, Figure S11). The
fact that mainland Colombians and Hondurans show not only
the highest proportions of the Latino-specific European com-
ponent in ADMIXTURE but also the most extreme deviation
from the Iberian cluster in ASPCA suggests stronger genetic
drift in these populations, compatible with a two-stage
European settlement involving insular territories at first, and
mainland populations subsequently absorbing a subset of
migrants from the islands.
There is documented evidence of extensive migration from the
islands to the continent throughout the 16th century [21]. There
were only two viceroyalties of the Spanish Empire in the New
World until the 18th century: the Viceroyalty of New Spain
(capital, Mexico City) and the Viceroyalty of Peru (capital, Lima).
An additional viceroyalty in South America was created in 1717
with Bogota as capital (Viceroyalty of New Granada), promoting
economic and population growth.
Interestingly, the estimated time for the second pulse of
European migrants into the ancestors of present-day Colombians
(i.e., 12 generations ago) coincides with the creation of the
Colombian-based Viceroyalty of New Granada, accounting for
the large increase (from 12.5% to 75%) of European ancestry in
the model based on tract length distributions. This small
contribution of European ancestry at the onset of admixture in
Colombians reinforces the idea that their patterns of European
diversity are heavily impacted by a reduced number of founders.
In contrast, Mexican-derived European haplotypes do not appear
to be impacted by founder events as much as the Caribbean
populations analyzed here. A possible explanation is that present-
day Mexico was the center of the wealthy Viceroyalty of New
Spain, one of the largest European settlements under Spanish rule.
This status ensured continuous exchange with Spain throughout
colonial times, resulting in a larger ancestral population size.
Space and time distinction of African migrations into theCaribbean
We find that populations from the insular Caribbean are best
modeled as mixtures absorbing two independent waves of African
migrants. Assuming a 30-year generation time [22], the estimated
average of 15 generations ago for the first pulse (circa 1550) agrees
with the introduction of African slaves soon after European
contact in the New World. At first, local natives were used as the
source of forced labor, but populations were decimated rapidly,
giving rise to the four-century-long transatlantic slave trade, which
is usually divided into two eras. The first one accounted for a small
proportion (3–16%) of all Atlantic slave trade, whereas the second
Atlantic system peaked in the last two decades of the 18th century,
accounting for more than half of the slave trade. This period of
increased activity coincides with the estimated age of the second
(and stronger) pulse of African tracts according to our model (e.g.,
7 generations ago in Dominicans), pointing to the late 18th
century. In other words, the estimated time separation between
these two pulses (i.e., 8 generations or ,240 years) based on
genetic data is in extraordinary agreement with historical records,
recapitulating the span between the onset of African slave trade
and its period of maximum intensity right before its rapid decline
during the 19th century [34].
To address the question of whether there was also a separation
in space between the origins of these two pulses, we relied on the
fact that chromosomes from older contributions to admixture have
undergone more recombination events, thus leading to shorter
continuous African ancestry tracts. By conducting two different
but complementary size-based analyses restricted to genomic
segments of inferred African ancestry, we provide compelling
evidence that short African tracts are enriched with haplotypes
from northern coastal West Africa, represented by Mandenka
samples from Senegal and Brong from western Ghana, near the
Ivory Coast. This is in agreement with documented deportation
flows during the 15th–16th centuries, wherein most enslaved
Africans were carried off from Senegambia and departed for the
Americas from the Goree Island, near Cape Verde [34]. African
slaves were obtained by European traders in ports along the West
African coast, but raiding zones extended inland with the
involvement of local African kingdoms. The Mandinka Kingdom
of Senegambia was part of the Mali Empire, one of the most
influential domains in West Africa, spreading its language, laws,
and culture along the Niger River. The empire’s total area
included nearly all the land between the Sahara Desert and coastal
forests, and by 1530 reached modern-day Ivory Coast and Ghana,
possibly accounting for the shared pattern between the Mandenka
and Brong with respect to the Caribbean’s short ancestry tracts.
While this interpretation is supported by the fact that the
Mandenka and Brong are the westernmost population samples
of our reference panel, the lack of additional samples from
northern West Africa prevent us from determining whether this
pattern is shared with other tribes as well. On the other hand, the
greater affinity of the longer ancestry tracts with the rest of the
African samples, which cover much of the central West African
coast, is compatible with the greater involvement of such regions
in the slave trade during the 18th century.
The volume of captives being embarked from the bights of
Benin (e.g., today’s Nigeria) and Biafra (e.g., today’s Cameroon)
was so elevated after 1700 that part of its shore soon became
known as the ‘‘Slave Coast’’ [34]. Population samples around this
area represented in our reference panel include the Yoruba and
Igbo from Nigeria, and the Bamoun and Fang from Cameroon, all
of which show higher probabilities of being assigned as the source
for longer African ancestry tracts in the admixed Latino groups
Ancestral Components of the Caribbean
PLOS Genetics | www.plosgenetics.org 13 November 2013 | Volume 9 | Issue 11 | e1003925
analyzed. Together with Brazil, the Caribbean Islands were the
major slave import zone during the 18th century. Later deporta-
tion flows in the 19th century involved ports of origin near the
Congo River in West Central Africa. The closest population
sample of our reference panel from this region is represented by
the Kongo, which also shows higher affinity with longer ancestry
tracts, compatible with a later contribution to admixture in the
Caribbean. The 19th century also saw the abolition of slavery in
most parts of the world; however, the massive international flow of
people it involved remains as one of the deepest signatures in the
genomes of descendent populations. While the geographic
extension of the regions of origin of African slaves brought to
the Americas has been widely documented, it was unclear until
now the extent to which particular sub-continental components
have shaped the genomic composition of present-day Afro-
Caribbean descendants. Our ancestry-specific and size-based
analyses allowed us to discover that African haplotypes derived
from Caribbean populations still retain a signature from the first
African ancestors despite the later dominance of African influx
from multiple sub-continental components.
ConclusionOur genome-wide dense genotyping data from six different
populations of Caribbean descent, coupled with the availability of
large-scale reference panels, allowed us to address long-standing
questions regarding the origin and admixture history of the
Caribbean Basin. The differences between insular and continental
Caribbean populations underscore the importance of character-
izing admixed populations at finer scales. We report ancestry-
specific recent bottlenecks affecting particular Latino groups, but
not others, which may have important implications in the expected
relative proportion of deleterious mutations and elevated allele
frequencies that can be detected via association studies in theses
populations. Finally, the extensive population stratification within
sub-continental components implies that medically relevant
genetic variants may be geographically restricted, reinforcing the
need for sequencing target populations in order to discover local
variants that may only be relevant in Latino-specific association
studies for disease.
Materials and Methods
Samples and data generationGenerated data and assembled datasets for this study are
summarized in Table S1. A total of 251 individuals representing
six different Caribbean-descent populations were recruited in
South Florida, USA. Participants were required to have at least
three grandparents from their countries of origin, thus limited
ethnographic and anonymous pedigree information was collected.
The majority of pedigrees (94.3%, n = 82) had four grandparents
from the same country. Only 5 pedigrees (5.7%) had one
grandparent from a different country. Informed consent was
obtained from all participants under approval by the University of
Miami Institutional Review Board (study no. 20081175). A total of
76 trios, 2 duos, and 19 parents were genotyped using Affymetrix
6.0 SNP arrays, which included: 80 Cubans, 85 Colombians, 34
Dominicans, 27 Puerto Ricans, 19 Hondurans, and 6 Haitians.
Genotype data will be made available through dbGaP under the
Genomic Origins and Admixture of Latinos (GOAL) study. Out of
173 founders, 18 samples were filtered from structure analyses due
to cryptic relatedness as inferred by IBD.10%. Four trios were
not considered for trio phasing due to an excess of Mendelian
errors (.100 K), two trios were removed due to 3rd or higher
degree of relatedness between parents as inferred by IBD, and five
trios were filtered due to cryptic relatedness between members of
different trios above 10% IBD. After filtering, 65 complete trios
remained for haplotype-based analyses. To study population
structure and demographic patterns involving relevant ancestral
populations, 79 previously collected samples from three native
Venezuelan tribes were genotyped using the same array (i.e., 25
Yukpa [aka Yucpa], 29 Bari, and 25 Warao). We combined our
data with publicly available genomic resources and assembled a
global database incorporating genome-wide SNP array data for
3,042 individuals from which two datasets with different SNP
densities were constructed (see Table S1). The high-density dataset
included populations with available SNP data from Affymetrix
arrays; namely African, European, and Mexican HapMap samples
[8], Europeans from POPRES [9], West Africans from Bryc et al.
[10], and Native Americans from Mao et al. [35]. After merging
and quality control filtering, 389,225 SNPs remained and
representative population subsets were used in different analyses
as detailed through sections below. Our lower density dataset
(30,860 SNPs) resulted from the intersection of our high-density
dataset with available SNP data generated on Illumina platform
arrays, including 52 additional Native American populations [11],
as well as additional Latino populations sampled in New York City
[7] and 1000 Genomes Latino samples [6]. The resulting dataset
combines genomic data for 1,262 individuals from 80 populations.
Full details on the population samples are available in Table S1.
Population structureAn unsupervised clustering algorithm, ADMIXTURE [12], was
run on our high-density dataset to explore global patterns of
population structure among a representative subset of 641
samples, including seven Native American, eleven POPRES
European, HapMap3 Nigerian Yoruba, HapMap3 Mexican,
and our six new Caribbean Latino populations (see Table S1).
Fourteen ancestral clusters (K = 2 through 15) were successively
tested. Log likelihoods and cross-validation errors for each K
clusters are available in Figure S3. FST based on allele frequencies
was calculated in ADMIXTURE v1.22 for each identified cluster
at K = 8 and values are available in Table S3. Our low-density
dataset comprising 1,262 samples (detailed in Table S1) was used
to run K = 2 through 20. Log likelihoods, cross validation errors
and FST values from ADMIXTURE are available in Figure S9
and Table S4. Principal component analysis (PCA) was applied to
both datasets using EIGENSOFT 4.2 [36] and plots were
generated using R 2.15.1. Sex bias in ancestry contributions was
evaluated by selecting only females (to ensure we compare a
diploid X chromosome to diploid autosomes), and running
ADMIXTURE at K = 3 on the X chromosome and autosomes
separately. The Wilcoxon signed rank test, a non-parametric
version of the paired Student’s t-test that does not require the
normality assumption, was applied to assess the significance of the
difference in X and autosomal ancestry proportions. This tests
whether the average difference of ancestry proportions assigned to
a given source population for the X and for the autosomes of each
sample is significantly different from zero. The test was applied to
the entire collection of Latino samples, revealing an over-arching
trend, and then to each population in turn to identify any between-
population differences. A rejection of the null hypothesis means
that the ancestry proportions on the X and the autosomes are
significantly different from one another but does not imply which
proportion is larger. We provide box plots as a visual aid to show
the direction of the difference (Figure S4). Global ancestry
estimates from ADMIXTURE at K = 3 were used to test the
correlation between male and female ancestry proportions
considering all trio founders within each Caribbean population
Ancestral Components of the Caribbean
PLOS Genetics | www.plosgenetics.org 14 November 2013 | Volume 9 | Issue 11 | e1003925
as well as within the full set of admixed trios. Linear models and
permutations (up to 100,000) were performed using R 2.15.1.
Phasing and local ancestry assignmentFamily trio genotypes from our six Caribbean populations and
continental reference samples were phased using BEAGLE 3.0
software [37]. Local ancestry assignment was performed using
PCAdmix (http://sites. google.com/site/pcadmix/ [19]) at K = 3
ancestral groups. This approach relies on phased data from
reference panels and the admixed individuals. To maintain SNP
density and maximize phasing accuracy we restricted to a subset of
reference samples with available Affymetrix 6.0 trio data, namely
10 YRI, 10 CEU HapMap3 trios, and 10 Native American trios
from Mexico [5]. Each chromosome is analyzed independently,
and local ancestry assignment is based on loadings from Principal
Components Analysis of the three putative ancestral population
panels. The scores from the first two PCs were calculated in
windows of 70 SNPs for each panel individual (in previous work
we have estimated a suitable number of 10,000 windows to break
the genome into when inferring local ancestry using PCAdmix,
and in this case, after merging Affymetrix 6.0 data from admixed
and reference panels, a total of 743,735 SNPs remained/
10,000 = window length of ,70 SNPs). For each window, the
distribution of individual scores within a population is modeled by
fitting a multivariate normal distribution. Given an admixed
chromosome, these distributions are used to compute likelihoods
of belonging to each panel. These scores are then analyzed in a
Hidden Markov Model with transition probabilities as in Bryc et
al. [10]. The g (generations) parameter in the HMM transition
model was determined iteratively so as to maximize the total
likelihood of each analyzed population. Local ancestry assign-
ments were determined using a 0.9 posterior probability threshold
for each window using the forward-background algorithm. In
analyses that required estimating the length of continuous ancestry
tracts, the Viterbi algorithm was used. An assessment of the
accuracy of this approach is given in [5].
Tract length analysisWe used the software Tracts [20] to identify the migratory model
that best explains the genome-wide distribution of ancestry
patterns. Specifically, we considered three migration models, each
featuring a panmictic population absorbing migrants from three
source populations. The models differ by the number of allowed
migration events per population. In the simplest model, the
population is founded by Native American and European
individuals, and later receives a pulse of African migrants. The
initial ancestry proportion and timing, as well as the African
migration amplitude and timing, are fitted to the data as described
below. The other two models feature an additional input of either
European or African migrants; the timing and magnitude of this
additional pulse result in two additional parameters that must be
fitted to the data. Here, the data consisted of Viterbi calls from
PCAdmix (see previous section and Figure 2), that is, the most
probable assignment of local ancestry along the genomes. To fit
parameters to these data, we tallied the inferred continuous
ancestry tracts according to inferred ancestry and tract length
using 50 equally spaced length bins per population, and one
additional bin to account for full chromosomes. Given a migration
model and parameters, Tracts calculates the expected counts per
bin. Assuming that counts in each bin are Poisson distributed, it
produces a likelihood estimate that is used to fit model parameters.
For each population, we report the model with the best Bayesian
Information Criterion (BIC) 22 Log(L)+k Log (n), with n = 153.
Because we imposed a fixed number of migration pulses, we must
keep in mind that migrations are likely to have been more
continuous than what is displayed in the best-fitting models. One
way to interpret the pulses are time points that the migrations
probably spanned. Resolving the duration of each pulse would
likely require refined models and a great deal more data.
Ancestry-Specific Principal Component Analysis (ASPCA)To explore within-continent population structure, we applied
the following approach for each of the continental ancestries (i.e.,
Native American, European, and African) of admixed genomes.
The general framework is shown in Figure 2. It comprises locus-
specific continental ancestry estimation along the genome,
followed by PCA analysis restricted to ancestry-specific portions
of the genome combined with sub-continental reference panels of
ancestral populations. For this purpose, we used our continental-
level local ancestry estimates provided by PCAdmix to partition
each genome into ancestral haplotype segments, and retained for
subsequent analyses only those haplotypes assigned to the
continental ancestry of interest. This is achieved by masking (i.e.,
setting to missing) all segments from the other two continental
ancestries. Because ancestry-specific segments may cover different
loci from one individual to another, a large amount of missing data
results from scaling this approach to a population level, which
limits the resolution of PCA. To overcome this problem, we
adapted the subspace PCA (ssPCA) algorithm introduced by Raiko
et al. [38] to implement a novel ancestry-specific PCA (ASPCA)
that allows accommodating phased haploid genomes with large
amounts of missing data. Our method is analogous to the ssPCA
implementation by Johnson et al. [23], which operates on
genotype data. In contrast, ASPCA operates on haplotypes,
allowing us to use much more of the genome (rather than just the
parts estimated to have two copies of a certain ancestry) and to
independently analyze the two haploid genomes of each individ-
ual. Finally, ancestry-specific haplotypes derived from admixed
individuals are combined with haplotypes derived from putative
parental populations and projected together onto PCA space.
Details of the ASPCA algorithm and constructed datasets are
described in Text S1.
Differentiation of sub-European ancestry componentsTo measure the observed deviation in ASPCA of European
haplotypes derived from admixed Caribbean populations with
respect to the cluster of Iberian samples, a bootstrap resampling-
based test was performed. The null distribution was generated
from comparing bootstraps of Portuguese and Spanish ASPCA
values as models of the intrinsic Iberian population structure. We
then compared the ASPCA values of the admixed individuals and
tested if the observed differences between Iberian ASPCA values
and those of the admixed individuals are more extreme than the
differences within Iberia. The distance was determined using the
chi-squared statistic of Fisher’s method combining ASPC1 and
ASPC2 t-tests for each bootstrap. We ran 10,000 bootstraps to
determine one-tailed p-values. As Iberians we considered:
POPRES Spanish, POPRES Portuguese, Andalusians, and
Galicians; and as Caribbean Latinos: CUB, PUR, DOM, COL,
and HON. Additional tests were performed comparing Portuguese
versus the rest of Iberians and between an independent dataset of
Mexican individuals analyzed by Moreno-Estrada, Gignoux et al.
(in preparation) projected onto ASPCA space using the same
reference panel of European populations. A bivariate test was
performed to measure the relative deviation from the Iberian
cluster of the distribution given by the Caribbean versus the
Mexican dataset. To determine whether insular versus mainland
Caribbean populations disperse over significantly different ranges
Ancestral Components of the Caribbean
PLOS Genetics | www.plosgenetics.org 15 November 2013 | Volume 9 | Issue 11 | e1003925
in ASPC2, a Wilcoxon rank test was performed between
(COL+HON) versus (CUB, PUR, DOM). Haitians were
excluded due to low sample size (N = 2 haplotypes). Boxplot is
available in Figure S11. Population differentiation estimates
between clusters inferred with ADMIXTURE were visualized
and compared across runs where both the Latino-specific and
southern European components were detected. Values are
available in Table S3 and Table S4. To provide independent
evidence on the sub-continental ancestry of European haplo-
types, we considered segments that are identical by descent
(IBD) between unrelated Latino individuals and a representative
subset of European populations. We used our high-density
dataset to extract a subset of 203 POPRES European
individuals and the founders of the 65 complete admixed trios.
We first performed a genome-wide pairwise IBS estimation
using PLINK [39] to ensure that the dataset contains no
samples with more than 10% IBS with any other sample. Then
we used fastIBD [37] to phase the data and estimate segments
shared IBD longer than 2 Mb to eliminate false positive IBD
matches and assuming that ancestry will be shared among
pairwise IBD hits of segments this long. All 2 Mb or greater
segments shared IBD between pairs of individuals were
summed, and histograms were created for pairwise matches
within each group (i.e., POPRES Europeans, Iberians, and
Caribbean Latinos). To inform about the proportion of shared
DNA between pairs of populations we calculated a summed
pairwise IBD statistic, which is the sum of lengths of all segments
inferred to be shared IBD between a given European population
and each Latino population, normalized by sample size.
Size-based ASPCA analysesGiven the evidence from our tract length analysis for a second
pulse of African migrants into the admixture of insular
Caribbean Latinos, a modified size-based ASPCA analysis was
performed. A reference panel was built integrating three
different resources [8,10,40] and focusing on putative source
populations from along the West African coast, including
Mandenka from Senegal, Yoruba and Igbo from Nigeria,
Bamoun and Fang from Cameroon, Brong from western
Ghana, and Kongo from the Democratic Republic of the
Congo. We begin with the continental local ancestry inference
from PCAdmix K = 3. For each individual we then divide
African ancestry tracts into small (0 to 50 cM) and large
(.50 cM) size classes. Given a partition of African ancestry
tracts, we take all sites included in one tract class, say short
tracts, and run PCA on our sub-continental West African
reference populations for only these sites. Using the first two
PCs from this analysis, we fit a bivariate normal distribution to
each reference population cluster. We then project our test
sample into this PCA space, and estimate the probability of it
coming from each reference population using the fitted
distributions. This procedure is repeated for each tract class,
for each individual. For each admixed Caribbean population,
we can then estimate the probability that a given class of African
ancestry tracts comes from a specific West African source
population as the average probability of assignment to this
population across all individuals. Finally, under the assumption
that a given class of African tracts must come from one of the
provided reference populations, we rescale these probabilities to
sum to one. Each assignment estimate is also provided with
error bars representing the standard error of the mean. We
compare the short and long assignment probabilities for each
Caribbean population to identify distinct sources for ‘‘older’’
and ‘‘younger’’ West African migratory source populations.
Haitians were not included in the analysis due to low sample
size (n = 4). Due to concerns that shorter tracts have a higher
likelihood of mis-assignment, we added a medium tract size class
(5 cM to 50 cM) to see if the results were simply due to very
short (0 cM to 5 cM) European or Native American tracts being
mis-classified as African. We compare the results for short and
medium tracts and find that the trends are maintained
suggesting the observation that older shorter tracts appear to
be primarily from the Mandenka and Brong source populations
is not simply due to short tract mis-assignment
Local ancestry estimation within African tractsTo identify likely regions of Yoruba versus Mandenka ancestry
in the African component, we modified our implementation of
PCAdmix to perform local ancestry deconvolution solely of the
African segments of the admixed genomes. The modification is
achieved in the final step of the algorithm: whereas the standard
approach estimates a single HMM across an entire chromosome,
here we fit J disjoint HMMs spanning each of the J blocks of
African ancestry in a given chromosome for a given individual.
Applying the method, we obtained posterior probabilities for
Mandenka versus Yoruba ancestry within the previously inferred
African segments. We then selected only those sub-regions that
were confidently called as Mandenka or Yoruba, and stratified
them by physical size.
Supporting Information
Figure S1 Principal component 1 versus lower order PCs
defining sub-continental components among Native American
populations. Top: PC5 separates Venezuelan population isolates
from the rest of Native Americans. Bottom: PC7 separates
Mesoamerican from Andean groups. Mexicans and Hondurans
distribute between the European and Mesoamerican clusters,
whereas Colombians slightly deviate towards the Andean and
Venezuelan clusters. Global PCA analysis based on the high-
density dataset (,390 K SNPs) and thus limited to reference panel
populations with available Affymetrix SNP array data (see Table
S1 for details).
(TIF)
Figure S2 ADMIXTURE results from K = 2 through 15 based
on the high-density dataset (,390 K SNPs) including 7 admixed
Latino populations and 19 reference populations. A low-frequency
Southern European component restricted to Mediterranean
populations at lower order Ks and specifically to Iberian
populations at higher order Ks, accounts for the majority of
European ancestry among Latinos (black bars). It further
decomposes into population-specific clusters (purple bars) denoting
higher similarities within the European portion among Latinos
compared to European source populations.
(TIF)
Figure S3 ADMIXTURE metrics at increasing K values based
on Log-likelihoods (A) and cross-validation errors (B) for results
shown in Figure S2.
(TIF)
Figure S4 Comparison of ADMIXTURE estimates obtained
from autosomes and the X chromosome in different Latino/
Caribbean populations. A) Cluster-based results for K = 3 using
the same set of ancestral populations as in Figure S2. Because
the X chromosome is diploid, the analysis was restricted to
female individuals from the seven admixed Latino populations.
Within each population, individuals are sorted from largest to
smallest proportion of European ancestry. B) Box plot showing
Ancestral Components of the Caribbean
PLOS Genetics | www.plosgenetics.org 16 November 2013 | Volume 9 | Issue 11 | e1003925
the directionality of the difference between X and autosomal
ancestry proportions considering all populations together. P-
values on top correspond to the Wilcoxon signed rank test
applied to assess statistical significance (see Materials and
Methods). C) Box plots and statistical tests for each population
(Haitians excluded due to low sample size). The observed
pattern strongly supports the presence of sex-biased gene flow
during the process of admixture throughout the Caribbean, with
significantly higher contribution from Native American, and to
a lesser extent West African, ancestors into the composition of
the X chromosome, which largely reflects the female demo-
graphic history of a population.
(TIF)
Figure S5 Correlation between male and female continental
ancestries. Parents’ ancestry proportions from each trio were used
to compare correlation coefficients between the observed values
and 100,000 permuted male-female pairs (p-values shown for the
combined set of Latino Caribbean samples and for each
population in Table S2).
(TIF)
Figure S6 Ancestry tract lengths distribution per population
and demographic model tested in Tracts. For each demographic
scenario, the observed distribution is compared to the
predictions of the best-fitting migration model (displayed below
each distribution). Solid lines represent model predictions and
shaded areas are one-sigma confidence region surrounding the
predictions. Three different demographic scenarios were
considered, all of which assume the involvement of European
and Native American tracts at the onset of admixture, followed
by the introduction of African migrants (denoted by EUR,-
NAT+AFR). The second and third models allow for an
additional pulse of European (EUR,NAT+AFR+EUR) and
African (EUR,NAT+AFR+AFR) ancestry, respectively. Likeli-
hood values for each model are shown on top of each plot.
Pie charts above each migration model are proportional to the
estimated number of migrants being introduced at each point in
time (black arrows). GA: generations ago.
(TIF)
Figure S7 ASPCA analysis of Native American haplotypes
derived from admixed genomes (solid circles) and reference panel
populations from [11] grouped by linguistic families as reported
therein. Top panels: ASPCA with the full reference panel of
Native American populations. Bottom panels: Filtered ASPCA
without extreme outliers (Aleutians, Greenlanders, and Surui
excluded from the analysis). Each individual from the reference
panel is represented by the corresponding population label
centered on its PCA coordinates. A zoomed version of PC1 vs.
PC2 for the filtered set (bottom left) grouped by geographic
sampling location is available in Figure 4A.
(TIF)
Figure S8 ADMIXTURE results from K = 2 through 20
based on the low-density dataset (,30 K SNPs) including
additional admixed Latino and Native American reference
populations (see Table S1 for details). The presence of the
Latino European component (black and gray bars) is recap-
tured among independently sampled Latino populations. FL:
Florida (this study); NY: New York; 1KG: 1000 Genomes
Project samples. Native American populations from [11] are
grouped according to linguistic families reported therein.
Labels are shown for the populations representing the 15
Native American clusters identified at K = 20 (four of the
remaining five being of European ancestry and one of West
African ancestry). Clusters involving multiple populations are
identified by those with the highest membership values.
Throughout lower and higher order Ks, several South
American components (yellow and green bars), show varying
degrees of shared genetic membership with Mesoamerican
Mayans, accounting for up to nearly half of their genome
composition (see Figure 4 for more details).
(TIF)
Figure S9 ADMIXTURE metrics at increasing K values based
on Log-likelihoods (A) and cross-validation errors (B) for results
shown in Figure S8.
(TIF)
Figure S10 ASPCA distribution of Iberian samples (red circles)
compared to European haplotypes derived from our Latino
Caribbean samples (top panel) and from an independent cohort of
Mexican samples (bottom panel). The relative deviation from the
Iberian cluster is significantly different comparing the Caribbean
versus the Mexican dataset (see the main text for details).
(TIF)
Figure S11 ASPC2 values per population from the European-
specific PCA analysis shown in Figure 5 and Figure S10.
Population codes as in Table S1. The boxplot shows that low
ASPC2 values are enriched with mainland Colombian and
Honduran haplotypes, whereas insular Caribbean populations
show less deviated values from the Iberian cluster. A Wilcoxon
rank test between mainland (COL, HON) versus insular samples
(CUB, PUR, DOM) demonstrated that these two groups disperse
over significantly different ranges in ASPC2 (Haitians excluded
due to low sample size).
(TIF)
Figure S12 IBD sharing between different Caribbean Latino
populations and a representative subset of POPRES European
populations as measured by a summed pairwise IBD statistic. For
each Latino population, maximum pairwise IBD levels were
observed in those pairs involving Spanish and, to a lesser extent,
Portuguese samples, in agreement with our ASPCA results.
(TIF)
Figure S13 IBD sharing between pairs of individuals within A)
Caribbean Latinos and B) a representative subset of POPRES
European populations. Inset histograms display counts lower
than 50 for the same binning categories. The overall count of
pairs sharing short segments of total IBD is higher among
Europeans, probably as a result of an older shared pool of
source haplotypes. In contrast, the higher frequency of longer
IBD matches among Latinos is compatible with a recent
European founder effect. After excluding within-population
pairs of Latino individuals (top right), there are still more and
longer IBD matches among Caribbean populations compared to
Iberians (bottom right).
(TIF)
Figure S14 ASPCA analysis of African haplotypes derived from
admixed genomes with .25% of African ancestry (black symbols)
and a representative subset of African HapMap3 and other West
African reference panel populations from [10]. Colombians and
Hondurans excluded due to lower overall proportions of African
ancestry.
(TIF)
Figure S15 ASPCA analysis of short versus long African
ancestry tracts from admixed genomes and West African reference
panel populations. To exemplify our size-based ASPCA approach,
the African genome of a Puerto Rican individual is displayed
Ancestral Components of the Caribbean
PLOS Genetics | www.plosgenetics.org 17 November 2013 | Volume 9 | Issue 11 | e1003925
(denoted by PUR). Left: PUR clusters with Mandenka when only
sites within short ancestry tracts (,50 cM) are considered to
perform PCA. Right: a similar background distribution is obtained
but the same PUR individual no longer clusters with Mandenka
when considering long ancestry tracts (.50 cM).
(TIF)
Figure S16 African ancestry size-based ASPCA results per
population sample. Considering three different classes of ancestry
tract lengths (black: short; red: long; blue: intermediate), scaled
assignment probabilities are shown for each African source
population. Values on the y-axis are the average probability of
assignment to each potential source population across all
individuals within each Latino population (see Materials and
Methods for details).
(TIF)
Table S1 Summary of Latino populations and assembled
reference panels.
(PDF)
Table S2 Correlation p-values of male vs. female ancestry.
(PDF)
Table S3 FST divergences between estimated populations for
K = 8 using ADMIXTURE.
(PDF)
Table S4 FST divergences between estimated populations for
K = 20 using ADMIXTURE.
(PDF)
Text S1 Methodology of the Ancestry-Specific PCA (ASPCA)
implementation.
(PDF)
Acknowledgments
We thank study participants for generously donating DNA samples,
Brenna M. Henn, Martin Sikora, and Meredith Carpenter for helpful
comments on earlier versions of the manuscript, Scott Huntsman for data
management, and David Reich and Andres Ruiz-Linares for sharing their
Native American dataset (obtained from the University of Antioquia
through a data access agreement dated July 26, 2012). We acknowledge the
NIH GWAS Data Repository for granting access to the Population
Reference Sample (POPRES) dataset. The datasets used for the analyses
described in this manuscript were obtained from dbGaP through accession
number phs000145.v1.p1.
Author Contributions
Conceived and designed the experiments: AME CDB ERM MLC JLM
JCMC. Performed the experiments: ERM JLM RJM DJH CE. Analyzed
the data: AME FZ SG JKB CRG PAOT SAA. Contributed reagents/
materials/analysis tools: ERM MLC JLM RWM KS PJN ZL PP EGB
CDB. Wrote the paper: AME SG FZ JKB CRG CDB.
References
1. Bustamante CD, Burchard EG, De la Vega FM (2011) Genomics for the world.
Nature 475: 163–165.
2. Wang S, Ray N, Rojas W, Parra MV, Bedoya G, et al. (2008) Geographic
patterns of genome admixture in Latin American Mestizos. PLoS Genet 4:
e1000037.
3. Bryc K, Velez C, Karafet T, Moreno-Estrada A, Reynolds A, et al. (2010)
Colloquium paper: genome-wide patterns of population structure and admixture
among Hispanic/Latino populations. Proc Natl Acad Sci U S A 107 Suppl 2:
8954–8961.
4. Via M, Gignoux CR, Roth LA, Fejerman L, Galanter J, et al. (2011) History
shaped the geographic distribution of genomic admixture on the island of Puerto
Rico. PLoS ONE 6: e16513.
5. Kidd JM, Gravel S, Byrnes J, Moreno-Estrada A, Musharoff S, et al. (2012)
Population genetic inference from personal genome data: impact of ancestry and
admixture on human genomic variation. Am J Hum Genet 91: 660–671.
6. Abecasis GR, Auton A, Brooks LD, DePristo MA, Durbin RM, et al. (2012) An
integrated map of genetic variation from 1,092 human genomes. Nature 491:
56–65.
7. Martinez-Cruzado J, Toro-Labrador G, Viera-Vera J, Rivera-Vega M, Startek
J, et al. (2005) Reconstructing the population history of Puerto Rico by means of
mtDNA phylogeographic analysis. Am J Phys Anthropol 128: 131–55
8. Consortium IH, Frazer KA, Ballinger DG, Cox DR, Hinds DA, et al. (2007) A
second generation human haplotype map of over 3.1 million SNPs. Nature 449:
851–861.
9. Nelson MR, Bryc K, King KS, Indap A, Boyko AR, et al. (2008) The Population
Reference Sample, POPRES: a resource for population, disease, and
pharmacological genetics research. Am J Hum Genet 83: 347–358.
10. Bryc K, Auton A, Nelson MR, Oksenberg JR, Hauser SL, et al. (2010) Genome-
wide patterns of population structure and admixture in West Africans and
African Americans. Proc Natl Acad Sci U S A 107: 786–791.
11. Reich D, Patterson N, Campbell D, Tandon A, Mazieres S, et al. (2012)
Reconstructing Native American population history. Nature 488: 370–374.
12. Alexander DH, Novembre J, Lange K (2009) Fast model-based estimation of
ancestry in unrelated individuals. Genome Res 19: 1655–1664.
13. Sandoval K, Moreno-Estrada A, Mendizabal I, Underhill PA, Lopez-Valenzuela
M, et al. (2012) Y-chromosome diversity in Native Mexicans reveals continental
transition of genetic structure in the Americas. Am J Phys Anthropol 148: 395–
405.
14. Wang S, Lewis C, Jakobsson M, Ramachandran S, Ray N, et al. (2007) Genetic
Variation and Population Structure in Native Americans. PLoS Genet 3: e185.
15. Novembre J, Johnson T, Bryc K, Kutalik Z, Boyko AR, et al. (2008) Genes
mirror geography within Europe. Nature 456: 98–101.
16. Auton A, Bryc K, Boyko A, Lohmueller K, Novembre J, et al. (2009) Global
distribution of genomic diversity underscores rich complex history of continental
human populations. Genome Res 19: 1–30.
17. Risch N, Choudhry S, Via M, Basu A, Sebro R, et al. (2009) Ancestry-related
assortative mating in Latino populations. Genome Biology 10: R132.
18. Pool JE, Nielsen R (2008) Inference of Historical Changes in Migration Rate
From the Lengths of Migrant Tracts. Genetics 181: 711–719.
19. Brisbin A, Bryc K, Byrnes J, Zakharia F, Omberg L, et al. (2012) PCAdmix:
Principal Components-Based Assignment of Ancestry Along Each Chromosomein Individuals with Admixed Ancestry from Two or More Populations. Hum
Biol 84: 343–364.
20. Gravel S (2012) Population genetics models of local ancestry. Genetics 191: 607–
619.
21. Fernandez-Mendez E (1970) Historia cultural de Puerto Rico. San Juan, Puerto
Rico: Ediciones El Cemı.
22. Tremblay M, Vezina H (2000) New estimates of intergenerational time intervals
for the calculation of age and origins of mutations. Am J Hum Genet 66: 651–658.
23. Johnson NA, Coram MA, Shriver MD, Romieu I, Barsh GS, et al. (2011)
Ancestral components of admixed genomes in a mexican cohort. PLoS Genet 7:
e1002410.
24. Botigue LR, Henn BM, Gravel S, Maples BK, Gignoux CR, et al. (2013) Gene
flow from North Africa contributes to differential human genetic diversity insouthern Europe. Proc Natl Acad Sci U S A 110: 11791–11796.
25. Lao O, Lu TT, Nothnagel M, Junge O, Freitag-Wolf S, et al. (2008) Correlation
between genetic and geographic structure in Europe. Curr Biol 18: 1241–1248.
26. Torgerson DG, Gignoux CR, Galanter JM, Drake KA, Roth LA, et al. (2012)
Case-control admixture mapping in Latino populations enriches for knownasthma-associated genes. J Allergy Clin Immunol 130: 76–82.
27. Rodrıguez Ramos R (2010) What is the Caribbean? An archaeologicalperspective. Journal of Caribbean Archaeology 3: 19–51.
28. Rouse I (1986) Migrations in prehistory : inferring population movement fromcultural remains. New Haven: Yale University Press. XIV, 202 p.
29. Rouse I (1993) The Tainos: Rise and Decline of the People who greeted
Columbus. New Haven: Yale University Press. 224 p.
30. Diamond J, Bellwood P (2003) Farmers and their languages: the first expansions.
Science 300: 597–603.
31. Ruhlen M (1991) A guide to the world’s languages. StanfordCalifornia: Stanford
University Press. 463 p.
32. Demarchi DA, Garcia Ministro A (2008) Genetic Structure of Native
Populations from the Gran Chaco Region, South America. Int J Hum Genet8: 131–141.
33. Lalueza-Fox C, Calderon FL, Calafell F, Morera B, Bertranpetit J (2001)MtDNA from extinct Tainos and the peopling of the Caribbean. Ann Hum
Genet 65: 137–151.
34. Eltis D, Richardson D (2010) Atlas of the Transatlantic Slave Trade. New
Haven: Yale University Press. 307 p.
35. Mao X, Bigham AW, Mei R, Gutierrez G, Weiss KM, et al. (2007) Agenomewide admixture mapping panel for Hispanic/Latino populations.
Am J Hum Genet 80: 1171–1178.
36. Price AL, Patterson NJ, Plenge RM, Weinblatt ME, Shadick NA, et al. (2006)
Principal components analysis corrects for stratification in genome-wideassociation studies. Nat Genet 38: 904–909.
Ancestral Components of the Caribbean
PLOS Genetics | www.plosgenetics.org 18 November 2013 | Volume 9 | Issue 11 | e1003925
37. Browning S, Browning B (2007) Rapid and Accurate Haplotype Phasing and
Missing-Data Inference for Whole-Genome Association Studies. Am J HumGenet 81: 1084–1097.
38. Raiko T, Ilin A, Karhunen J (2007) Principal component analysis for large
scale problems with lots of missing values. Machine Learning: ECML 2007:691–698.
39. Purcell S, Neale B, Todd-Brown K, Thomas L, Ferreira MAR, et al. (2007)
PLINK: a tool set for whole-genome association and population-based linkageanalyses. Am J Hum Genet 81: 559–575.
40. Li JZ, Absher DM, Tang H, Southwick AM, Casto AM, et al. (2008) Worldwide
human relationships inferred from genome-wide patterns of variation. Science319: 1100–1104.
Ancestral Components of the Caribbean
PLOS Genetics | www.plosgenetics.org 19 November 2013 | Volume 9 | Issue 11 | e1003925
Related Documents