Western University Scholarship@Western Electronic esis and Dissertation Repository June 2015 Reconstructing subsistence practices of southwestern Ontario Late Woodland Peoples (A.D. 900-1600) using stable isotopic analyses of faunal material Zoe H. Morris e University of Western Ontario Supervisor Dr. Christine White and Dr. Fred Longstaffe e University of Western Ontario Graduate Program in Anthropology A thesis submied in partial fulfillment of the requirements for the degree in Doctor of Philosophy © Zoe H. Morris 2015 Follow this and additional works at: hp://ir.lib.uwo.ca/etd Part of the Archaeological Anthropology Commons is Dissertation/esis is brought to you for free and open access by Scholarship@Western. It has been accepted for inclusion in Electronic esis and Dissertation Repository by an authorized administrator of Scholarship@Western. For more information, please contact [email protected]. Recommended Citation Morris, Zoe H., "Reconstructing subsistence practices of southwestern Ontario Late Woodland Peoples (A.D. 900-1600) using stable isotopic analyses of faunal material" (2015). Electronic esis and Dissertation Repository. Paper 2921.

Welcome message from author
This document is posted to help you gain knowledge. Please leave a comment to let me know what you think about it! Share it to your friends and learn new things together.
Transcript
Western UniversityScholarship@Western
Electronic Thesis and Dissertation Repository
June 2015
Reconstructing subsistence practices ofsouthwestern Ontario Late Woodland Peoples(A.D. 900-1600) using stable isotopic analyses offaunal materialZoe H. MorrisThe University of Western Ontario
SupervisorDr. Christine White and Dr. Fred LongstaffeThe University of Western Ontario
Graduate Program in Anthropology
A thesis submitted in partial fulfillment of the requirements for the degree in Doctor of Philosophy
© Zoe H. Morris 2015
Follow this and additional works at: http://ir.lib.uwo.ca/etd
Part of the Archaeological Anthropology Commons
This Dissertation/Thesis is brought to you for free and open access by Scholarship@Western. It has been accepted for inclusion in Electronic Thesisand Dissertation Repository by an authorized administrator of Scholarship@Western. For more information, please contact [email protected].
Recommended CitationMorris, Zoe H., "Reconstructing subsistence practices of southwestern Ontario Late Woodland Peoples (A.D. 900-1600) using stableisotopic analyses of faunal material" (2015). Electronic Thesis and Dissertation Repository. Paper 2921.
RECONSTRUCTING SUBSISTENCE PRACTICES OF SOUTHWESTERN ONTARIO LATE WOODLAND PEOPLES (AD 900–1600) USING STABLE
ISOTOPIC ANALYSES OF FAUNAL MATERIAL
(Integrated Article)
by
Zoe Hensley Morris
Graduate Program in Anthropology
A thesis submitted in partial fulfillment of the requirements for the degree of
Doctorate of Philosophy
The School of Graduate and Postdoctoral Studies The University of Western Ontario
London, Ontario, Canada
© Zoe Hensley Morris 2015
ii
ii
Abstract
Stable carbon–, nitrogen–, and oxygen–isotope analyses of animal bones and teeth from 28
archaeological sites are used to reconstruct human subsistence behaviour, i.e., increased
maize horticulturalism, during the Late Woodland period (A.D. 1000–1650) in southwestern
Ontario. The isotopic data provided dietary, seasonal, and geographic information, which
was analysed within archaeological, symbolic, and ecological contexts and used to
reconstruct the diets, hunting patterns, and animal processing practices of two neighbouring
groups, the Ontario Iroquoian and Western Basin peoples.
Paleodietary and seasonality analyses focused on the following species: canids (domestic
dogs, foxes, and wolves), wild turkeys and white-tailed deer, though additional fauna
(including black bears, raccoons, and squirrels) were also analysed. Bone (n=324) and
dentine (n=11) collagen provided dietary information, specifically concerning access to
maize and trophic position. The carbon– and nitrogen–isotope composition of modern plants
(n= 8) and animals (n=87) was used to expand the local food web and understand abilities of
modern animals to access crops. Structural carbonate isotopic analyses for archaeological
(n=126) and modern (n=28) individuals provided additional information about trophic
position, post–mortem alteration, and geographic affiliation. Serially sampled enamel was
analysed for several deer and a dog, and was successfully paired with x–radiographs to create
an enamel formation sequence, which enables reconstruction of short term (seasonal) diets.
The domestic dog isotopic data expanded our understanding of human dietary change over
the Late Woodland period for both Ontario Iroquoian and Western Basin peoples, including
different emphases on protein sources (i.e., fish). Wild fauna, particularly foxes, wild
turkeys, raccoons and squirrels, were able to access maize. The turkey isotopic data suggest a
unique hunting strategy at some Ontario Iroquoian sites, i.e., the purposeful discard of maize
to create a predictable field hunting zone. An unexpected relationship between the δ13Ccol and
δ13Csc values of deer appears to reflect a post–mortem processing (i.e., boiling) practice. This
thesis has expanded our understanding of Late Woodland diets, horticultural and hunting
practices. It has also demonstrated that fauna may be used to reconstruct human behaviour
and ideology in lieu of the destructive analysis of human remains.

iii
iii
Keywords
Stable isotopes, bioarchaeology, white-tailed deer, dogs, wild turkey, southwestern Ontario
Late Woodland archaeology
iv
iv
Dedication
Dedicated to all the selfless relationships that grow our hearts and expand our minds.
To Kai - my son and soul mate - your happiness is my greatest achievement and your impending birth gave me a deadline that inspired me to finally finish
To Lola - your unyielding loyalty brings me continued happiness and contentment. You truly
got me through the ups and downs of thesis research and writing.
v
v
Acknowledgments
There are so many people to thank for making my thesis possible that I am worried my
acknowledgments will be as long as the thesis itself! I can say without hesitation that I have
the best supervisors ever. Thank you to Dr. Christine White and Dr. Fred Longstaffe for your
tireless commitment and encouragement through this entire process. Chris, thank you for
choosing to have me come to Western and the Department of Anthropology. It is your
guidance and support through the maze and hoops of graduate school and research that got
me to the end. Thank you for tea at Angelo’s, for your kindness and patience, and for talking
me through my self-doubt. Fred, thank you for making me a part of the Laboratory for
Stable Isotope Science team. Thank you for keeping me focused when my ideas wandered.
Thank you for your terrible puns and, of course, thank you for your unmatched dedication to
the lab and your students. I owe you a thesis limerick.
A special thank you to Dr. Lisa Hodgetts for your role as part of my advisory and examining
committee and for the access to the Zooarchaeology Lab. You not only helped me with my
samples, but taught me the basics of faunal identification. Your personal support for my
project and for me and my family will always be remembered. Thank you for the invaluable
input, ideas, and direction from Dr. Neal Ferris and Dr. Christopher Ellis. Our discussions
shaped and directed my research and writing. Thank you to my examining committee, Dr.
Elizabeth Webb, Dr. Michael Spence, and Dr. Christopher Watts. Your time, questions, and
insights are truly appreciated.
Funding for this project was generously provided by a J. Armand Bombardier Doctoral
Scholarship from the Social Science and Humanities Research Council, an Ontario Graduate
Scholarship, the Western Graduate Scholarship, and Western Graduate Thesis Research
Awards as well as grants from Natural Sciences and Engineering Research Council, the
Western Graduate Research Fund, Canada Foundation for Innovation, the Ontario Research
Fund; and support from the Canada Research Chairs program.
Thank you to the many individuals and institutions that provided samples and laboratory
access for my project. Specifically, thank you to Dr. Kamal Khidas, Noel Alfonso and the
Canadian Museum of Nature for access to modern faunal specimens and their radiographic

vi
vi
equipment. Thank you to Kevin Seymour and the Royal Ontario Museum for access to their
comparative mammalian collection and use of their radiographic equipment. Thank you to
Sustainable Archaeology for the opportunity to work in the Ancient Images Laboratory,
access to samples for isotopic analysis, and use of their digital radiographic equipment.
Thank you to D.R. Poulton & Associates Inc. for access to modern comparative samples for
radiography and archaeological samples for isotopic analysis. Thank you to McMaster’s
Department of Anthropology, along with Dr. Meghan Burchell and Christine Cluney, for
access to their archaeological collections for isotopic analysis. Thank you to the Museum of
Ontario Archaeology, the London Office of the Ministry of Tourism, Culture and Sport, and
Golder and Associates Inc. for allowing me the access to analyze archaeological samples
from several sites.
At Western University, I would like to thank the Department of Biology and Sarah Lee for
access to hundreds of modern deer samples for radiography. The Department of
Anthropology has supported my long graduate career with incredible courses, teaching
assistant opportunities, funding and a wonderful team of faculty and staff. I would like give a
big thanks to the Department of Anthropology’s Zooarchaeology Laboratory for access to
samples, their comparative collection and a space to process modern samples. Thank you to
Edward Eastaugh for brainstorming ideas and sharing his space in the Zooarch Lab with me.
Thank you to Anthropology’s Radiography Laboratory and Dr. Andrew Nelson for training
me and providing me with film and chemicals. Additionally, I would like to thank Dr. Alexis
Dolphin, Anna Jung, Jim Keron and John Moody for their help in the Anthropology labs.
Thank you to Dr. Lindsay Foreman for helping identify the hundreds of samples collected for
isotopic analysis.
I would like to thank all the individuals who took the time to collect and donate modern deer
and wild turkey samples, which were invaluable to my research, including Ted Barney,
Richard Baskey, Mike Boyd, Dr. Ryan Hladyniuk, Jim Keron, Monica and Greg Maika, and
Dr. Wendy Russell. Thank you to Gypsy Price for access to her unpublished wild turkey
thesis data.
My extreme gratitude to the Laboratory for Stable Isotope Science and my lab family and
friends. I quite literally could not have done this project without you. Kim Law, you are the
vii
vii
laboratory glue which keeps all of us (and the machines) going. Thank you for friendship,
your bunk bed and your pool parties. Thank you to Li Huang for your dedication to keeping
the machines working for us, even those with wooden knobs. A big thank you to Grace Yau
for your help in the lab and going above and beyond as I was finishing up. Thank you to Dr.
Andrea Prentice; Deana Schwarz; Dr. Corey Maggiano; Dr. Jessica Metcalfe; Rachel
Schwartz–Narbonne; Mitchell Skuce; Dr. Paul Spzak; Dr. Emily Webb; and Emily Wells for
the stimulating and intellectual (and sometimes non-intellectual) isotopic (and sometimes
non-isotopic) exchanges of ideas. At first I was intimidated to be part of such an incredible
lab, but it was because of each of you that I feel that I grew to be a contributing part of the
lab group. An additional thank you to Paul for simplifying the collagen protocol right before
I started my samples - what excellent timing!
I am particularly grateful to Laura Booth for your gracious nature and insightful mind, and
that I had the pleasure to work with you on this thesis. I cannot imagine a better colleague
and friend with whom to share ideas, a project, and the stories of our loving pets.
I was incredibly fortunate to have a number of undergraduate volunteers assist me at various
stages of my thesis research. Many of you have become friends and colleagues. I would like
to thank and acknowledge Colin Baillie, Katherine Bishop, Rebecca Dillon, Tamara Hinan,
Alex Leatherdale, Rebecca Parry, Micheline Piskun, Tessa Plint, Stephanie McGill, and
Claire Venet–Rogers for all of your individual efforts and hard work.
Thank you to my graduate program cohort (plus or minus a few years) for the friendships that
go beyond academia. Thank you to Dr. Flannery Surette, Caitlin Hanson, Monica Maika,
Drs. Juli and Matt Beaudoin, Drs. Lana Williams and Sandra Wheeler, Dr. Jenn Long, Matt
Teeter, and Dr. Barbara Neufeld Hewitt. Whether in class, at the Grad Club, or from a
distance, I could count on any one of you to support me as a peer and friend.
My time at Western has allowed me to grow as an Anthropologist but also an educator and I
am incredibly grateful to have worked with and learned from the incredible teachers and
team at the Teaching Support Centre. Thank you to Dr. Nanda Dimitrov, Dr. Deb Dawson,
Judy Purves, and everyone on the TATP team.

viii
viii
To my friends who have supported me through my thesis and beyond, Tammy Kim, Dr.
Nicole Truesdell, and Michelle Wydra, thank you for your enduring friendships. Each of you
embodies what it means to be exceptional human beings, dedicated to enriching the world
beyond yourselves.
Every paragraph above about the labs, the department, the TSC, the friendships, the
intellectual insight, and the endless support all include Dr. Karyn Olsen. Karyn, I simply
can’t imagine my PhD experience without you! Thank you for your mentorship, your
friendship, your (purposefully) burnt baked goods, and your mutual love of all-you-can-eat
sashimi.
To my extended family, Hope and David, Frank and Hugh, Maureen, Sheila, and Laura,
thank you for years of support and love. To my grandparents, Paddy and Muriel, and uncle
Frank, you have passed on but are not forgotten. To Mary, any time I doubted myself, I
thought of you and your hard work towards your own dream, and your belief in my ability to
achieve mine, thank you.
Matt Hardy, thank you for giving me the greatest gift I have ever been given: our son, Kai.
Thank you for making me a part of your wonderful and loving family. And thank you to
Fredman and Geraldine Hardy, Jasmine, Alyson and Rhoman and their families, and all of
Matt’s aunts, uncles and cousins for accepting me with open arms. I am so glad that purple
car broke down ten years ago!
Thank you to my sister, Noriko Kariya and god-son, Tetsuhiko. Noriko your strength of
character and dedication in every aspect of your life, including our friendship, is
immeasurable. Tetsuhiko, your spirit is an inspiration that touches everyone who meets you.
It is difficult to express how lucky I am to have the family that I do. I truly have the most
generous, most kind, most patient, and most inspirational parents. Tim and Helena, your love
for each other, for life, and for Hope and me has made possible not just this thesis, but all of
my achievements in life. Thank you.
And, as promised, to my sister whom I love unconditionally:
Hope Morris.
ix
ix
Table of Contents Abstract ............................................................................................................................... ii
Dedication .......................................................................................................................... iv
Acknowledgments............................................................................................................... v
Table of Contents ............................................................................................................... ix
List of Tables ................................................................................................................... xiv
List of Figures ................................................................................................................ xviii
List of Appendices ......................................................................................................... xxiii
Chapter 1 ............................................................................................................................. 1
1 Introduction .................................................................................................................... 1
1.1 Research objectives ................................................................................................. 1
1.2 Stable isotopic analysis of faunal remains .............................................................. 2
1.3 Stable isotopes ........................................................................................................ 3
1.3.1 Carbon-isotope systematics ........................................................................ 4
1.3.2 Nitrogen-isotope systematics ...................................................................... 6
1.3.3 Previous food-web carbon- and nitrogen-isotope studies in Ontario .......... 6
1.3.4 Oxygen-isotope systematics...................................................................... 11
1.4 Research context: Late Woodland SW Ontario .................................................... 15
1.5 Research sample.................................................................................................... 16
1.6 Organization of this dissertation ........................................................................... 20
1.7 References ............................................................................................................. 21
Chapter 2 ........................................................................................................................... 32
2 Domestic and wild canids ............................................................................................ 32
2.1 Introduction ........................................................................................................... 32
2.1.1 History of dogs in North America ............................................................ 35
x
x
2.1.2 Dogs and other canids in the Great Lakes region ..................................... 36
2.1.3 Dogs as proxies for human diet ................................................................ 40
2.2 Materials and methods .......................................................................................... 41
2.2.1 Stable isotopes .......................................................................................... 41
2.2.2 Canid identification ................................................................................... 42
2.2.3 Bulk bone sampling .................................................................................. 46
2.2.4 Stable isotopic analysis ............................................................................. 46
2.3 Results ................................................................................................................... 49
2.3.1 Sample integrity ........................................................................................ 49
2.3.2 Adult canid remains isotope results .......................................................... 51
2.3.3 Juvenile canid remains isotope results ...................................................... 55
2.4 Discussion ............................................................................................................. 59
2.4.1 Identifying canid ecological niches .......................................................... 59
2.4.2 Juvenile Canids ......................................................................................... 70
2.4.3 Dogs as proxies for human diet ................................................................ 70
2.4.4 3C values of humans versus dogs .............................................................. 80
2.4.5 δ15Ncol values of humans versus dogs ....................................................... 85
2.4.6 Models used for reconstructing dog diets ................................................. 87
2.4.7 Western Basin dogs................................................................................... 89
2.4.8 Ontario Iroquoian dogs ............................................................................. 90
2.4.9 δ18Osc of canids: geographic associations ................................................. 93
2.5 Conclusion ............................................................................................................ 97
2.6 Future Work ........................................................................................................ 100
References Cited ........................................................................................................ 102
Chapter 3 ....................................................................................................................... 115
xi
xi
3 Wild Turkey ............................................................................................................... 115
3.1 Introduction ......................................................................................................... 115
3.2 Background ......................................................................................................... 117
3.2.1 The eastern wild turkey: habitat and behaviour ...................................... 117
3.2.2 Wild versus domesticated: dichotomies versus continuums ................... 121
3.2.3 Previous stable isotope bird studies ........................................................ 124
3.3 Materials and methods ........................................................................................ 125
3.3.1 Materials ................................................................................................. 125
3.3.2 Sample description .................................................................................. 127
3.3.3 Burial context .......................................................................................... 128
3.3.4 Post-mortem alteration ............................................................................ 129
3.3.5 Analytical procedures ............................................................................. 129
3.4 Results ................................................................................................................. 131
3.4.1 Sample integrity ...................................................................................... 131
3.4.2 Isotope results ......................................................................................... 134
3.5 Discussion ........................................................................................................... 135
3.5.1 Modern wild turkeys: analogies for maize–waste access ....................... 135
3.5.2 Ontario Iroquoian wild turkeys ............................................................... 144
3.5.3 Comparative collagen study .................................................................... 148
3.5.4 Wild turkey food security and garden hunting ....................................... 153
3.5.5 Wild turkey for ritual and cold-weather feasting .................................... 156
3.5.6 Domestication status ............................................................................... 158
3.5.7 Tracing hunting ranges using δ18Osc values ............................................ 159
3.6 Conclusions ......................................................................................................... 162
References Cited ........................................................................................................ 164

xii
xii
Chapter 4 ......................................................................................................................... 176
4 White-tailed deer ........................................................................................................ 176
4.1 Introduction ......................................................................................................... 176
4.2 Background ......................................................................................................... 178
4.2.1 White-tailed deer ecology and physiology ............................................. 178
4.2.2 Modern white-tailed deer and humans .................................................... 181
4.2.3 Ancient white-tailed deer and humans .................................................... 183
4.2.4 Stable isotopes ........................................................................................ 185
4.2.5 Post-mortem alteration ............................................................................ 187
4.2.6 Bone and dental tissue formation ............................................................ 191
4.3 Materials and methods ........................................................................................ 193
4.3.1 Age determinations based on dental eruption ......................................... 194
4.3.2 Age determination based on radiography ............................................... 195
4.3.3 Sampling for isotopic analysis ................................................................ 197
4.3.4 Bulk bone selection and identification .................................................... 199
4.3.5 Enamel serial section sampling ............................................................... 200
4.3.6 Analytical procedures ............................................................................. 201
4.3.7 Fourier transform infra–red spectroscopy (FTIR) .................................. 202
4.4 Results ................................................................................................................. 202
4.4.1 Dental mineralization .............................................................................. 202
4.4.2 Sample integrity ...................................................................................... 203
4.4.3 Isotope results ......................................................................................... 207
4.5 Discussion ........................................................................................................... 223
4.5.1 Modern and archaeological deer enamel (δ18Osc): Linking seasonality with dental formation ...................................................................................... 223
4.5.2 Modern deer: Proxies for maize access and consumption ...................... 224
xiii
xiii
4.5.3 Archaeological deer collagen (δ13Ccol, δ15Ncol): Tracking diet and canopy effect ....................................................................................................... 228
4.5.4 Archaeological deer enamel (δ13Csc) and dentine (δ13Ccol): Tracking seasonal diet ............................................................................................ 230
4.5.5 Archaeological deer structural carbonate (δ13Csc): Indication of maize access or post-mortem alteration? ........................................................... 234
4.5.6 Modern and archaeological deer bone (δ18Osc): Tracking hunting ranges with oxygen-isotopes .............................................................................. 245
4.6 Conclusion .......................................................................................................... 252
References Cited ........................................................................................................ 254
Chapter 5 ......................................................................................................................... 270
5 Conclusion ................................................................................................................. 270
5.1 Research summary .............................................................................................. 270
5.2 Contributions to zooarchaeology ........................................................................ 273
5.3 Contributions to Ontario archaeology ................................................................. 274
5.4 Future research considerations ............................................................................ 276
References cited ......................................................................................................... 277
6 Appendices ................................................................................................................. 280

xiv
xiv
List of Tables
Table 1.1: Isotopic data for modern and archaeological plants from the Eastern Woodland
region southwestern Ontario. .................................................................................................... 8
Table 1.2: Isotopic data for Late Woodland archaeological fauna (bone collagen), published
and this study. ........................................................................................................................... 9
Table 1.3: Cultural stages of southwestern Ontario. ............................................................... 16
Table 1.4: Total number of collagen and structural carbonate samples from archaeological
animals (excluding canids, wild turkeys and white-tailed deer). ............................................ 18
Table 1.5: Total number of collagen and structural carbonate samples from modern and
archaeological canids, wild turkey and white-tailed deer. ...................................................... 18
Table 2.1: Summary of canids sampled and analysed for this study. ..................................... 45
Table 2.2: Summary of FTIR Crystallinity Indices (CI) and Carbonate/Phosphate ratios (C/P)
for canid bone samples before and after pre-treatment ........................................................... 50
Table 2.3: Summary of sample integrity checks for collagen (C:N ratio and collagen yield)
and structural carbonate (bioapatite yield by weight and percentage of CO3 by weight)....... 52
Table 2.4: Summary of collagen (δ13Ccol, δ15Ncol) and structural carbonate (δ13Csc, δ18Osc)
results for all canids. ............................................................................................................... 53
Table 2.5: Summary of collagen (δ13Ccol, δ15Ncol) and structural carbonate (δ13Csc, δ18Osc)
results for adult remains by species. ....................................................................................... 54
Table 2.6: Stable isotopic ranges for the distinct canid categories ......................................... 58
Table 2.7: Summary of published modern canid (A.) and archaeological dog (B.) isotope
data and references. ................................................................................................................. 72
xv
xv
Table 2.8: Summary of published Southern Ontario and Western Lake Erie human isotope
data and references. ................................................................................................................. 74
Table 2.9: Distribution of dog and human samples (this study and published samples listed in
Tables 2.7 [dogs] and 2.8 [humans] by time, cultural period and location............................. 77
Table 2.10: Statistical summary (one–way ANOVA with post–hoc Dunnett T3) of dog and
human δ13Ccol comparison....................................................................................................... 78
Table 2.11: Average δ13Ccol values for Middle Ontario Iroquoian and Neutral dogs and
humans recovered from sites: (1) North of the Carolinian Forest Extent, and (2) within the
Carolinian Forest (see Figure 8). ............................................................................................ 82
Table 2.12: Average δ15Ncol values for dogs and humans by region....................................... 86
Table 3.1: Summary of wild turkeys analysed for this study ............................................... 127
Table 3.2: Summary of sample integrity checks for collagen (C:N ratio and collagen yield)
and structural carbonate (bioapatite yield by weight and percentage of CO3 by weight)..... 133
Table 3.3: Summary of FTIR Crystallinity Indices (CI) and Carbonate/Phosphate (C/P) ratios
for turkey bone samples before and after pre-treatment ....................................................... 134
Table 3.4: Summary of collagen (δ13Ccol, δ15Ncol) and structural carbonate (δ13Csc, δ18Osc)
results. ................................................................................................................................... 136
Table 3.5: Summary of the published δ13Ccol and δ15Ncol values for wild and domestic
archaeological turkey data from across North America. ...................................................... 148
Table 3.6: Summary of statistical significance (p-values) among the dietary niche groups
identified by one–way ANOVA. .......................................................................................... 150
Table 3.7: Summary of results from Bruce Boyd’s Early Woodland component. ............... 157
Table 4.1: Summary of Ontario White-tailed deer annual life cycle, feeding, and activity
patterns. ................................................................................................................................. 179
xvi
xvi
Table 4.2: Summary of previously published archaeological deer collagen and structural
carbonate data. ...................................................................................................................... 188
Table 4.3: Summary of juvenile deer by estimated age and donating institution. ................ 194
Table 4.4: Summary of radiographed modern and archaeological deer samples. ................ 196
Table 4.5: Number of white-tailed deer remains analysed by cultural stage. ....................... 197
Table 4.6: Summary of collagen and carbonate samples by cultural affiliation. .................. 200
Table 4.7: Summary of crown mineralization and predicted season of formation. .............. 205
Table 4.8: Summary of the predicted sequence of Ontario white-tailed deer posterior
mandibular dentition. ............................................................................................................ 205
Table 4.9: Summary of average sample parameters by time period and cultural affiliation. 206
Table 4.10: Summary of mean δ13Ccol, δ15Ncol values, and ∆13Cenamel–dentine spacing for each
tooth: A. archaeological and B. modern deer. ...................................................................... 208
Table 4.11: A. Mean difference for all individuals between the δ13Ccol (i.) and δ15Ncol (ii.)
values for each tooth relative to M1. .................................................................................... 208
Table 4.12: Summary of mean bone δ13Ccol and δ15Ncol values by time period ................... 211
Table 4.13: Statistical summary (p-values) comparing δ13Ccol, δ15Ncol and δ13Csc means by
time period. Statistically different results are shown in bold–faced type. ............................ 213
Table 4.14: Summary of mean δ13Csc and δ18Osc values by time period, as well as mean
∆13Csc–col spacing. .................................................................................................................. 213
Table 4.15: Statistical summary (p-values) comparing δ13Csc and ∆13Csc–col by Late Woodland
Phase. Statistically significant results are shown in bold–faced font. .................................. 213
Table 4.16: Summary of average (A.) δ13Ccol and (B.) δ15Ncol dentine for all teeth for each
individual deer, compared with their bone δ13Ccol and δ15Ncol values. ................................. 214
xvii
xvii
Table 4.17: Summary of (A.) mean δ18Osc values for each serial section and (B.) mean
difference for each serial section relative to the tip of M1. .................................................. 215
Table 4.18: ANOVA output showing the statistically significant grouping of serial sections
by δ18Osc values ..................................................................................................................... 216
Table 4.19: Summary of mean δ13Csc values for each serial section (A.) and mean difference
(B.) relative to the tip of M1. ................................................................................................ 218
Table 4.20: ANOVA output showing the statistically significant grouping of serial sections
by δ13Csc values, with (A.) modern deer and without (B.) modern deer. .............................. 219
Table 4.21: Summary of mean Δ13Cenamel–dentine value for each tooth for the archaeological
(n=8) and modern (n=2) deer. ............................................................................................... 220
Table 4.22: Comparison of mean δ18Osc values for all enamel serial sections relative to the
δ18Osc values of bone. ............................................................................................................ 250
xviii
xviii
List of Figures
Figure 1.1 Theoretical southwestern Ontario food web based on archaeological bone collagen
(δ13Ccol and δ15Ncol, mean±SD‰) data. ................................................................................... 10
Figure 1.2: Interpolated regional δ18O values based on the δ18O values of local precipitation
collected and analysed from sixteen water stations. ............................................................... 14
Figure 1.3: Map of southwestern Ontario including all archaeological sites from which faunal
samples were selected. ............................................................................................................ 19
Figure 2.1: Map of southwestern Ontario with all sites with canid isotope data mentioned in
the text. .................................................................................................................................... 34
Figure 2.2: Taxonomic relationships of canids present in southwestern Ontario. .................. 38
Figure 2.3: Comparison of dog mandibles used for canid identification. ............................... 43
Figure 2.4: Box plot summaries of the stable-isotopic composition of the canids. ................ 58
Figure 2.5: δ15Ncol versus δ13Ccol values for all canids. Distinct canid ecological/dietary
categories are circled. .............................................................................................................. 61
Figure 2.6: δ13Ccol versus δ13Csc values for all canids. Category B and C are still distinct. ... 62
Figure 2.7: δ15Ncol versus δ13Ccol values for all canids............................................................ 63
Figure 2.8: The relationship between δ13Csc and δ13Ccol values for Category A, B, and C
canids. ..................................................................................................................................... 64
Figure 2.9: Archaeological sites with published isotopic data for humans. ........................... 76
Figure 2.10: δ13Ccol values for dogs and humans through time; (A) compares Ontario
Iroquoian dogs and southwest/central Ontario humans; (B) compares Ontario Western Basin
dogs and Western Lake Erie Humans. .................................................................................... 79
xix
xix
Figure 2.11: Average δ13Ccol values of Middle Ontario Phase and Neutral dogs and humans
recovered from sites (1) North of the Carolinian Forest Extent, and (2) within the Carolinian
Forest....................................................................................................................................... 82
Figure 2.12: δ15Ncol values for dogs and humans through time; (A) compares Ontario
Iroquoian dogs and southwest/central Ontario humans; (B) compares Ontario Western Basin
dogs and Western Lake Erie Humans. .................................................................................... 84
Figure 2.13: Comparison of Late Woodland dog diets using a modified version of Froehle et
al’s (2012) multivariant model................................................................................................ 88
Figure 2.14: Examples of butcher marks on Pip(2)-103 (left) and Pip(1)-180 (right) ........... 92
Figure 2.15: Archaeological sites with canid remains overlaid on the interpolated δ18O values
for local precipitation .............................................................................................................. 95
Figure 2.16: Interpolated δ18Oprecipitation values compared to calculated δ18Oprecipitation values
based on the δ18Osc values. ...................................................................................................... 96
Figure 2.17: δ18Oenamel and δ15Ndentine values versus δ13Cenamel for serial sections of first and
second permanent mandibular molar of Van Besien site dog specimen Van–124. .............. 101
Figure 3.1: Distribution of wild turkey prior to European contact. ...................................... 118
Figure 3.2: Archaeological sites with wild turkey remains analysed in this study and
published isotope data ........................................................................................................... 119
Figure 3.3: Examples of cut marks indicative of (A) canine puncture marks, , (B) cut marks,
possibly indicative of butcheryand (C) cut mark,s possibly as a result bone bead manufacture.
............................................................................................................................................... 129
Figure 3.4: δ15Ncol versus δ13Ccol values for all turkey samples from this study and
Katzenberg (2006). ............................................................................................................... 137
Figure 3.5: δ15Ncol versus δ13Ccol values for avian species within known dietary niches. .... 138
xx
xx
Figure 3.6: δ15N versus δ13C values for whole, modern grasshoppers and crickets. ............ 139
Figure 3.7: Approximate locations of modern turkeys from this study in relation to
percentage of land seeded with corn in 2012. ....................................................................... 140
Figure 3.8: δ13Csc versus δ13Ccol values for archaeological and modern wild turkeys according
to the model adapted from Kellner and Schoeninger (2007, Figure 2B). ............................. 144
Figure 3.9: Box plot of δ 13Ccol values for all samples in this study. .................................... 146
Figure 3.10: Comparative δ15Ncol and δ13Ccol values for archaeological turkeys from several
regions of North America. .................................................................................................... 149
Figure 3.11: Modern and archaeological turkey locations overlaid on the interpolated
δ18Oprecipitation values (IAEA/WMO 2013; Longstaffe unpublished data, Figure 1.2) .......... 161
Figure 4.1: Summary of previously published δ13Ccol and δ13Csc values. See Table 4.2 for
references. ............................................................................................................................. 189
Figure 4.2: Cross section of a deer tooth. ............................................................................. 192
Figure 4.3: Map of all Ontario locations of deer for which isotopic analyses of deer bone and
teeth were completed. ........................................................................................................... 198
Figure 4.4: Comparison of elk/wapiti and white-tailed deer mandibles. .............................. 199
Figure 4.5: Example of manually serial sectioned posterior, dentition. ............................... 201
Figure 4.6: Individual δ13Ccol (A.) and δ15Ncol (B.) dentine values by tooth......................... 209
Figure 4.7: Mean difference in δ13Ccol (A.) and δ15Ncol (B.) values relative to M1 for
individual bone (gray box) and dentine samples (graphed by tooth).................................... 210
Figure 4.8: δ18Osc values of enamel serial sections ............................................................... 217
Figure 4.9: Relationship between δ13Csc and δ18Osc values for modern and archaeological
deer. ....................................................................................................................................... 221
xxi
xxi
Figure 4.10: Average ∆13Csc-col of enamel and dentine, respectively, by tooth (compared to
∆13Csc-col of bone in the gray box). ........................................................................................ 222
Figure 4.11: Estimated proportion of maize in the diet of the modern deer (~15% maize to
85% C3) compared with that of modern turkey (~45% maize to 55% C3). .......................... 225
Figure 4.12: Model for the relationship between δ13C values of structural carbonate and
collagen for modern deer. ..................................................................................................... 226
Figure 4.13: Comparison of Modern Deer 7 and Modern Deer 3 δ13Csc and δ18Osc values
obtained from enamel serial sections. ................................................................................... 231
Figure 4.14: Comparison of δ13Ccol and δ15Ncol of modern and archaeological deer bone from
the Great Lakes region. ......................................................................................................... 232
Figure 4.15: δ13Csc values of the archaeological deer serial sections and bulk bone. ........... 233
Figure 4.16: Model for the relationship between δ13C values of structural carbonate and
collagen for modern and archaeological deer. ...................................................................... 235
Figure 4.17: Predicted δ13Ccol and δ13Csc relationship based on Kellner and Schoeinger’s
model..................................................................................................................................... 237
Figure 4.18: Comparison of δ13Csc and δ13Ccol values for modern and archaeological Ontario
white-tailed deer, modern Ontario wild turkeys (this study) and southwestern Ontario
archaeological humans (Harrison and Katzenberg 2003). .................................................... 238
Figure 4.19: Comparison of (A.) mean ∆13Csc–col spacing, organized by time period, to post–
mortem alteration indicators including: (B.) collagen yield, (C.) percent bioapatite by weight,
(D.) percent CO3 by weight, (E.) CI Index and (F.) C/P ratio. Gray box indicates accepted
ranges for each parameter. .................................................................................................... 240
Figure 4.20: Archaeological and modern sites with deer remains overlaid on the interpolated
δ18O values for local precipitation ........................................................................................ 247
xxii
xxii
Figure 4.21: Predicted precipitation δ18O values for modern and archaeological deer bulk
bone δ18Osc values compared to the interpolated δ18O values for local precipitation248
Figure 4.22: Predicted precipitation δ18O values for modern and archaeological deer δ18Osc
enamel values (averaged by tooth) compared to the interpolated δ18O values for local
precipitation .......................................................................................................................... 251

xxiii
xxiii
List of Appendices
Appendix A: Summary of Ontario sites with faunal material isotopically analyzed for this
study. ..................................................................................................................................... 280
Appendix B: Bone collagen isotopic composition and sample description (archaeological) 290
Appendix C: Bone collagen isotopic composition and sample description (modern) .......... 311
Appendix D: Bone structural carbonate isotopic composition and sample description
(archaeological)..................................................................................................................... 315
Appendix E: Bone structural carbonate isotopic composition and sample description
(modern) ................................................................................................................................ 325
Appendix F: Whole insect isotopic composition and sample description ............................ 330
Appendix G: Whole plant isotopic composition and sample description ............................. 332
Appendix H: Dentinal collagen isotopic composition and sample description .................... 333
Appendix I: Enamel structural carbonate isotopic composition ........................................... 336
Appendix J: White-tailed deer eruption categories ............................................................... 342
Appendix K: Radiograph specimen and parameters description .......................................... 345
Appendix L: Estimated age-at-death by eruption (with inter and intra obervations) ........... 353
Appendix M: Mandibular dental mineralization descriptions .............................................. 362
1
Chapter 1
1 Introduction
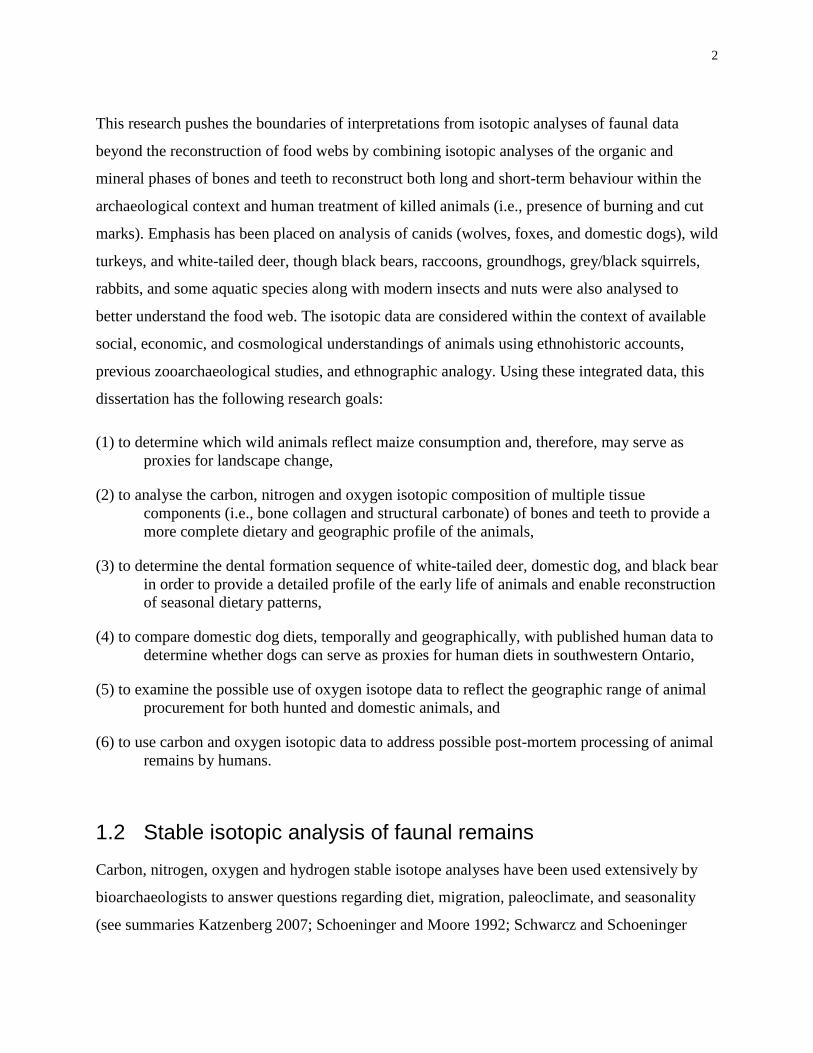
1.1 Research objectives In this thesis, stable isotope analyses of archaeological faunal material are used to investigate
how Ontario Late Woodland (A.D. 900 to 1650) human activities affected the isotopic
composition of animal bones due to increased maize horticulture, hunting locale, season of
hunting, and post-mortem treatment. During the Late Woodland period in southwestern Ontario,
two neighbouring groups, Ontario Iroquoian and Western Basin peoples, lived
contemporaneously until A.D. 1550 with a continuously westward shifting border. The
importance of maize to Late Woodland Ontario Iroquoian people has long been understood from
archaeobotanical remains and isotopic analyses of human remains (Katzenberg et al. 1995,
Harrison and Katzenberg 2003; Schwarcz et al. 1985; van der Merwe et al. 2003; Pfieffer et al.
2014). Until recently, the significance of maize in the diets of Ontario Western Basin peoples
was underestimated. The recent analyses of human remains from three sites, Krieger, Great
Western Park, and Inland West Pit 9 (Dewar et al. 2010; Spence et al. 2014; Watts et al. 2011),
and excavations in the Arkona region Inland West Pit sites (Golder and Associates 2012) suggest
heavy investment in maize among Western Basin people in southwestern Ontario.
By A.D. 1000, Ontario Iroquoian populations were growing substantially larger compared to the
preceding Middle Woodland period, and associated with increasing sedentism, a pattern that
would continue throughout the Late Woodland. Expanding village sites, surrounded by
horticultural fields, were in use for fifteen to twenty years and became more heavily fortified.
Currently, there is no evidence of the same degree of population increase at Ontario Western
Basin sites, nor was there a consistent shift to long-term village life style. Instead, Western Basin
sites varied in terms of their size and occupation length. Many sites were occupied seasonally,
usually near rivers or lakes during warmer months and further inland during cooler months.
Other sites were occupied year round, though the length of occupation was variable. Because of
smaller site size and shorter occupation length, the abundance of faunal remains is low and
preservation is often poor.
2
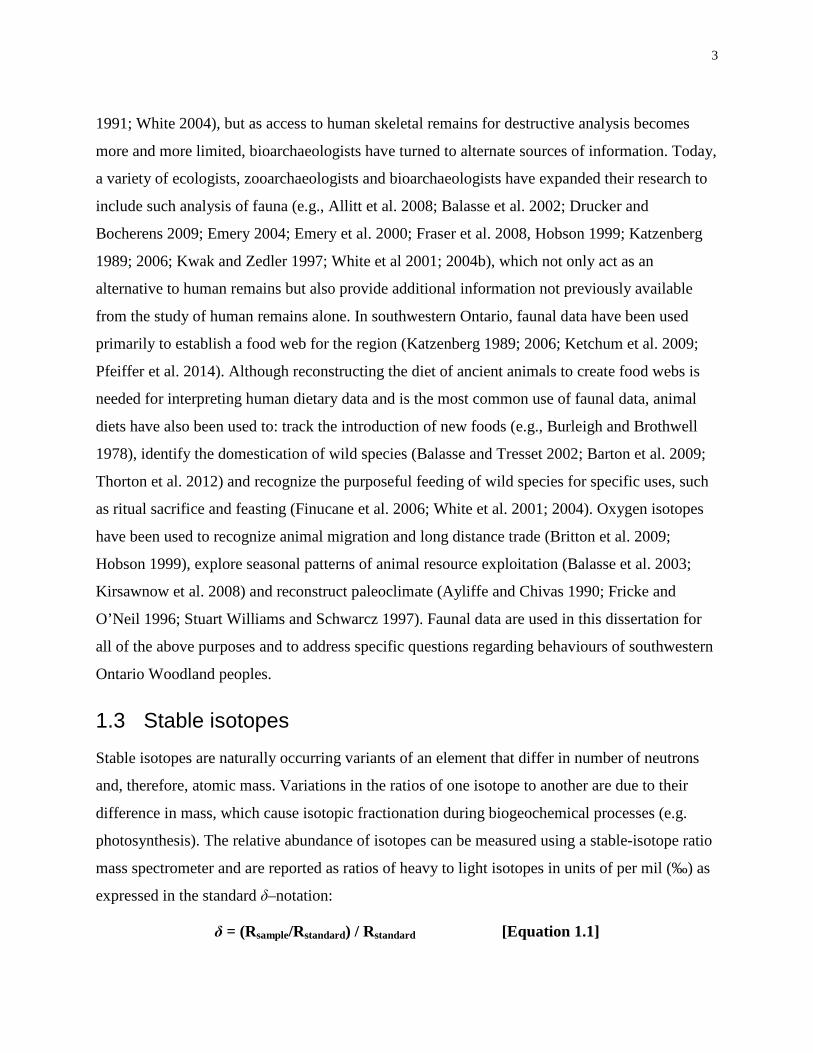
This research pushes the boundaries of interpretations from isotopic analyses of faunal data
beyond the reconstruction of food webs by combining isotopic analyses of the organic and
mineral phases of bones and teeth to reconstruct both long and short-term behaviour within the
archaeological context and human treatment of killed animals (i.e., presence of burning and cut
marks). Emphasis has been placed on analysis of canids (wolves, foxes, and domestic dogs), wild
turkeys, and white-tailed deer, though black bears, raccoons, groundhogs, grey/black squirrels,
rabbits, and some aquatic species along with modern insects and nuts were also analysed to
better understand the food web. The isotopic data are considered within the context of available
social, economic, and cosmological understandings of animals using ethnohistoric accounts,
previous zooarchaeological studies, and ethnographic analogy. Using these integrated data, this
dissertation has the following research goals:
(1) to determine which wild animals reflect maize consumption and, therefore, may serve as proxies for landscape change,
(2) to analyse the carbon, nitrogen and oxygen isotopic composition of multiple tissue components (i.e., bone collagen and structural carbonate) of bones and teeth to provide a more complete dietary and geographic profile of the animals,
(3) to determine the dental formation sequence of white-tailed deer, domestic dog, and black bear in order to provide a detailed profile of the early life of animals and enable reconstruction of seasonal dietary patterns,
(4) to compare domestic dog diets, temporally and geographically, with published human data to determine whether dogs can serve as proxies for human diets in southwestern Ontario,
(5) to examine the possible use of oxygen isotope data to reflect the geographic range of animal procurement for both hunted and domestic animals, and
(6) to use carbon and oxygen isotopic data to address possible post-mortem processing of animal remains by humans.
1.2 Stable isotopic analysis of faunal remains
Carbon, nitrogen, oxygen and hydrogen stable isotope analyses have been used extensively by
bioarchaeologists to answer questions regarding diet, migration, paleoclimate, and seasonality
(see summaries Katzenberg 2007; Schoeninger and Moore 1992; Schwarcz and Schoeninger
3
1991; White 2004), but as access to human skeletal remains for destructive analysis becomes
more and more limited, bioarchaeologists have turned to alternate sources of information. Today,
a variety of ecologists, zooarchaeologists and bioarchaeologists have expanded their research to
include such analysis of fauna (e.g., Allitt et al. 2008; Balasse et al. 2002; Drucker and
Bocherens 2009; Emery 2004; Emery et al. 2000; Fraser et al. 2008, Hobson 1999; Katzenberg
1989; 2006; Kwak and Zedler 1997; White et al 2001; 2004b), which not only act as an
alternative to human remains but also provide additional information not previously available
from the study of human remains alone. In southwestern Ontario, faunal data have been used
primarily to establish a food web for the region (Katzenberg 1989; 2006; Ketchum et al. 2009;
Pfeiffer et al. 2014). Although reconstructing the diet of ancient animals to create food webs is
needed for interpreting human dietary data and is the most common use of faunal data, animal
diets have also been used to: track the introduction of new foods (e.g., Burleigh and Brothwell
1978), identify the domestication of wild species (Balasse and Tresset 2002; Barton et al. 2009;
Thorton et al. 2012) and recognize the purposeful feeding of wild species for specific uses, such
as ritual sacrifice and feasting (Finucane et al. 2006; White et al. 2001; 2004). Oxygen isotopes
have been used to recognize animal migration and long distance trade (Britton et al. 2009;
Hobson 1999), explore seasonal patterns of animal resource exploitation (Balasse et al. 2003;
Kirsawnow et al. 2008) and reconstruct paleoclimate (Ayliffe and Chivas 1990; Fricke and
O’Neil 1996; Stuart Williams and Schwarcz 1997). Faunal data are used in this dissertation for
all of the above purposes and to address specific questions regarding behaviours of southwestern
Ontario Woodland peoples.
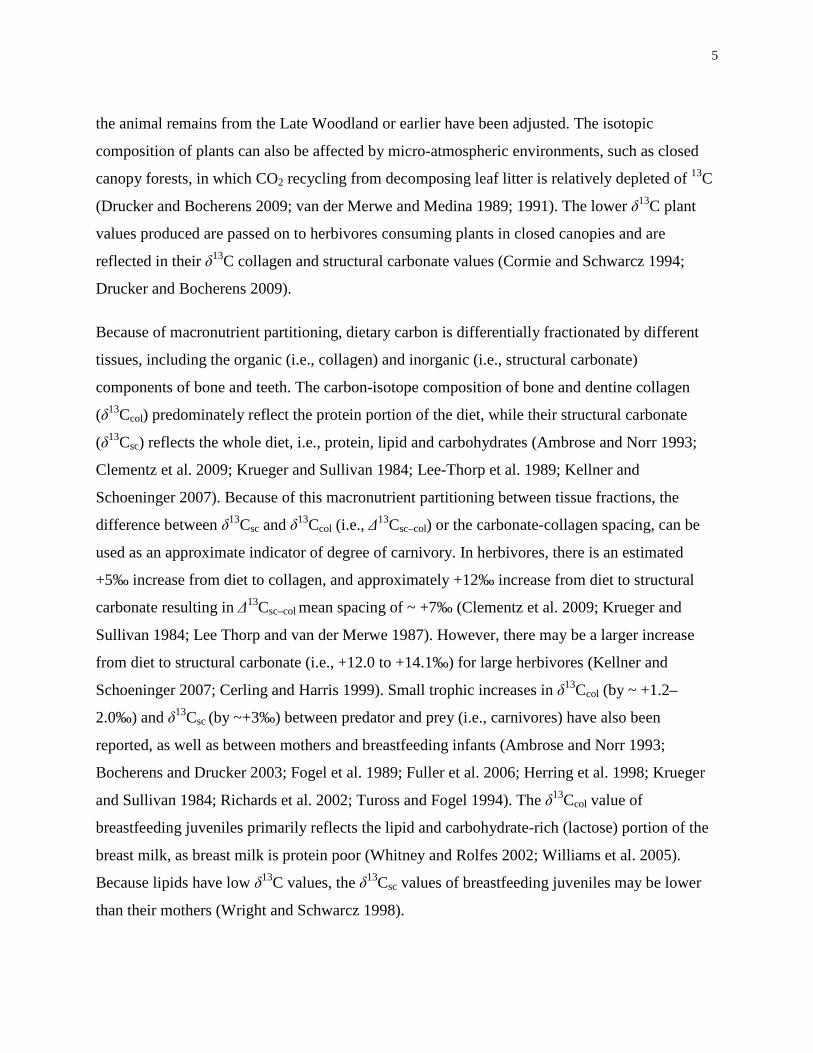
1.3 Stable isotopes
Stable isotopes are naturally occurring variants of an element that differ in number of neutrons
and, therefore, atomic mass. Variations in the ratios of one isotope to another are due to their
difference in mass, which cause isotopic fractionation during biogeochemical processes (e.g.
photosynthesis). The relative abundance of isotopes can be measured using a stable-isotope ratio
mass spectrometer and are reported as ratios of heavy to light isotopes in units of per mil (‰) as
expressed in the standard δ–notation:
δ = (Rsample/Rstandard) / Rstandard [Equation 1.1]

4
where R = 13C/12C, 15N/14N or 18O/16O (McKinney et al. 1950:730). Carbon isotopic
compositions are standardized to Vienna PeeDee Belemnite (VPDB) (Coplen 1996; 2011).
Nitrogen isotopic compositions are standardized to AIR (Mariotti 1983). Oxygen isotopic
compositions are standardized to Vienna Standard Mean Ocean Water (VSMOW) (Coplen 1996;
2011).
1.3.1 Carbon-isotope systematics
Carbon isotope ratios of preserved tissues can be used to explore diets of ancient organisms by
identifying the consumption of varying plant types (C3, C4 and CAM) and as an indicator of
degree of carnivory (DeNiro and Epstein 1978; van der Merwe 1982). Identifying the type of
plants consumed by an organism is based on differences in the three photosynthetic pathways
used by plants. C3 plants are the most common and include most vegetables, fruits, nuts, trees,
wheat and barley. They photosynthesize using a 3–carbon pathway, and have low δ13C values
(~–34 to –23‰, average –26.5‰) (O’Leary 1988; van der Merwe 1982). C4 plants, including
maize and several other tropical grasses, are more adapted to hot climates (Beadle 1939;
Matsuko et al. 2002). They photosynthesize using a 4–carbon pathway and are relatively 13C–
rich (~–16 to –9‰, average –12.5‰) (O’Leary 1988; van der Merwe 1982). Because these
photosynthetic types have a bimodal distribution of δ13C values, isotopic analysis has been useful
for tracking the spread of maize into North America (Allegreto 2007; Boyd et al. 2008;
Katzenberg et al. 1995; Schoeninger 2009; Schurr and Redmond 1991; van der Merwe 1982;
Vogel and van der Merwe 1977). A third plant type, Crassulacean Acid Metabolism (CAM),
which includes cacti and succulents, has isotope compositions that cover the range of C3 and C4
plants (van der Merwe 1982), but they were not a component of Ontario ecosystems.
Plant δ13C values are affected by the composition of CO2 in the atmosphere. Due to the burning
of fossil fuels and deforestation, addition of low-13C CO2 since the start of the Industrial
Revolution, a phenomenon known as the Suess Effect, has resulted in steadily decreasing δ13C
values of modern atmospheric CO2. As a consequence, the δ13C values of modern plants and
animals are isotopically lighter (i.e., have lower δ–values) than archaeological ones (Friedli et al.
1986; Verburg 2007; Yakir 2011). Thus all δ13C values of modern plants and animals mentioned
in this text have been corrected by +1.65‰ to account for the Suess Effect (Yakir 2011). None of
5
the animal remains from the Late Woodland or earlier have been adjusted. The isotopic
composition of plants can also be affected by micro-atmospheric environments, such as closed
canopy forests, in which CO2 recycling from decomposing leaf litter is relatively depleted of 13C
(Drucker and Bocherens 2009; van der Merwe and Medina 1989; 1991). The lower δ13C plant
values produced are passed on to herbivores consuming plants in closed canopies and are
reflected in their δ13C collagen and structural carbonate values (Cormie and Schwarcz 1994;
Drucker and Bocherens 2009).
Because of macronutrient partitioning, dietary carbon is differentially fractionated by different
tissues, including the organic (i.e., collagen) and inorganic (i.e., structural carbonate)
components of bone and teeth. The carbon-isotope composition of bone and dentine collagen
(δ13Ccol) predominately reflect the protein portion of the diet, while their structural carbonate
(δ13Csc) reflects the whole diet, i.e., protein, lipid and carbohydrates (Ambrose and Norr 1993;
Clementz et al. 2009; Krueger and Sullivan 1984; Lee-Thorp et al. 1989; Kellner and
Schoeninger 2007). Because of this macronutrient partitioning between tissue fractions, the
difference between δ13Csc and δ13Ccol (i.e., Δ13Csc–col) or the carbonate-collagen spacing, can be
used as an approximate indicator of degree of carnivory. In herbivores, there is an estimated
+5‰ increase from diet to collagen, and approximately +12‰ increase from diet to structural
carbonate resulting in Δ13Csc–col mean spacing of ~ +7‰ (Clementz et al. 2009; Krueger and
Sullivan 1984; Lee Thorp and van der Merwe 1987). However, there may be a larger increase
from diet to structural carbonate (i.e., +12.0 to +14.1‰) for large herbivores (Kellner and
Schoeninger 2007; Cerling and Harris 1999). Small trophic increases in δ13Ccol (by ~ +1.2–
2.0‰) and δ13Csc (by ~+3‰) between predator and prey (i.e., carnivores) have also been
reported, as well as between mothers and breastfeeding infants (Ambrose and Norr 1993;
Bocherens and Drucker 2003; Fogel et al. 1989; Fuller et al. 2006; Herring et al. 1998; Krueger
and Sullivan 1984; Richards et al. 2002; Tuross and Fogel 1994). The δ13Ccol value of
breastfeeding juveniles primarily reflects the lipid and carbohydrate-rich (lactose) portion of the
breast milk, as breast milk is protein poor (Whitney and Rolfes 2002; Williams et al. 2005).
Because lipids have low δ13C values, the δ13Csc values of breastfeeding juveniles may be lower
than their mothers (Wright and Schwarcz 1998).
6
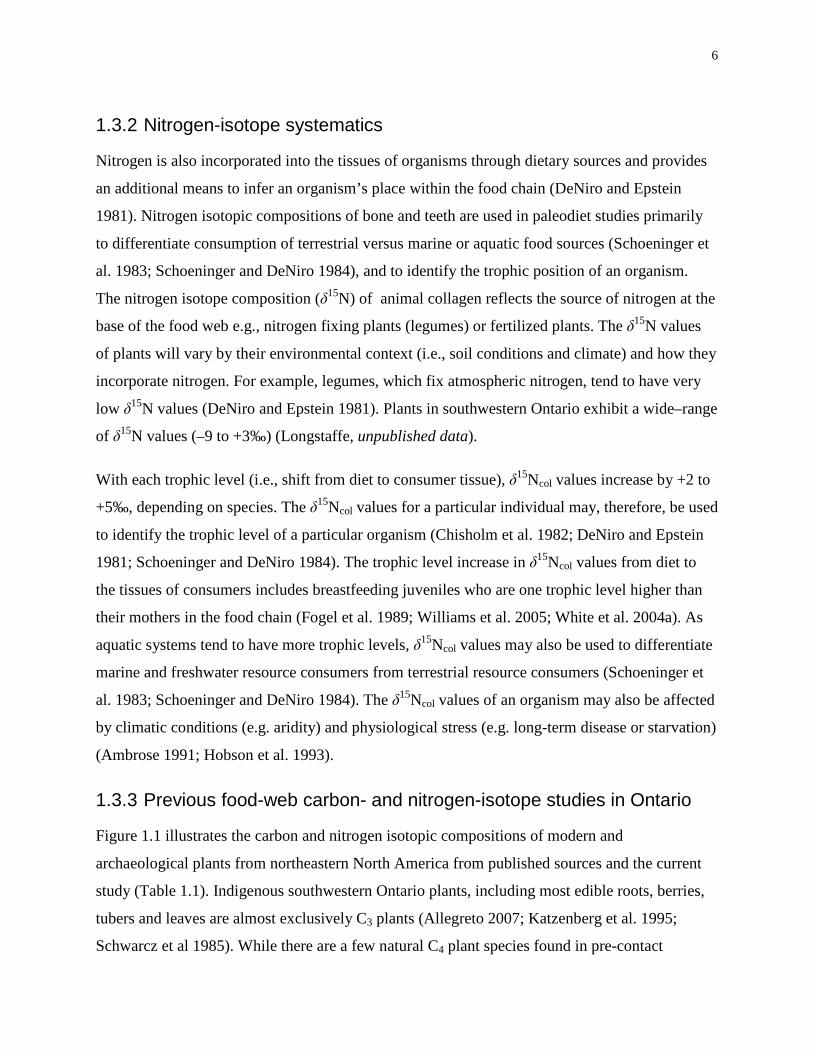
1.3.2 Nitrogen-isotope systematics
Nitrogen is also incorporated into the tissues of organisms through dietary sources and provides
an additional means to infer an organism’s place within the food chain (DeNiro and Epstein
1981). Nitrogen isotopic compositions of bone and teeth are used in paleodiet studies primarily
to differentiate consumption of terrestrial versus marine or aquatic food sources (Schoeninger et
al. 1983; Schoeninger and DeNiro 1984), and to identify the trophic position of an organism.
The nitrogen isotope composition (δ15N) of animal collagen reflects the source of nitrogen at the
base of the food web e.g., nitrogen fixing plants (legumes) or fertilized plants. The δ15N values
of plants will vary by their environmental context (i.e., soil conditions and climate) and how they
incorporate nitrogen. For example, legumes, which fix atmospheric nitrogen, tend to have very
low δ15N values (DeNiro and Epstein 1981). Plants in southwestern Ontario exhibit a wide–range
of δ15N values (–9 to +3‰) (Longstaffe, unpublished data).
With each trophic level (i.e., shift from diet to consumer tissue), δ15Ncol values increase by +2 to
+5‰, depending on species. The δ15Ncol values for a particular individual may, therefore, be used
to identify the trophic level of a particular organism (Chisholm et al. 1982; DeNiro and Epstein
1981; Schoeninger and DeNiro 1984). The trophic level increase in δ15Ncol values from diet to
the tissues of consumers includes breastfeeding juveniles who are one trophic level higher than
their mothers in the food chain (Fogel et al. 1989; Williams et al. 2005; White et al. 2004a). As
aquatic systems tend to have more trophic levels, δ15Ncol values may also be used to differentiate
marine and freshwater resource consumers from terrestrial resource consumers (Schoeninger et
al. 1983; Schoeninger and DeNiro 1984). The δ15Ncol values of an organism may also be affected
by climatic conditions (e.g. aridity) and physiological stress (e.g. long-term disease or starvation)
(Ambrose 1991; Hobson et al. 1993).
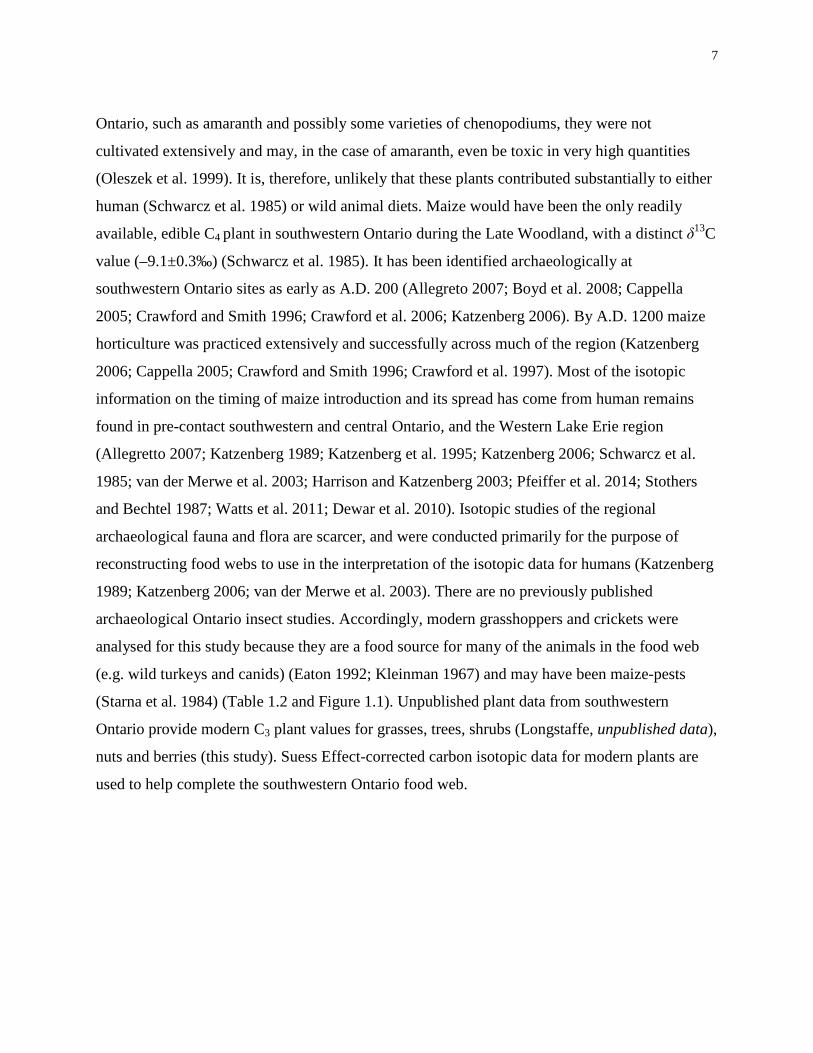
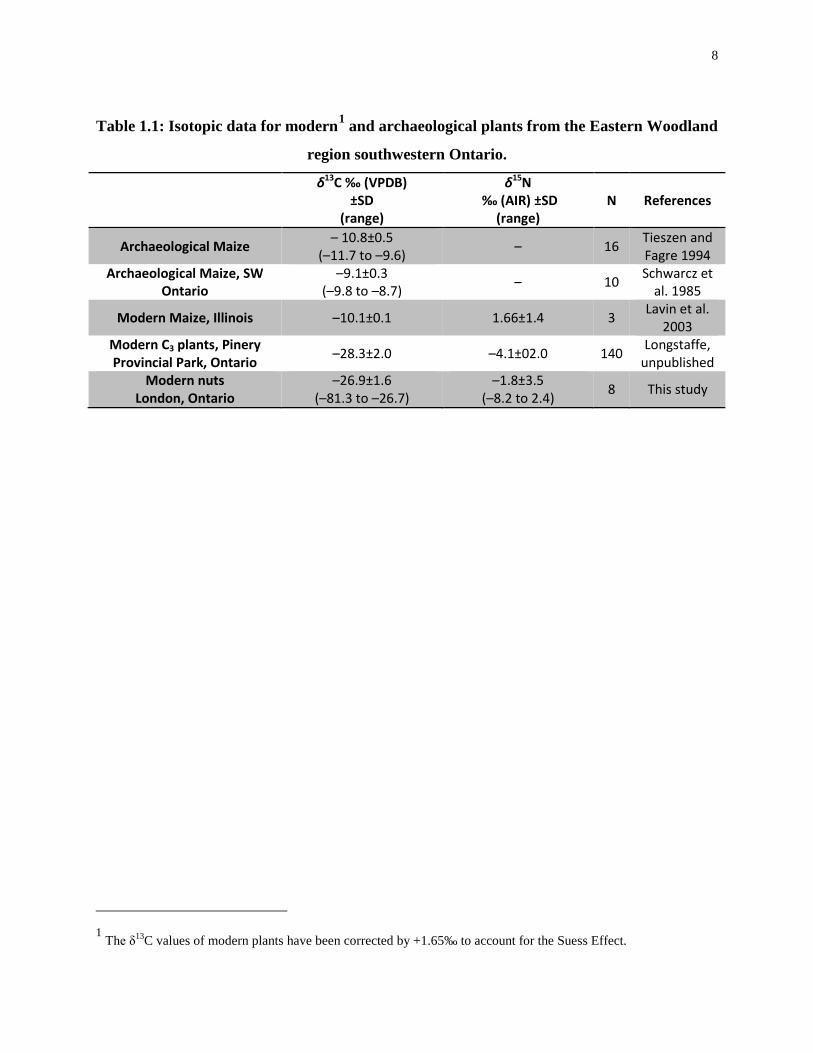
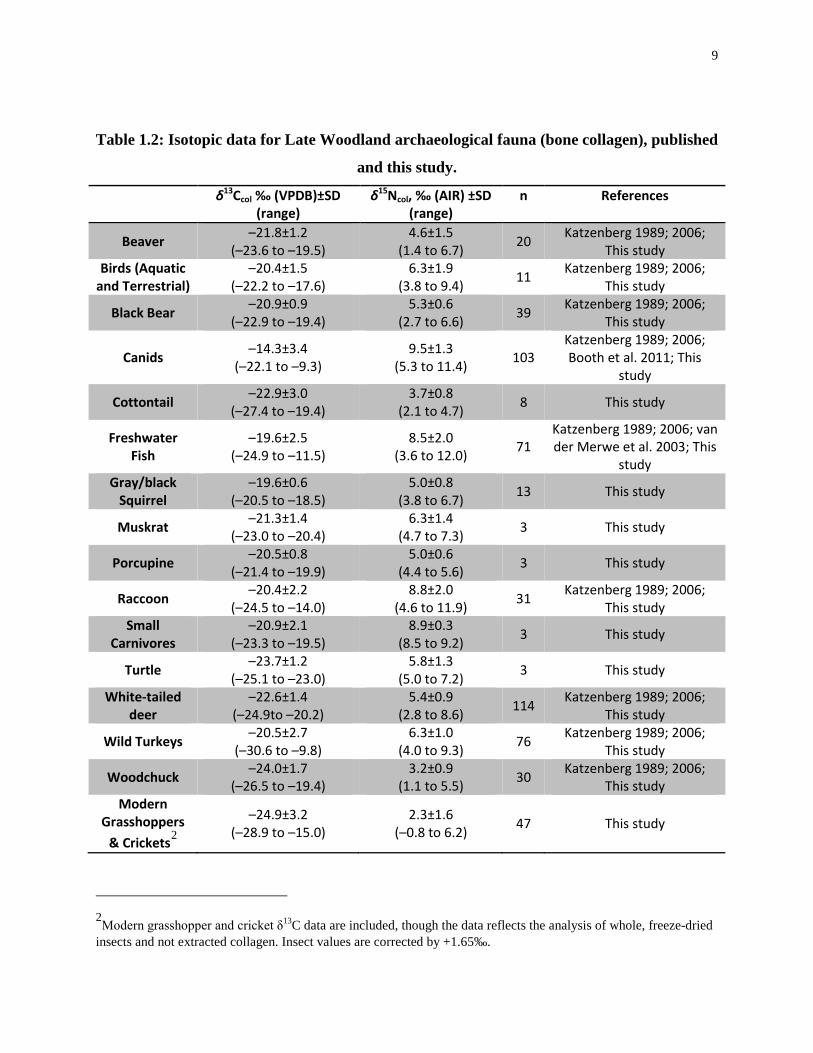
1.3.3 Previous food-web carbon- and nitrogen-isotope studies in Ontario
Figure 1.1 illustrates the carbon and nitrogen isotopic compositions of modern and
archaeological plants from northeastern North America from published sources and the current
study (Table 1.1). Indigenous southwestern Ontario plants, including most edible roots, berries,
tubers and leaves are almost exclusively C3 plants (Allegreto 2007; Katzenberg et al. 1995;
Schwarcz et al 1985). While there are a few natural C4 plant species found in pre-contact
7
Ontario, such as amaranth and possibly some varieties of chenopodiums, they were not
cultivated extensively and may, in the case of amaranth, even be toxic in very high quantities
(Oleszek et al. 1999). It is, therefore, unlikely that these plants contributed substantially to either
human (Schwarcz et al. 1985) or wild animal diets. Maize would have been the only readily
available, edible C4 plant in southwestern Ontario during the Late Woodland, with a distinct δ13C
value (–9.1±0.3‰) (Schwarcz et al. 1985). It has been identified archaeologically at
southwestern Ontario sites as early as A.D. 200 (Allegreto 2007; Boyd et al. 2008; Cappella
2005; Crawford and Smith 1996; Crawford et al. 2006; Katzenberg 2006). By A.D. 1200 maize
horticulture was practiced extensively and successfully across much of the region (Katzenberg
2006; Cappella 2005; Crawford and Smith 1996; Crawford et al. 1997). Most of the isotopic
information on the timing of maize introduction and its spread has come from human remains
found in pre-contact southwestern and central Ontario, and the Western Lake Erie region
(Allegretto 2007; Katzenberg 1989; Katzenberg et al. 1995; Katzenberg 2006; Schwarcz et al.
1985; van der Merwe et al. 2003; Harrison and Katzenberg 2003; Pfeiffer et al. 2014; Stothers
and Bechtel 1987; Watts et al. 2011; Dewar et al. 2010). Isotopic studies of the regional
archaeological fauna and flora are scarcer, and were conducted primarily for the purpose of
reconstructing food webs to use in the interpretation of the isotopic data for humans (Katzenberg
1989; Katzenberg 2006; van der Merwe et al. 2003). There are no previously published
archaeological Ontario insect studies. Accordingly, modern grasshoppers and crickets were
analysed for this study because they are a food source for many of the animals in the food web
(e.g. wild turkeys and canids) (Eaton 1992; Kleinman 1967) and may have been maize-pests
(Starna et al. 1984) (Table 1.2 and Figure 1.1). Unpublished plant data from southwestern
Ontario provide modern C3 plant values for grasses, trees, shrubs (Longstaffe, unpublished data),
nuts and berries (this study). Suess Effect-corrected carbon isotopic data for modern plants are
used to help complete the southwestern Ontario food web.
8
Table 1.1: Isotopic data for modern1 and archaeological plants from the Eastern Woodland
region southwestern Ontario.
δ13C ‰ (VPDB) ±SD
(range)
δ15N ‰ (AIR) ±SD
(range) N References
Archaeological Maize – 10.8±0.5 (–11.7 to –9.6) – 16 Tieszen and
Fagre 1994 Archaeological Maize, SW
Ontario –9.1±0.3
(–9.8 to –8.7) – 10 Schwarcz et al. 1985
Modern Maize, Illinois –10.1±0.1 1.66±1.4 3 Lavin et al. 2003
Modern C3 plants, Pinery Provincial Park, Ontario –28.3±2.0 –4.1±02.0 140 Longstaffe,
unpublished Modern nuts
London, Ontario –26.9±1.6
(–81.3 to –26.7) –1.8±3.5
(–8.2 to 2.4) 8 This study
1 The δ13C values of modern plants have been corrected by +1.65‰ to account for the Suess Effect.
9
Table 1.2: Isotopic data for Late Woodland archaeological fauna (bone collagen), published
and this study.
δ13Ccol ‰ (VPDB)±SD (range)
δ15Ncol, ‰ (AIR) ±SD (range)
n References
Beaver –21.8±1.2 (–23.6 to –19.5)
4.6±1.5 (1.4 to 6.7) 20 Katzenberg 1989; 2006;
This study Birds (Aquatic
and Terrestrial) –20.4±1.5
(–22.2 to –17.6) 6.3±1.9
(3.8 to 9.4) 11 Katzenberg 1989; 2006; This study
Black Bear –20.9±0.9 (–22.9 to –19.4)
5.3±0.6 (2.7 to 6.6) 39 Katzenberg 1989; 2006;
This study
Canids –14.3±3.4 (–22.1 to –9.3)
9.5±1.3 (5.3 to 11.4) 103
Katzenberg 1989; 2006; Booth et al. 2011; This
study
Cottontail –22.9±3.0 (–27.4 to –19.4)
3.7±0.8 (2.1 to 4.7) 8 This study
Freshwater Fish
–19.6±2.5 (–24.9 to –11.5)
8.5±2.0 (3.6 to 12.0) 71
Katzenberg 1989; 2006; van der Merwe et al. 2003; This
study Gray/black
Squirrel –19.6±0.6
(–20.5 to –18.5) 5.0±0.8
(3.8 to 6.7) 13 This study
Muskrat –21.3±1.4 (–23.0 to –20.4)
6.3±1.4 (4.7 to 7.3) 3 This study
Porcupine –20.5±0.8 (–21.4 to –19.9)
5.0±0.6 (4.4 to 5.6) 3 This study
Raccoon –20.4±2.2 (–24.5 to –14.0)
8.8±2.0 (4.6 to 11.9) 31 Katzenberg 1989; 2006;
This study Small
Carnivores –20.9±2.1
(–23.3 to –19.5) 8.9±0.3
(8.5 to 9.2) 3 This study
Turtle –23.7±1.2 (–25.1 to –23.0)
5.8±1.3 (5.0 to 7.2) 3 This study
White-tailed deer
–22.6±1.4 (–24.9to –20.2)
5.4±0.9 (2.8 to 8.6) 114 Katzenberg 1989; 2006;
This study
Wild Turkeys –20.5±2.7 (–30.6 to –9.8)
6.3±1.0 (4.0 to 9.3) 76 Katzenberg 1989; 2006;
This study
Woodchuck –24.0±1.7 (–26.5 to –19.4)
3.2±0.9 (1.1 to 5.5) 30 Katzenberg 1989; 2006;
This study Modern
Grasshoppers & Crickets2
–24.9±3.2 (–28.9 to –15.0)
2.3±1.6 (–0.8 to 6.2) 47 This study
2Modern grasshopper and cricket δ13C data are included, though the data reflects the analysis of whole, freeze-dried insects and not extracted collagen. Insect values are corrected by +1.65‰.
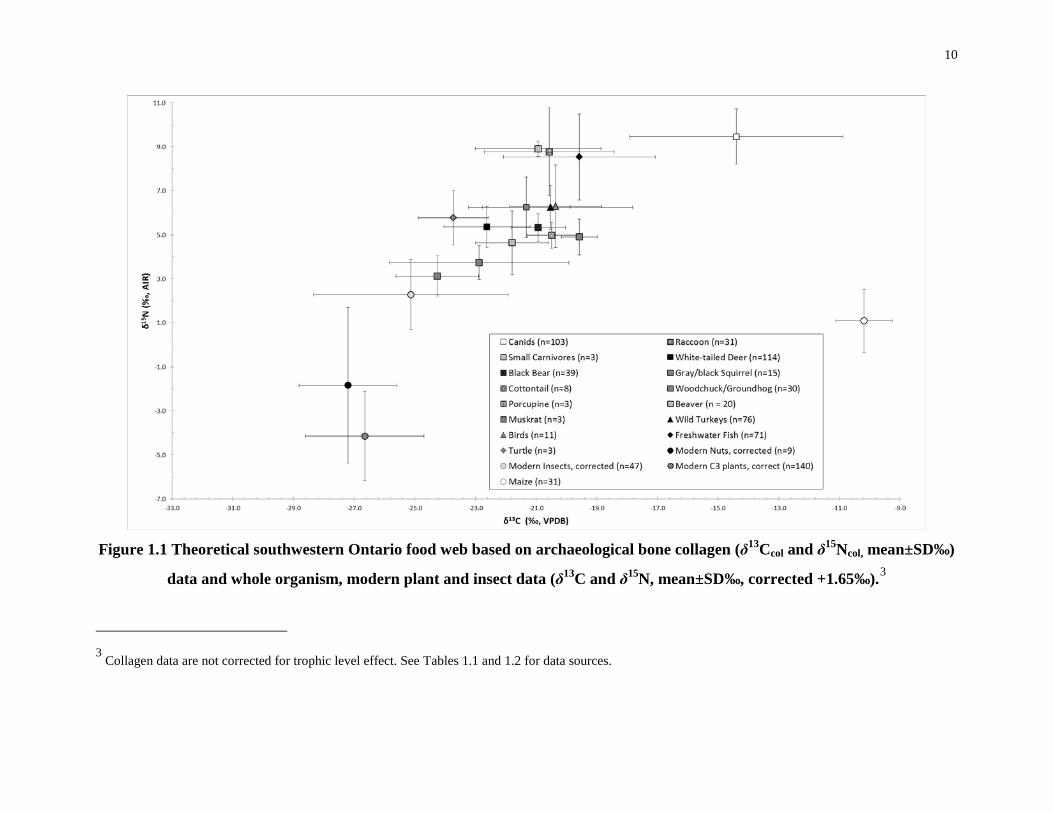
10
Figure 1.1 Theoretical southwestern Ontario food web based on archaeological bone collagen (δ13Ccol and δ15Ncol, mean±SD‰)
data and whole organism, modern plant and insect data (δ13C and δ15N, mean±SD‰, corrected +1.65‰).3
3 Collagen data are not corrected for trophic level effect. See Tables 1.1 and 1.2 for data sources.
11
1.3.4 Oxygen-isotope systematics
The δ18O values of bone and/or tooth bioapatite (structural carbonate or phosphate) can
be used to track geographic and climatic variations in precipitation, humidity, latitude,
altitude and temperature. Deciphering geographic and climatic variables is possible
because the oxygen-isotope composition of skeletal tissue is at equilibrium with body
water, which, in turn, is primarily derived from ingested water (Bryant and Froelich
1995; Luz et al. 1984; Luz and Kolodny 1985). Oxygen enters the body from: inhaled
atmospheric oxygen, ingested water, and water in food resources, but for most mammals,
ingested water is the primary source (Luz et al. 1990). Luz et al. (1990) found a
relationship between local meteoric water and the phosphate of white-tailed deer bones
collected across much of North America, and the relationship between the δ18O values of
body water and skeletal phosphate is well-established (Longinelli 1984; Luz et al. 1984;
Luz and Kolodny 1985). In bone that has not undergone isotopic alteration after death,
phosphate and structural carbonate δ18O values are correlated (Bryant et al. 1996;
Iacumin et al. 1996). This suggests that body water and structural carbonate oxygen
isotopic compositions should also be correlated, a hypothesis that is tested here by
comparing the δ18Osc values of wild and domesticated animals with the predicted δ18O
values of modern, local precipitation. Bone should provide a lifetime average of the
oxygen isotope composition of consumed water, obscuring seasonal fluctuations, while
tooth enamel should provide seasonal information related to the time of tissue formation.
Intra-species variation has enabled the reconstruction of past climates (Clementz and
Koch 2001; Longinelli 1984; Luz et al. 1984; Sponheimer and Lee–Thorp 1999;
Kirsanow et al. 2008), seasonality (Balasse et al. 2003), geographic movement (Britton et
al. 2009; Hobson 1999; Schwarcz et al. 1991) and transitions from breastfeeding to
weaning (White et al. 2004a; Williams et al. 2005; Wright and Schwarz 1998). Because
species-specific variations in δ18O can also be caused by differences in body size,
physiology and drinking/feeding ecology (i.e. obligate drinkers versus drought–tolerant
species) (Bryant et al. 1996; Bryant and Froelich 1995; Daux et al. 2008; Kirsanow and
Tuross 2011), isotopic research designs need to be controlled by species.
12
Latitude, altitude, humidity and temperature all affect the oxygen isotopic composition of
precipitation as it moves across continents (Ayliffe and Chivas 1990; Fricke and O’Neil
1999). For example, as evaporated water condenses and precipitates as rain or snow, the
distance it has traveled inland from the ocean, away from the equator and/or with
increasing altitude contributes to preferential loss of 18O, resulting in precipitation that is
increasingly depleted of 18O, a phenomenon known as the Rayleigh Distillation Effect
(Dansgaard 1964; Craig and Gordon 1965). Although there are differences in the effects
of evaporation among potential water sources for animals (i.e., puddles, small streams,
Great Lakes, plant water), the δ18O values of animal tissue may still provide an indirect
link to the δ18O value of local meteoric water.
Southwestern Ontario is a relatively small region, with minimal oxygen isotopic variation
due to distance from the ocean or altitude. There is, however, latitudinal and longitudinal
variation in δ18O values across southwestern Ontario (Longstaffe 2013, personal
communications). The precipitation data from sixteen stations spanning from Illinois to
Quebec (IAEA/WMO 2013; Longstaffe unpublished data) show a decrease in the heavy
isotope (18O) in precipitation moving across the Great Lakes region from west to east,
resulting in an approximately 2‰ geographic difference in δ18O values likely due to
temperature differences and the influx of air masses of different origin at different times
of the year (Edwards et al. 1996; Larson and Longstaffe 2007). The precipitation station
isotopic data were used to predict the annual precipitation δ18O values for the locations of
Western Basin and Iroquoian sites examined in this study (Figure 1.2).4
Over the past several thousand years there have been climatic events that may have
affected the seasonal and annual local meteoric water δ18O values. For example between
approximately A.D. 800 and 1200 there was the Medieval Warming Period (MWP),
4Predicted δ18O values of past, local precipitation for the archaeological sites mentioned in text (Figure 1.3) were interpolated using a Kriging analysis based on the δ18O values of local precipitation collected and analysed from sixteen water stations (six stations from IAEA/WMO 2013; ten stations from Longstaffe unpublished data). An ordinary, spherical Kriging analysis was performed with no special parameters. Only the Great Lakes region bounded by Lake Erie to the south, the western tip of Lake Ontario to the east, Lake St. Clair and the southeast tip of Lake Huron to the west and area south of Georgian Bay to the north (see Figure1.2 area of interest box) are considered in the proceeding discussions.
13
followed by the Little Ice Age (LIA) starting around A.D. 1450 and continuing through to
the early 1800s (Bernabo 1981; Campbell and Campbell 1989; Foster 2012; Gajewski
1988; Mullins et al. 2011; Viau and Gajewski 2012). During the MWP there may have
been an annual temperature increase of up to +0.1°C in most of this region, which likely
resulted in slightly higher δ18O values for meteoric water. During the LIA, there was
likely a temperature decrease between 0.2 to 0.3°C resulting in slightly lower δ18O values
(Viau and Gajewski 2012). Deer in this study come from sites dated to between 3500 to
400 years BP, so some may have been affected by the MWP and beginning of the LIA.
Nonetheless, Edwards et al. (1996) suggest that the temperature and precipitation patterns
of the Great Lakes region from 4000 B.P. onward appear to have been relatively stable
despite annual temperature changes (also see Bernabo and Webb 1977 for stability in
pollen record 2000–500 BP).
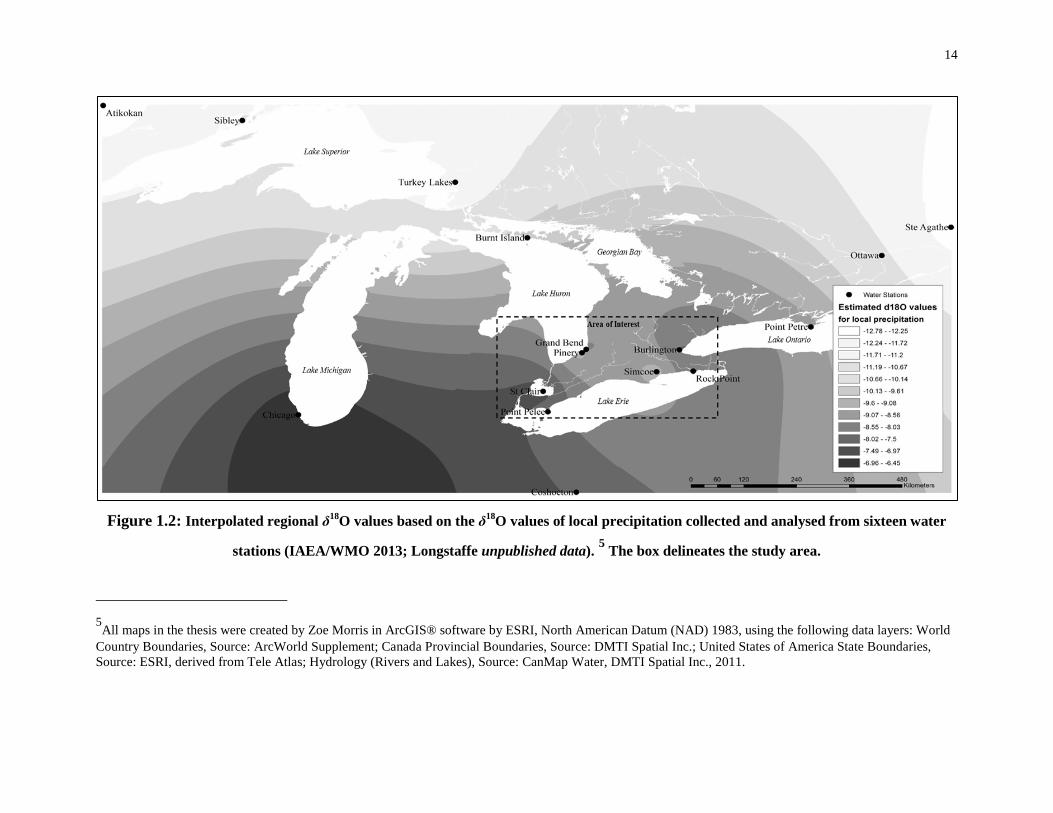
14
Figure 1.2: Interpolated regional δ18O values based on the δ18O values of local precipitation collected and analysed from sixteen water
stations (IAEA/WMO 2013; Longstaffe unpublished data). 5 The box delineates the study area.
5All maps in the thesis were created by Zoe Morris in ArcGIS® software by ESRI, North American Datum (NAD) 1983, using the following data layers: World Country Boundaries, Source: ArcWorld Supplement; Canada Provincial Boundaries, Source: DMTI Spatial Inc.; United States of America State Boundaries, Source: ESRI, derived from Tele Atlas; Hydrology (Rivers and Lakes), Source: CanMap Water, DMTI Spatial Inc., 2011.

15
1.4 Research context: Late Woodland SW Ontario Southwestern Ontario is loosely associated with the larger Northeastern Woodland
archaeological cultural area extending through southern Quebec, Ontario, and the
Maritimes in Canada and US Atlantic and Midwest states. The southwestern Ontario
Woodland region is bounded by Lake Erie to the south, Lake Huron and Lake St. Clair to
the west and Lake Ontario to the east, within the northern limit of the Carolinian forest.
Archaeologists have typically divided the material remains in this region into two groups;
; the Ontario Iroquoian6 and Western Basin peoples. These two cultural groups inhabited
this region contemporaneously and within shifting borders. Table 1.3 summarizes the
phases of Ontario Iroquoian and Western Basin cultural traditions, which are identified
primarily by pottery styles. Despite their proximity, there are differences in the
subsistence and settlement strategies adopted by the Ontario Iroquoians and Western
Basin peoples.
Both groups employed a mixed subsistence strategy, incorporating domestic plant
horticulturalism, with wild plant gathering, and hunting and fishing local faunal
resources. White-tailed deer, small mammals, a variety of birds, and freshwater fish were
all important dietary components throughout the Late Woodland time period. The
emphasis on particular hunted and fished species, however, differed by cultural group and
time period (Foreman 2011; Murphy and Ferris 1990; Prevec and Noble 1983; Stewart
2000; Warrick 2000). Settlement patterns for both groups are variable, though after A.D.
1000, generally Ontario Iroquoian sites appear to be occupied year round, while Western
Basin sites are less consistent in terms of season of occupation, patterns of annual re–use,
and length of occupation. The variation in settlement style had previously led researchers
6 The term Iroquoian is used in this dissertation to describe Iroquoian-speaking peoples living in the lower Great Lakes region prior to and following European contact. The term Iroquois specifically refers to peoples of the historic Five Nations of New York State, including Onodaga, Oneida, Mohawk, Seneca and Cayuga (Smith 1990:279; Trigger 1978:3). The Ontario Western Basin (herein referred to as Western Basin) name and sequence was adapted from Fitting (1965) and Stother (1975) by Murphy and Ferris (1990:189) to recognize the distinct cultural tradition present in the southwestern-most corner of Ontario, though it also extended into southeastern Michigan and northwestern Ohio.

16
to assume that the more sedentary Ontario Iroquoian people were more heavily reliant on
domestic crops, particularly maize, compared to their Western Basin neighbours. Recent
isotopic data for Ontario Western Basin peoples suggest a similar pattern of maize
consumption (Dewar et al. 2010; Spence et al. 2014; Watts et al. 2011). The seasonal
occupation evident at many Western Basin sites has created speculation as to where and
how Western Basin people were growing large quantities of maize and, therefore, the use
of additional proxies for landscape use warrant further investigation.
Table 1.3: Cultural stages of southwestern Ontario.
Pre–A.D. 200 Archaic ~8000–800 B.C. Ellis et al. 1990 Early Woodland ~900 – 0 B.C. Middle Woodland 300 B.C. to A.D.
500
Ontario Iroquoian Princess Point Phase A.D. 700–1000 Fox 1990 Early Ontario Iroquoian Period A.D. 900–1300 Williamson 1990 Middle Ontario Iroquoian Stage A.D. 1300–1450 Dodd et al. 1990; Finlayson 1998 Late Iroquoian/Neutral A.D 1450–1650 Lennox and Fitzgerald 1990 Ontario Western Basin Riviere au Vase Phase A.D. 600–900 Murphy and Ferris 1990 Younge Phase A.D 800–1200 Springwells Phase A.D 1200–1400 Wolf Phase A.D. 1400–1550
1.5 Research sample Faunal samples were procured from twenty–eight previously excavated archaeological
sites from southwestern Ontario (Appendix A). The samples ranged temporally from the
Late Archaic Davidson site, dated to 3500 B.P, to contact period Neutral sites, dating into
the mid–1650s. The majority of the sites, however, date between A.D. 1000 and 1650.
Sixteen Ontario Iroquoian sites were sampled, including two Princess Point sites, as well
as nine Western Basin sites. Three sites dating prior to as the entry ofmaize into the
region are used as baselines for C3-only resource availablity (Figure 1.3).
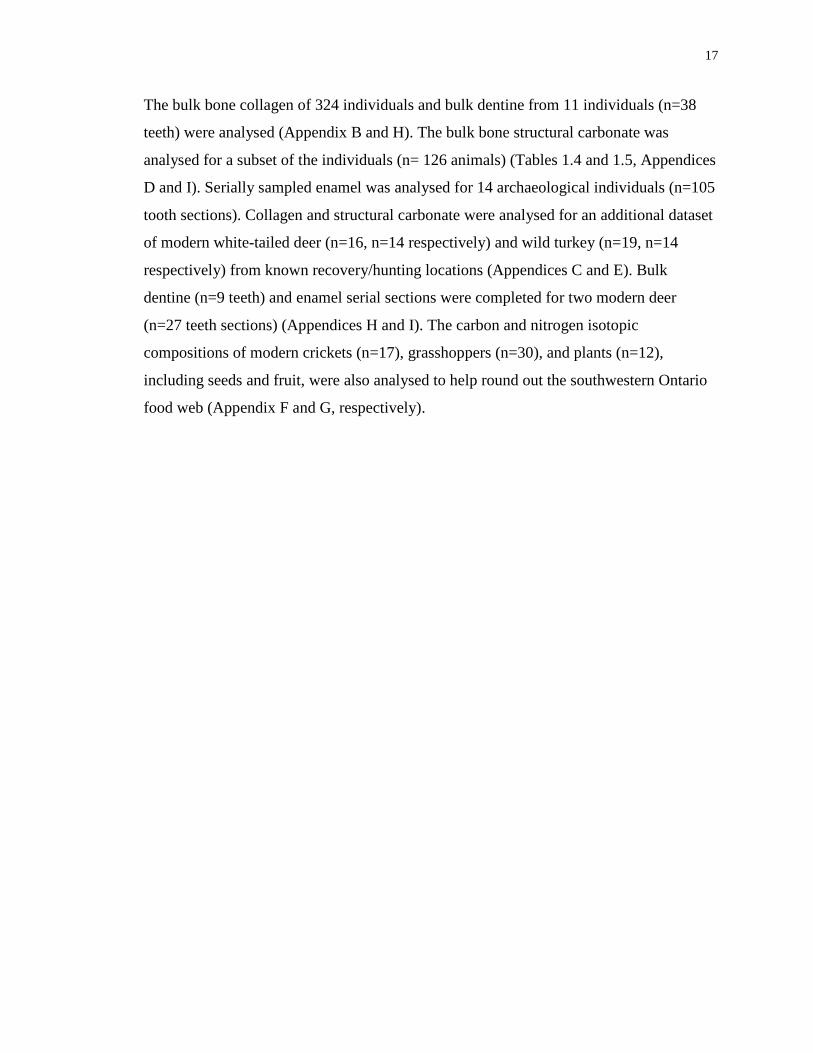
17
The bulk bone collagen of 324 individuals and bulk dentine from 11 individuals (n=38
teeth) were analysed (Appendix B and H). The bulk bone structural carbonate was
analysed for a subset of the individuals (n= 126 animals) (Tables 1.4 and 1.5, Appendices
D and I). Serially sampled enamel was analysed for 14 archaeological individuals (n=105
tooth sections). Collagen and structural carbonate were analysed for an additional dataset
of modern white-tailed deer (n=16, n=14 respectively) and wild turkey (n=19, n=14
respectively) from known recovery/hunting locations (Appendices C and E). Bulk
dentine (n=9 teeth) and enamel serial sections were completed for two modern deer
(n=27 teeth sections) (Appendices H and I). The carbon and nitrogen isotopic
compositions of modern crickets (n=17), grasshoppers (n=30), and plants (n=12),
including seeds and fruit, were also analysed to help round out the southwestern Ontario
food web (Appendix F and G, respectively).
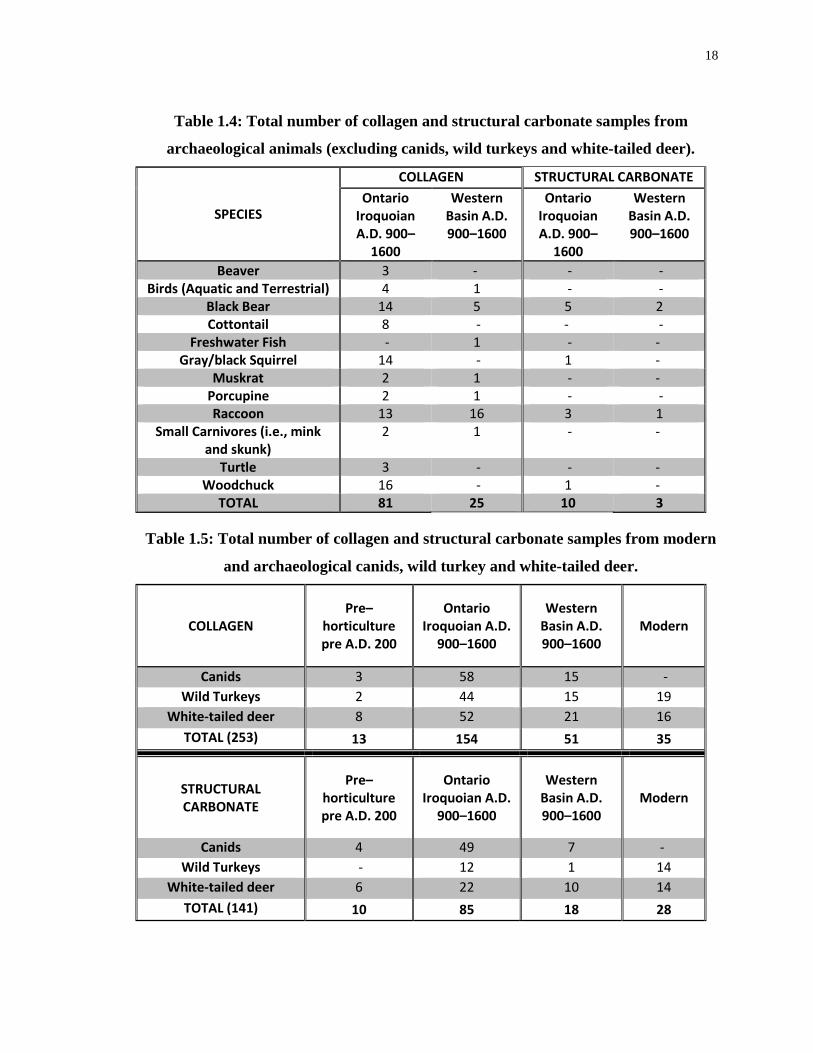
18
Table 1.4: Total number of collagen and structural carbonate samples from
archaeological animals (excluding canids, wild turkeys and white-tailed deer).
SPECIES
COLLAGEN STRUCTURAL CARBONATE Ontario
Iroquoian A.D. 900–
1600
Western Basin A.D. 900–1600
Ontario Iroquoian A.D. 900–
1600
Western Basin A.D. 900–1600
Beaver 3 - - - Birds (Aquatic and Terrestrial) 4 1 - -
Black Bear 14 5 5 2 Cottontail 8 - - -
Freshwater Fish - 1 - - Gray/black Squirrel 14 - 1 -
Muskrat 2 1 - - Porcupine 2 1 - - Raccoon 13 16 3 1
Small Carnivores (i.e., mink and skunk)
2 1 - -
Turtle 3 - - - Woodchuck 16 - 1 -
TOTAL 81 25 10 3
Table 1.5: Total number of collagen and structural carbonate samples from modern
and archaeological canids, wild turkey and white-tailed deer.
COLLAGEN Pre–
horticulture pre A.D. 200
Ontario Iroquoian A.D.
900–1600
Western Basin A.D. 900–1600
Modern
Canids 3 58 15 - Wild Turkeys 2 44 15 19
White-tailed deer 8 52 21 16 TOTAL (253) 13 154 51 35
STRUCTURAL CARBONATE
Pre–horticulture pre A.D. 200
Ontario Iroquoian A.D.
900–1600
Western Basin A.D. 900–1600
Modern
Canids 4 49 7 - Wild Turkeys - 12 1 14
White-tailed deer 6 22 10 14 TOTAL (141) 10 85 18 28
19
Figure 1.3: Map of southwestern Ontario including all archaeological sites from which faunal samples were selected.
Ancestral Ontario Iroquoian Sites: 1. Lightfoot; 2. Pipeline; 3. Rife; 4. Crawford Lake; 5. Bogle II; 6. Hamilton; 7. Winking Bull; 8. Old Lilac Garden; 9. Princess Point; 10. Cleveland; 11. Fonger; 12. Porteous; 13. Walker; 14. Van Besien, 15. Slack-Caswell; 16. Thorold. Pre-maize Sites:
17. Cranberry Creek; 18. Bruce Boyd; 19. Davidson. Ontario Western Basin Sites: 20. Figura; 21; Inland West Pit Sites, Loc. 3, 9 and 12; 22. Montoya; 23. Dobbelear; 24. Liahn I; 25. Roffelson; 26. Silverman.
20
1.6 Organization of this dissertation The dissertation body is organized into three substantive chapters, which will eventually
be published in peer-reviewed journals. Each chapter deals with a different group of
animals and includes relevant background, research questions and methodology specific
to that set of animals. In Chapter 2 the isotopic data of wild and domestic canids are used
to reconstruct the diets of canids, which include probable wolves, a group of large canids,
foxes, and domestic dogs. The domestic dog results are compared to published human
data for Ontario Iroquoian and Western Basin sites through time in order to determine
whether dogs can serve as proxies for southwestern Ontario humans. In Chapter 3 the
bone collagen and structural carbonate of wild turkeys recovered from Ontario Iroquoian
sites are compared to a set of modern wild turkeys from known locations as well as
archaeological turkeys from sites in the southeastern and southwestern United States and
Mexico. The unique pattern of maize access noted for the Ontario Iroquoian wild turkeys
is hypothesized as purposeful feeding. In Chapter 4 radiographic data are used to
reconstruct the dental formation sequence of white-tailed deer, which is corroborated
with the analysis of oxygen–isotope data from enamel serial sections from ten deer
mandibles. The same serial sections are also used to explore the diet and ecology of the
first year of life. Compared with models from modern deer collagen and structural
carbonate analyses, archaeological deer are not consuming significant quantities of maize
and show an unusual relationship between bone collagen and structural carbonate. The
lack of maize consumption indicates that these deer were hunted, and a specific post–
mortem treatment of deer is hypothesized to explain the unusual collagen–structural
carbonate results. In each chapter, the oxygen isotopic composition of carbonate (δ18Osc)
for each type of animal is compared with the predicted and/or measured oxygen isotopic
composition of local precipitation (Figure 1.2) in order to determine whether the isotopic
composition of the animals reflects their recovery locations/sites or if they have been
obtained from a distant region. Chapter 5 summarizes all of the findings and suggests
future directions for expanding this research.
21
1.7 References Allegretto, K.O., 2007. Adopting Maize in the Eastern Woodlands of North America.
[Unpublished Ph.D. thesis]. Brandeis University, Waltham, MA.
Allitt, S., Steward, M., Messner, T., 2008. The utility of dog bone (Canis familiaris) in stable isotope studies for investigating the presence of prehistoric maize (Zea mays ssp. Mays): A preliminary study. North American Archaeologist. 29(3–4), 343–367.
Ambrose, S. H., 1991. Effects of diet, climate and physiology on nitrogen isotope abundances in terrestrial foodwebs. Journal of Archaeological Science, 18(3), 293–317.
Ambrose S.H, Norr L. 1993. Experimental evidence for the relationship of the carbon isotope ratios of whole diet and dietary protein to those of bone collagen and carbonate. In: Lambert J., Grupe, G., (Eds), Prehistoric human bone: archaeology at the molecular level. Springer–Verlag, Berlin, pp. 1–37.
Ayliffe L.K., Chivas A.R., 1990. Oxygen isotope composition of the bone phosphate of Australian kangaroos: Potential as a palaeoenvironmental recorder. Geochimica et Cosmochimica Acta 54(9), 2603–2609.
Balasse, M., 2002. Reconstructing dietary and environmental history from enamel isotopic analysis: time resolution of intra‐tooth sequential sampling. International Journal of Osteoarchaeology, 12(3), 155–165.
Balasse, M., Ambrose, S. H., Smith, A. B., Price, T. D., 2002. The seasonal mobility model for prehistoric herders in the south–western Cape of South Africa assessed by isotopic analysis of sheep tooth enamel. Journal of Archaeological Science, 29(9), 917–932.
Balasse, M., Smith, A. B., Ambrose, S. H., Leigh, S.R., 2003. Determining sheep birth seasonality by analysis of tooth enamel oxygen isotope ratios: the Late Stone Age site of Kasteelberg (South Africa). Journal of Archaeological Science, 30(2), 205–215.
Balasse, M., & Tresset, A., 2002. Early weaning of Neolithic domestic cattle (Bercy, France) revealed by intra–tooth variation in nitrogen isotope ratios. Journal of Archaeological Science, 29(8), 853–859.
Barton, L., Newsome, S. D., Chen, F. H., Wang, H., Guilderson, T. P., Bettinger, R. L., 2009. Agricultural origins and the isotopic identity of domestication in northern China. Proceedings of the National Academy of Sciences, 106(14), 5523–5528.
Beadle G. W., 1939 Teosinte and the origin of maize. Journal of Heredity, 30, 245–247.
22
Bernabo, J. C., 1981. Quantitative estimates of temperature changes over the last 2700 years in Michigan based on pollen data. Quaternary Research, 15(2), 143–159.
Bernabo, J. C., Webb III, T., 1977. Changing patterns in the Holocene pollen record of northeastern North America: a mapped summary. Quaternary Research, 8(1), 64–96.
Bocherens, H., Drucker, D. 2003. Trophic level isotopic enrichment of carbon and nitrogen in bone collagen: Case studies from recent and ancient terrestrial ecosystems. International Journal of Osteoarchaeology. 13, 46–53.
Booth, L., C. D. White, F.J. Longstaffe, L. Hodgetts and Z. H. Morris (2012) An isotopic analysis of faunal remains from suspected ritual deposits on Ontario Iroquoian Tradition sites. Published abstract of the 77th Annual Meeting of the Society for American Archaeology, Memphis N, April 18–22.
Boyd, M., Varney, T., Surette, C., Surette, J., 2008. Reassessing the northern limit of maize consumption in North America: Stable isotope, plant microfossil and trace element content of carbonized food residue Journal of Archaeological Science, 35, 2545–2556
Britton, K., Grimes, V., Dau, J., Richards, M.P. 2009. Reconstructing faunal migrations using intra–tooth sampling and strontium and oxygen isotope analyses: a case study of modern caribou (Rangifer tarandus granti), Journal of Archaeological Science 36, 1163–1172.
Bryant, J.D., Froelich, P.N., 1995. A model of oxygen isotope fractionation in body water of large mammals. Geochimica et Cosmochimica Acta, 59(21), 4523–4537.
Bryant, J.D., Koch, P.L. Froelich, P.N., Shower, W.J., Genna, BJ., 1996.Oxygen isotope partitioning between phosphate and carbonate in mammalian apatite. Geochimica et Cosmochimica Acta, 60(24), 5145–5148.
Burleigh, R., Brothwell, D., 1978. Studies on Amerindian dogs, 1: Carbon isotopes in relation to maize in the diet of domestic dogs from early Peru and Ecuador. Journal of Archaeological Science, 5, 355–362.
Campbell C., Campbell I.D. 1989. The Little Ice Age and Neutral faunal assemblages. Ontario Archaeology, 49, 13–33.
Cappella K. 2005. Ontario’s First Farmers? Investigations into Princess Point and the Introduction of Horticulture to Ontario. [Unpublished Ph.D. thesis]. Peterborough: Trent University.
Cerling, T.E. and Harris, J.M., 1999. Carbon isotope fractionation between diet and bioapatite in ungulate mammals and implications for ecological and paleoecological studies. Oecologia, 120(3), 347–363.
23
Chisholm, B. S., Nelson, D. E., Hobson, K.A., Schwarcz, H. P., Knyf, M., 1983. Carbon isotope measurement techniques for bone collagen: notes for the archaeologist. Journal of Archaeological Sciences 10, 355–360.
Clementz, M.T., Koch, P.L., 2001. Differentiating aquatic mammal habitat and foraging ecology with stable isotopes in tooth enamel. Oecologia, 129(3), 461–472.
Clementz, M.T., Fox–Dobbs, K., Wheatley, P.V., Koch, P.L. and Doak, D.F., 2009. Revisiting old bones: coupled carbon isotope analysis of bioapatite and collagen as an ecological and palaeoecological tool. Geological Journal, 44(5), 605–620.
Coplen, T.B., 1996. New guidelines for reporting stable hydrogen, carbon, and oxygen isotope–ratio data. Geochimica et Cosmochimica Acta. 60 (17), 3359–3360.
Coplen, T. B., 2011. Guidelines and recommended terms for expression of stable‐isotope‐ratio and gas‐ratio measurement results. Rapid Communications in Mass Spectrometry, 25(17), 2538–2560.
Coplen, T.B., Brand, W.A., Gehre, M., Gröning, Meijer, H.A., Toman B., Verkouteren, R.M., 2006. New guidelines for δ13C measurements. Analytical Chemistry 78, 2439–2441.
Cormie, A. B., Schwarcz, H.P., 1994. Stable isotopes of nitrogen and carbon of North American white-tailed deer and implications for paleodietary and other food web studies. Palaeogeography, Palaeoclimatology, Palaeoecology. 107, 227–241.
Craig H, Gordon, L. 1965. Deuterium and oxygen 18 variation in the ocean and marine atmosphere. In Stable Isotopes in Oceanographic Studies and Palaeotemperatures, Spoleto 1965. Tongiorgi E. (ed). Consiglio Nazionale della Ricerca; Pi sa, Italy; 9– 130.
Crawford, G. W., Smith, D. G., 1996. Migration in prehistory: Princess Point and the Northern Iroquoian case. American Antiquity, 782–790.
Crawford, G.W., Saunders, D., Smith, D.G., 2006. Pre–Contact Maize from Ontario, Canada: Context, chronology, variation, and plant association. In: Staller, J., Tykot, R., Benz, B. (Eds.). Histories of maize: multidisciplinary approaches to the prehistory, linguistics, biogeography, domestication, and evolution of maize. Left Coast Press, Walnut Creek, pp. 549–559.
Crawford, G.W., Smith, D.G., Bowyer, V.E., 1997. Dating the entry of corn (Zea mays) into the lower Great Lakes region. American Antiquity 62(1), 112–119.
Dansgaard W., 1964. Stable isotopes in precipitation. Telus 16, 436– 468.
Daux, V., Lécuyer, C., Héran, M. A., Amiot, R., Simon, L., Fourel, F., Martineau, F., Lynnerup, D., Reychler, H., Escarguel, G., 2008. Oxygen isotope fractionation
24
between human phosphate and water revisited. Journal of Human Evolution, 55(6), 1138–1147.
DeNiro M.J., S. Epstein, S., 1978. Influence of diet on the distribution of carbon isotopes in animals. Geochimica et Cosmochimica Acta. 42, 495–506.
DeNiro M.J., S. Epstein, S., 1981. Influence of diet on the distribution of nitrogen isotopes in animals. Geochimica et Cosmochimica Acta 45, 341–351.
Dewar, G., Ginter, J.K., Shook, B.A.S., Ferris, N., Henderson, H., 2010. A bioarchaeoloigcal study of a Western Basin Tradition cemetery on the Detroit River. Journal of Archaeological Science 37, 2245–2254.
Dodd, C.F., Poulton, D.R., Lennox, P.A., Smith, D.G., Warrick, G.A., 1990. The middle Ontario Iroquoian stage. In: Ellis, C.J., Ferris, N., (Eds.), The archaeology of southern Ontario to A.D. 1650. Occasional Publications of the London Chapter, OAS Number 5, pp. 321–360.
Drucker, D. G., Bocherens, H. 2009. Carbon stable isotopes of mammal bones as tracers of canopy development and habitat use intemperate and boreal contexts. In: Creighton, J.D. Roney, P.J. (Eds.), Forest Canopies: Forest Production, Ecosystem Health, and Climate Conditions Nova Science Publishers, Inc., New York, pp. 103–109.
Eaton, S.W., 1992. Wild Turkey: Meleagris gallopavo. The Birds of North America: Life Histories for the 21st Century no. 22, the Academy of Natural Sciences, Philadelphia, pp. 1–28.
Edwards, T. W., Wolfe, B. B., Macdonald, G. M., 1996. Influence of changing atmospheric circulation on precipitation δ18O – temperature Relations in Canada during the Holocene. Quaternary Research, 46(3), 211–218.
Ellis, C.J., Kenyon, I.T, Spence, M.W. 1990. The Archaic. In: Ellis, C.J., Ferris, N., (Eds.), The archaeology of southern Ontario to A.D. 1650. Occasional Publications of the London Chapter, OAS Number 5, pp. 65-124.
Emery, K. F. 2004. Maya zooarchaeology: new directions in method and theory (Vol. 51). Cotsen Institute of Archaeology.
Emery, K. F., Wright, L.E., Schwarcz, H.P. 2000 Isotopic analysis of ancient deer bone: Biotic stability in collapse period Maya land–use. Journal of Archaeological Science, 27(6), 537–550.
Finlayson, W. D., 1998. Iroquoian Peoples of the land of rocks and water A.D. 1000–1650: A study in settlement archaeology, Vol. 1, Special Publication 1, London Museum of Archaeology.
25
Finucane, B., Agurto, P.M., Isbell, W.H., 2006. Human and animal diet at Conchopata, Peru: Stable isotope evidence for maize agriculture and animal management practices during the Middle Horizon. Journal of Archaeological Science., 33, 1766–1776.
Fogel, M.L., Tuross, N., Owsley, O., 1989. Nitrogen isotope tracers of human lactation in modern and archaeological populations. In: Report of the Director of the Geophysical Laboratory, Carnegie Institution Washington, 1988–1989. Geophysical Laboratory, Washington, DC, pp. 111–116.
Foreman, L., 2011. Seasonal subsistence in Late Woodland southwestern Ontario: An examination of the relationship between resource availability, maize agriculture, and faunal procurement and processing strategies. [Unpublished Ph.D. thesis]. The University of Western Ontario, London.
Foster, W. C., 2012. Climate and culture change in North America AD 900–1600. University of Texas Press, Austin.
Fox. W.A. 1990. The Middle to Late Woodland Transition. In: Ellis, C.J., Ferris, N., (Eds.), The archaeology of southern Ontario to A.D. 1650. Occasional Publications of the London Chapter, OAS Number 5, pp. 171–188.
Fraser, R. A., Grün, R., Privat, K., Gagan, M. K., 2008. Stable–isotope microprofiling of wombat tooth enamel records seasonal changes in vegetation and environmental conditions in eastern Australia. Palaeogeography, Palaeoclimatology, Palaeoecology, 269(1), 66–77.
Fricke, H. C., & O'Neil, J. R., 1996. Inter–and intra–tooth variation in the oxygen isotope composition of mammalian tooth enamel phosphate: implications for palaeoclimatological and palaeobiological research. Palaeogeography, Palaeoclimatology, Palaeoecology, 126(1), 91–99.
Fricke, H.C., O'Neil, J.R., 1999. The correlation between18O/ 16O ratios of meteoric water and surface temperature: its use in investigating terrestrial climate change over geologic time. Earth and Planetary Science Letters, 170, 181–196.
Friedli, H., Lötscher, H., Oeschger, H., Siegenthaler, U., Stauffer, B., 1986. Ice core record of the 13C/12C ratio of atmospheric CO2 in the past two centuries. Nature, 324(6094), 237–238.
Fuller, B. T., Fuller, J. L., Harris, D. A., Hedges, R. E., 2006. Detection of breastfeeding and weaning in modern human infants with carbon and nitrogen stable isotope ratios. American Journal of Physical Anthropology, 129(2), 279–293.
Gajewski, K.. 1988. Late Holocene climate changes in eastern North America estimated from pollen data. Quaternary Research, 29(3), 255–262.
26
Golder and Associates, 2012. Stage 2 archaeological assessment: Jericho Wind Inc., Jericho Wind Energy Centre, Lambton and Midddlesex Counties, Ontario. Manuscript on file, Ontario Ministry of Tourism, Culture and Sport, Toronto, Ontario.
Harrison, R. G., Katzenberg, M. A., 2003. Paleodiet studies using stable carbon isotopes from none apatite and Collagen: Examples from Southern Ontario and San Nicolas Island, California. Journal of Anthropological Archaeology, 22, 227–244.
Herring, D., Saunders, S. R., Katzenberg, M. A., 1998. Investigating the weaning process in past populations. American Journal of Physical Anthropology, 105(4), 425–439.
Hobson, K.A., 1999. Tracing origins and migration of wildlife using stable isotopes: A review. Oecologia, 120(3), 314–326.
Hobson, K. A., Alisauskas, R. T., & Clark, R. G. (1993). Stable–nitrogen isotope enrichment in avian tissues due to fasting and nutritional stress: implications for isotopic analyses of diet. Condor, 388–394.
Iacumin, P., Bocherens, H., Mariotti, A., Longinelli, A., 1996. Oxygen isotope analyses of coexisting carbonate and phosphate in biogenic apatite: a way to monitor diagenetic alteration of bone phosphate? Earth and Planetary Science Letters, 142(1), 1–6.
IAEA/WMO, 2013. Global Network of Isotopes in Precipitation. The GNIP Database. Accessible at: http://www.iaea.org/water
Katzenberg, M.A., 1989. Stable isotope analysis of archaeological faunal remains from southern Ontario. Journal of Archaeological Science 16, 319–329.
Katzenberg, M. A., 2006. Prehistoric maize in southern Ontario. In: Staller, J., Tykot, R., Benz, B. (Eds.). Histories of maize: multidisciplinary approaches to the prehistory, linguistics, biogeography, domestication, and evolution of maize. Left Coast Press, Walnut Creek, pp. 263–273.
Katzenberg, M. A., 2007. Stable isotope analysis: a tool for studying past diet, demography, and life history. In: Katzenberg, M.A., Saunders, S.R. (Eds.), Biological Anthropology of the Human Skeleton, Second Edition, John Wiley and Sons, Inc., Hoboken, pp. 411–441.
Katzenberg, M. A., Schwarcz, H. P., Knyf, M., Melbye, F.J., 1995. Stable isotope evidence for maize horticulture and paleodiet in southern Ontario, Canada. American Antiquity 60, 335–350.
Kellner, C.M., Schoeninger, M.J., 2007. A simple carbon isotope model for reconstructing prehistoric human diet. American Journal of Physical Anthropology, 133, 1112–1127.

27
Ketchum, S., Schurr, M., Garniewicz, R., 2009. A test for maize consumption by fauna in Late Prehistoric Eastern North America. North American Archaeologist 30(1), 87–101.
Kirsanow, K., Makarewicz, C., Tuross, N., 2008. Stable oxygen (δ18O) and hydrogen (δD) isotopes in ovicaprid dentinal collagen record seasonal variation. Journal of Archaeological Science, 35(12), 3159–3167.
Kirsanow, K., Tuross, N., 2011. Oxygen and hydrogen isotopes in rodent tissues: Impact of diet, water and ontogeny. Palaeogeography, Palaeoclimatology, Palaeoecology, 310(1), 9–16.
Kleiman, D. G., 1967. Some aspects of social behaviour in the Canidae. American Zoologist, 7(2), 365–372.
Krueger, H. W., Sullivan, C. H., 1984. Models for carbon isotope fractionation between diet and bone, In: Turnland, J.R., Johnson, P.E. (Eds.), Stable isotopes in nutrition, pp. 205–220.
Kwak, T. J., Zedler, J. B., 1997. Food web analysis of southern California coastal wetlands using multiple stable isotopes. Oecologia, 110(2), 262–277.
Larson, T. E., Longstaffe, F. J., 2007. Deciphering seasonal variations in the diet and drinking water of modern White‐Tailed deer by in situ analysis of osteons in cortical bone. Journal of Geophysical Research: Biogeosciences, 12, G04003.
Lavin, S. R., Van Deelen, T. R., Brown, P. W., Warner, R. E., Ambrose, S. H., 2003. Prey use by red foxes (Vulpes vulpes) in urban and rural areas of Illinois. Canadian Journal of Zoology, 81(6), 1070–1082.
Lee–Thorp, J., Sealy, J.C., van der Merwe, N.J., 1989. Stable carbon isotope ratio differences between bone collagen and bone apatite, and their relationship to diet. Journal of Archaeological Science, 16, 585–599.
Lee–Thorp, J. L., Van Der Merwe, N. J., 1987. Carbon isotope analysis of fossil bone apatite. South African Journal of Science, 83, 712–715.
Lennox, P. A., Fitzgerald, W. R., 1990. The culture history and archaeology of the Neutral Iroquoians. In: Ellis, C.J., Ferris, N., (Eds.), The archaeology of southern Ontario to A.D. 1650. Occasional Publications of the London Chapter, OAS Number 5, pp. 405–456.
Longinelli, A., 1984. Oxygen isotopes in mammal bone phosphate: a new tool for paleohydrological and paleoclimatological research? Geochimica et Cosmochimica Acta 48, 385–390.
Luz, B., Kolodny, Y., 1985. Oxygen isotope variations in phosphate of biogenic apatites, IV. Mammal teeth and bones. Earth and Planetary Science Letters, 75(1), 29–36.
28
Luz, B., Kolodny, Y., Horowitz, M., 1984. Fractionation of oxygen isotopes between mammalian bone–phosphate and environmental drinking water. Geochimica et Cosmochimica Acta, 48, 1689–1693.
Luz, B., Cormie, A. B., Schwarcz, H. P., 1990. Oxygen isotope variations in phosphate of deer bones. Geochimica et Cosmochimica Acta, 54(6), 1723–1728.
Mariotti, A., 1983. Atmospheric nitrogen is a reliable standard for natural 15N abundance measurements. Nature, 303, 685–687.
Matsuoka, Y., Vigouroux, Y., Goodman, M. M., Sanchez, J., Buckler, E., Doebley, J., 2002. A single domestication for maize shown by multilocus microsatellite genotyping. Proceedings of the National Academy of Sciences, 99(9), 6080–6084.
McKinney, C.R., McCrea, J.M., Epstein, S., Allen, H.A., Urey, H.C., 1950. Improvements in mass spectrometers for the measurement of small differences in isotope abundance ratios. Review of Scientific Instruments, 21(8), 724–730.
Mullins, H. T., Patterson, W. P., Teece, M. A., Burnett, A. W., 2011. Holocene climate and environmental change in central New York (USA). Journal of Paleolimnology, 45(2), 243–256.
Murphy, C., Ferris, N. 1990. The Late Woodland Western Basin Tradition in southwestern Ontario. In: Ellis, C.J., Ferris, N., (Eds.), The archaeology of southern Ontario to A.D. 1650. Occasional Publications of the London Chapter, OAS Number 5, pp. 189–278.
O'Leary, M. H., 1981. Carbon isotope fractionation in plants. Phytochemistry, 20(4), 553–567.
Oleszek, W., Junkuszew, M., Stochmal, A., 1999. Determination and toxicity of saponins from Amaranthus cruentus seeds. Journal of Agricultural and Food Chemistry, 47, 3685–3687.
Pfeiffer, S., Williamson, R. F., Sealy, J. C., Smith, D. G., Snow, M. H., 2014. Stable dietary isotopes and mtDNA from Woodland period southern Ontario people: results from a tooth sampling protocol. Journal of Archaeological Science, 42, 334–345.
Prevec, R., Noble, W. C., 1983. Historic Neutral Iroquois faunal utilization. Ontario Archaeology, 39, 41–56.
Richards, M. P., Mays, S., Fuller, B. T., 2002. Stable carbon and nitrogen isotope values of bone and teeth reflect weaning age at the Medieval Wharram Percy site, Yorkshire, UK. American Journal of Physical Anthropology, 119(3), 205–210.
Schoeninger, M. J., 2009. Stable isotope evidence for the adoption of maize agriculture. Current anthropology, 50(5), 633–640.
29
Schoeninger, M. J., DeNiro, M. J., 1984. Nitrogen and carbon isotopic composition of bone collagen from marine and terrestrial animals. Geochimica et Cosmochimica Acta, 48(4), 625–639.
Schoeninger, M. J., DeNiro, M. J., Tauber, H., 1983. Stable nitrogen isotope ratios of bone collagen reflect marine and terrestrial components of prehistoric human diet. Science, 220(4604), 1381–1383.
Schoeninger, M. J., Moore, K., 1992. Bone stable isotope studies in archaeology. Journal of World Prehistory, 6(2), 247–296.
Schurr, M. R., Redmond, B. G., 1991. Stable isotope analysis of incipient maize horticulturists from the Gard Island 2 site. Midcontinental Journal of Archaeology, 69–84.
Schwarcz, H. P., Schoeninger, M. J., 1991. Stable isotope analyses in human nutritional ecology. American Journal of Physical Anthropology, 34(S13), 283–321.
Schwarcz, H. P., Melbye, J., Anne Katzenberg, M., Knyf, M., 1985. Stable isotopes in human skeletons of southern Ontario: reconstructing palaeodiet. Journal of Archaeological Science, 12(3), 187–206.
Spence, M. W., Williams, L. J., Wheeler, S. M., 2014. Death and Disability in a Younge Phase Community. American Antiquity, 79(1), 108–126.
Sponheimer, M., Lee–Thorp, J. A., 1999. Isotopic evidence for the diet of an early hominid, Australopithecus africanus. Science, 283(5400), 368–370.
Starna, W. A., Relethford, J. H., 1985. Deer Densities and Population Dynamics: A Cautionary Note. American Antiquity, 825–832.
Stewart, F. L., 2000. Variability in Neutral Iroquoian Subsistence, AD 1540–1651. Ontario Archaeology, 69, 92–117.
Stothers, B.M. Bechtel, S.K., 1987. Stable Carbon Isotope Analysis: An Inter–Regional Perspective. The Archaeology of Eastern North America 15,137–154.
Stuart–Williams, H. L. Q., Schwarcz, H. P., White, C. D., Spence, M. W., 1996. The isotopic composition and diagenesis of human bone from Teotihuacan and Oaxaca, Mexico. Palaeogeography, Palaeoclimatology, Palaeoecology, 126(1), 1–14.
Thornton, E. K., Emery, K. F., Steadman, D. W., Speller, C., Matheny, R., Yang, D., 2012. Earliest Mexican Turkeys (Meleagris gallopavo) in the Maya region: implications for pre–hispanic animal trade and the timing of Turkey domestication. PloS one, 7(8).

30
Tieszen, L.L., Fagre, T., 1993. Carbon isotopic variability in modern and archaeological maize. Journal of Archaeological Science, 30,25–40.
Tuross N., Fogel, M.L., 1994. Stable isotope analysis and subsistence patterns at the Sully site. In: Owsley, D.W. Jantz, J.L. (Eds.), Skeletal biology in the Great Plains: Migration, warfare, health, and subsistence. Smithsonian Institute Press, Washington, DC, pp. 283–89.
van der Merwe, N. J., 1982. Carbon isotopes, photosynthesis, and archaeology: different pathways of photosynthesis cause characteristic changes in carbon isotope ratios that make possible the study of prehistoric human diets. American Scientist, 596–606.
van der Merwe, N. J., Medina, E., 1989. Photosynthesis and 13C/12C ratios in Amazonian rain forests. Geochimica et Cosmochimica Acta, 53, 1091–1094
van der Merwe, N. J., Medina, E., 1991. The canopy effect, carbon isotope ratios and foodwebs in Amazonia. Journal of Archaeological Science, 18(3), 249–259.
van der Merwe, N. J., Williamson, R. F., Pfeiffer, S., Thomas, S. C., Allegretto, K. O., 2003. The Moatfield ossuary: Isotopic dietary analysis of an Iroquoian community, using dental tissue. Journal of Anthropological Archaeology, 22(3), 245–261.
Verburg, P., 2007. The need to correct for the Suess effect in the application of δ13C in sediment of autotrophic Lake Tanganyika, as a productivity proxy in the Anthropocene. Journal of Paleolimnology, 37(4), 591–602.
Viau, A. E., Ladd, M., Gajewski, K., 2012. The climate of North America during the past 2000 years reconstructed from pollen data. Global and Planetary Change, 84, 75–83.
Vogel, J. C., Van der Merwe, N. J., 1977. Isotopic evidence for early maize cultivation in New York State. American Antiquity, 238–242.
Warrick, G. 2000. The precontact Iroquoian occupation of southern Ontario. Journal of World Prehistory, 14(4), 415–466.
Watts, C. M., White, C. D., Longstaffe, F. J., 2011. Childhood diet and Western Basin tradition foodways at the Krieger site, southwestern Ontario, Canada. American Antiquity, 76(3), 446–472.
White, C.D., 2004. Stable isotopes and the human–animal interface in Maya biosocial and environmental systems. Archaeofauna 13, 183–198.
White, C.D., Longstaffe, F. J., Law, K. R., 2004a. Exploring the effects of environment, physiology and diet on oxygen isotope ratios in ancient Nubian bones and teeth. Journal of Archaeological Science, 31(2), 233–250.

31
White, C. D., Pohl, M. E., Schwarcz, H. P., Longstaffe, F. J., 2001. Isotopic evidence for Maya patterns of deer and dog use at Preclassic Colha. Journal of Archaeological Science, 28(1), 89–107.
White, C. D., Pohl, M. D., Schwarcz, H. P., Longstaffe, F. J., 2004b. Deer and Dog Diets at Lagartero, Tikal, and Copán. In. Emery, K.F. (Ed.), Maya zooarchaeology: New directions in method and theory, The Cotsen Institute of Archaeology Press, Los Angeles, pp.141–158.
Whitney, E., Rolfes, S. R., 2008. Understanding nutrition, eleventh edition, Thomas Wadsworth, Belmont. CA.
Williams, J. S., White, C. D., Longstaffe, F. J., 2005. Trophic level and macronutrient shift effects associated with the weaning process in the Postclassic Maya. American Journal of Physical Anthropology, 128(4), 781–790.
Williamson, R. F., 1990. In: Ellis, C.J., Ferris, N., (Eds.), The archaeology of southern Ontario to A.D. 1650. Occasional Publications of the London Chapter, OAS Number 5, pp. 291–320.
Wright, L. E., Schwarcz, H. P., 1998. Stable carbon and oxygen isotopes in human tooth enamel: identifying breastfeeding and weaning in prehistory. American Journal of Physical Anthropology, 106(1), 1–18.
Yakir, D., 2011. The paper trail of the 13C of atmospheric CO2 since the industrial revolution period. Environmental Research Letters, 6(3), 034007.
32
Chapter 2
2 Domestic and wild canids
2.1 Introduction “Men should be good to their dogs, for kindness is due to those that aid us, and if they
are unkind, there may be a penalty. There is an abyss between us and the land of souls,
and over this two dogs hold a log in their teeth. Over this log, if fortunate, the soul passes
to the happy hunting grounds. If voices are heard saying, ‘He fed us, he sheltered us, he
loved us,’ then the dog at each end grips hard with his teeth, holding the log with all his
might and the soul passes safely over. But if the voices say, ‘He starved us, he beat us, he
drove us away,’ then, when he is halfway over, the dogs let go, and he falls into depths of
woe.” An Onodaga Story, Brehm 2011:365 from Bear c. 1932
During the Late Woodland period (A.D. 900–1600) two contemporary cultural traditions,
Western Basin and Ontario Iroquoian existed along a shifting frontier in southwestern
Ontario. Both traditions involved a mixed subsistence economy, based on hunting,
fishing, gathering and cultivation of crops that were both introduced (maize, squash,
beans) and locally domesticated (e.g., sunflower, tobacco). Archaeological evidence has
suggested that during the Late Woodland, Ontario Iroquoian people emphasized maize
horticulturalism and consequently occupied village sites for longer periods than their
Western Basin neighbours (Murphy and Ferris 1990; Warrick 2000; Williamson 1990).
In contrast, archaeological evidence has led to the belief that Ontario Western Basin
people de-emphasized maize cultivation because of their seasonal mobility, economic
and settlement flexibility (Murphy and Ferris 1990). Recent isotopic analyses of human
remains from southwestern Ontario has, however, revealed that Western Basin
individuals in Ontario were consuming amounts of maize comparable to their Ontario
Iroquoian contemporaries (Dewar et al. 2010; Spence et al. 2010; Watts et al. 2011).
Because human remains are rarely accessible for analysis, the animals with which they
interacted are used here to investigate their usefulness as dietary proxies and to examine
patterns of landscape use and subsistence activity.

33
The relationship between humans and animals provides insight into human cultural
choices (both economic and symbolic), ecological relationships and landscape use
(Comaroff and Comaroff 1990; Ingold 1994; Russell 2012; Shipman 2010). Dogs, and
their closely related canid cousins, are a particularly interesting group of animals because
of their varied and, at times, distinctive association with humans (Morey 2006; 2010;
Clutton-Brock 1994). In this paper, the diets of domestic dogs and humans are compared
and patterns of horticultural land-use and hunting choices related to wild canids are
reconstructed isotopically to determine the nature of relationships among Late Woodland
dogs, foxes and wolves and the humans who incorporated their remains into the
archaeological record.
Cultural norms and taboos often dictate human-animal relations, which are complicated
by individual preference and environmental/climatic contexts. Dogs have long been
integrated into human society, fulfilling a range of roles including hunting companions,
components of ritual and medicine, sacrificial objects, food, pets, village and crop guards,
tolerated scavengers and even bed-warmers (Brizinski and Savage 1983; Coppinger and
Coppinger 2001; Hriscu et al. 2000; Kerber 1997; Morey 2010; Olsen 1985; Olsen 2000;
Russell 2012; White 2004; Zeuner 1963). Social influences on the relationship between
humans and canids will also have biological consequences, such as changes in diet that
should be reflected in the stable isotopic composition of both species.
The carbon, nitrogen and oxygen isotopic compositions of collagen and structural
carbonate of canid bones (wolves, foxes and domestic dogs) recovered from fourteen
Ontario Iroquoian and six Western Basin sites (A.D. 900 – 1650) as well as three sites
pre-dating the entry of maize to the region (Figure 2.1) are used to determine whether the
isotopic variability of animals reflects distinct human cultural practices. Interpretive
frameworks include the use of: (1) diets of domesticated dogs as proxies for human
subsistence practices in southwestern Ontario, (2) comparison of human hunting
behaviours using the diets and deposition patterns of non–domestic canids, and (3)
oxygen isotopic composition of canid bones to explore their usefulness as proxies for
geographic movement (e.g. trade of dogs or range of hunting territories).
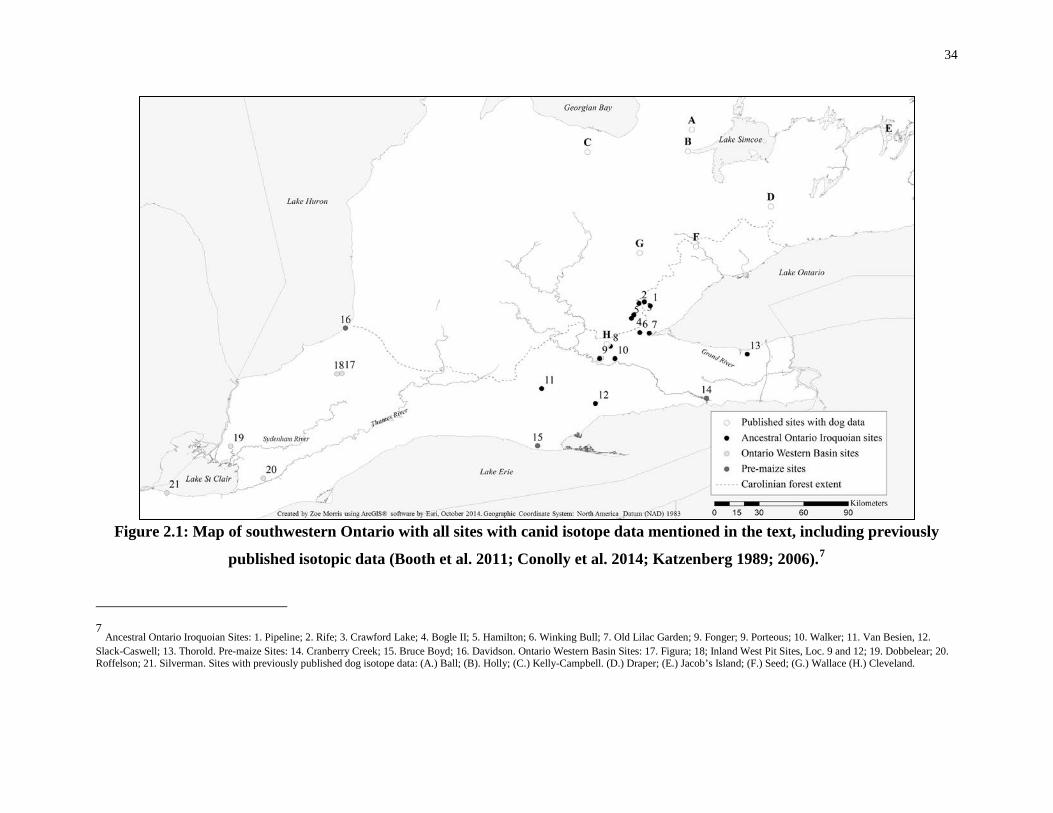
34
Figure 2.1: Map of southwestern Ontario with all sites with canid isotope data mentioned in the text, including previously
published isotopic data (Booth et al. 2011; Conolly et al. 2014; Katzenberg 1989; 2006).7
7 Ancestral Ontario Iroquoian Sites: 1. Pipeline; 2. Rife; 3. Crawford Lake; 4. Bogle II; 5. Hamilton; 6. Winking Bull; 7. Old Lilac Garden; 9. Fonger; 9. Porteous; 10. Walker; 11. Van Besien, 12. Slack-Caswell; 13. Thorold. Pre-maize Sites: 14. Cranberry Creek; 15. Bruce Boyd; 16. Davidson. Ontario Western Basin Sites: 17. Figura; 18; Inland West Pit Sites, Loc. 9 and 12; 19. Dobbelear; 20. Roffelson; 21. Silverman. Sites with previously published dog isotope data: (A.) Ball; (B). Holly; (C.) Kelly-Campbell. (D.) Draper; (E.) Jacob’s Island; (F.) Seed; (G.) Wallace (H.) Cleveland.
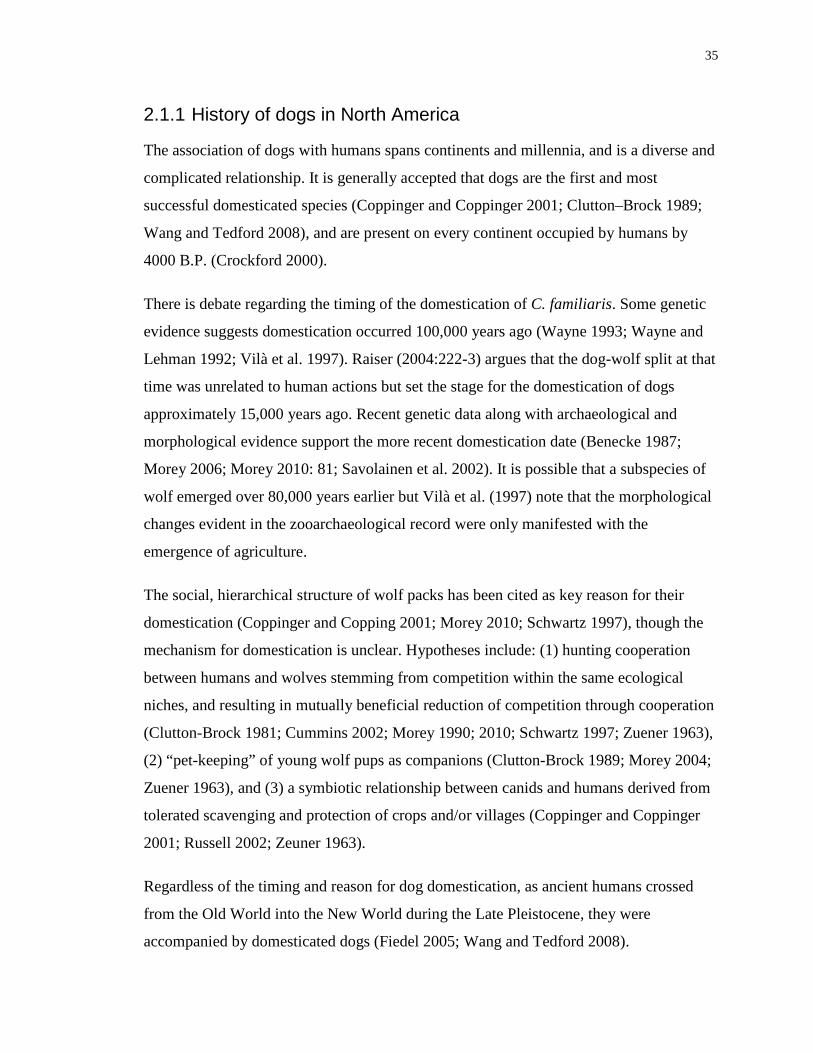
35
2.1.1 History of dogs in North America
The association of dogs with humans spans continents and millennia, and is a diverse and
complicated relationship. It is generally accepted that dogs are the first and most
successful domesticated species (Coppinger and Coppinger 2001; Clutton–Brock 1989;
Wang and Tedford 2008), and are present on every continent occupied by humans by
4000 B.P. (Crockford 2000).
There is debate regarding the timing of the domestication of C. familiaris. Some genetic
evidence suggests domestication occurred 100,000 years ago (Wayne 1993; Wayne and
Lehman 1992; Vilà et al. 1997). Raiser (2004:222-3) argues that the dog-wolf split at that
time was unrelated to human actions but set the stage for the domestication of dogs
approximately 15,000 years ago. Recent genetic data along with archaeological and
morphological evidence support the more recent domestication date (Benecke 1987;
Morey 2006; Morey 2010: 81; Savolainen et al. 2002). It is possible that a subspecies of
wolf emerged over 80,000 years earlier but Vilà et al. (1997) note that the morphological
changes evident in the zooarchaeological record were only manifested with the
emergence of agriculture.
The social, hierarchical structure of wolf packs has been cited as key reason for their
domestication (Coppinger and Copping 2001; Morey 2010; Schwartz 1997), though the
mechanism for domestication is unclear. Hypotheses include: (1) hunting cooperation
between humans and wolves stemming from competition within the same ecological
niches, and resulting in mutually beneficial reduction of competition through cooperation
(Clutton-Brock 1981; Cummins 2002; Morey 1990; 2010; Schwartz 1997; Zuener 1963),
(2) “pet-keeping” of young wolf pups as companions (Clutton-Brock 1989; Morey 2004;
Zuener 1963), and (3) a symbiotic relationship between canids and humans derived from
tolerated scavenging and protection of crops and/or villages (Coppinger and Coppinger
2001; Russell 2002; Zeuner 1963).
Regardless of the timing and reason for dog domestication, as ancient humans crossed
from the Old World into the New World during the Late Pleistocene, they were
accompanied by domesticated dogs (Fiedel 2005; Wang and Tedford 2008).
36
Mitochondrial DNA from Alaskan and Central American dogs demonstrates that New
World dogs originated from several lineages of Old World dogs (Leonard et al. 2002).
Humans and dogs spread rapidly and successfully across many parts of North, Central
and South America (Lupo and Janetski 1994; Raiser 2004; Schwartz 1997). The earliest
remains of domestic dogs in North America are found in the northwest at Old Crow in the
Yukon Territory dated to 11,450–12,660 B.P. and in Fairbanks, Alaska, dated to 10,000
B.P. (Beebe 1980; Olsen 1985). By 7000 B.P., dogs are found in Illinois (Morey and
Waint 1992), Wyoming (Walker and Frison 1982), Idaho (Yohe and Pauesic 2000, Haag
1970, Lawrence 1967; 1968) and as far south as Arizona (Warren 2000). While dogs are
presumed to be present in Ontario during the Paleo–Indian Phase (pre–10,000 B.P.),
preserved dog remains are not found until the Ontario Archaic period (10,000–3000 B.P.)
(Birzinski and Savage 1983; Oberholtzer 2002).
2.1.2 Dogs and other canids in the Great Lakes region “The dogs in this country howl rather than bark, and all have upright ears like foxes, but
in other respects all are like the moderate–sized mastiffs of our villagers. They are used
instead of sheep to be eaten at feast, they bring the moose to bay and discover the
animals’ lair, and they cost their master very little... On different occasions I have been
present at feasts of dog. I freely admit that at first it was abhorrent to me, but I had not
eaten of the meat twice before I found it good, with a taste rather like pork; moreover
(like pigs) their [dog’s] most usual fare is nothing but the refuse they find in the streets
and on the roads. They [dogs] also very frequently put their pointed nose into the
savages' pot of sagamité: but it is not thought to be less' clean on that account”
Wrong 1939:226 from Sagard’s 1632 The Long Journey into the Country of the Huron
Domesticated dogs (C. familiaris), gray wolves (C. lupus) and foxes (V. vulpes and U.
cinereoargenteus) co-habited southwestern Ontario prior to European contact, but
coyotes (C. latrans) were absent in the region until two centuries after Europeans arrived
(Geese and Bekoff 2004; Gomper 2002). Figure 2.2 provides the taxonomic relationships
for extant canids in southwestern Ontario. Allen (1920) documented seventeen breeds of
indigenous dogs present in the New World. In the Northeastern Woodland region, the
“Larger or Common Indian Dog” (see also, the “North American” dog, “C. canadensis”

37
identified by Richardson 1829:80–2) was present (Allen 1920:457; Cummins 2002;
Richardson 1829) and was significantly smaller than the Inuit dogs to the north (Allen
1920:462; Richardson 1829 80–82). The smaller “Short–legged Indian Dog” may also be
present in Ontario as remains of this variety were found in Ohio (Allen 1920). The
possibility of wolf–dog hybrids exists according to some accounts (Barton 1805;
Richardson 1829) as all members of the genus Canis are inter–fertile (Schwartz 1997).
As the only domesticated animal in pre-contact Ontario (Cummins 2002; Ferris 1989;
Thwaites 1896–1901 2), dogs served a variety of roles among the indigenous peoples of
the Great Lakes. They were companions and protectors (Cummins 2002; Richardson
1829; Thwaites 1896–1901 23), hunting partners (Thwaites 1896–1901 1; 2; 60; Barton
1805) and components of ritual and feasts (Birzinski and Savage 1983; Oberholtzer 2002;
Thwaites 1896–1901; 20). The role of dogs among Iroquoian groups, such as the Huron,
is well-established in ethnohistoric accounts (Harrington 1921; Katzenberg 1989;
Katzenberg 2006; Oberholtzer 2002; Wrong 1939) but the role dogs played among
Ontario Western Basin peoples is not as well understood.
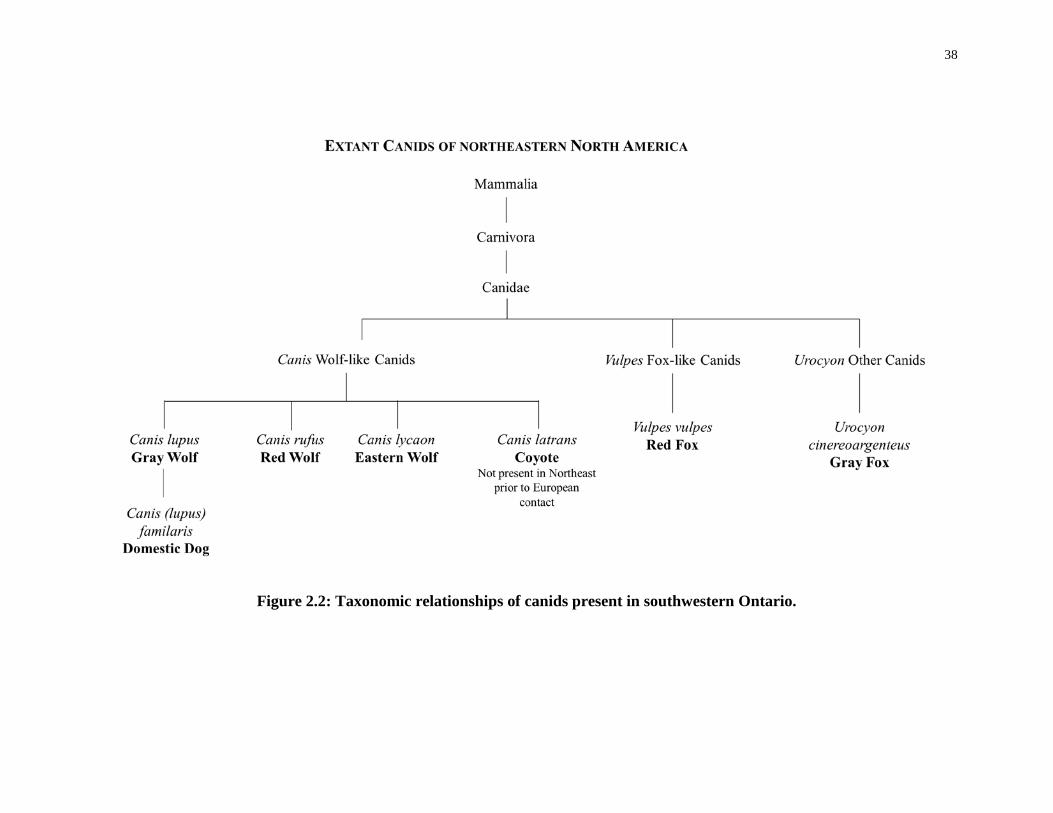
38
Figure 2.2: Taxonomic relationships of canids present in southwestern Ontario.
39
Dogs around the world are often both simultaneously revered and a practical food source
(Schwartz 1997; Morey 2010). Schwartz (1997:62) attributes the “mystification” of dog
consumption to the social nature of dogs and the personal bonds they form with humans
compared with other modern domesticates. Globally dogs are also the most common
animals used in sacrifice, and there is extensive ethnohistoric and archaeological
evidence of dog consumption among Eastern Woodland groups, often within a ritualized
context (Blau 1964; Brizinkski 1979; Brizinski and Savage 1983; Oberholtzer 2002;
Thwaites 1896–1901 23; Wrong 1939). Sagard describes their consumption as well as the
purposeful fattening of dogs for ceremonies:
“But they will only feed dogs, and sometimes young bears for important feasts, because
their flesh is very good; and, in order to have it ready they fatten them…. they give them
the remains of their sagamite [a stew of corn and grease] to eat.” (Wrong 1939:220).
Further, dog consumption in this area was often associated with specific events, such as
marriage (Wrong 1939; Schwartz 1997; 2002), departure for hunts, voyages or battle
(Cummins 2002; Kurath et al. 2009), and for healing the sick and injured (Thwaites
1896–1901:43; 60; Wrong 1939). Archaeologists now anticipate the presence of dog
burials (often attributed to ritual or social contexts) on Late Woodland sites because they
are so ubiquitous (Smith 2000).
Great Lakes mythologies provide further insight into the ambiguous ideological role of
dogs (i.e., wild versus tame) (Schwartz 1997). By occupying the liminal space between
the forest and village, dogs were regarded as ideal mediators between the worlds of man
and animals because they possessed both human and animal traits (Engelbrecht 2003;
Cantwell 1980). For example, some mythologies describe dogs as having souls that pass
into the afterlife (Schwartz 1997). For these reasons, among the Iroquois, dogs could be
substituted for humans in ceremonial sacrifices (Russell 2012), and the dog sacrifices of
both the Algonkian and Iroquoian peoples were always made to the “Great Spirit”
(Obeholtzer 2002:9). Numerous sacred legends from the northeastern region include
dogs, foxes and wolves (Brehm 2011; Bruchac 1995; Engelbrecht 2003; Kurath et al.
2009), and clan names and effigies provide further evidence of the symbolic significance
40
of canids in Great Lakes spiritualism (Dawson 1966; Ellis 2002; Lennox 2004; Mathews
1980; Parmalee and Stephens 1972; Parmenter 2010). For example there is the thieving
(or resourceful) fox in Ho–chunk, Ojibwe and Anisinâbe legends (see for example the
stories by Hágaga, Wâsāgunäckang and Johnston collected by Brehm 2011). Wolves are
often described as the wild analogs of dogs and are fiercely loyal to humans as
exemplified by stories of the Anisinâbe, Ojibwe and Winnebago (see for example Brehm
2011). The story of “How Graywolf Became Guardian of the World” (Smith 1997) is an
illustration of the sacred place of wolves as the protagonist that is simultaneously wild
and connected with humans: “Gray wolf is free, and his call is always heard the world
over, for he is the mightiest wolf of them all. He is the protector of the human race”
(Brehm 2011:364–5). Russell (2012) noted that the ideological value of wolves may
account for their rarity in the archaeological record, as there are often taboos against
killing them, except for symbolic purposes, or for self-protection or protection of food
resources. Understanding the spiritual and practical roles of canids among Late
Woodland people is critical for interpreting patterns of food access, hunting choice and
discard practices (i.e., purposeful burial versus placement in middens).
Published faunal data demonstrate the limited role of foxes and gray wolves as hunted
species (Foreman 2011; Lennox 1977; Stewart 1991; 2000). The majority of canid
remains found at Ontario Iroquoian and Western Basin sites are C. familiaris (domestic
dogs) or Canis sp., and the majority of Canis sp. remains are probably domestic dogs
(Foreman, personal communication 2013). Foxes are more ubiquitous than wolves at
Ontario Iroquoian sites but are relatively rare at Western Basin sites. No known wolves
have been recorded in the Western Basin faunal assemblage data.
2.1.3 Dogs as proxies for human diet
Burleigh and Brothwell (1978) were the first to use isotopic analyses of domesticated dog
remains as proxies for human diet. They noted an unexpected enrichment in carbon-13 in
3000 year old Peruvian dog hair and suggested the dogs had consumed large quantities of
maize, positing that dogs, humans and other fauna could be used as supportive evidence
of maize cultivation in the past. Since 1978, stable isotopic analyses of dogs have
successfully provided evidence of: production of maize and other plant domesticates

41
(Allitt et al. 2008; Bentley et al 2005; 1978; Hogue 2003; 2006), trends in marine
subsistence economy (Cannon et al. 1999; Clutton–Brock and Noe–Nygaard 1990;
Fischer et al. 2007; Guiry and Graves 2013; Rick et al. 2011; Schulting and Richards
2002) and canid-human relations, e.g., ritual uses of dogs (Booth et al. 2011; White
2004a; White et al. 2001, 2004b). Guiry (2012:352) recently coined the term, “canine
surrogacy approach (CSA),” by which he asserts that isotopic analyses of dogs can
provide an analog for human subsistence practices that is either direct (e.g. dogs are
“source” information regarding human diet) or indirect (e.g., dogs provide evidence of
specific food procurement behaviour, such as maize cultivation). The assumptions
underlying the belief that dogs can serve as proxies for human diet are: (1) dogs and
humans are metabolically similar and incorporate isotopes in a similar manner, and (2)
dogs would have accessed the same foods as their human companions either as
scavengers of food waste or human faeces (coprophagy), or through purposeful feeding
by humans (Alitt et al. 2008; Cannon et al. 1999; Guiry 2012; Katzenberg 1989:
Tankerslay and Koster 2009). Intentional feeding of dogs may imply: (1) care and
affection of a companion “pet”, guardian and/or hunting partner, (2) fattening for use as
food, or (3) preparation for specific ritual or ceremonial contexts, whether or not the dog
was to be eaten (Olsen 2000; White et al. 2001). Currently there are no studies examining
the metabolic comparability of human and dog isotopic fractionation and incorporation of
isotopes into tissues so it is not possible to directly assess this assumption. The
assumption that dogs have access to human food should be established for each
archaeological context independently.
2.2 Materials and methods
2.2.1 Stable isotopes
As an organism interacts with its environment by drinking and eating, it incorporates the
stable isotopic composition of ingested substances into its tissues. The stable isotopic
compositions of animal tissues are expressed as δ–values in per mil (‰), using the
formula (after McKinney et al. 1950:730):
δ = (Rsample/Rstandard) / Rstandard [Equation 2.1]
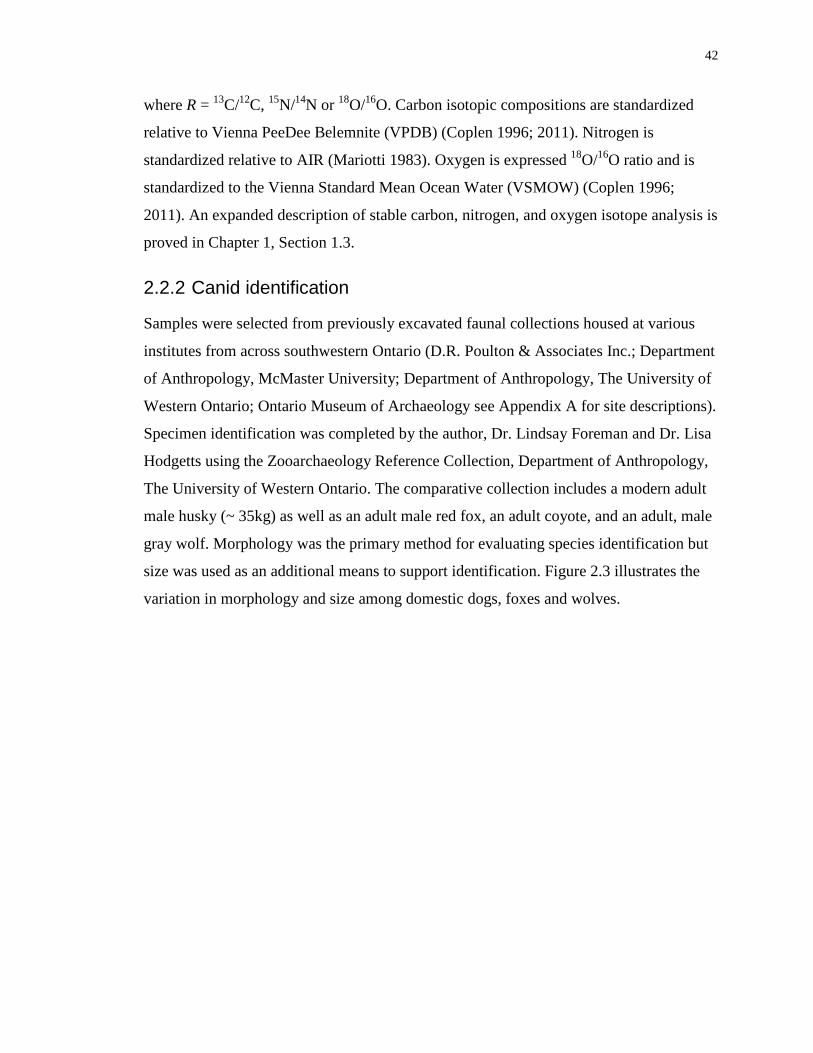
42
where R = 13C/12C, 15N/14N or 18O/16O. Carbon isotopic compositions are standardized
relative to Vienna PeeDee Belemnite (VPDB) (Coplen 1996; 2011). Nitrogen is
standardized relative to AIR (Mariotti 1983). Oxygen is expressed 18O/16O ratio and is
standardized to the Vienna Standard Mean Ocean Water (VSMOW) (Coplen 1996;
2011). An expanded description of stable carbon, nitrogen, and oxygen isotope analysis is
proved in Chapter 1, Section 1.3.
2.2.2 Canid identification
Samples were selected from previously excavated faunal collections housed at various
institutes from across southwestern Ontario (D.R. Poulton & Associates Inc.; Department
of Anthropology, McMaster University; Department of Anthropology, The University of
Western Ontario; Ontario Museum of Archaeology see Appendix A for site descriptions).
Specimen identification was completed by the author, Dr. Lindsay Foreman and Dr. Lisa
Hodgetts using the Zooarchaeology Reference Collection, Department of Anthropology,
The University of Western Ontario. The comparative collection includes a modern adult
male husky (~ 35kg) as well as an adult male red fox, an adult coyote, and an adult, male
gray wolf. Morphology was the primary method for evaluating species identification but
size was used as an additional means to support identification. Figure 2.3 illustrates the
variation in morphology and size among domestic dogs, foxes and wolves.
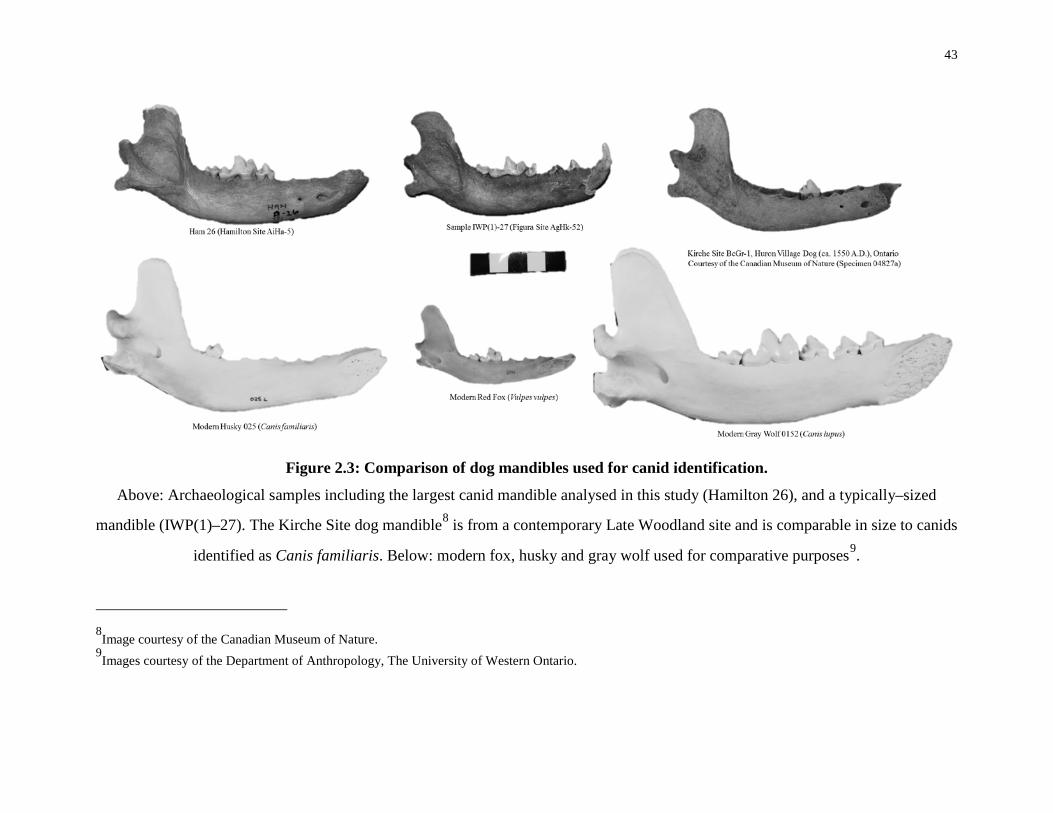
43
Figure 2.3: Comparison of dog mandibles used for canid identification.
Above: Archaeological samples including the largest canid mandible analysed in this study (Hamilton 26), and a typically–sized
mandible (IWP(1)–27). The Kirche Site dog mandible8 is from a contemporary Late Woodland site and is comparable in size to canids
identified as Canis familiaris. Below: modern fox, husky and gray wolf used for comparative purposes9.
8Image courtesy of the Canadian Museum of Nature. 9Images courtesy of the Department of Anthropology, The University of Western Ontario.
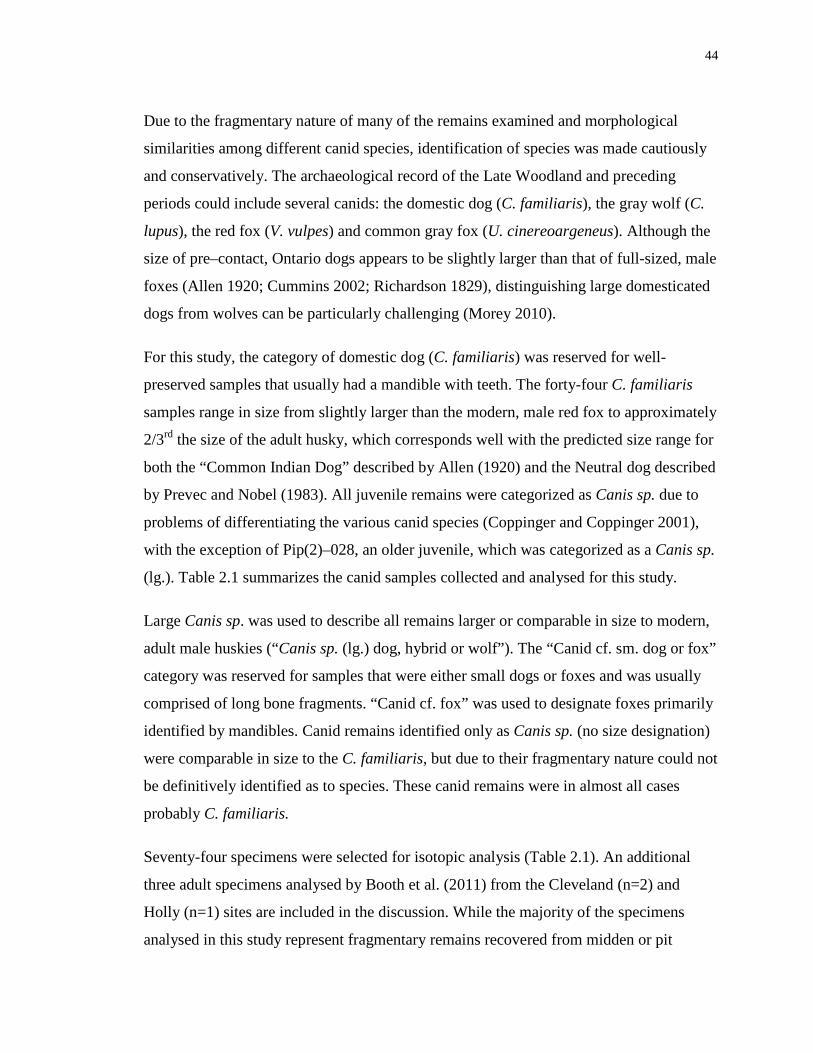
44
Due to the fragmentary nature of many of the remains examined and morphological
similarities among different canid species, identification of species was made cautiously
and conservatively. The archaeological record of the Late Woodland and preceding
periods could include several canids: the domestic dog (C. familiaris), the gray wolf (C.
lupus), the red fox (V. vulpes) and common gray fox (U. cinereoargeneus). Although the
size of pre–contact, Ontario dogs appears to be slightly larger than that of full-sized, male
foxes (Allen 1920; Cummins 2002; Richardson 1829), distinguishing large domesticated
dogs from wolves can be particularly challenging (Morey 2010).
For this study, the category of domestic dog (C. familiaris) was reserved for well-
preserved samples that usually had a mandible with teeth. The forty-four C. familiaris
samples range in size from slightly larger than the modern, male red fox to approximately
2/3rd the size of the adult husky, which corresponds well with the predicted size range for
both the “Common Indian Dog” described by Allen (1920) and the Neutral dog described
by Prevec and Nobel (1983). All juvenile remains were categorized as Canis sp. due to
problems of differentiating the various canid species (Coppinger and Coppinger 2001),
with the exception of Pip(2)–028, an older juvenile, which was categorized as a Canis sp.
(lg.). Table 2.1 summarizes the canid samples collected and analysed for this study.
Large Canis sp. was used to describe all remains larger or comparable in size to modern,
adult male huskies (“Canis sp. (lg.) dog, hybrid or wolf”). The “Canid cf. sm. dog or fox”
category was reserved for samples that were either small dogs or foxes and was usually
comprised of long bone fragments. “Canid cf. fox” was used to designate foxes primarily
identified by mandibles. Canid remains identified only as Canis sp. (no size designation)
were comparable in size to the C. familiaris, but due to their fragmentary nature could not
be definitively identified as to species. These canid remains were in almost all cases
probably C. familiaris.
Seventy-four specimens were selected for isotopic analysis (Table 2.1). An additional
three adult specimens analysed by Booth et al. (2011) from the Cleveland (n=2) and
Holly (n=1) sites are included in the discussion. While the majority of the specimens
analysed in this study represent fragmentary remains recovered from midden or pit
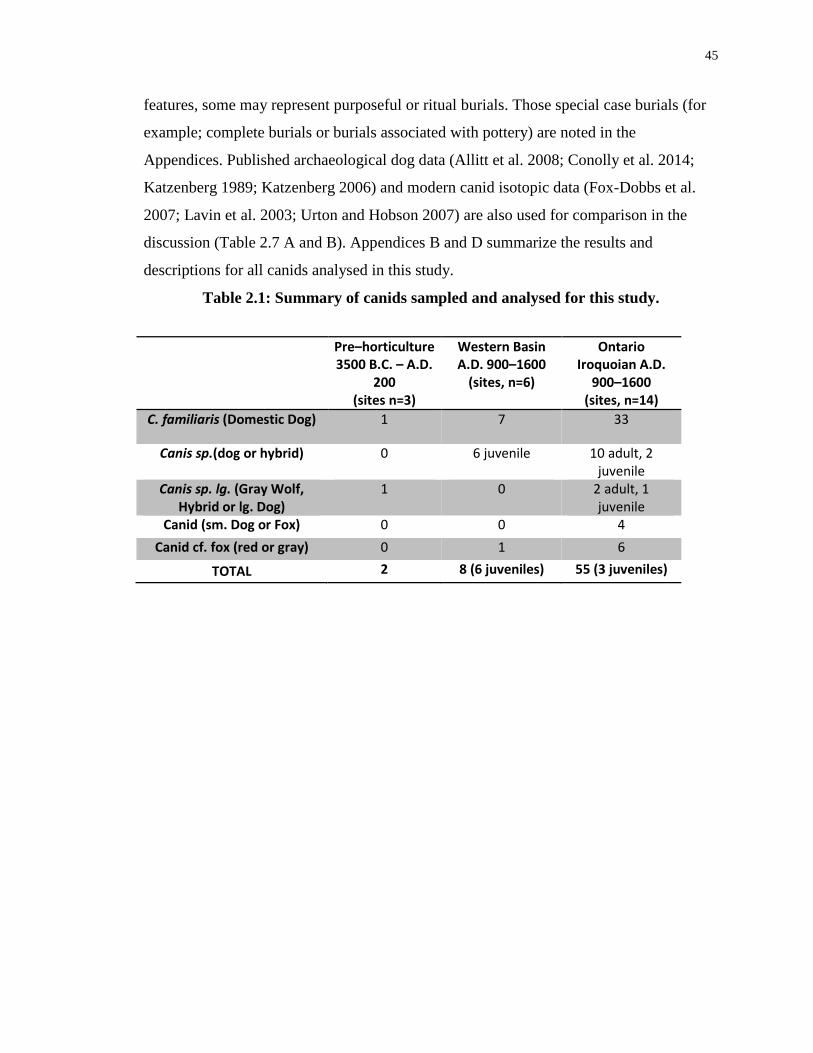
45
features, some may represent purposeful or ritual burials. Those special case burials (for
example; complete burials or burials associated with pottery) are noted in the
Appendices. Published archaeological dog data (Allitt et al. 2008; Conolly et al. 2014;
Katzenberg 1989; Katzenberg 2006) and modern canid isotopic data (Fox-Dobbs et al.
2007; Lavin et al. 2003; Urton and Hobson 2007) are also used for comparison in the
discussion (Table 2.7 A and B). Appendices B and D summarize the results and
descriptions for all canids analysed in this study.
Table 2.1: Summary of canids sampled and analysed for this study.
Pre–horticulture 3500 B.C. – A.D.
200 (sites n=3)
Western Basin A.D. 900–1600
(sites, n=6)
Ontario Iroquoian A.D.
900–1600 (sites, n=14)
C. familiaris (Domestic Dog) 1 7 33
Canis sp.(dog or hybrid) 0 6 juvenile 10 adult, 2 juvenile
Canis sp. lg. (Gray Wolf, Hybrid or lg. Dog)
1 0 2 adult, 1 juvenile
Canid (sm. Dog or Fox) 0 0 4 Canid cf. fox (red or gray) 0 1 6
TOTAL 2 8 (6 juveniles) 55 (3 juveniles)
46
2.2.3 Bulk bone sampling
Samples were selected based on availability and varied by bone type (e.g. mandible,
tibia), side (left or right), preservation state and size (complete or fragmentary). In the
case of complete bones or large bone fragments, a piece of the bone (approximately
500mg) was removed using a handheld Dremel. All efforts to preserve the integrity of the
remaining bone for future study were made. All bones were gently cleaned with a brush
and distilled water and allowed to dry overnight at room temperature.
Trabecular bone was separated from the cortical bone using clean dental instruments. The
remaining 300–500mg piece of cortical bone was crushed with a porcelain mortar and
pestle and put through a set of sieves. Powdered bone was collected at three intervals: (1)
180 to 850 µm (for collagen analysis), 2) 63 to 180 µm (for carbonate analysis) and (3)
45 to 63 µm (for FTIR analysis).
2.2.4 Stable isotopic analysis
All isotopic analyses were conducted at the Laboratory for Stable Isotope Science, in the
Department of Earth Sciences at The University of Western Ontario.
2.2.4.1 Collagen extraction protocol (δ13Ccol, δ15Ncol)
Bone collagen analysis involved multiphase tissue preparation to remove lipids,
inorganics and humics. The protocol used is a modification of Longin’s (1971) collagen
extraction method (Szpak et al. 2009). Crushed bone samples were weighed and placed in
vials. A 2:1 chloroform:methanol solution was used to extract lipids (adapted from the
method of Bligh and Dyer 1959; Kates 1986). The inorganic portion of the bone or tooth
was removed by treating the samples with 0.50M HCl at room temperature. The slow
demineralization of the bioapatite took several days. Bone samples were deemed
demineralized when fragments felt gelatinous and formed pseudomorphs. Once the
demineralized tissue was rinsed, humic acids and soil contaminants were removed using
multiple 0.1M NaOH washes.
47
The extracted collagen was then made water–soluble by heating the samples in slightly
acidic water in order to produce a collagen “gelatin” (Chisholm 1989:14). The water–
soluble collagen was carefully transferred into clean vials and dried. The dried collagen
was weighed to provide collagen yield. The extracted collagen was weighed (0.390 ±
0.01 mg) into 3.5 x 5.0 mm tin capsules, which were introduced into the Costech
Elemental Combustion System (ECS 4010) coupled to the Delta V Plus Isotope Ratio
Mass spectrometer for isotopic measurements.
The collagen provided δ13Ccol and δ15Ncol values as well as the carbon and nitrogen
content, which was used to calculate its C:N ratio. The δ13Ccol values were calibrated to
Vienna Pee Dee Belemnite (VPDB) using the standards USGS-40 (accepted value, –
26.39‰), and USGS-41(accepted value = +37.63 ‰). The δ15Ncol values were calibrated
to AIR using USGS-40 and USGS-41 (accepted values = –4.52 ‰ and +47.57 ‰,
respectively), following Coplen (1994) and Coplen et al. (2006). An internal laboratory
standard, Keratin (#90211, MP Biomedicals), was analysed approximately every fifth
sample to determine the accuracy and precision of the collagen analysis. Both were very
good. The accepted keratin value for δ13Ccol is –24.04‰, which compares well with the
mean δ13Ccol value of –24.07 ± 0.08‰ (n=72) obtained here; for δ15Ncol the accepted
value for the keratin is 6.36‰, compared to the mean δ15Ncol value of 6.29 ± 0.17‰
(n=71) obtained here. Duplicates (i.e., replicate analyses of the same collagen extraction)
and method duplicates (i.e., a different extraction and analysis of collagen on the same
sample) were performed on ~10% of all samples. Method duplicates provided
reproducibility values of ± 0.07‰ for δ13Ccol and ± 0.05‰ for δ15Ncol. The analytical
precision for δ13Ccol duplicates was ±0.03‰, and for δ15Ncol was ±0.05‰.
2.2.4.2 Carbonate extraction protocol (δ13Csc, δ18Osc)
It was necessary to first determine whether or not tissue samples from all the animals
(i.e., including both mammals and birds) should be pre-treated to remove secondary
carbonates and organic matter. In order to determine this, Pre-treated versus untreated
data were compared for fifteen bone pairs (n=30), three antler pairs (n=6), and fifty-four
enamel pairs from twelve individuals (n=108). Pre-treatment of the structural carbonate
was necessary because some samples showed the presence of secondary carbonates.

48
Therefore all bone and enamel samples were pretreated using the protocols developed by
Lee-Thorp (1989) to remove organic material and secondary carbonates. Successful
removal of the secondary carbonates was confirmed by FTIR analysis.
The two-step process involved the removal of organic matter using an excess of 1%
reagent grade sodium hypochlorite, reacted with the powdered tissue at room temperature
for 72 hours with bone and 24 hours with enamel. Samples were then rinsed multiple
times with Millipore water to remove the sodium hypochlorite solution. Next, samples
were reacted with 0.1 M acetic acid for 4 hours at room temperature in order to remove
diagenetic (secondary) carbonates. The samples were again washed multiple times with
Millipore water and then freeze-dried overnight to remove the remaining moisture. The
pretreated samples were weighed (approximately 0.8–1.0mg) into Multiprep sample vials
and the isotopic composition of the structural carbonate was analysed using a Micromass
Multiprep autosampler attached to a VG Optima dual–inlet IRMS, following Metcalfe et
al. (2009).
The δ13Csc values were calibrated to Vienna Pee Dee Belemnite (VPDB), following
Coplen (1994), using the NBS–19 standard (accepted value of 1.95 ‰) and Suprapur
(accepted value of –35.28 ‰). The δ18O values were calibrated to Vienna Standard Mean
Ocean Water (VSMOW), following Coplen (1996), using NBS-19 and NBS-18 standards
(accepted values of 28.60 ‰ and +7.20 ‰, respectively). An internal laboratory calcite
standard, World Standard 1 (WS-1), was analysed approximately every fifteenth sample
in order to assess the accuracy and precision of the carbonate analyses. The mean δ13Csc
value of 0.80 ± 0.18‰ (n=33) and the mean δ18Osc value of 26.24 ± 0.17‰ (n=32)
compared favourably to the accepted WS-1 values of 0.76‰ and 26.23‰, respectively.
Carbonate pre-treatment duplicates and method duplicates were conducted ~10% of the
canid samples with a mean reproducibility of ±0.09‰ for δ13Csc and ±0.17‰ for δ18Osc.
The analytical precision for δ13Csc was ± 0.06‰ and for δ18Osc was ± 0.10‰.
2.2.4.3 Fourier transform infra-red spectroscopy (FTIR)
Prior to pre-treatment, Fourier transform infra-red (FTIR) spectroscopy was conducted
for all canid bone samples whose structural carbonate isotopic composition was to be
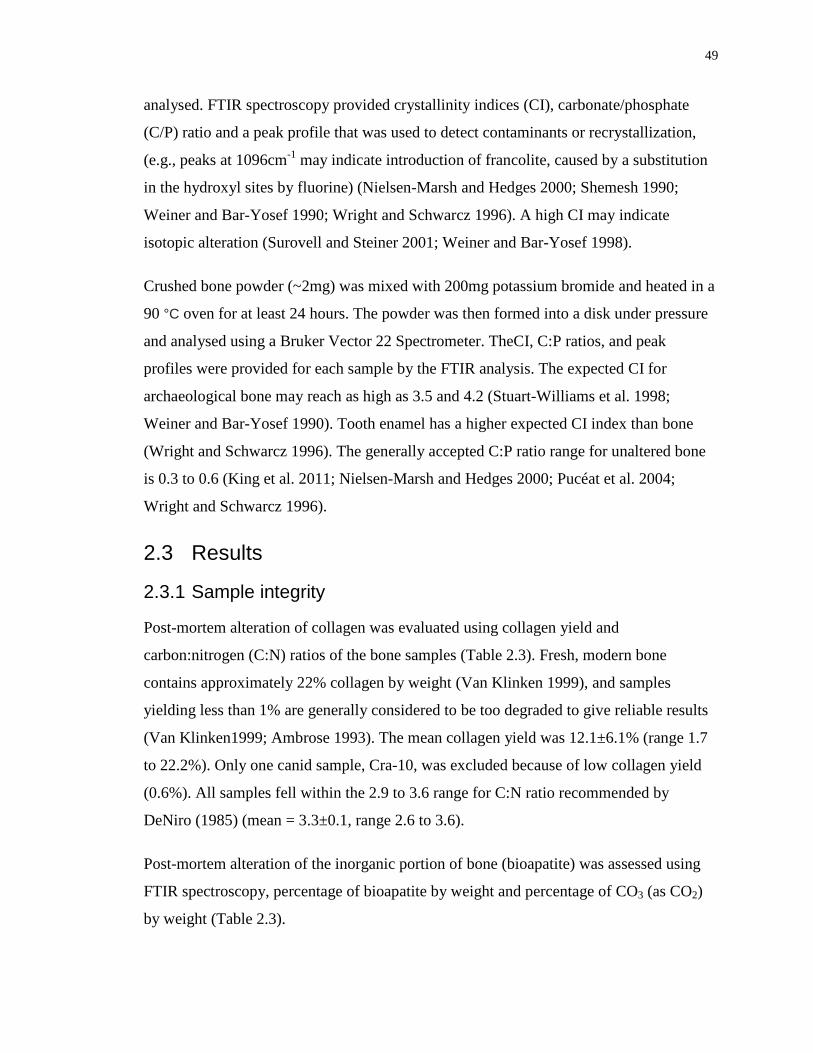
49
analysed. FTIR spectroscopy provided crystallinity indices (CI), carbonate/phosphate
(C/P) ratio and a peak profile that was used to detect contaminants or recrystallization,
(e.g., peaks at 1096cm-1 may indicate introduction of francolite, caused by a substitution
in the hydroxyl sites by fluorine) (Nielsen-Marsh and Hedges 2000; Shemesh 1990;
Weiner and Bar-Yosef 1990; Wright and Schwarcz 1996). A high CI may indicate
isotopic alteration (Surovell and Steiner 2001; Weiner and Bar-Yosef 1998).
Crushed bone powder (~2mg) was mixed with 200mg potassium bromide and heated in a
90 °C oven for at least 24 hours. The powder was then formed into a disk under pressure
and analysed using a Bruker Vector 22 Spectrometer. TheCI, C:P ratios, and peak
profiles were provided for each sample by the FTIR analysis. The expected CI for
archaeological bone may reach as high as 3.5 and 4.2 (Stuart-Williams et al. 1998;
Weiner and Bar-Yosef 1990). Tooth enamel has a higher expected CI index than bone
(Wright and Schwarcz 1996). The generally accepted C:P ratio range for unaltered bone
is 0.3 to 0.6 (King et al. 2011; Nielsen-Marsh and Hedges 2000; Pucéat et al. 2004;
Wright and Schwarcz 1996).
2.3 Results
2.3.1 Sample integrity
Post-mortem alteration of collagen was evaluated using collagen yield and
carbon:nitrogen (C:N) ratios of the bone samples (Table 2.3). Fresh, modern bone
contains approximately 22% collagen by weight (Van Klinken 1999), and samples
yielding less than 1% are generally considered to be too degraded to give reliable results
(Van Klinken1999; Ambrose 1993). The mean collagen yield was 12.1±6.1% (range 1.7
to 22.2%). Only one canid sample, Cra-10, was excluded because of low collagen yield
(0.6%). All samples fell within the 2.9 to 3.6 range for C:N ratio recommended by
DeNiro (1985) (mean = 3.3±0.1, range 2.6 to 3.6).
Post-mortem alteration of the inorganic portion of bone (bioapatite) was assessed using
FTIR spectroscopy, percentage of bioapatite by weight and percentage of CO3 (as CO2)
by weight (Table 2.3).
50
The FTIR analysis determined that the canid mean CI (2.74±0.16), and range (2.46 to
3.26) are comfortably below the accepted upper limit (Table 2.2), and so re-
crystallization is not indicated for any samples. The mean C:P ratio for the canid bone
samples was within the accepted range of 0.3 to 0.6 (0.53±0.33, range = 0.32 to 0.88) but
some canids (n=20) had C/P ratios >0.6. These samples were not rejected, however,
because their CI did not indicate re–crystallization and there is no evidence of
contaminants or recrystallization in their FTIR peak profiles. Further, a C:P comparison
between untreated and pretreated bone samples (n=26 canid sample pairs) showed that
pre-treatment lowered the C:P ratio for over 92% of the canids, shifting the mean C:P to a
mean of 0.33±0.08 and the range to 0.23 to 0.64 (Table 2.2). Finally, there were no
significant correlations between the canid CI values or C:P ratios and δ13Csc values. No
structural carbonate isotopic compositions were rejected based on the FTIR results
because: (1) the CI indices were acceptable for all canid samples, (2) there were no
unexpected peaks in the FTIR spectrum, and (3) pre-treatment lowered C:P ratios to
within the expected range.
Table 2.2: Summary of FTIR Crystallinity Indices (CI) and Carbonate/Phosphate
ratios (C/P) for canid bone samples before and after pre-treatment
Canids n mean±std dev (range) CI Before Pre-treatment 58 2.74 ±0.16 (2.46 to 3.26) CI After Pre-treatment 26 2.83 ±0.16 (0.32 to 0.88) C:P Before Pre-treatment 58 0.53 ±0.17 (2.48 to 3.28) C:P After Pre-treatment 26 0.33 ±0.08 (0.23 to 0.64)
Fresh bone has an expected bioapatite [Ca10(PO4)6(OH)2]) yield by weight between 70 –
75% (Ambrose 1993; Sillen 1989) to 90% (Lee-Thorp 1989). After removal of the
organic portion of the bone, the mean yield by weight for the canid bone was 72.3±7.6%
(range 46.3 to 90.7%). For pretreated bone samples the percentage of CO3 should range
from 2.0 to 7.9% (Lee-Thorp 1989; Lee-Thorp and Sponheimer 2003; Wright and
Schwarcz 1996) while enamel has a narrower range of 4.5 to 4.1% (Rink and Schwarcz
1995). The mean percentage of CO3 for canid samples fell within this range with a mean
of 5.99±1.22% (range = 2.50 to 7.90%). There were no significant correlations between
δ13Csc and δ18Osc values and percentage of inorganic content by weight or percentage of

51
CO3 by weight. Therefore, no isotopic data for structural carbonate samples were
rejected.
2.3.2 Adult canid remains isotope results
The isotopic data for adult and juvenile canids (all identified species together) are
summarized in Table 2.4 and a more comprehensive table including site dates and
references is presented in Appendices B and D. For the canids from pre A.D. 200 sites,
the mean δ13Ccol and δ15Ncol values were –21.32±0.76‰ and 9.35±1.37‰ respectively.
The mean δ13Csc and δ18Osc values were –10.21±2.85‰ and 21.39±1.83‰, respectively.
The mean Δ13Csc–col value was +9.87±1.87‰.
The overall mean isotopic compositions for the Ontario Iroquoian canids by species are
listed in Table 2.5 and visualized as box plots in Figure 2.4. The Ontario Iroquoian C.
familiaris had a mean δ13Ccol value of –12.57±1.44‰ and a mean δ15Ncol value of 9.46
±0.74‰. They also had a mean δ13Csc value of –6.55 ±1.42‰ with a mean Δ13Csc–col
value of +6.84±0.54‰, and the mean δ18Osc value was 21.08±1.18‰. For the Western
Basin sites, the mean δ–values were –14.03±1.45‰ for δ13Ccol, 10.25±0.76‰ for
δ15Ncol,–6.35±1.00‰ for δ13Csc and 21.23±1.02‰ for δ18Osc with a mean Δ13Csc–col value
of +7.48±3.89‰.
Nine Ontario Iroquoian specimens could not be identified beyond Canis sp., though most
likely represent C. familiaris based on size. Their mean δ13Ccol value was –12.04±1.79‰
and the mean δ15Ncol value was 9.50±0.56‰. The Canis sp. (n=8) had a mean δ13Csc of –
5.37±1.68‰ and a mean δ18Osc of 21.29±1.17‰. Six Ontario Iroquoian canids identified
as foxes had mean values of –18.81±0.66‰ for δ13Ccol and 8.81 ±0.90‰ for δ15Ncol.
Their mean δ–values were –10.20±1.89‰ for δ13Csc and 20.90±1.20‰ for δ18Osc. The
single Western Basin fox had δ13Ccol and δ15Ncol values of –19.34‰ and 8.74‰, and
δ13Csc and δ18Osc values of –10.37‰ and 20.61‰, respectively. Its Δ13Csc–col was
+8.92‰.
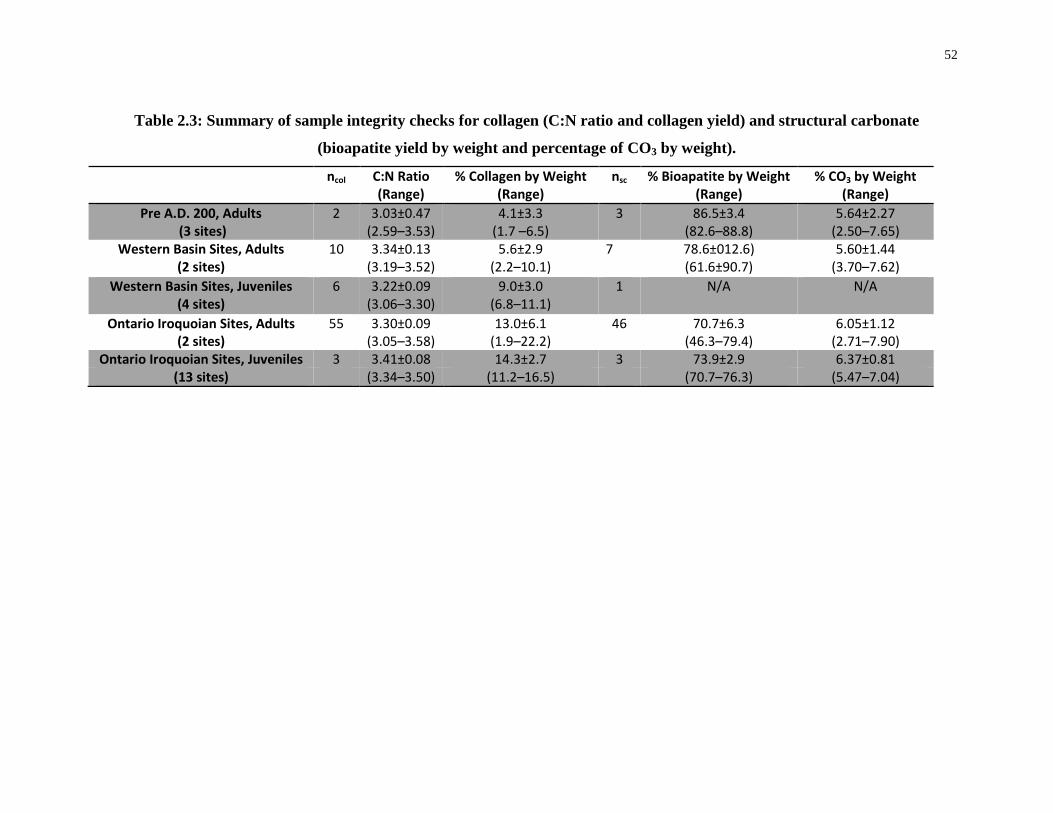
52
Table 2.3: Summary of sample integrity checks for collagen (C:N ratio and collagen yield) and structural carbonate
(bioapatite yield by weight and percentage of CO3 by weight).
ncol C:N Ratio (Range)
% Collagen by Weight (Range)
nsc % Bioapatite by Weight (Range)
% CO3 by Weight (Range)
Pre A.D. 200, Adults 2 3.03±0.47 4.1±3.3 3 86.5±3.4 5.64±2.27 (3 sites) (2.59–3.53) (1.7 –6.5) (82.6–88.8) (2.50–7.65)
Western Basin Sites, Adults 10 3.34±0.13 5.6±2.9 7 78.6±012.6) 5.60±1.44 (2 sites) (3.19–3.52) (2.2–10.1) (61.6±90.7) (3.70–7.62)
Western Basin Sites, Juveniles 6 3.22±0.09 9.0±3.0 1 N/A N/A (4 sites) (3.06–3.30) (6.8–11.1)
Ontario Iroquoian Sites, Adults 55 3.30±0.09 13.0±6.1 46 70.7±6.3 6.05±1.12 (2 sites) (3.05–3.58) (1.9–22.2) (46.3–79.4) (2.71–7.90)
Ontario Iroquoian Sites, Juveniles 3 3.41±0.08 14.3±2.7 3 73.9±2.9 6.37±0.81 (13 sites) (3.34–3.50) (11.2–16.5) (70.7–76.3) (5.47–7.04)
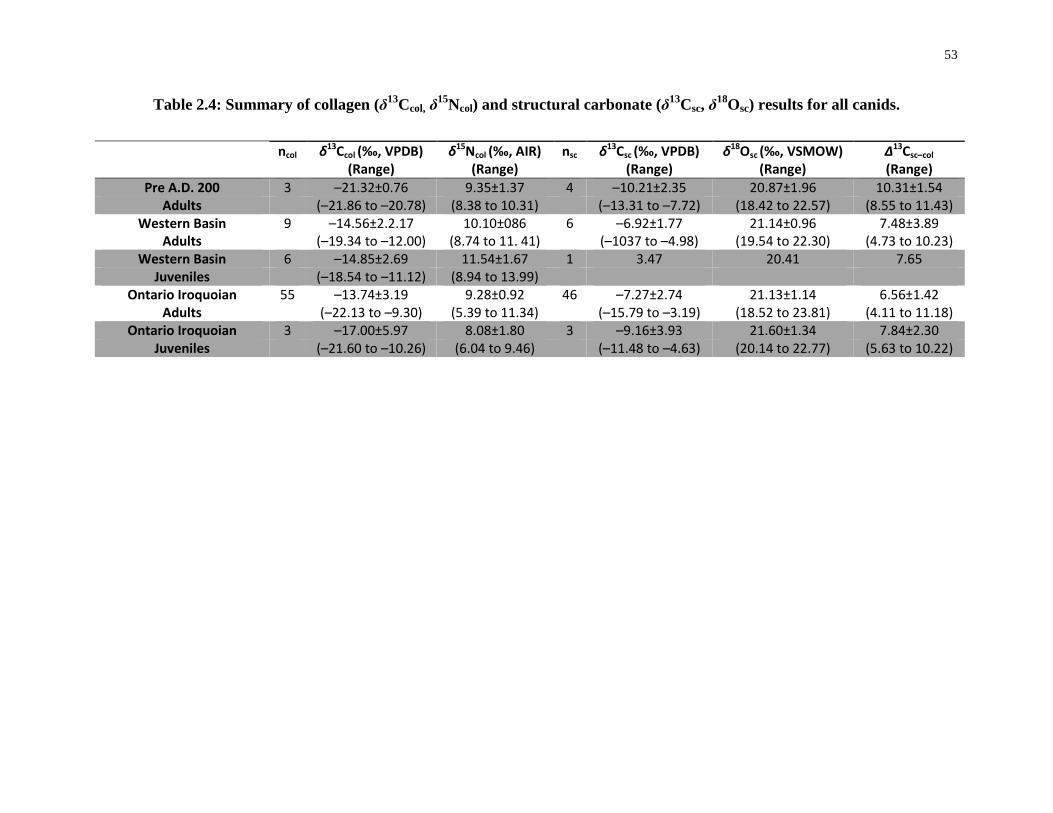
53
Table 2.4: Summary of collagen (δ13Ccol, δ15Ncol) and structural carbonate (δ13Csc, δ18Osc) results for all canids.
ncol δ13Ccol (‰, VPDB)
(Range) δ15Ncol (‰, AIR)
(Range) nsc δ13Csc (‰, VPDB)
(Range) δ18Osc (‰, VSMOW)
(Range) ∆13Csc–col
(Range) Pre A.D. 200 3 –21.32±0.76 9.35±1.37 4 –10.21±2.35 20.87±1.96 10.31±1.54
Adults (–21.86 to –20.78) (8.38 to 10.31) (–13.31 to –7.72) (18.42 to 22.57) (8.55 to 11.43) Western Basin 9 –14.56±2.2.17 10.10±086 6 –6.92±1.77 21.14±0.96 7.48±3.89
Adults (–19.34 to –12.00) (8.74 to 11. 41) (–1037 to –4.98) (19.54 to 22.30) (4.73 to 10.23) Western Basin 6 –14.85±2.69 11.54±1.67 1 3.47 20.41 7.65
Juveniles (–18.54 to –11.12) (8.94 to 13.99) Ontario Iroquoian 55 –13.74±3.19 9.28±0.92 46 –7.27±2.74 21.13±1.14 6.56±1.42 Adults (–22.13 to –9.30) (5.39 to 11.34) (–15.79 to –3.19) (18.52 to 23.81) (4.11 to 11.18)
Ontario Iroquoian 3 –17.00±5.97 8.08±1.80 3 –9.16±3.93 21.60±1.34 7.84±2.30 Juveniles (–21.60 to –10.26) (6.04 to 9.46) (–11.48 to –4.63) (20.14 to 22.77) (5.63 to 10.22)

54
Table 2.5: Summary of collagen (δ13Ccol, δ15Ncol) and structural carbonate (δ13Csc, δ18Osc) results for adult remains by species.
ncol δ13Ccol (‰, VPDB) (Range)
δ15Ncol (‰, AIR) (Range)
nsc δ13Csc (‰, VPDB) (Range)
δ18Osc (‰, VSMOW) (Range)
∆13Csc–col
(Range) Western Basin Sites, Adults 9 –14.03±1.45 10.25±0.76 6 –6.35±1.00 21.23±1.02 7.48±3.89
cf. C. familiaris (–16.29 to –12.00)
(8.99 to 11.41) (–7.54 to –4.98) (19.54 to 22.30) (4.73 to 10.23)
Western Basin Sites, Adults 1 –19.34 8.74 1 –10.37 20.61 8.97 Canid cf. fox
Ontario Iroquoian Sites, Adults, cf. C. familiaris
33 –12.57±1.44 9.46±0.74 27 –6.55±1.42 21.08±1.18 6.84±0.54
(–15.82 to –9.30) (7.87 to 11.34) (–9.32 to –4.42) (18.52 to 23.40) (6.41 to 7.45) Ontario Iroquoian Sites,
Adults, Canis sp. 9 –12.04±1.79 9.50±0.56 8 –5.37±1.68 21.29±1.17 6.89±0.81
(–14.78 to –10.14)
(8.13 to 9.98) (–7.49 to – 3.19) (19.81 to 23.81) (6.32 to 7.46)
Ontario Iroquoian Sites, Adults, Canid cf. fox
6 –18.81±0.67 8.81±0.90 6 10.26±1.82 20.91±1.18 7.98±1.62
(–19.67 to –17.95)
(7.57 to 10.30) (–13.03 to –8.58)
(19.39 to 22.39) (5.74 to 9.58)
Ontario Iroquoian Sites, Adults, Sm. Canid
4 –15.84±5.29 9.15±0.95 4 –9.79±5.47 20.81±0.75 6.04±0.53
(–21.22 to –11.19)
(7.88 to 10.14) (–15.79 to –4.69)
(19.85 to 21.50) (5.43 to 6.50)
Ontario Iroquoian Sites, Adults, Canis sp. lg.
2 –21.38±1.06 7.13±2.16 2 –12.15±1.70 22.28±1.24 9.23±2.76
(–22.13 to – 20.63)
(5.39 to 8.87) (–13.35 to –10.95)
(21.40 to 23.15) (7.28 to 11.18)
55
An additional four Ontario Iroquoian canids could not be differentiated as either fox or
small dog and had mean values of –15.84 ±5.29‰ for δ13Ccol and 9.13±0.90‰ for
δ15Ncol. The four small canids had mean δ13Csc and δ18Osc values of –9.79±5.47‰ and
20.81±0.75‰.
Two fragments from a large Canis sp. (large dog, dog–wolf hybrid or wolf based on size)
dated to the Late Woodland had δ13Ccol and δ15Ncol values of –21.38±1.06‰ and
7.13±2.46, and δ13Csc and δ18Osc values of –12.15±1.70‰ and 22.28±1.24‰.
For all the samples there was a significant correlation between δ13Ccol and δ15Ncol values
(Pearson’s r = 0.308, p=0.007) and δ13Ccol and δ13Csc values (Pearson’s r = 0.897,
p<0.000). Based on a one–way ANOVA, there are significant differences between the
cultural groups. A Dunnett T3 reveals that the pre-200 A.D. canid remains have
significantly lower δ13Ccol values compared to canids from the Late Woodland (A.D. 900
to 1650), Western Basin (p<0.000) and Ontario Iroquoian (p<0.000). The test also
demonstrated that the Western Basin adult canids had significantly higher δ15Ncol values
(Dunnett T3, p=0.003) relative to the adult Ontario Iroquoian canids.
2.3.3 Juvenile canid remains isotope results
Mean δ13Ccol and δ15Ncol values for the three Ontario Iroquoian juvenile Canis sp. samples
were –17.00 ±5.97‰ and 8.08±1.80‰. The mean δ13Csc and δ18Osc for the three Ontario
Iroquoian juvenile Canis sp. samples was –9.16±3.92‰ and 21.60±1.34‰ (Table 9).
Western Basin juvenile canids (n=6) had a mean δ13Ccol value of –14.85±2.69‰ and a
mean δ15Ncol value of 11.54 ±1.67‰. Structural carbonate was examined for only one
juvenile (fetal) Canis sp., which had δ13Csc and δ18Osc values of –3.47‰ and 20.41‰,
respectively. The mean Δ13Csc–col for the Ontario Iroquoian juvenile canids was
+7.84±2.30‰ and for the single Western Basin juvenile it was +7.65‰.
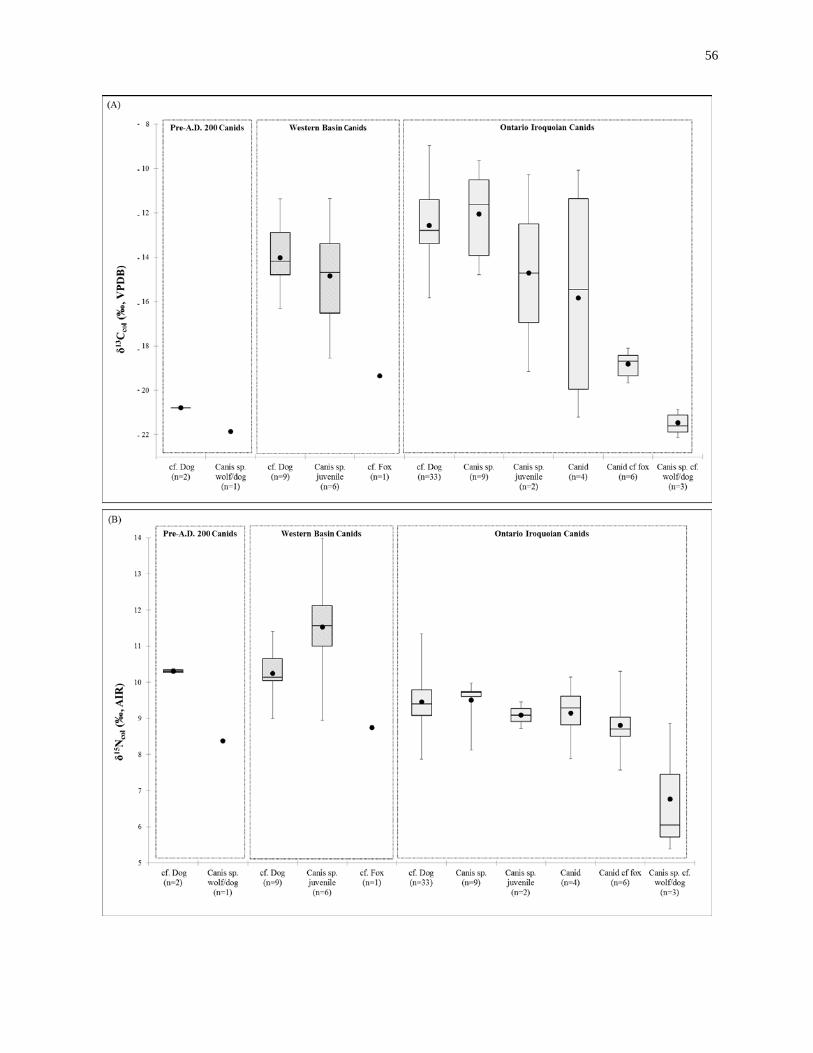
56
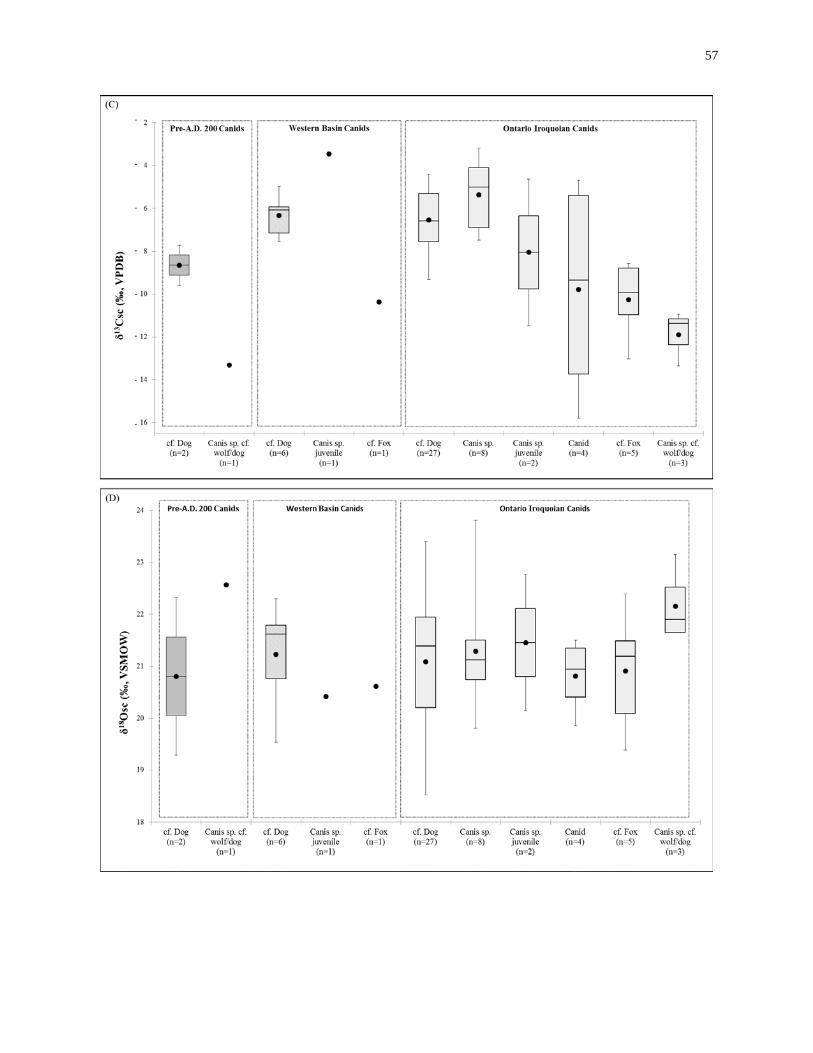
57
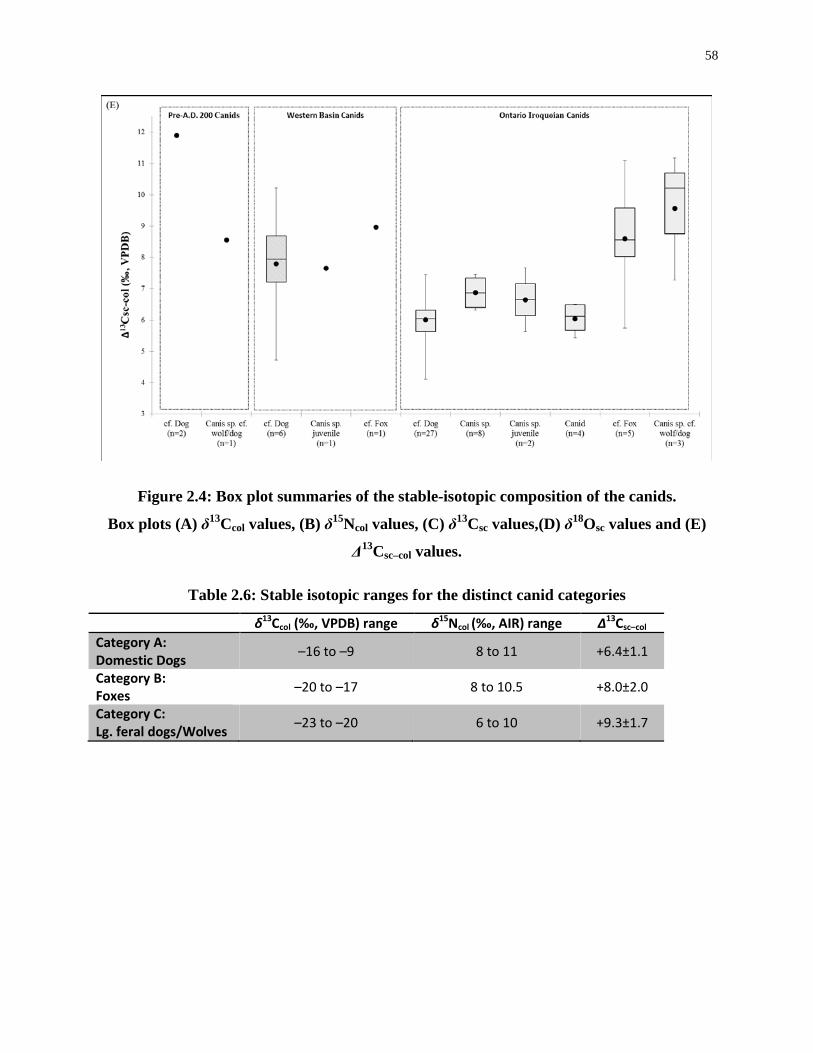
58
Figure 2.4: Box plot summaries of the stable-isotopic composition of the canids.
Box plots (A) δ13Ccol values, (B) δ15Ncol values, (C) δ13Csc values,(D) δ18Osc values and (E)
Δ13Csc–col values.
Table 2.6: Stable isotopic ranges for the distinct canid categories
δ13Ccol (‰, VPDB) range δ15Ncol (‰, AIR) range Δ13Csc–col Category A: Domestic Dogs –16 to –9 8 to 11 +6.4±1.1
Category B: Foxes –20 to –17 8 to 10.5 +8.0±2.0
Category C: Lg. feral dogs/Wolves –23 to –20 6 to 10 +9.3±1.7

59
2.4 Discussion This discussion is divided into several parts. First, the isotopic data for all adult canids
are compared with those from two modern dietary behavioural studies (Figure 2.7)
(Urton and Hobson 2006; Lavin et al. 2003) in order to describe and differentiate
ecological niches. Second, juvenile remains are examined separately. Third, the isotopic
data for adult domesticated dogs are compared to previously published isotopic data for
humans in order to determine whether the use of domestic dogs as proxies for human
subsistence practices is appropriate for this region. Finally, human–dog relationships are
compared with subsistence practices of Late Woodland Western Basin and Ontario
Iroquoian peoples within southwestern Ontario.
2.4.1 Identifying canid ecological niches
The variability in collagen isotopic compositions (δ13Ccol and δ15Ncol) of Late Woodland
Ontario canids suggests a wide range of dietary strategies (Table 2.5). Ontario mammals
with δ13Ccol values greater than –210‰ consumed some C4 foods, while those with values
lower than –21‰ have diets consistent with a pure C3 food web (Katzenberg 2006;
Morris unpublished data, this study). Osteological and collagen isotope data were used to
identify three categories of canids, each of which occupies a distinct ecological and/or
dietary niche (Table 2.6, Figure 2.5). Domesticated dogs have the greatest access to
maize, followed by foxes, and then feral canids who consumed little or no C4 foods. The
δ13Csc values (Figure 2.6) provided an additional means of indicating access to C4 foods
and trophic position. There is a significant difference in Δ13Csc–col values (Figure 2.4 (E),
Table 2.6) between domestic dogs (Category A) and both foxes (Category B) and feral
dogs/wolves (Category C) (Tukey HSD, p>0.000 and 0.006, respectively), which
indicates that domestic dogs were also more carnivorous.
2.4.1.1 Category A – domestic dogs
All the canids within Category A are definitively identified as domestic dogs (C.
familiaris) based on their morphology and isotopic compositions. These dogs are the
most isotopically distinct canids analysed for this study. Significantly enriched in 13C
60
(Tukey HSD, p>0.000), they are all maize consumers. The species identification of
domestic dog does not presume that all dogs were “pets” or actively kept. Some may have
been strays who were tolerated in or near villages. Modern wild canids have relatively
low δ15Ncol values (7.06±2.34‰) (Fox-Dobbs et al. 2007; Schwarcz et al. 1991; Urton
and Hobson 2007) compared to the archaeological dogs analysed in this study who, like
archaeological dogs in previous studies (9.57±0.78‰) (Katzenberg 1989: 2006),
consumed protein from a higher trophic level, such as freshwater fish. Such high trophic
level foods would only have been available if they were procured by humans. Wild
canids, such as foxes and wolves, rarely have access to freshwater fish in spite of being
flexible predators that consume hunted prey and carrion (Paradiso and Nowak 1982;
Samuel and Nelson 1982; Voigt 1987). Modern Ontario wolves do consume a terrestrial
meat-based diet but it is from a lower trophic level, i.e., up to 80% white-tailed deer
(Pimlott et al. 1967:71), and foxes are more flexible consumers who eat small prey and
foods like berries and insects (Samuel and Nelson 1982; Voigt 1987).
The δ13Csc values support the interpretation of significant maize consumption by some
Late Woodland dogs. Comparing the δ13Ccol and δ13Csc values also enables the separation
of dogs into two groups (Figure 2.6). Most of one group (Ai.) pre-date A.D. 1450
(hereafter referred to as Middle Ontario Iroquoian stage) and have significantly higher
δ13Csc (–6 to –3‰) and δ13Ccol values (> –12‰). Most of the second group (Aii.) post-
date A.D. 1450 (hereafter referred to as Neutral) and have significantly lower δ13Csc (–9
to –5‰) and δ13Ccol values (–16 to –12‰) (Tukey HSD, p>0.000). The isotopic
compositions of the Middle Ontario Iroquoian dogs correspond to those of their
contemporary humans, who have been interpreted as heavy maize-consumers (Harrison
and Katzenberg 2003; Katzenberg et al. 1985). The predominately Neutral group of
canids, however, has slightly lower δ13Ccol and δ13Csc values than humans, which suggests
less maize (C4) consumption. (A more detailed exploration of the anthropological
meaning of the dog data is provided below).
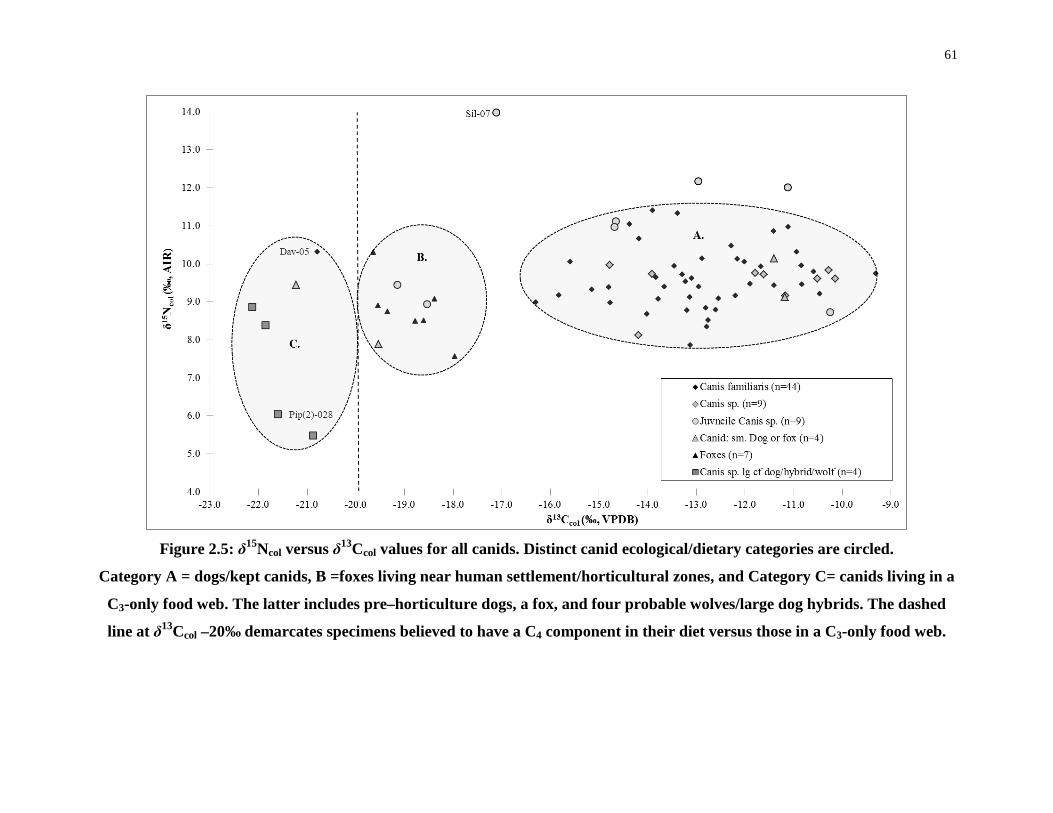
61
Figure 2.5: δ15Ncol versus δ13Ccol values for all canids. Distinct canid ecological/dietary categories are circled.
Category A = dogs/kept canids, B =foxes living near human settlement/horticultural zones, and Category C= canids living in a
C3-only food web. The latter includes pre–horticulture dogs, a fox, and four probable wolves/large dog hybrids. The dashed
line at δ13Ccol –20‰ demarcates specimens believed to have a C4 component in their diet versus those in a C3-only food web.
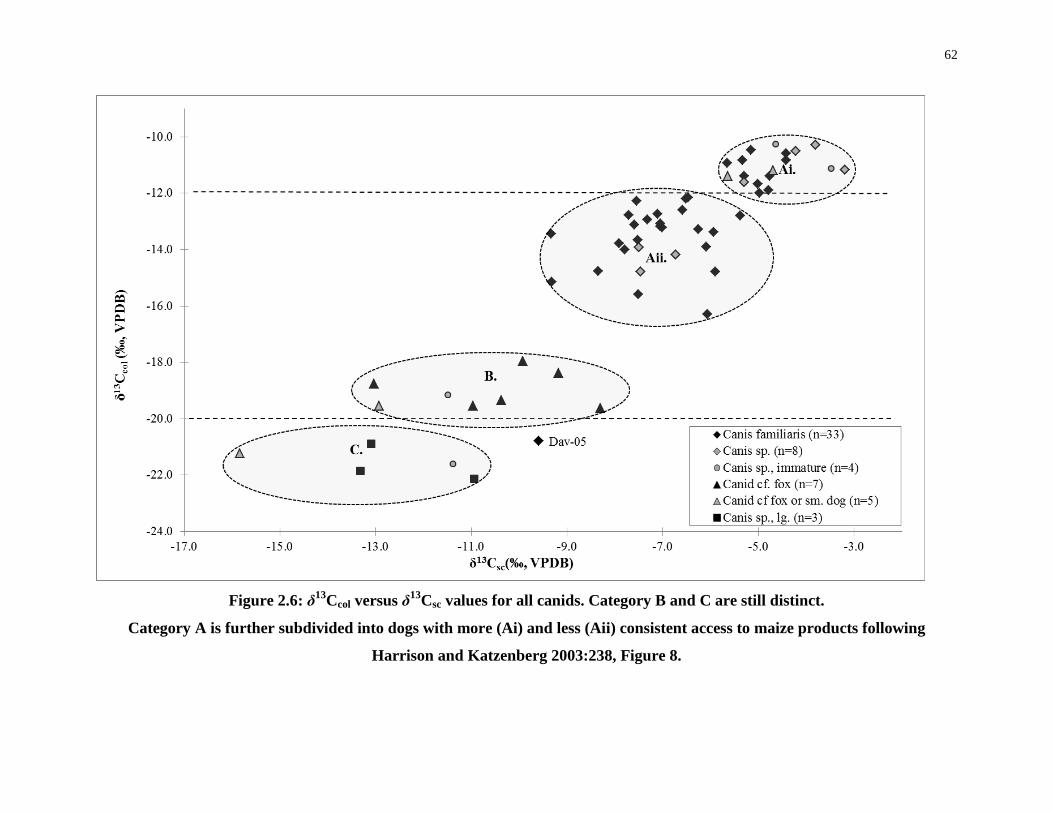
62
Figure 2.6: δ13Ccol versus δ13Csc values for all canids. Category B and C are still distinct.
Category A is further subdivided into dogs with more (Ai) and less (Aii) consistent access to maize products following
Harrison and Katzenberg 2003:238, Figure 8.
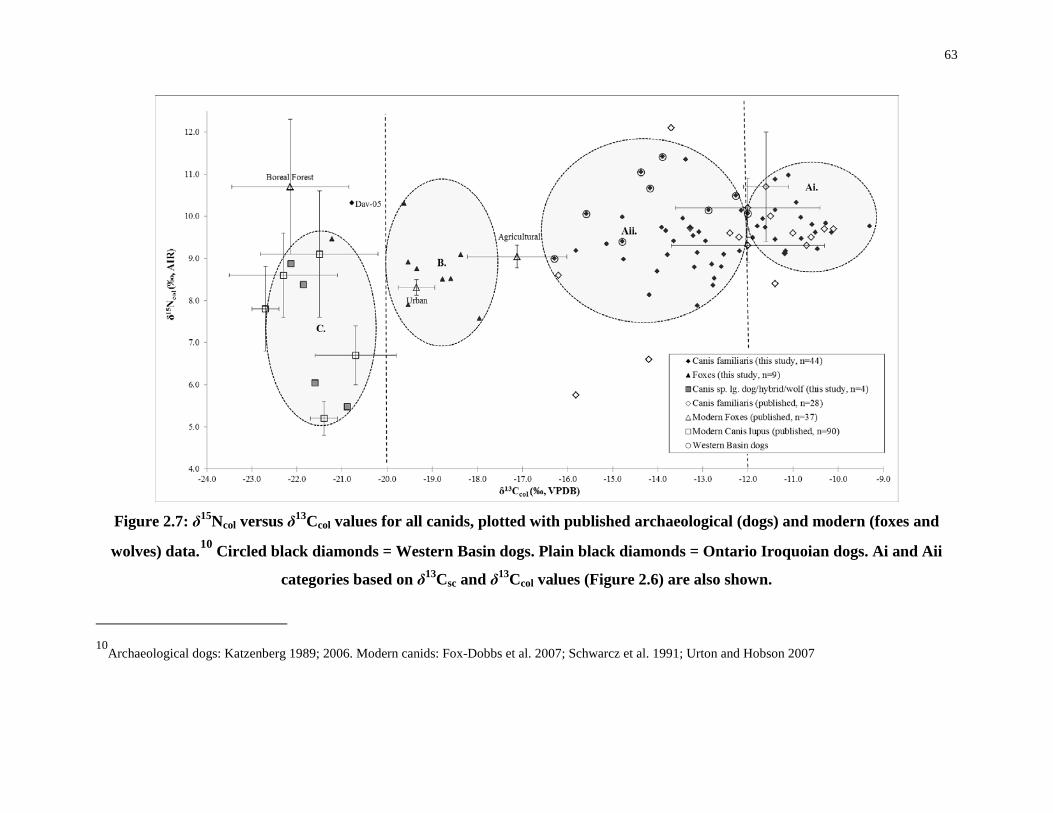
63
Figure 2.7: δ15Ncol versus δ13Ccol values for all canids, plotted with published archaeological (dogs) and modern (foxes and
wolves) data.10 Circled black diamonds = Western Basin dogs. Plain black diamonds = Ontario Iroquoian dogs. Ai and Aii
categories based on δ13Csc and δ13Ccol values (Figure 2.6) are also shown.
10Archaeological dogs: Katzenberg 1989; 2006. Modern canids: Fox-Dobbs et al. 2007; Schwarcz et al. 1991; Urton and Hobson 2007
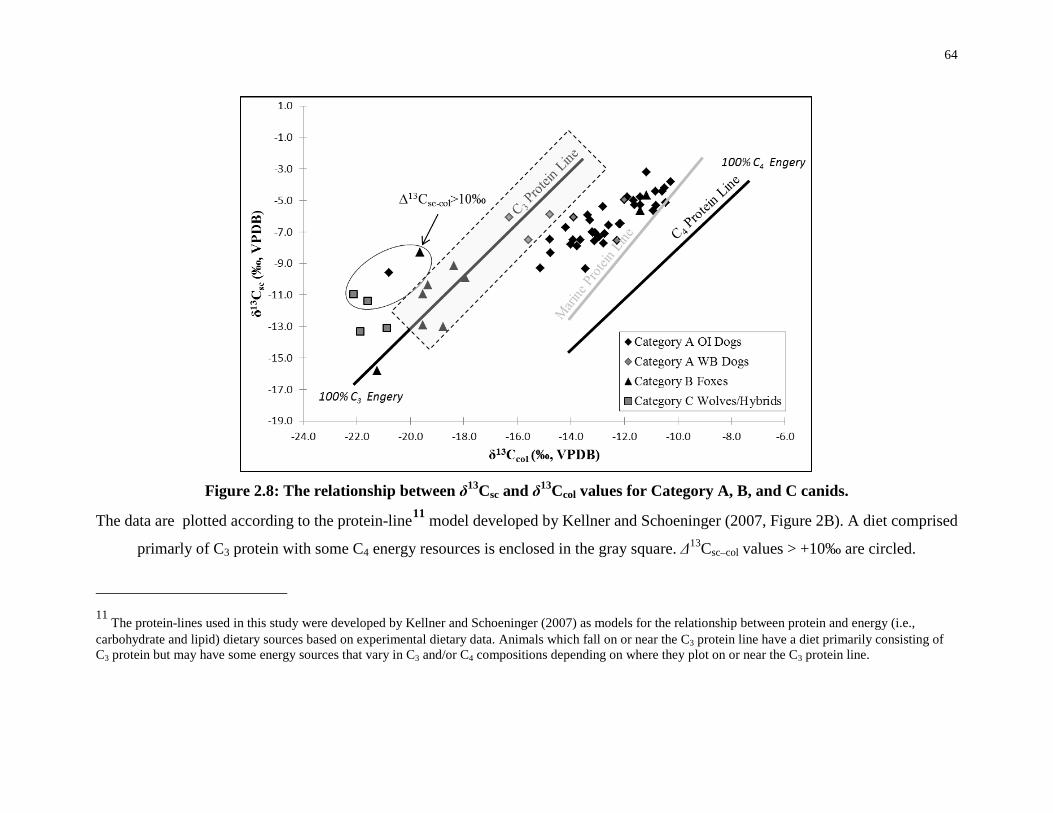
64
Figure 2.8: The relationship between δ13Csc and δ13Ccol values for Category A, B, and C canids.
The data are plotted according to the protein-line11 model developed by Kellner and Schoeninger (2007, Figure 2B). A diet comprised
primarly of C3 protein with some C4 energy resources is enclosed in the gray square. Δ13Csc–col values > +10‰ are circled.
11 The protein-lines used in this study were developed by Kellner and Schoeninger (2007) as models for the relationship between protein and energy (i.e., carbohydrate and lipid) dietary sources based on experimental dietary data. Animals which fall on or near the C3 protein line have a diet primarily consisting of C3 protein but may have some energy sources that vary in C3 and/or C4 compositions depending on where they plot on or near the C3 protein line.
65
2.4.1.2 Category B – foxes
Category B canid remains were identified as either foxes (n=7) or probable foxes (n=1)
because of the considerable uniformity in size, morphology and isotopic compositions.
Although they could have been either red or gray foxes (V. vulpes or U. cineroargenteus),
they occupied an ecological niche near human settlement. Their δ13Csc and δ13Ccol values
do not suggest the same access of C4 resources as the domestic dogs, but they are still
enriched in 13C. As flexible consumers foxes eat a range of prey, scavenged food and
plants (Voigt 1987). Modern fox diets mainly consist of meadow voles and other small
rodents, along with rabbits, woodchucks, ducks, fruit, insects, carrion and human garbage
(Samuel and Nelson 1982; Voigt 1987). The prey of archaeological foxes may reflect C4
consumption, including human waste as well as maize-consuming prey, e.g., gray/black
squirrels (Sciurus carolinensis) and wild turkeys (Meleagris gallopavo silvestris)
(Katzenberg 1989; 2006; Morris unpublished data this study), which could explain the
isotopic composition of the archaeological fox collagen. For example, predators
consuming large quantities of Late Woodland Ontario squirrel or turkey (Katzenberg
1989; 2006; Morris unpublished data this study) would have a predicted δ13Ccol values of
~–19 to –17‰ and δ15Ncol values of ~7 to 9‰, which correspond well with the results for
the foxes in this study (Figure 1.1 and Figure 2.5).
Published stable isotopic data from two modern dietary behavioural studies, which
include foxes, are plotted with the archaeological data in Figure 2.7. The modern fox
studies provide stable isotope profiles for three ecological niches: (1) a fox population
from the Boreal forest (Urton and Hobson 2006), (2) a rural environment with
agricultural access, and (3) an agricultural (maize and soybeans) farm (Lavin et al. 2003).
The isotope data from this study closely correspond to Lavin et al.’s (2003) δ13Ccol and
δ15Ncol values for foxes that exploited agricultural and rural environments, and ate
obligate herbivores (i.e., rabbits, groundhogs) and higher trophic herbivores/omnivores
(i.e., squirrels, birds) (Lavin et al. 2003: 1077: Figure 8). The δ15Ncol values of the foxes
are significantly lower than those of domestic dogs. The difference suggests that the
foxes are consuming different animal resources. Plotting the canid data onto previously
established protein-source lines (after Kellner and Schoeninger 2007: Figure 2.8), certain
66
patterns emerge. All the wild canids (Category B, as well category C discussed in the
proceeding section) fall on or above the C3 protein line, which suggests heavy
consumption of C3–protein. There is a continuum of maize field niche exploitation by
Late Woodland foxes that trends along the lower half of the C3 protein line and is distinct
from all other wild and domestic canids. The δ13Csc values of foxes ranging between –12
and –9‰ are consistent with those of swine experimentally fed 13–20% (by weight)
protein comprised of 20% C4, and a non-protein portion between 23% and 50% C4
(Warinner and Tuross 2009). A diet that consisted of wild foods with some C4–consuming
game (i.e. squirrel) and/or occasional maize would adequately explain the majority of fox
diets. Three additional foxes had diets with δ13Csc values lower than –13‰, which are
more consistent with a diet comprised of ~100% C3 protein and 75 to 100% C3 non–
protein (i.e. diets that were almost exclusively C3–based); two of these foxes may have
occasionally consumed maize or maize–consuming prey, while the third falls in Category
C and is assumed to have consumed no C4 resources.
Late Woodland Category B canids (i.e., foxes) likely preyed on C4-consuming herbivores
(e.g., squirrels) and occasionally ate maize waste (from middens or caches). Maize fields
offered a hunting ground for the foxes, placing them in close proximity to humans and
making them convenient meat and/or fur source. Alternatively, foxes may have been
viewed as crop pests because of their frequent appearance in fields. The behaviour
inferred from these isotopic data suggests that the Late Woodland peoples hunted foxes
living near their settlements. Foxes are, however, markedly underrepresented in Western
Basin faunal assemblages (Foreman 2011). In fact, less than 25% of Western Basin sites
had fox remains, compared to 51% of Ontario Iroquoian sites (Foreman 2011; Lennox
1977; Stewart 2000). Only one Western Basin fox (Dobleaar site, Wolf phase [A.D. 1400
to 1550]) could be obtained for isotopic analysis. This difference may be the result of
preferential hunting of foxes by Ontario Iroquoian people, differences in the disposal of
the remains, or differences in land-use. In the latter case, it may have been that Western
Basin maize fields were less extensive, at least prior to A.D. 1400, and/or that the
ecological niche exploited opportunistically by Ontario Iroquoian foxes was unavailable
in the Western Basin region. The seasonal mobility of Western Basin people may also
have had an influence on hunting practices. Western Basin peoples might have lived near
67
planted maize in the summer but only hunted/trapped foxes in the late fall or early winter
(as in modern contexts, Samuel and Nelson 1982), at which time groups may have
disbanded and moved to winter camps (Foreman 2011; Murphy and Ferris 1990). These
smaller sites are less frequently identified by archaeologists and often have very few
preserved animal bones, which may account for the underrepresentation of foxes at
Western Basin sites. These behaviours would suggest that Western Basin peoples had a
different relationship with their landscape than their eastern neighbours, the Ontario
Iroquoian peoples.
2.4.1.3 Category C – large Canis sp.
Morphologically, this category is represented by an Archaic (pre-maize) dog, four large
Canis sp. (large dogs, dog–wolf hybrids or small/female wolves) and one small canid.
The small canid (Van–075) likely represents a fox or small, feral dog and dates to the
Early Ontario Iroquoian period (A.D. 900 to 1200), but its diet is consistent with that of
the other large canids in Category C as well as the forest environment of modern foxes
(Urton and Hobson 2006).
According to descriptions of the “Common Indian” or “North American” dog (Allen
1920; Richardson 1929), the Category C husky-sized canids are most likely small wolves
or dog-wolf hybrids. Dog-wolf hybridization is possible wherever dog and wolf
populations overlap (Crockford 2000) and is discussed in some ethnohistoric accounts
(Barton 1805; Richardson 1829) e.g.:
“In Captain Parry's and Captain Franklin's narratives, instances are recorded of the
female Wolves associating with the domestic dog... The resemblance between the
northern wolves and the domestic dog of the Indians is so great, that the size and strength
of the Wolf seems to be the only difference.” (Richardson 1829:64)
Although other researchers have maintained that stories of hybridization are exaggerated
in pre-contact North America (Allen 1920; Ryder 2000; Vilá and Wayne 1999), there is
also zooarchaeological evidence of dog-wolf hybrids, primarily from the Plains region,
where indigenous dogs were much larger (Ryder 2000; Schwartz 1997). The remains in
68
Category C are substantially larger than the majority of the dog remains collected for this
study or the terrier-sized dogs described by Prevec and Nobel (1983) from Neutral sites.
Even if dog-wolf hybrids are present in this sample, it is assumed that they would
normally pursue a wild existence (Crockford 2000; Coppinger and Coppinger 2001). This
assumption appears to be upheld as all Category C canids are also isotopically distinct
from all other C. familiaris and Canis sp. samples. They have the lowest δ13Ccol values
(indicative of pure C3-food consumption), highly variable δ15Ncol and δ13Csc values, and
the largest Δ13Csc–col difference (Table 2.6). Their consumption of low trophic level prey
in an exclusively C3 food web suggests an ecological niche that is generally isolated from
human-altered (i.e. agricultural or urban) landscapes i.e., comparable to that of modern
wolves from Ontario, Saskatchewan and Minnesota (Fox-Dobbs et al. 2007; Schwarcz et
al. 1991; Urton and Hobson 2007) (Figure 2.6, Table 2.7).
Regardless of the taxonomic classification of the large canid remains, the important
question is whether Late Woodland people would have identified these four large canids
as dogs or as wolves. Their isotopic distinctiveness makes them a behaviourally discrete
group, and their large size would suggest that they were not only real wolves but also
perceived as such. Henceforward, they will be referred to as wolves. Wolves are not
common in the faunal assemblages of Ontario Iroquoian sites (present at 24% of sites)
(Foreman 2011; Lennox 1977; Stewart 1991), and are not even reported at any Western
Basin sites (Foreman 2011). Their limited appearance in faunal assemblages suggests that
they had minimal interaction with humans. It is even possible that wolves were not
actively hunted. Great Lakes mythology suggests they were sacred and that their loss was
serious enough to “bring death unto the world” (Brehm 2011:28). Therefore, they may
have been killed only in specific circumstances, e.g., if they were considered a threat to
human life or competing for prey, such as white-tailed deer. Ellis (2002) noted a shift
from the Archaic period emphasis on wolves in ritual, such as the inclusion of wolf
remains in human burials (Donaldson and Wortner 1995) and the presence of wolf masks
(Baby 1961; Parmalee and Stephens 1972) to an emphasis on the use of dogs in sacrifice
and feasting in the Woodland period. The shift from wolves to other canids in ceremonial
activities could explain the minimal presence of wolves in faunal assemblages. There is,
however, continuity in cosmological role of wolves, and Wolf remained a central clan
69
and/or national symbol of both the Iroquoian and Alongkian-speaking people throughout
the Late Woodland and Historic time periods (Ellis 2002). If wolves were given a special
status, it is plausible that any purposefully killed wolves might have been given
distinctive post-mortem treatment because of their sacred status, resulting in scarce
inclusion in middens or refuse pits. Further evidence of this differential post-mortem
treatment is the high Δ13Csc–col values of the wolves, discussed in detail in Chapter 4.
The pre-agricultural Davidson Site dog (Dav-05) also represents pure C3 food web
exploitation (–20.78), which is expected for a site pre-dating the entry of maize into the
region by over 3000 years. While the δ13Ccol values of this dog are lower than –20‰,
they are not as low as the values of the wolves and one fox believed to be exploiting the
C3 environment. Two potentially complementary explanations are: (1) the Archaic dog
consumed freshwater fish (discussed below), and (2) the wolves exploited prey in deeper
forest canopy areas, away from Late Woodland human-altered landscapes (Bonafini et al.
2013; Cerling and Harris 1999; Druker and Bocherens 2009; Vogel 1978). For a
discussion of deer who may have also exploited deeper forests, resulting in low δ13Ccol
values, see Chapter 4.
The pre-agricultural dog had a δ15Ncol value (10.31‰) that was high relative to the
wolves but similar to the Category A domestic dogs, which suggests a different trophic
feeding level and a domesticated relationship with humans. The Archaic dog probably
consumed a lot of freshwater fish, an interpretation that is also consistent with their
δ13Ccol and δ13Csc values (Figure 2.6). Such fish could include salmon, lake trout or
burbot (Van der Merwe et al. 2003: 255). Furthermore the δ13Ccol and δ13Csc values of the
Davidson dogs distinguish them from the other wild canids (Figure 2.5 and Figure 2.8).
Although a high degree of herbivory could explain the dog’s large Δ13Csc–col spacing
(+11.19‰), its high δ15Ncol value make this interpretation unlikely. Alternatively, its
δ13Csc value may have been altered by post-mortem processing (i.e., boiling, see Chapter
4), which might suggest that the Archaic dogs were eaten.
70
2.4.2 Juvenile Canids
Juvenile canids were not morphologically identified beyond Canis sp. because of
interpretive difficulties but their isotopic compositions suggest association with the same
ecological niches identified for the adult canid remains (Figure 2.4). Five of the
specimens fall within the expected range of isotopic compositions for dogs and two of the
samples fall within the range for foxes. Sil–07 appears to be an outlier based on its high
δ15Ncol value. As previously discussed, Pip (2)–028, an older immature (incompletely
fused long bone) large Canis sp. shares its isotopic composition with that of wolves.
As expected, there is a breastfeeding, trophic level enrichment evident in the δ15Ncol
values for most of the juvenile canids (Williams et al. 2005; Wright and Schwarcz 1998).
The mean δ15Ncol value of the juvenile canids is significantly higher relative to that of the
adult canid remains (Tukey HSD, p=0.020). There are distinct patterns of C4
consumption among the juvenile canids that suggest the same variation in maize
consumption as that found in the adult canids, and most likely reflect species differences
(i.e. domestic versus wild canids). The mean δ15Ncol value of juvenile domesticated dogs
(i.e., those with δ13Ccol > –15‰) is significantly higher than that of adults (Tukey HSD,
p=0.005). There is also a significant relationship between δ18Osc and δ15Ncol values of
dogs (r2= –0.105, p=0.018), which probably also reflects infant breastfeeding (see
Williams et al. 2005). Because the juveniles have statistically higher δ15Ncol values due to
breastfeeding, they are not used in the further comparisons of dog-human diets. There is
no significant difference between the δ15Ncol values of juvenile and adult foxes. This may
be because foxes wean quickly, i.e., within four to five weeks of birth (Larivière, S.,
Pasitschniak-Arts 1996).
2.4.3 Dogs as proxies for human diet
In order to determine whether dogs can be used to reconstruct human subsistence
practices, the isotopic compositions of the Category A dogs, as well as those of
previously reported Late Woodland domesticated dogs (Booth et al. 2011; Katzenberg
1989, 2006), have been compared to those published for adult humans from the Great
Lakes region (Figure 2.9). The isotopic data for Western Basin dogs are compared with
71
those published for Western Lake Erie humans (Allegretto 2007; Dewar et al. 2010;
Schurr and Redmond 1991; Stothers and Bechtel 1987; Spence et al. 2010; Watts et al.
2011). The isotopic data for Ontario Iroquoian dogs are compared to those published for
humans from southwestern and central Ontario (Harrison and Katzenberg 2003;
Katzenberg 1995; Schwarcz et al. 1985; van der Merwe et al. 2003) (summary of human
published data Table 2.8). For statistical purposes, dogs and humans were categorized
into temporal phases that roughly correspond to recognized cultural periods/phases
(Table 2.9).
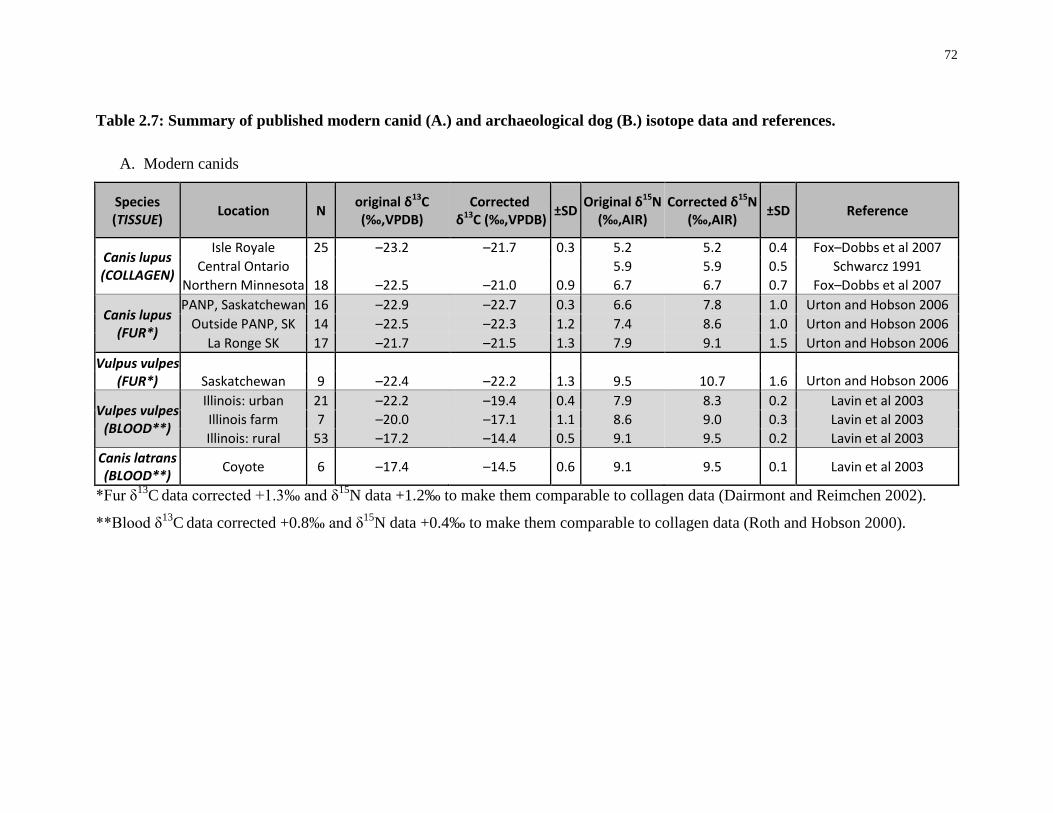
72
Table 2.7: Summary of published modern canid (A.) and archaeological dog (B.) isotope data and references.
A. Modern canids
Species (TISSUE) Location N original δ13C
(‰,VPDB) Corrected
δ13C (‰,VPDB) ±SD Original δ15N (‰,AIR)
Corrected δ15N (‰,AIR) ±SD Reference
Canis lupus (COLLAGEN)
Isle Royale 25 –23.2 –21.7 0.3 5.2 5.2 0.4 Fox–Dobbs et al 2007 Central Ontario 5.9 5.9 0.5 Schwarcz 1991
Northern Minnesota 18 –22.5 –21.0 0.9 6.7 6.7 0.7 Fox–Dobbs et al 2007
Canis lupus (FUR*)
PANP, Saskatchewan 16 –22.9 –22.7 0.3 6.6 7.8 1.0 Urton and Hobson 2006 Outside PANP, SK 14 –22.5 –22.3 1.2 7.4 8.6 1.0 Urton and Hobson 2006
La Ronge SK 17 –21.7 –21.5 1.3 7.9 9.1 1.5 Urton and Hobson 2006 Vulpus vulpes
(FUR*)
Saskatchewan 9
–22.4
–22.2
1.3
9.5
10.7
1.6
Urton and Hobson 2006
Vulpes vulpes (BLOOD**)
Illinois: urban 21 –22.2 –19.4 0.4 7.9 8.3 0.2 Lavin et al 2003 Illinois farm 7 –20.0 –17.1 1.1 8.6 9.0 0.3 Lavin et al 2003 Illinois: rural 53 –17.2 –14.4 0.5 9.1 9.5 0.2 Lavin et al 2003
Canis latrans (BLOOD**) Coyote 6 –17.4 –14.5 0.6 9.1 9.5 0.1 Lavin et al 2003
*Fur δ13C data corrected +1.3‰ and δ15N data +1.2‰ to make them comparable to collagen data (Dairmont and Reimchen 2002).
**Blood δ13C data corrected +0.8‰ and δ15N data +0.4‰ to make them comparable to collagen data (Roth and Hobson 2000).
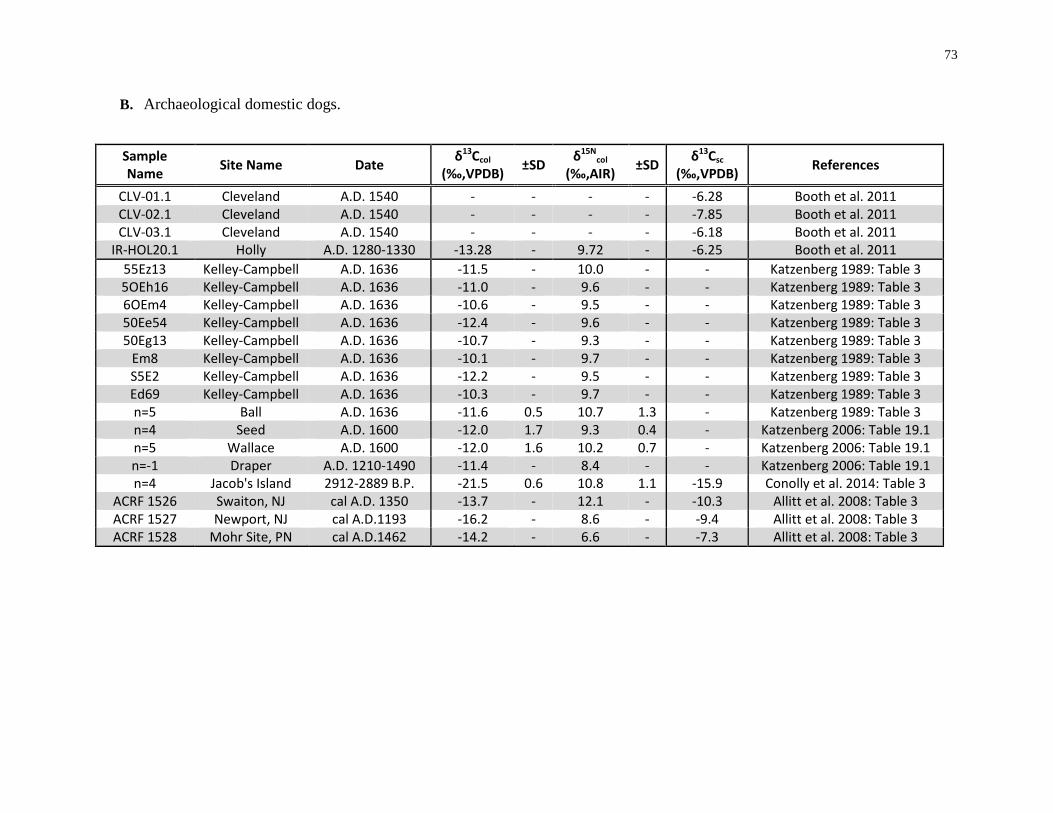
73
B. Archaeological domestic dogs. Sample Name Site Name Date δ13Ccol
(‰,VPDB) ±SD δ15Ncol
(‰,AIR) ±SD δ13Csc (‰,VPDB) References
CLV-01.1 Cleveland A.D. 1540 - - - - -6.28 Booth et al. 2011 CLV-02.1 Cleveland A.D. 1540 - - - - -7.85 Booth et al. 2011 CLV-03.1 Cleveland A.D. 1540 - - - - -6.18 Booth et al. 2011
IR-HOL20.1 Holly A.D. 1280-1330 -13.28 - 9.72 - -6.25 Booth et al. 2011 55Ez13 Kelley-Campbell A.D. 1636 -11.5 - 10.0 - - Katzenberg 1989: Table 3 5OEh16 Kelley-Campbell A.D. 1636 -11.0 - 9.6 - - Katzenberg 1989: Table 3 6OEm4 Kelley-Campbell A.D. 1636 -10.6 - 9.5 - - Katzenberg 1989: Table 3 50Ee54 Kelley-Campbell A.D. 1636 -12.4 - 9.6 - - Katzenberg 1989: Table 3 50Eg13 Kelley-Campbell A.D. 1636 -10.7 - 9.3 - - Katzenberg 1989: Table 3
Em8 Kelley-Campbell A.D. 1636 -10.1 - 9.7 - - Katzenberg 1989: Table 3 S5E2 Kelley-Campbell A.D. 1636 -12.2 - 9.5 - - Katzenberg 1989: Table 3 Ed69 Kelley-Campbell A.D. 1636 -10.3 - 9.7 - - Katzenberg 1989: Table 3 n=5 Ball A.D. 1636 -11.6 0.5 10.7 1.3 - Katzenberg 1989: Table 3 n=4 Seed A.D. 1600 -12.0 1.7 9.3 0.4 - Katzenberg 2006: Table 19.1 n=5 Wallace A.D. 1600 -12.0 1.6 10.2 0.7 - Katzenberg 2006: Table 19.1 n=-1 Draper A.D. 1210-1490 -11.4 - 8.4 - - Katzenberg 2006: Table 19.1 n=4 Jacob's Island 2912-2889 B.P. -21.5 0.6 10.8 1.1 -15.9 Conolly et al. 2014: Table 3
ACRF 1526 Swaiton, NJ cal A.D. 1350 -13.7 - 12.1 - -10.3 Allitt et al. 2008: Table 3 ACRF 1527 Newport, NJ cal A.D.1193 -16.2 - 8.6 - -9.4 Allitt et al. 2008: Table 3 ACRF 1528 Mohr Site, PN cal A.D.1462 -14.2 - 6.6 - -7.3 Allitt et al. 2008: Table 3
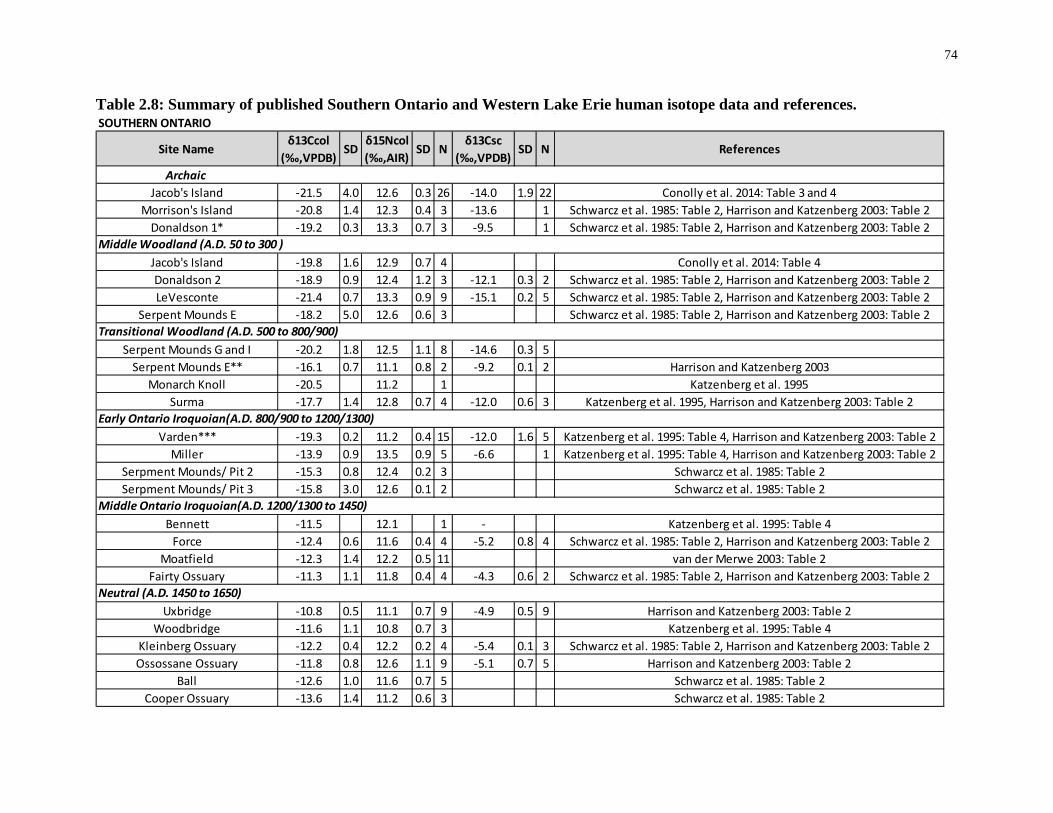
74
Table 2.8: Summary of published Southern Ontario and Western Lake Erie human isotope data and references.
Site Nameδ13Ccol
(‰,VPDB)SD
δ15Ncol (‰,AIR)
SD Nδ13Csc
(‰,VPDB)SD N References
ArchaicJacob's Island -21.5 4.0 12.6 0.3 26 -14.0 1.9 22 Conolly et al. 2014: Table 3 and 4
Morrison's Island -20.8 1.4 12.3 0.4 3 -13.6 1 Schwarcz et al. 1985: Table 2, Harrison and Katzenberg 2003: Table 2Donaldson 1* -19.2 0.3 13.3 0.7 3 -9.5 1 Schwarcz et al. 1985: Table 2, Harrison and Katzenberg 2003: Table 2
Jacob's Island -19.8 1.6 12.9 0.7 4 Conolly et al. 2014: Table 4Donaldson 2 -18.9 0.9 12.4 1.2 3 -12.1 0.3 2 Schwarcz et al. 1985: Table 2, Harrison and Katzenberg 2003: Table 2LeVesconte -21.4 0.7 13.3 0.9 9 -15.1 0.2 5 Schwarcz et al. 1985: Table 2, Harrison and Katzenberg 2003: Table 2
Serpent Mounds E -18.2 5.0 12.6 0.6 3 Schwarcz et al. 1985: Table 2, Harrison and Katzenberg 2003: Table 2
Serpent Mounds G and I -20.2 1.8 12.5 1.1 8 -14.6 0.3 5Serpent Mounds E** -16.1 0.7 11.1 0.8 2 -9.2 0.1 2 Harrison and Katzenberg 2003
Monarch Knoll -20.5 11.2 1 Katzenberg et al. 1995Surma -17.7 1.4 12.8 0.7 4 -12.0 0.6 3 Katzenberg et al. 1995, Harrison and Katzenberg 2003: Table 2
Varden*** -19.3 0.2 11.2 0.4 15 -12.0 1.6 5 Katzenberg et al. 1995: Table 4, Harrison and Katzenberg 2003: Table 2Miller -13.9 0.9 13.5 0.9 5 -6.6 1 Katzenberg et al. 1995: Table 4, Harrison and Katzenberg 2003: Table 2
Serpment Mounds/ Pit 2 -15.3 0.8 12.4 0.2 3 Schwarcz et al. 1985: Table 2Serpment Mounds/ Pit 3 -15.8 3.0 12.6 0.1 2 Schwarcz et al. 1985: Table 2
Bennett -11.5 12.1 1 - Katzenberg et al. 1995: Table 4Force -12.4 0.6 11.6 0.4 4 -5.2 0.8 4 Schwarcz et al. 1985: Table 2, Harrison and Katzenberg 2003: Table 2
Moatfield -12.3 1.4 12.2 0.5 11 van der Merwe 2003: Table 2Fairty Ossuary -11.3 1.1 11.8 0.4 4 -4.3 0.6 2 Schwarcz et al. 1985: Table 2, Harrison and Katzenberg 2003: Table 2
Uxbridge -10.8 0.5 11.1 0.7 9 -4.9 0.5 9 Harrison and Katzenberg 2003: Table 2Woodbridge -11.6 1.1 10.8 0.7 3 Katzenberg et al. 1995: Table 4
Kleinberg Ossuary -12.2 0.4 12.2 0.2 4 -5.4 0.1 3 Schwarcz et al. 1985: Table 2, Harrison and Katzenberg 2003: Table 2Ossossane Ossuary -11.8 0.8 12.6 1.1 9 -5.1 0.7 5 Harrison and Katzenberg 2003: Table 2
Ball -12.6 1.0 11.6 0.7 5 Schwarcz et al. 1985: Table 2Cooper Ossuary -13.6 1.4 11.2 0.6 3 Schwarcz et al. 1985: Table 2
SOUTHERN ONTARIO
Middle Woodland (A.D. 50 to 300 )
Transitional Woodland (A.D. 500 to 800/900)
Early Ontario Iroquoian(A.D. 800/900 to 1200/1300)
Middle Ontario Iroquoian(A.D. 1200/1300 to 1450)
Neutral (A.D. 1450 to 1650)
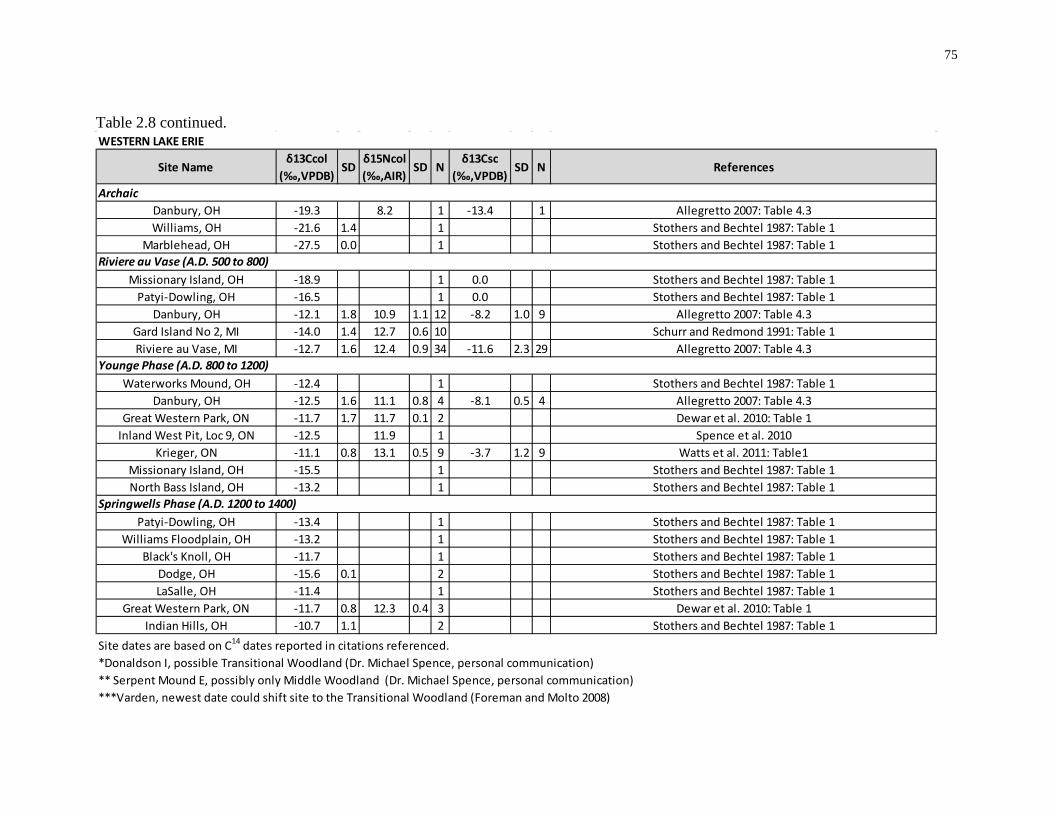
75
Table 2.8 continued.
Site Nameδ13Ccol
(‰,VPDB)SD
δ15Ncol (‰,AIR)
SD Nδ13Csc
(‰,VPDB)SD N References
Danbury, OH -19.3 8.2 1 -13.4 1 Allegretto 2007: Table 4.3Williams, OH -21.6 1.4 1 Stothers and Bechtel 1987: Table 1
Marblehead, OH -27.5 0.0 1 Stothers and Bechtel 1987: Table 1
Missionary Island, OH -18.9 1 0.0 Stothers and Bechtel 1987: Table 1Patyi-Dowling, OH -16.5 1 0.0 Stothers and Bechtel 1987: Table 1
Danbury, OH -12.1 1.8 10.9 1.1 12 -8.2 1.0 9 Allegretto 2007: Table 4.3Gard Island No 2, MI -14.0 1.4 12.7 0.6 10 Schurr and Redmond 1991: Table 1Riviere au Vase, MI -12.7 1.6 12.4 0.9 34 -11.6 2.3 29 Allegretto 2007: Table 4.3
Waterworks Mound, OH -12.4 1 Stothers and Bechtel 1987: Table 1Danbury, OH -12.5 1.6 11.1 0.8 4 -8.1 0.5 4 Allegretto 2007: Table 4.3
Great Western Park, ON -11.7 1.7 11.7 0.1 2 Dewar et al. 2010: Table 1Inland West Pit, Loc 9, ON -12.5 11.9 1 Spence et al. 2010
Krieger, ON -11.1 0.8 13.1 0.5 9 -3.7 1.2 9 Watts et al. 2011: Table1Missionary Island, OH -15.5 1 Stothers and Bechtel 1987: Table 1North Bass Island, OH -13.2 1 Stothers and Bechtel 1987: Table 1
Patyi-Dowling, OH -13.4 1 Stothers and Bechtel 1987: Table 1Williams Floodplain, OH -13.2 1 Stothers and Bechtel 1987: Table 1
Black's Knoll, OH -11.7 1 Stothers and Bechtel 1987: Table 1Dodge, OH -15.6 0.1 2 Stothers and Bechtel 1987: Table 1LaSalle, OH -11.4 1 Stothers and Bechtel 1987: Table 1
Great Western Park, ON -11.7 0.8 12.3 0.4 3 Dewar et al. 2010: Table 1Indian Hills, OH -10.7 1.1 2 Stothers and Bechtel 1987: Table 1
Site dates are based on C14 dates reported in citations referenced.*Donaldson I, possible Transitional Woodland (Dr. Michael Spence, personal communication)** Serpent Mound E, possibly only Middle Woodland (Dr. Michael Spence, personal communication)***Varden, newest date could shift site to the Transitional Woodland (Foreman and Molto 2008)
WESTERN LAKE ERIE
Riviere au Vase (A.D. 500 to 800)
Younge Phase (A.D. 800 to 1200)
Springwells Phase (A.D. 1200 to 1400)
Archaic
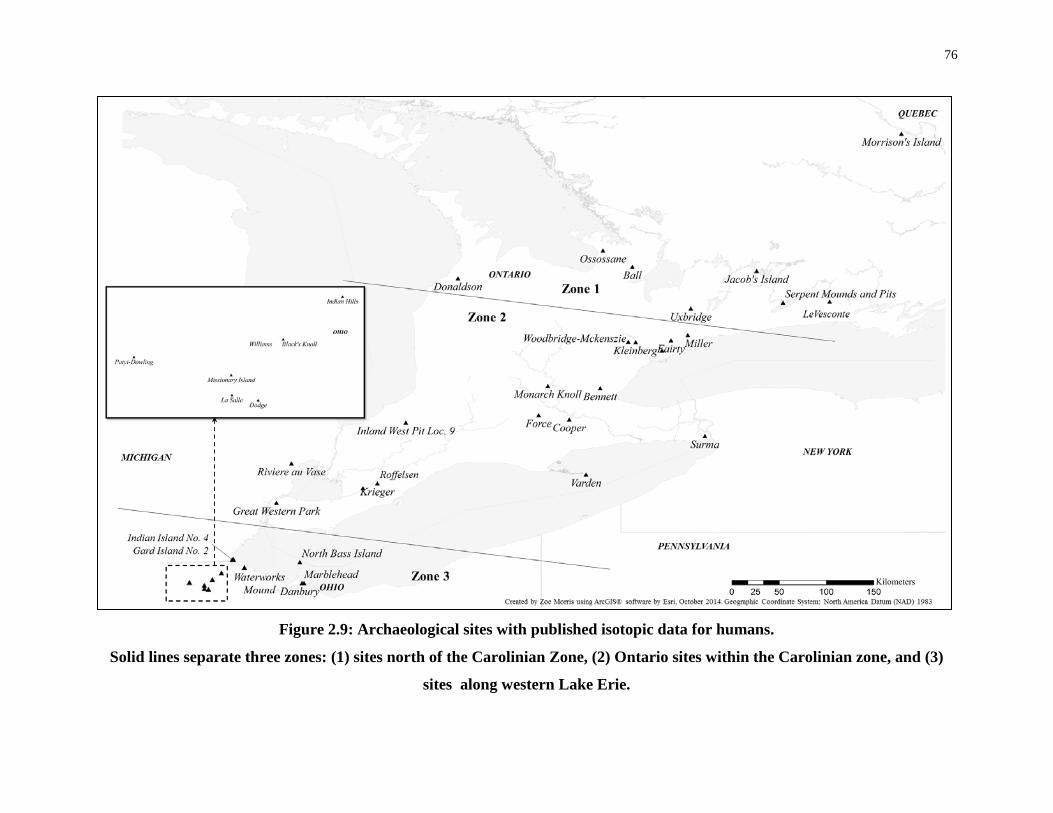
76
Figure 2.9: Archaeological sites with published isotopic data for humans.
Solid lines separate three zones: (1) sites north of the Carolinian Zone, (2) Ontario sites within the Carolinian zone, and (3)
sites along western Lake Erie.
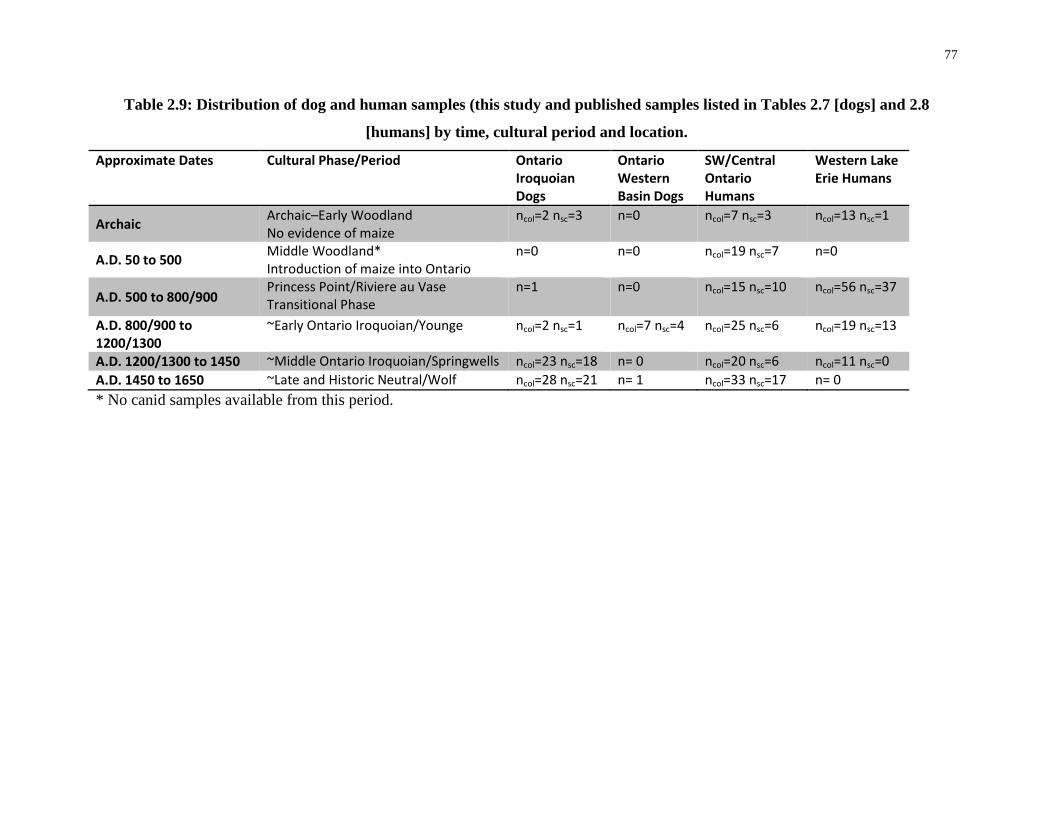
77
Table 2.9: Distribution of dog and human samples (this study and published samples listed in Tables 2.7 [dogs] and 2.8
[humans] by time, cultural period and location.
Approximate Dates Cultural Phase/Period
Ontario Iroquoian Dogs
Ontario Western Basin Dogs
SW/Central Ontario Humans
Western Lake Erie Humans
Archaic Archaic–Early Woodland No evidence of maize
ncol=2 nsc=3 n=0 ncol=7 nsc=3 ncol=13 nsc=1
A.D. 50 to 500 Middle Woodland* Introduction of maize into Ontario
n=0 n=0 ncol=19 nsc=7 n=0
A.D. 500 to 800/900 Princess Point/Riviere au Vase Transitional Phase
n=1 n=0 ncol=15 nsc=10 ncol=56 nsc=37
A.D. 800/900 to 1200/1300
~Early Ontario Iroquoian/Younge ncol=2 nsc=1 ncol=7 nsc=4 ncol=25 nsc=6 ncol=19 nsc=13
A.D. 1200/1300 to 1450 ~Middle Ontario Iroquoian/Springwells ncol=23 nsc=18 n= 0 ncol=20 nsc=6 ncol=11 nsc=0 A.D. 1450 to 1650 ~Late and Historic Neutral/Wolf ncol=28 nsc=21 n= 1 ncol=33 nsc=17 n= 0 * No canid samples available from this period.
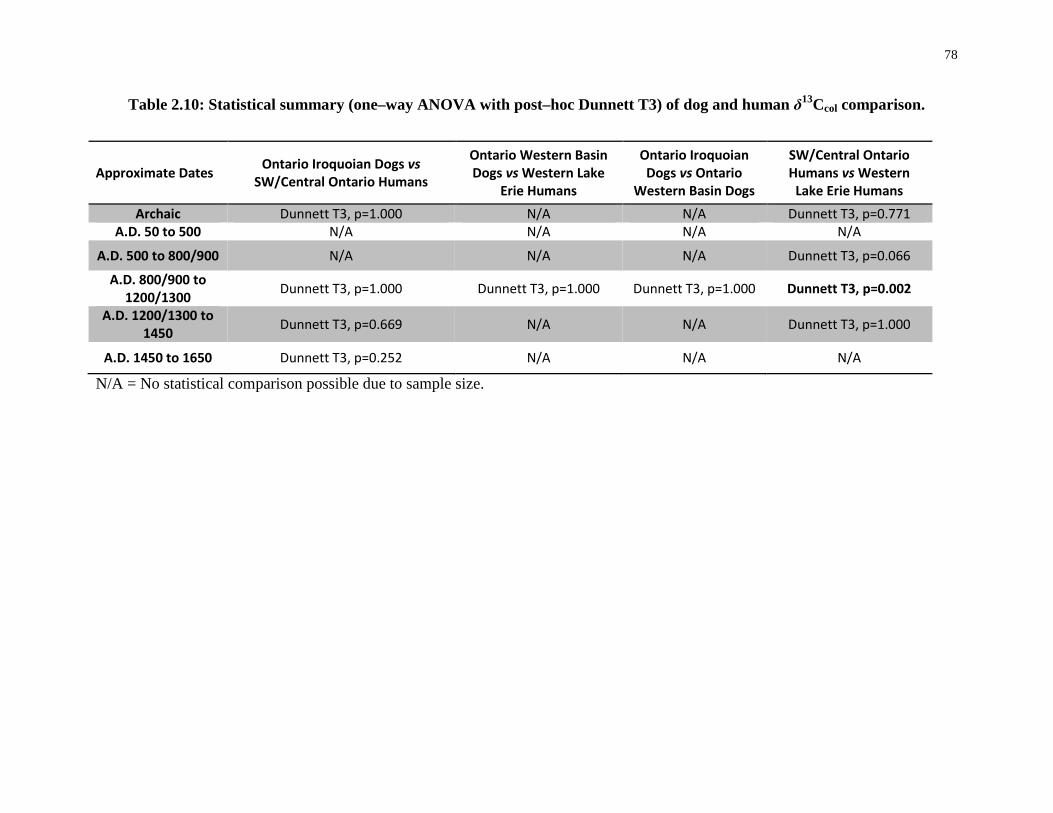
78
Table 2.10: Statistical summary (one–way ANOVA with post–hoc Dunnett T3) of dog and human δ13Ccol comparison.
Approximate Dates Ontario Iroquoian Dogs vs SW/Central Ontario Humans
Ontario Western Basin Dogs vs Western Lake
Erie Humans
Ontario Iroquoian Dogs vs Ontario
Western Basin Dogs
SW/Central Ontario Humans vs Western
Lake Erie Humans Archaic Dunnett T3, p=1.000 N/A N/A Dunnett T3, p=0.771
A.D. 50 to 500 N/A N/A N/A N/A
A.D. 500 to 800/900 N/A N/A N/A Dunnett T3, p=0.066
A.D. 800/900 to 1200/1300 Dunnett T3, p=1.000 Dunnett T3, p=1.000 Dunnett T3, p=1.000 Dunnett T3, p=0.002
A.D. 1200/1300 to 1450 Dunnett T3, p=0.669 N/A N/A Dunnett T3, p=1.000
A.D. 1450 to 1650 Dunnett T3, p=0.252 N/A N/A N/A
N/A = No statistical comparison possible due to sample size.
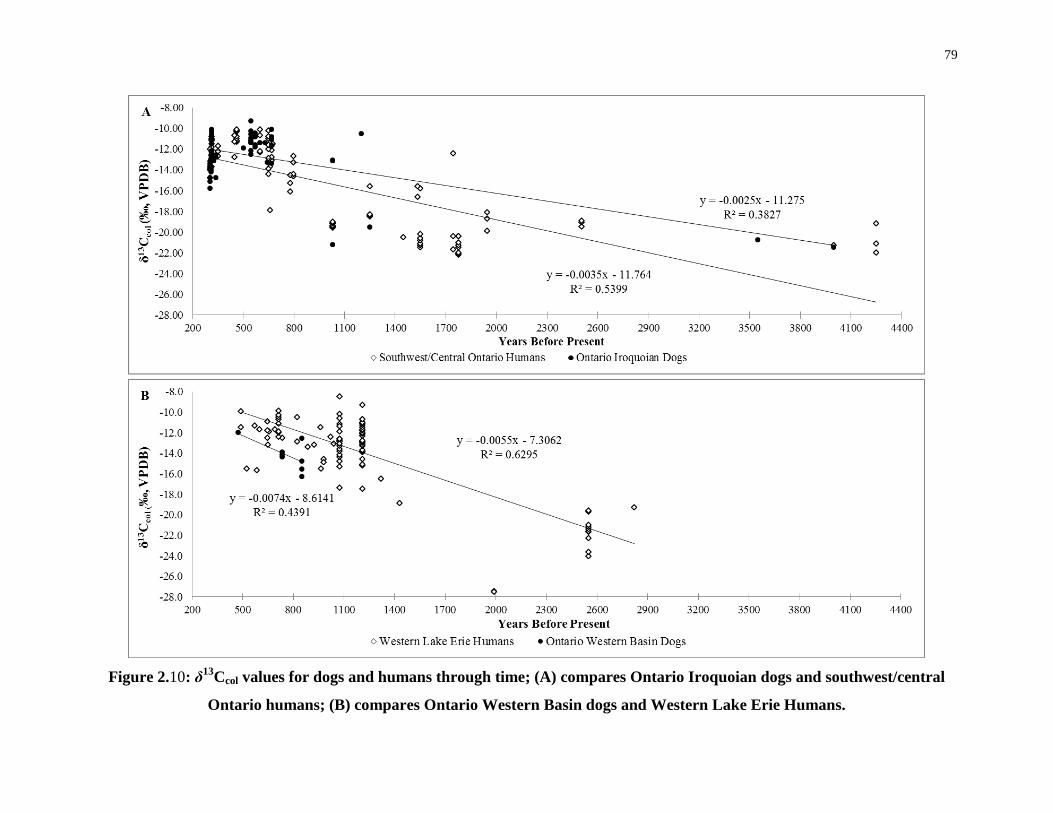
79
Figure 2.10: δ13Ccol values for dogs and humans through time; (A) compares Ontario Iroquoian dogs and southwest/central
Ontario humans; (B) compares Ontario Western Basin dogs and Western Lake Erie Humans.
80
2.4.4 3C values of humans versus dogs
The δ13Ccol values of humans and dogs from southwestern/central Ontario and Western
Lake Erie regions correspond well through time suggesting that dogs can serve as proxies
for human maize consumption for the Great Lakes region (Table 2.10, Figures 2.10A and
B).
2.4.4.1 No evidence of maize: Archaic
No dogs were analysed from the Western Lake Erie region earlier than the Younge Phase
(A.D. 900 to 1200). Only two Archaic dogs were analysed and collagen was preserved in
only one of those. The δ-value (δ13Ccol = -20.785‰), for the well–preserved sample from
the Davidson site reflects the pre-maize values of humans (Table 2.9). The Davidson dog
collagen value is similar to that of four other Archaic dogs from Jacob’s Island, Ontario,
that had a mean δ13Ccol value of -21.5±0.6‰ (Conolly et al. 2014, Table 3). Transitional
Woodland: A.D. 500–800/900
Archaeological evidence suggests that maize was introduced to Ontario as early as A.D.
200 (Allegreto 2007; Capella 2005; Crawford et al. 2006). The Princess Point phase
marks an important shift to the use of cultigens (Capella 2005) in Ontario. Only one dog
is definitively dated to this period (Old Lilac Garden site [OLG–14], Coote’s Paradise,
Smith 1997; Smith and Crawford 2002). The δ13Ccol and δ13Csc values for OLG-14 are
unexpectedly high (–10.5 and –4.2‰, respectively), which suggests that the Old Lilac
Garden site may actually date to the latter end of the Princess Point period as maize is
found infrequently at sites early in the phase. Conversely, these data may suggest that
maize was adopted earlier as a staple crop than previously thought.
2.4.4.2 Western Basin Younge/Early Ontario Iroquoian: A.D. 900/1000 to A.D. 1200
All isotopic measures suggest that post A.D. 900/1000 both groups of dogs and humans
consumed significant quantities of maize. There is no significant difference between
δ13Ccol values of the Ontario Iroquoian dogs and the humans dated to the Early Ontario
Iroquoian Phase. Similarly the eight Western Basin Younge Phase dogs and humans are
81
not significantly different (Table 2.10). With the shift to the Late Woodland period, both
Western Basin and Ontario Iroquoian dogs consumed significant amounts of maize, as
did their human counterparts. In fact, Western Lake Erie humans have significantly
higher δ13Ccol values than their Ontario Iroquoian neighbours, which could have resulted
from consumption of either more maize or possibly more freshwater fish (another 13C-
enriched resource, see δ15Ncol discussion below).
2.4.4.3 Western Basin Springwells/ Middle Ontario Iroquoian Phase: A.D. 1200 to 1400/1450
No Western Basin dogs were available from the Springwells Phase (A.D. 1200 to 1400).
Archaeological evidence supports heavy maize reliance among the Ontario Iroquoian
peoples between A.D. 1280 and 1450, with evidence of increasing sedentism and
population growth. Because of the well–established chronology of maize horticulturalism
at Crawford Lake site (Finlayson and Bryne 1975), the traditional chronology of the
Middle Ontario Iroquoian phase, A.D. 1300 to 1400 (Dodd et al. 1990), was extended to
A.D. 1450 (Finlayson 1998). The δ13Ccol data support the assumption that both Ontario
Iroquoian dogs (–11.33±0.94‰, n=23) and humans (–12.40±1.70‰, n=22) consumed
maize year round and there was no significant difference between dogs and humans
(Table 2.10). The isotopic composition of dogs is much less variable than that of the
humans, which may simply reflect sampling differences i.e., the isotopic data for humans
come from a much larger region. When separated by region, i.e. within and north of the
Carolinian zone (Figure 2.9), the isotopic results for dog and human become more
consistent (Table 2.11, Figure 2.11). The Eastern Carolinian, or Eastern Deciduous, forest
range is a unique biotic niche that extends into the southwestern tip of Ontario. Not
surprisingly, dogs and humans north of the Carolinian zone, where the growing season is
shorter and average annual temperatures are lower, have slightly lower δ13Ccol values
relative to the dogs and humans from sites with the Carolinian zone (Table 2.11, Figure
2.11).
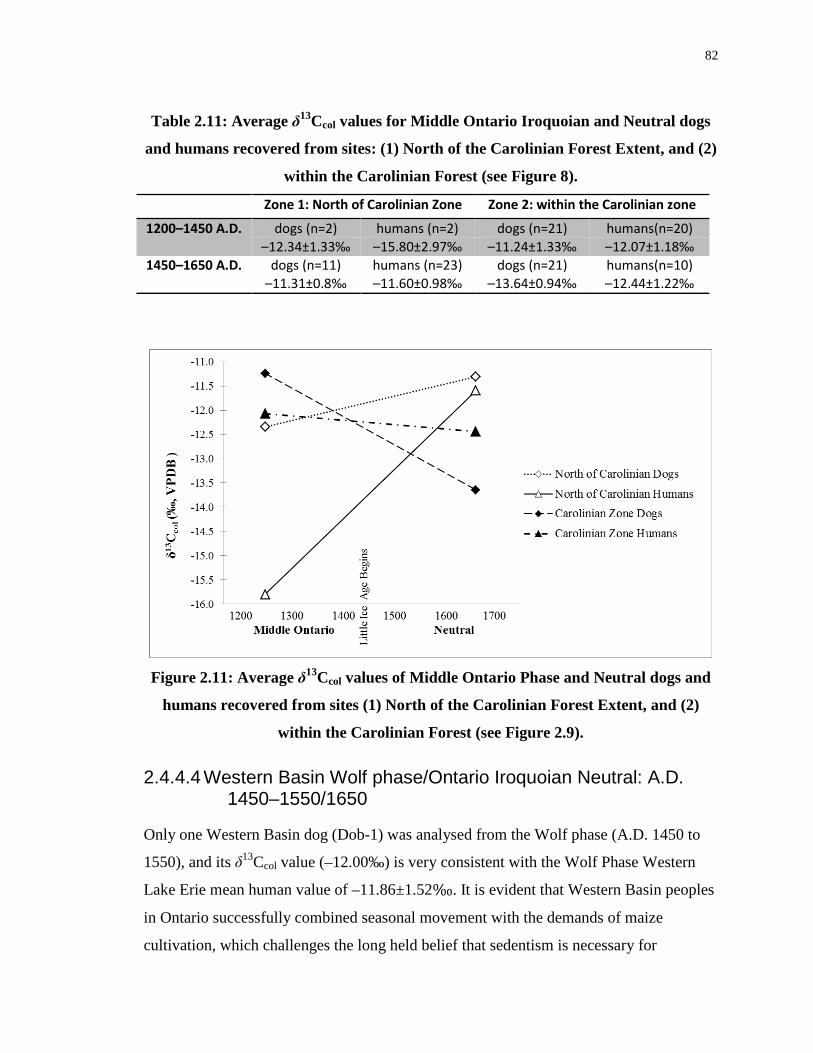
82
Table 2.11: Average δ13Ccol values for Middle Ontario Iroquoian and Neutral dogs
and humans recovered from sites: (1) North of the Carolinian Forest Extent, and (2)
within the Carolinian Forest (see Figure 8).
Zone 1: North of Carolinian Zone Zone 2: within the Carolinian zone
1200–1450 A.D. dogs (n=2) humans (n=2) dogs (n=21) humans(n=20) –12.34±1.33‰ –15.80±2.97‰ –11.24±1.33‰ –12.07±1.18‰
1450–1650 A.D. dogs (n=11) humans (n=23) dogs (n=21) humans(n=10) –11.31±0.8‰ –11.60±0.98‰ –13.64±0.94‰ –12.44±1.22‰
Figure 2.11: Average δ13Ccol values of Middle Ontario Phase and Neutral dogs and
humans recovered from sites (1) North of the Carolinian Forest Extent, and (2)
within the Carolinian Forest (see Figure 2.9).
2.4.4.4 Western Basin Wolf phase/Ontario Iroquoian Neutral: A.D. 1450–1550/1650
Only one Western Basin dog (Dob-1) was analysed from the Wolf phase (A.D. 1450 to
1550), and its δ13Ccol value (–12.00‰) is very consistent with the Wolf Phase Western
Lake Erie mean human value of –11.86±1.52‰. It is evident that Western Basin peoples
in Ontario successfully combined seasonal movement with the demands of maize
cultivation, which challenges the long held belief that sedentism is necessary for
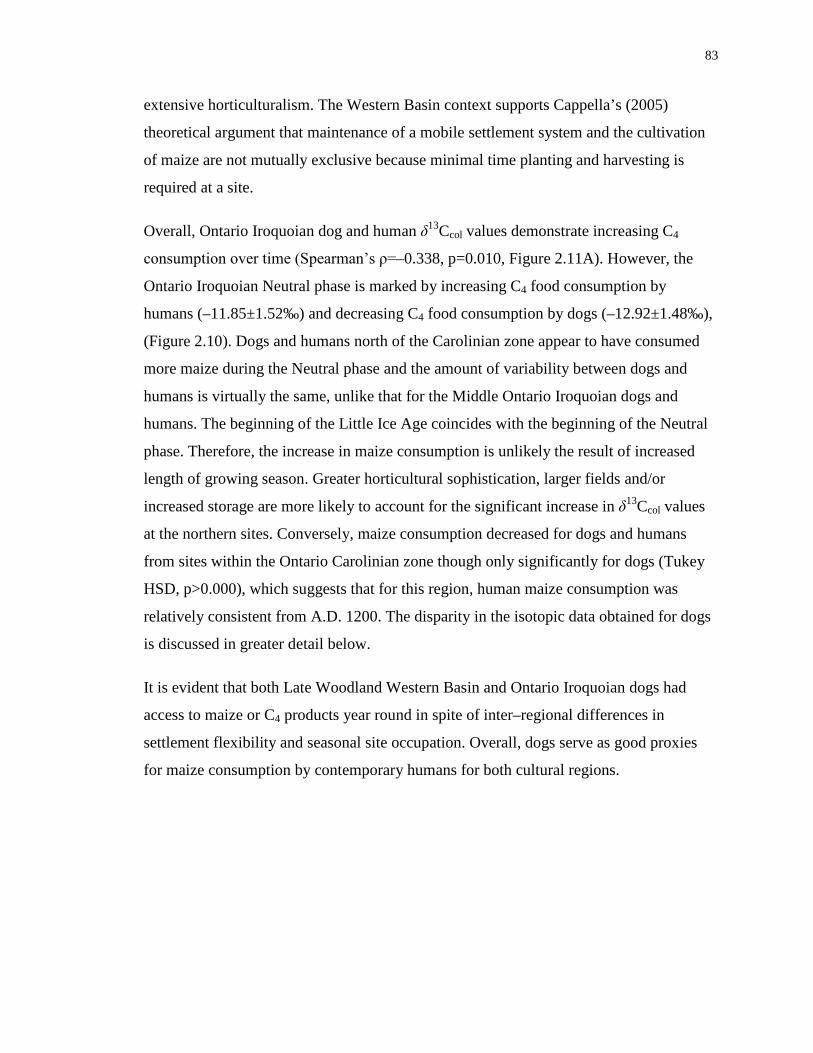
83
extensive horticulturalism. The Western Basin context supports Cappella’s (2005)
theoretical argument that maintenance of a mobile settlement system and the cultivation
of maize are not mutually exclusive because minimal time planting and harvesting is
required at a site.
Overall, Ontario Iroquoian dog and human δ13Ccol values demonstrate increasing C4
consumption over time (Spearman’s ρ=–0.338, p=0.010, Figure 2.11A). However, the
Ontario Iroquoian Neutral phase is marked by increasing C4 food consumption by
humans (–11.85±1.52‰) and decreasing C4 food consumption by dogs (–12.92±1.48‰),
(Figure 2.10). Dogs and humans north of the Carolinian zone appear to have consumed
more maize during the Neutral phase and the amount of variability between dogs and
humans is virtually the same, unlike that for the Middle Ontario Iroquoian dogs and
humans. The beginning of the Little Ice Age coincides with the beginning of the Neutral
phase. Therefore, the increase in maize consumption is unlikely the result of increased
length of growing season. Greater horticultural sophistication, larger fields and/or
increased storage are more likely to account for the significant increase in δ13Ccol values
at the northern sites. Conversely, maize consumption decreased for dogs and humans
from sites within the Ontario Carolinian zone though only significantly for dogs (Tukey
HSD, p>0.000), which suggests that for this region, human maize consumption was
relatively consistent from A.D. 1200. The disparity in the isotopic data obtained for dogs
is discussed in greater detail below.
It is evident that both Late Woodland Western Basin and Ontario Iroquoian dogs had
access to maize or C4 products year round in spite of inter–regional differences in
settlement flexibility and seasonal site occupation. Overall, dogs serve as good proxies
for maize consumption by contemporary humans for both cultural regions.
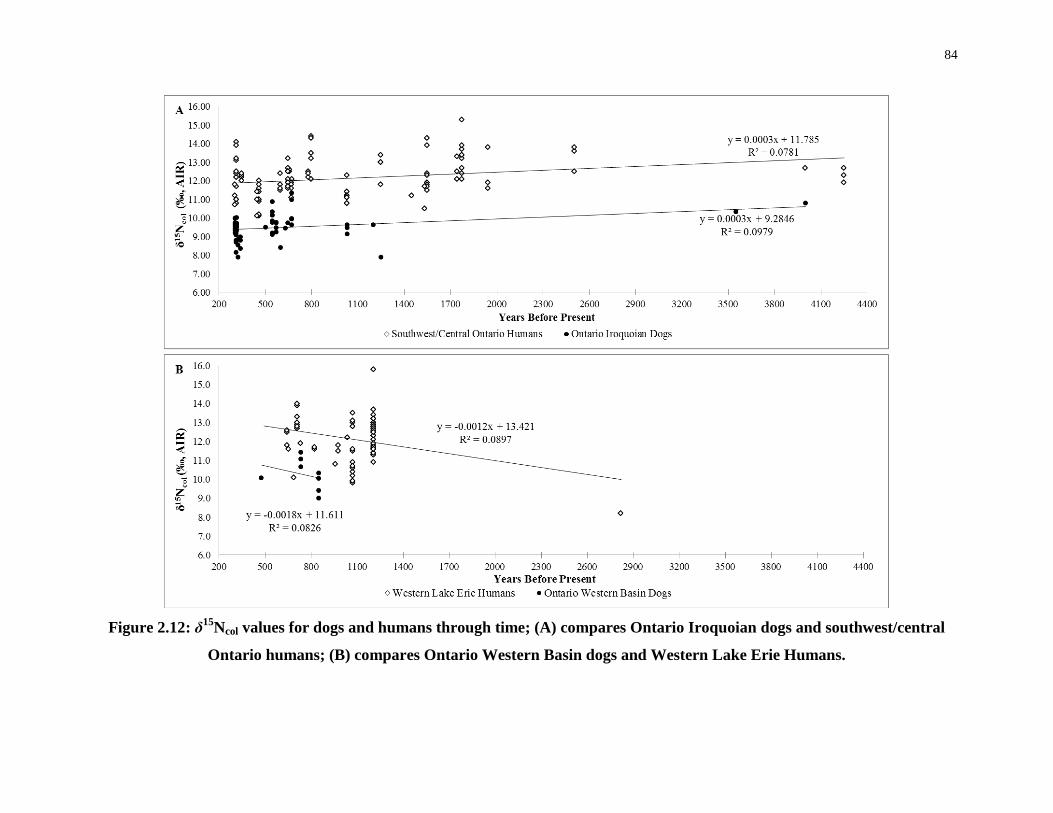
84
Figure 2.12: δ15Ncol values for dogs and humans through time; (A) compares Ontario Iroquoian dogs and southwest/central
Ontario humans; (B) compares Ontario Western Basin dogs and Western Lake Erie Humans.
85
2.4.5 δ15Ncol values of humans versus dogs
The δ15Ncol values of dogs are consistently lower relative to humans across all time
periods for both regions (Figure 2.12A and B) (Tukey HSD, p<0.005 for all time
periods). There is also a strong correlation between human and dog δ15Ncol values for
both cultural groups (Western Basin, Pearson’s r=0.794 and p=0.019 Ontario Iroquoian,
Pearson’s r=0.897, p<0.0005), which suggests that dogs had access to protein resources
supplied by humans.
In the Western Basin Lake Erie region, δ15Ncol values of both dogs and humans increase
with time (Figure 2.12 B), which suggests increasing amounts of higher trophic level
foods. By contrast, in the Ontario Iroquoian region, δ15Ncol values of both dogs and
humans decrease slightly over time (Figure 2.12A), which suggests consumption of lower
trophic level foods or decreased carnivory. The contrast in protein sources between the
two traditions likely indicates that, while Western Basin Lake Erie people were
increasing their dietary emphasis on fish, Ontario Iroquoian peoples were moving away
from fish consumption.
Dogs from combined Western Lake Erie and Central/Southwestern Ontario (i.e., Great
Lakes) sites were on average 2–3‰ lower than their contemporaneous humans, i.e.,
slightly less than one trophic level (Table 2.12). The difference in δ15Ncol values between
Great Lakes dogs and humans is the same and is consistent with previously reported
human-dog δ15Ncol differences (see summary Guiry 2012), specifically in the Eastern
Woodland region (Allitt 2007; Katzenberg 1989; Schwarcz and Schoeninger 1991), and
elsewhere (Allitt 2007; Katzenberg 1989, 2006). Proposed explanations for the
previously noted offsets include diet differences, trophic enrichment of humans from
consumption of dogs, coprophagy by dogs, and/or metabolic differences between dogs
and humans (Allitt 2007; Allitt et al. 2008; Cannon 1999; Guiry 2012; Katzenberg 1989;
2006; Schwarcz and Schoeninger 1991; White et al. 1991).
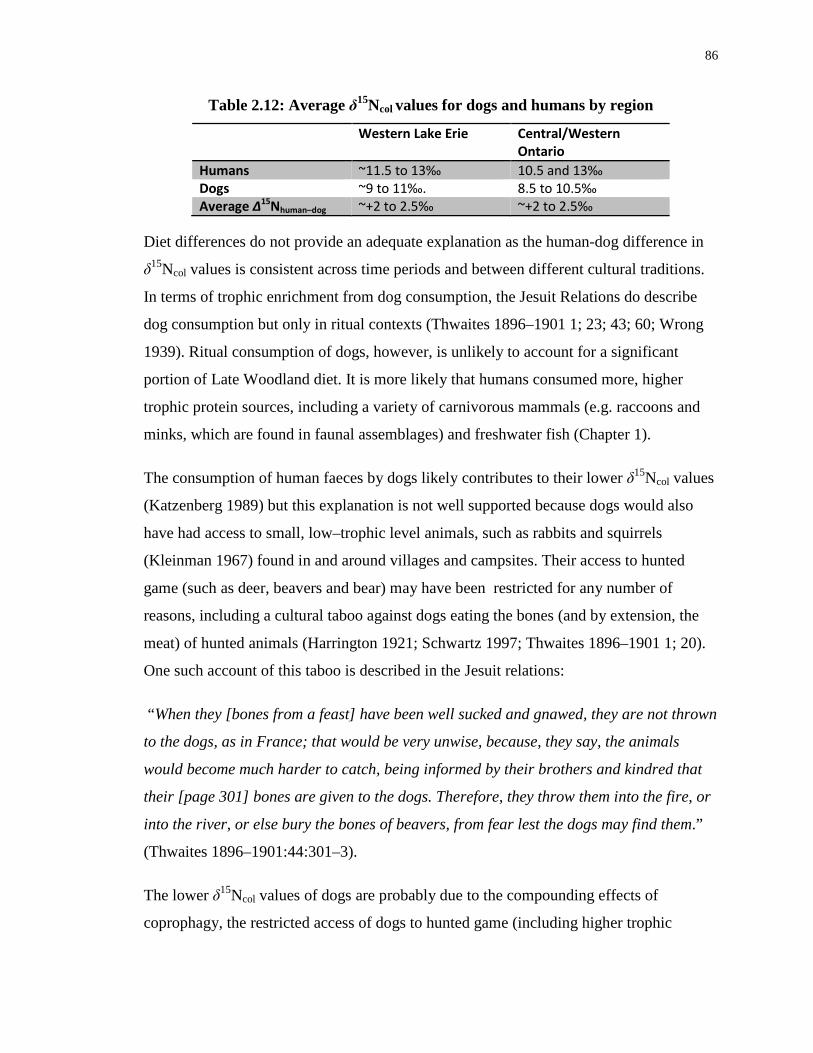
86
Table 2.12: Average δ15Ncol values for dogs and humans by region
Western Lake Erie Central/Western Ontario
Humans ~11.5 to 13‰ 10.5 and 13‰ Dogs ~9 to 11‰. 8.5 to 10.5‰ Average Δ15Nhuman–dog ~+2 to 2.5‰ ~+2 to 2.5‰
Diet differences do not provide an adequate explanation as the human-dog difference in
δ15Ncol values is consistent across time periods and between different cultural traditions.
In terms of trophic enrichment from dog consumption, the Jesuit Relations do describe
dog consumption but only in ritual contexts (Thwaites 1896–1901 1; 23; 43; 60; Wrong
1939). Ritual consumption of dogs, however, is unlikely to account for a significant
portion of Late Woodland diet. It is more likely that humans consumed more, higher
trophic protein sources, including a variety of carnivorous mammals (e.g. raccoons and
minks, which are found in faunal assemblages) and freshwater fish (Chapter 1).
The consumption of human faeces by dogs likely contributes to their lower δ15Ncol values
(Katzenberg 1989) but this explanation is not well supported because dogs would also
have had access to small, low–trophic level animals, such as rabbits and squirrels
(Kleinman 1967) found in and around villages and campsites. Their access to hunted
game (such as deer, beavers and bear) may have been restricted for any number of
reasons, including a cultural taboo against dogs eating the bones (and by extension, the
meat) of hunted animals (Harrington 1921; Schwartz 1997; Thwaites 1896–1901 1; 20).
One such account of this taboo is described in the Jesuit relations:
“When they [bones from a feast] have been well sucked and gnawed, they are not thrown
to the dogs, as in France; that would be very unwise, because, they say, the animals
would become much harder to catch, being informed by their brothers and kindred that
their [page 301] bones are given to the dogs. Therefore, they throw them into the fire, or
into the river, or else bury the bones of beavers, from fear lest the dogs may find them.”
(Thwaites 1896–1901:44:301–3).
The lower δ15Ncol values of dogs are probably due to the compounding effects of
coprophagy, the restricted access of dogs to hunted game (including higher trophic
87
species), the consumption of low-trophic small prey by dogs, and the consumption of
dogs by humans as an important ritual food source. Regardless of the reason for the
Δ15Nhuman-dog offset of 2–2.5‰, its consistency in all time periods and for both traditions
(Tukey HSD, p= 0.992) supports the premise that dogs can serve as proxies for human
subsistence practices in this region.
2.4.6 Models used for reconstructing dog diets
Because the Late Woodland period was a time of shifting subsistence, settlement and
cultural practices and because dogs appear to be good proxies for human subsistence
related activities, their data are now used to shed more light on the nature of the Western
Basin and Ontario Iroquoian traditions, in particular, the in vivo behaviour and treatment
of dogs as related to subsistence, and their post-mortem treatment. The δ13Ccol, δ15Ncol
and δ13Csc values are used to elucidate protein sources, i.e., C3 vs. C4/marine using a
multivariate cluster model (after Froehle et al. 2012, Figure 2.13). This model was
developed using archaeological human data from areas with well-established subsistence
patterns, including data from the Great Lakes region.
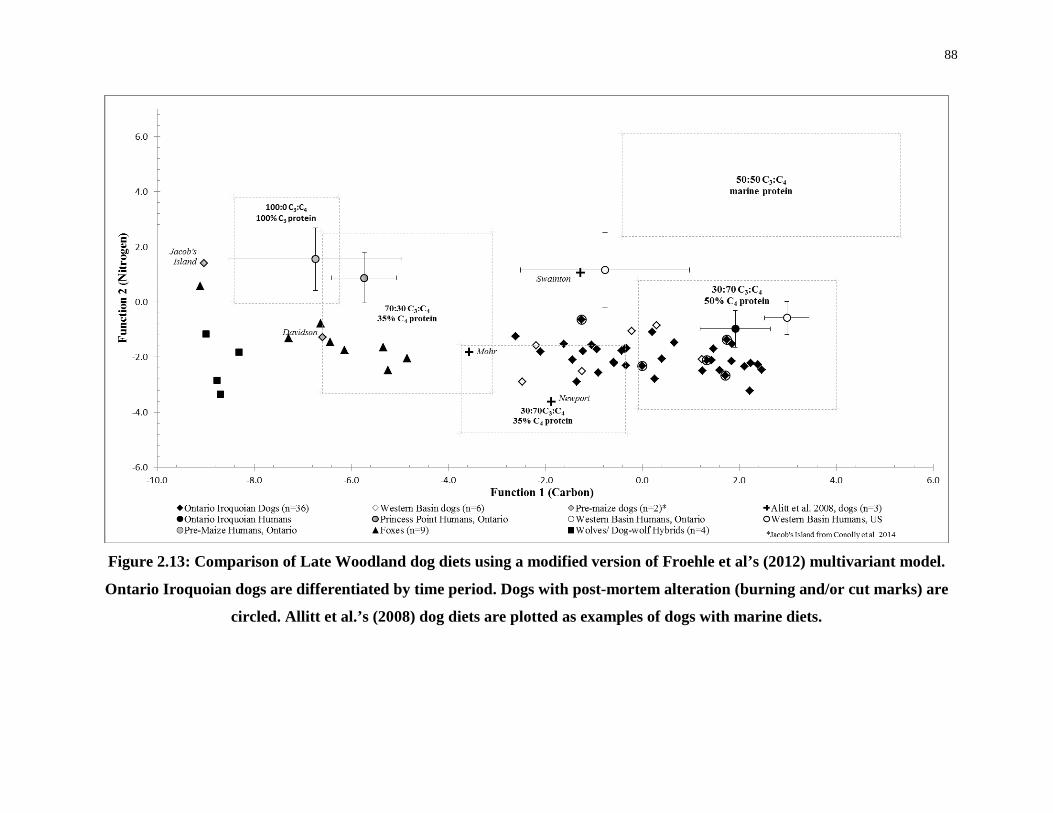
88
Figure 2.13: Comparison of Late Woodland dog diets using a modified version of Froehle et al’s (2012) multivariant model.
Ontario Iroquoian dogs are differentiated by time period. Dogs with post-mortem alteration (burning and/or cut marks) are
circled. Allitt et al.’s (2008) dog diets are plotted as examples of dogs with marine diets.
89
2.4.7 Western Basin dogs
Published isotopic data for Western Basin humans are currently available for only three
Ontario sites: Krieger (Watts et al. 2011), Great Western Park (Dewar et al. 2012) and
Inland West Pit, Location 9 (Spence et al. 2010). The isotopic data for dogs in the current
study significantly expand the number of Ontario Western Basin sites from which
paleodietary information can be inferred (Figure 2.1, Dobleaar, Roffelsen and Inland
West Pit, Location 12). The dogs associated with these sites not only consumed quantities
of maize comparable to larger, contemporary Western Basin villages to the west in
Michigan and Ohio, but also to Iroquoian villages to the east.
Late Woodland Western Basin dogs from this study are not only significantly enriched in 15N relative to Ontario Iroquoian dogs (Mann-Whitney, Z=–2.789, p=0.005) but also
have significantly lower δ13Ccol values (Mann-Whitney, Z=–2.986, p=0.003). Although
there is no difference in their δ13Csc values, Western Basin dogs have a significantly
larger Δ13Csc–col values (Mann-Whiteny U, Z=–2.348, p=0.019). Increased herbivory
could explain a larger Δ13Csc–col value, but it is also possible that a greater portion of the
Ontario Iroquoian dog diet came from C4 resources. The most probable explanation for
the difference in δ15Ncol values is that dogs from Western Basin sites consumed more
higher trophic-level protein, such as freshwater fish, though perhaps less meat over-all,
and similar amounts of maize relative to Ontario Iroquoian dogs. Although there is inter-
site variability among the Western Basin dogs in terms of freshwater fish access, their
diets are consistent with archaeological evidence of subsistence and settlement patterns
for their human counterparts, in particular the location of summer camp sites near
lacustrine and riverine resources (Foreman 2011; Murphy and Ferris 1990). Of the
structural carbonate isotopic compositions of six Western Basin dogs that were analysed,
over half (all from Arkona) fall along the C3 protein line (Figure 2.8) and have diets
corresponding with animals experimentally fed a diet that was 20% protein (100% C3 )
and 80% non–protein (70 to 100% C4) (Tieszen and Fagre 1993; Ambrose and Norr
1993). The four Arkona dogs plot within the 30:70/C3:C4 and 35% C4 protein box shown
on Figure 2.13 (the fourth plots just outside). Although there is some protein in maize
(e.g. 3.2±0.04% in modern fresh maize and 8.6±1.1% in dried maize, USDA 2012), it is
90
negligible compared to that of game meat or fish, which is approximately 20% (raw) and
30% (cooked) protein by weight (USDA 2012). However, a diet in which meat protein is
supplemented with cooked maize could account for the isotopic results and still be
consistent with the archaeological interpretation that Western Basin dogs consumed more 13C-rich freshwater fish. Dogs from the Younge Phase, Arkona site cluster have the
lowest δ15Ncol and δ13Ccol values, which suggests a regionally or temporally specific
pattern in dog provisioning, i.e., unlimited maize access but limited access to freshwater
fish or any game that may have consumed maize, including crop or village pests such as
mice or squirrels. Interestingly, the Arkona sites represent more settled communities that
have greater contact with their Iroquoian neighbours.
The other two Western Basin dogs are from very different contexts and plot closer to the
upper C4 protein line (Figure 2.8) and to the 50% C4 protein consumption box (Figure
2.13). The Roffelsen dog is one of two from a special context mortuary site that was used
for a single family group and dates to approximately A.D. 900–1000 (Grant 2012; Spence
et al. 2014). The dog buried at the site was given ritual treatment; i.e., located at the base
of a wall (Grant 2012; Spence et al. 2014). Because of itsspecial treatment after death,
this dog may also have received distinctive treatment in life. By contrast, the Dobleaar
site is later in time (Wolf phase A.D. 1450–1550), and its assignation as a component of
the Western Basin cultural continuum is contentious (Stothers and Pratt 1981). The high
δ13C value of Dobleaar dog (–12.00‰) relative to all other Western Basin dogs, as well
as the presence of the fox (discussed previously) at this site, distinguish it from other
Western Basin sites, but without further data the reason for the differences cannot be
explained.
2.4.8 Ontario Iroquoian dogs
An ethnohistoric account of Iroquoian dog diets comes from Sagard (1632) who
describes the diet of dogs whose “most usual fare is nothing but the refuse they find in the
streets and on the roads” (Wrong 1939:226). According to Eastern Woodland
mythology, dogs were transitional creatures moving between domestic and wild spaces.
Their ideologically transitional state would enable them to scavenge within villages as
well as maize fields and caches. The lower δ15Ncol values of the Late Woodland Ontario
91
Iroquoian dogs would suggest they did not access as much fish as Western Basin dogs
but may have een consumed scraps of fish and meat as well as scavenged maize/maize
products, perhaps supplemented with small game hunting. Assuming they were mainly
scavengers, the type of refuse they found appears to have changed over time and
indicates two dietary patterns, which correlate roughly with the transition from the
Middle Ontario Iroquoian phase (A.D. 1200 to 1450) to Neutral phase (A.D. 1450–1650),
i.e., A-1 and A-2 groups of domestic dogs noted above.
The primary dietary difference between the two clusters is the C4 protein contribution.
The Middle Ontario Iroquoian dogs cluster in the 50% C4 protein box, whereas the
Neutral phase dogs consumed only 35% C4 protein (Figure 2.13). The shift in protein
source between the two time periods may represent human fishing strategies if lower
δ13Ccol values indicate increased procurement of fish such as pike, bowfin and
perciformes during later periods (see for example, van der Merwe et al 2003: Fig. 4, page
255). Although this interpretation would be consistent with the composition of faunal
assemblages (Foreman 2011), a similar shift is not noted in the isotopic data for humans.
Alternatively, the shift may be related to variable scavenging ability caused by variable
defensibility (presence or absence of palisades) of Middle Ontario Iroquoian sites. For
example, the Crawford site was not palisaded, which would provide dogs with greater
access to corn–pests in fields and refuse in middens found outside village fortifications,
but Neutral sites were predominately and more heavily palisaded (Dodd et al. 1990),
which potentially isolated dogs from the world outside the walls.
The function of dogs and their changing role in the community through time could also
account for the variation, and reflect a Middle Ontario Iroquoian emphasis on specialized
treatment for particular types of dogs (e.g. the use of certain dogs for ritual consumption)
compared to a more generalized role of dogs during the Neutral. Wright (2004:1373)
remarked on the number of butchered dogs found at Middle Ontario Iroquoian sites,
postulating that this time period may have been one “of heightened ceremonial-political
activity.” Campbell and Campbell (1989) noted increased numbers of dogs in middens at
Neutral sites and suggested a shift to a more utilitarian role during the Neutral period.
Burning [Fon-117, Ham-25, Rif-020] and cut marks [Pip(1)-180, Pip(2)-103 and Rif-020]
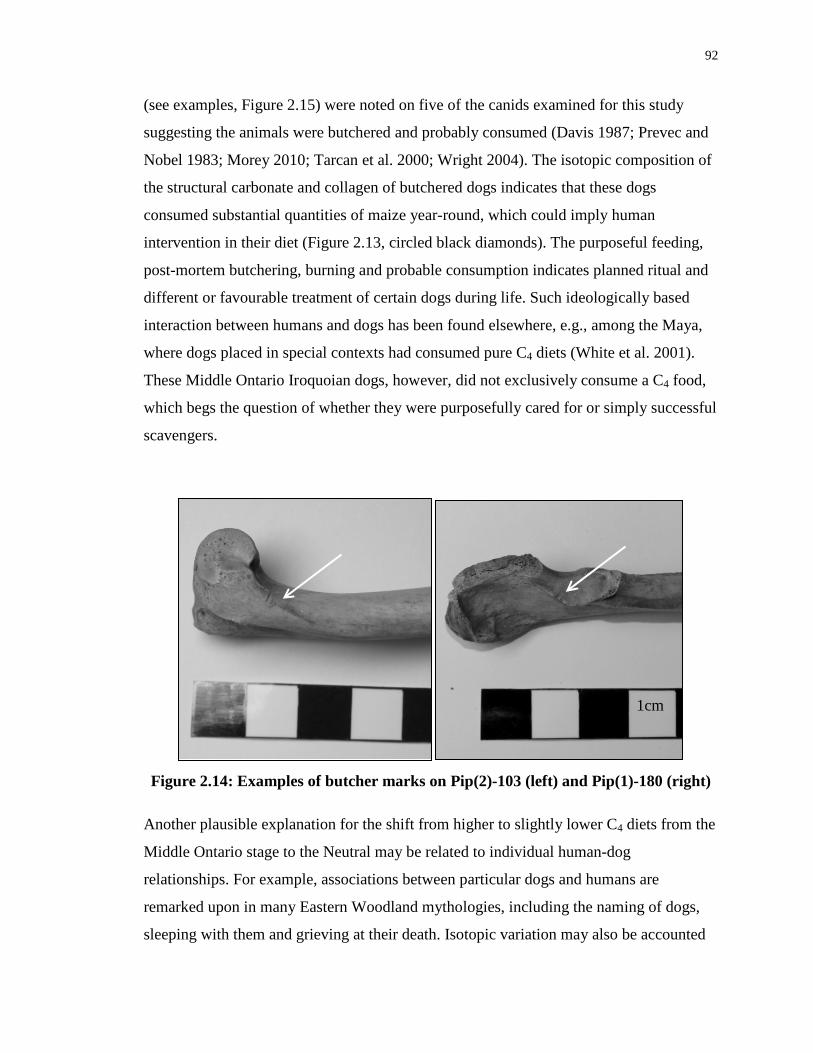
92
(see examples, Figure 2.15) were noted on five of the canids examined for this study
suggesting the animals were butchered and probably consumed (Davis 1987; Prevec and
Nobel 1983; Morey 2010; Tarcan et al. 2000; Wright 2004). The isotopic composition of
the structural carbonate and collagen of butchered dogs indicates that these dogs
consumed substantial quantities of maize year-round, which could imply human
intervention in their diet (Figure 2.13, circled black diamonds). The purposeful feeding,
post-mortem butchering, burning and probable consumption indicates planned ritual and
different or favourable treatment of certain dogs during life. Such ideologically based
interaction between humans and dogs has been found elsewhere, e.g., among the Maya,
where dogs placed in special contexts had consumed pure C4 diets (White et al. 2001).
These Middle Ontario Iroquoian dogs, however, did not exclusively consume a C4 food,
which begs the question of whether they were purposefully cared for or simply successful
scavengers.
Figure 2.14: Examples of butcher marks on Pip(2)-103 (left) and Pip(1)-180 (right)
Another plausible explanation for the shift from higher to slightly lower C4 diets from the
Middle Ontario stage to the Neutral may be related to individual human-dog
relationships. For example, associations between particular dogs and humans are
remarked upon in many Eastern Woodland mythologies, including the naming of dogs,
sleeping with them and grieving at their death. Isotopic variation may also be accounted
1cm
93
for by individual human preference in the treatment of “their” dog or simply be a
function of the sample size. Many of these explanations are not mutually exclusive as
their multiple roles and ideological nature enables dogs simultaneously to occupy many
positions within a single community.
2.4.9 δ18Osc of canids: geographic associations
The δ18Osc values of the canid bones have the potential to reveal information related to in
vivo geographic locations, e.g., whether wild canids were hunted near human settlements.
There are several assumptions that need to be made: (1) the δ18O values of structural
carbonate are well preserved and will reflect locally ingested waters; (2) locally ingested
waters will be associated with local precipitation, and (3) local precipitation can be
extrapolated from modern water station data. Local δ18Oprecipitation values were
interpolated with a Kriging analysis using precipitation isotopic data from across the
Great Lakes region (IAEA/WMO 2013; Longstaffe, unpublished data, Figures 1.2 and
2.16). Structural carbonate isotopic data were transformed to phosphate isotopic
compositions following Iacumin et al. (1996:4):
δ18Ophosphate = 0.98(δ18Osc) –8.5 [Equation 2.2]
Currently, there is no specific equation for the relationship between δ18Ophosphate and
δ18Oprecipitation values for canids, as there is for humans (Daux et al. 2008), deer (Luz et al.
1990), and experimental rats and pigs (see for example Longinelli 1984; Luz and
Kolodny 1985). For this study, two equations were used to calculate δ18Oprecipitation values:
Luz et al.’s general equation (1984:1690) and Luz et al.’s deer-specific equation
(1990:1724). Neither produced significantly different results, and therefore Luz et al.’s
(1990:1724) relationship was selected because it was developed from North American
data, including the Great Lakes region, and allowed the addition of average humidity to
the calculation.
δ18Ophosphate = 34.63 + 0.6506(δ18Oprecipitation) – 0.171(humidity) 12 [Equation 2.3]
12 humidity was estimated at 85%, based on an Ontario average.
94
For the canids whose structural carbonate was analysed (n=56 adults, 4 juveniles), the
δ18Osc values were compared with several geographic variables, including site longitude
and latitude, and estimated δ18Oprecipitation for the site. The only statistically significant
relationship was an association between δ18Osc values and latitude (Spearman’s ρ=0.255,
p=0.049). In order to explore these variables further, juveniles were removed from the
sample set because of a potential breast-feeding weaning bias, with the exception of Pip
(2)-028, the near adult wolf/dog wolf hybrid. Domestic dogs and wild canids were
analysed separately because they are expected to have different access to water sources
i.e., domestic dogs may have consumed water within villages.
Water sources may vary in their δ18O values for several reasons. First, the source of the
water being consumed by an animal will affect the δ18O values (i.e., ground water, direct
precipitation, surface water). For example, ground water δ18O values are usually the
average δ18O value of precipitation from the recharge area, which may have a different
δ18O composition than surface water depending on size and retention-time of the surface
waters (i.e., large lakes versus streams) or if ground water is fed by multiple recharge
areas (Clark and Fritz 1997; Sharp 2007). Variation in the precipitation feeding ground
and surface water (as well as evaporation rates related to temperature and humidity) will
be compounded by the time of year (i.e., changes in temperature, humidity and air mass
sources) (Clark and Fritz 1997; Sharp 2007). Finally, drinking water sources may be
altered by human behaviors, for example boiling of the water will result in highly
evaporated water, which is expected to be enriched in 18O.
The following analysis works on the assumption that if fauna are consuming largely
unaltered precipitation (i.e., minimally evaporated surface water) there will be a
relationship between the estimated δ18O value of local precipitation and the δ18Osc values
of faunal tissues. However, the low geographic variability of the δ18Oprecipitation values
across the Great Lakes region of interest (~2‰ based on the interpolation from
IAEA/WMO 2013 and Longstaffe unpublished data water stations), relative to other
factors, such as seasonal fluctuations and source water, means all interpretations should
be taken with some caution. While a statistical analysis is completed in the following
sections, further work is needed to confirm the findings.

95
Figure 2.15: Archaeological sites with canid remains overlaid on the interpolated δ18O values for local precipitation from the
previously described Kriging model (IAEA/WMO 2013; Longstaffe unpublished data, Figure 1.2). Ancestral Ontario Iroquoian Sites: 1. Pipeline; 2. Rife; 3. Crawford Lake; 4. Bogle II; 5. Hamilton; 6. Winking Bull; 7. Old Lilac Garden; 8. Fonger; 9. Porteous; 10. Walker; 11. Van Besien, 12. Slack-Caswell; 13. Thorold.Pre-maize Sites: 14. Cranberry Creek; 15. Bruce Boyd; 16. Davidson. Ontario Western Basin Sites: 17. Figura; 18; Inland West Pit Sites, Loc. 3, 9 and 12; 19. Dobbelear; 20. Roffelson, 21. Silverman..

96
Figure 2.16: Interpolated δ18Oprecipitation values13 compared to calculated δ18Oprecipitation values based on the δ18Osc values14.
Ontario Iroquoian domestic dogs = black diamonds, Western Basin domestic dogs = circled black diamonds.
13 Interpolated from water station data from IAEA/WMO 2013; Longstaffe unpublished data, Figure 1.2 14 Calculated from Iacumin et al. (1996:4) and Luz et al.’s (1990:1724).
97
There was a stronger association between the wild canid δ18Osc values and the predicted
δ18Oprecipitation values (Spearman’s ρ=–0.631, p=0.028, Figure 2.16), but the correlation is
negative making, which makes interpretation difficult.
For domestic dogs, the only geographic variable significantly correlated with δ18Osc
values was latitude (Pearson’s R=–0.340, p=0.016), which suggests some geographic
relationship between the δ18Osc values of their bones and site location. However, unlike
the wild canids, water consumed by the domestic dogs does not reflect local δ18Oprecipitation
values (Figure 2.16). One putative explanation is that domestic dogs were restricted
geographically (e.g., by palisades or by choosing to stay close to scavenged food) and
therefore limited to imbibing evaporated waters found within villages and campsites (e.g.,
puddles, water collected in pots, or boiled water in sagamite and stews). The δ18Osc
values of the domestic dogs, however, are not significantly higher than those of the wild
canids, which would be expected if the domestic dogs consumed evaporated waters. An
alternative explanation is that dogs ranged between isotopic zones as hunting partners or
were traded between isotopic zones. Ethnohistoric documents from the Eastern
Woodland report that dogs may have been traded and/or sought across great distances
(Thwaites 1896–1901 43; 23). The two possibilities are not mutually exclusive as
multiple roles and treatments are evident for the domestic dogs.
2.5 Conclusion
This paper has demonstrated the importance of integrating multiple isotope analysis with
zooarchaeological data and of using wild and domestic species to understand cultural
preferences regarding hunting strategies and subsistence choices. Wild canids, i.e., foxes
and wolves, have been used here to identify hunting locations and an opportunistic
approach toward certain hunted species. Domestic dogs proved to be excellent proxies for
human diet for both Ontario Iroquoian and Western Basin populations, thereby expanding
the number of sites that could yield dietary data and enabling a better understanding of
the similarities and differences in diet and subsistence.
98
Differences in the frequency of wild canid species recovered from Ontario Iroquoian and
Western Basin faunal assemblages suggest different hunting strategies or patterns of
disposal. The isotopic compositions of bone collagen and structural carbonate of dogs
and wild canids demonstrate variable access to maize and protein sources. The four large
Canid sp., presumed to be wolves, consumed only from a C3 food web, which suggests
geographic separation from human settlement. However, their presence in Iroquoian
faunal assemblages and their δ18Osc values suggest that overlapping hunting territories
could have resulted in occasional interspecies aggression and/or ritual use of wolf
remains. The carbon and nitrogen isotopic compositions of foxes from Ontario Iroquoian
and post A.D. 1400 Western Basin sites indicate they were consuming ‘crop-pests’ and,
in turn may, have been opportunistically hunted while in maize fields. The higher
frequency of fox remains at Iroquoian sites suggests different seasonal land use, hunting
strategies or disposal patterns. Ontario Iroquoian peoples may have actively pursued crop
pests (explored further in the following Chapter 3) while Western Basin peoples pursued
game more often during cold weather and their hunting grounds may have been
geographically separated from the location of their maize fields.
Dogs from both Late Woodland Iroquoian and Western Basin sites effectively serve as
proxies for human diet, thus facilitating comparison of the well-known Ontario Iroquoian
dedicated maize horticultural diet with the diet of the semi-mobile, horticultural Western
Basin peoples. The findings suggest that domestic dogs ate protein from a higher trophic
level than wild canids, which probably indicates more fish in their diet. Both Western
Basin and Ontario Iroquoian dogs ate comparable amounts of maize, which supports
recent evidence of heavy maize consumption by Western Basin human populations.
These findings support year-round maize consumption at Western Basin sites despite the
archaeological evidence of seasonal mobility.
Western Basin dogs appear to have consumed a lot of fish in general, though inter-site
variability suggests that site-specific patterns should be further explored. Younge Phase
dogs at Arkona have distinct diets, marked by more C3 protein. A dog from Roffelsen, a
unique Younge Phase site, has a diet consistent with purposeful maize feeding, which
may be related to its roles before and after death as it was recovered from a special
99
context burial. The single, late phase Western Basin Dobleaar dog had a diet consistent
with year-round maize access and is believed to have consumed large quantities of maize
and presumably freshwater fish.
The Late Woodland Ontario Iroquoian dogs varied both geographically (north of the
Carolinian versus within the Carolinian forest) and temporally. As might be expected,
domestic dogs recovered from within the Carolinian forest, an area marked by longer
growing seasons, had greater access to maize. An unexpected finding was the higher δ13C
values from the earlier, Middle Ontario Iroquoian stage (A.D. 1200–1450) relative to the
Neutral (A.D. 1450 to 1650). Previous research has suggested that the Middle Iroquoian
stage may have been a time of increasing ceremonialism, resulting in more dog sacrifice.
Three of the Middle Ontario Iroquoian dogs display cut marks consistent with post-
mortem butchery and may have been ritually consumed or sacrificed. By contrast, the
later Neutral dogs show no cut marks (although there were two incidences of burning), a
reduction of maize access and more variability in δ15Ncol values. A shift in the type of
freshwater fish consumed by humans (e.g., pike, bowfin and perciformes, which have
lower δ13Ccol values) may explain some of the change, and is consistent with the species
composition of faunal assemblages. In addition, the economic and spiritual role of
Iroquoian dogs may have changed with increasing population size and sedentism.
Whether or not such shifts were the result of stricter taboos, food scarcity or the
development of a different relationship between dogs and people cannot be deciphered
from the stable isotopic analysis alone.
An Archaic dog from the Davidson site represents the oldest canid analysed isotopically
in southwestern Ontario. The dog appears to have consumed high trophic level prey,
probably from both terrestrial and aquatic systems within a C3–dominated food web. Itsr
likely consumption of freshwater fish, not readily available to wild canids, marks its
domesticated status. This finding makes this 3500 year old canid the earliest-known,
definitively domesticated dogs in southwestern Ontario.
No significant differences in oxygen isotopic composition were found between Ontario
Iroquoian and Western Basin domestic dogs. There are, however, differences between
100
domestic dogs and wild canids, which may be related to water access. The negative
correlation between wild canid δ18Osc values and local precipitation is problematic to
interpret. The δ18Osc values of domestic dogs are not correlated with precipitation
isotopic compositions, perhaps because they drank from variable water sources (i.e.,
puddles) or moved around as hunting partners and/or trade items.
The demonstration that dogs can provide a valid dietary proxy for contemporary humans
is a significant step forward in our ability to reconstruct the life-ways of indigenous
peoples in this region, especially as access to human remains is tightly restricted. This
study also provided insight into other aspects of human-canid relationships. The analysis
of both wild and domestic canids from Ontario Iroquoian and Western Basin sites
successfully demonstrated: (1) differences in cultural relationships to land use; (2) dietary
shifts that might reflect changing economic and spiritual roles of dogs during the Late
Woodland period, and (3) differences in hunting patterns.
2.6 Future Work
Future research should focus on the selection of: (1) a wider temporal and geographic
sample of canids in order to fill gaps, particularly from the Middle to Late Woodland
transition, as well as the entire Western Basin temporal span in Ontario, and (2)
specimens where multiple tissues (e.g. enamel, dentine and bone) are available. The latter
would enable expansion of seasonal studies regarding canid access to maize, and
geographic studies of the movement of dogs as proxies for trade. Future work should also
expand on the structural carbonate isotopic analysis of all canids to create more detailed
dietary profiles.
In an exploratory study, isotopic analyses were performed on serial samples of the first
and second permanent mandibular molar (the third permanent molar was not available)
from an archaeological dog (Van 124) from Van Besien site, an Early Ontario Iroquoian
village. The test was successful in capturing a clear weaning signal (Figure 2.17). Based
on modern domestic dog eruption sequences (Hillson 2005:258, Mulligan et al. 1998:72)
and radiographs (n=8) of juvenile dogs (Morris, unpublished), the two molars are
estimated to form over approximately three months, the first molar completing formation
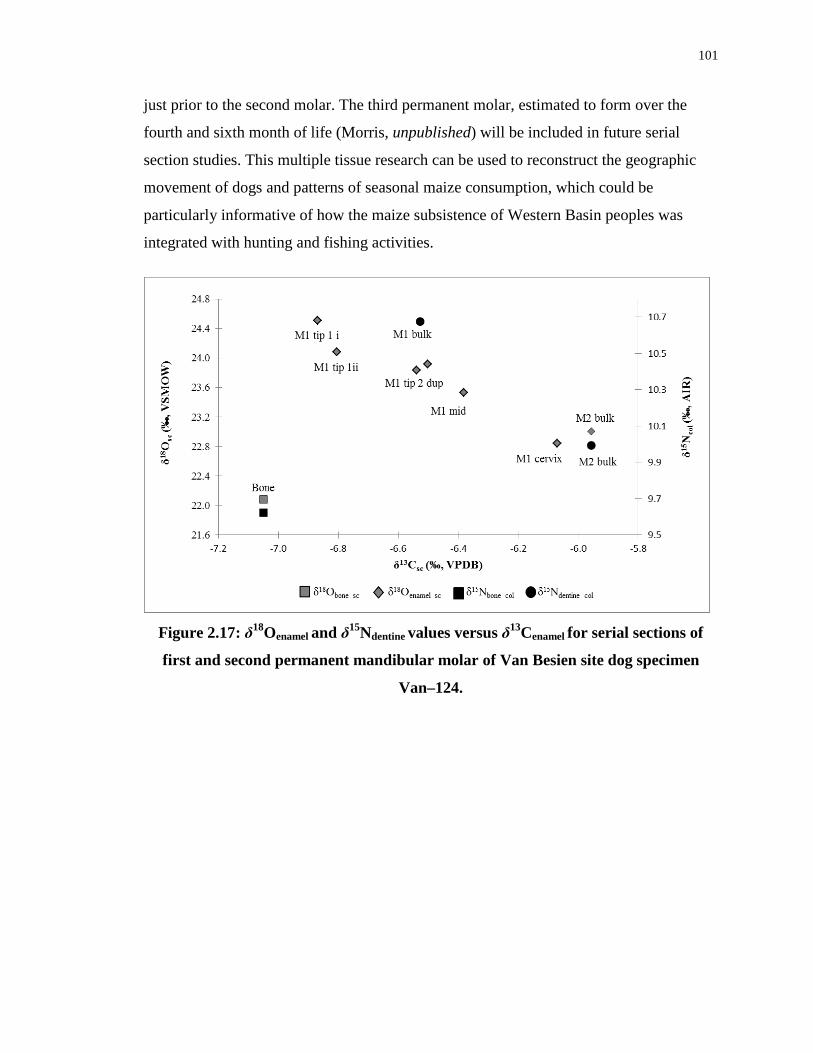
101
just prior to the second molar. The third permanent molar, estimated to form over the
fourth and sixth month of life (Morris, unpublished) will be included in future serial
section studies. This multiple tissue research can be used to reconstruct the geographic
movement of dogs and patterns of seasonal maize consumption, which could be
particularly informative of how the maize subsistence of Western Basin peoples was
integrated with hunting and fishing activities.
Figure 2.17: δ18Oenamel and δ15Ndentine values versus δ13Cenamel for serial sections of
first and second permanent mandibular molar of Van Besien site dog specimen
Van–124.
102
References Cited Allegretto, K.O., 2007. Adopting Maize in the Eastern Woodlands of North America.
[Unpublished Ph.D. thesis]. Brandeis University, Waltham, MA.
Allen, G.M., 1920. Dogs of the American aborigines. Bulletin of the Museum of Comparative Zoology 63(9),429–517.
Allitt, S., 2007. Stable isotopic insights into the subsistence patterns of prehistoric dogs (Canis familiaris) and their human counterparts in Northeastern North America. [Unpublished Ph.D. thesis]. Temple University, Philadelphia, PA .
Allitt, S., Steward, M., Messner, T., 2008. The utility of dog bone (Canis familiaris) in stable isotope studies for investigating the presence of prehistoric maize (Zea mays ssp. Mays): A preliminary study. North American Archaeologist. 29(3–4), 343–367.
Ambrose S.H, Norr L. 1993. Experimental evidence for the relationship of the carbon isotope ratios of whole diet and dietary protein to those of bone collagen and carbonate. In: Lambert J., Grupe, G., (Eds), Prehistoric human bone: archaeology at the molecular level. Springer–Verlag, Berlin, pp. 1–37
Barton, B. S., 1805. Some account of the different species and varieties of Native American or Indian dogs. Philadelphia Medical and Physical Journal (formerly Barton's Medical and Physical Journal), 1(2), 3–31.
Beebe, B. F., 1980. A domestic dog (Canis familiaris L.) of probable Pleistocene age from Old Crow, Yukon Territory, Canada. Canadian Journal of Archaeology, 4), 161–168.
Benecke, N., 1987. Studies on early dog remains from northern Europe. Journal of Archaeological Science. 14, 31–49.
Bentley, R. A., Pietrusewsky, M., Douglas, M. T., Atkinson, T. C., 2005. Matrilocality during the prehistoric transition to agriculture in Thailand? Antiquity, 79(306), 865–881.
Blau, H., 1964. The Iroquois White Dog Sacrifice: Its Evolution and Symbolism. Ethnohistory, 97–119.
Bligh, E. G., Dyer, W. J, 1959. A rapid method of total lipid extraction and purification. Canadian journal of biochemistry and physiology, 37(8), 911–917.
Bonafini M., Pellegrini, M., Ditchfield P., Pollard, A.M. 2013. Investigations of the 'canopy effect' in the isotope ecology of temperature woodlands. Journal of Archaeological Science 4, 3926–3935.

103
Booth, L., White, C. D. , Longstaffe, F.J.,. Hodgetts, L., Morris, Z.H., 2012. An isotopic analysis of faunal remains from suspected ritual deposits on Ontario Iroquoian Tradition sites. Published abstract of the 77th Annual Meeting of the Society for American Archaeology, Memphis N, April 18–22.
Brehm, V. (Ed.), 2011. Star Songs and Water Spirits: A Great Lakes Native Reader. Ladyslipper Press, Tustin, MI.
Brizinski, M., Savage, H., 1983. Dog sacrifices among the Algonkian Indians: an example from the Frank Bay Site. Ontario Archaeology, 39, 33–40.
Bruchac, J. 1995. The Dog People: Native dog stories. Fulcrum Publishing, Golden, CO.
Burleigh, R., Brothwell, D., 1978. Studies on Amerindian dogs, 1: Carbon isotopes in relation to maize in the diet of domestic dogs from early Peru and Ecuador. Journal of Archaeological Science, 5, 355–362.
Campbell C., Campbell I.D. 1989. The Little Ice Age and Neutral faunal assemblages. Ontario Archaeology, 49, 13–33.
Cannon, A., Schwarcz, H. P., Knyf, M., 1999. Marine–based subsistence trends and the stable isotope analysis of dog bones from Namu, British Columbia. Journal of Archaeological Science, 26(4), 399–407.
Cantwell, A. M., 1980. Middle Woodland dog ceremonialism in Illinois. The Wisconsin Archeologist, 61, 480–496.
Cappella K. 2005. Ontario’s First Farmers? Investigations into Princess Point and the Introduction of Horticulture to Ontario. [Unpublished Ph.D. thesis]. Peterborough: Trent University.
Cerling, T.E. and Harris, J.M., 1999. Carbon isotope fractionation between diet and bioapatite in ungulate mammals and implications for ecological and paleoecological studies. Oecologia, 120(3), 347–363.
Chisholm BS, Nelson DE, Hobson KA, Schwarcz HP, Knyf M., 1983. Carbon isotope measurement techniques for bone collagen: notes for the archaeologist. Journal of Archaeological Sciences 10, 355–360.
Clutton–Brock, J., 1981. Domesticated animals from early times. Heinemann and British Museum (Natural History), London.
Clutton–Brock, J., 1989. Introduction. In: Clutton–Brock, J. (Ed.), The walking larder: patterns of domestication, pastoralism, and predation. Unwin and Hyman, London, pp. 1–5.
104
Clutton–Brock, J., 1994. The unnatural world: Behavioural aspects of humans and animals in the process of domestication. In: Manning, A., Serpell, J., (Eds), Animals and society; Changing perspectives, Routledge, London, pp. 23–35.
Clutton–Brock, J., 1995. Origins of the dog: domestication and early history. In: Serpell, J. (Ed.), The domestic dog: Its evolution, behaviour and interactions with people, Cambridge University Press, Cambridge, pp. 7–20.
Clutton–Brock, J. 2000. Introduction. In: Crockford, S. J. (Ed.), Dogs Through Time: An Archaeological Perspective; Proceedings of the 1st ICAZ Symposium on the History of the Domestic Dog, BAR International Series, 889,pp. 3–10.
Clutton–Brock, J., Noe–Nygaard, N., 1990. New osteological and C–isotope evidence on mesolithic dogs: Comparisons to bunters and fishers at Star Carr, Seamer Cart and Kongemose. Journal of Archaeological Science, 17, 643–653.
Conolly, J., Dillane, J., Dougherty, K., Elaschuk, K., Csenkey, K., Wagner, T., Williams, J., 2014. Early Collective Burial Practices in a Complex Wetland Setting: An Interim Report on Mortuary Patterning, Paleodietary Analysis, Zooarchaeology, Material Culture and Radiocarbon Dates from Jacob Island (BcGo-17), Kawartha Lakes, Ontario. Canadian Journal of Archaeology, 38(1), 106-133.
Coplen, T.B. 1994. Reporting stable hydrogen, carbon and oxygen isotope abundances. Pure and Applied Chemistry. 66, 271 – 276.
Coplen, T.B. 1996. New guidelines for reporting stable hydrogen, carbon, and oxygen isotope–ratio data. Geochimica et Cosmochimica Acta. 60, 3359–3360.
Coplen, T. B., 2011. Guidelines and recommended terms for expression of stable‐isotope‐ratio and gas‐ratio measurement results. Rapid Communications in Mass Spectrometry, 25(17), 2538–2560.
Comaroff, J. L., Comaroff, J., 1990. Goodly beasts, beastly goods: Cattle and commodities in a South African context. American Ethnologist, 17(2), 195–216.
Coppinger, R., Coppinger, L., 2001. Dogs: A startling new understanding of canine origin, behaviour & evolution. Simon and Schuster, New York.
Crockford, S. J., 2000. A commentary on dog evolution: regional variation, breed development and hybridisation with wolves. In: Crockford, S. J. (Ed.), Dogs Through Time: An Archaeological Perspective; Proceedings of the 1st ICAZ Symposium on the History of the Domestic Dog, BAR International Series, 889, pp. 295–312.
Cummins, B. D., 2002. First nations, first dogs: Canadian aboriginal ethnocynology. Detselig Enterprises, Calgary.
105
Daux, V., Lécuyer, C., Héran, M. A., Amiot, R., Simon, L., Fourel, F., Martineau, F., Lynnerup, D., Reychler, H., Escarguel, G., 2008. Oxygen isotope fractionation between human phosphate and water revisited. Journal of Human Evolution, 55(6), 1138–1147.
Davis, S. J.,1992. A rapid method for recording information about mammal bones from archaeological sites. English Heritage AML report, 71: 1–16.
Dawson, K.C.A., 1966. The Kaministikwia Intaglio Dog Effigy Mound. Ontario Archaeology 9, 25–34.
DeNiro, M.J., 1985. Postmortem preservation and alteration of in vivo bone collagen isotope ratios in relation to palaeodietary reconstruction. Nature 317, 806–809.
Dewar, G., Ginter, J.K., Shook, B.A.S., Ferris, N., Henderson, H., 2010. A bioarchaeoloigcal study of a Western Basin Tradition cemetery on the Detroit River. Journal of Archaeological Science 37, 2245–2254.
Dodd, C.F., Poulton, D.R., Lennox, P.A., Smith, D.G., Warrick, G.A., 1990. The middle Ontario Iroquoian stage. In: Ellis, C.J., Ferris, N., (Eds.), The archaeology of southern Ontario to A.D. 1650. Occasional Publications of the London Chapter, OAS Number 5, pp. 321–360.
Donaldson, W., Wortner, S., 1995. The Hind Site and the Glacial Kame Burial Complex in Ontario. Ontario Archaeology 59 ,5–95.
Drucker, D. G., Bocherens, H. 2009. Carbon stable isotopes of mammal bones as tracers of canopy development and habitat use intemperate and boreal contexts. In: Creighton, J.D. Roney, P.J. (Eds.), Forest Canopies: Forest Production, Ecosystem Health, and Climate Conditions Nova Science Publishers, Inc., New York, pp. 103–109.
Ellis, C., 2002. An Unusual Slate Gorget Fragment from Oxford County, Ontario. Ontario Archaeology, 74, 22–42.
Engelbrecht, W., 2003. Iroquois: The making of a Native World. Syracuse University Press, Syracuse.
Ferris, N., 1989. Continuity Within Change: Settlement–subsistence Strategies and Artifact Patterns of the Southwestern Ontario Ojibwa, AD 1780–1861. [Unpublished M.A. thesis]. York University, Toronto, ON.
Fiedel, S. J., 2005. Man's best friend–mammoth's worst enemy? A speculative essay on the role of dogs in Paleoindian colonization and megafaunal extinction. World Archaeology, 37(1), 11–25.
106
Finlayson, W. D., 1998. Iroquoian Peoples of the land of rocks and water A.D. 1000–1650: A study in settlement archaeology, Vol. 1, Special Publication 1, London Museum of Archaeology.
Finlayson, W. D., Bryne, R., 1975. Investigations of Iroquoian settlement and subsistence patterns at Crawford Lake, Ontario-a preliminary report. Ontario Archaeology, 25, 31-36.
Fischer, A., Olsen, J., Richards, M., Heinemeier, J., Sveinbjörnsdóttir, Á. E., Bennike, P., 2007. Coast–inland mobility and diet in the Danish Mesolithic and Neolithic: evidence from stable isotope values of humans and dogs. Journal of Archaeological Science, 34(12), 2125–2150.
Ferris, Neal and Jim Wilson (2009) The Archaeology of a Late Woodland Borderland in Southwestern Ontario. Electronic document, http://uwo.academia.edu/NealFerris/Papers, accessed October 8, 2010.
Foreman, L., 2011. Seasonal subsistence in Late Woodland southwestern Ontario: An examination of the relationship between resource availability, maize agriculture, and faunal procurement and processing strategies. [Unpublished Ph.D. thesis]. The University of Western Ontario, London, ON.
Fox–Dobbs, K., Bump, J. K., Peterson, R. O., Fox, D. L., Koch, P. L., 2007. Carnivore–specific stable isotope variables and variation in the foraging ecology of modern and ancient wolf populations: case studies from Isle Royale, Minnesota, and La Brea. Canadian Journal of Zoology, 85(4), 458–471.
Froehle, A.W., Kellner, C.M., Schoeninger, M.J., 2010. Effect of diet and protein source on carbon stable isotope ratios in collagen: follow up to Warinner and Tuross (2009). Journal of Archaeological Science, 37,2662–2670.
Froehle, A.W., Kellner, C.M., Schoeninger, M.J., 2012. Multivariate carbon and nitrogenstable isotope model for the reconstruction of prehistoric human diet. American Journal of Physical Anthropology, 147, 352–369.
Geese E.M., Bekoff, M. 2004. Coyote Canis latrens. Chapter 4.1 In: Sillero–Zubiri, C., Hoffmann, M., Macdonald, D. W. (Eds.). Canids: foxes, wolves, jackals, and dogs: status survey and conservation action plan (Vol. 62). Osprey Publishing., Cambridge, UK, pp. 81–87.
Grant, A. 2012. The Roffelsen Site (AcHn–33): A Younge Phase, Western Basin Tradition, Special Purpose Site. OAS meetings, Windsor, Ontario.
Guiry, E. J. 2012. Dogs as Analogs in Stable Isotope–Based Human Paleodietary Reconstructions: A Review and Considerations for Future Use. Archaeological Method and Theory. 19, 351–376.

107
Guiry, E. J., & Grimes, V. (2013). Domestic dog (Canis familiaris) diets among coastal Late Archaic groups of northeastern North America: A case study for the canine surrogacy approach. Journal of anthropological archaeology, 32(4), 732–745.
Golder Associates (2012) Stage 2 Archaeological Assessment: Jericho Wind Inc., Jericho Wind Energy Centre, Lambton and Midddlesex Counties, Ontario. Manuscript on file, Ontario Ministry of Tourism, Culture and Sport, Toronto, Ontario.
Gompper, M.E., 2002. Top carnivores in the suburbs? Ecological and conservation issues raised by colonization of North–eastern North America by Coyotes The expansion of the coyote's geographical range may broadly influence community structure, and rising coyote densities in the suburbs may alter how the general public views wildlife. Bioscience, 52(2), 185–190.
Grant, A. 2012. The Roffelsen Site (AcHn-33): A Younge Phase Western Basin Tradition Specialized Site in Southwestern Ontario. Ontario Archaeological Society Annual Meeting, Windsor, ON, November 9-11.
Harrington, M. R., 1921. Religion and Ceremonies of the Lenape (Vol. 19). AMS Press Inc., New York.
Harrison, R. G., Katzenberg, M. A., 2003. Paleodiet studies using stable carbon isotopes from none apatite and Collagen: Examples from Southern Ontario and San Nicolas Island, California. Journal of Anthropological Archaeology, 22, 227–244.
Hogue, S. H. 2003. Corn dogs and hush puppies: diet and domestication at two protohistoric farmsteads in Oktibbeha County, Mississippi. Southeastern Archaeology, 185–195.
IAEA/WMO, 2013. Global Network of Isotopes in Precipitation. The GNIP Database. Accessible at: http://www.iaea.org/water.
Ingold, T., 1994. From Trust to Domination: An alternative history of human–animal relations. In: Manning, A., Serpell, J. (Eds.), Animals and society: Changing perspective, Routledge, London, pp. 1–22.
Kates, M., 1986. Lipid extraction procedures. Techniques of lipidology. Elsevier, Amsterdam.
Katzenberg, M.A., 1989. Stable isotope analysis of archaeological faunal remains from southern Ontario. Journal of Archaeological Science 16, 319–329.
Katzenberg, M. A., 2006. Prehistoric maize in southern Ontario. In: Staller, J., Tykot, R., Benz, B. (Eds.). Histories of maize: multidisciplinary approaches to the prehistory, linguistics, biogeography, domestication, and evolution of maize. Left Coast Press, Walnut Creek, pp. 263–273.
108
Katzenberg, M. A., Schwarcz, H. P., Knyf, M., Melbye, F.J., 1995. Stable isotope evidence for maize horticulture and paleodiet in southern Ontario, Canada. American Antiquity 60, 335–350.
Kellner, C.M., Schoeninger, M.J., 2007. A simple carbon isotope model for reconstructing prehistoric human diet. American Journal of Physical Anthropology, 133, 1112–1127.
Kerber, J.E., 1997. Native American treatment of dogs in Northeastern North America: Archaeological and Ethnohistorical Perspectives. Archaeology of Eastern North America 25, 81–96.
King, C. L., Tayles, N., Gordon, K. C., 2011. Re–examining the chemical evaluation of diagenesis in human bone apatite, Journal of Archaeological Science, 38(9), 2222–2230.
Kleiman, D. G., 1967. Some aspects of social behaviour in the Canidae. American Zoologist, 7(2), 365–372.
Kurath, G. P., Ettawageshik, J., Ettawageshik, F., McNally, M.D., 2009. The art of tradition: sacred music, dance, & myth of Michigan's Anishinaabe, 1946–1955, Michigan State University Press, East Lansing.
Larivière, S., Pasitschniak-Arts, M., 1996. Vulpes vulpes. Mammalian species, 537, 1-11.
Lavin, S. R., Van Deelen, T. R., Brown, P. W., Warner, R. E., Ambrose, S. H., 2003. Prey use by red foxes (Vulpes vulpes) in urban and rural areas of Illinois. Canadian Journal of Zoology, 81(6), 1070–1082.
Lee–Thorp, J.A., 1989. Stable carbon isotopes in deep time. The diets of fossil fauna and hominids. [Unpublished Ph.D. thesis]. University of Cape Town, Cape Town.
Lee–Thorp, J., Sponheimer, M., 2003. Three case studies used to reassess the reliability of fossil bone and enamel isotope signals for paleodietary studies. Journal of Anthropological Archaeology, 22, 208–216.
Lennox, P., 1977. The Hamilton Site: A Late historic Neutral Town. [Unpublished Ph.D. Thesis] McMaster University, Hamilton, ON.
Lennox, P., 2004 A Ceramic effigy with glass eyes from the historic Neutral Hamilton Site. Ontario Archaeology, 4, 15–16.
Leonard, J. A., Wayne, R. K., Wheeler, J., Valadez, R., Guillén, S., Vila, C., 2002. Ancient DNA evidence for Old World origin of New World dogs. Science, 298(5598), 1613–1616.
Longin ,R., 1971. New method of collagen extraction for radiocarbon dating. Nature, 230, 241–242.
109
Longinelli, A., 1984. Oxygen isotopes in mammal bone phosphate: a new tool for paleohydrological and paleoclimatological research? Geochimica et Cosmochimica Acta 48, 385–390.
Lupo, K. D., Janetski, J. C., 1994. Evidence of domesticated dogs and some related canids in the eastern Great Basin. Journal of California and Great Basin Anthropology, 199–220.
Luz, B., Kolodny, Y., 1985. Oxygen isotope variations in phosphate of biogenic apatites, IV. Mammal teeth and bones. Earth and Planetary Science Letters, 75(1), 29–36.
Luz, B., Kolodny, Y., Horowitz, M., 1984. Fractionation of oxygen isotopes between mammalian bone–phosphate and environmental drinking water. Geochimica et Cosmochimica Acta, 48, 1689–1693.
Luz, B., Cormie, A. B., Schwarcz, H. P., 1990. Oxygen isotope variations in phosphate of deer bones. Geochimica et Cosmochimica Acta, 54(6), 1723–1728.
Mariotti, A., 1983. Atmospheric nitrogen is a reliable standard for natural 15N abundance measurements. Nature, 303, 685–687.
Mathews, Z. P., 1980. Of Man and Beast: The chronology of effigy pipes among Ontario Iroquoians. Ethnohistory, 295–307.
McKinney, C.R., McCrea, J.M., Epstein, S., Allen, H.A., Urey, H.C., 1950. Improvements in mass spectrometers for the measurement of small differences in isotope abundance ratios. Review of Scientific Instruments, 21(8), 724–730.
Metcalfe, J. Z., Longstaffe, F. J., White, C. D., 2009. Method–dependent variations in stable isotope results for structural carbonate in bone bioapatite. Journal of Archaeological Science, 36(1), 110–121.
Morey, D. F. 2006. Burying key evidence: the social bond between dogs and people. Journal of Archaeological Science, 33(2), 158–175.
Morey, D.,2010. Dogs: domestication and the development of a social bond. Cambridge University Press, Cambridge.
Morey, D. F., Wiant, M. D., 1992. Early Holocene domestic dog burials from the North American Midwest. Current Anthropology, 224–229.
Murphy, C., Ferris, N., 1990. The late Woodland Western Basin tradition of southwestern Ontario. In: Ellis, C.J., Ferris, N. (Eds.), The Archaeology of Southern Ontario to AD, 1650, Occasional Publications of the London Chapter, OAS Number 5, pp. 189–278
Nielsen–Marsh, C. M., Hedges, R. E. 2000. Patterns of diagenesis in bone I: the effects of site environments. Journal of Archaeological Science, 27(12), 1139–1150.
110
O'Leary, M. H., 1981. Carbon isotope fractionation in plants. Phytochemistry, 20(4), 553–567.
Oberholtzer, C., 2002. Fleshing out the evidence: from Archaic dog burials to historic dog feasts. Ontario Archaeology, 73, 314.
Olsen, S. J., 1985. Origins of the domestic dog: the fossil record. Tucson: University of Arizona Press. Tucson.
Olsen, S. L., 2000. The secular and sacred roles of dogs at Botai, North Kazakstan. In: S.J. Crockford (Ed.), Dogs Through Time: An Archaeological Perspective. Proceedings of the 1st ICAZ Symposium on the History of the Domestic Dog, BAR International Series, 889, 71–92.
Paradiso, J.L., Nowak, R.M., 1982. Wolves: Canis lupus and Allies. In: Chapman, J.A., Feldhamer, G.A. (Eds.), Wild Mammals of North America: Biology, Management and Economics. The Johns Hopkins University Press, Baltimore, pp. 460–474.
Parmalee, P.W., Stephens, D. 1972. A wolf mask and other carnivore skull artifacts from the Palestine site, Illinois, Pennsylvania Archaeologist, 42,, 71–5.
Parmenter, J., 2010. The edge of the woods: Iroquoia 1534–1701. East Lansing: Michigan State University Press.
Prevec, R., Noble, W. C., 1983. Historic Neutral Iroquois faunal utilization. Ontario Archaeology, 39, 41–56.
Pucéat, E., Reynard, B., Lécuyer, C., 2004. Can crystallinity be used to determine the degree of chemical alteration of biogenic apatites?. Chemical Geology, 205(1), 83–97.
Raisor, M. J., 2004. Determining the antiquity of dog origins: canine domestication as a model for the consilience between molecular genetics and archaeology [Unpublished Ph.D. thesis], Texas A&M University.
Raisor, M. J.,2005. Determining the antiquity of dog origins: canine domestication as a model for the consilience between molecular genetics and archaeology (Vol. 1367). British Archaeological Reports Ltd.
Richardson, J., 2012. Fauna Boreali–Americana; Or, The Zoology of the Northern Parts of British America: Containing Descriptions of the Objects of Natural History Collected on the Late Northern Land Expeditions Under Command of Captain Sir John Franklin, RN (Vol. 2). Cambridge University Press, New York.
Rick, T. C., Culleton, B. J., Smith, C. B., Johnson, J. R., Kennett, D. J., 2011. Stable isotope analysis of dog, fox, and human diets at a Late Holocene Chumash village (CA–SRI–2) on Santa Rosa Island, California. Journal of Archaeological Science, 38(6), 1385–1393.
111
Rink, W. J., Schwarcz, H. P., 1995. Tests for diagenesis in tooth enamel: ESR dating signals and carbonate contents. Journal of Archaeological Science, 22(2), 251-255.
Russell, N., 2012. Social Zooarchaeology: Humans and Animals in Prehistory. Cambridge University Press, New York.
Ryder, M.L., 2000. Harr measurements of domestic dogs. In: Crockford, S. J. (Ed.), Dogs Through Time: An Archaeological Perspective; Proceedings of the 1st ICAZ Symposium on the History of the Domestic Dog, BAR International Series, pp. 251–256.
Samuel, D.E., Nelson, B.B., 1982. Foxes: Vulpes vulpes and Allies. In: Chapman, J.A., Feldhamer, G.A. (Eds.), Wild Mammals of North America: Biology, Management and Economics. The Johns Hopkins University Press, Baltimore, pp. 460–474.
Savolainen, P., Zhang, Y., Luo, J., Lundeberg J., Leitner, T., 2002. Genetic Evidence for an East Asian Origin of Domestic Dogs. Science 298:1610–1613.
Schoeller, D.A., 1999. Isotope Fractionation: Why Aren’t We What We Eat? Journal of Archaeological Science 26:667–673.
Schulting, R. J., Richards, M. P., 2002. Dogs, ducks, deer and diet: New stable isotope evidence on Early Mesolithic dogs from the Vale of Pickering, North–East England. Journal of Archaeological Science, 29(4), 327–333.
Schurr, M. R., Redmond, B. G., 1991. Stable isotope analysis of incipient maize horticulturists from the Gard Island 2 site. Midcontinental Journal of Archaeology, 69–84.
Schwarcz, H. P., Schoeninger, M. J., 1991. Stable isotope analyses in human nutritional ecology. American Journal of Physical Anthropology, 34(S13), 283–321.
Schwarcz, H. P., Melbye, J., Anne Katzenberg, M., Knyf, M., 1985. Stable isotopes in human skeletons of southern Ontario: reconstructing palaeodiet. Journal of Archaeological Science, 12(3), 187–206.
Schwarcz, H. P., Gibbs, L., Knyf, M., 1812. Oxygen isotope analysis as an indicator of place of origin. Snake Hill: An investigation of a military cemetery from the War of, 1991, 262–268.
Schwartz, M., 1997. A history of dogs in the early Americas. Yale University Press: New Haven.
Shipman, P., 2010. The animal connection and human evolution. Current Anthropology, 51(4), 519–538.
112
Smith, B.A., 2000. Ritual Dog Burials and the Relation to exchange and ethnicity in the Late Precontact Upper Great Lakes. Published abstract of the 65th Annual Meeting of the Society for American Archaeology, Philadelphia, PA, April.
Smith, D.G., Crawford, G., 1997. Recent Developments in the Archaeology of the Princess Point complex in Southern Ontario, Canadian Journal of Archaeology 21(1), 9–32.
Spence, M.W., White, C.D., Ferris, N., Longstaffe, F.J., 2010. Treponemal infection in a Western Basin community. KEWA, 8, 1–10.
Spence, M. W., Williams, L. J., Wheeler, S. M., 2014. Death and Disability in a Younge Phase Community. American Antiquity, 79(1), 108–126.
Stewart, F. L., 2000. Variability in Neutral Iroquoian Subsistence, AD 1540–1651. Ontario Archaeology, 69, 92–117.
Stothers, B.M. Bechtel, S.K., 1987. Stable Carbon Isotope Analysis: An Inter–Regional Perspective. The Archaeology of Eastern North America 15, 137–154.
Stuart–Williams, H. L. Q., Schwarcz, H. P., White, C. D., Spence, M. W., 1996. The isotopic composition and diagenesis of human bone from Teotihuacan and Oaxaca, Mexico. Palaeogeography, Palaeoclimatology, Palaeoecology, 126(1), 1–14.
Szpak, P., Orchard, T. J., Gröcke, D. R., 2009. A late holocene vertebrate food web from southern Haida Gwaii (Queen Charlotte Islands, British Columbia). Journal of Archaeological Science, 36(12), 2734–2741.
Tankersley, K. B., Koster, J. M., 2009. Sources of stable isotope variation in archaeological dog remains. North American Archaeologist, 30(4), 361–375.
Tarcan, C., Cordy, J.M., Bejenaru, L., Udrescu, M., 2000. Butchery Evidence on Dog Faunal Remains from Roman Period Sites in Belgium (Braives and Romania). In: Crockford, S. J. (Ed.), Dogs Through Time: An Archaeological Perspective; Proceedings of the 1st ICAZ Symposium on the History of the Domestic Dog, BAR International Series, pp. 123–128.
Thwaites, Reuben Gold (Ed.). (1896–1901). The Jesuit Relations and Allied Documents:
Travels and explorations of the Jesuit missionaries in New France 1610–1791. The Burrows Brothers Co., Cleveland, OH. Website http://puffin.creighton.edu/jesuit/relations/relations_48.html
Tieszen, L.L., Fagre, T., 1993. Carbon isotopic variability in modern and archaeological maize. Journal of Archaeological Science, 30, 25–40.
113
Urton, E. J., Hobson, K. A., 2005. Intrapopulation variation in gray wolf isotope (δ15Ncoland δ13C) profiles: implications for the ecology of individuals. Oecologia, 145(2), 316–325.
van der Merwe, N. J., Williamson, R. F., Pfeiffer, S., Thomas, S. C., Allegretto, K. O., 2003. The Moatfield ossuary: Isotopic dietary analysis of an Iroquoian community, using dental tissue. Journal of Anthropological Archaeology, 22(3), 245–261.
van Klinken, G. J., 1999. Bone collagen quality indicators for palaeodietary and radiocarbon measurements. Journal of Archaeological Science, 26(6), 687–695.
Vilà, C., Savolainen, P., Maldonado, J. E., Amorim, I. R., Rice, J. E., Honeycutt, R. L., Crandall, K.A., Lundeberg, J., Wayne, R. K., 1997. Multiple and ancient origins of the domestic dog. Science, 276(5319), 1687–1689.
Voigt, D. R., 1987. Red fox. In: Novak, M. (Ed.), Wild furbearer management and conservation in North America, pp. 379–392.
Vogel, J.C., 1978. Recycling of carbon in a forest environment, Oecologia Plantarum 13, 89–94.
Walker, D. N., Frison, G. C., 1982. Studies on Amerindian dogs, 3: Prehistoric wolf/dog hybrids from the Northwestern Plains. Journal of Archaeological Science, 9(2), 125–172.
Wang, X., Tedford, R.H., 2008. Dogs: Their Fossil Relatives and Evolutionary History. Columbia University Press: New York.
Warinner, C., Tuross, N., 2009. Alkaline cooking and stable isotope tissue–diet spacing in swine: archaeological implications. Journal of Archaeological Science, 36(8), 1690–1697.
Warren, D.M. 2000. Paleopathology of Archaic Period dogs from the North American southeast. In: Crockford, S. J. (Ed.), Dogs Through Time: An Archaeological Perspective; Proceedings of the 1st ICAZ Symposium on the History of the Domestic Dog, BAR International Series, pp. 105–114.
Watts, C. M., White, C. D., Longstaffe, F. J., 2011. Childhood diet and Western Basin tradition foodways at the Krieger site, southwestern Ontario, Canada. American Antiquity, 76(3), 446–472.
Wayne, R. K., 1993. Molecular evolution of the dog family. Trends in genetics, 9(6), 218–224.
Wayne, R. K., Lehman, N., Allard, M. W., Honeycutt, R. L., 1992. Mitochondrial DNA variability of the gray wolf: genetic consequences of population decline and habitat fragmentation. Conservation Biology, 6(4), 559–569.
114
Weiner, S., Bar–Yosef, O., 1990. States of preservation of bones from prehistoric sites in the Near East: a survey. Journal of Archaeological Science, 17(2), 187–196.
White, C.D., 2004. Stable isotopes and the human–animal interface in Maya biosocial and environmental systems. Archaeofauna 13, 183–198.
White, C. D., Healy, P. F., Schwarcz, H. P., 1993. Intensive agriculture, social status, and Maya diet at Pacbitun, Belize. Journal of Anthropological Research, 347–375.
White, C. D., Pohl, M. E., Schwarcz, H. P., Longstaffe, F. J., 2001. Isotopic evidence for Maya patterns of deer and dog use at Preclassic Colha. Journal of Archaeological Science, 28(1), 89–107.
White, C. D., Pohl, M. D., Schwarcz, H. P., Longstaffe, F. J., 2004. Deer and Dog Diets at Lagartero, Tikal, and Copán. In. Emery, K.F. (Ed.), Maya zooarchaeology: New directions in method and theory, The Cotsen Institute of Archaeology Press, Los Angeles, pp.141–158.
Williams, J. S., White, C. D., Longstaffe, F. J., 2005. Trophic level and macronutrient shift effects associated with the weaning process in the Postclassic Maya. American Journal of Physical Anthropology, 128(4), 781–790.
Wright, J.V., 2004. History of the Native people of Canada: Volume III (A.D. 500 – European Contact). Mercury Series, Archaeological Survey of Canada Paper No. 152, National Museum of Man, Ottawa.
Wright, L. E., Schwarcz, H. P., 1996. Infrared and isotopic evidence for diagenesis of bone apatite at Dos Pilas, Guatemala: palaeodietary implications. Journal of Archaeological Science, 23(6), 933–944.
Wright, L. E., Schwarcz, H. P., 1998. Stable carbon and oxygen isotopes in human tooth enamel: identifying breastfeeding and weaning in prehistory. American Journal of Physical Anthropology, 106(1), 1–18.
Wright, R.G., Paisley, R.N., Kubisiak, J.F., 1989. Farmland habitat use by wild turkeys in Wisconsin. Proceedings of the Eastern Wildlife Damage Control Conference, 4, 120–126.
Wrong, G. M. (Ed.), 1939. Sagard: The Long Journey to the Country of the Hurons. Toronto: The Champlain Society.
Yohe, R.M., Pauesic, M.G., 2000. Early Archaic domestic dogs from Western Idaho, USA. . In: Crockford, S. J. (Ed.), Dogs Through Time: An Archaeological Perspective; Proceedings of the 1st ICAZ Symposium on the History of the Domestic Dog, BAR International Series, pp. 93–104.
Zeuner, F.E., 1963. A History of Domesticated Animals. Harper & Row, New York.

115
Chapter 3
3 Wild Turkey
3.1 Introduction
“In some districts… there are turkeys, which they call Ondettontaque, not tame but
migrating wild birds. The son–in–law of the great' chief of our town chased one for a
long time near our hut but was unable to catch it. For though these turkeys are heavy and
clumsy they can fly, and in spite of their weight make their escape from tree to tree, and
in this way avoid the arrows. If the savages were willing to give themselves the trouble of
feeding young ones they would domesticate them as well as we do here.” (Wrong
1939:220)
Gabriel Sagard’s quote, describing the relationship of turkey to the Iroquoian-speaking
nations, highlights a commonly held belief that animals are limited to either wild or
domestic spheres. This paper attempts to dispel the myth that human-animal relations are
a dichotomy of the wild versus domestic, and instead, examines the nuanced and varied
relationships of the ancestral Neutral Ontario Iroquoian people with the eastern “wild”
turkey. Employing the concept of spectrum (Russell 2012:251) to explain a range of
human-animal interactions, the stable isotopic and faunal data provide evidence of
“protection” of wild turkeys in the form of purposeful discard of maize waste in fields, a
behaviour that attracted the birds and provided increased food assurance for the Late
Woodland Iroquoian people. As Harris (1996) notes, the range of relations between wild
and domestic is neither inevitable nor unidirectional (i.e. it is reversible). Therefore no
assumptions are made regarding wild turkey domestication in southwestern Ontario.
As the largest terrestrial avian species indigenous to North and Central America, wild
turkeys were an important hunted species, even in regions where domesticated turkeys
are present (see for example use of Merriam’s turkey in the southwest, Speller 2009). The
wild turkey was exploited by indigenous peoples for food, ritual, medicine, tools, and
clothing (Dickson 1992; Laubin and Laubin 1977; McNeese 1998; Ritzenthaler and
Ritzenthaler 1970; Schorger 1966). Numerous ethnohistoric accounts from the northern
116
Eastern Woodland region describe the hunting and consumption of wild turkeys
(Thwaites 1896–1901 vols. 34; 47; 54; 58; 59; 60; 65; 66; 67; 69; 70; 71; Wrong 1939),
the hunting of turkeys in colder months (Thwaites 1896–1901 vols. 21; 32; 34; 59; 60),
the use of turkeys to construct cloaks and hair pieces (Leland 1886; Thwaites 1896–1901
vol. 65), and the use of turkeys in ritual and medicine (Thwaites 1896–1901 vol. 13).
Zooarchaeological data provide evidence of the ubiquity of wild turkeys in Late
Woodland faunal assemblages, though their relative importance varies by site and time
compared to other birds (such as the passenger pigeon), mammals and fish (Foreman
2011; Prevec and Nobel 1983; Stewart 2000). Further, there was a decrease in wild
turkey procurement over the course of the Late Woodland (A.D. 900 to 1600), which is
attributed to a shift to spring planting and fall harvesting of domestic crops (Foreman
2011). It is speculated that the diversion of labour necessitated by these activities would
have caused a reduction of hunting opportunities for cold weather–hunted species
including white-tailed deer and wild turkey. As long-term settlement use and domestic
crop dependency increased over the 700-year period, faunal procurement became less
specialized and more informal (Foreman 2011).
Although there are ample archaeological and ethnohistoric data to indicate that turkeys of
the Eastern Woodland were hunted wild for food, feathers and bones, there are no data to
indicate they were domesticated by either Late Woodland groups of the northeast or
Mississippian peoples of the southeast. They might, however, have been managed and/or
loosely protected by food baiting, i.e., creating a winter feeding-ground by leaving maize
in fields after harvest. This practice has not been described elsewhere in North American
archaeology but is sometimes used today not only by individual hunters and farmers but
also by jurisdictions attempting to aid re-introduction and survival of wild turkeys (see
for example the New Hampshire Fish and Games and Department of Environmental
Conservation [2014, updated May 2015) advisory for feeding wild turkey).
The importance of maize horticulturalism increased significantly around A.D. 1000
becoming a dietary staple for Ontario Iroquoian and Western Basin peoples, two
neighbouring Great Lakes cultural groups. Despite a mutual growing dependence on
117
maize, the two groups maintained different subsistence-settlement strategies (Murphy and
Ferris 1990). Sedentism and population growth increased exponentially after A.D. 1000
among the Iroquois while Western Basin peoples pursued more varied settlement
patterns, often moving in order to exploit seasonal resources. Examination of the animals
exploited by archaeological peoples provides insight into ancient subsistence and hunting
strategies. In this case, the isotopic compositions of wild turkeys from faunal assemblages
were compared with those from modern Ontario wild turkeys and archaeological turkeys
from Eastern Woodland, American Southwestern, and Mexican sites (Figure 3.1) in order
to better understand the faunal record and determine whether Late Woodland Ontario
peoples managed wild turkeys by using maize. Because maize was the only horticultural
C4 plant in southwestern Ontario during the study period, stable isotopes can provide
evidence of human provisioning of wild turkeys with maize. Furthermore, the fact that
turkeys are non–migratory, terrestrial birds that opportunistically forage on available
resources (Eaton 1992; Lippold 1974; Schorger 1966) makes them an ideal proxy for
examining human landscape change in the past.
3.2 Background
3.2.1 The eastern wild turkey: habitat and behaviour
Prior to European contact, the turkey (Meleagris gallopavo) was represented by six
subspecies in Northern and Central America (Figure 3.1). The eastern wild turkey
(Meleagris gallopavo silvestris, or M.g. silvestris) was native to the eastern United States
and southwestern Ontario (Eaton 1992; Godfrey 1966; Shorger 1966). Because severe
winters can devastate wild turkey populations (McIlwraith 1886), the mild climate of
southwestern Ontario is the only Canadian location for these birds and represents their
northern limit (Dean 1994; Prevec and Noble 1983). M.g. ocseola was found in Florida,
and integrated with M.g. silvestris in the southeastern Atlantic and Gulf States. M.g.
intermedia was found from eastern Texas along the northeastern coast of Mexico, while
M.g. mexicana was originally dispersed along the west coast of Mexico. M.g. gallopavo
was originally dispersed throughout central Mexico. Finally, M.g. merriami was found in
the southwest, north of the Mexican border (Eaton 1992; Leopold 1944; Schorger 1966;
Speller et al. 2010).
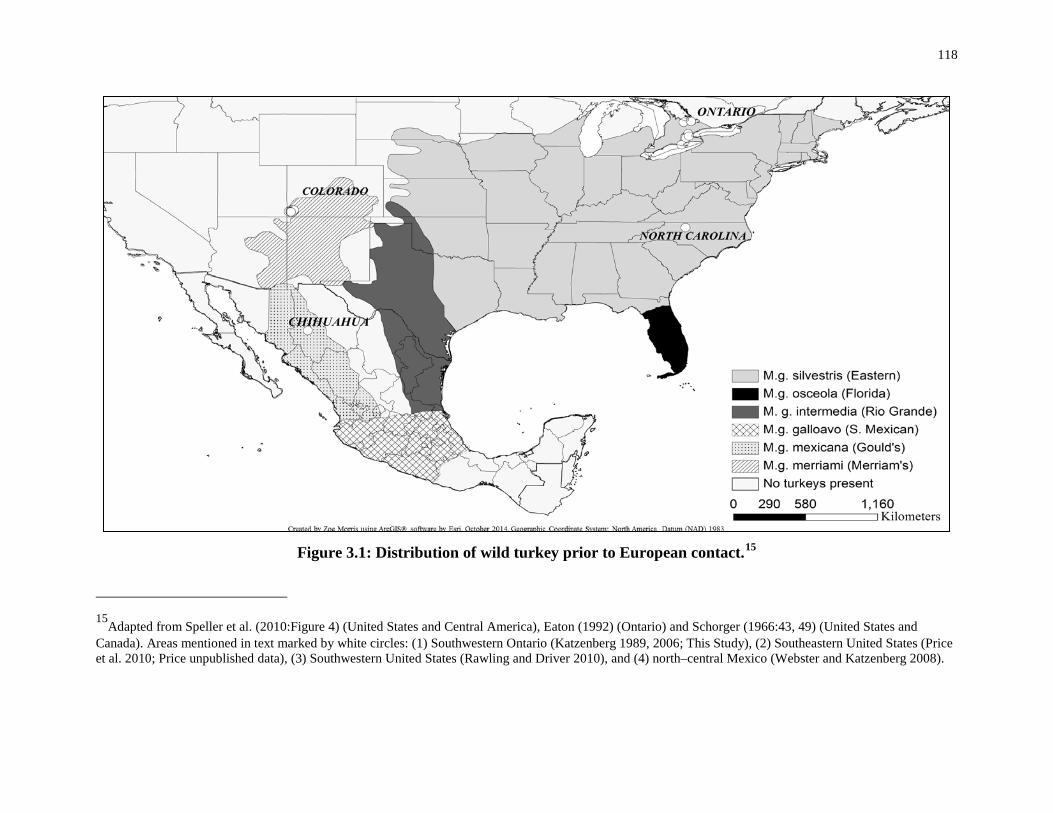
118
Figure 3.1: Distribution of wild turkey prior to European contact.15
15Adapted from Speller et al. (2010:Figure 4) (United States and Central America), Eaton (1992) (Ontario) and Schorger (1966:43, 49) (United States and Canada). Areas mentioned in text marked by white circles: (1) Southwestern Ontario (Katzenberg 1989, 2006; This Study), (2) Southeastern United States (Price et al. 2010; Price unpublished data), (3) Southwestern United States (Rawling and Driver 2010), and (4) north–central Mexico (Webster and Katzenberg 2008).
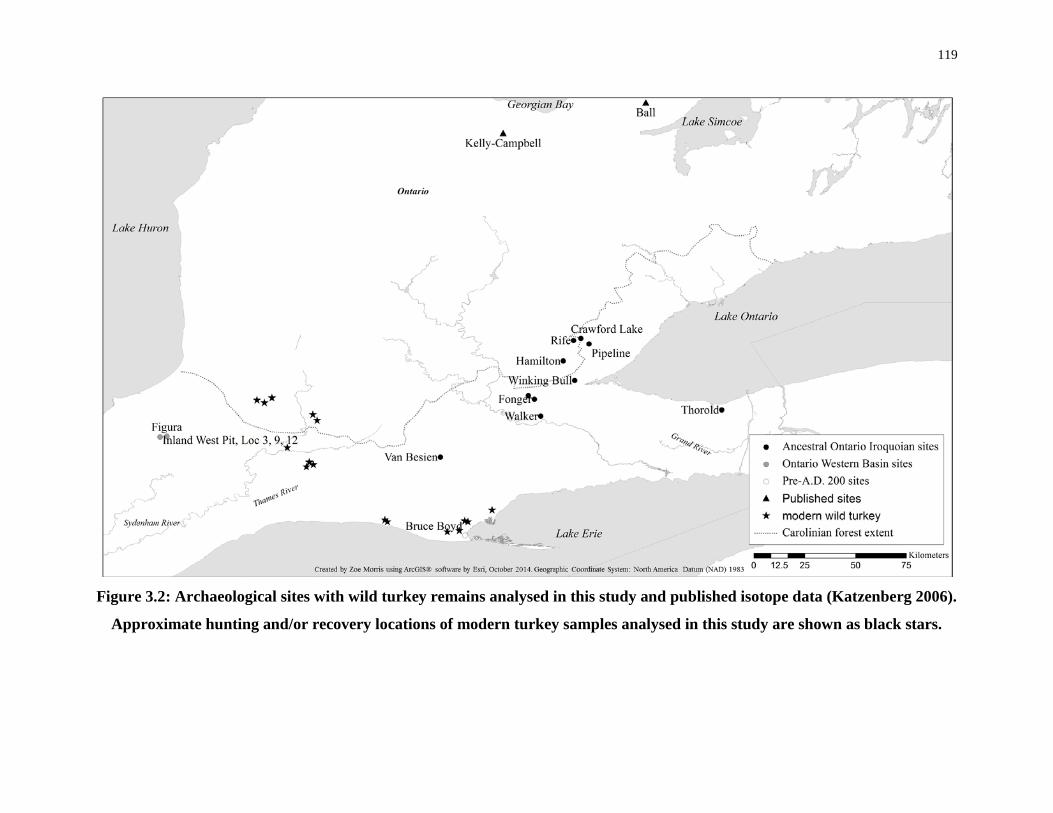
119
Figure 3.2: Archaeological sites with wild turkey remains analysed in this study and published isotope data (Katzenberg 2006).
Approximate hunting and/or recovery locations of modern turkey samples analysed in this study are shown as black stars.
120
Wild turkeys (M.g. silvestris) were extirpated from Ontario due to a disease contracted
from introduced domestic species, over hunting, and land clearing activities, but were re-
introduced to the region in the 1980s (Heckleau 1982; McIlwraith 1886; Weaver 1989).
Weaver (1989:1) analysed the movement of a re–settled population of wild turkeys in
southwestern Ontario describing them as “ecological generalists, adapted to variable and
unpredictable environments.” The modern range of re-introduced wild turkeys is greater
than their post-contact, historic range and considerably more diverse because they are
broadly adaptable (Weaver 1989). Modern ecological studies of wild turkeys suggest that
they can tolerate human population densities up to fifteen persons per km2, exploit a wide
range of food resources and inhabit areas of mature forest that are interspersed with open
meadow or agricultural fields (Hecklau et al. 1982), but they must be near water sources
(Eaton 1992; Schorger 1966; Weaver 1989). Although the diet of the turkey is widely
variable and best described as opportunistic, regionally and seasonally adaptable, it is
dominated by hard and soft mast (i.e., nuts and fruits from trees and shrubs), as well as
insects and small vertebrates (Eaton 1992; Schorger 1966; Weaver 1989). In areas with
available agricultural sources more than half of the diet will include cultigens, with waste
maize comprising up to 77% of the agricultural component or approximately 35% of the
total diet (Groepper et al. 2013; Tefft et al. 2005).
The adaptability of wild turkeys is also reflected in their flexible patterns of movement
and use of home ranges. Researchers have argued that food location and abundance
controls turkey movement, particularly in the winter (Ellis and Lewis 1967). Wild turkeys
in southwestern Ontario do not significantly re-locate during winter (Weaver 1989),
which suggests that they are able to meet nutritional requirements without increasing
daily distance travelled. In fact, the average annual range of southwestern Ontario turkeys
is approximately 1000 acres (Weaver 1989), which is lower than that for the northeastern
United States (see for example Schroger 1960). However, their use of agricultural land,
particularly maize fields, increases during winter months and is often a primary factor in
selection of wintering areas (Ellis and Lewis 1967; Leopold 1944), contributing to higher
survival rates (Hayden 1980; Porter 1977; Porter et al. 1980; Vander–Haegan et al. 1989;
Weaver 1989). Although the feeding range of wild turkeys changes with season, once a
121
food source is found, it is often accessed using the same routes, which makes them
vulnerable to predators, including human hunters (Schorger 1960). Their daily pilgrimage
routes are predictable as are their times of arrival and departure.
The presence of wild turkeys in maize fields has led to their characterization as crop–
pests but, in fact, they rarely cause crop damage. Extensive research in the mid–west and
Ontario has demonstrated that they eat only maize damaged by wind or water, or knocked
down by other animals or left in the fields after harvest (Greene et al. 2010; Groepper et
al. 2013; Tefft et al. 2005; Wright et al. 1989). Turkeys can remove kernels from cobs
that have fallen to the ground but cannot reach or pull down the cobs from standing
stalks. Damage to crops is usually the result of depredation by other species, such as deer
and raccoons (Ontario Ministry of Natural Resources 2007; Tefft et al. 2005). The
presence of wild turkeys in fields may, in fact, benefit farmers because insects (including
known crop-pests such as grasshoppers) are an important summer food for turkeys
(Groepper et al. 2013; MacGown et al. 2006; Wright et al. 1989). Young poults born in
the early summer consume far more insects than mature turkeys, and then convert to a
primarily plant-based diet within four to five weeks after hatching (Dickson 1992; Eaton
1992; Wright 1989). The fact that wild turkeys can only eat maize ears and other
remnants left on the ground has profound implications for archaeological interpretation of
human harvesting patterns and the possible management of wild turkey populations to
create a stable cold weather food source for ancient peoples .
Wild turkey hunting in the northeast, both today and in the past, appears to be restricted
to colder months (October through March), likely because summer turkeys are low
weight and tick-infested (Boone 1851; Foreman 2011; Lippold 1974; Schorger 1966).
3.2.2 Wild versus domesticated: dichotomies versus continuums
In reference to domestication of animals, including wild turkeys in the southwest
United States;. “It has already been shown that agriculture was, in its beginning, an
art of the desert; it may now be affirmed that the sister art, zooculture, is also a child
of sun and sand,” (White 1945:230).
122
An important economic and ritual resource in many indigenous regions (Davis 2001;
Dickson 1992; McKusick 1986; Rawlings and Driver 2010), the turkey was the only
animal domesticated in North America prior to European contact. Even the dog arrived to
the Americas already domesticated. After contact, turkeys quickly became a globally
important food source as Europeans brought domesticated turkeys back to Europe and
other colonies (Crawford 1992; McIlhenny 1914; Russell 2012; Schorger 1966).
Currently, the widely accepted definition of domestication is the selective modification of
a plant or animal in captivity (or isolation from wild counterparts) for the benefit of
humans, resulting in genetic and morphological differences in that organism relative to
their wild progenitors (Bökönyi 1969; Branford Oltenacu 2004; Clutton-Brock 1994;
Harris 1996; Ingold 1994). Russell (2012) has argued that most definitions such as this,
however, are either so broad as to become meaningless, or too exclusionary. Russell does
note that having a definition of domestication is important for defining criteria to identify
human-animal relationships in the past (i.e., morphological changes, shifts to animals as
property, etc.). The concept of domestication defined above does provide a general
understanding of how (isolated, selective breeding) and why (human benefit)
domestication may occur. Therefore, it is possible to examine wild and domestic species
morphologically and consider the various ways humans used those animals for their
benefit. However, the definition does not leave room for other human-animal
interactions. For example, management of certain species to maintain “wild” populations
would not be recognized as domestication, but may alter natural distributions of a
species. Even the population size and age profiles of “wild animals” may be changed for
human benefit so may not be a clear example of an unaltered relationship (i.e.,
aquaculture, Webster et al. 2004). Nor does the above definition address why certain
organisms may or may not be candidates for domestication. In fact, there are certain
criteria that have been recognized as important for successful domestication for both
plants and animals (see for example Chapter 2, domestication of the wolf). Wild turkeys
exhibit behavioural patterns critical for animal domestication, which include their social
nature (flocking behaviour), promiscuous mating system, strong parent-young bonding,
high fertility, short flight response (non-migratory behaviour), low reactivity to humans
and environmental change and their omnivorous diet and innate adaptability (Breitburg

123
1993:163, after Hale 1969). Their ease of domestication has been demonstrated in the
American southwest and Mexico, where they became an important economic and ritual
resource (Beachum and Durand 2007; Davis 2001; Dickson 1992; McKusick 1986;
Rawlings and Driver 2010).
While some organisms may be prone to domestication, the range of interactions between
humans and animals, which are neither “domestication” nor “not-domestication” cannot
be ignored, as they may be part of the process towards the domestication of species. For
example, there may be different behaviours exhibited by humans interacting with
animals, such as taming, protective herding and free-range management, including
adaptation to human landscape changes and consumption of human waste products,
which alters the nature of their relationship and may begin the process of modification in
the organism, with or without intent for domestication (Harris 1996; Ingold 1994; Russell
2012).
The limiting dichotomy of wild versus domestic, therefore, has justifiably been
challenged by many researchers who advocate a more fluid conceptualization or a
continuum of this human-animal relationship (Harris 1996; Ingold 1994; Russell 2012;
Zeuner 1963). For example, Russell (2012) remarks on the difficulty of defining
domestication because it is only one of a myriad of human-animal relationships, and
argues that the complicated nature of human-animal interactions should be viewed as a
spectrum rather than a continuum, which implies a smooth and/or directional process
(2012). Zeuner (1963:63) described stages of “intensity” where the relationship between
animals and humans may pass from loose contact to the extermination of the wild
ancestors, which is the most extreme result of domestication. The process of
domestication is neither inevitable nor irreversible, but includes a stage of “protection,”
which according to Harris (1996:447-8) falls between predation and domestication.
Protection may include taming of wild animals or free-range management. The spectrum
approach is particularly useful when considering the case of the wild turkey in
southwestern Ontario.
124
Humans benefit from the food security conferred by domestication, as a domesticated
organism is a more controllable, available, and predictable food source than a wild
gathered plant or hunted animal. Increased access to secondary food products such as
eggs, dairy, and by-products (e.g., honey) are also associated with domestication. Other
reasons for domestication include companionship, hunting partners, and beasts of burden
(Clutton–Brock 1994; Harris 1996; Russell 2012).
Nearly simultaneous, but independent, domestication of turkeys in the Americas has been
confirmed genetically, and occurred approximately 2000 years B.P. (Mock et al. 2002;
Speller 2009; Speller et. al. 2010; Thornton et. al. 2012). M.g. gallopavos was
domesticated in south-central Mexico (Schorger 1966) and an as-of-yet unknown
progenitor, most likely M.g. silvestris or M.g. intermedia, was domesticated in the
southwestern United States (Breitburg 1993). The motivation for turkey domestication is
unclear. Some ethnohistoric accounts suggest turkey were domesticated as a food source
for meat and eggs while others argued their feathers were valued more than meat because
of their ritual significance (Breigburg 1993). The activity of feasting, which may involve
the ritual and practical use of animals, has also been suggested as a major motivation for
turkey domestication (Hayden 2009). The separation of ritual and food uses of turkey
may, therefore, be artificial (see for example Zimmerman-Holt 1996) when trying to
understand their domestication.
3.2.3 Previous stable isotope bird studies
The majority of bioarchaeological, paleodietary and paleoenvironmental isotopic studies
focus on the analysis of mammals (human or other). There are fewer studies of ancient
birds, though modern research has been conducted for several species (e.g., Kelly 2000
for summary). Modern bird research has focused on metabolic factors (Hobson and Clark
1992a; 1992b), migration (Hobson 1999; Rubenstein and Hobson 2004), starvation and
fasting (Hatch 2012; Hobson 1993; Kempster et al. 2007), diet reconstruction (Mizutani
et al. 1992) and seasonality (Stearns 2010). The latter study used δ13C values of wild
turkey feathers collected during winter months in Utah to demonstrate the inclusion of
agricultural fields in the winter feeding-range of wild turkeys. Generally, the principles of
125
stable isotopic analysis of bone apply to both birds and mammals, though some key
differences are addressed below.
Bone is a dynamic tissue that continuously remodels throughout life and generally
represents a long-term average of what an organism eats and drinks, but the isotopic
turnover rate of any tissue is correlated with metabolic rate (Hobson and Clark 1992a;
Tieszen et al. 1983). Differences in metabolic rates have been noted between mammals
and birds, and are influenced by habitat, dietary niche and body size (Nagy 1987, 2005).
Birds, in general, have higher metabolic rates than land mammals (e.g., Hobson and
Clark [1992a] calculated the half-life of carbon in Japanese quail collagen to be 173.3
days) but captivity slows down metabolism (Hobson and Clark 1992a; Nagy 1987).
Nonetheless, the family to which turkeys belong (Galliformes) has a low metabolic rate
compared to other birds regardless of wild or captive state (Nagy 2005). As large
terrestrial birds, turkeys most likely have a metabolic rate comparable to equivalent-sized
mammals (Lasiewski et al. 1967). Young birds, however, have much faster bone turnover
rates than adult birds. Consequently, the collagen of juveniles (i.e., < 1 yr old) is assumed
to represent their growth phase, and that of adults, a life-time, post-growth phase average
(Hobson and Clark 1992a). The results of adult and juvenile wild turkeys were therefore
initially considered separately to ensure that there were no statistically significant
differences between the adult and juvenile populations.
Differences in tissue isotope fractionation between birds and mammals could also be
caused by the fact that that birds produce uric acid instead of urea, but to date, no such
differences have been found for collagen (Hobson and Clark 1992b). There are also no
data to suggest that the structural carbonate contained in bone bioapatite behaves
differently in birds and mammals.
3.3 Materials and methods
3.3.1 Materials
Archaeological turkey samples were selected from previously excavated faunal
collections housed at various institutes across southwestern Ontario (Department of
Anthropology, McMaster University; Department of Anthropology, The University of
126
Western Ontario; Ontario Museum of Archaeology) Site descriptions may be found in
Appendix A). Modern wild turkey samples were donated by the Comparative Faunal
Laboratory, Department of Anthropology and Department of Biology, The University of
Western Ontario, as well as by several individuals (Brad Tweddle, Jim Keron, Dr. Ryan
Hladyniuk, Dr. Wendy Russell, and Ted Barney). Figure 3.2 shows the approximate
locations for the modern turkeys and the locations of archaeological sites in Ontario
discussed in the text. Due to variable preservation quality, archaeological wild turkey
samples were selected based on their availability, but where multiple turkeys of the same
age/size were found within a single feature, the same element and side were selected to
avoid duplicate sampling of the same individual. The ulna was preferentially selected
because the wings were the most common portion of the bird donated by hunters.
De-fleshing of the modern turkey samples was completed by the author in the
Zooarchaeology Laboratory, Department of Anthropology, The University of Western
Ontario. Specimen identification was completed by the author, Dr. Lindsay Foreman and
Dr. Lisa Hodgetts, all from the Department of Anthropology, The University of Western
Ontario. The Western comparative collection includes several adult, eastern wild turkey
(M.g. silvestris) skeletons, along with many other indigenous birds from Ontario, which
were used for morphological comparison. Wild turkeys are the largest terrestrial bird in
Ontario and therefore have a morphologically distinct skeleton, which helps to
differentiate their fragmentary remains from those of other large bird species, most of
which are migratory and/or aquatic.
The collagen of eighty wild turkeys was analysed for this study (summarized in
Appendix B). Forty–four Ontario Iroquoian wild turkeys, including 34 adults and 10
juveniles, were selected for collagen analysis from ten sites located in southwestern
Ontario. The isotopic analyses of two Late Woodland wild turkeys from previous work
by Katzenberg (2006) expand the geographic range of the Ontario Iroquoian samples. An
additional fifteen adult wild turkeys were analysed from the neighbouring Western Basin
Inland West Pit sites (A.D. 1150–1270), near Arkona, Ontario. To provide an isotopic
baseline for turkeys prior to the entry of maize to the region (Crawford et al. 2006), two
wild turkeys from the Bruce Boyd site (component dating to ~700 to 400 B.C.) were also

127
analysed (Spence et al. 1978) (Table 3.1). Published isotopic data for archaeological wild
and domestic turkeys from other North American sites were used for comparison
including: the Donnaha Site in North Carolina, n=16 (Price et al 2010; Price 2009),
several sites in Colorado, n=30 (Rawlings and Driver 2010), and a single sample from the
Chihuahua region of Mexico (Webster and Katzenberg 2008) (Figure 3.1). Collagen from
nineteen modern turkeys from southwestern Ontario was also analysed (Appendix C).
Additionally, the isotopic composition of bone bioapatite structural carbonate from
fourteen modern and thirteen archaeological turkey samples was analysed to assess
whether the relationship between avian collagen and structural carbonate is comparable
to that of mammals (Appendix D and E).
Table 3.1: Summary of wild turkeys analysed for this study
Pre–horticulture pre A.D. 200 (sites n=1)
Ontario Iroquoian A.D. 900–
1600 (sites, n=10)
Western Basin A.D. 900–1600
(sites, n=3)
Modern Wild Turkey
(known hunted locations, n=6)
Adult
Collagen Structural Carbonate
2 0
34 8
15 1
18 13
Juvenile Collagen Structural Carbonate
0 0
10 4
0 0
1 1
TOTAL Collagen Structural Carbonate
2 0
44 12
15 1
19 14
3.3.2 Sample description
Age and sex determinations are recorded in Appendix B for the archaeological samples
and Appendix C for the modern samples. All but two modern wild turkeys were still
fleshed when donated. Therefore aging and sexing of the modern birds was possible and
either provided by the donator/hunter or assessed by the author prior to the removal of
bone for sampling. All fleshed, modern turkeys were adult males, ranging in age from
one to five plus years, based on spur and beard presence and length (beard length age was
estimated by the hunter/donators) (Dickson 1992; Schroger 1966). Wild turkeys are
sexually dimorphic, males being larger than females.
For the archaeological remains definitive sex identification was difficult because of bone
fragmentation; sex determination could only be made if the tarsometarsal bone was
128
present (males have a spur) (Gilbert et al. 1996). In some instances size was used to
provide possible sex differences (i.e. distal coracoid breadth).
For the juvenile samples, age was assigned as a relative category based on McKusick’s
(1986) criteria. The majority of the samples represent older juveniles estimated to be
three to five months of age at the time of death. In Ontario, wild turkeys begin nesting in
the spring, as early as late April and into May with an incubation period of approximately
thirty days. If early nests are destroyed, however, female turkeys may lay a clutch of eggs
later in spring/summer (Weaver 1989). Based on the osteological analysis of the juvenile
remains and breeding/nesting behaviour, it is estimated that the majority of juvenile
turkeys were killed in the fall/winter, between late September and January (also see
Lennox 1977).
3.3.3 Burial context
The burial context for many of the samples was not available. Despite this lack of
contextual data, some assumptions can be made based on the osteology and available
archaeological feature/square information. With the exception of Bruce Boyd, an Early
Woodland burial that was part of a multi-component site (Spence et al. 1978), all turkeys
were recovered from villages or hamlets of varying sizes that were occupied year round.
The majority were recovered from middens, usually as single, fragmentary bones. For
example, the vast majority of turkey remains at the Hamilton site were recovered from
large middens (A and C) outside the palisades. One turkey bone, Ham–05, however, was
buried in a small midden within the village walls (Lennox 1977). At the Walker site, a
large, Neutral village, one turkey (Wal–50) was associated with a winter house (House 8)
(Wright 1977).
Several features appear to contain special context burials including multiple co-mingled
turkeys of varying ages, complete or nearly complete turkeys, and ritual bundles. The
burial of multiple individuals within the same feature might indicate consumption or
disposal of the turkeys in a single event (i.e., the turkeys were killed and/or eaten at the
same time) such as a feast (Hayden 1996). Cold weather feasting might explain the
assemblage of one feature type at both Crawford Lake (A.D. 1435–1459) and Hamilton
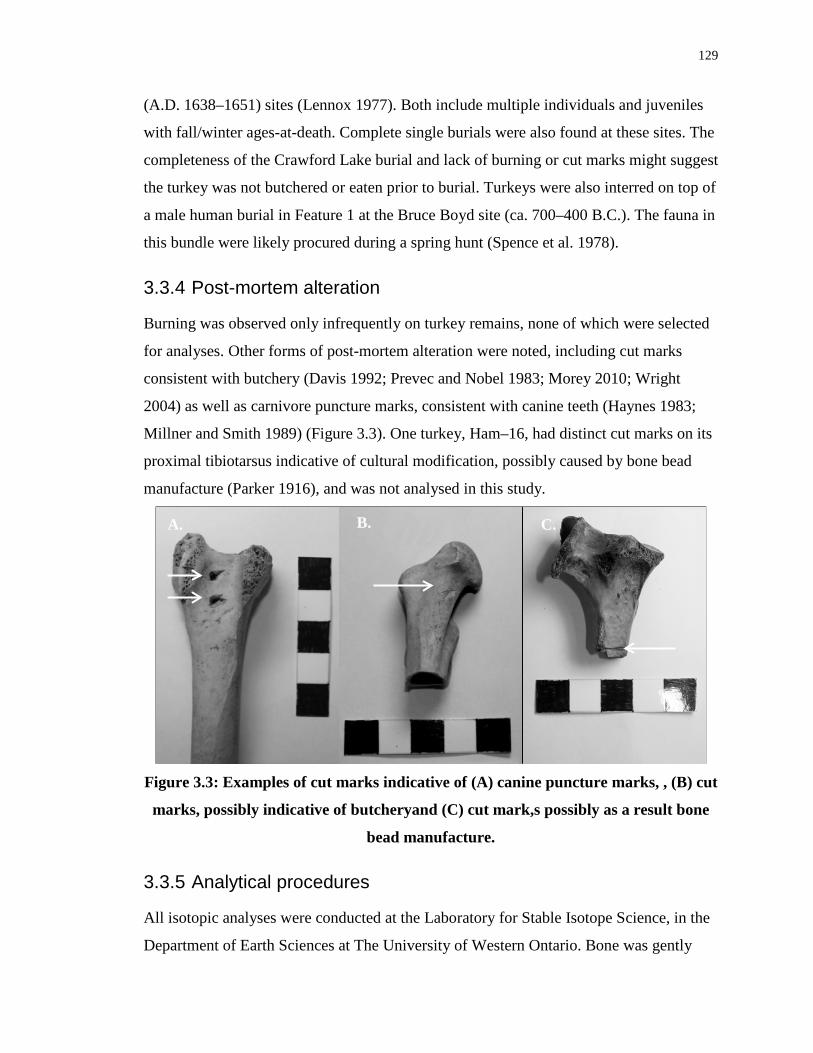
129
(A.D. 1638–1651) sites (Lennox 1977). Both include multiple individuals and juveniles
with fall/winter ages-at-death. Complete single burials were also found at these sites. The
completeness of the Crawford Lake burial and lack of burning or cut marks might suggest
the turkey was not butchered or eaten prior to burial. Turkeys were also interred on top of
a male human burial in Feature 1 at the Bruce Boyd site (ca. 700–400 B.C.). The fauna in
this bundle were likely procured during a spring hunt (Spence et al. 1978).
3.3.4 Post-mortem alteration
Burning was observed only infrequently on turkey remains, none of which were selected
for analyses. Other forms of post-mortem alteration were noted, including cut marks
consistent with butchery (Davis 1992; Prevec and Nobel 1983; Morey 2010; Wright
2004) as well as carnivore puncture marks, consistent with canine teeth (Haynes 1983;
Millner and Smith 1989) (Figure 3.3). One turkey, Ham–16, had distinct cut marks on its
proximal tibiotarsus indicative of cultural modification, possibly caused by bone bead
manufacture (Parker 1916), and was not analysed in this study.
Figure 3.3: Examples of cut marks indicative of (A) canine puncture marks, , (B) cut
marks, possibly indicative of butcheryand (C) cut mark,s possibly as a result bone
bead manufacture.
3.3.5 Analytical procedures
All isotopic analyses were conducted at the Laboratory for Stable Isotope Science, in the
Department of Earth Sciences at The University of Western Ontario. Bone was gently
A. B. C.

130
cleaned with a brush and distilled water, and allowed to dry overnight at room
temperature. A small sample of cortical bone (0.2–0.4 g) was removed from complete or
large bone fragments. Because bird bone is almost exclusively cortical, it was rarely
necessary to remove trabecular bone. The cortical bone was crushed with a porcelain
mortar and pestle, sieved, and powder collected at several intervals. The feathers and
flesh were cut away manually from the modern wild turkeys, and a piece of the mid–ulna
was removed using a handheld Dremel. The bone was rinsed thoroughly in warm water
and dried at room temperature. When necessary, additional removal of dried flesh was
completed through manual scrubbing and additional rinses.
3.3.5.1 Extraction and analytical protocols
For complete collagen (δ13Ccol, δ15Ncol) and carbonate ((δ13Csc, δ18Osc) extraction
protocols see Chapter 2, sections 2.2.3.1 and 2.2.3.2 respectively.
The collagen was analysed to obtain δ13Ccol and δ15Ncol values and carbon and nitrogen
contents, which were used to calculate a C:N ratio. The δ13Ccol values were calibrated to
Vienna Pee Dee Belemnite (VPDB) using the standards USGS-40 (accepted value, –
26.39‰), and USGS-41 (accepted value = 37.63 ‰). The δ15Ncol values were calibrated
to AIR also using USGS-40 and USGS-41 (accepted values = –4.52 ‰ and 47.57 ‰,
respectively), following Coplen (1994) and Coplen et al. (2006). An internal laboratory
standard, Keratin (#90211, MP Biomedicals), was analysed approximately every fifth
sample to evaluate the accuracy and precision of the collagen analysis. Accuracy and
precision were excellent. The accepted keratin value for δ13Ccol is –24.04‰ (compared to
the mean sample δ13Ccol value of –24.08 ± 0.08‰, n=86), and for δ15Ncol it is 6.36‰
(compared to the mean δ15Ncol value of 6.31 ± 0.15‰, n=80). Method duplicate pairs
(i.e., a different extraction and analysis of collagen on the same sample) were performed
for ~10% of the turkey and had a mean reproducibility of ± 0.06‰ for δ13Ccol and ±
0.11‰ for δ15Ncol. The analytical precision for ~10% δ13Ccol duplicates (i.e., replicate
analysis of the same collagen) was ±0.03‰, and for δ15Ncol was ±0.05‰.
The δ13Csc and δ18O values were obtained for structural carbonate from thirteen
archaeological and thirteen modern turkey samples. The δ13Csc values were calibrated to

131
VPDB, following Coplen (1994), using the NBS-19 standard (accepted value of 1.95 ‰)
and Suprapur (accepted value of –35.28 ‰). The δ18O values were calibrated to
VSMOW, following Coplen (1996), using NBS-19 and NBS-18 standards (accepted
values of 28.60 ‰ and 7.20 ‰, respectively). An internal laboratory calcite standard,
World Standard 1 (WS-1), was analysed approximately every fifteenth sample in order to
assess the accuracy and precision of the carbonate analysis. The mean δ13Csc value of 0.76
± 0.22‰ (n=11) and the mean δ18Osc value of 26.20 ± 0.19‰ (n=10) compared
favourably to the accepted WS-1 values of 0.76‰ and 26.23‰, respectively. Carbonate
pre-treatment method duplicates were conducted on three pairs of turkey samples with a
mean reproducibility of ±0.04‰ for δ13Csc and ±0.19‰ for δ18Osc. The analytical
precision for duplicate analyses of the same structural carbonate preparation was ±
0.07‰ for δ13Csc and ±0.07‰ for δ18Osc.
3.3.5.2 Fourier transform infra–red spectroscopy (FTIR)
For complete description of the Fourier transform infra–red spectroscopy (FTIR)
procedures, see Chapter 2, Section 2.2.3.3.
3.4 Results
3.4.1 Sample integrity
Collagen yields and carbon:nitrogen (C:N) ratios were used to assess post–mortem
alteration of the organic portion of bone (Table 3.2). Samples yielding less than 1%
collagen are considered to be too degraded to give reliable results (Van Klinken1999;
Ambrose 1993). Yields varied, with slightly lower collagen yields at the oldest site
(Bruce Boyd, 5.0±0.7%) relative to Late Woodland (A.D. 1000–1600) sites (Table 3.2).
No archaeological turkeys had yields less than 4% yield, suggesting the preservation was
acceptable for isotopic analysis. Modern turkey had excellent preservation, as is expected
for fresh bone, with a mean collagen yield of 20.4% (Van Klinken 1999). The C:N ratios
for all samples fell well within the range of 2.9 to 3.6 recommended by DeNiro (1985).
There was no significant correlation (Pearson’s Correlation) between δ13Ccol and δ15Ncol
values and either C:N ratio or percent collagen yield. Therefore, all isotopic collagen data
were accepted.
132
For the structural carbonate, three checks were used to assess the integrity of the samples;
FTIR analysis, percentage of bioapatite by weight, and percentage of CO3 (as CO2) in
bioapatite by weight.
The expected CI for fresh bone lies below 2.8 and 3.0, which is consistent with that
measured for the modern turkeys (2.63±0.19, n=19) (Table 3.3). The mean CI of the
archaeological turkey samples (2.78±0.23, n=19) was below that limit, and closer to that
of the modern samples (Table 3.3). Re-crystallization is, therefore, not indicated and all
wild turkey samples were retained for isotopic analysis.
All fresh (i.e., de-fleshed) modern turkey bones had C:P ratios > 0.6 (Table 3.3), higher
than is expected for bioapatite (King et al. 2011; Nielsen-Marsh and Hedges 2000; Pucéat
et al. 2004), which is most likely related to a methodological error trying to analyse fresh
bone that still contained a high percentage of organic matter such as lipids. The C:P ratio
for the archaeological turkey bone samples was 0.53±0.33, suggesting a larger amount of
structural carbonate than normally expected for some archaeological bone (Nielsen–
Marsh and Hedges 2000; Wright and Schwarcz 1996). A comparison of C:P ratios prior
to pre-treatment and after pre-treatment of mammalian (n=41) and wild turkey samples
(n=12) demonstrated that pre-treatment lowers the C:P ratio in over 70% of cases,
shifting the mean C:P for archaeological turkey bone samples to an acceptable ratio of
0.33±0.16 (Table 3.3).
The structural carbonate from turkey samples used in this study for isotopic analysis is
considered to represent unaltered material because (1) the CI indices were acceptable, (2)
there were peaks in the FTIR profiles that suggest secondary contamination or
recrystallization, and (3) pre-treatment lowered sample C:P ratios to within the expected
range.
Fresh bone has an expected bioapatite [Ca10(PO4)6(OH)2]) yield by weight of 70 –75%
(Ambrose 1993; Sillen 1989) to 90% (Lee–Thorp 1989). The yields measured here
aligned closely with those reported by Ambrose (1993) and Sillen (1989): modern turkey
bone = 65.7±7.2%, range = 47.6–72.7%, and archaeological turkey bone = 79.3±3.9,
range = 76.0–84.8% (Table 3.2). The higher bioapatite yield of archaeological turkey
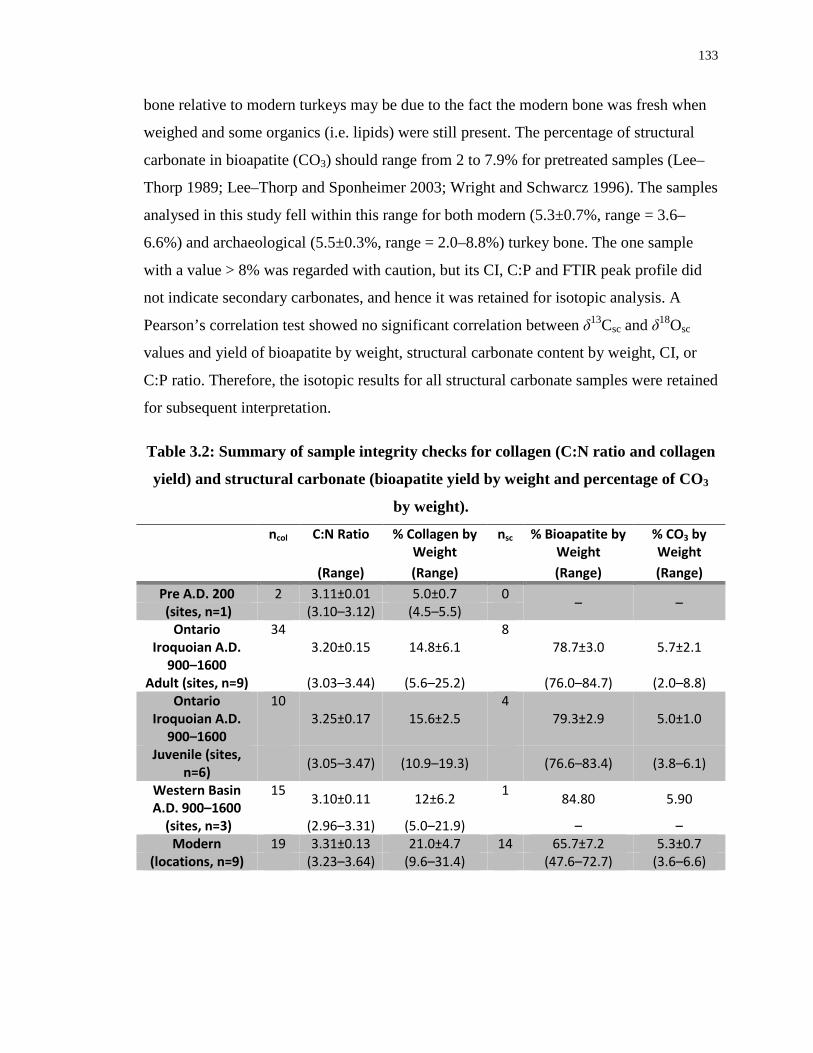
133
bone relative to modern turkeys may be due to the fact the modern bone was fresh when
weighed and some organics (i.e. lipids) were still present. The percentage of structural
carbonate in bioapatite (CO3) should range from 2 to 7.9% for pretreated samples (Lee–
Thorp 1989; Lee–Thorp and Sponheimer 2003; Wright and Schwarcz 1996). The samples
analysed in this study fell within this range for both modern (5.3±0.7%, range = 3.6–
6.6%) and archaeological (5.5±0.3%, range = 2.0–8.8%) turkey bone. The one sample
with a value > 8% was regarded with caution, but its CI, C:P and FTIR peak profile did
not indicate secondary carbonates, and hence it was retained for isotopic analysis. A
Pearson’s correlation test showed no significant correlation between δ13Csc and δ18Osc
values and yield of bioapatite by weight, structural carbonate content by weight, CI, or
C:P ratio. Therefore, the isotopic results for all structural carbonate samples were retained
for subsequent interpretation.
Table 3.2: Summary of sample integrity checks for collagen (C:N ratio and collagen
yield) and structural carbonate (bioapatite yield by weight and percentage of CO3
by weight).
ncol C:N Ratio % Collagen by Weight
nsc % Bioapatite by Weight
% CO3 by Weight
(Range) (Range) (Range) (Range) Pre A.D. 200 2 3.11±0.01 5.0±0.7 0 – – (sites, n=1) (3.10–3.12) (4.5–5.5)
Ontario Iroquoian A.D.
900–1600
34 3.20±0.15 14.8±6.1
8 78.7±3.0 5.7±2.1
Adult (sites, n=9) (3.03–3.44) (5.6–25.2) (76.0–84.7) (2.0–8.8) Ontario
Iroquoian A.D. 900–1600
10 3.25±0.17 15.6±2.5
4 79.3±2.9 5.0±1.0
Juvenile (sites, n=6)
(3.05–3.47) (10.9–19.3) (76.6–83.4) (3.8–6.1)
Western Basin A.D. 900–1600
15 3.10±0.11 12±6.2 1 84.80 5.90
(sites, n=3) (2.96–3.31) (5.0–21.9) – – Modern 19 3.31±0.13 21.0±4.7 14 65.7±7.2 5.3±0.7
(locations, n=9) (3.23–3.64) (9.6–31.4) (47.6–72.7) (3.6–6.6)
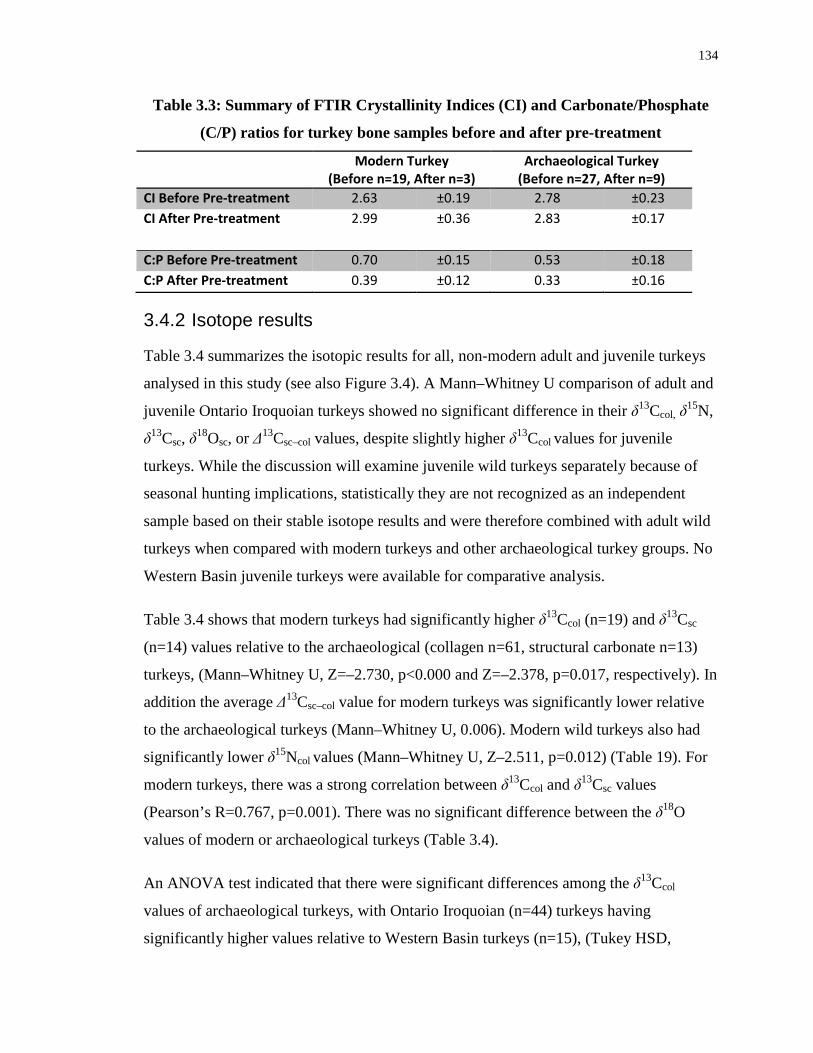
134
Table 3.3: Summary of FTIR Crystallinity Indices (CI) and Carbonate/Phosphate
(C/P) ratios for turkey bone samples before and after pre-treatment
Modern Turkey (Before n=19, After n=3)
Archaeological Turkey (Before n=27, After n=9)
CI Before Pre-treatment 2.63 ±0.19 2.78 ±0.23 CI After Pre-treatment 2.99 ±0.36 2.83 ±0.17 C:P Before Pre-treatment 0.70 ±0.15 0.53 ±0.18 C:P After Pre-treatment 0.39 ±0.12 0.33 ±0.16
3.4.2 Isotope results
Table 3.4 summarizes the isotopic results for all, non-modern adult and juvenile turkeys
analysed in this study (see also Figure 3.4). A Mann–Whitney U comparison of adult and
juvenile Ontario Iroquoian turkeys showed no significant difference in their δ13Ccol, δ15N,
δ13Csc, δ18Osc, or Δ13Csc–col values, despite slightly higher δ13Ccol values for juvenile
turkeys. While the discussion will examine juvenile wild turkeys separately because of
seasonal hunting implications, statistically they are not recognized as an independent
sample based on their stable isotope results and were therefore combined with adult wild
turkeys when compared with modern turkeys and other archaeological turkey groups. No
Western Basin juvenile turkeys were available for comparative analysis.
Table 3.4 shows that modern turkeys had significantly higher δ13Ccol (n=19) and δ13Csc
(n=14) values relative to the archaeological (collagen n=61, structural carbonate n=13)
turkeys, (Mann–Whitney U, Z=–2.730, p<0.000 and Z=–2.378, p=0.017, respectively). In
addition the average Δ13Csc–col value for modern turkeys was significantly lower relative
to the archaeological turkeys (Mann–Whitney U, 0.006). Modern wild turkeys also had
significantly lower δ15Ncol values (Mann–Whitney U, Z–2.511, p=0.012) (Table 19). For
modern turkeys, there was a strong correlation between δ13Ccol and δ13Csc values
(Pearson’s R=0.767, p=0.001). There was no significant difference between the δ18O
values of modern or archaeological turkeys (Table 3.4).
An ANOVA test indicated that there were significant differences among the δ13Ccol
values of archaeological turkeys, with Ontario Iroquoian (n=44) turkeys having
significantly higher values relative to Western Basin turkeys (n=15), (Tukey HSD,
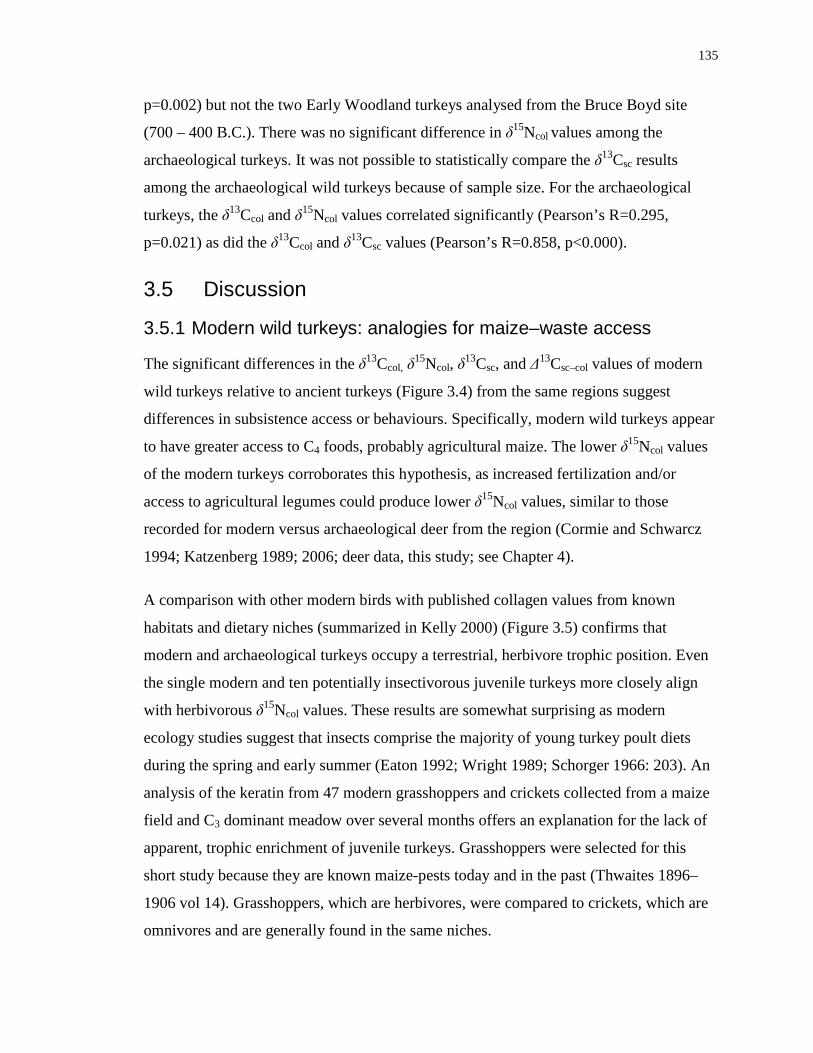
135
p=0.002) but not the two Early Woodland turkeys analysed from the Bruce Boyd site
(700 – 400 B.C.). There was no significant difference in δ15Ncol values among the
archaeological turkeys. It was not possible to statistically compare the δ13Csc results
among the archaeological wild turkeys because of sample size. For the archaeological
turkeys, the δ13Ccol and δ15Ncol values correlated significantly (Pearson’s R=0.295,
p=0.021) as did the δ13Ccol and δ13Csc values (Pearson’s R=0.858, p<0.000).
3.5 Discussion
3.5.1 Modern wild turkeys: analogies for maize–waste access
The significant differences in the δ13Ccol, δ15Ncol, δ13Csc, and Δ13Csc–col values of modern
wild turkeys relative to ancient turkeys (Figure 3.4) from the same regions suggest
differences in subsistence access or behaviours. Specifically, modern wild turkeys appear
to have greater access to C4 foods, probably agricultural maize. The lower δ15Ncol values
of the modern turkeys corroborates this hypothesis, as increased fertilization and/or
access to agricultural legumes could produce lower δ15Ncol values, similar to those
recorded for modern versus archaeological deer from the region (Cormie and Schwarcz
1994; Katzenberg 1989; 2006; deer data, this study; see Chapter 4).
A comparison with other modern birds with published collagen values from known
habitats and dietary niches (summarized in Kelly 2000) (Figure 3.5) confirms that
modern and archaeological turkeys occupy a terrestrial, herbivore trophic position. Even
the single modern and ten potentially insectivorous juvenile turkeys more closely align
with herbivorous δ15Ncol values. These results are somewhat surprising as modern
ecology studies suggest that insects comprise the majority of young turkey poult diets
during the spring and early summer (Eaton 1992; Wright 1989; Schorger 1966: 203). An
analysis of the keratin from 47 modern grasshoppers and crickets collected from a maize
field and C3 dominant meadow over several months offers an explanation for the lack of
apparent, trophic enrichment of juvenile turkeys. Grasshoppers were selected for this
short study because they are known maize-pests today and in the past (Thwaites 1896–
1906 vol 14). Grasshoppers, which are herbivores, were compared to crickets, which are
omnivores and are generally found in the same niches.
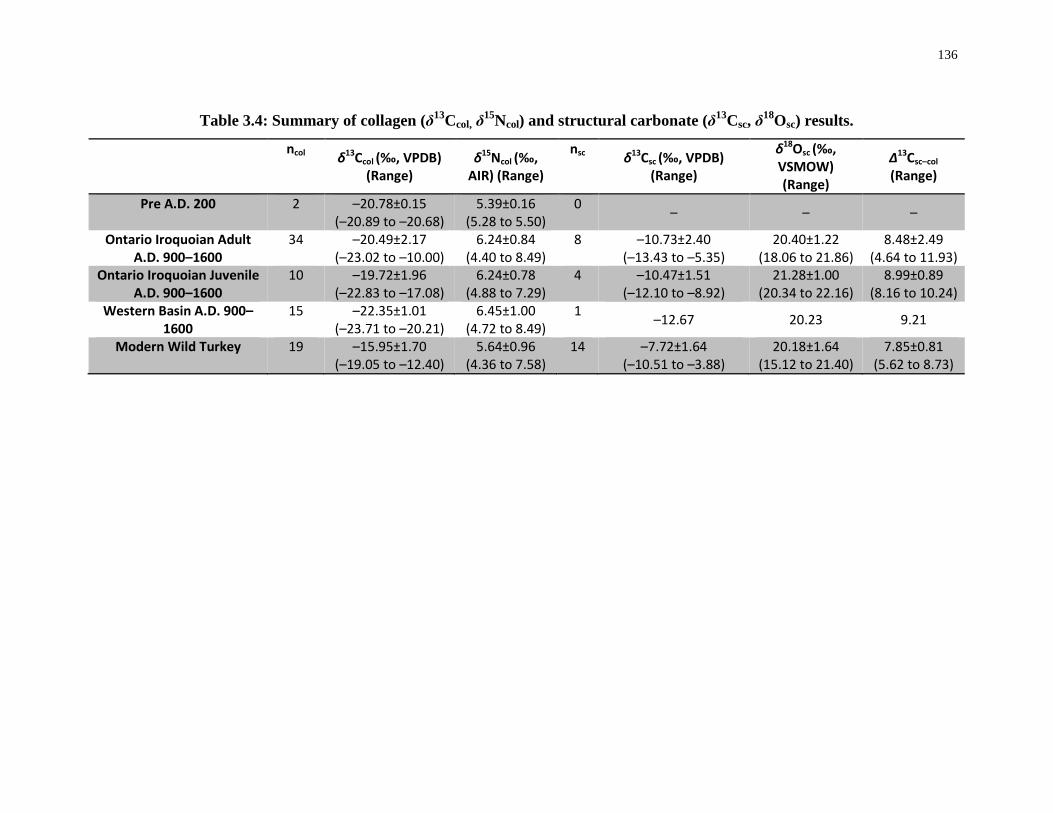
136
Table 3.4: Summary of collagen (δ13Ccol, δ15Ncol) and structural carbonate (δ13Csc, δ18Osc) results.
ncol δ13Ccol (‰, VPDB) (Range)
δ15Ncol (‰, AIR) (Range)
nsc δ13Csc (‰, VPDB) (Range)
δ18Osc (‰, VSMOW) (Range)
∆13Csc–col
(Range)
Pre A.D. 200 2 –20.78±0.15 (–20.89 to –20.68)
5.39±0.16 (5.28 to 5.50)
0 – – –
Ontario Iroquoian Adult A.D. 900–1600
34 –20.49±2.17 (–23.02 to –10.00)
6.24±0.84 (4.40 to 8.49)
8 –10.73±2.40 (–13.43 to –5.35)
20.40±1.22 (18.06 to 21.86)
8.48±2.49 (4.64 to 11.93)
Ontario Iroquoian Juvenile A.D. 900–1600
10 –19.72±1.96 (–22.83 to –17.08)
6.24±0.78 (4.88 to 7.29)
4 –10.47±1.51 (–12.10 to –8.92)
21.28±1.00 (20.34 to 22.16)
8.99±0.89 (8.16 to 10.24)
Western Basin A.D. 900–1600
15 –22.35±1.01 (–23.71 to –20.21)
6.45±1.00 (4.72 to 8.49)
1 –12.67 20.23 9.21
Modern Wild Turkey 19 –15.95±1.70 (–19.05 to –12.40)
5.64±0.96 (4.36 to 7.58)
14 –7.72±1.64 (–10.51 to –3.88)
20.18±1.64 (15.12 to 21.40)
7.85±0.81 (5.62 to 8.73)
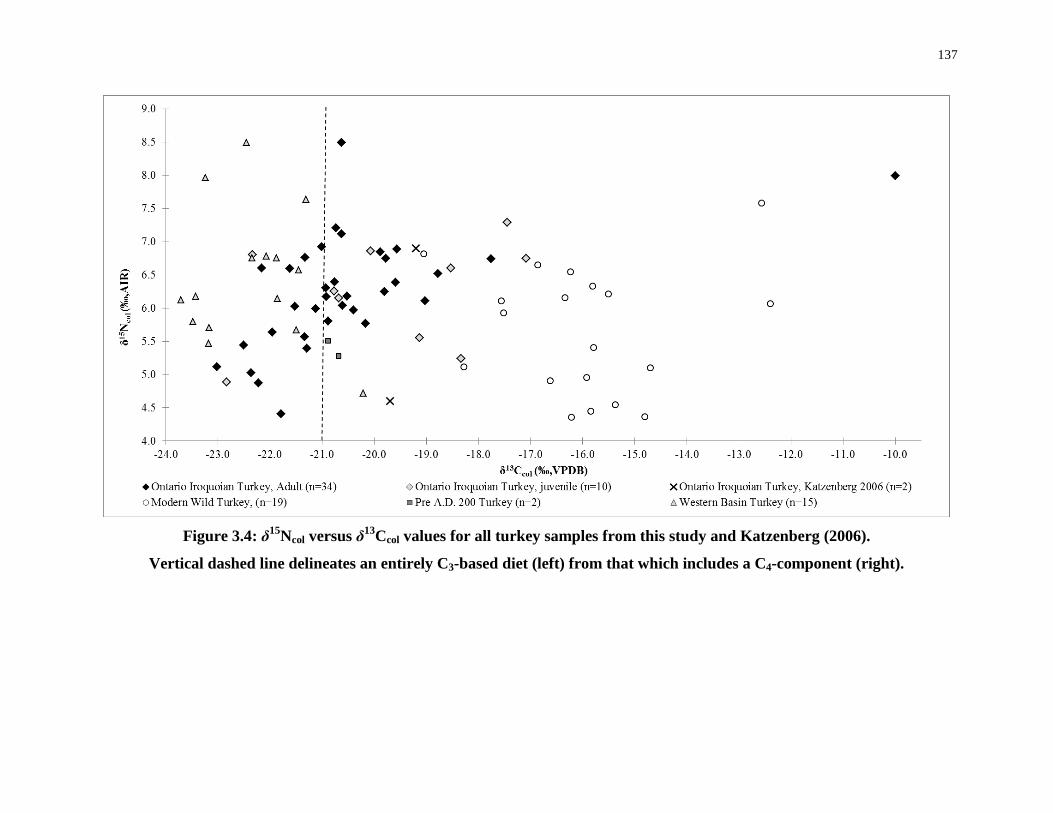
137
Figure 3.4: δ15Ncol versus δ13Ccol values for all turkey samples from this study and Katzenberg (2006).
Vertical dashed line delineates an entirely C3-based diet (left) from that which includes a C4-component (right).
138
Figure 3.5: δ15Ncol versus δ13Ccol values for avian species within known dietary niches.
All modern, collagen data for non-wild turkey species are from Kelly (2000, summary).
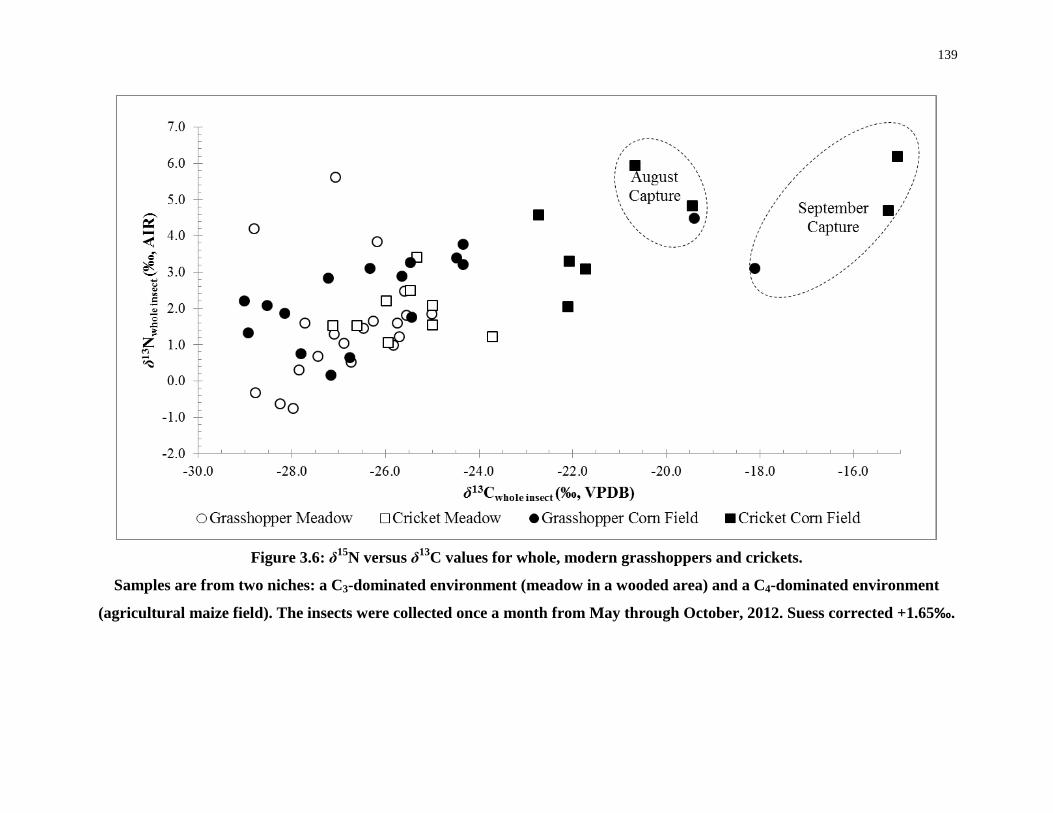
139
Figure 3.6: δ15N versus δ13C values for whole, modern grasshoppers and crickets.
Samples are from two niches: a C3-dominated environment (meadow in a wooded area) and a C4-dominated environment
(agricultural maize field). The insects were collected once a month from May through October, 2012. Suess corrected +1.65‰.
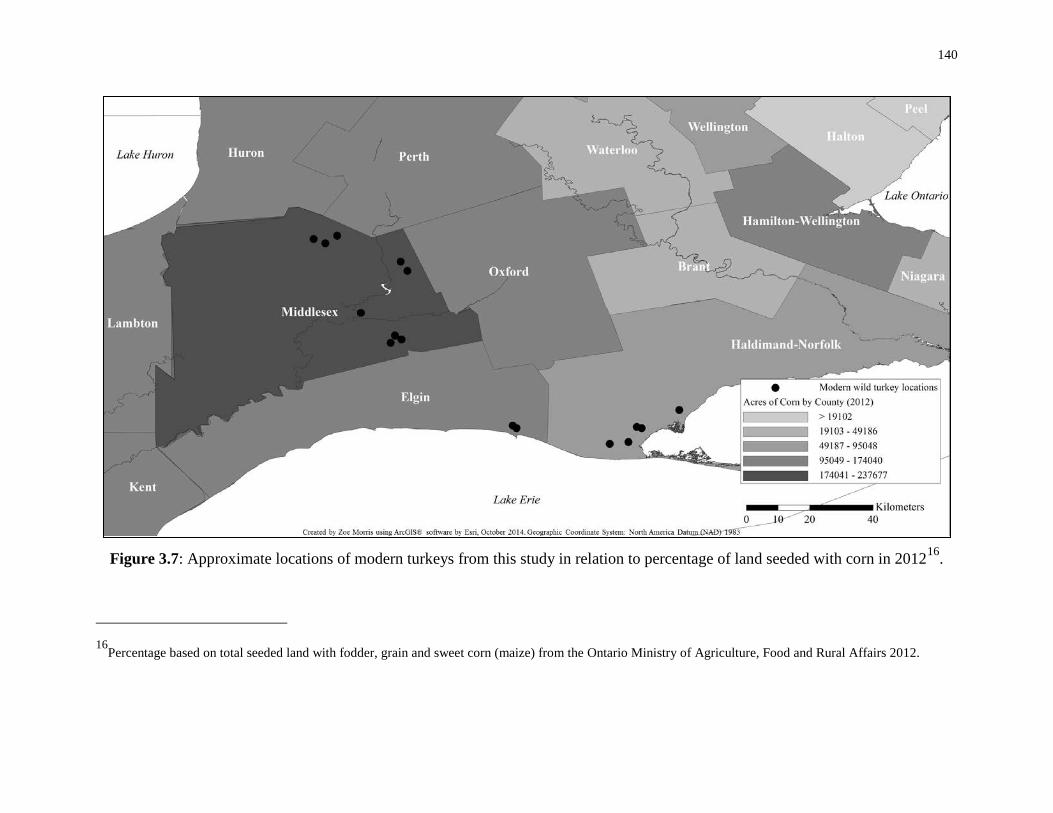
140
Figure 3.7: Approximate locations of modern turkeys from this study in relation to percentage of land seeded with corn in 201216.
16Percentage based on total seeded land with fodder, grain and sweet corn (maize) from the Ontario Ministry of Agriculture, Food and Rural Affairs 2012.
141
The mean δ13Ccol value for grasshoppers (n=30) was –26.29±2.09‰ and for crickets
(n=16) was –23.01±3.64‰. The results suggested that all of the insects collected in the
meadow were eating in a C3-only environment and, interestingly, many of the insects
collected in the maize field did not consume maize, especially in the early spring growing
stages. There was evidence that the crickets collected in the late summer/fall from maize
fields had consumed some C4 resources (Figure 3.6). The mean δ15Ncol value for the
grasshoppers was 1.84±1.41‰ and for the crickets was 2.93±1.64‰. Although, as
omnivores, crickets have expectedly higher δ15Ncol values, both species are within the
range expected for plants in the region (i.e., they are not a trophic level higher than the
plants) (Longstaffe unpublished results; Cormie and Schwarcz 1994, 1996). The lack of a
clear C4 signal in the spring/early summer-collected insects and the low δ15Ncol values
means that, as a food item, grasshoppers and crickets would more closely resemble C3
plants during the time period that insects play a role in the turkey’s diet.
If, therefore, insects were an important part of juvenile turkey diets, they may not have
caused the trophic enrichment expected based on published data (Kelly 2006; Rawlings
and Driver 2010; Webster and Katzenberg 2008). The modern juvenile turkey and many
of the archaeological juvenile turkeys analysed in this study, had, however, clearly
consumed C4 resources. Grasshoppers and crickets, however, were unlikely to be the
major C4 resource responsible for causing the measured enrichment in 13C.
The data also suggest that modern wild turkeys occupy a dietary niche with significantly
more maize relative to other birds for which isotopic data for collagen are available.
These results are important for understanding maize availability and turkey behaviour
because they demonstrate that (1) if available, modern turkeys in Ontario will eat maize,
and (2) they are able access maize in quantities sufficient to alter their collagen isotopic
composition significantly, despite the fact that turkeys can only eat maize waste (i.e.,
cobs and/or kernels already on the ground). As would be expected for the low waste
production rates of ancient maize fields, many of the adult archaeological wild turkeys,
plot close to the expected range for herbivorous birds from C3-dominated environments
(Figure 3.5). Nonetheless, some archaeological turkeys have isotopic signatures
142
consistent with significant consumption of C4 foods (i.e., δ13Ccol > –21‰), so it is clear
that some pre–contact turkeys lived in environments with access to relatively large and/or
stable maize sources.
Southwestern Ontario agricultural data can provide a useful analog for understanding the
relationship between maize waste in fields and agricultural intensity. The mean annual
home range for wild turkeys in southwestern Ontario is 1000 acres, but is variable by
season and sex of the bird (Weaver 1989:60). Approximately 50% of the range of modern
turkeys is comprised of agricultural areas and water sources (Schorger 1960:224). The
hunters who donated the birds for this study reported hunting in forested or open areas all
of which were located near agricultural fields in Elgin, Middlesex, and Norfolk counties
during spring 2012. Examination of the Ontario Ministry of Agriculture, Food and Rural
Affairs (OMAFRA) 2012 data indicates that in that same year, 30% of Middlesex and
Elgin county land was seeded with maize (Figure 3.7).
According to OMAFRA (2012), modern southern Ontario maize fields produce
approximately 150 bushels per acre, where one bushel is equivalent to ~15 kilograms of
maize (Murphy 2008). The δ13Ccol and δ13Csc values for the modern wild turkeys suggest
that all of the birds analysed in this study consumed some maize, though in highly
variable quantities. Because turkeys can only consume maize already on the ground, they
probably consumed maize lost from combine machines during harvest, which ranges
between 2 and 10% of the crop (Sumner and Williams 2012). Using estimates of maize
loss from combine waste as well as wind and water damage, as much as 77 to 282
kilograms of maize per acre (calculated from OMFARA 2012; William 2008) can be left
in Ontario fields, an amount that creates a rich, post-harvest food source for modern wild
turkeys and could provide an overwintering food source for a large number of turkeys,
even in competition with other species dependent on agricultural waste, such as white-
tailed deer. These interpretations are consistent with a previous study by Groepper et al.
(2013), which found that modern wild turkeys with access to maize fields had diets
comprising up to 37% maize.
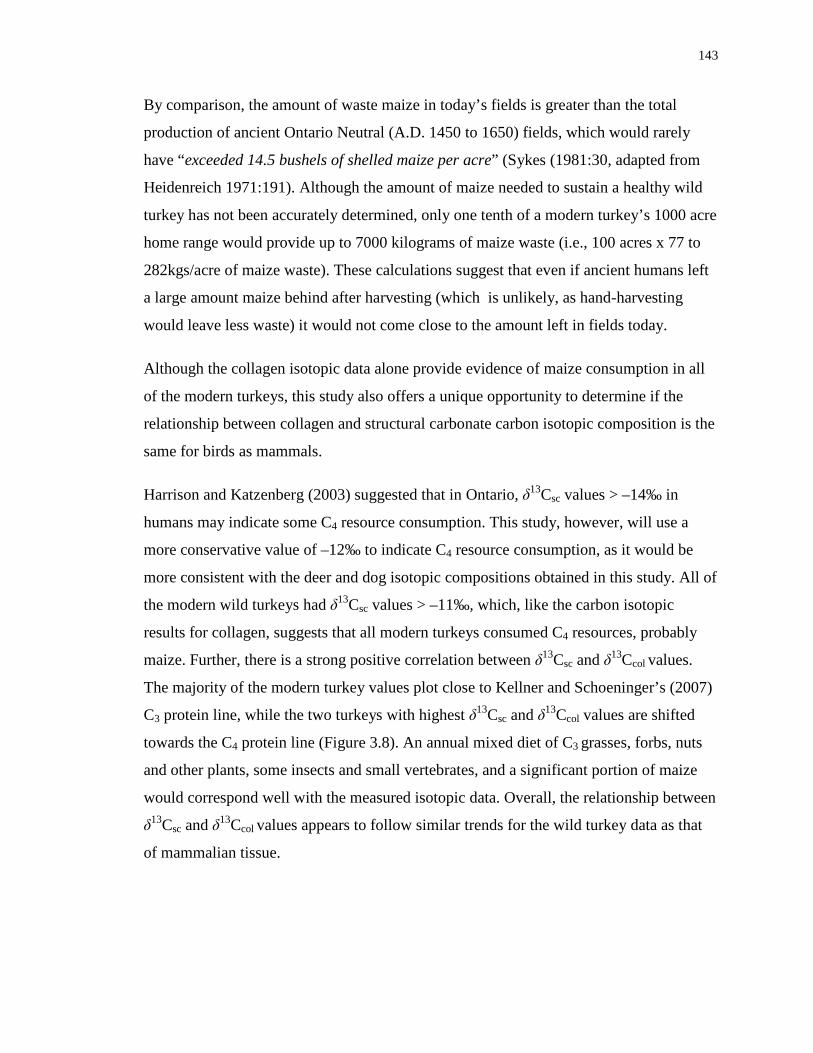
143
By comparison, the amount of waste maize in today’s fields is greater than the total
production of ancient Ontario Neutral (A.D. 1450 to 1650) fields, which would rarely
have “exceeded 14.5 bushels of shelled maize per acre” (Sykes (1981:30, adapted from
Heidenreich 1971:191). Although the amount of maize needed to sustain a healthy wild
turkey has not been accurately determined, only one tenth of a modern turkey’s 1000 acre
home range would provide up to 7000 kilograms of maize waste (i.e., 100 acres x 77 to
282kgs/acre of maize waste). These calculations suggest that even if ancient humans left
a large amount maize behind after harvesting (which is unlikely, as hand-harvesting
would leave less waste) it would not come close to the amount left in fields today.
Although the collagen isotopic data alone provide evidence of maize consumption in all
of the modern turkeys, this study also offers a unique opportunity to determine if the
relationship between collagen and structural carbonate carbon isotopic composition is the
same for birds as mammals.
Harrison and Katzenberg (2003) suggested that in Ontario, δ13Csc values > –14‰ in
humans may indicate some C4 resource consumption. This study, however, will use a
more conservative value of –12‰ to indicate C4 resource consumption, as it would be
more consistent with the deer and dog isotopic compositions obtained in this study. All of
the modern wild turkeys had δ13Csc values > –11‰, which, like the carbon isotopic
results for collagen, suggests that all modern turkeys consumed C4 resources, probably
maize. Further, there is a strong positive correlation between δ13Csc and δ13Ccol values.
The majority of the modern turkey values plot close to Kellner and Schoeninger’s (2007)
C3 protein line, while the two turkeys with highest δ13Csc and δ13Ccol values are shifted
towards the C4 protein line (Figure 3.8). An annual mixed diet of C3 grasses, forbs, nuts
and other plants, some insects and small vertebrates, and a significant portion of maize
would correspond well with the measured isotopic data. Overall, the relationship between
δ13Csc and δ13Ccol values appears to follow similar trends for the wild turkey data as that
of mammalian tissue.
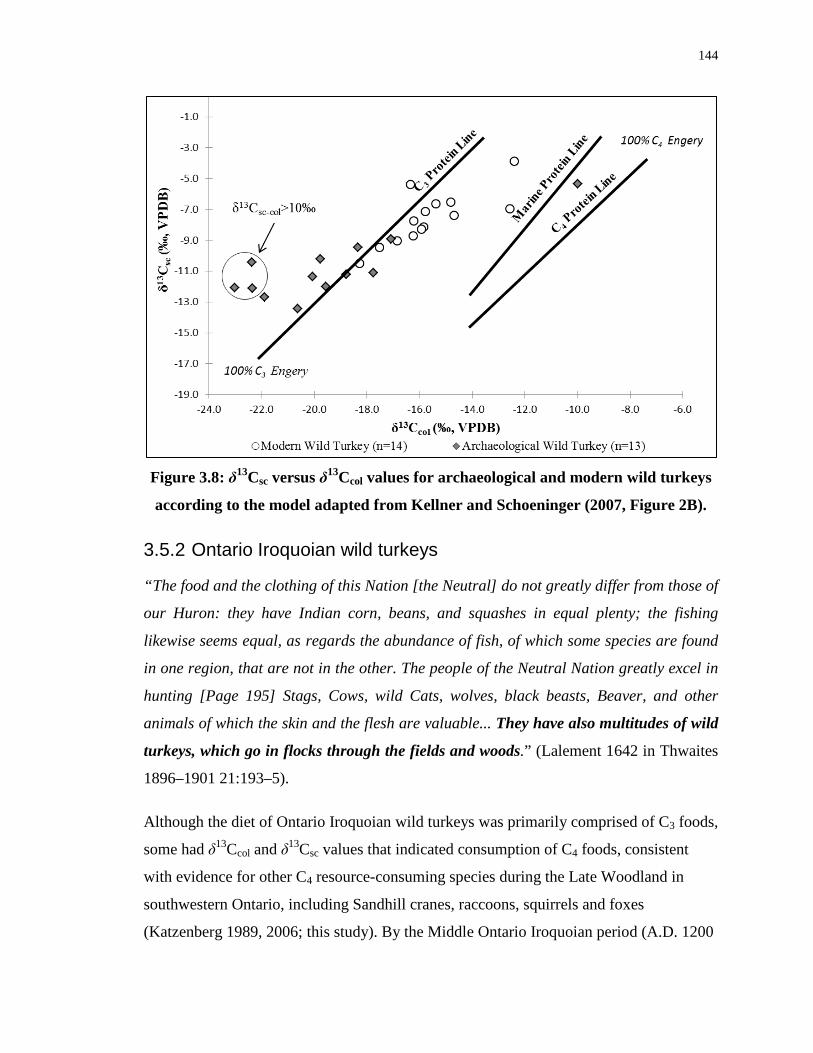
144
Figure 3.8: δ13Csc versus δ13Ccol values for archaeological and modern wild turkeys
according to the model adapted from Kellner and Schoeninger (2007, Figure 2B).
3.5.2 Ontario Iroquoian wild turkeys
“The food and the clothing of this Nation [the Neutral] do not greatly differ from those of
our Huron: they have Indian corn, beans, and squashes in equal plenty; the fishing
likewise seems equal, as regards the abundance of fish, of which some species are found
in one region, that are not in the other. The people of the Neutral Nation greatly excel in
hunting [Page 195] Stags, Cows, wild Cats, wolves, black beasts, Beaver, and other
animals of which the skin and the flesh are valuable... They have also multitudes of wild
turkeys, which go in flocks through the fields and woods.” (Lalement 1642 in Thwaites
1896–1901 21:193–5).
Although the diet of Ontario Iroquoian wild turkeys was primarily comprised of C3 foods,
some had δ13Ccol and δ13Csc values that indicated consumption of C4 foods, consistent
with evidence for other C4 resource-consuming species during the Late Woodland in
southwestern Ontario, including Sandhill cranes, raccoons, squirrels and foxes
(Katzenberg 1989, 2006; this study). By the Middle Ontario Iroquoian period (A.D. 1200
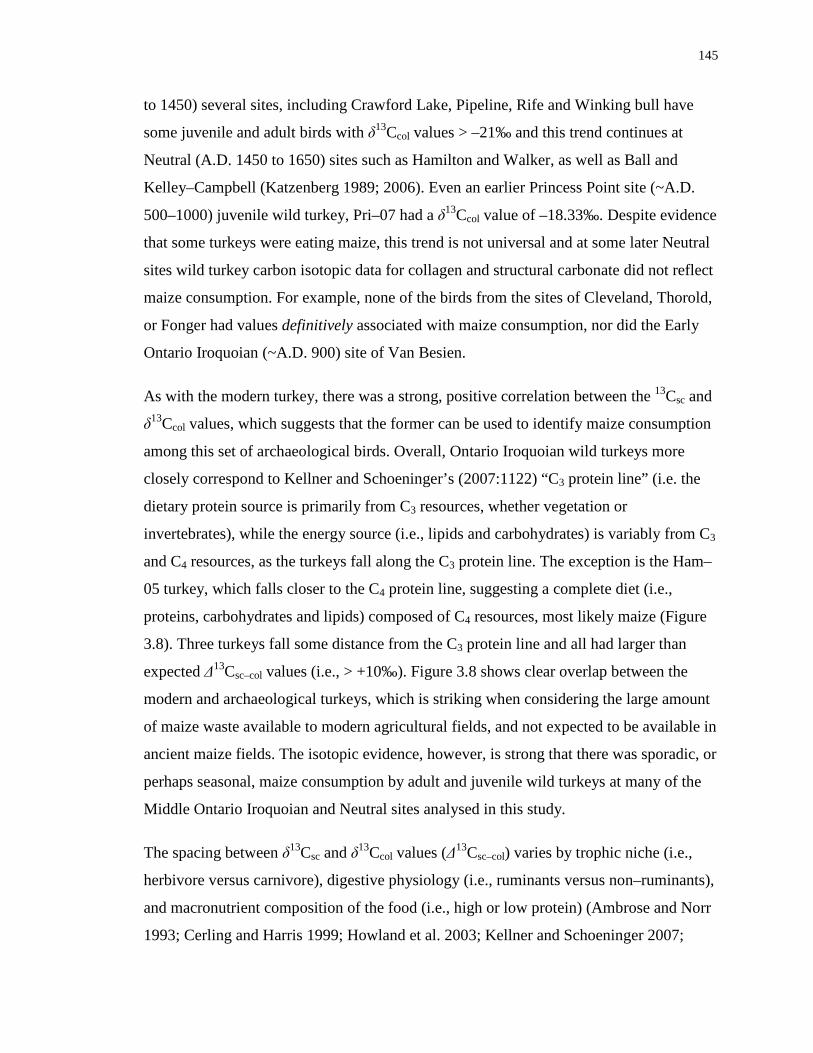
145
to 1450) several sites, including Crawford Lake, Pipeline, Rife and Winking bull have
some juvenile and adult birds with δ13Ccol values > –21‰ and this trend continues at
Neutral (A.D. 1450 to 1650) sites such as Hamilton and Walker, as well as Ball and
Kelley–Campbell (Katzenberg 1989; 2006). Even an earlier Princess Point site (~A.D.
500–1000) juvenile wild turkey, Pri–07 had a δ13Ccol value of –18.33‰. Despite evidence
that some turkeys were eating maize, this trend is not universal and at some later Neutral
sites wild turkey carbon isotopic data for collagen and structural carbonate did not reflect
maize consumption. For example, none of the birds from the sites of Cleveland, Thorold,
or Fonger had values definitively associated with maize consumption, nor did the Early
Ontario Iroquoian (~A.D. 900) site of Van Besien.
As with the modern turkey, there was a strong, positive correlation between the 13Csc and
δ13Ccol values, which suggests that the former can be used to identify maize consumption
among this set of archaeological birds. Overall, Ontario Iroquoian wild turkeys more
closely correspond to Kellner and Schoeninger’s (2007:1122) “C3 protein line” (i.e. the
dietary protein source is primarily from C3 resources, whether vegetation or
invertebrates), while the energy source (i.e., lipids and carbohydrates) is variably from C3
and C4 resources, as the turkeys fall along the C3 protein line. The exception is the Ham–
05 turkey, which falls closer to the C4 protein line, suggesting a complete diet (i.e.,
proteins, carbohydrates and lipids) composed of C4 resources, most likely maize (Figure
3.8). Three turkeys fall some distance from the C3 protein line and all had larger than
expected Δ13Csc–col values (i.e., > +10‰). Figure 3.8 shows clear overlap between the
modern and archaeological turkeys, which is striking when considering the large amount
of maize waste available to modern agricultural fields, and not expected to be available in
ancient maize fields. The isotopic evidence, however, is strong that there was sporadic, or
perhaps seasonal, maize consumption by adult and juvenile wild turkeys at many of the
Middle Ontario Iroquoian and Neutral sites analysed in this study.
The spacing between δ13Csc and δ13Ccol values (Δ13Csc–col) varies by trophic niche (i.e.,
herbivore versus carnivore), digestive physiology (i.e., ruminants versus non–ruminants),
and macronutrient composition of the food (i.e., high or low protein) (Ambrose and Norr
1993; Cerling and Harris 1999; Howland et al. 2003; Kellner and Schoeninger 2007;
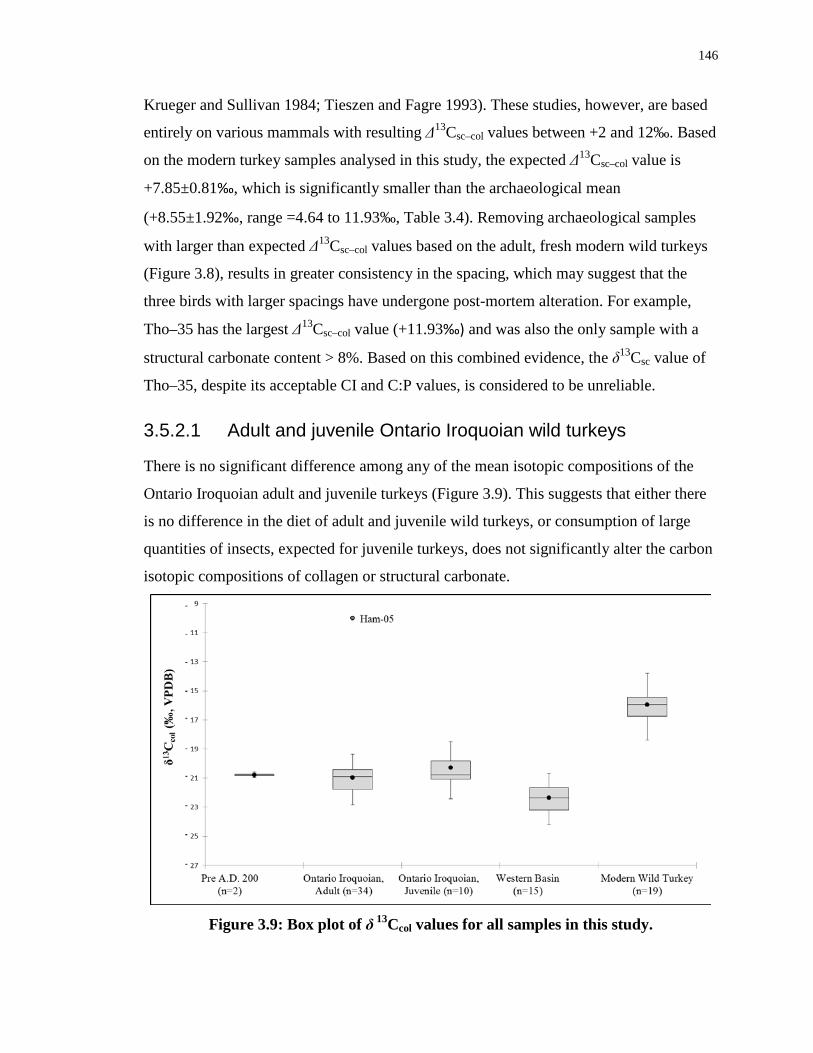
146
Krueger and Sullivan 1984; Tieszen and Fagre 1993). These studies, however, are based
entirely on various mammals with resulting Δ13Csc–col values between +2 and 12‰. Based
on the modern turkey samples analysed in this study, the expected Δ13Csc–col value is
+7.85±0.81‰, which is significantly smaller than the archaeological mean
(+8.55±1.92‰, range =4.64 to 11.93‰, Table 3.4). Removing archaeological samples
with larger than expected Δ13Csc–col values based on the adult, fresh modern wild turkeys
(Figure 3.8), results in greater consistency in the spacing, which may suggest that the
three birds with larger spacings have undergone post-mortem alteration. For example,
Tho–35 has the largest Δ13Csc–col value (+11.93‰) and was also the only sample with a
structural carbonate content > 8%. Based on this combined evidence, the δ13Csc value of
Tho–35, despite its acceptable CI and C:P values, is considered to be unreliable.
3.5.2.1 Adult and juvenile Ontario Iroquoian wild turkeys
There is no significant difference among any of the mean isotopic compositions of the
Ontario Iroquoian adult and juvenile turkeys (Figure 3.9). This suggests that either there
is no difference in the diet of adult and juvenile wild turkeys, or consumption of large
quantities of insects, expected for juvenile turkeys, does not significantly alter the carbon
isotopic compositions of collagen or structural carbonate.
Figure 3.9: Box plot of δ 13Ccol values for all samples in this study.

147
The analysis of modern grasshoppers and crickets (above) has already shown that they
had relatively low δ15Ncol and δ13C values, many closely mimicking C3 plants in the
region, despite the fact some of the insects were collected in maize fields. The juvenile
and adult turkeys that have carbon isotopic compositions reflecting C4 resource
consumption are, therefore, believed to have consumed maize, as opposed to maize–
consuming insects. This is significant because insects are consumed earlier in the
summer, while maize is consumed by turkeys in the fall or winter, after the crop harvest.
It may also be possible that the predominately insectivorous diet, which only lasts the
first four to five weeks of a poult’s life (Eaton 1992), contributes only a minor portion to
the lifetime carbon isotopic average of the bone. The average age-at-death for poults in
this study is between three to five months, based on a May/June hatching. The high bone
turnover rate for young, growing birds (Hobson and Clark 1992a) may be obscuring any
effect of insect consumption. As all the juvenile turkeys are less than one year of age at
death, their carbon isotopic composition is the result of a single maize-harvest season.
For young turkeys in particular, it may be possible to link the season during which they
were killed to access to maize fields.
The presence of three to five month-old juvenile turkeys in faunal assemblages supports
the interpretation of a late fall/winter turkey hunt proposed by zooarchaeologists (e.g.,
Foreman 2010; Prevec and Noble 1983). The seasonality of the turkey hunt is also
supported by ethnohistoric descriptions of tracking turkeys through snow and their winter
consumption (Denke 1804; Thwaites 1896–1901 32; 59; 60). Juvenile birds were found
from sites dating from the Princess Point through Middle Ontario Iroquoian and Neutral
stages, which suggests continuity in cold weather turkey hunting throughout the Late
Woodland period at Ontario Iroquoian sites. Except in rare cases (for example, Wal–50
from a winter house at Walker village), it has not been possible to provide a season-of-
death for the adult turkey remains, so the ability to correlate cold weather turkey hunting
with higher δ13C values (i.e., maize consumption) in juveniles of less than one year of age
is an exciting find. In order to determine the archaeological significance of these results,
Ontario Iroquoian turkeys are compared next to turkeys from other archaeological
contexts across North America with maize horticulture.
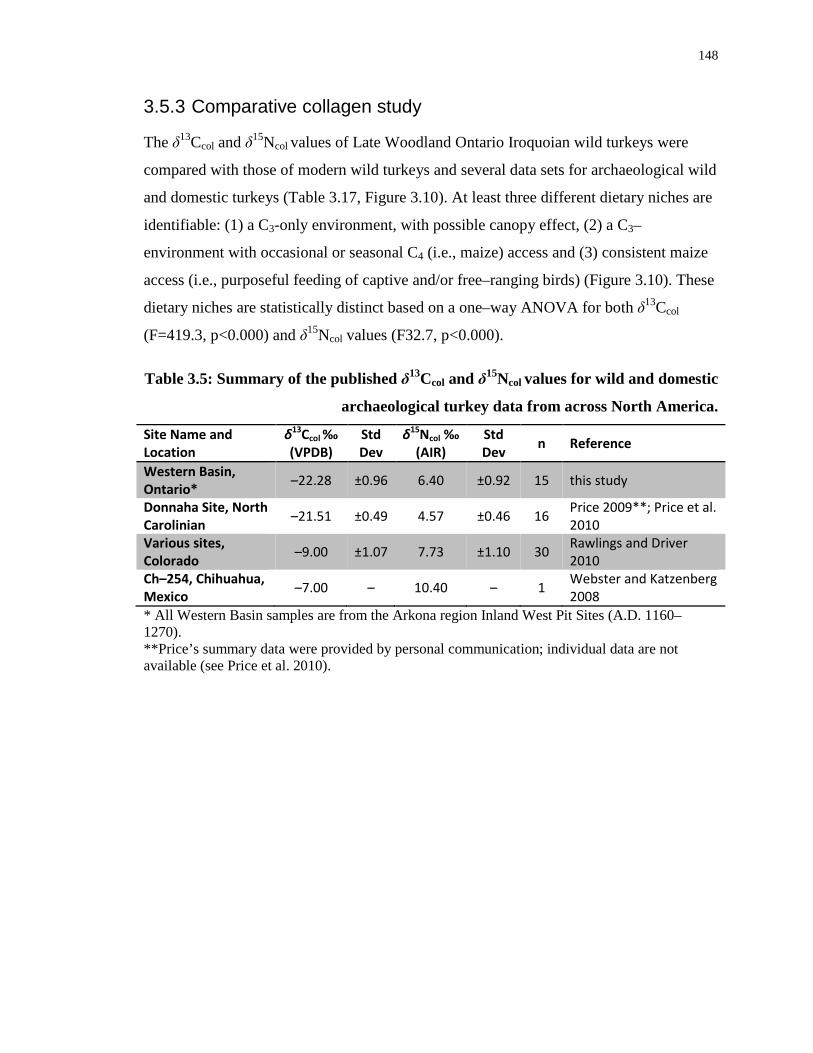
148
3.5.3 Comparative collagen study
The δ13Ccol and δ15Ncol values of Late Woodland Ontario Iroquoian wild turkeys were
compared with those of modern wild turkeys and several data sets for archaeological wild
and domestic turkeys (Table 3.17, Figure 3.10). At least three different dietary niches are
identifiable: (1) a C3-only environment, with possible canopy effect, (2) a C3–
environment with occasional or seasonal C4 (i.e., maize) access and (3) consistent maize
access (i.e., purposeful feeding of captive and/or free–ranging birds) (Figure 3.10). These
dietary niches are statistically distinct based on a one–way ANOVA for both δ13Ccol
(F=419.3, p<0.000) and δ15Ncol values (F32.7, p<0.000).
Table 3.5: Summary of the published δ13Ccol and δ15Ncol values for wild and domestic
archaeological turkey data from across North America.
Site Name and Location
δ13Ccol ‰ (VPDB)
Std Dev
δ15Ncol ‰ (AIR)
Std Dev n Reference
Western Basin, Ontario* –22.28 ±0.96 6.40 ±0.92 15 this study
Donnaha Site, North Carolinian –21.51 ±0.49 4.57 ±0.46 16 Price 2009**; Price et al.
2010 Various sites, Colorado –9.00 ±1.07 7.73 ±1.10 30 Rawlings and Driver
2010 Ch–254, Chihuahua, Mexico –7.00 – 10.40 – 1 Webster and Katzenberg
2008 * All Western Basin samples are from the Arkona region Inland West Pit Sites (A.D. 1160–1270). **Price’s summary data were provided by personal communication; individual data are not available (see Price et al. 2010).
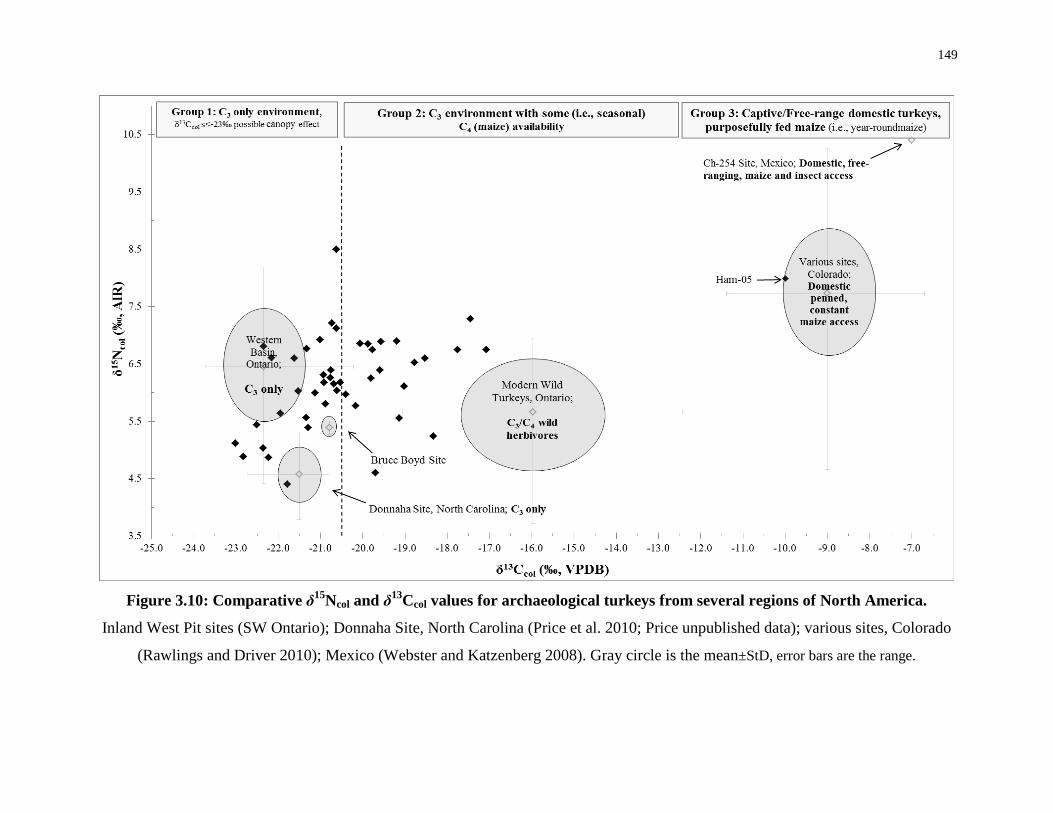
149
Figure 3.10: Comparative δ15Ncol and δ13Ccol values for archaeological turkeys from several regions of North America.
Inland West Pit sites (SW Ontario); Donnaha Site, North Carolina (Price et al. 2010; Price unpublished data); various sites, Colorado
(Rawlings and Driver 2010); Mexico (Webster and Katzenberg 2008). Gray circle is the mean±StD, error bars are the range.
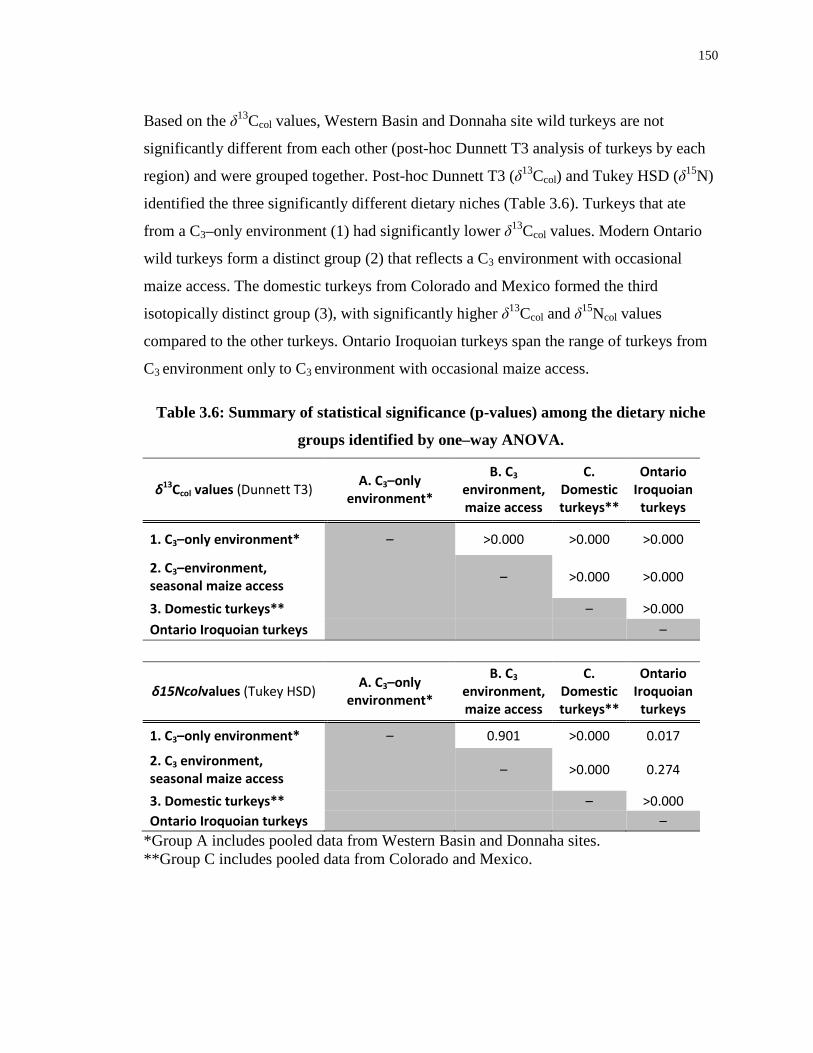
150
Based on the δ13Ccol values, Western Basin and Donnaha site wild turkeys are not
significantly different from each other (post-hoc Dunnett T3 analysis of turkeys by each
region) and were grouped together. Post-hoc Dunnett T3 (δ13Ccol) and Tukey HSD (δ15N)
identified the three significantly different dietary niches (Table 3.6). Turkeys that ate
from a C3–only environment (1) had significantly lower δ13Ccol values. Modern Ontario
wild turkeys form a distinct group (2) that reflects a C3 environment with occasional
maize access. The domestic turkeys from Colorado and Mexico formed the third
isotopically distinct group (3), with significantly higher δ13Ccol and δ15Ncol values
compared to the other turkeys. Ontario Iroquoian turkeys span the range of turkeys from
C3 environment only to C3 environment with occasional maize access.
Table 3.6: Summary of statistical significance (p-values) among the dietary niche
groups identified by one–way ANOVA.
δ13Ccol values (Dunnett T3) A. C3–only environment*
B. C3 environment, maize access
C. Domestic turkeys**
Ontario Iroquoian
turkeys
1. C3–only environment* – >0.000 >0.000 >0.000
2. C3–environment, seasonal maize access – >0.000 >0.000
3. Domestic turkeys** – >0.000 Ontario Iroquoian turkeys –
δ15Ncolvalues (Tukey HSD) A. C3–only
environment*
B. C3
environment, maize access
C. Domestic turkeys**
Ontario Iroquoian
turkeys
1. C3–only environment* – 0.901 >0.000 0.017
2. C3 environment, seasonal maize access – >0.000 0.274
3. Domestic turkeys** – >0.000 Ontario Iroquoian turkeys –
*Group A includes pooled data from Western Basin and Donnaha sites. **Group C includes pooled data from Colorado and Mexico.
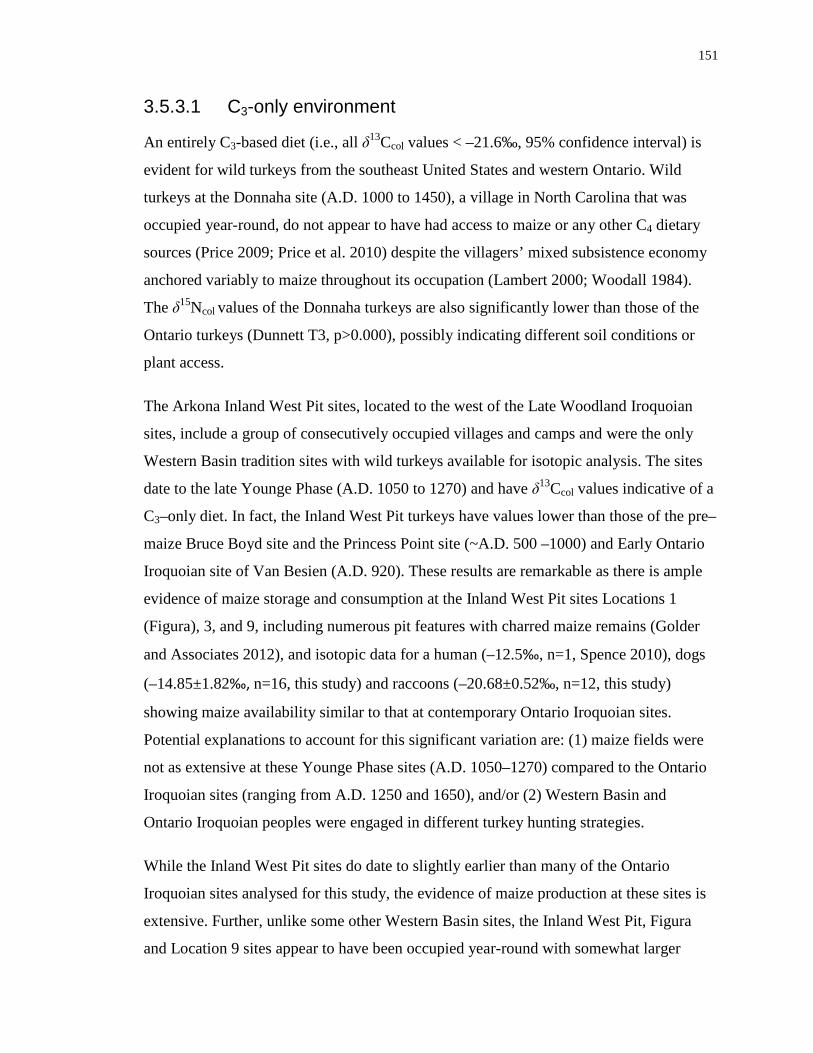
151
3.5.3.1 C3-only environment
An entirely C3-based diet (i.e., all δ13Ccol values < –21.6‰, 95% confidence interval) is
evident for wild turkeys from the southeast United States and western Ontario. Wild
turkeys at the Donnaha site (A.D. 1000 to 1450), a village in North Carolina that was
occupied year-round, do not appear to have had access to maize or any other C4 dietary
sources (Price 2009; Price et al. 2010) despite the villagers’ mixed subsistence economy
anchored variably to maize throughout its occupation (Lambert 2000; Woodall 1984).
The δ15Ncol values of the Donnaha turkeys are also significantly lower than those of the
Ontario turkeys (Dunnett T3, p>0.000), possibly indicating different soil conditions or
plant access.
The Arkona Inland West Pit sites, located to the west of the Late Woodland Iroquoian
sites, include a group of consecutively occupied villages and camps and were the only
Western Basin tradition sites with wild turkeys available for isotopic analysis. The sites
date to the late Younge Phase (A.D. 1050 to 1270) and have δ13Ccol values indicative of a
C3–only diet. In fact, the Inland West Pit turkeys have values lower than those of the pre–
maize Bruce Boyd site and the Princess Point site (~A.D. 500 –1000) and Early Ontario
Iroquoian site of Van Besien (A.D. 920). These results are remarkable as there is ample
evidence of maize storage and consumption at the Inland West Pit sites Locations 1
(Figura), 3, and 9, including numerous pit features with charred maize remains (Golder
and Associates 2012), and isotopic data for a human (–12.5‰, n=1, Spence 2010), dogs
(–14.85±1.82‰, n=16, this study) and raccoons (–20.68±0.52‰, n=12, this study)
showing maize availability similar to that at contemporary Ontario Iroquoian sites.
Potential explanations to account for this significant variation are: (1) maize fields were
not as extensive at these Younge Phase sites (A.D. 1050–1270) compared to the Ontario
Iroquoian sites (ranging from A.D. 1250 and 1650), and/or (2) Western Basin and
Ontario Iroquoian peoples were engaged in different turkey hunting strategies.
While the Inland West Pit sites do date to slightly earlier than many of the Ontario
Iroquoian sites analysed for this study, the evidence of maize production at these sites is
extensive. Further, unlike some other Western Basin sites, the Inland West Pit, Figura
and Location 9 sites appear to have been occupied year-round with somewhat larger
152
populations, particularly at Location 9. If maize dependency was increasing at the sites
by this time, as seems probable based on the extensive maize storage pit system (Golder
and Associates 2012), maize fields could have been quite large. Differences in human
behavioural patterns at Western Basin versus Ontario Iroquoian sites related to turkey
hunting practices may be the best explanation for the data. For example, maize
production and turkey hunting may have been geographically separate activities at
Western Basin sites. Western Basin peoples may have hunted turkeys away from maize
fields and/or their harvesting techniques may have left minimal maize waste in fields
leaving no cold weather food resource for turkeys. These ideas are explored in more
detail below.
3.5.3.2 C3 environment with seasonal maize access
Although all of the modern turkeys consumed a mixed C3/C4 diet and were generally
more enriched in 13C, their isotopic compositions overlap with archaeological turkeys
from sites within the Grand River basin in central southwestern Ontario as well as the
two sites to the north analysed by Katzenberg (1989; 2006). This dietary specialization
indicates an interaction between humans and animals whereby: (1) the landscape is
altered by domestic crops, (2) humans accidently or purposefully leave behind some of
their domestic (maize) produce, creating a niche that will attract turkeys, and (3) humans
then use this niche for hunting them. In the case of modern turkeys, maize waste may be
accidental; however, modern hunters know that agricultural fields attract turkeys and will
often hunt turkeys near the edge of fields. As discussed previously, there is osteological
(i.e., juvenile skeletal remains with age-at-death estimates), contextual (i.e., winter house
middens), zooarchaeological (Foreman 2011; Noble and Prevec 1983), and ethnohistoric
(Thwaites 1896–1901) evidence of cold-weather hunting of turkeys, the time of year
turkeys would be expected to be in maize fields. The turkeys analysed at the Ontario
Iroquoian sites had eaten some maize suggesting that they may have been hunted in or
near maize fields. The question is whether or not Late Woodland Ontario Iroquoian
peoples purposefully or accidentally created this C3/C4 niche, which is discussed in detail
below.
153
3.5.3.3 Domestic turkeys
Not surprisingly, domestic turkeys have significantly higher mean δ13Ccol values, which
indicate year-round access to maize, and are the compositions expected for domesticated
birds. Almost all of the Ontario Iroquoian turkeys analysed in this study do not appear to
have been domesticated turkeys provisioned year-round with maize. However, a single
Neutral sample, Ham–05, from the Hamilton site, has a δ13Ccol value comparable to the
domestic turkeys of the American southwest (Figure 3.10). This turkey was recovered
from a small midden found within the palisades, as opposed to the majority of turkeys,
which were recovered from middens outside the village walls (Lennox 1977). The
location within the walls and the δ13Csc and δ13Ccol values suggest that this turkey was
specially treated as discussed below. The domestic turkeys from the American southwest
and Mexico also had significantly higher δ15Ncol values, which has been attributed to
increased regional aridity causing higher δ15Ncol values of plants (Ambrose 1991).
3.5.4 Wild turkey food security and garden hunting
In the fall, turkeys will gorge on acorns, maize waste, and other readily available foods to
fatten for the winter. During the winter, turkeys in Ontario, at the northern extremes of
their natural range, actively seek out winter food resources or face starvation. The Jesuit
Relations includes descriptions of turkeys venturing near human settlement to find food
during winter scarcity (Thwaites 1896–1901 59:171). This behaviour creates hunting
opportunities for humans because maize waste in fields provides a sustainable food
resource for the turkeys during these months. Although it has been argued that the
attraction of turkeys to food available in human settlements led to self-domestication in
the southwest (Dickson 1992), based on the isotopic and zooarchaeological data, this did
not happen in Ontario.
Faunal assemblages indicate that starting in the Middle Ontario Iroquoian phase (A.D.
1240 to 1450) there is a marked decrease in the number of cold-weather hunted species
such as turkeys and white-tailed deer (Foreman 2011; Prevec and Noble 1983; Stewart
2000). Foreman (2011) attributes the decrease in wild turkeys to a scheduling conflict
between crop harvesting/nut collecting and the start of fall hunting season (deer, raccoon
154
and turkey). With heavier reliance on crops, there was an increasing emphasis on near-
settlement, opportunistic procurement of animals (Foreman 2011). A number of the
turkeys at Middle Ontario Iroquoian and Neutral (A.D. 1450 to 1540) sites have high
δ13Ccol values, which support the hypothesis that Ontario Iroquoian peoples hunted crop-
eating birds in their fields opportunistically.
The number of archaeological turkeys exhibiting these high δ13C values, some of which
overlap with modern turkeys known to live near maize fields, suggests access to
relatively large quantities of maize. It is possible that accidental maize waste would not
provide sufficient resources for these birds, and in fact, Ontario Iroquoian peoples
probably left a certain amount of maize waste in fields on purpose after harvest, creating
a cold-weather feeding space for several species, including wild turkeys.
Providing food security for wild turkeys is not unheard of in modern contexts and it is
possible to conclude that the ancient peoples of Ontario did the same thing. What may
have begun as an observation that turkeys preferentially selected maize fields for fall
fattening and winter food sources, therefore creating predictable hunting zones, may have
shifted to food provisioning by ancient humans. This behaviour may explain why a great
number of the turkeys from the central southwestern Ontario area sites (n=12 of 32) have
δ13C values indicative of maize consumption. However, the provisioning of turkeys
appears to be limited geographically to central southwestern Ontario. At sites west of this
region, such as the Western Basin tradition Inland West Pit sites, and east of the region,
such as Thorold, turkeys ate in an exclusively C3 environment. The question to consider
is how and why this practice may have developed.
Tending fields and harvesting was considered women’s work among the Iroquois-
speaking nations (Heidenreich 1971; Thwaites 1896–1901 65; Tooker 1991; Wrong
1939). Carr (1883:36) recounted the words of Parker, an Iroquoian general, describing
the Six Nations Iroquois:
"Among all the Indian tribes, especially the more powerful ones, the principle that a man
should not demean himself or mar his dignity by cultivating the soil or gathering its
product was most strongly inculcated and enforced. It was taught that a man's province
155
was war, hunting, and fishing. While the pursuit of agriculture, in any of its branches,
was by no means prohibited, yet, when any man, excepting the cripples, old men, and
those disabled in war or hunting, chose to till the earth, he was at once ostracized from
men's society, classed as a woman or squaw, and was disqualified from sitting or
speaking in the councils of his people until he had redeemed himself by becoming a
skillful warrior or a successful hunter."
As women were responsible for harvesting crops, it may also have been the women and
perhaps elderly men, who created a garden hunting niche by leaving behind maize in
fields. Prior to 1200 A.D., turkeys may have been actively hunted in the forest by men
(Dickson 1992; Engelbrecht 2003) but the opportunistic and supplemental turkey meat
may have been managed by women. With decreasing winter hunting and greater
opportunistic hunting, a shift to turkey hunting closer to fields and villages may have
evolved.
Wright (2004) has noted that the Middle Ontario Iroquoian phase was also a time of
considerable ceremonial activity. Therefore the emphasis on a predictable turkey source
may not have been for meat, but for feathers, an important component of medicine
bundles, and ritual headdresses and cloaks.
While turkey provisioning appears to have commenced during the Middle Ontario
Iroquoian tradition, it continues at Neutral sites, which were distinguished not only by
increasing populations, long-term habitation and maize exploitation but also climate
change in which the Medieval Warm Period (MWP, ~A.D. 800 to 1200) was followed by
the cooling effect of the Little Ice Age (LIA, ~A.D. 1450 to 1800). The impact of these
major climatic events on northeastern North America would have been a shift from a
notably longer growing season to a shorter growing season beginning at the end of the
Middle Ontario Iroquoian stage and continuing throughout the Neutral (Bernabo 1981;
Campbell and Campbell 1989; Dean 1994:7; Foster 2012; Gajewski 1988; Mullins et al.
2011; Viau et al. 2012). The consequences of climate change to the Neutral include
famine. The Jesuit Relations refer to famine during Historic Neutral times. In 1639, du
Peron writes, “[t]he famine this year is rather serious; but it is worse in the Neutral
156
nation, where children are sold like slaves in order to procure corn” (Thwaites 1896–
1901 15:157), and in 1642 Lalemant describes a three-year famine that ravaged Neutral
peoples (Thwaites 1896–1901 21). During this Neutral stage a trade-off between maize
collection and predictable protein sources may explain variation in the δ13C values of
turkey bones at different sites. For example, at two Neutral sites, Thorold on the Niagara
Peninsula (A.D. 1620–1630) and Fonger located on the Grand River (A.D. 1580–1600),
mean δ13Ccol values suggest dominantly wild C3 diets. By comparison, Neutral sites such
as Walker, Hamilton, Ball and Kelly-Campbell (Katzenberg 1989; 2006) contain turkeys
that had continued to access maize. Although variation in the turkey δ13Ccol values may
be the result of sample size, based on the current data, it appears that site and/or region
specific food provisioning of wild turkeys, a unique activity, was used by many Ontario
Iroquoian peoples during the Late Woodland.
3.5.5 Wild turkey for ritual and cold-weather feasting
Wild turkey remains recovered from “distinct” contexts might also provide further insight
into cultural ideology. Two specific cases are explored: the ritual bundles from an Early
Woodland component of the Bruce Boyd site, and cold-weather feasting at Middle
Ontario and Neutral phase sites.
The two samples from an Early Woodland component (700 -400 B.C.) of the Bruce Boyd
site (Table 3.7) were recovered from a human burial feature (Spence et al. 1978; M.
Spence, personal communications). They have unexpectedly high δ13Ccol values (mean =
–20.78±0.15‰) and slightly lower than expected δ15Ncol values (mean = 5.39±0.16‰).
Although these turkeys were intended to provide a baseline for a C3–only environment
because the Bruce Boyd site pre-dates maize horticulture, these birds may have
consumed small amounts of C4 foods. This unexpected result could be explained by a
much earlier entry of maize into Ontario than was previously known, an alternate C4
resource (e.g., amaranth), and/or trade of bones or animal parts for ritually specific
purposes from a location outside of Ontario (i.e., New York or Ohio) where maize was
present much earlier (Allegreto 2007; Capella 2005; Crawford et al. 2006; Martin 2004).
Exchange of animal remains with special properties, specifically of turkey wings as
medicinal objects, is recorded in the Jesuit Relations; “[Saossarinon, a healer] taught the
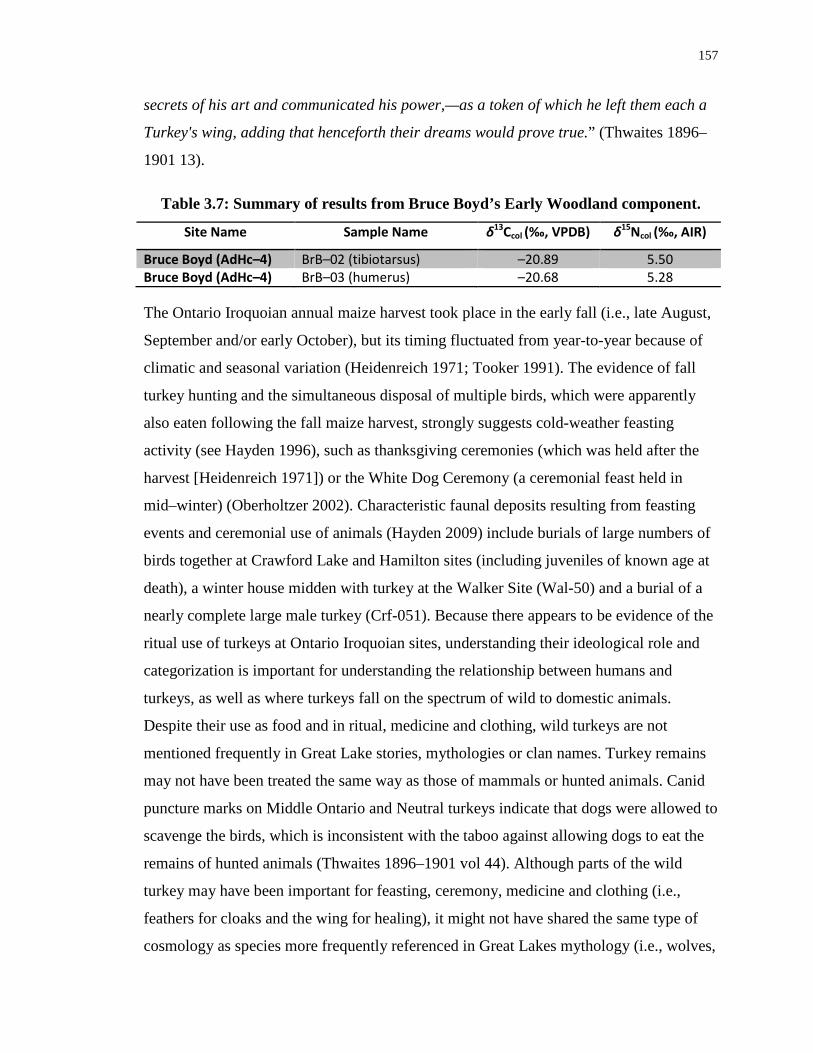
157
secrets of his art and communicated his power,—as a token of which he left them each a
Turkey's wing, adding that henceforth their dreams would prove true.” (Thwaites 1896–
1901 13).
Table 3.7: Summary of results from Bruce Boyd’s Early Woodland component.
Site Name Sample Name δ13Ccol (‰, VPDB) δ15Ncol (‰, AIR)
Bruce Boyd (AdHc–4) BrB–02 (tibiotarsus) –20.89 5.50 Bruce Boyd (AdHc–4) BrB–03 (humerus) –20.68 5.28
The Ontario Iroquoian annual maize harvest took place in the early fall (i.e., late August,
September and/or early October), but its timing fluctuated from year-to-year because of
climatic and seasonal variation (Heidenreich 1971; Tooker 1991). The evidence of fall
turkey hunting and the simultaneous disposal of multiple birds, which were apparently
also eaten following the fall maize harvest, strongly suggests cold-weather feasting
activity (see Hayden 1996), such as thanksgiving ceremonies (which was held after the
harvest [Heidenreich 1971]) or the White Dog Ceremony (a ceremonial feast held in
mid–winter) (Oberholtzer 2002). Characteristic faunal deposits resulting from feasting
events and ceremonial use of animals (Hayden 2009) include burials of large numbers of
birds together at Crawford Lake and Hamilton sites (including juveniles of known age at
death), a winter house midden with turkey at the Walker Site (Wal-50) and a burial of a
nearly complete large male turkey (Crf-051). Because there appears to be evidence of the
ritual use of turkeys at Ontario Iroquoian sites, understanding their ideological role and
categorization is important for understanding the relationship between humans and
turkeys, as well as where turkeys fall on the spectrum of wild to domestic animals.
Despite their use as food and in ritual, medicine and clothing, wild turkeys are not
mentioned frequently in Great Lake stories, mythologies or clan names. Turkey remains
may not have been treated the same way as those of mammals or hunted animals. Canid
puncture marks on Middle Ontario and Neutral turkeys indicate that dogs were allowed to
scavenge the birds, which is inconsistent with the taboo against allowing dogs to eat the
remains of hunted animals (Thwaites 1896–1901 vol 44). Although parts of the wild
turkey may have been important for feasting, ceremony, medicine and clothing (i.e.,
feathers for cloaks and the wing for healing), it might not have shared the same type of
cosmology as species more frequently referenced in Great Lakes mythology (i.e., wolves,
158
bears, foxes, eagles and beavers) and on effigy pipes (owls, crows, ravens, ducks and
eagles) (Mathews 1980; Noble 1979; Wonderley 2005).
It is possible, therefore, that wild turkeys were categorized differently than the more
frequently depicted aquatic and predatory bird species in Eastern Woodland art and myth
(Mathews 1980). For example, the “native taxonomy” of the American Bottom,
(southwestern Illinois around the Mississippian floodplain), which is based on faunal
assemblages and depiction in art, sorts species into those that are ideologically important
and commonly represented in art (bears, snakes and spider) versus others that were only
eaten or economically important and less frequently represented (such as deer and fish)
(Zimmerman Holt 1996:100). In the American Bottom, according to Zimmerman Holt’s
categorization, turkeys could have been categorized with other opportunistically hunted
terrestrial animals (i.e., muskrats and squirrels) or with the complicated category of birds.
Based on the minimal imagery of turkeys in myths and on pottery, turkeys may have been
categorized on their terrestrial nature (unlike aquatic or migrating birds), behavioural
patterns (i.e., diurnal, flocking, non–migratory), and practical significance as a high
reward-relatively low energy hunted species. There is a unique pattern of human
provisioning that occurred in southwestern Ontario, not currently recognized elsewhere.
The question remains whether this was a form of proto–domestication or simply a
convenient hunting strategy for Late Woodland Ontario Iroquoian peoples.
3.5.6 Domestication status
Researchers in the southwest and Central America have hypothesized that the ceremonial
uses of the turkeys (i.e. feather production and role in ritual) led to their domestication
(Breitburg 1993). Because wild turkeys in southwestern Ontario appear to have been used
for both feasting and ceremony from the Early (Bruce Boyd) to Late Woodland periods
(Crawford Lake and Hamilton), it is possible that they were on a continuum to
domestication for this reason as well. There is isotopic evidence at the Hamilton site that
at least one Neutral wild turkey (Ham-05) was held in captivity within the village and
purposefully fed. Likely the most important site within the Grand River region, the
Hamilton village was occupied at the height of the Neutral famine (1638 to 1651)
(Lennox 1977). Ham-05 was recovered from a small midden within the village and had
159
access to maize year round. Because it must have been kept in captivity, this bird was
either raised for food or kept as a pet. The keeping of small mammals and birds as pets
has been recognized in ethnohistoric accounts of the Neutral (Galton 1865; Wrong 1939),
as well as in the practice of specifically capturing and raising turkey poults in other
regions (Schorger 1966). Pet keeping has been argued by some researchers as a precursor
to domestication given appropriate economic pressures (Serpell 1989). The close
relationship between humans and turkeys that is implied by the purposeful feeding of a
captive bird may mark a phase of raising turkeys within the village walls,. Overall, there
was not enough evidence to support a theory of proto-domestication, but it is clear that
there was a unique relationship between turkeys and humans at Ontario Iroquoian sites
involving provisioning, cold-weather feasting and/or ritual use, purposeful feeding and
captivity. Further, this relationship is variable and dynamic, changing regionally and
temporally.
3.5.7 Tracing hunting ranges using δ18Osc values
Because wild turkeys are non-migratory and their habitats must include access to water,
usually within 2.4 to 3.2 kms of their roost (Schorger 1966), their δ18Osc values should
reflect those of the local water they drink. Based on this hypothesis, it may be possible to
determine if turkeys were hunted locally (i.e., near sites) or away from sites.
To estimate what the available δ18O values of water available to turkeys may have been at
each of the sites sampled in this study, annual average oxygen isotopic compositions for
precipitation (δ18Oprecipitation) were interpolated based on sixteen water stations across the
Great Lakes region (IAEA/WMO 2013; Longstaffe unpublished data) see discussion
Chapter 1, Section 1.3.4, Figure 1.2 and 3.11). The range of δ18Oprecipitation values for the
region with available turkeys is less than 2%. The δ18O values of the turkeys’ structural
carbonate was converted to phosphate following Iacumin et al. (1996:4):
δ18Ophosphate = 0.98(δ18Osc) –8.5 [Equation 3.1]
The bone phosphate values were converted to precipitation values following Luz et al.’s
(1990:1724) formula:
160
δ18Ophosphate = 34.63 + 0.6506(δ18Oprecipitation) – 0.171(humidity)17 [Equation 3.2]
and statistically compared to the interpolated δ18Oprecipitation for each site
The results show no statistical relationship between turkey δ18Osc values and predicted
δ18Oprecipitation values based on a Pearson’s correlation for either the archaeological turkeys
(mean = 20.66±1.14‰, range = 18.06 to 22.16‰) or modern wild turkeys (mean =
20.18±1.64‰, range =15.12 to 21.40‰).
There are several explanations for this lack of correlation. The most likely explanation is
the limitations of the current precipitation model, based on a very small range of
δ18Oprecipitation values for the geographic region of interest.
There may be other contributing factors affecting the lack of correlation between δ18Osc
values and predicted δ18Oprecipitation values, such as different ages-of-death of the turkeys.
As bone represents a lifetime average, depending on the metabolic rate and age at death,
the turkeys’ structural carbonate could reflect different numbers of summers or winters
survived. The seasonal effect on δ18Oprecipitation values can be quite significant in Ontario
due to changing temperatures and air mass sources. Alternatively, the lack of correlation
could be explained by changing water sources throughout the year. For example, in the
winter turkeys may access spring–fed streams essential for cold weather survival
(Schorger 1966), and which often include ground water, which may not directly reflect
δ18Oprecipitation values (Darling et al. 2003). During the warmer months of the year, turkeys
are able to access ponds, streams and rivers fed by local precipitation, more readily.
17 humidity was estimated at 85%, based on an Ontario average.
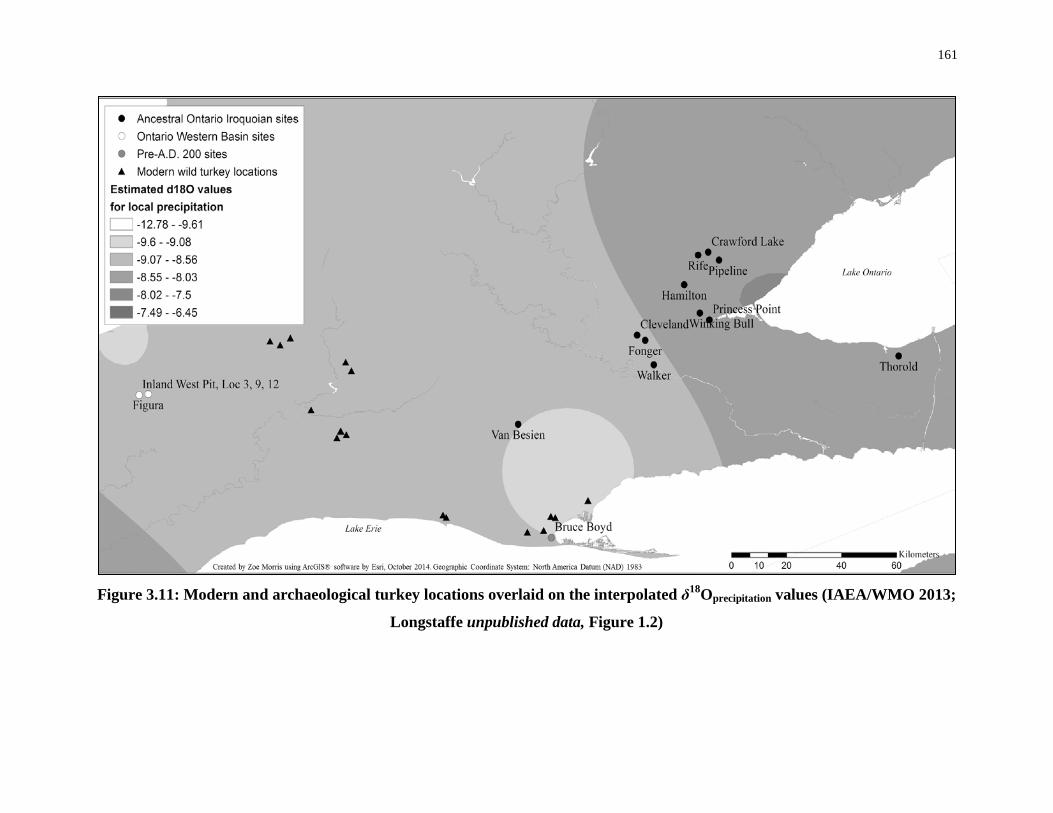
161
Figure 3.11: Modern and archaeological turkey locations overlaid on the interpolated δ18Oprecipitation values (IAEA/WMO 2013;
Longstaffe unpublished data, Figure 1.2)
162
3.6 Conclusions This study has demonstrated the importance of using modern species as comparative
models for understanding human-animal interactions in the past, and that δ13Csc values for
birds can be used to expand on traditional dietary δ13Ccol studies. The carbon and nitrogen
isotopic data also provide insight into: (1) dietary adaptations of turkeys to changing
environments; (2) varying behavioural patterns of past humans related to subsistence
practice, and (3) the complexity of the relationship between humans and animals. Further,
cultural differences in landscape and animal management used by Ontario Iroquoian and
Western Basin peoples and responses by turkeys to environmental change were explored
through regional comparison of turkey carbon-isotopic analyses. Although full
domestication of wild turkeys is not part of the spectrum of human-animal relationships
in southern Ontario, this study has shown an interaction between wild turkeys and
Ontario Iroquoian people that is currently unique in the North American archaeological
literature.
The carbon isotopic composition of wild turkey remains from Grand River basin sites
indicates that turkeys began consuming maize more consistently in the Middle Ontario
Iroquoian phase. This behaviour continued into the historic Neutral period at some sites,
along with evidence of year–round, purposeful feeding of at least one turkey at the
Hamilton site. Age-at-death analysis of juvenile turkeys and burial context provided
direct evidence of cold-weather turkey hunting, supported by previously established
zooarchaeological and ethnohistoric descriptions of fall and winter hunting of wild
turkeys in Ontario. The increasing number of turkeys that consumed maize combined
with the decreasing numbers of turkeys in faunal assemblages starting around A.D. 1200
may represent a shift to opportunistic, near-settlement hunting at Ontario Iroquoian sites.
Based on the results, it is suggested that turkeys hunted at Late Woodland Ontario
Iroquoian sites were purposefully provisioned with maize, post-harvest, ensuring the
availability of turkey for food, feasting, ritual, and medicine during the colder months.
Because the Iroquoian maize harvest was the responsibility of women, it is proposed that
they were responsible for creating the garden-hunting niche by leaving surplus maize in
fields and possibly hunting the turkeys there as well.
163
The use of δ18Osc values of turkey bones to confirm near-site hunting does not appear to
be a useful method for tracking the geographic hunting ranges of Late Woodland hunters
because of a lack of variation in local precipitation δ18O values within the geographic
region.
Our understanding of the wild turkey and its relationship to Ontario archaeological
peoples should be expanded in future work by increasing the sample size, particularly for
the Western Basin region, and incorporating multiple tissue analysis in order to better
understand the influence of seasonality on human–animal interactions.
164
References Cited Allegretto, K.O., 2007. Adopting Maize in the Eastern Woodlands of North America.
[Unpublished Ph.D. thesis]. Brandeis University, Waltham, MA.
Ambrose, S. H., 1991. Effects of diet, climate and physiology on nitrogen isotope abundances in terrestrial foodwebs. Journal of Archaeological Science, 18(3), 293–317.
Ambrose, S. H., 1993. Isotopic analysis of paleodiets: methodological and interpretive considerations. In: Sandford, M. K. (Ed.) Investigations of Ancient Human Tissue: Chemical Analyses in Anthropology, Gordon and Breach, New York, pp. 58.
Ambrose S.H, Norr L. 1993. Experimental evidence for the relationship of the carbon isotope ratios of whole diet and dietary protein to those of bone collagen and carbonate. In: Lambert J., Grupe, G., (Eds), Prehistoric human bone: archaeology at the molecular level. Springer–Verlag, Berlin, pp. 1–37.
Bernabo, J. C., 1981. Quantitative estimates of temperature changes over the last 2700 years in Michigan based on pollen data. Quaternary Research, 15(2), 143–159.
Beachum, B.E., Durand, S.R., 2007. Eggshell and the archaeological record: new insights into turkey husbandry in the American Southwest. Journal of Archaeological Science 34, 1610–1621.
Bligh, E. G., Dyer, W. J, 1959. A rapid method of total lipid extraction and purification. Canadian journal of biochemistry and physiology, 37(8), 911–917.
Bökönyi, S. (1969). Archaeological problems and methods of recognizing animal domestication. The domestication and exploitation of plants and animals, In: Ucko, P. J., Dimbleby, G. W. (Eds.), The domestication and exploitation of plants and animals. Aldine Transaction Publishers, Chicago, pp. 219–29.
Branford Oltenacu, E.A., 2004., Domestication of animals. In: Pond, W.G., Bell, A.W. (Eds.), Encyclopedia of animal science. Marcel Dekker, New York, pp. 294–296.
Breitburg, E., 1993. The evolution of turkey domestication in the greater southwest and Mesoamerica. In: Woosley, A.I., Ravesloot, J.C. (Eds), Culture and Contact: Charles C. Di Peso’s Gran Chichimeca, University of New Mexico Press, Albuquerque, pp 153–172.
Campbell C., Campbell I.D. 1989. The Little Ice Age and Neutral Faunal Assemblages. Ontario Archaeology 49, 13–33.
Cappella K. 2005. Ontario’s First Farmers? Investigations into Princess Point and the Introduction of Horticulture to Ontario. [Unpublished Ph.D. thesis]. Peterborough: Trent University.
165
Carr, L., 1883. The mounds of the Mississippi Valley historically considered, Vol. II of the Memoirs of the Kentucky Geological Survey.
Cerling, T.E. and Harris, J.M., 1999. Carbon isotope fractionation between diet and bioapatite in ungulate mammals and implications for ecological and paleoecological studies. Oecologia, 120(3), 347–363.
Chisholm BS, Nelson DE, Hobson KA, Schwarcz HP, Knyf M., 1983. Carbon isotope measurement techniques for bone collagen: notes for the archaeologist. Journal of Archaeological Sciences 10, 355–360.
Clementz, M.T., Koch, P.L., 2001. Differentiating aquatic mammal habitat and foraging ecology with stable isotopes in tooth enamel. Oecologia, 129(3), 461–472.
Clutton–Brock, J., 1994. The unnatural world: Behavioural aspects of humans and animals in the process of domestication. In: Manning, A., Serpell, J., (Eds), Animals and society; Changing perspectives, Routledge, London, pp. 23–35.
Coplen, T.B., 1996. New guidelines for reporting stable hydrogen, carbon, and oxygen isotope–ratio data. Geochimica et Cosmochimica Acta. 60: 3359–3360.
Coplen, T. B., 2011. Guidelines and recommended terms for expression of stable‐isotope‐ratio and gas‐ratio measurement results. Rapid Communications in Mass Spectrometry, 25(17), 2538–2560.
Coplen, T.B., Brand, W.A., Gehre, M., Gröning, Meijer, H.A., Toman B., Verkouteren, R.M., 2006. New guidelines for δ13C measurements. Analytical Chemistry 78, 2439–2441.
Cormie, A. B., Schwarcz, H.P., 1994. Stable isotopes of nitrogen and carbon of North American white-tailed deer and implications for paleodietary and other food web studies. Palaeogeography, Palaeoclimatology, Palaeoecology. 107, 227–241.
Crawford, R.D., 1992. Introduction to Europe and the diffusion of domesticated turkeys from the Americas. Archivos de Zootecnia. 41, 307–314.
Crawford, G.W., Saunders, D., Smith, D.G., 2006. Pre–Contact Maize from Ontario, Canada: Context, chronology, variation, and plant association. In: Staller, J., Tykot, R., Benz, B. (Eds.). Histories of maize: multidisciplinary approaches to the prehistory, linguistics, biogeography, domestication, and evolution of maize. Left Coast Press, Walnut Creek, pp. 549–559.
Darling, W. G., Bath, A. H., and Talbot, J. C., 2003. The O and H stable isotope composition of freshwaters in the British Isles. 2: surface waters and groundwater. Hydrology and Earth System Sciences, 7, 183–195.
Davis, K., 2001. More than a meal: The turkey in history, myth, ritual, and reality. Lantern Books: New York.
166
Davis, S. J.,1992. A rapid method for recording information about mammal bones from archaeological sites. English Heritage AML report, 71: 1–16.
Dean, W.G., 1994. The Ontario landscape, circa A.D. 1600. In: Rogers, E.S., Smith, D.B. (Eds.), Aboriginal Ontario: Historical perspectives on the First Nations, Dundrum Press Ltd., Toronto, pp. 3–20.
DeNiro, M.J., 1985. Postmortem preservation and alteration of in vivo bone collagen isotope ratios in relation to palaeodietary reconstruction. Nature 317, 806–809.
Denke, C., 1804–1805. The Diaries of Christian Denke on the Sydenham River 1804–1805, website: http://www.denke.org/CDDiaries.htm.
Dickson, O.P., 1992. Canada's First Nations: A history of founding peoples from earliest times (Vol. 208). University of Oklahoma Press: Norman, Oklahoma.
Dietz, Maurine W. and Robert E. Ricklefs (1997) Growth Rate and Maturation of Skeletal Muscles over a Size Range of Galliform Birds. Physiological Zoology, 70(5):502–510.
Eaton, S.W., 1992. Wild Turkey: Meleagris gallopavo. The Birds of North America: Life Histories for the 21st Century no. 22, the Academy of Natural Sciences, Philadelphia, pp. 1–28.
Ellis, J.E., Lewis, J.B., 1967. Mobility and annual range of wild turkeys in Missouri. The Journal of Wildlife Management, 31(3), 568–581.
Engelbrecht, W., 2003. Iroquois: The making of a Native World. Syracuse University Press, Syracuse.
Foreman, L., 2011. Seasonal subsistence in Late Woodland southwestern Ontario: An examination of the relationship between resource availability, maize agriculture, and faunal procurement and processing strategies. [Unpublished Ph.D. thesis]. The University of Western Ontario, London.
Foster, W. C., 2012. Climate and culture change in North America AD 900–1600. University of Texas Press, Austin
Galton, F., 1865. The first steps towards the domestication of animals. Transactions of the Ethnological Society of London, 122–138.
Godfrey, W.E., 1966. The birds of Canada. National Museums of Canada Bulletin No. 203, Biological Series No. 73, Ottawa.
Golder and Associates, 2012. Stage 2 archaeological assessment: Jericho Wind Inc., Jericho Wind Energy Centre, Lambton and Midddlesex Counties, Ontario. Manuscript on file, Ontario Ministry of Tourism, Culture and Sport, Toronto, Ontario.
167
Greene, C.D., Nielsen, C.K., Woolf, A., Delahunt, K.S., Nawrot, J.R., 2010. Wild turkeys cause little damage to row crops in Illinois. Transactions of the Illinois State Academy of Science, 103: 145–152.
Groepper, S. R., Hygnstrom, S. E., Houck, B., Vantassel, S. M., 2013. Real and Perceived Damage by Wild Turkeys: A Literature Review. Journal of Integrated Pest Management, 4(1), A1–A5.
Harris, D.R., 1996. Domesticatory Relationships of People, Plants and Animals. In: Ellen, R., Fukui, K. (Eds.), Redefining nature: Ecology, culture and domestication. BERG, Oxford, pp. 437–463.
Harrison, R. G., Katzenberg, M. A., 2003. Paleodiet studies using stable carbon isotopes from none apatite and Collagen: Examples from Southern Ontario and San Nicolas Island, California. Journal of Anthropological Archaeology, 22, 227–244.
Hatch, K. A., 2012. The use and application of stable isotope analysis to the study of starvation, fasting, and nutritional stress in animals. In: McCue, M.D. (Ed.), Comparative physiology of fasting, starvation, and food limitation, Springer, Berlin, pp. 337–364.
Hammett, J.E. 2000. Ethnohistory of Aboriginal landscapes in the southeastern United States. In: Minnis, P.E., Elisens, W.J. (Eds.), Biodiversity and Native America. University of Oklahoma Press: Norman, pp. 248–300.
Hayden, A.H., 1980. Dispersal and movements of wild turkeys in northern Pennsylvania. Transaction of the Northeastern Wildlife Society, 37, 258–265.
Hayden, B., 1996. Feasting in prehistoric and traditional societies. In: Wiessner, P., Schiefenhövel, W., (Eds.), Food and the status quest: an interdisciplinary perspective, Berghahn Books: New York, pp. 127–147.
Hayden, B., 2009. The proof is in the pudding. Current Anthropology, 50(5), 597–601.
Haynes, G., 1983. A guide for differentiating mammalian carnivore taxa responsible for gnaw damage to herbivore limb bones. Paleobiology, 164–172.
Heckleau, J.D., Porter, W.F., Shields, W.M., 1982. Feasibility of transplanting wild turkeys into areas of restricted forest cover and high human density. Proceedings of the 39th Northeast Fish and Wildlife Conference, 13–15 April, pp. 96–104.
Heidenreich, C., 1971. Huronia: A history and geography of the Huron Indians 1600–1650. McClelland and Steward Limited, Toronto.
Hobson, K. A., 1999. Tracing diets and origins of migratory birds using stable isotope techniques. Society of Canadian Ornithologists Special Publication, Fredericton, New Brunswick, pp. 21–41.
168
Hobson, K. A., 2006. Stable isotopes and the determination of avian migratory connectivity and seasonal interactions. The Auk 122(4), 1037–1048.
Hobson, K. A., Alisauskas, R.T., Clark, R.G., 1993. Stable–nitrogen isotope enrichment in avian tissues due to fasting and nutritional stress: implications for isotopic analyses of diet. Condor 95:388–394
Hobson, K. A., Clark, R. G. 1992. Assessing avian diets using stable isotopes I: turnover of 13C in tissues. Condor, 181–188.
Hobson, K. A., Clark, R. G. 1992. Assessing avian diets using stable isotopes II: factors influencing diet–tissue fractionation. Condor, 189–197.
Howland, M. R., Corr, L. T., Young, S. M., Jones, V., Jim, S., Van Der Merwe, N. J., Mitchell, A.D., Evershed, R. P. 2003. Expression of the dietary isotope signal in the compound‐specific δ13C values of pig bone lipids and amino acids. International Journal of Osteoarchaeology, 13(1‐2), 54–65.
Kates, M., 1986. Lipid extraction procedures. Techniques of lipidology. Elsevier, Amsterdam.
Ingold, T., 1994. From trust to domination: An alternative history of human–animal relations. In: Manning A., Serpell, J. (Eds.), Animals and society; Changing perspective. Routledge, London, pp. 1–22.
Katzenberg, M.A., 1989. Stable isotope analysis of archaeological faunal remains from southern Ontario. Journal of Archaeological Science 16, 319–329.
Katzenberg, M. A., 2006. Prehistoric maize in southern Ontario. In: Staller, J., Tykot, R., Benz, B. (Eds.). Histories of maize: multidisciplinary approaches to the prehistory, linguistics, biogeography, domestication, and evolution of maize. Left Coast Press, Walnut Creek, pp. 263–273.
Kelly, J. F., 2000. Stable isotopes of carbon and nitrogen in the study of avian and mammalian trophic ecology. Canadian Journal of Zoology, 78(1), 1–27.
Kellner, C.M., Schoeninger, M.J., 2007. A simple carbon isotope model for reconstructing prehistoric human diet. American Journal of Physical Anthropology, 133, 1112–1127.
Kelly, J. F. 2000. Stable isotopes of carbon and nitrogen in the study of avian and mammalian trophic ecology, Canadian Journal of Zoology, 78(1), 1–27.
Kempster, B., L. Zanette, F.J. Longstaffe, S.A. MacDougall–Shackleton, J.C. Wingfield and M. Clinchy. 2007. Do stable isotopes reflect nutritional stress? Results from a laboratory experiment on song sparrows, Oecologia, 151(3), 365–371.

169
King, C. L., Tayles, N., Gordon, K. C., 2011. Re–examining the chemical evaluation of diagenesis in human bone apatite, Journal of Archaeological Science, 38(9), 2222–2230.
Kirsanow, K., Makarewicz, C., Tuross, N., 2008. Stable oxygen (δ18O) and hydrogen (δD) isotopes in ovicaprid dentinal collagen record seasonal variation. Journal of Archaeological Science, 35(12), 3159–3167.
Krueger, H. W., Sullivan, C. H., 1984. Models for carbon isotope fractionation between diet and bone, In: Turnland, J.R., Johnson, P.E. (Eds.), Stable isotopes in nutrition, pp. 205–220.
Lambert, P.M., 2000. Life on the periphery: Health in farming communities of interior North Carolinian and Virginia. In: Lambert, P.M., (ed.), Bioarchaeological studies of life in the age of agriculture: A view from the Southeast, The University of Alabama Press, Tuscaloosa, pp. 168–194.
Lasiewski, R. C., Dawson, W. R., 1967. A re–examination of the relation between standard metabolic rate and body weight in birds. The Condor, 69(1), 13–23.
Laubin, R., Laubin, G., 1977. Indian dances of North America: their importance to Indian life (Vol. 141). University of Oklahoma Press, Norman.
Lee–Thorp, J.A., 1989. Stable carbon isotopes in deep time. The diets of fossil fauna and hominids. [Unpublished Ph.D. thesis]. University of Cape Town, Cape Town.
Lee–Thorp, J., Sponheimer, M., 2003. Three case studies used to reassess the reliability of fossil bone and enamel isotope signals for paleodietary studies. Journal of Anthropological Archaeology, 22, 208–216.
Leland, C.G., 1886. The mythology, legends, and folk–lore of the Algonkins. Transactions of the Royal Society of Literature (London), vol. XIV, Part I, pp. 68–91.
Lennox, P. A., 1977. The Hamilton Site: A Late Historic Neutral Town. National Museum of Man, Mercury Series, No. 102. Ottawa.
Leopold A. S., 1944. The nature of heritable wildness in turkeys. The Condor, 46:133–197.
Lippold, L. K., 1974. Avifauna from Wisconsin woodland sites. Arctic Anthropology, 280–285.
Longin ,R., 1971. New method of collagen extraction for radiocarbon dating. Nature, 230, 241–242.

170
MacGowan, B. J., Humberg, L.A., Rhodes Jr., O.E., 2006. Truths and myths about wild turkey. Purdue Extension publication FNR–264–W. Purdue University Cooperative Extension, West Lafayette, Indiana.
Mariotti, A., 1983. Atmospheric nitrogen is a reliable standard for natural 15N abundance measurements. Nature, 303, 685–687.
Martin, S., 2004. Lower Great Lakes Region Maize and Enchainment in the First Millennium AD. Ontario Archaeology, 77(78), 135–159.
Mathews, Z. P., 1980. Of Man and Beast: The chronology of effigy pipes among Ontario Iroquoians. Ethnohistory, 295–307.
McIlhenny, E.A., 1914. The wild turkey and its hunting. Doubleday, Page and Company, Garden City.
McIlwraith, T., 1886. Birds of Ontario. Journal of the Proceedings of Hamilton and Association A. Lawson and Company, Toronto. 1(3).
McKusick, C.R., 2001. Southwest birds of sacrifice. Arizona Archaeological Society, Tucson.
McNeese, T., 1998. Myths of Native America. Running Press: New York.
Metcalfe, J. Z., Longstaffe, F. J., White, C. D., 2009. Method–dependent variations in stable isotope results for structural carbonate in bone bioapatite. Journal of Archaeological Science, 36(1), 110–121.
Milner, G.R., Smith, V.G., 1989. Carnivore alteration of human bone from a late prehistoric site in Illinois, American Journal of Physical Anthropology, 79(1), 43–49.
Mizutani, H., Fukuda, M., Kabaya, Y., 1992. 13C and 15N Enrichment Factors of Feathers of 11 Species of Adult Birds. Ecology, 1391–1395.
Mock, K. E., Theimer, T. C., Rhodes, O. E., Greenberg, D. L., Keim, P., 2002. Genetic variation across the historical range of the wild turkey (Meleagris gallopavo). Molecular ecology, 11(4), 643–657.
Morey, D., 2010. Dogs: domestication and the development of a social bond. Cambridge University Press.
Mullins, H. T., Patterson, W. P., Teece, M. A., Burnett, A. W., 2011. Holocene climate and environmental change in central New York (USA). Journal of Paleolimnology, 45(2), 243–256.
Murphy, C., Ferris, N., 1990. The late Woodland Western Basin tradition of southwestern Ontario. In: Ellis, C.J., Ferris, N. (Eds.), The Archaeology of Southern Ontario to
171
AD, 1650, Occasional Publications of the London Chapter, OAS Number 5, pp. 189–278
Nagy, K. A., 1987. Field metabolic rate and food requirement scaling in mammals and birds. Ecological monographs, 112–128.
Nagy, K. A., 2005. Field metabolic rate and body size. Journal of Experimental Biology, 208(9), 1621–1625.
New Hampshire Fish and Game Department of Environmental Conservation, 2014. Guidelines for winter feeding of wild turkeys in New Hampshire, website: http://www.wildnh.com/Wildlife/turkey_feed_guidelines.htm.
Nielsen–Marsh, C. M., Hedges, R. E. 2000. Patterns of diagenesis in bone I: the effects of site environments. Journal of Archaeological Science, 27(12), 1139–1150. O'Leary, M. H., 1981. Carbon isotope fractionation in plants. Phytochemistry, 20(4), 553–567.
Noble, William C. (1979) Ontario Iroquois effigy pipes. Canadian Journal of Archaeology 3, 69–90.
Oberholtzer, C., 2002. Fleshing out the evidence: from Archaic dog burials to historic dog feasts. Ontario Archaeology, 73, 314.
Ontario Ministry of Agriculture, Food, and Rural Affairs, 2012. Grain Corn: Area and Production, by County, 2012. website: http://www.omafra.gov.on.ca/english/stats/crops/index.html.
Ontario Ministry of Agriculture, Food, and Rural Affairs, 2012. Fodder Corn: Area and Production, by County, 2012, website: http://www.omafra.gov.on.ca/english/stats/crops/ctyfcorn12.htm.
Ontario Ministry of Natural Resources, 2007.Wild turkey management plan for Ontario, website: https://dr6j45jk9xcmk.cloudfront.net/documents/3082/200271.pdf.
Parker, A. C., 1916. The origin of the Iroquois as suggested by their archeology. American Anthropologist, 18(4), 479–507.
Porter, W.F., 1977. Utilization of agricultural habitats by wild turkeys in southeastern Minnesota. International Congress of Game Biologists, 13, 319–323
Porter, W.F., Tangen, R. D., Nelson, G. C., Hamilton, D. A., 1980. Effects of corn food plots on Wild Turkeys in the upper Mississippi Valley. The Journal of Wildlife Management, 456–462.
Prevec, R., Noble, W. C., 1983. Historic Neutral Iroquois faunal utilization. Ontario Archaeology, 39, 41–56.

172
Price, Gypsy 2009. The Donnaha Site: A Regional Isotope Ecology of Late Woodland North Central Piedmont of North Carolina. [Unpublished M.A. thesis]. University of Florida.
Price, G., Krigbaum, J. Thacker, P. 2010. Inferring sociopolitics using faunal stable isotope data from the Late Woodland Donnaha Site. Published abstract of the 75th Annual Meeting of the Society for American Archaeology, St. Louis, Missouri, April 14 – 18.
Pucéat, E., Reynard, B., Lécuyer, C., 2004. Can crystallinity be used to determine the degree of chemical alteration of biogenic apatites?. Chemical Geology, 205(1), 83–97.
Rawlings, T. A., Driver, J. C., 2010. Paleodiet of domestic turkey, Shields Pueblo (5MT3807), Colorado: isotopic analysis and its implications for care of a household domesticate. Journal of Archaeological Science, 37(10), 2433–2441.
Ritzenthaler, R., Ritzenthaler, P. 1970. The Woodland Indians of the Western Great Lakes. The Natural History Press, Garden City, New York.
Rubenstein, D. R., Hobson, K.A., 2004. From birds to butterflies: animal movement patterns and stable isotopes. Trends in Ecology and Evolution, 19(5), 256–263.
Russell, N., 2012. Social zooarchaeology: Humans and animals in prehistory. Cambridge University Press, New York.
Schorger, A.W., 1966) The wild turkey: Its history and domestication. University of Oklahoma Press, Norman.
Sebeok, T. A., 1988. ‘Animal’ in biological and semiotic perspective. In: Ingold, T. (Ed.), What is an Animal?, Unwin Hyman, London, pp. 63–76.
Serpell, J., 1989. Pet–keeping and animal domestication: a reappraisal. In: Clutton–Brock, J. (Ed.), The walking larder: Patterns of domestication, pastoralism, and predation, Routledge, 2–10.
Sillen, A., 1989. Diagenesis of the inorganic phase of cortical bone. In: Price, T.D. (Ed.), The chemistry of prehistoric human bone, Cambridge University Press, Cambridge, pp. 211–229.
Shemesh A., Kolodny Y., & Luz, B. (1988) Isotope geochemistry of oxygen and carbon in phosphate and carbonate of phosphorite francolite. Geochimica et Cosmochimica Acta, 52, 2565–2572.
Speller, C. F., 2009. Investigating turkey (Meleagris gallopavo) domestication in the Southwest United States through ancient DNA analysis, [Unpublished Ph.D. thesis]. Simon Fraser University.
173
Speller, C. F., Kemp, B. M., Wyatt, S. D., Monroe, C., Lipe, W. D., Arndt, U. M., Yang, D. Y., 2010. Ancient mitochondrial DNA analysis reveals complexity of indigenous North American turkey domestication. Proceedings of the National Academy of Sciences, 107(7), 2807–2812.
Spence, M.W., Williamson, R.F., Dawkins, J.H., 1978. The Bruce Boyd Site: An early Woodland component in southwestern Ontario. Ontario Archaeology, 29:33–46.
Sponheimer, M., Lee–Thorp, J. A., 1999. Isotopic evidence for the diet of an early hominid, Australopithecus africanus. Science, 283(5400), 368–370.
Stearns, B.D., 2010. Diet reconstruction of wild Rio–Grande turkey of central Utah using stable isotope analysis, [Unpublished M.A. thesis], Brigham Young University.
Stewart, F. L., 2000. Variability in Neutral Iroquoian Subsistence, AD 1540–1651. Ontario Archaeology, 69, 92–117.
Stuart–Williams, H. L. Q., Schwarcz, H. P., White, C. D., Spence, M. W., 1996. The isotopic composition and diagenesis of human bone from Teotihuacan and Oaxaca, Mexico. Palaeogeography, Palaeoclimatology, Palaeoecology, 126(1), 1–14.
Sumner, P. E., Williams, E. J., 2009. Measuring field losses from grain combines. The University of Georgia College of Agricultural and Environmental Sciences Cooperative Extension, Bulletin 973: 1–8.
Sykes, C. M., 1981. Northern Iroquoian maize remains, Ontario Archaeology, 35, 23–33.
Szpak, P., Orchard, T. J., Gröcke, D. R., 2009. A late holocene vertebrate food web from southern Haida Gwaii (Queen Charlotte Islands, British Columbia). Journal of Archaeological Science, 36(12), 2734–2741.
Tefft, B.C., Gregonis, M.A., Eriksen, R.E., 2005. Assessment of crop depredation by wild turkeys in the United States and Ontario, Canada. Wildlife Society Bulletin, 33(2),590–595.
Thornton, E. K., Emery, K. F., Steadman, D. W., Speller, C., Matheny, R., Yang, D., 2012. Earliest Mexican Turkeys (Meleagris gallopavo) in the Maya region: implications for pre–hispanic animal trade and the timing of Turkey domestication. PloS one, 7(8).
Thwaites, R.G. (Ed.). (1896–1901). The Jesuit Relations and Allied Documents: Travels and explorations of the Jesuit missionaries in New France 1610–1791. The Burrows Brothers Co., Cleveland, website: http://puffin.creighton.edu/jesuit/relations/relations_48.html.
174
Tieszen, L. L., Boutton, T. W., Tesdahl, K. G., Slade, N. A., 1983. Fractionation and turnover of stable carbon isotopes in animal tissues: implications for δ13C analysis of diet. Oecologia, 57(1–2), 32–37.
Tieszen, L.L., Fagre, T., 1993. Carbon isotopic variability in modern and archaeological maize. Journal of Archaeological Science, 30, 25–40.
Tooker, E., 1991. An ethnography of the Huron Indians, 1615–1649 (Vol. 190). Syracuse University Press, Syracuse.
van Klinken, G. J., 1999. Bone collagen quality indicators for palaeodietary and radiocarbon measurements. Journal of Archaeological Science, 26(6), 687–695.
Vander–Haegen, W. M., Sayre, M. W., Dodge, W. E., 1989. Winter use of agricultural habitats by wild turkeys in Massachusetts., The Journal of Wildlife Management, 30–33.
Viau, A. E., Ladd, M., Gajewski, K., 2012. The climate of North America during the past 2000 years reconstructed from pollen data. Global and Planetary Change, 84, 75–83.
Weaver, J.E., 1989. On the ecology of wild turkeys reintroduced to southern Ontario. [Unpublished M.A. thesis], The University of Western Ontario.
Webster, C.D., Thompson, K.R., Muzinic, L.A., 2004. Aquatic Animals: Fishes– Major. In: Pond, W.G., Bell, A.W. (Eds), Encyclopedia of animal science. Marcel Dekker, New York, pp. 52–54.
Webster, M., Katzenberg, M.A., 2008. Dietary reconstructions and human Adaptation in west central Chihuahua. Albuquerque. In: Kemrer, M.F. (Ed.), Celebrating Jane Holden Kelley and Her Work. New Mexico Archaeological Council Special Publication No. 5, pp. 71–101.
Weiner, S., Bar–Yosef, O., 1990. States of preservation of bones from prehistoric sites in the Near East: a survey. Journal of Archaeological Science, 17(2), 187–196.
William, J.M., 2008. Tables for weights and measurement: Crops. University of Missouri Extension, website: http://extension.missouri.edu/publications/DisplayPub.aspx?P=G4020.
Wonderley, A., 2005. Effigy pipes, diplomacy, and myth: Exploring interaction between St. Lawrence Iroquoians and Eastern Iroquois in New York State. American Antiquity, 70(2), 211–240.
Woodall, J. Ned (1984) The Donnaha Site: 1973, 1975 Excavations. North Carolinan Archaeological Council Publication No. 22.
175
Wright, J.V., 2004. History of the Native people of Canada: Volume III (A.D. 500 – European Contact). Mercury Series, Archaeological Survey of Canada Paper No. 152, National Museum of Man, Ottawa.
Wright, J.W. 1977. The Walker Site. [Unpublished M.A. thesis]. McMaster University.
Wright, L. E., Schwarcz, H. P., 1996. Infrared and isotopic evidence for diagenesis of bone apatite at Dos Pilas, Guatemala: palaeodietary implications. Journal of Archaeological Science, 23(6), 933–944.
Wright, R.G., Paisley, R.N., Kubisiak, J.F., 1989. Farmland habitat use by wild turkeys in Wisconsin. Proceedings of the Eastern Wildlife Damage Control Conference, 4, 120–126.
Wrong, G. M. (Ed.), 1939. Sagard: The Long Journey to the Country of the Hurons. Toronto: The Champlain Society.
Zeuner, F.E., 1963. A History of Domesticated Animals. Harper & Row, New York.
Zimmermann–Holt, J., 1996. Beyond optimization: Alternative ways of examining animal exploitation, Zooarchaeology: New Approaches and Theory, 28(1), 89–109.
176
Chapter 4
4 White-tailed deer
4.1 Introduction “Perhaps it was the ever present problem of food, clothing and shelter from the earliest
times that prevented the white-tailed deer from sharing much of this reverence and
sanctity. For an animal of such utilitarian value could not carry the cultural impedimenta
that go with totem and taboo, such as are found in the case of the black bear, and still be
of so much value as a source of food, clothing, and shelter.”
Curtis 1944:273
Great Lake Woodland economies and life-ways were dependent on game, particularly
white-tailed deer (Odocoileus virginianus), as food and raw materials for clothing and
tools as well as social cohesion through meat sharing, hunting, and trade. In southwestern
Ontario, neighbouring Western Basin and Ontario Iroquoian cultural groups both hunted
deer extensively, regardless of changing settlement patterns and increasing importance of
cultigens. Corresponding approximately with the onset of the Late Woodland (A.D.
1000), Ontario Iroquoian settlement patterns shifted, reflecting greater sedentism and
exponential population growth relative to the more variable settlement patterns seen at
Western Basin sites. Many Western Basin sites appear to have been used only part of the
year, with people following the movement of seasonally available resources, while
contemporary Ontario Iroquoian sites were occupied year round for 10 and 20 years at a
time. Despite these differences, starting around A.D. 1000, dedicated maize
horticulturalism increased and year-round maize consumption is inferred from stable
isotopic compositions of both Iroquoian and Western Basin humans (Dewar et al. 2012;
Harrison and Katzenberg 2003; Katzenberg et al. 1995; Pfeiffer et al. 2014; Schwarcz et
al. 1985; Spence et al. 2010; van der Merwe et al. 2003; Watts et al. 2011). In this study,
isotopic analysis of enamel serial sections and bulk dentine along with paired bone
collagen and structural carbonate samples are used to provide a more nuanced
understanding of the feeding behaviour of white-tailed deer. These data enable the use of
deer in reconstructing hunting patterns and tests their use as proxies of landscape change
177
(i.e., introduction and expansion of maize fields). Post-mortem cultural practices related
to the processing and/or disposal of deer remains are also inferred. A clearer
understanding of the long term relationship between humans and deer has significance for
archaeological and paleoecological research, as well as modern wildlife management.
Differences in the ability of deer to access maize fields are hypothesized to be related to
time period, region and cultural affiliation. Variation in maize consumption has been
hypothesized in previous studies in the Maya region as a means to identify deer browsing
at field edges or purposeful feeding of deer for ritual sacrifice (Emery et al. 2000; White
et al. 2001, 2004b). Collagen analysis of modern deer from the lower Great Lakes
suggested that δ13C values higher than –21‰ indicated agricultural field browsing, and
δ13C values higher than –12‰ indicated captive, purposefully maize-fed deer (Cormie
and Schwarcz 1994). Using these parameters, analysis of deer bone may provide
evidence of maize consumption by ancient Ontario deer, which may be associated with
field expansion by Ontario peoples and reflect tolerance of field pests and/or hunting
patterns, such as hunting of deer in or near maize fields. Modern studies in the region
indicate deer will preferentially use agricultural fields for food, which reflects the
behaviour of both deer and humans (i.e., major alteration of the landscape including
extensive use of maize and other crops). The absence of maize consumption reported
previously for archaeological Ontario deer (Katzenberg 1989; 2006; Ketchum et al. 2009;
Pfeiffer et al. 2014) can similarly indicate that deer were avoiding maize fields because of
predators (human hunters) and/or that humans were either protecting their maize fields
from deer and other pests or hunting deer in the wild.
In order to explore these possibilities, the bones and teeth of white-tailed deer from 25
sites from southwestern Ontario, spanning 3000 years, were analysed isotopically. The
analysis of radiographs of juvenile deer and enamel serial sections of mandibular
dentition were used to determine the mineralization chronology of permanent, posterior
mandibular dentition. The season of enamel mineralization during the first year of life
was predicted using 150 radiographs and verified using δ18Osc and δ13Csc values of the
structural carbonate preserved in the enamel from ten deer. Bulk bone collagen and
structural carbonate of sixteen modern deer and 81 archaeological deer were used to
178
determine average life time diet (δ13Ccol and δ13Csc) and to explore human geographic
(hunting) range (δ18Osc).
4.2 Background
4.2.1 White-tailed deer ecology and physiology
White-tailed deer are the most ubiquitous and adaptable of the North American cervids
with a range extending from the Canadian Shield to the jungles of Central America
(Dobbyn et al. 1994; Hesselton and Hesselton 1982:878; Miller et al. 2003:906). Their
wide range reflects flexibility in habitat use, social behaviour and food exploitation.
White-tailed deer are ruminants but because they have relatively small rumen they need
higher quality food, a requirement they meet with an “uncanny” ability to maximize
nutritional selections (Hesselton and Hesselton 1982:883; Miller et al. 2003:1912). When
food is plentiful, deer will select plants with the highest nutritional value and only
become generalists when food is scarce. Anecdotal evidence has shown deer will select
fertilized over non-fertilized foods, plant parts with higher nutritional values and foods
with more quickly digestible nutrients (Hesselton and Hesselton 1982; Miller et al. 2003).
White-tailed deer consume a wide range of mast, forbs and browse, including fruits,
berries, nuts, mushrooms, leaves, twigs, and digestible grasses. Their nutritional and
habitat requirements shift seasonally with behavioural changes (Table 4.1), particularly in
northeastern North America, where seasons are more extreme and they are more affected
by temperature and daylight changes (Hesselton and Hesselton 1982:884). Despite the
variations in diet and food resource locations, deer are not considered a migrating
species. In fact, their non-migratory nature led Cormie and Schwarcz (1994) to label
them as ideal candidates for isotopic baseline studies.

179
Table 4.1: Summary of Ontario White-tailed deer annual life cycle, feeding, and activity patterns.
Also shown; the archaeological Ontario maize annual cultivation and harvesting patterns (top row) and estimated sequence of
tooth mineralization (bottom row).
180
During the spring all deer increase food intake after winter has depleted fat and muscle
reserves. Spring is the only time period that deer routinely graze. Male deer begin to form
antlers in late spring and for females, April and May are the last trimester of their
pregnancies and when 90% of fetal growth takes place, making spring forage very
important. In Ontario, fawns are usually born at the end of May or in early June (Smith
and Verkruysse 1983). During the first few weeks of life, does and fawns stay hidden and
isolated, usually within woodlots. By six weeks, fawns are weaned and accompanying
mothers in the search for food. The growth rate of fawns is affected by sex, population
density and soil fertility, with females maturing more quickly than males (Miller et al.
2003). To permanently stunt growth it takes extreme nutritional deficiencies (i.e., less
than 5% protein), as deer are able to recycle up to 90% of urea in cases of low dietary
protein (Robbins et al. 1974). Urea recycling might result in low δ15Ncol tissue values
(Ambrose 2002).
During the summer, deer consume carbohydrates for energy, eating leaves and seedlings
of a wide range of wild trees, shrubs, and in some areas, crops. Fall is a critical time
period for fattening so that the deer will be able to endure the mating season (especially
males entering rut) as well as harsh winters in the northeast (Smith and Verkruysse
1983). A shift in daylight hours signals a hormonal change commencing rut and mating,
and is followed by an exponential increase in fawn growth (Miller et al. 2003). The fall
hormonal change also signals a peak in the intake of high energy foods to compensate for
these activities; for example high energy hard masts, particularly maize, may constitute
up to 70% of the fall diet. Ripening fruits are also an important dietary component at this
time (Smith and Verkruysse 1983). Mushrooms, a major protein source, are also
preferentially consumed during the fall, comprising up to 15% of the diet (Miller et al.
2003:913). During the winter, deer survive primarily on their fat reserves but also
consume available browse, including twigs, branches, needles, and bark and they dig
through the snow to get to underlying grasses (Armstrong et al. 1983; Smith and
Verkruysse 1983). Deer adapt their metabolism to extreme temperatures, and through
much of the winter, their metabolism drops significantly (Holter et al. 1976; Mautz et al.
181
1992; Silver et al. 1969). In order to minimize energy expenditure during this time
period, less nutritional food may be consumed if it is closer at hand.
As a prey species, deer are highly adapted to predator avoidance. For example, does with
young fawns will sacrifice nutrition for isolation. Rue (2004) also noted that bucks are
more likely to exploit deeper, wood lot environments and that once fawns are able to
travel, doe-fawn families will venture closer to open areas more frequently than bucks.
Does may have higher δ13C values because they consume more maize crops, and bucks
may have lower δ13C values because of a canopy affect created by forested environments
(Loken et al.1992). Deer cannot live exclusively in deep forests, however, because of a
lack of browse, and all deer need a variable landscape provided by use of forest edges,
open spaces and wood lots. Deer are important prey species for wolves, often dictating
wolf ranges and densities. In many regions, however, coyotes have largely replaced gray
wolves as the major non-human predator of deer. Cougars, bobcats, domestic dogs, and
black bears may also prey on deer, especially fawns and elderly or injured deer (Ballard
2011; Starna and Relethford 1985; Wolverton 2008). Further, white-tailed deer are not
only vulnerable to predators but also severe winter starvation as well as parasites and
diseases because they will not disperse with increasing population size (and associated
resource depletion) and actually aggregate in the winter when food is most scarce
(Armstrong et al. 1983). While white-tailed deer can live up to 15 years, however, mean
life expectancy for wild deer is typically 5.5 years for females and 3.5 years for males
(Hesselton and Hesselton 1982:916; Miller et al. 2003:917; Smith and Verkruysse 1983).
4.2.2 Modern white-tailed deer and humans
White-tailed deer are regarded as one of the most important modern game animals in
North America, particularly the Midwest (Arnold and Torgersen 1980; Hesselton and
Hesselton 1982; Knoche and Lupi 2012; Smith and Verkruysse 1983). Millions of deer
are hunted annually in the United States alone (Craven and Hygnstrom 1994), the
revenue for which is estimated to be hundreds of millions of dollars (Hesselton and
Hesselton 1982; Knoche and Lupi 2011). As wild deer populations continue to rise in
many areas, some researchers have suggested a need for increased hunting in order to
bring deer densities below carrying capacity, and protect forest ecosystems and more

182
sensitive species in competition with them (McShea 2012; VerCauteren et al 2011).
Understanding deer habitat use throughout the year is essential for making management
policy as well as survey and harvest regulations, important foci for state and provincial
wildlife agencies (Creed and Haberland 1980:83 Roseberry 1980). Stable isotopes offer
one means of tracking animal movement and seasonal patterns related to food access.
The tolerance of deer for human altered landscapes has produced three major problems.
First, as crop pests, white-tailed deer have economic and social implications. Hesselton
and Hesselton (1982:883) noted that since 1900 deer have readily adapted to agricultural
landscapes in regions such as the “corn belt” of the American Midwest, where they eat
maize, alfalfa and soybeans. Although deer preferentially select a mosaic landscape of
woodlots and open fields, a shift to significant crop consumption is reported to have
occurred after heavy logging and landscape changes necessitated adaption by the deer in
those regions. White-tailed deer cause more crop damage today than any other wildlife
species in the US (see also Brittingham et al. 1997; Conover and Decker 1991; Craven
and Hygnstrom 1994; Hewitt 2011; Tzilkowski et al. 2002), with staggering implications.
For example, they can destroy up to 2/3 of a maize harvest (Harlen 1972, cited in
Hesselton and Hesselton 1982:885) and some US states report crop damage in excess of
$30 million (Craven and Hygnstrom 1994: 39). Crop dependence also results in higher
reproduction and heavier deer, which further compounds the problem. In Ontario, both
raccoons and deer are mainly responsible for damage to maize crops, with raccoons
responsible for the majority of damage.
Vehicle collisions are a second major problem related to shared space between white-
tailed deer and humans, causing millions of dollars in damages in the US and Canada
each year (Heselton and Heselton 1982), and up to 3% mortality of deer populations in
some regions (Munro et al. 2012). However, improved access to food and reduced
numbers of predators in modern agricultural landscapes appear to outweigh the risk of
collisions resulting in net population growth of deer in these shared landscapes (Munro et
al. 2012). Lastly, deer can play a role in the transmission of disease to livestock. High
population density and congregation in food habitats appear to be linked to bovine
tuberculosis (Mycobacterium bovis) Kjær et al. 2008).
183
4.2.3 Ancient white-tailed deer and humans
Late Holocene changes in hunting strategies are recognized by a shift from broad
spectrum hunting to a focus on white-tailed deer in many areas of North and Central
America (example Wolverton et al. 2008), which reflects the fact that deer became one of
the most important species hunted for food, clothing and tools, as well as social cohesion
and ritual across much of North and Central America. White-tailed deer remains (bone,
teeth and/or antler) are common in North and Central American archaeological sites
(Mesoamerica: Flannery 1966, Santley and Rose 1979, Emery et al. 2000, White et al.
2001, Rosenwig 2006, ; Hamblin 1984; Southeast United States: Bolstad and Gragson
2008; Midwestern United States: Zimmermann–Holt 1996, Hedman et al. 2009, Nelson
1999; Eastern Woodland: Curtis 1952, Foreman 2011, Gramly 1977, Katzenberg 1989,
2006; Prevec and Noble 1983; Stewart 2000; Turner and Santley 1979, Warrick 2000,
Madigral and Zimmerman Holt 2002).
As one of the largest and most common mammals in the faunal record, deer were clearly
an important protein source for many pre-contact peoples, but ethnohistoric,
archaeological and zooarchaeological evidence suggest that white-tailed deer were also
prized for their hide, antlers, bone and sinews during the Woodland period in Ontario,
(Gramly 1977; Katzenberg 1989; Ketchum et al. 2009; Prevec and Noble 1983; Stewart
2000; Turner et al. 1979). With growing human populations, there was probably
competition over deer hunting territories, which was likely linked to social and economic
change (Theler and Boszhardt 2006) as well as hunting territory expansion, primarily into
the uninhabited lands (Turner and Santley 1979; Webster 1979). Deer were fundamental
to the economies of both Western Basin and Ontario Iroquoian traditions between A.D.
1000 to 1600, dominating most faunal assemblages (Foreman 2011:74; Prevec and Noble
1983; Wrong 1939:225).
The ubiquity of white-tailed deer in faunal assemblages and their essential role for Late
Woodland survival does not preclude them from playing a significant cosmological role
in Great Lakes mythology and iconography. According to Menomini (Algonkin) myths,
both the bear and deer ruled the underworld. However, Curtis (1952) speculated that the
utility (and necessity) of deer for meat and skin would always out-weigh its ritual or
184
social value, and meant that they could not achieve the reverence, and therefore sanctity,
of the black bear. It is similarly postulated that the economic importance of deer in the
American Bottom (southwestern Illinois around the Mississippian floodplain) relegated
them to a separate economic and non-ritual category in the “native taxonomy” of that
area (Zimmerman-Holt 1996). This kind of ideology could explain the representation of
Ontario Iroquoian and Western Basin deer as a food resource, rather than an
anthropomorphized character in clan names, pipe effigies, and pottery (Matthews 1980),
as well as in myth and legends, but it does not preclude their role in taboos and feasts.
There are numerous references to specific taboos related to the disposal of deer. For
example, Sagard states that;
“[t]hey [the Neutral] have the same superstition in hunting deer, moose and other
animals, believing that if any of the fat drops into the fire, or any bones are thrown into
it, they will be unable to get any more,” (Wrong 1939:187), and from the Jesuit
Relations; “they consider it a sin to throw the bones to the dogs; they either burn them in
the fire or bury them in the ground. For, they say, if the bears, beaver, and other wild
animals which we capture in hunting should know that their bones were given to dogs
and broken to pieces, they would not suffer themselves to be taken so easily” (Thwaites
1896–1901:1:283, from the Jesuit Relations).
The taboos indicate specific depositional requirements for certain hunted species,
including deer. Deer are also mentioned as key components of feasts, including the
sharing of flesh and boiling of deer heads (Wrong 1939:111). Fenton (1953:106–107)
summarizes the evolution of Great Lakes’ traditional ceremonies:
"Feasts on an animal head echo an earlier ceremonial cannibalism. The Huron,
Mohawk, and Oneida tribes held feasts where the head, frequently the head of an enemy
captive after torture, went into the kettle and then as a choice morsel went first to the
chiefs. In the war feast the head, often a dog's head cooked in the soup, was presented to
the captain who carried it in his hands inciting others to enlist. By the middle of the
eighteenth century, the accounts refer to whole hogs being boiled in the maize soup and
warriors successively danced with the hog's head in their hands. Thus, pork replaced the
185
dog as the war feast food, and later it supplanted the bear and venison in all feasts, until
today the pig's head is the ceremonial head, the pièce de résistance.”
4.2.4 Stable isotopes
Isotopes are variants of an element that differ in their number of neutrons and, therefore,
in atomic weight. The differences in atomic weight cause isotopes to behave differently
in chemical and physical reactions, resulting in variations in the ratios of one isotope to
another. For example, as water evaporates, the lighter isotope of oxygen, 16O, is
preferentially evaporated over the heavier isotope, 18O, resulting in the evaporated
moisture being isotopically lighter relative to the source water. Organisms will
incorporate the environmental isotopes into their tissues through the foods they ingest, air
they breathe and water they drink. The isotopic compositions of animal tissues will,
therefore, reflect their environment and are expressed as δ–values of the heavy to light
isotope in per mil (‰), using the formula:
δ = (Rsample/Rstandard) / Rstandard
where R = 13C/12C, 15N/14N or 18O/16O (McKinney et al. 1950:730; Coplen 2011) .
Carbon isotopic compositions are standardized to Vienna PeeDee Belemnite Limestone
(VPDB) (Coplen 1996; 2011). Nitrogen isotopic compositions are standardized to AIR
(Mariotti 1983). Oxygen isotopic compositions are standardized to Vienna Standard
Mean Ocean Water (VSMOW) (Coplen 1996; 2011). An expanded description of stable
carbon, nitrogen, and oxygen isotope analysis is proved in Chapter 1, Section 1.3.
4.2.4.1 Previous isotopic studies of deer
The δ13Ccol and δ15Ncol values of bone collagen from 33 archaeological white-tailed deer
from five southwestern Ontario sites tightly cluster around –22.1±0.9‰ and 6.4±0.8‰,
and are interpreted as consistent with terrestrial herbivores consuming non-leguminous
plants in a C3 only environment (Katzenberg 1989; 2006). Almost identical means
(δ13Ccol = –22.4±1.0‰ and δ15Ncol = 5.9±0.9‰) were reported for dentine collagen of 45
more archaeological southwestern Ontario white-tailed deer (Pfieffer et al. 2014:341). A
commonly considered upper end point for a C3 only diet is –21.4‰ (van der Merwe
1982; Cormie and Schwarcz 1994; Katzenberg 1989; 2006). Deer with δ13Ccol values

186
lower than this could also have been feeding in more deeply wooded areas i.e., a canopy
effect (Bonafini et al. 2013; Drucker and Bocherens 2009). Most studies of deer show
δ13Ccol ranges from –22.5 to –19.5‰ (Bergh 2012 for southeast US; Loken et al. 1992 for
Nebraska; Emery et al. 2000, White et al. 2001, 2004b for Mesoamerica), which are
generally interpreted as reflecting C3 dominant diets, with the exception of some deer
who had consumed small amounts of maize probably obtained by browsing at the edge of
agricultural fields. Cormie and Schwarcz (1994) suggested a range of –21 to –16‰ to
reflect C3 dominant diets with some degree of maize consumption (uncorrected for the
Suess Effect for modern wild deer with access to maize), which mirrors the –21.5‰ cut
off suggested by van der Merwe 1982 for a C3 only diet. Taking the Suess effect into
consideration, a more conservative upper end value of –20.5‰ will be used to indicate a
C3 only diet in this study. It will be assumed that deer with δ13Ccol values between –20
and –18‰ have consumed some C4 resources, and those with higher values have
consumed significant amounts.
Cormie and Schwarcz (1994) analysed the effect of climatic variables, such as aridity, on
the δ15Ncol values of modern white-tailed deer bone collagen across North America,
including southwestern Ontario and Michigan. They noted that the δ15Ncol values from
the Great Lakes region were relatively low, which they attribute to any combination of
high precipitation, consumption of legumes, consumption of fertilized agricultural
produce or plants growing in soil affected by agricultural inputs from fertilization and/or
nitrogen fixing by agricultural legumes. The published archaeological deer data from the
Great Lakes region have higher δ15Ncol values compared with the modern deer,
suggesting that extensive agriculture inputs, not differences in precipitation, may be the
primary cause for the low δ15Ncol values of the modern deer.
There are a few published white-tailed deer structural carbonate oxygen and carbon
isotopic results, though overall, such data for structural carbonate are not as frequently
reported as for collagen (but see Booth et al. [2011] for bone collagen-carbonate pairs
from Late Woodland Ontario deer, Loken et al. [1992] for collagen-carbonate bone pairs
from archaeology sites in Dakota, and Repussard [2009] for bone structural carbonate of
Maya deer [Table 4.2, summarized Figure 4.1]).
187
Luz et al. (1990) mapped variations in the δ18O values from the phosphate (δ18Ophosphate)
of deer bone across North America, including portions of the Great Lakes, finding
minimal variation between animals from the same region, which is interpreted as
δ18Ophosphate values reflecting local environments. Precipitation across the Great Lakes
region is only minimally affected by latitude or altitude. There is, however, longitudinal
variation in δ18O values across southwestern Ontario with a 2‰ decrease in δ18O values
moving east from Lake St. Clair to the western tip of Lake Ontario (IAEA/WMO 2013;
Longstaffe unpublished data, Figure 1.2).
4.2.5 Post-mortem alteration
After death, the tissues of the body begin to change. Post-mortem alteration of bones and
teeth can be due to any combination of factors including the natural breakdown of body
tissues, environmental and human induced taphonomic changes and diagenetic alteration
of chemical structures (Berner 1980:3; DeNiro 1985; Koch et al. 1997; Sandford 1993;
Sillen 1989). The protein, collagen, in bones and the dentine of teeth is quite resilient
(Collins et al. 2002; Lee-Thorp and van der Merwe 1987), but can be altered by either
microbial attack or hydrolysis (Hedges 2002). In anaerobic, water-logged conditions or
dry environments (e.g., caves) microbial attack is less likely to occur but is rapid in hot,
humid conditions (Hedges 2002; Nielsen-Marsh and Hedges 2000; Stuart-Williams et al.
1996). Collagen loss can also cause the remaining tissue to be contaminated with non-
collagenous substances, usually lipids or soil humic acids, resulting in low δ13C values
and high carbon to nitrogen ratios (Ambrose and Norr 1992). Collagen content and the
ratio of carbon to nitrogen are used to determine whether bone and dentine collagen have
been altered. Collagen loss is believed to occur relatively early after death and may result
in increased porosity, which reduces histological integrity (Nielsen-Marsh and Hedges
2000) and can contribute to the alteration of the inorganic portion of the bone (Hedges
2002). Von Endt et al. (1984) also demonstrated that within a site, depth of burial and
size of bones will contribute to post-mortem alteration, with bones buried closer to the
surface exhibiting great alteration.
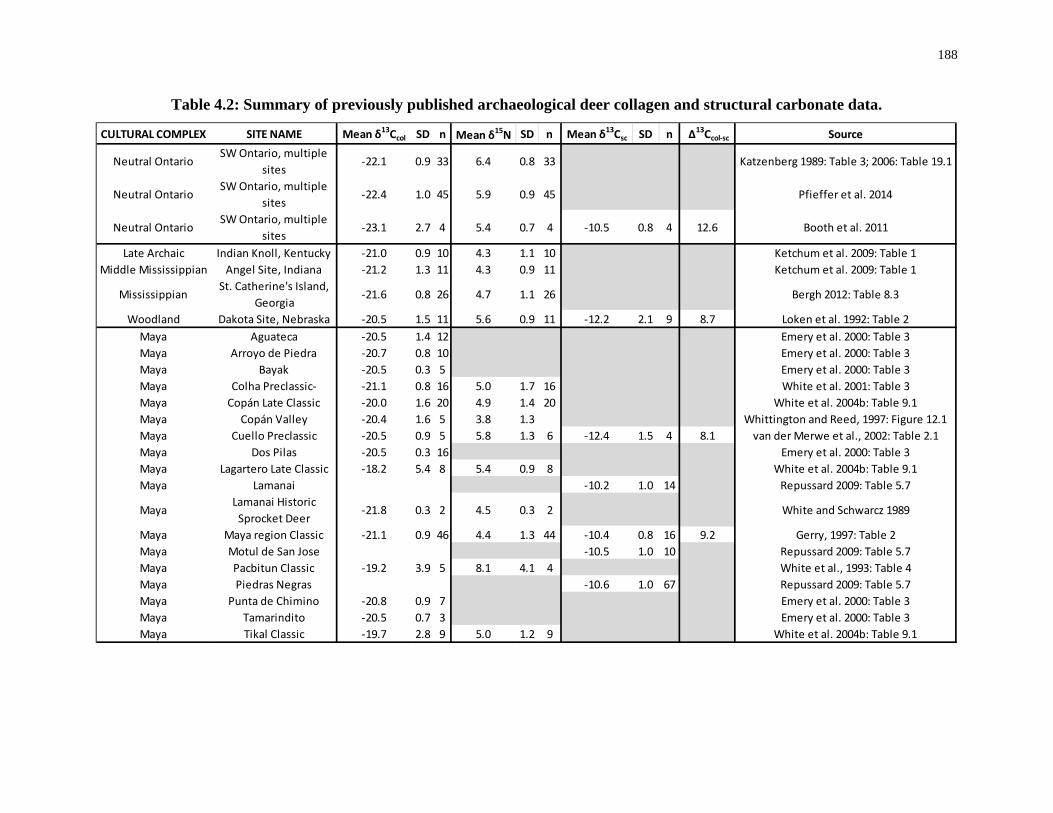
188
Table 4.2: Summary of previously published archaeological deer collagen and structural carbonate data.
CULTURAL COMPLEX SITE NAME Mean δ13Ccol SD n Mean δ15N SD n Mean δ13Csc SD n Δ13Ccol-sc Source
Neutral OntarioSW Ontario, multiple
sites-22.1 0.9 33 6.4 0.8 33 Katzenberg 1989: Table 3; 2006: Table 19.1
Neutral OntarioSW Ontario, multiple
sites-22.4 1.0 45 5.9 0.9 45 Pfieffer et al. 2014
Neutral OntarioSW Ontario, multiple
sites-23.1 2.7 4 5.4 0.7 4 -10.5 0.8 4 12.6 Booth et al. 2011
Late Archaic Indian Knoll, Kentucky -21.0 0.9 10 4.3 1.1 10 Ketchum et al. 2009: Table 1Middle Mississippian Angel Site, Indiana -21.2 1.3 11 4.3 0.9 11 Ketchum et al. 2009: Table 1
MississippianSt. Catherine's Island,
Georgia-21.6 0.8 26 4.7 1.1 26 Bergh 2012: Table 8.3
Woodland Dakota Site, Nebraska -20.5 1.5 11 5.6 0.9 11 -12.2 2.1 9 8.7 Loken et al. 1992: Table 2Maya Aguateca -20.5 1.4 12 Emery et al. 2000: Table 3Maya Arroyo de Piedra -20.7 0.8 10 Emery et al. 2000: Table 3Maya Bayak -20.5 0.3 5 Emery et al. 2000: Table 3Maya Colha Preclassic- -21.1 0.8 16 5.0 1.7 16 White et al. 2001: Table 3Maya Copán Late Classic -20.0 1.6 20 4.9 1.4 20 White et al. 2004b: Table 9.1Maya Copán Valley -20.4 1.6 5 3.8 1.3 Whittington and Reed, 1997: Figure 12.1Maya Cuello Preclassic -20.5 0.9 5 5.8 1.3 6 -12.4 1.5 4 8.1 van der Merwe et al., 2002: Table 2.1 Maya Dos Pilas -20.5 0.3 16 Emery et al. 2000: Table 3Maya Lagartero Late Classic -18.2 5.4 8 5.4 0.9 8 White et al. 2004b: Table 9.1Maya Lamanai -10.2 1.0 14 Repussard 2009: Table 5.7
MayaLamanai Historic
Sprocket Deer-21.8 0.3 2 4.5 0.3 2 White and Schwarcz 1989
Maya Maya region Classic -21.1 0.9 46 4.4 1.3 44 -10.4 0.8 16 9.2 Gerry, 1997: Table 2Maya Motul de San Jose -10.5 1.0 10 Repussard 2009: Table 5.7Maya Pacbitun Classic -19.2 3.9 5 8.1 4.1 4 White et al., 1993: Table 4Maya Piedras Negras -10.6 1.0 67 Repussard 2009: Table 5.7Maya Punta de Chimino -20.8 0.9 7 Emery et al. 2000: Table 3Maya Tamarindito -20.5 0.7 3 Emery et al. 2000: Table 3Maya Tikal Classic -19.7 2.8 9 5.0 1.2 9 White et al. 2004b: Table 9.1
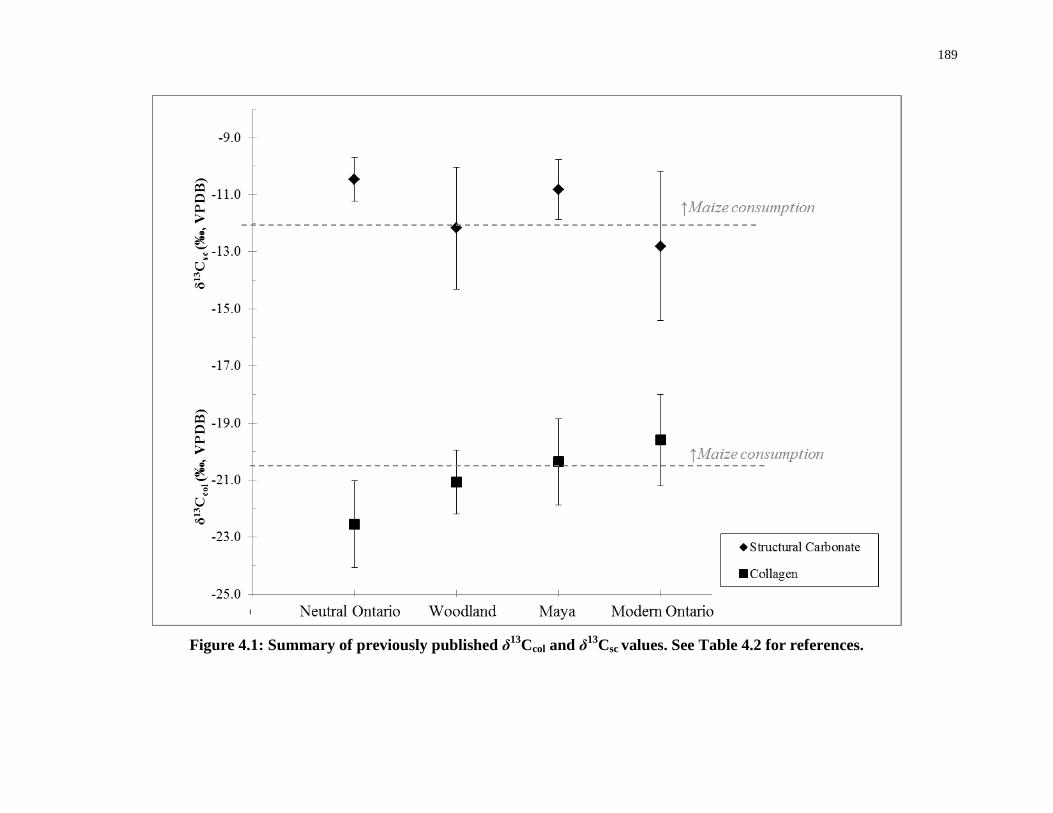
189
Figure 4.1: Summary of previously published δ13Ccol and δ13Csc values. See Table 4.2 for references.
190
The crystalline structure of the hydroxyapatite may be altered post-mortem by the uptake
of F– and CO3– from ground and soil water, the alteration of hydroxyapatite to brushite,
and/or the dissolution and re-precipitation of hydroxyapatite under post-burial conditions
(Hedges and Millard 1995; Hedges 2002; Wright and Schwarcz 1996). Some researchers
have argued that the structural carbonate of bone (and in some cases dentine) may be
unacceptably susceptible to contamination by environmental carbonates and, therefore,
should not be considered a reliable tool for reconstructing past diets (Ketchum et al.
2009; Kolodny et al. 1983; Shemesh et al 1983; Schoeninger and DeNiro 1982). Other
archaeologists have argued that the information available in structural carbonate is
valuable (Harrison and Katzenberg 2003; Koch et al. 1997; Lee-Thorp and van der
Merwe 1987; Wright and Schwarcz 1996). As with collagen, there are methods for
determining the presence of alteration, either by the uptake of secondary carbonates or by
re-crystallization. Fourier transform infra-red (FTIR) analysis is used to identify re-
crystallization using the crystallinity index (CI), as well as the presence of peaks from
secondary calcite or brushite (Nielsen-Marsh and Hedges 2000). Wright and Schwarcz
(1996:934) and White (2004) stress that because structural carbonate is prone to
alteration it is essential that each specimen be evaluated for alteration, after which the
appropriate cleaning treatments (i.e., acetic acid wash) should be implemented. The high
crystallinity and low porosity of tooth enamel makes it less susceptible to diagenesis than
bone. Thus in cases where bone may be altered, enamel can provide a viable alternative
sample source (Koch et al. 1997; Lee-Thorp and van der Merwe 1987; LeGeros 1981;
Yang and Cerling 1994).
The effects of human-induced bone changes (i.e. cooking or defleshing) on post-mortem
alteration continues to be studied (Nielsen-Marsh and Hedges 2000; Pijoan et al. 2007;
Roberts et al. 2002). Under laboratory conditions (i.e., boiling in distilled water), DeNiro
et al. (1985) and Munro et al. (2007; 2008) found that boiling had no effect on either
bone collagen or bone carbonate isotopic values. Sustained boiling, however, may mimic
diagenesis through re-crystallization (Roberts et al. 2002), and/or make buried bones
more susceptible to exchange with soil carbonates due to increased porosity (Pijoan et al.
2007). Extended boiling (beyond nine hours) should be recognizable in bone, as it should
191
reduce collagen yields (<2%), produce poor C:N ratios (>3.6) and result in high CIs
(>4.5) (Roberts et al. 2002). Heating of bone for shorter periods cannot be identified with
post-mortem alteration tests for either collagen (collagen concentration and C:N ratio) or
structural carbonate (CI index) unless the heat is over 350⁰ (Munro et al. 2007).
4.2.6 Bone and dental tissue formation
Bioarchaeologists are limited to those tissues that preserve post-mortem, and usually
work with hard tissues such as bone and dentition. Bone is a dynamic tissue, and both the
organic (collagen) and inorganic (structural carbonate) portions of bone continuously
remodel throughout life. Estimating the rate of bone turnover has been a long-standing
research question, but estimates suggest that humans have bone turnover rates of 15 to 25
years (Frost 1969; Hedges et al, 2007; Martin et al. 1998). While basal metabolic rate,
habitat and diet can have a direct effect on tissue turnover, it is generally accepted that
larger bodied animals have slower tissue turnover (Nagy 1987). As such, bulk collagen
and structural carbonate of large-bodied mammals, including white-tailed deer, is
generally believed to reflect a life time average, with higher contributions from the sub-
adult growth stage (Hedges et al. 2007).
Dental tissues (Figure 4.2), such as enamel and dentine, typically reflect the time period
of tissue formation. Enamel formation, amelogenesis, is initiated quite early in embryonic
development for most mammals but may continue for several months or years after birth.
Enamel formation of the crown is always completed prior to eruption of the tooth and
takes place in two phases: the initial secretion of proteins and organic matrix by
amelobasts, followed by the mineralization phase whereby ameoblasts transport proteins
needed to complete mineralization (Davis and Mead 2013; Garant 2003; Passey and
Cerling 2002). The crown mineralizes sequentially from the coronal (crown) surface
towards the cervical region (cemento-enamel junction) of the tooth. The dual
secretion/mineralization process of enamel mineralization may result in some averaging
of the isotopic signatures at the time of formation (Passey and Cerling 2002), but with
appropriate sampling can provide incremental isotopic information. The sequential
isotopic analysis of enamel (phosphate and structural carbonate) has been successfully
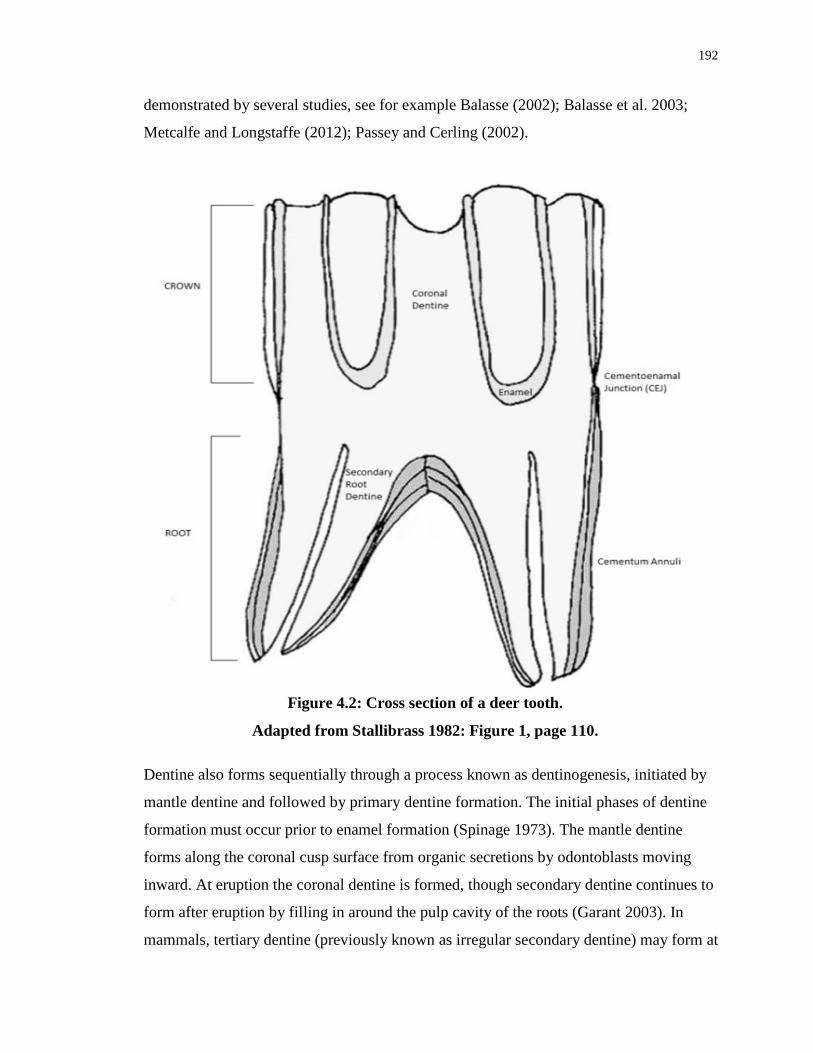
192
demonstrated by several studies, see for example Balasse (2002); Balasse et al. 2003;
Metcalfe and Longstaffe (2012); Passey and Cerling (2002).
Dentine also forms sequentially through a process known as dentinogenesis, initiated by
mantle dentine and followed by primary dentine formation. The initial phases of dentine
formation must occur prior to enamel formation (Spinage 1973). The mantle dentine
forms along the coronal cusp surface from organic secretions by odontoblasts moving
inward. At eruption the coronal dentine is formed, though secondary dentine continues to
form after eruption by filling in around the pulp cavity of the roots (Garant 2003). In
mammals, tertiary dentine (previously known as irregular secondary dentine) may form at
Figure 4.2: Cross section of a deer tooth.
Adapted from Stallibrass 1982: Figure 1, page 110.
193
any stage of life on the coronal surface due to extreme wear or injury of the primary
dentine (Spinage 1973).
While dental eruption studies have existed since the 1950s for white-tailed deer, there are
no studies on their dental mineralization. In order to accurately determine the time period
(i.e., month or season) of tooth formation as a means to link isotopic data with deer life
stages, it is essential to determine the mineralization sequence for white-tailed deer teeth,
specifically deer from northeast region as there is geographic variability in the
development stages of deer across North America (Hesselton and Hesselton 1982).
Because there are currently no published dental mineralization studies of white-tailed
deer, two types of radiography are used here to provide this necessary information.
The use of dental eruption for determining age-at-death of Old World wild and domestic
ungulates was first proposed in 1824 by Girard (McLean 1936; Spinage 1973). In
general, determining age of juvenile white-tailed deer (and other ungulates, such as goat
and elk) based on dental eruption and replacement is considered an accurate technique
(Dirks et al. 2009; Gee et al. 1991; Gee et al. 2002; Hamlin et al. 2000; Hesselton and
Hesselton 1982:881; Rees et al. 1966; Servinghaus 1949; Taber 1971), and is used by
both wildlife management authorities (Deniz and Payne 1982; Miller et al. 2003; Ryel et
al. 1961) and zooarchaeologists (see for example, Kay 1974 and Payne 1973). After two
years of age, wear patterns, crown height (Gilbert and Stolt 1970; Hamlin et al. 2000;
Klein et al. 1981; Ryel 1961; Taber 1971) and cementum annuli counts (Gilbert 1966;
Hamlin et al. 2000; Lockard 1972; Low and Conwan 1963) have been used to determine
age of mature white-tailed deer and other cervids. Unfortunately, these methods produce
inconsistent results, regardless of species.
4.3 Materials and methods This study included several methodologies, including (1) determining ages of modern,
juvenile white-tailed deer based on dental eruption, (2) radiographic analysis of the same
deer to determine the dental formation sequence, (3) the identification and selection of
archaeological deer fragments from several Ontario archaeological sites, (4) the isotopic
analysis of bone collagen and structural carbonate of modern and archaeological deer,
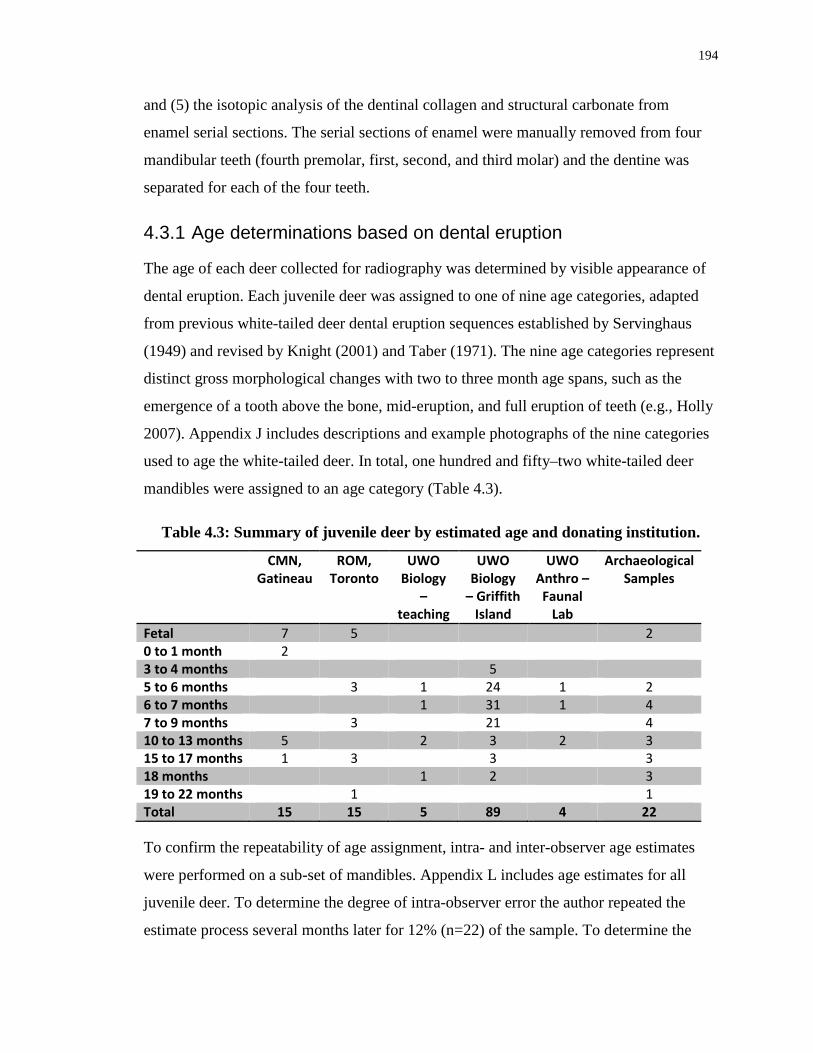
194
and (5) the isotopic analysis of the dentinal collagen and structural carbonate from
enamel serial sections. The serial sections of enamel were manually removed from four
mandibular teeth (fourth premolar, first, second, and third molar) and the dentine was
separated for each of the four teeth.
4.3.1 Age determinations based on dental eruption
The age of each deer collected for radiography was determined by visible appearance of
dental eruption. Each juvenile deer was assigned to one of nine age categories, adapted
from previous white-tailed deer dental eruption sequences established by Servinghaus
(1949) and revised by Knight (2001) and Taber (1971). The nine age categories represent
distinct gross morphological changes with two to three month age spans, such as the
emergence of a tooth above the bone, mid-eruption, and full eruption of teeth (e.g., Holly
2007). Appendix J includes descriptions and example photographs of the nine categories
used to age the white-tailed deer. In total, one hundred and fifty–two white-tailed deer
mandibles were assigned to an age category (Table 4.3).
Table 4.3: Summary of juvenile deer by estimated age and donating institution.
CMN, Gatineau
ROM, Toronto
UWO Biology
– teaching
UWO Biology
– Griffith Island
UWO Anthro – Faunal
Lab
Archaeological Samples
Fetal 7 5 2 0 to 1 month 2 3 to 4 months 5 5 to 6 months 3 1 24 1 2 6 to 7 months 1 31 1 4 7 to 9 months 3 21 4 10 to 13 months 5 2 3 2 3 15 to 17 months 1 3 3 3 18 months 1 2 3 19 to 22 months 1 1 Total 15 15 5 89 4 22
To confirm the repeatability of age assignment, intra- and inter-observer age estimates
were performed on a sub-set of mandibles. Appendix L includes age estimates for all
juvenile deer. To determine the degree of intra-observer error the author repeated the
estimate process several months later for 12% (n=22) of the sample. To determine the
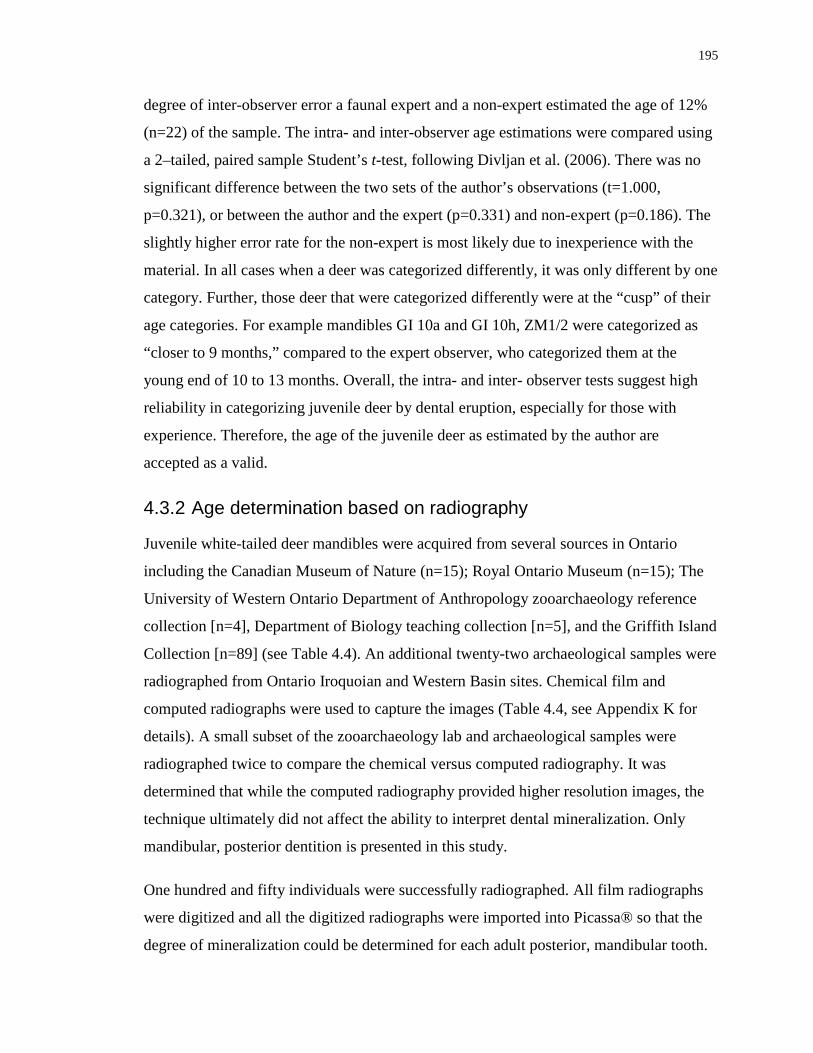
195
degree of inter-observer error a faunal expert and a non-expert estimated the age of 12%
(n=22) of the sample. The intra- and inter-observer age estimations were compared using
a 2–tailed, paired sample Student’s t-test, following Divljan et al. (2006). There was no
significant difference between the two sets of the author’s observations (t=1.000,
p=0.321), or between the author and the expert (p=0.331) and non-expert (p=0.186). The
slightly higher error rate for the non-expert is most likely due to inexperience with the
material. In all cases when a deer was categorized differently, it was only different by one
category. Further, those deer that were categorized differently were at the “cusp” of their
age categories. For example mandibles GI 10a and GI 10h, ZM1/2 were categorized as
“closer to 9 months,” compared to the expert observer, who categorized them at the
young end of 10 to 13 months. Overall, the intra- and inter- observer tests suggest high
reliability in categorizing juvenile deer by dental eruption, especially for those with
experience. Therefore, the age of the juvenile deer as estimated by the author are
accepted as a valid.
4.3.2 Age determination based on radiography
Juvenile white-tailed deer mandibles were acquired from several sources in Ontario
including the Canadian Museum of Nature (n=15); Royal Ontario Museum (n=15); The
University of Western Ontario Department of Anthropology zooarchaeology reference
collection [n=4], Department of Biology teaching collection [n=5], and the Griffith Island
Collection [n=89] (see Table 4.4). An additional twenty-two archaeological samples were
radiographed from Ontario Iroquoian and Western Basin sites. Chemical film and
computed radiographs were used to capture the images (Table 4.4, see Appendix K for
details). A small subset of the zooarchaeology lab and archaeological samples were
radiographed twice to compare the chemical versus computed radiography. It was
determined that while the computed radiography provided higher resolution images, the
technique ultimately did not affect the ability to interpret dental mineralization. Only
mandibular, posterior dentition is presented in this study.
One hundred and fifty individuals were successfully radiographed. All film radiographs
were digitized and all the digitized radiographs were imported into Picassa® so that the
degree of mineralization could be determined for each adult posterior, mandibular tooth.
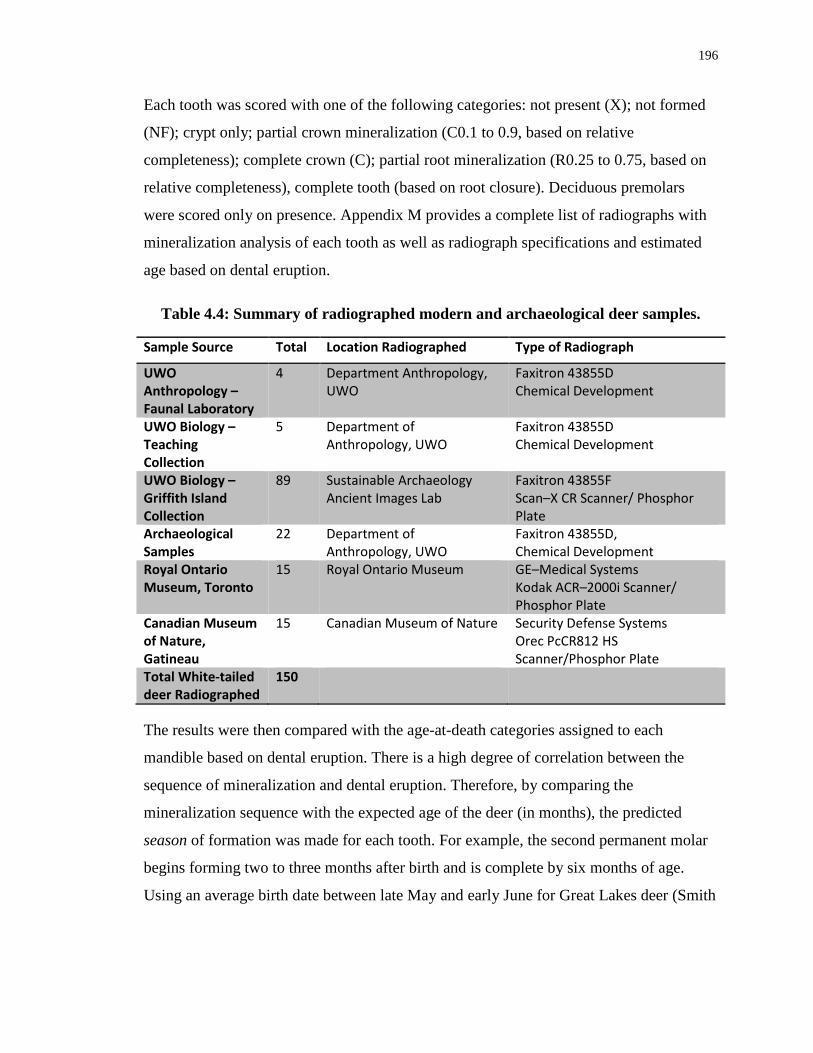
196
Each tooth was scored with one of the following categories: not present (X); not formed
(NF); crypt only; partial crown mineralization (C0.1 to 0.9, based on relative
completeness); complete crown (C); partial root mineralization (R0.25 to 0.75, based on
relative completeness), complete tooth (based on root closure). Deciduous premolars
were scored only on presence. Appendix M provides a complete list of radiographs with
mineralization analysis of each tooth as well as radiograph specifications and estimated
age based on dental eruption.
Table 4.4: Summary of radiographed modern and archaeological deer samples.
The results were then compared with the age-at-death categories assigned to each
mandible based on dental eruption. There is a high degree of correlation between the
sequence of mineralization and dental eruption. Therefore, by comparing the
mineralization sequence with the expected age of the deer (in months), the predicted
season of formation was made for each tooth. For example, the second permanent molar
begins forming two to three months after birth and is complete by six months of age.
Using an average birth date between late May and early June for Great Lakes deer (Smith
Sample Source Total Location Radiographed Type of Radiograph
UWO Anthropology – Faunal Laboratory
4 Department Anthropology, UWO
Faxitron 43855D Chemical Development
UWO Biology – Teaching Collection
5 Department of Anthropology, UWO
Faxitron 43855D Chemical Development
UWO Biology – Griffith Island Collection
89 Sustainable Archaeology Ancient Images Lab
Faxitron 43855F Scan–X CR Scanner/ Phosphor Plate
Archaeological Samples
22 Department of Anthropology, UWO
Faxitron 43855D, Chemical Development
Royal Ontario Museum, Toronto
15 Royal Ontario Museum GE–Medical Systems Kodak ACR–2000i Scanner/ Phosphor Plate
Canadian Museum of Nature, Gatineau
15 Canadian Museum of Nature Security Defense Systems Orec PcCR812 HS Scanner/Phosphor Plate
Total White-tailed deer Radiographed
150
197
and Verkuysse 1983), the second molar is predicted to mineralize sequentially between
August and November.
4.3.3 Sampling for isotopic analysis
Archaeological white-tailed deer were sampled from previously excavated faunal
collections housed at various institutes from across southwestern Ontario representing
deer spanning 3000 years (Table 4.5), including the Department of Anthropology,
McMaster University; Department of Anthropology, The University of Western Ontario;
Ontario Museum of Archaeology; and D.R. Poulton and Associates Inc. Site descriptions
may be found in Appendix A. Modern samples were donated by several individuals,
including Monica and Greg Maika, Ted Barney, Richard Baskey, Mike Boyd, and Jim
Keron, from several Ontario locations as hunted or road kill deer. Figure 4.3 includes the
locations of archaeological sites in Ontario discussed in the text as well as approximate
locations from which the modern deer came.
Table 4.5: Number of white-tailed deer remains analysed by cultural stage. Pre–A.D. 200 Total 8 Deer
Archaic ~8000–800 B.C. 3 Early Woodland ~900 – 0 B.C. 4
Middle Woodland 300 B.C. to A.D. 500 1
Ontario Iroquoian Total 51 Deer Princess Point Phase A.D. 700–1000 8 Early Ontario Iroquoian Period A.D. 900–1300 7 Middle Ontario Iroquoian Period A.D. 1300–1450 7 Late Iroquoian/Neutral A.D 1450–1650 29
Ontario Western Basin Total 21 Deer Riviere au Vase Phase A.D. 600–900 2 Younge Phase A.D 800–1200 17 Springwells Phase A.D 1200–1400 2 Wolf Phase A.D. 1400–1550 0
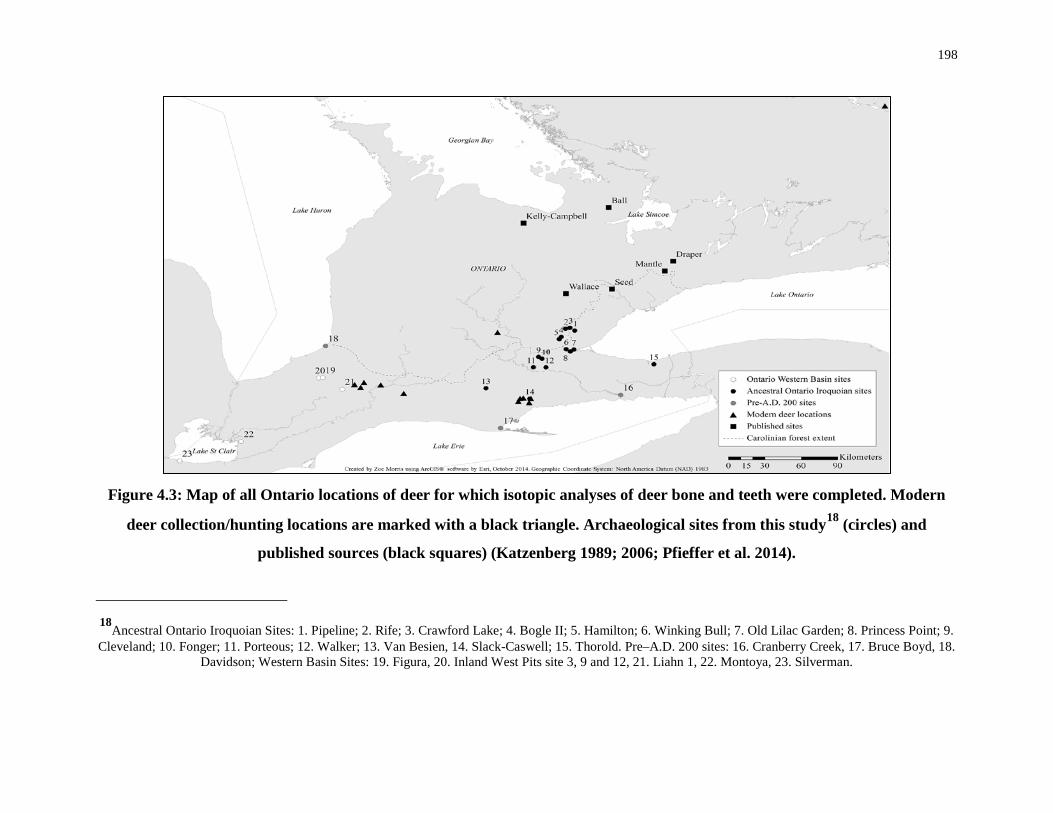
198
Figure 4.3: Map of all Ontario locations of deer for which isotopic analyses of deer bone and teeth were completed. Modern
deer collection/hunting locations are marked with a black triangle. Archaeological sites from this study18 (circles) and
published sources (black squares) (Katzenberg 1989; 2006; Pfieffer et al. 2014).
18Ancestral Ontario Iroquoian Sites: 1. Pipeline; 2. Rife; 3. Crawford Lake; 4. Bogle II; 5. Hamilton; 6. Winking Bull; 7. Old Lilac Garden; 8. Princess Point; 9. Cleveland; 10. Fonger; 11. Porteous; 12. Walker; 13. Van Besien, 14. Slack-Caswell; 15. Thorold. Pre–A.D. 200 sites: 16. Cranberry Creek, 17. Bruce Boyd, 18.
Davidson; Western Basin Sites: 19. Figura, 20. Inland West Pits site 3, 9 and 12, 21. Liahn 1, 22. Montoya, 23. Silverman.
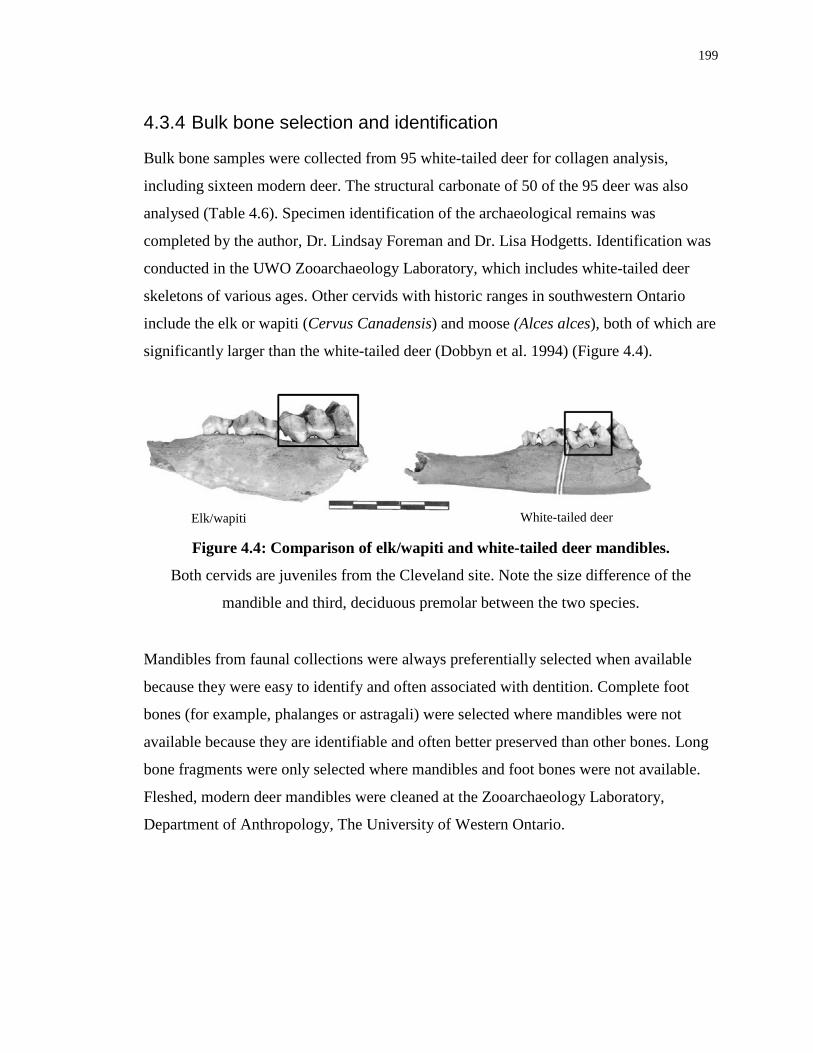
199
4.3.4 Bulk bone selection and identification
Bulk bone samples were collected from 95 white-tailed deer for collagen analysis,
including sixteen modern deer. The structural carbonate of 50 of the 95 deer was also
analysed (Table 4.6). Specimen identification of the archaeological remains was
completed by the author, Dr. Lindsay Foreman and Dr. Lisa Hodgetts. Identification was
conducted in the UWO Zooarchaeology Laboratory, which includes white-tailed deer
skeletons of various ages. Other cervids with historic ranges in southwestern Ontario
include the elk or wapiti (Cervus Canadensis) and moose (Alces alces), both of which are
significantly larger than the white-tailed deer (Dobbyn et al. 1994) (Figure 4.4).
Mandibles from faunal collections were always preferentially selected when available
because they were easy to identify and often associated with dentition. Complete foot
bones (for example, phalanges or astragali) were selected where mandibles were not
available because they are identifiable and often better preserved than other bones. Long
bone fragments were only selected where mandibles and foot bones were not available.
Fleshed, modern deer mandibles were cleaned at the Zooarchaeology Laboratory,
Department of Anthropology, The University of Western Ontario.
Elk/wapiti White-tailed deer
Figure 4.4: Comparison of elk/wapiti and white-tailed deer mandibles.
Both cervids are juveniles from the Cleveland site. Note the size difference of the
mandible and third, deciduous premolar between the two species.
200
Table 4.6: Summary of collagen and carbonate samples by cultural affiliation.
Pre–horticulture pre A.D. 200 (sites, n=3)
Ontario Iroquoian A.D.
900–1600 (sites, n=15)
Western Basin A.D.
900–1600 (sites, n=7)
Modern White-tailed
deer (locations,
n=5)
Total Deer
Analysed
collagen 8 52 21 16 95 carbonate 6 22 10 14 50
4.3.5 Enamel serial section sampling
Dentitions from ten white-tailed deer mandibles were serially sampled (hunted modern
deer, n=2; Early Woodland, n=1; Late Woodland, n=7). All teeth were from adults and
fully erupted, with the exception of an eighteen-month-old modern deer (Mod–deer-7)
from which a bulk sample of a deciduous premolar was collected. Due to limited
availability of complete mandibles among the Western Basin samples, Montoya 8 did not
have a third molar.
Serial sampling was completed using a Dremel 545 Diamond Wheel mounted on a
Dremel rotary tool. The wheel was cleaned by sonicating in distilled water between cuts
to prevent contamination between serial sections. The three to five serial samples were
taken along the lingual aspect of the four posterior teeth: premolar 4 (PM4, also referred
to as premolar 3 in some texts), molar 1 (M1), molar 2 (M2) and molar 3 (M3), for a total
of 116 sections. Only half the tooth (lingual surface) was sampled to allow future, micro-
sampling of the enamel (Figure 4.6). Enamel and dentine were manually separated for
each serial section. The enamel was pretreated for structural carbonate analysis (for
protocol see Chapter 2, Section 2.2.3.2.2) and collagen was extracted from 38 bulk
dentine samples (for protocol see Chapter 2, Section 2.2.3.2.1).
Pieces of bone weighing between ~0.2–0.4g were collected for each sample. Trabecular
bone was then manually removed using dental tools, and the remaining cortical bone was
cleaned with distilled water and dried overnight. Once dry, the cortical bone was crushed
with a porcelain mortar and pestle, passed through a set of sieves and powder was
collected at several intervals.
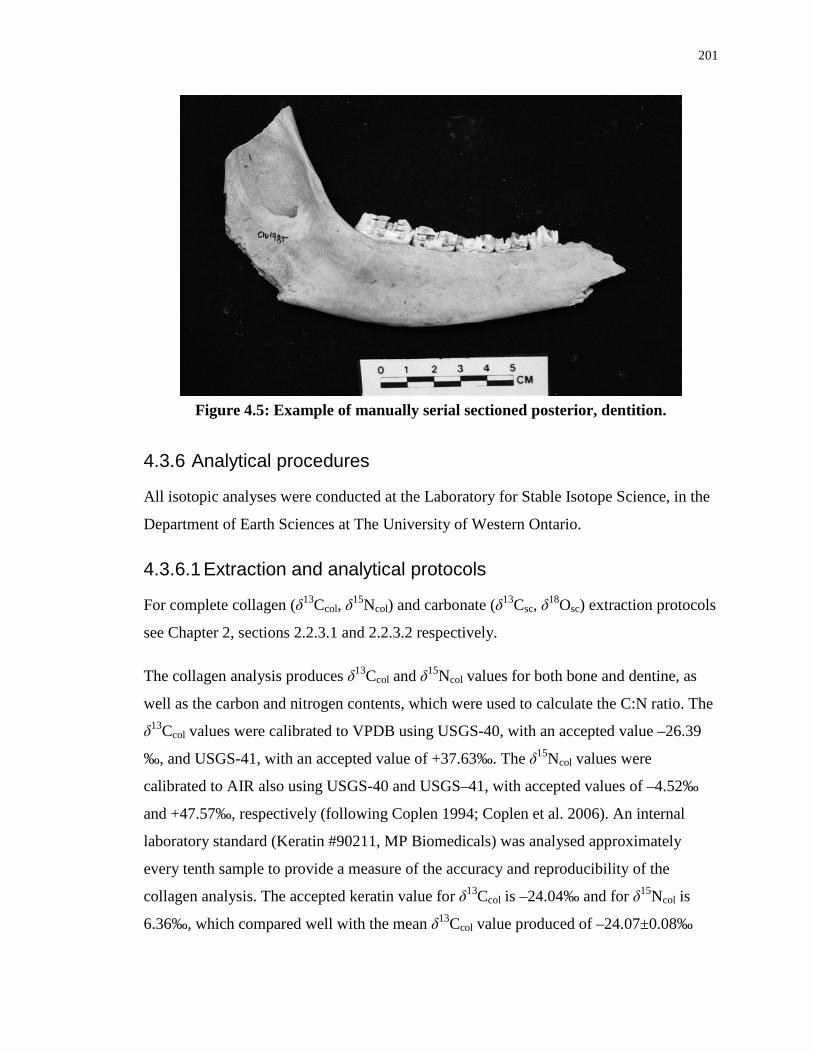
201
4.3.6 Analytical procedures
All isotopic analyses were conducted at the Laboratory for Stable Isotope Science, in the
Department of Earth Sciences at The University of Western Ontario.
4.3.6.1 Extraction and analytical protocols
For complete collagen (δ13Ccol, δ15Ncol) and carbonate (δ13Csc, δ18Osc) extraction protocols
see Chapter 2, sections 2.2.3.1 and 2.2.3.2 respectively.
The collagen analysis produces δ13Ccol and δ15Ncol values for both bone and dentine, as
well as the carbon and nitrogen contents, which were used to calculate the C:N ratio. The
δ13Ccol values were calibrated to VPDB using USGS-40, with an accepted value –26.39
‰, and USGS-41, with an accepted value of +37.63‰. The δ15Ncol values were
calibrated to AIR also using USGS-40 and USGS–41, with accepted values of –4.52‰
and +47.57‰, respectively (following Coplen 1994; Coplen et al. 2006). An internal
laboratory standard (Keratin #90211, MP Biomedicals) was analysed approximately
every tenth sample to provide a measure of the accuracy and reproducibility of the
collagen analysis. The accepted keratin value for δ13Ccol is –24.04‰ and for δ15Ncol is
6.36‰, which compared well with the mean δ13Ccol value produced of –24.07±0.08‰
Figure 4.5: Example of manually serial sectioned posterior, dentition.
202
(n=107) and a δ15Ncol value of 6.29 ± 0.17‰ (n=106). Method duplicate pairs ((i.e., a
different extraction and analysis of collagen on the same sample) were performed on 25%
of samples with a mean reproducibility for δ13Ccol of ±0.03‰ and for δ15Ncol of ±0.08‰.
The analytical precision of duplicate (i.e., replicate analyses of the same collagen
extraction) analyses was ±0.03‰ for δ13Ccol and ±0.05‰ for δ15Ncol.
The analysis of the bone structural carbonate provided δ13Csc and δ18O values, for which
δ13Csc values were calibrated to VPDB, following Coplen (1994), using NBS-19, with an
accepted value of +1.95 ‰ and Suprapur, with an accepted value of –35.28 ‰. The δ18O
values were calibrated to VSMOW, following Coplen (1994), using NBS-19 and NBS-
18, with accepted values of +28.60 ‰ and +7.20 ‰, respectively. An internal laboratory
calcite standard, World-Standard 1 (WS-1) was analysed approximately every fifteenth
sample in order to assess the accuracy of the carbonate isotopic data, which produced a
mean δ13Csc value of 0.79 ± 0.22‰ (n=32) and mean δ18Osc value of 26.26 ± 0.19‰
(n=32), comparing favourably with the accepted WS-1 values of 0.76‰ and 26.23‰,
respectively. Method duplicates and duplicates were performed for ~10% of the deer
samples. Method duplicates had a mean reproducibility for δ13Csc values of ±0.12‰, and
for δ18Osc values, ±0.15‰. Duplicate precision for δ13Csc values was ±0.08‰ and for
δ18Osc values, ±0.09‰.
4.3.7 Fourier transform infra–red spectroscopy (FTIR)
Prior to pre-treatment, Fourier transform infra–red (FTIR) spectroscopy was conducted
for the 50 white-tailed deer bone samples Due to the small sample size of enamel serial
sections, it was not possible to perform FTIR analysis of all serial sections. For complete
description of the Fourier transform infra–red spectroscopy (FTIR) procedures, see
Chapter 2, Section 2.2.3.3.
4.4 Results
4.4.1 Dental mineralization
The results of the dental mineralization study show a clear, staggered formation pattern
for the mandibular molar crowns, which corresponds with previously published data for
203
other deer species (Reese et al. 1966). By correlating the radiographic mineralization data
with the age-at-death data it was possible to determine that the first permanent
mandibular molar (M1) begins to form in utero and crown mineralization has finished by
two months after birth. The second, permanent mandibular molar (M2) begins forming
after the M1 is finished, approximately two months after birth, and the crown is
completely mineralized between five and six months. The third permanent mandibular
molar (M3) begins to form at approximately five to six months, and the crown is
completely mineralized between nine and ten months after birth. The three permanent
mandibular premolars (PM2 through PM4) start forming at approximately nine months
and the crowns are completely mineralized by fifteen months (Table 4.7, 4.8).
4.4.2 Sample integrity
The mean CI for the archaeological white-tailed deer bone was 2.87±0.28 (range=2.20–
3.91) (Table 4.9), and for the enamel samples it was 3.30±0.26. The mean C/P for the
archaeological deer was 0.42±0.13 (range = 0.24–0.69), which is within the generally
accepted range (0.3 to 0.6) for well preserved samples (King et al. 2011; Nielsen–Marsh
and Hedges 2000; Pucéat et al. 2004; Thompson et al. 2009). All modern deer samples
had C/P ratios above 0.6 with a mean C/P ratio of 0.72±0.15. It is believed that the
untreated modern deer bones contained a high percentage of organic components
(probably lipids) that interfered with the FTIR analysis. The mean C/P ratio of the
modern deer bone after carbonate pre-treatment was 3.6±0.10, within the expected range
(Table 4.9).
The FTIR profile of each sample was also examined for unexpected peaks, such as
francolite at 1096 cm–1and calcite at 711 cm–1 (Nielsen–Marsh and Hedges 2000). Two
archaeological samples (Por–9 and Pip[1]–157) were rejected for carbonate analysis
based on the presence of calcite peaks both before and after pre-treatment, and their high
C/P ratios (0.71 and 0.98, respectively). All other modern and archaeological deer
samples were accepted for carbonate analysis based on their combined CI, C/P ratios and
peak profiles.
204
The minimum collagen yield for results to be considered reliable is 1% (Van
Klinken1999; Ambrose 1993). All archaeological samples had yields greater than 1% and
the mean was 9.1±6.1% (range=1.8–22.6%). The mean yield for modern deer was
19.6±4.8%, which is similar to the predicted percent collagen by weight of 22% for
modern bone (Van Klinken 1999). The average C:N ratio for all samples was 3.28±0.11,
well within the expected range of 2.9 to 3.6 (DeNiro 1985; DeNiro et al. 1985). Only one
sample, Win 157, had a C:N ratio higher than 3.6 and, therefore, its collagen isotopic
compositions were not used in this study. Based on the percent collagen yield and C:N
ratio, all other collagen samples analysed were accepted (Table 4.9).
Varying expected percentages of bioapatite in bone have been reported, ranging from 70 -
75% (Ambrose 1993; Sillen 1989) up to 90% (Lee–Thorp 1989). The percentage of
bioapatie by weight was measured for each sample after pre-treatment, and averaged
70.8±12.2% for modern deer and 72.9±8.4% (range=54.7–84.1%) for archaeological
deer.
The percentage of CO3 released as CO2 from bone bioapatite for pretreated samples
should range from 2.0 to 7.9%, enamel having slightly lower and narrower values with a
range of 4.5 to 4.1% ( (Lee–Thorp 1989; Lee–Thorp and Sponheimer 2003; Rink and
Schwarcz 1995; Wright and Schwarcz 1996). The mean percentage of CO3 in the modern
bone was within the expected range at 5.2±1.4%, as was archaeological bone at 6.2±1.3%
(range = 3.5 to 8.7%). There was no difference between modern and archaeological
enamel samples for this measure, which together had a mean of 4.6±1.1% (range=2.4–
7.1%). Samples with CO3 abundances higher than 8% (n=3) were regarded with caution,
as this could indicate secondary carbonate that was not removed by the acetic acid pre–
treatment. However, other parameters for those bone samples, (CI, C/P, FTIR peak
profile) did not indicate the presence of secondary carbonates, and hence no samples
were rejected.
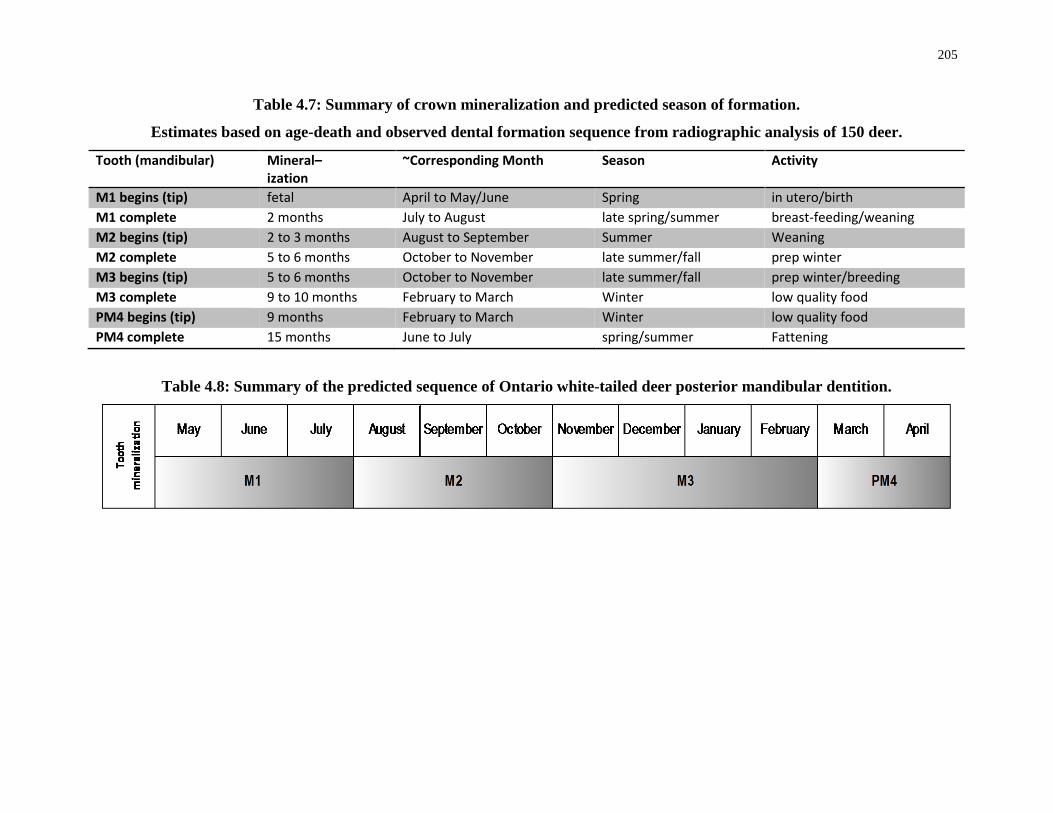
205
Table 4.7: Summary of crown mineralization and predicted season of formation.
Estimates based on age-death and observed dental formation sequence from radiographic analysis of 150 deer.
Tooth (mandibular) Mineral– ization
~Corresponding Month Season Activity
M1 begins (tip) fetal April to May/June Spring in utero/birth M1 complete 2 months July to August late spring/summer breast-feeding/weaning M2 begins (tip) 2 to 3 months August to September Summer Weaning M2 complete 5 to 6 months October to November late summer/fall prep winter M3 begins (tip) 5 to 6 months October to November late summer/fall prep winter/breeding M3 complete 9 to 10 months February to March Winter low quality food PM4 begins (tip) 9 months February to March Winter low quality food PM4 complete 15 months June to July spring/summer Fattening
Table 4.8: Summary of the predicted sequence of Ontario white-tailed deer posterior mandibular dentition.
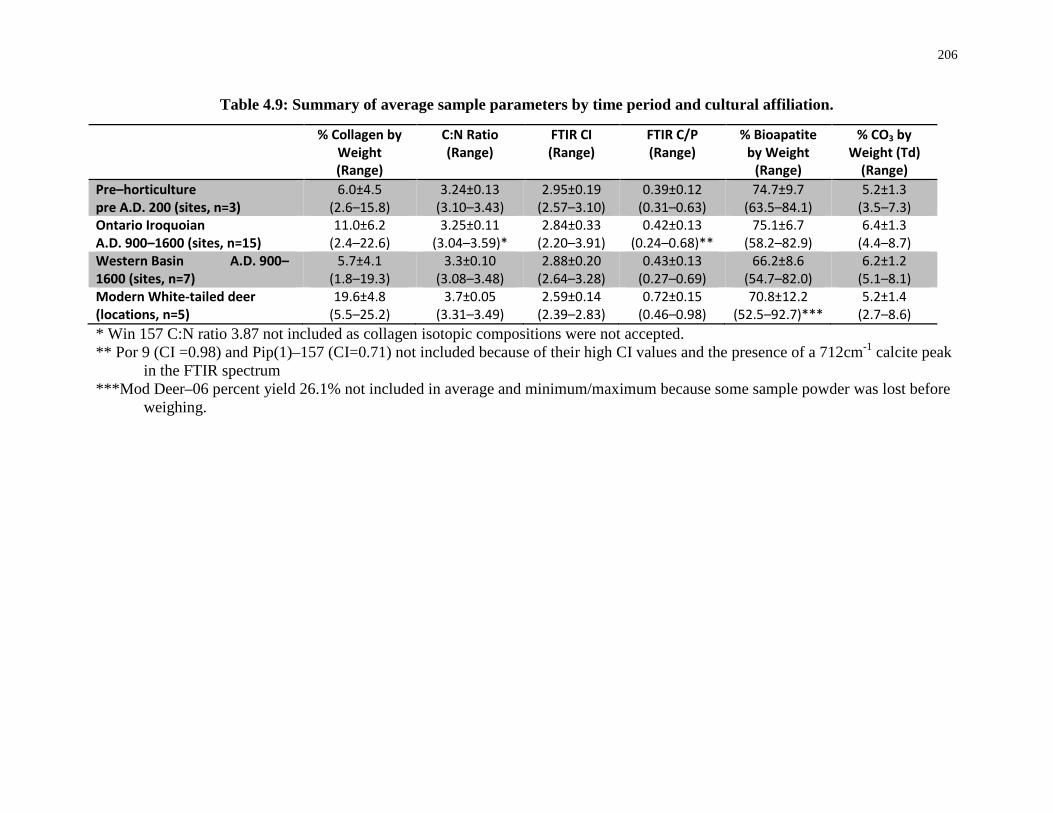
206
Table 4.9: Summary of average sample parameters by time period and cultural affiliation.
* Win 157 C:N ratio 3.87 not included as collagen isotopic compositions were not accepted. ** Por 9 (CI =0.98) and Pip(1)–157 (CI=0.71) not included because of their high CI values and the presence of a 712cm-1 calcite peak
in the FTIR spectrum ***Mod Deer–06 percent yield 26.1% not included in average and minimum/maximum because some sample powder was lost before
weighing.
% Collagen by Weight (Range)
C:N Ratio (Range)
FTIR CI (Range)
FTIR C/P (Range)
% Bioapatite by Weight
(Range)
% CO3 by Weight (Td)
(Range) Pre–horticulture pre A.D. 200 (sites, n=3)
6.0±4.5 (2.6–15.8)
3.24±0.13 (3.10–3.43)
2.95±0.19 (2.57–3.10)
0.39±0.12 (0.31–0.63)
74.7±9.7 (63.5–84.1)
5.2±1.3 (3.5–7.3)
Ontario Iroquoian A.D. 900–1600 (sites, n=15)
11.0±6.2 (2.4–22.6)
3.25±0.11 (3.04–3.59)*
2.84±0.33 (2.20–3.91)
0.42±0.13 (0.24–0.68)**
75.1±6.7 (58.2–82.9)
6.4±1.3 (4.4–8.7)
Western Basin A.D. 900–1600 (sites, n=7)
5.7±4.1 (1.8–19.3)
3.3±0.10 (3.08–3.48)
2.88±0.20 (2.64–3.28)
0.43±0.13 (0.27–0.69)
66.2±8.6 (54.7–82.0)
6.2±1.2 (5.1–8.1)
Modern White-tailed deer (locations, n=5)
19.6±4.8 (5.5–25.2)
3.7±0.05 (3.31–3.49)
2.59±0.14 (2.39–2.83)
0.72±0.15 (0.46–0.98)
70.8±12.2 (52.5–92.7)***
5.2±1.4 (2.7–8.6)
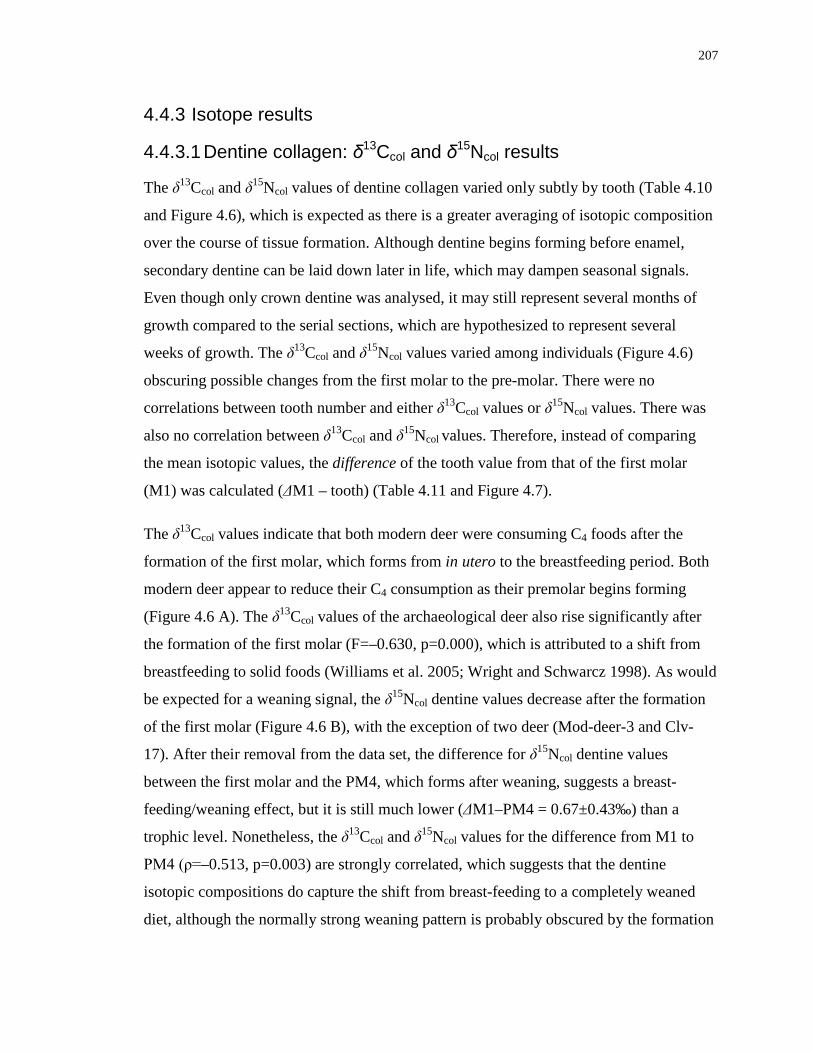
207
4.4.3 Isotope results
4.4.3.1 Dentine collagen: δ13Ccol and δ15Ncol results
The δ13Ccol and δ15Ncol values of dentine collagen varied only subtly by tooth (Table 4.10
and Figure 4.6), which is expected as there is a greater averaging of isotopic composition
over the course of tissue formation. Although dentine begins forming before enamel,
secondary dentine can be laid down later in life, which may dampen seasonal signals.
Even though only crown dentine was analysed, it may still represent several months of
growth compared to the serial sections, which are hypothesized to represent several
weeks of growth. The δ13Ccol and δ15Ncol values varied among individuals (Figure 4.6)
obscuring possible changes from the first molar to the pre-molar. There were no
correlations between tooth number and either δ13Ccol values or δ15Ncol values. There was
also no correlation between δ13Ccol and δ15Ncol values. Therefore, instead of comparing
the mean isotopic values, the difference of the tooth value from that of the first molar
(M1) was calculated (ΔM1 – tooth) (Table 4.11 and Figure 4.7).
The δ13Ccol values indicate that both modern deer were consuming C4 foods after the
formation of the first molar, which forms from in utero to the breastfeeding period. Both
modern deer appear to reduce their C4 consumption as their premolar begins forming
(Figure 4.6 A). The δ13Ccol values of the archaeological deer also rise significantly after
the formation of the first molar (F=–0.630, p=0.000), which is attributed to a shift from
breastfeeding to solid foods (Williams et al. 2005; Wright and Schwarcz 1998). As would
be expected for a weaning signal, the δ15Ncol dentine values decrease after the formation
of the first molar (Figure 4.6 B), with the exception of two deer (Mod-deer-3 and Clv-
17). After their removal from the data set, the difference for δ15Ncol dentine values
between the first molar and the PM4, which forms after weaning, suggests a breast-
feeding/weaning effect, but it is still much lower (ΔM1–PM4 = 0.67±0.43‰) than a
trophic level. Nonetheless, the δ13Ccol and δ15Ncol values for the difference from M1 to
PM4 (ρ=–0.513, p=0.003) are strongly correlated, which suggests that the dentine
isotopic compositions do capture the shift from breast-feeding to a completely weaned
diet, although the normally strong weaning pattern is probably obscured by the formation
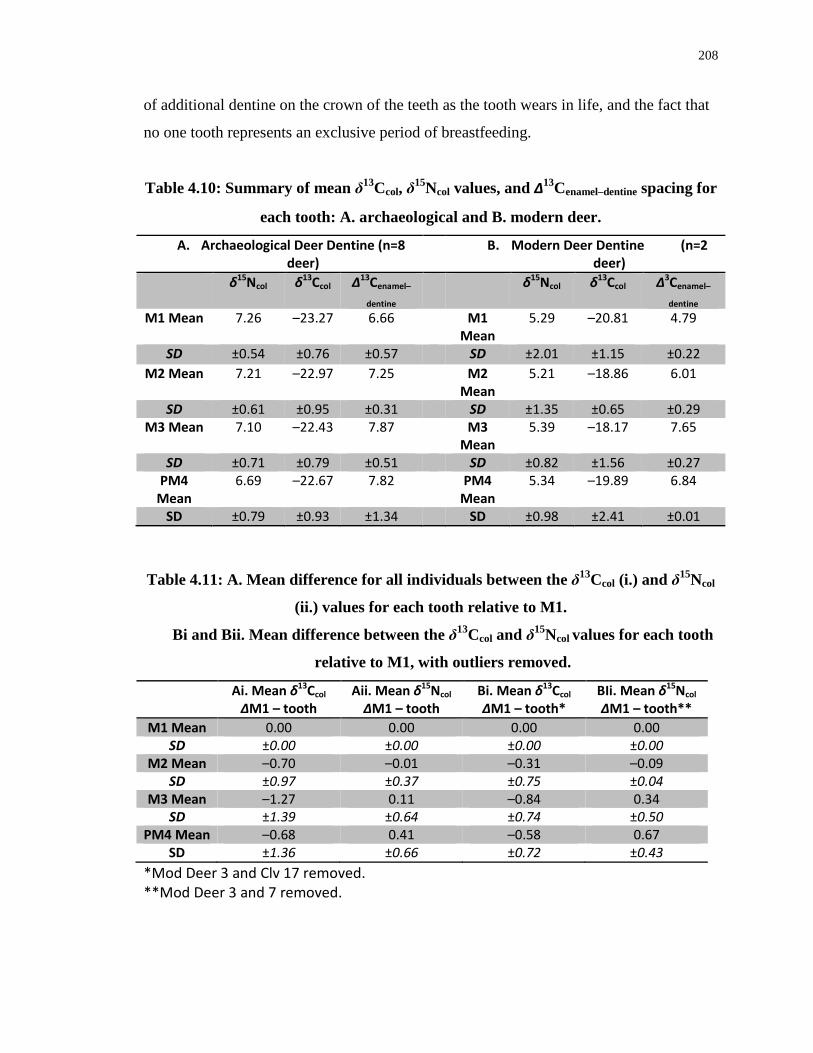
208
of additional dentine on the crown of the teeth as the tooth wears in life, and the fact that
no one tooth represents an exclusive period of breastfeeding.
Table 4.10: Summary of mean δ13Ccol, δ15Ncol values, and ∆13Cenamel–dentine spacing for
each tooth: A. archaeological and B. modern deer.
A. Archaeological Deer Dentine (n=8 deer)
B. Modern Deer Dentine (n=2 deer)
δ15Ncol δ13Ccol ∆13Cenamel–
dentine δ15Ncol δ13Ccol ∆3Cenamel–
dentine M1 Mean 7.26 –23.27 6.66 M1
Mean 5.29 –20.81 4.79
SD ±0.54 ±0.76 ±0.57 SD ±2.01 ±1.15 ±0.22 M2 Mean 7.21 –22.97 7.25 M2
Mean 5.21 –18.86 6.01
SD ±0.61 ±0.95 ±0.31 SD ±1.35 ±0.65 ±0.29 M3 Mean 7.10 –22.43 7.87 M3
Mean 5.39 –18.17 7.65
SD ±0.71 ±0.79 ±0.51 SD ±0.82 ±1.56 ±0.27 PM4
Mean 6.69 –22.67 7.82 PM4
Mean 5.34 –19.89 6.84
SD ±0.79 ±0.93 ±1.34 SD ±0.98 ±2.41 ±0.01
Table 4.11: A. Mean difference for all individuals between the δ13Ccol (i.) and δ15Ncol
(ii.) values for each tooth relative to M1.
Bi and Bii. Mean difference between the δ13Ccol and δ15Ncol values for each tooth
relative to M1, with outliers removed.
*Mod Deer 3 and Clv 17 removed. **Mod Deer 3 and 7 removed.
Ai. Mean δ13Ccol ΔM1 – tooth
Aii. Mean δ15Ncol ΔM1 – tooth
Bi. Mean δ13Ccol ΔM1 – tooth*
BIi. Mean δ15Ncol ΔM1 – tooth**
M1 Mean 0.00 0.00 0.00 0.00 SD ±0.00 ±0.00 ±0.00 ±0.00
M2 Mean –0.70 –0.01 –0.31 –0.09 SD ±0.97 ±0.37 ±0.75 ±0.04
M3 Mean –1.27 0.11 –0.84 0.34 SD ±1.39 ±0.64 ±0.74 ±0.50
PM4 Mean –0.68 0.41 –0.58 0.67 SD ±1.36 ±0.66 ±0.72 ±0.43

209
Figure 4.6: Individual δ13Ccol (A.) and δ15Ncol (B.) dentine values by tooth.
Bone isotopic results for each deer are also shown at left in gray box.
210
Figure 4.7: Mean difference in δ13Ccol (A.) and δ15Ncol (B.) values relative to M1 for individual bone (gray box) and dentine
samples (graphed by tooth).
-5.0
-4.0
-3.0
-2.0
-1.0
0.0
1.0
2.0
3.0δ1
3 Cco
l of M
1 - δ
13C c
ol to
oth/
bone
Bone M1(baseline) M2 M3 PM4
δ13Ccol value is higher than M1
δ13Ccol value is lower than M1
A.
-2.0
-1.5
-1.0
-0.5
0.0
0.5
1.0
1.5
2.0
2.5
3.0
δ15 N
col o
f M1
- δ15
Nco
l too
th/b
one
δ15Ncol value is higher than M1
δ15Ncol value is lower than M1
B.
Bone M1(baseline) M2 M3 PM4
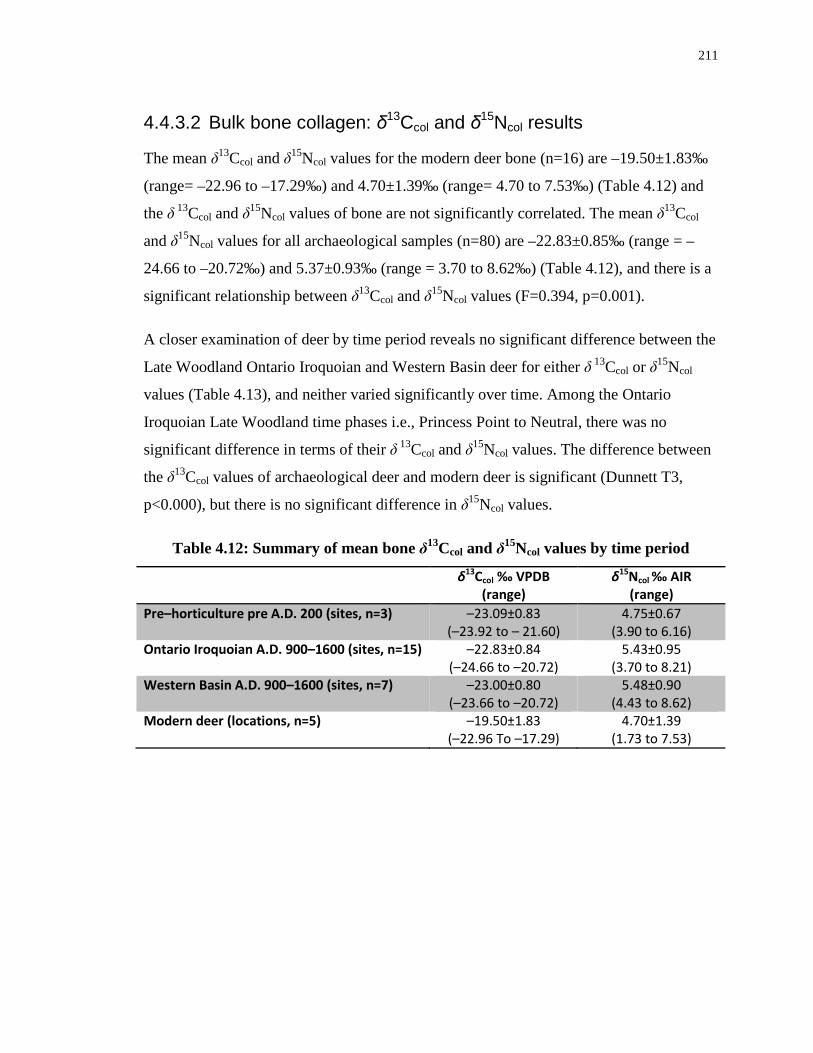
211
4.4.3.2 Bulk bone collagen: δ13Ccol and δ15Ncol results
The mean δ13Ccol and δ15Ncol values for the modern deer bone (n=16) are –19.50±1.83‰
(range= –22.96 to –17.29‰) and 4.70±1.39‰ (range= 4.70 to 7.53‰) (Table 4.12) and
the δ 13Ccol and δ15Ncol values of bone are not significantly correlated. The mean δ13Ccol
and δ15Ncol values for all archaeological samples (n=80) are –22.83±0.85‰ (range = –
24.66 to –20.72‰) and 5.37±0.93‰ (range = 3.70 to 8.62‰) (Table 4.12), and there is a
significant relationship between δ13Ccol and δ15Ncol values (F=0.394, p=0.001).
A closer examination of deer by time period reveals no significant difference between the
Late Woodland Ontario Iroquoian and Western Basin deer for either δ 13Ccol or δ15Ncol
values (Table 4.13), and neither varied significantly over time. Among the Ontario
Iroquoian Late Woodland time phases i.e., Princess Point to Neutral, there was no
significant difference in terms of their δ 13Ccol and δ15Ncol values. The difference between
the δ13Ccol values of archaeological deer and modern deer is significant (Dunnett T3,
p<0.000), but there is no significant difference in δ15Ncol values.
Table 4.12: Summary of mean bone δ13Ccol and δ15Ncol values by time period
δ13Ccol ‰ VPDB (range)
δ15Ncol ‰ AIR (range)
Pre–horticulture pre A.D. 200 (sites, n=3) –23.09±0.83 (–23.92 to – 21.60)
4.75±0.67 (3.90 to 6.16)
Ontario Iroquoian A.D. 900–1600 (sites, n=15) –22.83±0.84 (–24.66 to –20.72)
5.43±0.95 (3.70 to 8.21)
Western Basin A.D. 900–1600 (sites, n=7) –23.00±0.80 (–23.66 to –20.72)
5.48±0.90 (4.43 to 8.62)
Modern deer (locations, n=5) –19.50±1.83 (–22.96 To –17.29)
4.70±1.39 (1.73 to 7.53)
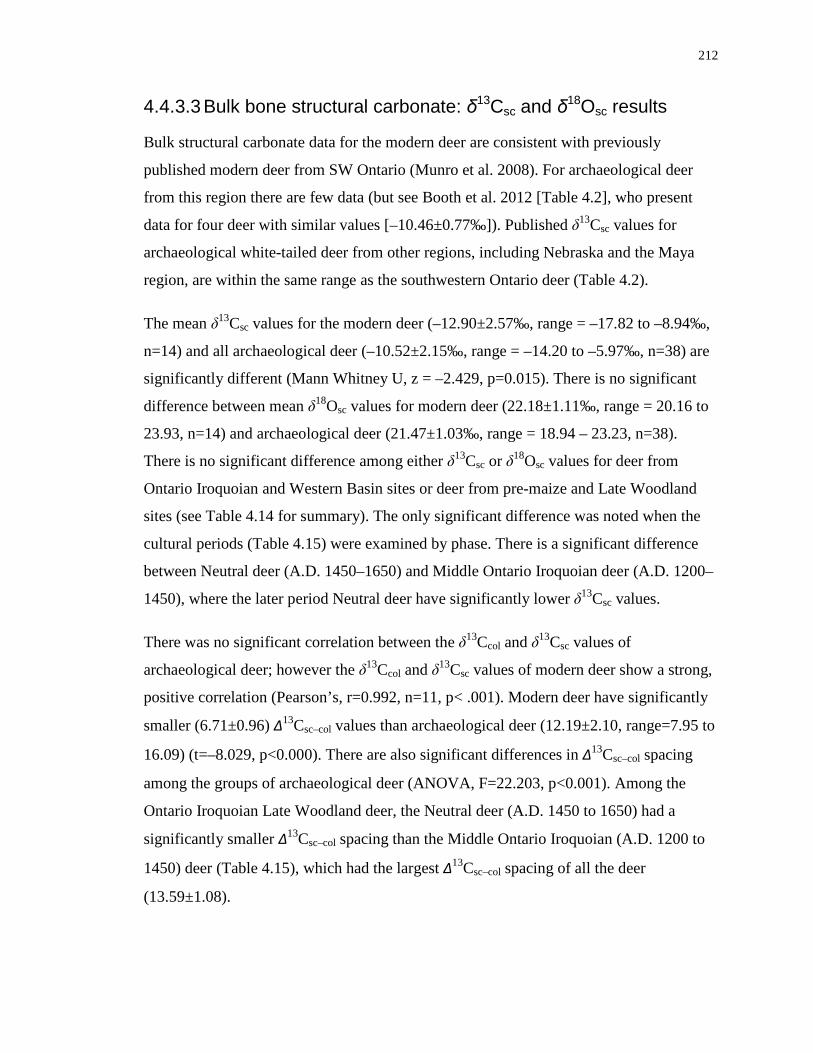
212
4.4.3.3 Bulk bone structural carbonate: δ13Csc and δ18Osc results
Bulk structural carbonate data for the modern deer are consistent with previously
published modern deer from SW Ontario (Munro et al. 2008). For archaeological deer
from this region there are few data (but see Booth et al. 2012 [Table 4.2], who present
data for four deer with similar values [–10.46±0.77‰]). Published δ13Csc values for
archaeological white-tailed deer from other regions, including Nebraska and the Maya
region, are within the same range as the southwestern Ontario deer (Table 4.2).
The mean δ13Csc values for the modern deer (–12.90±2.57‰, range = –17.82 to –8.94‰,
n=14) and all archaeological deer (–10.52±2.15‰, range = –14.20 to –5.97‰, n=38) are
significantly different (Mann Whitney U, z = –2.429, p=0.015). There is no significant
difference between mean δ18Osc values for modern deer (22.18±1.11‰, range = 20.16 to
23.93, n=14) and archaeological deer (21.47±1.03‰, range = 18.94 – 23.23, n=38).
There is no significant difference among either δ13Csc or δ18Osc values for deer from
Ontario Iroquoian and Western Basin sites or deer from pre-maize and Late Woodland
sites (see Table 4.14 for summary). The only significant difference was noted when the
cultural periods (Table 4.15) were examined by phase. There is a significant difference
between Neutral deer (A.D. 1450–1650) and Middle Ontario Iroquoian deer (A.D. 1200–
1450), where the later period Neutral deer have significantly lower δ13Csc values.
There was no significant correlation between the δ13Ccol and δ13Csc values of
archaeological deer; however the δ13Ccol and δ13Csc values of modern deer show a strong,
positive correlation (Pearson’s, r=0.992, n=11, p< .001). Modern deer have significantly
smaller (6.71±0.96) ∆13Csc–col values than archaeological deer (12.19±2.10, range=7.95 to
16.09) (t=–8.029, p<0.000). There are also significant differences in ∆13Csc–col spacing
among the groups of archaeological deer (ANOVA, F=22.203, p<0.001). Among the
Ontario Iroquoian Late Woodland deer, the Neutral deer (A.D. 1450 to 1650) had a
significantly smaller ∆13Csc–col spacing than the Middle Ontario Iroquoian (A.D. 1200 to
1450) deer (Table 4.15), which had the largest ∆13Csc–col spacing of all the deer
(13.59±1.08).

213
Table 4.13: Statistical summary (p-values) comparing δ13Ccol, δ15Ncol and δ13Csc
means by time period. Statistically different results are shown in bold–faced type.
Late Woodland Pre–AD 200 δ13Ccol Modern 0.000 0.000
Late Woodland – 0.837 δ15Ncol Modern 0.142 0.985
Late Woodland – 0.069 δ13Csc Modern 0.014 0.350
Late Woodland – 0.020 δ18Osc Modern 0.089 0.229
Late Woodland – 0.972 ∆13Csc–col Modern 0.000 0.000
Late Woodland – 0.931
Table 4.14: Summary of mean δ13Csc and δ18Osc values by time period, as well as
mean ∆13Csc–col spacing.
Table 4.15: Statistical summary (p-values) comparing δ13Csc and ∆13Csc–col by Late
Woodland Phase. Statistically significant results are shown in bold–faced font.
Middle Ontario Neutral δ13Csc Early Ontario 0.313 0.128
Middle Ontario – 0.004 δ18Osc Early Ontario
Middle Ontario ∆13Csc–col Early Ontario 0.905 0.317
Middle Ontario – 0.000
δ13Csc ‰ VPDB (range)
δ18Osc ‰ VSMOW (range)
∆13Csc–col ‰ (range)
Pre–horticulture pre A.D. 200 (sites, n=3)
–11.92±0.76 (–12.94 to –11.01)
21.37±0.50 (20.66 to 22.01)
11.35±0.93
Ontario Iroquoian A.D. 900–1600 (sites, n=15)
–10.21±2.16 (–14.20 to –5.97)
21.78±0.99 (20.05 to 23.23)
11.22±2.04
Western Basin A.D. 900–1600 (sites, n=7)
–10.31±2.49 (–13.99 to –8.08)
20.89±1.14 (18.94 to 22.56)
12.25±2.41
Modern deer (locations, n=5) (–12.90 (–17.82 to –8.94)
22.46±1.01 (20.16 to 23.93)
6.64±0.96 (5.14 to 8.35)
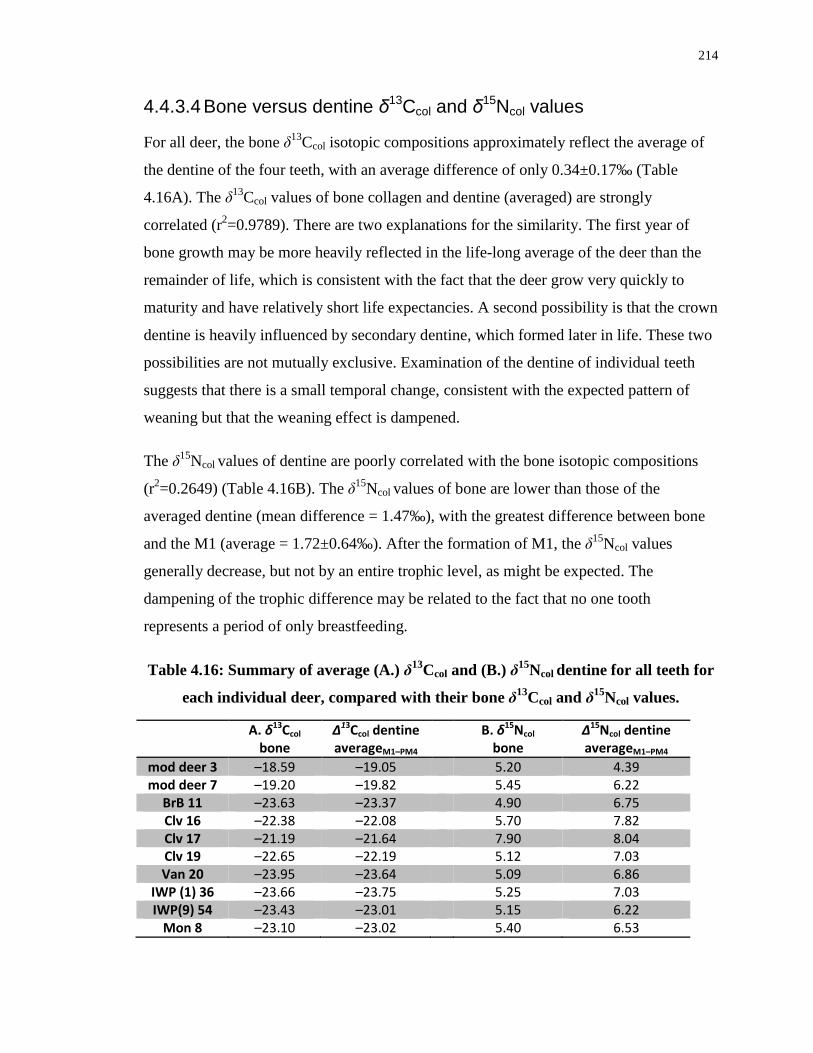
214
4.4.3.4 Bone versus dentine δ13Ccol and δ15Ncol values
For all deer, the bone δ13Ccol isotopic compositions approximately reflect the average of
the dentine of the four teeth, with an average difference of only 0.34±0.17‰ (Table
4.16A). The δ13Ccol values of bone collagen and dentine (averaged) are strongly
correlated (r2=0.9789). There are two explanations for the similarity. The first year of
bone growth may be more heavily reflected in the life-long average of the deer than the
remainder of life, which is consistent with the fact that the deer grow very quickly to
maturity and have relatively short life expectancies. A second possibility is that the crown
dentine is heavily influenced by secondary dentine, which formed later in life. These two
possibilities are not mutually exclusive. Examination of the dentine of individual teeth
suggests that there is a small temporal change, consistent with the expected pattern of
weaning but that the weaning effect is dampened.
The δ15Ncol values of dentine are poorly correlated with the bone isotopic compositions
(r2=0.2649) (Table 4.16B). The δ15Ncol values of bone are lower than those of the
averaged dentine (mean difference = 1.47‰), with the greatest difference between bone
and the M1 (average = 1.72±0.64‰). After the formation of M1, the δ15Ncol values
generally decrease, but not by an entire trophic level, as might be expected. The
dampening of the trophic difference may be related to the fact that no one tooth
represents a period of only breastfeeding.
Table 4.16: Summary of average (A.) δ13Ccol and (B.) δ15Ncol dentine for all teeth for
each individual deer, compared with their bone δ13Ccol and δ15Ncol values.
A. δ13Ccol bone
∆13Ccol dentine averageM1–PM4
B. δ15Ncol bone
∆15Ncol dentine averageM1–PM4
mod deer 3 –18.59 –19.05 5.20 4.39 mod deer 7 –19.20 –19.82 5.45 6.22
BrB 11 –23.63 –23.37 4.90 6.75 Clv 16 –22.38 –22.08 5.70 7.82 Clv 17 –21.19 –21.64 7.90 8.04 Clv 19 –22.65 –22.19 5.12 7.03 Van 20 –23.95 –23.64 5.09 6.86
IWP (1) 36 –23.66 –23.75 5.25 7.03 IWP(9) 54 –23.43 –23.01 5.15 6.22
Mon 8 –23.10 –23.02 5.40 6.53
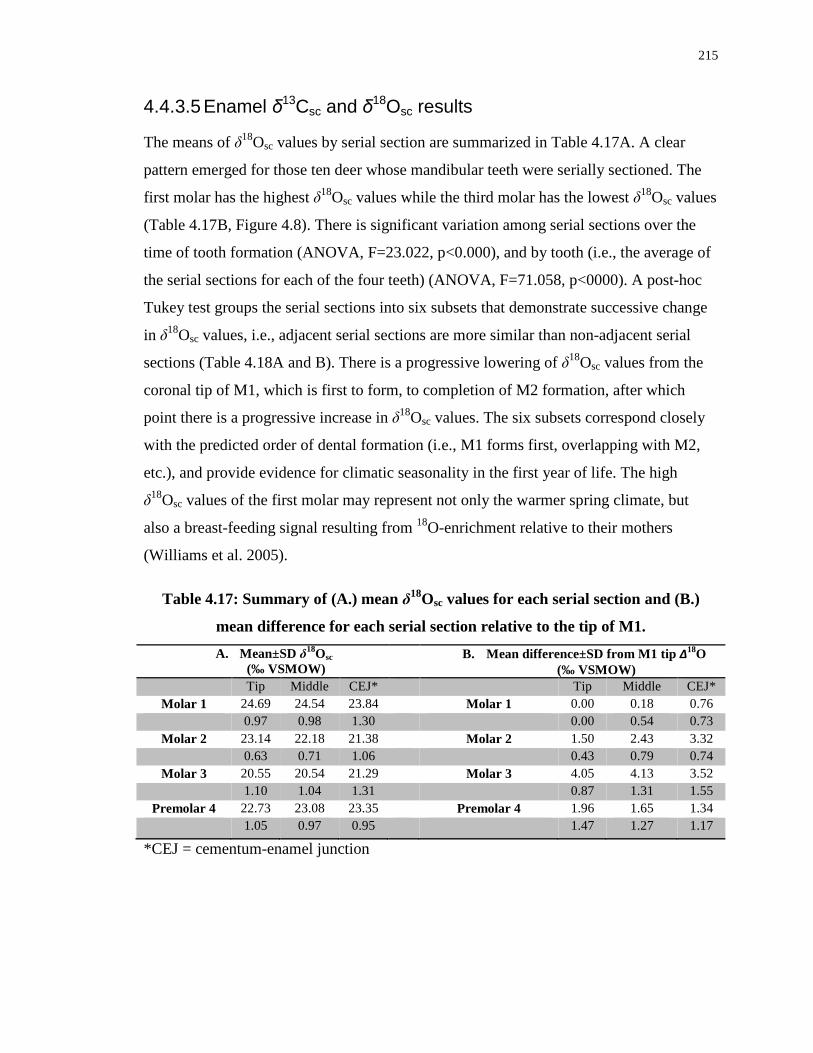
215
4.4.3.5 Enamel δ13Csc and δ18Osc results
The means of δ18Osc values by serial section are summarized in Table 4.17A. A clear
pattern emerged for those ten deer whose mandibular teeth were serially sectioned. The
first molar has the highest δ18Osc values while the third molar has the lowest δ18Osc values
(Table 4.17B, Figure 4.8). There is significant variation among serial sections over the
time of tooth formation (ANOVA, F=23.022, p<0.000), and by tooth (i.e., the average of
the serial sections for each of the four teeth) (ANOVA, F=71.058, p<0000). A post-hoc
Tukey test groups the serial sections into six subsets that demonstrate successive change
in δ18Osc values, i.e., adjacent serial sections are more similar than non-adjacent serial
sections (Table 4.18A and B). There is a progressive lowering of δ18Osc values from the
coronal tip of M1, which is first to form, to completion of M2 formation, after which
point there is a progressive increase in δ18Osc values. The six subsets correspond closely
with the predicted order of dental formation (i.e., M1 forms first, overlapping with M2,
etc.), and provide evidence for climatic seasonality in the first year of life. The high
δ18Osc values of the first molar may represent not only the warmer spring climate, but
also a breast-feeding signal resulting from 18O-enrichment relative to their mothers
(Williams et al. 2005).
Table 4.17: Summary of (A.) mean δ18Osc values for each serial section and (B.)
mean difference for each serial section relative to the tip of M1. A. Mean±SD δ18Osc
(‰ VSMOW) B. Mean difference±SD from M1 tip ∆18O
(‰ VSMOW) Tip Middle CEJ* Tip Middle CEJ*
Molar 1 24.69 24.54 23.84 Molar 1 0.00 0.18 0.76 0.97 0.98 1.30 0.00 0.54 0.73
Molar 2 23.14 22.18 21.38 Molar 2 1.50 2.43 3.32 0.63 0.71 1.06 0.43 0.79 0.74
Molar 3 20.55 20.54 21.29 Molar 3 4.05 4.13 3.52 1.10 1.04 1.31 0.87 1.31 1.55
Premolar 4 22.73 23.08 23.35 Premolar 4 1.96 1.65 1.34 1.05 0.97 0.95 1.47 1.27 1.17
*CEJ = cementum-enamel junction
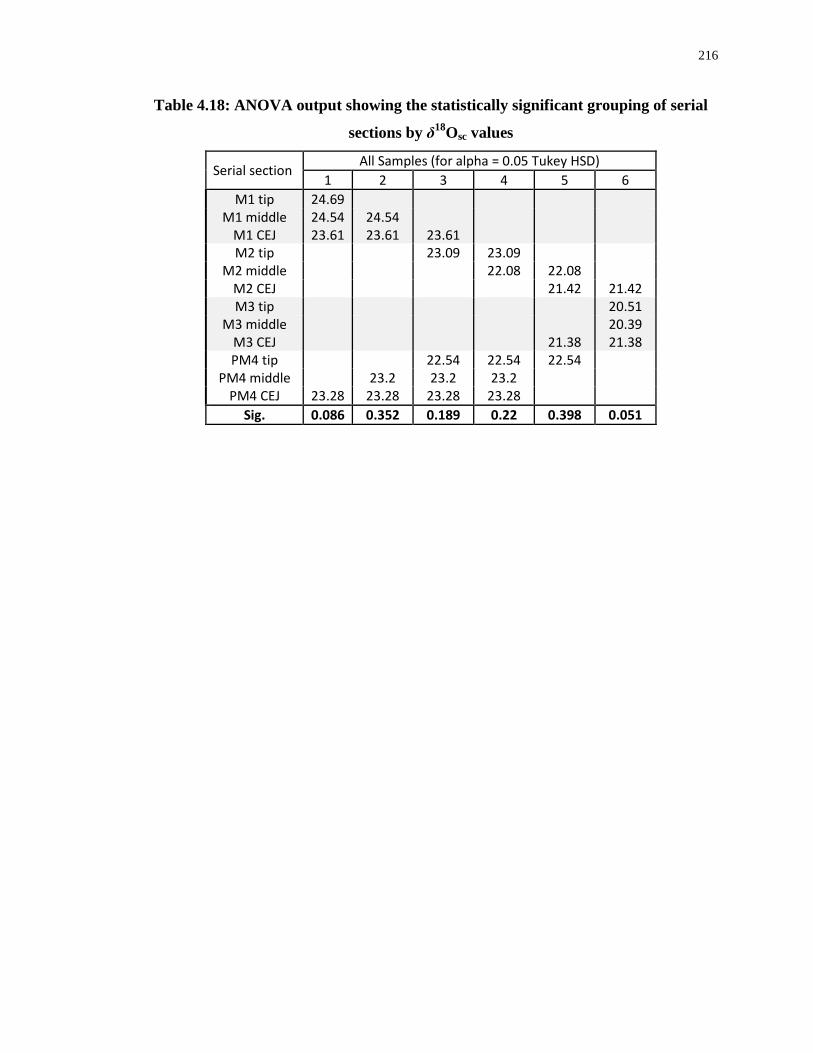
216
Table 4.18: ANOVA output showing the statistically significant grouping of serial
sections by δ18Osc values
Serial section All Samples (for alpha = 0.05 Tukey HSD)
1 2 3 4 5 6 M1 tip 24.69
M1 middle 24.54 24.54 M1 CEJ 23.61 23.61 23.61 M2 tip 23.09 23.09
M2 middle 22.08 22.08 M2 CEJ 21.42 21.42 M3 tip 20.51
M3 middle 20.39 M3 CEJ 21.38 21.38 PM4 tip 22.54 22.54 22.54
PM4 middle 23.2 23.2 23.2 PM4 CEJ 23.28 23.28 23.28 23.28
Sig. 0.086 0.352 0.189 0.22 0.398 0.051
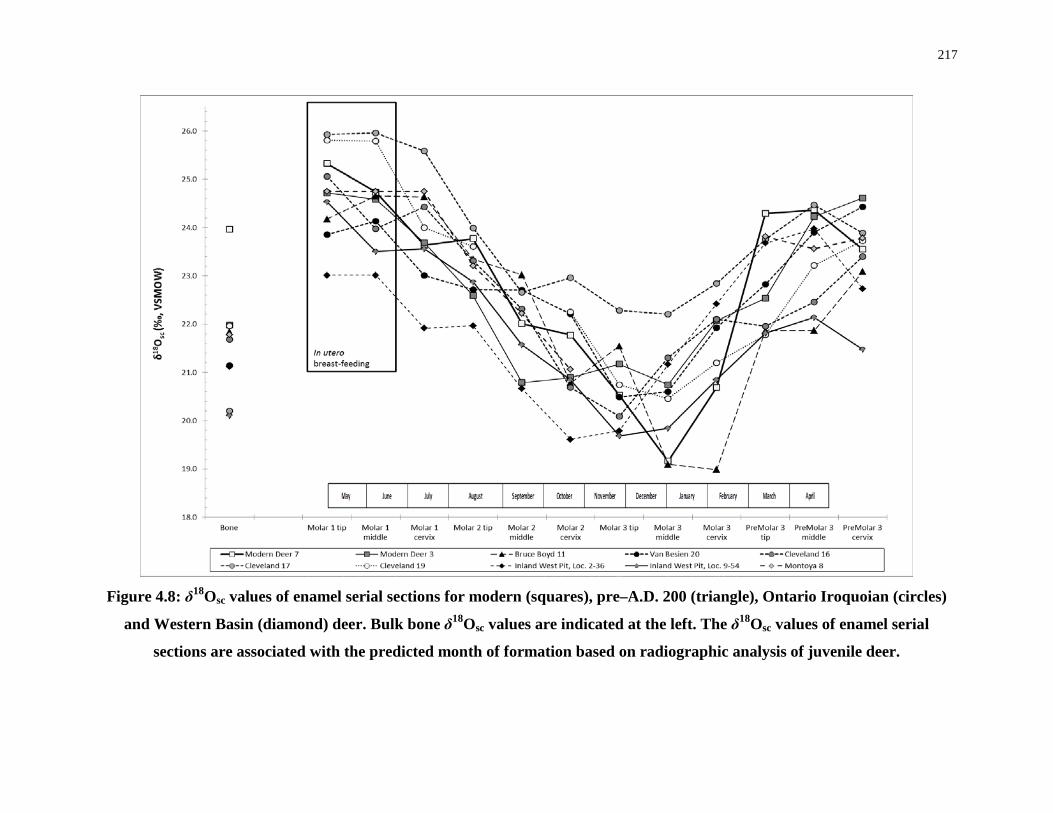
217
Figure 4.8: δ18Osc values of enamel serial sections for modern (squares), pre–A.D. 200 (triangle), Ontario Iroquoian (circles)
and Western Basin (diamond) deer. Bulk bone δ18Osc values are indicated at the left. The δ18Osc values of enamel serial
sections are associated with the predicted month of formation based on radiographic analysis of juvenile deer.

218
The δ18Csc values of the enamel serial sections for modern (Figure 4.12) and
archaeological (Figure 4.8) samples also show a pattern across the period of enamel
formation. Earlier forming serial sections, from M1 and M2, have lower δ18Csc values
relative to later forming serial sections, i.e., M3 and PM4 (Table 4.19A). Unlike the
seasonal pattern observed in the oxygen-isotope data, the δ18Csc values most likely reflect
dietary changes. The diet of the two modern deer reflects the introduction of maize
during the initial formation of M2, corresponding with weaning (Table 4.20A, Figure
4.12), increasing during the formation of M2 and M3, and decreasing with the formation
of the premolars. Increasing δ18Osc values are strongly associated with increasing δ18Csc
values (Pearson’s r=–0.679, n33, p>0.001) in the two modern deer. This relationship
likely reflects both the weaning of the young deer and the introduction of C4 foods,
probably maize, into their diet. Maize appears in the younger deer’s diet in the late
summer/early fall, increasing exponentially for one of the deer until December.
Table 4.19: Summary of mean δ13Csc values for each serial section (A.) and mean
difference (B.) relative to the tip of M1.
A post–hoc Tukey test for the archaeological deer alone suggests three subsets of δ13Csc
values (Table 4.20B). The first includes the M1 and part of the M2, which have the
lowest δ18Csc values and document the time period when the deer was in utero,
breastfeeding, and weaning. Subset 2 is a transition phase, that is, post-birth and weaning
as the deer shift to only solid foods. The third subset represents the post-weaning period
and reflects a completely C3 plant-based diet. While the first two dietary phases (in utero
and breastfeeding) and the transition from weaning are evident for the modern and
A. Mean±SD δ13Csc (‰VPDB)
B. Mean difference from M1tip ∆13Csc (‰VPDB)
Tip Middle CEJ Tip Middle CEJ Molar 1 –16.70 –16.93 –16.35 Molar 1 0.00 0.12 –0.39 0.46 0.75 0.98 0.00 0.34 0.76 Molar 2 –15.82 –14.97 –14.56 Molar 2 –0.94 –1.88 –2.26 1.14 2.00 1.78 0.99 1.84 1.68 Molar 3 –14.78 –14.68 –14.16 Molar 3 –2.01 –2.23 –2.49 0.76 0.00 0.60 0.54 0.54 0.48 Premolar 4 –14.63 –14.33 –14.55 Premolar 4 –2.06 –2.56 –2.29 0.33 0.42 0.64 0.54 0.90 0.80

219
archaeological deer, there is a clear separation between modern and archaeological deer
as they shift to a plant-only diet. The modern deer consumed some C4 plants, while the
archaeological deer consumed only C3 plants.
Table 4.20: ANOVA output showing the statistically significant grouping of serial
sections by δ13Csc values, with (A.) modern deer and without (B.) modern deer.
A. Serial section
All samples (Subset for alpha = 0.05) 1 2 3 4
M1 tip –16.70 M1 middle –16.93
M1 CEJ –16.25 –16.25 M2 tip –15.77 –15.77 –15.77
M2 middle –14.48 –14.48 –14.48 M2 CEJ –14.56 –14.56 –14.56 M3 tip –13.87 –13.87
M3 middle –13.06 M3 CEJ –13.72 –13.72 PM4 tip –14.33 –14.33 –14.33
PM4 middle –14.18 –14.18 –14.18 PM4 CEJ –14.50 –14.50 –14.50
Sig. 0.805 0.063 0.07 0.447
B. Serial section Archaeological samples only
(Subset for alpha = 0.05) 1 2 3
M1 tip –16.74 M1 middle –17.00
M1 CEJ –16.39 –16.39 M2 tip –16.13 –16.13
M2 middle –16.01 –16.01 M2 CEJ –15.23 –15.23 M3 tip –14.61
M3 middle –14.57 M3 CEJ –14.35 PM4 tip –14.67
PM4 middle –14.26 PM4 CEJ –14.61
Sig. 0.195 0.059 0.22
For the archaeological deer there is a significant correlation (Pearson’s r=–0.278, n=110,
p=0.003) between δ18Osc and δ13Csc values of the enamel serial sections, though it is not
as strong as for the modern deer (Figure 4.9). The correlation is likely the result of
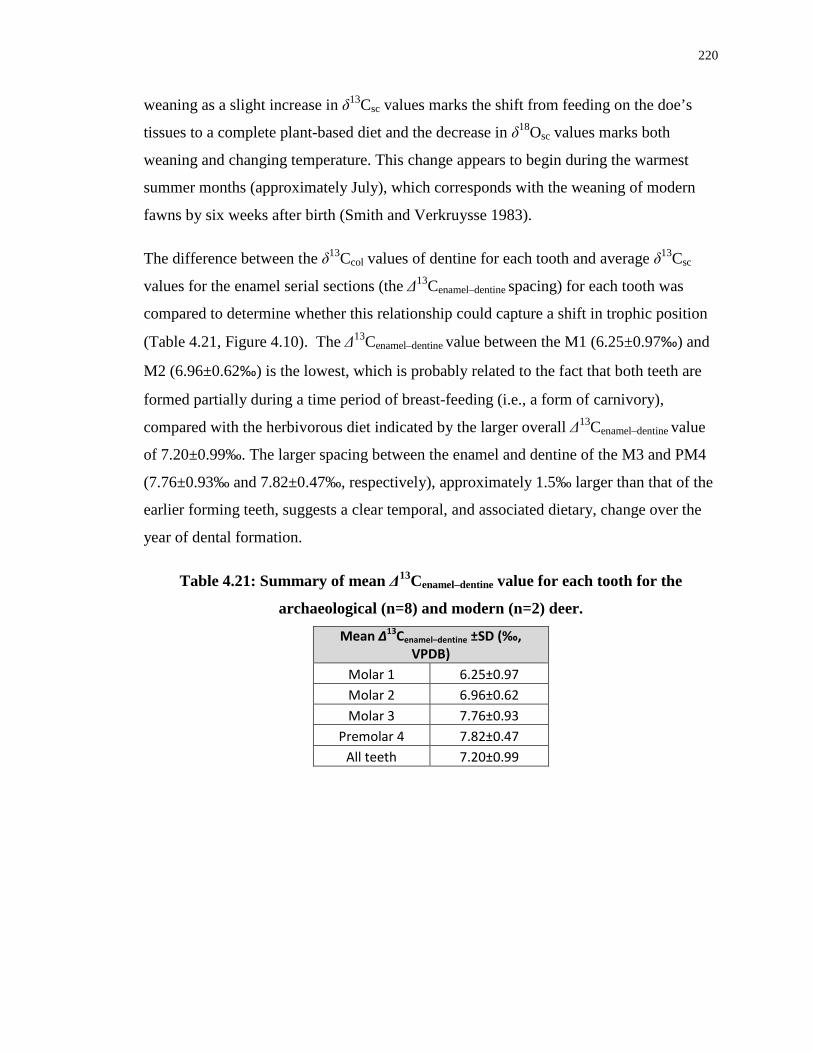
220
weaning as a slight increase in δ13Csc values marks the shift from feeding on the doe’s
tissues to a complete plant-based diet and the decrease in δ18Osc values marks both
weaning and changing temperature. This change appears to begin during the warmest
summer months (approximately July), which corresponds with the weaning of modern
fawns by six weeks after birth (Smith and Verkruysse 1983).
The difference between the δ13Ccol values of dentine for each tooth and average δ13Csc
values for the enamel serial sections (the Δ13Cenamel–dentine spacing) for each tooth was
compared to determine whether this relationship could capture a shift in trophic position
(Table 4.21, Figure 4.10). The Δ13Cenamel–dentine value between the M1 (6.25±0.97‰) and
M2 (6.96±0.62‰) is the lowest, which is probably related to the fact that both teeth are
formed partially during a time period of breast-feeding (i.e., a form of carnivory),
compared with the herbivorous diet indicated by the larger overall Δ13Cenamel–dentine value
of 7.20±0.99‰. The larger spacing between the enamel and dentine of the M3 and PM4
(7.76±0.93‰ and 7.82±0.47‰, respectively), approximately 1.5‰ larger than that of the
earlier forming teeth, suggests a clear temporal, and associated dietary, change over the
year of dental formation.
Table 4.21: Summary of mean Δ13Cenamel–dentine value for each tooth for the
archaeological (n=8) and modern (n=2) deer.
Mean Δ13Cenamel–dentine ±SD (‰, VPDB)
Molar 1 6.25±0.97 Molar 2 6.96±0.62 Molar 3 7.76±0.93
Premolar 4 7.82±0.47 All teeth 7.20±0.99

221
Figure 4.9: Relationship between δ13Csc and δ18Osc values for modern and archaeological deer.

222
Figure 4.10: Average ∆13Csc-col of enamel and dentine, respectively, by tooth (compared to ∆13Csc-col of bone in the gray box).
Grey diamonds are average for the 10 serially sampled deer, while the black diamonds are bone average for all deer.
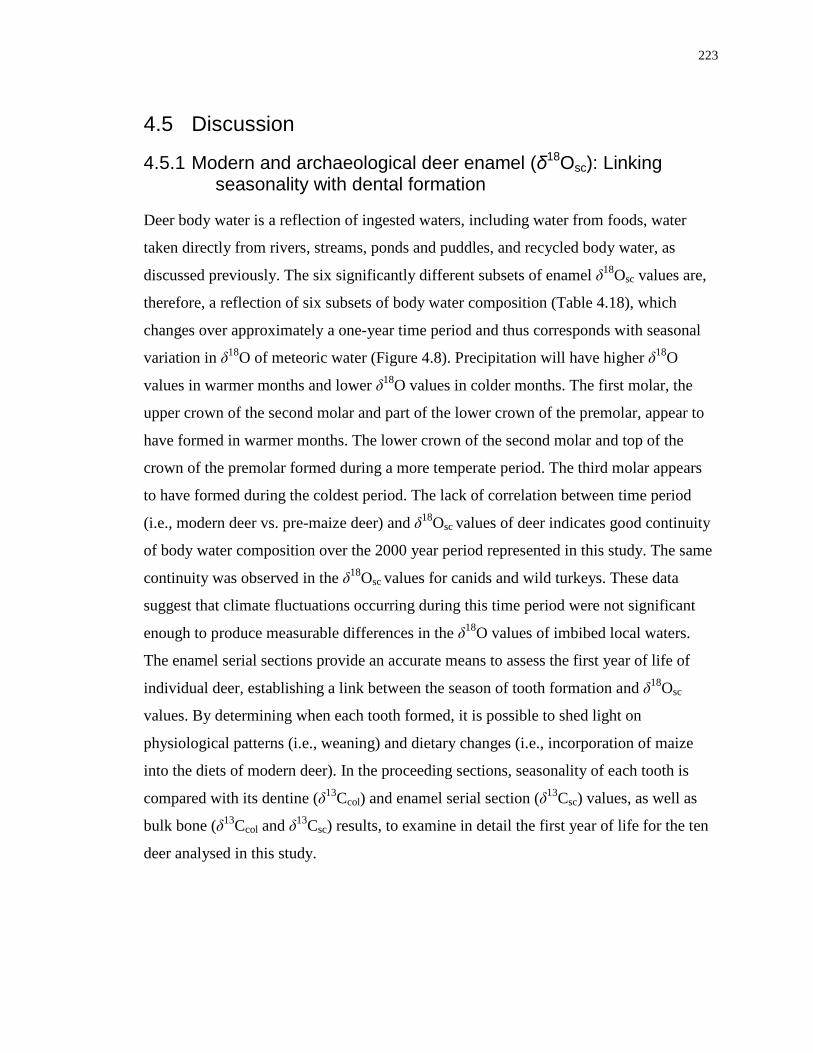
223
4.5 Discussion
4.5.1 Modern and archaeological deer enamel (δ18Osc): Linking seasonality with dental formation
Deer body water is a reflection of ingested waters, including water from foods, water
taken directly from rivers, streams, ponds and puddles, and recycled body water, as
discussed previously. The six significantly different subsets of enamel δ18Osc values are,
therefore, a reflection of six subsets of body water composition (Table 4.18), which
changes over approximately a one-year time period and thus corresponds with seasonal
variation in δ18O of meteoric water (Figure 4.8). Precipitation will have higher δ18O
values in warmer months and lower δ18O values in colder months. The first molar, the
upper crown of the second molar and part of the lower crown of the premolar, appear to
have formed in warmer months. The lower crown of the second molar and top of the
crown of the premolar formed during a more temperate period. The third molar appears
to have formed during the coldest period. The lack of correlation between time period
(i.e., modern deer vs. pre-maize deer) and δ18Osc values of deer indicates good continuity
of body water composition over the 2000 year period represented in this study. The same
continuity was observed in the δ18Osc values for canids and wild turkeys. These data
suggest that climate fluctuations occurring during this time period were not significant
enough to produce measurable differences in the δ18O values of imbibed local waters.
The enamel serial sections provide an accurate means to assess the first year of life of
individual deer, establishing a link between the season of tooth formation and δ18Osc
values. By determining when each tooth formed, it is possible to shed light on
physiological patterns (i.e., weaning) and dietary changes (i.e., incorporation of maize
into the diets of modern deer). In the proceeding sections, seasonality of each tooth is
compared with its dentine (δ13Ccol) and enamel serial section (δ13Csc) values, as well as
bulk bone (δ13Ccol and δ13Csc) results, to examine in detail the first year of life for the ten
deer analysed in this study.
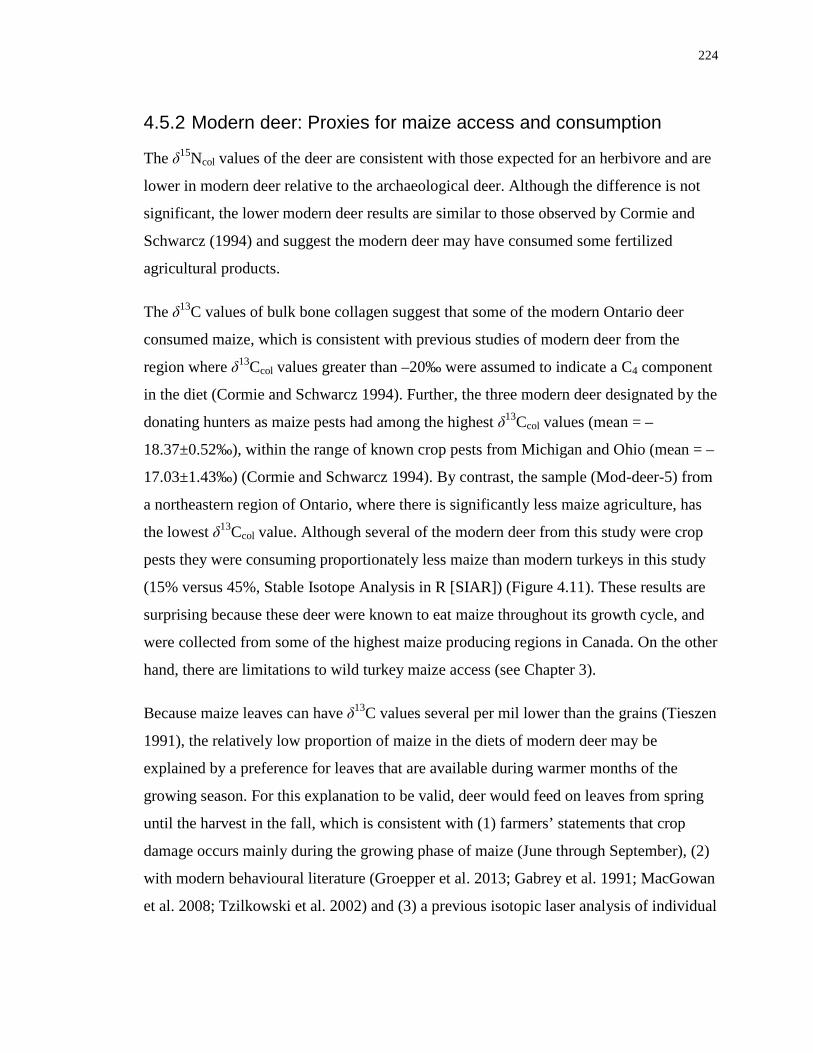
224
4.5.2 Modern deer: Proxies for maize access and consumption
The δ15Ncol values of the deer are consistent with those expected for an herbivore and are
lower in modern deer relative to the archaeological deer. Although the difference is not
significant, the lower modern deer results are similar to those observed by Cormie and
Schwarcz (1994) and suggest the modern deer may have consumed some fertilized
agricultural products.
The δ13C values of bulk bone collagen suggest that some of the modern Ontario deer
consumed maize, which is consistent with previous studies of modern deer from the
region where δ13Ccol values greater than –20‰ were assumed to indicate a C4 component
in the diet (Cormie and Schwarcz 1994). Further, the three modern deer designated by the
donating hunters as maize pests had among the highest δ13Ccol values (mean = –
18.37±0.52‰), within the range of known crop pests from Michigan and Ohio (mean = –
17.03±1.43‰) (Cormie and Schwarcz 1994). By contrast, the sample (Mod-deer-5) from
a northeastern region of Ontario, where there is significantly less maize agriculture, has
the lowest δ13Ccol value. Although several of the modern deer from this study were crop
pests they were consuming proportionately less maize than modern turkeys in this study
(15% versus 45%, Stable Isotope Analysis in R [SIAR]) (Figure 4.11). These results are
surprising because these deer were known to eat maize throughout its growth cycle, and
were collected from some of the highest maize producing regions in Canada. On the other
hand, there are limitations to wild turkey maize access (see Chapter 3).
Because maize leaves can have δ13C values several per mil lower than the grains (Tieszen
1991), the relatively low proportion of maize in the diets of modern deer may be
explained by a preference for leaves that are available during warmer months of the
growing season. For this explanation to be valid, deer would feed on leaves from spring
until the harvest in the fall, which is consistent with (1) farmers’ statements that crop
damage occurs mainly during the growing phase of maize (June through September), (2)
with modern behavioural literature (Groepper et al. 2013; Gabrey et al. 1991; MacGowan
et al. 2008; Tzilkowski et al. 2002) and (3) a previous isotopic laser analysis of individual
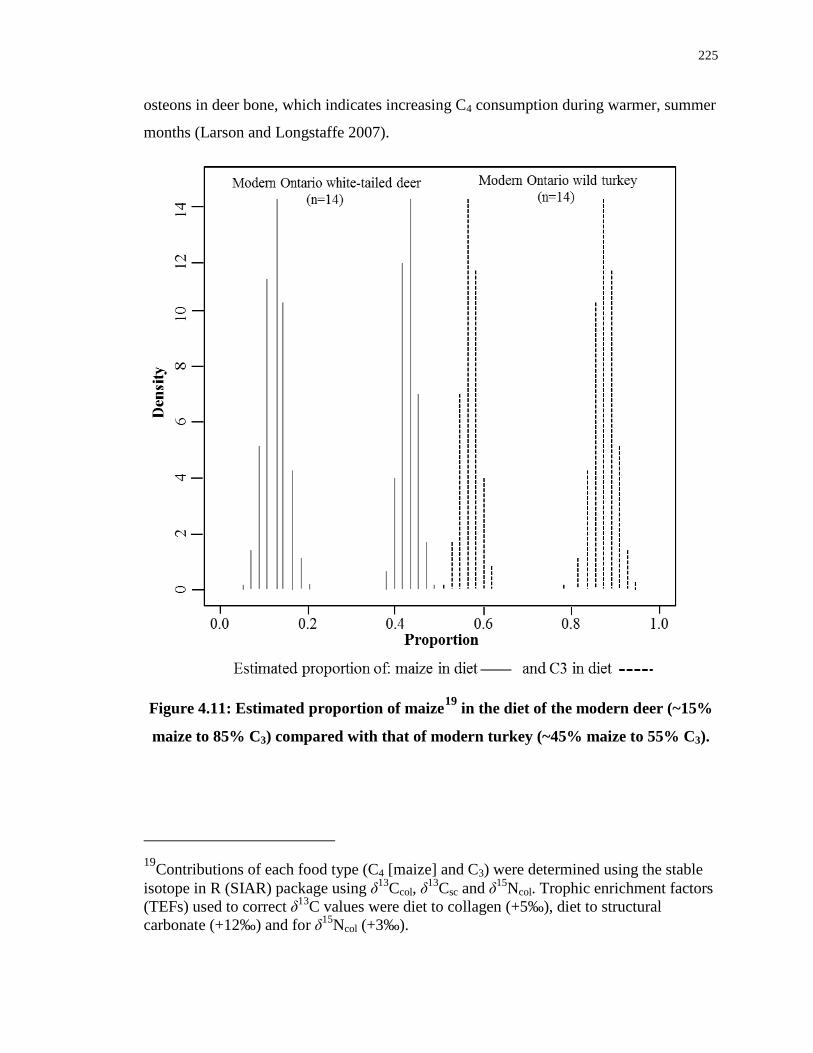
225
osteons in deer bone, which indicates increasing C4 consumption during warmer, summer
months (Larson and Longstaffe 2007).
Figure 4.11: Estimated proportion of maize19 in the diet of the modern deer (~15%
maize to 85% C3) compared with that of modern turkey (~45% maize to 55% C3).
19Contributions of each food type (C4 [maize] and C3) were determined using the stable isotope in R (SIAR) package using δ13Ccol, δ13Csc and δ15Ncol. Trophic enrichment factors (TEFs) used to correct δ13C values were diet to collagen (+5‰), diet to structural carbonate (+12‰) and for δ15Ncol (+3‰).
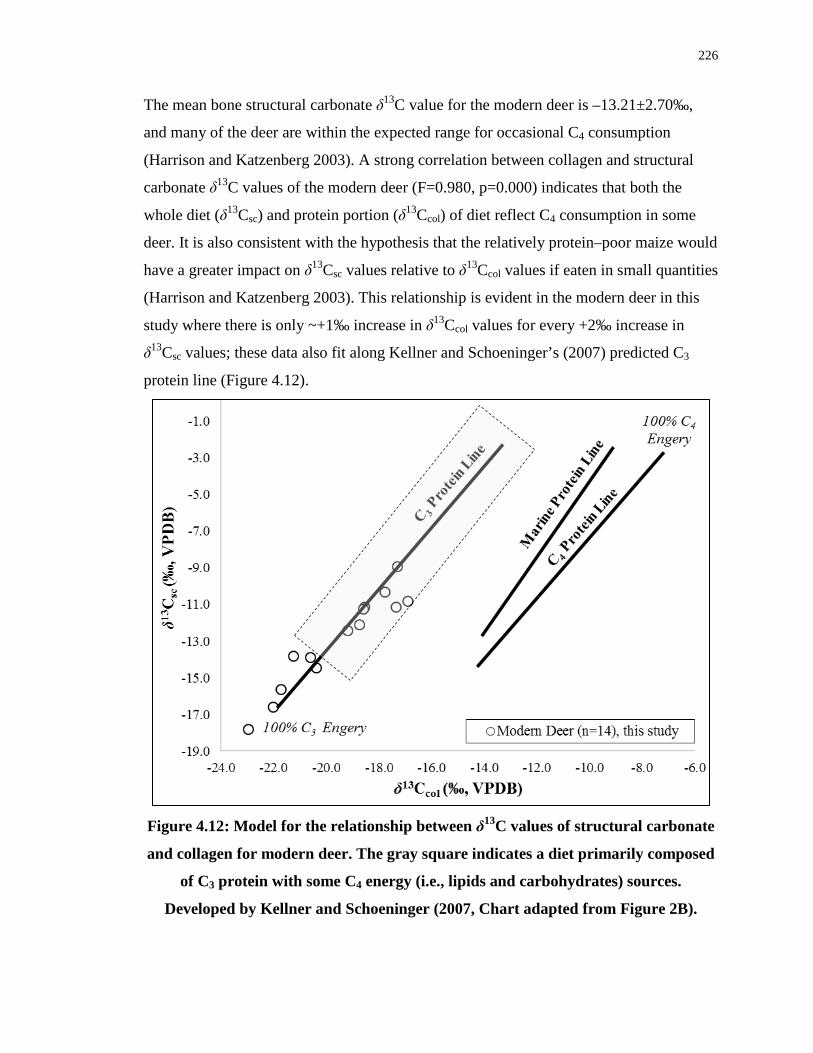
226
The mean bone structural carbonate δ13C value for the modern deer is –13.21±2.70‰,
and many of the deer are within the expected range for occasional C4 consumption
(Harrison and Katzenberg 2003). A strong correlation between collagen and structural
carbonate δ13C values of the modern deer (F=0.980, p=0.000) indicates that both the
whole diet (δ13Csc) and protein portion (δ13Ccol) of diet reflect C4 consumption in some
deer. It is also consistent with the hypothesis that the relatively protein–poor maize would
have a greater impact on δ13Csc values relative to δ13Ccol values if eaten in small quantities
(Harrison and Katzenberg 2003). This relationship is evident in the modern deer in this
study where there is only ~+1‰ increase in δ13Ccol values for every +2‰ increase in
δ13Csc values; these data also fit along Kellner and Schoeninger’s (2007) predicted C3
protein line (Figure 4.12).
Figure 4.12: Model for the relationship between δ13C values of structural carbonate
and collagen for modern deer. The gray square indicates a diet primarily composed
of C3 protein with some C4 energy (i.e., lipids and carbohydrates) sources.
Developed by Kellner and Schoeninger (2007, Chart adapted from Figure 2B).
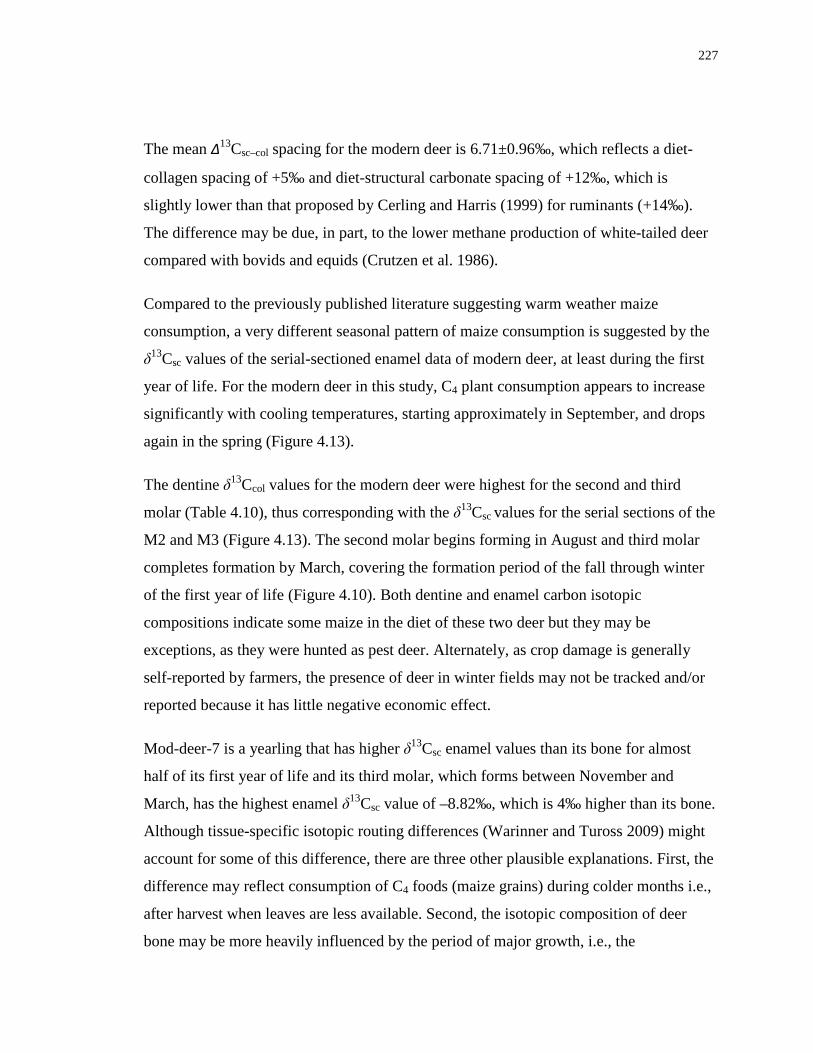
227
The mean ∆13Csc–col spacing for the modern deer is 6.71±0.96‰, which reflects a diet-
collagen spacing of +5‰ and diet-structural carbonate spacing of +12‰, which is
slightly lower than that proposed by Cerling and Harris (1999) for ruminants (+14‰).
The difference may be due, in part, to the lower methane production of white-tailed deer
compared with bovids and equids (Crutzen et al. 1986).
Compared to the previously published literature suggesting warm weather maize
consumption, a very different seasonal pattern of maize consumption is suggested by the
δ13Csc values of the serial-sectioned enamel data of modern deer, at least during the first
year of life. For the modern deer in this study, C4 plant consumption appears to increase
significantly with cooling temperatures, starting approximately in September, and drops
again in the spring (Figure 4.13).
The dentine δ13Ccol values for the modern deer were highest for the second and third
molar (Table 4.10), thus corresponding with the δ13Csc values for the serial sections of the
M2 and M3 (Figure 4.13). The second molar begins forming in August and third molar
completes formation by March, covering the formation period of the fall through winter
of the first year of life (Figure 4.10). Both dentine and enamel carbon isotopic
compositions indicate some maize in the diet of these two deer but they may be
exceptions, as they were hunted as pest deer. Alternately, as crop damage is generally
self-reported by farmers, the presence of deer in winter fields may not be tracked and/or
reported because it has little negative economic effect.
Mod-deer-7 is a yearling that has higher δ13Csc enamel values than its bone for almost
half of its first year of life and its third molar, which forms between November and
March, has the highest enamel δ13Csc value of –8.82‰, which is 4‰ higher than its bone.
Although tissue-specific isotopic routing differences (Warinner and Tuross 2009) might
account for some of this difference, there are three other plausible explanations. First, the
difference may reflect consumption of C4 foods (maize grains) during colder months i.e.,
after harvest when leaves are less available. Second, the isotopic composition of deer
bone may be more heavily influenced by the period of major growth, i.e., the
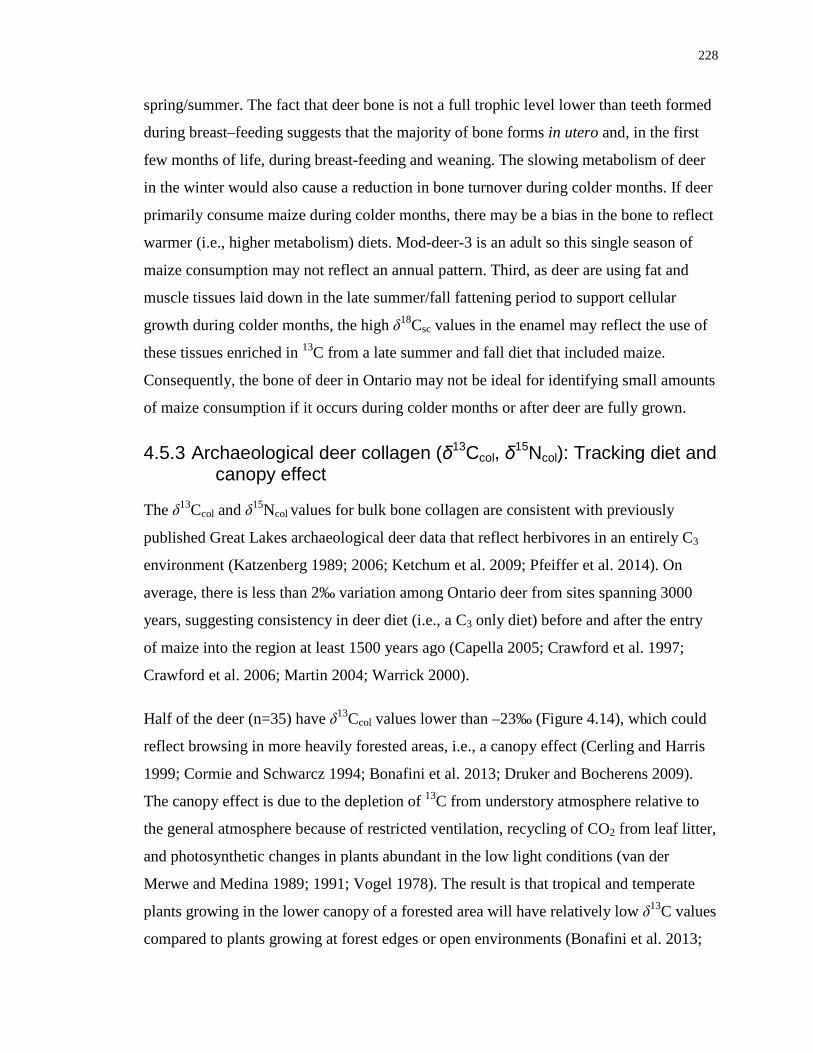
228
spring/summer. The fact that deer bone is not a full trophic level lower than teeth formed
during breast–feeding suggests that the majority of bone forms in utero and, in the first
few months of life, during breast-feeding and weaning. The slowing metabolism of deer
in the winter would also cause a reduction in bone turnover during colder months. If deer
primarily consume maize during colder months, there may be a bias in the bone to reflect
warmer (i.e., higher metabolism) diets. Mod-deer-3 is an adult so this single season of
maize consumption may not reflect an annual pattern. Third, as deer are using fat and
muscle tissues laid down in the late summer/fall fattening period to support cellular
growth during colder months, the high δ18Csc values in the enamel may reflect the use of
these tissues enriched in 13C from a late summer and fall diet that included maize.
Consequently, the bone of deer in Ontario may not be ideal for identifying small amounts
of maize consumption if it occurs during colder months or after deer are fully grown.
4.5.3 Archaeological deer collagen (δ13Ccol, δ15Ncol): Tracking diet and canopy effect
The δ13Ccol and δ15Ncol values for bulk bone collagen are consistent with previously
published Great Lakes archaeological deer data that reflect herbivores in an entirely C3
environment (Katzenberg 1989; 2006; Ketchum et al. 2009; Pfeiffer et al. 2014). On
average, there is less than 2‰ variation among Ontario deer from sites spanning 3000
years, suggesting consistency in deer diet (i.e., a C3 only diet) before and after the entry
of maize into the region at least 1500 years ago (Capella 2005; Crawford et al. 1997;
Crawford et al. 2006; Martin 2004; Warrick 2000).
Half of the deer (n=35) have δ13Ccol values lower than –23‰ (Figure 4.14), which could
reflect browsing in more heavily forested areas, i.e., a canopy effect (Cerling and Harris
1999; Cormie and Schwarcz 1994; Bonafini et al. 2013; Druker and Bocherens 2009).
The canopy effect is due to the depletion of 13C from understory atmosphere relative to
the general atmosphere because of restricted ventilation, recycling of CO2 from leaf litter,
and photosynthetic changes in plants abundant in the low light conditions (van der
Merwe and Medina 1989; 1991; Vogel 1978). The result is that tropical and temperate
plants growing in the lower canopy of a forested area will have relatively low δ13C values
compared to plants growing at forest edges or open environments (Bonafini et al. 2013;

229
Cerling and Harris 1999; Druker and Bocherens 2009; Vogel 1978). Drucker and
Bocherens (2009) interpreted the δ13C composition of ancient bovids to track the
introduction of deep forests in France, while Bonafini et al. (2013) found a moderate
canopy effect on roe deer living at the forest edge, as might be expected for animals
living on plants both in open and closed environments. Both studies suggest that the
canopy effect, well recognized for plants, may be also identifiable when moving up a
trophic level to primary consumers.
Like the roe deer in Bonafini et al.’s (2013) study, the ecology of modern white-tailed
deer would suggest that they may hide in forests if disturbed, but in general they eat in
more open areas, and therefore a canopy effect is unlikely. Many of the archaeological
deer, however, appear to have δ13Ccol values consistent with a canopy effect, as described
by Cormie and Schwarcz (1994) and Bonafini et al. (2013). The implication is that these
deer, hunted by ancient Ontario peoples, did not access C4 (i.e., maize) plants, and
further, may have browsed in more deeply shaded areas than their modern counterparts,
avoiding open terrain. Modern deer are unable to move into deeply forested areas in
southwestern Ontario because of deforestation over the last 200 years. Despite extensive
Late Woodland maize agriculture, a large amount of the region would have remained
closed forest before A.D. 1650. The collagen isotopic data indicate that the ancient deer
may have actively avoided human predators and, therefore, foregone foraging in maize
fields, despite its rich food resource potential. Deer hunting, therefore, likely occurred
away from open and/or cleared lands. Because a large number of deer would have been
required to support the food and clothing needs of past peoples, deer within the
immediate vicinity of villages would have been quickly hunted out. According to Ripple
and Breschta’s (2003) “terrain of fear” theory, prey species, including ungulates, will
alter their foraging patterns in order to avoid sites with higher risk of predation (see also
Wolverton 2008). Any deer living near humans during the Late Woodland times may
have either been immediately hunted out or fled the area, resulting in the need for Late
Woodland hunters to go further afield to find enough deer to support growing
populations. This theory is consistent with ethnographic descriptions of deer hunting
among the Late Woodland Neutral people; “game was scarce near villages and Indians
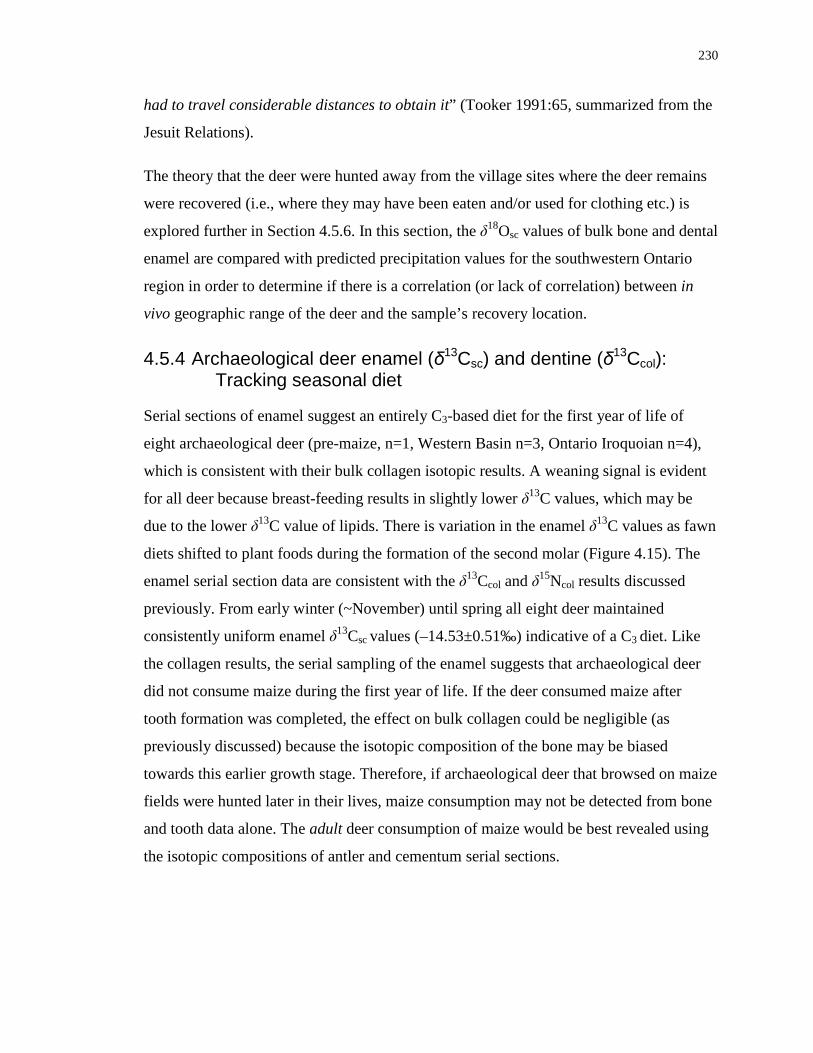
230
had to travel considerable distances to obtain it” (Tooker 1991:65, summarized from the
Jesuit Relations).
The theory that the deer were hunted away from the village sites where the deer remains
were recovered (i.e., where they may have been eaten and/or used for clothing etc.) is
explored further in Section 4.5.6. In this section, the δ18Osc values of bulk bone and dental
enamel are compared with predicted precipitation values for the southwestern Ontario
region in order to determine if there is a correlation (or lack of correlation) between in
vivo geographic range of the deer and the sample’s recovery location.
4.5.4 Archaeological deer enamel (δ13Csc) and dentine (δ13Ccol): Tracking seasonal diet
Serial sections of enamel suggest an entirely C3-based diet for the first year of life of
eight archaeological deer (pre-maize, n=1, Western Basin n=3, Ontario Iroquoian n=4),
which is consistent with their bulk collagen isotopic results. A weaning signal is evident
for all deer because breast-feeding results in slightly lower δ13C values, which may be
due to the lower δ13C value of lipids. There is variation in the enamel δ13C values as fawn
diets shifted to plant foods during the formation of the second molar (Figure 4.15). The
enamel serial section data are consistent with the δ13Ccol and δ15Ncol results discussed
previously. From early winter (~November) until spring all eight deer maintained
consistently uniform enamel δ13Csc values (–14.53±0.51‰) indicative of a C3 diet. Like
the collagen results, the serial sampling of the enamel suggests that archaeological deer
did not consume maize during the first year of life. If the deer consumed maize after
tooth formation was completed, the effect on bulk collagen could be negligible (as
previously discussed) because the isotopic composition of the bone may be biased
towards this earlier growth stage. Therefore, if archaeological deer that browsed on maize
fields were hunted later in their lives, maize consumption may not be detected from bone
and tooth data alone. The adult deer consumption of maize would be best revealed using
the isotopic compositions of antler and cementum serial sections.
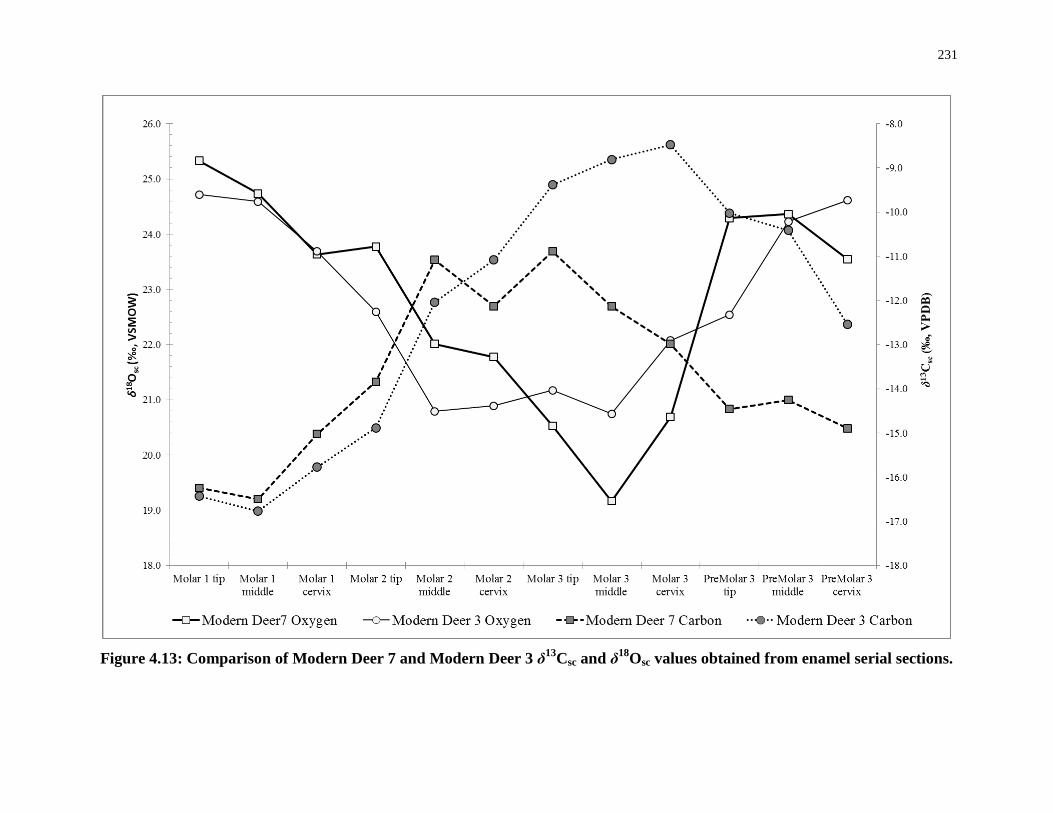
231
Figure 4.13: Comparison of Modern Deer 7 and Modern Deer 3 δ13Csc and δ18Osc values obtained from enamel serial sections.
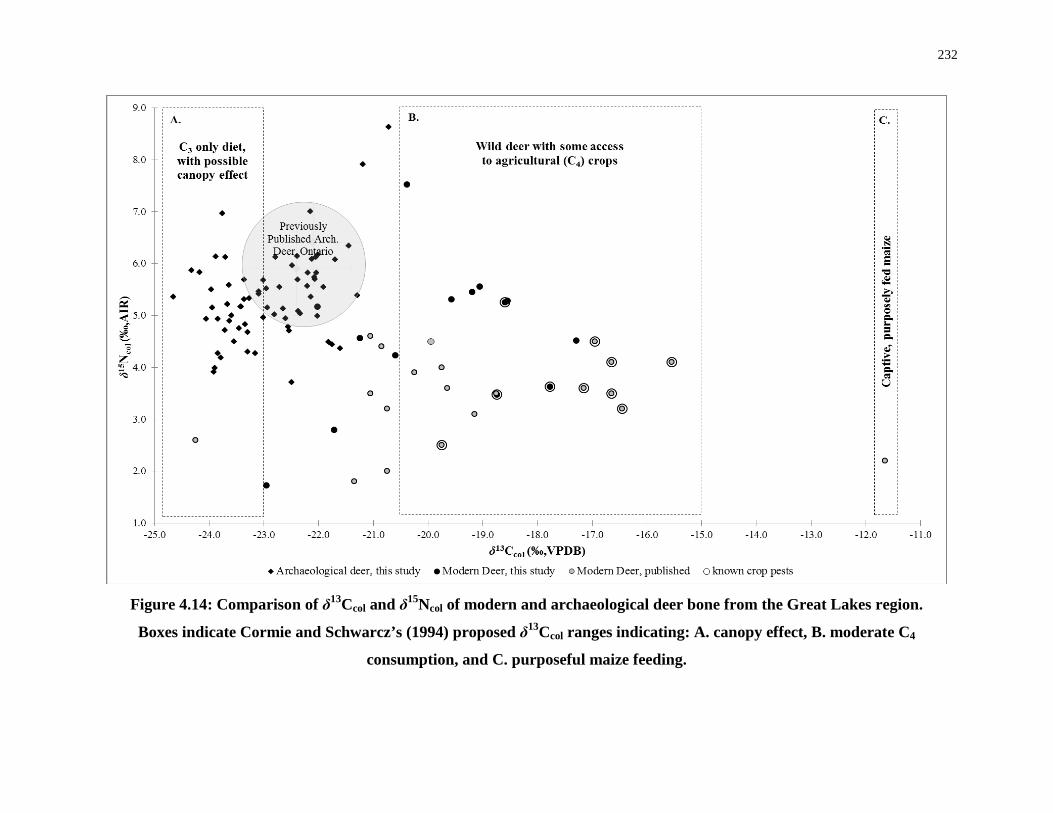
232
Figure 4.14: Comparison of δ13Ccol and δ15Ncol of modern and archaeological deer bone from the Great Lakes region.
Boxes indicate Cormie and Schwarcz’s (1994) proposed δ13Ccol ranges indicating: A. canopy effect, B. moderate C4
consumption, and C. purposeful maize feeding.
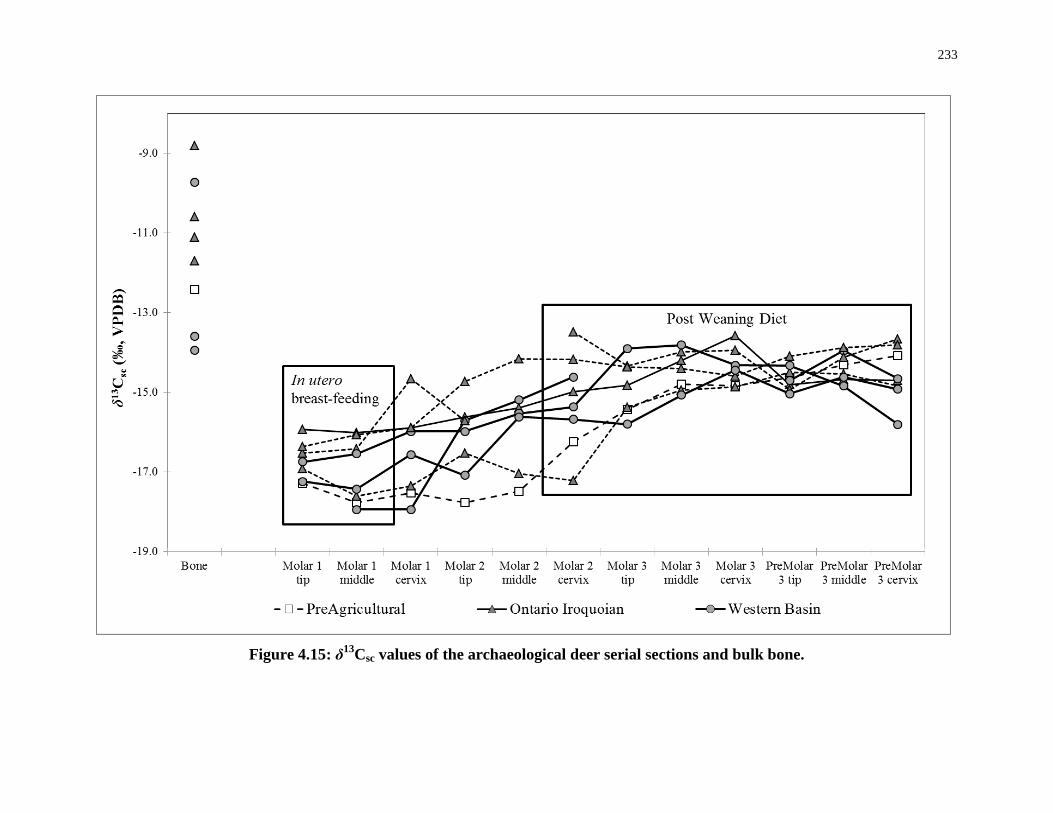
233
Figure 4.15: δ13Csc values of the archaeological deer serial sections and bulk bone.
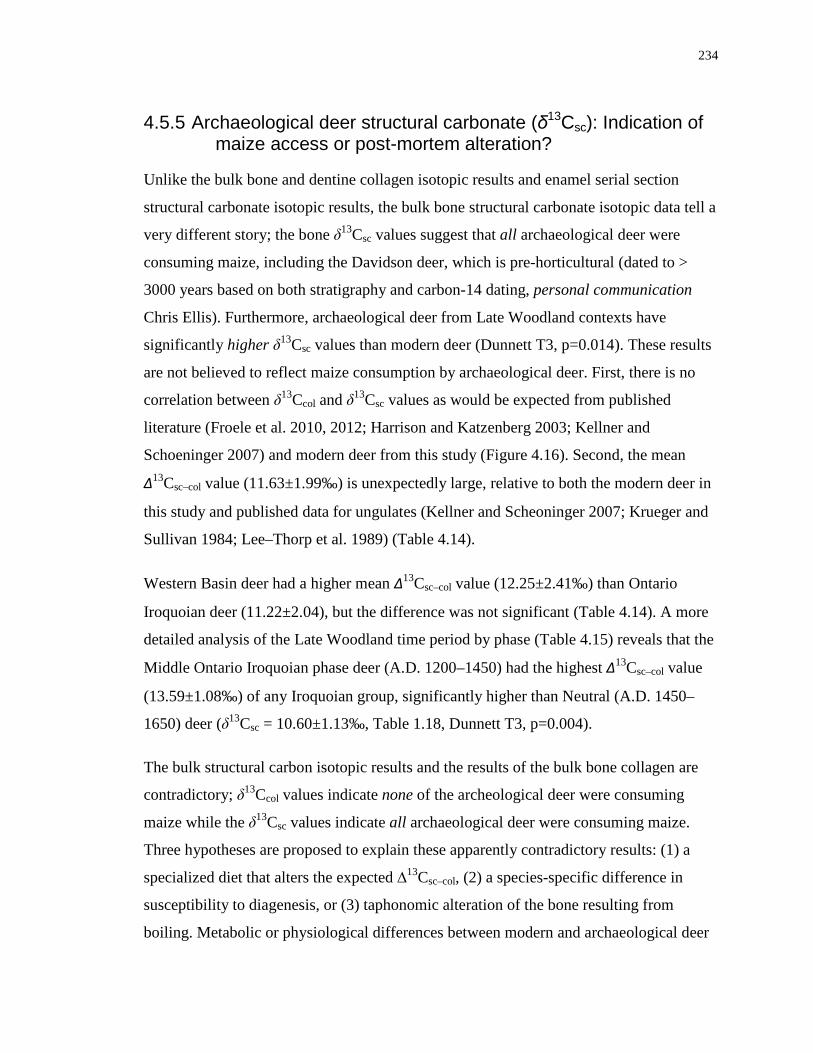
234
4.5.5 Archaeological deer structural carbonate (δ13Csc): Indication of maize access or post-mortem alteration?
Unlike the bulk bone and dentine collagen isotopic results and enamel serial section
structural carbonate isotopic results, the bulk bone structural carbonate isotopic data tell a
very different story; the bone δ13Csc values suggest that all archaeological deer were
consuming maize, including the Davidson deer, which is pre-horticultural (dated to >
3000 years based on both stratigraphy and carbon-14 dating, personal communication
Chris Ellis). Furthermore, archaeological deer from Late Woodland contexts have
significantly higher δ13Csc values than modern deer (Dunnett T3, p=0.014). These results
are not believed to reflect maize consumption by archaeological deer. First, there is no
correlation between δ13Ccol and δ13Csc values as would be expected from published
literature (Froele et al. 2010, 2012; Harrison and Katzenberg 2003; Kellner and
Schoeninger 2007) and modern deer from this study (Figure 4.16). Second, the mean
∆13Csc–col value (11.63±1.99‰) is unexpectedly large, relative to both the modern deer in
this study and published data for ungulates (Kellner and Scheoninger 2007; Krueger and
Sullivan 1984; Lee–Thorp et al. 1989) (Table 4.14).
Western Basin deer had a higher mean ∆13Csc–col value (12.25±2.41‰) than Ontario
Iroquoian deer (11.22±2.04), but the difference was not significant (Table 4.14). A more
detailed analysis of the Late Woodland time period by phase (Table 4.15) reveals that the
Middle Ontario Iroquoian phase deer (A.D. 1200–1450) had the highest ∆13Csc–col value
(13.59±1.08‰) of any Iroquoian group, significantly higher than Neutral (A.D. 1450–
1650) deer (δ13Csc = 10.60±1.13‰, Table 1.18, Dunnett T3, p=0.004).
The bulk structural carbon isotopic results and the results of the bulk bone collagen are
contradictory; δ13Ccol values indicate none of the archeological deer were consuming
maize while the δ13Csc values indicate all archaeological deer were consuming maize.
Three hypotheses are proposed to explain these apparently contradictory results: (1) a
specialized diet that alters the expected ∆13Csc–col, (2) a species-specific difference in
susceptibility to diagenesis, or (3) taphonomic alteration of the bone resulting from
boiling. Metabolic or physiological differences between modern and archaeological deer
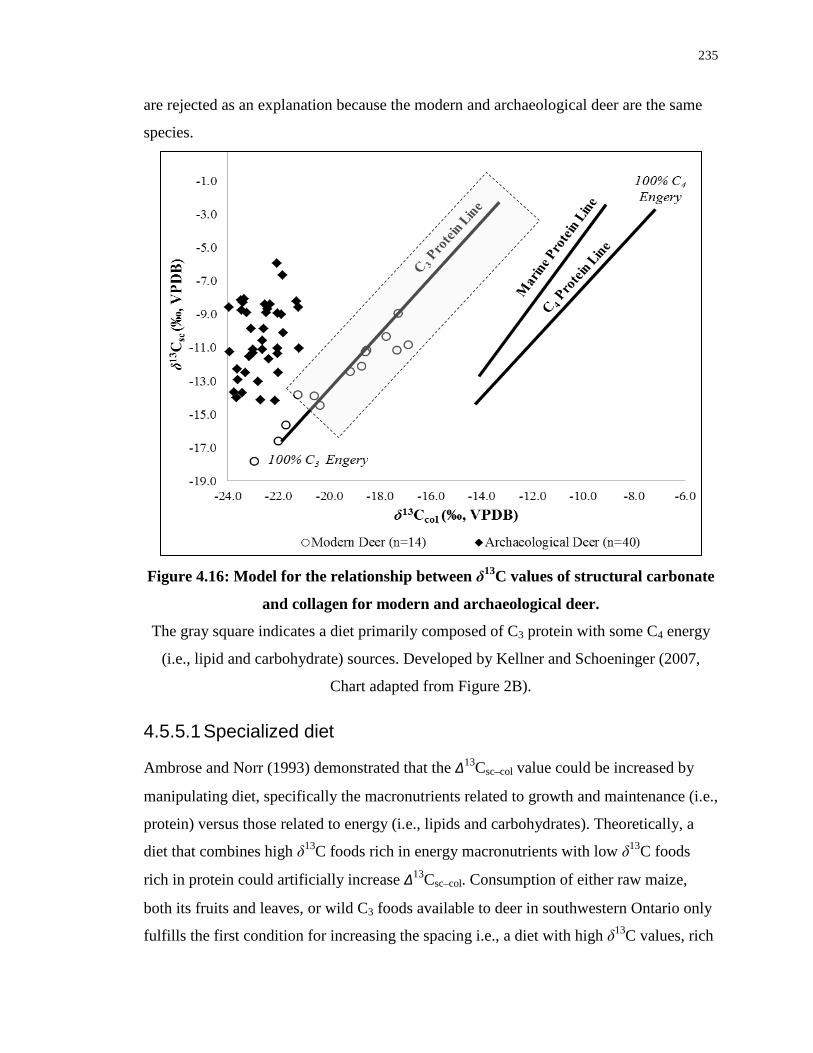
235
are rejected as an explanation because the modern and archaeological deer are the same
species.
Figure 4.16: Model for the relationship between δ13C values of structural carbonate
and collagen for modern and archaeological deer.
The gray square indicates a diet primarily composed of C3 protein with some C4 energy
(i.e., lipid and carbohydrate) sources. Developed by Kellner and Schoeninger (2007,
Chart adapted from Figure 2B).
4.5.5.1 Specialized diet
Ambrose and Norr (1993) demonstrated that the ∆13Csc–col value could be increased by
manipulating diet, specifically the macronutrients related to growth and maintenance (i.e.,
protein) versus those related to energy (i.e., lipids and carbohydrates). Theoretically, a
diet that combines high δ13C foods rich in energy macronutrients with low δ13C foods
rich in protein could artificially increase ∆13Csc–col. Consumption of either raw maize,
both its fruits and leaves, or wild C3 foods available to deer in southwestern Ontario only
fulfills the first condition for increasing the spacing i.e., a diet with high δ13C values, rich

236
in carbohydrates and lipids but very low in protein. As modern deer do not display the
large ∆13Csc–col value of archaeological deer, a differential macronutrient routing model
would not likely explain the different spacing. Furthermore, the archaeological deer do
not fit anywhere among the expected relationships of macronutrients in major dietary
groups, whereas modern deer follow the expected pattern for C3 protein consumption and
variable C4 access for free-ranging herbivores. For example, based on the calculations of
Kellner and Schoeninger (2007, Figure 2: 1122), using the following models, where x =
δ13Ccol values and y = expected δ13Csc values:
C3 protein diet y=1.74x+21.4 [Equation 4.1]
C4 protein diet y=1.71x +10.6 [Equation 4.2]
the expected ∆13Csc–col value for the archaeological deer eating an exclusively C3 diet
would be 4.58±0.57‰ (Figure 4.17). The predicted ∆13Csc–col value for the archaeological
deer eating a diet with a C4 component resulted in the impossible situation of predicted
structural carbonate values being more negative than their collagen values.
4.5.5.2 Post-mortem alteration
The idea of an inherent, species-specific susceptibility to diagenesis seems unlikely in the
case of deer, as there is no evidence that deer exhibit any differences in their tissue
preservation relative to other large bodied mammals. In order to evaluate whether a post-
mortem alteration pattern specific to deer could explain the results, the δ13Ccol and δ13Csc
values for all animals from this study were re-considered. Although some sites produced
higher or lower collagen yields, all of the other animals from those sites shared similar
collagen yields and similar Δ13Csc–col values. The archaeological deer examined in this
study appear to have distinct Δ 13Csc–col values relative to other Ontario animals, including
humans (Harrison and Katzenberg 2003), dogs, turkeys, raccoons, and bears (this study)
(Figure 4.18 –raccoons, dogs, and bears not displayed in figure). Only deer exhibit an
unusually large Δ 13Csc–col relationship (12.19±2.10, range=7.95 to 16.09). Because no
statistical patterns were noted by element (i.e., mandibles vs. long bones), age of
individual (adult vs. juvenile), site or burial contexts, the idea of a post-mortem alteration
pattern specific to deer is rejected.

237
Figure 4.17: Predicted δ13Ccol and δ13Csc relationship based on Kellner and Schoeinger’s model (2007, Chart adapted from
Figure 2B) for C3-only (grey diamond) and C4 (white diamond) protein diets.
238
Figure 4.18: Comparison of δ13Csc and δ13Ccol values for modern and archaeological Ontario white-tailed deer, modern
Ontario wild turkeys (this study) and southwestern Ontario archaeological humans (Harrison and Katzenberg 2003).
The gray square indicates range of values with a predicted C4 component to the diet. The gray dashed line indicates the relationship
between δ13Csc and δ13Ccol values for modern deer.
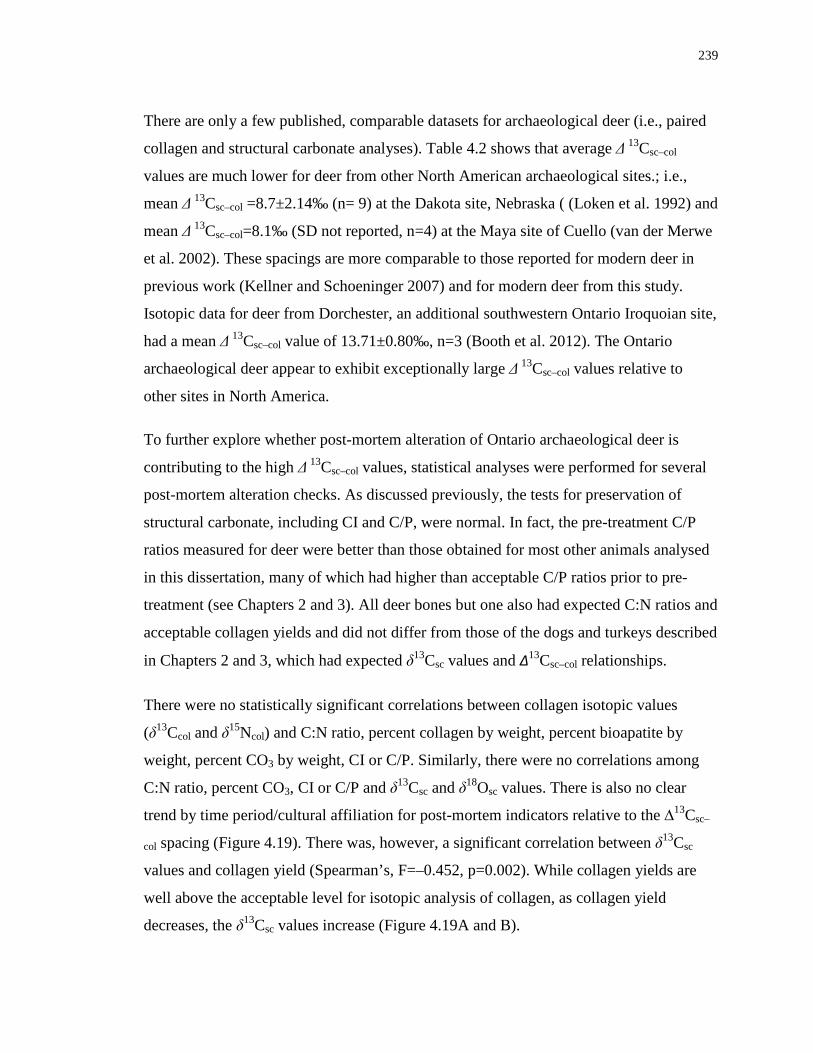
239
There are only a few published, comparable datasets for archaeological deer (i.e., paired
collagen and structural carbonate analyses). Table 4.2 shows that average Δ 13Csc–col
values are much lower for deer from other North American archaeological sites.; i.e.,
mean Δ 13Csc–col =8.7±2.14‰ (n= 9) at the Dakota site, Nebraska ( (Loken et al. 1992) and
mean Δ 13Csc–col=8.1‰ (SD not reported, n=4) at the Maya site of Cuello (van der Merwe
et al. 2002). These spacings are more comparable to those reported for modern deer in
previous work (Kellner and Schoeninger 2007) and for modern deer from this study.
Isotopic data for deer from Dorchester, an additional southwestern Ontario Iroquoian site,
had a mean Δ 13Csc–col value of 13.71±0.80‰, n=3 (Booth et al. 2012). The Ontario
archaeological deer appear to exhibit exceptionally large Δ 13Csc–col values relative to
other sites in North America.
To further explore whether post-mortem alteration of Ontario archaeological deer is
contributing to the high Δ 13Csc–col values, statistical analyses were performed for several
post-mortem alteration checks. As discussed previously, the tests for preservation of
structural carbonate, including CI and C/P, were normal. In fact, the pre-treatment C/P
ratios measured for deer were better than those obtained for most other animals analysed
in this dissertation, many of which had higher than acceptable C/P ratios prior to pre-
treatment (see Chapters 2 and 3). All deer bones but one also had expected C:N ratios and
acceptable collagen yields and did not differ from those of the dogs and turkeys described
in Chapters 2 and 3, which had expected δ13Csc values and ∆13Csc–col relationships.
There were no statistically significant correlations between collagen isotopic values
(δ13Ccol and δ15Ncol) and C:N ratio, percent collagen by weight, percent bioapatite by
weight, percent CO3 by weight, CI or C/P. Similarly, there were no correlations among
C:N ratio, percent CO3, CI or C/P and δ13Csc and δ18Osc values. There is also no clear
trend by time period/cultural affiliation for post-mortem indicators relative to the ∆13Csc–
col spacing (Figure 4.19). There was, however, a significant correlation between δ13Csc
values and collagen yield (Spearman’s, F=–0.452, p=0.002). While collagen yields are
well above the acceptable level for isotopic analysis of collagen, as collagen yield
decreases, the δ13Csc values increase (Figure 4.19A and B).
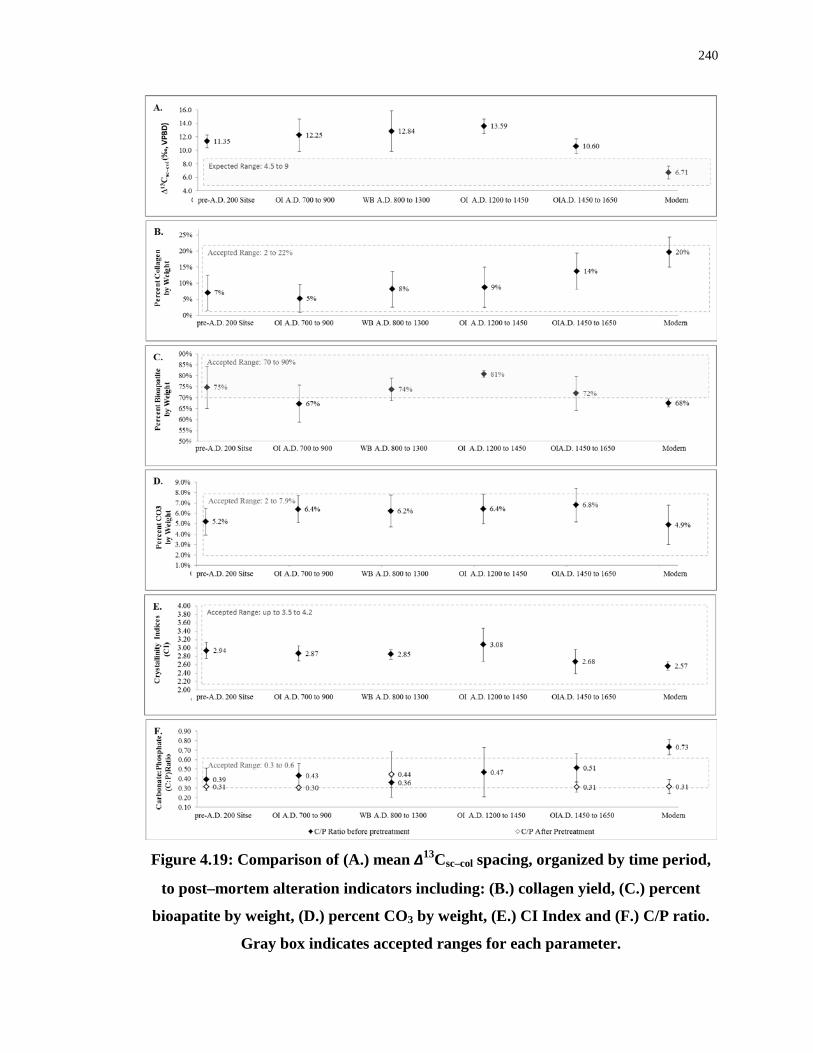
240
Figure 4.19: Comparison of (A.) mean ∆13Csc–col spacing, organized by time period,
to post–mortem alteration indicators including: (B.) collagen yield, (C.) percent
bioapatite by weight, (D.) percent CO3 by weight, (E.) CI Index and (F.) C/P ratio.
Gray box indicates accepted ranges for each parameter.
241
Further exploration reveals that there are also statistically significant differences in
collagen yield (ANOVA, F=8.434, p=0.000) by sub-group of archaeological deer.
Western Basin deer had the lowest yield (5.3±4.3%) relative to those from Ontario
Iroquoian (11.1±6.3%) and pre-maize (7.1±5.4%) sites. Within the Ontario Iroquoian
sites, there were also statistically significant differences (ANOVA, F=8.343, p=0.001) by
time period, with Neutral deer having higher yields (13.96±5.70%) than the Princess
Point/Early Ontario Iroquoian (7.93±5.14%) and Middle Ontario Iroquoian (8.21±5.37%)
deer. While the δ13Ccol values are not related to collagen yield, the δ13Csc values are. The
δ13Csc and Δ13Csc–col values mirror the collagen yield pattern, with the highest δ13Csc and
∆13Csc–col values found at Western Basin sites (1100 to 600 years old) and Middle Ontario
Iroquoian sites (750 to 500 years old).
Diagenetic alteration of the structural carbonate of the bone over time can explain the low
collagen yield at early sites (i.e., pre-A.D 200) and in specific burial conditions (i.e.,
Western Basin and Middle Ontario Iroquoian sites), and the higher than expected δ13Csc
values. As collagen is lost due to microbial invasion or other diagenesis-inducing
processes (e.g., regular flushing with water) bone porosity and permeability increases as a
consequence of bioapatite dissolution; this provides an opportunity for precipitation of, or
exchange with, secondary carbonates. Therefore, structural carbonate may become so
altered that it no longer represents its original isotopic composition, unlike collagen,
which generally maintains its isotopic integrity until there is less than 1% remaining.
Environmental carbonates have high δ13C values relative to biological carbonates, which
can result in carbonate carbon isotopic compositions that mimic C4 consumption
(Ketchum et al. 2009; Kovda et al. 2006).
While the link between collagen yield and increasing δ13Csc values, and therefore Δ 13Csc–
col, can be explained by post-mortem alteration due to dissolution, it does not explain: (1)
why only the deer bone at these sites are affected, (2) why the diagenesis checks (CI and
C/P) are not registering alteration, and (3) how the post–mortem conditions at Western
Basin and Middle Ontario Iroquoian sites differ from other sites. The specificity of this
pattern could suggest cultural intervention, i.e., differential treatment of deer bones at
242
certain sites, during processing, cooking and/or discard of the deer, resulting in this
specific pattern.
4.5.5.3 Post-mortem processing of deer
The way in which deer are processed may hold the key to understanding the unusual
pattern of post-mortem alteration seen here. There is ample evidence that, during the time
periods of this study, meats were cooked before consumption. Although burn marks
indicative of roasting were noted on turkey and canid bones, they were not found on any
of the deer processed in this study. The cooking of deer may therefore, have been done by
boiling. The stewing of meat is mentioned throughout ethnohistoric accounts (Thwaites
1896-1901 37:108; Peale 1872 see also Tooker 1991:68;70;73 and Fenton 1953). For
example, Sagard (Wrong 1939:111) recounts “if it’s deer they say Gagenon Youry, and
so with other kinds of food, naming the kind or the materials in the kettle one after
another.” The preferential boiling of deer, in general, could explain the higher δ13Csc
values.
Although laboratory experiments on conventional boiling of deer bone (i.e., less than 8
hours) did not alter its isotopic composition or FTIR patterns, it did increase porosity
(and permeability) (Roberts et al. 2002). Increased porosity should make bone more
susceptible to post-burial diagenesis, which should be reflected in the CI and C/P ratios.
The alteration of CI and C/P ratios is not seen here, possibly indicating post-mortem
alteration, but not post-burial alteration (i.e., the bones were altered due to the boiling,
not the burial). The previously reported boiling experiments all used distilled laboratory
water (i.e., water with no dissolved inorganic carbon [DIC]) without any added
ingredients such as one would expect in a stew. If ancient Ontario people were boiling
deer in local waters along with maize (i.e., making of saagamite), there could have been
fractionation and exchange between the water and bone. The predisposition of carbonates
to precipitate under boiling conditions with the added presence of dissolved inorganic
carbon (DIC) in river or lake water could have also changed the isotopic composition of
the bones. The δ13C values for DIC in river water (Grand and Thames Rivers) in
southwestern Ontario is estimated to be between –11 to –8‰ (Yang et al. 1996), which
could cause the high δ13Csc values and unusual δ13Csc–col spacing.
243
There are several reasons that deer may have been boiled. Low meat yield elements, such
as the mandibles and foot bones that dominate the analysed samples, may have been
boiled to extract marrow or grease. Foreman (2011) found evidence of grease extraction
at Western Basin sites where there was extensive fragmentation of deer long bones.
Church and Lyman (2003) argue that it was not necessary to pulverize bone to extract
grease, but it was necessary to break the bones and boil them for approximately 2 to 3
hours. The majority of the mandibles analysed in this study were also broken (n=18,
90%), though not extensively fragmented. Although there are some differences in long
bone fragmentation between Ontario Iroquoian and Western Basin sites (Foreman 2011),
the mandibles used in this study were similarly broken with similar ranges in δ13Csc
values. If low marrow/grease yielding parts of the deer are being boiled, extraction of
grease or marrow may not have been the only reason for boiling deer elements. It should
also be considered that since mandibles and foot bones were purposefully selected
because they are readily identifiable as white-tailed deer, this may have inadvertently
resulted in biased results if these elements were treated differently because of their low
meat yield.
Ideology may also have played a role in the apparent special processing of deer. It was
not uncommon for whole skulls of animals, including bears, dogs, and deer to be boiled
for feasting events (Fenton 1953), which might suggest that all the deer mandibles
recovered were associated with feasting activity. However, other animals analysed in this
study, including bears and dogs, do not show similar ∆13Csc–col patterns.
Alternately, feasting activities might also have included the production of flesh-free
animal parts (particularly skulls). References to animal skulls, specifically antlered
animals, appear in the mythology of the Great Lakes. Descriptions of wendigos, for
example, include terrifying imagery of a skeletal giant (from an Anishinâbe story,
Johnston 2011:122): “The Weendigo was gaunt to the point of emaciation, its desiccated
skin pulled tautly over its bones. With its bones pushing out against its skin, its
complexion the ash gray of death, and its eyes pushed back deep into their sockets, the
Weendigo looked like a gaunt skeleton recently disinterred” In creating tableaux or other
forms of dramatization, the “mask”-like appearance of animal skulls may have been

244
coveted in rituals. Exploration of ritual site skulls should be investigated for unusual
δ13Ccol and δ13Csc relationships that could be explained by boiling animals skulls as part of
ceremonial feasts or tableaus.
Another probable explanation for the specific boiling of deer skulls would be to access
and liquefy the deer brains for tanning hides, a process known as brain-tanning. The most
important and most commonly tanned animal hide in Ontario was without question the
white-tail deer hide. According to Peale’s (1872:330) observations in North America,
“[t]he material used for the preparation of the skins is principally the brains of the
animal from which they were taken.” Baillargeon (2005:149) describes the most
“common recipe” for tanning among First Nations cultures throughout North America is
the incorporation of brains, possibly with fat from marrow and/or liver, boiled in water.
Baillargeon (2005:1480-9) further notes that animal brains were important in the tanning
process because they may have been considered restorative and transformative; “The
transformation that takes place in hide tanning centers around the belief that the soul or
power (energy) of the animal resides in the brain… The use of the animal's own brain in
the tanning process would be essential to bring about revival and the restoration of
power/life.”
Lewis H. Morgan recounts a story heard during his mid-1800’s travels among the
Iroquois, explaining the discovery of brain-tanning: “A stiff deer skin was one day
walking around from house to house through an Indian village, frightening everyone it
visited. At last it went to the house of a man who was boiling deer's brains [to induce] a
vomit. He did not propose to be frightened by this mysterious skin out of his house, and
therefore he poured the hot water solution of deer's brains upon the stiff skin which at
once softened it down, took away from it all power of motion, and flattened it to the floor.
The people in fright had been shooting it with arrows. After it was softened they began to
pull it and thus resulted the tanned deer skins.”
Richter and Dettloff (2002:307), in an experimental study recreating Midwestern
Woodland brain-tanning as described at European contact, found that each deer’s brain
was sufficient to tan its hide, an expression repeated in much of the modern, tanning
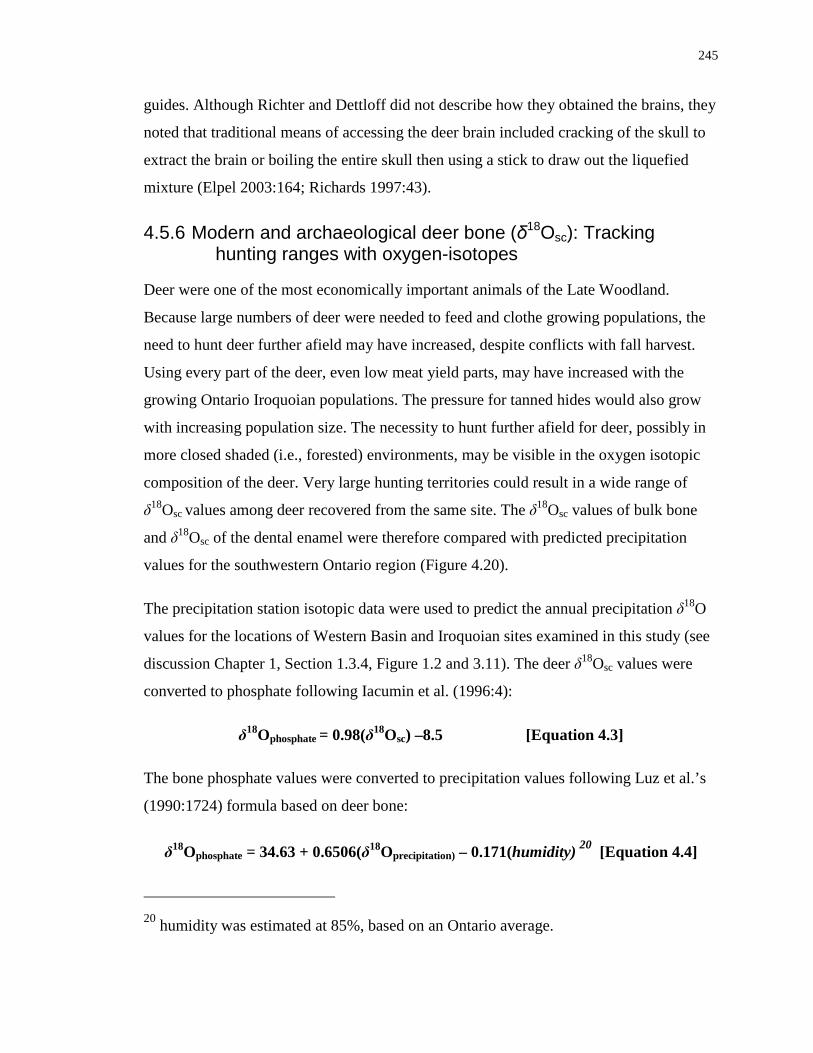
245
guides. Although Richter and Dettloff did not describe how they obtained the brains, they
noted that traditional means of accessing the deer brain included cracking of the skull to
extract the brain or boiling the entire skull then using a stick to draw out the liquefied
mixture (Elpel 2003:164; Richards 1997:43).
4.5.6 Modern and archaeological deer bone (δ18Osc): Tracking hunting ranges with oxygen-isotopes
Deer were one of the most economically important animals of the Late Woodland.
Because large numbers of deer were needed to feed and clothe growing populations, the
need to hunt deer further afield may have increased, despite conflicts with fall harvest.
Using every part of the deer, even low meat yield parts, may have increased with the
growing Ontario Iroquoian populations. The pressure for tanned hides would also grow
with increasing population size. The necessity to hunt further afield for deer, possibly in
more closed shaded (i.e., forested) environments, may be visible in the oxygen isotopic
composition of the deer. Very large hunting territories could result in a wide range of
δ18Osc values among deer recovered from the same site. The δ18Osc values of bulk bone
and δ18Osc of the dental enamel were therefore compared with predicted precipitation
values for the southwestern Ontario region (Figure 4.20).
The precipitation station isotopic data were used to predict the annual precipitation δ18O
values for the locations of Western Basin and Iroquoian sites examined in this study (see
discussion Chapter 1, Section 1.3.4, Figure 1.2 and 3.11). The deer δ18Osc values were
converted to phosphate following Iacumin et al. (1996:4):
δ18Ophosphate = 0.98(δ18Osc) –8.5 [Equation 4.3]
The bone phosphate values were converted to precipitation values following Luz et al.’s
(1990:1724) formula based on deer bone:
δ18Ophosphate = 34.63 + 0.6506(δ18Oprecipitation) – 0.171(humidity) 20 [Equation 4.4]
20 humidity was estimated at 85%, based on an Ontario average.
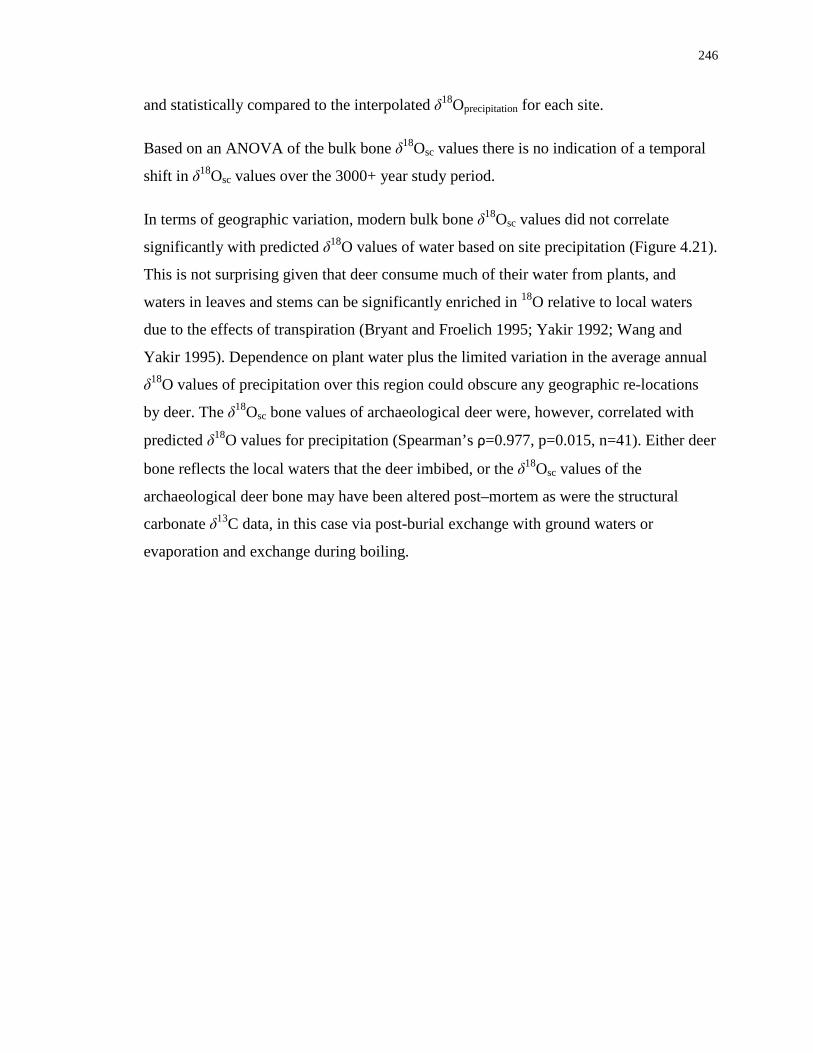
246
and statistically compared to the interpolated δ18Oprecipitation for each site.
Based on an ANOVA of the bulk bone δ18Osc values there is no indication of a temporal
shift in δ18Osc values over the 3000+ year study period.
In terms of geographic variation, modern bulk bone δ18Osc values did not correlate
significantly with predicted δ18O values of water based on site precipitation (Figure 4.21).
This is not surprising given that deer consume much of their water from plants, and
waters in leaves and stems can be significantly enriched in 18O relative to local waters
due to the effects of transpiration (Bryant and Froelich 1995; Yakir 1992; Wang and
Yakir 1995). Dependence on plant water plus the limited variation in the average annual
δ18O values of precipitation over this region could obscure any geographic re-locations
by deer. The δ18Osc bone values of archaeological deer were, however, correlated with
predicted δ18O values for precipitation (Spearman’s ρ=0.977, p=0.015, n=41). Either deer
bone reflects the local waters that the deer imbibed, or the δ18Osc values of the
archaeological deer bone may have been altered post–mortem as were the structural
carbonate δ13C data, in this case via post-burial exchange with ground waters or
evaporation and exchange during boiling.
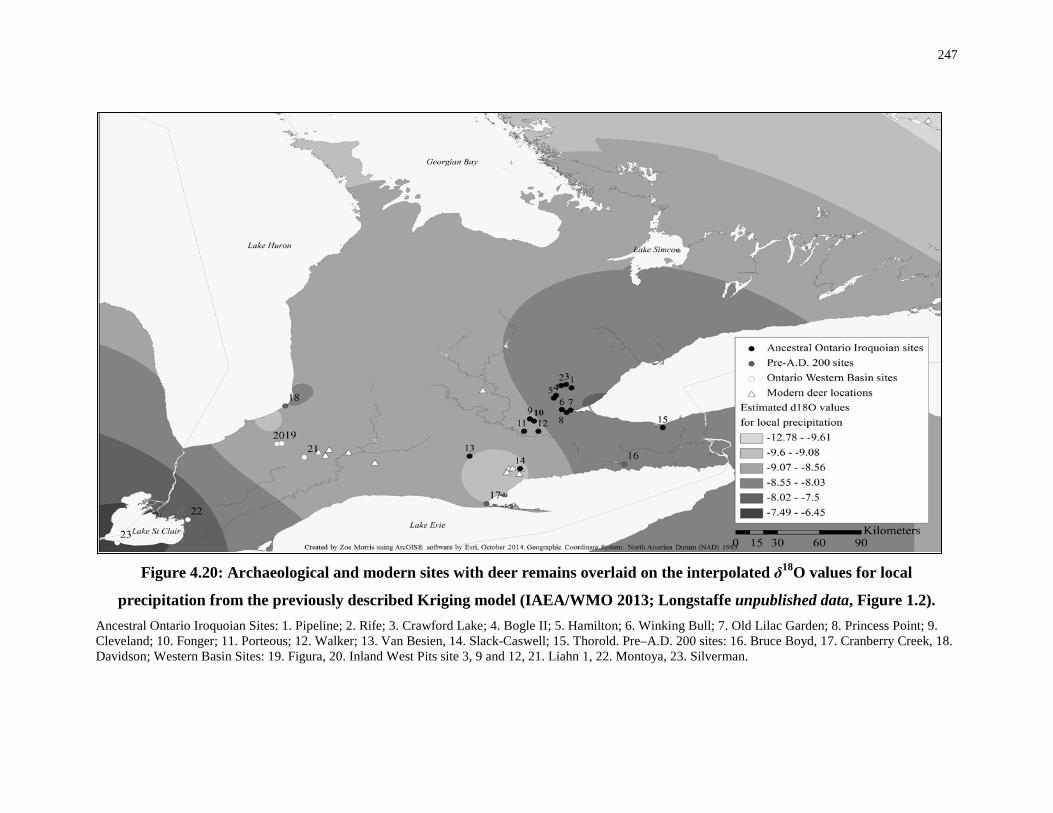
247
Figure 4.20: Archaeological and modern sites with deer remains overlaid on the interpolated δ18O values for local
precipitation from the previously described Kriging model (IAEA/WMO 2013; Longstaffe unpublished data, Figure 1.2). Ancestral Ontario Iroquoian Sites: 1. Pipeline; 2. Rife; 3. Crawford Lake; 4. Bogle II; 5. Hamilton; 6. Winking Bull; 7. Old Lilac Garden; 8. Princess Point; 9. Cleveland; 10. Fonger; 11. Porteous; 12. Walker; 13. Van Besien, 14. Slack-Caswell; 15. Thorold. Pre–A.D. 200 sites: 16. Bruce Boyd, 17. Cranberry Creek, 18. Davidson; Western Basin Sites: 19. Figura, 20. Inland West Pits site 3, 9 and 12, 21. Liahn 1, 22. Montoya, 23. Silverman.
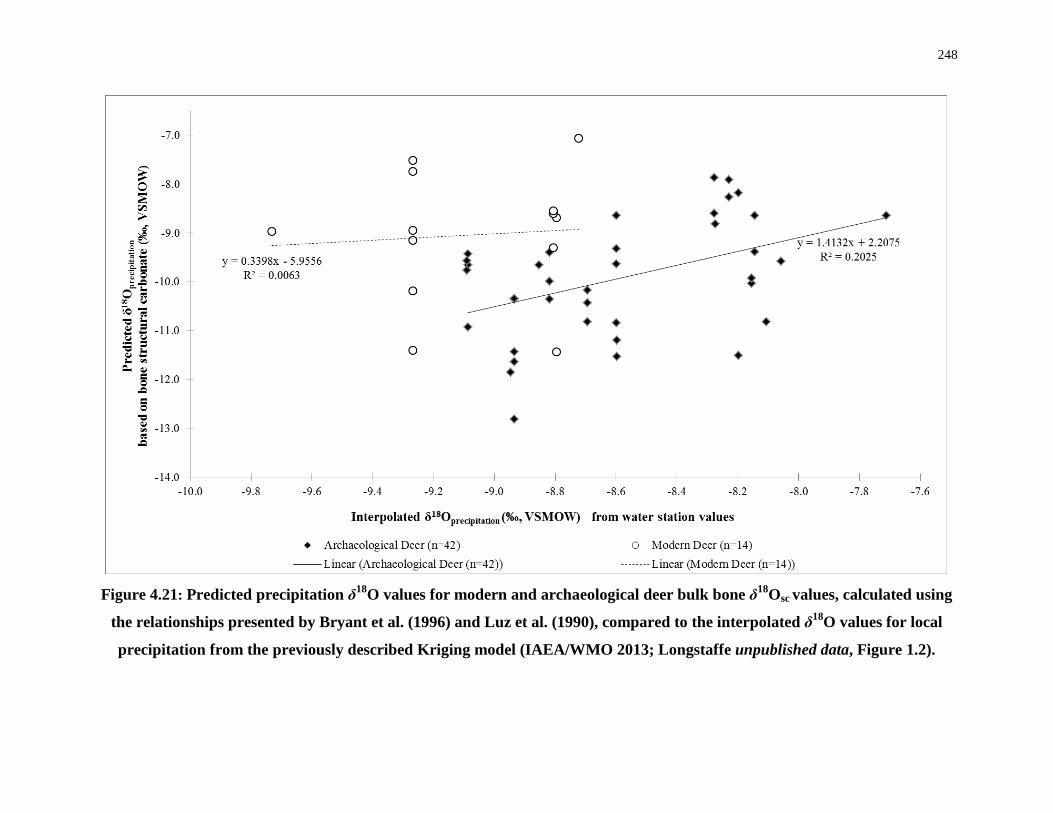
248
Figure 4.21: Predicted precipitation δ18O values for modern and archaeological deer bulk bone δ18Osc values, calculated using
the relationships presented by Bryant et al. (1996) and Luz et al. (1990), compared to the interpolated δ18O values for local
precipitation from the previously described Kriging model (IAEA/WMO 2013; Longstaffe unpublished data, Figure 1.2).
249
In order to explore this possibility in more detail, the deer bones were examined by time
period, as older bones are more likely to have been altered. Examination of individual
subsets of bone based on time period and culture reveals that pre-maize bones are highly,
negatively correlated with their predicted δ18Osc values (Spearman’s ρ= –0.877, p=0.022).
By comparison, the Late Woodland (post-A.D. 900) bones were positively correlated
with predicted δ18Osc values, though only Western Basin deer bulk bone is significantly
correlated (ρ=0.770, p=0.003). In other words, at Late Woodland sites, increasing δ18Osc
bone values are correlated with increasing interpolated δ18Oprecipitation values, and
significantly so at Western Basin sites. As discussed previously, Western Basin deer
appear to have been more heavily targeted for grease extraction (Foreman 2011). If these
bones were boiled extensively, as hypothesized based on the δ13Csc results, the δ18Osc
values may also have been altered towards local waters near sites used for boiling, as
opposed to local waters imbibed by the deer. Unfortunately, these data make it difficult to
use bulk bone structural carbonate isotopic data as a geographic proxy for the deer during
life and, therefore, should not be considered a reliable indicator of hunting territories of
Late Woodland people. The positive correlation between predicted and actual δ18Osc
values may in fact lend support to the hypothesis that Late Woodland peoples were
extensively boiling these low–meat yield parts. Whether boiling was done for grease
extraction, hide-tanning, or other culturally specific practices still needs further study.
The mean δ18Osc value for all serial sections of enamel for one individual should
represent a first-year average and the bone δ18Osc value should represent a lifetime
average. Indeed, the mean enamel δ18Osc values do not correlate significantly with
corresponding bone isotopic compositions. For nine deer, the mean enamel δ18Osc value
average is higher than bone (+1.35±0.81‰) (Table 4.22). The difference could be due to
a trophic level effect in the first molar as its enamel was forming partly in utero and
during breast-feeding, which is consistent with observations that δ18Osc values may be
high for breastfeeding juveniles relative to females within the same population (White et
al. 2004a; Williams et al. 2005; Wright and Schwarz 1998). The difference might also
reflect routing differences to these tissues, wherein enamel structural carbonate has δ18Osc
values that are 1.7‰ higher than those of bone (Warinner and Tuross 2009).
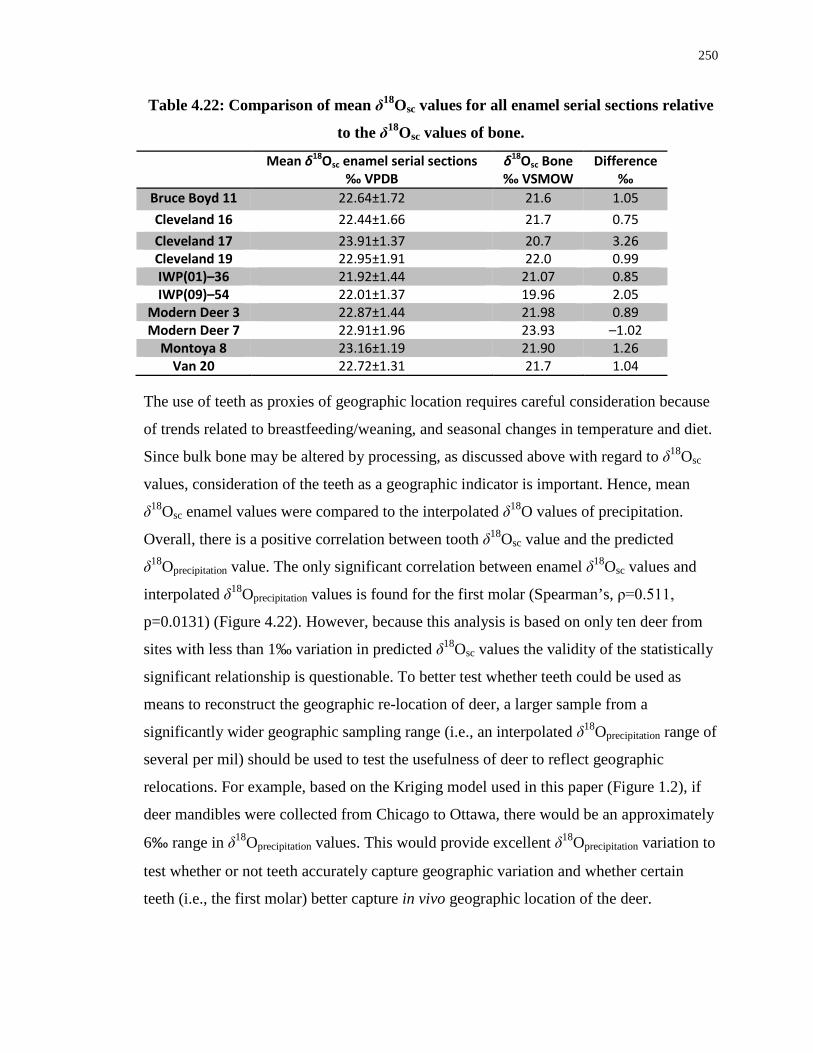
250
Table 4.22: Comparison of mean δ18Osc values for all enamel serial sections relative
to the δ18Osc values of bone.
Mean δ18Osc enamel serial sections ‰ VPDB
δ18Osc Bone ‰ VSMOW
Difference ‰
Bruce Boyd 11 22.64±1.72 21.6 1.05 Cleveland 16 22.44±1.66 21.7 0.75 Cleveland 17 23.91±1.37 20.7 3.26 Cleveland 19 22.95±1.91 22.0 0.99 IWP(01)–36 21.92±1.44 21.07 0.85 IWP(09)–54 22.01±1.37 19.96 2.05
Modern Deer 3 22.87±1.44 21.98 0.89 Modern Deer 7 22.91±1.96 23.93 –1.02
Montoya 8 23.16±1.19 21.90 1.26 Van 20 22.72±1.31 21.7 1.04
The use of teeth as proxies of geographic location requires careful consideration because
of trends related to breastfeeding/weaning, and seasonal changes in temperature and diet.
Since bulk bone may be altered by processing, as discussed above with regard to δ18Osc
values, consideration of the teeth as a geographic indicator is important. Hence, mean
δ18Osc enamel values were compared to the interpolated δ18O values of precipitation.
Overall, there is a positive correlation between tooth δ18Osc value and the predicted
δ18Oprecipitation value. The only significant correlation between enamel δ18Osc values and
interpolated δ18Oprecipitation values is found for the first molar (Spearman’s, ρ=0.511,
p=0.0131) (Figure 4.22). However, because this analysis is based on only ten deer from
sites with less than 1‰ variation in predicted δ18Osc values the validity of the statistically
significant relationship is questionable. To better test whether teeth could be used as
means to reconstruct the geographic re-location of deer, a larger sample from a
significantly wider geographic sampling range (i.e., an interpolated δ18Oprecipitation range of
several per mil) should be used to test the usefulness of deer to reflect geographic
relocations. For example, based on the Kriging model used in this paper (Figure 1.2), if
deer mandibles were collected from Chicago to Ottawa, there would be an approximately
6‰ range in δ18Oprecipitation values. This would provide excellent δ18Oprecipitation variation to
test whether or not teeth accurately capture geographic variation and whether certain
teeth (i.e., the first molar) better capture in vivo geographic location of the deer.
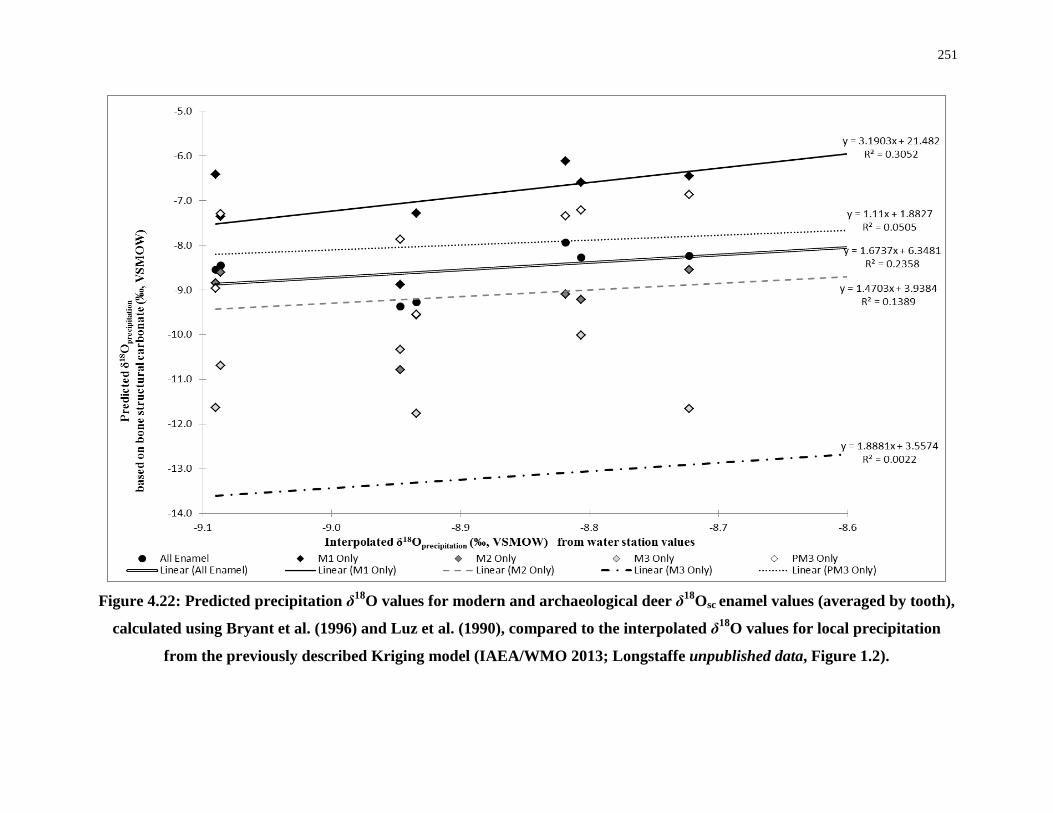
251
Figure 4.22: Predicted precipitation δ18O values for modern and archaeological deer δ18Osc enamel values (averaged by tooth),
calculated using Bryant et al. (1996) and Luz et al. (1990), compared to the interpolated δ18O values for local precipitation
from the previously described Kriging model (IAEA/WMO 2013; Longstaffe unpublished data, Figure 1.2).
252
4.6 Conclusion By calibrating radiographic information on deer tooth mineralization with the enamel
δ18Osc values it was possible to determine the season of formation for each tooth, and
therefore access dietary information at a more detailed level. For example, the serial
section data for both modern and archaeological deer provided evidence for a shift from
breast-feeding to a plant-based diet within two months of birth.
Collagen and structural carbonate carbon isotopic data suggest that modern deer in
southwestern Ontario consumed maize but in spite of the fact that they were living and
eating in a region of almost unlimited access to maize, their bulk bone δ13Ccol values
suggest relatively low quantities of C4 consumption (~15%). The two modern deer whose
teeth were serially sectioned began eating maize during cooler months and reduced their
maize consumption in the spring, contrary to expectations that they would be consuming
maize during the spring and summer. It is hypothesized that the decreased metabolic
activity of deer during colder months inhibits the winter consumption of maize from
being reflected in bone. Additionally, predation of maize leaves, which have lower mean
δ13C values, may not alter bone chemistry to the same degree as consumption of grain.
The carbon isotopic composition of bulk bone collagen from white-tailed deer cannot be
used as proxy for landscape change in Ontario as it does not appear to be sensitive
enough to detect small dietary changes, such as the occasional inclusion of maize leaves.
The δ13Ccol and δ15Ncol data confirm that archaeological deer from southwestern Ontario
sites spanning 3000 years (Archaic through to the Late Woodland contact periods) were
consistently consuming plant material from a C3 only environment, and that they were
not supplementing their diet by browsing in maize fields. This conclusion is supported by
the serial sampling of teeth from an additional eight archaeological deer that provided
detailed foraging history for the first year of life. Not only were deer not consuming
maize but, according to previous work, their low δ13Ccol values may be indicate a
temperate “canopy” effect (Cormie and Schwarcz 1994; Bonafini et al. 2013), i.e., they
were browsing in forested areas away from open fields, perhaps to avoid human
predation. The hypothesis that deer were being hunted at a distance from the villages
253
because of human population growth was unsupported by the δ18Osc values and requires
further investigation. The expected patterning was obscured by low variability in the
oxygen isotopic composition of precipitation across southwestern Ontario, the fact that
deer receive much of their water from plant leaves, which is enriched in 18O due to
transpiration, and relatively small sample size. Although the δ18Osc values of
archaeological deer were correlated with the δ18Oprecipitation values, these data are
interpreted as evidence of post-mortem exchange with local waters from either boiling of
the bones in local waters or post-burial alteration.
Although maize consumption is suggested by the bulk bone δ13Csc values of the
archaeological deer, the contradiction between δ13Ccol and δ13Csc data, the predisposition
of structural carbonate to post-mortem isotopic alteration, and the unusually high Δ13Csc–
col values, have led to the conclusion that, despite apparently normal FTIR values, the
δ13Csc values of bone are unreliable because of post-mortem alteration of the structural
carbonate. Boiling is hypothesized to explain: (1) large Δ13Csc–col values, (2), the
correlation between high δ13Csc values and lower collagen yield, and (3) “normal” FTIR
results. Boiling in river water or the production of sagamite may have caused
replacement of the original structural carbonate in the bioapatite structure by new
structural carbonate. The purposeful selection of mandibles and foot bones to ensure
identification of the white-tailed deer may have inadvertently resulted in biased results, as
these specific elements may have been treated differently because they have low meat
yield. There are several practical reasons for boiling deer remains, which may include
extraction of grease or marrow (particularly for low meat yield elements), facilitation of
sinew removal, and extraction of marrow and brains for tanning of hides. There may also
have been ideological reasons, such as the use of deer in specific ritual or feasting events,
wherein presentation of a de-fleshed skull was central. Future work will be needed to test
the boiling hypothesis by ascertaining the degree to which carbon and oxygen isotopic
exchange takes place between bone structural carbonate and water during the boiling
process. Testing this hypothesis may provide a new avenue for using isotopic
investigations to understand the relationship between humans and animals; before death
(i.e., what foods the animal ate in life), at death (i.e., season of hunting), and after death
(i.e., why deer were processed differently than all other animals analysed in this study).
254
References Cited Ambrose S.H. 2002. Controlled diet and climate experiments on nitrogen isotope ratios
of rats. In: Ambrose, S.H., Katzenberg, M.A. (Eds.) Biogeochemical approaches to paleodietary analysis, Springer, New York, pp. 243–259.
Ambrose S.H, Norr L. 1992. On stable isotopic data and prehistoric subsistence in the Soconusco region. Current Anthropology 33(4), 401–404.
Ambrose S.H, Norr L. 1993. Experimental evidence for the relationship of the carbon isotope ratios of whole diet and dietary protein to those of bone collagen and carbonate, in: Lambert J., Grupe, G., (Eds), Prehistoric human bone: archaeology at the molecular level. Springer–Verlag, Berlin, pp. 1–37.
Armstrong E., Euler D., Racey G., 1983. Winter bed–site selection by white-tailed deer in central Ontario. The Journal of Wildlife Management, 47(3), 880–884.
Arnold D.A., Torgerson O., 1980. Preface, in: Hine, R.H., Nehls, S., (Eds.) White-tailed deer Population Management in the North Central States: Proceeding of the 41st Midwest Fish and Wildlife Conference, North Central Section of the Wildlife Society, pp. 3.
Baillargeon, M., 2005. Hide Tanning: The Act of Reviving. In: Frink, L., Weedman, K. (Eds.) Gender and Hide Production, AltaMira Press, Walnut Creek, pp. 143–152.
Balasse, M., 2002. Reconstructing dietary and environmental history from enamel isotopic analysis: time resolution of intra‐tooth sequential sampling. International Journal of Osteoarchaeology, 12(3), 155–165.
Balasse, M., Smith, A. B., Ambrose, S. H., Leigh, S.R., 2003. Determining sheep birth seasonality by analysis of tooth enamel oxygen isotope ratios: the Late Stone Age site of Kasteelberg (South Africa). Journal of Archaeological Science, 30(2), 205–215.
Ballard, W., 2011. Predator–prey relationships. In: Hewitt, D.G. (Ed.) Biology and management of white-tailed deer. CRC Press, Boca Raton, pp. 251–286.
Bergh, S. G., 2012. Subsistence, settlement, and land–use changes during the Mississippian period on St. Catherines Island, Georgia. [Unpublished Ph.D. thesis]. University of Georgia, Athens, GA.
Berner, R. A., 1980. Early diagenesis: A theoretical approach (No. 1). Princeton University Press, Princeton.
Bligh, E. G., Dyer, W. J, 1959. A rapid method of total lipid extraction and purification. Canadian journal of biochemistry and physiology, 37(8), 911–917.
255
Bocherens, H., Drucker, D. 2003. Trophic level isotopic enrichment of carbon and nitrogen in bone collagen: Case studies from recent and ancient terrestrial ecosystems. International Journal of Osteoarchaeology. 13:46–53.
Bolstad, P.V., Gragson, T.L., 2008. Resource abundance constraints on the early post–contact Cherokee population, Journal of Archaeological Science, 35, 563–576
Bonafini M., Pellegrini, M., Ditchfield P., Pollard, A.M. 2013. Investigations of the 'canopy effect' in the isotope ecology of temperature woodlands. Journal of Archaeological Science 4:3926–3935.
Booth, L., C. D. White, F.J. Longstaffe, L. Hodgetts and Z. H. Morris (2012) An isotopic analysis of faunal remains from suspected ritual deposits on Ontario Iroquoian Tradition sites. Published abstract of the 77th Annual Meeting of the Society for American Archaeology, Memphis N, April 18–22.
Boutton, T.W., P.D. Klein, M.J. Lynott, J.E. Price and L.L. Tieszen (1984) Stable Carbon Isotope Ratios as Indicators of Prehistoric Human Diet. In Stable Isotopes in Nutrition, J.R. Turnland and P.E. Johnson (eds). Pp.191–204.
Johnston, B. 2011. Weendigo. In: Brehm, V. (Ed.), Star Songs and Water Spirits: A Great Lakes Native Reader. Ladyslipper Press, Tustin, MI.
Brittingham, M.C., Tzilkowski, W.M., Zeidler, J.M., Lovallo M.J. 1997. Wildlife Damage to Agricultural Crops in Pennsylvania: The Farmers’ Perspective. Proceedings of the Eighth Eastern Wildlife Damage Management Conference. Paper 5, pp. 84–93.
Bryant, J.D., Froelich, P.N., 1995. A model of oxygen isotope fractionation in body water of large mammals. Geochimica et Cosmochimica Acta, 59(21), 4523–4537.
Bryant, J.D., Koch, P.L. Froelich, P.N., Shower, W.J., Genna, BJ., 1996.Oxygen isotope partitioning between phosphate and carbonate in mammalian apatite. Geochimica et Cosmochimica Acta, 60(24), 5145–5148.
Cappella K. 2005. Ontario’s First Farmers? Investigations into Princess Point and the Introduction of Horticulture to Ontario. [Unpublished Ph.D. thesis]. Peterborough: Trent University.
Cerling, T.E. and Harris, J.M., 1999. Carbon isotope fractionation between diet and bioapatite in ungulate mammals and implications for ecological and paleoecological studies. Oecologia, 120(3): 347–363.
Chisholm, B. S., Nelson, D. E., Schwarcz, H. P., 1982. Stable–carbon isotope ratios as a measure of marine versus terrestrial protein in ancient diets. Science, 216(4550), 1131–1132.
256
Church, Robert R. and R. Lee Lyman (2003) Small fragments make small differences in efficiency when rendering grease from fractured artiodactyl bones by boiling. Journal of Archaeological Sciences 30, 1077–1084.
Collins, M. J., C. M. Nielsen–Marsh, J. Hiller, C. I. Smith, J. P. Roberts, R. V. Prigodich, T. J. Wess, J. Csapo, A. R. Millard, and G. Turner–Walker (2002) The survival of organic matter in bone: a review. Archaeometry 44(3), 383–394.
Conover, Michael R. and Daniel J. Decker (1989) Wildlife Damage to Drops: Perceptions of agricultural and wildlife professionals in 1957 and 1987. Wildlife Society Bulletin. 1991(1), 46–52.
Coplen, T.B. 1996., New guidelines for reporting stable hydrogen, carbon, and oxygen isotope–ratio data. Geochimica et Cosmochimica Acta. 60, 3359–3360.
Coplen, T. B., 2011. Guidelines and recommended terms for expression of stable‐isotope‐ratio and gas‐ratio measurement results. Rapid Communications in Mass Spectrometry, 25(17), 2538–2560.
Coplen, T.B., Brand, W.A., Gehre, M., Gröning, Meijer, H.A., Toman B., Verkouteren, R.M., 2006. New guidelines for δ13C measurements. Analytical Chemistry 78, 2439–2441.
Cormie, A. B., Schwarcz, H.P., 1994. Stable isotopes of nitrogen and carbon of North American white-tailed deer and implications for paleodietary and other food web studies. Palaeogeography, Palaeoclimatology, Palaeoecology. 107, 227–241.
Craven, S. R., Hygnstrom, S. E. 1994. Deer. The Handbook: Prevention and Control of Wildlife Damage, University of Nebraska, Lincoln, 47, 25–40.
Crawford, G.W., Saunders, D., Smith, D.G., 2006. Pre–Contact Maize from Ontario, Canada: Context, chronology, variation, and plant association. In: Staller, J., Tykot, R., Benz, B. (Eds.). Histories of maize: multidisciplinary approaches to the prehistory, linguistics, biogeography, domestication, and evolution of maize. Left Coast Press, Walnut Creek, pp. 549–559.
Crawford, G.W., Smith, D.G., Bowyer, V.E., 1997. Dating the entry of corn (Zea mays) into the lower Great Lakes region. American Antiquity 62(1), 112–119.
Creed, W.A., Haberland, F.P. 1980. Deer herd management – Putting it all together. In: Hine, R.L., Nehls, S. (Eds), White-tailed deer population management in the north ventral states. Proceeding of the 41st Midwest Fish and Wildlife Conference, North Central Section of the Wildlife Society. Pp. 83–88.
Curtis, M.E., 1952. The black bear and white-tailed deer as potent factors in the folklore of the Menomini Indians, Midwest Folklore 2(3), 177–190.

257
Dansu, A.J., 1994. A Cache of Bighorn Sheep and Deer Skulls from Northeastern Nevada. Nevada Archaeologist, 12, 5–13.
Davis, H. S., Mead, A. J., 2013. Enamel hypoplasia as an indicator of nutritional stress in juvenile white-tailed deer. Georgia Journal of Science, 71(2), 95–101.
DeNiro, M.J., 1985. Postmortem preservation and alteration of in vivo bone collagen isotope ratios in relation to palaeodietary reconstruction. Nature 317, 806–809.
DeNiro, M.J., Schoeninger, M.J., Hastorf, C.A. 1985. Effect of heating on the stable carbon and nitrogen isotope ratios of bone collagen. Journal of Archaeological Science, 12, 1–7.
Deniz, E., Payne, S., 1982. Eruption and wear in the mandibular dentition as a guide to ageing Turkish Angora Goats. In: B. Wilson, C.Grigson and S. Payne (Eds.). Ageing and Sexing Animal Bones from Archaeological Sites. BAR British Series 109, pp. 155–206.
Dewar, G., Ginter, J.K., Shook, B.A.S., Ferris, N., Henderson, H., 2010. A bioarchaeoloigcal study of a Western Basin Tradition cemetery on the Detroit River. Journal of Archaeological Science 37, 2245–2254.
Dirks, W., R. L. Anemone, P. A. Holroyd, D. J. Reid, and P. Walton (2009) Phylogeny, life history and the timing of molar crown formation in two archaic ungulates, Meniscotherium and Phenacodus (Mammalia,‘Condylarthra’). In: Koppe, T., Meyer, G., Alt, K.W. (Eds). Comparative Dental Morphology: Frontiers of Oral Biology Volume 13. Karger: Basal, Switzerland, pp. 3–8.
Divljan, A., Parry–Jones, K., Wardle, G.M., 2006. Age determination in the grey headed flying fox. The Journal of Wildlife Management, 70(2), 607–611.
Dobbyn, J.S., Eger, J., Wilson, N. 1994. Atlas of the Mammals of Ontario. Federation of Ontario Naturalists, Toronto.
Drucker, D. G., Bocherens, H. 2009. Carbon stable isotopes of mammal bones as tracers of canopy development and habitat use intemperate and boreal contexts. In: Creighton, J.D. Roney, P.J. (Eds.), Forest Canopies: Forest Production, Ecosystem Health, and Climate Conditions Nova Science Publishers, Inc., New York, pp. 103–109.
Elpel, T.J.. 2003. Primitive Living, Self–Sufficiency, and Survival Skills. House and Home. The Globe Pequot Press, Guilford.
Emery, K. F., Wright, L.E., Schwarcz, H.P. 2000 Isotopic analysis of ancient deer bone: Biotic stability in collapse period Maya land–use. Journal of Archaeological Science, 27(6), 537–550.
258
Fenton, W.N., 1953. The Iroquois Eagle Dance: An offshoot of the Calumet Dance. United States Government Printing Office: Washington.
Flannery, K.V. 1966. The postglacial "re–adaptation" as viewed from Mesoamerica. American Antiquity 31(6), 800–805.
Foreman, L., 2011. Seasonal subsistence in Late Woodland southwestern Ontario: An examination of the relationship between resource availability, maize agriculture, and faunal procurement and processing strategies. [Unpublished Ph.D. thesis]. The University of Western Ontario, London.
Froehle, A.W., Kellner, C.M., Schoeninger, M.J., 2010. Effect of diet and protein source on carbon stable isotope ratios in collagen: follow up to Warinner and Tuross (2009). Journal of Archaeological Science, 37,2662–2670.
Froehle, A.W., Kellner, C.M., Schoeninger, M.J., 2012. Multivariate carbon and nitrogenstable isotope model for the reconstruction of prehistoric human diet. American Journal of Physical Anthropology, 147, 352–369.
Frost, H. M., 1969. Tetracycline–based histological analysis of bone remodeling. Calcified Tissue International, 3(1), 211–237.
Gabrey, S., Vohs, P., Pease, J., 1991. Managing Iowa Wildlife: Wild Turkeys. Iowa State University, University Extension, Ames, pp. 1–8.
Garant, P. R., 2003. Oral cells and tissues. Quintessence Publishing Company, Hanover Park, IL.
Gee, K.L., Porter, M.D., Demarais, S., Bryant, F.C., Van Vreede, G., 1991. White-tailed deer: Their Foods and Management in the Cross Timbers, 2nd Edition. Samuel Roberts Nobel Foundation, Ardmore, OK.
Gee, K.L., Holman, J.H., Causey, M.K., Rossi, A.N., Armstrong, J.B., 2002. Aging white-tailed deer by tooth replacement and wear: a critical evaluation of a time–honored technique. Wildlife Society Bulletin. 30(2), 387–393.
Gerry, J. P., 1997. Bone isotope ratios and their bearing on elite privilege among the Classic Maya. Geoarchaeology, 12(1), 41–69.
Gilbert, F.F., 1966. Aging white-tailed deer by annuli in the cementum of the first incisor. The Journal of Wildlife Management. 30(1), 200–202.
Gilbert, F.F., Stolt, S.L., 1970. Variability in aging Maine white-tailed deer by tooth–wear characteristics. The Journal of Wildlife Management 34(3), 532–535.
Gramly, R.M., 1977. Deer skins and hunting territories: Competition for a scarce resource of the Northeastern Woodlands. American Antiquity. 42(4), 601–605.

259
Groepper, S. R., Hygnstrom, S. E., Houck, B., Vantassel, S. M., 2013. Real and Perceived Damage by Wild Turkeys: A Literature Review. Journal of Integrated Pest Management, 4(1), A1–A5.
Hamblin, N. L., 1984. Animal use by the Cozumel Maya. University of Arizona Press, Tuscon.
Hamlin, K. L., Pac, D. F., Sime, C. A., DeSimone, R. M., Dusek, G. L., 2000. Evaluating the accuracy of ages obtained by two methods for Montana ungulates. The Journal of Wildlife Management 441–449.
Harrison, R. G., Katzenberg, M. A., 2003. Paleodiet studies using stable carbon isotopes from none apatite and Collagen: Examples from Southern Ontario and San Nicolas Island, California. Journal of Anthropological Archaeology, 22, 227–244.
Hedges, R. E., 2002. Bone diagenesis: an overview of processes. Archaeometry, 44(3), 319–328.
Hedges, R. E., Clement, J.G., Thomas, C.D.L., O'Connell, T. C., 2007. Collagen turnover in the adult femoral mid‐shaft: Modeled from anthropogenic radiocarbon tracer measurements. American Journal of Physical Anthropology, 133(2), 808–816.
Hedges, R. E., Millard A.R., 1995. Bones and groundwater: towards the modelling of diagenetic processes. Journal of Archaeological Science, 22(2), 155–164.
Hedman, K. M., Curry, B. B., Johnson, T. M., Fullagar, P. D., Emerson, T. E., 2009. Variation in strontium isotope ratios of archaeological fauna in the Midwestern United States: a preliminary study. Journal of Archaeological Science, 36(1), 64–73.
Hesselton, W.T., Hesselton, R.M., 1982 White-tailed deer: Odocoileus virginianus. In: Chapman, J.A., Feldhamer, G.E. (Eds.), Wild Mammals of North America: Biology, Management and Economics. John Hopkins University Press: Baltimore, pp. 878–901.
Hewitt, D.G, 2011. Nutrition. In: Hewitt, D.G. (Ed.) Biology and management of white-tailed deer. CRC Press, Boca Raton, pp. 75–106.
Holter, J. B., Urban, Jr., W. E., Hayes, H. H., Silver, H., 1976. Predicting metabolic rate from telemetered heart rate in white-tailed deer. Journal of Wildlife Management. 40, 626–629.
Kates, M., 1986. Lipid extraction procedures. Techniques of lipidology. Elsevier, Amsterdam.
Katzenberg, M.A., 1989. Stable isotope analysis of archaeological faunal remains from southern Ontario. Journal of Archaeological Science 16, 319–329.
260
Katzenberg, M. A., 2006. Prehistoric maize in southern Ontario. In: Staller, J., Tykot, R., Benz, B. (Eds.). Histories of maize: multidisciplinary approaches to the prehistory, linguistics, biogeography, domestication, and evolution of maize. Left Coast Press, Walnut Creek, pp. 263–273.
Katzenberg, M. A., Schwarcz, H. P., Knyf, M., Melbye, F.J., 1995. Stable isotope evidence for maize horticulture and paleodiet in southern Ontario, Canada. American Antiquity 60, 335–350.
Kay, M., 1974. Dental annuli age determination on white-tailed deer from archaeological sites. The Plains Anthropologist, 224–227.
Kellner, C.M., Schoeninger, M.J., 2007. A simple carbon isotope model for reconstructing prehistoric human diet. American Journal of Physical Anthropology, 133, 1112–1127.
Ketchum, S., Schurr, M., Garniewicz, R., 2009. A test for maize consumption by fauna in Late Prehistoric Eastern North America. North American Archaeologist 30(1), 87–101.
King, C. L., Tayles, N., Gordon, K. C., 2011. Re–examining the chemical evaluation of diagenesis in human bone apatite. Journal of Archaeological Science, 38(9), 2222–2230.
Kjær, L. J., Schauber, E. M., Nielsen, C. K.,2008. Spatial and Temporal Analysis of Contact Rates in Female White‐Tailed Deer. The Journal of Wildlife Management, 72(8), 1819–1825.
Klein, R.G., Wolf, C., Freeman, L.G., Allwarden, K., 1981. The use of dental crown heights for constructing age profiles of red deer and similar species in archaeological samples. Journal of Archaeological Science, 8(1), 1–31.
Knight, J.E., 2001. Determining the Age of a Deer. Montana State University Extension Services MT200107 AG, Bozeman.
Knoche, S., Lupi, F., 2012. The economic value of publicly accessible deer hunting land. The Journal of Wildlife Management. 76(3), 462–470.
Koch, P. L., Tuross, N., Fogel, M. L., 1997. The effects of sample treatment and diagenesis on the isotopic integrity of carbonate in biogenic hydroxylapatite. Journal of Archaeological Science, 24(5), 417–429.
Kolodny, Y., Luz, B., Navon, O., 1983. Oxygen isotope variations in phosphate of biogenic apatites, I. Fish bone apatite—rechecking the rules of the game. Earth and Planetary Science Letters, 64(3), 398–404.
261
Kovda, I., Mora, C. I., Wilding, L. P., 2006. Stable isotope compositions of pedogenic carbonates and soil organic matter in a temperate climate Vertisol with gilgai, southern Russia. Geoderma, 136(1), 423–435.
Krueger, H. W., Sullivan, C. H., 1984. Models for carbon isotope fractionation between diet and bone, In: Turnland, J.R., Johnson, P.E. (Eds.), Stable isotopes in nutrition, pp. 205–220.
Larson, T. E., Longstaffe, F. J., 2007. Deciphering seasonal variations in the diet and drinking water of modern White‐Tailed deer by in situ analysis of osteons in cortical bone. Journal of Geophysical Research: Biogeosciences, 12, G04003..
Lee–Thorp, J.A., 1989. Stable carbon isotopes in deep time. The diets of fossil fauna and hominids. [Unpublished Ph.D. thesis]. University of Cape Town, Cape Town.
Lee–Thorp, J., Sealy, J.C., van der Merwe, N.J., 1989. Stable carbon isotope ratio differences between bone collagen and bone apatite, and their relationship to diet. Journal of Archaeological Science, 16, 585–599.
Lee–Thorp, J., Sponheimer, M., 2003. Three case studies used to reassess the reliability of fossil bone and enamel isotope signals for paleodietary studies. Journal of Anthropological Archaeology, 22, 208–216.
Lee–Thorp, J. L., Van Der Merwe, N. J., 1987. Carbon isotope analysis of fossil bone apatite. South African Journal of Science, 83, 712–715.
LeGeros, R. Z. (1981) Apatites in biological systems. Progress in crystal growth and characterization. In: Pamplin, B. (Ed.), Inorganic biological crystal growth, progress in crystal growth, and characterization, volume 4. Pergamon Press, New York, pp.1–45.
Linde, A., and Goldberg, M. (1993) Dentinogenesis. Critical Reviews in Oral Biology and Medicine, 4(5), 679–728.
Lockard, G. R., 1972. Further studies of dental annuli for aging white-tailed deer. The Journal of Wildlife Management, 46–55.
Loken, B., Rothenburger, D., Tieszen, L. L., 1992. Inferences about diets based on delta 13C analysis of collagen and other tissues from modern and early historic mammals. Proceedings of the South Dakota Academy of Science, 71, 85–94.
Longin ,R., 1971. New method of collagen extraction for radiocarbon dating. Nature, 230, 241–242.
Low, W. A., Conwan, M.I., 1963. Age determination of deer by annular structure of dental cementum. The Journal of Wildlife Management 27, 466–471.
262
Luz, B., Cormie, A. B., Schwarcz, H. P., 1990. Oxygen isotope variations in phosphate of deer bones. Geochimica et Cosmochimica Acta, 54(6), 1723–1728.
Madrigal, T. C., Zimmermann–Holt, J., 2002. White-tailed deer meat and marrow return rates and their application to Eastern Woodlands archaeology. American Antiquity, 67(4), 745–59.
Mariotti, A., 1983. Atmospheric nitrogen is a reliable standard for natural 15N abundance measurements. Nature, 303, 685–687.
Martin, S., 2004. Lower Great Lakes Region Maize and Enchainment in the First Millennium AD. Ontario Archaeology, 77(78), 135–159.
Martin, R.B., Burr, D.B., Sharkey, N.A., 1998. Skeletal biology. In: Skeletal tissue mechanics. New York: Springer.
Mathews, Z. P., 1980. Of Man and Beast: The chronology of effigy pipes among Ontario Iroquoians. Ethnohistory, 295–307.
Mautz, W. W., Kanter, J., Perkins, P.L., 1992. Seasonal metabolic rhythms of captive female white-tailed deer: A reexamination. Journal of Wildlife Management 56, 656–661.
McLean, D.D., 1936. The replacement of teeth in deer as a means of age determination. California Fish & Game, 28, 43–44.
McShea, W. J, 2012. Ecology and management of white‐tailed deer in a changing world. Annals of the New York Academy of Sciences, 1249(1), 45–56.
Metcalfe, J. Z., Longstaffe, F. J., White, C. D., 2009. Method–dependent variations in stable isotope results for structural carbonate in bone bioapatite. Journal of Archaeological Science, 36(1), 110–121.
Metcalfe, J. Z., Longstaffe, F. J., 2012. Mammoth tooth enamel growth rates inferred from stable isotope analysis and histology. Quaternary Research, 77(3), 424–432.
Miller, K.V., Muller, L.I, Demarais, S., 2003. White-tailed deer: Odocoileus virginianus. In: Feldhamer, G.A, Thompson, B.C., Chapman, J.A. (Eds.), Wild Mammals of North America: Biology, Management, and Conservation, 2nd Edition. John Hopkins University Press, Baltimore, pp. 906–930.
Munro, K. G., Bowman, J., Fahrig, L., 2012. Effect of paved road density on abundance of white-tailed deer. Wildlife Research, 39(6), 478–487.
Munro, L. E., Longstaffe, F. J., White, C. D., 2007. Burning and boiling of modern deer bone: effects on crystallinity and oxygen isotope composition of bioapatite phosphate. Palaeogeography, Palaeoclimatology, Palaeoecology, 249(1), 90–102.
263
Munro, L. E., Longstaffe, F. J., White, C. D., 2008. Effects of heating on the carbon and oxygen–isotope compositions of structural carbonate in bioapatite from modern deer bone. Palaeogeography, Palaeoclimatology, Palaeoecology, 266(3), 142–150.
Nagy, K. A., 1987. Field metabolic rate and food requirement scaling in mammals and birds. Ecological monographs, 112–128.
Nelson, S. V., 2005. Paleoseasonality inferred from equid teeth and intra–tooth isotopic variability. Palaeogeography, Palaeoclimatology, Palaeoecology, 222(1), 122–144.
Nielsen–Marsh, C. M., Hedges, R. E. 2000. Patterns of diagenesis in bone I: the effects of site environments. Journal of Archaeological Science, 27(12), 1139–1150.
Passey, B. H., Cerling, T. E., 2002. Tooth enamel mineralization in ungulates: implications for recovering a primary isotopic time–series. Geochimica et Cosmochimica Acta, 66(18), 3225–3234.
Payne, S., 1973. Kill–off Patterns in Sheep and Goats: The mandibles from Asvan Kale. Anatolian Studies, 23, 281–303.
Peale, T. R., 1872. On the Uses of the Brain and Marrow of Animals among the Indians of North America, 390–391.
Pfeiffer, S., Williamson, R. F., Sealy, J. C., Smith, D. G., Snow, M. H., 2014. Stable dietary isotopes and mtDNA from Woodland period southern Ontario people: results from a tooth sampling protocol. Journal of Archaeological Science, 42, 334–345.
Pijoan, C., Mansilla, j. Leboreiro, I. Lara, V.H, Bosch, P., 2007. Thermal Alteration in Archaeological Bones. Archaeometry 49(4), 713–727.
Prevec, R., Noble, W. C., 1983. Historic Neutral Iroquois faunal utilization. Ontario Archaeology, 39(41–56).
Pucéat, E., Reynard, B., Lécuyer, C., 2004. Can crystallinity be used to determine the degree of chemical alteration of biogenic apatites?. Chemical Geology, 205(1), 83–97.
Repussard, A., 2009. Stable carbon and oxygen isotopes in bone: Tracing droughts during the Maya era ssing archaeological deer remains. [Unpublished M.A. thesis]. McMaster University, Hamilton.
Richards, M. 1997. Deerskins into Buckskins: How to Tan with Brains, Soap or Eggs; 2nd Edition, Back Country Publishing, Cave Junction, OR.
264
Richter, M., Dettloff, D., 2002. Experiments in Hide Brain–tanning with a Comparative Analysis of Stone and Bone Tools [Unpublished Ph.D. thesis] University of Wisconsin, La Crosse, pp. 301–317.
Rees, J. W., Kainer, R. A., Davis, R. W. 1966. Chronology of mineralization and eruption of mandibular teeth in mule deer. The Journal of Wildlife Management, 629–631.
Ripple, W. J., Beschta, R. L., 2003. Wolf reintroduction, predation risk, and cottonwood recovery in Yellowstone National Park. Forest Ecology and Management, 184(1), 299–313.
Robbins, C.T., Prior, R.L., Moen, A.N., Visek, W.J., 1974. Nitrogen metabolism of white-tailed deer. Journal of Animal Science 38(1), 186–191.
Roberts, S. J., Smith, C. I., Millard, A., Collins, M. J., 2002. The taphonomy of cooked bone: characterizing boiling and its physico–chemical effects. Archaeometry, 44(3), 485–494.
Roseberry, J.L., 1980. Age determination of white-tailed deer in the Midwest: Methods and problems. In: Hine, R.L., Nehls, S. (Eds.) White-tailed deer Population Management in the North Central States: Proceeding of the 41st Midwest Fish and Wildlife Conference, North Central Section of the Wildlife Society, pp. 73–82.
Rosenswig, R. M., 2006. Sedentism and food production in early complex societies of the Soconusco, Mexico. World archaeology, 38(2), 330–355.
Rue, L. L. 2004. The Deer of North America. Lyons Press, Danbury, CT.
Ryel, L.A., Fay, L.D., Van Etten, R.C., 1961. Validity of age determination in Michigan deer. Michigan Academy Science, Arts, and Letters 46, 289–316.
Sanford, M. K., 1993. Understanding the biogenic–diagenetic continuum: Interpreting elemental concentrations of archaeological bone. In: Sandford, M. K. (Ed.) Investigations of Ancient Human Tissue: Chemical Analyses in Anthropology, Gordon and Breach, New York, pp. 3–57.
Santley, R. S., Rose, E. K., 1979). Diet, nutrition and population dynamics in the Basin of Mexico. World archaeology, 11(2), 185–207.
Schoeninger, M. J., DeNiro, M. J., 1982. Carbon isotope ratios of apatite from fossil bone cannot be used to reconstruct diets of animals.
Schoeninger, M. J., Moore, J., Sept, J. M., 1999. Subsistence strategies of two" savanna" chimpanzee populations: The stable isotope evidence. American Journal of Primatology, 49(4), 297–314.

265
Schwarcz, H. P., Melbye, J., Anne Katzenberg, M., Knyf, M., 1985. Stable isotopes in human skeletons of southern Ontario: reconstructing palaeodiet. Journal of Archaeological Science, 12(3), 187–206.
Severinghaus, C. W. 1949. Tooth development and wear as criteria of age in white-tailed deer. The Journal of Wildlife Management, 13, 195–215.
Shemesh, A,1990. Crystallinity and diagenesis of sedimentary apatites. Geochimica et Cosmochimica Acta, 54(9), 2433–2438.
Shemesh, A., Kolodny, Y., Luz, B., 1983. Oxygen isotope variations in phosphate of biogenic apatites, II. Phosphorite rocks. Earth and Planetary Science Letters, 64(3), 405–416.
Sillen, A., 1989. Diagenesis of the inorganic phase of cortical bone. In: Price, T.D. (Ed.), The chemistry of prehistoric human bone, Cambridge University Press, Cambridge, pp. 211–229.
Silver, H., Colovos, N. F. Holter, J. B. Hayes, H. H., 1969. Fasting metabolism of white-tailed deer. Journal of Wildlife Management, 33, 490–498.
Smith, H. L., Verkruysse, P. L., 1983. The white-tailed deer in Ontario. Ministry of Natural Resources, Wildlife Branch.
Spence, M.W., White, C.D., Ferris, N., Longstaffe, F.J., 2010. Treponemal infection in a Western Basin community. KEWA, 8, 1–10.
Spinage, C. A., 1973. A review of the age determination of mammals by means of teeth, with especial reference to Africa. African Journal of Ecology, 11(2), 165–187.
Stallibrass, S., 1982. The use of cement layers for absolute ageing of mammalian teeth: a selective review of the literature, with suggestions for further studies and alternative applications. In: Willson, B. Grigson, C., Payne, S. (Eds.), Ageing and sexing animal bones from archaeological sites, BAR British Archaeological Report Series, 109, 109–126.
Starna, W. A., Relethford, J. H., 1985. Deer Densities and Population Dynamics: A Cautionary Note. American Antiquity, 825–832.
Stewart, F. L., 2000. Variability in Neutral Iroquoian Subsistence, AD 1540–1651. Ontario Archaeology, 69, 92–117.
Stuart–Williams, H. L. Q., Schwarcz, H. P., White, C. D., Spence, M. W., 1996. The isotopic composition and diagenesis of human bone from Teotihuacan and Oaxaca, Mexico. Palaeogeography, Palaeoclimatology, Palaeoecology, 126(1), 1–14.
266
Surovell, T. A., Stiner, M. C., 2001. Standardizing infra–red measures of bone mineral crystallinity: an experimental approach. Journal of Archaeological Science, 28(6), 633–642.
Szpak, P., Orchard, T. J., Gröcke, D. R., 2009. A late holocene vertebrate food web from southern Haida Gwaii (Queen Charlotte Islands, British Columbia). Journal of Archaeological Science, 36(12), 2734–2741.
Taber, R.D., 1971. Criteria for Sex and Age. In: Mosby, H.S. (Ed.), Wildlife investigation techniques, 2nd edition. The Wildlife Society, Virginia, pp. 119–189.
Theler, J. L., Boszhardt, R. F., 2006. Collapse of crucial resources and culture change: A model for the woodland to oneota transformation in the upper midwest. American antiquity, 433–472.Turner, R. Santley, R.S., 1979. Deer Skins and Hunting Territories Reconsidered. American Antiquity, 44(4), 810–816.
Thwaites, R.G. (Ed.). (1896–1901). The Jesuit Relations and Allied Documents: Travels and explorations of the Jesuit missionaries in New France 1610–1791. The Burrows Brothers Co., Cleveland, OH. Website http://puffin.creighton.edu/jesuit/relations/relations_48.html
Tooker, E., 1991. An ethnography of the Huron Indians, 1615–1649 (Vol. 190). Syracuse University Press, Syracuse.
Tzilkowski, W.M., Brittingham, M.C., Lovallo, M.J. 2002. Wildlife Damage to Corn in Pennsylvania: Farmer and On–the–Ground Estimates, The Journal of Wildlife Management, 66(3), 678–682.
van der Merwe, N. J., 1982. Carbon isotopes, photosynthesis, and archaeology: different pathways of photosynthesis cause characteristic changes in carbon isotope ratios that make possible the study of prehistoric human diets. American Scientist, 596–606.
van der Merwe, N. J., Medina, E., 1989. Photosynthesis and 13C/12C ratios in Amazonian rain forests. Geochimica et Cosmochimica Acta, 53, 1091–1094
van der Merwe, N. J., Medina, E., 1991. The canopy effect, carbon isotope ratios and foodwebs in Amazonia. Journal of Archaeological Science, 18(3), 249–259.
Van Der Merwe, N. J., Tykot, R. H., Hammond, N., Oakberg, K., 2002. Diet and animal husbandry of the Preclassic Maya at Cuello, Belize: Isotopic and zooarchaeological evidence. In: Ambrose, S.H., Katzenberg, M.A. (Eds.) Biogeochemical approaches to paleodietary analysis, Springer, New York, pp. 23–38.
van der Merwe, N. J., Williamson, R. F., Pfeiffer, S., Thomas, S. C., Allegretto, K. O., 2003. The Moatfield ossuary: Isotopic dietary analysis of an Iroquoian
267
community, using dental tissue. Journal of Anthropological Archaeology, 22(3), 245–261.
van Klinken, G. J., 1999. Bone collagen quality indicators for palaeodietary and radiocarbon measurements. Journal of Archaeological Science, 26(6), 687–695.
VerCauteren, K. C., Anderson, C. W., Van Deelen, T. R., Drake, D., Walter, W. D., Vantassel, S. M., Hygnstrom, S. E., 2011. Regulated commercial harvest to manage overabundant white‐tailed deer: An idea to consider? Wildlife Society Bulletin, 35(3), 185–194.
Von Endt, D. W., Ortner, D. J., 1984. Experimental effects of bone size and temperature on bone diagenesis. Journal of Archaeological Science, 11(3), 247–253.
Wang, X. F., Yakir, D., 1995. Temporal and spatial variations in the oxygen‐18 content of leaf water in different plant species. Plant, Cell & Environment, 18(12), 1377–1385.
Wang, Y. and T.E. Cerling (1994) A model of fossil tooth and bone diagenesis: implications for paleodiet reconstruction from stable isotopes. Palaeogeography, Palaeoclimatology, Palaeoecology, 107(3), 281–289.
Warinner, C., Tuross, N., 2009. Alkaline cooking and stable isotope tissue–diet spacing in swine: archaeological implications. Journal of Archaeological Science, 36(8), 1690–1697.
Warrick, G., 2000. The precontact Iroquoian occupation of southern Ontario. Journal of World Prehistory, 14(4), 415–466.
Watts, C. M., White, C. D., Longstaffe, F. J., 2011. Childhood diet and Western Basin tradition foodways at the Krieger site, southwestern Ontario, Canada. American Antiquity, 76(3), 446–472.
Webster, G.S., 1979. Deer hides and tribal confederacies: An appraisal of Gramly's hypothesis, American Antiquity, 44(4), pp. 816–820.
Weiner, S., Bar–Yosef, O., 1990. States of preservation of bones from prehistoric sites in the Near East: a survey. Journal of Archaeological Science, 17(2), 187–196.
White, C.D., 2004. Stable isotopes and the human–animal interface in Maya biosocial and environmental systems. Archaeofauna 13, 183–198.
White, C. D., Healy, P. F., Schwarcz, H. P., 1993. Intensive agriculture, social status, and Maya diet at Pacbitun, Belize. Journal of Anthropological Research, 347–375.
White, C.D., Longstaffe, F. J., Law, K. R., 2004a. Exploring the effects of environment, physiology and diet on oxygen isotope ratios in ancient Nubian bones and teeth. Journal of Archaeological Science, 31(2), 233–250.

268
White, C. D., Pohl, M. E., Schwarcz, H. P., Longstaffe, F. J., 2001. Isotopic evidence for Maya patterns of deer and dog use at Preclassic Colha. Journal of Archaeological Science, 28(1), 89–107.
White, C. D., Pohl, M. D., Schwarcz, H. P., Longstaffe, F. J., 2004b. Deer and Dog Diets at Lagartero, Tikal, and Copán. In. Emery, K.F. (Ed.), Maya zooarchaeology: New directions in method and theory, The Cotsen Institute of Archaeology Press, Los Angeles, pp.141–158.
White, C. D., Schwarcz, H. P., 1989. Ancient Maya diet: as inferred from isotopic and elemental analysis of human bone. Journal of Archaeological Science, 16(5), 451–474.
Whittington, S. L., Reed, D. M., 2006. Commoner diet at Copán: Insights from stable isotopes and porotic hyperostosis. In: Whittington, S. L., Reed, D. M. (Eds.), Bones of the Maya: studies of ancient skeletons. University of Alabama Press.
Williams, J. S., White, C. D., Longstaffe, F. J., 2005. Trophic level and macronutrient shift effects associated with the weaning process in the Postclassic Maya. American Journal of Physical Anthropology, 128(4), 781–790.
Wolverton, S., 2008. Harvest pressure and environmental carrying capacity: An ordinal–scale model of effects on ungulate prey. American Antiquity 73(2), 179–199.
Wolverton, S., Nagaoka, L., Densmore, J., Fullerton, B., 2008. White-tailed deer harvest pressure and within–bone nutrient exploitation during the mid–to late Holocene in southeast Texas. Before Farming, 2(3), 1–23.
Wright, L. E., Schwarcz, H. P., 1996. Infrared and isotopic evidence for diagenesis of bone apatite at Dos Pilas, Guatemala: palaeodietary implications. Journal of Archaeological Science, 23(6), 933–944.
Wright, L. E., Schwarcz, H. P., 1998. Stable carbon and oxygen isotopes in human tooth enamel: identifying breastfeeding and weaning in prehistory. American Journal of Physical Anthropology, 106(1), 1–18.
Wrong, G. M. (Ed.), 1939. Sagard: The Long Journey to the Country of the Hurons. Toronto: The Champlain Society.
Yakir, D. (1992). Variations in the natural abundance of oxygen‐18 and deuterium in plant carbohydrates. Plant, Cell & Environment, 15(9), 1005–1020.
Wang, Y., Cerling, T. E., 1994. A model of fossil tooth and bone diagenesis: implications for paleodiet reconstruction from stable isotopes. Palaeogeography, Palaeoclimatology, Palaeoecology, 107(3), 281–289.
Yakir, D., 1992. Variations in the natural abundance of oxygen‐18 and deuterium in plant carbohydrates. Plant, Cell & Environment, 15(9), 1005–1020.

269
Yang, C., Telmer, K., Veizer, J., 1996. Chemical dynamics of the "St. Lawrence" riverine system: δDH2O, δ18
H2O, δ13DIC, δ34Ssulfate and dissolved 87Sr/86Sr. Geochimica et
Cosmochimica Acta, 60, 851–866.
Zimmermann–Holt, J., 1996. Beyond optimization: Alternative ways of examining animal exploitation, Zooarchaeology: New Approaches and Theory, 28(1), 89–109.
270
Chapter 5
5 Conclusion
This thesis investigated the human-altered landscapes, hunting patterns, dietary
preferences, and post-mortem animal processing methods of Late Woodland Ontario
Iroquoian and Western Basin peoples using isotopic analysis of organic and mineral
phases of various animal tissues. Carbon-, nitrogen- and oxygen-isotope analyses of
modern and archaeological animal tissue were used to reconstruct dietary patterns and in
vivo geographic location histories of animals recovered from archaeological sites. Long
term (from bone) and short term (from serial sections of enamel) diets were compared to
reconstruct seasonal access to maize and maize products. The main conclusions of the
research are summarized in the following sections along with the contributions of this
research to isotopic zooarchaeology and Great Lakes archaeology. Finally, future
research directions are considered.
5.1 Research summary This research examined how isotopic analyses of faunal remains can be used
interpretatively with other lines of evidence, such as burial context, state of the remains,
ethnohistory, mythology and zooarchaeology, to understand human-animal relationships.
Particular interest was taken in human-animal ecologies related to subsistence
behaviours, landscape use and change, and how the cultural meaning of dogs, deer and
turkeys affected their treatment in life, at death, and even in the post-mortem processing
of their remains.
A detailed examination of the role of domestic dogs from both Ontario Iroquoian and
Western Basin sites revealed dietary parallels between humans and their canine
companions, confirming the validity of using dogs from Ontario as proxies for human
diets for both groups. Consequently, this research has significantly expanded our
knowledge of human paleodiets at many sites without doing destructive analyses on
human remains. Dogs from both Western Basin and Ontario Iroquoian sites clearly
demonstrate the introduction and expansion of maize-dependent horticulturalism.
Differences in protein source between the two traditions were also observed. Western
271
Basin dogs were eating at a higher trophic level than Ontario Iroquoian dogs, most likely
because they were eating more freshwater fish. This difference in subsistence choices
between the two cultural traditions may be related to geographic variation in resource
exploitation and further evidence suggests that Western Basin peoples relocated to
riverine and lacustrine resources during the year (Foreman 2011; Murphy and Ferris
1990).
Analyses of the Late Woodland Ontario Iroquoian dogs (A.D. 950 to 1650) provided
nuanced differences by geographic region. Dogs from centrally located sites in the Grand
River displayed an unexpected pattern, i.e., they consumed more maize during the Middle
Ontario time period than during the later Neutral period. Several hypothesis were put
forth to explain this shift, including; a peak in ceremonialism that involved more dog
sacrifices during the Middle Ontario Iroquoian period, a shift in the types of freshwater
fish consumed by humans (and therefore accessible to dogs), and individual variation in
the treatment of dogs, possibly due to a general shift in the economic and spiritual role of
Iroquoian dogs as population size and sedentism increased.
Western Basin sites consistently lack wild canids (i.e., foxes and wolves). The variation
between the two neighbouring traditions in species presence in faunal assemblages and
species access to maize suggests different hunting strategies. Isotopic analyses of the
faunal tissue, paired with burial context and previous zooarchaeological research, has
provided information on the hunting season (i.e., cold weather) and location of death (i.e.,
near or in maize fields). Analyses of raccoons, squirrels, wild turkeys, and foxes from
Ontario Iroquoian sites consistently suggested that these animals were able to access
maize and/or maize products from fields/middens from the Middle Ontario Iroquoian
stage onward. Western Basin raccoons from faunal assemblages may have had access to
maize, but the wild turkeys from Western Basin sites were clearly not accessing maize,
and therefore were likely feeding in denser forested areas away from open fields.
Seasonal dietary analyses inferred from age-at-death further indicate that Western Basin
turkey hunting took place in cold weather away from summer maize fields. These data
support the current understanding that Western Basin people used a different seasonal
272
subsistence strategy than the Ontario Iroquoian people despite the parallel expansion of
maize dependency in both groups.
The data indicating maize consumption by wild turkeys at Ontario Iroquoian sites
(despite the fact turkeys are not known crop pests [Greene et al 2010; Groepper et al
2013; Tefft et al 2005) is unexpected, and interpreted as evidence of purposeful food
provisioning to create a winter hunting ground during colder months. This practice is not
recognized elsewhere in Woodland archaeology, and may be evidence of a stage in the
spectrum of human-animal relationships that could have led to domestication. A result of
the relationship between humans and turkeys seems to be the opportunistic hunting of
other predatory species, such as foxes, in the same fields.
The lack of maize consumption by large canids (i.e., wolves), white-tailed deer, and
Western Basin turkeys was also informative. The diets of these animals were strictly
based on C3 foods, so they may have been exploiting a deep forest environment (Cerling
and Harris 1999; Bonafini et al. 2013; Druker and Bocherons 2009). In the case of
wolves, this pattern is not unexpected (Pimlott et al. 1967), but for deer and turkeys, who
are known field edge browsers (Hecklau et al. 1982; Loken et al.1992), these findings
were surprising and may suggest human hunting strategies that altered the behavior of the
animals.
The white-tailed deer data are very intriguing, as deer recovered from both groups are not
consuming maize despite the fact modern deer in Ontario are known crop pests
(Hesselton and Hesselton 1982; Hewitt 2011). In fact, the δ13Ccol values of many of the
deer from both Western Basin and Ontario Iroquoian sites suggest a canopy-effect, i.e.,
consumption of forest foods. As human populations increased in size and density, there
would have been more demand for meat and skins, driving deer further from human
settlements (Gramly 1977, Katzenberg 1989, Ketchum et al. 2009; Prevec and Noble
1983; Stewart 2000; Turner and Stantley 1979).
The δ18O values of bones were used to determine whether it was possible to build a
geographic profile of the animals’ movement in life. These values were compared to
expected δ18O values of local precipitation for Ontario Iroquoian and Western Basin sites
273
using modern water station data from across the region (IAEA/WMO 2013; Longstaffe
unpublished data). The low variability of δ18O values of local precipitation in this region
unfortunately inhibited the usefulness of this measure, and the variability of water
sources (i.e., streams, plant waters, evaporated puddles etc.) likely used by the animals
further confounded interpretation. Oxygen isotope analysis was, however, useful for the
wild canids whose δ18O values definitively correlated with those of local waters, and
deer, whose teeth sampled in serial sections provided an excellent record of seasonal
fluctuations in δ18O values.
5.2 Contributions to zooarchaeology This work has expanded isotopic zooarchaeology methodologically, and in ways that can
also be used by ecology researchers in Biology or Environmental Science. Previous
isotopic zooarchaeology focused on the reconstruction of local food webs used in the
interpretation of human diets. The current research has shifted the focus to the use of
animal diets and behaviour as in an indirect means to reconstruct human diet and
behaviour, expanding the interpretive models available without the destructive analysis of
human remains.
First, the enamel formation sequence of white-tailed deer has been clearly established and
linked to monthly seasonal events. This information may be used for future studies
examining both archaeological and modern deer to understand patterns of weaning and
food access for the first eighteen months of life. Preliminary data for the tooth formation
sequence of domestic dogs are also provided, and appear to capture the pre- and post-
weaning period. Pairing this data with δ18O values may provide insight into seasonal diets
of dogs (i.e., differences and similarities in the cold versus warm weather diet of dogs),
which can be used to further expand studies of human diet and behavior.
The use of modern animals known to exploit maize fields, notably white-tailed deer, wild
turkeys and insects (grasshoppers and crickets) has enabled a better understanding of the
effect of maize availability on the isotopic composition of faunal tissues. For example,
wild turkeys will readily exploit maize when it is removed from standing stalks and left
for them. By contrast, the bones of white-tailed deer, well known crop pests, are not as
274
heavily influenced by maize consumption as other species (e.g., turkeys), possibly due to
short term consumption or lowered winter metabolism. Nonetheless, deer teeth can
provide detailed seasonal maize consumption patterns for the first year and a half of life.
Clearly the co-analysis of various tissues representing different time frames provides a
more complete picture of an animal’s dietary profile. Finally, this research expands the
database for insects, which are often consumed by many animals, particularly small
species. Grasshoppers and crickets do not appear to eat maize in the spring or early
summer, despite their presence in maize fields throughout the year.
Oxygen isotope analyses of incrementally growing tissues (e.g., tooth enamel) have
illustrated the presence of seasonal variation, but reconstructing the locational history of
deer, canids and wild turkey from bone δ18O values representing long term environmental
experiences is more complicated. Because no statistical relationship could be established
between δ18O values of tissue and those expected for local precipitation, for either
modern deer or turkey from known hunting locales, it can be inferred that this measure is
of very limited use in this region. Oxygen isotope compositions of water vary by season
(precipitation) plant type/part and water source (puddle, lake, river, etc.) all of which
obscure the ability to successfully use δ18O values as geographic markers for most
species in this study. Finally, although many studies of animals have included the
analyses of both the organic and inorganic phases of bone, there are few such studies for
either modern or ancient birds. The strong relationship between collagen and structural
carbonate δ-values for both modern and archaeological turkeys suggests that the two
phases of bird bone behave similarly, which provides an additional avenue of research for
future bird studies.
5.3 Contributions to Ontario archaeology The research has expanded southwestern Ontario food webs geographically and
temporally. Pre-horticultural and modern animals have been used to anchor our
understanding of how maize horticulture changed landscapes, and the effects those
changes had on both human and animal behaviour. This research has also demonstrated
that faunal remains may be used to not only reconstruct dietary profiles of animals but to
also provide information about ancient human behavioural patterns. Domestic dogs from
275
both Western Basin and Ontario Iroquoian sites have been successfully used to expand
our understanding of the transition to maize dependency during the Late Woodland, and
support interpretations recently made from isotopic work on Western Basin humans
(Dewar et al. 2010; Spence et al. 2014; Watts et al. 2011). Further, differences in dog
diets support archaeological data indicating that Western Basin peoples were exploiting
fish to a greater degree than their Ontario Iroquoian neighbours, using their landscapes
very differently despite the fact that both groups consumed similar amounts of maize.
The analysis of one the most ancient dogs in Ontario, dating to 3500BP from the
Davidson site, provided invaluable data on the relationship between Archaic humans and
dogs. The results suggest the dog was domesticated, as it was provisioned with high
trophic level food (i.e., fresh water fish) during life, and may have been consumed (i.e.,
boiled) in death.
Wild species, particularly wild turkey and foxes have expanded our understanding of the
similarities and differences in subsistence practices by Ontario Iroquoian and Western
Basin people. For example, wild turkey data support the hypothesis that Western Basin
peoples continued to use a more mobile settlement pattern, wherein they followed
seasonally available resources and geographically separated cold weather hunting
activities and maize cultivation. On the other hand, some Ontario Iroquoian peoples
appear to have capitalized on hunting in maize fields by purposefully leaving maize in
fields, thereby creating food assurance for certain species (i.e., wild turkeys) and a cold
weather hunting ground.
The completely C3 food diets of white-tailed deer from both Ontario Iroquoian and
Western Basin sites reflect a behavioral shift by deer who appear to have moved further
away from cleared and open-lands to escape hunting pressures created by the effect of
population increase on demand for deer skins and meat.
It is hypothesized that extensive boiling of animal bone, particularly deer, as a method of
Post-mortem processing caused abnormally high δ13Csc values and, therefore,
unexpectedly large Δ13Csc-col values. Although commonly used tests for post-mortem
alteration, such as the CI index, did not indicate alteration of structural carbonate values,
276
deer bone structural carbonate could not be used for reconstructing diet with validity. The
prevalence of altered structural carbonate values indicates that extensive boiling, whether
done for accessing grease and marrow or using brains for tanning, was a significant
means of post-mortem processing for both Ontario Iroquoian and Western Basin peoples.
This finding provides a new and meaningful use for altered data.
5.4 Future research considerations
Future research will continue to expand the data set by focusing on the selection of a
wider temporal and geographic sample of fauna in order to fill gaps, particularly from the
Middle to Late Woodland transition at Ontario Iroquoian sites, as well as the entire
Western Basin temporal span in Ontario. Western Basin dog, wild canid and wild turkey
data, as well as squirrel and raccoon data, are needed to more fully understand Western
Basin landscape changes and subsistence strategies.
Sampling of multiple tissues (e.g. enamel, dentine and bone) needs to be a component of
future faunal analyses as a means to better understand long- and short-term dietary
choices, seasonal patterns, geographic movement in life, and potential Post-mortem
alteration of the bone. An additional tissue, cementum, which is an annually forming
dental layer (Meaers 2005; Stallibrass 1982), should be included in mammalian studies as
means to provide temporal profiles across the life span of the animal, not just the first few
months of life (i.e., enamel and dentine).
Finally, further work is currently being pursued to investigate the usefulness of altered
structural carbonate data to reconstruct in vivo human behaviour, i.e. methods of post-
mortem processing of animal remains and its cultural meaning.
277
References cited Bonafini M., Pellegrini, M., Ditchfield P., Pollard, A.M. 2013. Investigations of the
'canopy effect' in the isotope ecology of temperature woodlands. Journal of Archaeological Science 4, 3926-3935.
Booth, L., C. D. White, F.J. Longstaffe, L. Hodgetts and Z. H. Morris (2012) An isotopic analysis of faunal remains from suspected ritual deposits on Ontario Iroquoian Tradition sites. Published abstract of the 77th Annual Meeting of the Society for American Archaeology, Memphis N, April 18-22.
Cerling, T.E., Harris, J.M., 1999. Carbon isotope fractionation between diet and bioapatite in ungulate mammals and implications for ecological and paleoecological studies. Oecologia, 120(3): 347-363.
DeNiro, M.J., Schoeninger, M.J., Hastorf, C.A., 1985. Effect of heating on the stable carbon and nitrogen isotope ratios of bone collagen. Journal of Archaeological Science, 12, 1-7.
Dewar, G., Ginter, J.K., Shook, B.A.S., Ferris, N., Henderson, H., 2010. A bioarchaeoloigcal study of a Western Basin Tradition cemetery on the Detroit River. Journal of Archaeological Science 37, 2245-2254.
Drucker, D. G., Bocherens, H. 2009. Carbon stable isotopes of mammal bones as tracers of canopy development and habitat use intemperate and boreal contexts. In: Creighton, J.D. Roney, P.J. (Eds.), Forest Canopies: Forest Production, Ecosystem Health, and Climate Conditions Nova Science Publishers, Inc., New York, pp. 103-109.
Gramly, R.M., 1977. Deer skins and hunting territories: Competition for a scarce resource of the Northeastern Woodlands. American Antiquity. 42(4), 601-605.
Greene, C.D., Nielsen, C.K., Woolf, A., Delahunt, K.S., Nawrot, J.R., 2010. Wild turkeys cause little damage to row crops in Illinois. Transactions of the Illinois State Academy of Science, 103. 145-152.
Groepper, S. R., Hygnstrom, S. E., Houck, B., Vantassel, S. M., 2013. Real and Perceived Damage by Wild Turkeys: A Literature Review. Journal of Integrated Pest Management, 4(1), A1-A5.
Heckleau, J.D., Porter, W.F., Shields, W.M., 1982. Feasibility of transplanting wild turkeys into areas of restricted forest cover and high human density. Proceedings of the 39th Northeast Fish and Wildlife Conference, 13-15 April, pp. 96-104.
Hesselton, W.T., Hesselton, R.M., 1982 White-tailed Deer: Odocoileus virginianus. In: Chapman, J.A., Feldhamer, G.E. (Eds.), Wild Mammals of North America: Biology, Management and Economics. John Hopkins University Press: Baltimore, pp. 878-901.
278
Hewitt, D.G, 2011. Nutrition. In: Hewitt, D.G. (Ed.) Biology and management of white-tailed deer. CRC Press, Boca Raton, pp. 75-106.
Katzenberg, M.A., 1989. Stable isotope analysis of archaeological faunal remains from southern Ontario. Journal of Archaeological Science 16, 319-329.
Ketchum, S., Schurr, M., Garniewicz, R., 2009. A test for maize consumption by fauna in Late Prehistoric Eastern North America. North American Archaeologist 30(1), 87-101.
Loken, B., Rothenburger, D., Tieszen, L. L., 1992. Inferences about diets based on delta 13C analysis of collagen and other tissues from modern and early historic mammals. Proceedings of the South Dakota Academy of Science, 71, 85-94.
Meares, J.M., 2005 Evaluation of new technologies for estimating age of white-tailed deer by tooth characteristics. [Unpublished M.Sc. Thesis], The University of Georgia, Athens, GA.
Munro, L. E., Longstaffe, F. J., White, C. D., 2007. Burning and boiling of modern deer bone: effects on crystallinity and oxygen isotope composition of bioapatite phosphate. Palaeogeography, Palaeoclimatology, Palaeoecology, 249(1), 90-102.
Munro, L. E., Longstaffe, F. J., White, C. D., 2008. Effects of heating on the carbon and oxygen-isotope compositions of structural carbonate in bioapatite from modern deer bone. Palaeogeography, Palaeoclimatology, Palaeoecology, 266(3), 142-150.
Pijoan, C., Mansilla, j. Leboreiro, I. Lara, V.H, Bosch, P., 2007. Thermal Alteration in Archaeological Bones. Archaeometry 49(4), 713-727.
Pimlott, D. H., 1967. Wolf predation and ungulate populations. American Zoologist, 7(2), 267-278.
Prevec, R., Noble, W. C., 1983. Historic Neutral Iroquois faunal utilization. Ontario Archaeology, 39, 41-56.
Roberts, S. J., Smith, C. I., Millard, A., Collins, M. J., 2002. The taphonomy of cooked bone: characterizing boiling and its physico–chemical effects. Archaeometry, 44(3), 485-494.
Spence, M. W., Williams, L. J., Wheeler, S. M., 2014. Death and Disability in a Younge Phase Community. American Antiquity, 79(1), 108-126.
Stallibrass, S., 1982. The use of cement layers for absolute ageing of mammalian teeth: a selective review of the literature, with suggestions for further studies and alternative applications. In: Willson, B. Grigson, C., Payne, S. (Eds.), Ageing and sexing animal bones from archaeological sites, BAR British Archaeological Report Series, 109, 109-126.
279
Stewart, F. L., 2000. Variability in Neutral Iroquoian Subsistence, AD 1540–1651. Ontario Archaeology, 69, 92-117.
Tefft, B.C., Gregonis, M.A., Eriksen, R.E., 2005. Assessment of crop depredation by wild turkeys in the United States and Ontario, Canada. Wildlife Society Bulletin, 33(2), 590-595.
Turner, R. Santley, R.S., 1979. Deer Skins and Hunting Territories Reconsidered. American Antiquity, 44(4), 810-816.
Watts, C. M., White, C. D., Longstaffe, F. J., 2011. Childhood diet and Western Basin tradition foodways at the Krieger site, southwestern Ontario, Canada. American Antiquity, 76(3), 446-472.
280
6 Appendices
Appendix A: Summary of Ontario sites with faunal material isotopically analyzed for this study.
PRE-MAIZE SITES:
Bruce Boyd (AdHc-4) is a burial site is located in Norfolk County, Ontario excavated in 1976 by Spence, Williamson and Dawkin. The site is composed of several Early Woodland (700 to 900B.C.) burials located on a knoll, including that of an incomplete adult male (Feature 1) associated with the remains of animals (including wild turkey). There is no evidence of habitation structures, and Spence et al. (1978) speculate it may have been used repeatedly over several seasons to inter individuals in the spring/summer. In this thesis, Bruce Boyd samples are designated BrB. Samples were obtained with permission from the Museum of Ontario Archaeology and included faunal material from Feature 1 (two wild turkeys) as well as deer and a large canid (no feature information).
References: Spence, M.W., Williamson, R.F., Dawkins, J.H., 1978. The Bruce Boyd Site: An early Woodland component in southwestern Ontario. Ontario Archaeology, 29,33–46.
Cranberry Creek (AfGv-62), a Middle Woodland site in Hadlimand-Norfolk county, was excavated by Stothers and Lennox in 1974. The site is estimated to be multi-component with two occupation dates of 200 to 300 B.C. and A.D. 700 to 900. Because Cranberry Creek was occupied during both the Middle and Late Woodland, only a limited number of samples were selected for analysis from site, including a deer, canid (probable dog), and woodchuck. Samples analysed from Cranberry Creek are designated as CrC in this thesis. Samples were obtained with permission from the Anthropology Department at McMaster University.
Reference: Lennox, P.A. (n.d) The Cranberry Creek Site: An Early Middle and Late Woodland Component in Haldimand Country.
Davidson (AjGw-4) is an unusually large Archaic site situated on the Ausable River near Grand Bend and is currently being excavated by Dr. Chris Ellis. Excavations began at the site by Kenyon in the late 1970s. The site is complex, multicomponent site occupied during the Archaic through Middle and Late Woodland. Investigations at the site have included test pitting, surface survey, and excavation but also gradiometer/magnetometer survey. Site features include houses and large pits. An Archaic Broadpoint component (radiocarbon dated to ca. 2400 to 2030 B.C.) included the remains of a dog and deer. A dog and three deer were analyzed for this study, courtesy of Dr. Chris Ellis. Davidson samples are designated Dav.
References: Ellis, C., 2006. A Preliminary Report on the 2006 Test Excavations at the Davidson Site: An Archaic "Broad Point" Component. Kewa 06(7), 1-16.
Kenyon, I.T., 1980. The George Davidson Site: An Archaic 'Broad Point' Component in Southwestern Ontario. Archaeology of Eastern North America 8, 11-28.
281
ONTARIO IROQUOIAN TRANSITIONAL AND LATE WOODLAND SITES:
Bogle II (AiHa-11) is a Neutral hamlet located in the Hamilton-Wentworth region, part of the Bronte Creek site cluster (along with Hood, Christianson, Bogle I and Hamilton). The site was excavated in 1979 by Paul Lennox and is estimated to be relatively small, at approximately 50 x 50 m with a faunal assemblage of 1468. Bogle II dates to A.D. 1638 to 1651, roughly contemporaneous with the larger Hamilton village site. Lennox suggested that Bogle I and II represent hamlets (or satellite villages) based on their small size, though it is believed to been occupied year round based on the faunal data and the presence of at least four houses. Because there were an unusually high number of invertebrates (shell) at Bogle II, the site is hypothesized Bogle II was used by Hamilton site inhabitants for the collection and processing of shell for pottery production.
Designated as Bog for this thesis, samples analyzed include black bear, beaver, raccoon, deer and dog. Samples were obtained with permission from the Anthropology Department at McMaster University.
Reference: Lennox, P.A., 1984. The Bogle I and Bogle II Sites: Historic Neutral Hamlets of the Northern Tier. National Museum of Man Mercury Series Paper 121. Canadian Museum of Civilization.
Stewart, F. L., 2000. Variability in Neutral Iroquoian Subsistence, AD 1540–1651. Ontario Archaeology, 69, 92–117.
Cleveland (AhHb-7) is located in Brant County, Ontario along a Grand River tributary and is a pre-contact Neutral village excavated by Noble in 1971. Cleveland was excavated by Noble in the early 1970s and is dated to A.D. 1540. A set of three near complete dog burials were found at Cleveland, including the skeleton of a diseased dog, investigated by Rhonda Bathurst and found to have tuberculosis.
Designated Clv in this thesis and include several deer and a wild turkey. The Cleveland dog was analyzed by Laura Booth. Samples were obtained with permission from the Anthropology Department at McMaster University.
Reference: Bathurst, R. R., Barta, J. L., 2004. Molecular evidence of tuberculosis induced hypertrophic osteopathy in a 16th-century Iroquoian dog. Journal of Archaeological Science, 31(7), 917-925.
Prevec, R., Noble, W. C., 1983. Historic Neutral Iroquois faunal utilization. Ontario Archaeology, 39, 41–56.
Stewart, F. L., 2000. Variability in Neutral Iroquoian Subsistence, AD 1540–1651. Ontario Archaeology, 69, 92–117.
Crawford Lake (AiGx-6) village site is located on Crawford Lake on the Niagara Escarpment, West of Toronto, Ontario. The site was dated to the Middle Ontario Iroquoian stage (A.D. 1435 to 1459) using stratified pollen layers in the lake sediment .

282
The site was excavated by Finlayson and Byrne starting in 1973, and six long houses were discovered. The use of flotation screening was used and provided evidence of not only maize cultivation (as was expected based on the pollen data) but also bean cultivation.
Crawford Lake samples are designated Crf and include a number of turkey, deer, dog and raccoon. Samples were obtained with permission from the Museum of Ontario Archaeology.
References: Finlayson, W. D., Bryne, R., 1975. Investigations of Iroquoian settlement and subsistence patterns at Crawford Lake, Ontario-a preliminary report. Ontario Archaeology, 25, 31-36.
Fonger (AhHb-8) is a Neutral village site excavated by Gary Warrick in 1978 and 1979 near Brantford, Ontario. Fonger is a smaller village (0.8 ha) dating to A.D. 1580 to 1620. A large number of invertebrates (shell) at the site is believed to be related to pottery production (Holterman2007). The site is composed of six middens and eighteen longhouses, encircled by palisades. The Fonger site yielded 1621 faunal remains.
Fonger samples are designated as Fon and include black bear, dog, squirrel, deer and wild turkey. Samples were obtained with permission from the Anthropology Department at McMaster University.
References: Holterman, C., 2007. So Many Decisions! The Fonger Site: A Case Study of Neutral Iroquoian Ceramic Technology. [Unpublished M.A. thesis]. McMaster University, Hamilton, ON.
Prevec, R., Noble, W. C., 1983. Historic Neutral Iroquois faunal utilization. Ontario Archaeology, 39, 41–56.
Warrick, G., 1984. The Fonger Site: A Protohistoric Neutral community, Monograph, Ontario Heritage Foundation, Toronto.
Hamilton (AiHa-5) site is a large Neutral (A.d. 1638 to 1651) village located In West Flamborough township, Ontario. The site was first investigated by Noble in 1970 and further excavated by Lennox in 1972. The 3 ha site is surrounded by a double palisade and includes at least 8 middens (most at the periphery of the village, though midden B was within the village itself) and 5 houses. Lennox argues that, based on its size and location, Hamilton may represent a “capital” for the site clusters of the region. The site yielded 20481 faunal samples, with emphasis on wild turkeys (and de-emphases on passenger pigeons) including a number of juveniles hunted in the fall.
Hamilton samples are identified in this thesis as Ham and include bear, dog, deer and wild turkey. Samples were obtained with permission from the Anthropology Department at McMaster University.
References: Lennox, P., 1977. The Hamilton Site: A Late historic Neutral Town. [Unpublished Ph.D. Thesis] McMaster University, Hamilton, ON.
283
Lightfoot (AjGw-5), located in Mississauga Ontario, is an Early Ontario Iroquoian site excavated by Mayer, Poulton and Associates Inc. in 1988 and 1989. The Lightfoot camp is composed of 5 long houses and several middens and yielded 402 faunal remains.
Bear and woodchuck were analyzed from the Lightfoot site, designated as Lig samples in this thesis. Samples were obtained with permission from D.R. Poulton & Associates Inc.
References: Prevec, R. 1989. The Lightfoot Site AjGw-5: Faunal Report submitted to Mayer, Poulton and Associates Inc., Burlington, Ontario.
Pipeline (AiGx-12) site is a late Middle Ontario Iroquoian village (or early pre-contact Neutral) dating to A.D. 1400 and estimated to be over 2 ha. The site was first excavated in 1975 and 1977 and again in 2006 by D.R. Poulton & Associates Inc. Pipeline includes at least six long houses, though no evidence of a palisade. Over 19,000 faunal samples were recovered in the excavations
Pipeline samples are labelled as Pip and include a number of dog and deer as well as fox, rabbit, raccoon, and wild turkey. Samples were obtained with permission from D.R. Poulton & Associates Inc. and the Museum of Ontario Archaeology.
References: Dodd, C.F., Poulton, D.R., Lennox, P.A., Smith, D.G., Warrick, G.A., 1990. The middle Ontario Iroquoian stage. In: Ellis, C.J., Ferris, N., (Eds.), The archaeology of southern Ontario to A.D. 1650. Occasional Publications of the London Chapter, OAS Number 5, pp. 321–360.
Neill, C.G., 2008. The Faunal Specimens from Pipeline Site (AiGx-12). Report on file with D.R. Poulton & Associates Inc.
Porteous (AgHb-1) is a village (43 x 160 m) near Brantford, Ontario dating to the Princess Point/Transitional Woodland (A.D. 700 to 900). The site was first excavated in 1969 by Noble. The site has two longhouses (and probable third) and 17 distinct pit features. The longhouses are noted by Noble and Kenyon to be unusually “refined” for the date of the site. There is no evidence of palisades and shallow middens. 2753 faunal remains were recovered from Porteous.
A small canid and deer were isotopically analyzed from Porteous, designated Por in this thesis. Samples were obtained with permission from the Anthropology Department at McMaster University.
References: Crawford, G. W., Smith, D. G., 1996. Migration in prehistory: Princess Point and the Northern Iroquoian case. American Antiquity, 782-790.
Noble, W.C., Kenyon, I.T., 1972. Porteous (AgHb-1): A Probable Early Glen Meyer Village in Brant County, Ontario. Ontario Archaeology, 19, 11-38.
The Princess Point (AhGx-1) site (near Hamilton, Ontario) is part of the Princess Point complex (n = ~80 sites) of sites originally identified by Stothers as Transitional period
284
between the Middle and Late Woodland dating to A.D. 500 to 900/1000 (extended by Smith and Crawford). The Princess Point site is believed to be a larger site within the complex, located in a wetland area. The site has evidence of maize, but does have a later Early Ontario Iroquoian component that could be intrusive. There is some debate as to whether site was occupied year-round or seasonally in warmer months as a macro-band site.
A black bear, wild turkey and several deer were analyzed from the Princess Point site, identified as Pri. Samples were obtained with permission from the Anthropology Department at McMaster University.
References: Crawford, G. W., Smith, D. G., 1996. Migration in prehistory: Princess Point and the Northern Iroquoian case. American Antiquity, 782-790.
Smith, D.G., Crawford, G., 1997. Recent Developments in the Archaeology of the Princess Point complex in Southern Ontario, Canadian Journal of Archaeology 21(1): 9–32.
Stothers, P. M., 1977. The Princess Point Complex. Musée National de l'Homme. Collection Mercure. Commission Archéologique du Canada. Publications d'Archéologie. Dossier Ottawa, (58), 1-403.
Old Lilac Garden (AhGx-6) is a small Princess Point site located on a peninsula, elevated from the water. The site was excavated in1984. There is some debate as to whether site was occupied year-round or seasonally in warmer months as a macro-band site.
Deer, rabbit, and a dog were analyzed isotopically and are designated as OLG. Samples were obtained with permission from the Anthropology Department at McMaster University.
References: Smith, D.G., Crawford, G., 1997. Recent Developments in the Archaeology of the Princess Point complex in Southern Ontario, Canadian Journal of Archaeology 21(1), 9–32.
Rife (AiGx-7) is a Middle Ontario Iroquoian, 1.4 ha village site occupied between A.D. 1474 and 1504. The original small village site, excavated first in the 1980s and later again by Finlayson in 1998, was expanded twice to form a much larger village. Finlayson undertook careful excavations (i.e., half meter vs. 1 meter squares), particularly of House 2, an undisturbed longhouse, producing in situ took kits.
Canids, deer and turkey were analyzed from Rife, designated Rif. Samples were obtained with permission from the Museum of Ontario Archaeology.
References: Dodd, C.F., Poulton, D.R., Lennox, P.A., Smith, D.G., Warrick, G.A., 1990. The middle Ontario Iroquoian stage. In: Ellis, C.J., Ferris, N., (Eds.), The archaeology of southern Ontario to A.D. 1650. Occasional Publications of the London Chapter, OAS Number 5, pp. 321–360.
285
Finlayson, W. D., 2004. Archaeological Research in the Crawford Lake Area 1997-2003. Report for the Niagara Escarpment Commission. Leading Edge, March 3-5.
Slack-Caswell (AfHa-1) is a multicomponent site, intensively used as hamlet site dated to A.D. 1300 to 1380 (Middle Ontario Iroquoian stage). The site located in Townsend Township, Ontario was excavated over two seasons. The hamlet is composed of a very large longhouse (90m), four middens, and possible additional structure. No palisade was identified. Eight-four faunal elements were identified from the site.
Slack-Caswell samples, designated Sla, included a duck, squirrel, canid, turtle and deer. Samples were obtained with permission from the Anthropology Department at McMaster University.
References: Dodd, C.F., Poulton, D.R., Lennox, P.A., Smith, D.G., Warrick, G.A., 1990. The middle Ontario Iroquoian stage. In: Ellis, C.J., Ferris, N., (Eds.), The archaeology of southern Ontario to A.D. 1650. Occasional Publications of the London Chapter, OAS Number 5, pp. 321–360.
Jamieson, S.M., 1986. Late Middleport Catchment Areas and the Slack-Caswell example. Ontario Archaeology, 45, 27-38.
Thorold (AgGt-1) is a large, Historic Neutral (A.D. 1615-1630) town located in the Niagara Peninsula. The site was excavated by Noble in 1979 and estimated to be 4 ha, composed of at least five longhouses and several middens, enclosed within palisades. Noble suggest the site may have served as a regional capitol.
The site faunal assemblage is notable in its relatively low numbers of deer. Samples analyzed from Thorold, abbreviated to Tho, include deer, turkey, a woodchuck, fox and dog. Samples were obtained with permission from the Anthropology Department at McMaster University.
References: Prevec, R., Noble, W. C., 1983. Historic Neutral Iroquois faunal utilization. Ontario Archaeology, 39, 41–56.
Stewart, F. L., 2000. Variability in Neutral Iroquoian Subsistence, AD 1540–1651. Ontario Archaeology, 69, 92–117.
Van Besien (AfHd-2) is an Early Ontario Iroquoian site dated to A.D 940 located in Oxford county, Ontario. During its occupation, Van Besien expanded twice from 0.4 to 0.6, finally, to 1.2 ha, and was palisaded during some of the time. Noble began excavations at the site 1971 continuing for another season in 1972. Despite the expansions at the site, Noble identified three long houses. Middens were excavated on the three, sloping hills of the sites sides.
The remains of 4967 fauna, indicating year-round subsistence economy, were found at the site. Bear, fox, dog, squirrel, porcupine, rabbit, raccoon, deer, wild turkey and ground hog were all isotopically anlayzed from Van Besien, designated Van in this thesis.
286
Samples were obtained with permission from the Anthropology Department at McMaster University.
References: Noble, W.C., 1975 Van Besien (AfHd -2): A Study in Glen Meyer Development. Ontario Archaeology 24, 3-95.
Walker (AgHa-9) is located in Brant County and is identified as a large, 4 ha Neutral town excavated by Walker in the mid-1970s. Despite its size and date, no palisades could be identified at the Walker site.
Seven middens were excavated, along with twelve houses (including House 8 identified as a winter house). Over 10,500 faunal elements were recovered from the site. Noble interpreted the site as a regional capital. Black bear, passenger pigeon, beaver, dog, mink, squirrel, skunk, muskrat, porcupine, rabbit, raccoon, turtle, deer, wild turkey and woodchuck were all isotopically analyzed from the Walker site (Wal). Samples were obtained with permission from the Anthropology Department at McMaster University.
References: Wright, J.W. 1977. The Walker Site. [Unpublished M.A. thesis] McMaster University, Hamilton, ON.
Winking Bull (AiHa-20) is 0.8 ha Middle Ontario Iroquoian village from the Crawford Lake region dating to A.D. 1280. The site was excavated by Finlayson in the early 1980s. 1704 faunal samples were identified at Winking Bull, including a large number that had modified bone (bone beads).
Canids, raccoons, deer and wild turkey were isotopically analyzed from Winking Bull (designated Win). Samples were obtained with permission from the Museum of Ontario Archaeology.
References: Dodd, C.F., Poulton, D.R., Lennox, P.A., Smith, D.G., Warrick, G.A., 1990. The middle Ontario Iroquoian stage. In: Ellis, C.J., Ferris, N., (Eds.), The archaeology of southern Ontario to A.D. 1650. Occasional Publications of the London Chapter, OAS Number 5, pp. 321–360.

287
WESTERN BASIN TRANSITIONAL AND LATE WOODLAND SITES:
Dobbelaar (no borden) is a Wolf Phase site dated to A.D. 1400-1550 located near the St. Clair river. The faunal material (n=5187) was analyzed by Lindsay Foreman, who interprets the sites emphasis on muskrat procurement as a warm weather settlement. A fox and dog were analyzed from the Dobbelaar site. Samples from Dobbelaar (Dob) were accessed courtesy of the London Office of the Ministry of Tourism, Culture and Sport.
References: Foreman, L., 2011. Seasonal subsistence in Late Woodland southwestern Ontario: An examination of the relationship between resource availability, maize agriculture, and faunal procurement and processing strategies. [Unpublished Ph.D. thesis]. The University of Western Ontario, London, ON.
Figura (AgHk-52), also known as Inland Aggregate or Inland West Pit No. 1, is part of an aggregation of sites near Arkona, ON, excavated by Golder and Associates. The site was excavated in 2007 and 2008 along with Inland Aggregate locations 3 (AgHk-54), 9 (AgHk-58) and 12 (AgHk-60) by Golder and Associates and were sampled courtesy of Sustainable Archaeology.
The Stage 4 excavation at the Figura site (88 x 105 m) revealed 303 features (including two large middens), as well as six small house structures. Five houses and one midden are surrounded by a palisade. Over 11,200 faunal remains were recovered at the site, but at the time of the 2008 excavation a detailed faunal report was still forthcoming. The site is dated to the Yonge Phase (A.D. 800 to 1200). In this thesis Figura samples are identified as IWP(01) and include deer, wild turkey, and raccoon.
The Stage 4 excavation of Location 3 resulted in the recovery of 87 features and 3862 faunal pieces, which have not been analyzed at this time. The site is, approximately 65 x 45 m, and its features do not indicate the presence of house or palisade structures. The site is dated to the Yonge Phase (A.D. 800 to 1200). A detailed faunal report for the site has not yet been completed. Thesis samples from Location 3 are identified as IWP(03) and include the isotopic analysis of deer and wild turkey.
The Stage 4 excavation of Location 9 led to the recovery of over 23,000 faunal remains from 129 features (many were pits) with a partial palisade. The excavation is interpreted as a portion of a large, Yonge Phase village. A detailed faunal report for the site has not yet been completed. Faunal material (identified as IWP(09)) was analyzed from pits 2, 18, 21, 38, 46, 56, 59, 61, 72, 102 and 107 and includes black bear, ruffed grouse, domestic dogs, raccoon, deer and wild turkey.
The Stage 4 excavation of Location 12 identified 21 features and a partial palisade or fence. The remains of 4810 fauna were found at site, for which an assessment has been completed by Lindsay Foreman for two features (Feature 14 located within the palisade/fence and Feature 19 outside the palisade fence). The initial report suggests the site was used during the Yonge Phase from A.D. 1050 to 1150, with an emphasis on cervid hunting and heavy processing of the remains on site. Based on the faunal data, the
288
site has been interpreted as a cold weather site. Fauna analyzed for this study are labelled IWP(12) and include a dog and several deer.
References: Golder and Associates (2012) Stage 4 Archaeological Assessment: Inland West Pit Locations 1, 3, 6, 9 and 12. Part of Lots 28 and 29, Concession 5 N.E.R. Township of Warwick, Lambton County, Ontario. Ontario. Manuscript on file, Ontario Ministry of Tourism, Culture and Sport, Toronto, Ontario.
Foreman, L., 2011. Seasonal subsistence in Late Woodland southwestern Ontario: An examination of the relationship between resource availability, maize agriculture, and faunal procurement and processing strategies. [Unpublished Ph.D. thesis]. The University of Western Ontario, London, ON.
Spence, M.W., White, C.D., Ferris, N., Longstaffe, F.J., 2010. Treponemal Infection in a Western Basin Community. Kewa 10(3), 1-10.
Liahn I (AcHo-1), located near the St. Clair River, was excavated in 1977 by Ian Kenyon. The site is estimated to be 1.6 ha, but occupied intensively in a 0.6 ha area. The site, dated to the Springwells Phase (A.D. 1300 and 1600), includes large a long house and a large number of pit features. The emphasis on lake resource exploitation is suggested by Kenyon to indicate warm weather site use. Faunal samples analyzed in this thesis are designated as Lia and include a bowfin, muskrat, porcupine, raccoons and deer. Samples from Lianh I (designated Lia) were accessed courtesy of the London Office of the Ministry of Tourism, Culture and Sport.
References: Kenyon, I. 1988. Late Woodland Occupations at the Liahn I Site, Kent Co. Kewa. 88(2), 2-22.
Montoya (AfHi-243) is a Riviere au Vase (possibly used into the Yonge phase) site, dated to A.D. 800 to 1000. The site, located near Strathroy, ON, is believed to have been inhabited during the colder weather for cervid hunting, based on the faunal and artifact assemblages. The site was approximately 1.5 ha in size with over 6000 faunal remains recovered by Archaeologix Inc., who excavated the site in the early 2000s.
In this thesis, Montoya samples are designated Mon and include the analysis of several deer and a raccoon. Permission to sample Montoya site faunal material was granted courtesy of Golder and Associates Inc,
References: Archaeologix Inc., 2004 Archaeological Assessment (Stage 4): The Montoya Site (AfHi-243), Saxonville Estates Subdivision, Phase 2, Part of Lot 9, Concession 10, Geographic Township of Caradoc, Town of Strathroy, Middlesex County, Ontario. Manuscript on file, Ontario Ministry of Tourism and Culture, Toronto,
Foreman, L., 2011. Seasonal subsistence in Late Woodland southwestern Ontario: An examination of the relationship between resource availability, maize agriculture, and faunal procurement and processing strategies. [Unpublished Ph.D. thesis]. The University of Western Ontario, London, ON.
289
The Roffelsen (AcHn-33) site is a Yonge phase (A.D. 900 to 1000) burial site located near Chatham on the Thames River. The site was excavated by Archaeologix and analyzed by Adria Grant. Michael Spence analyzed the burial features (7 individuals). The site is approximately 50 by 45m and is mostly encompassed within a palisade. No house structures were identified, however a number of pit features were present within and outside the palisade. Feature 54, just outside the palisade, consisted of a dog burial, analyzed isotopically in this study. Permission to sample Roffelsen (designated Rof) site faunal material was granted courtesy of Golder and Associates Inc.
References: Spence, M., Williams, L., Wheeler, S., 2014. Death and Disability in a Younge Phase Community. American Antiquity, 79(1), 108-126.
Silverman (AbHr-5) site, located near Lake St. Clair beach, was first excavated in 1994 by Mayer Heritage Consultants, and went to Stage 4 excavation in 1995. The site covers an area of approximately 1.53 ha and is a multi-component relatively large campsite, occupied seasonal (spring through fall) between A.D. 700 and 1200. The features include a number of small houses and storage pit clusters. Silverman samples analyzed for this study are designated Sil and include a black bear, dog, raccoon, and deer. Samples from Silverman, (designated Sil) were accessed courtesy of the London Office of the Ministry of Tourism, Culture and Sport.
References: Mayer Heritage Consultants, 1996. Archaeological Mitigative Excavation (Stage 4) Silverman Site (AbHr-5), Registered Plan 12R-13025 Town of St. Clair Beach, Essex County, Ontario. Manuscript on file, Ontario Ministry of Tourism, Culture and Sport, Toronto, Ontario.
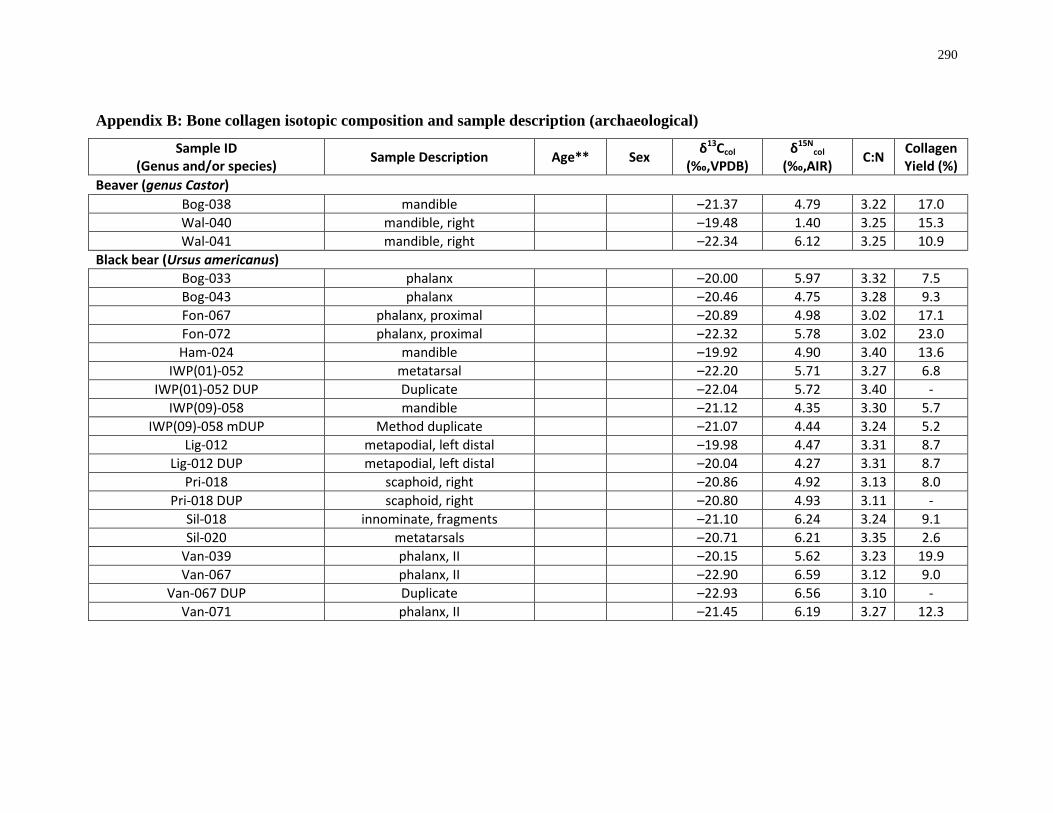
290
Appendix B: Bone collagen isotopic composition and sample description (archaeological)
Sample ID (Genus and/or species) Sample Description Age** Sex δ13Ccol
(‰,VPDB) δ15N
col (‰,AIR) C:N Collagen
Yield (%) Beaver (genus Castor)
Bog-038 mandible –21.37 4.79 3.22 17.0 Wal-040 mandible, right –19.48 1.40 3.25 15.3 Wal-041 mandible, right –22.34 6.12 3.25 10.9
Black bear (Ursus americanus) Bog-033 phalanx –20.00 5.97 3.32 7.5 Bog-043 phalanx –20.46 4.75 3.28 9.3 Fon-067 phalanx, proximal –20.89 4.98 3.02 17.1 Fon-072 phalanx, proximal –22.32 5.78 3.02 23.0 Ham-024 mandible –19.92 4.90 3.40 13.6
IWP(01)-052 metatarsal –22.20 5.71 3.27 6.8 IWP(01)-052 DUP Duplicate –22.04 5.72 3.40 -
IWP(09)-058 mandible –21.12 4.35 3.30 5.7 IWP(09)-058 mDUP Method duplicate –21.07 4.44 3.24 5.2
Lig-012 metapodial, left distal –19.98 4.47 3.31 8.7 Lig-012 DUP metapodial, left distal –20.04 4.27 3.31 8.7
Pri-018 scaphoid, right –20.86 4.92 3.13 8.0 Pri-018 DUP scaphoid, right –20.80 4.93 3.11 -
Sil-018 innominate, fragments –21.10 6.24 3.24 9.1 Sil-020 metatarsals –20.71 6.21 3.35 2.6
Van-039 phalanx, II –20.15 5.62 3.23 19.9 Van-067 phalanx, II –22.90 6.59 3.12 9.0
Van-067 DUP Duplicate –22.93 6.56 3.10 - Van-071 phalanx, II –21.45 6.19 3.27 12.3
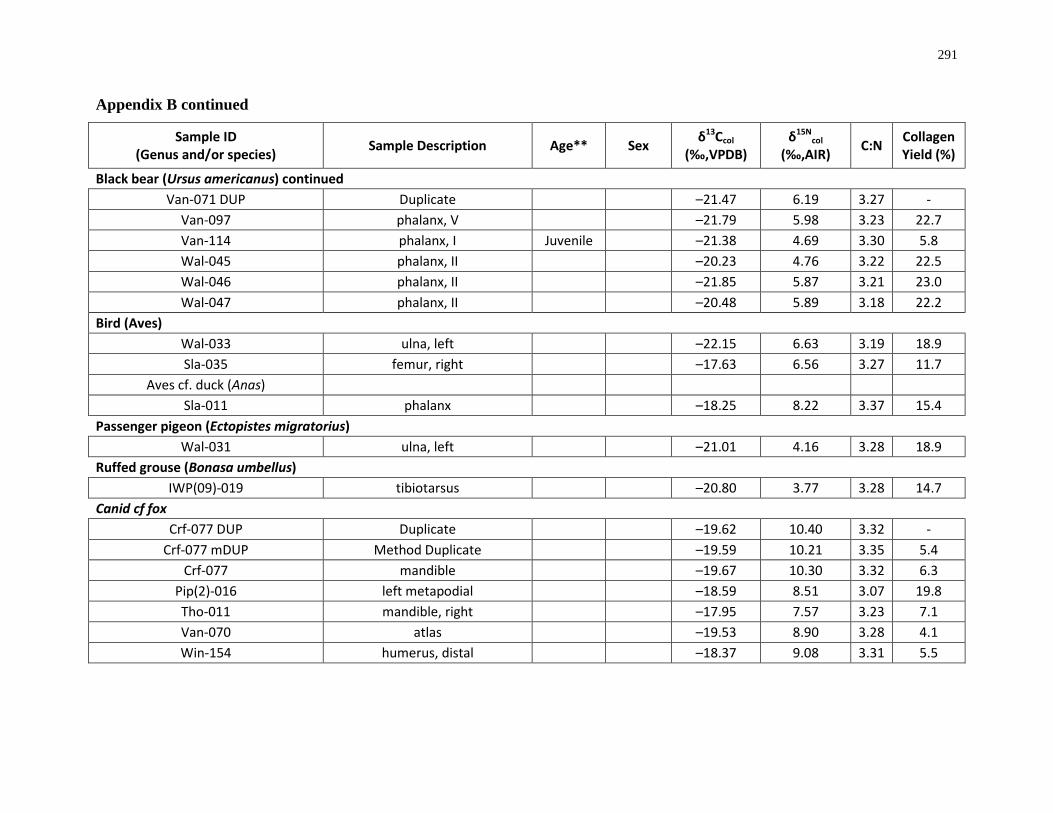
291
Appendix B continued
Sample ID (Genus and/or species) Sample Description Age** Sex δ13Ccol
(‰,VPDB) δ15N
col (‰,AIR) C:N Collagen
Yield (%)
Black bear (Ursus americanus) continued Van-071 DUP Duplicate –21.47 6.19 3.27 -
Van-097 phalanx, V –21.79 5.98 3.23 22.7 Van-114 phalanx, I Juvenile –21.38 4.69 3.30 5.8 Wal-045 phalanx, II –20.23 4.76 3.22 22.5 Wal-046 phalanx, II –21.85 5.87 3.21 23.0 Wal-047 phalanx, II –20.48 5.89 3.18 22.2
Bird (Aves) Wal-033 ulna, left –22.15 6.63 3.19 18.9 Sla-035 femur, right –17.63 6.56 3.27 11.7
Aves cf. duck (Anas) Sla-011 phalanx –18.25 8.22 3.37 15.4
Passenger pigeon (Ectopistes migratorius) Wal-031 ulna, left –21.01 4.16 3.28 18.9
Ruffed grouse (Bonasa umbellus) IWP(09)-019 tibiotarsus –20.80 3.77 3.28 14.7
Canid cf fox Crf-077 DUP Duplicate –19.62 10.40 3.32 -
Crf-077 mDUP Method Duplicate –19.59 10.21 3.35 5.4 Crf-077 mandible –19.67 10.30 3.32 6.3
Pip(2)-016 left metapodial –18.59 8.51 3.07 19.8 Tho-011 mandible, right –17.95 7.57 3.23 7.1 Van-070 atlas –19.53 8.90 3.28 4.1 Win-154 humerus, distal –18.37 9.08 3.31 5.5
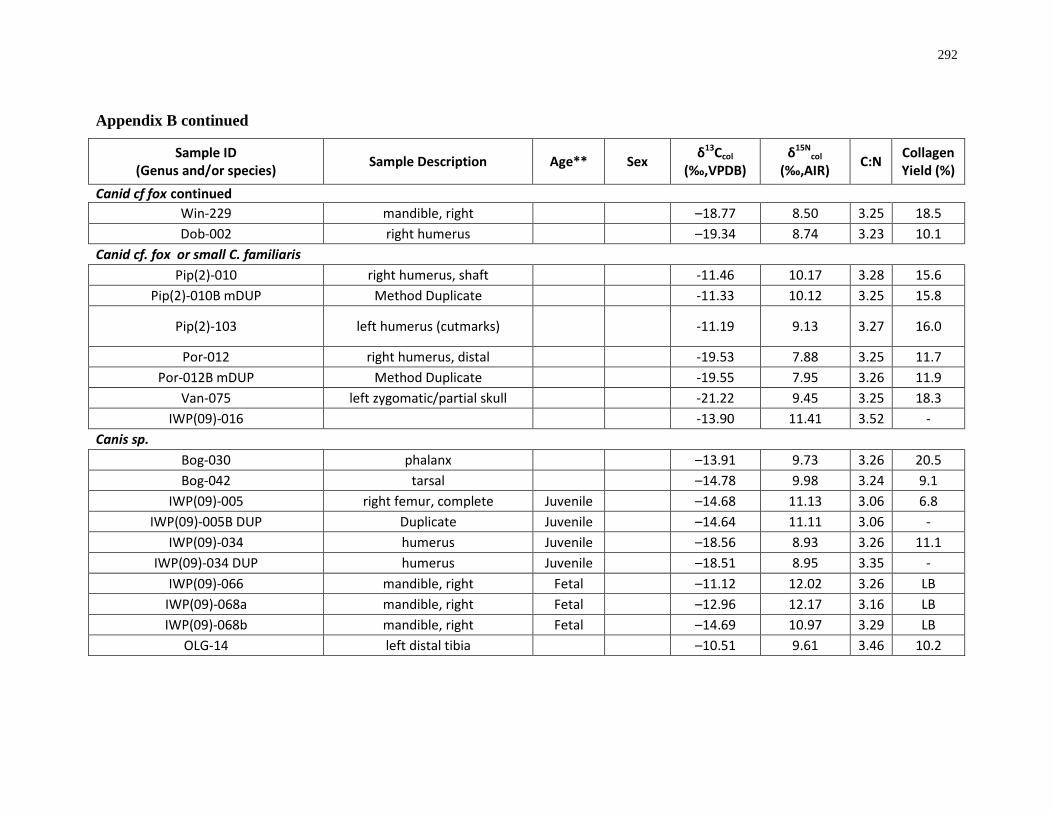
292
Appendix B continued
Sample ID (Genus and/or species) Sample Description Age** Sex δ13Ccol
(‰,VPDB) δ15N
col (‰,AIR) C:N Collagen
Yield (%) Canid cf fox continued
Win-229 mandible, right –18.77 8.50 3.25 18.5 Dob-002 right humerus –19.34 8.74 3.23 10.1
Canid cf. fox or small C. familiaris Pip(2)-010 right humerus, shaft -11.46 10.17 3.28 15.6
Pip(2)-010B mDUP Method Duplicate -11.33 10.12 3.25 15.8
Pip(2)-103 left humerus (cutmarks) -11.19 9.13 3.27 16.0
Por-012 right humerus, distal -19.53 7.88 3.25 11.7 Por-012B mDUP Method Duplicate -19.55 7.95 3.26 11.9
Van-075 left zygomatic/partial skull -21.22 9.45 3.25 18.3 IWP(09)-016 -13.90 11.41 3.52 -
Canis sp. Bog-030 phalanx –13.91 9.73 3.26 20.5 Bog-042 tarsal –14.78 9.98 3.24 9.1
IWP(09)-005 right femur, complete Juvenile –14.68 11.13 3.06 6.8 IWP(09)-005B DUP Duplicate Juvenile –14.64 11.11 3.06 -
IWP(09)-034 humerus Juvenile –18.56 8.93 3.26 11.1 IWP(09)-034 DUP humerus Juvenile –18.51 8.95 3.35 -
IWP(09)-066 mandible, right Fetal –11.12 12.02 3.26 LB IWP(09)-068a mandible, right Fetal –12.96 12.17 3.16 LB IWP(09)-068b mandible, right Fetal –14.69 10.97 3.29 LB
OLG-14 left distal tibia –10.51 9.61 3.46 10.2
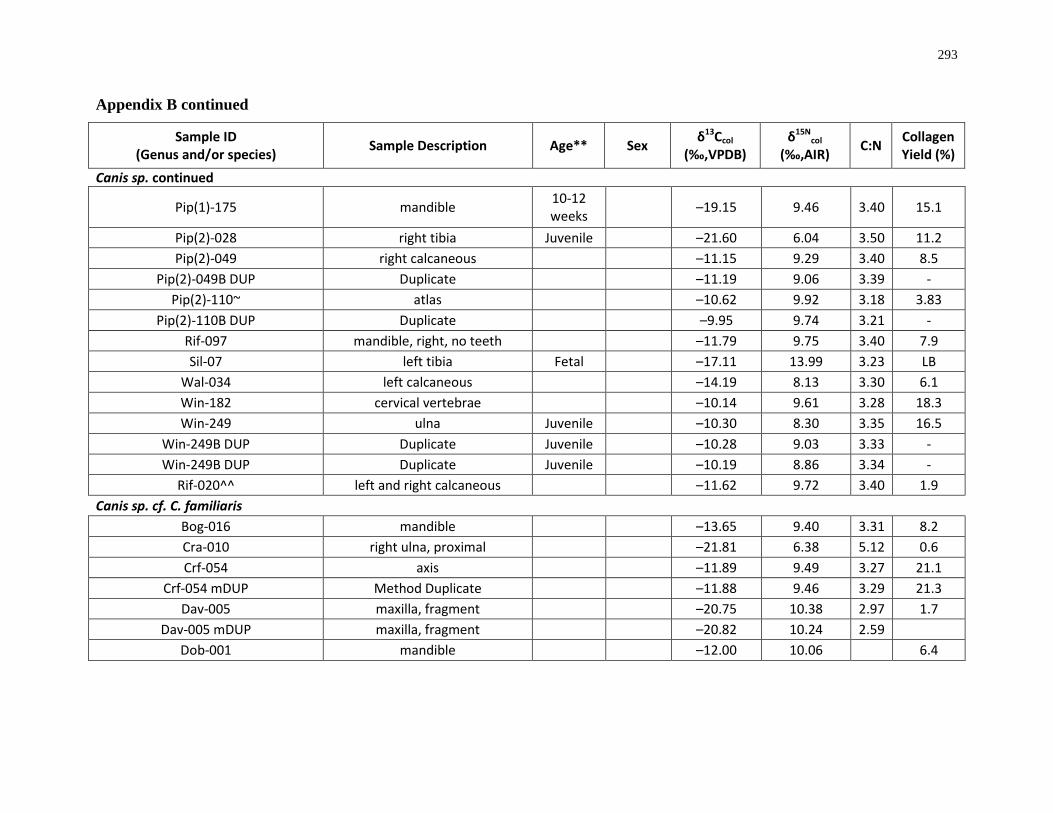
293
Appendix B continued
Sample ID (Genus and/or species) Sample Description Age** Sex δ13Ccol
(‰,VPDB) δ15N
col (‰,AIR) C:N Collagen
Yield (%) Canis sp. continued
Pip(1)-175 mandible 10-12 weeks –19.15 9.46 3.40 15.1
Pip(2)-028 right tibia Juvenile –21.60 6.04 3.50 11.2 Pip(2)-049 right calcaneous –11.15 9.29 3.40 8.5
Pip(2)-049B DUP Duplicate –11.19 9.06 3.39 - Pip(2)-110~ atlas –10.62 9.92 3.18 3.83
Pip(2)-110B DUP Duplicate –9.95 9.74 3.21 - Rif-097 mandible, right, no teeth –11.79 9.75 3.40 7.9 Sil-07 left tibia Fetal –17.11 13.99 3.23 LB
Wal-034 left calcaneous –14.19 8.13 3.30 6.1 Win-182 cervical vertebrae –10.14 9.61 3.28 18.3 Win-249 ulna Juvenile –10.30 8.30 3.35 16.5
Win-249B DUP Duplicate Juvenile –10.28 9.03 3.33 - Win-249B DUP Duplicate Juvenile –10.19 8.86 3.34 -
Rif-020^^ left and right calcaneous –11.62 9.72 3.40 1.9 Canis sp. cf. C. familiaris
Bog-016 mandible –13.65 9.40 3.31 8.2 Cra-010 right ulna, proximal –21.81 6.38 5.12 0.6 Crf-054 axis –11.89 9.49 3.27 21.1
Crf-054 mDUP Method Duplicate –11.88 9.46 3.29 21.3 Dav-005 maxilla, fragment –20.75 10.38 2.97 1.7
Dav-005 mDUP maxilla, fragment –20.82 10.24 2.59 Dob-001 mandible –12.00 10.06 6.4

294
Appendix B continued
Sample ID (Genus and/or species) Sample Description Age** Sex δ13Ccol
(‰,VPDB) δ15N
col (‰,AIR) C:N Collagen
Yield (%) Canis sp. cf. C. familiaris continued
Fon-061 mandible, left –12.78 8.35 3.80 7.3 Fon-117 mandible, right –12.59 8.79 3.38 2.3 Fon-121 mandible, left –14.76 8.97 3.05 19.6 Ham-026 mandible, right –13.21 9.53 3.37 22.2 Ham-027 mandible, right –15.14 9.33 3.39 16.9 Ham-028 mandible, right –13.82 9.65 3.39 9.1 Ham-029 mandible, right –15.82 9.18 3.38 17.8
IWP(01)-027 mandible, right –14.57 9.40 3.13 5.1 IWP(01)-027B mDUP Method Duplicate –15.01 9.38 3.52 5.6
IWP(01)-035 mandible, right –15.58 10.05 3.50 2.2 IWP(09)-091 mandible, left –14.30 10.87 3.42 LB
IWP(09)-091B mDUP mandible, left –14.04 10.44 3.32 LB IWP(12)-01 tibia, complete –16.29 8.99 3.24 5.0 Pip-(1)-138 radius, left complete –10.55 9.81 3.35 12.4
Pip-(1)-138B DUP Duplicate –10.51 9.79 3.36 - Pip(1)-180+ ulna, left complete –11.40 10.87 3.31 17.0 Pip(2)-018 atlas –12.54 9.10 3.20
Pip(2)-018B mDUP atlas –12.54 9.07 3.22 Pip(2)-044 scapula, left –10.93 10.32 3.33 19.2 Pip(2)-087 ulna, right proximal –12.15 10.13 3.32 3.1
Rif-008 Femur, left –10.46 9.22 3.30 19.0 Rif-019 mandible, left –10.82 9.47 3.37 16.0
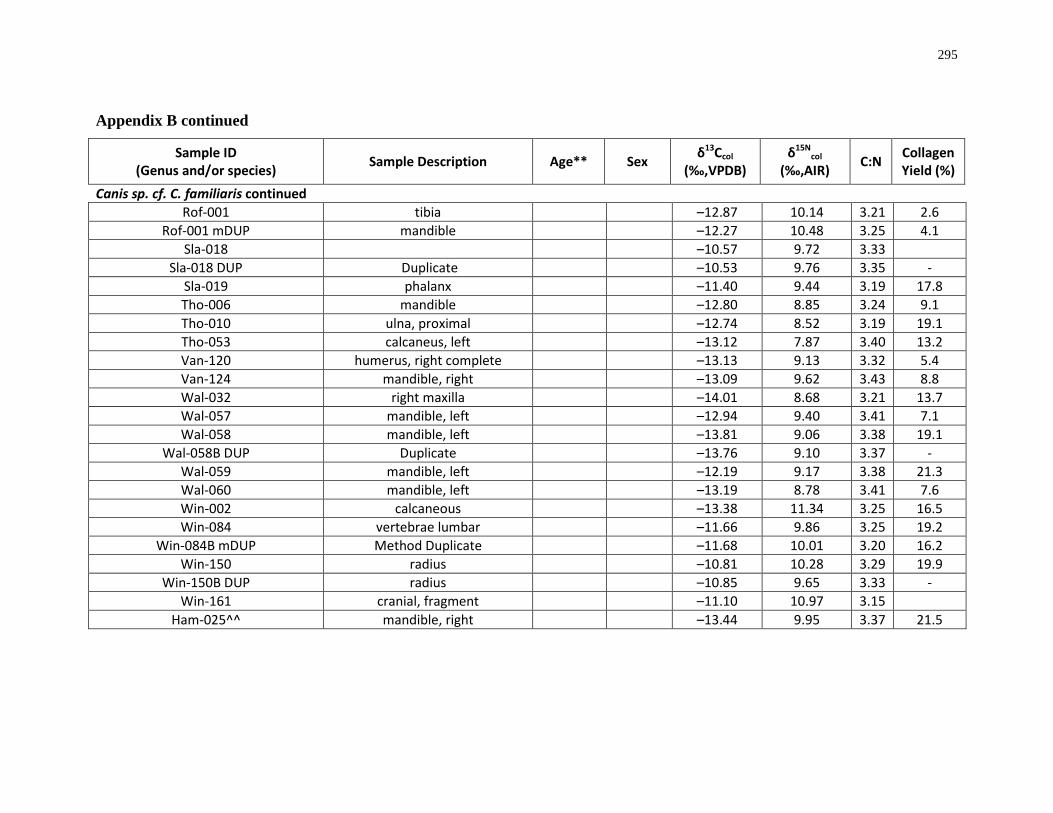
295
Appendix B continued
Sample ID (Genus and/or species) Sample Description Age** Sex δ13Ccol
(‰,VPDB) δ15N
col (‰,AIR) C:N Collagen
Yield (%) Canis sp. cf. C. familiaris continued
Rof-001 tibia –12.87 10.14 3.21 2.6 Rof-001 mDUP mandible –12.27 10.48 3.25 4.1
Sla-018 –10.57 9.72 3.33 Sla-018 DUP Duplicate –10.53 9.76 3.35 -
Sla-019 phalanx –11.40 9.44 3.19 17.8 Tho-006 mandible –12.80 8.85 3.24 9.1 Tho-010 ulna, proximal –12.74 8.52 3.19 19.1 Tho-053 calcaneus, left –13.12 7.87 3.40 13.2 Van-120 humerus, right complete –13.13 9.13 3.32 5.4 Van-124 mandible, right –13.09 9.62 3.43 8.8 Wal-032 right maxilla –14.01 8.68 3.21 13.7 Wal-057 mandible, left –12.94 9.40 3.41 7.1 Wal-058 mandible, left –13.81 9.06 3.38 19.1
Wal-058B DUP Duplicate –13.76 9.10 3.37 - Wal-059 mandible, left –12.19 9.17 3.38 21.3 Wal-060 mandible, left –13.19 8.78 3.41 7.6 Win-002 calcaneous –13.38 11.34 3.25 16.5 Win-084 vertebrae lumbar –11.66 9.86 3.25 19.2
Win-084B mDUP Method Duplicate –11.68 10.01 3.20 16.2 Win-150 radius –10.81 10.28 3.29 19.9
Win-150B DUP radius –10.85 9.65 3.33 - Win-161 cranial, fragment –11.10 10.97 3.15
Ham-025^^ mandible, right –13.44 9.95 3.37 21.5
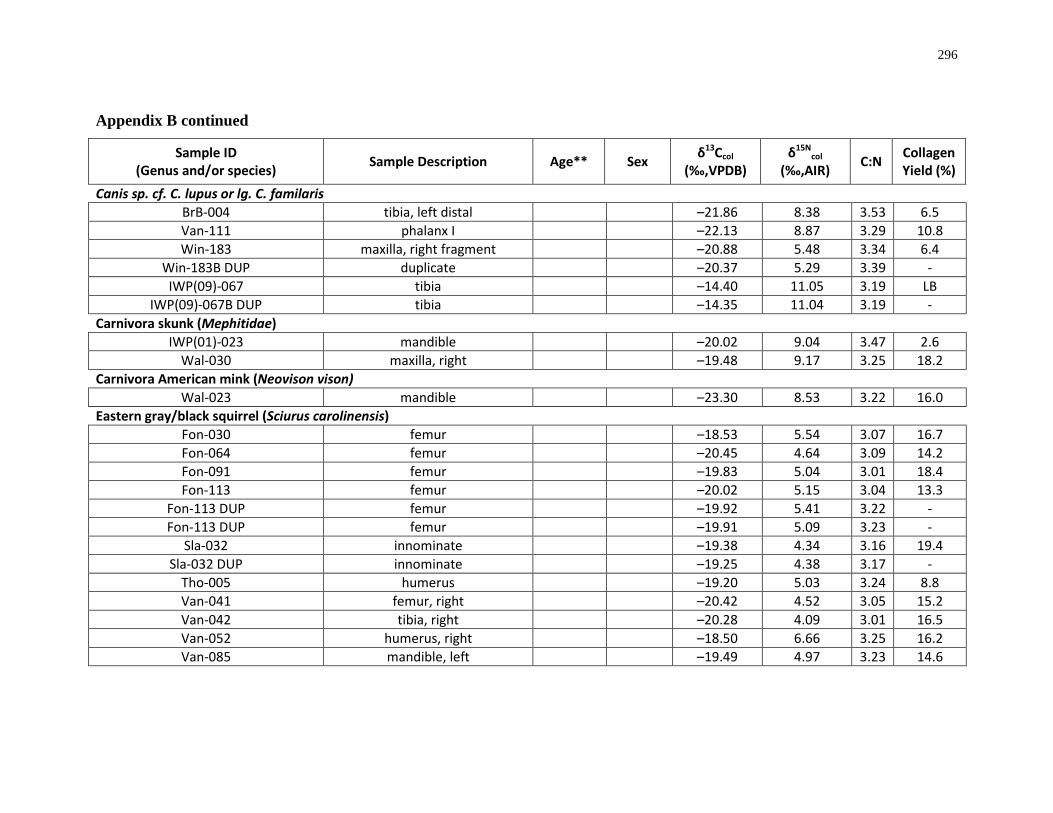
296
Appendix B continued
Sample ID (Genus and/or species) Sample Description Age** Sex δ13Ccol
(‰,VPDB) δ15N
col (‰,AIR) C:N Collagen
Yield (%) Canis sp. cf. C. lupus or lg. C. familaris
BrB-004 tibia, left distal –21.86 8.38 3.53 6.5 Van-111 phalanx I –22.13 8.87 3.29 10.8 Win-183 maxilla, right fragment –20.88 5.48 3.34 6.4
Win-183B DUP duplicate –20.37 5.29 3.39 - IWP(09)-067 tibia –14.40 11.05 3.19 LB
IWP(09)-067B DUP tibia –14.35 11.04 3.19 - Carnivora skunk (Mephitidae)
IWP(01)-023 mandible –20.02 9.04 3.47 2.6 Wal-030 maxilla, right –19.48 9.17 3.25 18.2
Carnivora American mink (Neovison vison) Wal-023 mandible –23.30 8.53 3.22 16.0
Eastern gray/black squirrel (Sciurus carolinensis) Fon-030 femur –18.53 5.54 3.07 16.7 Fon-064 femur –20.45 4.64 3.09 14.2 Fon-091 femur –19.83 5.04 3.01 18.4 Fon-113 femur –20.02 5.15 3.04 13.3
Fon-113 DUP femur –19.92 5.41 3.22 - Fon-113 DUP femur –19.91 5.09 3.23 -
Sla-032 innominate –19.38 4.34 3.16 19.4 Sla-032 DUP innominate –19.25 4.38 3.17 -
Tho-005 humerus –19.20 5.03 3.24 8.8 Van-041 femur, right –20.42 4.52 3.05 15.2 Van-042 tibia, right –20.28 4.09 3.01 16.5 Van-052 humerus, right –18.50 6.66 3.25 16.2 Van-085 mandible, left –19.49 4.97 3.23 14.6
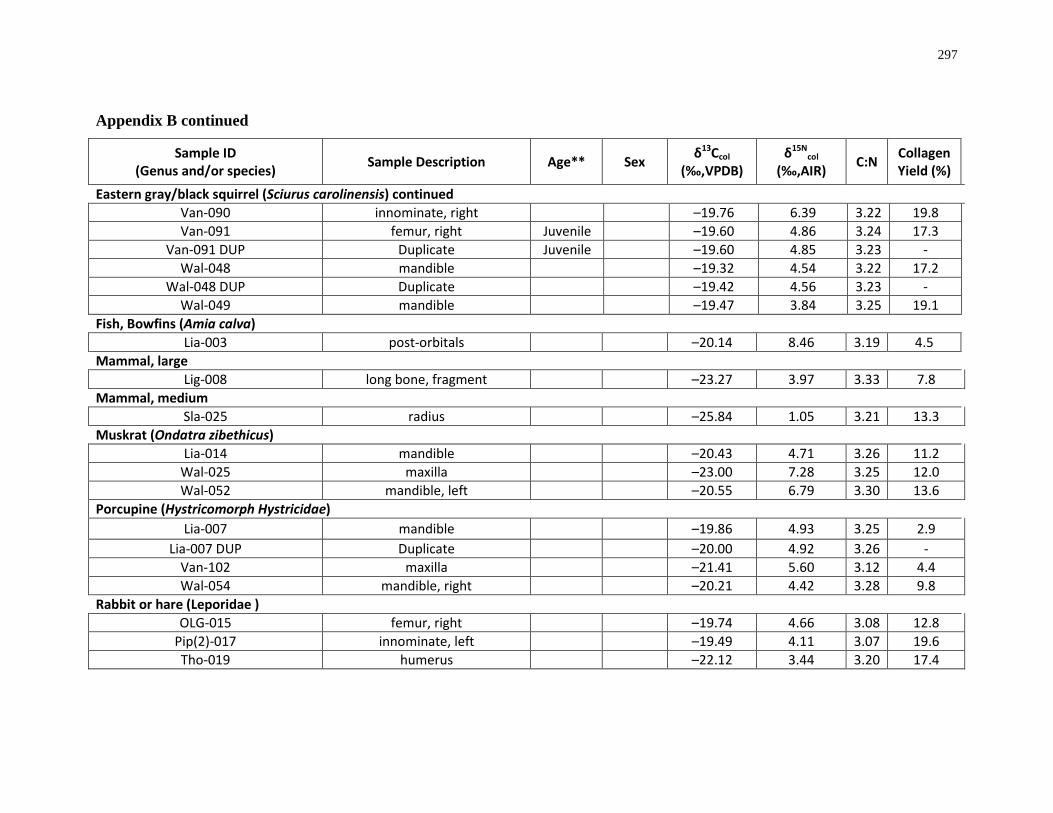
297
Appendix B continued
Sample ID (Genus and/or species) Sample Description Age** Sex δ13Ccol
(‰,VPDB) δ15N
col (‰,AIR) C:N Collagen
Yield (%)
Eastern gray/black squirrel (Sciurus carolinensis) continued Van-090 innominate, right –19.76 6.39 3.22 19.8 Van-091 femur, right Juvenile –19.60 4.86 3.24 17.3
Van-091 DUP Duplicate Juvenile –19.60 4.85 3.23 - Wal-048 mandible –19.32 4.54 3.22 17.2
Wal-048 DUP Duplicate –19.42 4.56 3.23 - Wal-049 mandible –19.47 3.84 3.25 19.1
Fish, Bowfins (Amia calva) Lia-003 post-orbitals –20.14 8.46 3.19 4.5
Mammal, large Lig-008 long bone, fragment –23.27 3.97 3.33 7.8
Mammal, medium Sla-025 radius –25.84 1.05 3.21 13.3
Muskrat (Ondatra zibethicus) Lia-014 mandible –20.43 4.71 3.26 11.2
Wal-025 maxilla –23.00 7.28 3.25 12.0 Wal-052 mandible, left –20.55 6.79 3.30 13.6
Porcupine (Hystricomorph Hystricidae) Lia-007 mandible –19.86 4.93 3.25 2.9
Lia-007 DUP Duplicate –20.00 4.92 3.26 - Van-102 maxilla –21.41 5.60 3.12 4.4 Wal-054 mandible, right –20.21 4.42 3.28 9.8
Rabbit or hare (Leporidae ) OLG-015 femur, right –19.74 4.66 3.08 12.8
Pip(2)-017 innominate, left –19.49 4.11 3.07 19.6 Tho-019 humerus –22.12 3.44 3.20 17.4
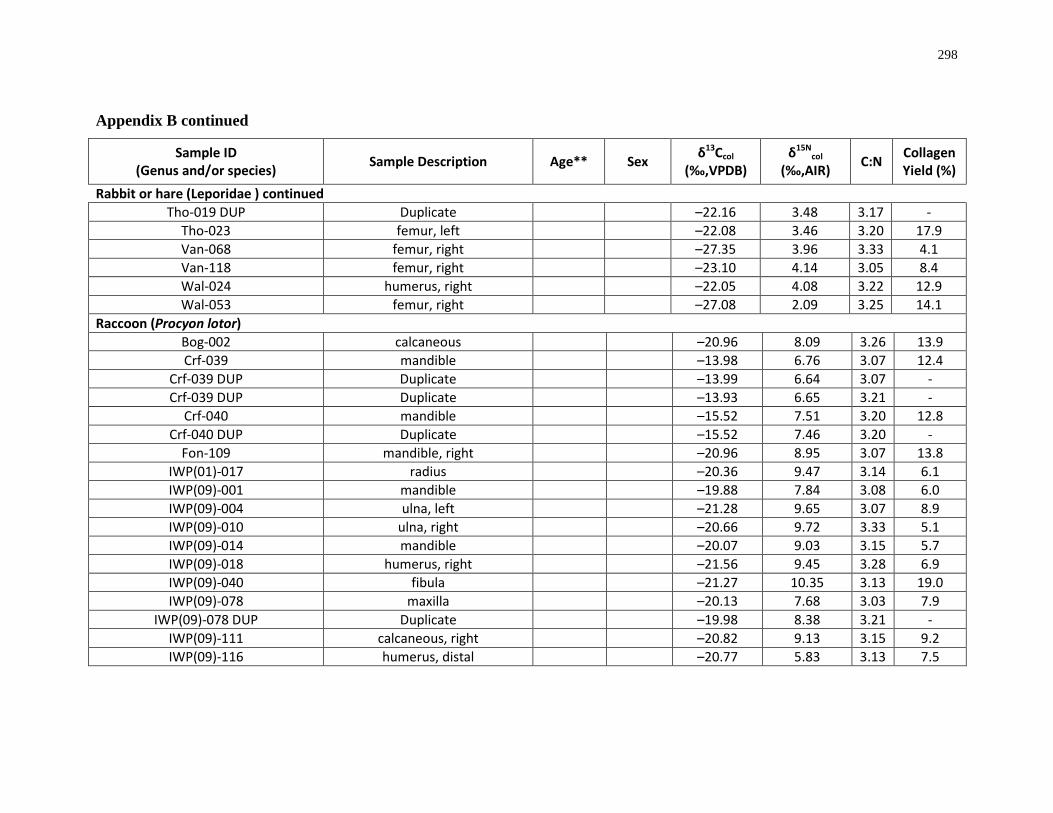
298
Appendix B continued
Sample ID (Genus and/or species) Sample Description Age** Sex δ13Ccol
(‰,VPDB) δ15N
col (‰,AIR) C:N Collagen
Yield (%) Rabbit or hare (Leporidae ) continued
Tho-019 DUP Duplicate –22.16 3.48 3.17 - Tho-023 femur, left –22.08 3.46 3.20 17.9 Van-068 femur, right –27.35 3.96 3.33 4.1 Van-118 femur, right –23.10 4.14 3.05 8.4 Wal-024 humerus, right –22.05 4.08 3.22 12.9 Wal-053 femur, right –27.08 2.09 3.25 14.1
Raccoon (Procyon lotor) Bog-002 calcaneous –20.96 8.09 3.26 13.9 Crf-039 mandible –13.98 6.76 3.07 12.4
Crf-039 DUP Duplicate –13.99 6.64 3.07 - Crf-039 DUP Duplicate –13.93 6.65 3.21 -
Crf-040 mandible –15.52 7.51 3.20 12.8 Crf-040 DUP Duplicate –15.52 7.46 3.20 -
Fon-109 mandible, right –20.96 8.95 3.07 13.8 IWP(01)-017 radius –20.36 9.47 3.14 6.1 IWP(09)-001 mandible –19.88 7.84 3.08 6.0 IWP(09)-004 ulna, left –21.28 9.65 3.07 8.9 IWP(09)-010 ulna, right –20.66 9.72 3.33 5.1 IWP(09)-014 mandible –20.07 9.03 3.15 5.7 IWP(09)-018 humerus, right –21.56 9.45 3.28 6.9 IWP(09)-040 fibula –21.27 10.35 3.13 19.0 IWP(09)-078 maxilla –20.13 7.68 3.03 7.9
IWP(09)-078 DUP Duplicate –19.98 8.38 3.21 - IWP(09)-111 calcaneous, right –20.82 9.13 3.15 9.2 IWP(09)-116 humerus, distal –20.77 5.83 3.13 7.5
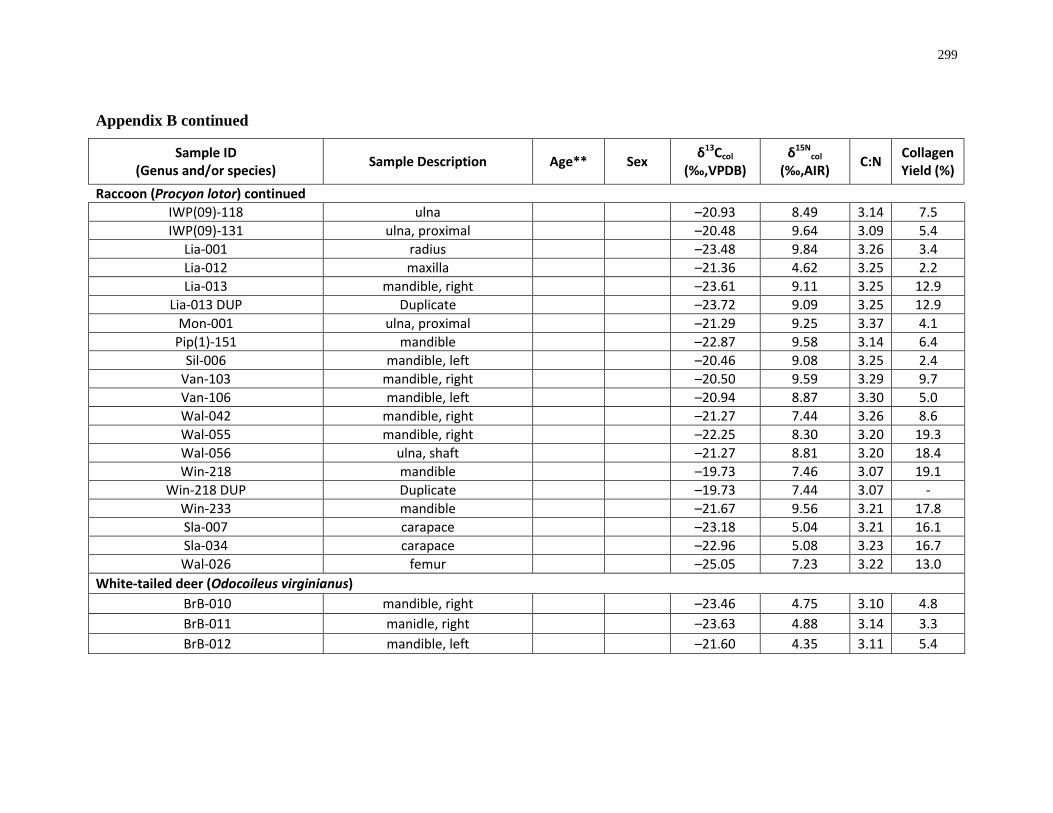
299
Appendix B continued
Sample ID (Genus and/or species) Sample Description Age** Sex δ13Ccol
(‰,VPDB) δ15N
col (‰,AIR) C:N Collagen
Yield (%) Raccoon (Procyon lotor) continued
IWP(09)-118 ulna –20.93 8.49 3.14 7.5 IWP(09)-131 ulna, proximal –20.48 9.64 3.09 5.4
Lia-001 radius –23.48 9.84 3.26 3.4 Lia-012 maxilla –21.36 4.62 3.25 2.2 Lia-013 mandible, right –23.61 9.11 3.25 12.9
Lia-013 DUP Duplicate –23.72 9.09 3.25 12.9 Mon-001 ulna, proximal –21.29 9.25 3.37 4.1
Pip(1)-151 mandible –22.87 9.58 3.14 6.4 Sil-006 mandible, left –20.46 9.08 3.25 2.4
Van-103 mandible, right –20.50 9.59 3.29 9.7 Van-106 mandible, left –20.94 8.87 3.30 5.0 Wal-042 mandible, right –21.27 7.44 3.26 8.6 Wal-055 mandible, right –22.25 8.30 3.20 19.3 Wal-056 ulna, shaft –21.27 8.81 3.20 18.4 Win-218 mandible –19.73 7.46 3.07 19.1
Win-218 DUP Duplicate –19.73 7.44 3.07 - Win-233 mandible –21.67 9.56 3.21 17.8 Sla-007 carapace –23.18 5.04 3.21 16.1 Sla-034 carapace –22.96 5.08 3.23 16.7 Wal-026 femur –25.05 7.23 3.22 13.0
White-tailed deer (Odocoileus virginianus) BrB-010 mandible, right –23.46 4.75 3.10 4.8 BrB-011 manidle, right –23.63 4.88 3.14 3.3 BrB-012 mandible, left –21.60 4.35 3.11 5.4
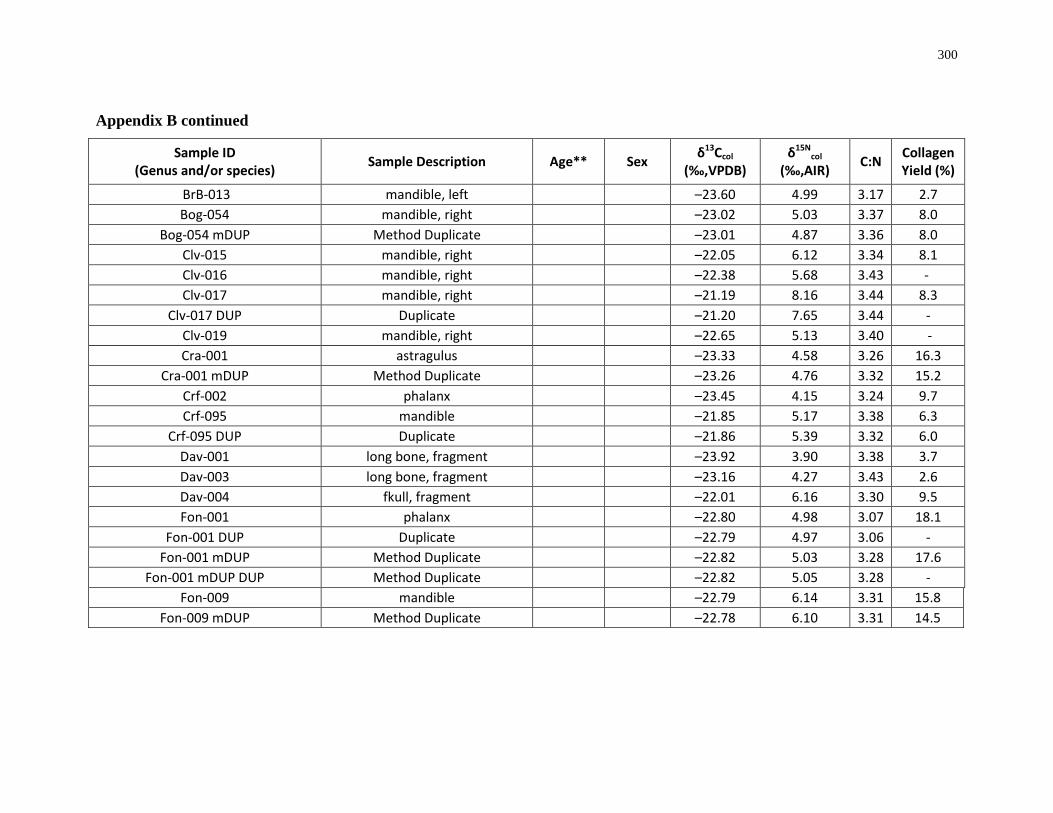
300
Appendix B continued
Sample ID (Genus and/or species) Sample Description Age** Sex δ13Ccol
(‰,VPDB) δ15N
col (‰,AIR) C:N Collagen
Yield (%)
BrB-013 mandible, left –23.60 4.99 3.17 2.7 Bog-054 mandible, right –23.02 5.03 3.37 8.0
Bog-054 mDUP Method Duplicate –23.01 4.87 3.36 8.0 Clv-015 mandible, right –22.05 6.12 3.34 8.1 Clv-016 mandible, right –22.38 5.68 3.43 - Clv-017 mandible, right –21.19 8.16 3.44 8.3
Clv-017 DUP Duplicate –21.20 7.65 3.44 - Clv-019 mandible, right –22.65 5.13 3.40 - Cra-001 astragulus –23.33 4.58 3.26 16.3
Cra-001 mDUP Method Duplicate –23.26 4.76 3.32 15.2 Crf-002 phalanx –23.45 4.15 3.24 9.7 Crf-095 mandible –21.85 5.17 3.38 6.3
Crf-095 DUP Duplicate –21.86 5.39 3.32 6.0 Dav-001 long bone, fragment –23.92 3.90 3.38 3.7 Dav-003 long bone, fragment –23.16 4.27 3.43 2.6 Dav-004 fkull, fragment –22.01 6.16 3.30 9.5 Fon-001 phalanx –22.80 4.98 3.07 18.1
Fon-001 DUP Duplicate –22.79 4.97 3.06 - Fon-001 mDUP Method Duplicate –22.82 5.03 3.28 17.6
Fon-001 mDUP DUP Method Duplicate –22.82 5.05 3.28 - Fon-009 mandible –22.79 6.14 3.31 15.8
Fon-009 mDUP Method Duplicate –22.78 6.10 3.31 14.5
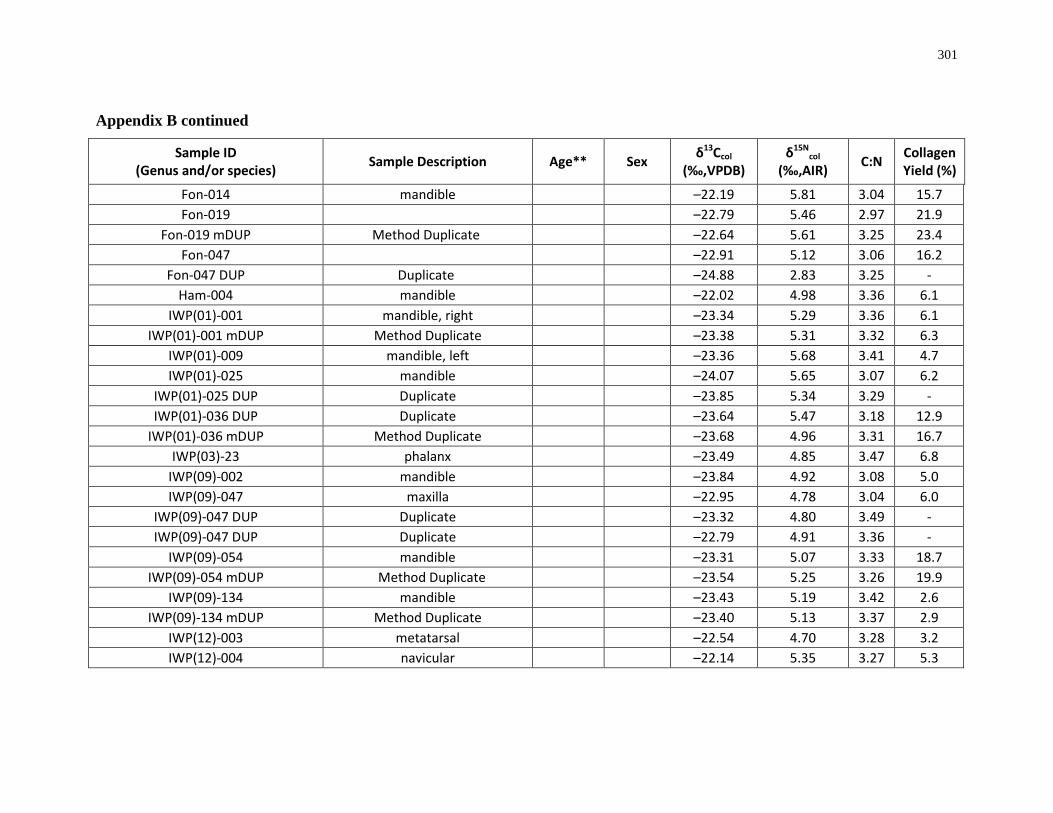
301
Appendix B continued
Sample ID (Genus and/or species) Sample Description Age** Sex δ13Ccol
(‰,VPDB) δ15N
col (‰,AIR) C:N Collagen
Yield (%)
Fon-014 mandible –22.19 5.81 3.04 15.7 Fon-019 –22.79 5.46 2.97 21.9
Fon-019 mDUP Method Duplicate –22.64 5.61 3.25 23.4 Fon-047 –22.91 5.12 3.06 16.2
Fon-047 DUP Duplicate –24.88 2.83 3.25 - Ham-004 mandible –22.02 4.98 3.36 6.1
IWP(01)-001 mandible, right –23.34 5.29 3.36 6.1 IWP(01)-001 mDUP Method Duplicate –23.38 5.31 3.32 6.3
IWP(01)-009 mandible, left –23.36 5.68 3.41 4.7 IWP(01)-025 mandible –24.07 5.65 3.07 6.2
IWP(01)-025 DUP Duplicate –23.85 5.34 3.29 - IWP(01)-036 DUP Duplicate –23.64 5.47 3.18 12.9
IWP(01)-036 mDUP Method Duplicate –23.68 4.96 3.31 16.7 IWP(03)-23 phalanx –23.49 4.85 3.47 6.8
IWP(09)-002 mandible –23.84 4.92 3.08 5.0 IWP(09)-047 maxilla –22.95 4.78 3.04 6.0
IWP(09)-047 DUP Duplicate –23.32 4.80 3.49 - IWP(09)-047 DUP Duplicate –22.79 4.91 3.36 -
IWP(09)-054 mandible –23.31 5.07 3.33 18.7 IWP(09)-054 mDUP Method Duplicate –23.54 5.25 3.26 19.9
IWP(09)-134 mandible –23.43 5.19 3.42 2.6 IWP(09)-134 mDUP Method Duplicate –23.40 5.13 3.37 2.9
IWP(12)-003 metatarsal –22.54 4.70 3.28 3.2 IWP(12)-004 navicular –22.14 5.35 3.27 5.3
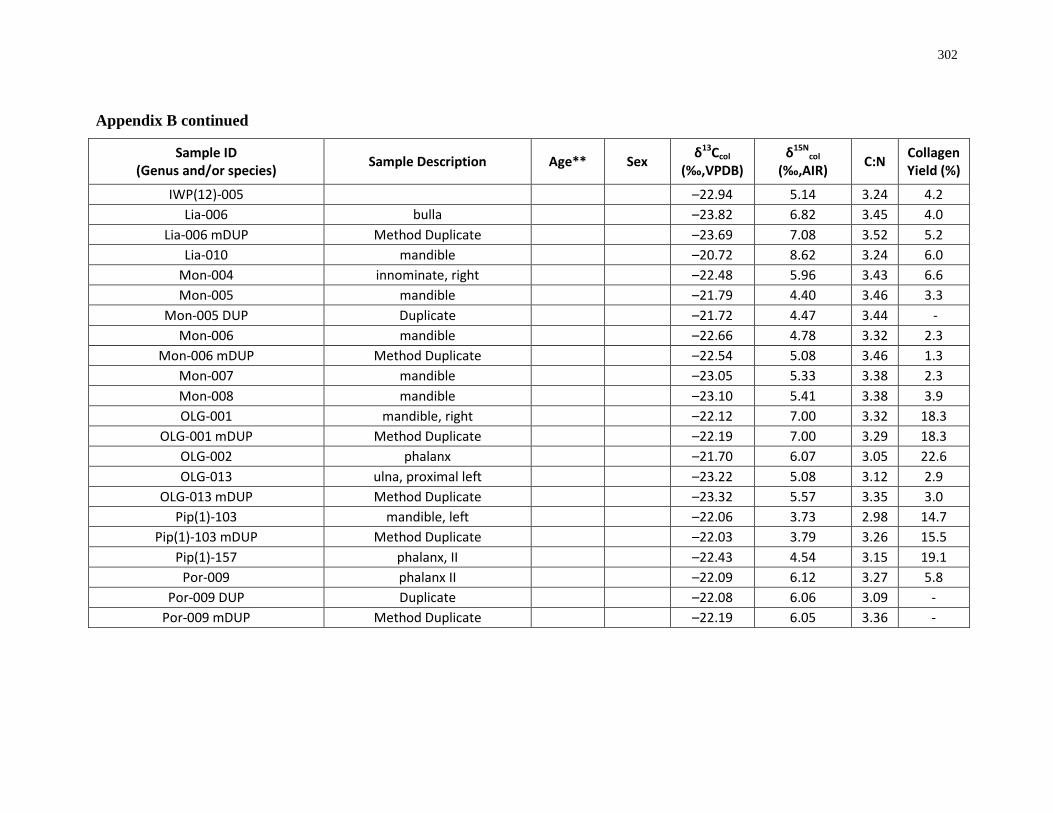
302
Appendix B continued
Sample ID (Genus and/or species) Sample Description Age** Sex δ13Ccol
(‰,VPDB) δ15N
col (‰,AIR) C:N Collagen
Yield (%)
IWP(12)-005 –22.94 5.14 3.24 4.2 Lia-006 bulla –23.82 6.82 3.45 4.0
Lia-006 mDUP Method Duplicate –23.69 7.08 3.52 5.2 Lia-010 mandible –20.72 8.62 3.24 6.0
Mon-004 innominate, right –22.48 5.96 3.43 6.6 Mon-005 mandible –21.79 4.40 3.46 3.3
Mon-005 DUP Duplicate –21.72 4.47 3.44 - Mon-006 mandible –22.66 4.78 3.32 2.3
Mon-006 mDUP Method Duplicate –22.54 5.08 3.46 1.3 Mon-007 mandible –23.05 5.33 3.38 2.3 Mon-008 mandible –23.10 5.41 3.38 3.9 OLG-001 mandible, right –22.12 7.00 3.32 18.3
OLG-001 mDUP Method Duplicate –22.19 7.00 3.29 18.3 OLG-002 phalanx –21.70 6.07 3.05 22.6 OLG-013 ulna, proximal left –23.22 5.08 3.12 2.9
OLG-013 mDUP Method Duplicate –23.32 5.57 3.35 3.0 Pip(1)-103 mandible, left –22.06 3.73 2.98 14.7
Pip(1)-103 mDUP Method Duplicate –22.03 3.79 3.26 15.5 Pip(1)-157 phalanx, II –22.43 4.54 3.15 19.1
Por-009 phalanx II –22.09 6.12 3.27 5.8 Por-009 DUP Duplicate –22.08 6.06 3.09 -
Por-009 mDUP Method Duplicate –22.19 6.05 3.36 -

303
Appendix B continued
Sample ID (Genus and/or species) Sample Description Age** Sex δ13Ccol
(‰,VPDB) δ15N
col (‰,AIR) C:N Collagen
Yield (%)
Por-017 carpal, left radial –22.13 5.01 3.12 6.3 Por-017 mDUP Method Duplicate –21.99 5.04 3.31 6.5
Pri-008 astragulus, right –23.05 4.95 3.16 9.6 Pri-017 vertebrae, cervical –22.35 4.91 3.19 8.4
Pri-017 DUP Duplicate –20.24 5.85 3.01 - Pri-019 tibia, distal, left –22.54 4.41 3.16 8.1
Pri-019 DUP Duplicate –22.46 2.99 3.19 - Rif-007 mandible –21.25 8.23 3.92 4.0
Rif-007 mDUP Method Duplicate –21.32 8.05 3.27 3.9 Rif-077 mandible –22.65 6.80 3.40 6.3 Sil-019 –22.65 5.54 3.34 2.4
Sil-019 DUP Duplicate –23.25 5.48 3.29 - Sil-026 –23.81 6.09 3.34 4.0
Sil-026 DUP Duplicate –23.95 6.17 3.24 - Sla-017 carpal –24.18 5.82 3.06 19.3 Tho-002 humerus, distal –22.07 5.73 3.30 4.9 Tho-012 phalanx –22.08 5.75 3.08 12.7
Tho-012 mDUP Method Duplicate –22.00 5.87 3.31 13.2 Tho-018 ulna, proximal –22.07 5.69 3.30 10.2 Van-001 astragulus, right –23.00 5.52 3.09 5.3
Van-001 mDUP Method Duplicate –23.03 5.82 3.35 4.7 Van-003 astragulus, right –21.82 4.49 3.06 3.1
Van003 mDUP Method Duplicate –21.82 4.47 3.44 1.6 Van-018 maxilla, left –21.45 6.33 3.33 4.7
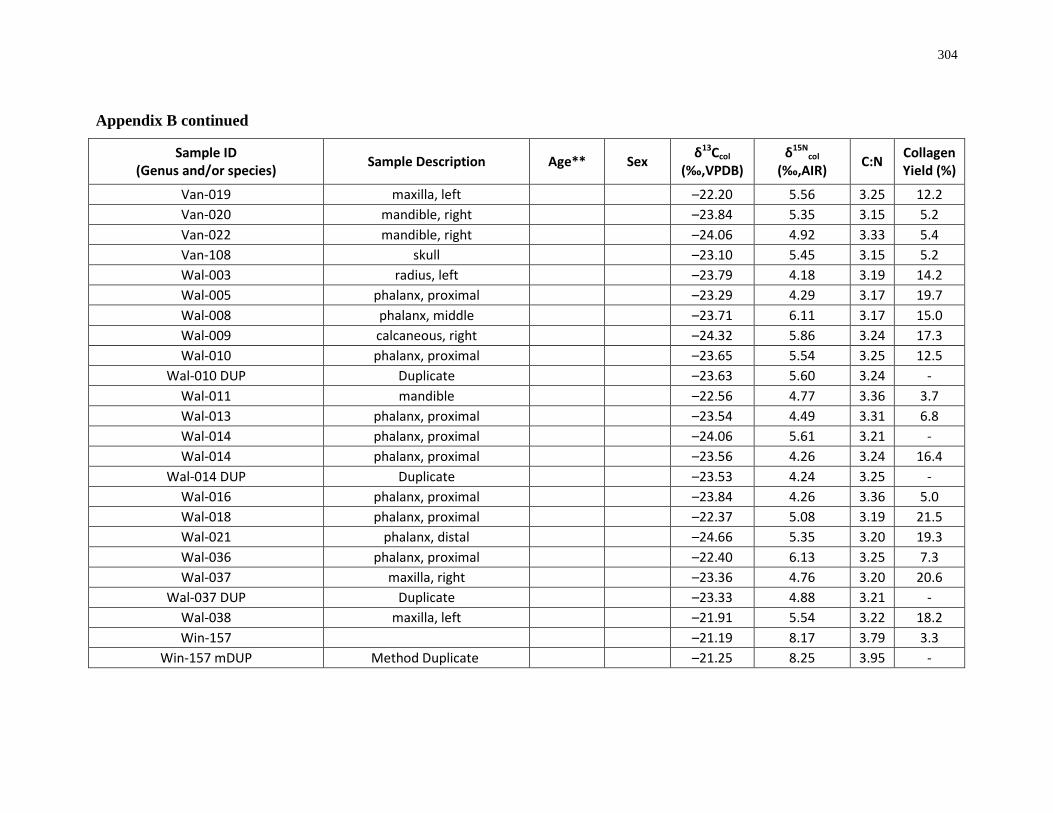
304
Appendix B continued
Sample ID (Genus and/or species) Sample Description Age** Sex δ13Ccol
(‰,VPDB) δ15N
col (‰,AIR) C:N Collagen
Yield (%)
Van-019 maxilla, left –22.20 5.56 3.25 12.2 Van-020 mandible, right –23.84 5.35 3.15 5.2 Van-022 mandible, right –24.06 4.92 3.33 5.4 Van-108 skull –23.10 5.45 3.15 5.2 Wal-003 radius, left –23.79 4.18 3.19 14.2 Wal-005 phalanx, proximal –23.29 4.29 3.17 19.7 Wal-008 phalanx, middle –23.71 6.11 3.17 15.0 Wal-009 calcaneous, right –24.32 5.86 3.24 17.3 Wal-010 phalanx, proximal –23.65 5.54 3.25 12.5
Wal-010 DUP Duplicate –23.63 5.60 3.24 - Wal-011 mandible –22.56 4.77 3.36 3.7 Wal-013 phalanx, proximal –23.54 4.49 3.31 6.8 Wal-014 phalanx, proximal –24.06 5.61 3.21 - Wal-014 phalanx, proximal –23.56 4.26 3.24 16.4
Wal-014 DUP Duplicate –23.53 4.24 3.25 - Wal-016 phalanx, proximal –23.84 4.26 3.36 5.0 Wal-018 phalanx, proximal –22.37 5.08 3.19 21.5 Wal-021 phalanx, distal –24.66 5.35 3.20 19.3 Wal-036 phalanx, proximal –22.40 6.13 3.25 7.3 Wal-037 maxilla, right –23.36 4.76 3.20 20.6
Wal-037 DUP Duplicate –23.33 4.88 3.21 - Wal-038 maxilla, left –21.91 5.54 3.22 18.2 Win-157 –21.19 8.17 3.79 3.3
Win-157 mDUP Method Duplicate –21.25 8.25 3.95 -
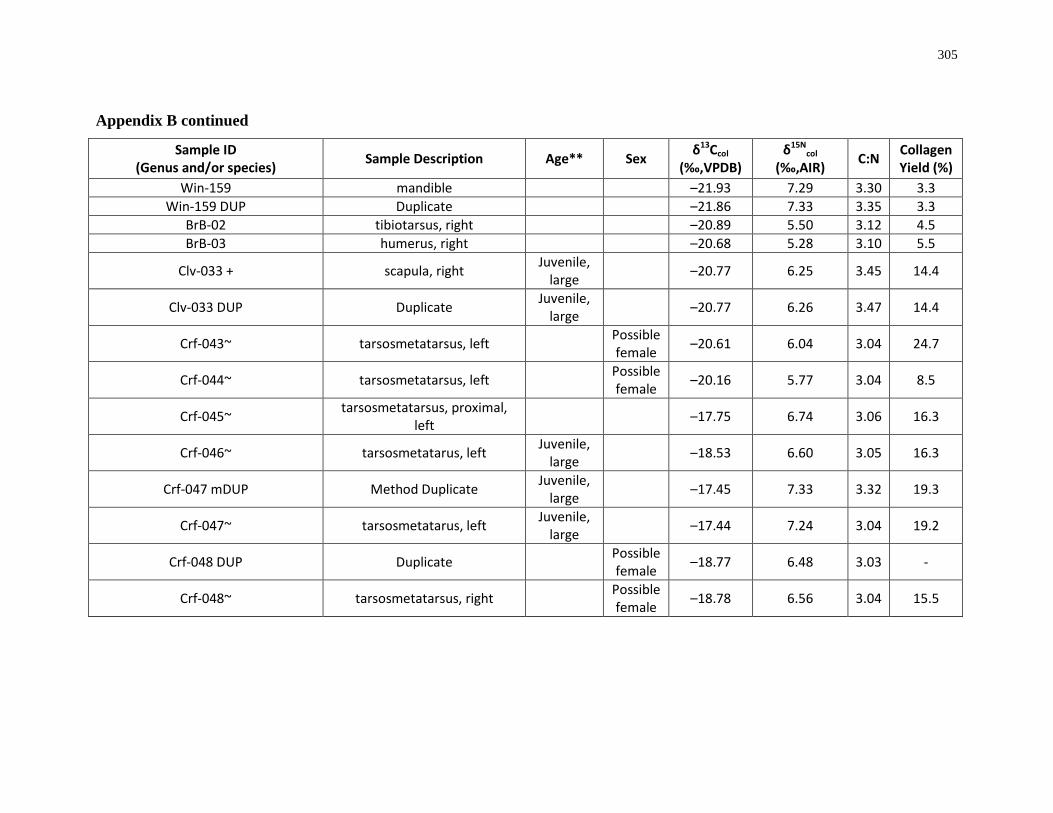
305
Appendix B continued
Sample ID (Genus and/or species) Sample Description Age** Sex δ13Ccol
(‰,VPDB) δ15N
col (‰,AIR) C:N Collagen
Yield (%) Win-159 mandible –21.93 7.29 3.30 3.3
Win-159 DUP Duplicate –21.86 7.33 3.35 3.3 BrB-02 tibiotarsus, right –20.89 5.50 3.12 4.5 BrB-03 humerus, right –20.68 5.28 3.10 5.5
Clv-033 + scapula, right Juvenile, large –20.77 6.25 3.45 14.4
Clv-033 DUP Duplicate Juvenile, large –20.77 6.26 3.47 14.4
Crf-043~ tarsosmetatarsus, left Possible female –20.61 6.04 3.04 24.7
Crf-044~ tarsosmetatarsus, left Possible female –20.16 5.77 3.04 8.5
Crf-045~ tarsosmetatarsus, proximal, left –17.75 6.74 3.06 16.3
Crf-046~ tarsosmetatarus, left Juvenile, large –18.53 6.60 3.05 16.3
Crf-047 mDUP Method Duplicate Juvenile, large –17.45 7.33 3.32 19.3
Crf-047~ tarsosmetatarus, left Juvenile, large –17.44 7.24 3.04 19.2
Crf-048 DUP Duplicate Possible female –18.77 6.48 3.03 -
Crf-048~ tarsosmetatarsus, right Possible female –18.78 6.56 3.04 15.5

306
Appendix B continued
Sample ID (Genus and/or species) Sample Description Age** Sex δ13Ccol
(‰,VPDB) δ15N
col (‰,AIR) C:N Collagen
Yield (%)
Crf-051~ tarsosmetatarsus, right 4 + years Probable male –20.92 6.17 3.09 6.7
Fon-020 carpometacarpus, left –21.59 6.31 3.09 7.0 Fon-020 mDUP Method Duplicate –21.65 6.80 3.41 7.0
Fon-020 mDUP DUP Duplicate –21.63 6.67 3.41 - Fon-033 foot phalanx –21.01 6.90 3.23 23.3
Fon-033 DUP foot phalanx –21.01 6.94 3.22 - Fon-104 foot phalanx –21.29 5.39 3.10 9.0 Ham-05 humerus, right distal –9.93 8.17 3.32 16.5
Ham-05 DUP Duplicate –9.83 7.89 3.36 - Ham-05 mDUP Method Duplicate –10.23 7.91 3.29 15.3
Ham-06 coracoid –19.80 6.25 3.42 12.9
Ham-07 long bone frag (id'd by McMaster) –20.64 6.13 3.34 15.1
Ham-07 mDUP Method Duplicate –20.72 6.17 3.32 14.5
Ham-08 coracoid, left Juvenile, large –17.08 6.75 3.39 18.1
Ham-09~ coracoid, distal, left Possible female –19.59 6.39 3.44 12.4
Ham-10~ humerus, right Juvenile, large –22.83 4.88 3.47 13.0
Ham-11~ coracoid, left Juvenile, large –19.13 5.55 3.37 16.9
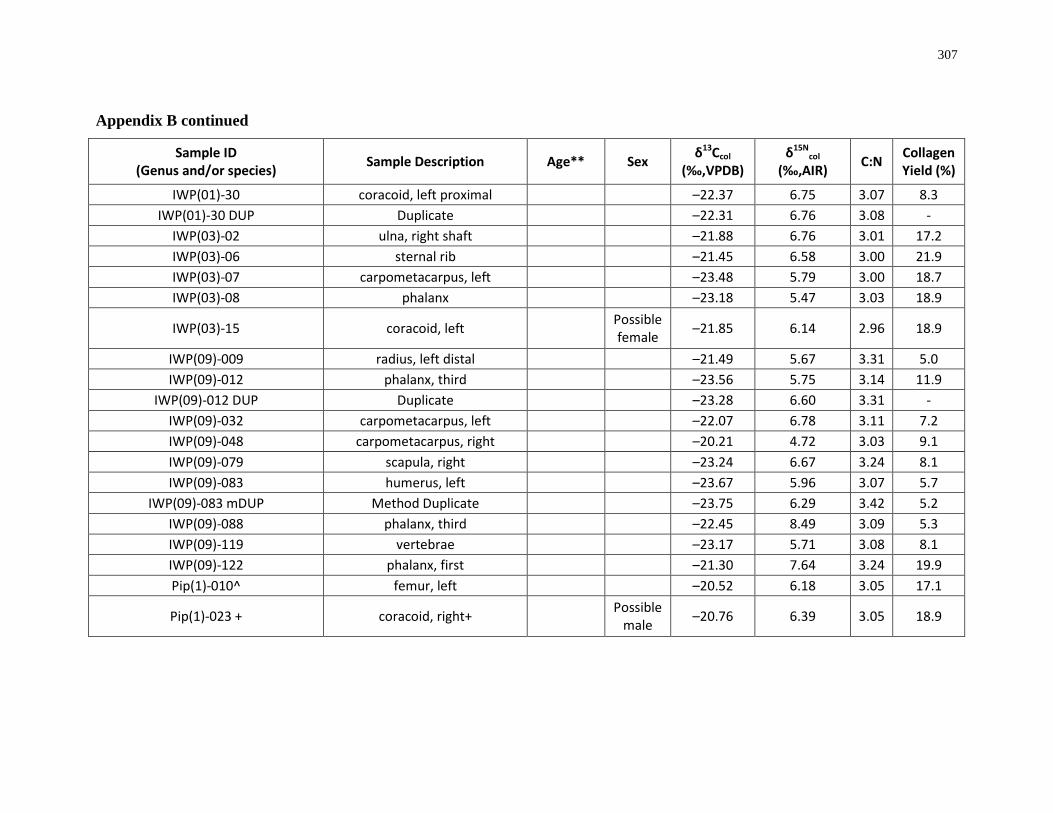
307
Appendix B continued
Sample ID (Genus and/or species) Sample Description Age** Sex δ13Ccol
(‰,VPDB) δ15N
col (‰,AIR) C:N Collagen
Yield (%)
IWP(01)-30 coracoid, left proximal –22.37 6.75 3.07 8.3 IWP(01)-30 DUP Duplicate –22.31 6.76 3.08 -
IWP(03)-02 ulna, right shaft –21.88 6.76 3.01 17.2 IWP(03)-06 sternal rib –21.45 6.58 3.00 21.9 IWP(03)-07 carpometacarpus, left –23.48 5.79 3.00 18.7 IWP(03)-08 phalanx –23.18 5.47 3.03 18.9
IWP(03)-15 coracoid, left Possible female –21.85 6.14 2.96 18.9
IWP(09)-009 radius, left distal –21.49 5.67 3.31 5.0 IWP(09)-012 phalanx, third –23.56 5.75 3.14 11.9
IWP(09)-012 DUP Duplicate –23.28 6.60 3.31 - IWP(09)-032 carpometacarpus, left –22.07 6.78 3.11 7.2 IWP(09)-048 carpometacarpus, right –20.21 4.72 3.03 9.1 IWP(09)-079 scapula, right –23.24 6.67 3.24 8.1 IWP(09)-083 humerus, left –23.67 5.96 3.07 5.7
IWP(09)-083 mDUP Method Duplicate –23.75 6.29 3.42 5.2 IWP(09)-088 phalanx, third –22.45 8.49 3.09 5.3 IWP(09)-119 vertebrae –23.17 5.71 3.08 8.1 IWP(09)-122 phalanx, first –21.30 7.64 3.24 19.9 Pip(1)-010^ femur, left –20.52 6.18 3.05 17.1
Pip(1)-023 + coracoid, right+ Possible male –20.76 6.39 3.05 18.9
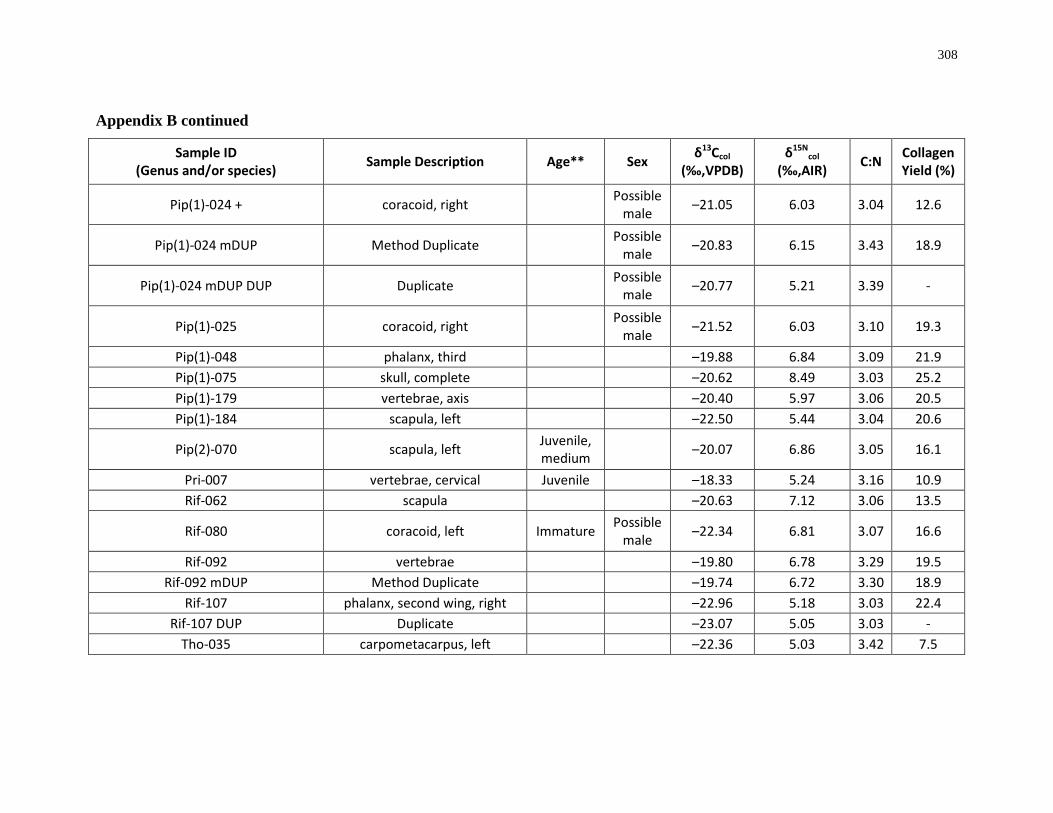
308
Appendix B continued
Sample ID (Genus and/or species) Sample Description Age** Sex δ13Ccol
(‰,VPDB) δ15N
col (‰,AIR) C:N Collagen
Yield (%)
Pip(1)-024 + coracoid, right Possible male –21.05 6.03 3.04 12.6
Pip(1)-024 mDUP Method Duplicate Possible male –20.83 6.15 3.43 18.9
Pip(1)-024 mDUP DUP Duplicate Possible male –20.77 5.21 3.39 -
Pip(1)-025 coracoid, right Possible male –21.52 6.03 3.10 19.3
Pip(1)-048 phalanx, third –19.88 6.84 3.09 21.9 Pip(1)-075 skull, complete –20.62 8.49 3.03 25.2 Pip(1)-179 vertebrae, axis –20.40 5.97 3.06 20.5 Pip(1)-184 scapula, left –22.50 5.44 3.04 20.6
Pip(2)-070 scapula, left Juvenile, medium –20.07 6.86 3.05 16.1
Pri-007 vertebrae, cervical Juvenile –18.33 5.24 3.16 10.9 Rif-062 scapula –20.63 7.12 3.06 13.5
Rif-080 coracoid, left Immature Possible male –22.34 6.81 3.07 16.6
Rif-092 vertebrae –19.80 6.78 3.29 19.5 Rif-092 mDUP Method Duplicate –19.74 6.72 3.30 18.9
Rif-107 phalanx, second wing, right –22.96 5.18 3.03 22.4 Rif-107 DUP Duplicate –23.07 5.05 3.03 -
Tho-035 carpometacarpus, left –22.36 5.03 3.42 7.5
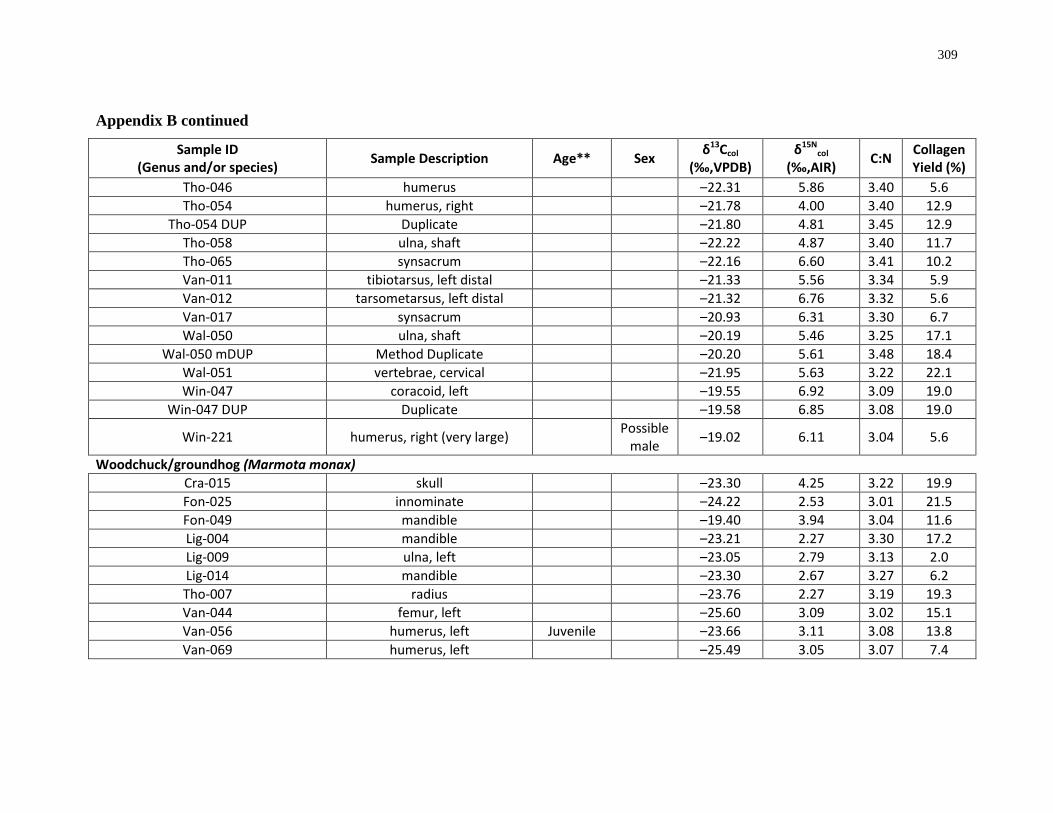
309
Appendix B continued
Sample ID (Genus and/or species) Sample Description Age** Sex δ13Ccol
(‰,VPDB) δ15N
col (‰,AIR) C:N Collagen
Yield (%) Tho-046 humerus –22.31 5.86 3.40 5.6 Tho-054 humerus, right –21.78 4.00 3.40 12.9
Tho-054 DUP Duplicate –21.80 4.81 3.45 12.9 Tho-058 ulna, shaft –22.22 4.87 3.40 11.7 Tho-065 synsacrum –22.16 6.60 3.41 10.2 Van-011 tibiotarsus, left distal –21.33 5.56 3.34 5.9 Van-012 tarsometarsus, left distal –21.32 6.76 3.32 5.6 Van-017 synsacrum –20.93 6.31 3.30 6.7 Wal-050 ulna, shaft –20.19 5.46 3.25 17.1
Wal-050 mDUP Method Duplicate –20.20 5.61 3.48 18.4 Wal-051 vertebrae, cervical –21.95 5.63 3.22 22.1 Win-047 coracoid, left –19.55 6.92 3.09 19.0
Win-047 DUP Duplicate –19.58 6.85 3.08 19.0
Win-221 humerus, right (very large) Possible male –19.02 6.11 3.04 5.6
Woodchuck/groundhog (Marmota monax) Cra-015 skull –23.30 4.25 3.22 19.9 Fon-025 innominate –24.22 2.53 3.01 21.5 Fon-049 mandible –19.40 3.94 3.04 11.6 Lig-004 mandible –23.21 2.27 3.30 17.2 Lig-009 ulna, left –23.05 2.79 3.13 2.0 Lig-014 mandible –23.30 2.67 3.27 6.2 Tho-007 radius –23.76 2.27 3.19 19.3 Van-044 femur, left –25.60 3.09 3.02 15.1 Van-056 humerus, left Juvenile –23.66 3.11 3.08 13.8 Van-069 humerus, left –25.49 3.05 3.07 7.4
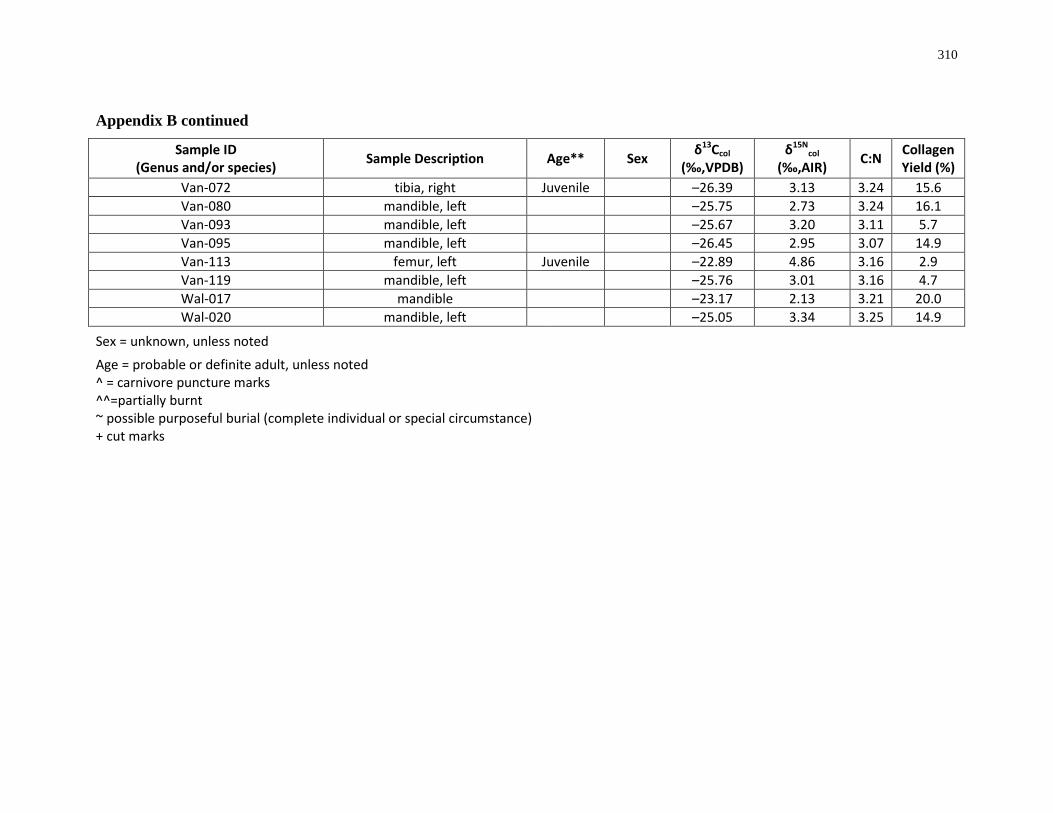
310
Appendix B continued
Sample ID (Genus and/or species) Sample Description Age** Sex δ13Ccol
(‰,VPDB) δ15N
col (‰,AIR) C:N Collagen
Yield (%) Van-072 tibia, right Juvenile –26.39 3.13 3.24 15.6 Van-080 mandible, left –25.75 2.73 3.24 16.1 Van-093 mandible, left –25.67 3.20 3.11 5.7 Van-095 mandible, left –26.45 2.95 3.07 14.9 Van-113 femur, left Juvenile –22.89 4.86 3.16 2.9 Van-119 mandible, left –25.76 3.01 3.16 4.7 Wal-017 mandible –23.17 2.13 3.21 20.0 Wal-020 mandible, left –25.05 3.34 3.25 14.9
Sex = unknown, unless noted Age = probable or definite adult, unless noted ^ = carnivore puncture marks
^^=partially burnt ~ possible purposeful burial (complete individual or special circumstance) + cut marks
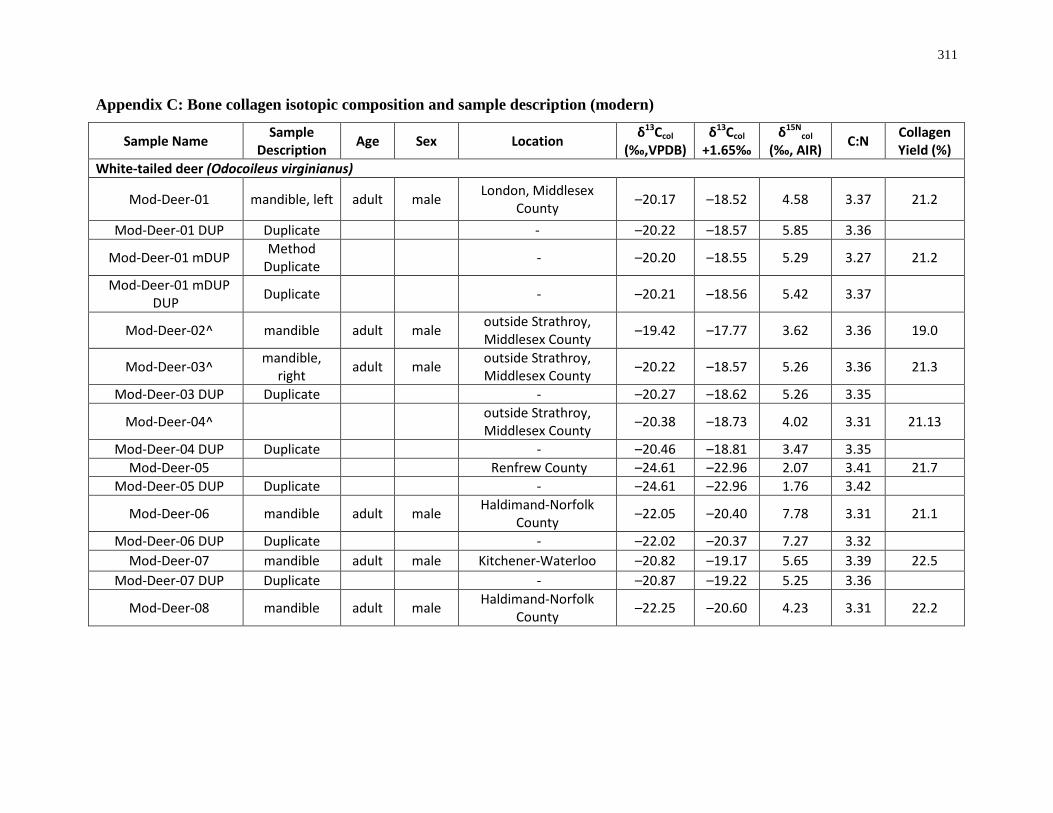
311
Appendix C: Bone collagen isotopic composition and sample description (modern)
Sample Name Sample Description Age Sex Location δ13Ccol
(‰,VPDB) δ13Ccol
+1.65‰ δ15N
col (‰, AIR) C:N Collagen
Yield (%) White-tailed deer (Odocoileus virginianus)
Mod-Deer-01 mandible, left adult male London, Middlesex County –20.17 –18.52 4.58 3.37 21.2
Mod-Deer-01 DUP Duplicate - –20.22 –18.57 5.85 3.36
Mod-Deer-01 mDUP Method Duplicate - –20.20 –18.55 5.29 3.27 21.2
Mod-Deer-01 mDUP DUP Duplicate - –20.21 –18.56 5.42 3.37
Mod-Deer-02^ mandible adult male outside Strathroy, Middlesex County –19.42 –17.77 3.62 3.36 19.0
Mod-Deer-03^ mandible, right adult male outside Strathroy,
Middlesex County –20.22 –18.57 5.26 3.36 21.3
Mod-Deer-03 DUP Duplicate - –20.27 –18.62 5.26 3.35
Mod-Deer-04^ outside Strathroy, Middlesex County
–20.38 –18.73 4.02 3.31 21.13
Mod-Deer-04 DUP Duplicate - –20.46 –18.81 3.47 3.35 Mod-Deer-05 Renfrew County –24.61 –22.96 2.07 3.41 21.7
Mod-Deer-05 DUP Duplicate - –24.61 –22.96 1.76 3.42
Mod-Deer-06 mandible adult male Haldimand-Norfolk County –22.05 –20.40 7.78 3.31 21.1
Mod-Deer-06 DUP Duplicate - –22.02 –20.37 7.27 3.32 Mod-Deer-07 mandible adult male Kitchener-Waterloo –20.82 –19.17 5.65 3.39 22.5
Mod-Deer-07 DUP Duplicate - –20.87 –19.22 5.25 3.36
Mod-Deer-08 mandible adult male Haldimand-Norfolk County –22.25 –20.60 4.23 3.31 22.2
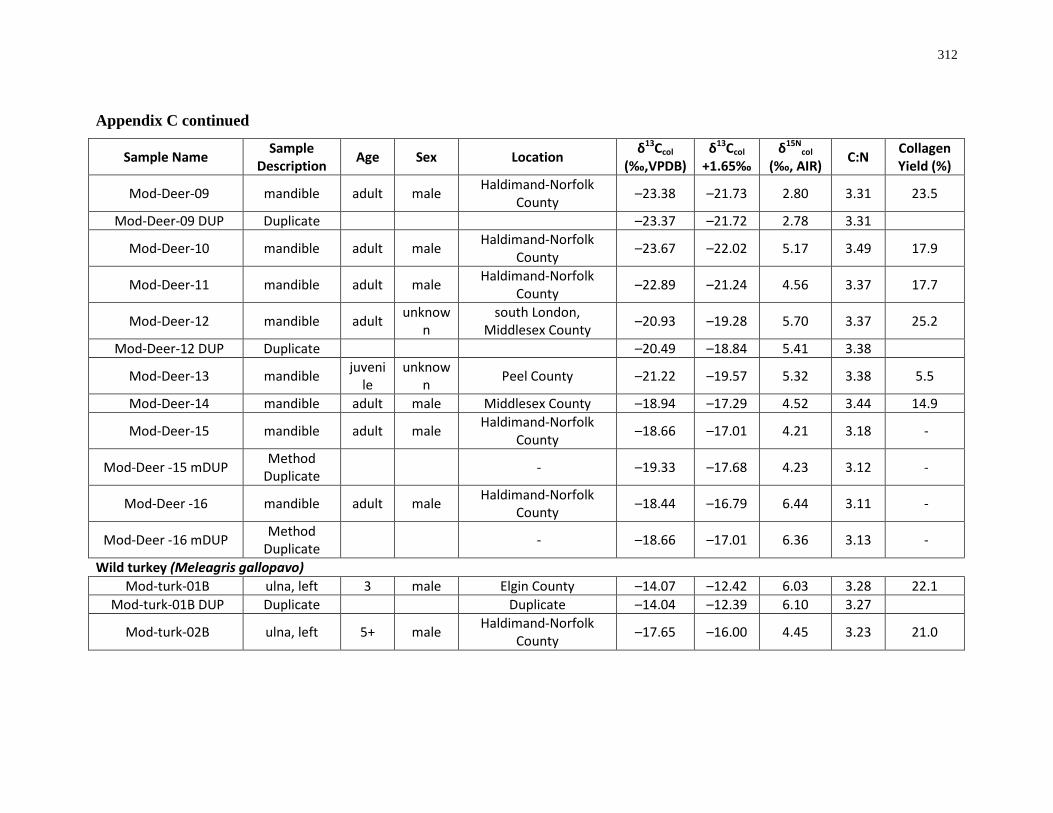
312
Appendix C continued
Sample Name Sample Description Age Sex Location δ13Ccol
(‰,VPDB) δ13Ccol
+1.65‰ δ15N
col (‰, AIR) C:N Collagen
Yield (%)
Mod-Deer-09 mandible adult male Haldimand-Norfolk County –23.38 –21.73 2.80 3.31 23.5
Mod-Deer-09 DUP Duplicate –23.37 –21.72 2.78 3.31
Mod-Deer-10 mandible adult male Haldimand-Norfolk County –23.67 –22.02 5.17 3.49 17.9
Mod-Deer-11 mandible adult male Haldimand-Norfolk County –22.89 –21.24 4.56 3.37 17.7
Mod-Deer-12 mandible adult unknown
south London, Middlesex County –20.93 –19.28 5.70 3.37 25.2
Mod-Deer-12 DUP Duplicate –20.49 –18.84 5.41 3.38
Mod-Deer-13 mandible juvenile
unknown Peel County –21.22 –19.57 5.32 3.38 5.5
Mod-Deer-14 mandible adult male Middlesex County –18.94 –17.29 4.52 3.44 14.9
Mod-Deer-15 mandible adult male Haldimand-Norfolk County –18.66 –17.01 4.21 3.18 -
Mod-Deer -15 mDUP Method Duplicate - –19.33 –17.68 4.23 3.12 -
Mod-Deer -16 mandible adult male Haldimand-Norfolk County –18.44 –16.79 6.44 3.11 -
Mod-Deer -16 mDUP Method Duplicate - –18.66 –17.01 6.36 3.13 -
Wild turkey (Meleagris gallopavo) Mod-turk-01B ulna, left 3 male Elgin County –14.07 –12.42 6.03 3.28 22.1
Mod-turk-01B DUP Duplicate Duplicate –14.04 –12.39 6.10 3.27
Mod-turk-02B ulna, left 5+ male Haldimand-Norfolk County –17.65 –16.00 4.45 3.23 21.0
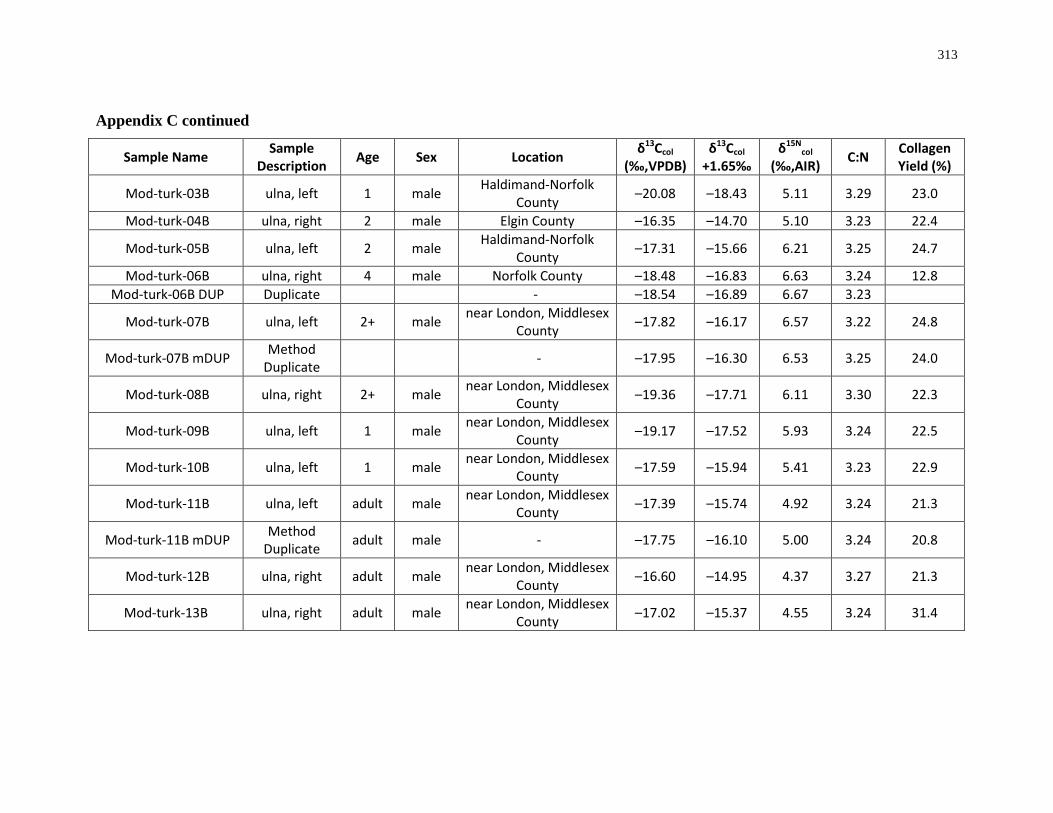
313
Appendix C continued
Sample Name Sample Description Age Sex Location δ13Ccol
(‰,VPDB) δ13Ccol
+1.65‰ δ15N
col (‰,AIR) C:N Collagen
Yield (%)
Mod-turk-03B ulna, left 1 male Haldimand-Norfolk County –20.08 –18.43 5.11 3.29 23.0
Mod-turk-04B ulna, right 2 male Elgin County –16.35 –14.70 5.10 3.23 22.4
Mod-turk-05B ulna, left 2 male Haldimand-Norfolk County –17.31 –15.66 6.21 3.25 24.7
Mod-turk-06B ulna, right 4 male Norfolk County –18.48 –16.83 6.63 3.24 12.8 Mod-turk-06B DUP Duplicate - –18.54 –16.89 6.67 3.23
Mod-turk-07B ulna, left 2+ male near London, Middlesex County –17.82 –16.17 6.57 3.22 24.8
Mod-turk-07B mDUP Method Duplicate - –17.95 –16.30 6.53 3.25 24.0
Mod-turk-08B ulna, right 2+ male near London, Middlesex County –19.36 –17.71 6.11 3.30 22.3
Mod-turk-09B ulna, left 1 male near London, Middlesex County –19.17 –17.52 5.93 3.24 22.5
Mod-turk-10B ulna, left 1 male near London, Middlesex County –17.59 –15.94 5.41 3.23 22.9
Mod-turk-11B ulna, left adult male near London, Middlesex County –17.39 –15.74 4.92 3.24 21.3
Mod-turk-11B mDUP Method Duplicate adult male - –17.75 –16.10 5.00 3.24 20.8
Mod-turk-12B ulna, right adult male near London, Middlesex County –16.60 –14.95 4.37 3.27 21.3
Mod-turk-13B ulna, right adult male near London, Middlesex County –17.02 –15.37 4.55 3.24 31.4
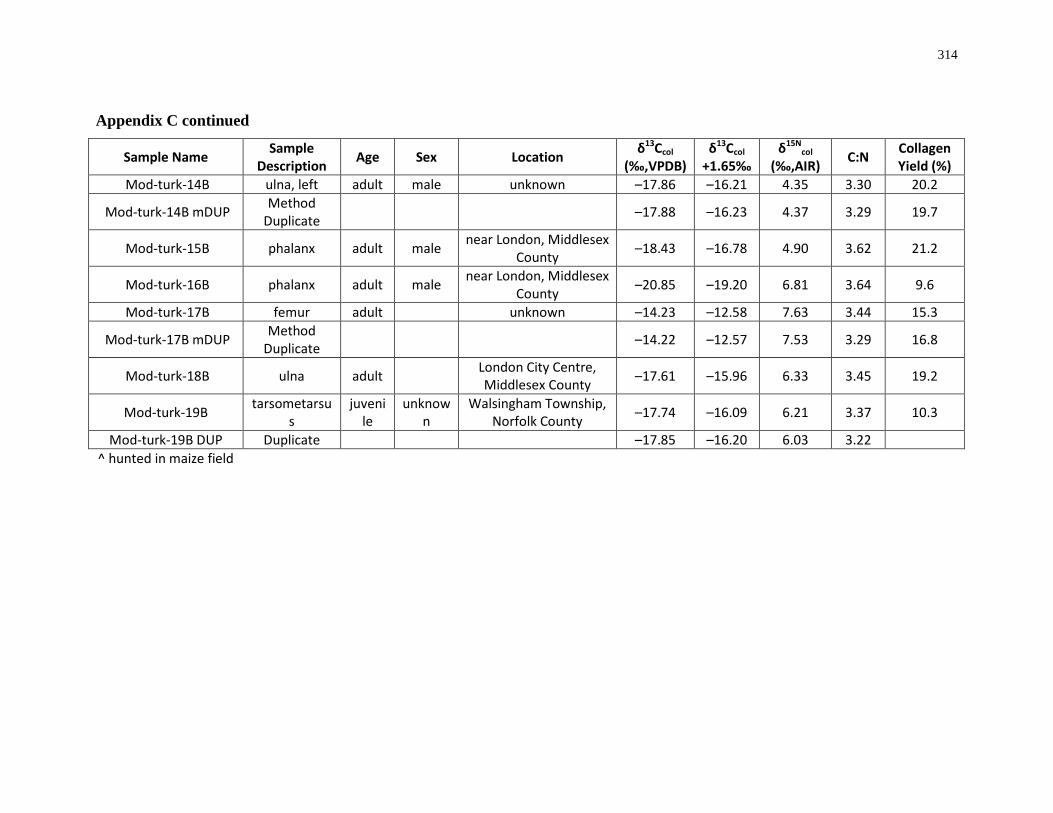
314
Appendix C continued
Sample Name Sample Description Age Sex Location δ13Ccol
(‰,VPDB) δ13Ccol
+1.65‰ δ15N
col (‰,AIR) C:N Collagen
Yield (%) Mod-turk-14B ulna, left adult male unknown –17.86 –16.21 4.35 3.30 20.2
Mod-turk-14B mDUP Method Duplicate –17.88 –16.23 4.37 3.29 19.7
Mod-turk-15B phalanx adult male near London, Middlesex County –18.43 –16.78 4.90 3.62 21.2
Mod-turk-16B phalanx adult male near London, Middlesex County –20.85 –19.20 6.81 3.64 9.6
Mod-turk-17B femur adult unknown –14.23 –12.58 7.63 3.44 15.3
Mod-turk-17B mDUP Method Duplicate
–14.22 –12.57 7.53 3.29 16.8
Mod-turk-18B ulna adult London City Centre, Middlesex County –17.61 –15.96 6.33 3.45 19.2
Mod-turk-19B tarsometarsus
juvenile
unknown
Walsingham Township, Norfolk County –17.74 –16.09 6.21 3.37 10.3
Mod-turk-19B DUP Duplicate –17.85 –16.20 6.03 3.22 ^ hunted in maize field
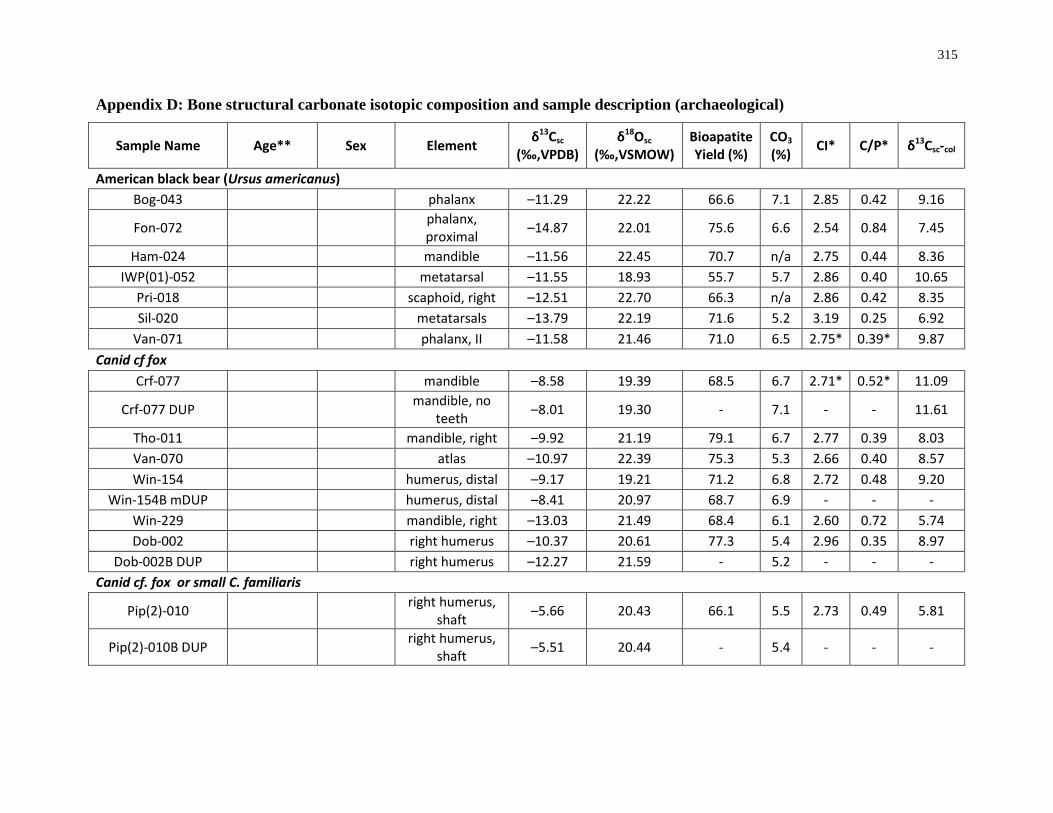
315
Appendix D: Bone structural carbonate isotopic composition and sample description (archaeological)
Sample Name Age** Sex Element δ13Csc (‰,VPDB)
δ18Osc (‰,VSMOW)
Bioapatite Yield (%)
CO3 (%) CI* C/P* δ13Csc-col
American black bear (Ursus americanus) Bog-043 phalanx –11.29 22.22 66.6 7.1 2.85 0.42 9.16
Fon-072 phalanx, proximal –14.87 22.01 75.6 6.6 2.54 0.84 7.45
Ham-024 mandible –11.56 22.45 70.7 n/a 2.75 0.44 8.36 IWP(01)-052 metatarsal –11.55 18.93 55.7 5.7 2.86 0.40 10.65
Pri-018 scaphoid, right –12.51 22.70 66.3 n/a 2.86 0.42 8.35 Sil-020 metatarsals –13.79 22.19 71.6 5.2 3.19 0.25 6.92
Van-071 phalanx, II –11.58 21.46 71.0 6.5 2.75* 0.39* 9.87 Canid cf fox
Crf-077 mandible –8.58 19.39 68.5 6.7 2.71* 0.52* 11.09
Crf-077 DUP mandible, no teeth –8.01 19.30 - 7.1 - - 11.61
Tho-011 mandible, right –9.92 21.19 79.1 6.7 2.77 0.39 8.03 Van-070 atlas –10.97 22.39 75.3 5.3 2.66 0.40 8.57 Win-154 humerus, distal –9.17 19.21 71.2 6.8 2.72 0.48 9.20
Win-154B mDUP humerus, distal –8.41 20.97 68.7 6.9 - - - Win-229 mandible, right –13.03 21.49 68.4 6.1 2.60 0.72 5.74 Dob-002 right humerus –10.37 20.61 77.3 5.4 2.96 0.35 8.97
Dob-002B DUP right humerus –12.27 21.59 - 5.2 - - - Canid cf. fox or small C. familiaris
Pip(2)-010 right humerus, shaft –5.66 20.43 66.1 5.5 2.73 0.49 5.81
Pip(2)-010B DUP right humerus, shaft –5.51 20.44 - 5.4 - - -
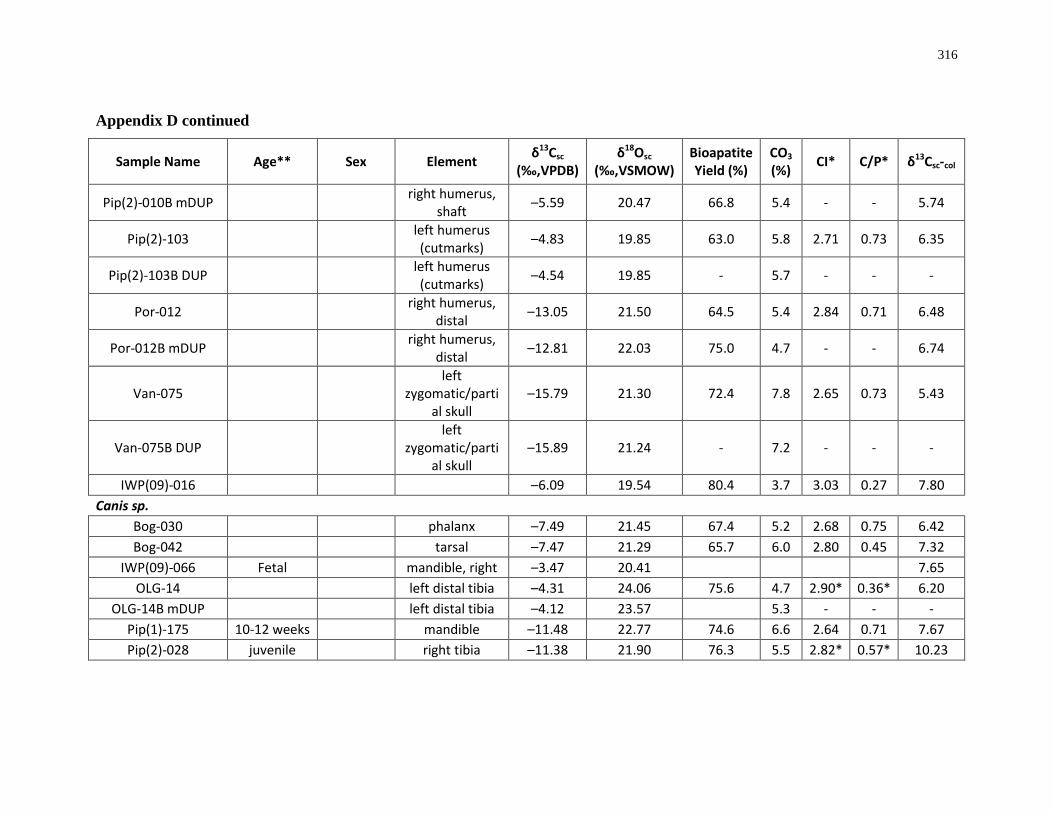
316
Appendix D continued
Sample Name Age** Sex Element δ13Csc (‰,VPDB)
δ18Osc (‰,VSMOW)
Bioapatite Yield (%)
CO3 (%) CI* C/P* δ13Csc-col
Pip(2)-010B mDUP right humerus, shaft –5.59 20.47 66.8 5.4 - - 5.74
Pip(2)-103 left humerus (cutmarks) –4.83 19.85 63.0 5.8 2.71 0.73 6.35
Pip(2)-103B DUP left humerus (cutmarks) –4.54 19.85 - 5.7 - - -
Por-012 right humerus, distal –13.05 21.50 64.5 5.4 2.84 0.71 6.48
Por-012B mDUP right humerus, distal –12.81 22.03 75.0 4.7 - - 6.74
Van-075 left
zygomatic/partial skull
–15.79 21.30 72.4 7.8 2.65 0.73 5.43
Van-075B DUP left
zygomatic/partial skull
–15.89 21.24 - 7.2 - - -
IWP(09)-016 –6.09 19.54 80.4 3.7 3.03 0.27 7.80 Canis sp.
Bog-030 phalanx –7.49 21.45 67.4 5.2 2.68 0.75 6.42 Bog-042 tarsal –7.47 21.29 65.7 6.0 2.80 0.45 7.32
IWP(09)-066 Fetal mandible, right –3.47 20.41 7.65 OLG-14 left distal tibia –4.31 24.06 75.6 4.7 2.90* 0.36* 6.20
OLG-14B mDUP left distal tibia –4.12 23.57 5.3 - - - Pip(1)-175 10-12 weeks mandible –11.48 22.77 74.6 6.6 2.64 0.71 7.67 Pip(2)-028 juvenile right tibia –11.38 21.90 76.3 5.5 2.82* 0.57* 10.23

317
Appendix D continued
Sample Name Age** Sex Element δ13Csc (‰,VPDB)
δ18Osc (‰,VSMOW)
Bioapatite Yield (%)
CO3 (%) CI* C/P* δ13Csc-col
Pip(2)-049 right calcaneous –3.19 21.64 66.1 - 2.69 0.51 7.96 Pip(2)-110 atlas –3.81 20.81 6.81
Sla-026 metacarpal –4.74 20.52 70.5 6.6 2.61 0.73 - Wal-034 left calcaneous –6.73 20.95 73.4 - 2.49 0.53 7.45 Win-249 juvenile ulna –4.63 20.14 70.7 7.0 2.75 0.68 5.67
Rif-020 left and right calcaneous
(burnt) –5.30 19.81 65.2 7.4 2.81* 0.40* 6.32
Canis sp. cf. C. familiaris Bog-016 mandible –7.52 22.03 76.5 6.5 2.85 0.38 6.13
Cra-010 right ulna, proximal –7.72 22.32 88.0 7.7 2.93 0.32 14.09
Crf-054 axis –4.87 18.71 69.7 4.4 2.59* 0.63* 7.02 Crf-054 mDUP axis –4.70 18.34 68.2 5.2 - - 7.18
Dav-005 maxilla, fragment –9.80 18.42 88.8 6.9 2.73 0.36 10.95
Dav-006 maxilla, fragment –9.38 20.16 60.7 2.5 3.24 0.28 11.44
Dob-001 mandible –4.92 22.30 100.3 4.8 2.99* 0.36* 7.08 Dob-001B mDUP mandible –5.01 22.37 81.1 7.6 - - - Dob-001B mDUP
DUP mandible –5.02 22.01 - 7.1 - - -
Fon-061 mandible, left –7.71 22.32 75.9 7.3 2.68 0.53 5.07 Fon-117 mandible, right –6.59 19.99 63.0 6.1 2.46 0.61 6.00
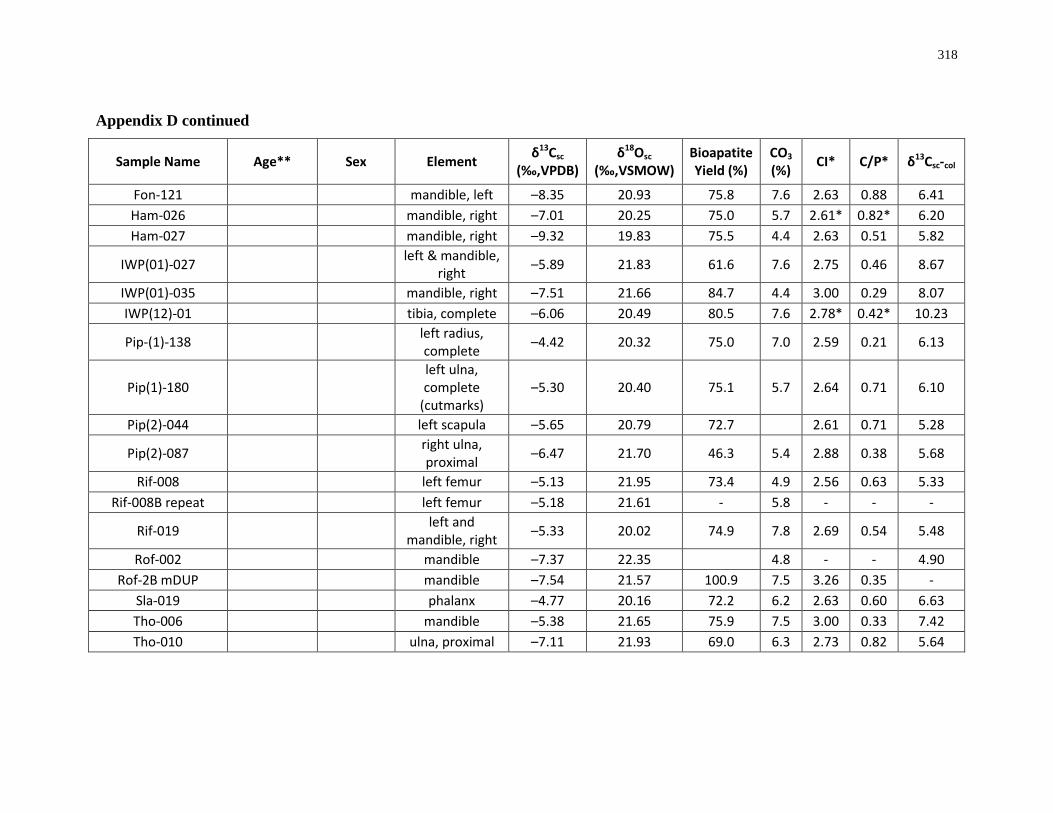
318
Appendix D continued
Sample Name Age** Sex Element δ13Csc (‰,VPDB)
δ18Osc (‰,VSMOW)
Bioapatite Yield (%)
CO3 (%) CI* C/P* δ13Csc-col
Fon-121 mandible, left –8.35 20.93 75.8 7.6 2.63 0.88 6.41 Ham-026 mandible, right –7.01 20.25 75.0 5.7 2.61* 0.82* 6.20 Ham-027 mandible, right –9.32 19.83 75.5 4.4 2.63 0.51 5.82
IWP(01)-027 left & mandible, right –5.89 21.83 61.6 7.6 2.75 0.46 8.67
IWP(01)-035 mandible, right –7.51 21.66 84.7 4.4 3.00 0.29 8.07 IWP(12)-01 tibia, complete –6.06 20.49 80.5 7.6 2.78* 0.42* 10.23
Pip-(1)-138 left radius, complete –4.42 20.32 75.0 7.0 2.59 0.21 6.13
Pip(1)-180 left ulna, complete
(cutmarks) –5.30 20.40 75.1 5.7 2.64 0.71 6.10
Pip(2)-044 left scapula –5.65 20.79 72.7 2.61 0.71 5.28
Pip(2)-087 right ulna, proximal –6.47 21.70 46.3 5.4 2.88 0.38 5.68
Rif-008 left femur –5.13 21.95 73.4 4.9 2.56 0.63 5.33 Rif-008B repeat left femur –5.18 21.61 - 5.8 - - -
Rif-019 left and mandible, right –5.33 20.02 74.9 7.8 2.69 0.54 5.48
Rof-002 mandible –7.37 22.35 4.8 - - 4.90 Rof-2B mDUP mandible –7.54 21.57 100.9 7.5 3.26 0.35 -
Sla-019 phalanx –4.77 20.16 72.2 6.2 2.63 0.60 6.63 Tho-006 mandible –5.38 21.65 75.9 7.5 3.00 0.33 7.42 Tho-010 ulna, proximal –7.11 21.93 69.0 6.3 2.73 0.82 5.64
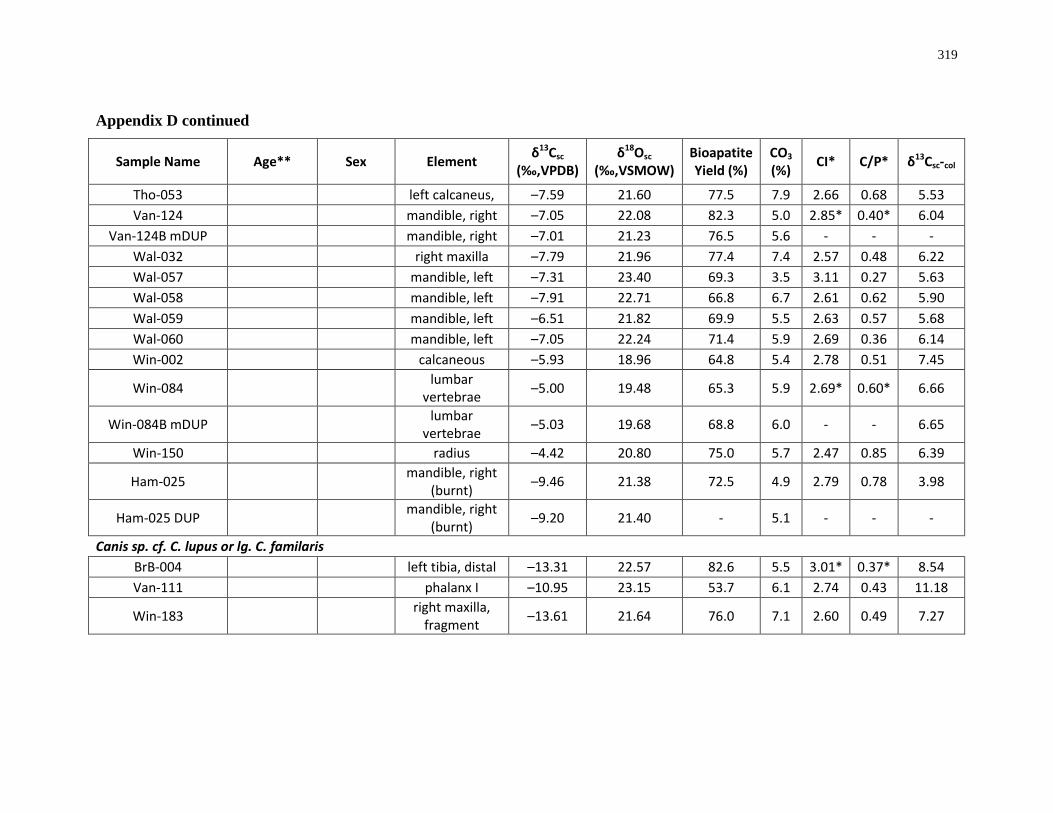
319
Appendix D continued
Sample Name Age** Sex Element δ13Csc (‰,VPDB)
δ18Osc (‰,VSMOW)
Bioapatite Yield (%)
CO3 (%) CI* C/P* δ13Csc-col
Tho-053 left calcaneus, –7.59 21.60 77.5 7.9 2.66 0.68 5.53 Van-124 mandible, right –7.05 22.08 82.3 5.0 2.85* 0.40* 6.04
Van-124B mDUP mandible, right –7.01 21.23 76.5 5.6 - - - Wal-032 right maxilla –7.79 21.96 77.4 7.4 2.57 0.48 6.22 Wal-057 mandible, left –7.31 23.40 69.3 3.5 3.11 0.27 5.63 Wal-058 mandible, left –7.91 22.71 66.8 6.7 2.61 0.62 5.90 Wal-059 mandible, left –6.51 21.82 69.9 5.5 2.63 0.57 5.68 Wal-060 mandible, left –7.05 22.24 71.4 5.9 2.69 0.36 6.14 Win-002 calcaneous –5.93 18.96 64.8 5.4 2.78 0.51 7.45
Win-084 lumbar vertebrae –5.00 19.48 65.3 5.9 2.69* 0.60* 6.66
Win-084B mDUP lumbar vertebrae –5.03 19.68 68.8 6.0 - - 6.65
Win-150 radius –4.42 20.80 75.0 5.7 2.47 0.85 6.39
Ham-025 mandible, right (burnt) –9.46 21.38 72.5 4.9 2.79 0.78 3.98
Ham-025 DUP mandible, right (burnt) –9.20 21.40 - 5.1 - - -
Canis sp. cf. C. lupus or lg. C. familaris BrB-004 left tibia, distal –13.31 22.57 82.6 5.5 3.01* 0.37* 8.54 Van-111 phalanx I –10.95 23.15 53.7 6.1 2.74 0.43 11.18
Win-183 right maxilla, fragment –13.61 21.64 76.0 7.1 2.60 0.49 7.27
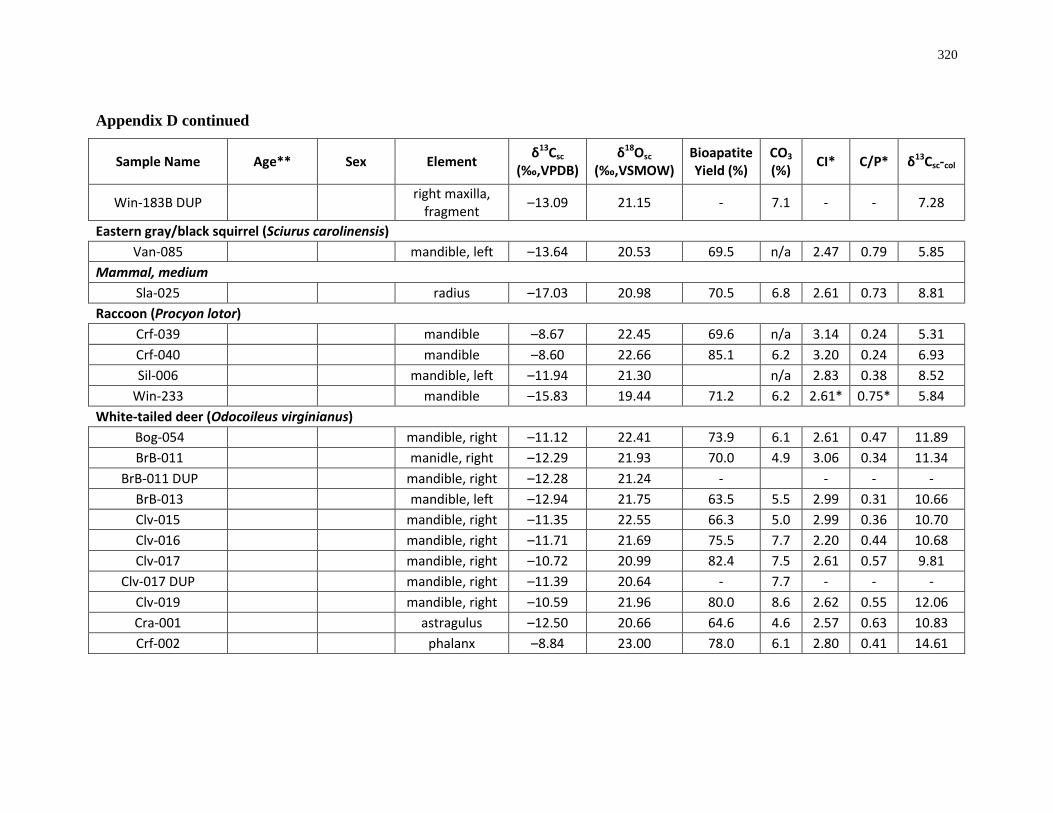
320
Appendix D continued
Sample Name Age** Sex Element δ13Csc (‰,VPDB)
δ18Osc (‰,VSMOW)
Bioapatite Yield (%)
CO3 (%) CI* C/P* δ13Csc-col
Win-183B DUP right maxilla, fragment –13.09 21.15 - 7.1 - - 7.28
Eastern gray/black squirrel (Sciurus carolinensis) Van-085 mandible, left –13.64 20.53 69.5 n/a 2.47 0.79 5.85
Mammal, medium Sla-025 radius –17.03 20.98 70.5 6.8 2.61 0.73 8.81
Raccoon (Procyon lotor) Crf-039 mandible –8.67 22.45 69.6 n/a 3.14 0.24 5.31 Crf-040 mandible –8.60 22.66 85.1 6.2 3.20 0.24 6.93 Sil-006 mandible, left –11.94 21.30 n/a 2.83 0.38 8.52
Win-233 mandible –15.83 19.44 71.2 6.2 2.61* 0.75* 5.84 White-tailed deer (Odocoileus virginianus)
Bog-054 mandible, right –11.12 22.41 73.9 6.1 2.61 0.47 11.89 BrB-011 manidle, right –12.29 21.93 70.0 4.9 3.06 0.34 11.34
BrB-011 DUP mandible, right –12.28 21.24 - - - - BrB-013 mandible, left –12.94 21.75 63.5 5.5 2.99 0.31 10.66 Clv-015 mandible, right –11.35 22.55 66.3 5.0 2.99 0.36 10.70 Clv-016 mandible, right –11.71 21.69 75.5 7.7 2.20 0.44 10.68 Clv-017 mandible, right –10.72 20.99 82.4 7.5 2.61 0.57 9.81
Clv-017 DUP mandible, right –11.39 20.64 - 7.7 - - - Clv-019 mandible, right –10.59 21.96 80.0 8.6 2.62 0.55 12.06 Cra-001 astragulus –12.50 20.66 64.6 4.6 2.57 0.63 10.83 Crf-002 phalanx –8.84 23.00 78.0 6.1 2.80 0.41 14.61
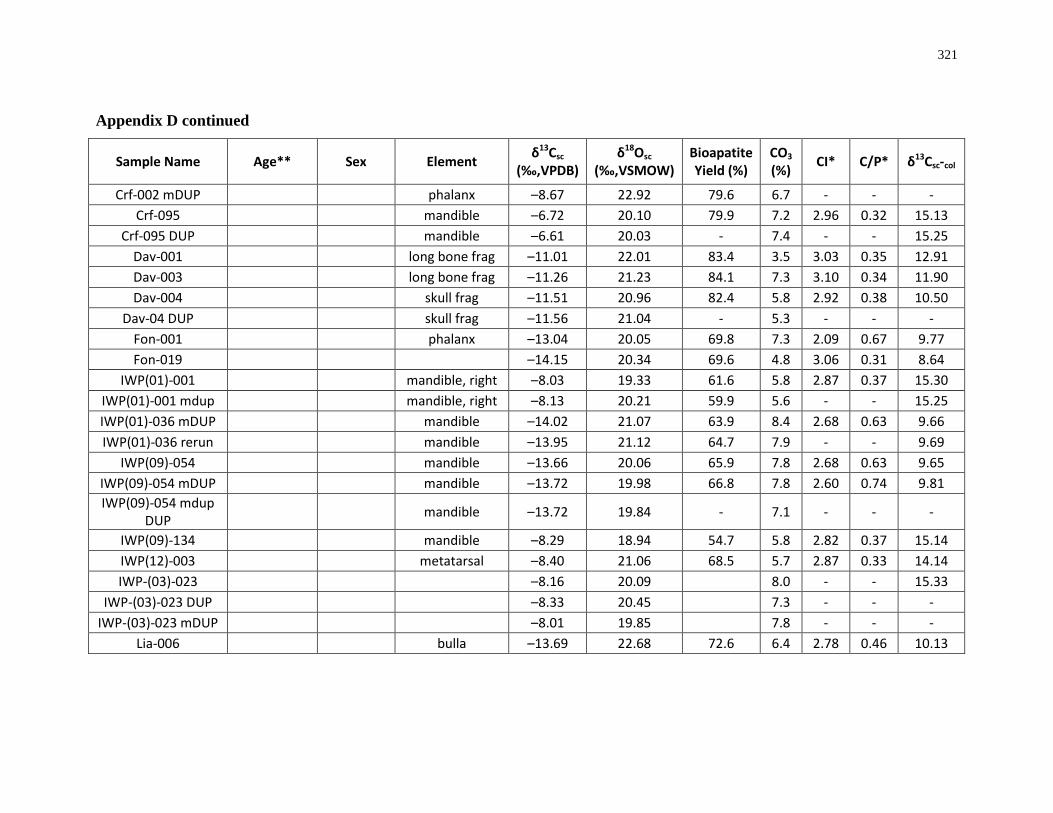
321
Appendix D continued
Sample Name Age** Sex Element δ13Csc (‰,VPDB)
δ18Osc (‰,VSMOW)
Bioapatite Yield (%)
CO3 (%) CI* C/P* δ13Csc-col
Crf-002 mDUP phalanx –8.67 22.92 79.6 6.7 - - - Crf-095 mandible –6.72 20.10 79.9 7.2 2.96 0.32 15.13
Crf-095 DUP mandible –6.61 20.03 - 7.4 - - 15.25 Dav-001 long bone frag –11.01 22.01 83.4 3.5 3.03 0.35 12.91 Dav-003 long bone frag –11.26 21.23 84.1 7.3 3.10 0.34 11.90 Dav-004 skull frag –11.51 20.96 82.4 5.8 2.92 0.38 10.50
Dav-04 DUP skull frag –11.56 21.04 - 5.3 - - - Fon-001 phalanx –13.04 20.05 69.8 7.3 2.09 0.67 9.77 Fon-019 –14.15 20.34 69.6 4.8 3.06 0.31 8.64
IWP(01)-001 mandible, right –8.03 19.33 61.6 5.8 2.87 0.37 15.30 IWP(01)-001 mdup mandible, right –8.13 20.21 59.9 5.6 - - 15.25 IWP(01)-036 mDUP mandible –14.02 21.07 63.9 8.4 2.68 0.63 9.66 IWP(01)-036 rerun mandible –13.95 21.12 64.7 7.9 - - 9.69
IWP(09)-054 mandible –13.66 20.06 65.9 7.8 2.68 0.63 9.65 IWP(09)-054 mDUP mandible –13.72 19.98 66.8 7.8 2.60 0.74 9.81 IWP(09)-054 mdup
DUP mandible –13.72 19.84 - 7.1 - - -
IWP(09)-134 mandible –8.29 18.94 54.7 5.8 2.82 0.37 15.14 IWP(12)-003 metatarsal –8.40 21.06 68.5 5.7 2.87 0.33 14.14 IWP-(03)-023 –8.16 20.09 8.0 - - 15.33
IWP-(03)-023 DUP –8.33 20.45 7.3 - - - IWP-(03)-023 mDUP –8.01 19.85 7.8 - - -
Lia-006 bulla –13.69 22.68 72.6 6.4 2.78 0.46 10.13
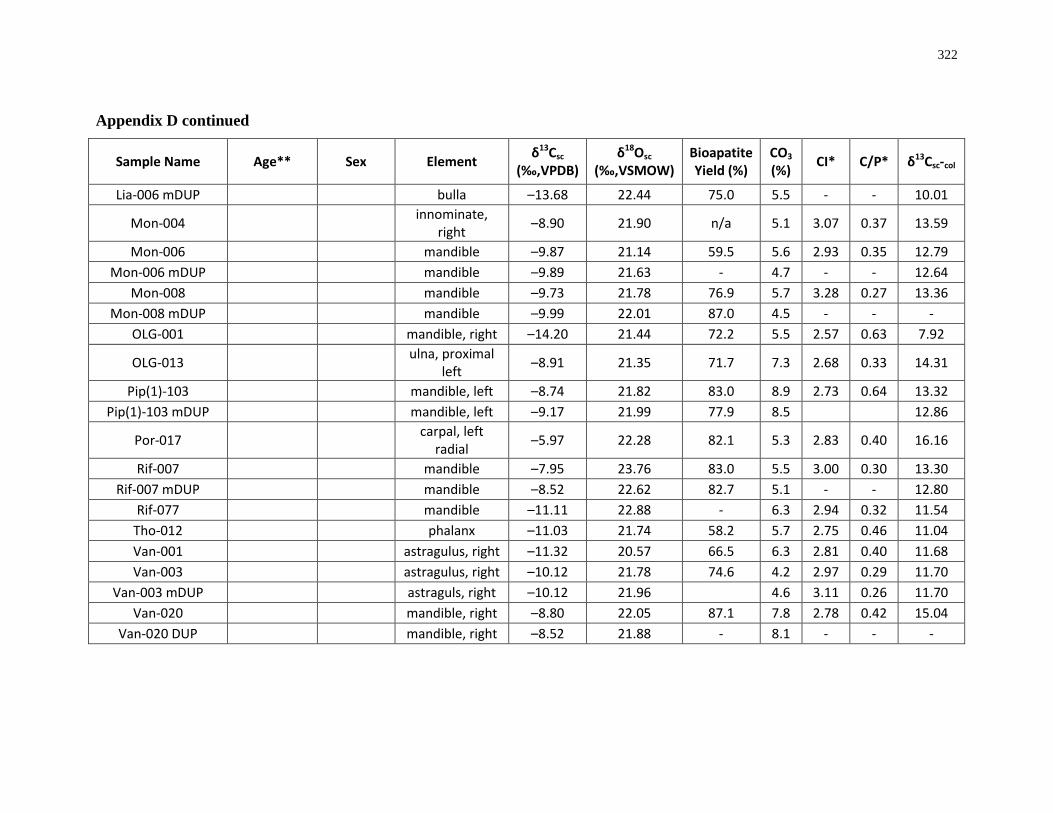
322
Appendix D continued
Sample Name Age** Sex Element δ13Csc (‰,VPDB)
δ18Osc (‰,VSMOW)
Bioapatite Yield (%)
CO3 (%) CI* C/P* δ13Csc-col
Lia-006 mDUP bulla –13.68 22.44 75.0 5.5 - - 10.01
Mon-004 innominate, right –8.90 21.90 n/a 5.1 3.07 0.37 13.59
Mon-006 mandible –9.87 21.14 59.5 5.6 2.93 0.35 12.79 Mon-006 mDUP mandible –9.89 21.63 - 4.7 - - 12.64
Mon-008 mandible –9.73 21.78 76.9 5.7 3.28 0.27 13.36 Mon-008 mDUP mandible –9.99 22.01 87.0 4.5 - - -
OLG-001 mandible, right –14.20 21.44 72.2 5.5 2.57 0.63 7.92
OLG-013 ulna, proximal left –8.91 21.35 71.7 7.3 2.68 0.33 14.31
Pip(1)-103 mandible, left –8.74 21.82 83.0 8.9 2.73 0.64 13.32 Pip(1)-103 mDUP mandible, left –9.17 21.99 77.9 8.5 12.86
Por-017 carpal, left radial –5.97 22.28 82.1 5.3 2.83 0.40 16.16
Rif-007 mandible –7.95 23.76 83.0 5.5 3.00 0.30 13.30 Rif-007 mDUP mandible –8.52 22.62 82.7 5.1 - - 12.80
Rif-077 mandible –11.11 22.88 - 6.3 2.94 0.32 11.54 Tho-012 phalanx –11.03 21.74 58.2 5.7 2.75 0.46 11.04 Van-001 astragulus, right –11.32 20.57 66.5 6.3 2.81 0.40 11.68 Van-003 astragulus, right –10.12 21.78 74.6 4.2 2.97 0.29 11.70
Van-003 mDUP astraguls, right –10.12 21.96 4.6 3.11 0.26 11.70 Van-020 mandible, right –8.80 22.05 87.1 7.8 2.78 0.42 15.04
Van-020 DUP mandible, right –8.52 21.88 - 8.1 - - -
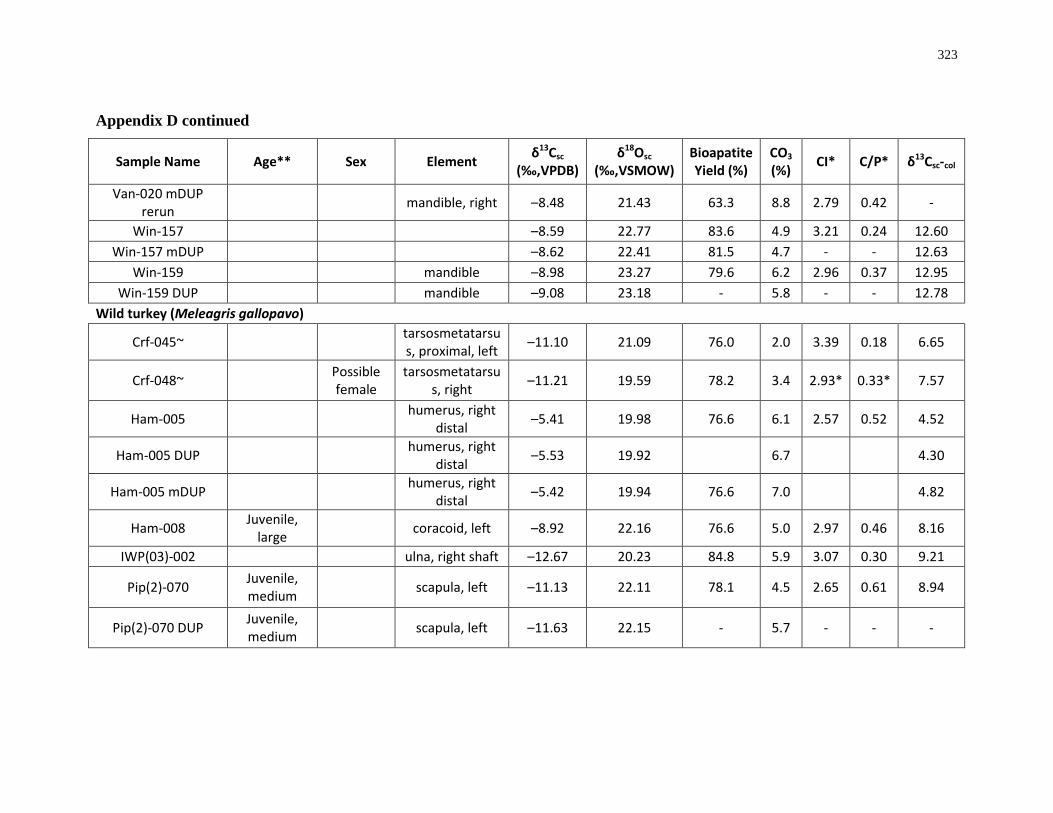
323
Appendix D continued
Sample Name Age** Sex Element δ13Csc (‰,VPDB)
δ18Osc (‰,VSMOW)
Bioapatite Yield (%)
CO3 (%) CI* C/P* δ13Csc-col
Van-020 mDUP rerun mandible, right –8.48 21.43 63.3 8.8 2.79 0.42 -
Win-157 –8.59 22.77 83.6 4.9 3.21 0.24 12.60 Win-157 mDUP –8.62 22.41 81.5 4.7 - - 12.63
Win-159 mandible –8.98 23.27 79.6 6.2 2.96 0.37 12.95 Win-159 DUP mandible –9.08 23.18 - 5.8 - - 12.78
Wild turkey (Meleagris gallopavo)
Crf-045~ tarsosmetatarsus, proximal, left –11.10 21.09 76.0 2.0 3.39 0.18 6.65
Crf-048~ Possible female
tarsosmetatarsus, right –11.21 19.59 78.2 3.4 2.93* 0.33* 7.57
Ham-005 humerus, right distal –5.41 19.98 76.6 6.1 2.57 0.52 4.52
Ham-005 DUP humerus, right distal –5.53 19.92 6.7 4.30
Ham-005 mDUP humerus, right distal –5.42 19.94 76.6 7.0 4.82
Ham-008 Juvenile, large coracoid, left –8.92 22.16 76.6 5.0 2.97 0.46 8.16
IWP(03)-002 ulna, right shaft –12.67 20.23 84.8 5.9 3.07 0.30 9.21
Pip(2)-070 Juvenile, medium scapula, left –11.13 22.11 78.1 4.5 2.65 0.61 8.94
Pip(2)-070 DUP Juvenile, medium scapula, left –11.63 22.15 - 5.7 - - -
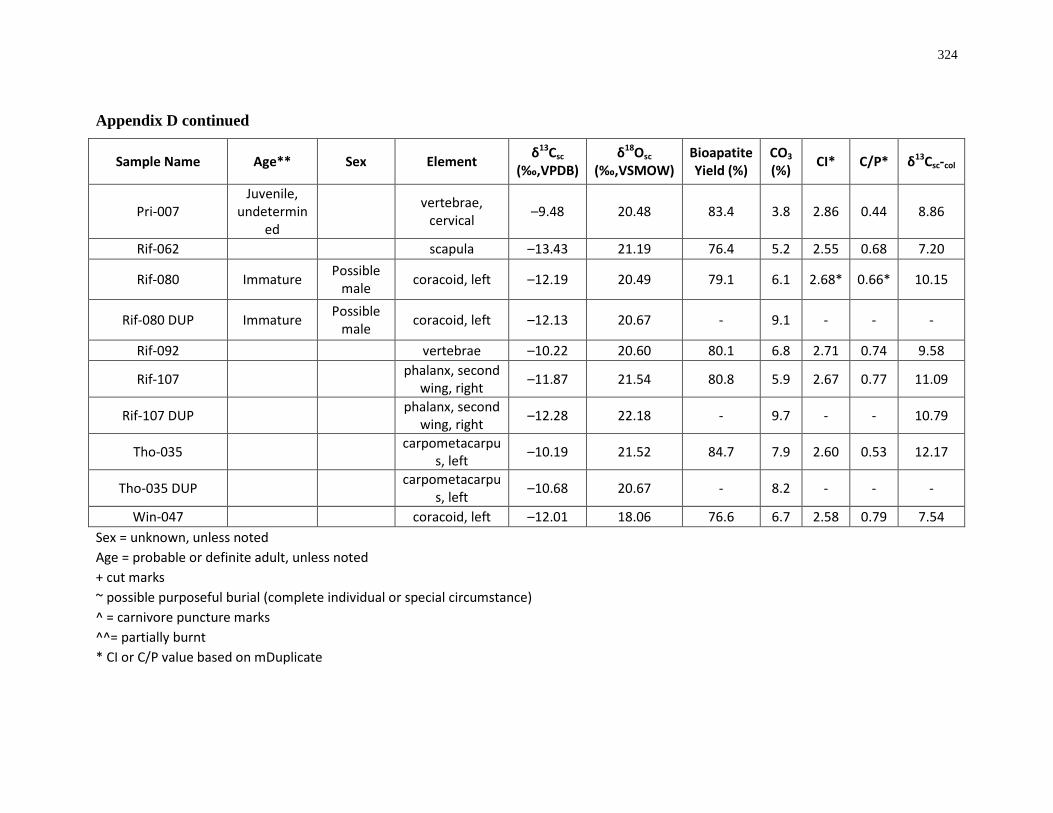
324
Appendix D continued
Sample Name Age** Sex Element δ13Csc (‰,VPDB)
δ18Osc (‰,VSMOW)
Bioapatite Yield (%)
CO3 (%) CI* C/P* δ13Csc-col
Pri-007 Juvenile,
undetermined
vertebrae, cervical –9.48 20.48 83.4 3.8 2.86 0.44 8.86
Rif-062 scapula –13.43 21.19 76.4 5.2 2.55 0.68 7.20
Rif-080 Immature Possible male coracoid, left –12.19 20.49 79.1 6.1 2.68* 0.66* 10.15
Rif-080 DUP Immature Possible male coracoid, left –12.13 20.67 - 9.1 - - -
Rif-092 vertebrae –10.22 20.60 80.1 6.8 2.71 0.74 9.58
Rif-107 phalanx, second wing, right –11.87 21.54 80.8 5.9 2.67 0.77 11.09
Rif-107 DUP phalanx, second wing, right –12.28 22.18 - 9.7 - - 10.79
Tho-035 carpometacarpus, left –10.19 21.52 84.7 7.9 2.60 0.53 12.17
Tho-035 DUP carpometacarpus, left –10.68 20.67 - 8.2 - - -
Win-047 coracoid, left –12.01 18.06 76.6 6.7 2.58 0.79 7.54 Sex = unknown, unless noted Age = probable or definite adult, unless noted + cut marks
~ possible purposeful burial (complete individual or special circumstance) ^ = carnivore puncture marks ^^= partially burnt * CI or C/P value based on mDuplicate
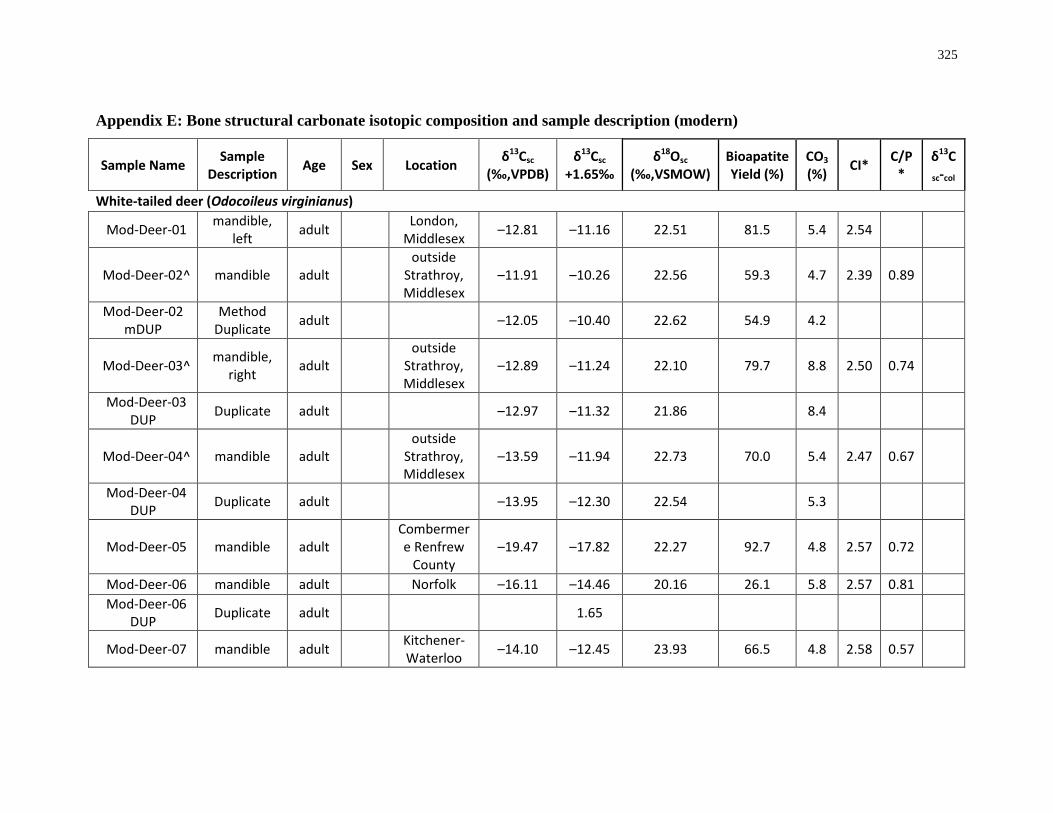
325
Appendix E: Bone structural carbonate isotopic composition and sample description (modern)
Sample Name Sample Description Age Sex Location δ13Csc
(‰,VPDB) δ13Csc
+1.65‰ δ18Osc
(‰,VSMOW) Bioapatite Yield (%)
CO3 (%) CI* C/P
* δ13Csc-col
White-tailed deer (Odocoileus virginianus)
Mod-Deer-01 mandible, left adult London,
Middlesex –12.81 –11.16 22.51 81.5 5.4 2.54
Mod-Deer-02^ mandible adult outside
Strathroy, Middlesex
–11.91 –10.26 22.56 59.3 4.7 2.39 0.89
Mod-Deer-02 mDUP
Method Duplicate adult –12.05 –10.40 22.62 54.9 4.2
Mod-Deer-03^ mandible, right adult
outside Strathroy, Middlesex
–12.89 –11.24 22.10 79.7 8.8 2.50 0.74
Mod-Deer-03 DUP Duplicate adult –12.97 –11.32 21.86 8.4
Mod-Deer-04^ mandible adult outside
Strathroy, Middlesex
–13.59 –11.94 22.73 70.0 5.4 2.47 0.67
Mod-Deer-04 DUP Duplicate adult –13.95 –12.30 22.54 5.3
Mod-Deer-05 mandible adult Combermere Renfrew
County –19.47 –17.82 22.27 92.7 4.8 2.57 0.72
Mod-Deer-06 mandible adult Norfolk –16.11 –14.46 20.16 26.1 5.8 2.57 0.81 Mod-Deer-06
DUP Duplicate adult 1.65
Mod-Deer-07 mandible adult Kitchener-Waterloo –14.10 –12.45 23.93 66.5 4.8 2.58 0.57
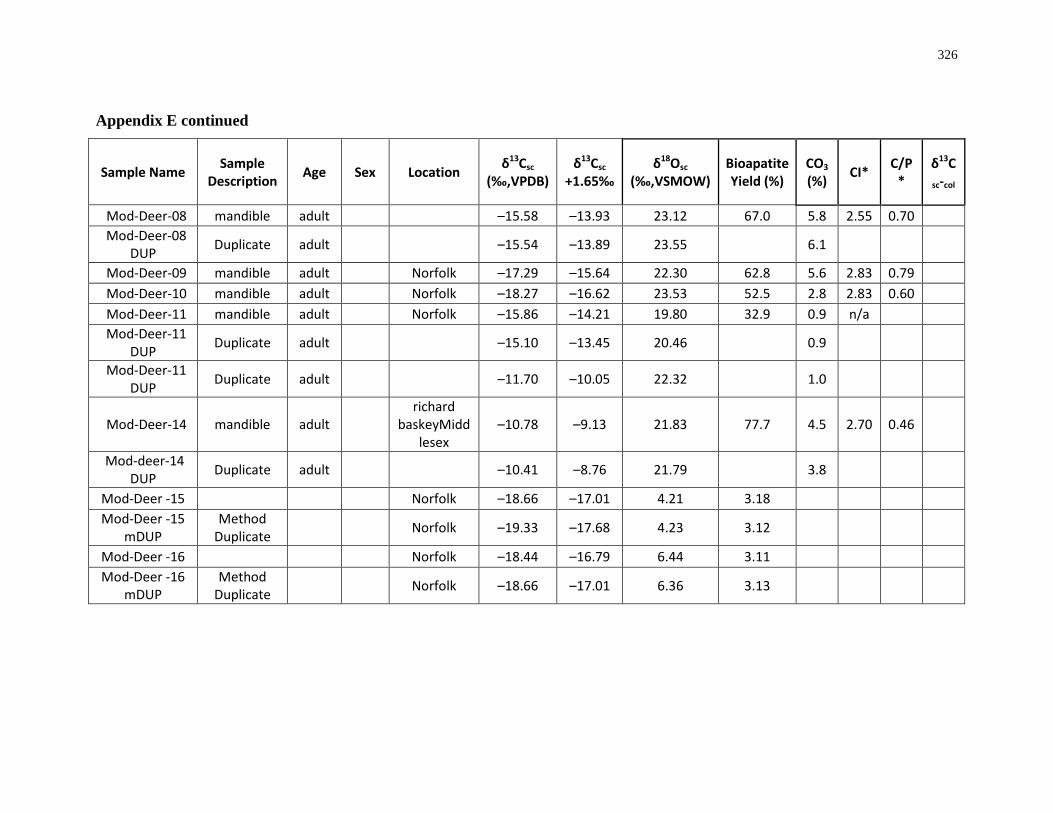
326
Appendix E continued
Sample Name Sample Description Age Sex Location δ13Csc
(‰,VPDB) δ13Csc
+1.65‰ δ18Osc
(‰,VSMOW) Bioapatite Yield (%)
CO3 (%) CI* C/P
* δ13Csc-col
Mod-Deer-08 mandible adult –15.58 –13.93 23.12 67.0 5.8 2.55 0.70 Mod-Deer-08
DUP Duplicate adult –15.54 –13.89 23.55 6.1 Mod-Deer-09 mandible adult Norfolk –17.29 –15.64 22.30 62.8 5.6 2.83 0.79 Mod-Deer-10 mandible adult Norfolk –18.27 –16.62 23.53 52.5 2.8 2.83 0.60 Mod-Deer-11 mandible adult Norfolk –15.86 –14.21 19.80 32.9 0.9 n/a Mod-Deer-11
DUP Duplicate adult –15.10 –13.45 20.46 0.9 Mod-Deer-11
DUP Duplicate adult –11.70 –10.05 22.32 1.0
Mod-Deer-14 mandible adult richard
baskeyMiddlesex
–10.78 –9.13 21.83 77.7 4.5 2.70 0.46
Mod-deer-14 DUP Duplicate adult –10.41 –8.76 21.79 3.8
Mod-Deer -15 Norfolk –18.66 –17.01 4.21 3.18 Mod-Deer -15
mDUP Method
Duplicate Norfolk –19.33 –17.68 4.23 3.12 Mod-Deer -16 Norfolk –18.44 –16.79 6.44 3.11 Mod-Deer -16
mDUP Method
Duplicate Norfolk –18.66 –17.01 6.36 3.13
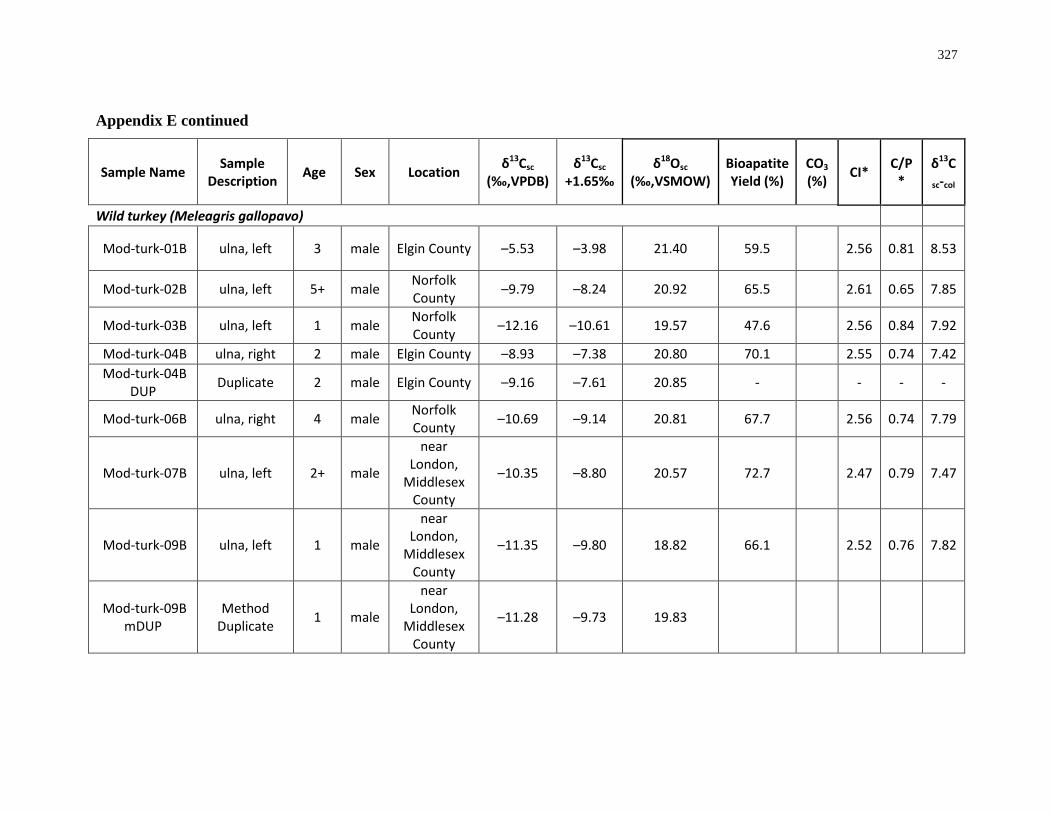
327
Appendix E continued
Sample Name Sample Description Age Sex Location δ13Csc
(‰,VPDB) δ13Csc
+1.65‰ δ18Osc
(‰,VSMOW) Bioapatite Yield (%)
CO3 (%) CI* C/P
* δ13Csc-col
Wild turkey (Meleagris gallopavo)
Mod-turk-01B ulna, left 3 male Elgin County –5.53 –3.98 21.40 59.5
2.56 0.81 8.53
Mod-turk-02B ulna, left 5+ male Norfolk County –9.79 –8.24 20.92 65.5 2.61 0.65 7.85
Mod-turk-03B ulna, left 1 male Norfolk County –12.16 –10.61 19.57 47.6 2.56 0.84 7.92
Mod-turk-04B ulna, right 2 male Elgin County –8.93 –7.38 20.80 70.1 2.55 0.74 7.42 Mod-turk-04B
DUP Duplicate 2 male Elgin County –9.16 –7.61 20.85 - - - -
Mod-turk-06B ulna, right 4 male Norfolk County –10.69 –9.14 20.81 67.7 2.56 0.74 7.79
Mod-turk-07B ulna, left 2+ male
near London,
Middlesex County
–10.35 –8.80 20.57 72.7
2.47 0.79 7.47
Mod-turk-09B ulna, left 1 male
near London,
Middlesex County
–11.35 –9.80 18.82 66.1
2.52 0.76 7.82
Mod-turk-09B mDUP
Method Duplicate 1 male
near London,
Middlesex County
–11.28 –9.73 19.83

328
Appendix E continued
Sample Name Sample Description Age Sex Location δ13Csc
(‰,VPDB) δ13Csc
+1.65‰ δ18Osc
(‰,VSMOW) Bioapatite Yield (%)
CO3 (%) CI* C/P
* δ13Csc-col
Mod-turk-09B DUP Duplicate 1 male
near London,
Middlesex County
–10.75 –9.20 20.43
Mod-turk-10B ulna, left 1 male
near London,
Middlesex County
–8.79 –7.24 21.27 66.1
2.61 0.64 8.80
Mod-turk-11B ulna, left adult male
near London,
Middlesex County
–9.92 –8.37 21.19 71.4
2.54 0.74 7.47
Mod-turk-12B ulna, right adult male
near London,
Middlesex County
–8.19 –6.64 20.54 71.0
2.54 0.69 8.42
Mod-turk-13B ulna, right adult male
near London,
Middlesex County
–8.30 –6.75 20.85 70.7
2.56 0.71 8.72
Mod-turk-13B DUP Duplicate adult male
near London,
Middlesex County
–8.28 –6.73 20.59
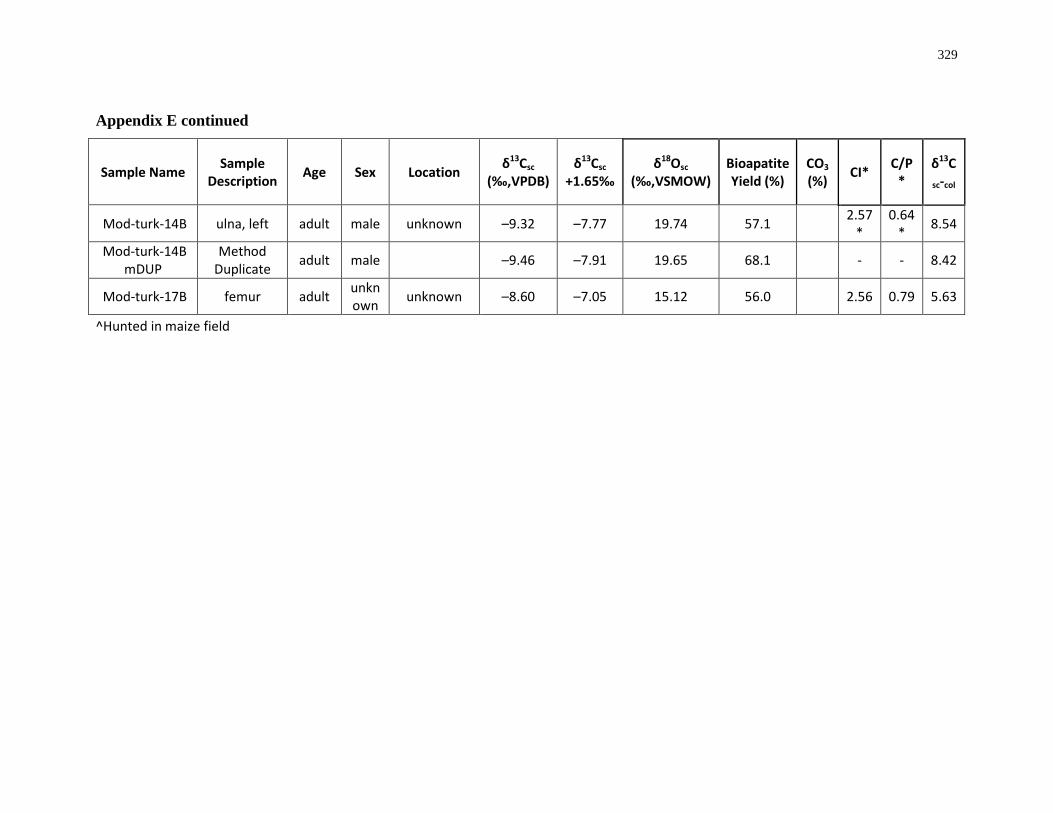
329
Appendix E continued
Sample Name Sample Description Age Sex Location δ13Csc
(‰,VPDB) δ13Csc
+1.65‰ δ18Osc
(‰,VSMOW) Bioapatite Yield (%)
CO3 (%) CI* C/P
* δ13Csc-col
Mod-turk-14B ulna, left adult male unknown –9.32 –7.77 19.74 57.1 2.57
* 0.64
* 8.54
Mod-turk-14B mDUP
Method Duplicate adult male –9.46 –7.91 19.65 68.1 - - 8.42
Mod-turk-17B femur adult unknown unknown –8.60 –7.05 15.12 56.0 2.56 0.79 5.63
^Hunted in maize field
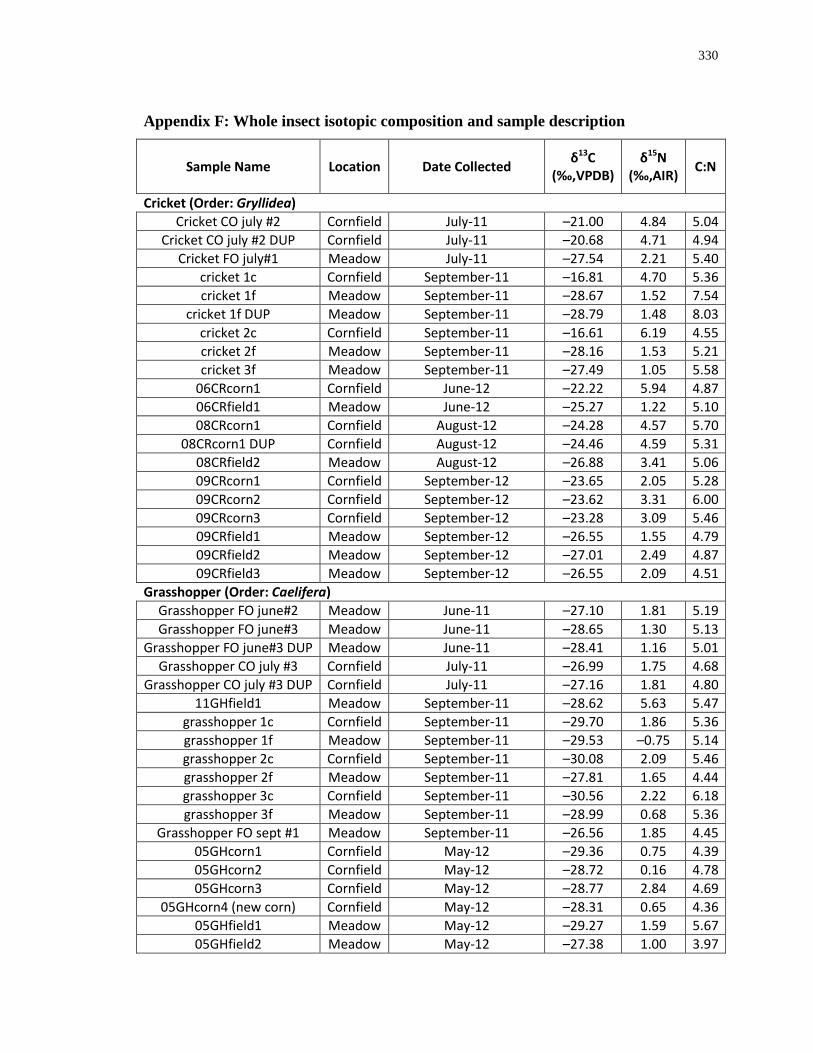
330
Appendix F: Whole insect isotopic composition and sample description
Sample Name Location Date Collected δ13C (‰,VPDB)
δ15N (‰,AIR) C:N
Cricket (Order: Gryllidea) Cricket CO july #2 Cornfield July-11 –21.00 4.84 5.04
Cricket CO july #2 DUP Cornfield July-11 –20.68 4.71 4.94 Cricket FO july#1 Meadow July-11 –27.54 2.21 5.40
cricket 1c Cornfield September-11 –16.81 4.70 5.36 cricket 1f Meadow September-11 –28.67 1.52 7.54
cricket 1f DUP Meadow September-11 –28.79 1.48 8.03 cricket 2c Cornfield September-11 –16.61 6.19 4.55 cricket 2f Meadow September-11 –28.16 1.53 5.21 cricket 3f Meadow September-11 –27.49 1.05 5.58
06CRcorn1 Cornfield June-12 –22.22 5.94 4.87 06CRfield1 Meadow June-12 –25.27 1.22 5.10 08CRcorn1 Cornfield August-12 –24.28 4.57 5.70
08CRcorn1 DUP Cornfield August-12 –24.46 4.59 5.31 08CRfield2 Meadow August-12 –26.88 3.41 5.06 09CRcorn1 Cornfield September-12 –23.65 2.05 5.28 09CRcorn2 Cornfield September-12 –23.62 3.31 6.00 09CRcorn3 Cornfield September-12 –23.28 3.09 5.46 09CRfield1 Meadow September-12 –26.55 1.55 4.79 09CRfield2 Meadow September-12 –27.01 2.49 4.87 09CRfield3 Meadow September-12 –26.55 2.09 4.51
Grasshopper (Order: Caelifera) Grasshopper FO june#2 Meadow June-11 –27.10 1.81 5.19 Grasshopper FO june#3 Meadow June-11 –28.65 1.30 5.13
Grasshopper FO june#3 DUP Meadow June-11 –28.41 1.16 5.01 Grasshopper CO july #3 Cornfield July-11 –26.99 1.75 4.68
Grasshopper CO july #3 DUP Cornfield July-11 –27.16 1.81 4.80 11GHfield1 Meadow September-11 –28.62 5.63 5.47
grasshopper 1c Cornfield September-11 –29.70 1.86 5.36 grasshopper 1f Meadow September-11 –29.53 –0.75 5.14 grasshopper 2c Cornfield September-11 –30.08 2.09 5.46 grasshopper 2f Meadow September-11 –27.81 1.65 4.44 grasshopper 3c Cornfield September-11 –30.56 2.22 6.18 grasshopper 3f Meadow September-11 –28.99 0.68 5.36
Grasshopper FO sept #1 Meadow September-11 –26.56 1.85 4.45 05GHcorn1 Cornfield May-12 –29.36 0.75 4.39 05GHcorn2 Cornfield May-12 –28.72 0.16 4.78 05GHcorn3 Cornfield May-12 –28.77 2.84 4.69
05GHcorn4 (new corn) Cornfield May-12 –28.31 0.65 4.36 05GHfield1 Meadow May-12 –29.27 1.59 5.67 05GHfield2 Meadow May-12 –27.38 1.00 3.97
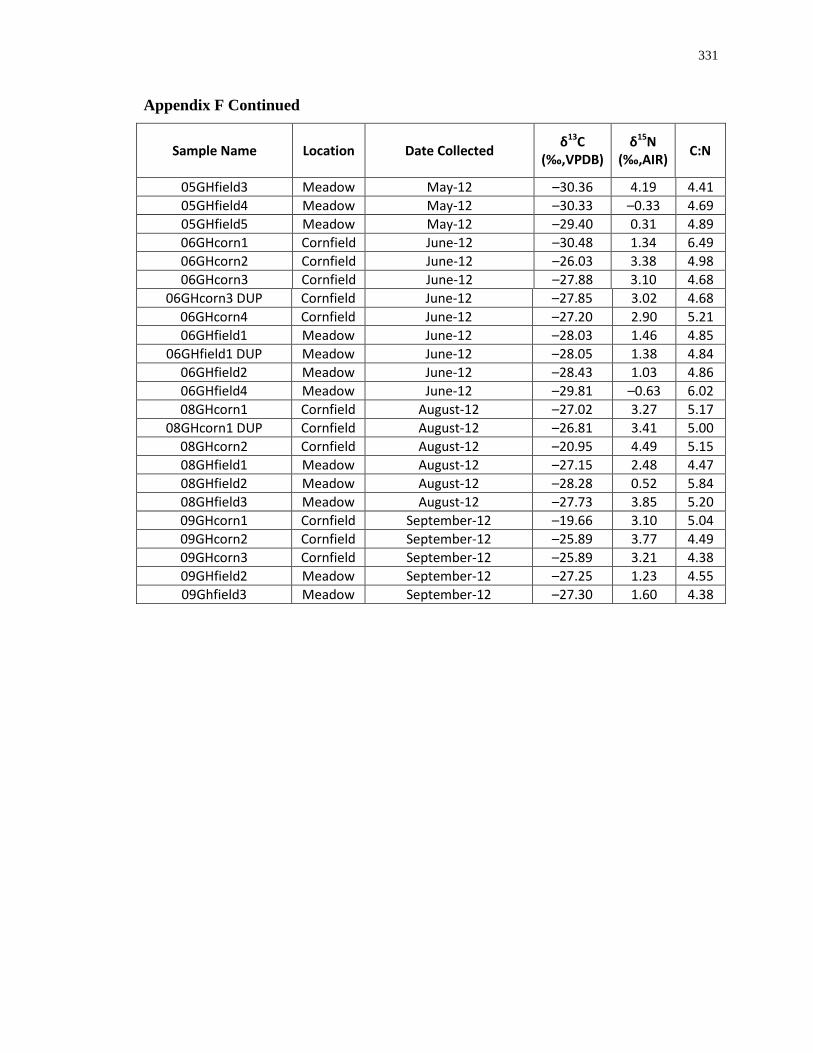
331
Appendix F Continued
Sample Name Location Date Collected δ13C (‰,VPDB)
δ15N (‰,AIR) C:N
05GHfield3 Meadow May-12 –30.36 4.19 4.41 05GHfield4 Meadow May-12 –30.33 –0.33 4.69 05GHfield5 Meadow May-12 –29.40 0.31 4.89 06GHcorn1 Cornfield June-12 –30.48 1.34 6.49 06GHcorn2 Cornfield June-12 –26.03 3.38 4.98 06GHcorn3 Cornfield June-12 –27.88 3.10 4.68
06GHcorn3 DUP Cornfield June-12 –27.85 3.02 4.68 06GHcorn4 Cornfield June-12 –27.20 2.90 5.21 06GHfield1 Meadow June-12 –28.03 1.46 4.85
06GHfield1 DUP Meadow June-12 –28.05 1.38 4.84 06GHfield2 Meadow June-12 –28.43 1.03 4.86 06GHfield4 Meadow June-12 –29.81 –0.63 6.02 08GHcorn1 Cornfield August-12 –27.02 3.27 5.17
08GHcorn1 DUP Cornfield August-12 –26.81 3.41 5.00 08GHcorn2 Cornfield August-12 –20.95 4.49 5.15 08GHfield1 Meadow August-12 –27.15 2.48 4.47 08GHfield2 Meadow August-12 –28.28 0.52 5.84 08GHfield3 Meadow August-12 –27.73 3.85 5.20 09GHcorn1 Cornfield September-12 –19.66 3.10 5.04 09GHcorn2 Cornfield September-12 –25.89 3.77 4.49 09GHcorn3 Cornfield September-12 –25.89 3.21 4.38 09GHfield2 Meadow September-12 –27.25 1.23 4.55 09Ghfield3 Meadow September-12 –27.30 1.60 4.38
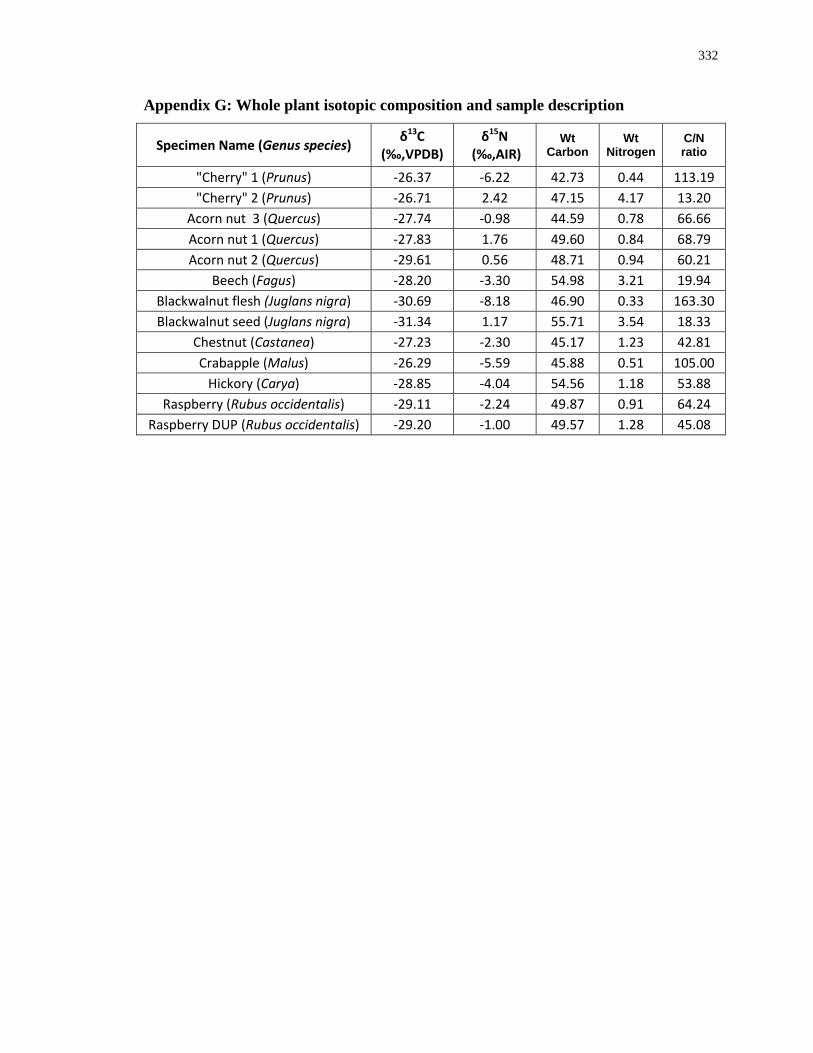
332
Appendix G: Whole plant isotopic composition and sample description
Specimen Name (Genus species) δ13C (‰,VPDB)
δ15N (‰,AIR)
Wt Carbon
Wt Nitrogen
C/N ratio
"Cherry" 1 (Prunus) -26.37 -6.22 42.73 0.44 113.19 "Cherry" 2 (Prunus) -26.71 2.42 47.15 4.17 13.20
Acorn nut 3 (Quercus) -27.74 -0.98 44.59 0.78 66.66 Acorn nut 1 (Quercus) -27.83 1.76 49.60 0.84 68.79 Acorn nut 2 (Quercus) -29.61 0.56 48.71 0.94 60.21
Beech (Fagus) -28.20 -3.30 54.98 3.21 19.94 Blackwalnut flesh (Juglans nigra) -30.69 -8.18 46.90 0.33 163.30 Blackwalnut seed (Juglans nigra) -31.34 1.17 55.71 3.54 18.33
Chestnut (Castanea) -27.23 -2.30 45.17 1.23 42.81 Crabapple (Malus) -26.29 -5.59 45.88 0.51 105.00
Hickory (Carya) -28.85 -4.04 54.56 1.18 53.88 Raspberry (Rubus occidentalis) -29.11 -2.24 49.87 0.91 64.24
Raspberry DUP (Rubus occidentalis) -29.20 -1.00 49.57 1.28 45.08
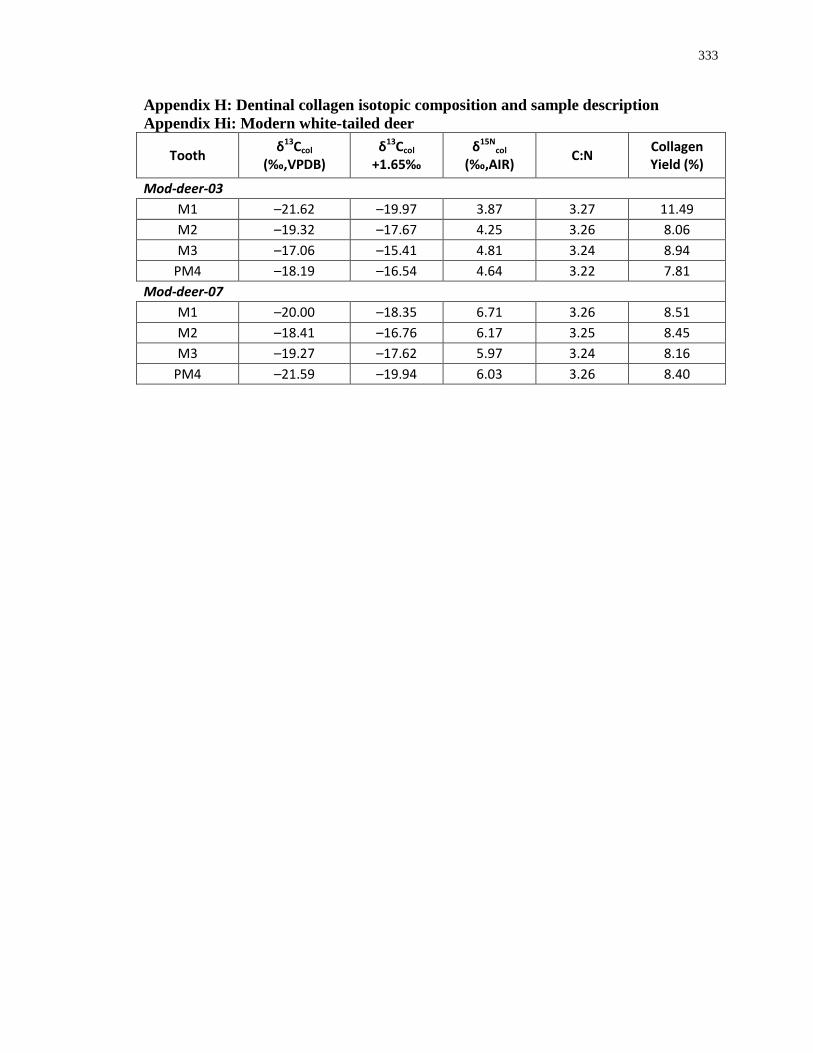
333
Appendix H: Dentinal collagen isotopic composition and sample description Appendix Hi: Modern white-tailed deer
Tooth δ13Ccol (‰,VPDB)
δ13Ccol
+1.65‰ δ15N
col (‰,AIR) C:N Collagen
Yield (%)
Mod-deer-03 M1 –21.62 –19.97 3.87 3.27 11.49 M2 –19.32 –17.67 4.25 3.26 8.06 M3 –17.06 –15.41 4.81 3.24 8.94
PM4 –18.19 –16.54 4.64 3.22 7.81 Mod-deer-07
M1 –20.00 –18.35 6.71 3.26 8.51 M2 –18.41 –16.76 6.17 3.25 8.45 M3 –19.27 –17.62 5.97 3.24 8.16
PM4 –21.59 –19.94 6.03 3.26 8.40
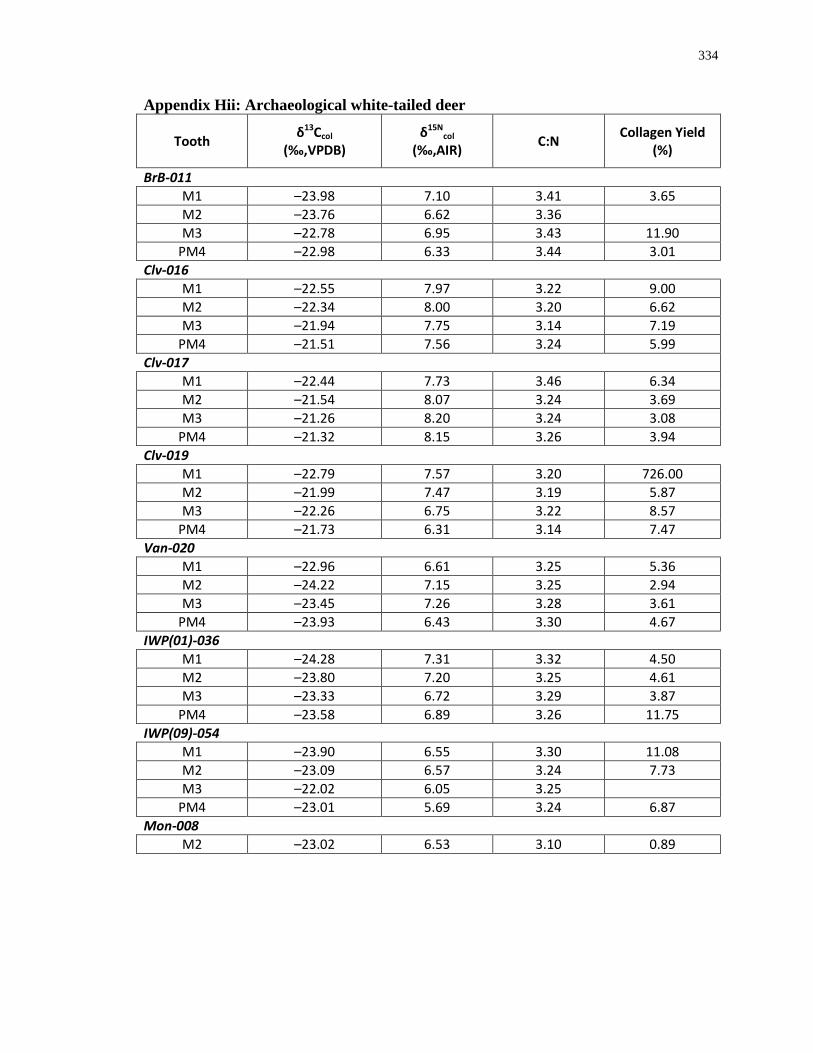
334
Appendix Hii: Archaeological white-tailed deer
Tooth δ13Ccol (‰,VPDB)
δ15Ncol
(‰,AIR) C:N Collagen Yield (%)
BrB-011 M1 –23.98 7.10 3.41 3.65 M2 –23.76 6.62 3.36 M3 –22.78 6.95 3.43 11.90
PM4 –22.98 6.33 3.44 3.01 Clv-016
M1 –22.55 7.97 3.22 9.00 M2 –22.34 8.00 3.20 6.62 M3 –21.94 7.75 3.14 7.19
PM4 –21.51 7.56 3.24 5.99 Clv-017
M1 –22.44 7.73 3.46 6.34 M2 –21.54 8.07 3.24 3.69 M3 –21.26 8.20 3.24 3.08
PM4 –21.32 8.15 3.26 3.94 Clv-019
M1 –22.79 7.57 3.20 726.00 M2 –21.99 7.47 3.19 5.87 M3 –22.26 6.75 3.22 8.57
PM4 –21.73 6.31 3.14 7.47 Van-020
M1 –22.96 6.61 3.25 5.36 M2 –24.22 7.15 3.25 2.94 M3 –23.45 7.26 3.28 3.61
PM4 –23.93 6.43 3.30 4.67 IWP(01)-036
M1 –24.28 7.31 3.32 4.50 M2 –23.80 7.20 3.25 4.61 M3 –23.33 6.72 3.29 3.87
PM4 –23.58 6.89 3.26 11.75 IWP(09)-054
M1 –23.90 6.55 3.30 11.08 M2 –23.09 6.57 3.24 7.73 M3 –22.02 6.05 3.25
PM4 –23.01 5.69 3.24 6.87 Mon-008
M2 –23.02 6.53 3.10 0.89

335
Appendix HiiI: Archaeological dog
Tooth δ13Ccol (‰,VPDB)
δ15Ncol
(‰,AIR) C:N Collagen Yield (%)
Van-124 M1 –16.53 10.67 3.73 3.71 M2 –14.84 9.99 3.43 3.77
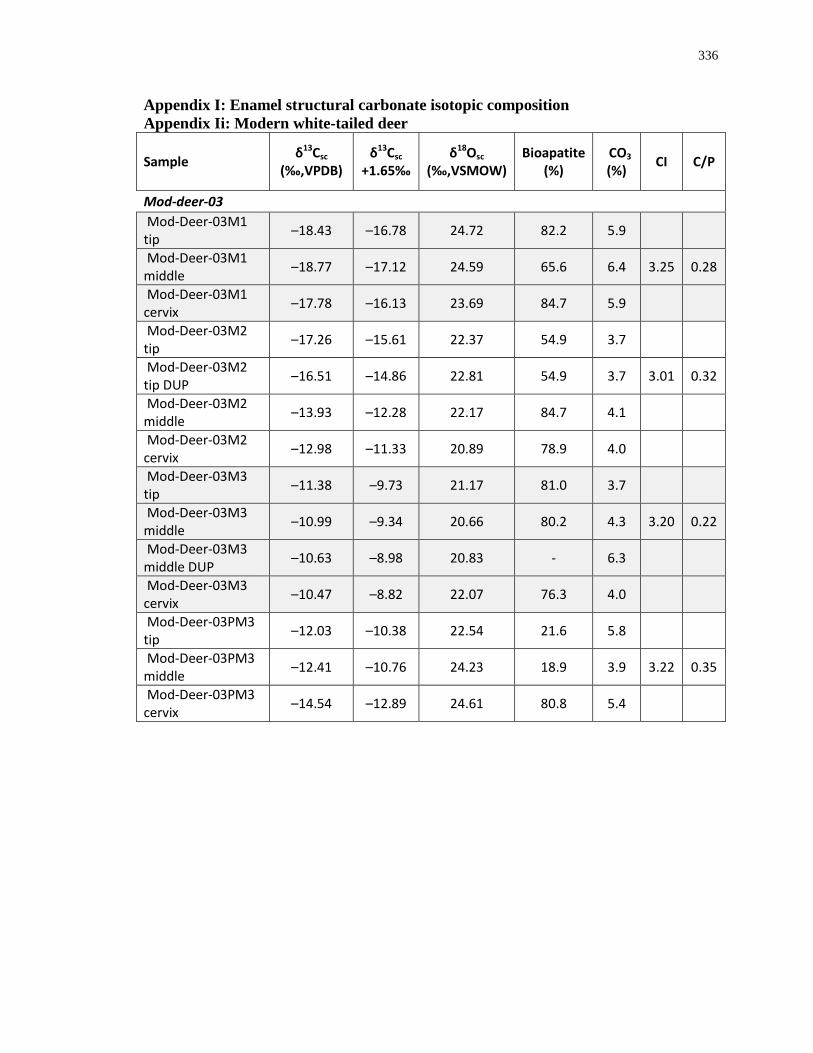
336
Appendix I: Enamel structural carbonate isotopic composition Appendix Ii: Modern white-tailed deer
Sample δ13Csc (‰,VPDB)
δ13Csc +1.65‰
δ18Osc (‰,VSMOW)
Bioapatite (%)
CO3
(%) CI C/P
Mod-deer-03 Mod-Deer-03M1 tip –18.43 –16.78 24.72 82.2 5.9
Mod-Deer-03M1 middle –18.77 –17.12 24.59 65.6 6.4 3.25 0.28
Mod-Deer-03M1 cervix –17.78 –16.13 23.69 84.7 5.9
Mod-Deer-03M2 tip –17.26 –15.61 22.37 54.9 3.7
Mod-Deer-03M2 tip DUP –16.51 –14.86 22.81 54.9 3.7 3.01 0.32
Mod-Deer-03M2 middle –13.93 –12.28 22.17 84.7 4.1
Mod-Deer-03M2 cervix –12.98 –11.33 20.89 78.9 4.0
Mod-Deer-03M3 tip –11.38 –9.73 21.17 81.0 3.7
Mod-Deer-03M3 middle –10.99 –9.34 20.66 80.2 4.3 3.20 0.22
Mod-Deer-03M3 middle DUP –10.63 –8.98 20.83 - 6.3
Mod-Deer-03M3 cervix –10.47 –8.82 22.07 76.3 4.0
Mod-Deer-03PM3 tip –12.03 –10.38 22.54 21.6 5.8
Mod-Deer-03PM3 middle –12.41 –10.76 24.23 18.9 3.9 3.22 0.35
Mod-Deer-03PM3 cervix –14.54 –12.89 24.61 80.8 5.4
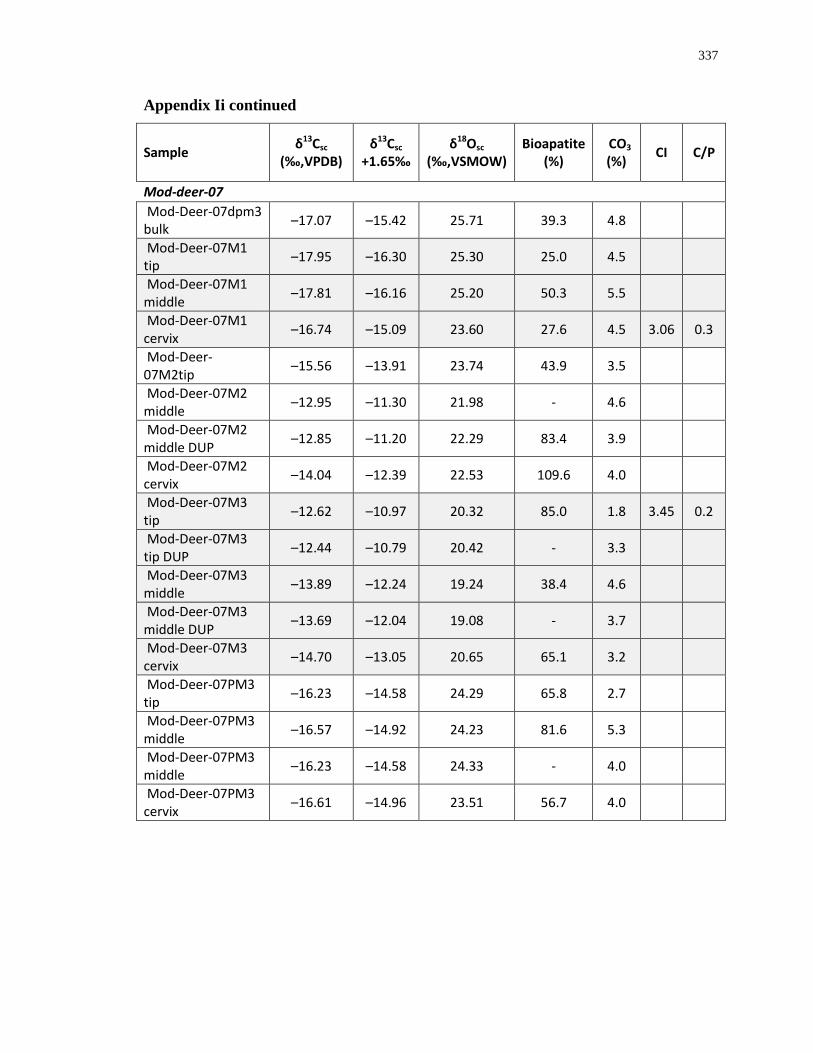
337
Appendix Ii continued
Sample δ13Csc (‰,VPDB)
δ13Csc +1.65‰
δ18Osc (‰,VSMOW)
Bioapatite (%)
CO3
(%) CI C/P
Mod-deer-07 Mod-Deer-07dpm3 bulk –17.07 –15.42 25.71 39.3 4.8
Mod-Deer-07M1 tip –17.95 –16.30 25.30 25.0 4.5
Mod-Deer-07M1 middle –17.81 –16.16 25.20 50.3 5.5
Mod-Deer-07M1 cervix –16.74 –15.09 23.60 27.6 4.5 3.06 0.3
Mod-Deer-07M2tip –15.56 –13.91 23.74 43.9 3.5
Mod-Deer-07M2 middle –12.95 –11.30 21.98 - 4.6
Mod-Deer-07M2 middle DUP –12.85 –11.20 22.29 83.4 3.9
Mod-Deer-07M2 cervix –14.04 –12.39 22.53 109.6 4.0
Mod-Deer-07M3 tip –12.62 –10.97 20.32 85.0 1.8 3.45 0.2
Mod-Deer-07M3 tip DUP –12.44 –10.79 20.42 - 3.3
Mod-Deer-07M3 middle –13.89 –12.24 19.24 38.4 4.6
Mod-Deer-07M3 middle DUP –13.69 –12.04 19.08 - 3.7
Mod-Deer-07M3 cervix –14.70 –13.05 20.65 65.1 3.2
Mod-Deer-07PM3 tip –16.23 –14.58 24.29 65.8 2.7
Mod-Deer-07PM3 middle –16.57 –14.92 24.23 81.6 5.3
Mod-Deer-07PM3 middle –16.23 –14.58 24.33 - 4.0
Mod-Deer-07PM3 cervix –16.61 –14.96 23.51 56.7 4.0
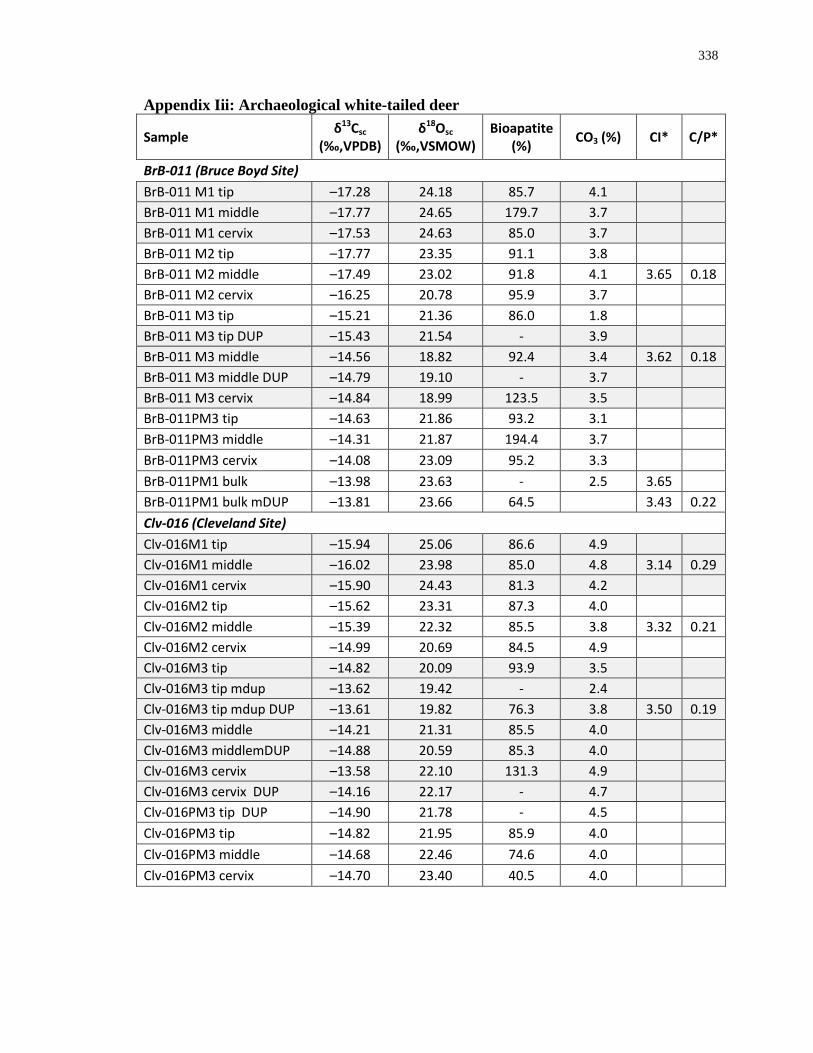
338
Appendix Iii: Archaeological white-tailed deer
Sample δ13Csc (‰,VPDB)
δ18Osc (‰,VSMOW)
Bioapatite (%) CO3 (%) CI* C/P*
BrB-011 (Bruce Boyd Site) BrB-011 M1 tip –17.28 24.18 85.7 4.1 BrB-011 M1 middle –17.77 24.65 179.7 3.7 BrB-011 M1 cervix –17.53 24.63 85.0 3.7 BrB-011 M2 tip –17.77 23.35 91.1 3.8 BrB-011 M2 middle –17.49 23.02 91.8 4.1 3.65 0.18 BrB-011 M2 cervix –16.25 20.78 95.9 3.7 BrB-011 M3 tip –15.21 21.36 86.0 1.8 BrB-011 M3 tip DUP –15.43 21.54 - 3.9 BrB-011 M3 middle –14.56 18.82 92.4 3.4 3.62 0.18 BrB-011 M3 middle DUP –14.79 19.10 - 3.7 BrB-011 M3 cervix –14.84 18.99 123.5 3.5 BrB-011PM3 tip –14.63 21.86 93.2 3.1 BrB-011PM3 middle –14.31 21.87 194.4 3.7 BrB-011PM3 cervix –14.08 23.09 95.2 3.3 BrB-011PM1 bulk –13.98 23.63 - 2.5 3.65 BrB-011PM1 bulk mDUP –13.81 23.66 64.5 3.43 0.22 Clv-016 (Cleveland Site) Clv-016M1 tip –15.94 25.06 86.6 4.9 Clv-016M1 middle –16.02 23.98 85.0 4.8 3.14 0.29 Clv-016M1 cervix –15.90 24.43 81.3 4.2 Clv-016M2 tip –15.62 23.31 87.3 4.0 Clv-016M2 middle –15.39 22.32 85.5 3.8 3.32 0.21 Clv-016M2 cervix –14.99 20.69 84.5 4.9 Clv-016M3 tip –14.82 20.09 93.9 3.5 Clv-016M3 tip mdup –13.62 19.42 - 2.4 Clv-016M3 tip mdup DUP –13.61 19.82 76.3 3.8 3.50 0.19 Clv-016M3 middle –14.21 21.31 85.5 4.0 Clv-016M3 middlemDUP –14.88 20.59 85.3 4.0 Clv-016M3 cervix –13.58 22.10 131.3 4.9 Clv-016M3 cervix DUP –14.16 22.17 - 4.7 Clv-016PM3 tip DUP –14.90 21.78 - 4.5 Clv-016PM3 tip –14.82 21.95 85.9 4.0 Clv-016PM3 middle –14.68 22.46 74.6 4.0 Clv-016PM3 cervix –14.70 23.40 40.5 4.0
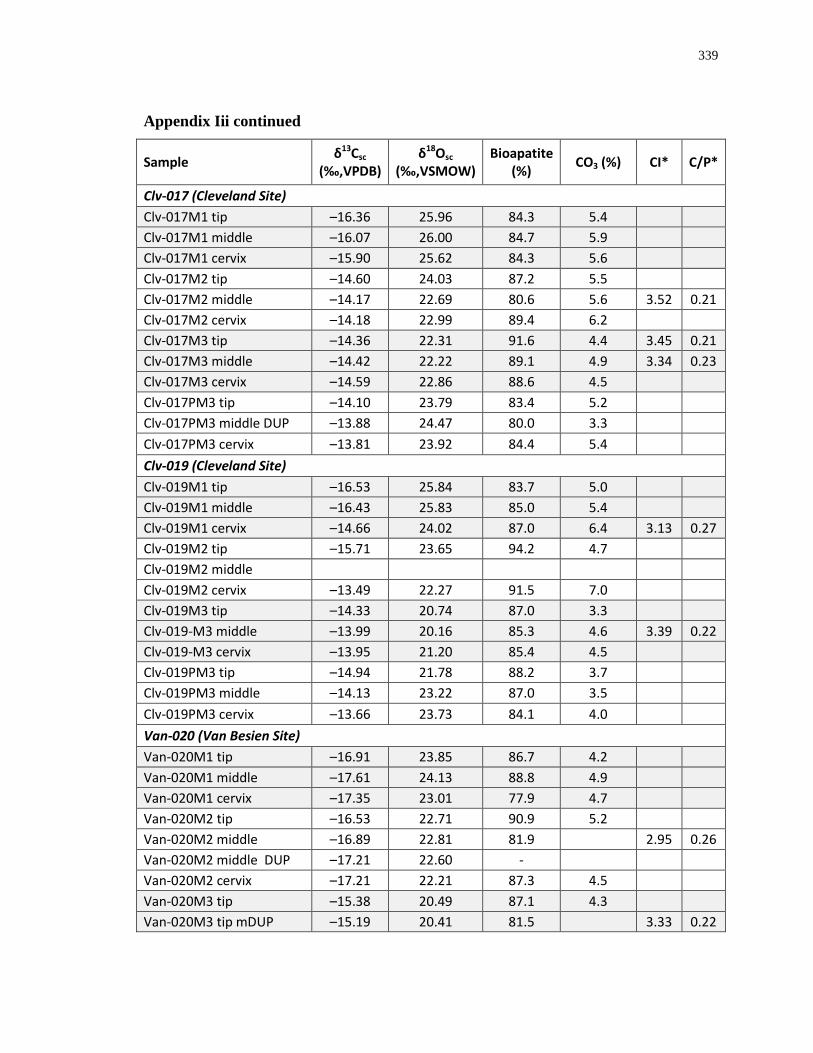
339
Appendix Iii continued
Sample δ13Csc (‰,VPDB)
δ18Osc (‰,VSMOW)
Bioapatite (%) CO3 (%) CI* C/P*
Clv-017 (Cleveland Site) Clv-017M1 tip –16.36 25.96 84.3 5.4 Clv-017M1 middle –16.07 26.00 84.7 5.9 Clv-017M1 cervix –15.90 25.62 84.3 5.6 Clv-017M2 tip –14.60 24.03 87.2 5.5 Clv-017M2 middle –14.17 22.69 80.6 5.6 3.52 0.21 Clv-017M2 cervix –14.18 22.99 89.4 6.2 Clv-017M3 tip –14.36 22.31 91.6 4.4 3.45 0.21 Clv-017M3 middle –14.42 22.22 89.1 4.9 3.34 0.23 Clv-017M3 cervix –14.59 22.86 88.6 4.5 Clv-017PM3 tip –14.10 23.79 83.4 5.2 Clv-017PM3 middle DUP –13.88 24.47 80.0 3.3 Clv-017PM3 cervix –13.81 23.92 84.4 5.4 Clv-019 (Cleveland Site) Clv-019M1 tip –16.53 25.84 83.7 5.0 Clv-019M1 middle –16.43 25.83 85.0 5.4 Clv-019M1 cervix –14.66 24.02 87.0 6.4 3.13 0.27 Clv-019M2 tip –15.71 23.65 94.2 4.7 Clv-019M2 middle Clv-019M2 cervix –13.49 22.27 91.5 7.0 Clv-019M3 tip –14.33 20.74 87.0 3.3 Clv-019-M3 middle –13.99 20.16 85.3 4.6 3.39 0.22 Clv-019-M3 cervix –13.95 21.20 85.4 4.5 Clv-019PM3 tip –14.94 21.78 88.2 3.7 Clv-019PM3 middle –14.13 23.22 87.0 3.5 Clv-019PM3 cervix –13.66 23.73 84.1 4.0 Van-020 (Van Besien Site) Van-020M1 tip –16.91 23.85 86.7 4.2 Van-020M1 middle –17.61 24.13 88.8 4.9 Van-020M1 cervix –17.35 23.01 77.9 4.7 Van-020M2 tip –16.53 22.71 90.9 5.2 Van-020M2 middle –16.89 22.81 81.9 2.95 0.26 Van-020M2 middle DUP –17.21 22.60 - Van-020M2 cervix –17.21 22.21 87.3 4.5 Van-020M3 tip –15.38 20.49 87.1 4.3 Van-020M3 tip mDUP –15.19 20.41 81.5 3.33 0.22
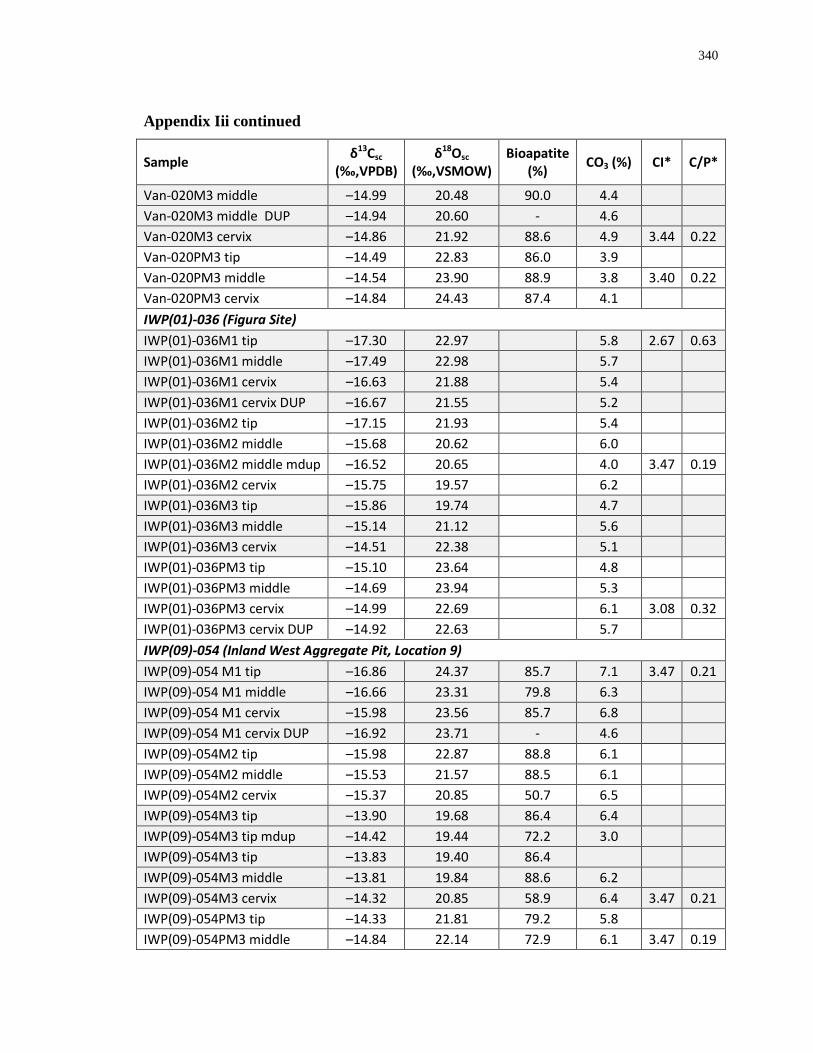
340
Appendix Iii continued
Sample δ13Csc (‰,VPDB)
δ18Osc (‰,VSMOW)
Bioapatite (%) CO3 (%) CI* C/P*
Van-020M3 middle –14.99 20.48 90.0 4.4 Van-020M3 middle DUP –14.94 20.60 - 4.6 Van-020M3 cervix –14.86 21.92 88.6 4.9 3.44 0.22 Van-020PM3 tip –14.49 22.83 86.0 3.9 Van-020PM3 middle –14.54 23.90 88.9 3.8 3.40 0.22 Van-020PM3 cervix –14.84 24.43 87.4 4.1 IWP(01)-036 (Figura Site) IWP(01)-036M1 tip –17.30 22.97 5.8 2.67 0.63 IWP(01)-036M1 middle –17.49 22.98 5.7 IWP(01)-036M1 cervix –16.63 21.88 5.4 IWP(01)-036M1 cervix DUP –16.67 21.55 5.2 IWP(01)-036M2 tip –17.15 21.93 5.4 IWP(01)-036M2 middle –15.68 20.62 6.0 IWP(01)-036M2 middle mdup –16.52 20.65 4.0 3.47 0.19 IWP(01)-036M2 cervix –15.75 19.57 6.2 IWP(01)-036M3 tip –15.86 19.74 4.7 IWP(01)-036M3 middle –15.14 21.12 5.6 IWP(01)-036M3 cervix –14.51 22.38 5.1 IWP(01)-036PM3 tip –15.10 23.64 4.8 IWP(01)-036PM3 middle –14.69 23.94 5.3 IWP(01)-036PM3 cervix –14.99 22.69 6.1 3.08 0.32 IWP(01)-036PM3 cervix DUP –14.92 22.63 5.7 IWP(09)-054 (Inland West Aggregate Pit, Location 9) IWP(09)-054 M1 tip –16.86 24.37 85.7 7.1 3.47 0.21 IWP(09)-054 M1 middle –16.66 23.31 79.8 6.3 IWP(09)-054 M1 cervix –15.98 23.56 85.7 6.8 IWP(09)-054 M1 cervix DUP –16.92 23.71 - 4.6 IWP(09)-054M2 tip –15.98 22.87 88.8 6.1 IWP(09)-054M2 middle –15.53 21.57 88.5 6.1 IWP(09)-054M2 cervix –15.37 20.85 50.7 6.5 IWP(09)-054M3 tip –13.90 19.68 86.4 6.4 IWP(09)-054M3 tip mdup –14.42 19.44 72.2 3.0 IWP(09)-054M3 tip –13.83 19.40 86.4 IWP(09)-054M3 middle –13.81 19.84 88.6 6.2 IWP(09)-054M3 cervix –14.32 20.85 58.9 6.4 3.47 0.21 IWP(09)-054PM3 tip –14.33 21.81 79.2 5.8 IWP(09)-054PM3 middle –14.84 22.14 72.9 6.1 3.47 0.19
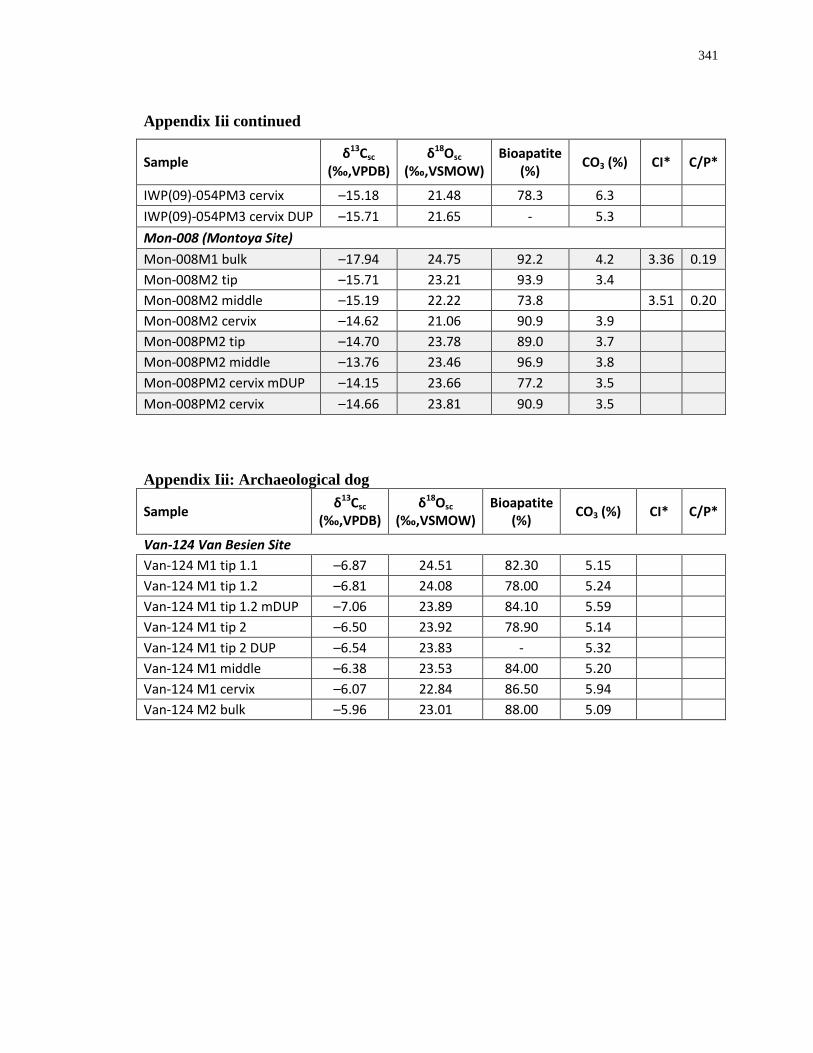
341
Appendix Iii continued
Sample δ13Csc (‰,VPDB)
δ18Osc (‰,VSMOW)
Bioapatite (%) CO3 (%) CI* C/P*
IWP(09)-054PM3 cervix –15.18 21.48 78.3 6.3 IWP(09)-054PM3 cervix DUP –15.71 21.65 - 5.3 Mon-008 (Montoya Site) Mon-008M1 bulk –17.94 24.75 92.2 4.2 3.36 0.19 Mon-008M2 tip –15.71 23.21 93.9 3.4 Mon-008M2 middle –15.19 22.22 73.8 3.51 0.20 Mon-008M2 cervix –14.62 21.06 90.9 3.9 Mon-008PM2 tip –14.70 23.78 89.0 3.7 Mon-008PM2 middle –13.76 23.46 96.9 3.8 Mon-008PM2 cervix mDUP –14.15 23.66 77.2 3.5 Mon-008PM2 cervix –14.66 23.81 90.9 3.5
Appendix Iii: Archaeological dog
Sample δ13Csc (‰,VPDB)
δ18Osc (‰,VSMOW)
Bioapatite (%) CO3 (%) CI* C/P*
Van-124 Van Besien Site Van-124 M1 tip 1.1 –6.87 24.51 82.30 5.15 Van-124 M1 tip 1.2 –6.81 24.08 78.00 5.24 Van-124 M1 tip 1.2 mDUP –7.06 23.89 84.10 5.59 Van-124 M1 tip 2 –6.50 23.92 78.90 5.14 Van-124 M1 tip 2 DUP –6.54 23.83 - 5.32 Van-124 M1 middle –6.38 23.53 84.00 5.20 Van-124 M1 cervix –6.07 22.84 86.50 5.94 Van-124 M2 bulk –5.96 23.01 88.00 5.09
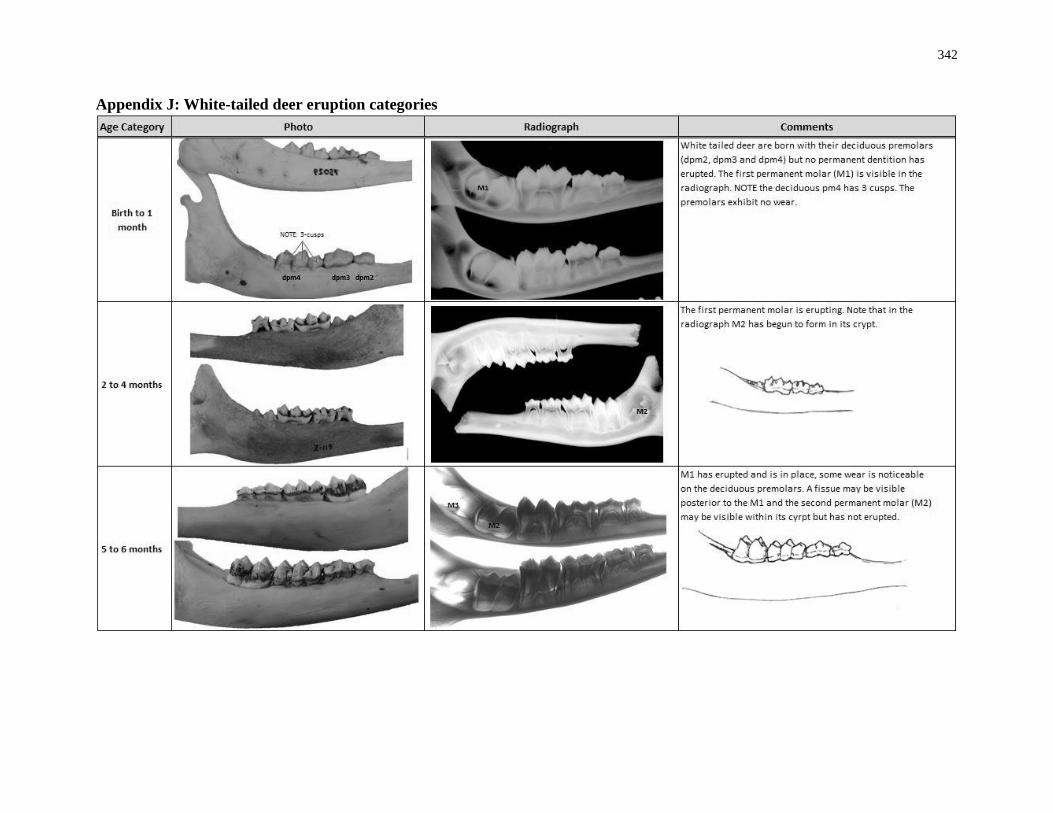
342
Appendix J: White-tailed deer eruption categories
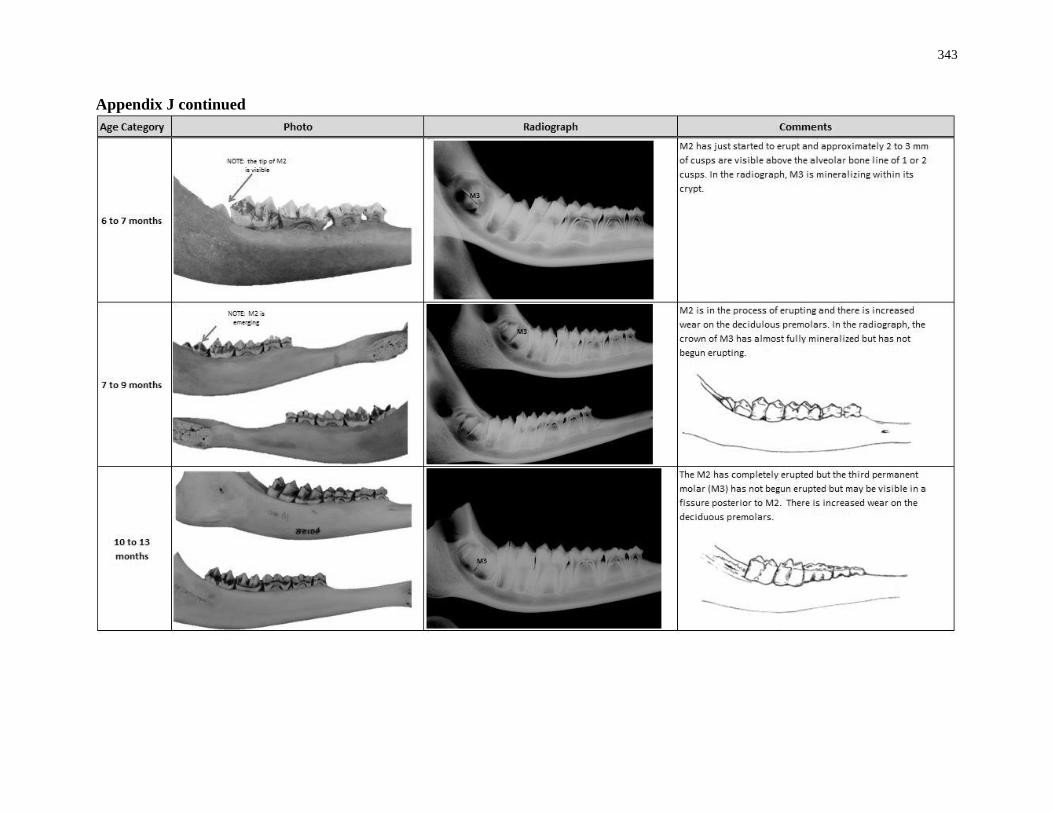
343
Appendix J continued
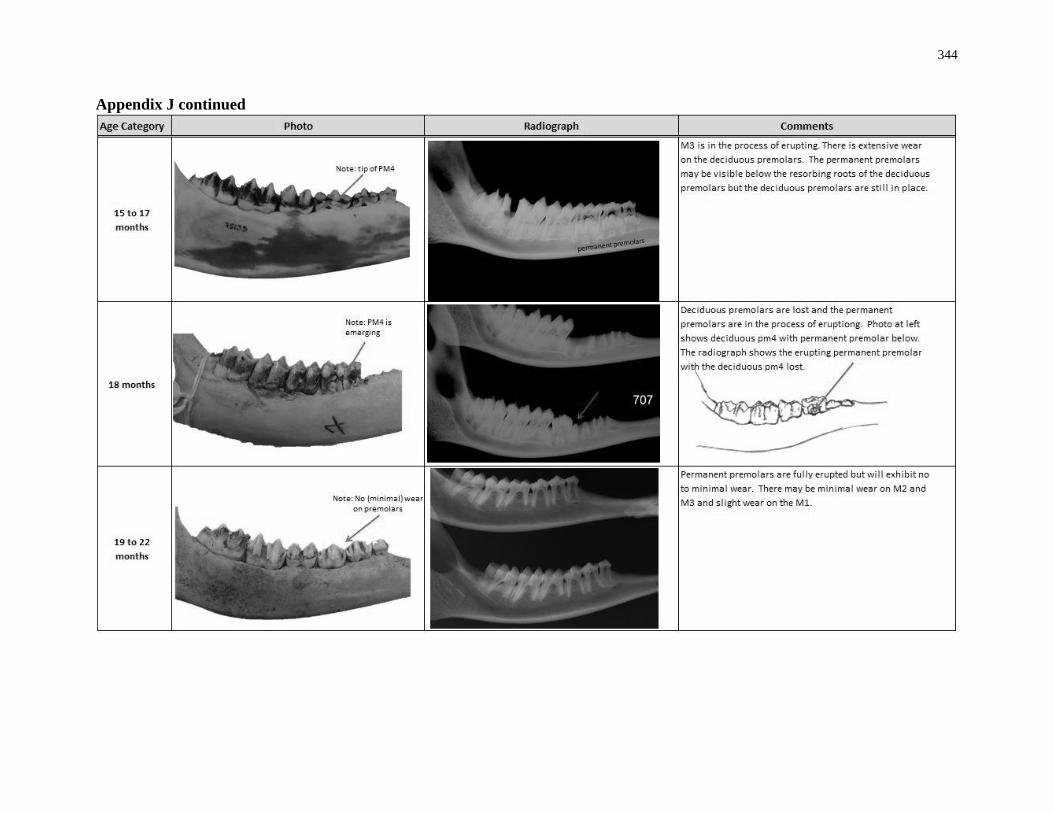
344
Appendix J continued
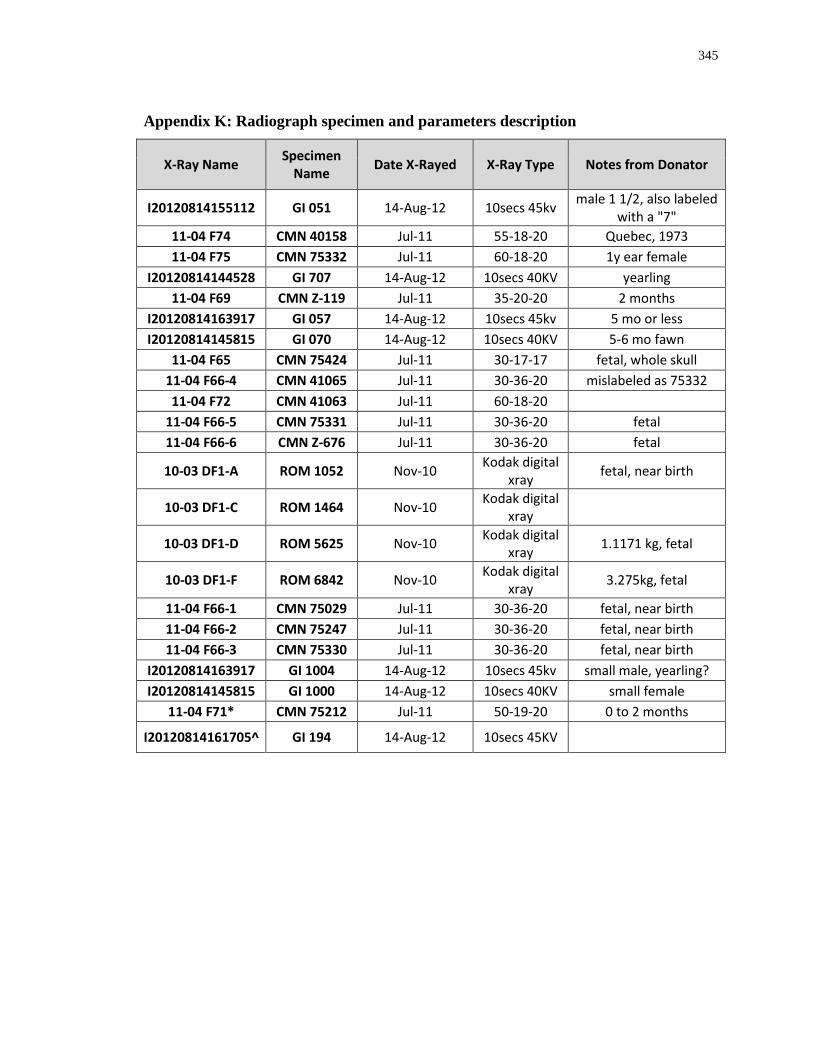
345
Appendix K: Radiograph specimen and parameters description
X-Ray Name Specimen Name Date X-Rayed X-Ray Type Notes from Donator
I20120814155112 GI 051 14-Aug-12 10secs 45kv male 1 1/2, also labeled with a "7"
11-04 F74 CMN 40158 Jul-11 55-18-20 Quebec, 1973 11-04 F75 CMN 75332 Jul-11 60-18-20 1y ear female
I20120814144528 GI 707 14-Aug-12 10secs 40KV yearling 11-04 F69 CMN Z-119 Jul-11 35-20-20 2 months
I20120814163917 GI 057 14-Aug-12 10secs 45kv 5 mo or less I20120814145815 GI 070 14-Aug-12 10secs 40KV 5-6 mo fawn
11-04 F65 CMN 75424 Jul-11 30-17-17 fetal, whole skull 11-04 F66-4 CMN 41065 Jul-11 30-36-20 mislabeled as 75332 11-04 F72 CMN 41063 Jul-11 60-18-20
11-04 F66-5 CMN 75331 Jul-11 30-36-20 fetal 11-04 F66-6 CMN Z-676 Jul-11 30-36-20 fetal
10-03 DF1-A ROM 1052 Nov-10 Kodak digital xray fetal, near birth
10-03 DF1-C ROM 1464 Nov-10 Kodak digital xray
10-03 DF1-D ROM 5625 Nov-10 Kodak digital xray 1.1171 kg, fetal
10-03 DF1-F ROM 6842 Nov-10 Kodak digital xray 3.275kg, fetal
11-04 F66-1 CMN 75029 Jul-11 30-36-20 fetal, near birth 11-04 F66-2 CMN 75247 Jul-11 30-36-20 fetal, near birth 11-04 F66-3 CMN 75330 Jul-11 30-36-20 fetal, near birth
I20120814163917 GI 1004 14-Aug-12 10secs 45kv small male, yearling? I20120814145815 GI 1000 14-Aug-12 10secs 40KV small female
11-04 F71* CMN 75212 Jul-11 50-19-20 0 to 2 months
I20120814161705^ GI 194 14-Aug-12 10secs 45KV
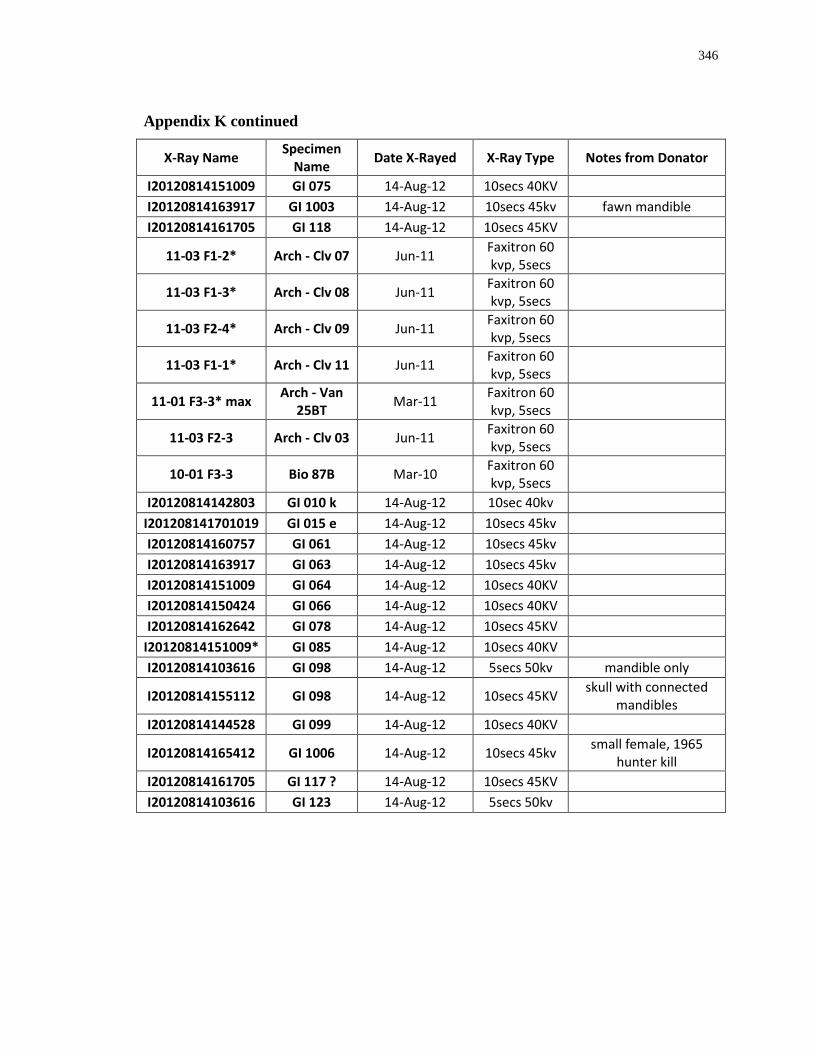
346
Appendix K continued
X-Ray Name Specimen Name Date X-Rayed X-Ray Type Notes from Donator
I20120814151009 GI 075 14-Aug-12 10secs 40KV I20120814163917 GI 1003 14-Aug-12 10secs 45kv fawn mandible I20120814161705 GI 118 14-Aug-12 10secs 45KV
11-03 F1-2* Arch - Clv 07 Jun-11 Faxitron 60 kvp, 5secs
11-03 F1-3* Arch - Clv 08 Jun-11 Faxitron 60 kvp, 5secs
11-03 F2-4* Arch - Clv 09 Jun-11 Faxitron 60 kvp, 5secs
11-03 F1-1* Arch - Clv 11 Jun-11 Faxitron 60 kvp, 5secs
11-01 F3-3* max Arch - Van 25BT Mar-11 Faxitron 60
kvp, 5secs
11-03 F2-3 Arch - Clv 03 Jun-11 Faxitron 60 kvp, 5secs
10-01 F3-3 Bio 87B Mar-10 Faxitron 60 kvp, 5secs
I20120814142803 GI 010 k 14-Aug-12 10sec 40kv I201208141701019 GI 015 e 14-Aug-12 10secs 45kv I20120814160757 GI 061 14-Aug-12 10secs 45kv I20120814163917 GI 063 14-Aug-12 10secs 45kv I20120814151009 GI 064 14-Aug-12 10secs 40KV I20120814150424 GI 066 14-Aug-12 10secs 40KV I20120814162642 GI 078 14-Aug-12 10secs 45KV
I20120814151009* GI 085 14-Aug-12 10secs 40KV I20120814103616 GI 098 14-Aug-12 5secs 50kv mandible only
I20120814155112 GI 098 14-Aug-12 10secs 45KV skull with connected mandibles
I20120814144528 GI 099 14-Aug-12 10secs 40KV I20120814165412 GI 1006 14-Aug-12 10secs 45kv small female, 1965
hunter kill I20120814161705 GI 117 ? 14-Aug-12 10secs 45KV I20120814103616 GI 123 14-Aug-12 5secs 50kv
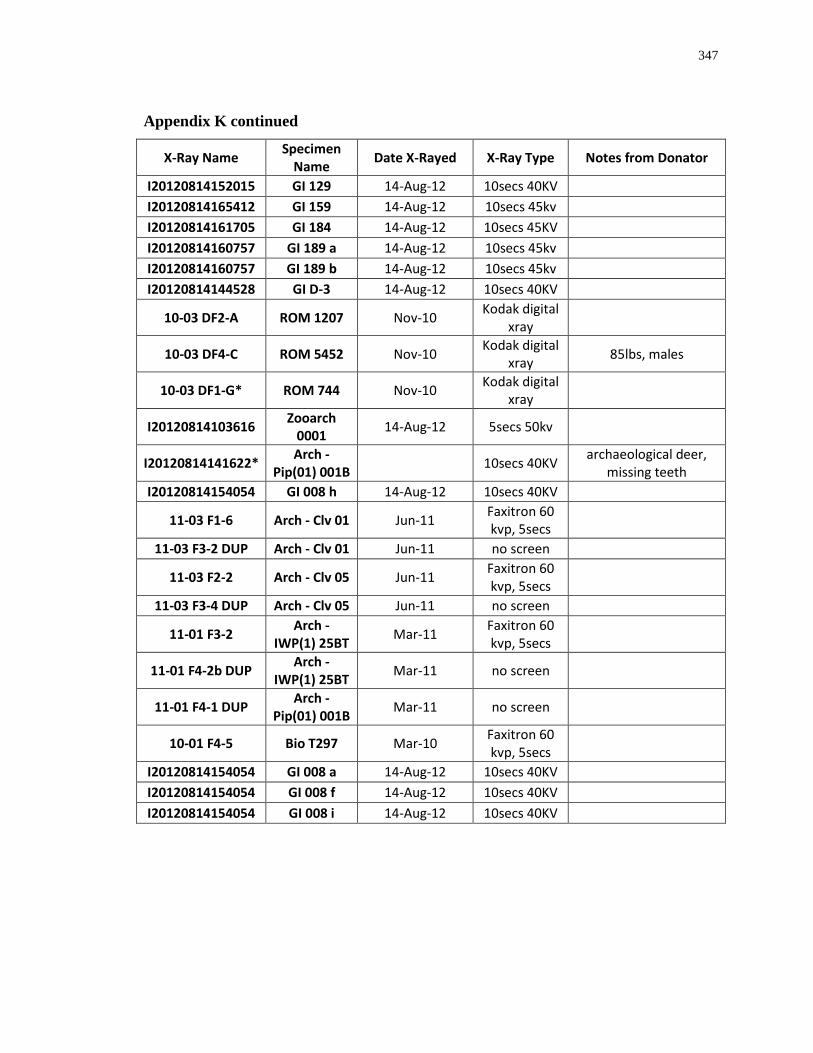
347
Appendix K continued
X-Ray Name Specimen Name Date X-Rayed X-Ray Type Notes from Donator
I20120814152015 GI 129 14-Aug-12 10secs 40KV I20120814165412 GI 159 14-Aug-12 10secs 45kv I20120814161705 GI 184 14-Aug-12 10secs 45KV I20120814160757 GI 189 a 14-Aug-12 10secs 45kv I20120814160757 GI 189 b 14-Aug-12 10secs 45kv I20120814144528 GI D-3 14-Aug-12 10secs 40KV
10-03 DF2-A ROM 1207 Nov-10 Kodak digital xray
10-03 DF4-C ROM 5452 Nov-10 Kodak digital xray 85lbs, males
10-03 DF1-G* ROM 744 Nov-10 Kodak digital xray
I20120814103616 Zooarch 0001 14-Aug-12 5secs 50kv
I20120814141622* Arch - Pip(01) 001B 10secs 40KV archaeological deer,
missing teeth I20120814154054 GI 008 h 14-Aug-12 10secs 40KV
11-03 F1-6 Arch - Clv 01 Jun-11 Faxitron 60 kvp, 5secs
11-03 F3-2 DUP Arch - Clv 01 Jun-11 no screen
11-03 F2-2 Arch - Clv 05 Jun-11 Faxitron 60 kvp, 5secs
11-03 F3-4 DUP Arch - Clv 05 Jun-11 no screen
11-01 F3-2 Arch - IWP(1) 25BT Mar-11 Faxitron 60
kvp, 5secs
11-01 F4-2b DUP Arch - IWP(1) 25BT Mar-11 no screen
11-01 F4-1 DUP Arch - Pip(01) 001B Mar-11 no screen
10-01 F4-5 Bio T297 Mar-10 Faxitron 60 kvp, 5secs
I20120814154054 GI 008 a 14-Aug-12 10secs 40KV I20120814154054 GI 008 f 14-Aug-12 10secs 40KV I20120814154054 GI 008 i 14-Aug-12 10secs 40KV
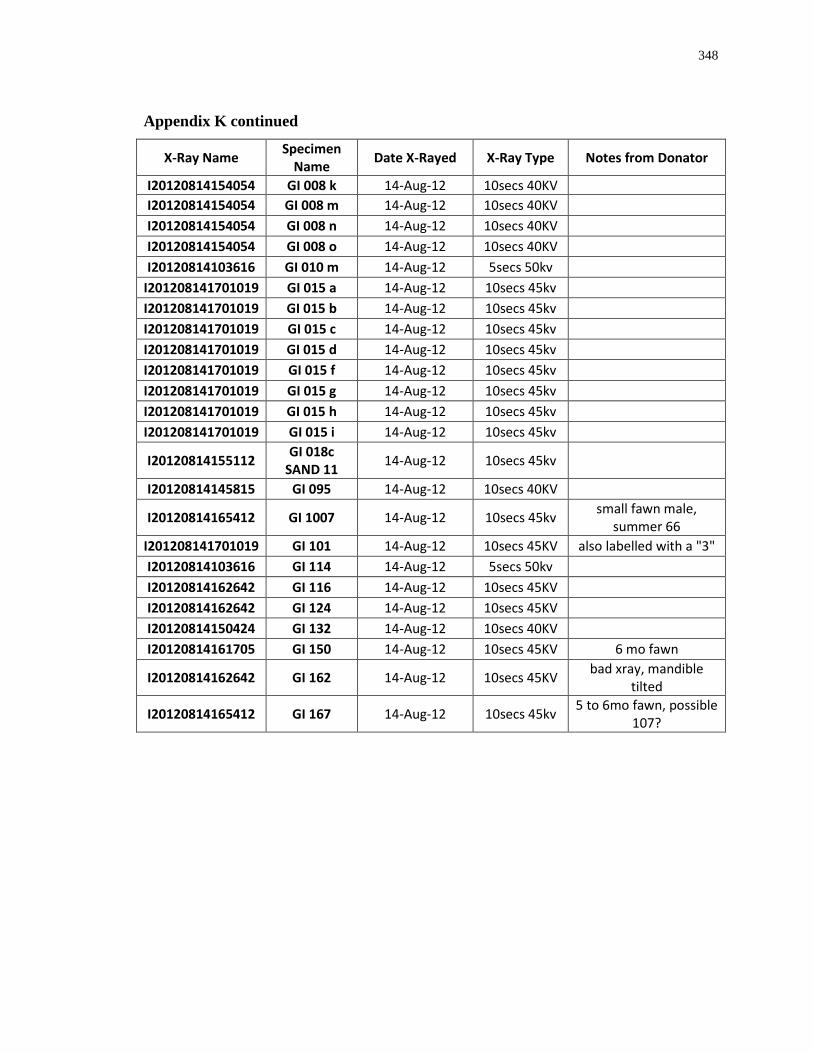
348
Appendix K continued
X-Ray Name Specimen Name Date X-Rayed X-Ray Type Notes from Donator
I20120814154054 GI 008 k 14-Aug-12 10secs 40KV I20120814154054 GI 008 m 14-Aug-12 10secs 40KV I20120814154054 GI 008 n 14-Aug-12 10secs 40KV I20120814154054 GI 008 o 14-Aug-12 10secs 40KV I20120814103616 GI 010 m 14-Aug-12 5secs 50kv
I201208141701019 GI 015 a 14-Aug-12 10secs 45kv I201208141701019 GI 015 b 14-Aug-12 10secs 45kv I201208141701019 GI 015 c 14-Aug-12 10secs 45kv I201208141701019 GI 015 d 14-Aug-12 10secs 45kv I201208141701019 GI 015 f 14-Aug-12 10secs 45kv I201208141701019 GI 015 g 14-Aug-12 10secs 45kv I201208141701019 GI 015 h 14-Aug-12 10secs 45kv I201208141701019 GI 015 i 14-Aug-12 10secs 45kv I20120814155112 GI 018c
SAND 11 14-Aug-12 10secs 45kv I20120814145815 GI 095 14-Aug-12 10secs 40KV I20120814165412 GI 1007 14-Aug-12 10secs 45kv small fawn male,
summer 66 I201208141701019 GI 101 14-Aug-12 10secs 45KV also labelled with a "3" I20120814103616 GI 114 14-Aug-12 5secs 50kv I20120814162642 GI 116 14-Aug-12 10secs 45KV I20120814162642 GI 124 14-Aug-12 10secs 45KV I20120814150424 GI 132 14-Aug-12 10secs 40KV I20120814161705 GI 150 14-Aug-12 10secs 45KV 6 mo fawn
I20120814162642 GI 162 14-Aug-12 10secs 45KV bad xray, mandible tilted
I20120814165412 GI 167 14-Aug-12 10secs 45kv 5 to 6mo fawn, possible 107?
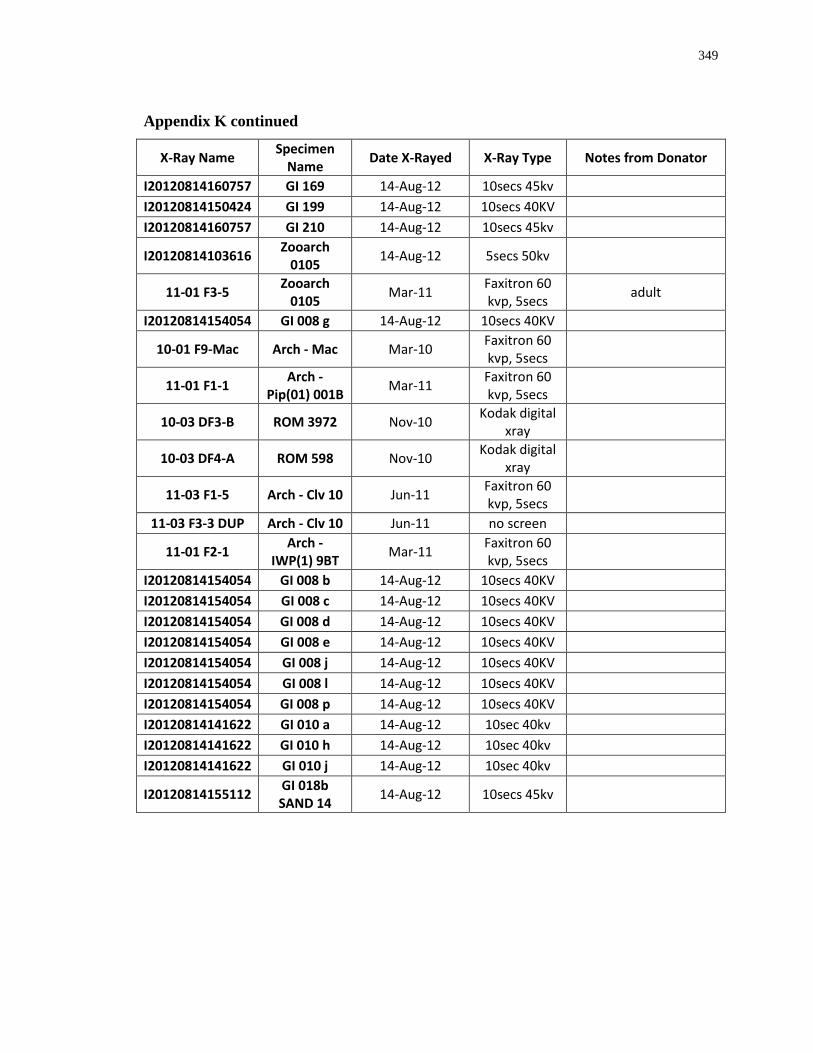
349
Appendix K continued
X-Ray Name Specimen Name Date X-Rayed X-Ray Type Notes from Donator
I20120814160757 GI 169 14-Aug-12 10secs 45kv I20120814150424 GI 199 14-Aug-12 10secs 40KV I20120814160757 GI 210 14-Aug-12 10secs 45kv I20120814103616 Zooarch
0105 14-Aug-12 5secs 50kv
11-01 F3-5 Zooarch 0105 Mar-11 Faxitron 60
kvp, 5secs adult
I20120814154054 GI 008 g 14-Aug-12 10secs 40KV 10-01 F9-Mac Arch - Mac Mar-10 Faxitron 60
kvp, 5secs
11-01 F1-1 Arch - Pip(01) 001B Mar-11 Faxitron 60
kvp, 5secs
10-03 DF3-B ROM 3972 Nov-10 Kodak digital xray
10-03 DF4-A ROM 598 Nov-10 Kodak digital xray
11-03 F1-5 Arch - Clv 10 Jun-11 Faxitron 60 kvp, 5secs
11-03 F3-3 DUP Arch - Clv 10 Jun-11 no screen
11-01 F2-1 Arch - IWP(1) 9BT Mar-11 Faxitron 60
kvp, 5secs
I20120814154054 GI 008 b 14-Aug-12 10secs 40KV I20120814154054 GI 008 c 14-Aug-12 10secs 40KV I20120814154054 GI 008 d 14-Aug-12 10secs 40KV I20120814154054 GI 008 e 14-Aug-12 10secs 40KV I20120814154054 GI 008 j 14-Aug-12 10secs 40KV I20120814154054 GI 008 l 14-Aug-12 10secs 40KV I20120814154054 GI 008 p 14-Aug-12 10secs 40KV I20120814141622 GI 010 a 14-Aug-12 10sec 40kv I20120814141622 GI 010 h 14-Aug-12 10sec 40kv I20120814141622 GI 010 j 14-Aug-12 10sec 40kv I20120814155112 GI 018b
SAND 14 14-Aug-12 10secs 45kv

350
Appendix K continued
X-Ray Name Specimen Name Date X-Rayed X-Ray Type Notes from Donator
I20120814152015 GI 1001 14-Aug-12 10secs 40KV juv, female, july 12, 1966, I-10
I20120814160757 GI 1002 14-Aug-12 10secs 45kv small female, summer
I20120814163917 GI 1005 14-Aug-12 10secs 45kv small male, july '66 (labelled 6a and 6b)
I20120814162642 GI 151 14-Aug-12 10secs 45KV I20120814163917 GI 181 14-Aug-12 10secs 45kv I20120814163917 GI 185 14-Aug-12 10secs 45kv I20120814165412 GI 196 14-Aug-12 10secs 45kv I20120814141622 GI 228 14-Aug-12 10secs 40KV also labelled with "5b" I20120814152015 GI 233 14-Aug-12 10secs 40KV very small
10-03 DF2-B ROM 6736 Nov-10 Kodak digital xray
11-04 F73 CMN 57060 Jul-11 60-18-20 10-01 F2-10 Zooarch
VanSas Mar-10 Faxitron 60 kvp, 5secs
I20120814142803 Arch - Clv 06 14-Aug-12 10sec 40kv 11-03 F1-8 Arch - Clv 06 Jun-11 Faxitron 60
kvp, 5secs
11-03 F3-1 DUP Arch - Clv 06 Jun-11 Faxitron 60 kvp, 5secs
11-03 F1-4 Arch - Clv 12 Jun-11 Faxitron 60 kvp, 5secs
10-01 F9-Van Arch - Van Mar-10 Faxitron 60 kvp, 5secs
11-01 F3-4 Arch - Van 21BT Mar-11 Faxitron 60
kvp, 5secs adult
11-01 F4-4 DUP Arch - Van 21BT Mar-11 no screen
10-01 F5-1 Bio 211 Mar-10 Faxitron 60 kvp, 5secs
10-01 F5-2 Bio 87c? Mar-10 Faxitron 60 kvp, 5secs
11-04 F76 CMN 55118 Jul-11 60-18-20
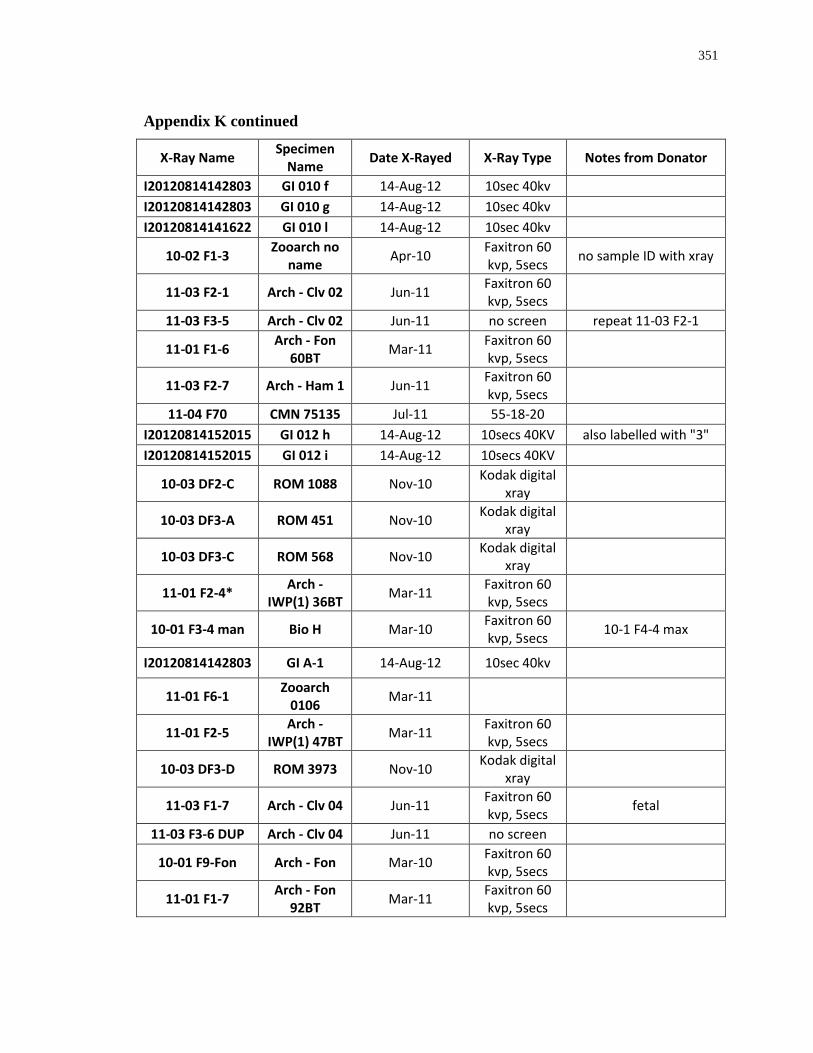
351
Appendix K continued
X-Ray Name Specimen Name Date X-Rayed X-Ray Type Notes from Donator
I20120814142803 GI 010 f 14-Aug-12 10sec 40kv I20120814142803 GI 010 g 14-Aug-12 10sec 40kv I20120814141622 GI 010 l 14-Aug-12 10sec 40kv
10-02 F1-3 Zooarch no name Apr-10 Faxitron 60
kvp, 5secs no sample ID with xray
11-03 F2-1 Arch - Clv 02 Jun-11 Faxitron 60 kvp, 5secs
11-03 F3-5 Arch - Clv 02 Jun-11 no screen repeat 11-03 F2-1
11-01 F1-6 Arch - Fon 60BT Mar-11 Faxitron 60
kvp, 5secs
11-03 F2-7 Arch - Ham 1 Jun-11 Faxitron 60 kvp, 5secs
11-04 F70 CMN 75135 Jul-11 55-18-20 I20120814152015 GI 012 h 14-Aug-12 10secs 40KV also labelled with "3" I20120814152015 GI 012 i 14-Aug-12 10secs 40KV
10-03 DF2-C ROM 1088 Nov-10 Kodak digital xray
10-03 DF3-A ROM 451 Nov-10 Kodak digital xray
10-03 DF3-C ROM 568 Nov-10 Kodak digital xray
11-01 F2-4* Arch - IWP(1) 36BT Mar-11 Faxitron 60
kvp, 5secs
10-01 F3-4 man Bio H Mar-10 Faxitron 60 kvp, 5secs 10-1 F4-4 max
I20120814142803 GI A-1 14-Aug-12 10sec 40kv
11-01 F6-1 Zooarch 0106 Mar-11
11-01 F2-5 Arch - IWP(1) 47BT Mar-11 Faxitron 60
kvp, 5secs
10-03 DF3-D ROM 3973 Nov-10 Kodak digital xray
11-03 F1-7 Arch - Clv 04 Jun-11 Faxitron 60 kvp, 5secs fetal
11-03 F3-6 DUP Arch - Clv 04 Jun-11 no screen 10-01 F9-Fon Arch - Fon Mar-10 Faxitron 60
kvp, 5secs
11-01 F1-7 Arch - Fon 92BT Mar-11 Faxitron 60
kvp, 5secs
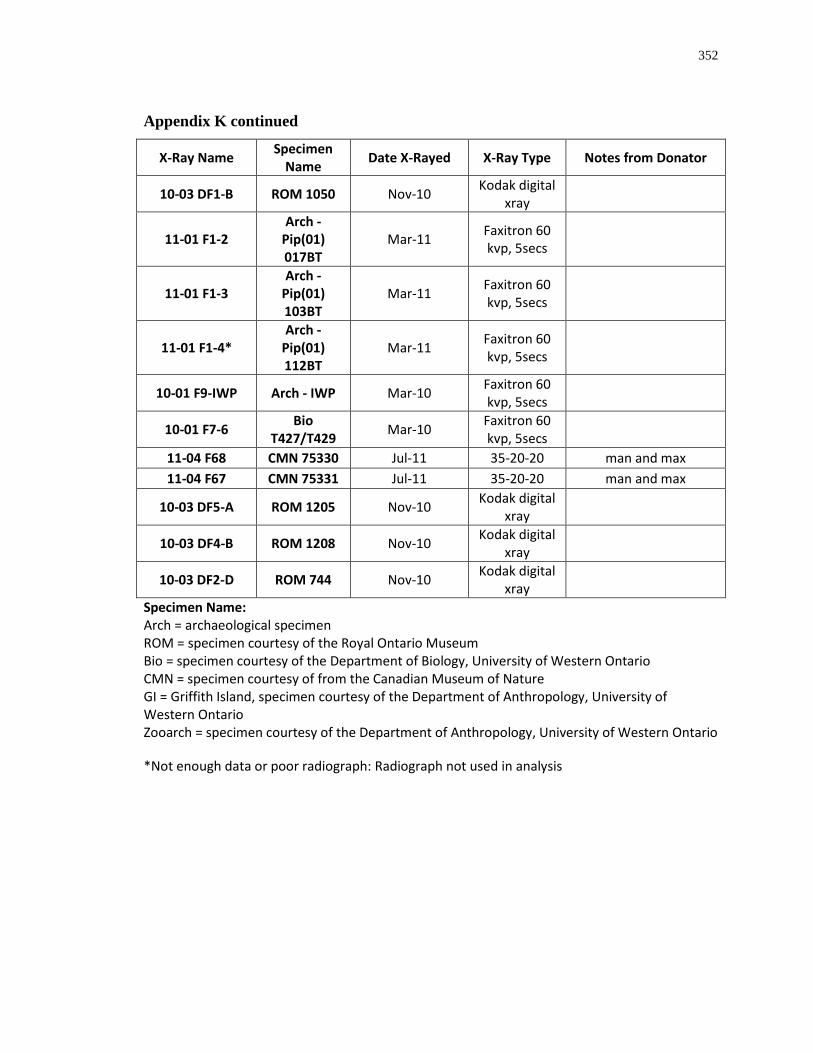
352
Appendix K continued
X-Ray Name Specimen Name Date X-Rayed X-Ray Type Notes from Donator
10-03 DF1-B ROM 1050 Nov-10 Kodak digital xray
11-01 F1-2 Arch -
Pip(01) 017BT
Mar-11 Faxitron 60 kvp, 5secs
11-01 F1-3 Arch -
Pip(01) 103BT
Mar-11 Faxitron 60 kvp, 5secs
11-01 F1-4* Arch -
Pip(01) 112BT
Mar-11 Faxitron 60 kvp, 5secs
10-01 F9-IWP Arch - IWP Mar-10 Faxitron 60 kvp, 5secs
10-01 F7-6 Bio T427/T429 Mar-10 Faxitron 60
kvp, 5secs
11-04 F68 CMN 75330 Jul-11 35-20-20 man and max 11-04 F67 CMN 75331 Jul-11 35-20-20 man and max
10-03 DF5-A ROM 1205 Nov-10 Kodak digital xray
10-03 DF4-B ROM 1208 Nov-10 Kodak digital xray
10-03 DF2-D ROM 744 Nov-10 Kodak digital xray
Specimen Name: Arch = archaeological specimen ROM = specimen courtesy of the Royal Ontario Museum Bio = specimen courtesy of the Department of Biology, University of Western Ontario CMN = specimen courtesy of from the Canadian Museum of Nature GI = Griffith Island, specimen courtesy of the Department of Anthropology, University of Western Ontario Zooarch = specimen courtesy of the Department of Anthropology, University of Western Ontario
*Not enough data or poor radiograph: Radiograph not used in analysis

353
Appendix L: Estimated age-at-death by eruption (with inter and intra obervations)
X-Ray # Specimen Name
Estimated by Zoe Morris
Estimated by Donor (if provided)
Estimated by Zoe Morris (Intra)
Estimated by Faunal
Expert (inter 1)
Estimated by Non- Expert
(inter 2)
I20120814155112 GI 051 15 to 17 months 1 1/2
11-04 F74 CMN 40158
10 to 13 months 1 year
11-04 F75 CMN 75332
10 to 13 months 1 year
I20120814144528 GI 707 18 months
1 year 6 mos
11-04 F69 CMN Z-119
0 to 2 months 2 months
I20120814163917 GI 057 5 to 6 months 5 mo or less
I20120814145815 GI 070 5 to 6 months 5 to 6mo
11-04 F65 CMN 75424 fetal 80 days old
11-04 F66-4 CMN 41065
9 to 11 months fetal
11-04 F72 CMN 41063 fetal fetal
11-04 F66-5 CMN 75331 fetal fetal
11-04 F66-6 CMN Z-676 fetal fetal
10-03 DF1-A ROM 1052 fetal fetal
10-03 DF1-C ROM 1464 fetal fetal
10-03 DF1-D ROM 5625 fetal fetal
10-03 DF1-F ROM 6842 fetal fetal
11-04 F66-1 CMN 75029 fetal near birth
11-04 F66-2 CMN 75247 fetal near birth
11-04 F66-3 CMN 75330 fetal near birth
I20120814163917 GI 1004 7 to 9 months yearling?
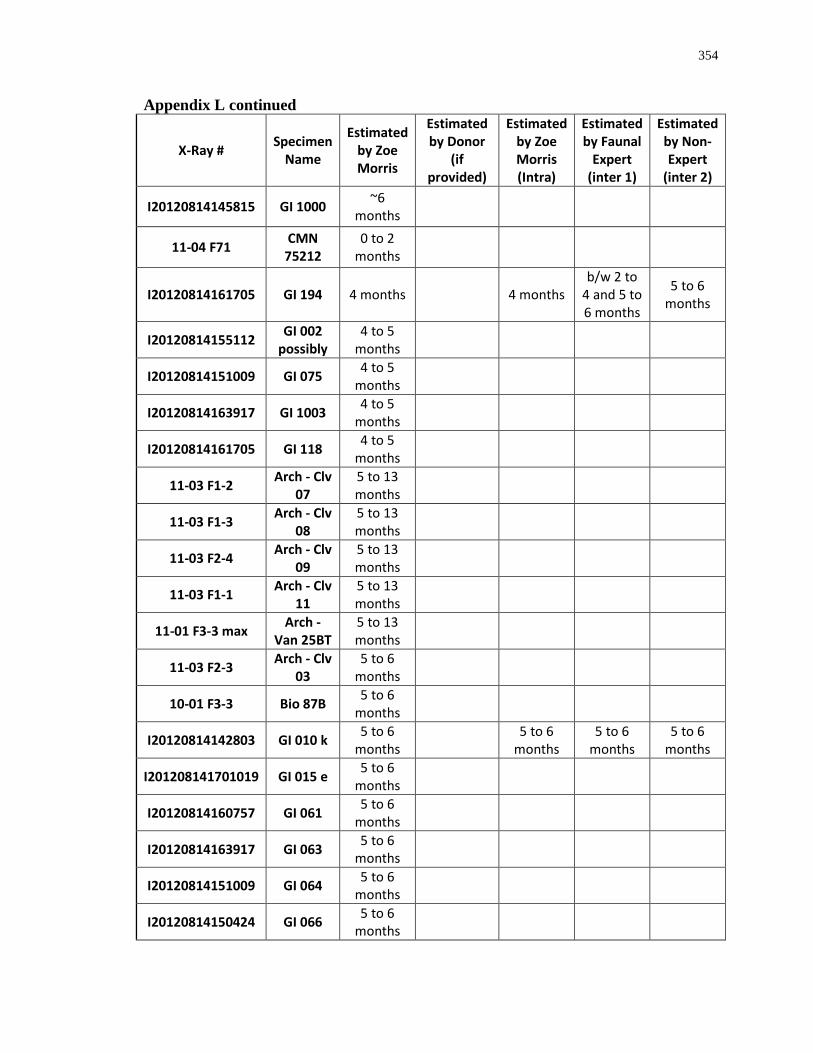
354
Appendix L continued
X-Ray # Specimen Name
Estimated by Zoe Morris
Estimated by Donor
(if provided)
Estimated by Zoe Morris (Intra)
Estimated by Faunal
Expert (inter 1)
Estimated by Non- Expert
(inter 2)
I20120814145815 GI 1000 ~6 months
11-04 F71 CMN 75212
0 to 2 months
I20120814161705 GI 194 4 months 4 months b/w 2 to
4 and 5 to 6 months
5 to 6 months
I20120814155112 GI 002 possibly
4 to 5 months
I20120814151009 GI 075 4 to 5 months
I20120814163917 GI 1003 4 to 5 months
I20120814161705 GI 118 4 to 5 months
11-03 F1-2 Arch - Clv 07
5 to 13 months
11-03 F1-3 Arch - Clv 08
5 to 13 months
11-03 F2-4 Arch - Clv 09
5 to 13 months
11-03 F1-1 Arch - Clv 11
5 to 13 months
11-01 F3-3 max Arch - Van 25BT
5 to 13 months
11-03 F2-3 Arch - Clv 03
5 to 6 months
10-01 F3-3 Bio 87B 5 to 6 months
I20120814142803 GI 010 k 5 to 6 months
5 to 6 months
5 to 6 months
5 to 6 months
I201208141701019 GI 015 e 5 to 6 months
I20120814160757 GI 061 5 to 6 months
I20120814163917 GI 063 5 to 6 months
I20120814151009 GI 064 5 to 6 months
I20120814150424 GI 066 5 to 6 months
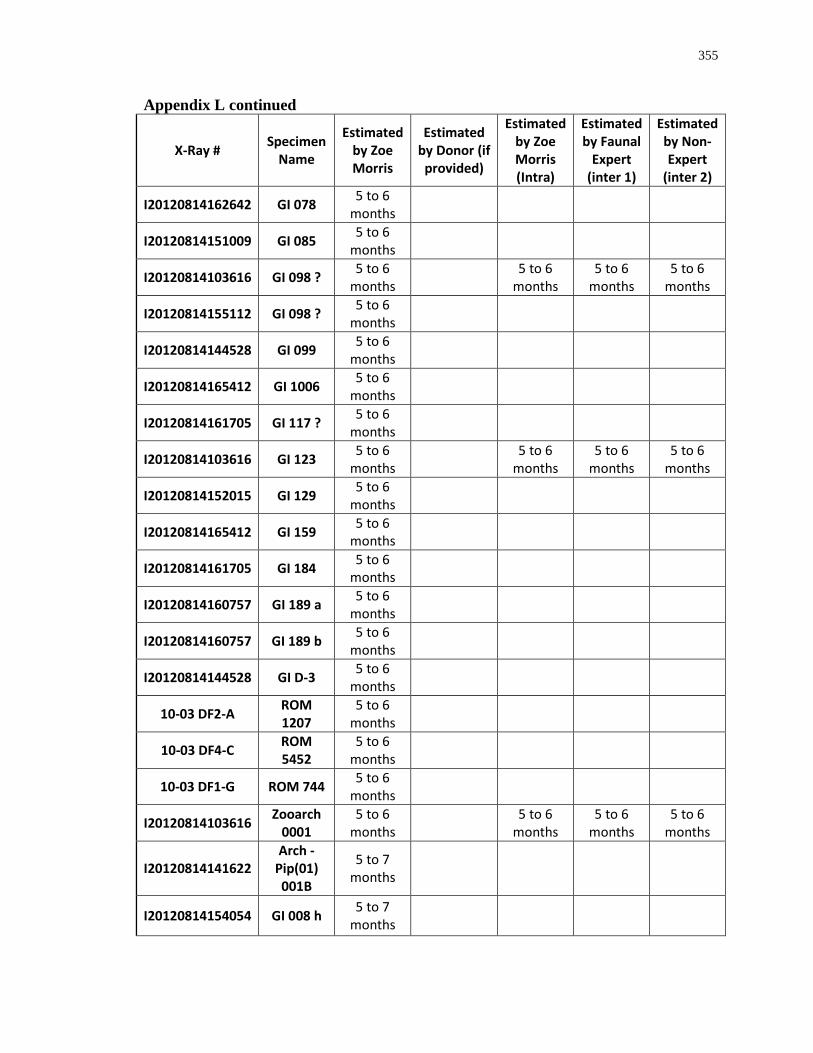
355
Appendix L continued
X-Ray # Specimen Name
Estimated by Zoe Morris
Estimated by Donor (if provided)
Estimated by Zoe Morris (Intra)
Estimated by Faunal
Expert (inter 1)
Estimated by Non- Expert
(inter 2)
I20120814162642 GI 078 5 to 6 months
I20120814151009 GI 085 5 to 6 months
I20120814103616 GI 098 ? 5 to 6 months 5 to 6
months 5 to 6
months 5 to 6
months
I20120814155112 GI 098 ? 5 to 6 months
I20120814144528 GI 099 5 to 6 months
I20120814165412 GI 1006 5 to 6 months
I20120814161705 GI 117 ? 5 to 6 months
I20120814103616 GI 123 5 to 6 months
5 to 6 months
5 to 6 months
5 to 6 months
I20120814152015 GI 129 5 to 6 months
I20120814165412 GI 159 5 to 6 months
I20120814161705 GI 184 5 to 6 months
I20120814160757 GI 189 a 5 to 6 months
I20120814160757 GI 189 b 5 to 6 months
I20120814144528 GI D-3 5 to 6 months
10-03 DF2-A ROM 1207
5 to 6 months
10-03 DF4-C ROM 5452
5 to 6 months
10-03 DF1-G ROM 744 5 to 6 months
I20120814103616 Zooarch 0001
5 to 6 months
5 to 6 months
5 to 6 months
5 to 6 months
I20120814141622 Arch -
Pip(01) 001B
5 to 7 months
I20120814154054 GI 008 h 5 to 7 months
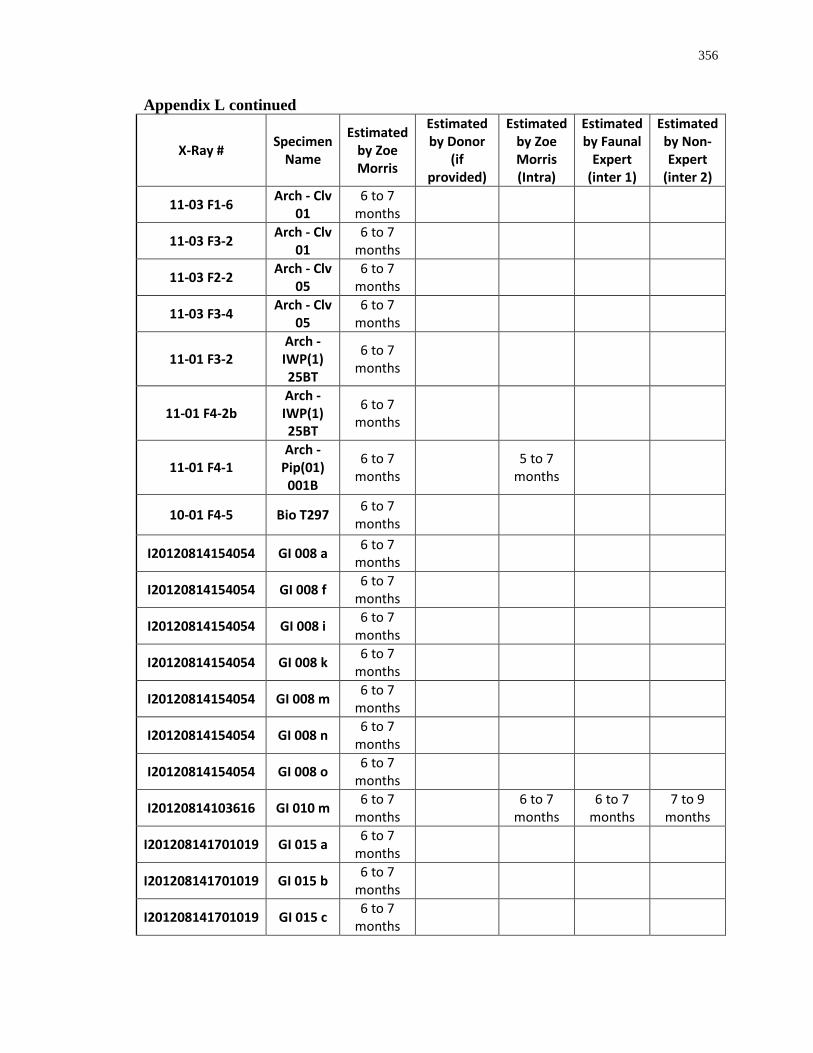
356
Appendix L continued
X-Ray # Specimen Name
Estimated by Zoe Morris
Estimated by Donor
(if provided)
Estimated by Zoe Morris (Intra)
Estimated by Faunal
Expert (inter 1)
Estimated by Non- Expert
(inter 2)
11-03 F1-6 Arch - Clv 01
6 to 7 months
11-03 F3-2 Arch - Clv 01
6 to 7 months
11-03 F2-2 Arch - Clv 05
6 to 7 months
11-03 F3-4 Arch - Clv 05
6 to 7 months
11-01 F3-2 Arch - IWP(1) 25BT
6 to 7 months
11-01 F4-2b Arch - IWP(1) 25BT
6 to 7 months
11-01 F4-1 Arch -
Pip(01) 001B
6 to 7 months
5 to 7 months
10-01 F4-5 Bio T297 6 to 7 months
I20120814154054 GI 008 a 6 to 7 months
I20120814154054 GI 008 f 6 to 7 months
I20120814154054 GI 008 i 6 to 7 months
I20120814154054 GI 008 k 6 to 7 months
I20120814154054 GI 008 m 6 to 7 months
I20120814154054 GI 008 n 6 to 7 months
I20120814154054 GI 008 o 6 to 7 months
I20120814103616 GI 010 m 6 to 7 months
6 to 7 months
6 to 7 months
7 to 9 months
I201208141701019 GI 015 a 6 to 7 months
I201208141701019 GI 015 b 6 to 7 months
I201208141701019 GI 015 c 6 to 7 months
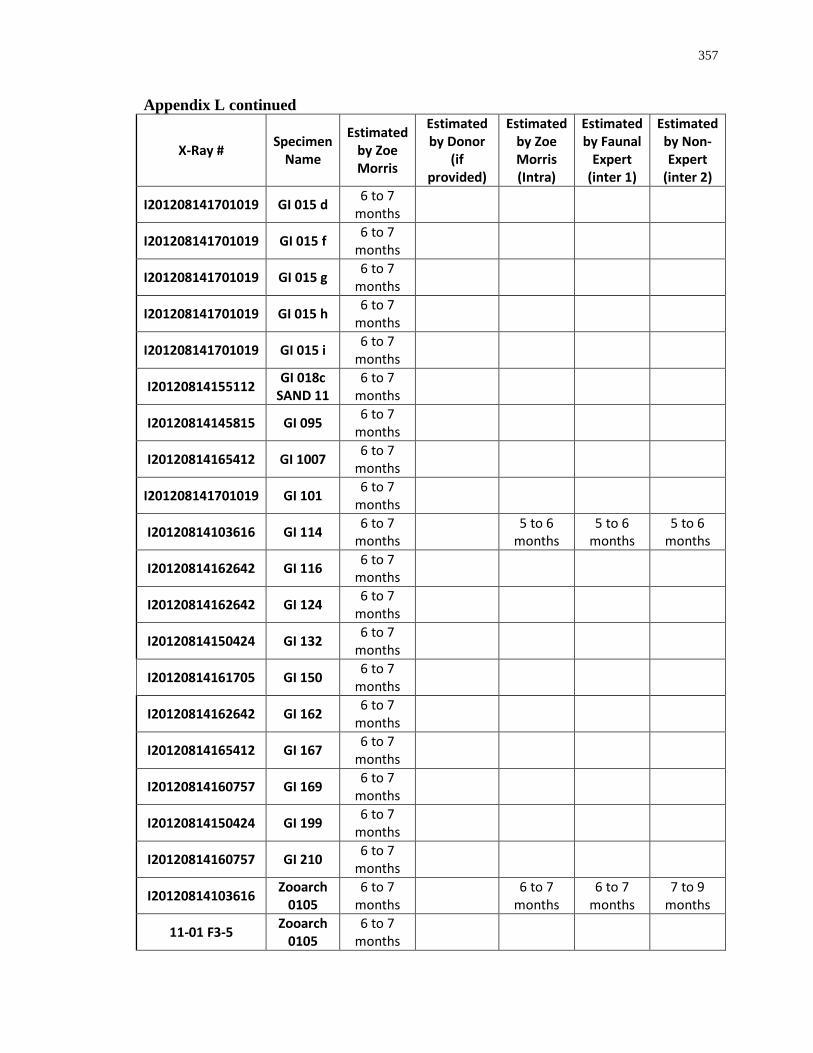
357
Appendix L continued
X-Ray # Specimen Name
Estimated by Zoe Morris
Estimated by Donor
(if provided)
Estimated by Zoe Morris (Intra)
Estimated by Faunal
Expert (inter 1)
Estimated by Non- Expert
(inter 2)
I201208141701019 GI 015 d 6 to 7 months
I201208141701019 GI 015 f 6 to 7 months
I201208141701019 GI 015 g 6 to 7 months
I201208141701019 GI 015 h 6 to 7 months
I201208141701019 GI 015 i 6 to 7 months
I20120814155112 GI 018c SAND 11
6 to 7 months
I20120814145815 GI 095 6 to 7 months
I20120814165412 GI 1007 6 to 7 months
I201208141701019 GI 101 6 to 7 months
I20120814103616 GI 114 6 to 7 months
5 to 6 months
5 to 6 months
5 to 6 months
I20120814162642 GI 116 6 to 7 months
I20120814162642 GI 124 6 to 7 months
I20120814150424 GI 132 6 to 7 months
I20120814161705 GI 150 6 to 7 months
I20120814162642 GI 162 6 to 7 months
I20120814165412 GI 167 6 to 7 months
I20120814160757 GI 169 6 to 7 months
I20120814150424 GI 199 6 to 7 months
I20120814160757 GI 210 6 to 7 months
I20120814103616 Zooarch 0105
6 to 7 months
6 to 7 months
6 to 7 months
7 to 9 months
11-01 F3-5 Zooarch 0105
6 to 7 months
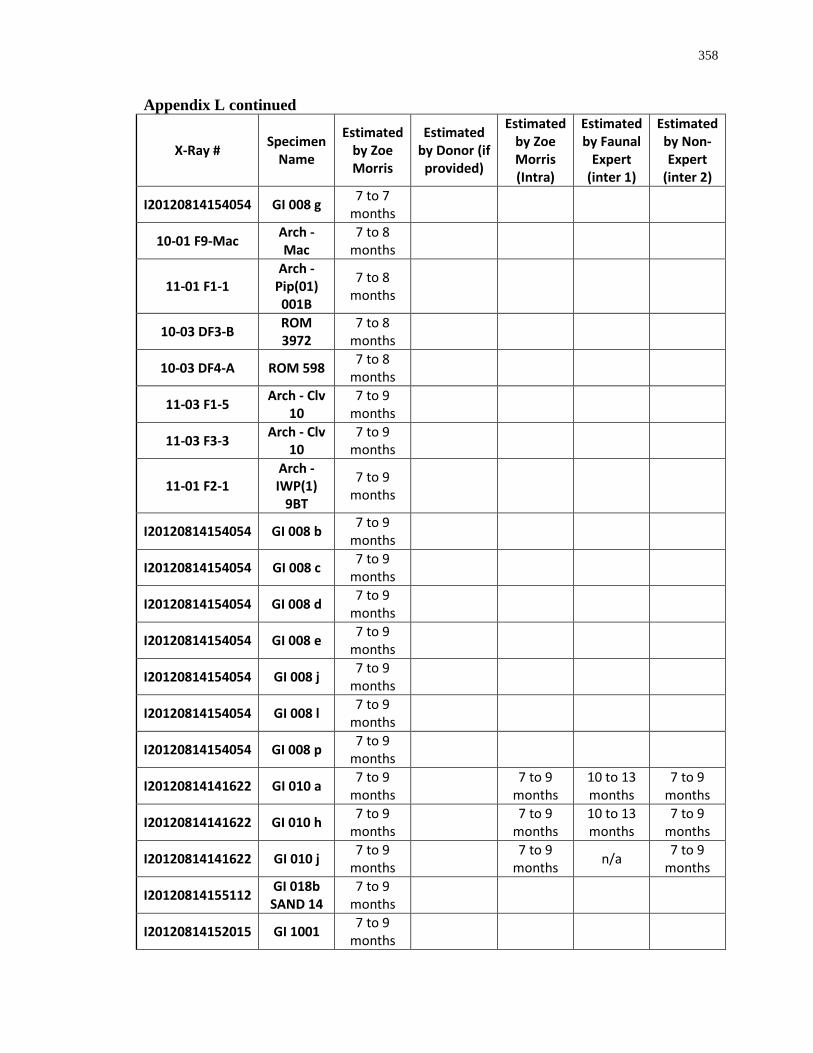
358
Appendix L continued
X-Ray # Specimen Name
Estimated by Zoe Morris
Estimated by Donor (if provided)
Estimated by Zoe Morris (Intra)
Estimated by Faunal
Expert (inter 1)
Estimated by Non- Expert
(inter 2)
I20120814154054 GI 008 g 7 to 7 months
10-01 F9-Mac Arch - Mac
7 to 8 months
11-01 F1-1 Arch -
Pip(01) 001B
7 to 8 months
10-03 DF3-B ROM 3972
7 to 8 months
10-03 DF4-A ROM 598 7 to 8 months
11-03 F1-5 Arch - Clv 10
7 to 9 months
11-03 F3-3 Arch - Clv 10
7 to 9 months
11-01 F2-1 Arch - IWP(1)
9BT
7 to 9 months
I20120814154054 GI 008 b 7 to 9 months
I20120814154054 GI 008 c 7 to 9 months
I20120814154054 GI 008 d 7 to 9 months
I20120814154054 GI 008 e 7 to 9 months
I20120814154054 GI 008 j 7 to 9 months
I20120814154054 GI 008 l 7 to 9 months
I20120814154054 GI 008 p 7 to 9 months
I20120814141622 GI 010 a 7 to 9 months
7 to 9 months
10 to 13 months
7 to 9 months
I20120814141622 GI 010 h 7 to 9 months
7 to 9 months
10 to 13 months
7 to 9 months
I20120814141622 GI 010 j 7 to 9 months
7 to 9 months n/a 7 to 9
months
I20120814155112 GI 018b SAND 14
7 to 9 months
I20120814152015 GI 1001 7 to 9 months
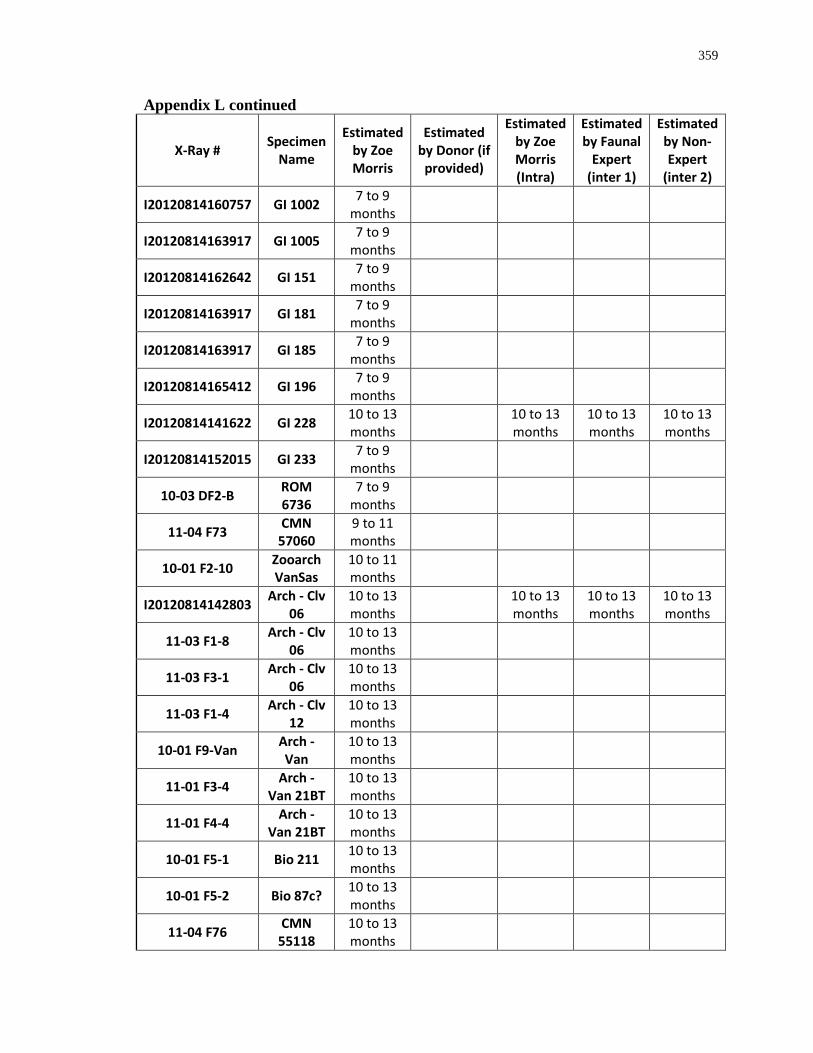
359
Appendix L continued
X-Ray # Specimen Name
Estimated by Zoe Morris
Estimated by Donor (if provided)
Estimated by Zoe Morris (Intra)
Estimated by Faunal
Expert (inter 1)
Estimated by Non- Expert
(inter 2)
I20120814160757 GI 1002 7 to 9 months
I20120814163917 GI 1005 7 to 9 months
I20120814162642 GI 151 7 to 9 months
I20120814163917 GI 181 7 to 9 months
I20120814163917 GI 185 7 to 9 months
I20120814165412 GI 196 7 to 9 months
I20120814141622 GI 228 10 to 13 months
10 to 13 months
10 to 13 months
10 to 13 months
I20120814152015 GI 233 7 to 9 months
10-03 DF2-B ROM 6736
7 to 9 months
11-04 F73 CMN 57060
9 to 11 months
10-01 F2-10 Zooarch VanSas
10 to 11 months
I20120814142803 Arch - Clv 06
10 to 13 months
10 to 13 months
10 to 13 months
10 to 13 months
11-03 F1-8 Arch - Clv 06
10 to 13 months
11-03 F3-1 Arch - Clv 06
10 to 13 months
11-03 F1-4 Arch - Clv 12
10 to 13 months
10-01 F9-Van Arch - Van
10 to 13 months
11-01 F3-4 Arch - Van 21BT
10 to 13 months
11-01 F4-4 Arch - Van 21BT
10 to 13 months
10-01 F5-1 Bio 211 10 to 13 months
10-01 F5-2 Bio 87c? 10 to 13 months
11-04 F76 CMN 55118
10 to 13 months

360
Appendix L continued
X-Ray # Specimen Name
Estimated by Zoe Morris
Estimated by Donor (if provided)
Estimated by Zoe Morris (Intra)
Estimated by Faunal
Expert (inter 1)
Estimated by Non- Expert
(inter 2)
I20120814142803 GI 010 f 10 to 13 months 10 to 13
months 10 to 13 months
10 to 13 months
I20120814142803 GI 010 g 10 to 13 months 10 to 13
months 10 to 13 months
10 to 13 months
I20120814141622 GI 010 l 10 to 13 months 10 to 13
months 10 to 13 months
10 to 13 months
GI 110 10 to 13 months
10-02 F1-3 Zooarch no name
10 to 13 months
11-03 F2-1 Arch - Clv 02
15 to 17 months
11-03 F3-5 Arch - Clv 02
15 to 17 months
11-01 F1-6 Arch - Fon 60BT
15 to 17 months
11-04 F70 CMN 75135
15 to 17 months
I20120814152015 GI 012 h 15 to 17 months
I20120814152015 GI 012 i 15 to 17 months
15 to 17 months
15 to 17 months
15 to 17 months
10-03 DF2-C ROM 1088
15 to 17 months
10-03 DF3-A ROM 451 15 to 17months
10-03 DF3-C ROM 568 15 to 17months
C-1 17 months
17 to 18 months
18 months
18 months
11-01 F2-4 Arch - IWP(1) 36BT
18 months
10-01 F3-4 man Bio H 18 months
I20120814142803 GI A-1 18 months
18 months
18 months
18 months
11-01 F6-1 Zooarch 0106
18 months

361
Appendix L continued
X-Ray # Specimen Name
Estimated by Zoe Morris
Estimated by Donor (if
provided)
Estimated by Zoe Morris (Intra)
Estimated by Faunal
Expert (inter 1)
Estimated by Non- Expert
(inter 2)
11-01 F2-5 Arch - IWP(1) 47BT
18 months +
D-1 18 months + 19 to 22
months 18 months 18 months
10-03 DF3-D ROM 3973 19 months +
13 i 19 to 22 months
11-03 F1-7 Arch - Clv 04 fetal
11-03 F3-6 Arch - Clv 04 fetal
10-01 F9-Fon Arch - Fon fetal
11-01 F1-7 Arch - Fon 92BT fetal fetal
10-03 DF1-B ROM 1050 fetal
11-01 F1-2 Arch -
Pip(01) 017BT
less than 10 months
11-01 F1-3 Arch -
Pip(01) 103BT
less than 6 months
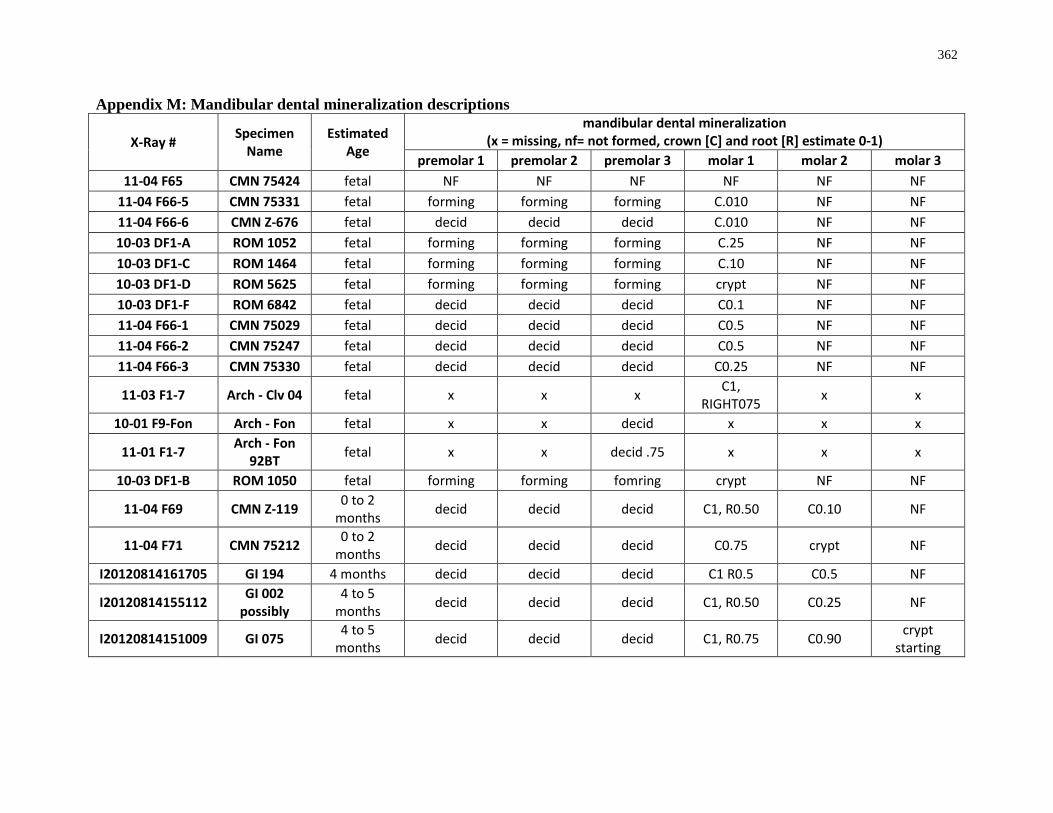
362
Appendix M: Mandibular dental mineralization descriptions
X-Ray # Specimen Name
Estimated Age
mandibular dental mineralization (x = missing, nf= not formed, crown [C] and root [R] estimate 0-1)
premolar 1 premolar 2 premolar 3 molar 1 molar 2 molar 3 11-04 F65 CMN 75424 fetal NF NF NF NF NF NF
11-04 F66-5 CMN 75331 fetal forming forming forming C.010 NF NF 11-04 F66-6 CMN Z-676 fetal decid decid decid C.010 NF NF 10-03 DF1-A ROM 1052 fetal forming forming forming C.25 NF NF 10-03 DF1-C ROM 1464 fetal forming forming forming C.10 NF NF 10-03 DF1-D ROM 5625 fetal forming forming forming crypt NF NF 10-03 DF1-F ROM 6842 fetal decid decid decid C0.1 NF NF 11-04 F66-1 CMN 75029 fetal decid decid decid C0.5 NF NF 11-04 F66-2 CMN 75247 fetal decid decid decid C0.5 NF NF 11-04 F66-3 CMN 75330 fetal decid decid decid C0.25 NF NF
11-03 F1-7 Arch - Clv 04 fetal x x x C1, RIGHT075 x x
10-01 F9-Fon Arch - Fon fetal x x decid x x x
11-01 F1-7 Arch - Fon 92BT fetal x x decid .75 x x x
10-03 DF1-B ROM 1050 fetal forming forming fomring crypt NF NF
11-04 F69 CMN Z-119 0 to 2 months decid decid decid C1, R0.50 C0.10 NF
11-04 F71 CMN 75212 0 to 2 months decid decid decid C0.75 crypt NF
I20120814161705 GI 194 4 months decid decid decid C1 R0.5 C0.5 NF
I20120814155112 GI 002 possibly
4 to 5 months decid decid decid C1, R0.50 C0.25 NF
I20120814151009 GI 075 4 to 5 months decid decid decid C1, R0.75 C0.90 crypt
starting
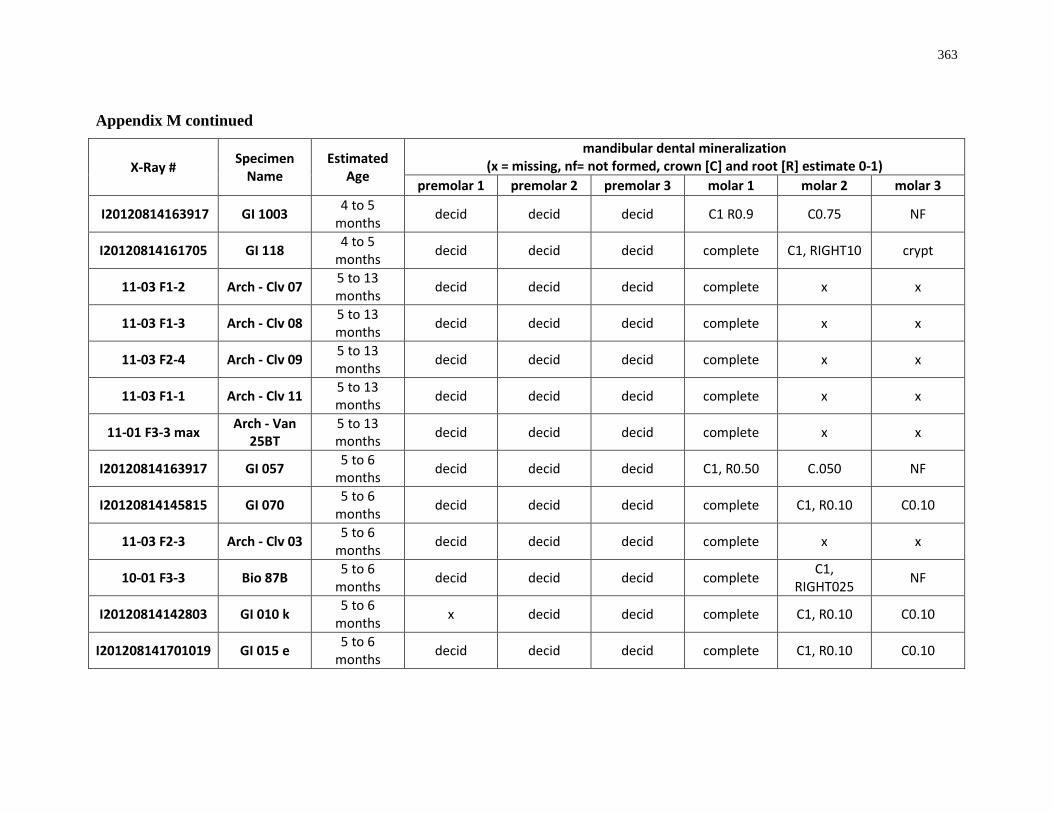
363
Appendix M continued
X-Ray # Specimen Name
Estimated Age
mandibular dental mineralization (x = missing, nf= not formed, crown [C] and root [R] estimate 0-1)
premolar 1 premolar 2 premolar 3 molar 1 molar 2 molar 3
I20120814163917 GI 1003 4 to 5 months decid decid decid C1 R0.9 C0.75 NF
I20120814161705 GI 118 4 to 5 months decid decid decid complete C1, RIGHT10 crypt
11-03 F1-2 Arch - Clv 07 5 to 13 months decid decid decid complete x x
11-03 F1-3 Arch - Clv 08 5 to 13 months decid decid decid complete x x
11-03 F2-4 Arch - Clv 09 5 to 13 months decid decid decid complete x x
11-03 F1-1 Arch - Clv 11 5 to 13 months decid decid decid complete x x
11-01 F3-3 max Arch - Van 25BT
5 to 13 months decid decid decid complete x x
I20120814163917 GI 057 5 to 6 months decid decid decid C1, R0.50 C.050 NF
I20120814145815 GI 070 5 to 6 months decid decid decid complete C1, R0.10 C0.10
11-03 F2-3 Arch - Clv 03 5 to 6 months decid decid decid complete x x
10-01 F3-3 Bio 87B 5 to 6 months decid decid decid complete C1,
RIGHT025 NF
I20120814142803 GI 010 k 5 to 6 months x decid decid complete C1, R0.10 C0.10
I201208141701019 GI 015 e 5 to 6 months decid decid decid complete C1, R0.10 C0.10
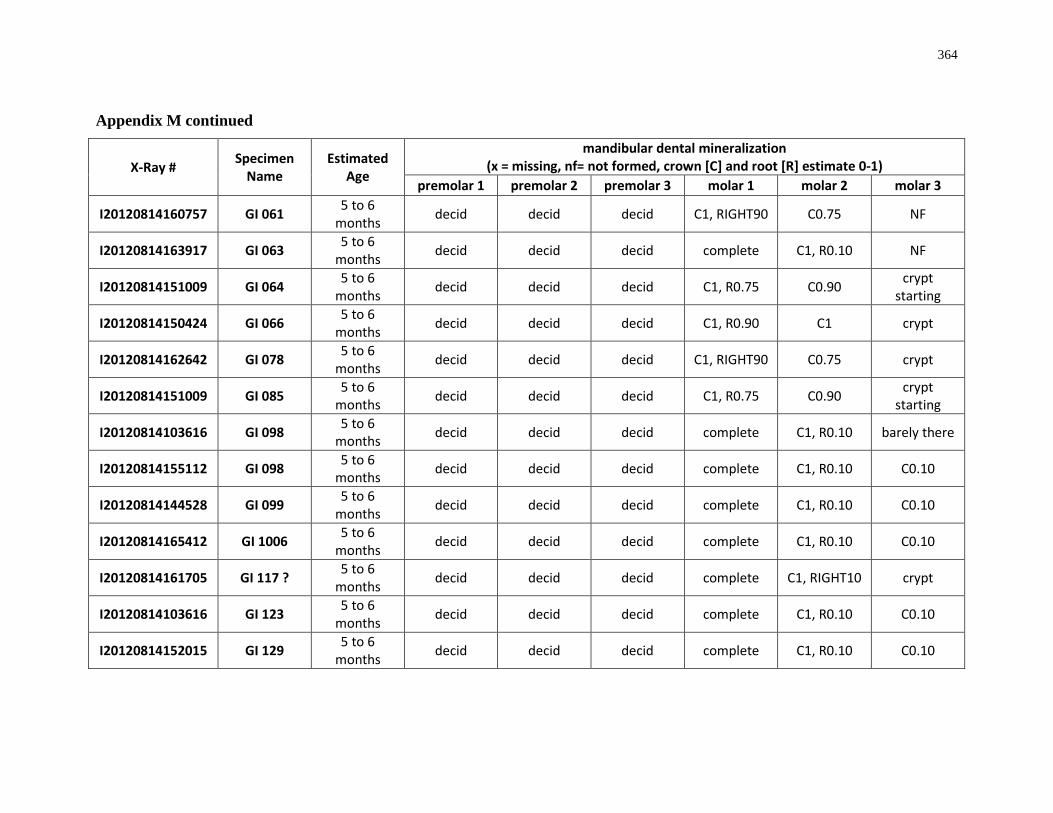
364
Appendix M continued
X-Ray # Specimen Name
Estimated Age
mandibular dental mineralization (x = missing, nf= not formed, crown [C] and root [R] estimate 0-1)
premolar 1 premolar 2 premolar 3 molar 1 molar 2 molar 3
I20120814160757 GI 061 5 to 6 months decid decid decid C1, RIGHT90 C0.75 NF
I20120814163917 GI 063 5 to 6 months decid decid decid complete C1, R0.10 NF
I20120814151009 GI 064 5 to 6 months decid decid decid C1, R0.75 C0.90 crypt
starting
I20120814150424 GI 066 5 to 6 months decid decid decid C1, R0.90 C1 crypt
I20120814162642 GI 078 5 to 6 months decid decid decid C1, RIGHT90 C0.75 crypt
I20120814151009 GI 085 5 to 6 months decid decid decid C1, R0.75 C0.90 crypt
starting
I20120814103616 GI 098 5 to 6 months decid decid decid complete C1, R0.10 barely there
I20120814155112 GI 098 5 to 6 months decid decid decid complete C1, R0.10 C0.10
I20120814144528 GI 099 5 to 6 months decid decid decid complete C1, R0.10 C0.10
I20120814165412 GI 1006 5 to 6 months decid decid decid complete C1, R0.10 C0.10
I20120814161705 GI 117 ? 5 to 6 months decid decid decid complete C1, RIGHT10 crypt
I20120814103616 GI 123 5 to 6 months decid decid decid complete C1, R0.10 C0.10
I20120814152015 GI 129 5 to 6 months decid decid decid complete C1, R0.10 C0.10
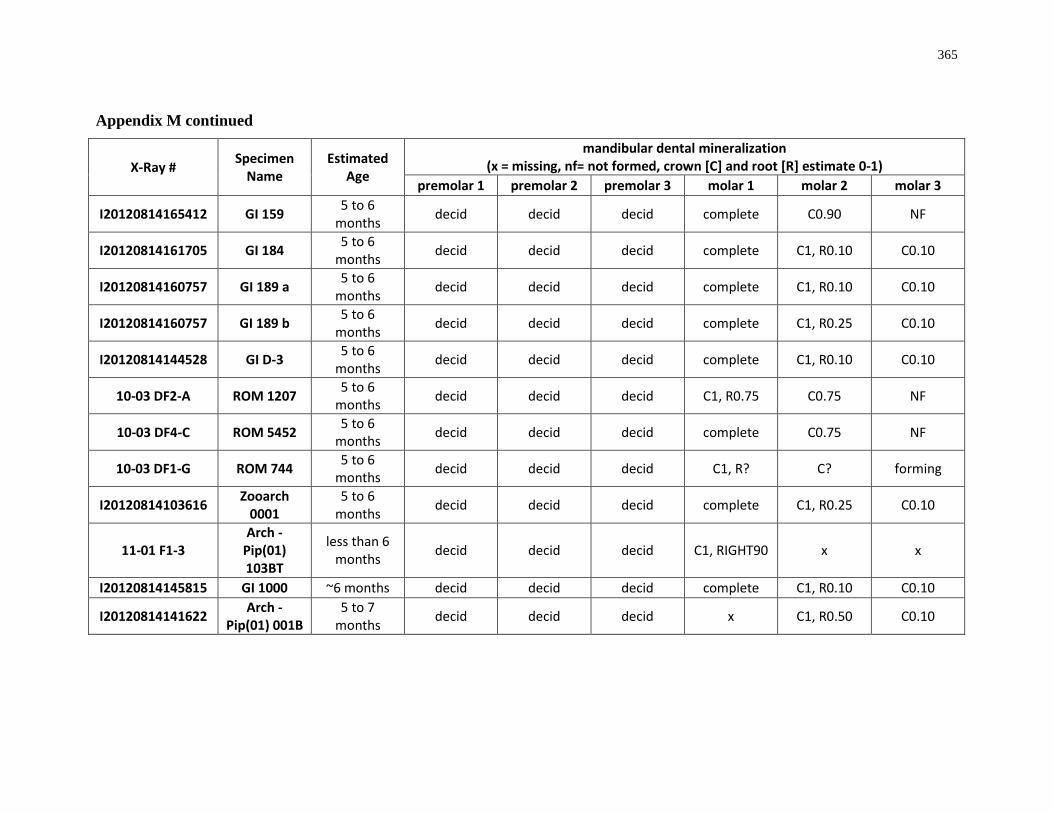
365
Appendix M continued
X-Ray # Specimen Name
Estimated Age
mandibular dental mineralization (x = missing, nf= not formed, crown [C] and root [R] estimate 0-1)
premolar 1 premolar 2 premolar 3 molar 1 molar 2 molar 3
I20120814165412 GI 159 5 to 6 months decid decid decid complete C0.90 NF
I20120814161705 GI 184 5 to 6 months decid decid decid complete C1, R0.10 C0.10
I20120814160757 GI 189 a 5 to 6 months decid decid decid complete C1, R0.10 C0.10
I20120814160757 GI 189 b 5 to 6 months decid decid decid complete C1, R0.25 C0.10
I20120814144528 GI D-3 5 to 6 months decid decid decid complete C1, R0.10 C0.10
10-03 DF2-A ROM 1207 5 to 6 months decid decid decid C1, R0.75 C0.75 NF
10-03 DF4-C ROM 5452 5 to 6 months decid decid decid complete C0.75 NF
10-03 DF1-G ROM 744 5 to 6 months decid decid decid C1, R? C? forming
I20120814103616 Zooarch 0001
5 to 6 months decid decid decid complete C1, R0.25 C0.10
11-01 F1-3 Arch -
Pip(01) 103BT
less than 6 months decid decid decid C1, RIGHT90 x x
I20120814145815 GI 1000 ~6 months decid decid decid complete C1, R0.10 C0.10
I20120814141622 Arch - Pip(01) 001B
5 to 7 months decid decid decid x C1, R0.50 C0.10
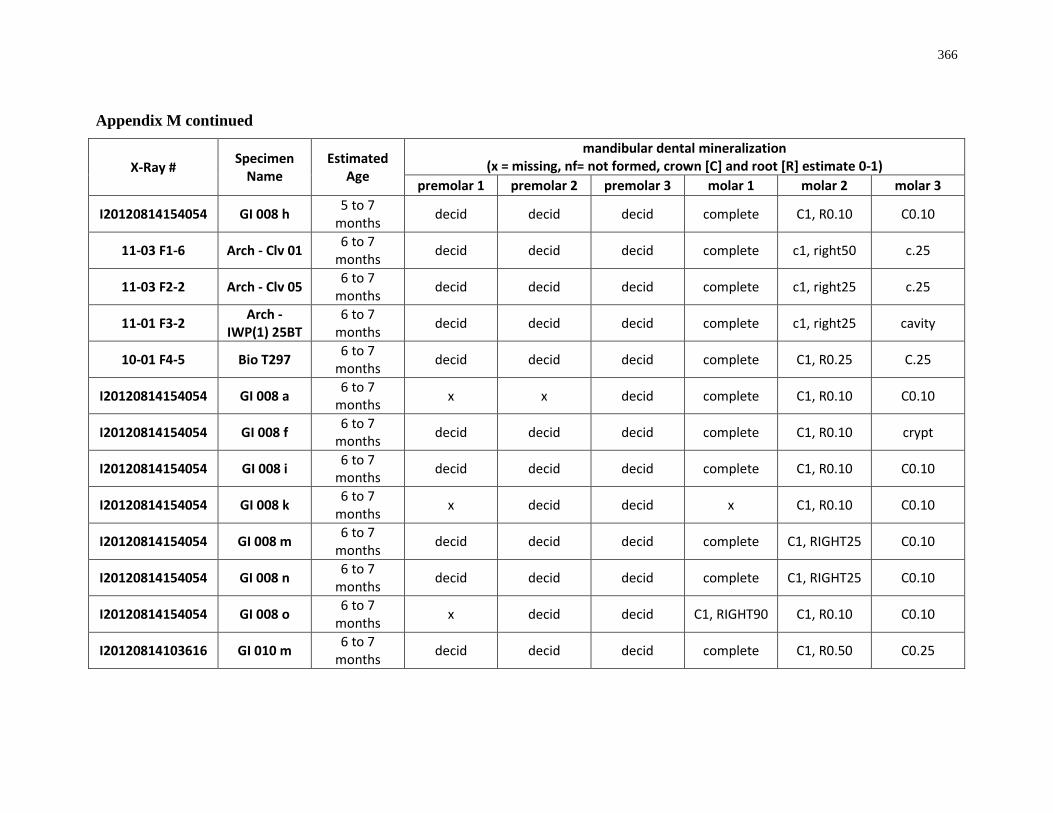
366
Appendix M continued
X-Ray # Specimen Name
Estimated Age
mandibular dental mineralization (x = missing, nf= not formed, crown [C] and root [R] estimate 0-1)
premolar 1 premolar 2 premolar 3 molar 1 molar 2 molar 3
I20120814154054 GI 008 h 5 to 7 months decid decid decid complete C1, R0.10 C0.10
11-03 F1-6 Arch - Clv 01 6 to 7 months decid decid decid complete c1, right50 c.25
11-03 F2-2 Arch - Clv 05 6 to 7 months decid decid decid complete c1, right25 c.25
11-01 F3-2 Arch - IWP(1) 25BT
6 to 7 months decid decid decid complete c1, right25 cavity
10-01 F4-5 Bio T297 6 to 7 months decid decid decid complete C1, R0.25 C.25
I20120814154054 GI 008 a 6 to 7 months x x decid complete C1, R0.10 C0.10
I20120814154054 GI 008 f 6 to 7 months decid decid decid complete C1, R0.10 crypt
I20120814154054 GI 008 i 6 to 7 months decid decid decid complete C1, R0.10 C0.10
I20120814154054 GI 008 k 6 to 7 months x decid decid x C1, R0.10 C0.10
I20120814154054 GI 008 m 6 to 7 months decid decid decid complete C1, RIGHT25 C0.10
I20120814154054 GI 008 n 6 to 7 months decid decid decid complete C1, RIGHT25 C0.10
I20120814154054 GI 008 o 6 to 7 months x decid decid C1, RIGHT90 C1, R0.10 C0.10
I20120814103616 GI 010 m 6 to 7 months decid decid decid complete C1, R0.50 C0.25

367
Appendix M continued
X-Ray # Specimen Name
Estimated Age
mandibular dental mineralization (x = missing, nf= not formed, crown [C] and root [R] estimate 0-1)
premolar 1 premolar 2 premolar 3 molar 1 molar 2 molar 3
I201208141701019 GI 015 a 6 to 7 months decid decid decid complete C1, R0.25 C0.10
I201208141701019 GI 015 b 6 to 7 months x decid decid x C1, R0.10 crypt
I201208141701019 GI 015 c 6 to 7 months decid decid decid complete C1, R0.10 crypt
I201208141701019 GI 015 d 6 to 7 months decid decid decid complete C1, R0.10 C0.10
I201208141701019 GI 015 f 6 to 7 months decid decid decid x C1, R0.10 C0.10
I201208141701019 GI 015 g 6 to 7 months decid decid decid complete C1, R0.10 crypt
I201208141701019 GI 015 h 6 to 7 months decid decid decid complete C1, R0.10 x
I201208141701019 GI 015 i 6 to 7 months decid decid decid complete C1, R0.25 x
I20120814155112 GI 018c SAND 11
6 to 7 months decid decid decid complete C1, RIGHT10 crypt
I20120814145815 GI 095 6 to 7 months decid decid decid complete C1, R0.10 C0.10
I20120814165412 GI 1007 6 to 7 months decid decid decid complete C1, R0.10 C0.10
I201208141701019 GI 101 6 to 7 months decid decid decid complete C1, R0.25 C0.25
I20120814103616 GI 114 6 to 7 months decid decid decid complete C1, R0.10 C0.10
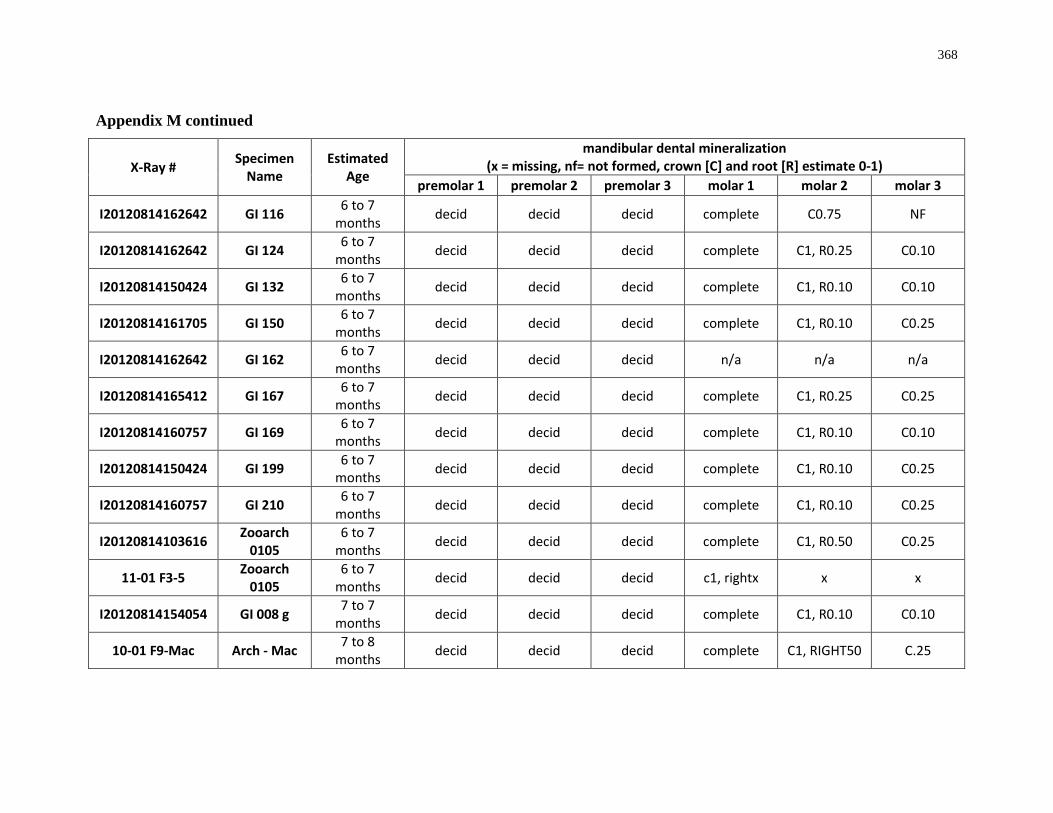
368
Appendix M continued
X-Ray # Specimen Name
Estimated Age
mandibular dental mineralization (x = missing, nf= not formed, crown [C] and root [R] estimate 0-1)
premolar 1 premolar 2 premolar 3 molar 1 molar 2 molar 3
I20120814162642 GI 116 6 to 7 months decid decid decid complete C0.75 NF
I20120814162642 GI 124 6 to 7 months decid decid decid complete C1, R0.25 C0.10
I20120814150424 GI 132 6 to 7 months decid decid decid complete C1, R0.10 C0.10
I20120814161705 GI 150 6 to 7 months decid decid decid complete C1, R0.10 C0.25
I20120814162642 GI 162 6 to 7 months decid decid decid n/a n/a n/a
I20120814165412 GI 167 6 to 7 months decid decid decid complete C1, R0.25 C0.25
I20120814160757 GI 169 6 to 7 months decid decid decid complete C1, R0.10 C0.10
I20120814150424 GI 199 6 to 7 months decid decid decid complete C1, R0.10 C0.25
I20120814160757 GI 210 6 to 7 months decid decid decid complete C1, R0.10 C0.25
I20120814103616 Zooarch 0105
6 to 7 months decid decid decid complete C1, R0.50 C0.25
11-01 F3-5 Zooarch 0105
6 to 7 months decid decid decid c1, rightx x x
I20120814154054 GI 008 g 7 to 7 months decid decid decid complete C1, R0.10 C0.10
10-01 F9-Mac Arch - Mac 7 to 8 months decid decid decid complete C1, RIGHT50 C.25
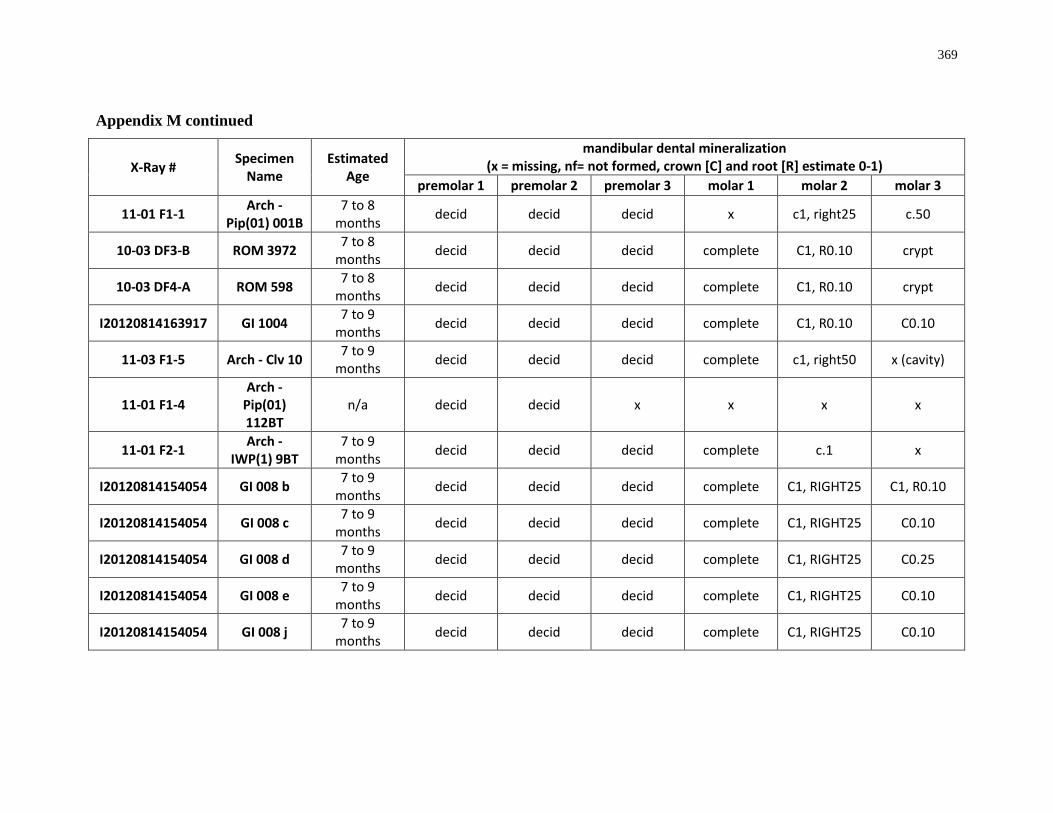
369
Appendix M continued
X-Ray # Specimen Name
Estimated Age
mandibular dental mineralization (x = missing, nf= not formed, crown [C] and root [R] estimate 0-1)
premolar 1 premolar 2 premolar 3 molar 1 molar 2 molar 3
11-01 F1-1 Arch - Pip(01) 001B
7 to 8 months decid decid decid x c1, right25 c.50
10-03 DF3-B ROM 3972 7 to 8 months decid decid decid complete C1, R0.10 crypt
10-03 DF4-A ROM 598 7 to 8 months decid decid decid complete C1, R0.10 crypt
I20120814163917 GI 1004 7 to 9 months decid decid decid complete C1, R0.10 C0.10
11-03 F1-5 Arch - Clv 10 7 to 9 months decid decid decid complete c1, right50 x (cavity)
11-01 F1-4 Arch -
Pip(01) 112BT
n/a decid decid x x x x
11-01 F2-1 Arch - IWP(1) 9BT
7 to 9 months decid decid decid complete c.1 x
I20120814154054 GI 008 b 7 to 9 months decid decid decid complete C1, RIGHT25 C1, R0.10
I20120814154054 GI 008 c 7 to 9 months decid decid decid complete C1, RIGHT25 C0.10
I20120814154054 GI 008 d 7 to 9 months decid decid decid complete C1, RIGHT25 C0.25
I20120814154054 GI 008 e 7 to 9 months decid decid decid complete C1, RIGHT25 C0.10
I20120814154054 GI 008 j 7 to 9 months decid decid decid complete C1, RIGHT25 C0.10
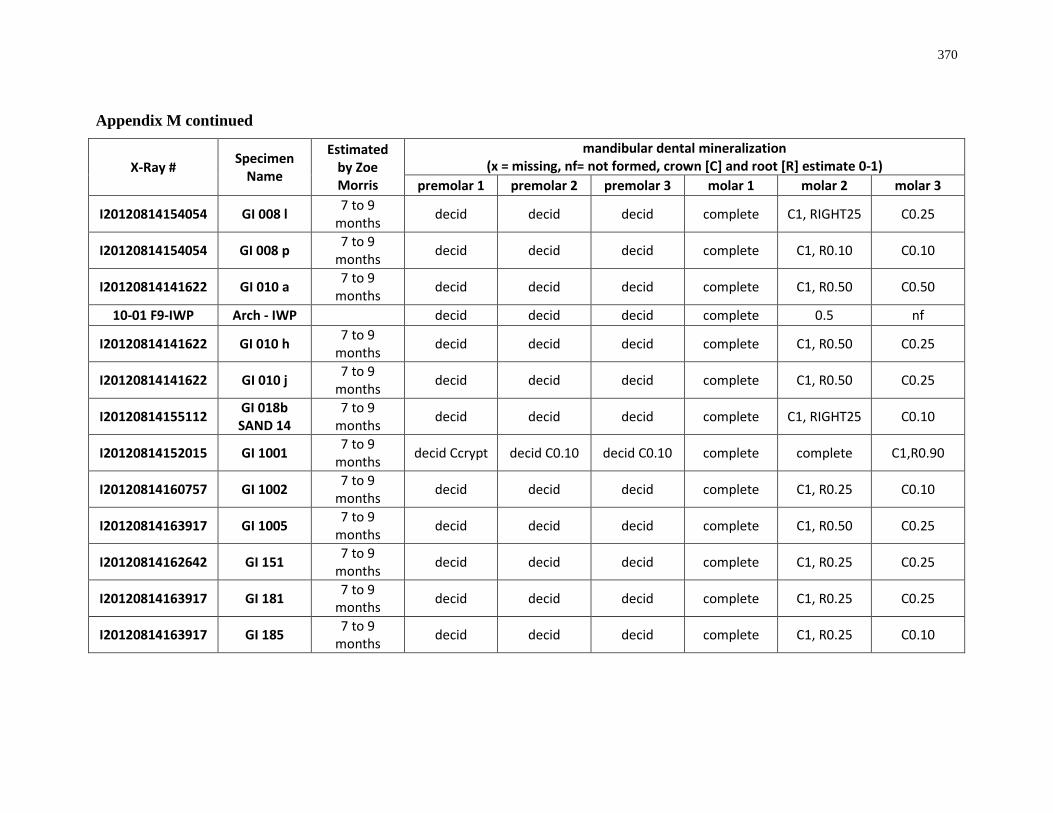
370
Appendix M continued
X-Ray # Specimen Name
Estimated by Zoe Morris
mandibular dental mineralization (x = missing, nf= not formed, crown [C] and root [R] estimate 0-1)
premolar 1 premolar 2 premolar 3 molar 1 molar 2 molar 3
I20120814154054 GI 008 l 7 to 9 months decid decid decid complete C1, RIGHT25 C0.25
I20120814154054 GI 008 p 7 to 9 months decid decid decid complete C1, R0.10 C0.10
I20120814141622 GI 010 a 7 to 9 months decid decid decid complete C1, R0.50 C0.50
10-01 F9-IWP Arch - IWP decid decid decid complete 0.5 nf
I20120814141622 GI 010 h 7 to 9 months decid decid decid complete C1, R0.50 C0.25
I20120814141622 GI 010 j 7 to 9 months decid decid decid complete C1, R0.50 C0.25
I20120814155112 GI 018b SAND 14
7 to 9 months decid decid decid complete C1, RIGHT25 C0.10
I20120814152015 GI 1001 7 to 9 months decid Ccrypt decid C0.10 decid C0.10 complete complete C1,R0.90
I20120814160757 GI 1002 7 to 9 months decid decid decid complete C1, R0.25 C0.10
I20120814163917 GI 1005 7 to 9 months decid decid decid complete C1, R0.50 C0.25
I20120814162642 GI 151 7 to 9 months decid decid decid complete C1, R0.25 C0.25
I20120814163917 GI 181 7 to 9 months decid decid decid complete C1, R0.25 C0.25
I20120814163917 GI 185 7 to 9 months decid decid decid complete C1, R0.25 C0.10

371
Appendix M continued
X-Ray # Specimen Name
Estimated by Zoe Morris
mandibular dental mineralization (x = missing, nf= not formed, crown [C] and root [R] estimate 0-1)
premolar 1 premolar 2 premolar 3 molar 1 molar 2 molar 3
I20120814165412 GI 196 7 to 9 months decid decid decid complete C1, R0.50 C0.25
I20120814152015 GI 233 7 to 9 months decid decid decid complete C1, R0.50 C0.25
10-03 DF2-B ROM 6736 7 to 9 months decid decid decid complete C1, R0.75 0.1
11-04 F66-4 CMN 41065 9 to 11 months decid decid decid complete C1, R0.75 C1
11-04 F73 CMN 57060 9 to 11 months decid decid decid complete C1, R0.75 C1
11-01 F1-2 Arch -
Pip(01) 017BT
less than 10 months decid decid decid x x x
10-01 F2-10 Zooarch VanSas
10 to 11 months decid decid decid complete C1, RIGHT75 C0.90
11-04 F74 CMN 40158 10 to 13 months decid decid decid complete complete C1,
RIGHT010
11-04 F75 CMN 75332 10 to 13 months decid, C0.10 decid, C0.10 decid, C0.10 complete complete C1, RIGHT0.1
I20120814141622 GI 228 10 to 13 months decid decid decid complete complete C1, R0.10
I20120814142803 Arch - Clv 06 10 to 13 months decid decid decid complete complete C1, R0.10
11-03 F1-8 Arch - Clv 06 10 to 13 months decid decid decid complete c1, right95 c1

372
Appendix M continued
X-Ray # Specimen Name
Estimated by Zoe Morris
mandibular dental mineralization (x = missing, nf= not formed, crown [C] and root [R] estimate 0-1)
premolar 1 premolar 2 premolar 3 molar 1 molar 2 molar 3
11-03 F3-1 Arch - Clv 06 10 to 13 months
11-03 F1-4 Arch - Clv 12 10 to 13 months decid decid decid complete root socket x
10-01 F9-Van Arch - Van 10 to 13 months decid decid decid complete c1, right75 c.5
11-01 F3-4 Arch - Van 21BT
10 to 13 months decid decid decid complete c1, right75 c.75
11-01 F4-4 Arch - Van 21BT
10 to 13 months
10-01 F5-1 Bio 211 10 to 13 months decid decid decid complete C1, R0.25 C.25
10-01 F5-2 Bio 87c? 10 to 13 months decid decid decid complete c1, right5 c.5
11-04 F76 CMN 55118 10 to 13 months decid decid decid complete C1, R0.75 C1, R0.25
I20120814142803 GI 010 f 10 to 13 months decid C.10 decid C.10 decid C.25 complete complete C1, R0.10
I20120814142803 GI 010 g 10 to 13 months x C.10 decid C.10 decid C.10 complete complete C1
I20120814141622 GI 010 l 10 to 13 months decid decid decid complete complete C1, R0.10
10-02 F1-3 Zooarch no name
10 to 13 months decid decid decid complete complete C1, R0.25
I20120814155112 GI 051 15 to 17 months
decid C1, RIGHT50
decid C1, RIGHT50
decid C1, RIGHT50 complete complete C1,R0.10
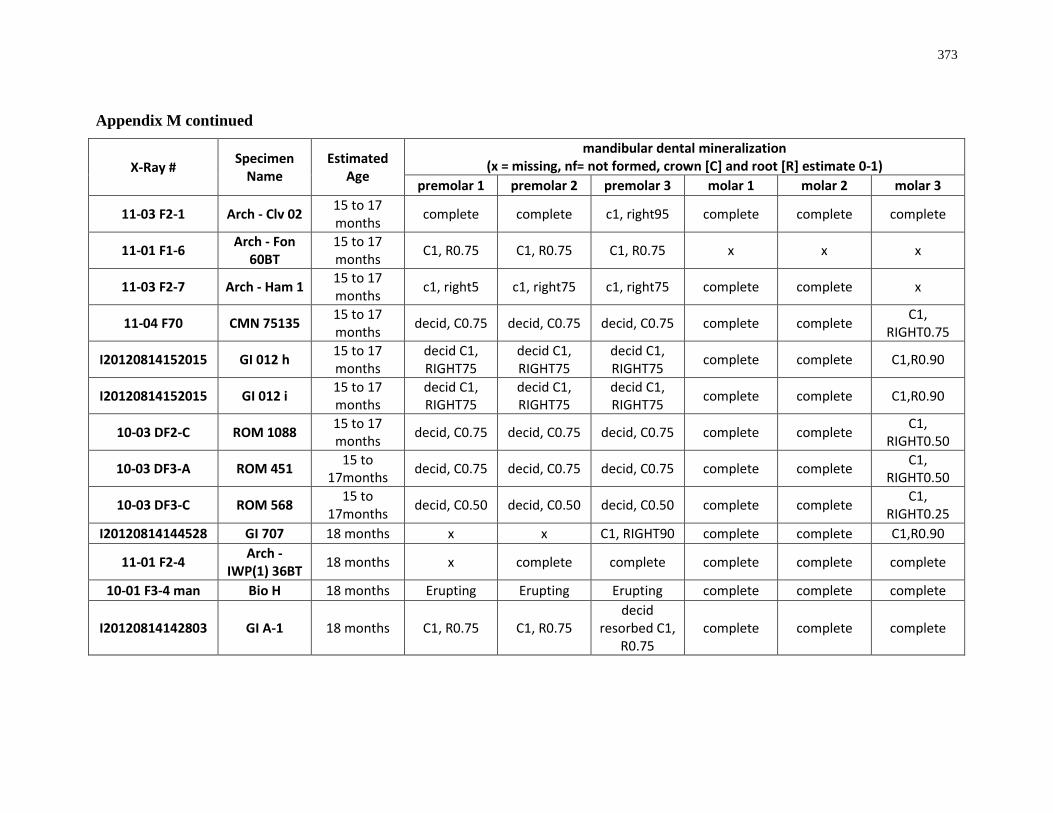
373
Appendix M continued
X-Ray # Specimen Name
Estimated Age
mandibular dental mineralization (x = missing, nf= not formed, crown [C] and root [R] estimate 0-1)
premolar 1 premolar 2 premolar 3 molar 1 molar 2 molar 3
11-03 F2-1 Arch - Clv 02 15 to 17 months complete complete c1, right95 complete complete complete
11-01 F1-6 Arch - Fon 60BT
15 to 17 months C1, R0.75 C1, R0.75 C1, R0.75 x x x
11-03 F2-7 Arch - Ham 1 15 to 17 months c1, right5 c1, right75 c1, right75 complete complete x
11-04 F70 CMN 75135 15 to 17 months decid, C0.75 decid, C0.75 decid, C0.75 complete complete C1,
RIGHT0.75
I20120814152015 GI 012 h 15 to 17 months
decid C1, RIGHT75
decid C1, RIGHT75
decid C1, RIGHT75 complete complete C1,R0.90
I20120814152015 GI 012 i 15 to 17 months
decid C1, RIGHT75
decid C1, RIGHT75
decid C1, RIGHT75 complete complete C1,R0.90
10-03 DF2-C ROM 1088 15 to 17 months decid, C0.75 decid, C0.75 decid, C0.75 complete complete C1,
RIGHT0.50
10-03 DF3-A ROM 451 15 to 17months decid, C0.75 decid, C0.75 decid, C0.75 complete complete C1,
RIGHT0.50
10-03 DF3-C ROM 568 15 to 17months decid, C0.50 decid, C0.50 decid, C0.50 complete complete C1,
RIGHT0.25 I20120814144528 GI 707 18 months x x C1, RIGHT90 complete complete C1,R0.90
11-01 F2-4 Arch - IWP(1) 36BT 18 months x complete complete complete complete complete
10-01 F3-4 man Bio H 18 months Erupting Erupting Erupting complete complete complete
I20120814142803 GI A-1 18 months C1, R0.75 C1, R0.75 decid
resorbed C1, R0.75
complete complete complete
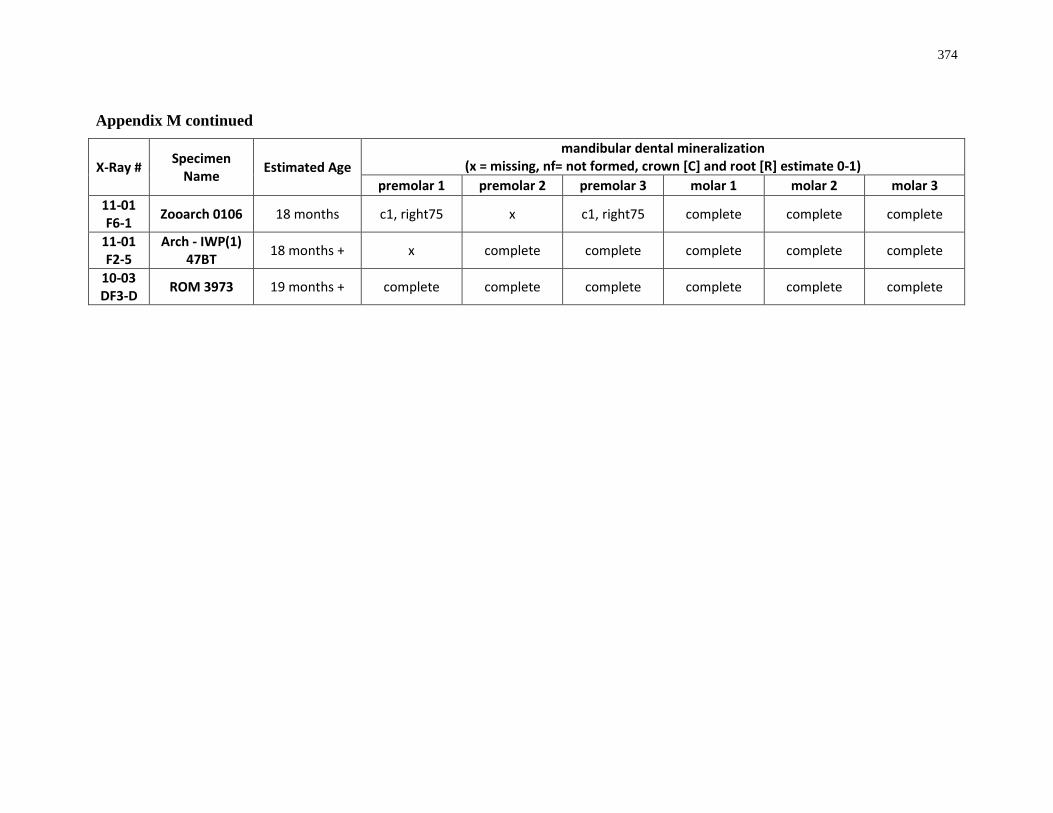
374
Appendix M continued
X-Ray # Specimen Name Estimated Age
mandibular dental mineralization (x = missing, nf= not formed, crown [C] and root [R] estimate 0-1)
premolar 1 premolar 2 premolar 3 molar 1 molar 2 molar 3 11-01 F6-1 Zooarch 0106 18 months c1, right75 x c1, right75 complete complete complete
11-01 F2-5
Arch - IWP(1) 47BT 18 months + x complete complete complete complete complete
10-03 DF3-D ROM 3973 19 months + complete complete complete complete complete complete

375
Name: Zoe Hensley Morris Post–secondary University of Toronto Education and Toronto, Ontario, Canada Degrees: 1997-2003 H.B.Sc.
Louisiana State Univesity Baton Rouge, Louisiana, Unite States 2004-2007 M.A.
The University of Western Ontario London, Ontario, Canada 2007 Ph.D.
Honours and Province of Ontario Graduate Scholarship Awards: 2011-2012
Research Western Graduate Thesis Research Award 2010, 2011 Social Science and Humanities Research Council (SSHRC) J. Armand Bombardier Doctoral Award 2008-2011 Great Ideas for Teaching Award Teaching Support Centre, The University of Western Ontario 2009 Graduate Student Teaching Award, Social Sciences Teaching Support Centre, The University of Western Ontario 2008 Province of Ontario Graduate Scholarship 2008 (declined) Western Graduate Research Doctoral Scholarship 2007-2008 School of Graduate Studies Conference Grant, Louisiana State University 2006 West Russell Grant Department of Geography and Anthropology, Louisiana State University 2005
376
Related Work Experience : Instructor, Resource Developer (in-class and online), and Research Assistant
Teaching Support Centre, The University of Western Ontario 2010-2015
Undergraduate Course Developer and Laboratory Supervisor (Alex Leatherdale) Department of Anthropology, The University of Western Ontario 2012-2014 Teaching Assistant Academic Transfer Program, Western Continuing Education 2013 Teaching Assistant Department of Anthropology, The University of Western Ontario 2007-2008, 2011 Teaching Assistant Centre for Global Studies, Huron University College 2009-2010, 2011, 2012 Instructor Department of Geography and Anthropology, Louisiana State University
2008
Ancient Images Laboratory Technician Sustainable Archaeology, Museum of Ontario Archaeology 2012-2013 Comparative Faunal Laboratory Manager Department of Anthropology, The University of Western Ontario 2011-2012 Cultural Resource Management Field Assistant D.R. Poulton & Associates Inc. 2008, 2011 Maya Archaeological Laboratory and Field Research Assistant Department of Geography and Anthropology, Louisiana State University
2006-2007
Graduate Assistant and Student Group Advisor Center for Student Leadership and Involvement, Dean of Students Office, Louisiana State University 2005-2006
377
Ethnographic Research Assistant and Interviewer Louisiana State University
2006, 2007 Publications: Morris, Z.H. (2011) The Value of a Four-Field Approach to Anthropology, Part II. Anthropology News. Canada, K.A. (ed.) Section News, National Association of Student Anthropologists (NASA). November Issue. Mazutis, D.D., Morris Z.H., Olsen, K.C. (2011) Leadership at the Graduate Studies and Postdoctoral Levels. A Research Study Presented to the: Vanier Canada Graduate Scholarship Program, Social Sciences and Humanities Research Council, and Government of Canada. Published online by the Vanier Canada Graduate Scholarship Program at: http://www.vanier.gc.ca/eng/pdf/leadership_report_e.pdf Presentations: 2013 Ellis, L., A. Suda, A. Nelson, R. Martin, Z.H., Morris, E. Moffatt, J. Poulin, R.
Newman, H. Sobol and I. Lefebvre Investigating miniature masterpieces: The technical study of boxwood prayer beads in the Thomson Collection at the Art Gallery of Ontario. Heritage Wood: Research & Conservation in the 21st Century. Warsaw, Poland, October 28-30.
2013 Morris, Z.H,, White, C., Longstaffe, F. and Hodgetts, L.
Stable Isotopic Comparison of Maize-Consumption by Wild Turkeys from Late Woodland Ontario Iroquoian versus Western Basin Sites. Published abstract of the 78th Annual Meeting of the Society for American Archaeology, Honolulu HI, April 3-7.
2012 Morris, Z.H,, White, C., Longstaffe, F. and Hodgetts, L.
Stable Isotopic Investigation of Ontario Iroquoian and Western Dogs as Proxies for Human Subsistence Behavior. Poster Presentation, Proceedings of the 40th Annual Meeting of the Canadian Association of Physical Anthropology, Victoria BC. November 7-10.
2012 Nelson, A., Butler, J.R., Garvin, G., Gelman, G., Moran, G, Wade, A.D. and
Morris. ZH.. Non-destructive Multimodal Imaging of the First 7 Years of the Mummification Process – The Afterlife of Yes the Cat. Poster Presentation, Proceedings of the 40th Annual Meeting of the Canadian Association of Physical Anthropology, Victoria BC. November 7-10.
2012 Morris, Z.H., White, C., Longstaffe, F. and Hodgetts, L. Warm Corn and Cold Hunts: Isotopic Evidence of Differences in Seasonal Landscape Use by Western Basin and Ontario Iroquoian Peoples during the Late

378
Woodland. Ontario Archaeological Society Annual Meeting, Windsor, ON, November 9-11.
2012 Ellis, L., Martin, R., Moffatt, E., Morris, Z.H., Nelson, A. & R. Newman.
Prayer Beads in the Thomson Collection at the Art Gallery of Ontario: Materials and Construction,” Proceedings from Prayer Nuts, Private Devotion and Early Modern Art Collecting. Abegg-Stiftung, Riggisberg, Switzerland, International Colloquium, 20–21 September 2012.
2012 Morris, Z. H., White, C. Longstaffe, F., Hodgetts, L. and Ferris, N.
Life-stages, landscapes and human-deer interactions during the Ontario Late Woodland period: isotopic, radiographic and histological evidence. Published abstract of the 77th Annual Meeting of the Society for American Archaeology, Memphis TN, April 18-22.
2012 L. Booth, L., White, ., Longstaffe, F., Hodgetts, L. and Morris, Z.H.
An isotopic analysis of faunal remains from suspected ritual deposits on Ontario Iroquoian Tradition sites. Poster Presentation, Published Abstract of the 77th Annual Meeting of the Society for American Archaeology, Memphis TN, April 18-22.
2012 Heim, K., McKillop, H., Morris, Z.H., and Joyce, R.
Dental Genetic Traits of Selected Maya Burials From Wild Cane Cay and Moho Cay, Belize. Poster Presentation, Published Abstract of the 77th Annual Meeting of the Society for American Archaeology, Memphis TN, April 18-22.
2011 Morris, Z.H., White, C., Longstaffe, F. and Hodgetts, L.
Life-stages, landscapes and human-deer interactions during the Ontario Late Woodland period: The isotopic evidence. Proceedings of Deer and People: Past, Present and Future, Riseholme Park, University of Lincoln, England, September 8-11.
2010 Z.H. Morris, C. White. L. Hodgetts, N. Ferris and F. Longstaffe.
Life-stages, landscapes and human-deer interactions during the Ontario Late Woodland period: The Growing Places:Late Woodland (AD 1000-1600) Agricultural Landscapes in Southwestern Ontario. 11th International Conference of the International Council for Archaeozoology, Paris, August 23-28.
2009 Z.H. Morris, M. Manhein and G. Listi Size Matters, but So Does Location: A Consideration of Human and Nonhuman
Secondary Osteon Area for Bone Fragment Identification, 37th Annual Meeting of the Canadian Association for Physical Anthropology, Vancouver, October 28-31.
2008 Z.H. Morris, M. Manhein and G. Listi Quantitative and Spatial Analysis of the Microscope Bone Structures of Deer
(Odocoileus virginianus), Dog (Canis familiaris), and Pig (Sus scrofa
379
domesticus), poster presentation, 73rd Annual Meeting of the Society of American Archaeology, Vancouver March 26-30.
2008 Z.H. Morris, M. Manhein and G. Listi
Quantitative and Spatial Analysis of the Microscope Bone Structures of Deer (Odocoileus virginianus), Dog (Canis familiaris), and Pig (Sus scrofa domesticus), poster presentation, 60th Annual Meeting of the American Academy of Forensic Science, Washington, February 18-23.
2007 Z.H. Morris Visions of a Whole Community: Role of Vietnamese-American Youth Leaders in
the New Orleans East Village Recovery, Annual Meetings of the American Ethnological Society (subsection CASCA), Toronto, May 9-12.
2007 Z.H. Morris and H. McKillop The Ancient Maya and the Sea: The Cays, the Coast and Underwater in Belize, A
Biological Profile of the Moho Cay and Wild Cane Burials, 72nd Annual Meeting of the Society of American Archaeology, Austin, April 25-29.
2006 Z.H. Morris Rebuilding Community and Creating Voice: the New Orleans Vietnamese East
Village, Annual Meeting Race, Ethnicity & Place: Race Ethnicity and Katrina, San Marcos November 3.
2006 Z.H. Morris Visions of a Whole Community: Role of Vietnamese-American Young Leaders in
the New Orleans East Village During and Post Katrina, Annual Meeting of the American Folklore Society, Milwaukee, October 18-22.
2006 Z.H. Morris Creating Voice Post Katrina: Vietnamese Community of New Orleans East
Village After Katrina: Rebuilding Cultures, Rebuilding Landscapes, Baton Rouge June 17.
2006 Z.H. Morris Active Engagement of Identity Construction by Vietnamese American Youth
Activists in Village De L’Est, New Orleans, 66th Annual Meeting of the Society for Applied Anthropology, Vancouver, March 28-Apr 2.
2006 Z.H. Morris
Bridging: Role of Vietnamese American Youth Activists from New Orleans East, 50th Annual Meeting of the Louisiana Folklore Society, Lafayette, March 25.
2005 Z.H. Morris and C. Crowder
Reducing Intra- and Inter-Observer Error Through Histomorphometric Variable Selection, American Association of Forensic Sciences, New Orleans, Feb 21-26.
Related Documents