Reconstructing Speech from Human Auditory Cortex Brian N. Pasley 1 *, Stephen V. David 2 , Nima Mesgarani 2,3 , Adeen Flinker 1 , Shihab A. Shamma 2 , Nathan E. Crone 4 , Robert T. Knight 1,3,5 , Edward F. Chang 3 1 Helen Wills Neuroscience Institute, University of California Berkeley, Berkeley, California, United States of America, 2 Institute for Systems Research and Department of Electrical and Computer Engineering, University of Maryland, College Park, Maryland, United States of America, 3 Department of Neurological Surgery, University of California–San Francisco, San Francisco, California, United States of America, 4 Department of Neurology, The Johns Hopkins University, Baltimore, Maryland, United States of America, 5 Department of Psychology, University of California Berkeley, Berkeley, California, United States of America Abstract How the human auditory system extracts perceptually relevant acoustic features of speech is unknown. To address this question, we used intracranial recordings from nonprimary auditory cortex in the human superior temporal gyrus to determine what acoustic information in speech sounds can be reconstructed from population neural activity. We found that slow and intermediate temporal fluctuations, such as those corresponding to syllable rate, were accurately reconstructed using a linear model based on the auditory spectrogram. However, reconstruction of fast temporal fluctuations, such as syllable onsets and offsets, required a nonlinear sound representation based on temporal modulation energy. Reconstruction accuracy was highest within the range of spectro-temporal fluctuations that have been found to be critical for speech intelligibility. The decoded speech representations allowed readout and identification of individual words directly from brain activity during single trial sound presentations. These findings reveal neural encoding mechanisms of speech acoustic parameters in higher order human auditory cortex. Citation: Pasley BN, David SV, Mesgarani N, Flinker A, Shamma SA, et al. (2012) Reconstructing Speech from Human Auditory Cortex. PLoS Biol 10(1): e1001251. doi:10.1371/journal.pbio.1001251 Academic Editor: Robert Zatorre, McGill University, Canada Received June 24, 2011; Accepted December 13, 2011; Published January 31, 2012 Copyright: ß 2012 Pasley et al. This is an open-access article distributed under the terms of the Creative Commons Attribution License, which permits unrestricted use, distribution, and reproduction in any medium, provided the original author and source are credited. Funding: This research was supported by NS21135 (RTK), PO4813 (RTK), NS40596 (NEC), and K99NS065120 (EFC). The funders had no role in study design, data collection and analysis, decision to publish, or preparation of the manuscript. Competing Interests: The authors have declared that no competing interests exist. Abbreviations: A1, primary auditory cortex; STG, superior temporal gyrus; STRF, spectro-temporal receptive field * E-mail: [email protected] Introduction The early auditory system decomposes speech and other complex sounds into elementary time-frequency representations prior to higher level phonetic and lexical processing [1–5]. This early auditory analysis, proceeding from the cochlea to the primary auditory cortex (A1) [1–3,6], yields a faithful represen- tation of the spectro-temporal properties of the sound waveform, including those acoustic cues relevant for speech perception, such as formants, formant transitions, and syllable rate [7]. However, relatively little is known about what specific features of natural speech are represented in intermediate and higher order human auditory cortex. In particular, the posterior superior temporal gyrus (pSTG), part of classical Wernicke’s area [8], is thought to play a critical role in the transformation of acoustic information into phonetic and pre-lexical representations [4,5,9,10]. PSTG is believed to participate in an ‘‘intermediate’’ stage of processing that extracts spectro-temporal features essential for auditory object recognition and discards nonessential acoustic features [4,5,9–11]. To investigate the nature of this auditory representation, we directly quantified how well different stimulus representations account for observed neural responses in nonprimary human auditory cortex, including areas along the lateral surface of STG. One approach, referred to as stimulus reconstruction [12–15], is to measure population neural responses to various stimuli and then evaluate how accurately the original stimulus can be reconstructed from the measured responses. Comparison of the original and reconstructed stimulus representation provides a quantitative description of the specific features that can be encoded by the neural population. Furthermore, different stimulus representa- tions, referred to as encoding models, can be directly compared to test hypotheses about how the neural population represents auditory function [16]. In this study, we focus on whether important spectro-temporal auditory features of spoken words and continuous sentences can be reconstructed from population neural responses. Because signifi- cant information may be transformed or lost in the course of higher order auditory processing, an exact reconstruction of the physical stimulus is not expected. However, analysis of stimulus reconstruction can reveal the key auditory features that are preserved in the temporal cortex representation of speech. To investigate this, we analyzed multichannel electrode recordings obtained from the surface of human auditory cortex and examined the extent to which these population neural signals could be used for reconstruction of different auditory representations of speech sounds. Results Words and sentences from different English speakers were presented aurally to 15 patients undergoing neurosurgical procedures for epilepsy or brain tumor. All patients in this study had normal language capacity as determined by neurological exam. Cortical surface field potentials were recorded from non- PLoS Biology | www.plosbiology.org 1 January 2012 | Volume 10 | Issue 1 | e1001251

Welcome message from author
This document is posted to help you gain knowledge. Please leave a comment to let me know what you think about it! Share it to your friends and learn new things together.
Transcript
Reconstructing Speech from Human Auditory CortexBrian N. Pasley1*, Stephen V. David2, Nima Mesgarani2,3, Adeen Flinker1, Shihab A. Shamma2, Nathan E.
Crone4, Robert T. Knight1,3,5, Edward F. Chang3
1 Helen Wills Neuroscience Institute, University of California Berkeley, Berkeley, California, United States of America, 2 Institute for Systems Research and Department of
Electrical and Computer Engineering, University of Maryland, College Park, Maryland, United States of America, 3 Department of Neurological Surgery, University of
California–San Francisco, San Francisco, California, United States of America, 4 Department of Neurology, The Johns Hopkins University, Baltimore, Maryland, United States
of America, 5 Department of Psychology, University of California Berkeley, Berkeley, California, United States of America
Abstract
How the human auditory system extracts perceptually relevant acoustic features of speech is unknown. To address thisquestion, we used intracranial recordings from nonprimary auditory cortex in the human superior temporal gyrus todetermine what acoustic information in speech sounds can be reconstructed from population neural activity. We found thatslow and intermediate temporal fluctuations, such as those corresponding to syllable rate, were accurately reconstructedusing a linear model based on the auditory spectrogram. However, reconstruction of fast temporal fluctuations, such assyllable onsets and offsets, required a nonlinear sound representation based on temporal modulation energy.Reconstruction accuracy was highest within the range of spectro-temporal fluctuations that have been found to becritical for speech intelligibility. The decoded speech representations allowed readout and identification of individual wordsdirectly from brain activity during single trial sound presentations. These findings reveal neural encoding mechanisms ofspeech acoustic parameters in higher order human auditory cortex.
Citation: Pasley BN, David SV, Mesgarani N, Flinker A, Shamma SA, et al. (2012) Reconstructing Speech from Human Auditory Cortex. PLoS Biol 10(1): e1001251.doi:10.1371/journal.pbio.1001251
Academic Editor: Robert Zatorre, McGill University, Canada
Received June 24, 2011; Accepted December 13, 2011; Published January 31, 2012
Copyright: � 2012 Pasley et al. This is an open-access article distributed under the terms of the Creative Commons Attribution License, which permitsunrestricted use, distribution, and reproduction in any medium, provided the original author and source are credited.
Funding: This research was supported by NS21135 (RTK), PO4813 (RTK), NS40596 (NEC), and K99NS065120 (EFC). The funders had no role in study design, datacollection and analysis, decision to publish, or preparation of the manuscript.
Competing Interests: The authors have declared that no competing interests exist.
Abbreviations: A1, primary auditory cortex; STG, superior temporal gyrus; STRF, spectro-temporal receptive field
* E-mail: [email protected]
Introduction
The early auditory system decomposes speech and other
complex sounds into elementary time-frequency representations
prior to higher level phonetic and lexical processing [1–5]. This
early auditory analysis, proceeding from the cochlea to the
primary auditory cortex (A1) [1–3,6], yields a faithful represen-
tation of the spectro-temporal properties of the sound waveform,
including those acoustic cues relevant for speech perception, such
as formants, formant transitions, and syllable rate [7]. However,
relatively little is known about what specific features of natural
speech are represented in intermediate and higher order human
auditory cortex. In particular, the posterior superior temporal
gyrus (pSTG), part of classical Wernicke’s area [8], is thought to
play a critical role in the transformation of acoustic information
into phonetic and pre-lexical representations [4,5,9,10]. PSTG is
believed to participate in an ‘‘intermediate’’ stage of processing
that extracts spectro-temporal features essential for auditory object
recognition and discards nonessential acoustic features [4,5,9–11].
To investigate the nature of this auditory representation, we
directly quantified how well different stimulus representations
account for observed neural responses in nonprimary human
auditory cortex, including areas along the lateral surface of STG.
One approach, referred to as stimulus reconstruction [12–15], is to
measure population neural responses to various stimuli and then
evaluate how accurately the original stimulus can be reconstructed
from the measured responses. Comparison of the original and
reconstructed stimulus representation provides a quantitative
description of the specific features that can be encoded by the
neural population. Furthermore, different stimulus representa-
tions, referred to as encoding models, can be directly compared to
test hypotheses about how the neural population represents
auditory function [16].
In this study, we focus on whether important spectro-temporal
auditory features of spoken words and continuous sentences can be
reconstructed from population neural responses. Because signifi-
cant information may be transformed or lost in the course of
higher order auditory processing, an exact reconstruction of the
physical stimulus is not expected. However, analysis of stimulus
reconstruction can reveal the key auditory features that are
preserved in the temporal cortex representation of speech. To
investigate this, we analyzed multichannel electrode recordings
obtained from the surface of human auditory cortex and examined
the extent to which these population neural signals could be used
for reconstruction of different auditory representations of speech
sounds.
Results
Words and sentences from different English speakers were
presented aurally to 15 patients undergoing neurosurgical
procedures for epilepsy or brain tumor. All patients in this study
had normal language capacity as determined by neurological
exam. Cortical surface field potentials were recorded from non-
PLoS Biology | www.plosbiology.org 1 January 2012 | Volume 10 | Issue 1 | e1001251

penetrating multi-electrode arrays placed over the lateral temporal
cortex (Figure 1, red circles), including the pSTG. We investigated
the nature of auditory information contained in temporal cortex
neural responses using a stimulus reconstruction approach (see
Materials and Methods) [12–15]. The reconstruction procedure is
a multi-input, multi-output predictive model that is fit to stimulus-
response data. It constitutes a mapping from neural responses to a
multi-dimensional stimulus representation (Figures 1 and 2). This
mapping can be estimated using a variety of different learning
algorithms [17]. In this study a regularized linear regression
algorithm was used to minimize the mean-square error between
the original and reconstructed stimulus (see Materials and
Methods). Once the model was fit to a training set, it could then
be used to predict the spectro-temporal content of any arbitrary
sound, including novel speech not used in training.
The key component in the reconstruction algorithm is the
choice of stimulus representation, as this choice encapsulates a
hypothesis about the neural coding strategy under study. Previous
applications of stimulus reconstruction in non-human auditory
systems [14,15] have focused primarily on linear models to
reconstruct the auditory spectrogram. The spectrogram is a time-
varying representation of the amplitude envelope at each acoustic
frequency (Figure 1, bottom left) [18]. The spectrogram envelope
of natural sounds is not static but rather fluctuates across both
frequency and time [19–21]. Envelope fluctuations in the
spectrogram are referred to as modulations [18–22] and play an
important role in the intelligibility of speech [19,21]. Temporal
modulations occur at different temporal rates and spectral
modulations occur at different spectral scales. For example, slow
and intermediate temporal modulation rates (,4 Hz) are asso-
ciated with syllable rate, while fast modulation rates (.16 Hz)
correspond to syllable onsets and offsets. Similarly, broad spectral
modulations relate to vowel formants while narrow spectral
structure characterizes harmonics. In the linear spectrogram
model, modulations are represented implicitly as the fluctuations
of the spectrogram envelope. Furthermore, neural responses are
assumed to be linearly related to the spectrogram envelope.
For stimulus reconstruction, we first applied the linear
spectrogram model to human pSTG responses using a stimulus
set of isolated words from an individual speaker. We used a leave-
one-out cross-validation fitting procedure in which the recon-
struction model was trained on stimulus-response data from
isolated words and evaluated by directly comparing the original
and reconstructed spectrograms of the out-of-sample word.
Reconstruction accuracy is quantified as the correlation coefficient
(Pearson’s r) between the original and reconstructed stimulus. The
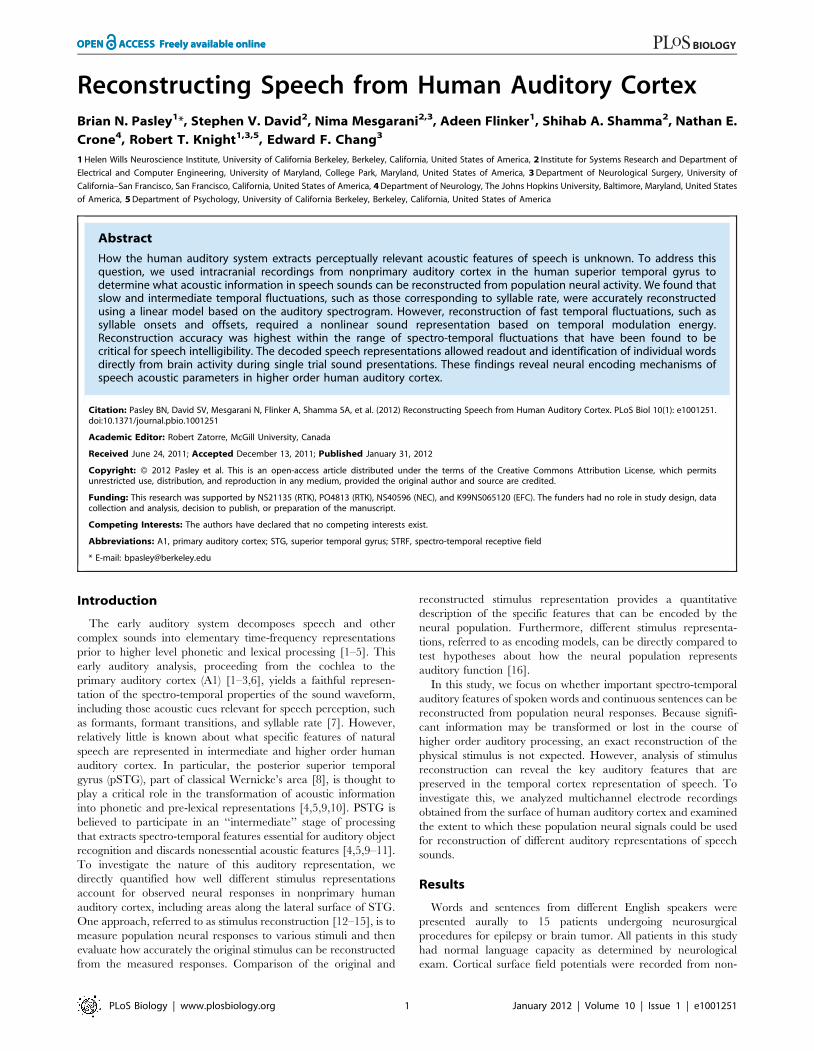
reconstruction procedure is illustrated in Figure 2 for one
participant with a high-density (4 mm) electrode grid placed over
posterior temporal cortex. For different words, the linear model
yielded accurate spectrogram reconstructions at the level of single
trial stimulus presentations (Figure 2A and B; see Figure S7 and
Supporting Audio File S1 for example audio reconstructions). The
reconstructions captured major spectro-temporal features such as
energy concentration at vowel harmonics (Figure 2A, purple bars)
and high frequency components during fricative consonants
(Figure 2A, [z] and [s], green bars). The anatomical distribution
of weights in the fitted reconstruction model revealed that the most
informative electrode sites within temporal cortex were largely
confined to pSTG (Figure 2C).
Across the sample of participants (N = 15), cross-validated
reconstruction accuracy for single trials was significantly greater
than zero in all individual participants (p,0.001, randomization
test, Figure 3A). At the population level, mean accuracy averaged
over all participants and stimulus sets (including different word sets
and continuous sentences from different speakers) was highly
significant (mean accuracy r = 0.28, p,1025, one-sample t test,
df = 14). As a function of acoustic frequency, mean accuracy
ranged from r = ,0.2–0.3 (Figure 3B).
We observed that overall reconstruction quality was influenced
by a number of anatomical and functional factors as described
Figure 1. Experiment paradigm. Participants listened to words(acoustic waveform, top left), while neural signals were recorded fromcortical surface electrode arrays (top right, red circles) implanted oversuperior and middle temporal gyrus (STG, MTG). Speech-inducedcortical field potentials (bottom right, gray curves) recorded at multipleelectrode sites were used to fit multi-input, multi-output models foroffline decoding. The models take as input time-varying neural signalsat multiple electrodes and output a spectrogram consisting of time-varying spectral power across a range of acoustic frequencies (180–7,000 Hz, bottom left). To assess decoding accuracy, the reconstructedspectrogram is compared to the spectrogram of the original acousticwaveform.doi:10.1371/journal.pbio.1001251.g001
Author Summary
Spoken language is a uniquely human trait. The humanbrain has evolved computational mechanisms that decodehighly variable acoustic inputs into meaningful elementsof language such as phonemes and words. Unravelingthese decoding mechanisms in humans has provendifficult, because invasive recording of cortical activity isusually not possible. In this study, we take advantage ofrare neurosurgical procedures for the treatment ofepilepsy, in which neural activity is measured directly fromthe cortical surface and therefore provides a uniqueopportunity for characterizing how the human brainperforms speech recognition. Using these recordings, weasked what aspects of speech sounds could be recon-structed, or decoded, from higher order brain areas in thehuman auditory system. We found that continuousauditory representations, for example the speech spectro-gram, could be accurately reconstructed from measuredneural signals. Reconstruction quality was highest forsound features most critical to speech intelligibility andallowed decoding of individual spoken words. The resultsprovide insights into higher order neural speech process-ing and suggest it may be possible to readout intendedspeech directly from brain activity.
Neural Decoding of Speech Sounds
PLoS Biology | www.plosbiology.org 2 January 2012 | Volume 10 | Issue 1 | e1001251
below. First, informative temporal electrodes were primarily
localized to pSTG. To quantify this, we defined ‘‘informative’’
electrodes as those associated with parameters with high signal-to-
noise ratio in the reconstruction models (t ratio.2.5, p,0.05, false
discovery rate (FDR) correction) Figure 4A shows the anatomical
distribution of informative electrodes pooled across participants
and plotted in standardized anatomical coordinates (Montreal
Neurological Institute, MNI) [23]). The distribution was centered
in the pSTG (x = 270, y = 229, z = 12, MNI coordinates;
Brodmann area 42), and was dispersed along the anterior-
posterior axis.
Second, significant predictive power (r.0) was largely confined to
neural responses in the high gamma band (,70–170 Hz; Figure 4B;
p,0.01, one-sample t tests, df = 14, Bonferroni correction).
Predictive power for the high gamma band (,70–170 Hz) was
significantly better compared to other neural frequency bands
(p,0.05, Bonferroni adjusted pair-wise comparisons between
frequency bands, following significant one-way repeated measures
analysis of variance (ANOVA), F(30,420) = 128.7, p,10210). This is
consistent with robust speech-induced high gamma responses
reported in previous intracranial studies [24–29] and with observed
correlations between high gamma power and local spike rate [30].
Third, increasing the number of electrodes used in the reconstruc-
tion improved overall reconstruction accuracy (Figure 4C). Overall
prediction quality was relatively low for participants with five or fewer
responsive STG electrodes (mean accuracy r = 0.19, N = 6 partici-
pants) and was robust for cases with high density grids (mean accuracy
r = 0.43, N = 4, mean of 37 responsive STG electrodes per
participant).
What neural response properties allow the linear model to find
an effective mapping to the stimulus spectrogram? There are two
major requirements as described in the following paragraphs.
First, individual recording sites must exhibit reliable frequency
selectivity (e.g., Figure 2B, right column; Figures S1B, S2). An
absence of frequency selectivity (i.e., equal neural response
amplitudes to all stimulus frequencies) would imply that neural
responses do not encode frequency and could not be used to
differentiate stimulus frequencies. To quantify frequency tuning at
Figure 2. Spectrogram reconstruction. (A) Top: spectrogram of six isolated words (deep, jazz, cause) and pseudowords (fook, ors, nim) presentedaurally to an individual participant. Bottom: spectrogram-based reconstruction of the same speech segment, linearly decoded from a set ofelectrodes. Purple and green bars denote vowels and fricative consonants, respectively, and the spectrogram is normalized within each frequencychannel for display. (B) Single trial high gamma band power (70–150 Hz, gray curves) induced by the speech segment in (A). Recordings are from fourdifferent STG sites used in the reconstruction. The high gamma response at each site is z-scored and plotted in standard deviation (SD) units. Rightpanel: frequency tuning curves (dark black) for each of the four electrode sites, sorted by peak frequency and normalized by maximum amplitude.Red bars overlay each peak frequency and indicate SEM of the parameter estimate. Frequency tuning was computed from spectro-temporal receptivefields (STRFs) measured at each individual electrode site. Tuning curves exhibit a range of functional forms including multiple frequency peaks(Figures S1B and S2B). (C) The anatomical distribution of fitted weights in the reconstruction model. Dashed box denotes the extent of the electrodegrid (shown in Figure 1). Weight magnitudes are averaged over all time lags and spectrogram frequencies and spatially smoothed for display.Nonzero weights are largely focal to STG electrode sites. Scale bar is 10 mm.doi:10.1371/journal.pbio.1001251.g002
Neural Decoding of Speech Sounds
PLoS Biology | www.plosbiology.org 3 January 2012 | Volume 10 | Issue 1 | e1001251

individual electrodes, we used estimates of standard spectro-
temporal receptive fields (STRFs) (see Materials and Methods).
The STRF is a forward modeling approach commonly used to
estimate neural tuning to a wide variety of stimulus parameters in
different sensory systems [16]. We found that different electrodes
were sensitive to different acoustic frequencies important for speech
sounds, ranging from low (,200 Hz) to high (,7,000 Hz). The
majority of individual sites exhibited a complex tuning profile with
multiple peaks (e.g., Figure 2B, rows 2 and 3; Figure S2B). The full
range of the acoustic speech spectrum was encoded by responses
from multiple electrodes in the ensemble, although coverage of the
spectrum varied by participant (Figure 4D). Across participants, total
reconstruction accuracy was positively correlated with the propor-
tion of spectrum coverage (r = 0.78, p,0.001, df = 13; Figure 4D).
A second key requirement of the linear model is that the neural
response must rise and fall reliably with fluctuations in the stimulus
spectrogram envelope. This is because the linear model assumes a
linear mapping between the response and the spectrogram
envelope. This requirement for ‘‘envelope-locking’’ reveals a
major limitation of the linear model, which is most evident at fast
temporal modulation rates. This limitation is illustrated in
Figure 5A (blue curve), which plots reconstruction accuracy as a
function of modulation rate. A one-way repeated measures
ANOVA (F(5,70) = 13.99, p,1028) indicated that accuracy was
significantly higher for slow modulation rates (#4 Hz) compared
to faster modulation rates (.8 Hz) (p,0.05, post hoc pair-wise
comparisons, Bonferroni correction). Accuracy for slow and
intermediate modulation rates (#8 Hz) was significantly greater
than zero (r = ,0.15 to 0.42; one-sample paired t tests, p,0.0005,
df = 14, Bonferroni correction) indicating that the high gamma
response faithfully tracks the spectrogram envelope at these rates
[26]. However, accuracy levels were not significantly greater than
zero at fast modulation rates (.8 Hz; r = ,0.10; one-sample
paired t tests, p.0.05, df = 14, Bonferroni correction), indicating a
lack of reliable envelope-locking to rapid temporal fluctuations
[31].
Given the failure of the linear spectrogram model to reconstruct
fast modulation rates, we evaluated competing models of auditory
neural encoding. We investigated an alternative, nonlinear model
based on modulation (described in detail in [18]). Speech sounds
are characterized by both slow and fast temporal modulations
(e.g., syllable rate versus onsets) as well as narrow and broad
spectral modulations (e.g., harmonics versus formants) [7]. The
modulation model represents these multi-resolution features
explicitly through a complex wavelet analysis of the auditory
spectrogram. Computationally, the modulation representation is
generated by a population of modulation-selective filters that
analyze the two-dimensional spectrogram and extract modulation
energy (a nonlinear operation) at different temporal rates and
spectral scales (Figure 6A) [18]. Conceptually, this transformation
is similar to the modulus of a 2-D Fourier transform of the
spectrogram, localized at each acoustic frequency [18]. The
modulation model and applications to speech processing are
described in detail in [18] and [7].
The nonlinear component of the model is phase invariance to
the spectrogram envelope (Figure 6B). A fundamental difference
with the linear spectrogram model is that phase invariance permits
a nonlinear temporal coding scheme, whereby envelope fluctua-
tions are encoded by amplitude rather than envelope-locking
(Figure 6B). Such amplitude-based coding schemes are broadly
referred to as ‘‘energy models’’ [32,33]. The modulation model
therefore represents an auditory analog to the classical energy
model of complex cells in the visual system [32–36], which are
invariant to the spatial phase of visual stimuli.
Reconstructing the modulation representation proceeds simi-
larly to the spectrogram, except that individual reconstructed
stimulus components now correspond to modulation energy at
different rates and scales instead of spectral energy at different
acoustic frequencies (see Materials and Methods, Stimulus
Reconstruction). We next compared reconstruction accuracy
using the nonlinear modulation model to that of the linear
spectrogram model (Figure 5A; Figure S3). In the group data, the
nonlinear model yielded significantly higher accuracy compared to
the linear model (two-way repeated measures ANOVA; main
effect of model type, F(1,14) = 33.36, p,1024). This included
significantly better accuracy for fast temporal modulation rates
compared to the linear spectrogram model (4–32 Hz; Figure 5A,
red versus blue curves; model type by modulation rate interaction
Figure 3. Individual participant and group average reconstruc-tion accuracy. (A) Overall reconstruction accuracy for each participantusing the linear spectrogram model. Error bars denote resampling SEM.Overall accuracy is reported as the mean over all acoustic frequencies.Participants are grouped by grid density (low or high) and stimulus set(isolated words or sentences). Statistical significance of the correlationcoefficient for each individual participant was computed using arandomization test. Reconstructed trials were randomly shuffled 1,000times and the correlation coefficient was computed for each shuffle tocreate a null distribution of coefficients. The p value was calculated asthe proportion of elements greater than the observed correlation. (B)Reconstruction accuracy as a function of acoustic frequency averagedover all participants (N = 15) using the linear spectrogram model.Shaded region denotes SEM over participants.doi:10.1371/journal.pbio.1001251.g003
Neural Decoding of Speech Sounds
PLoS Biology | www.plosbiology.org 4 January 2012 | Volume 10 | Issue 1 | e1001251

effect, F(5,70) = 3.33, p,0.01; post hoc pair-wise comparisons,
p,1024, Bonferroni correction).
The improved performance of the modulation model suggested
that this representation provided better neural sensitivity to fast
modulation rates compared to the linear spectrogram. To further
investigate this possibility, we estimated modulation rate tuning
curves at individual STG electrode sites (n = 195) using linear and
nonlinear STRFs, which are based on the spectrogram and
modulation representations, respectively (Figure S4). Consistent
with prior recordings from lateral temporal human cortex [31],
average envelope-locked responses exhibit prominent tuning to
low rates (1–8 Hz) with a gradual loss of sensitivity at higher rates
(.8 Hz) (Figure 5B and C). In contrast, the average modulation-
based tuning curves preserve sensitivity to much higher rates
approaching 32 Hz (Figure 5B and C).
Sensitivity to fast modulation rates at single STG electrodes is
illustrated for one participant in Figure 7A. In this example (the
word ‘‘waldo’’), the spectrogram envelope (blue curve, top)
fluctuates rapidly between the two syllables (‘‘wal’’ and ‘‘do,’’
,300 ms). The linear model assumes that neural responses (high
gamma power, black curves, left) are envelope-locked and directly
track this rapid change. However, robust tracking of such rapid
envelope changes was not generally observed, in violation of linear
model assumptions. This is illustrated for several individual
electrodes in Figure 7A (compare black curves, left, with blue
curve, top). In contrast, the modulation representation encodes
this fluctuation nonlinearly as an increase in energy at fast rates
(.8 Hz, dashed red curves, ,300 ms, bottom two rows). This
allows the model to capture energy-based modulation information
in the neural response. Modulation energy encoding at these sites
is quantified by the corresponding nonlinear rate tuning curves
(Figure 7A, right column). These tuning curves show neural
sensitivity to a range of temporal modulations with a single peak
rate. For illustrative purposes, Figure 7A (left) compares modula-
tion energy at the peak temporal rate (dashed red curves) with the
neural responses (black curves) at each individual site. This
illustrates the ability of the modulation model to account for a
rapid decrease in the spectrogram envelope without a correspond-
ing decrease in the neural response.
The effect of sensitivity to fast modulation rates can also be
observed when the modulation reconstruction is viewed in the
spectrogram domain (Figure 7B, middle, see Material and
Methods, Reconstruction Accuracy). The result is that dynamic
spectral information (such as the upward frequency sweep at
,400–500 ms, Figure 7B, top) is better resolved compared to the
linear spectrogram-based reconstruction (Figure 7B, bottom).
Figure 4. Factors influencing reconstruction quality. (A) Group average t value map of informative electrodes, which are predominantlylocalized to posterior STG. For each participant, informative electrodes are defined as those associated with significant weights (p,0.05, FDRcorrection) in the fitted reconstruction model. To plot electrodes in a common anatomical space, spatial coordinates of significant electrodes arenormalized to the MNI (Montreal Neurological Institute) brain template (Yale BioImage Suite, www.bioimagesuite.org). The dashed white line denotesthe extent of electrode coverage pooled over participants. (B) Reconstruction accuracy is significantly greater than zero when using neural responseswithin the high gamma band (,70–170 Hz; p,0.05, one sample t tests, df = 14, Bonferroni correction). Accuracy was computed separately in 10 Hzbands from 1–300 Hz and averaged across all participants (N = 15). (C) Mean reconstruction accuracy improves with increasing number of electrodesused in the reconstruction algorithm. Error bars indicate SEM over 20 cross-validated data sets of four participants with 4 mm high density grids. (D)Accuracy across participants is strongly correlated (r = 0.78, p,0.001, df = 13) with tuning spread (which varied by participant depending on gridplacement and electrode density). Tuning spread was quantified as the fraction of frequency bins that included one or more peaks, ranging from 0(no peaks) to 1 (at least one peak in all frequency bins, ranging from 180–7,000 Hz).doi:10.1371/journal.pbio.1001251.g004
Neural Decoding of Speech Sounds
PLoS Biology | www.plosbiology.org 5 January 2012 | Volume 10 | Issue 1 | e1001251

These combined results support the idea of an emergent
population-level representation of temporal modulation energy
in primate auditory cortex [37]. In support of this notion,
subpopulations of neurons have been found that exhibit both
envelope and energy-based response properties in primary
auditory cortex of non-human primates [37–39]. This has led to
the suggestion of a dual coding scheme in which slow fluctuations
are encoded by synchronized (envelope-locked) neurons, while fast
fluctuations are encoded by non-synchronized (energy-based)
neurons [37].
While these results indicate that a nonlinear model is required to
reliably reconstruct fast modulation rates, psychoacoustic studies
have shown that slow and intermediate modulation rates (,1–
8 Hz) are most critical for speech intelligibility [19,21]. These slow
temporal fluctuations carry essential phonological information
such as formant transitions and syllable rate [7,19,21]. The linear
spectrogram model, which also yielded good performance within
this range (Figure 5A; Figure S3), therefore appears sufficient to
reconstruct the essential range of temporal modulations. To
examine this issue, we further assessed reconstruction quality by
evaluating the ability to identify isolated words using the linear
spectrogram reconstructions. We analyzed a participant implanted
with a high-density electrode grid (4 mm spacing), the density of
which provided a large set of pSTG electrodes. Compared to
Figure 5. Comparison of linear and nonlinear coding oftemporal fluctuations. (A) Mean reconstruction accuracy (r) as afunction of temporal modulation rate, averaged over all participants(N = 15). Modulation-based decoding accuracy (red curve) is highercompared to spectrogram-based decoding (blue curve) for temporalrates $4 Hz. In addition, spectrogram-based decoding accuracy issignificantly greater than zero for lower modulation rates (#8 Hz),supporting the possibility of a dual modulation and envelope-basedcoding scheme for slow modulation rates. Shaded gray regions indicateSEM over participants. (B) Mean ensemble rate tuning curve across allpredictive electrode sites (n = 195). Error bars indicate SEM. Overlaidhistograms indicate proportion of sites with peak tuning at each rate.(C) Within-site differences between modulation and spectrogram-basedtuning. Arrow indicates the mean difference across sites. Within-site,nonlinear modulation models are tuned to higher temporal modulationrates than the corresponding linear spectrogram models (p,1027, twosample paired t test, df = 194).doi:10.1371/journal.pbio.1001251.g005
Figure 6. Schematic of nonlinear modulation model. (A) Theinput spectrogram (top left) is transformed by a linear modulation filterbank (right) followed by a nonlinear magnitude operation (not shown).This nonlinear operation extracts the modulation energy of theincoming spectrogram and generates phase invariance to localfluctuations in the spectrogram envelope. The input representation isthe two-dimensional spectrogram S(f,t) across frequency f and time t.The output (bottom left) is the four-dimensional modulation energyrepresentation M(s,r,f,t) across spectral modulation scale s, temporalmodulation rate r, frequency f, and time t. In the full modulationrepresentation [18], negative rates by convention correspond toupward frequency sweeps, while positive rates correspond todownward frequency sweeps. Accuracy for positive and negative rateswas averaged unless otherwise shown. See Materials and Methods. (B)Schematic of linear (spectrogram envelope) and nonlinear (modulationenergy) temporal coding. Left: acoustic waveform (black curve) andspectrogram of a temporally modulated tone. The linear spectrogrammodel (top) assumes that neural responses are a linear function of thespectrogram envelope (plotted for the tone center frequency channel,top right). In this case, the instantaneous output may be high or lowand does not directly indicate the modulation rate of the envelope. Thenonlinear modulation model (bottom) assumes that neural responsesare a linear function of modulation energy. This is an amplitude-basedcoding scheme (plotted for the peak modulation channel, bottomright). The nonlinear modulation model explicitly estimates themodulation rate by taking on a constant value for a constant rate [32].doi:10.1371/journal.pbio.1001251.g006
Neural Decoding of Speech Sounds
PLoS Biology | www.plosbiology.org 6 January 2012 | Volume 10 | Issue 1 | e1001251

lower density grid cases, data for this participant included
ensemble frequency tuning that covered the majority of the
(speech-related) acoustic spectrum (180–7,000 Hz), a factor which
we found was critical for accurate reconstruction (Figure 4D).
Spectrogram reconstructions were generated for each of 47 words,
using neural responses either from single trials or averaged over 3–
5 trials per word (same word set and cross-validated fitting
procedure as described in Figure 2). To identify individual words
from the reconstructions, a simple speech recognition algorithm
based on dynamic time warping was used to temporally align
words of variable duration [40]. For a target word, a similarity
score (correlation coefficient) was then computed between the
target reconstruction and the actual spectrograms of each of the 47
words in the candidate set. The 47 similarity scores were sorted
and word identification rank was quantified as the percentile rank
of the correct word. (1.0 indicates the target reconstruction
matched the correct word out of all candidate words; 0.0 indicates
the target was least similar to the correct word among all other
candidates.) The expected mean of the distribution of identifica-
tion ranks is 0.5 at chance level.
Word identification using averaged trials was substantially
higher than chance (Figure 8A and B, median identification
rank = 0.89, p,0.0001; randomization test), with correctly
identified words exhibiting accurate reconstructions and poorly
identified words exhibiting inaccurate reconstructions
(Figure 8C). For single trials, identification performance declined
slightly but remained significant (median = 0.76, p,0.0001;
randomization test). In addition, for each possible word pair,
we computed the similarity between the two original spectro-
grams and compared this to the similarity between the
reconstructed and actual spectrograms (using averaged trials;
Figure 8D; Figure S5). Acoustic and reconstruction word
similarities were correlated (r = 0.41, p,10210, df = 45), suggest-
ing that acoustic similarity of the candidate words is likely to
influence identification performance (i.e., identification is more
difficult when the word set contains many acoustically similar
sounds).
Discussion
These findings demonstrate that key features in continuous and
novel speech signals can be accurately reconstructed from STG
neural responses using both spectrogram and modulation-based
auditory representations, with the latter yielding better predictions
at fast temporal modulation rates. For both representations,
regions of good prediction performance included the range of
spectro-temporal modulations most critical to speech intelligibility
[19,21].
Figure 7. Example of nonlinear modulation coding and reconstruction. (A) Top: the spectrogram of an isolated word (‘‘waldo’’) presentedaurally to one participant. Blue curve plots the spectrogram envelope, summed over all frequencies. Left panels: induced high gamma responses(black curves, trial averaged) at four different STG sites. Temporal modulation energy of the stimulus (dashed red curves) is overlaid (computed from2, 4, 8, and 16 Hz modulation filters and normalized to maximum value). Dashed black lines indicate baseline response level. Right panels: nonlinearmodulation rate tuning curves for each site (estimated from nonlinear STRFs). Shaded regions and error bars indicate SEM. (B) Original spectrogram(top), modulation-based reconstruction (middle), and spectrogram-based reconstruction (bottom), linearly decoded from a fixed set of STGelectrodes. The modulation reconstruction is projected into the spectrogram domain using an iterative projection algorithm and an overcomplete setof modulation filters [18]. The displayed spectrogram is averaged over 100 random initializations of the algorithm.doi:10.1371/journal.pbio.1001251.g007
Neural Decoding of Speech Sounds
PLoS Biology | www.plosbiology.org 7 January 2012 | Volume 10 | Issue 1 | e1001251

The primary difference between the linear spectrogram and
nonlinear modulation models was evident in the predictive
accuracy for fast temporal modulations (Figure 5). To understand
why the nonlinear modulation model performed better at fast
modulation rates, it is useful to consider how the linear and
nonlinear models make different assumptions about neural coding.
The linear and nonlinear models are specified by different
choices of stimulus representation. The linear model assumes a
linear mapping between neural responses and the auditory
spectrogram. The nonlinear model assumes a linear mapping
between neural responses and the modulation representation.
The modulation representation itself is a nonlinear transforma-
tion of the spectrogram and is based on emergent tuning
properties that have been identified in the auditory cortex [18].
Choosing a nonlinear stimulus representation effectively linear-
izes the stimulus-response mapping and allows one to fit linear
models to the new space of transformed stimulus features
[17,35]. If the nonlinear stimulus representation is a more
accurate description of neural responses, its predictive accuracy
will be higher. In this approach, the choice of stimulus
representation for reconstruction encapsulates hypotheses about
the coding strategies under study. For example, Rieke et al. [41]
reconstructed the sound pressure waveform using neural
responses from the bullfrog auditory periphery, where neural
responses phase-lock to fluctuations in the raw stimulus
waveform [2]. In the central auditory pathway, phase-locking
to the stimulus waveform is rare [2], and waveform reconstruc-
tion would be expected to fail. Instead, many neurons phase-lock
to the spectrogram envelope (a nonlinear transformation of the
stimulus waveform) [2]. Consistent with these response proper-
ties, spectrogram reconstruction has been demonstrated using
neural responses from mammalian primary auditory cortex [14]
or the avian midbrain [15]. Beyond primary auditory areas,
further processing in intermediate and higher-order auditory
cortex likely results in additional stimulus transformations [5]. In
this study, we examined human STG, a nonprimary auditory
area, and found that a nonlinear modulation representation
yielded the best overall reconstruction accuracy, particularly at
fast modulation rates ($4 Hz). This suggests that phase-locking
to the amplitude envelope is less robust at higher temporal rates
and may instead be coded by an energy-based scheme [37].
Although additional studies are needed, this is consistent with a
number of results suggesting that the capacity for envelope-
locking decreases along the auditory pathway, extending from
the inferior colliculus (32–256 Hz), medial geniculate body
(16 Hz), primary auditory cortex (8 Hz), to nonprimary auditory
areas (4–8 Hz) [2,6,26,31,42].
Fidelity of the reconstructions was sufficient to identify
individual words using a rudimentary speech recognition algo-
rithm. However, reconstruction quality at present is not clearly
Figure 8. Word identification. Word identification based on the reconstructed spectrograms was assessed using a set of 47 individual words andpseudowords from a single speaker in a high density 4 mm grid experiment. The speech recognition algorithm is described in the text. (A)Distribution of identification rank for all 47 words in the set. Median identification rank is 0.89 (black arrow), which is higher than 0.50 chance level(dashed line; p,0.0001; randomization test). Statistical significance was assessed by a randomization test in which a null distribution of the medianwas constructed by randomly shuffling the word pairs 10,000 times, computing median identification rank for each shuffle, and calculating thepercentile rank of the true median in the null distribution. Best performance was achieved after smoothing the spectrograms with a 2-D box filter(500 ms, 2 octaves). (B) Receiver operating characteristic (ROC) plot of identification performance (red curve). Diagonal black line indicates nopredictive power. (C) Examples of accurately (right) and inaccurately (left) identified words. Left: reconstruction of pseudoword ‘‘heef’’ is poor andleads to a low identification rank (0.13). Right: reconstruction of pseudoword ‘‘thack’’ is accurate and best matches the correct word out of 46 othercandidate words (identification rank = 1.0). (D) Actual and reconstructed word similarity is correlated (r = 0.41). Pair-wise similarity between theoriginal spectrograms of individual words is correlated with pair-wise similarity between the reconstructed and original spectrograms. Plotted valuesare computed prior to spectrogram smoothing used in the identification algorithm. Gray points denote the similarity between identical words.doi:10.1371/journal.pbio.1001251.g008
Neural Decoding of Speech Sounds
PLoS Biology | www.plosbiology.org 8 January 2012 | Volume 10 | Issue 1 | e1001251
intelligible to a human listener (Figure S7 and Supporting Audio
File S1). It is possible that a better signal-to-noise ratio or more
comprehensive (higher density) recordings in STG could produce
intelligible speech reconstructions. Alternatively, the true features
represented by STG may not be readily inverted back to an
intelligible acoustic waveform. For speech comprehension, it is
hypothesized that intermediate and higher-order auditory areas
extract or construct information-rich features of speech, while
discarding nonessential low-level acoustic information [4,5,9,
10,43]. In the case that STG applies a highly nonlinear stimulus
transformation, an exact reconstruction of the acoustic signal from
STG responses would not be possible. Instead, speech reconstruc-
tion provides an important tool to investigate the critical features
that are faithfully represented at different stages of the auditory
system. For example, we found that low spectro-temporal
modulations (temporal modulations ,8 Hz, spectral modulations
,4 cycles/octave, Figure S3) are accurately reconstructed from
spectrogram or modulation-based models. Modulations within this
range correspond to important structural features of natural
speech, including formants and syllable rate [19,21]. Although
more work is needed to characterize the neural representation in
the STG, this suggests that such key features are preserved at this
stage in auditory processing. Our results are therefore consistent
with the idea of pSTG as an intermediate stage in a hierarchy of
auditory object processing [5,9,10,44].
Hierarchical auditory object processing has been hypothesized
to follow a ventral ‘‘what’’ pathway, with an antero-lateral
gradient along the superior temporal region [5,9,10,11] where
stimulus selectivity increases from pure tones in primary auditory
cortex to words and sentences in anterior STG [5]. How can
hypotheses about the ventral pathway be tested within the stimulus
reconstruction framework? In this framework, encoding models
must be developed that encapsulate hypothesized neural mecha-
nisms. These hypotheses are then tested by comparing predictive
accuracies of the competing models [16]. For example, in the
current work we compared reconstruction accuracy of linear and
nonlinear auditory models. An important future direction is to
compare performance of these auditory models to higher level
models that implement more complex stimulus selectivity.
Previous work suggests that categorical representations are an
important organizational principle in STG [9,45–47]. These
studies found evidence of neural selectivity for entire speech
categories, such as vowels or syllables. Unlike the auditory
representations studied here, these neural responses were relatively
insensitive to acoustic variation. At a more abstract level of
representation, a recent functional imaging study also demon-
strated that the semantic content of nouns could be used as an
effective encoding model across multiple cortical regions [48].
An important application of this approach has also been
demonstrated in the study of visual object recognition in the
primate visual system [36,49,50]. These studies found that
structural encoding models, based on spatio-temporal visual
features, yielded good performance in primary and intermediate
visual areas, including visual areas V1, V2, and V3, whereas a
high level encoding model based on semantic features was
required to achieve good performance in higher level areas such
as V4 and lateral occipital cortex [50]. Our results suggest that a
similar approach may be usefully applied to the auditory cortex,
where structural auditory models may partially account for
responses in primary and intermediate areas (e.g., A1 and
pSTG), but development of higher level encoding models could
be required to describe more anterior areas in the ventral
auditory pathway. As understanding of cortical speech repre-
sentation improves, future research into speech reconstruction
may also be useful for development of neural interfaces for
communication, for example by revealing the content of inner
speech imagery.
Materials and Methods
Participants and Neural RecordingsElectrocorticographic (ECoG) recordings were obtained using
subdural electrode arrays implanted in 15 patients undergoing
neurosurgical procedures for epilepsy or brain tumor. All parti-
cipants volunteered and gave their informed consent before
testing. The experimental protocol was approved by the Johns
Hopkins Hospital, Columbia University Medical Center, Univer-
sity of California, San Francisco and Berkeley Institutional Review
Boards and Committees on Human Research. Electrode grids had
center-to-center distance of either 4 mm (N = 4 participants) [46]
or 10 mm (N = 11) [24,25]. Grid placement was determined
entirely by clinical criteria and covered left or right fronto-
temporal regions in all patients. Localization and coregistration of
electrodes with the structural MRI is described in detail in [51].
Multi-channel ECoG data were amplified and digitally recorded
with sampling rate = 1,000 Hz (N = 6 participants) [24], 2,003 Hz
(N = 5) [25], or 3,052 Hz (N = 4) [46]. All ECoG signals were
remontaged to a common average reference [24] after removal of
channels with artifacts or excessive noise (including electromag-
netic noise from hospital equipment and poor contact with the
cortical surface). Time-varying high gamma band power (70–
150 Hz) was extracted from the multi-channel ECoG signal using
the Hilbert-Huang transform [25], converted to standardized
z-scores, and used for all analyses (except Figure 4B in which the
ECoG signal was filtered into 30 bands of width 10 Hz, ranging
from 1–300 Hz, in order to calculate band-specific prediction
accuracy). Data from a variety of language tasks were analyzed.
Tasks included passive listening (N = 5 participants), target word
detection (N = 5), and word/sentence repetition (N = 5).
Speech StimuliSpeech stimuli consisted of isolated words from a single speaker
(N = 10 participants) or sentences from a variety of male and
female speakers (N = 5). Isolated words included nouns, verbs,
proper names, and pseudowords and were recorded by a native
English female speaker (0.3–1 s duration, 16 kHz sample rate).
Sentences were phonetically transcribed stimuli from the Texas
Instruments/Massachusetts Institute of Technology (TIMIT)
database (2–4 s, 16 kHz) [52]. Stimuli were presented aurally at
the patient’s bedside using either external free-field loudspeakers
or calibrated ear inserts (Etymotic ER-5A) at approximately 70–
80 dB.
The spectrogram representation (linear model) was generated
from the speech waveform using a 128 channel auditory filter bank
mimicking the auditory periphery [18,53]. Filters had logarithmi-
cally spaced center frequencies ranging from 180–7,000 Hz and
bandwidth of approximately 1/12th octave. The spectrogram was
subsequently downsampled to 32 frequency channels.
The modulation representation (nonlinear model) was obtained
by a 2-D complex wavelet transform of the 128 channel auditory
spectrogram [18], implemented by a bank of causal modulation-
selective filters spanning a range of spectral scales (0.5–8 cyc/oct)
and temporal rates (1–32 Hz). The modulation selective filters are
idealized spectro-temporal receptive fields similar to those
measured in mammalian primary auditory cortex (Figure 6).
The filter bank output constitutes a complex-valued time-varying
multi-dimensional speech representation (downsampled to 32
acoustic frequency612 rate65 scale = 1,920 total stimulus chan-
Neural Decoding of Speech Sounds
PLoS Biology | www.plosbiology.org 9 January 2012 | Volume 10 | Issue 1 | e1001251
nels) [18]. The modulation representation is obtained by taking
the magnitude of this complex-valued output. In specific analyses
(stated in the text), reduced modulation representations were used
to reduce dimensionality and to achieve an acceptable computa-
tional load, as well as to verify that tuning estimates were not
affected by regularization, given the large number of fitted
parameters in the full model. Reduced modulation representations
included (1) rate-scale (60 total channels) and (2) rate only (six total
channels). The rate-scale representation was obtained by averag-
ing along the irrelevant dimension (frequency) prior to the
nonlinear magnitude operation. The rate only representation
was obtained by filtering the spectrogram with pure temporal
modulation filters (described in detail in Chi et al. [18]). Note that
spectro-temporal filtering of the spectrogram is directional and
captures upward and downward frequency sweeps, which by
convention are denoted as positive and negative rates, respectively.
Pure temporal filtering in the rate-only representation is not
directional and results in half the total number of rate channels.
These operations are described in detail in Chi et al. [18]. Figure
S6 summarizes the stimulus correlations present in the linear and
nonlinear representations.
Stimulus ReconstructionThe stimulus reconstruction model is the linear mapping
between the responses at a set of electrodes and the original
stimulus representation (e.g., modulation or spectrogram repre-
sentation) [12,14]. For a set of N electrodes, we represent the
response of electrode n at time t = 1 … T as R(t, n). The
reconstruction model, g(t, f, n), is a function that maps R(t, n) to
stimulus S(t, f) as follows:
SS(t,f )~X
n
X
t
g(t,f ,n) R(t{t,n), ð1Þ
where SS denotes the estimated stimulus representation. Equation 1
implies that the reconstruction of each channel in the stimulus
representation, Sf (t), from the neural population is independent of
the other channels (estimated using a separate set of gf (t, n)). If we
consider the reconstruction of one such channel, it can be written
as:
SSf (t)~X
n
X
t
gf (t,n)R(t{t,n): ð2Þ
The entire reconstruction function is then described as the
collection of functions for each stimulus feature:
G~ g1,g2, . . . gFf g: ð3Þ
For the spectrogram, time-varying spectral energy in 32 individual
frequency channels was reconstructed. For the modulation
representation, unless otherwise stated we reconstructed the
reduced rate-scale representation, which consists of time-varying
modulation energy in 60 rate-scale channels (defined in Speech
Stimuli). We used t= 100 temporal lags, discretized at 10 ms.
Model FittingPrior to model fitting, stimuli and neural response data were
synchronized, downsampled to 100 Hz, and standardized to zero
mean and unit standard deviation. Model parameters (G in Eqn. 3)
were fit to a training set of stimulus-response data (ranging from
2.5–17.5 min for different participants) using coordinate gradient
descent with early stopping regularization, an iterative linear
regression algorithm [16,36,49]. Each data set was divided into
training (80%), validation (10%), and test sets (10%). Overfitting
was minimized by monitoring prediction accuracy on the
validation set and terminating the algorithm after a series of 50
iterations failed to improve performance (an indication that
overfitting was beginning to occur). Reconstruction accuracy was
then evaluated on the independent test set. Coordinate descent
produces a sparse solution in the weight vector (i.e., most weight
values set to zero) and essentially performs variable selection
simultaneously with model fitting [17]. Consequently, there is no
requirement to preselect electrodes for the reconstruction model.
For grid sizes studied here, inclusion of all electrodes in the
reconstruction model can be advantageous because the algorithm
encourages irrelevant parameters to maintain zero weight, while
allowing the model to capture additional variance using electrodes
potentially excluded by feature selection approaches. Equal
numbers of parameters are used to estimate each stimulus channel
in both linear and nonlinear models. For each stimulus channel,
the number of parameters in the corresponding reconstruction
filter is N electrodes6100 time lags (the number of electrodes for
each participant was determined by clinical criteria and therefore
N varied by participant).
Cross-ValidationParameter estimation was performed by a cross-validation
procedure using repeated random subsampling [54], also referred
to as Monte Carlo cross-validation [55]. This has the advantage
over k-fold cross-validation in that the proportion of train/test
data is independent of the number of folds. Repeated random sub-
sampling is similar to a bootstrap procedure (without replacement)
that ensures there is no overlap between training and test data sets.
For each repeat, trials were randomly partitioned into training
(80% of trials), validation (10%), and test sets (10%); model fitting
was then performed using the training/validation data; and
reconstruction accuracy was evaluated on the test set. This
procedure is repeated multiple times (depending on computational
load) and the parameters and reconstruction accuracy measures
were averaged over all repeats. The forward encoding models
were estimated using 20 resamples; the spectrogram and
modulation reconstruction models were estimated using 10 and
3 resamples, respectively (due to increasing computational load).
Identical data partitions were used for comparing predictive power
for different reconstruction models (i.e., spectrogram versus
modulation) to ensure potential differences were not due to
different stimuli or noise levels in the evaluation data. To check
stability of the generalization error estimates, we verified that
estimated spectrogram reconstruction accuracy was stable as a
function of the number of resamples used in the estimation
(ranging from 3 to 10). The total duration of the test set equaled
the length of the concatenated resampled data sets (range of ,0.8–
17.5 min across participants). Standard error of individual
parameters was calculated as the standard deviation of the
resampled estimates [17]. Statistical significance of individual
parameters was assessed by the t-ratio (coefficient divided by its
resampled standard error estimate). Model fitting was performed
with the MATLAB toolbox STRFLab (http://strflab.berkeley.
edu).
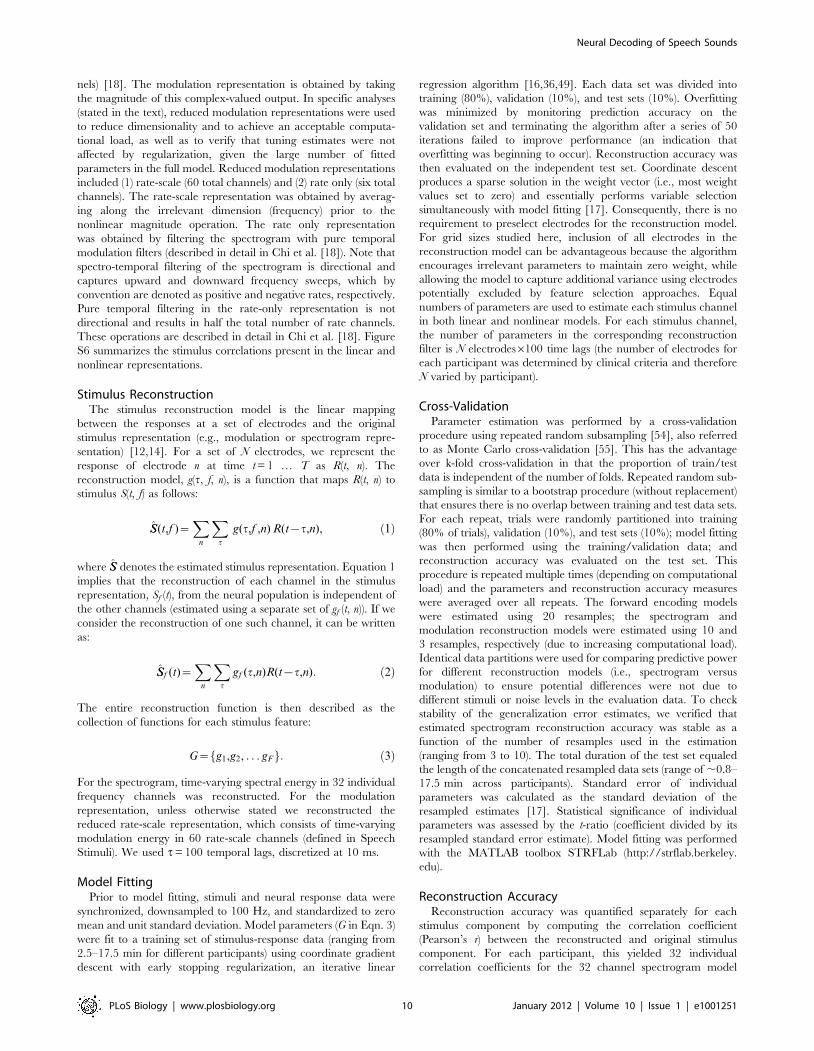
Reconstruction AccuracyReconstruction accuracy was quantified separately for each
stimulus component by computing the correlation coefficient
(Pearson’s r) between the reconstructed and original stimulus
component. For each participant, this yielded 32 individual
correlation coefficients for the 32 channel spectrogram model
Neural Decoding of Speech Sounds
PLoS Biology | www.plosbiology.org 10 January 2012 | Volume 10 | Issue 1 | e1001251

and 60 correlation coefficients for the 60 channel rate-scale
modulation model (defined in Speech Stimuli). Overall recon-
struction accuracy is reported as the mean correlation over all
stimulus components.
To make a direct comparison of modulation and spectro-
gram-based accuracy, the reconstructions need to be compared
in the same stimulus space. The linear spectrogram reconstruc-
tion was therefore projected into the rate-scale modulation
space (using the modulation filterbank as described in Speech
Stimuli). This transformation provides an estimate of the
modulation content of the spectrogram reconstruction and
allows direct comparison with the modulation reconstruction.
The transformed reconstruction was then correlated with the 60
rate-scale components of the original stimulus. Accuracy as a
function of rate (Figure 5A) was calculated by averaging over the
scale dimension. Positive and negative rates were also averaged
unless otherwise shown. Comparison of reconstruction accuracy
for a subset of data in the full rate-scale-frequency modulation
space yielded similar results. To impose additivity and
approximate a normal sampling distribution of the correlation
coefficient statistic, Fisher’s z-transform was applied to correla-
tion coefficients prior to tests of statistical significance and prior
to averaging over stimulus channels and participants. The
inverse z-transform was then applied for all reported mean r
values.
To visualize the modulation-based reconstruction in the
spectrogram domain (Figure 7B), the 4-D modulation represen-
tation needs to be inverted [18]. If both magnitude and phase
responses are available, the 2-D spectrogram can be restored by
a linear inverse filtering operation [18]. Here, only the
magnitude response is reconstructed directly from neural
activity. In this case, the spectrogram can be recovered
approximately from the magnitude-only modulation representa-
tion using an iterative projection algorithm and an overcomplete
set of modulation filters as described in Chi et al. [18]. Figure 7B
displays the average of 100 random initializations of this
algorithm. This approach is subject to non-neural errors due
to the phase-retrieval problem (i.e., the algorithm does not
perfectly recover the spectrogram, even when applied to the
original stimulus) [18]. Therefore, quantitative comparisons with
the spectrogram-based reconstruction were performed in the
modulation space.
Reconstruction accuracy was cross-validated and the reported
correlation is the average over all resamples (see Cross-Validation)
[53]. Standard error is computed as the standard deviation of the
resampled distribution [17]. The reported correlations are not
corrected to account for the noise ceiling on prediction accuracy
[16], which limits the amount of potentially explainable variance.
An ideal model would not achieve perfect prediction accuracy of
r = 1.0 due to the presence of random noise that is unrelated to the
stimulus. With repeated trials of identical stimuli, it is possible to
estimate trial-to-trial variability to correct for the amount of
potentially explainable variance [56]. In the experiments reported
here, a sufficient number of trial repetitions (.5) was generally
unavailable for a robust estimate, and uncorrected values are
therefore reported.
STRF Encoding ModelsEncoding models describe the linear mapping between the
stimulus representation and the neural response at individual sites.
For a stimulus representation s(x,t) and instantaneous neural
response r(t) sampled at times t = 1 … T, the encoding model is
defined as the linear mapping [14,56]:
r tð Þ~XX ,U
x~1,u~0
h x,uð Þs x,t{uð Þze tð Þ: ð4Þ
Each coefficient of h indicates the gain applied to stimulus feature x
at time lag u. Positive values indicate components of the stimulus
correlated with increased neural response, and negative values
indicate components correlated with decreased response. The
residual, e(t), represents components of the response (nonlinearities
and noise) that cannot be predicted by the encoding model.
Model fitting for the STRF models (h in Eqn. 4) proceeded
similarly to reconstruction except a standard gradient descent
algorithm (with early stopping regularization) was used that does
not impose a sparse solution [16,36,49]. The linear STRF model
included 32 frequency channels6100 time lags (3,200 parameters).
The full nonlinear modulation STRF model included 32
frequency65 scale612 rate6100 time lags (192,000 parameters)
and the reduced rate-time modulation model (Figure S4) included
6 rate6100 time lags (600 parameters). The STRF models were
cross-validated using 20 resampled data sets with no overlap
between training and test partitions within each resample. Data
partitions were identical across STRF model type (linear and
nonlinear). We did not enforce identical resampled data sets for
estimating STRF and reconstruction models, because the
predictive power of these two approaches is not comparable.
Tuning curves were estimated from STRFs as follows: Frequency
tuning was estimated from the linear STRF models by first setting
all inhibitory weights to zero and then summing across the time
dimension [53]. Nonlinear rate tuning was estimated from the
nonlinear STRF modulation model by the same procedure, using
the reduced rate-only representation. Linear rate tuning was
estimated from the linear STRF model by filtering the fitted STRF
with the modulation filterbank (see Speech Stimuli) and averaging
along the irrelevant dimensions. Linear rate tuning computed in
this way was similar to that computed from the modulation
transfer function (modulus of the 2-D Fourier transform) of the
fitted linear STRF [57]. For all tuning curves, standard error was
computed as the standard deviation of the resampled estimates
[17]. Frequency tuning curve peaks were identified as significant
parameters (t.2.0) separated by more than a half octave. To
calculate ensemble tuning curves (Figure 5B), the tuning curve for
each site was normalized by the maximum value and averaged
across sites. STG sites with forward prediction accuracy of r.0.1
were analyzed (n = 195).
Supporting Information
Figure S1 Anatomical distribution of surface local field potential
(LFP) responses and linear STRFs in a low density grid participant
(10 mm electrode spacing). (A) Trial averaged spectral LFP
responses to English sentences (2–4 s duration) at individual
electrode sites. Consistent with previous intracranial language
studies [1–5], speech stimuli evoke increased high gamma power
(,70–150 Hz) sometimes accompanied by decreased power at
lower frequencies (,40 Hz) throughout sites in the temporal
auditory cortex. Black outline indicates temporal cortex sites with
high gamma responses (.0.5 SD from baseline). (B) Example
linear STRFs across all sites for one participant. All models are fit
to power in the high gamma band range (70–150 Hz). (C)
Anatomical location of subdural electrode grid (10 mm electrode
spacing). Yellow outline indicates sites as in (A) and (B).
(TIF)
Neural Decoding of Speech Sounds
PLoS Biology | www.plosbiology.org 11 January 2012 | Volume 10 | Issue 1 | e1001251
Figure S2 Frequency tuning. (A) Left panels: linear STRFs for
two example electrode sites. Right panels: pure tone frequency
tuning (black curves) matches frequency tuning derived from fitted
linear STRF models (red curves). For one participant, pure tones
(375–6,000 Hz, logarithmically spaced) were presented for 100 ms
at 80 dB. Pure tone tuning curves were calculated as the
amplitudes of the induced high gamma response across tone
frequencies. STRF-derived tuning curves were calculated by first
setting all inhibitory weights to zero and then summing across the
time dimension [6]. At these two sites, frequency tuning is
approximately high-pass (top) or low-pass (bottom). (B) Distribu-
tion of the number of frequency tuning peaks across significant
electrodes (N = 15 participants) estimated from linear STRF
models (32-channel). The majority of sites exhibit complex
frequency tuning patterns of 2–5 peaks. Peaks were identified as
significant parameters (t.2.0) separated by more than a half
octave.
(TIF)
Figure S3 Mean reconstruction accuracy for the joint rate-scale
space across all participants (N = 15). Top: modulation-based
(nonlinear) decoding accuracy is significantly higher compared to
frequency-based (linear) decoding (bottom) for all spectral scales at
temporal rates $16 Hz (p,0.05, post hoc pair-wise comparisons,
Bonferroni correction, following significant two-way repeated
measures ANOVA; model type by stimulus component interaction
effect, F(59,826) = 1.84, p,0.0005).
(TIF)
Figure S4 Modulation rate tuning was estimated from both
linear and nonlinear STRF models, based on the spectrogram or
modulation representation, respectively. Linear STRFs have a 2-D
parameter space (frequency6time). Modulation rate tuning for the
linear STRF was computed by filtering the fitted STRF model
with the modulation filterbank (see Materials and Methods) and
averaging along the irrelevant dimensions. Modulation rate tuning
computed in this way was similar to that computed from the
modulation transfer function (MTF) (modulus of the 2-D Fourier
transform of the fitted STRF [7]). Nonlinear STRFs have a 4-D
parameter space (rate6scale6frequency6time). Modulation-based
rate tuning curves were computed by summing across the three
irrelevant dimensions [8]. Modulation rate tuning was similar
whether this procedure was applied to a reduced dimension model
(rate6time only) or to the marginalized full model. Reported
estimates of modulation rate tuning were computed from the
reduced (rate6time) models. (A) Left: example linear STRF. The
linear STRF can be transformed into rate-scale space (the MTF,
right) by taking the modulus of the 2-D Fourier transform [7] or by
filtering the STRF with the modulation filter bank. The linear
modulation rate tuning curve (blue curve, top) is obtained after
averaging along the scale dimension. (B) Left: example nonlinear
STRF from the same site as in (A), fit in the rate-time parameter
space. Right: the corresponding modulation-based rate tuning
curve (red) is plotted against the spectrogram-based tuning curve
(blue) from (A) (only positive rates are shown).
(TIF)
Figure S5 Confusion matrix for word identification (Figure 8).
Left: pair-wise similarities (correlation coefficient) between actual
auditory spectrograms of each word pair. Right: pair-wise
similarities between reconstructed and actual spectrograms of
each word pair. Correlations were computed prior to any
spectrogram smoothing.
(TIF)
Figure S6 Stimulus correlations in linear and nonlinear stimulus
representations. Speech, like other natural sounds, has strong
stimulus correlations (illustrated for acoustic frequency, top panels,
and temporal modulation rate, bottom panels). Correlations were
estimated from 1,000 randomly selected TIMIT sentences at
different time lags (t = 0, 50, 250 ms; note the temporal
asymmetry due to the use of causal modulation filters). Under
an efficient coding hypothesis [9], these statistical redundancies
may be exploited by the brain during sensory processing. In this
study, we used an optimal linear estimator (Wiener filter) [10],
which is essentially a multivariate linear regression and does not
account for correlations among the output variables. Stimulus
reconstruction therefore reflects an upper bound on the stimulus
features that are encoded by the neural ensemble [10]. As
described in previous work [10,11], the effect of stimulus statistics
on reconstruction accuracy can be explored systematically using
different stimulus priors.
(TIF)
Figure S7 Audio playback of reconstructed speech. The audio
file contains a sequence of six isolated words that were
reconstructed from single trial neural activity. Single trial
reconstructions are generally not intelligible. However, coarse
features such as syllable structure may be discerned. In addition,
up and down frequency sweeps (corresponding to faster
temporal rates) are more evident in the modulation reconstruc-
tions compared to the spectrogram reconstructions. Perceptual
similarities between original and reconstructed words can be
more easily recognized after first listening to the original sound.
In the audio file, each word is presented as a sequence of the
original sound heard by the participant, followed by the
spectrogram (linear) reconstruction, followed by the modulation
(nonlinear) reconstruction. The figure shows the spectrograms of
the original and reconstructed words. For audio playback, the
spectrogram or modulation representations must be converted
to an acoustic waveform, a transformation that requires both
magnitude and phase information. Because the reconstructed
representations are magnitude-only, the phase must be estimat-
ed. In general, this is known as the phase retrieval problem [8].
To recover the acoustic waveform from the spectrogram, we
used an iterative projection algorithm to estimate the phase [8].
This step introduces additional acoustic artifacts that can distort
the auditory features reconstructed directly from neural
responses. Consequently, the audio file is an accurate but not
perfect reflection of the reconstructed speech representation. A
similar algorithm can be used to recover the spectrogram from
the modulation representation [8]. For the purposes of this
demo, we instead projected the spectrogram reconstruction into
the (complex) modulation domain, extracted the phase, and
then combined the extracted phase with the reconstructed
magnitude of the modulation representation. With both phase
and magnitude information, an invertible transformation can
then be used to convert the (complex) modulation representa-
tion back to the spectrogram [8]. Finally, to aid perceptual
inspection of the reconstructions, the sample rate of the audio
file is slightly slower (14 kHz) than that presented to participants
(16 kHz).
(TIF)
Text S1 Supporting Information references.
(PDF)
Audio File S1 Example audio of reconstructed speech.
(WAV)
Neural Decoding of Speech Sounds
PLoS Biology | www.plosbiology.org 12 January 2012 | Volume 10 | Issue 1 | e1001251

Acknowledgments
We are grateful to the individuals who participated in this experiment and
to the laboratories of Nina Dronkers, Ralph Freeman, Frederic
Theunissen, and Jack Gallant for technical assistance and discussions.
Author Contributions
The author(s) have made the following declarations about their
contributions: Conceived and designed the experiments: BNP SVD.
Performed the experiments: NEC EFC BNP AF. Analyzed the data: BNP
SVD. Contributed reagents/materials/analysis tools: NM SVD SAS BNP.
Wrote the paper: BNP SVD NM AF SAS NEC RTK EFC. Coordinated
project: RTK NEC EFC.
References
1. Young ED (2008) Neural representation of spectral and temporal information in
speech. Philos Trans R Soc Lond B Biol Sci 363: 923–945.
2. Joris PX, Schreiner CE, Rees A (2004) Neural processing of amplitude-
modulated sounds. Physiol Rev 84: 541–577.
3. Schreiner CE, Froemke RC, Atencio CA (2011) Spectral processing in auditory
cortex. In: Winer JA, Schreiner CE, eds. The auditory cortex Springer US. pp
275–308.
4. Hickok G, Poeppel D (2007) The cortical organization of speech processing. Nat
Rev Neurosci 8: 393–402.
5. Rauschecker JP, Scott SK (2009) Maps and streams in the auditory cortex:
nonhuman primates illuminate human speech processing. Nat Neurosci 12:
718–724.
6. Eggermont JJ, Wang X (2011) Temporal coding in auditory cortex. In: Winer JA,
Schreiner CE, eds. The auditory cortex Springer US. pp 275–308.
7. Shamma SA (2003) Physiological foundations of temporal integration in the
perception of speech. Journal of Phonetics 31: 279–287.
8. Geschwind N (1965) Disconnexion syndromes in animals and man: Part I. Brain
88: 237–294.
9. Recanzone GH, Cohen YE (2010) Serial and parallel processing in the primate
auditory cortex revisited. Behavioural Brain Research 206: 1–7.
10. Steinschneider M (2011) Unlocking the role of the superior temporal gyrus for
speech sound categorization. Journal of Neurophysiology 105: 2631–2633.
11. Romanski LM, Averbeck BB (2009) The primate cortical auditory system and
neural representation of conspecific vocalizations. Annu Rev Neurosci 32:
315–346.
12. Bialek W, Rieke F, de Ruyter van Steveninck RR, Warland D (1991) Reading a
neural code. Science 252: 1854–1857.
13. Stanley GB, Li FF, Dan Y (1999) Reconstruction of natural scenes from
ensemble responses in the lateral geniculate nucleus. J Neurosci 19: 8036–
8042.
14. Mesgarani N, David SV, Fritz JB, Shamma SA (2009) Influence of context and
behavior on stimulus reconstruction from neural activity in primary auditory
cortex. J Neurophysiol 102: 3329–3339.
15. Ramirez AD, Ahmadian Y, Schumacher J, Schneider D, Woolley SM, et al.
(2011) Incorporating naturalistic correlation structure improves spectrogram
reconstruction from neuronal activity in the songbird auditory midbrain.
J Neurosci 31: 3828–3842.
16. Wu MC, David SV, Gallant JL (2006) Complete functional characterization of
sensory neurons by system identification. Annu Rev Neurosci 29: 477–505.
17. Hastie T, Tibshirani R, Friedman J (2009) Elements of statistical learning. New
YorkNY: Springer Science.
18. Chi T, Ru P, Shamma SA (2005) Multiresolution spectrotemporal analysis of
complex sounds. J Acoust Soc Am 118: 887–906.
19. Chi T, Gao Y, Guyton MC, Ru P, Shamma S (1999) Spectro-temporal
modulation transfer functions and speech intelligibility. J Acoust Soc Am 106:
2719–2732.
20. Singh NC, Theunissen FE (2003) Modulation spectra of natural sounds and
ethological theories of auditory processing. J Acoust Soc Am 114: 3394–3411.
21. Elliott TM, Theunissen FE (2009) The modulation transfer function for speech
intelligibility. PLoS Comput Biol 5: e1000302. doi:10.1371/journal.pcbi.1000302.
22. Dau T, Kollmeier B, Kohlrausch A (1997) Modeling auditory processing of
amplitude modulation. I. Detection and masking with narrow-band carriers.
J Acoust Soc Am 102: 2892–2905.
23. Evans AC, Collins DL, Mills SR, Brown ED, Kelly RL. pp 1813–1817.
24. Crone NE, Boatman D, Gordon B, Hao L (2001) Induced electrocorticographic
gamma activity during auditory perception. Brazier Award-winning article,
2001. Clin Neurophysiol 112: 565–582.
25. Canolty RT, Soltani M, Dalal SS, Edwards E, Dronkers NF, et al. (2007)
Spatiotemporal dynamics of word processing in the human brain. Front
Neurosci 1: 185–196.
26. Nourski KV, Reale RA, Oya H, Kawasaki H, Kovach CK, et al. (2009)
Temporal envelope of time-compressed speech represented in the human
auditory cortex. J Neurosci 29: 15564–15574.
27. Flinker A, Chang EF, Kirsch HE, Barbaro NM, Crone NE, et al. (2010) Single-
trial speech suppression of auditory cortex activity in humans. The Journal of
Neuroscience 30: 16643–16650.
28. Edwards E, Nagarajan SS, Dalal SS, Canolty RT, Kirsch HE, et al. (2010)
Spatiotemporal imaging of cortical activation during verb generation and picture
naming. Neuroimage 50: 291–301.
29. Pei X, Leuthardt EC, Gaona CM, Brunner P, Wolpaw JR, et al. (2011)
Spatiotemporal dynamics of electrocorticographic high gamma activity duringovert and covert word repetition. Neuroimage 54: 2960–2972.
30. Logothetis NK, Wandell BA (2004) Interpreting the BOLD signal. Annu Rev
Physiol 66: 735–769.31. Liegeois-Chauvel C, Lorenzi C, Trebuchon A, Regis J, Chauvel P (2004)
Temporal envelope processing in the human left and right auditory cortices.Cereb Cortex 14: 731–740.
32. Adelson EH, Bergen JR (1985) Spatiotemporal energy models for the perceptionof motion. J Opt Soc Am A 2: 284–299.
33. Kouh M, Poggio T (2008) A canonical neural circuit for cortical nonlinear
operations. Neural Computation 20: 1427–1451.34. Hubel DH, Wiesel TN (1962) Receptive fields, binocular interaction and
functional architecture in the cat’s visual cortex. J Physiol 160: 106–154.35. David SV, Vinje WE, Gallant JL (2004) Natural stimulus statistics alter the
receptive field structure of v1 neurons. J Neurosci 24: 6991–7006.
36. Willmore BD, Prenger RJ, Gallant JL (2010) Neural representation of naturalimages in visual area V2. J Neurosci 30: 2102–2114.
37. Wang X, Lu T, Bendor D, Bartlett E (2008) Neural coding of temporalinformation in auditory thalamus and cortex. Neuroscience 154: 294–303.
38. Lu T, Liang L, Wang X (2001) Temporal and rate representations of time-varying signals in the auditory cortex of awake primates. Nat Neurosci 4:
1131–1138.
39. Bendor D, Wang X (2007) Differential neural coding of acoustic flutter withinprimate auditory cortex. Nat Neurosci 10: 763–771.
40. Rabiner L, Juang BH (1993) Fundamentals of speech recognition. EnglewoodCliffsNJ: Prentice-Hall, Inc.
41. Rieke F, Bodnar DA, Bialek W (1995) Naturalistic stimuli increase the rate and
efficiency of information transmission by primary auditory afferents. Proc BiolSci 262: 259–265.
42. Nourski KV, Brugge JF (2011) Representation of temporal sound features in thehuman auditory cortex. Reviews in the Neurosciences 22: 187–203.
43. Greenberg S (2006) A multi-tier theoretical framework for understanding spokenlanguage. In: Listening to speech. In: Greenberg S, Ainsworth WA, eds.
Listening to speech: an auditory perspective. MahwahNJ: Lawrence Erlbaum
Associates. pp 411–433.44. Russ BE, Ackelson AL, Baker AE, Cohen YE (2008) Coding of auditory-stimulus
identity in the auditory non-spatial processing stream. Journal of Neurophys-iology 99: 87–95.
45. Formisano E, De Martino F, Bonte M, Goebel R (2008) ‘‘Who’’ is saying
‘‘what’’? Brain-based decoding of human voice and speech. Science 322:970–973.
46. Chang EF, Rieger JW, Johnson K, Berger MS, Barbaro NM, et al. (2010)Categorical speech representation in human superior temporal gyrus. Nat
Neurosci 13: 1428–1432.47. Tsunada J, Lee JH, Cohen YE (2011) Representation of speech categories in the
primate auditory cortex. Journal of Neurophysiology.
48. Mitchell TM, Shinkareva SV, Carlson A, Chang KM, Malave VL, et al. (2008)Predicting human brain activity associated with the meanings of nouns. Science
320: 1191–1195.49. Kay KN, Naselaris T, Prenger RJ, Gallant JL (2008) Identifying natural images
from human brain activity. Nature 452: 352–355.
50. Naselaris T, Prenger RJ, Kay KN, Oliver M, Gallant JL (2009) Bayesianreconstruction of natural images from human brain activity. Neuron 63:
902–915.51. Dalal SS, Guggisberg AG, Edwards E, Sekihara K, Findlay AM, et al. (2007)
Spatial localization of cortical time-frequency dynamics. Conf Proc IEEE Eng
Med Biol Soc 2007: 4941–4944.52. Garofolo JS, Lamel LF, Fisher WM, Fiscus JG, Pallet DS, et al. (1993) Acoustic-
phonetic continuous speech corpus. Linguistic Data Consortium.53. David SV, Mesgarani N, Shamma SA (2007) Estimating sparse spectro-temporal
receptive fields with natural stimuli. Network 18: 191–212.54. Rokach L (2010) Pattern classification using ensemble method. London: World
Scientific Pub Co Inc.
55. Boulesteix AL, Strobl C, Augustin T, Daumer M (2008) Evaluating microarray-based classifiers: an overview. Cancer Inform 6: 77–97.
56. David SV, Gallant JL (2005) Predicting neuronal responses during naturalvision. Network 16: 239–260.
57. Miller LM, Escabi MA, Read HL, Schreiner CE (2002) Spectrotemporal
receptive fields in the lemniscal auditory thalamus and cortex. J Neurophysiol87: 516–527.
Neural Decoding of Speech Sounds
PLoS Biology | www.plosbiology.org 13 January 2012 | Volume 10 | Issue 1 | e1001251
Related Documents