REDI3x3 Working paper 9 June 2015 Reconsidering the effectiveness of zero-rating of value-added tax in South Africa Ada Jansen and Estian Calitz Abstract South Africa has used zero-rating and exemptions to address the regressivity of the VAT for more than two decades. From an economic perspective, it remains contestable whether zero- rating is the most cost-effective way of targeting the poor. The appointment in 2013 of the Davis Tax Committee of inquiry into the South African tax system has refocused the attention on the usefulness of zero-rating from an income distribution and poverty perspective. This paper is considers some questions on the zero-rating of VAT in SA. We first ask whether (conceptually) zero-rating should be a consideration. Then we present a quantitative investigation of the impact on the poor if zero-rating were to be removed, as well as the tax revenue implications of such a policy change. We also explore the appropriateness of the items currently zero-rated and whether or not more items should be considered for possible zero-rating. We also consider alternatives like a luxury VAT or revised excise rates. Finally, we explore the possibility of replacing the benefits of zero-rating to the poor with an income support programme. We use data from the Income and Expenditure Surveys (IES) conducted by Statistics South Africa (StatsSA), as well as statistics from the National Treasury of SA. We conclude that the significant improvement of income-support programmes since the introduction of VAT (with zero-ratings) justifies a reconsideration of the most cost-effective income-support package of programmes, inclusive of VAT zero-rating. The Research Project on Employment, Income Distribution and Inclusive Growth is based at SALDRU at the University of Cape Town and supported by the National Treasury. Views ex- pressed in REDI3x3 Working Papers are those of the authors and are not to be attributed to any of these institutions. © REDI3x3 1 www.REDI3x3.org

Welcome message from author
This document is posted to help you gain knowledge. Please leave a comment to let me know what you think about it! Share it to your friends and learn new things together.
Transcript
REDI3x3 Working paper 9 June 2015
Reconsidering the effectiveness of zero-rating of value-added tax in South Africa Ada Jansen and Estian Calitz
Abstract South Africa has used zero-rating and exemptions to address the regressivity of the VAT for more than two decades. From an economic perspective, it remains contestable whether zero-rating is the most cost-effective way of targeting the poor. The appointment in 2013 of the Davis Tax Committee of inquiry into the South African tax system has refocused the attention on the usefulness of zero-rating from an income distribution and poverty perspective.
This paper is considers some questions on the zero-rating of VAT in SA. We first ask whether (conceptually) zero-rating should be a consideration. Then we present a quantitative investigation of the impact on the poor if zero-rating were to be removed, as well as the tax revenue implications of such a policy change. We also explore the appropriateness of the items currently zero-rated and whether or not more items should be considered for possible zero-rating. We also consider alternatives like a luxury VAT or revised excise rates. Finally, we explore the possibility of replacing the benefits of zero-rating to the poor with an income support programme.
We use data from the Income and Expenditure Surveys (IES) conducted by Statistics South Africa (StatsSA), as well as statistics from the National Treasury of SA. We conclude that the significant improvement of income-support programmes since the introduction of VAT (with zero-ratings) justifies a reconsideration of the most cost-effective income-support package of programmes, inclusive of VAT zero-rating.
The Research Project on Employment, Income Distribution and Inclusive Growth is based at SALDRU at the University of Cape Town and supported by the National Treasury. Views ex-pressed in REDI3x3 Working Papers are those of the authors and are not to be attributed to any of these institutions.
© REDI3x3 1 www.REDI3x3.org
Reconsidering the effectiveness of zero-rating of value-added tax in South Africa
Ada Jansen and Estian Calitz ∗
(Department of Economics, Stellenbosch University)
1. Introduction
On 30 September 1991 South Africa replaced its general sales tax (GST), levied at 12 percent, with a broad-base value-added tax (VAT) at 10 percent. Because of its broad-basedness, the replacement was deemed to be more or less revenue neutral to the fiscus. The structure of VAT reflected the widely held view (at the time) that allocative efficiency and tax-revenue goals were best served by a broad-based tax, while the regressive impact of VAT (as an indirect tax) is best countered by targeted relief to vulnerable groups in society via the expenditure side of the government budget – in the form of cash transfers. Retrospectively, this approach matched the thinking about redistribution in South Africa in the Growth, Employment and Redistribution (GEAR) policy document of the post-apartheid government (RSA, 1996: 10): “International experience confirms that it is on the expenditure side that the fiscus is most effectively able to contribute to redistribution. It is nonetheless important that the incidence of taxation should remain progressive1, while at the same time impacting across a broad base so as to avoid excessive rates.”
Soon after the introduction of VAT, it became clear that a higher rate was required to replace the revenue yielded by GST. In addition, the regressiveness of VAT was continually challenged and its acceptability was at high risk, arguably also because of the lag with which the targeted expenditure programmes became effective. Consequently, the rate was increased to 14 percent while at the same time a number of items which were deemed to form an essential part of the consumption basket of lower-income groups were zero-rated, notwithstanding the fact that more well-to-do households were, in aggregate, spending more on the same goods in absolute terms and some of these goods were intermediate inputs in the production of goods and services in the economy2. In ensuing years the government yielded to further pressure by adding a limited number of additional items to the zero-rated list.
∗ We thank Dr Derek Yu for his assistance with the data analyses, Prof Ingrid Woolard for constructive advice and comments on earlier drafts of the paper and an anonymous referee. The authors wish to thank REDI3x3 for funding this research project 1 This also implies that the nature and extent of fiscal redistribution extends beyond the impact of any single tax or expenditure measure: an assessment of fiscal incidence in its entirety is indicated. 2 For example, when any of the zero-rated food items is used as feed to animals.
© REDI3x3 2 www.REDI3x3.org
With the basic VAT structure having been in place for more than twenty years and many other policies and government programmes having been implemented, an assessment of the VAT structure in the context of South Africa’s experience and progress with poverty reduction and income redistribution is justified. In particular, such assessment needs to be in the context of all measures of fiscal redistribution. The purpose of this paper is to address the following questions: Conceptually, why would one want to zero rate? Theoretically, it is always better to keep
the base broad and use the revenue to provide directed transfers to the poor on the expenditure side of the budget. Under what conditions is zero-rating a better option?
If the zero-ratings were to be abolished, what would the impact be on the poor? How much revenue would be gained by abolishing zero-rating?
Are there items on the list that are inappropriate? Are there items that ought to be on the list that aren’t? How much revenue would be lost
if they were zero-rated? Does a luxury VAT make conceptual sense? How is this better than tweaking excise
rates? If there were to be a luxury VAT – probably for political rather than economic reasons –
what items might one target and how much revenue would it raise? How pro-poor would it be?
Can the zero-rating benefit to the poor be effectively replaced by an income support programme?
2. Conceptualising the zero-rating of VAT
The economic literature provides some guidance on the design of indirect taxes such as VAT. From the standpoint of allocative efficiency, the Ramsey rule suggests that the deadweight loss is minimised (if not eliminated) when the rate of tax is inversely proportional to the price elasticity of demand for a good or service, given that all goods and services are subjected to the tax (Rosen and Gayer, 2014). This guideline emphasises the broad-basedness of the tax. It also implies that all goods with different price elasticities of demand should be taxed differently. This compromises the administrative efficiency of the tax, puts compliance at risk and makes enforcement potentially costly. That is why a single (universal) rate3 has been preferred as a second-best, pragmatic approach, thus reflecting a trade-off between allocative and technical or administrative efficiency. Bird and Gendron (2007), as reported in Keen (2009: 160-161) enhance the credibility of this view inter alia because they are non-IMF
3 Keen (2009: 161) states as follows about the single rate issue, namely that “the few empirical studies that have addressed the question firmly reject the weak separability condition of A.B. Atkinson and Joseph E. Stiglitz (1976) under which rate differentiation is unnecessary when — perhaps a reasonable first approximation for developed countries, though evidently not for developing countries — an optimal nonlinear wage tax can be deployed”.
© REDI3x3 3 www.REDI3x3.org
scholars of stature, and their view about VAT design is: “The tax should avoid zero-rating other than for exports, and have minimal exemptions, a single positive rate, a fairly high threshold (perhaps in the order of $100,000 per annum for many low income countries), rely on self-assessment (meaning that taxpayers declare and pay tax due, subject to audit and penalty) and structure the tax administration along functional or taxpayer-segment lines to accommodate the requirements of the VAT.”
In a sense the single-rate idea, while perhaps deviating from optimal tax rate design, does go some way towards addressing another complication with VAT, namely its equity implications. This arises from the fact that lower income people (households) spend a large part, if not all, of their income on basic foodstuffs and other necessities, with the result that, as a percentage of their total income or consumption, they pay more tax than people in higher income or expenditure categories. The VAT is therefore a regressive tax: the tax burden falls with rising income. In this sense the VAT, when viewed in isolation, adds to income inequality, but arguable less so than if Ramsey rule rates were to apply. Nonetheless, it still is perceived as a regressive and anti-poor tax.
3. Three approaches to imposing VAT
One of three approaches (or a combination) is indicated in an assessment of VAT from an efficiency, equity and poverty alleviation point of view, as described below.
(a) The regressiveness of a specific indirect tax such as VAT is softened, if not fully neutralised, by way of multiple tax rates, which could take the form of a standard rate and a lower rate for goods and services consumed relatively more intensively by lower income groups. A feature of a second rate below the standard rate is, in a sense, its implied paternalistic nature: the government decides which goods are best consumed by lower-income households. This approach is sometimes also accompanied by a third rate above the standard rate on luxury goods, which addresses equity but does not contribute to poverty relief. A “luxury” VAT rate not only adds further complexity to tax administration and compliance, but also encounters the difficulty of definition: for example, durable consumer goods such as mobile phones and television sets are heavily used (and bought) by low-income household as well.
(b) A somewhat wider approach is to consider the regressiveness of all indirect taxes, of which VAT is only one type. In this regard excise taxes are looked upon as a tax to compensate for the regressiveness of VAT, which enhances the possibility of a broad-based, single-rate VAT with the associated efficiency gains. By levying an excise tax on luxury items typically consumed by the rich or higher-income groups, a clear redistribution signal is given. Moreover, if the to-be-taxed products are carefully chosen, such a tax would arguably be applied to imported rather than domestic production – this is
© REDI3x3 4 www.REDI3x3.org
tantamount to an import tax, which will then have a small impact, if any, on local producers. This approach suffers from the same definitional problems as in (a) and because of the relatively high price elasticities of demand typically associated with these types of products, the distributional and revenue gains from such taxes are not likely to be very significant.
(c) An even wider approach focuses on the combination of tax and government expenditure. In other words, the total fiscal impact on households is at issue, rather than that of individual or all taxes. In general the consensus on VAT design in the international literature is to adopt a single tax rate and undertake fiscal redistribution via the expenditure side of the budget (see Keen (2012) and OECD (2012)).4 This approach typically assesses the combined impact of fiscal measures on the revenue and expenditure side of national and provincial budgets.
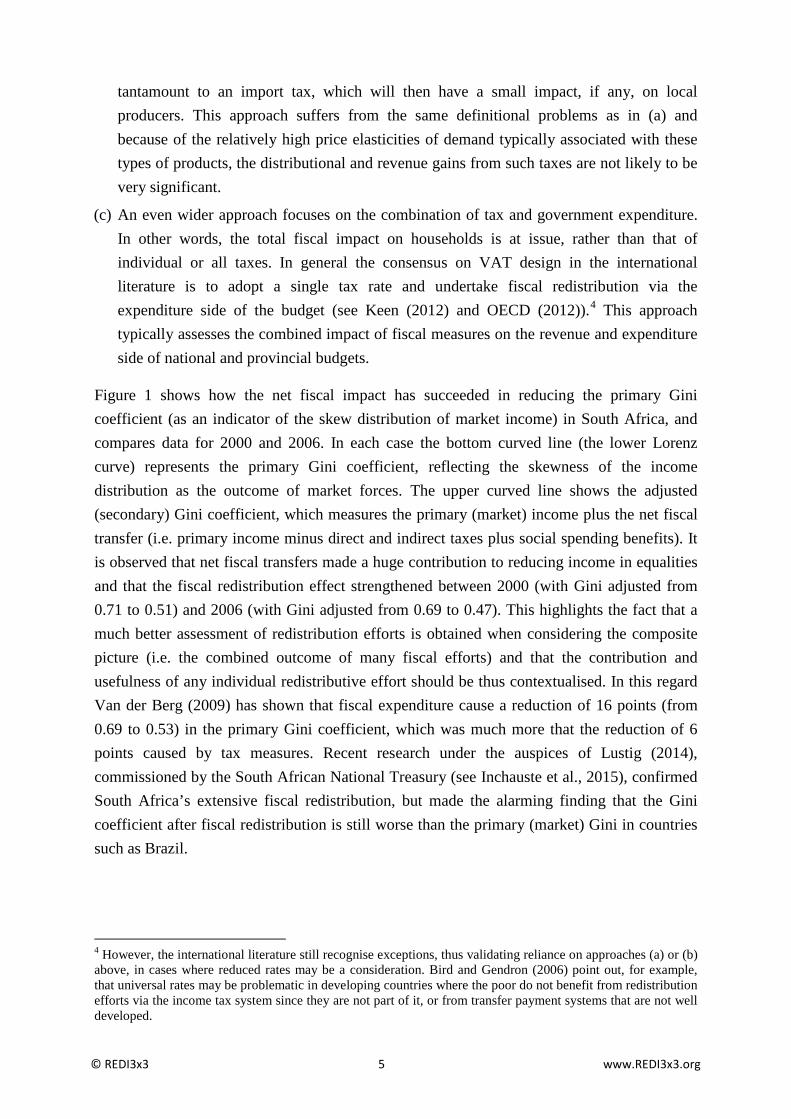
Figure 1 shows how the net fiscal impact has succeeded in reducing the primary Gini coefficient (as an indicator of the skew distribution of market income) in South Africa, and compares data for 2000 and 2006. In each case the bottom curved line (the lower Lorenz curve) represents the primary Gini coefficient, reflecting the skewness of the income distribution as the outcome of market forces. The upper curved line shows the adjusted (secondary) Gini coefficient, which measures the primary (market) income plus the net fiscal transfer (i.e. primary income minus direct and indirect taxes plus social spending benefits). It is observed that net fiscal transfers made a huge contribution to reducing income in equalities and that the fiscal redistribution effect strengthened between 2000 (with Gini adjusted from 0.71 to 0.51) and 2006 (with Gini adjusted from 0.69 to 0.47). This highlights the fact that a much better assessment of redistribution efforts is obtained when considering the composite picture (i.e. the combined outcome of many fiscal efforts) and that the contribution and usefulness of any individual redistributive effort should be thus contextualised. In this regard Van der Berg (2009) has shown that fiscal expenditure cause a reduction of 16 points (from 0.69 to 0.53) in the primary Gini coefficient, which was much more that the reduction of 6 points caused by tax measures. Recent research under the auspices of Lustig (2014), commissioned by the South African National Treasury (see Inchauste et al., 2015), confirmed South Africa’s extensive fiscal redistribution, but made the alarming finding that the Gini coefficient after fiscal redistribution is still worse than the primary (market) Gini in countries such as Brazil.
4 However, the international literature still recognise exceptions, thus validating reliance on approaches (a) or (b) above, in cases where reduced rates may be a consideration. Bird and Gendron (2006) point out, for example, that universal rates may be problematic in developing countries where the poor do not benefit from redistribution efforts via the income tax system since they are not part of it, or from transfer payment systems that are not well developed.
© REDI3x3 5 www.REDI3x3.org
Figure 1: Net impact of fiscal measures on income inequality in South Africa
2000 Panel (a)
2006 Panel (b)
Source: Van der Berg (2009: 23)
© REDI3x3 6 www.REDI3x3.org
Based on experiences elsewhere and with reference to the redistribution efforts and patterns in South Africa during the past twenty years, this paper explores the extent to which zero-rating has become a much less significant factor than when it was assessed as a lone-standing instrument and implemented to compensate for the regressiveness of VAT in the early 1990s.5
4. Assessing the impact of zero-rating in South Africa
To initiate our analysis of zero-rating, we analyse the spending patterns of households across the income distribution (in our case we use total consumption as the indicator variable as income data in surveys generally tend to be underreported and also generally a less accurate indicator of actual living standards). We use data from the Income and Expenditure Survey (IES) of 2010/11 released by Statistics South Africa. Although the majority of the data analyses rely on the IES 2010/11 survey, we do compare these results to analyses from an earlier survey, i.e. IES 2005/06. It is therefore important to comment on the comparability of these datasets over time. As indicated by Finn et al. (2014), four IESs have been conducted since 1994 (i.e. in 1995, 2000, 2005, and 2010). Focusing on the latter years' surveys, the methodologies employed to collect data in 2005 and 2010 were quite similar. Both surveys employed the dairy method6 to record expenditure by the household and applied the Classification of Individual Consumption According to Purpose (COICOP) (see Appendix B in Finn, et al. (2014: 42-51)), which make the two surveys comparable.
Table 1 shows the expenditure patterns by main consumption category for the different consumption deciles. Spending on food and non-alcoholic beverages, clothing and footwear, and housing, water, electricity, gas and other fuels, constitutes more than half of the expenditure of the bottom 5 deciles.
5 Bird and Gendron (2007), as reported in Keen (2009: 165), emphasise this: looking at the impact of any single tax, ignoring offsetting changes in other taxes and/or public spending, gives a false picture of overall distributional impacts, which is what really matters. 6 The earlier IES surveys used the recall method (where respondents had to remember their expenditure), and the Standard Trade Classification (STC) – see Appendix B in Finn et al. (2014: 42-51) for further details.
© REDI3x3 7 www.REDI3x3.org
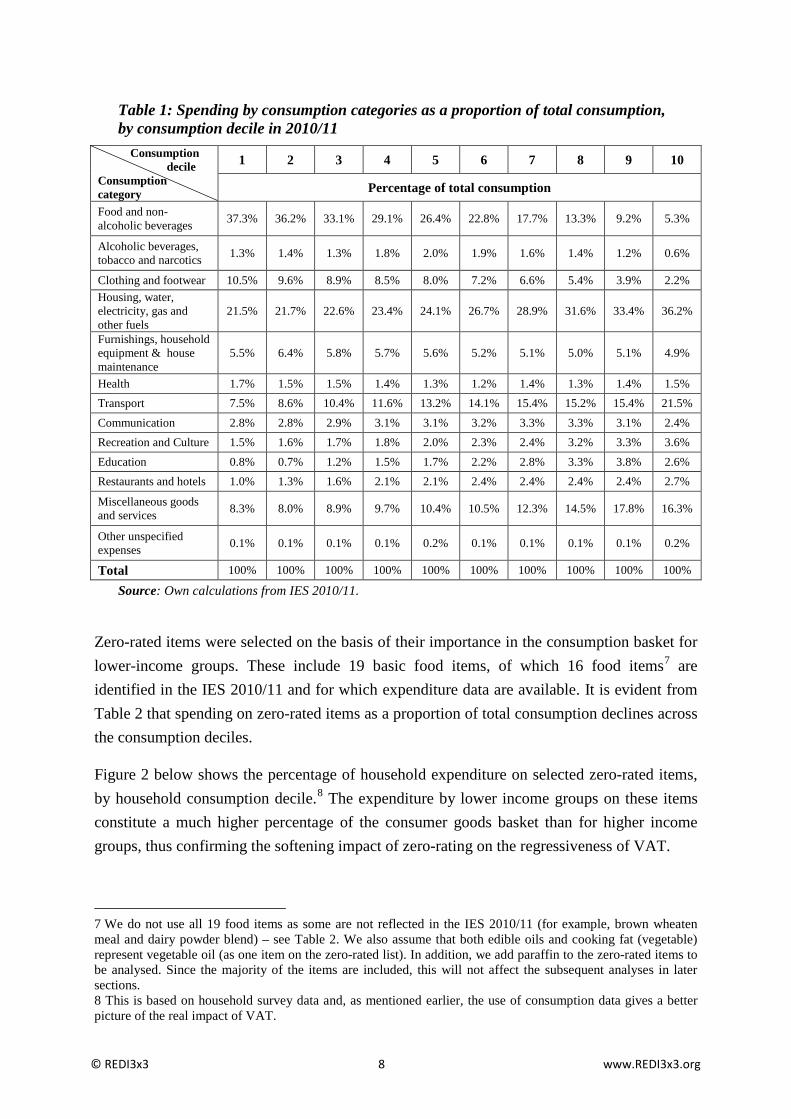
Table 1: Spending by consumption categories as a proportion of total consumption, by consumption decile in 2010/11
Source: Own calculations from IES 2010/11.
Zero-rated items were selected on the basis of their importance in the consumption basket for lower-income groups. These include 19 basic food items, of which 16 food items7 are identified in the IES 2010/11 and for which expenditure data are available. It is evident from Table 2 that spending on zero-rated items as a proportion of total consumption declines across the consumption deciles.
Figure 2 below shows the percentage of household expenditure on selected zero-rated items, by household consumption decile.8 The expenditure by lower income groups on these items constitute a much higher percentage of the consumer goods basket than for higher income groups, thus confirming the softening impact of zero-rating on the regressiveness of VAT.
7 We do not use all 19 food items as some are not reflected in the IES 2010/11 (for example, brown wheaten meal and dairy powder blend) – see Table 2. We also assume that both edible oils and cooking fat (vegetable) represent vegetable oil (as one item on the zero-rated list). In addition, we add paraffin to the zero-rated items to be analysed. Since the majority of the items are included, this will not affect the subsequent analyses in later sections. 8 This is based on household survey data and, as mentioned earlier, the use of consumption data gives a better picture of the real impact of VAT.
Consumption decile Consumption category
1 2 3 4 5 6 7 8 9 10
Percentage of total consumption Food and non-alcoholic beverages 37.3% 36.2% 33.1% 29.1% 26.4% 22.8% 17.7% 13.3% 9.2% 5.3%
Alcoholic beverages, tobacco and narcotics 1.3% 1.4% 1.3% 1.8% 2.0% 1.9% 1.6% 1.4% 1.2% 0.6%
Clothing and footwear 10.5% 9.6% 8.9% 8.5% 8.0% 7.2% 6.6% 5.4% 3.9% 2.2% Housing, water, electricity, gas and other fuels
21.5% 21.7% 22.6% 23.4% 24.1% 26.7% 28.9% 31.6% 33.4% 36.2%
Furnishings, household equipment & house maintenance
5.5% 6.4% 5.8% 5.7% 5.6% 5.2% 5.1% 5.0% 5.1% 4.9%
Health 1.7% 1.5% 1.5% 1.4% 1.3% 1.2% 1.4% 1.3% 1.4% 1.5% Transport 7.5% 8.6% 10.4% 11.6% 13.2% 14.1% 15.4% 15.2% 15.4% 21.5% Communication 2.8% 2.8% 2.9% 3.1% 3.1% 3.2% 3.3% 3.3% 3.1% 2.4% Recreation and Culture 1.5% 1.6% 1.7% 1.8% 2.0% 2.3% 2.4% 3.2% 3.3% 3.6% Education 0.8% 0.7% 1.2% 1.5% 1.7% 2.2% 2.8% 3.3% 3.8% 2.6% Restaurants and hotels 1.0% 1.3% 1.6% 2.1% 2.1% 2.4% 2.4% 2.4% 2.4% 2.7%
Miscellaneous goods and services 8.3% 8.0% 8.9% 9.7% 10.4% 10.5% 12.3% 14.5% 17.8% 16.3%
Other unspecified expenses 0.1% 0.1% 0.1% 0.1% 0.2% 0.1% 0.1% 0.1% 0.1% 0.2%
Total 100% 100% 100% 100% 100% 100% 100% 100% 100% 100%
© REDI3x3 8 www.REDI3x3.org
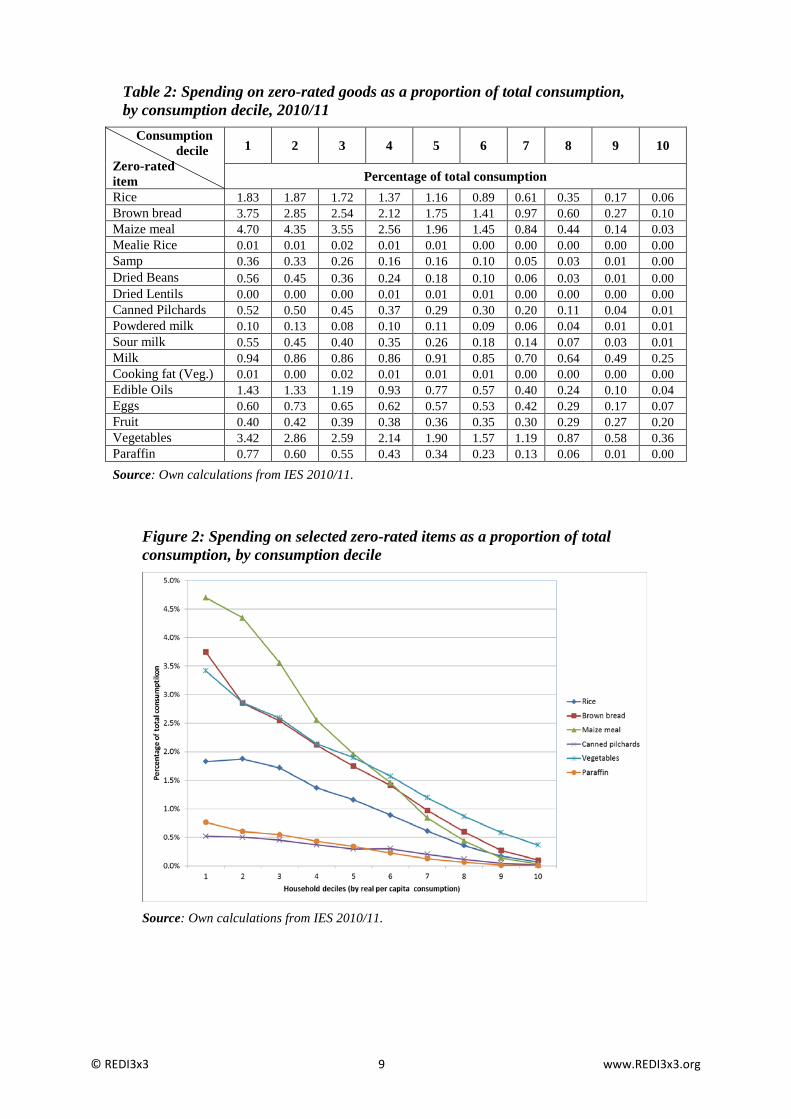
Table 2: Spending on zero-rated goods as a proportion of total consumption, by consumption decile, 2010/11
Figure 2: Spending on selected zero-rated items as a proportion of total consumption, by consumption decile
Source: Own calculations from IES 2010/11.
Consumption decile Zero-rated item
1 2 3 4 5 6 7 8 9 10
Percentage of total consumption Rice 1.83 1.87 1.72 1.37 1.16 0.89 0.61 0.35 0.17 0.06 Brown bread 3.75 2.85 2.54 2.12 1.75 1.41 0.97 0.60 0.27 0.10 Maize meal 4.70 4.35 3.55 2.56 1.96 1.45 0.84 0.44 0.14 0.03 Mealie Rice 0.01 0.01 0.02 0.01 0.01 0.00 0.00 0.00 0.00 0.00 Samp 0.36 0.33 0.26 0.16 0.16 0.10 0.05 0.03 0.01 0.00 Dried Beans 0.56 0.45 0.36 0.24 0.18 0.10 0.06 0.03 0.01 0.00 Dried Lentils 0.00 0.00 0.00 0.01 0.01 0.01 0.00 0.00 0.00 0.00 Canned Pilchards 0.52 0.50 0.45 0.37 0.29 0.30 0.20 0.11 0.04 0.01 Powdered milk 0.10 0.13 0.08 0.10 0.11 0.09 0.06 0.04 0.01 0.01 Sour milk 0.55 0.45 0.40 0.35 0.26 0.18 0.14 0.07 0.03 0.01 Milk 0.94 0.86 0.86 0.86 0.91 0.85 0.70 0.64 0.49 0.25 Cooking fat (Veg.) 0.01 0.00 0.02 0.01 0.01 0.01 0.00 0.00 0.00 0.00 Edible Oils 1.43 1.33 1.19 0.93 0.77 0.57 0.40 0.24 0.10 0.04 Eggs 0.60 0.73 0.65 0.62 0.57 0.53 0.42 0.29 0.17 0.07 Fruit 0.40 0.42 0.39 0.38 0.36 0.35 0.30 0.29 0.27 0.20 Vegetables 3.42 2.86 2.59 2.14 1.90 1.57 1.19 0.87 0.58 0.36 Paraffin 0.77 0.60 0.55 0.43 0.34 0.23 0.13 0.06 0.01 0.00 Source: Own calculations from IES 2010/11.
© REDI3x3 9 www.REDI3x3.org
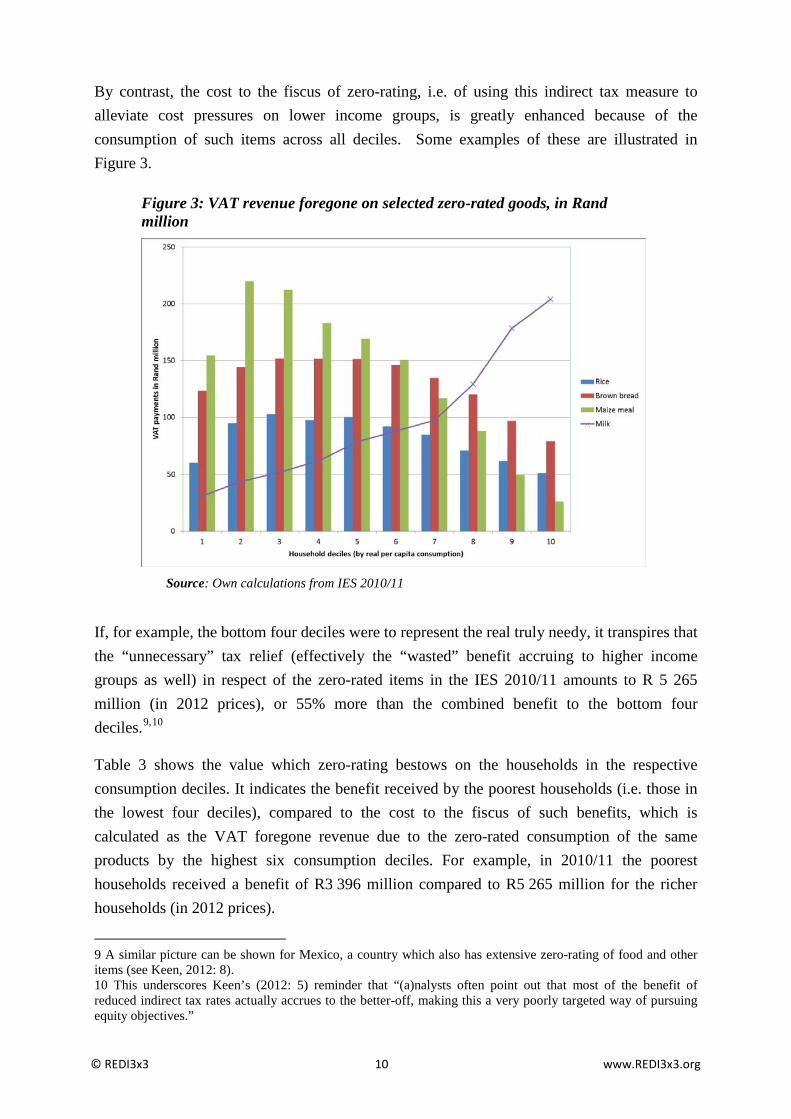
By contrast, the cost to the fiscus of zero-rating, i.e. of using this indirect tax measure to alleviate cost pressures on lower income groups, is greatly enhanced because of the consumption of such items across all deciles. Some examples of these are illustrated in Figure 3.
Figure 3: VAT revenue foregone on selected zero-rated goods, in Rand million
Source: Own calculations from IES 2010/11
If, for example, the bottom four deciles were to represent the real truly needy, it transpires that the “unnecessary” tax relief (effectively the “wasted” benefit accruing to higher income groups as well) in respect of the zero-rated items in the IES 2010/11 amounts to R 5 265 million (in 2012 prices), or 55% more than the combined benefit to the bottom four deciles.9,10
Table 3 shows the value which zero-rating bestows on the households in the respective consumption deciles. It indicates the benefit received by the poorest households (i.e. those in the lowest four deciles), compared to the cost to the fiscus of such benefits, which is calculated as the VAT foregone revenue due to the zero-rated consumption of the same products by the highest six consumption deciles. For example, in 2010/11 the poorest households received a benefit of R3 396 million compared to R5 265 million for the richer households (in 2012 prices).
9 A similar picture can be shown for Mexico, a country which also has extensive zero-rating of food and other items (see Keen, 2012: 8). 10 This underscores Keen’s (2012: 5) reminder that “(a)nalysts often point out that most of the benefit of reduced indirect tax rates actually accrues to the better-off, making this a very poorly targeted way of pursuing equity objectives.”
© REDI3x3 10 www.REDI3x3.org
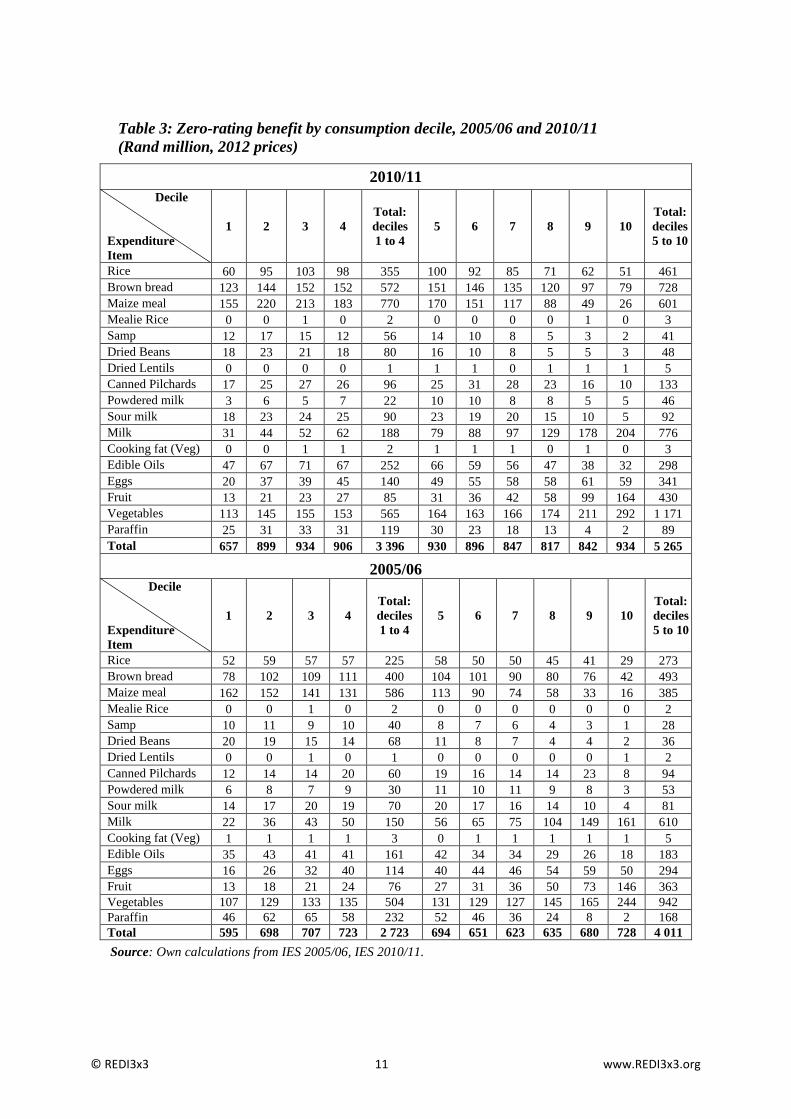
Table 3: Zero-rating benefit by consumption decile, 2005/06 and 2010/11 (Rand million, 2012 prices)
2010/11 Decile
Expenditure Item
1 2 3 4 Total: deciles 1 to 4
5 6 7 8 9 10 Total: deciles 5 to 10
Rice 60 95 103 98 355 100 92 85 71 62 51 461 Brown bread 123 144 152 152 572 151 146 135 120 97 79 728 Maize meal 155 220 213 183 770 170 151 117 88 49 26 601 Mealie Rice 0 0 1 0 2 0 0 0 0 1 0 3 Samp 12 17 15 12 56 14 10 8 5 3 2 41 Dried Beans 18 23 21 18 80 16 10 8 5 5 3 48 Dried Lentils 0 0 0 0 1 1 1 0 1 1 1 5 Canned Pilchards 17 25 27 26 96 25 31 28 23 16 10 133 Powdered milk 3 6 5 7 22 10 10 8 8 5 5 46 Sour milk 18 23 24 25 90 23 19 20 15 10 5 92 Milk 31 44 52 62 188 79 88 97 129 178 204 776 Cooking fat (Veg) 0 0 1 1 2 1 1 1 0 1 0 3 Edible Oils 47 67 71 67 252 66 59 56 47 38 32 298 Eggs 20 37 39 45 140 49 55 58 58 61 59 341 Fruit 13 21 23 27 85 31 36 42 58 99 164 430 Vegetables 113 145 155 153 565 164 163 166 174 211 292 1 171 Paraffin 25 31 33 31 119 30 23 18 13 4 2 89 Total 657 899 934 906 3 396 930 896 847 817 842 934 5 265
2005/06 Decile Expenditure Item
1 2 3 4 Total: deciles 1 to 4
5 6 7 8 9 10 Total: deciles 5 to 10
Rice 52 59 57 57 225 58 50 50 45 41 29 273 Brown bread 78 102 109 111 400 104 101 90 80 76 42 493 Maize meal 162 152 141 131 586 113 90 74 58 33 16 385 Mealie Rice 0 0 1 0 2 0 0 0 0 0 0 2 Samp 10 11 9 10 40 8 7 6 4 3 1 28 Dried Beans 20 19 15 14 68 11 8 7 4 4 2 36 Dried Lentils 0 0 1 0 1 0 0 0 0 0 1 2 Canned Pilchards 12 14 14 20 60 19 16 14 14 23 8 94 Powdered milk 6 8 7 9 30 11 10 11 9 8 3 53 Sour milk 14 17 20 19 70 20 17 16 14 10 4 81 Milk 22 36 43 50 150 56 65 75 104 149 161 610 Cooking fat (Veg) 1 1 1 1 3 0 1 1 1 1 1 5 Edible Oils 35 43 41 41 161 42 34 34 29 26 18 183 Eggs 16 26 32 40 114 40 44 46 54 59 50 294 Fruit 13 18 21 24 76 27 31 36 50 73 146 363 Vegetables 107 129 133 135 504 131 129 127 145 165 244 942 Paraffin 46 62 65 58 232 52 46 36 24 8 2 168 Total 595 698 707 723 2 723 694 651 623 635 680 728 4 011 Source: Own calculations from IES 2005/06, IES 2010/11.
© REDI3x3 11 www.REDI3x3.org
Because of the across-the board consumption of zero-rated products, zero-rating has more value as an anti-poverty instrument than an inequality-reducing instrument. In this regard, Keen (2012: 7) observes that “…the amount of redistribution that can be achieved by differentiating rates of indirect taxation will generally be quite limited … because variation in the share of income spent on particular goods is generally just not great enough to make this an effective way to distinguish between poor and rich.” The incidence of zero-rating thus raises the question whether there are more cost-efficient ways of alleviating the plight of lower income groups. To the extent that this is so and that the past twenty years have witnessed substantial progress in this regard in South Africa, it begs another question: does it make sense to continue with a less cost efficient measure? However difficult the political economy of such a question might be, the question is valid and justified from the point view of efficiency and equity.
The balanced-budget approach to tax analysis means that any tax relief in the form of zero-rating has to be compensated for by other taxes, which obviously will have different distributional features. This means that the tax system as it stands today reflects a set of taxes and distributional effects which came about when certain goods were zero-rated as many as 20 years ago. This means that, should zero-rating be removed or reduced, the impact on the economy goes much further than that of the removal because a new set of distributional relations will be effected. Their nature will depend on how the extra revenue is used.
One possibility could be to use the extra tax revenue from a 14% VAT on formerly zero-rated goods consumed by the lowest income/consumption deciles to finance a new or extend an existing income support programme by the same amount. To the extent that the delivery cost is less than the tax yield in respect of the higher income/consumption deciles, there will be a net revenue gain for the government, to be allocated in line with other fiscal priorities. In the hand of skilled politicians and technocrats, such a scenario might be feasible from a political economy as well. Tables 4 and 6 contain estimates of the revenue, cost and net fiscal gain. Obviously, a key question will be whether zero-rating can be replaced by a program that reaches the same beneficiaries. We return to this question later (Section 8).
It has to be noted that the data discussed so far in Figures 2 and 3 do not take into account the impact of exemption from VAT on low-income groups in society. Because small businesses are exempted from registration as vendors, they cannot claim input credits for VAT paid on supplies and therefore fall outside the built-in monitoring of price behaviour of South Africa’s invoice-VAT system.11 This also enables – or possibly even incentivises - such businesses to add higher profit margins on which no VAT is paid or even misleadingly disguised as reflection of VAT payments, a practice which is quite easy in less sophisticated societies and in rural areas where competition might not be an effective discipline on retail prices. The increase in consumer prices under a VAT system with this type of retail exemption, therefore,
11 The impact of VAT exemption of course goes much further. Wherever a supplier is exempted in the production chain, no credit can be claimed for VAT on intermediate inputs at that point and any subsequent VAT thus results in a tax cascading effect (see Keen, 2012: 6).
© REDI3x3 12 www.REDI3x3.org
is not limited only to what accrues to the fiscus in the form of tax revenue.12 In the absence of reliable data, these effects are not easily quantified and exposed. In the final analysis, VAT exemption of small businesses represents a trade-off in favour of reduced compliance cost for SMEs up to a threshold of business size.13
There are further considerations when assessing the effectiveness and importance of zero-rating in the broader context of poverty alleviation and income inequality. One such consideration is the relative contribution of zero-rating over time, compared to other forms of assistance – as indicated by approach (c) outlined earlier. This remains an issue of debate and raises a fundamental question posed by Keen (2012: 5) as follows: “How well targeted do public spending measures have to be for the poor to be best served not by taxing at a particularly low or zero rate those commodities that account for an especially large part of their budget, but by taxing them and using the proceeds to increase that public spending?” We will return to this question in Section 8.
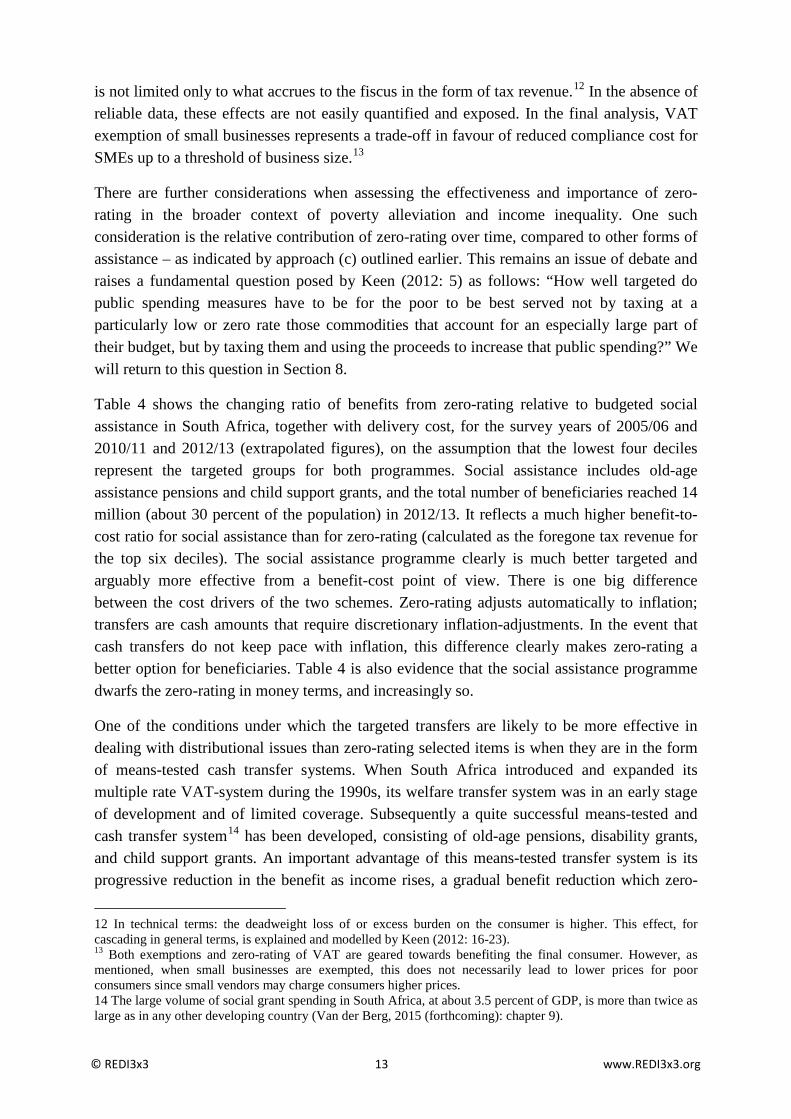
Table 4 shows the changing ratio of benefits from zero-rating relative to budgeted social assistance in South Africa, together with delivery cost, for the survey years of 2005/06 and 2010/11 and 2012/13 (extrapolated figures), on the assumption that the lowest four deciles represent the targeted groups for both programmes. Social assistance includes old-age assistance pensions and child support grants, and the total number of beneficiaries reached 14 million (about 30 percent of the population) in 2012/13. It reflects a much higher benefit-to-cost ratio for social assistance than for zero-rating (calculated as the foregone tax revenue for the top six deciles). The social assistance programme clearly is much better targeted and arguably more effective from a benefit-cost point of view. There is one big difference between the cost drivers of the two schemes. Zero-rating adjusts automatically to inflation; transfers are cash amounts that require discretionary inflation-adjustments. In the event that cash transfers do not keep pace with inflation, this difference clearly makes zero-rating a better option for beneficiaries. Table 4 is also evidence that the social assistance programme dwarfs the zero-rating in money terms, and increasingly so.
One of the conditions under which the targeted transfers are likely to be more effective in dealing with distributional issues than zero-rating selected items is when they are in the form of means-tested cash transfer systems. When South Africa introduced and expanded its multiple rate VAT-system during the 1990s, its welfare transfer system was in an early stage of development and of limited coverage. Subsequently a quite successful means-tested and cash transfer system14 has been developed, consisting of old-age pensions, disability grants, and child support grants. An important advantage of this means-tested transfer system is its progressive reduction in the benefit as income rises, a gradual benefit reduction which zero-
12 In technical terms: the deadweight loss of or excess burden on the consumer is higher. This effect, for cascading in general terms, is explained and modelled by Keen (2012: 16-23). 13 Both exemptions and zero-rating of VAT are geared towards benefiting the final consumer. However, as mentioned, when small businesses are exempted, this does not necessarily lead to lower prices for poor consumers since small vendors may charge consumers higher prices. 14 The large volume of social grant spending in South Africa, at about 3.5 percent of GDP, is more than twice as large as in any other developing country (Van der Berg, 2015 (forthcoming): chapter 9).
© REDI3x3 13 www.REDI3x3.org
rating lacks. It might, of course, be argued that targeted expenditure is subject to benefit shifting in the sense that the de facto beneficiary is not the same as the de jure beneficiary. The same phenomenon characterises tax benefit incidence, however. South Africa’s progress with poverty relief systems since the early 1990s has therefore diminished the importance and usefulness of and consequently the need for zero-rating, although the removal of such tax benefits, however small relative to other social security benefits, remains a thorny issue.
Table 4: Comparison of benefit and cost of social assistance programmes and zero-rating of VAT
Rand million (2012 prices)
2005/6 2010/11 2012/13 Social Assistance Total benefit (old age pension and child support grant) 49 990 72 115 78 563
Total cost* (administration of all social assistance) 4 948 5 824 5 782
Ratio: Benefit to Cost 10 12 14
Number of beneficiaries (old age pension and child support grant) 9 189 018 12 800 367 14 000 000 Average Benefit (old age pension and child support grant) 0.0054 0.0056 0.0056 Average Cost (administration of all social assistance) 0.00045 0.00040 0.00036
Ratio: Benefit to Cost 12 14 16
Value Added Tax Total benefit (of zero-rating to poorest 4 deciles) 2 723 3 396 **3 566 Total cost (benefit of zero-rating to richest 6 deciles) 4 011 5 265 **5 528
Ratio: Benefit to Cost 0.68 0.65 0.65
Total number of weighted households 12 447 012 13 099 569 ***13 230 565 Number of households in poorest 4 deciles 4 979 278 5 239 632 ****5 292 226 Number of households in richest 6 deciles 7 467 734 7 859 937 7 938 339 Average benefit (of zero-rating to poorest 4 deciles) 0.00055 0.00065 0.00067 Average Cost (benefit of zero-rating to richest 6 deciles) 0.00054 0.00067 0.00070
Ratio: Benefit to Cost 1.02 0.97 0.96 Notes: * The table contains the total administrative cost of programme 5 of the National Department of Social Development for the South African Social Security Agency. ** We assume a 5% increase in the total VAT benefit and cost. ***We assume the 1% average annual increase between 2005 and 2010, to also apply from 2010/11 to 2012/13. **** We assume that 40% of the total number of households will be in deciles 1 to 4. This is based on the average proportion of the two surveys. Source: Own calculations from IES 2005/06, IES 2010/11 and National Treasury, 2009 and 2014.
© REDI3x3 14 www.REDI3x3.org
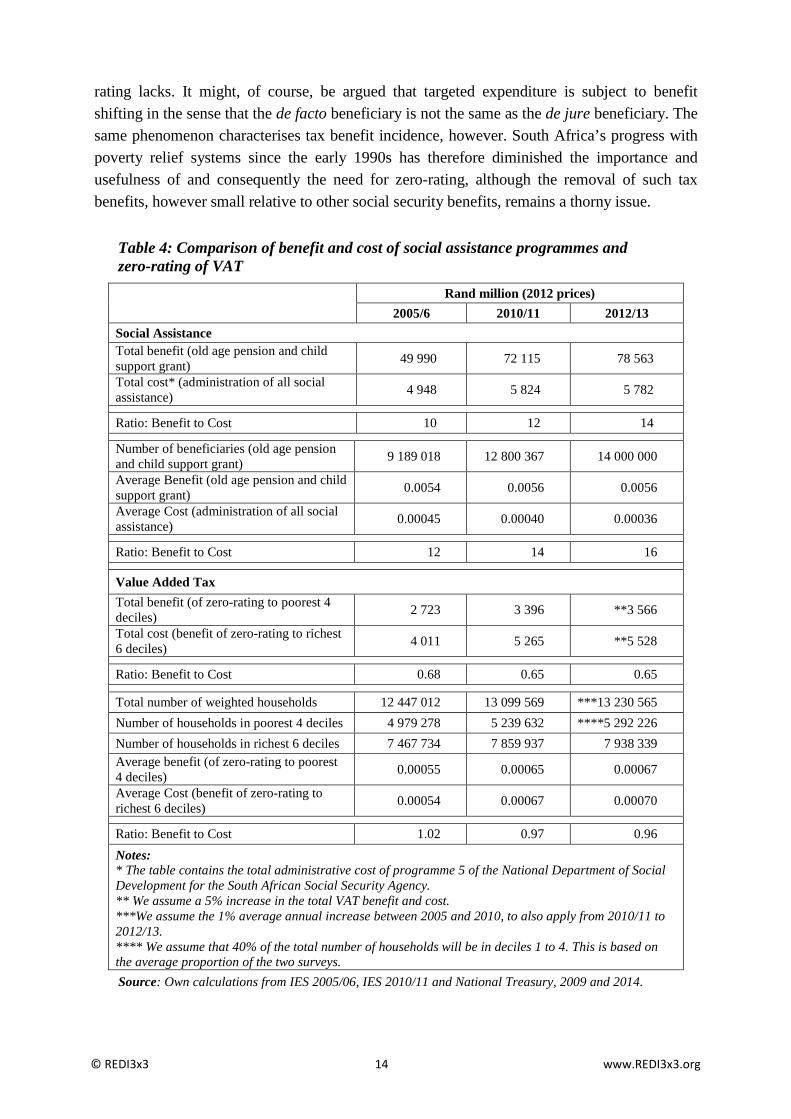
The question is whether the above relatively reduced reliance on indirect tax relief is also characteristic of international trends. Table 5 gives a summary of the international experience, showing that over time an increased percentage of new VAT regimes have carried a single rate at introduction.
Table 5: International VAT regimes with a single rate at time of introduction
Period Number of new VATs Percentage with a single rate at introduction
Before 1990 48 25 1990–1999 75 71 1999–2011 31 81 Source: IMF, as quoted by Keen (2012: 7)
Anecdotal case-study evidence of country developments about trends in the structure of VAT in developing countries is also relevant to this analysis. India is an example of distributional choice. In the face of equity considerations, their Empowered Committee of State Finance Ministers suggested a standard VAT15 rate of 20 percent (state and federal VATs combined) in 2009 and a reduced rate of 12 percent on necessities, but converging to 16 percent within three years (Keen, 2012: 5) – thus signalling an envisaged reduced reliance for equity purposes on multiple VAT rates. Even so, zero-rating (and thus approach (a) in Section 3 above) remains an attractive pragmatic choice, which depends on the availability of alternative redistributive instruments. In this regard, Keen (2009: 166) reports both Bird and Gendron (2007) and Ebrill et al. (2001) as stating that the case for differential rates of commodity taxation is stronger in developing countries than elsewhere, given the lesser availability of other instruments to address distributional concerns.16
The above discussion leads us to a few further questions, as indicated in the beginning, which we now address.
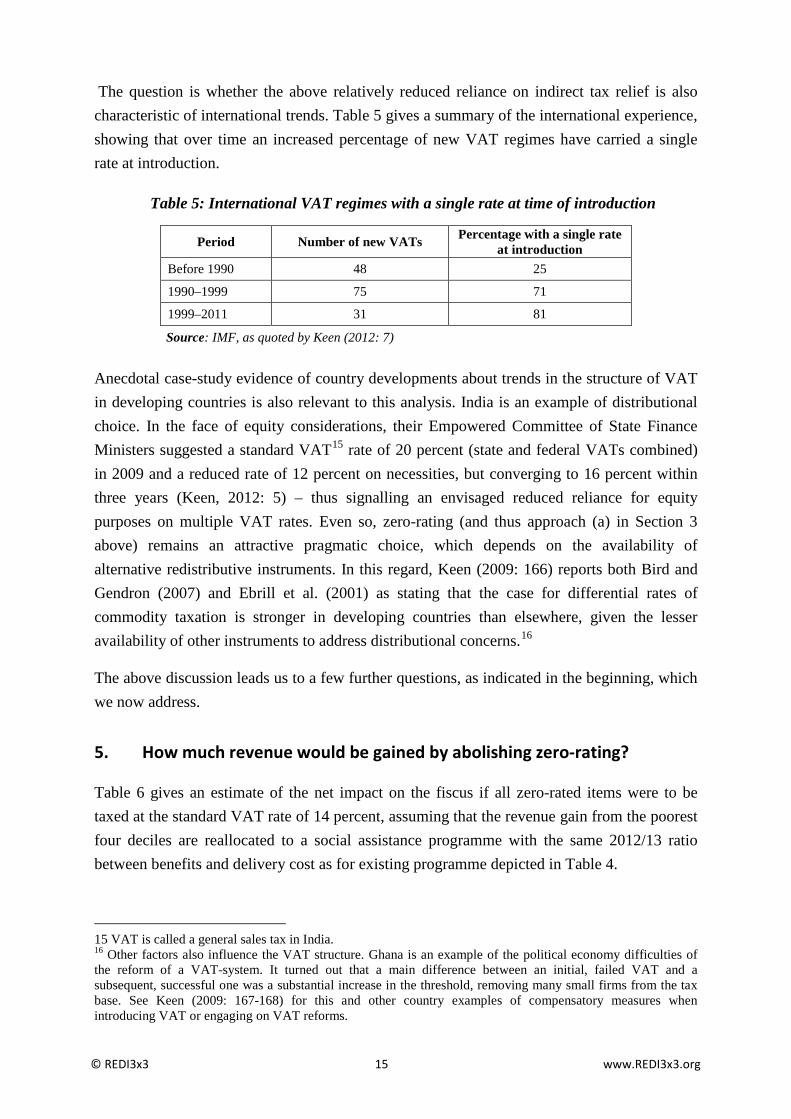
5. How much revenue would be gained by abolishing zero-rating?
Table 6 gives an estimate of the net impact on the fiscus if all zero-rated items were to be taxed at the standard VAT rate of 14 percent, assuming that the revenue gain from the poorest four deciles are reallocated to a social assistance programme with the same 2012/13 ratio between benefits and delivery cost as for existing programme depicted in Table 4.
15 VAT is called a general sales tax in India. 16 Other factors also influence the VAT structure. Ghana is an example of the political economy difficulties of the reform of a VAT-system. It turned out that a main difference between an initial, failed VAT and a subsequent, successful one was a substantial increase in the threshold, removing many small firms from the tax base. See Keen (2009: 167-168) for this and other country examples of compensatory measures when introducing VAT or engaging on VAT reforms.
© REDI3x3 15 www.REDI3x3.org
A reallocation of government funds as implied by the calculation in Table 6 will plug a huge leakage in the indirect tax system, thus adding to tax efficiency. Provided the compensatory social assistance is implemented efficiently and well-targeted, the end result will also be superior to zero-rating17 as regards income inequality, but without sacrificing poverty relief.
Table 6: Estimate of the net revenue gain for the fiscus of replacing zero-rating with target social assistance
2012/13
(R million in 2012 prices) Revenue gain if all zero-ratings abolished 9 094 Minimum cost of reallocating recouped revenue to social assistance programme 3 566 Minimum delivery cost of added assistance programme (same ratio as existing programme) 570.6
Net direct gain to fiscus 4 957 Source: Authors’ calculations from data in Table 4.
There are of course a number of variations on the themes suggested by the three approaches outlined at the beginning of this paper. The next few sections explore them with reference to the remaining questions posed in the introduction.
6. Partial removal of zero-rating
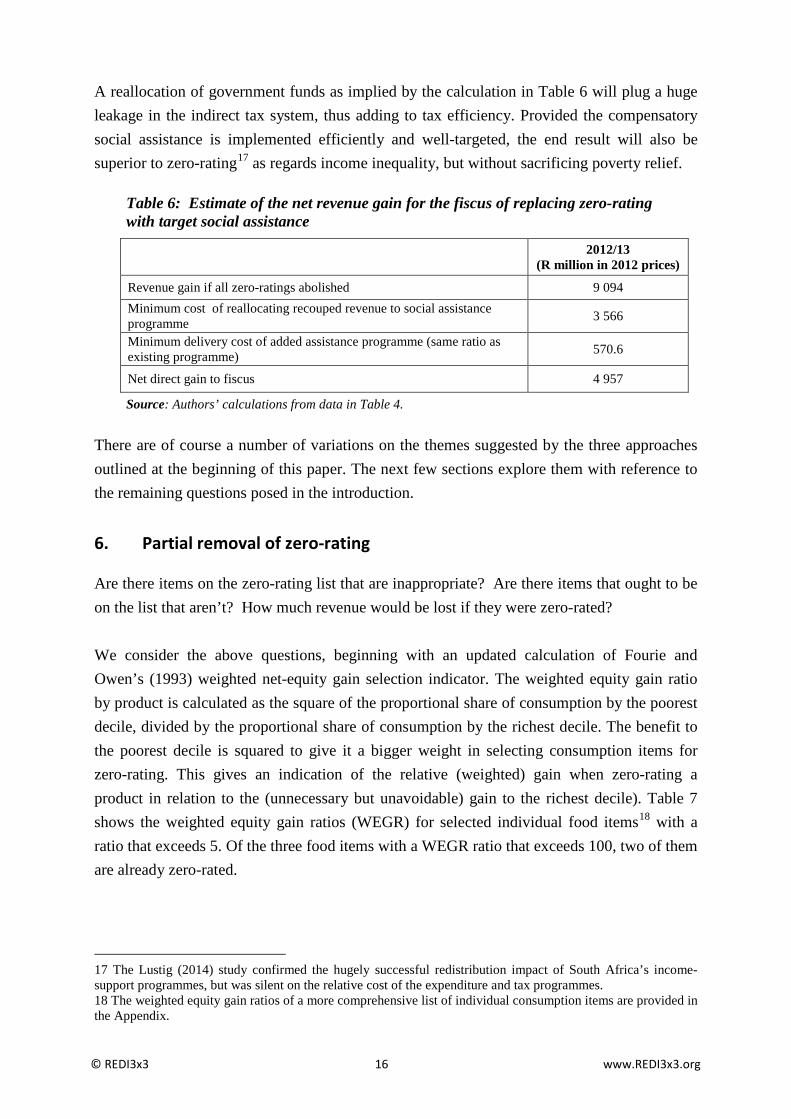
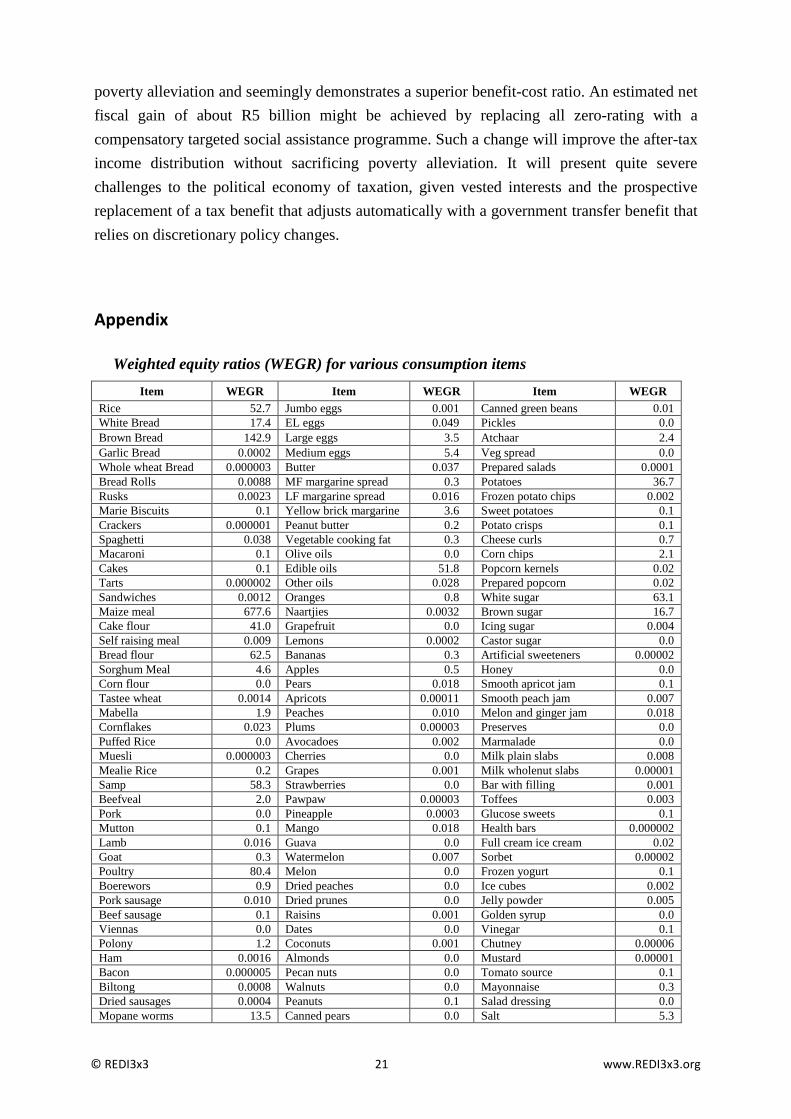
Are there items on the zero-rating list that are inappropriate? Are there items that ought to be on the list that aren’t? How much revenue would be lost if they were zero-rated? We consider the above questions, beginning with an updated calculation of Fourie and Owen’s (1993) weighted net-equity gain selection indicator. The weighted equity gain ratio by product is calculated as the square of the proportional share of consumption by the poorest decile, divided by the proportional share of consumption by the richest decile. The benefit to the poorest decile is squared to give it a bigger weight in selecting consumption items for zero-rating. This gives an indication of the relative (weighted) gain when zero-rating a product in relation to the (unnecessary but unavoidable) gain to the richest decile). Table 7 shows the weighted equity gain ratios (WEGR) for selected individual food items18 with a ratio that exceeds 5. Of the three food items with a WEGR ratio that exceeds 100, two of them are already zero-rated.
17 The Lustig (2014) study confirmed the hugely successful redistribution impact of South Africa’s income-support programmes, but was silent on the relative cost of the expenditure and tax programmes. 18 The weighted equity gain ratios of a more comprehensive list of individual consumption items are provided in the Appendix.
© REDI3x3 16 www.REDI3x3.org
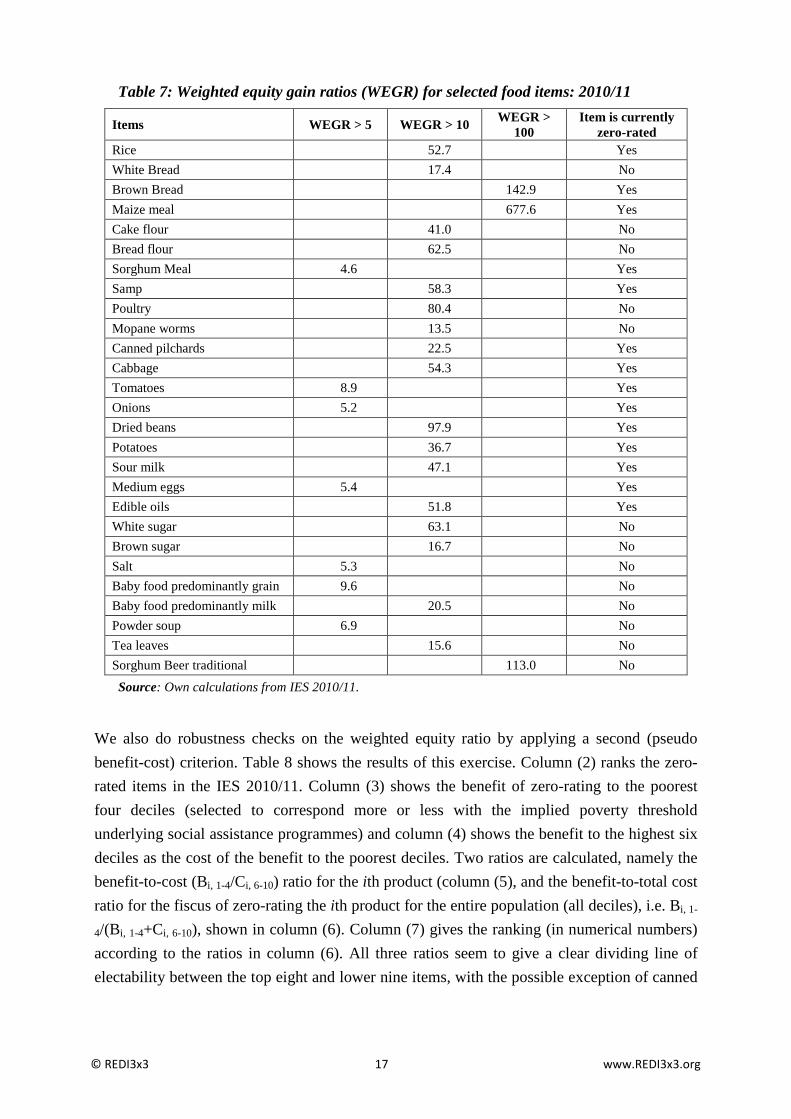
Table 7: Weighted equity gain ratios (WEGR) for selected food items: 2010/11
Source: Own calculations from IES 2010/11.
We also do robustness checks on the weighted equity ratio by applying a second (pseudo benefit-cost) criterion. Table 8 shows the results of this exercise. Column (2) ranks the zero-rated items in the IES 2010/11. Column (3) shows the benefit of zero-rating to the poorest four deciles (selected to correspond more or less with the implied poverty threshold underlying social assistance programmes) and column (4) shows the benefit to the highest six deciles as the cost of the benefit to the poorest deciles. Two ratios are calculated, namely the benefit-to-cost (Bi, 1-4/Ci, 6-10) ratio for the ith product (column (5), and the benefit-to-total cost ratio for the fiscus of zero-rating the ith product for the entire population (all deciles), i.e. Bi, 1-
4/(Bi, 1-4+Ci, 6-10), shown in column (6). Column (7) gives the ranking (in numerical numbers) according to the ratios in column (6). All three ratios seem to give a clear dividing line of electability between the top eight and lower nine items, with the possible exception of canned
Items WEGR > 5 WEGR > 10 WEGR > 100
Item is currently zero-rated
Rice 52.7 Yes White Bread 17.4 No Brown Bread 142.9 Yes Maize meal 677.6 Yes Cake flour 41.0 No Bread flour 62.5 No Sorghum Meal 4.6 Yes Samp 58.3 Yes Poultry 80.4 No Mopane worms 13.5 No Canned pilchards 22.5 Yes Cabbage 54.3 Yes Tomatoes 8.9 Yes Onions 5.2 Yes Dried beans 97.9 Yes Potatoes 36.7 Yes Sour milk 47.1 Yes Medium eggs 5.4 Yes Edible oils 51.8 Yes White sugar 63.1 No Brown sugar 16.7 No Salt 5.3 No Baby food predominantly grain 9.6 No Baby food predominantly milk 20.5 No Powder soup 6.9 No Tea leaves 15.6 No Sorghum Beer traditional 113.0 No
© REDI3x3 17 www.REDI3x3.org
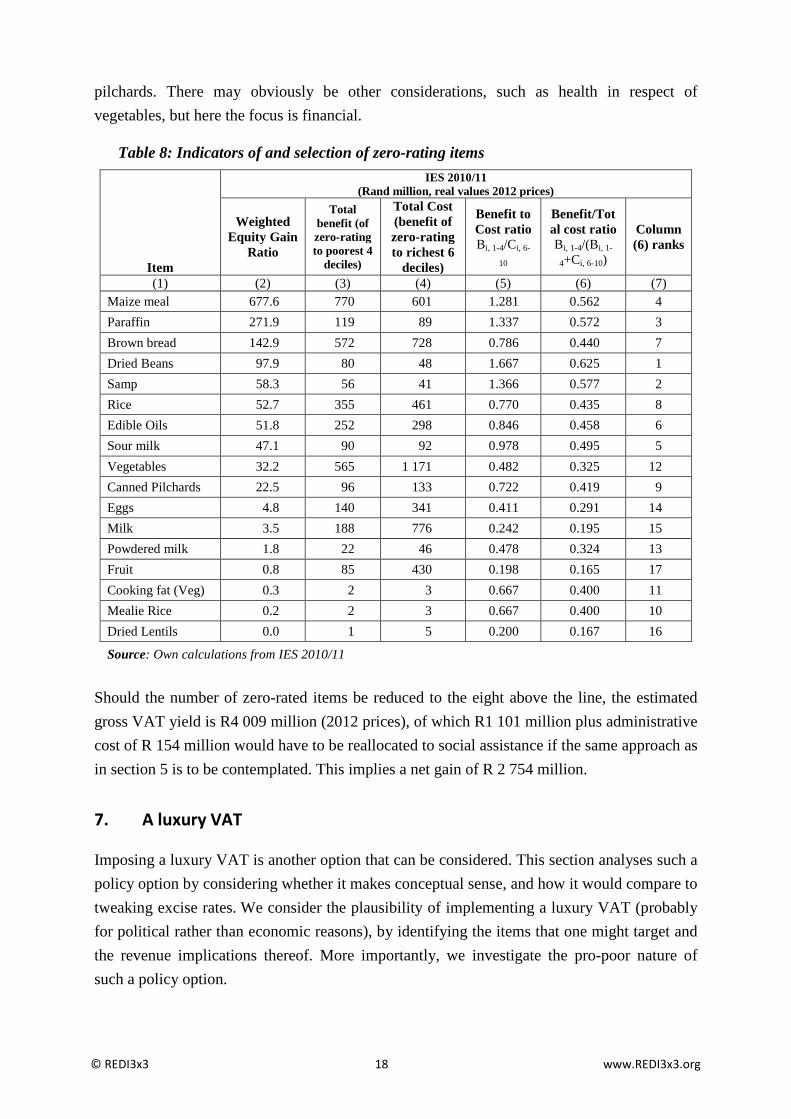
pilchards. There may obviously be other considerations, such as health in respect of vegetables, but here the focus is financial.
Table 8: Indicators of and selection of zero-rating items
Should the number of zero-rated items be reduced to the eight above the line, the estimated gross VAT yield is R4 009 million (2012 prices), of which R1 101 million plus administrative cost of R 154 million would have to be reallocated to social assistance if the same approach as in section 5 is to be contemplated. This implies a net gain of R 2 754 million.
7. A luxury VAT
Imposing a luxury VAT is another option that can be considered. This section analyses such a policy option by considering whether it makes conceptual sense, and how it would compare to tweaking excise rates. We consider the plausibility of implementing a luxury VAT (probably for political rather than economic reasons), by identifying the items that one might target and the revenue implications thereof. More importantly, we investigate the pro-poor nature of such a policy option.
Item
IES 2010/11 (Rand million, real values 2012 prices)
Weighted Equity Gain
Ratio
Total benefit (of zero-rating to poorest 4
deciles)
Total Cost (benefit of zero-rating to richest 6
deciles)
Benefit to Cost ratio Bi, 1-4/Ci, 6-
10
Benefit/Total cost ratio Bi, 1-4/(Bi, 1-
4+Ci, 6-10)
Column (6) ranks
(1) (2) (3) (4) (5) (6) (7) Maize meal 677.6 770 601 1.281 0.562 4 Paraffin 271.9 119 89 1.337 0.572 3 Brown bread 142.9 572 728 0.786 0.440 7 Dried Beans 97.9 80 48 1.667 0.625 1 Samp 58.3 56 41 1.366 0.577 2 Rice 52.7 355 461 0.770 0.435 8 Edible Oils 51.8 252 298 0.846 0.458 6 Sour milk 47.1 90 92 0.978 0.495 5 Vegetables 32.2 565 1 171 0.482 0.325 12 Canned Pilchards 22.5 96 133 0.722 0.419 9 Eggs 4.8 140 341 0.411 0.291 14 Milk 3.5 188 776 0.242 0.195 15 Powdered milk 1.8 22 46 0.478 0.324 13 Fruit 0.8 85 430 0.198 0.165 17 Cooking fat (Veg) 0.3 2 3 0.667 0.400 11 Mealie Rice 0.2 2 3 0.667 0.400 10 Dried Lentils 0.0 1 5 0.200 0.167 16 Source: Own calculations from IES 2010/11
© REDI3x3 18 www.REDI3x3.org
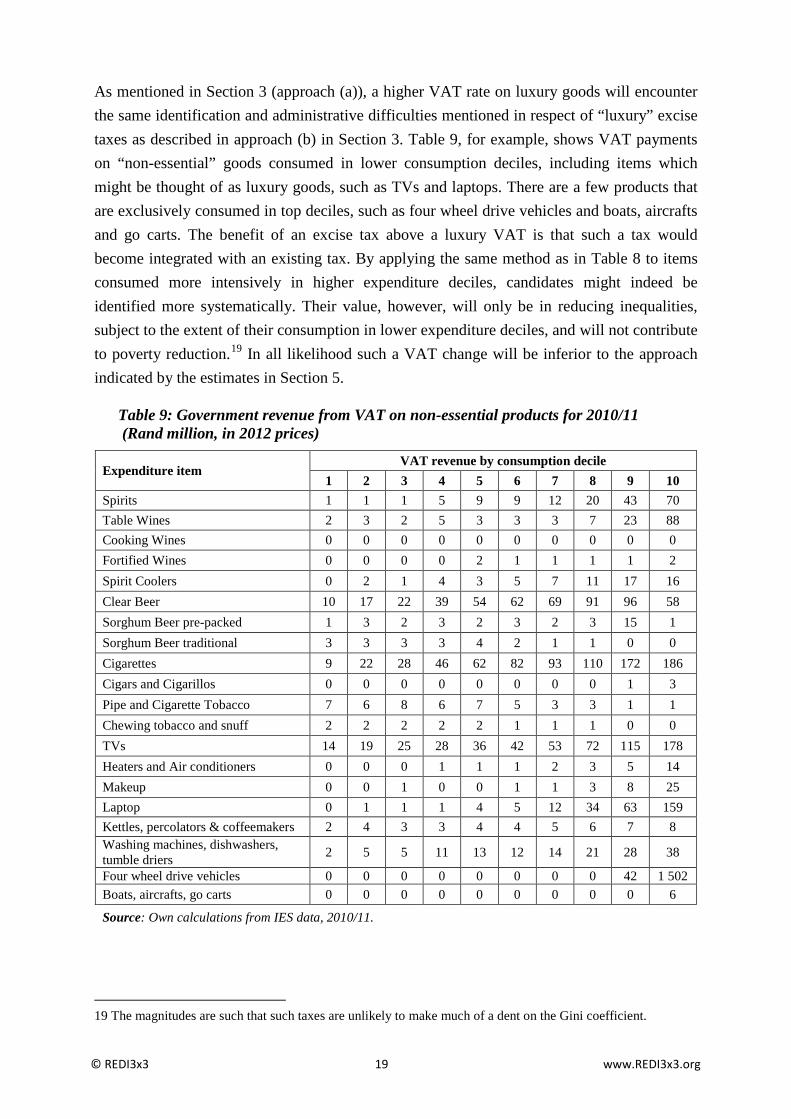
As mentioned in Section 3 (approach (a)), a higher VAT rate on luxury goods will encounter the same identification and administrative difficulties mentioned in respect of “luxury” excise taxes as described in approach (b) in Section 3. Table 9, for example, shows VAT payments on “non-essential” goods consumed in lower consumption deciles, including items which might be thought of as luxury goods, such as TVs and laptops. There are a few products that are exclusively consumed in top deciles, such as four wheel drive vehicles and boats, aircrafts and go carts. The benefit of an excise tax above a luxury VAT is that such a tax would become integrated with an existing tax. By applying the same method as in Table 8 to items consumed more intensively in higher expenditure deciles, candidates might indeed be identified more systematically. Their value, however, will only be in reducing inequalities, subject to the extent of their consumption in lower expenditure deciles, and will not contribute to poverty reduction.19 In all likelihood such a VAT change will be inferior to the approach indicated by the estimates in Section 5.
Table 9: Government revenue from VAT on non-essential products for 2010/11 (Rand million, in 2012 prices)
19 The magnitudes are such that such taxes are unlikely to make much of a dent on the Gini coefficient.
Expenditure item VAT revenue by consumption decile
1 2 3 4 5 6 7 8 9 10 Spirits 1 1 1 5 9 9 12 20 43 70 Table Wines 2 3 2 5 3 3 3 7 23 88 Cooking Wines 0 0 0 0 0 0 0 0 0 0 Fortified Wines 0 0 0 0 2 1 1 1 1 2 Spirit Coolers 0 2 1 4 3 5 7 11 17 16 Clear Beer 10 17 22 39 54 62 69 91 96 58 Sorghum Beer pre-packed 1 3 2 3 2 3 2 3 15 1 Sorghum Beer traditional 3 3 3 3 4 2 1 1 0 0 Cigarettes 9 22 28 46 62 82 93 110 172 186 Cigars and Cigarillos 0 0 0 0 0 0 0 0 1 3 Pipe and Cigarette Tobacco 7 6 8 6 7 5 3 3 1 1 Chewing tobacco and snuff 2 2 2 2 2 1 1 1 0 0 TVs 14 19 25 28 36 42 53 72 115 178 Heaters and Air conditioners 0 0 0 1 1 1 2 3 5 14 Makeup 0 0 1 0 0 1 1 3 8 25 Laptop 0 1 1 1 4 5 12 34 63 159 Kettles, percolators & coffeemakers 2 4 3 3 4 4 5 6 7 8 Washing machines, dishwashers, tumble driers 2 5 5 11 13 12 14 21 28 38 Four wheel drive vehicles 0 0 0 0 0 0 0 0 42 1 502 Boats, aircrafts, go carts 0 0 0 0 0 0 0 0 0 6 Source: Own calculations from IES data, 2010/11.
© REDI3x3 19 www.REDI3x3.org
8. Is there a distributionally neutral substitute for zero-rating?
At various points in this paper a key question was raised or implied: can zero-rated goods be replaced by an alternative income-support programme that reaches the same lower-income beneficiaries. More specifically, can zero-rating be replaced with a cheaper fiscal programme that will leave none of the zero-rating beneficiaries worse off? This raises a number of questions that fall outside of the scope of this paper, but which we identify as important research questions in the light of various doubts about the efficacy of zero-rating as the best and most cost-effective income support mechanism.
The first question is who the current beneficiaries of zero-rating are. We have already established that and the high cost of ensuring this as a benefit to the lower income groups. We also registered that such a financial benefit arguably contributes more to poverty reduction or alleviation that income redistribution. When nutritional value enters the equation, further doubt is raised about the value of some of the zero-rated items.
The second question is whether the benefits currently enjoyed in the form of zero-rating can be replaced by adding cash transfers to any of the existing income-support programmes. Already the IES-data show the extent to which the various income deciles benefit from fiscal transfers. More work will be needed to establish the extent to which a one-to-one correspondence will be possible and/or to identify non-corresponding beneficiaries.
A third question is whether any other more cost-effective programmes can be conceptualised. At various times in the past the idea of a universal grant was proposed, part of which could be recouped via the income tax system (i.e. designing the grant as a negative income tax). The idea was judged to be unacceptable from a cost point of view. Given the information in this paper about the “delivery cost” of zero-rated goods, it might just be an appropriate time to investigate alternatives to zero-rating (an example would be a universal grant) and compare the relative delivery costs of these alternatives to those of zero-rated goods.
9. Conclusion
This paper investigated a number of questions about possible changes in the South African VAT tax system from the perspectives of efficiency and equity (including poverty alleviation). Internationally there still is a tendency towards broad-based and single-rate VAT, although the literature also refers to exceptions where reduced rates may be a consideration. The feasibility and political acceptability of the latter depends on the extent to which well-targeted social assistance programmes are or can be put in place. Since the introduction of a relatively broad-based VAT in South Africa in 1991, which now embodies 19 zero-rated items, the coverage and delivery effectiveness of social assistance programmes have developed substantially. The latter now dwarfs zero-rating in its effect on inequality and
© REDI3x3 20 www.REDI3x3.org
poverty alleviation and seemingly demonstrates a superior benefit-cost ratio. An estimated net fiscal gain of about R5 billion might be achieved by replacing all zero-rating with a compensatory targeted social assistance programme. Such a change will improve the after-tax income distribution without sacrificing poverty alleviation. It will present quite severe challenges to the political economy of taxation, given vested interests and the prospective replacement of a tax benefit that adjusts automatically with a government transfer benefit that relies on discretionary policy changes.
Appendix
Weighted equity ratios (WEGR) for various consumption items
Item WEGR Item WEGR Item WEGR Rice 52.7 Jumbo eggs 0.001 Canned green beans 0.01 White Bread 17.4 EL eggs 0.049 Pickles 0.0 Brown Bread 142.9 Large eggs 3.5 Atchaar 2.4 Garlic Bread 0.0002 Medium eggs 5.4 Veg spread 0.0 Whole wheat Bread 0.000003 Butter 0.037 Prepared salads 0.0001 Bread Rolls 0.0088 MF margarine spread 0.3 Potatoes 36.7 Rusks 0.0023 LF margarine spread 0.016 Frozen potato chips 0.002 Marie Biscuits 0.1 Yellow brick margarine 3.6 Sweet potatoes 0.1 Crackers 0.000001 Peanut butter 0.2 Potato crisps 0.1 Spaghetti 0.038 Vegetable cooking fat 0.3 Cheese curls 0.7 Macaroni 0.1 Olive oils 0.0 Corn chips 2.1 Cakes 0.1 Edible oils 51.8 Popcorn kernels 0.02 Tarts 0.000002 Other oils 0.028 Prepared popcorn 0.02 Sandwiches 0.0012 Oranges 0.8 White sugar 63.1 Maize meal 677.6 Naartjies 0.0032 Brown sugar 16.7 Cake flour 41.0 Grapefruit 0.0 Icing sugar 0.004 Self raising meal 0.009 Lemons 0.0002 Castor sugar 0.0 Bread flour 62.5 Bananas 0.3 Artificial sweeteners 0.00002 Sorghum Meal 4.6 Apples 0.5 Honey 0.0 Corn flour 0.0 Pears 0.018 Smooth apricot jam 0.1 Tastee wheat 0.0014 Apricots 0.00011 Smooth peach jam 0.007 Mabella 1.9 Peaches 0.010 Melon and ginger jam 0.018 Cornflakes 0.023 Plums 0.00003 Preserves 0.0 Puffed Rice 0.0 Avocadoes 0.002 Marmalade 0.0 Muesli 0.000003 Cherries 0.0 Milk plain slabs 0.008 Mealie Rice 0.2 Grapes 0.001 Milk wholenut slabs 0.00001 Samp 58.3 Strawberries 0.0 Bar with filling 0.001 Beefveal 2.0 Pawpaw 0.00003 Toffees 0.003 Pork 0.0 Pineapple 0.0003 Glucose sweets 0.1 Mutton 0.1 Mango 0.018 Health bars 0.000002 Lamb 0.016 Guava 0.0 Full cream ice cream 0.02 Goat 0.3 Watermelon 0.007 Sorbet 0.00002 Poultry 80.4 Melon 0.0 Frozen yogurt 0.1 Boerewors 0.9 Dried peaches 0.0 Ice cubes 0.002 Pork sausage 0.010 Dried prunes 0.0 Jelly powder 0.005 Beef sausage 0.1 Raisins 0.001 Golden syrup 0.0 Viennas 0.0 Dates 0.0 Vinegar 0.1 Polony 1.2 Coconuts 0.001 Chutney 0.00006 Ham 0.0016 Almonds 0.0 Mustard 0.00001 Bacon 0.000005 Pecan nuts 0.0 Tomato source 0.1 Biltong 0.0008 Walnuts 0.0 Mayonnaise 0.3 Dried sausages 0.0004 Peanuts 0.1 Salad dressing 0.0 Mopane worms 13.5 Canned pears 0.0 Salt 5.3
© REDI3x3 21 www.REDI3x3.org
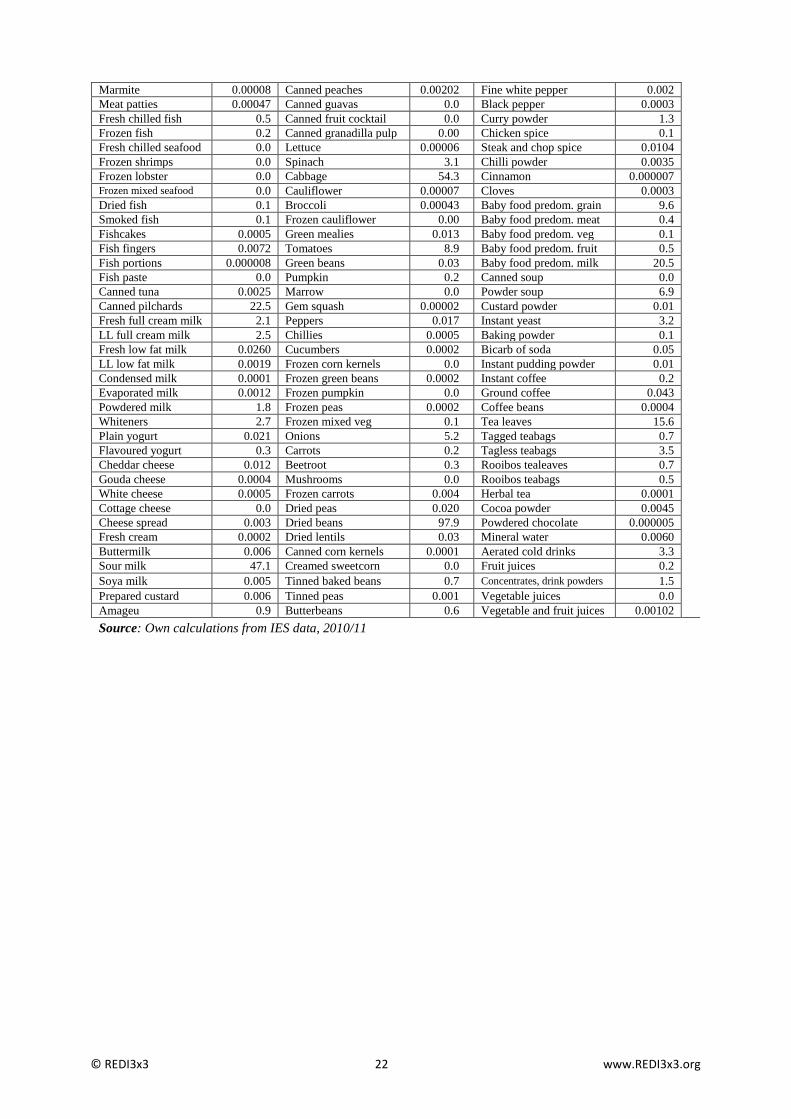
Marmite 0.00008 Canned peaches 0.00202 Fine white pepper 0.002 Meat patties 0.00047 Canned guavas 0.0 Black pepper 0.0003 Fresh chilled fish 0.5 Canned fruit cocktail 0.0 Curry powder 1.3 Frozen fish 0.2 Canned granadilla pulp 0.00 Chicken spice 0.1 Fresh chilled seafood 0.0 Lettuce 0.00006 Steak and chop spice 0.0104 Frozen shrimps 0.0 Spinach 3.1 Chilli powder 0.0035 Frozen lobster 0.0 Cabbage 54.3 Cinnamon 0.000007 Frozen mixed seafood 0.0 Cauliflower 0.00007 Cloves 0.0003 Dried fish 0.1 Broccoli 0.00043 Baby food predom. grain 9.6 Smoked fish 0.1 Frozen cauliflower 0.00 Baby food predom. meat 0.4 Fishcakes 0.0005 Green mealies 0.013 Baby food predom. veg 0.1 Fish fingers 0.0072 Tomatoes 8.9 Baby food predom. fruit 0.5 Fish portions 0.000008 Green beans 0.03 Baby food predom. milk 20.5 Fish paste 0.0 Pumpkin 0.2 Canned soup 0.0 Canned tuna 0.0025 Marrow 0.0 Powder soup 6.9 Canned pilchards 22.5 Gem squash 0.00002 Custard powder 0.01 Fresh full cream milk 2.1 Peppers 0.017 Instant yeast 3.2 LL full cream milk 2.5 Chillies 0.0005 Baking powder 0.1 Fresh low fat milk 0.0260 Cucumbers 0.0002 Bicarb of soda 0.05 LL low fat milk 0.0019 Frozen corn kernels 0.0 Instant pudding powder 0.01 Condensed milk 0.0001 Frozen green beans 0.0002 Instant coffee 0.2 Evaporated milk 0.0012 Frozen pumpkin 0.0 Ground coffee 0.043 Powdered milk 1.8 Frozen peas 0.0002 Coffee beans 0.0004 Whiteners 2.7 Frozen mixed veg 0.1 Tea leaves 15.6 Plain yogurt 0.021 Onions 5.2 Tagged teabags 0.7 Flavoured yogurt 0.3 Carrots 0.2 Tagless teabags 3.5 Cheddar cheese 0.012 Beetroot 0.3 Rooibos tealeaves 0.7 Gouda cheese 0.0004 Mushrooms 0.0 Rooibos teabags 0.5 White cheese 0.0005 Frozen carrots 0.004 Herbal tea 0.0001 Cottage cheese 0.0 Dried peas 0.020 Cocoa powder 0.0045 Cheese spread 0.003 Dried beans 97.9 Powdered chocolate 0.000005 Fresh cream 0.0002 Dried lentils 0.03 Mineral water 0.0060 Buttermilk 0.006 Canned corn kernels 0.0001 Aerated cold drinks 3.3 Sour milk 47.1 Creamed sweetcorn 0.0 Fruit juices 0.2 Soya milk 0.005 Tinned baked beans 0.7 Concentrates, drink powders 1.5 Prepared custard 0.006 Tinned peas 0.001 Vegetable juices 0.0 Amageu 0.9 Butterbeans 0.6 Vegetable and fruit juices 0.00102 Source: Own calculations from IES data, 2010/11
© REDI3x3 22 www.REDI3x3.org
References Atkinson, A.B. and J.E. Stiglitz. 1976. The Design of Tax Structure: Direct versus Indirect Taxation.
Journal of Public Economics, 6(1-2): 55-75. Bird, R. M. and P. Gendron. 2006. Is VAT the Best Way to Impose a General Consumption Tax in
Developing Countries? IBFD Bulletin (July 2006): 287-296. Bird, R. M. and P. Gendron. 2007. The VAT in Developing and Transitional Countries. Cambridge
and New York: Cambridge University Press. Ebrill, L., M. Keen, J. Bodin, and V. Summers. 2001. The Modern VAT. Washington, D.C.:
International Monetary Fund. Finn A., M. Leibbrandt and M. Oosthuizen. 2014. Poverty, inequality, and prices in post-apartheid
South Africa. WIDER Working Paper 2014/127, October. Available: http://www.wider.unu.edu/publications/working-papers/2014/en_GB/wp2014-127/. Accessed: 18 May 2015.
Fourie, F.C.v.N. and A. Owen. 1993. Value-Added Tax and Regressivity in South Africa. South African Journal of Economics, 61(4): 308-319.
Inchauste, G., N. Lustig, M. Maboshe, C. Purfield, I. Woolard. 2015. The distributional impact of fiscal policy in South Africa. Policy Research Working Paper Series 7194, The World Bank.
Keen, M. 2009. What Do (and Don’t) We Know about the Value Added Tax? A Review of Richard M. Bird and Pierre-Pascal Gendron’s The VAT in Developing and Transitional Countries. Journal of Economic Literature 47(1): 159-170.
______. 2012. Targeting, Cascading, and Indirect Tax Design. Paper delivered as the third Dr. Raja J. Chelliah Memorial Lecture. New Delhi: National Institute of Public Finance and Policy. 9 February 2012. 31 pages.
Lustig, N. 2014. Fiscal Policy, Inequality and the Poor in the Developing World. Round 1. CEQ Working Paper No. 23, Center for Inter-American Policy and Research and Department of Economics, Tulane University and Inter-American Dialogue, forthcoming.
National Treasury. 2009. Estimate of Expenditure. National Treasury, Pretoria. ______. 2014. Estimate of Expenditure. National Treasury, Pretoria. OECD. 2012. Consumption tax trends 2012: Vat/GST and Excise Rates, Trends and Administration
Issues. OECD Publishing. Available: http://www.oecd-ilibrary.org/taxation/consumption-tax-trends-2012_ctt-2012-en. Accessed: 21 May 2015.
RSA. 1996. Macroeconomic strategy on growth, employment and redistribution. Pretoria: Government Printer.
Rosen, H. S. and T. Gayer. 2014. Public Finance. 10th edition. McGraw-Hill Irwin. Statistics South Africa. 2008. Income and Expenditure Survey 2005/2006. Pretoria: Statistics South
Africa. ______. 2012. Income and Expenditure Survey 2010/2011. Pretoria: Statistics South Africa. Van der Berg, S. 2009. Fiscal incidence of social spending in South Africa, 2006. Stellenbosch
Working Paper Series No. WP10/2009. Available at: http://www.ekon.sun.ac.za/wpapers/2009. Accessed: 24 September 2014.
______. 2015 (forthcoming). Poverty and inequality in South Africa: fiscal and social policy issues. In Black, P.A., E. Calitz and T.J. Steenekamp (eds): Public Economics. 6th edition. Cape Town: Oxford University Press. Chapter 8.
© REDI3x3 23 www.REDI3x3.org

The Research Project on Employment, Income Distribution and Inclusive Growth (REDI3x3) is a multi-year collaborative national research initiative. The project seeks to address South Africa's unemployment, inequality and poverty challenges.
It is aimed at deepening understanding of the dynamics of employment, incomes and economic growth trends, in particular by focusing on the interconnections between these three areas.
The project is designed to promote dialogue across disciplines and paradigms and to forge a stronger engagement between research and policy making. By generating an independent, rich and nuanced knowledge base and expert network, it intends to contribute to integrated and consistent policies and development strategies that will address these three critical problem areas effectively.
Collaboration with researchers at universities and research entities and fostering engagement between researchers and policymakers are key objectives of the initiative.
The project is based at SALDRU at the University of Cape Town and supported by the National Treasury.
Consult the website for information on research grants and scholarships.
Tel: (021) 650-5715
www.REDI3x3.org
© REDI3x3 24 www.REDI3x3.org
Related Documents


