NEW YORK UNIVERSITY SCHOOL OF LAW October 2015 Jayni Foley Hein Peter Howard, Ph.D. Photo © J Sidle Reconsidering Coal’s Fair Market Value e Social Costs of Coal Production and the Need for Fiscal Reform

Welcome message from author
This document is posted to help you gain knowledge. Please leave a comment to let me know what you think about it! Share it to your friends and learn new things together.
Transcript

NEW YORK UNIVERSITY SCHOOL OF LAW
October 2015Jayni Foley Hein
Peter Howard, Ph.D.
Phot
o ©
J Si
dle
Reconsidering Coal’s Fair
Market ValueThe Social Costs of Coal Production
and the Need for Fiscal Reform
Copyright © 2015 by the Institute for Policy Integrity.All rights reserved.
Institute for Policy IntegrityNew York University School of LawWilf Hall, 139 MacDougal StreetNew York, New York 10012
Report Lead Author: Jayni Foley Hein, Policy DirectorEconomic Appendices Lead Author: Peter Howard, Ph.D., Economics Director
The authors would like to thank Michael Livermore, Richard Revesz, Jason Schwartz, and Mark Haggerty for their insights and comments.
1
Part I. Introduction
C oal mining on federal lands accounts for more than 40 percent of all coal produced in the United States.1
Nearly 90 percent of federally-produced coal comes from strip mines in the Powder River Basin in Wyo-ming and Montana.2 As a result of outdated policies, longstanding loopholes, and prevalent environmental
externalities, American taxpayers are not receiving their fair share of value from coal mined on public lands. The Department of the Interior (“Interior”) has the obligation and statutory authority to make changes to the leasing program in order to earn a fair return for the American public and protect the environment.
The federal coal leasing program is not structured to ensure that taxpayers receive “fair market value,” as the law requires, for coal extracted from public lands. Recent investigations have shown that coal companies exploit loopholes to avoid paying their fair share of royalties, costing taxpayers up to $1 billion each year in lost revenue.3 Outdated fiscal policies fail to remedy uncompetitive bidding practices or properly account for coal’s export value. And central to the recommendations in this report, Interior’s fiscal terms do not account for the prevalent environmental externalities and option values associated with coal production that impose uncompensated costs on the public.
Led by Secretary Sally Jewell, in 2015 Interior called for an “honest and open conversation about modernizing the federal coal program” and emphasized the need to make changes to bring the coal program into the 21st Century.4
Interior’s Bureau of Land Management (“BLM”), which is responsible for the management of the federal coal program, embarked upon a series of “listening sessions” across the United States to gather feedback and comments on the federal coal program. This is welcome progress. Now, Interior should act on the call to modernize the federal coal program by closing corporate loopholes, updating outdated fiscal terms, and accounting for social and environmental costs and option values, in order to earn a fair share for taxpayers.
This report suggests that a robust definition of “fair market value” should include: the market price of the coal resource, the option value of mining that resource, and the social cost of mining—the cost to American taxpayers of mining on public lands due to environmental and social externalities. This definition would be consistent with Interior’s dual mandate to earn a fair return on development of energy resources, and to preserve and protect the environment for future generations. Specifically, Interior should:
• Adjust BLM’s internal “fair market value” calculations to account for the option value, or informational value of delay, and fixed social costs of coal leasing;
• Raise minimum bids to account for inflation, option value, and the fixed social costs associated with coal leasing;
• Calculate the royalties that coal companies owe to the public by using the market price of coal;
• Adjust the royalty rate for coal leases to account for the environmental and social costs of coal production; and
• End the practice of granting royalty rate reductions and providing uncapped transportation allowances to coal companies, which amount to a subsidy for coal production.
2
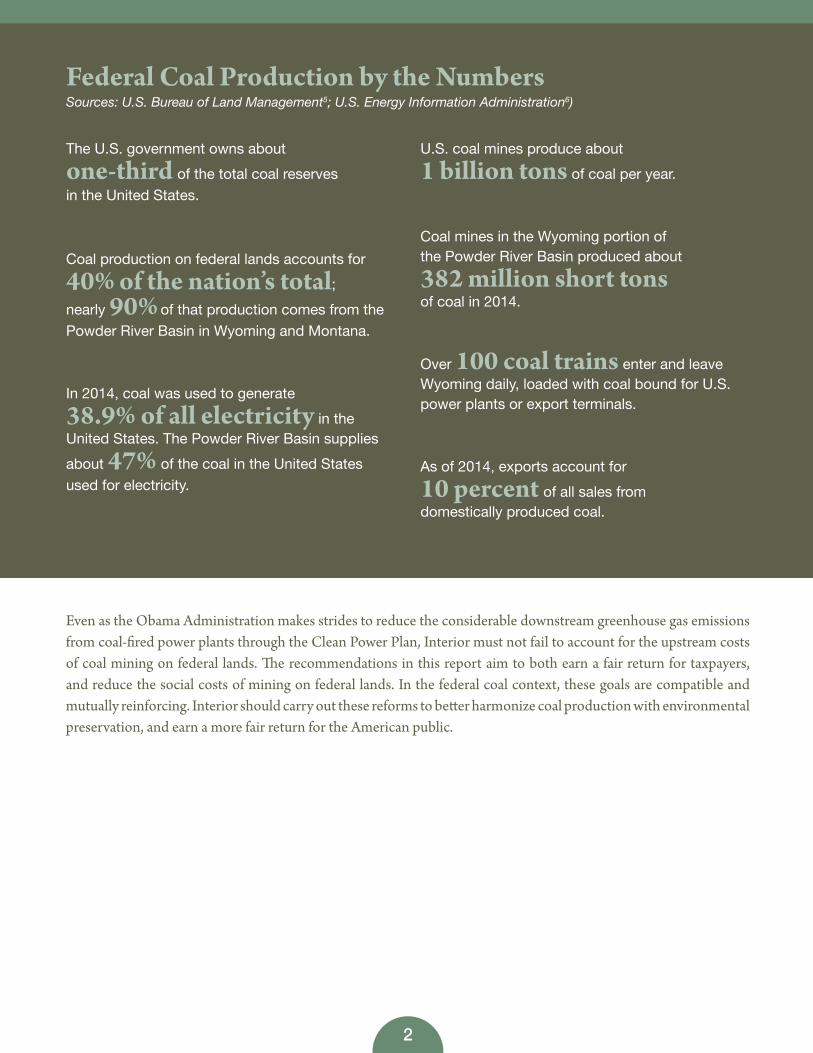
Federal Coal Production by the Numbers Sources: U.S. Bureau of Land Management5; U.S. Energy Information Administration6)
The U.S. government owns about one-third of the total coal reserves in the United States.
Coal production on federal lands accounts for 40% of the nation’s total; nearly 90% of that production comes from the Powder River Basin in Wyoming and Montana.
In 2014, coal was used to generate 38.9% of all electricity in the United States. The Powder River Basin supplies about 47% of the coal in the United States used for electricity.
U.S. coal mines produce about 1 billion tons of coal per year.
Coal mines in the Wyoming portion of the Powder River Basin produced about 382 million short tons of coal in 2014.
Over 100 coal trains enter and leave Wyoming daily, loaded with coal bound for U.S. power plants or export terminals.
As of 2014, exports account for 10 percent of all sales from domestically produced coal.
Even as the Obama Administration makes strides to reduce the considerable downstream greenhouse gas emissions from coal-fired power plants through the Clean Power Plan, Interior must not fail to account for the upstream costs of coal mining on federal lands. The recommendations in this report aim to both earn a fair return for taxpayers, and reduce the social costs of mining on federal lands. In the federal coal context, these goals are compatible and mutually reinforcing. Interior should carry out these reforms to better harmonize coal production with environmental preservation, and earn a more fair return for the American public.

3
Part II. Key Deficiencies in the Federal Coal Leasing Program
T he Department of the Interior, through BLM, manages coal leases on 570 million acres of surface and subsurface federal land, much of which is concentrated in the Powder River Basin in Wyoming and Montana. In total, coal mines in the United States (located on federal, state, and private lands) produce about 1 billion
tons of coal per year.7 Coal mines in the Wyoming portion of the Powder River Basin produced about 382 million short tons of coal in 2014. Coal from the Powder River Basin is typically low-sulfur subbituminous coal that is strip mined (a type of surface mining) and shipped long distances by train for domestic use in power plants.8
Coal companies mining on federal lands are not paying their fair share for the resources they extract. Key deficiencies in federal coal management include lack of competitive auctions; inconsistent and incomplete “fair market value” calculations; stagnant minimum bids, rental rates, and royalty rates; royalty payment loopholes that give coal companies a windfall; and prevalent environmental externalities that impose uncompensated costs on the public.
Lack of Competitive Leasing and Abdication of the Lease Planning Process
The Mineral Leasing Act of 1920 and Federal Coal Leasing Amendments Act of 1976 require that federal coal leases be offered competitively.9 However, for decades, BLM has run a noncompetitive program that lacks transparency and oversight, and undervalues coal at a loss to the American taxpayer.
Mining spoils next to the Tongue River Reservoir, which is a popular recreation destination in Montana.Photo © WildEarth Guardians

4
In 2013, the Government Accountability Office (“GAO”) found that approximately 90 percent of all federal coal lease sales since 1990 attracted only one bidder.10 From 1990 to 2012, 96 coal tracts were leased with only a single bidder; 10 tracts were leased in sales with two bidders.11
This lack of competition can be traced back to Interior’s decertification of the Powder River Basin as a “coal production region” in 1990. In certified coal production regions, BLM is required to identify potential lease tracts and determine how much total coal should be leased in a region.12 By decertifying the Powder River Basin, Interior ushered in the modern practice of leasing by application (or “LBA”) by which coal producers nominate tracts for leasing.13 In this manner, Interior abdicated much of the lease planning process, allowing coal companies to select tracts for development, rather than having to follow a regional leasing plan—as called for in the Federal Coal Leasing Amendments Act of 1976.14
All current coal leasing in the Powder River Basin is done by application.15 Leasing by application allows private coal companies to design lease boundaries (subject to BLM land use screening and environmental review prior to lease sales16); this perpetuates the problems of noncompetitive leasing and opportunistic expansion via lease modifications.17 Further, leasing by application permits companies to decide where it is privately optimal to locate a mine, rather than where it is socially optimal, which may be different, given environmental externalities and other factors (see Appendices A and B). Compounding this issue, the Energy Policy Act of 2005 increased the amount of land that can be added to an existing lease through noncompetitive lease modification from 160 acres to 960 acres.18
Since January 1990, BLM has leased 107 coal tracts under the lease by application process.19 BLM approved 45 lease modifications from 2000 to 2013.20
Inconsistent “Fair Market Value” Estimates
In light of the documented lack of competition, BLM’s responsibility to obtain fair market value for federal coal leases has heightened importance. The Mineral Leasing Act states that “[n]o bid shall be accepted which is less than the fair market value, as determined by the Secretary, of the coal subject to the lease.”21 The minimum bid for a coal lease is currently set at $100 per acre.22 Before each lease sale or lease modification, BLM formulates an estimate of the fair market value of the coal tract offered. BLM’s fair market value calculation is confidential and is used only to evaluate the bid or bids received during a sale, and the value of a proposed lease modification.23 For lease sales, the winning bid is the highest bid that meets or exceeds the coal tract’s presale estimated fair market value.24
The Government Accountability Office determined that BLM’s process for assessing the fair market value of federal coal “lacks sufficient rigor and oversight,” and that BLM’s state offices varied widely in the approaches they use to develop an estimate of fair market value.25 The “comparable sales” approach uses lease sales and prior bids paid in similar mineral rights transactions.26 The “income approach” uses projected revenue from the resource over time, under realistic conditions.27 Some state offices use both the comparable sales and income approaches in their appraisals, while others rely solely on the comparable sales approach and may not be fully considering future market conditions as a result.28 As discussed below, these two approaches to measuring a fair return do not properly account for the option value, or the informational value of delay, associated with federal leasing. In addition, because many leases are uncompetitive, relying on comparable lease sales may simply perpetuate a pattern of accepting improperly low bids. GAO also found that BLM did not consistently document the rationale for accepting bids that were initially below its fair market value presale estimate.29 BLM accepted bids below its own fair market value presale estimate in 4

5
out of 31 lease sales in three states.30 In total, the accepted bonus bid amounts related to all four tracts was more than $2 million below the presale estimate of fair market value.
Consistent with GAO’s findings, in 2013 the U.S. Department of the Interior’s Office of Inspector General also “found weaknesses in the current coal sale process that could put the government at risk of not receiving the full, fair market value for the leases.”31 The Inspector General “identified lost bonus revenues of $2 million in recent lease sales and $60 million in potentially undervalued lease modifications.”32 The Inspector General analyzed 45 lease modifications since 2000 and found that BLM typically approved a substantially lower price—averaging more than 80 percent lower—than the price used in regular lease sales held during the same period. The Inspector General found that BLM state offices did not prepare a full fair market value appraisal for modifications as required,33 and lack of documentation made it difficult to validate BLM’s decisionmaking process. According to BLM regulations, modification is only appropriate when “the modification serves the interests of the United States.”34
Failure to Account for Exports and Market Dynamics
BLM’s fair market value appraisal should also account for the growing role of coal exports. In its 2013 report, GAO found that BLM considered exports only “to a limited extent when estimating fair market value.”35 The U.S. Energy Information Administration reports that 125 million tons of coal were exported during 2012, more than twice 2007 levels. Likewise, the price of exported coal more than doubled from 2007 through 2011.36 While coal exports have fallen slightly each year since 2011,37 in 2014, exports accounted for 10 percent of all sales from domestically produced coal.38
Exports remain an important market for domestic coal producers. Domestic coal consumption is projected to decrease over the next few years, driven by lower natural gas prices, as well as by the retirements of coal-fired power plants in response to natural gas alternatives and the deadlines for compliance with the Mercury and Air Toxics Standards in 2015 and 2016.39 Full implementation of the Environmental Protection Agency’s Clean Power Plan, which regulates carbon dioxide emissions from existing power plants under section 111(d) of the Clean Air Act, is also expected lower domestic coal consumption and lower domestic coal production by as much as 20 percent by 2020.40
Coal sold overseas often sells at a higher price, making export potential relevant to fair market value estimates. A report by the Sightline Institute concluded that coal companies routinely purchase low-cost federal coal and resell it overseas at higher prices, at a loss to taxpayers.41 GAO found that the Wyoming and Montana BLM offices considered exports, but they generally included only generic statements about exports in the reports they prepared, and were likely failing to factor specific export information into their appraisals. In 2014, BLM updated its Coal Evaluation Manual and Coal Evaluation Handbook, which direct exports to be considered “where appropriate,” and require Interior’s Office of Valuation Services to provide an independent third party review of each federal coal resource valuation.42 However, it remains to be seen whether this will improve BLM’s internal fair market value appraisals.
Failure to Account for Option Value, or the Informational Value of Delay
BLM’s fair market value appraisals also fail to account for the option value of energy resources, which is the value of waiting for more information on energy prices and extraction risks before deciding whether and when to lease the

6
public’s energy resources to private companies. Based on a review of BLM’s regulations, Coal Evaluation Manual, and Coal Evaluation Handbook, BLM does not factor option value into its internal fair market value assessment. As a result, it systematically undervalues the public’s non-renewable coal resources. (See Appendix C for definitions and conditions for option value.)
Option value is the value of waiting to make an irreversible decision until critical new information arrives. One well-known example is stock options, which are valuable because they grant their holder the time to learn more about future stock prices before deciding whether to buy or sell. A conceptually identical and well-established methodology exists to quantify the value of waiting to gain greater information about environmental, social, economic, and technological uncertainties.43 Uncertainty around future energy prices creates option value, as does the uncertainty around extraction costs, such as whether technological developments may, in the future, reduce the environmental risks of coal mining. Uncertainty about the extent or cause of environmental costs, such as the methane emissions associated with coal mining, also has option value. In fact, coal companies themselves routinely account for option value with respect to coal pricing, which explains their longstanding practice of stockpiling leases, yet waiting years to begin production.44 Accounting for option value does not always require that the government postpone issuing leases; rather, it requires that the government is adequately compensated for the value that it foregoes by not waiting to have more information before making a decision.
Interior’s Bureau of Ocean and Energy Management (“BOEM”) recently recognized the utility of option value in its proposed offshore leasing plan for 2017 to 2022. Specifically, BOEM noted that: (i) environmental and social cost uncertainties can affect the size, timing, and location of offshore leasing; (ii) option value can be a component of the fair market value of a lease; and (iii) BOEM can raise minimum bids, rents, and royalties for leases to account for option value.45 Fair market value is defined in BOEM’s manual identically to the description in BLM’s handbook.46
During its program development stage, BOEM uses a “hurdle price analysis” to filter out program areas where delaying a sale may provide greater future economic value (see Appendix C for a more in-depth discussion).47 BOEM also assesses fiscal and lease terms at the lease sale stage to safeguard against leases being awarded for less than fair market value.
In addition, the United States Court of Appeals for the D.C. Circuit recently acknowledged the validity of option value with respect to offshore oil and gas drilling. In Center for Sustainable Economy v. Jewell, Petitioner argued that the Outer Continental Shelf Lands Act required BOEM to explicitly consider and quantify the option value of delaying leasing in specific regions of the Outer Continental Shelf.48 The Court’s decision recognized the utility of option value to Interior’s offshore leasing program:
More is learned with the passage of time: Technology improves. Drilling becomes cheaper, safer, and less environmentally damaging. Better tanker technology renders oil tanker spills less likely and less damaging. The true costs of tapping OCS energy resources are better understood as more becomes known about the damaging effects of fossil fuel pollutants. Development of energy efficiencies and renewable energy sources reduces the need to rely on fossil fuels. As safer techniques and more effective technologies continue to be developed, the costs associated with drilling decline. There is therefore a tangible present economic benefit to delaying the decision to drill for fossil fuels to preserve the opportunity to see what new technologies develop and what new information comes to light.49
7
Ultimately, the Court found that BOEM’s failure to quantify option value was not arbitrary or irrational at this time because the methodology for quantifying option value is not yet “sufficiently established.”50 But importantly, the Court noted: “Had the path been well worn, it might have been irrational for Interior not to follow it.”51
While the D.C. Circuit decision addressed offshore leasing, the Court’s language on the utility of option value is equally applicable to both onshore and offshore leasing, including of coal resources. And BLM, unlike BOEM, currently fails to address environmental and social option value in any manner, qualitatively or quantitatively. As discussed in Part IV, BLM should account for option value when pricing leases; this would best effectuate the dual mandate of the Federal Land Policy and Management Act, and help ensure a fair return to the public as called for in the relevant federal statutes.
Stagnant Minimum Bids, Rental Rates and Royalty Rates
The Mineral Leasing Act directs BLM to collect three types of payment from leaseholders: an initial lease bid (or “bonus bid”) payment for the right to mine coal on federal lands; annual rental payments of $3 per acre; and royalties paid on the value of coal that is mined.52 BLM has broad authority to set the fiscal terms of these payments. Royalties account for nearly two-thirds of the total revenue from federal coal leases, and bonus bids account for most of the remainder.53 Bonuses, rental payments, and royalties are paid to the U.S. Treasury, and 49 percent of that revenue is returned to the states where the production activity takes place.54
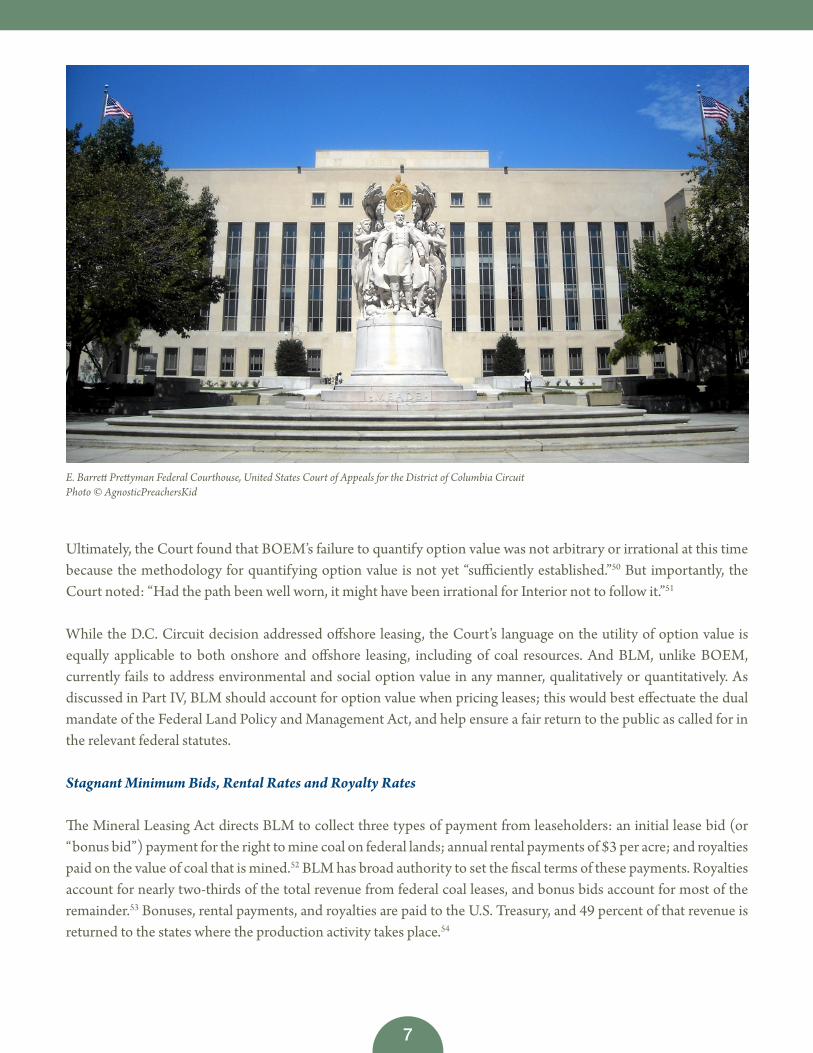
E. Barrett Prettyman Federal Courthouse, United States Court of Appeals for the District of Columbia Circuit Photo © AgnosticPreachersKid
8
Minimum bids and rental rates have failed to keep pace with inflation, and fail to account for the cost of environmental externalities associated with coal exploration and production. In addition, the federal royalty payment system is riddled with loopholes and allowable deductions, which hinder receipt of fair market value and break with economic best practices.
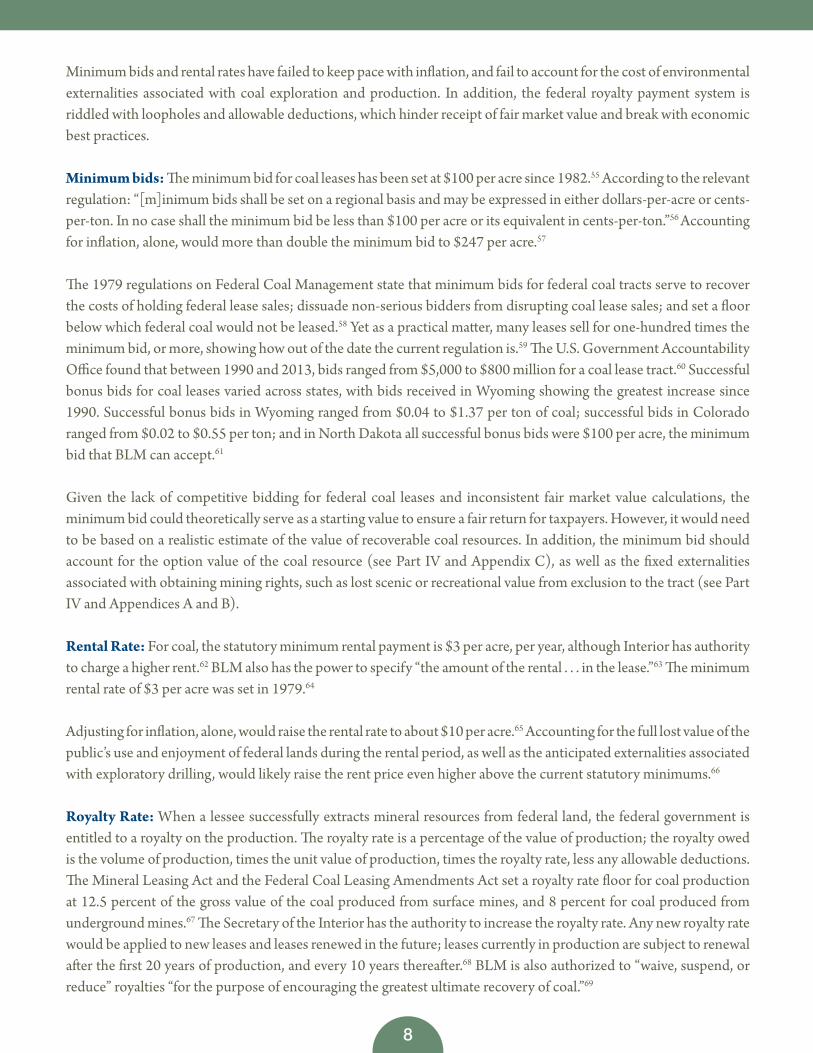
Minimum bids: The minimum bid for coal leases has been set at $100 per acre since 1982.55 According to the relevant regulation: “[m]inimum bids shall be set on a regional basis and may be expressed in either dollars-per-acre or cents-per-ton. In no case shall the minimum bid be less than $100 per acre or its equivalent in cents-per-ton.”56 Accounting for inflation, alone, would more than double the minimum bid to $247 per acre.57
The 1979 regulations on Federal Coal Management state that minimum bids for federal coal tracts serve to recover the costs of holding federal lease sales; dissuade non-serious bidders from disrupting coal lease sales; and set a floor below which federal coal would not be leased.58 Yet as a practical matter, many leases sell for one-hundred times the minimum bid, or more, showing how out of the date the current regulation is.59 The U.S. Government Accountability Office found that between 1990 and 2013, bids ranged from $5,000 to $800 million for a coal lease tract.60 Successful bonus bids for coal leases varied across states, with bids received in Wyoming showing the greatest increase since 1990. Successful bonus bids in Wyoming ranged from $0.04 to $1.37 per ton of coal; successful bids in Colorado ranged from $0.02 to $0.55 per ton; and in North Dakota all successful bonus bids were $100 per acre, the minimum bid that BLM can accept.61
Given the lack of competitive bidding for federal coal leases and inconsistent fair market value calculations, the minimum bid could theoretically serve as a starting value to ensure a fair return for taxpayers. However, it would need to be based on a realistic estimate of the value of recoverable coal resources. In addition, the minimum bid should account for the option value of the coal resource (see Part IV and Appendix C), as well as the fixed externalities associated with obtaining mining rights, such as lost scenic or recreational value from exclusion to the tract (see Part IV and Appendices A and B).
Rental Rate: For coal, the statutory minimum rental payment is $3 per acre, per year, although Interior has authority to charge a higher rent.62 BLM also has the power to specify “the amount of the rental . . . in the lease.”63 The minimum rental rate of $3 per acre was set in 1979.64
Adjusting for inflation, alone, would raise the rental rate to about $10 per acre.65 Accounting for the full lost value of the public’s use and enjoyment of federal lands during the rental period, as well as the anticipated externalities associated with exploratory drilling, would likely raise the rent price even higher above the current statutory minimums.66
Royalty Rate: When a lessee successfully extracts mineral resources from federal land, the federal government is entitled to a royalty on the production. The royalty rate is a percentage of the value of production; the royalty owed is the volume of production, times the unit value of production, times the royalty rate, less any allowable deductions.The Mineral Leasing Act and the Federal Coal Leasing Amendments Act set a royalty rate floor for coal production at 12.5 percent of the gross value of the coal produced from surface mines, and 8 percent for coal produced from underground mines.67 The Secretary of the Interior has the authority to increase the royalty rate. Any new royalty rate would be applied to new leases and leases renewed in the future; leases currently in production are subject to renewal after the first 20 years of production, and every 10 years thereafter.68 BLM is also authorized to “waive, suspend, or reduce” royalties “for the purpose of encouraging the greatest ultimate recovery of coal.”69
9
The royalty rate for surface mined coal is lower than the royalty rate collected for other taxpayer-owned natural resources, such as offshore oil and gas, which generate royalties of 18.75 percent.70 Interior raised the offshore oil and gas royalty rate in 2007 due to a number of factors, including increased oil and gas prices, technological improvements that made exploration and production more efficient, and the competitive market for leases.71 Notably, former Interior Secretary Ken Salazar said increasing the offshore rate was necessary to ensure that “the American taxpayer is getting a fair return for the oil and gas that the American people own”; he also pointed to higher state onshore rates for oil and gas as a possible justification to raise the onshore federal rate for oil and gas.72 Like coal, federal onshore oil and gas royalty rates have been set at 12.5 percent for decades; Interior has acknowledged the need to revisit these rates and recently published an Advanced Notice of Proposed Rulemaking soliciting suggestions for reform.73
Ignoring the Cost of Production Externalities in Royalty Rates
Existing royalty rates currently fail to account for the social cost of the externalities of coal production on federal lands. Coal production causes numerous externalities, including greenhouse gas emissions (methane and CO2), inefficient water use, water pollution (including acid mine runoff), ecosystem losses, impairment of scenic and recreational uses of the land, and transportation costs from transporting coal long distances to power plants, export terminals, and industrial end users. Appendices A and B, accompanying this report, provide more detail on the extent of these externalities and their social costs. This report focuses on upstream externalities, alone, because: (1) they stem directly from coal mining on federal lands, and (2) these externalities are not internalized by existing power plant regulations. Because many of these externalities are currently unregulated by federal law, or may not rise to the level of actionable legal claims, they represent uncompensated social costs.
Greenhouse gas emissions are likely the most significant externality from coal mining.74 The most prominent greenhouse gas emitted from coal production is methane, which is released from coal seams during mining. Coal mining is the United States’ fourth-largest source of methane emissions, accounting for more than 10 percent of total domestic methane emissions in 2013.75 Coal mining also releases CO2 emissions from running equipment during the mining process and transporting coal, often over long distances, by diesel-powered trains.
Methane is a potent greenhouse gas, with a global warming potential up to 86 times greater than carbon dioxide in the first 20 years after release, and 34 times more powerful on a 100-year timeframe.76 In surface mining, methane escapes into the atmosphere through natural fissures, surface air exposure, venting, and other sources.77 Post-mining operations—when coal is stored in piles and transported—and abandoned mines also produce fugitive methane emissions.
Methane capture and abatement technology exists, which can reduce these emissions. BLM released an Advanced Notice of Proposed Rulemaking in April 2014 to gather public input on the development of a program for the capture and sale of methane from coal mines on public lands. However, in the absence of federal regulation, coal companies will capture and abate only as much fugitive methane from mining as maximizes private net benefits. This would account for the resale or reuse value of the captured methane, which is mostly comprised of natural gas. But because methane produces an externality, where the cost of emissions is borne by outside parties, companies will not capture all of the methane that is socially optimal unless required to do so. Thus, as described in Part IV, Interior should raise the royalty rate for companies without sufficient methane capture and control technology.
10
Coal mining also has the potential to pollute rivers, lakes, and sensitive habitat with acid mine drainage and other pollution. And it uses a significant amount of water for dust control, extraction (to cool equipment and prevent fires), and processing.78 The Department of Energy estimates that U.S. coal mining uses approximately 70 to 260 million gallons of water per day, with average uses of 10 gallons per ton of coal mined on the surface in the West, and 100 gallons per ton of coal mined underground in Appalachia.79 To the extent that Wyoming and Montana do not have an efficient water market and face water shortages in relevant watersheds, this is also an externality cost borne by Western coal regions.80 In addition, mine operators extract coal from underground and surface mines using machinery and explosives. Seismic exploration and operating equipment (such as drills, bulldozers and trucks) cause air pollution (such as CO2 and particulate matter emissions), as well as noise pollution.
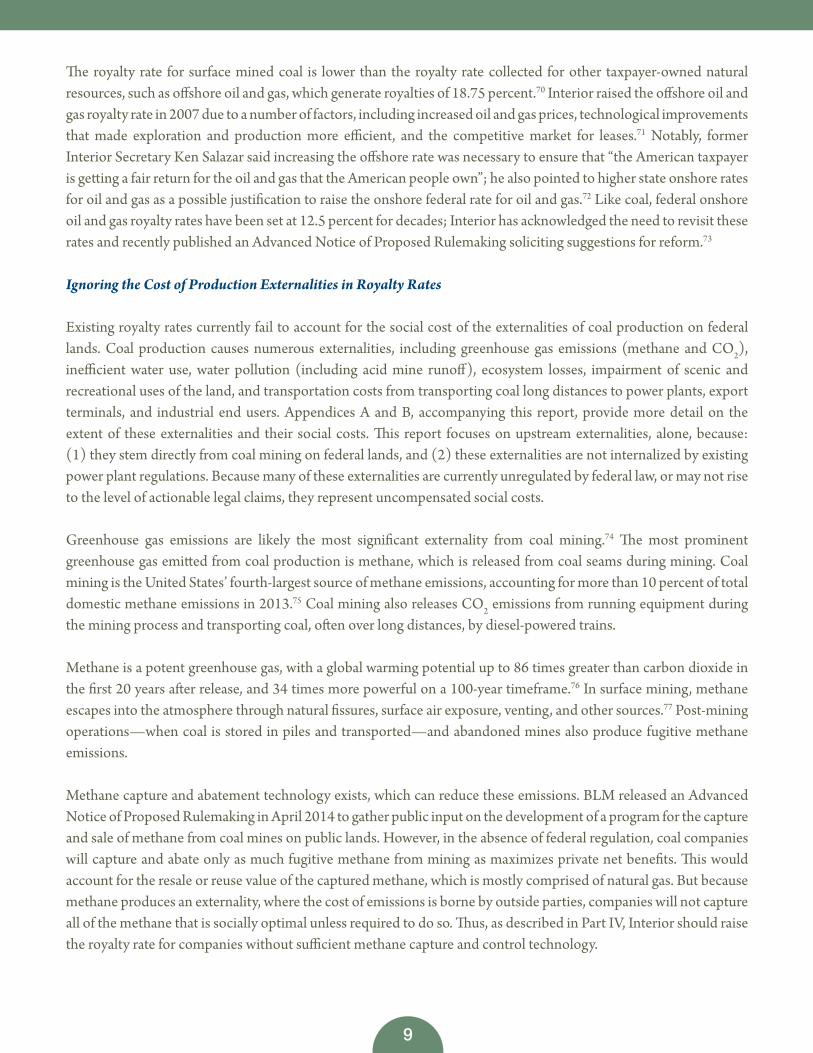
The transportation of coal also results in externalities. In the United States, 70 percent of coal is transported by rail. Domestically, coal accounts for almost half of all tonnage and over 40 percent of commercial freight sent by rail.81 In Wyoming, 90 percent of coal is transported by rail out of the state for use in power plants. Transportation by rail results in multiple externalities including emission of greenhouse gases; emission of particulate matter; increased risk to public health due to accidents; and noise and congestion.
As explained in Part IV and Appendices B and D, Interior should consider increasing royalty rates above current levels to account for foreseeable environmental and social costs of production and transportation. Each of these externalities is a variable social cost of coal production, or, a cost that increases with the amount of coal mined. The type and extent of production externalities vary according to the production method and pollution control measures and technology that may be in place. And with the exception of greenhouse gas emissions, which have global climate change effects, the severity of many of these impacts depends on the location of households, farmland, scenic sites, and critical and sensitive ecosystems, in relation to the coal mine.
Interior has reasonable latitude to adjust individual royally rates based on these factors, or to develop regional or national estimates that are applied more generally. Either approach would improve the agency’s ability to secure a more socially optimal return from coal mining on public lands.
Freight train carrying multiple cars filled with coal.Photo © WildEarth Guardians
11
Royalty Rate Reductions, Deductions and Loopholes
Central to the question of whether royalties are properly structured to ensure a fair return is how royalties are calculated, including whether any deductions or loopholes affect the overall return to the public. Unfortunately, the federal coal program suffers from numerous deficiencies with respect to royalty rate reductions, transportation and processing cost deductions, and royalty payment assessments. As a result, royalties are not based on the market price of coal.
First, in a competitive market, a product’s value on the market is the price that maximizes profit for the seller based on what a buyer is willing to pay. In the coal context, power plants and electric utilities are the buyers in the market. The market value of coal, therefore, is the price that power plants are willing to pay.82 Thus, royalties should be paid on this market price of coal in order to maximize the social return from mining public resources.
Yet, Interior’s Office of Natural Resources Revenue values coal for royalty purposes at the first point of sale at or near the mine, rather than when the coal is delivered to the end user. This practice risks systematically undervaluing the resource. This “first arm’s length sale” often occurs near the point of production, meaning that royalties are calculated using the “mine-mouth” price of coal instead of the market price at which the coal is sold to a power plant or other end user. In other words, the federal government assesses royalties too early in the sale process.83
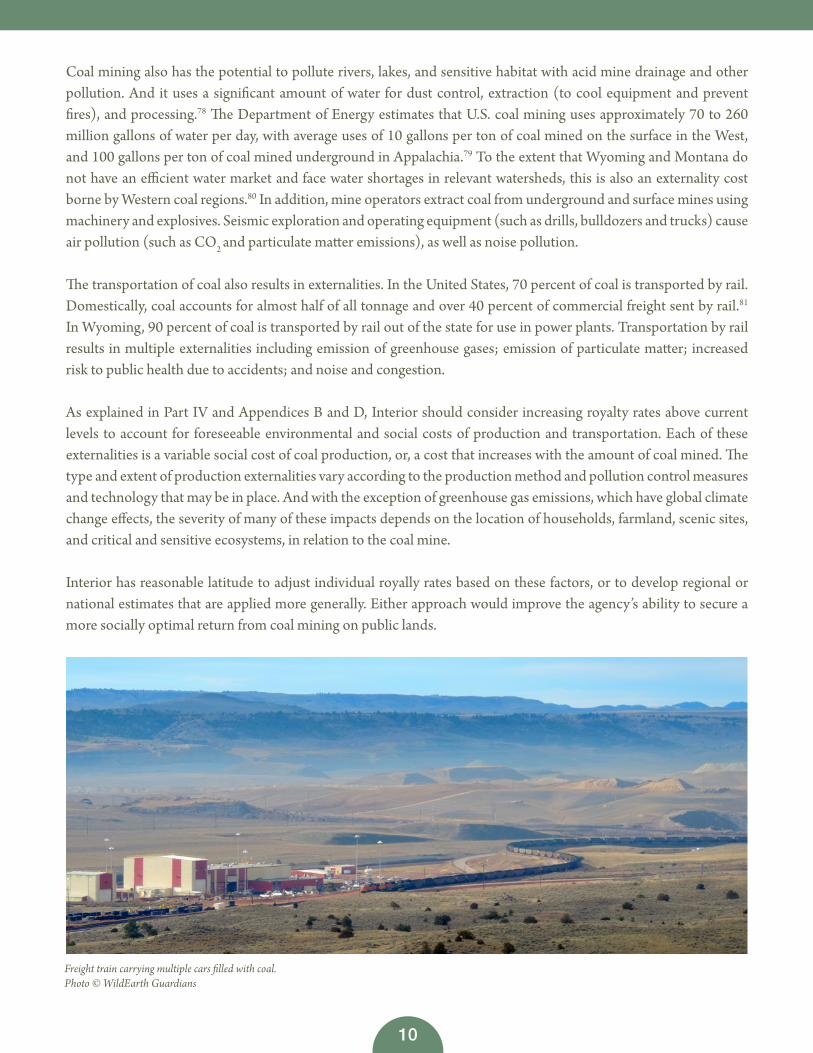
There is also evidence of companies engaging in captive transactions, or non-arm’s length transactions, to sell coal to their own subsidiary companies or affiliates at depressed prices and then reporting these sales as arm’s length in order to pay a lower royalty.84 A 2012 Reuters report found that captive transactions allowed companies to retain an additional $40 million in coal exports from Wyoming and Montana in 2011.85 These issues led Interior’s Office of Natural Resources Revenue to propose a new rule in January 2015, to clarify the definition of arm’s length transactions and give the agency more authority to police this practice. However, Interior can do more to ensure a fair return. As
Coal hauler at the Jim Bridger Power Plant near Point of Rocks, Wyoming. Photo © Randy C. Bunney; Great Circle Photographics

12
described in Part IV, it has discretion to change the point of sale for royalty determination purposes from the first arm’s length transaction to the final delivery point, or market price.86
Second, coal lessees can apply for a royalty rate reduction if the current royalty rate imposes economic hardship that would otherwise result in abandoning the lease, or in less than full recovery of leased coal.87 BLM has discretion to grant royalty rate reductions if three requirements are met: (i) the royalty rate reduction encourages the greatest ultimate recovery of the coal resource; (ii) the rate reduction is in the interest of conservation of the coal and other resources; and (iii) the rate reduction is necessary to promote development of the coal resource.88 These three requirements are contradictory, calling for both the promotion of greater coal development and the conservation of coal and other resources.
Independent analysis by Headwaters Economics found that royalty rate reductions occurred on approximately 36 percent of leases offered for sale since 1990.89 The effective royalty rate was only 4.9 percent of the gross market value of coal extracted between 2008 and 2012.90 Similarly, GAO found that the reported rate that lessees pay on the mine price used for royalty valuation ranged between 5.6 percent for federal leases in Colorado and 12.2 percent in Wyoming.91 The lower reported rates were largely a function of rate reductions. These effective royalty rates are well below the statutorily-set minimum rate of 12.5 percent. More fundamentally, these rate reductions distort the energy market by subsidizing coal production, even in cases where production may be uneconomical. Further, because lease-specific royalty rates and allowable cost deductions are considered proprietary data, there is very little oversight of the entire fiscal program.
Third, coal lessees are allowed to deduct transportation and washing costs—with essentially no ceiling on deductions—from the sale price upon which federal coal royalties are calculated.92 Powder River Basin coal does not require washing; as a result, the washing and processing allowance is almost entirely reserved for Appalachian coal. A transportation deduction is allowable only when “the value for royalty purposes has been determined at a point remote from the lease or mine.”93
The transportation deduction is used sparingly in practice, as most Powder River Basin coal companies sell coal at the mine mouth, making transportation costs irrelevant to the royalty assessment.94 However, if Interior changes the point of valuation for coal royalty rates to the final delivery point (or another point remote from the mine), then transportation costs will become more relevant to royalty payments. In such a scenario, the transportation deduction would translate into an allowance for the full cost of transporting federal coal from the mine to a remote point of sale. This would eliminate the incentive for companies to find the most efficient and lowest cost mode of transportation, and to locate production in the most socially optimal place. In addition, the potential for gaming would likely increase, as companies may inflate reported transportation costs.
Under current federal regulations, transportation deductions for oil and gas royalty purposes are also allowable, but are capped at 50 percent of the value of the resource.95 For coal, there is no such cap, except that the authorized allowance cannot “reduce the value for royalty purposes to zero.”96 Interior should strongly consider capping the coal transportation allowance at a lower level, or eliminating it altogether, and taking steps to prevent any gaming of the system.
In Part IV and the appendices accompanying this report, we discuss how Interior can make changes to the current program to remedy these deficiencies, in line with its statutory mandates. The relevant statutory framework is first described in the following section.

13
Part III. Statutory Framework and Dual Mandate
T hree primary statutes set forth Interior’s duties with respect to coal leasing and federal land management: the Federal Land Policy and Management Act, the Mineral Leasing Act, and the Federal Coal Leasing Amendments Act of 1976. These statutes articulate two important principles: First, Interior must balance
orderly production of energy on federal lands with environmental preservation. Second, Interior must receive “fair market value” for the right to explore and develop federal mineral resources. However, there is a chasm between the requirements of federal law, and the federal coal program as it stands today.
Federal Law Requires Interior to Both Produce Energy and Preserve Federal Lands
Enacted in 1976, the Federal Land Policy and Management Act provides that federal lands are to be used only for the advancement of the national interest.97 The Act declares that:
[P]ublic lands be managed in a manner that will protect the quality of scientific, scenic, historical, ecological, environmental, air and atmospheric, water resource, and archeological values; that, where appropriate, will preserve and protect certain public lands in their natural condition; that will provide food and habitat for fish and wildlife and domestic animals; and that will provide for outdoor recreation and human occupancy and use.98
The Act sets forth the dual mandate of development and preservation. Agencies must both protect the environment99 and manage federal lands in such a way as to provide for domestic sources of “minerals [including hydrocarbon energy resources], food, timber, and fiber.”100
The Federal Land Policy and Management Act requires agencies to develop land use plans, and to manage public lands in accordance with the “principles of multiple use and sustained yield.”101 The Act defines “multiple use” as:
[T]he management of the public lands and their various resource values so that they are utilized in the combination that will best meet the present and future needs of the American people; . . . the use of some land for less than all of the resources; a combination of balanced and diverse resource uses that takes into account the long-term needs of future generations for renewable and nonrenewable resources, including, but not limited to, recreation, range, timber, minerals, watershed, wildlife and fish, and natural scenic, scientific and historical values.102
“Multiple use” also refers to the “harmonious and coordinated management of the various resources without permanent impairment of the productivity of the land and the quality of the environment with consideration being given to the relative values of the resources and not necessarily to the combination of uses that will give the greatest economic return or the greatest unit output.”103
14
The Act defines “sustained yield,” as “the achievement and maintenance in perpetuity of a high-level annual or regular periodic output of the various renewable resources of the public lands consistent with multiple use.”104 Importantly, this definition emphasizes maintaining the output of renewable resources, but not of non-renewable resources, such as fossil fuels. In line with this attention to environmental values, the Act also tasks Interior with “tak[ing] any action necessary to prevent unnecessary or undue degradation of the lands.”105
The Mineral Leasing Act of 1920, which predates the Federal Land Policy and Management Act by more than fifty years, declares that it is the policy of the federal government and in the national interest to foster and encourage private enterprise in “orderly economic development of domestic mineral resources.”106 Among many provisions dedicated to mineral leasing, the Act also provides that the Secretary of the Interior can issue regulations requiring that operators prevent “undue waste.”107 Thus, even when encouraging the “orderly economic development of domestic mineral resources,” federal law requires Interior to ensure that valuable public resources are not wasted. Indeed, the word “orderly” conveys a congressional desire for careful, rational management of America’s valuable energy resources. The term “economic” can also include relevant factors such as externalities and option value.
The Federal Coal Leasing Amendments Act of 1976 modified the Mineral Leasing Act and clarified that the Secretary of the Interior is authorized to “divide any lands subject to this Act which have been classified for coal leasing into leasing tracts of such size as he finds appropriate and in the public interest.”108
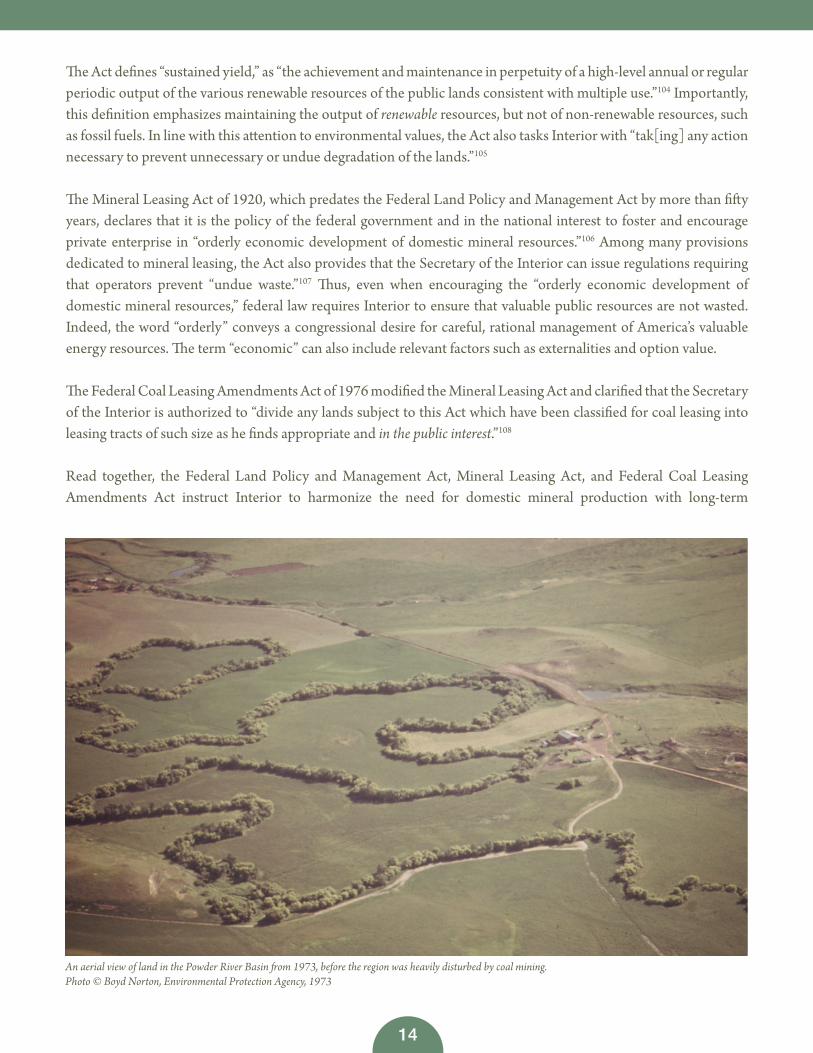
Read together, the Federal Land Policy and Management Act, Mineral Leasing Act, and Federal Coal Leasing Amendments Act instruct Interior to harmonize the need for domestic mineral production with long-term
An aerial view of land in the Powder River Basin from 1973, before the region was heavily disturbed by coal mining.Photo © Boyd Norton, Environmental Protection Agency, 1973

15
environmental protection and stewardship of public lands. The statutes’ references to “multiple use,” “sustained yield,” and direction to prevent undue waste and degradation imply a calculus that balances resource extraction with long-term environmental protection.
This reading of the statutory framework also aligns with a general economic perspective that seeks to manage shared resources in such a way as to maximize social welfare. For example, from a sustainable economic development standpoint, coal should be produced until its marginal benefit equals its marginal cost, including any negative externality costs of production (such as pollution).109 The Hotelling rule for optimal resource extraction requires resource extraction until the marginal benefit of using the resource is equal to the sum of extraction, user, and externality costs.110 Thus, application of the Hotelling rule should result in an optimal drawdown of non-renewable resources.
While a full discussion of these economic principles is beyond the scope of this report, they can serve as a useful organizing framework for Interior. Interpreting “fair market value” broadly to account for the cost of externalities and the option value inherent in natural resource leasing should result in more socially optimal resource management. Indeed, such an interpretation is consistent with the Federal Land Policy and Management Act’s instruction to manage federal lands pursuant to the principles of “multiple use and sustained yield,” and in the “combination that will best meet the present and future needs of the American people,” including “the use of some land for less than all of the resources.”111
Federal Law Requires that Interior Receive Fair Market Value for the Rights It Conveys
The Federal Land Policy and Management Act requires that the United States “receive fair market value of the use of the public lands and their resources unless otherwise provided for by statute.”112 The term “fair market value” is not defined in the statute itself. In 1982—the last time that Interior convened a working group to comprehensively review its “fair market value” procedures—the task force determined that “fair market value” was not merely the value of the resource discovered or produced, but the value of “the right” to explore and, if there is a discovery, to develop and produce the energy resource.113 Indeed, the statute refers to the value of using the lands, and not solely to the value of the resources.
The Mineral Leasing Act does not contain an explicit “fair market value” requirement. However, it states that the Secretary of the Interior can include coal, oil, or gas lease terms that she or he deems necessary “to insure the sale of the production of such leased lands to the United States and to the public at reasonable prices, for the protection of the interests of the United States, for the prevention of monopoly, and for the safeguarding of the public welfare.”114
In the early 1970s, to address growing concerns regarding speculative leasing and failure to obtain fair value, Congress enacted the Federal Coal Leasing Amendments Act of 1976, which amended the Mineral Leasing Act to require competitive bids and to specify that no bid may be accepted which is less than “the fair market value, as determined by the Secretary, of the coal subject to the lease.”115 The Act established diligent development requirements to reduce speculation and instituted minimum royalty rates.116 This language replaced more flexible language in the Mineral Leasing Act that had authorized the Secretary to negotiate sales as provided in regulations.
16
Today, fair market value is defined in BLM’s economic valuation handbook as “the amount in cash, or on terms reasonably equivalent to cash, for which, in all probability, the property would be sold by a knowledgeable owner willing but not obligated to sell to a knowledgeable purchaser who desired but is not obligated to buy.”117 A knowledgeable owner would be expected to care about the externalities affecting them directly, such as potential air, water, and noise pollution from leasing land they own for fossil fuel production.
Fair market value should be understood within the broader context and goals of the Federal Land Policy and Management Act, Mineral Leasing Act, and Federal Coal Leasing Amendments Act. If the fair market value requirement is interpreted broadly—in line with the statutory mandate to harmonize production with conservation—it can maximize the social return of coal mining. A robust definition of fair market value, then, should include: the market price of the coal resource, the option value of leasing that resource, and the social cost of mining—the cost to American taxpayers of mining on public lands due to non-internalized externalities. This broader definition would be consistent with Interior’s dual mandate to earn a fair return on development of energy resources, and to preserve and protect the environment.
In the recommendations section, we propose reforms that will allow BLM to recover the option value of leasing and the cost of coal production externalities, which should also incentivize socially optimal levels of production.

17
Part IV. Recommendations for Reform
T he following recommendations aim to help Interior modernize the coal program, with the goal of maximizing social welfare and harmonizing coal production with environmental conservation.
The Federal Land Policy and Management Act requires that the United States “receive fair market value of the use of the public lands and their resources unless otherwise provided for by statute.”118 A robust definition of fair market value should include the market price of the coal resource, the option value of leasing that resource, and the social cost of mining. At the bidding stage, BLM should be compensated for the estimated market price of the coal to be leased, as well as the option value of mining coal, as both of these are fixed costs. Environmental and social externalities from coal production vary with the amount of coal produced; therefore, these costs are best recouped through royalties, as discussed below.
BLM’s internal “fair market value” calculations and minimum bid should account for the option value, or informational value of delay, of natural resources leasing
BLM fails to address the environmental and social option value of coal leasing. Option value, or the informational value of delay, is relevant for coal prices, as well as environmental and social costs (including methane emissions, water use, and water pollution, to name a few) and future technological changes that could make mining more efficient or reduce pollution. In fact, coal companies themselves routinely account for option value with respect to coal pricing, which explains their longstanding practice of stockpiling leases, yet waiting years to begin production.119
Accounting for option value does not always require that the government postpone issuing leases; rather, it requires that the government is adequately compensated for the value that it foregoes by not waiting to have more information before making a decision. BLM’s failure to account for option value in its internal fair market value calculations systematically undervalues this public non-renewable resource, and may contribute to leasing too much coal, too early, and at too low of a price.
First, with respect to price uncertainty, Interior holds—on behalf of the American public—perpetual options to develop or lease oil, gas, and coal tracts; the agency must decide when and where exercising those options will be most opportune. When BLM sells a coal lease, the federal government’s perpetual option is converted to a time-limited option held by the lessee, lasting for the 20-year duration of the lease. A perpetual option is more valuable than a time-limited option, as it gives the option holder the power to wait, indefinitely, for more information (or for prices to rise) before making an irreversible decision. Thus, when the federal government sells a private lessee the right to develop a coal tract, it extinguishes the perpetual option that the government holds on behalf of the American people, and sells a time-limited option. Interior does not account for the lost value of its perpetual option in the price of its leases. As a result, the public does not receive the full value of the right to exploit its resources.

18
Second, BLM fails to account for environmental and social uncertainty when assessing fair market value and setting the minimum bid for coal leases. The environmental, social, and economic uncertainties associated with coal mining include:
• Uncertainty about the magnitude of risk from externalities, such as methane emissions, particulate matter emissions, and potential aquifer overdraft. As a recent example, methane leakage from natural gas gathering facilities was recently found to be 8 times higher than prior EPA estimates;120
• Uncertainty about the development rate of pollution-prevention technologies, as well as technologies that may better protect worker safety;
• Uncertainty with respect to the cost of externalities, including the social cost of carbon and the social cost of methane;
• Uncertainty about competing uses of federally-owned lands, such as the potential and need for renewable energy siting;
• Uncertainty with respect to coal reserve estimates, which may affect the long-term availability and price of accessible coal; and
• Uncertainty with respect to climate sensitivities, such as climate conditions that may exacerbate the damaging effects air or water pollution, or consequences for land values near production sites.121
These uncertainties can and should be accounted for when evaluating which parcels to offer for leasing, as well as when determining fair market value for coal tracts. As BOEM recently acknowledged, the option value associated with these uncertainties is a component of the fair market value of the right to develop public resources.122 Moreover, the non-competitive nature of federal coal lease sales all but guarantees that the full value of the government option is not captured in the bid price.
BLM should issue guidance to regional managers instructing them to incorporate option value when calculating fair market value
Because individual fair market value calculations are done for each lease sale by the BLM regional office where the leasing takes place, BLM should instruct regional offices to incorporate option value into to their internal calculations. It can do so by updating its Coal Evaluation Manual and Handbook, without the need to propose a new rulemaking. Or, it can revise its current regulations to require or encourage the use of option value in fair market value appraisals.
As described above in Part II, BOEM currently evinces a more sophisticated understanding and application of option value than BLM. BLM should review BOEM’s latest five-year plan for offshore oil leasing, which describes its use of “hurdle pricing” to account for price uncertainty, as well as its qualitative treatment of option value.123
Further, BLM should review and adopt BOEM’s language on the utility of option value to both its program-level and lease sale decisions.124 As the D.C. Circuit affirmed, there is “a tangible present economic benefit to delaying the decision to drill,” and failing to account for this value undervalues public resources.125 While BOEM does not yet quantitatively assess environmental or social option value, BLM should adopt BOEM’s approach to option value as a starting point, and consult with BOEM’s economists and staff about further improving fair market value estimates.

19
BLM should also examine how to conduct more long-term strategic planning, as BOEM does; for example, it should consider reinstating the Powder River Basin’s status as a “coal production region.”126
BLM can use Appendices C and D of this report to help quantify the option value associated with coal leasing. Interior should also consider organizing a working group to further evaluate methods to use and quantify option value for both offshore and onshore natural resources leasing.
Finally, BLM should include the fixed social costs of mining—such as lost scenic or recreational value from exclusion to the tract—in setting the internal fair market value. Because these costs are incurred immediately after a lease is sold, they are fixed social costs that are best recouped through the bonus bid. (See Appendices A, B, and D.)
Interior should raise minimum bids to account for inflation, the fixed social costs of mining, and option value
BLM should also evaluate how to incorporate option value into minimum bids for coal leases. Interior has allowed the minimum bid to remain at $100 per acre since 1982.127 BLM has the authority, pursuant to the Mineral Leasing Act and Federal Coal Leasing Amendments Act, to increase minimum bids. It can and should evaluate what level of bid increase is necessary in order to account for the value of the government’s perpetual option for coal leasing.
To better serve the intended purpose of the minimum bid—to serve as a floor price for “fair market value”—the minimum bid should be raised to account for both inflation and the option value of coal leasing. The Center for American Progress, for example, suggests raising the minimum bid to $1 per ton, the average market price of coal during the Obama Administration.128 Without assessing the merits of using that specific value, the minimum bid
T. B. Simon Power Plant at Michigan State University. The plant provides electricity, heating, cooling , and water to the East Lansing campus. Its primary fuel is coal. Photo © Michael P. Kube-McDowell

20
should be adjusted upwards to account for the option value of the coal resource, and to approximate the true value of the coal leased on the modern market.
As described above, BLM should, at minimum, catch up with BOEM’s understanding and application of option value. BLM should also use the appendices of this report to help quantify the option value associated with coal leasing.
Finally, BLM should include the fixed social costs of mining—such as lost amenities (i.e., lost public access to recreation) or public funding of reclamation—in the minimum bid price. (See Appendices A, B, and D.) Accounting for the fixed social costs of selling the coal tract assumes that the next-best use of the tract has zero externalities, which is a reasonable assumption for Western tracts that would otherwise be used for scenic or recreational purposes. If the next-best use of the tract presented its own externalities, Interior should also be compensated for these social costs, for example, through bid prices for renewable energy production.
Interior should calculate royalties using the market price of coal, not the first sale price
Due to a history of captive transactions and to earn a more fair return, Interior’s Office of Natural Resources Revenue should calculate royalties due using the price of coal at its final point of sale, rather than at the first arm’s length transaction. This would ensure that coal companies pay royalties on the market value of federal coal. Further, this adjustment can be done easily, by changing BLM guidance, and it would apply to both new and existing leases as soon as implemented.
Independent analysis by Headwaters Economics recently found that using market prices in royalty valuation—as opposed to the current practice of using the first arm’s length sale price—would increase royalty revenue by $139 million annually (a 20% increase).129 If transportation deductions were limited to just 50 percent of the net delivered price of coal, revenue would increase by $512 million annually (a 73% increase). The study found that demand for coal for the domestic power sector would fall by only 0.2 percent in the first scenario, and 1 percent in the second scenario.130
Moving the point of coal valuation from the mine price to the market price would also increase transparency, lower administrative costs for Interior, and allow for a more accurate assessment of whether taxpayers are receiving a fair return.
Interior should adjust the royalty rate to account for the environmental and social costs of coal production
Interior should comprehensively review the royalty rates for surface and underground coal, in order to assess how an increase in royalty rates might affect overall returns and better meet the mandates of the Federal Land Policy and Management Act, Mineral Leasing Act, and Federal Coal Leasing Amendments Act. Many of the factors that led Interior to update its offshore royalty rates in 2007 have been present in the onshore coal market for nearly as long (if not longer), such as technological advancement, political stability, and relatively high resource prices.
Second, Interior should consider increasing minimum royalty rates above current levels to account for foreseeable environmental and social costs of production (see Appendices A, B and D). For all leases obtained competitively,

21
BLM is permitted to negotiate royalty rates on a lease-by-lease basis; however, most federal leases are set at or near the statutorily prescribed minimum of 12.5 percent for surface coal production.131 A new royalty rate would apply only prospectively to new leases, leaving the current rate for existing leases unchanged.
A royalty rate that would lead to a more socially optimal level of extraction, and fairer return, should account for: (1) the cost of production-related environmental externalities; (2) the cost of transportation-related externalities, including CO2 emissions; (3) uncompensated infrastructure demand (e.g., water, power, processing facilities); and (4) any foreseeable “waste” of the resource, such as vented or flared methane associated with coal production.132
Methane emissions provide a good illustration of why a tailored approach to the royalty rate makes sense for coal leases. Technology exists to safely capture and exploit mine methane for profit, as the majority of methane is comprised of natural gas, which can be processed and sold for end use.135 BLM’s current leasing regime, however, encourages suboptimal levels of capture and abatement, both because coal lessees often lack a clear legal right to exploit mine methane and because the lessees do not internalize the full social costs of their methane emissions.136
First, even if an operator has the legal right to capture the methane released by its mining operations, it will likely capture (and abate) methane emissions at suboptimal levels, because a rational private actor will capture methane emissions only up to the level where the resale value of the gas covers its gathering and capture costs. But because methane is a global externality and potent greenhouse gas, to maximize social welfare a coal producer should capture a unit of methane whenever the commercial value of the gas plus the avoided social costs of venting it outweigh the cost of capture. BLM can incentivize coal operators to capture and abate socially optimal volumes of methane by exercising the power to adjust coal royalty rates to reflect both the social costs and foregone commercial value of the methane projected to be released as a result of the operators’ mining. If forced to internalize these costs, coal operators should engage in all capture and abatement activities that are cost‐benefit justified.
Second, different mineral estates are leased separately, so a mining company that secures a coal lease does not automatically secure the right to produce coal seam gas.137 While coal lessees lack an implied right to commercially exploit mine methane, BLM should use its broad authority under the Mineral Leasing Act to grant coal lessees an express right to do so. At least one regional BLM office has issued “addenda” to an existing coal lease that authorize the coal lessee to capture for use or sale “any combustible gas located in, over, under or adjacent to the coal that will or may infiltrate underground mining operations” (i.e., mine methane).138 The negotiation of such addenda is consistent with BLM’s statutory authority, which states that BLM can set “such other terms and conditions as the Secretary [of the Interior] shall determine.”139 And the Act expressly contemplates the inclusion of terms aimed at “the prevention of undue waste.”140 Further, in Vessels Coal Gas, Inc., the Interior Board of Land Appeals held that “BLM bears no obligation to conduct a public competitive MLA lease sale” before allowing mine methane to be captured and used or marketed.141 Accordingly, BLM should explicitly authorize the capture and exploitation of mine methane in future coal leases and lease renewals, when not inconsistent with other pre-existing ownership claims.
Coalbed Methane: Cloudy Ownership Issues and Potent Externalities

22
Appendix B of this report contains economic analysis that estimates the average cost of upstream externalities associated with coal production from the Powder River Basin. Using the results of Epstein et al (2012), the analysis finds a best variable cost estimate for coal mining in the Powder River Basin to be $5.06 per metric ton of coal, in 2015 dollars.133 If the external costs of non-GHG air pollution (ozone and particulate matter) from rail transport are included and adjustments to Epstein et al (2012) are made to coincide with the latest climate research (IWG, 2015; IPCC, 2014), the best estimate of the variable costs increases to $12.93 per metric ton of coal. Appendix B contains information about the methodology used to derive these estimates, and Appendix D discusses integrating these costs into royalty rates. In addition, both estimates likely underestimate the variable social cost of mining because they exclude multiple environmental impacts, including GHG emissions from rail transportation and the over-use of water resources. In order to secure fair market value, Interior’s royalty rates should be structured to recoup the cost of these known social costs.
As an alternative to an across-the-board royalty rate increase (applied nationally or regionally), BLM could calculate externality adjustments on a lease-by-lease basis. For individual leases, BLM could assess foreseeable environmental and social costs by converting projections found in site-specific assessments and environmental impact statements, required by NEPA, into “externality adjustments” that may raise the royalty rate for certain leases by a certain percentage. Or alternatively, BLM could determine that a lessee qualifies for a rate reduction; this may be appropriate, for example, if overall royalty rates are raised to account for externalities, but a particular lessee already eliminated those externalities through pollution control techniques. Such an adjustment could be made on a lease-by-lease basis, and be tailored to the type of resource to be extracted, method of production, and type and extent of the anticipated externalities. Relying on NEPA documents would appropriately narrow the agencies’ attention to “reasonably foreseeable environmental effects of the action,” rather than every conceivable possibility.134
In all, in order to earn fair market value, Interior’s royalty rates should be structured to recoup the cost of externalities, whether through an across-the-board royalty rate increase (applied regionally or nationally), or through lease-specific royalty rate adjustments.
BLM should eliminate royalty relief provisions and transportation deductions that provide improper incentives and fail to provide a fair return
Royalty rate reductions occurred on approximately 36 percent of leases offered for sale since 1990.142 These rate reductions distort the energy market by subsidizing coal production, even in cases where production may be uneconomical.
Under current regulations, BLM has discretion to grant royalty rate reductions if: (i) the royalty rate reduction encourages the greatest ultimate recovery of the coal resource; (ii) the rate reduction is in the interest of conservation of the coal and other resources; and (iii) the rate reduction is necessary to promote development of the coal resource.143 Interior should eliminate this regulation. This practice amounts to a subsidy for coal, and there is no reason for the federal government to privilege one form of energy production over another. The government should not be in the business of supporting uneconomical coal production from public lands, at a potential loss to taxpayers.
Coal lessees are also allowed to deduct transportation costs from the total sale price upon which federal coal royalties are calculated, when royalties are based on sales remote from the mine.144 As a practical matter, the transportation deduction is used sparingly by Powder River Basin coal producers, as most companies sell their coal at the mine

23
mouth, making transportation costs irrelevant to the royalty assessment. However, if Interior changes the point of valuation for coal royalty rates to the final delivery point or another point remote from the mine, as it is considering,145 then transportation costs will become more relevant to royalty payments. In such a scenario, the transportation deduction would translate into an allowance for the full cost of transporting federal coal from the mine to a remote point of sale; this would eliminate the incentive for companies to find the most efficient and lowest-cost mode of transportation.
Interior should strongly consider eliminating, or at least capping, the coal transportation allowance in order to maintain internal incentives for efficient transportation and prevent gaming. An unlimited transportation allowance is simply a subsidy for coal. This allowance distorts the market by subsiding coal’s full transportation costs, when no equivalent allowance is afforded to other energy resources (oil and gas transportation allowances are capped at 50 percent of the value of the resource).146 It also potentially contributes to increased externalities in the form of transportation-related CO2 emissions, because energy producers have less incentive to locate coal production closer
Types of Coal Produced in the United States (Source: U.S. Energy Information Administration (2011)151 and Union of Concerned Scientists152)
While almost all coal consumed in the United States is used to generate electricity, coal is classified into four types, distinguished by the amount of heat it produces. Coal with higher levels of heat content and lower sulfur levels is typically more valuable. The four main types of coal produced in the United States are:
Subbituminous: Subbituminous coal makes up 47% of U.S. coal production by weight and 41% by energy intensity. Generally used for electricity generation in power plants, subbituminous coal contains 35% to 45% carbon. Large quantities of this coal are found in thick beds near the surface, resulting in low mining cost and, correspondingly, lower prices. Western coal is mostly subbituminous. Wyoming produces the majority of subbituminous coal in the United States. It has an energy content of about 18 million Btu per ton. Wyoming coal is only 0.35 percent sulfur by weight.
Bituminous: The oldest and most abundant coal type found in the United States, bituminous coal makes up 45% of U.S. coal production by weight 54% by energy intensity. Bituminous coal has a wide range of carbon content (45% to 86%), and is mainly used as a fuel to generate electricity, as well as coking coal to produce steel. Bituminous coal comes mostly from the Appalachian Basin and the Midwest. West Virginia leads production, followed by Kentucky and Pennsylvania. It has a high energy content, averaging 24 million Btu per ton. Kentucky bituminous coal is 1.59 percent sulfur by weight.153
Lignite: Lignite is used in electricity generation and comprises 7% of U.S. coal production by weight and 5% by energy intensity. Lignite has a low carbon content (25% to 35%), and Texas and North Dakota are its main producers. Lignite has a low energy content, typically about 13 million Btu per ton.
Anthracite: Rare in the United States, anthracite comprises only 0.2% of total coal production. All of the anthracite mines in the U.S. are located in northeast Pennsylvania. Anthracite has the highest carbon content (86% to 97%), and energy content around 23 million Btu per ton. It also tends to have a high sulfur content.

24
to end users (such as power plants) or to find the most efficient means of transport. As a result, these subsidies increase reliance on fossil fuels, and mask their true social costs.147 If Interior decides to preserve the transportation allowance, it should cap it and take steps to encourage efficient transportation, for example, by using a publicly available index of transportation costs to calculate the allowance, rather than relying on company-reported costs.
Evaluating Substitution Effects
Eliminating allowances or raising royalty rates could have the effect of shifting some development from federal lands to state and private lands. Or, it could have the effect of increasing demand for other energy resources, such as natural gas, oil, or renewable energy. This substitution effect is commonly referred to as leakage. Interior should evaluate the probability of such substitution effects as a result of updating the fiscal terms of coal leasing.
With respect to leakage from coal to another resource produced on federal land, the externalities from these alternative energy sources could theoretically be higher or lower than the production of coal on public lands. However, consistent with the recommendations of this report, Interior should also account for the upstream externalities associated with these other energy sources when managing leasing and setting their fiscal terms. Given that coal has one of the highest levels of externalities according to most lifecycle analyses, coal is a reasonable resource with which to start this update in bid prices and royalty rates.
Interior should also study the potential leakage of coal from federal lands to private or state lands, if bids and royalty rates are increased. There is evidence that the most attractive federal parcels, where coal discovery and development prospects are strongest, would likely continue to be sold at auction.148 Headwaters Economics estimated the
A coal washer located in Clay County in Eastern Kentucky.Photo © Jfacew

25
magnitude of changes in coal prices, coal production, and overall revenue associated with using the market (net delivered) price of coal, rather than the first arm’s length sale price, for royalty valuation, and found that “changes in federal royalty policy could have substantial revenue benefits for federal and state governments, with limited impact on coal production from federal lands.”149
Moreover, coal basins in the United States produce different types of coal; coal resources are not fully fungible among basins, especially as Powder River Basin coal is low sulfur, subbituminous coal that requires no washing, whereas Appalachian coal has higher sulfur content and requires washing. Low sulfur coal releases less soot and smog forming pollutants than Appalachian coal when it is burned, which is important for compliance with Clean Air Act regulations. Sulfur dioxide, particulate matter, and nitrogen oxide emissions are currently regulated for coal-burning power plants, and mercury and air toxics standards are expected to be fully implemented in 2016.150 As described in Appendix D, we believe that the leakage rate to private coal will be relatively limited due to the lower production costs and sulfur content of Western coal.
To summarize our principal recommendations, a robust definition of fair market value should include the market price of the coal resource, the option value of mining that resource, and the social cost of mining. At the bidding stage, BLM should be compensated for the estimated market price of the coal to be leased, as well as for the option value of leasing coal. Interior’s royalty rates should be structured to recoup the cost of known, variable externalities, whether through an across-the-board royalty rate increase, or through lease-specific royalty rate adjustments. Royalty relief for uneconomical mines and deductions for transportation should be curtailed, as these are merely subsidies for coal production.
26
Part V. Economic Analysis
T his report is accompanied by Appendices A through D, which contain economic analysis detailing: (a) the externalities of coal mining; (b) an estimate of the monetary value of coal production externalities; (c) methods for measuring option value; and (d) methods for integrating externalities and option value
into minimum bids and royalty rates. These appendices build on and provide economic support for many of the recommendations in this report.
Part VI. Conclusion
I nterior has the obligation and statutory authority to make changes to the federal coal leasing program in order to earn a fair return for the American people and protect the environment. The recommendations in this report aim to both earn fair market value for taxpayers and reduce the social costs of mining on federal lands. Interior
should not hesitate to implement these reforms in order to modernize the federal coal production and best effectuate its dual mandate.
Endnotes
1 U.S. Energy Information Administration, Sales of Fossil Fuels Produced from Federal and Indian Lands, FY 2003 through FY 2012 at 4 ( June 2014), available at http://www.eia.gov/analysis/requests/fed-erallands/pdf/eia-federallandsales.pdf.
2 Nidhi Thakar and Michael Madowitz, Federal Coal Leasing in the Powder River Basin, Center for American Progress (2014), available at https://cdn.americanprogress.org/wp-content/uploads/2014/07/ThakarPowderRiver-brief.pdf. The authors’ calcula-tions were based on 2012 data from the U.S. Energy In-formation Administration and the U.S. Department of the Interior’s Office of Natural Resources Revenue. See U.S. Energy Information Administration, Coal Data Browser, available at http://www.eia.gov/beta/coal/data/browser/; Dept. of the Interior, Office of Natural Resources Revenue, Statistical Infor-mation, available at http://statistics.onrr.gov/Report-Tool.aspx.
3 Tom Sanzillo, The Great Giveaway: An analysis of The United States’ Long-Term Trend of Selling Feder-ally Owned Coal for Less Than Fair Market Value, In-stitute for Energy Economics and Financial Analysis ( June 2012), available at https://docs.google.com/file/d/0B_qWeYLAqoq1V2YyX3hnR25l-cXM/edit. The author conducted independent analysis and found that as a result of policy choices and a sub-jective, flawed fair market value appraisal process, the U.S. Treasury lost almost $30 billion in revenue from the coal program during the past 30 years.
4 U.S. Dept. of the Interior, Press Release: Interior Department Announces Series of Public Listening Ses-sions on Federal Coal Program ( July 9, 2015), avail-able at http://www.blm.gov/wo/st/en/info/news-room/2015/july/nr_07_09_2015.html.
5 U.S. Bureau of Land Management, Wyoming Di-vision, Powder River Basin Coal, available at http://www.blm.gov/wy/st/en/programs/energy/Coal_Re-sources/PRB_Coal.html (last updated Sept. 10, 2015).
6 U.S. Energy Information Administration, An-nual Coal Report (April 23, 2015), available at http://www.eia.gov/coal/annual/.
7 U.S. Energy Information Administration, Monthly Coal Data: Table 6.1 Coal Overview ( July 28, 2015), available at http://www.eia.gov/totalen-ergy/data/monthly/pdf/sec6_3.pdf (last accessed Sept. 10, 2015 from http://www.eia.gov/coal/data.cfm#summary). In the past decade, production peaked at 1.17 billion short tons in 2008, and declined to 999 million short tons in 2014.
8 U.S. National Research Council, Hidden Costs of Energy: Unpriced Consequences of Energy Production and Use, National Academies Press 72 (2010), available at http://www.nap.edu/cata-log/12794/hidden-costs-of-energy-unpriced-conse-quences-of-energy-production-and.
9 30 U.S.C. § 201(a)(1); Federal Coal Leasing Amend-ments Act of 1975, Pub. L. No. 94-377, 90 Stat. 1083, 1087 (1976), codified as amended at 30 U.S.C. § 181 et seq.
10 U.S. Gov’t Accountability Office, No. GAO-14-140, Coal Leasing: BLM Could Enhance Appraisal Process, More Explicitly Consider Coal Exports, and Provide More Public Infor-mation 16 (Dec. 2013), available at http://www.gao.gov/assets/660/659801.pdf (hereinafter “U.S. Gov’t Accountability Office, Coal Leasing Report”).
11 Id.
12 See 43 C.F.R. § 3400.5.
13 See 43 C.F.R. 3425.0-2; U.S. Bureau of Land Man-agement, History of the Coal Program, available at http://www.blm.gov/wy/st/en/programs/energy/Coal_Resources/PRB_Coal/history.print.html.
14 See Federal Coal Leasing Amendments Act of 1975, Pub. L. No. 94-377, 90 Stat. 1083, 1087 (1976), codi-
27

28
fied as amended at 30 U.S.C. § 181 et seq. The statute states: “No lease sale shall be held unless the lands containing the coal deposits have been included in a comprehensive land-use plan and such sale is compat-ible with such plan. The Secretary of the Interior shall prepare such land-use plans on lands under his respon-sibility where such plans have not been previously pre-pared.” 30 U.S.C. §201(a)(3)(A)(i).
15 Id.
16 U.S. Bureau of Land Management, Coal Opera-tions; Competitive Leasing Process, available at http://www.blm.gov/wo/st/en/prog/energy/coal_and_non-energy.html (last updated Aug. 22, 2014).
17 See id; Sanzillo, The Great Giveaway, supra note 3 at 20.
18 Energy Policy Act of 2005, Pub. L. No. 109-58 (Aug. 8, 2005).
19 U.S. Gov’t Accountability Office, Coal Leasing Report, supra note 10 at 15.
20 U.S. Department of the Interior, Office of In-spector General, No. CR-EV-BLM-0001-2012, Coal Management Program, U.S. Department of the Interior 13 (2013), available at http://www.eenews.net/assets/2013/06/11/document_pm_01.pdf (hereinafter “Inspector General Report”).
21 30 U.S.C. § 201(a)(1) (emphasis added).
22 43 C.F.R. § 3422.1(c)(2); see also U.S. Gov’t Ac-countability Office, Coal Leasing Report, supra note 10 at 9.
23 U.S. Bureau of Land Management, Coal Opera-tions: Competitive Leasing Process, available at http://www.blm.gov/wo/st/en/prog/energy/coal_and_non-energy.html (last updated August 22, 2014).
24 Winning bids are publicly available. See, e.g., U.S. Bu-reau of Land Management, Powder River Basin Coal Leases by Application, available at http://www.blm.gov/wy/st/en/programs/energy/Coal_Resourc-es/PRB_Coal/lba_title.html (last updated March 31, 2015).
25 U.S. Gov’t Accountability Office, Coal Leasing Report, supra note 10 at 28.
26 U.S. Bureau of Land Management, No. H-3073-1, Coal Evaluation Handbook 4-1 (Oct. 2, 2014), available at http://www.nma.org/attachments/ar-ticle/1923/BLM%20Coal%20Evaluation%20Hand-book%20H-3073-1.pdf.
27 Id.
28 U.S. Gov’t Accountability Office, Coal Leasing Report, supra note 10 at 28.
29 U.S. Gov’t Accountability Office, Coal Leas-ing, supra note 10 at 28.
30 Three of these sales occurred in the 1990s, and one oc-curred in 2007. Id. at 33.
31 Inspector General Report, supra note 20 at 1-3.
32 Id. at 1.
33 See 43 C.F.R. § 3432.2(c).
34 43 C.F.R. § 3432.2(a).
35 U.S. Gov’t Accountability Office, Coal Leasing Report, supra note 10 at 1.
36 Inspector General Report, supra note 20 at 7.
37 U.S. Energy Information Administration, Short-Term Energy Outlook Coal (Sept. 9, 2015), available at http://www.eia.gov/forecasts/steo/report/coal.cfm. In 2013, 117.7 million short tons were exported. In 2014, 97.3 million short tons were exported.
38 Id. Coal exports for the first half of 2015 are down 20% compared with the same period in 2014.
39 Id. In a 5-4 ruling in June 2015, the U.S. Supreme Court sent the Mercury and Air Toxics Standards back to the D.C. Circuit, finding that EPA should have consid-ered costs when it found that it was “appropriate and necessary” to regulate hazardous air emissions from power plants. Michigan v. EPA, 135 S. Ct. 2699 ( June 29, 2015). The Supreme Court left the rule in effect on remand. EPA has requested that the D.C. Circuit keep the rule in place while it addresses the costs. The agency committed to formally considering the costs of the rule
by April 15, 2016, the compliance date for power plants that asked for a one-year extension to the rule.
40 U.S. Energy Information Administration, Anal-ysis of the Impacts of the Clean Power Plan (May 22, 2015), available at http://www.eia.gov/analysis/re-quests/powerplants/cleanplan/. For example, the EIA found that using the proposed Clean Power Plan as modeled using EIA’s National Energy Modeling Sys-tem, projected U.S. coal production in 2020 and 2025 will be 20% and 32% lower relative to the baseline level in those years, respectively.
41 Clark Williams-Derry, Unfair Market Value: By Ignor-ing Exports, BLM Underprices Federal Coal, Sight-line Institute (2014), available at http://www.sight-line.org/research/unfair-market-value/. The report de-scribes several instances of this practice. For example, Cloud Peak Energy purchased coal at its Spring Creek Mine for $0.11 and $0.18 per ton and sold much of this coal abroad for more than $60 per ton.
42 U.S. Bureau of Land Management, No. MS-3073, Coal Evaluation Manual (Oct. 2, 2014); U.S. Bu-reau of Land Management, Coal Evaluation Hand-book, H-3073-1 (Oct. 2, 2014).
43 Michael A. Livermore, Patience is an Economic Virtue: Real Options, Natural Resources, and Offshore Oil, 84 U. Colo. L. Rev. 581, 589 (2013).
44 See, e.g., Sanzillo, The Great Giveaway, supra note 3 at 11-12.
45 U.S. Bureau of Ocean and Energy Management, 2017-2022 Outer Continental Shelf Oil and Gas Leasing Draft Proposed Program at 5-20, 8-3 to 8-19 (2015), available at http://www.boem.gov/2017-2022-DPP/ [hereinafter “2017-2022 Draft Proposed Program”].
46 U.S. Bureau of Ocean and Energy Management, Regulation and Enforcement Manual, 610.1: Fair Market Value § 1 (Oct. 25, 2010).
47 U.S. Bureau of Ocean and Energy Management, 2017-2022 Draft Proposed Program, supra note 45 at 8-1.
48 Center for Sustainable Economy v. Jewell, 779 F.3d 588 (D.C. Cir. Mar. 6, 2015). Policy Integrity served as counsel to Petitioner, Center for Sustainable Economy. See also Opening and Reply Briefs for Petitioner.
49 Id. at 610 (emphasis added).
50 Id. at 611.
51 Id.
52 30 U.S.C. §207(a).
53 U.S. Gov’t Accountability Office, Coal Leasing Report, supra note 10 at 23, 25.
54 U.S. Department of Interior, Office of Natural Resources Revenue, Natural Resource Revenues from U.S. Federal Lands, available at https://useiti.doi.gov/.
55 U.S. Gov’t Accountability Office, Coal Leasing Report, supra note 10.
56 43 C.F.R. § 3422.1(c)(2).
57 The minimum bid of $100 per acre, or the equivalent in cents per ton, was set by regulation in 1982. See 43 C.F.R. § 3422.1(c)(2). The rental rate of $3 per acre was set in 1979. See id., § 3473.3-1 (a).
58 See 51 Fed. Reg. 18,886 (May 23, 1986).
59 See, e.g., U.S. Bureau of Land Management, Pow-der River Basin Coal Leases by Application, available at http://www.blm.gov/wy/st/en/programs/energy/Coal_Resources/PRB_Coal/lba_title.html (last up-dated March 31, 2015).
60 U.S. Gov’t Accountability Office, Coal Leasing Report, supra note 10 at 26.
61 Id.
62 30 U.S.C. § 207; see also Federal Coal Leasing Amend-ments Act of 1975, Pub. L. No. 94-377, 90 Stat. 1083, 1087 (codified as amended at 30 U.S.C. § 181 et seq.).
63 43 C.F.R. § 3473.3-1(a).
64 43 C.F.R. § 3473.3-1(a).
29
30
65 According to the Bureau of Labor Statistics, $3.00 in 1979 has the same buying power as $9.86 in 2015 dollars. Bureau of Labor Statistics, CPI Inflation Calculator, available at http://www.bls.gov/data/infla-tion_calculator.htm.
66 For a more detailed discussion of potential rental rate reforms, please see Jayni Foley Hein, Harmonizing Pres-ervation and Production: How Modernizing the Depart-ment of the Interior’s Fiscal Terms for Oil, Gas, and Coal Leases Can Ensure a Fair Return to the American Public, Institute for Policy Integrity, NYU School of Law ( June 2015), http://policyintegrity.org/files/publications/DOI_LeasingReport.pdf.
67 30 U.S.C. § 207(a); Federal Coal Leasing Amendments Act of 1976, Pub. L. 94-377, 90 Stat. 1083 (Aug. 4, 1976).
68 Id. § 226(l).
69 30 U.S.C. § 209.
70 43 U.S.C. § 1337.
71 U.S. Government Accountability Office, No. GAO-14-50, Oil and Gas Resources: Actions Needed for Interior to Better Ensure a Fair Re-turn 13–14 (Dec. 2013), available at http://www.gao.gov/assets/660/659515.pdf.
72 Hon. Ken Salazar, Secretary of the Interior, “Interior, Environment, and Related Agencies Appropriations for 2013,” Testimony before the House Committee on Appropriations, Subcommittee on Interior, Environ-ment, and Related Agencies (Feb. 16, 2012), pp. 46–47, available at http://www.gpo.gov/fdsys/pkg/CHRG-112hhrg74739/pdf/CHRG-112hhrg74739.pdf (“The President’s budget includes an estimated royalty rate which is at 18.75 percent for the onshore. The underly-ing principle is we are mandated by statute, mandated by fairness to make sure the American taxpayer is get-ting a fair return for the assets the American people own.”).
73 U.S. Department of the Interior, Advanced No-tice of Proposed Rulemaking: Oil and Gas Leasing: Royalty on Production, Rental Payments, Minimum Acceptable Bids, Bonding Requirements, and Civil
Penalty Assessments, RIN 1004–AE41, 80 Fed. Reg. 22148, 22152 (April 21, 2015).
74 See Appendix A for more detail and scientific studies (citing Berry et al., 1995; Berry et al., 1998, Krupnick and Burtraw, 1996; NRC, 2010).
75 U.S. Environmental Protection Agency, In-ventory of U.S. Greenhouse Gas Emissions and Sinks: 1990 – 2013, Tables 2-1 and 2-2: Recent Trends in U.S. Greenhouse Gas Emissions and Sinks (April 15, 2015), available at http://www.epa.gov/climat-echange/Downloads/ghgemissions/US-GHG-Inven-tory-2015-Main-Text.pdf.
76 IPCC Working Group I, Fifth Assessment Re-port, Climate Change 2013: The Physical Sci-ence Basis, Chapter 8: Anthropogenic and Natural Radiative Forcing (2014) at 714 (Table 8.7), available at https://www.ipcc.ch/pdf/assessment-report/ar5/wg1/WG1AR5_Chapter08_ FINAL.pdf.
77 U.S. Environmental Protection Agency, Coalbed Methane Outreach Program: Promoting CMM Recov-ery and Use (Nov. 2014), available at http://www.epa.gov/cmop/docs/CMOP-General-Flyer.pdf.
78 See Appendix A and citations therein.
79 Id. In addition, 80 percent of Eastern coal is washed, us-ing an additional 20 to 40 gallons of water per ton of coal.
80 See Appendix A. Groundwater is a common resource, and as such suffers from a tragedy of the commons. There is some evidence that mining is leading to the draining of some aquifers that are used for alternate uses, such as drinking water and livestock.
81 See Appendix A and citations therein.
82 Matt Lee-Ashley and Nidhi Thakar, Cutting Subsidies and Closing Loopholes in the U.S. Department of the Interior’s Coal Program, Center for American Progress ( Jan. 6, 2015), available at https://cdn.americanprogress.org/wp-content/uploads/2015/01/CoalSubs-brief2.pdf.
83 See id. at 2.

31
84 A December 2012 Reuters report alleged that compa-nies including Peabody Energy and Cloud Peak En-ergy use trading affiliates to hide profits from overseas sales of Powder River Basin coal, to ensure they only pay royalties to the federal government based on low-er U.S. sales prices. Patrick Rucker, “Asia Coal Export Boom Brings No Bonus for U.S. Taxpayers,” Reuters (Dec. 4, 2012), available at http://www.reuters.com/article/2012/12/04/us-usa-coal-royalty-idUSBRE-8B30IL20121204.
85 Id.
86 See 30 C.F.R. § 1206.255(a) (“For all leases subject to this subpart, royalty shall be computed on the basis of the quantity and quality of Federal coal in marketable condition measured at the point of royalty measure-ment as determined jointly by BLM and ONRR .”).
87 30 U.S.C. §209.
88 43 C.F.R. §§3473.3-2(e), 3485.2(c)(1) (2013).
89 Headwaters Economics, An Assessment of U.S. Federal Coal Royalties Current Royalty Structure, Effective Royalty Rates, and Re-form Options 8 ( Jan. 2015), available at http://headwaterseconomics.org/wphw/wp-content/up-loads/Report-Coal-Royalty-Valuation.pdf (citing U.S. Department of the Interior, Bureau of Land Management, Total Federal Coal Leases in Effect, To-tal Acres Under Lease, and Lease Sales by Fiscal Year Since 1990, available at http://www.blm.gov/wy/st/en/programs/energy/Coal_Resources/coaltables.html); see also Department of the Interior, Bu-reau of Land Management, Wyoming Field Of-fice, Frequently Asked Questions about the Federal Coal Leasing Program: Royalty Rate Reductions, avail-able at http://www.blm.gov/wy/st/en/programs/en-ergy/Coal_Resources/coalfaqs/royalty_rate_reduc-tions.print.html.
90 Headwaters Economics, Royalty Structure Re-port, supra note 89 at 1.
91 Id. at 8; U.S. Gov’t Accountability Office, Coal Leasing Report, supra note 10 at 25.
92 30 C.F.R. § 1206.261 (transportation allowances); 30 C.F.R. §1206.258 (washing allowances).
93 30 C.F.R. § 1206.261(a).
94 See, e.g., Peabody Energy Company, 2014 Form 10-K at 7, available at https://mscusppegrs01.blob.core.windows.net/mmfiles/files/investors/2014%20peabody%20annual%20report.pdf (“Coal consumed in the U.S. is usually sold at the mine with transportation costs borne by the purchaser.”).
95 30 C.F.R. § 1206.109.
96 30 C.F.R. § 1206.109(b).
97 43 U.S.C. § 1701(a)(1).
98 43 U.S.C. § 1701(a)(8).
99 Id.
100 43 U.S.C. § 1701(a)(12).
101 43 U.S.C. § 1712(a)-(c)(1).
102 Id. § 1702(c) (emphasis added).
103 Id.
104 Id.
105 43 U.S.C. § 1732(b).
106 30 U.S.C § 21(a).
107 30 U.S.C. § 187.
108 Id. (emphasis added).
109 See, e.g., Ravago, M., Roumasset, J., Balisacan, A., Eco-nomic Policy for Sustainable Development vs. Greedy Growth and Preervationism, Sustainability Science for Watershed Landscapes, Institute of South-east Asian Studies/Southeast Asian Regional Center for Graduate Study and Research in Agriculture 3-45 (2010), available at http://www.economics.hawaii.edu/research/workingpapers/WP_09-9.pdf; see also Burnett, et. al., Islands of Sustainability in Time and Space, Working Paper No. 2011-13, University of Hawaii Economic Research Organization, Uni-versity of Hawaii at Manoa (2011), available at http://www.uhero.hawaii.edu/assets/WP_2011-13.pdf.
110 Id.

3232
111 43 U.S.C. § 1702(c).
112 43 U.S.C. § 1701(a)(9).
113 U.S. Gov’t Accountability Office, Coal Leasing Report, supra note 10 at 3.
114 30 U.S.C. § 187.
115 Federal Coal Leasing Amendments Act of 1975, Pub. L. No. 94-377, 90 Stat. 1083, 1087 (1976), codified as amended at 30 U.S.C. § 181 et seq.
116 Implementing regulations were adopted in 1979 and 1982.
117 U.S. Bureau of Land Management, No. H-3070-2, Economic Evaluation of Oil and Gas Proper-ties Handbook at I.C, available at http://www.blm.gov/style/medialib/blm/wo/Information_Resourc-es_Management/policy/blm_handbook.Par.39460.File.dat/h3070-2.pdf.
118 43 U.S.C. § 1701(a)(9).
119 See, e.g., Sanzillo, The Great Giveaway, supra note 3 at 11-12.
120 See John Schwartz, “Methane Leaks in Natural-Gas Supply Chain Far Exceed Estimates, Study Says,” N.Y. Times (Aug. 18, 2015), available at http://www.ny-times.com/2015/08/19/science/methane-leaks-in-natural-gas-supply-chain-far-exceed-estimates-study-says.html?_r=1.
121 Many of these uncertainties are detailed in Appendix C of this report.
122 See U.S. Bureau of Ocean and Energy Manage-ment, 2017-2022 Draft Proposed Program, supra note 45 at 5-20, 8-3 to 8-19.
123 Id. at 8-1.
124 Id. at 5-20, 8-3 to 8-19.
125 Center for Sustainable Economy, 779 F.3d at 610.
126 See 43 C.F.R. § 3400.5.
127 43 C.F.R. § 3422.1(c)(2).
128 Nidhi Thakar, Modernizing the Federal Coal Program, Center for American Progress 5 (December 9, 2014), available at https://cdn.americanprogress.org/wp-content/uploads/2014/12/FederalCoal.pdf.
129 Headwaters Economics, Royalty Structure Re-port, supra note 89 at 2.
130 Id.
131 See 30 U.S.C. § 207(a).
132 See, e.g., Jayni Foley Hein, Capturing Value: Science and Strategies to Curb Methane Emissions from the Oil and Natural Gas Sector, Institute for Policy Integ-rity, NYU School of Law (Dec. 2014), available at http://policyintegrity.org/files/publications/Captur-ing_Value_-_Methane_Policy_Brief.pdf.
133 Appendix B at 20; Table B.1.
134 See Theodore Roosevelt Conservation P’ship v. Salazar, 605 F. Supp. 2d 263, 274 (D.D.C. 2009) aff ’d, 616 F.3d 497 (D.C. Cir. 2010); Hammond v. Norton, 370 F.Supp.2d 226, 245–46 (D.D.C. 2005); see also Pub. Utils. Comm’n of Cal. v. FERC, 900 F.2d 269, 282–83 (D.C. Cir. 1990) (finding that NEPA does not require agencies to con-sider environmental effects of actions that are not rea-sonably foreseeable, especially in light of the agency’s discussion of how it would mitigate any effects that may occur in the future); cf. NRDC v. Hodel, 865 F.2d 288, 298–99 (D.C. Cir.1988) (finding a “few sentences” in the Final Environmental Impact Statement insufficient to address the effects of “reasonably foreseeable” ac-tions).
135 U.S. Environmental Protection Agency, Coal-bed Methane Outreach Program: Basic Information, available at http://www.epa.gov/cmop/basic.html.
136 For a more complete explanation of coalbed methane issues, please see the public comments submitted by the Institute for Policy Integrity on BLM’s Advance Notice of Proposed Rulemaking Regarding Waste Mine Meth-ane Capture, Use, Sale, or Destruction, 79 Fed. Reg. 23,923 (Apr. 29, 2014), available at http://policyinteg-rity.org/documents/BLM_Waste_Mine_Methane_ANPR_Comments_June2014.pdf/.
3333
137 In Amoco Production Company v. Southern Ute Indian Tribe, the U.S. Supreme Court recognized that the right to mine coal “implies the right to release gas incident to coal mining where it is necessary and reasonable to do so.” 526 U.S. 865, 879 (1999). But the Court clari-fied that this right does not “imply the ownership of the gas in the first instance.” Id. Instead, it “simply reflects the established common‐law right of the owner of one mineral estate to use, and even damage, a neighboring estate as necessary and reasonable” to the extraction of one’s own minerals. Id.
138 Robert A. Bassett Et Al., U.S. Laws & Poli-cies Regarding Capturing Methane Gas 20 (2009), available at http://www.epa.gov/cmop/docs/cmm_conference_sept09/02bassett_white_paper.pdf (quoting BLM Addendum to Coal Leases C‐1362, COC‐56447, COC‐67011, C‐0117192, D‐044569, COC‐54558, COC‐67232 ( Jan. 14, 2009)).
139 30 U.S.C. § 207(a).
140 30 U.S.C. § 187.
141 175 IBLA 8, 26 (2008). The Interior Board of Land Ap-peals found that methane released by coal mining into the environment does not qualify as a “deposit” within the meaning of the Mineral Leasing Act, freeing BLM of the requirement to hold a competitive lease sale. The Interior Board of Land Appeals is an appellate review body that issues final decisions for the Department of the Interior. U.S. Dep’t of Interior, About the Interi-or Board of Land Appeals, available at http://www.doi.gov/oha/ibla/index.cfm (last visited June 25, 2014).
142 Headwaters Economics, Royalty Structure Report, supra note 89 at 8; see also U.S. Department of the Interior, Bureau of Land Management, Total Federal Coal Leases in Effect, Total Acres Under Lease, and Lease Sales by Fiscal Year Since 1990, avail-able at http://www.blm.gov/wy/st/en/programs/en-ergy/Coal_Resources/coaltables.htmlU.S.
143 43 C.F.R. §§3473.3-2(e), 3485.2(c)(1) (2013); see also U.S. Department of the Interior, Bureau of Land Management, Wyoming Field Office, Frequently Asked Questions about the Federal Coal Leasing Program: Royalty Rate Reductions, available at http://www.blm.gov/wy/st/en/programs/energy/
Coal_Resources/coalfaqs/royalty_rate_reductions.print.html (last updated Oct. 20, 2008).
144 30 C.F.R. § 1206.261.
145 See Office of Natural Resources Revenue, Pro-posed Rule, Consolidated Federal Oil & Gas and Feder-al & Indian Coal Valuation Reform, Docket No. ONRR-2012-0004, 80 Fed. Reg. 608, 609 ( Jan. 6, 2015).
146 See 30 C.F.R. § 1206.109.
147 See Richard L. Revesz, “Let’s Cut All Energy Subsidies and Start Taxing Pollution,” The Wall Street Jour-nal (Sept. 15, 2015), available at http://blogs.wsj.com/experts/2015/09/15/lets-cut-all-energy-subsi-dies-and-start-taxing-pollution/.
148 See Headwaters Economics, The Impact of Federal Coal Royalty Reform on Prices, Production, and State Revenue 10-14 (May 2015), available at http://head-waterseconomics.org/wphw/wp-content/uploads/Report-Coal-Royalty-Reform-Impacts.pdf.
149 Id. at 12.
150 See U.S. Environmental Protection Agency, Fact Sheet: Mercury and Air Toxics Standards for Power Plants (2011), available at http://www.epa.gov/mats/pdfs/20111221MATSsummaryfs.pdf.
151 U.S. Energy Information Administration, Sub-bituminous and Bituminous Coal Dominate U.S. Coal Production (Aug. 16, 2011), available at http://www.eia.gov/todayinenergy/detail.cfm?id=2670.
152 Union of Concerned Scientists, How Coal Works, available at http://www.ucsusa.org/clean_energy/coalvswind/brief_coal.html#.Vfdef BFVhBc.
153 Id.

Economic Appendices

A1
Appendix A. Externalities of Coal Mining
A ccording to existing statutes, the Department of the Interior must obtain at least the fair market value for the development of fossil fuels—including coal—on public lands. If we interpret “fair market value” narrowly, we can interpret this as the market price of all fossil resources—coal and natural gas—on the
land, and their corresponding option value. If we interpret “fair market value” more broadly, we can interpret this as maximizing the social return of mining; this includes the fair market price of fossil fuel resources—e.g., coal and natural gas—and the social cost of mining—i.e., the cost to American consumers of mining on public lands due to non-internalized externalities, and their corresponding option values. According to both definitions of fair market value, the Department of Interior should increase the price of coal leases—via minimum bids, internal “fair market value” calculations, and royalty rates.
This section—Appendix A—discusses the various externalities from coal production upstream of coal fired power plants. We focus on upstream externalities from a ton of coal because they (1) directly stem from the mining of coal and not the final use of coal, and (2) are not internalized by existing power plant regulations. Specifically, we discuss the upstream externalities from producing a “typical” ton of coal mined on public lands in the United States. While the externalities from any particular mine varies according to its location (i.e., the human population and the environmental sensitivity of the surrounding landscape), the chemical makeup of the soil and coal, and mining and transportation methods employed in production (Berry et al., 1995; Freeman and Rowe, 1995; Krupnick and Burtraw, 1996; Dones et al., 2005; Odeh and Cockerill, 2008; Burtraw et al., 2012), it is valuable for policymakers setting minimum bids and royalty rates to understand the average externality burden of mining on U.S. public lands to ensure that they are capturing the fair market value of coal. However, to do so, we first need to define a “typical” coal mine.
Boundaries of the Analysis—Defining the Relevant Externalities from a Typical U.S. Coal Mine
This section catalogs the upstream externalities directly related to mining the average ton of coal on U.S. public lands. This includes the relevant externalities from coal production activities—including obtaining mining rights, mining, processing, and transportation (costs that are “upstream” from coal combustion)—and land recovery (if funded by government) for the average ton of coal, not internalized by regulations at the power plant level. Given that between 80% to 90% of public coal mining is in the Power River Basin of Montana of Wyoming (CRS, 2013, Headwater, 2015), we can define the upstream externalities of a typical ton of coal (from U.S. public lands) as those from the average ton of coal from the Powder River Basin. Coal from the Powder River Basin is typically strip mined (a type of surface mining) subbituminous coal that is unprocessed and shipped long distances by train for domestic use in power plants (NRC, 2010).
Given the rural nature of this region and long-distance of shipping, we will focus the bulk of our attention on the most significant externalities: location-independent production externalities—greenhouse gas emissions, water use, and ecosystem losses—and transportation costs. Additionally, we will briefly discuss various location-dependent externalities—such as non-greenhouse gas emissions into air and water. Finally, this section will conclude with a

A2
short discussion of externalities from mining using other methods—underground mining and mountaintop removal (MTR)—and in other regions.
We will catalog all relevant externalities across space and time. Given that a significant externality from strip mining is methane leakages that impact the entire planet, we determine that the relevant spatial range of greenhouse gas (GHG) externalities is global. For non-GHG impacts, the spatial ranges of relevant and significant impacts are local or domestic in nature. Additionally, all externalities that occur from mining during the lifetime of the mine are included. This includes costs after the closing of the mine—e.g., cleanup costs, site rehabilitation, and climate change impacts—that result directly from coal mining (Berry et al., 1998).
In our consideration of externalities, we ignore “externalities” that are already internalized into mine operators’ decisions. For example, several life cycle analyses of coal quantify and value occupational hazards (e.g., Lee et al., 1995)1. We do not include these costs in this analysis because it is generally assumed that these costs are internalized through higher wages, insurance premiums, etc. (NRC, 2010). As a consequence, the company already internalizes these costs—and hence—they are not truly an externality.
Average externalities from a ton of U.S. Coal
Externalities from producing coal occur at the various stages of the coal production process: obtaining mining rights, mining, processing, and transportation. In other words, each of these stages of coal production results in costs borne by the public, and not the coal company producing these externalities. In this subsection where we characterize the average externalities of a ton of coal produced on public lands in the U.S., we will ignore externalities at the processing stage because coal from the Powder River Basin is raw: it is crushed and resized to lower transport costs but not washed to remove impurities (UCS, 1999; NRC, 2010).
Obtaining Mining Rights. The external cost of obtaining the mining rights of a tract include lost amenities to the public from their exclusion to the tract and any unfunded land reclamation.
The public loses access to property when a coal company obtains mining rights to that property through the bidding process. In particular, the surrounding community loses recreational services and other (though not necessarily all) amenities provided by this particular tract (Epstein, 2011). Additionally, the eventual conversion of the site from natural landscape to a working landscape can potentially imply a further loss of amenities (Power, 2005). Given that the creation of a surface mine entails the removal of vegetation and soil (UCS, 2015), the loss of recreational and other amenities from the conversion of the site to a working landscape may be semi-permanent, at least until the mining site is returned to its prior condition as required by the 1977 Surface Mining Control and Reclamation Act (Epstein et al., 2011; NRC, 2010). However, given that the reclamation of many mining sites goes unfunded by the Abandoned Mine Reclamation Fund set up for this purpose (Epstein et al., 2011; UCS, 2015), these losses may be permanent (Epstein et al., 2011). 2
As mentioned above, reclamation of surface mines is required by U.S. law. Reclamation can take the form of returning the land to “agricultural use, rangeland, tree groves, or recreation (Spath et al., 1999).” Yet, reclamation is often underfunded—as discussed in the previous paragraph—and as a result, the government may have to pay for this reclamation, which is an additional externality of mining, in order to reverse this loss (Epstein et al., 2011).3

A3
Given the low population density of the Wyoming region, the recreational amenities of these sites are likely to be low. The exceptions are if the site provides significant tourism benefits or ecosystem benefits, particularly for valuable species. In the latter case, the site may have significant existence values for non-residence if the ecosystem supports rare and desired species. Otherwise, these values are likely to be less significant. Mining locations in more densely populated and ecologically significant regions—such as the Appalachians—may face higher externality costs from obtaining mining rights (Epstein et al., 2011).
The externalities associated with obtaining mining rights are the sole fixed social costs of mining. These are the sole externalities that should be captured in the minimum bid price, instead of royalty prices. Though as appendix D dis-cusses, the option value associated with the uncertainty of fossil fuel resource prices and environmental externalities should also increase the minimum bid for coal tracts. 4
Production. Coal mining produces several production-related externalities, including the emission of greenhouse gases, water pollution, and potentially inefficient water use. As noted earlier, onsite working hazards are not an externality, and are internalized into the costs by firms. Each of these production externalities is a variable social cost of coal production, and should be included as an addition to the royalty rate.
The emission of greenhouse gases—though small relative to emissions from combustion (NRC, 2010; Odeh and Cockerill, 2008)—is likely the most significant externality from coal mines (Berry et al., 1995; Berry et al., 1998, Krupnick and Burtraw, 1996).5 The most important source is methane emissions from mining—also known as methane leakage—which occurs when gases trapped in coal seams are released when the seams are cut to extract coal (NRC, 2010). Though methane emissions remain in the atmosphere for a shorter time than carbon dioxide (EPA, 2015b), methane emissions are a serious concern because methane has a global warming potential 84 times that of carbon dioxide in 20 years after emission and 34 times that of carbon dioxide in 100 years after emission. In 2009, EIA (2011) estimated that coal mining released 86 million metric tons CO2e of methane (measured in CO2 equivalents using a global-warming potential of 25).6 Given that the United States produced 975 million metric tons of coal in 2009 (EIA, 2009), the U.S. emission rate was 0.09 metric tons of CO2e per metric ton of coal.7 In addition to these emissions from mining, there are also emissions from abandoned surface mines which EPA (2015) estimated at 2.5 million metric tons in 2009.8 Underground mining releases more methane emissions than surface mining (as do abandoned underground mines relative to underground surface mines (EPA, 2015)) because the coal beds are under more pressure—due to their deeper depths (Spath et al., 1999); though some methane is captured in underground mining (Spath et al., 1999; EPA, 2015).9
Alternative production sources of greenhouse gas emissions include mining equipment—potentially including trucks used to move coal on site—that mostly relies on fossil fuels (NRC, 2010). Additionally, coal mining uses substantial levels of electricity (Spath et al., 1999). While emissions from equipment are significant for surface mining, they are more significant for underground mining, which relies on small, less energy efficient equipment as compared to the large and more energy efficient equipment used in strip mining (NRC, 2010, UCS, 2015). According to Spath et al., (1999, page 29), CO2 emissions (excluding methane) from surface mining accounts for 0.9% of CO2 emissions in the lifecycle of U.S. coal.10,11
Running equipment (drills, bulldozers and trucks) causes other types of air pollution than GHG emissions—particularly criteria pollutants (NRC, 2010). Again, relative to air pollution from power plants, the impacts of
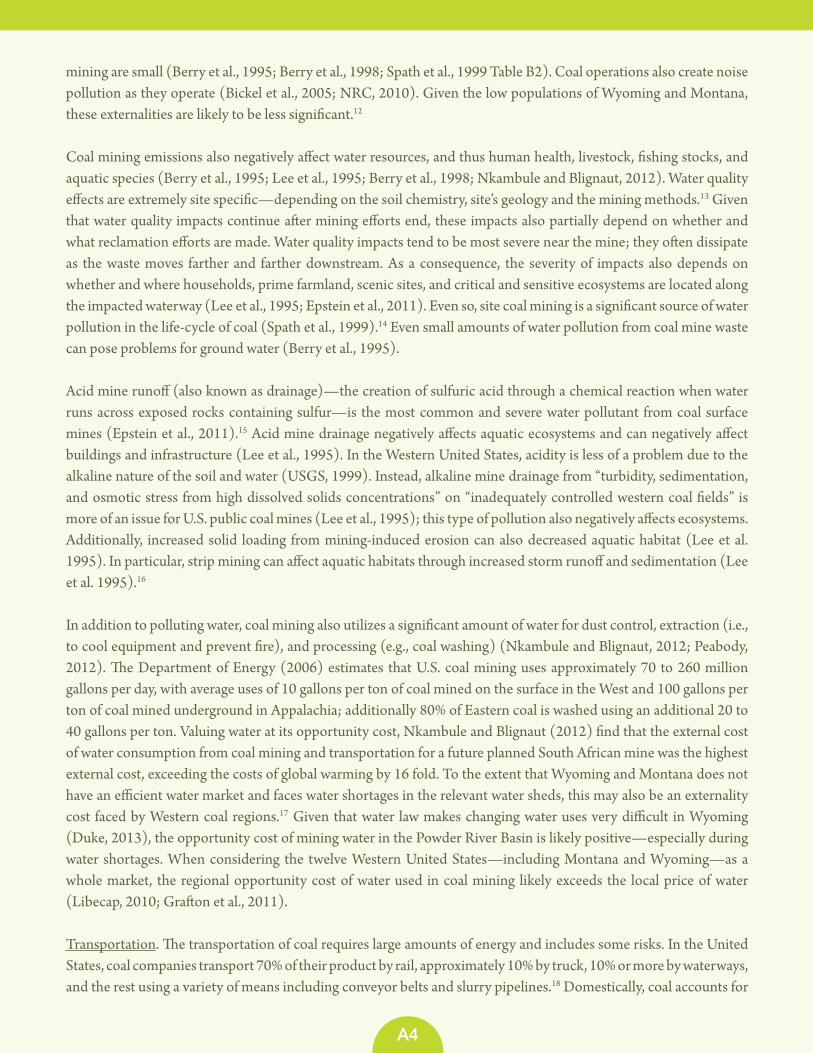
A4
mining are small (Berry et al., 1995; Berry et al., 1998; Spath et al., 1999 Table B2). Coal operations also create noise pollution as they operate (Bickel et al., 2005; NRC, 2010). Given the low populations of Wyoming and Montana, these externalities are likely to be less significant.12
Coal mining emissions also negatively affect water resources, and thus human health, livestock, fishing stocks, and aquatic species (Berry et al., 1995; Lee et al., 1995; Berry et al., 1998; Nkambule and Blignaut, 2012). Water quality effects are extremely site specific—depending on the soil chemistry, site’s geology and the mining methods.13 Given that water quality impacts continue after mining efforts end, these impacts also partially depend on whether and what reclamation efforts are made. Water quality impacts tend to be most severe near the mine; they often dissipate as the waste moves farther and farther downstream. As a consequence, the severity of impacts also depends on whether and where households, prime farmland, scenic sites, and critical and sensitive ecosystems are located along the impacted waterway (Lee et al., 1995; Epstein et al., 2011). Even so, site coal mining is a significant source of water pollution in the life-cycle of coal (Spath et al., 1999).14 Even small amounts of water pollution from coal mine waste can pose problems for ground water (Berry et al., 1995).
Acid mine runoff (also known as drainage)—the creation of sulfuric acid through a chemical reaction when water runs across exposed rocks containing sulfur—is the most common and severe water pollutant from coal surface mines (Epstein et al., 2011).15 Acid mine drainage negatively affects aquatic ecosystems and can negatively affect buildings and infrastructure (Lee et al., 1995). In the Western United States, acidity is less of a problem due to the alkaline nature of the soil and water (USGS, 1999). Instead, alkaline mine drainage from “turbidity, sedimentation, and osmotic stress from high dissolved solids concentrations” on “inadequately controlled western coal fields” is more of an issue for U.S. public coal mines (Lee et al., 1995); this type of pollution also negatively affects ecosystems. Additionally, increased solid loading from mining-induced erosion can also decreased aquatic habitat (Lee et al. 1995). In particular, strip mining can affect aquatic habitats through increased storm runoff and sedimentation (Lee et al. 1995).16
In addition to polluting water, coal mining also utilizes a significant amount of water for dust control, extraction (i.e., to cool equipment and prevent fire), and processing (e.g., coal washing) (Nkambule and Blignaut, 2012; Peabody, 2012). The Department of Energy (2006) estimates that U.S. coal mining uses approximately 70 to 260 million gallons per day, with average uses of 10 gallons per ton of coal mined on the surface in the West and 100 gallons per ton of coal mined underground in Appalachia; additionally 80% of Eastern coal is washed using an additional 20 to 40 gallons per ton. Valuing water at its opportunity cost, Nkambule and Blignaut (2012) find that the external cost of water consumption from coal mining and transportation for a future planned South African mine was the highest external cost, exceeding the costs of global warming by 16 fold. To the extent that Wyoming and Montana does not have an efficient water market and faces water shortages in the relevant water sheds, this may also be an externality cost faced by Western coal regions.17 Given that water law makes changing water uses very difficult in Wyoming (Duke, 2013), the opportunity cost of mining water in the Powder River Basin is likely positive—especially during water shortages. When considering the twelve Western United States—including Montana and Wyoming—as a whole market, the regional opportunity cost of water used in coal mining likely exceeds the local price of water (Libecap, 2010; Grafton et al., 2011).
Transportation. The transportation of coal requires large amounts of energy and includes some risks. In the United States, coal companies transport 70% of their product by rail, approximately 10% by truck, 10% or more by waterways, and the rest using a variety of means including conveyor belts and slurry pipelines.18 Domestically, coal accounts for
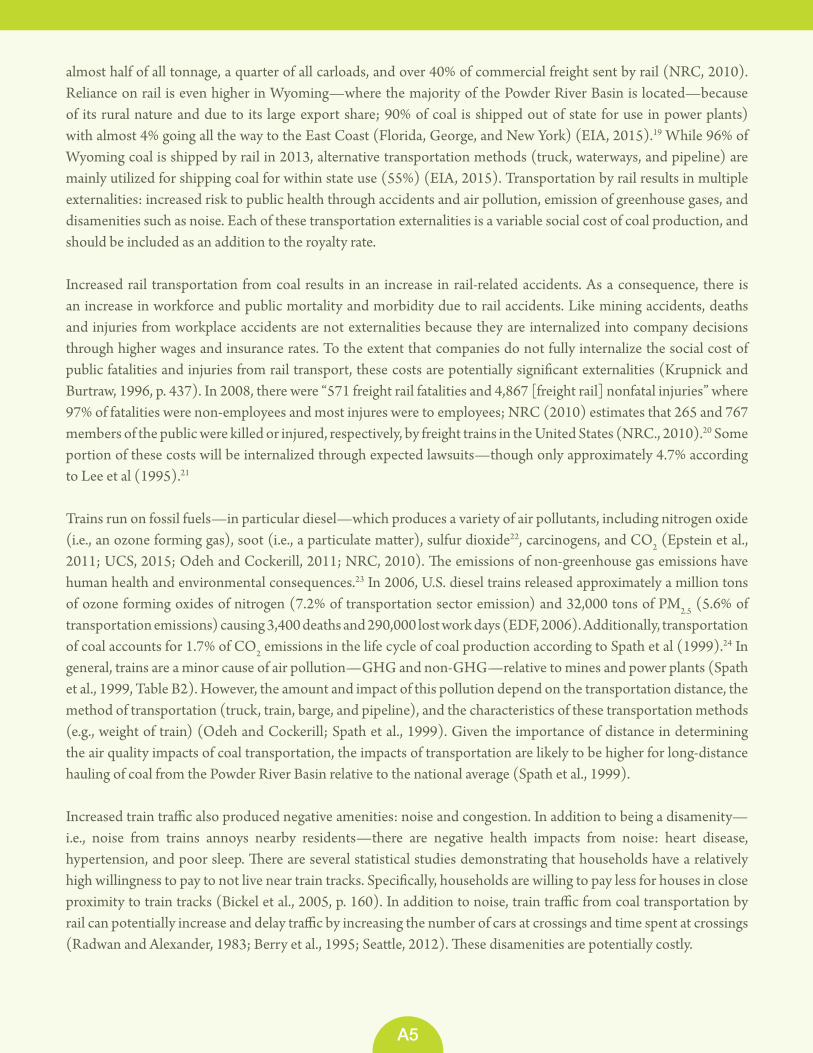
A5
almost half of all tonnage, a quarter of all carloads, and over 40% of commercial freight sent by rail (NRC, 2010). Reliance on rail is even higher in Wyoming—where the majority of the Powder River Basin is located—because of its rural nature and due to its large export share; 90% of coal is shipped out of state for use in power plants) with almost 4% going all the way to the East Coast (Florida, George, and New York) (EIA, 2015).19 While 96% of Wyoming coal is shipped by rail in 2013, alternative transportation methods (truck, waterways, and pipeline) are mainly utilized for shipping coal for within state use (55%) (EIA, 2015). Transportation by rail results in multiple externalities: increased risk to public health through accidents and air pollution, emission of greenhouse gases, and disamenities such as noise. Each of these transportation externalities is a variable social cost of coal production, and should be included as an addition to the royalty rate.
Increased rail transportation from coal results in an increase in rail-related accidents. As a consequence, there is an increase in workforce and public mortality and morbidity due to rail accidents. Like mining accidents, deaths and injuries from workplace accidents are not externalities because they are internalized into company decisions through higher wages and insurance rates. To the extent that companies do not fully internalize the social cost of public fatalities and injuries from rail transport, these costs are potentially significant externalities (Krupnick and Burtraw, 1996, p. 437). In 2008, there were “571 freight rail fatalities and 4,867 [freight rail] nonfatal injuries” where 97% of fatalities were non-employees and most injures were to employees; NRC (2010) estimates that 265 and 767 members of the public were killed or injured, respectively, by freight trains in the United States (NRC., 2010).20 Some portion of these costs will be internalized through expected lawsuits—though only approximately 4.7% according to Lee et al (1995).21
Trains run on fossil fuels—in particular diesel—which produces a variety of air pollutants, including nitrogen oxide (i.e., an ozone forming gas), soot (i.e., a particulate matter), sulfur dioxide22, carcinogens, and CO2 (Epstein et al., 2011; UCS, 2015; Odeh and Cockerill, 2011; NRC, 2010). The emissions of non-greenhouse gas emissions have human health and environmental consequences.23 In 2006, U.S. diesel trains released approximately a million tons of ozone forming oxides of nitrogen (7.2% of transportation sector emission) and 32,000 tons of PM2.5 (5.6% of transportation emissions) causing 3,400 deaths and 290,000 lost work days (EDF, 2006). Additionally, transportation of coal accounts for 1.7% of CO2 emissions in the life cycle of coal production according to Spath et al (1999).24 In general, trains are a minor cause of air pollution—GHG and non-GHG—relative to mines and power plants (Spath et al., 1999, Table B2). However, the amount and impact of this pollution depend on the transportation distance, the method of transportation (truck, train, barge, and pipeline), and the characteristics of these transportation methods (e.g., weight of train) (Odeh and Cockerill; Spath et al., 1999). Given the importance of distance in determining the air quality impacts of coal transportation, the impacts of transportation are likely to be higher for long-distance hauling of coal from the Powder River Basin relative to the national average (Spath et al., 1999).
Increased train traffic also produced negative amenities: noise and congestion. In addition to being a disamenity—i.e., noise from trains annoys nearby residents—there are negative health impacts from noise: heart disease, hypertension, and poor sleep. There are several statistical studies demonstrating that households have a relatively high willingness to pay to not live near train tracks. Specifically, households are willing to pay less for houses in close proximity to train tracks (Bickel et al., 2005, p. 160). In addition to noise, train traffic from coal transportation by rail can potentially increase and delay traffic by increasing the number of cars at crossings and time spent at crossings (Radwan and Alexander, 1983; Berry et al., 1995; Seattle, 2012). These disamenities are potentially costly.

A6
Additional Costs
As stated earlier, the upstream costs of coal mining are site and production method specific. In addition to strip mining, coal mining takes the form of underground mining and mountaintop removal. The U.S. produces coal in many states other than Wyoming;25 production in these states is often on private land and sometimes uses these alternative methods.26 Given that strip mining in Wyoming still makes up the vast majority of public coal mining in the United States, these alternative methods and regions make up a minor share of public coal mines. Even though strip mining in the Powder River Basin reflects the average cost of coal mining on public lands, BLM should estimate the additional costs of alternative mining methods (underground mining and mountaintop removal) and production in other regions in order to adjust this average cost estimate to reflect higher cost situations.27
Underground Mining. Overall, surface and underground mining have the same level of emissions. The main difference is that surface mining produces more ammonia emissions28 due to the use of blasting, while underground mining produces more particulate emissions due to the use of limestone (Spath et al., 1999). As mentioned earlier, underground mines produce more methane per unit of production, from twice as much (Spath et al., 1999, p. iv) to six times as much (Spath et al., 1999, Table 52)—though some is captured for use. Additionally, underground mines can result in subsidence—the sudden or gradual collapse of a mine—which can affect water flows and damage housing and infrastructure (Berry et al., 1995; NRC, 2010). Abandoned mines can also suffer from subsidence, as well as mine fires and leakage of mine waste into waterways (NRC, 2010). While Spath et al. (1999) indicates that there is general equality of damages between the two types of mines, the evidence appears to favor strip mines as less damaging to human and environmental health on a per tonnage basis.
Mountaintop removal mine in Pike County, Kentucky.Photo © Matt Wasson

A7
A higher percentage of underground mines are found in the Eastern United States. As a consequence, there is high correlation between impacts of underground mining and externalities from being located in a location—i.e., East of the Mississippi—where coal mining externalities, including acid mine drainage and water pollution from the processing of coal, are higher due to differences in the chemical structure of the soil and coal. See below for more.
Mountaintop Removal (MTR). Of the various types of coal mining methods utilized in the United States, mountaintop removal—a type of surface mine most commonly utilized in Appalachia– produces the most externalities (NRC, 2010; UCS, 2015). In addition to sharing many of the externalities common to other types of surface mining, such as strip mining, MTR produces many additional externalities due to the steep terrain where it is utilized and the production of excess spoils—large volumes of coal mining waste—which are often disposed in the valley below. This excess waste can pollute waterways –with carcinogens and heavy metals—and can even completely cover them with debris; approximately 2,000 miles of rivers—including headwaters—have been buried in in Kentucky, Virginia, West Virginia, and Tennessee. The mining also affects land based ecosystems by removing trees, completely transforming huge swaths of landscape (1.4 million acres in Kentucky, Virginia, West Virginia, and Tennessee), fragmenting the landscape, and compacting the soil (NRC, 2010; Epstein et al., 2011); the practice deteriorates soil quality in the surrounding area so much that forested ecosystems are replaced by exotic grasses—the only ecosystem that the soil can support. As a consequence, the practice increases the risk of flooding and landslides, increasing damages to housing, infrastructure, and waterways (NRC, 2010; Epstein et al. 2011, UCS, 2015).
Greenhouse gas emissions are even higher for MTR. In addition to methane leakage, there is the loss of CO2 stored in the soil and emissions from spoils. Citing the Fox and Campbell (2009) study of the effects of mountaintop removal on the lifecycle, Epstein et al (2011) argues that the use of mountaintop removal increases CO2 emissions in the lifecycle of coal by 17% due to deforestation and land change. As a consequence, indirect emissions from MTR are equivalent to 7% of emissions from conventional coal powered power plants—approximately 6 to 7 million tons of CO2 stored in forests, 2.6 million tons of CO2e stored in soil, and 27.5 million CO2e emitted from mining spoils are lost annually (Epstein et al, 2011).29 For southern Appalachian forests, this implies up 30 million tons of CO2
emissions annually. In addition to greenhouse gas emissions, non-GHG emissions may also increase as the result of MTR (Epstein et al., 2011).
Again, mountaintop removal is predominately utilized in the Eastern United States. Therefore, like underground mines, the types of externalities are strongly correlated with externalities common to mining Eastern coal. See below for more.
Other Locations. Mining coal in the Eastern United States implies additional externalities—this is partly due to the different soil and coal composition. As discussed earlier, acid mine drainage is more significant than alkaline mine drainage in the Eastern United States. Additionally, coal in the Eastern United States must be processed—washed with water and chemicals—before being shipped to power plants (NRC, 2010). The waste from the processing—which consists of up to 50% of the processing inputs according to NRC (2010)—is known as slurry, and contains toxic chemicals and heavy metals. Due to its toxic nature—to humans and ecosystems—it is stored in impoundments. In the United States, this waste is a significant contributor to water contamination. Particularly costly are large scale pollution events that can occur when these impoundments give way due to their unstable location or extreme weather events (NRC, 2010; Epstein et al., 2011).30

A8
Location of upstream coal mining externalities also matters because the Eastern United States—which includes West Virginia, Kentucky, and Pennsylvania—is more densely populated than Wyoming—one of the least densely populated states. As a consequence, non-greenhouse gases and water pollution affect greater number of people. This is because more individuals are exposed to toxins—increasing health impacts—and more people experience a loss of nearby environmental amenities. For similar reasons, the cost of noise pollution, loss of recreational sites due to mining, and congestion all result in higher external costs in more densely populated locations (Freeman and Row, 1995). Additionally, much of mountaintop removal is in Appalachia—a biological hotspot—where coal mining costs in terms of ecosystem services and biodiversity are high (Epstein et al., 2011).31
Finally, Eastern mines potentially ship their coal shorter distances and less by train.32 Shorter distances imply fewer externalities from the transportation of coal. However, Eastern mines rely more on trucks (14% compared to 0.3% for Wyoming (EIA, 2015), which also produce similar externalities as trains—fatalities, air pollution, noise, and congestion costs (Berry et al., 1995; Lee et al., 1995)—and additional externalities—wear and tear of public roads (Krupnick and Burtraw, 1996).33

A9
Appendix B. How Interior Should Value Externalities and Account for Uncertainty
T his section attempts to review the empirical literature on coal mine externalities. In doing so, we highlight estimates of the various externalities discussed in Appendix A. The primary goal is to determine which externalities are the most empirically relevant. Additionally, we discuss how to estimate the relevant
externalities. This is followed by an attempt to assemble the relevant social cost estimates in order to provide lower bound adjustments for the fair market calculation of minimum bid and royalty rates.
An important point to note is that each study determines the relevant scope of their study—just as Appendix A defined the relevant scope for the adjustment of U.S. minimum bids and royalty rates as strip mining in the Powder River Basin. In doing so, each study defines: (1) the relevant stages of the coal fuel chain to study, (2) the location of coal activities, (3) the relevant technologies, (4) the significant externalities,34 (5) the spatial and temporal limits of these externalities, and (6) how to price these externalities (Berry et al., 1998). Given that many studies chose different scopes than our study, some of the resulting estimates are not compatible with our analysis or require some adjustment. While most studies focus on the lifecycle of coal—i.e., upstream and downstream externalities—we focus exclusively on the upstream externalities. More problematic is that none of the studies focus on strip mining on public lands in the Western United States and are at best studies of the average externalities for U.S. coal mining or an average U.S. power plant. In many cases, studies are empirical estimates from other nations—which are not empirically relevant. When possible, we attempt to adjust domestic estimates such that they reflect the external cost of production of strip mining coal in the Powder River Basin.
Literature
In the 1990s, a literature developed to estimate the external cost of energy production and generation for use by utilities and their regulatory commissioners (Burtraw et al., 2012). There are a handful of studies on the external costs of coal from a lifecycle perspective—including both the upstream and downstream social costs of coal production. Burtraw and Krupnick (2012)—a report from Resources for the Future—and Grausz (2012)—a report by the World Bank—highlight and recommend several reports (and their underlying models): RFF/ORNL (Lee et al., 1995),35 the EXMOD computer model used in Rowe et al (1995),36 the 1995 and 2005 versions of ExternE (EC, 1995; Bickel and Friedrich, 2005) and its various applications (Berry et al., 1995; Berry et al., 1998; Dones et al., 2005; Rafaj and Kypreos, 2007),37 and the National Research Council (2010).38 Additionally, the World Bank also highlights Epstein et al. (2011).39 In addition to these reports, Spath et al (1999)40, Hondo (2005), Odeh and Cockerill (2008),41 and Nkambule and Blignaut (2012)42 independently estimate the external costs of coal mining or the lifecycle of coal for the United States, Japan, the UK, and South Africa, respectively. For the most part, the above studies apply the damage function approach43—in which they employ the benefit transfer method instead of developing their own primary estimates of parameters—to estimate site-specific impacts.44
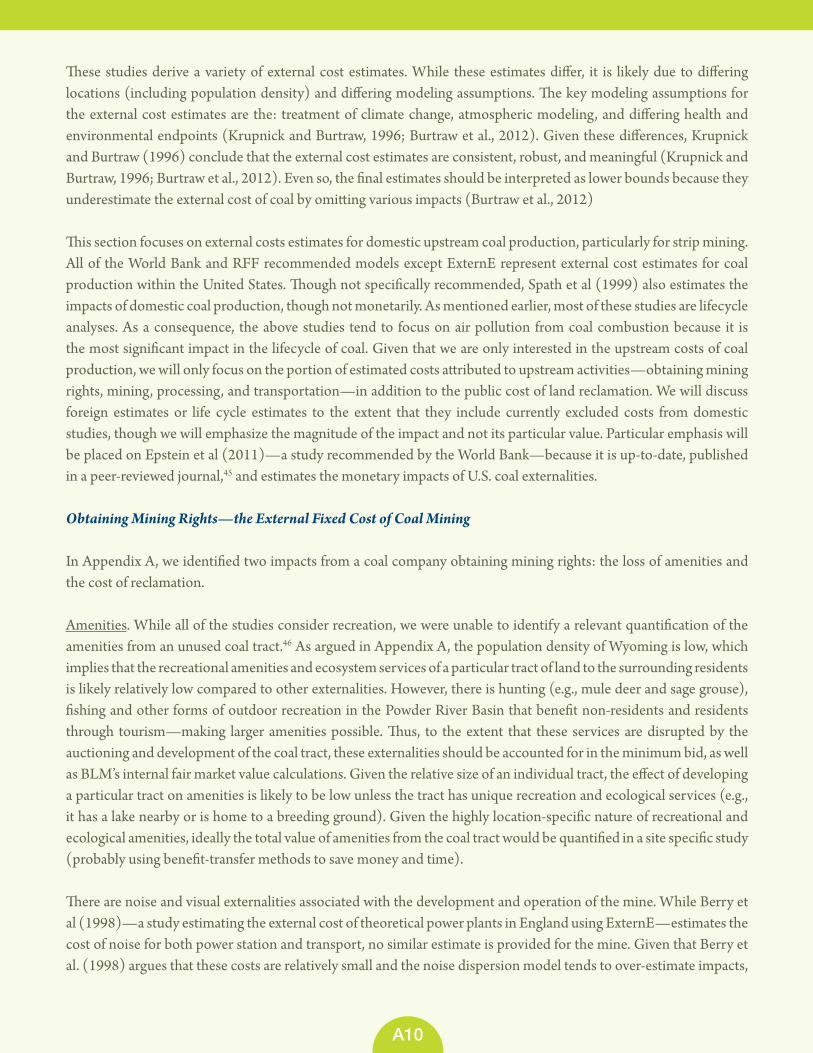
A10
These studies derive a variety of external cost estimates. While these estimates differ, it is likely due to differing locations (including population density) and differing modeling assumptions. The key modeling assumptions for the external cost estimates are the: treatment of climate change, atmospheric modeling, and differing health and environmental endpoints (Krupnick and Burtraw, 1996; Burtraw et al., 2012). Given these differences, Krupnick and Burtraw (1996) conclude that the external cost estimates are consistent, robust, and meaningful (Krupnick and Burtraw, 1996; Burtraw et al., 2012). Even so, the final estimates should be interpreted as lower bounds because they underestimate the external cost of coal by omitting various impacts (Burtraw et al., 2012)
This section focuses on external costs estimates for domestic upstream coal production, particularly for strip mining. All of the World Bank and RFF recommended models except ExternE represent external cost estimates for coal production within the United States. Though not specifically recommended, Spath et al (1999) also estimates the impacts of domestic coal production, though not monetarily. As mentioned earlier, most of these studies are lifecycle analyses. As a consequence, the above studies tend to focus on air pollution from coal combustion because it is the most significant impact in the lifecycle of coal. Given that we are only interested in the upstream costs of coal production, we will only focus on the portion of estimated costs attributed to upstream activities—obtaining mining rights, mining, processing, and transportation—in addition to the public cost of land reclamation. We will discuss foreign estimates or life cycle estimates to the extent that they include currently excluded costs from domestic studies, though we will emphasize the magnitude of the impact and not its particular value. Particular emphasis will be placed on Epstein et al (2011)—a study recommended by the World Bank—because it is up-to-date, published in a peer-reviewed journal,45 and estimates the monetary impacts of U.S. coal externalities.
Obtaining Mining Rights—the External Fixed Cost of Coal Mining
In Appendix A, we identified two impacts from a coal company obtaining mining rights: the loss of amenities and the cost of reclamation.
Amenities. While all of the studies consider recreation, we were unable to identify a relevant quantification of the amenities from an unused coal tract.46 As argued in Appendix A, the population density of Wyoming is low, which implies that the recreational amenities and ecosystem services of a particular tract of land to the surrounding residents is likely relatively low compared to other externalities. However, there is hunting (e.g., mule deer and sage grouse), fishing and other forms of outdoor recreation in the Powder River Basin that benefit non-residents and residents through tourism—making larger amenities possible. Thus, to the extent that these services are disrupted by the auctioning and development of the coal tract, these externalities should be accounted for in the minimum bid, as well as BLM’s internal fair market value calculations. Given the relative size of an individual tract, the effect of developing a particular tract on amenities is likely to be low unless the tract has unique recreation and ecological services (e.g., it has a lake nearby or is home to a breeding ground). Given the highly location-specific nature of recreational and ecological amenities, ideally the total value of amenities from the coal tract would be quantified in a site specific study (probably using benefit-transfer methods to save money and time).
There are noise and visual externalities associated with the development and operation of the mine. While Berry et al (1998)—a study estimating the external cost of theoretical power plants in England using ExternE—estimates the cost of noise for both power station and transport, no similar estimate is provided for the mine. Given that Berry et al. (1998) argues that these costs are relatively small and the noise dispersion model tends to over-estimate impacts,

A11
noise from establishing and running the coal mine is unlikely to be a major source of upstream externality costs of coal mining, particularly in the low density area of Wyoming.
Reclamation. As noted in Appendix A, reclamation of surface mines is required by law, though many go unfunded. Epstein et al (2011) estimates the cost of unfunded reclamation projects from surface mines as of 2007. Using “data on the number and monetary value of unfunded abandoned mine land projects remaining at the end of 2007 for the nation were collected directly from the Abandoned Mine Land Inventory System”, they estimate a total cost of $8.8 billion in 2008 USD. Assuming that all of these unfunded reclamations were for mines abandoned after 1977 and that these reclamations will not be funded by the mining companies in the future, this is equivalent to $0.44/ton in 2015 USD (averaged using all coal production from 1978 to 2007); given the conditional nature of this estimate, this number should be interpreted as an upper bound. A similar analysis should be conducted for Wyoming (or at a minimum the Western United States) for unfunded reclamation projects from 1978 to the current time period.
Production Externalities—External Variable Cost of Coal Mining
In Appendix A, we identified several impacts from the production of coal: greenhouse gas emissions from methane leakage, other air pollution, water use, and water pollution.
Greenhouse gases. Many of the earlier studies do not monetize the costs of greenhouse gas emissions from coal production (Burtraw et al., 2012; Krupnick and Burtraw, 1996). This is true of all of the studies recommended by Burtraw et al. (2012) –with the exception of ExternE (Burtraw and Krupnick, 2012).47 At the time of their development, many of the studies decided that that estimates were too uncertain even though they recognized that climate damages represented the most significant cost of coal (Krupnick and Burtraw, 1996); this is unsurprising given that the first social cost of carbon (SCC) estimates were being released during the same time period (Tol, 2011). As the SCC has improved over the last two decades, more recent studies include estimates of climate damages from coal. For example, Epstein et al (2011)—a model recommended by the World Bank—accounts for the costs of GHG emissions—including methane emissions from mines and combustion at plants—as does Nkambule and Blignaut (2012). In all cases, the studies fail to utilize the appropriate U.S. estimate of the external cost of CO2 and methane emission—the social cost estimates consistent with the 2013 Interagency Working Group on the Social Cost of Carbon (IWG, 2013; Marten et al., 2015).
Epstein et al (2011) estimates the social cost of greenhouse gas emissions from methane emissions from U.S. mines. Citing the Energy Information Administration (2010), U.S. methane emissions from coal were approximately 71 million metric tons of CO2 equivalent (CO2e); these estimates use a 25 global warming potential (GWP) to adjust tons of methane to CO2e. They value greenhouse gas emissions using social cost of carbon numbers of $10, $30, and $100 per metric ton of CO2—which correspond to ballpark estimates from DICE, FUND, and PAGE using discount rates of 4.5%, 3%, and 1.5%, respectively—drawn from Table 5-9 of NRC (2010). The total cost of methane emissions from U.S. mines equals $2.2052 billion—with a range of $0.684 billion to $6.841 billion—in 2008 USD. These estimates are also adjusted downwards by 10% to account for only 90% of coal being used for electricity. Using the EIA estimates of total coal production and correcting for the 90% adjustment downwards, the external cost of methane is $2.92/metric ton in $2015—with a range of $0.89 and $8.52.
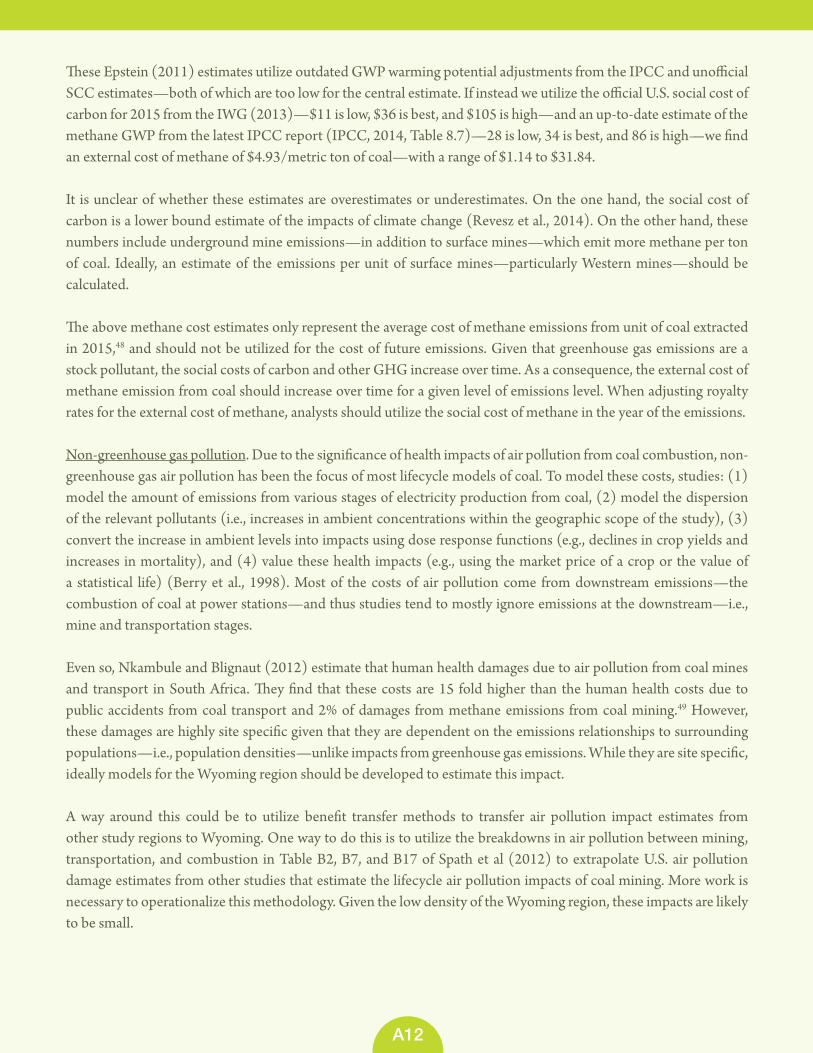
A12
These Epstein (2011) estimates utilize outdated GWP warming potential adjustments from the IPCC and unofficial SCC estimates—both of which are too low for the central estimate. If instead we utilize the official U.S. social cost of carbon for 2015 from the IWG (2013)—$11 is low, $36 is best, and $105 is high—and an up-to-date estimate of the methane GWP from the latest IPCC report (IPCC, 2014, Table 8.7)—28 is low, 34 is best, and 86 is high—we find an external cost of methane of $4.93/metric ton of coal—with a range of $1.14 to $31.84.
It is unclear of whether these estimates are overestimates or underestimates. On the one hand, the social cost of carbon is a lower bound estimate of the impacts of climate change (Revesz et al., 2014). On the other hand, these numbers include underground mine emissions—in addition to surface mines—which emit more methane per ton of coal. Ideally, an estimate of the emissions per unit of surface mines—particularly Western mines—should be calculated.
The above methane cost estimates only represent the average cost of methane emissions from unit of coal extracted in 2015,48 and should not be utilized for the cost of future emissions. Given that greenhouse gas emissions are a stock pollutant, the social costs of carbon and other GHG increase over time. As a consequence, the external cost of methane emission from coal should increase over time for a given level of emissions level. When adjusting royalty rates for the external cost of methane, analysts should utilize the social cost of methane in the year of the emissions.
Non-greenhouse gas pollution. Due to the significance of health impacts of air pollution from coal combustion, non-greenhouse gas air pollution has been the focus of most lifecycle models of coal. To model these costs, studies: (1) model the amount of emissions from various stages of electricity production from coal, (2) model the dispersion of the relevant pollutants (i.e., increases in ambient concentrations within the geographic scope of the study), (3) convert the increase in ambient levels into impacts using dose response functions (e.g., declines in crop yields and increases in mortality), and (4) value these health impacts (e.g., using the market price of a crop or the value of a statistical life) (Berry et al., 1998). Most of the costs of air pollution come from downstream emissions—the combustion of coal at power stations—and thus studies tend to mostly ignore emissions at the downstream—i.e., mine and transportation stages.
Even so, Nkambule and Blignaut (2012) estimate that human health damages due to air pollution from coal mines and transport in South Africa. They find that these costs are 15 fold higher than the human health costs due to public accidents from coal transport and 2% of damages from methane emissions from coal mining.49 However, these damages are highly site specific given that they are dependent on the emissions relationships to surrounding populations—i.e., population densities—unlike impacts from greenhouse gas emissions. While they are site specific, ideally models for the Wyoming region should be developed to estimate this impact.
A way around this could be to utilize benefit transfer methods to transfer air pollution impact estimates from other study regions to Wyoming. One way to do this is to utilize the breakdowns in air pollution between mining, transportation, and combustion in Table B2, B7, and B17 of Spath et al (2012) to extrapolate U.S. air pollution damage estimates from other studies that estimate the lifecycle air pollution impacts of coal mining. More work is necessary to operationalize this methodology. Given the low density of the Wyoming region, these impacts are likely to be small.

A13
Water pollution. All of the recommended models analyze water pollution (Burtraw et al., 2012), though Rowe et al (1995) places particular emphasis on non-air pollution (Krupnick and Burtraw, 1996). However, Krupnick and Burtraw (1996) identify damages to aquatic ecosystems and to groundwater as two of the key omitted impacts from lifecycle models.50 Maybe for this reason, Rowe et al (1997) finds that externalities from air pollution far exceed those from water pollution.51
Epstein et al (2011) value only a portion of water pollution—in particular carcinogens from coal mines and power plants. Using health impacts in terms of disability-adjusted life years (drawn from NRC (2010)), the study provides a lower bound estimate of $11.776 billion in 2008 USD for the health costs of carcinogen emissions from the life cycle of coal—of which 94% are water emissions. This implies that costs to human health from water based emissions of carcinogens are approximately $14 per metric ton of coal in 2005. It is unclear what portion of these costs is due to upstream or downstream emissions, though it appears to be mostly from power plant waste.
Nkambule and Blignaut estimate the cost of water pollution—specifically the emission of sulphates that cause acid mine drainage—for a South African mine. They calculate these costs by multiplying the quantity of sulphate emissions (a function of the quantity of coal) by the damage estimates drawn from the literature. These numbers do not specifically apply in this case because (1) acid mine drainage applies more to coal mines in the Eastern United States than Wyoming (see Appendix A), and (2) the resulting damage cost estimates are based on South African based studies. However, their small magnitude indicates the cost of water pollution from coal mines is relatively insignificant compared to the overall external cost of mining.
Given that water pollution is site specific, models for the Wyoming region should be developed to estimate this impact. One inexpensive way to utilize benefit transfer methods is to transfer water pollution impact estimates from other study regions to Wyoming. One possible method is to utilize the breakdowns in water pollution between mining, transportation, and combustion in Table B3, B8, and B18 of Spath et al (2012) to extrapolate U.S. water pollution damage estimates from other studies that estimate lifecycle water pollution impacts for coal mining. More work is necessary to operationalize this methodology. However, given the low density of the Wyoming region and the above evidence, these impacts are likely to be small.
Water Use. Of the recommended models, none estimates the social cost of inefficient water use by mines, except EXMOD, according to Freeman and Rowe (1995); however, no specific estimates were identified. Additionally, Berry et al. (1995) and Berry et al. (1998) mention it as an omitted externality from the 1995 version of ExternE. Nkambule and Blignaut is the sole study to identify and estimate the external impact of water consumption. Their calculation method was to: (1) calculate the quantity of water utilized by the coal mine, (2) calculate the opportunity cost (or shadow price) of water (i.e., the price of water if there was an efficient market), (3) adjust this cost to a per unit basis, and (4) multiple the quantity and price. In their study of a new South African mine, they find that the external cost of water use by coal mines accounts for 90% of all external costs in their study. Given the potential significance of this cost component, future studies should attempt to estimate the external cost of water consumption by Wyoming coal mining operations.

A14
Transportation—External Variable Cost of Coal Mining
In Appendix A, we identified several impacts from the transportation of coal: greenhouse gas emissions, other air pollution, public fatalities, and disamenities from rail transport. As will be demonstrated in this sub-section, there are monetary estimates for some of these impacts in the literature. However, as an application to coal in the Powder River Basin, it is unclear if current estimates of the external travel cost of coal are overestimates or underestimates. On the one hand, there is a fundamental assumption of non-displacement in rail traffic from decreased coal in most studies (Lee et al., 1995, p. 9-2). While this implies an over-estimation of costs, we will maintain this assumption to simplify the externality calculation. On the other hand, given that travel distances for coal from the Powder River Basin are higher than average travel distance for coal in the U.S. (EIA, 2015) and travel costs increase with distance traveled, they represent underestimations. When possible, we try to correct for this latter deficiency in the literatures’ estimates.
GHG emissions. To our knowledge, none of the recommended studies estimated the monetary value of greenhouse gas emissions from transport.
Spath et al (1999) estimates the non-monetary impacts of coal in a lifecycle analysis of an average U.S. coal-fired power plant assuming two different types of mining (surface and underground) and three different forms of transportation (railroad, water, and trucks). For their average plant, they estimate that upstream emissions account for 4.4% of total GHG emissions, of which only 43% comes from methane leakage. The remaining 56% is split between GHG emissions from the mining operation (18%) and transport (39%) (Odeh and Cockerill, 2008). While Spath et al (1999) is the sole U.S. study that we are aware of that estimates the amount of upstream GHG emissions in addition to methane leakage, the importance of non-methane leakage sources in their study—while indicating a need for further study—differs from other studies. This may be partly due to longer travel distances assumed, which is based on transport distances for Perry County, Pennsylvania.52 Given that travel distance is larger for Wyoming coal than Pennsylvania coal—the average trip is almost three times longer and the ton-miles are 49 times higher53—Spath et al (1999) may actually underestimate the share of GHG emissions due to transport for public U.S. mines.
As mentioned in the previous paragraph, several studies on other nations have estimated the quantity and/or cost of GHG emitted in the transport of coal. First, Nkambule and Blignaut (2012) calculate these costs for a new coal power plant in South Africa—the Kusile coal fired power station. With respect to this plant, the authors find that approximately 0.5% of the external costs of GHG emissions are from transporting coal. Second, in a Japanese study, Hondo (2005) estimates that 12.5% and 20% of upstream GHG emissions—which account for 8% of total GHG emissions—come from CO2 emissions from mining equipment and transportation, respectively. Last, Odeh and Cockerill (2008) estimate that 11% of upstream GHG emissions for “existing UK pulverized coal power plants” come from CO2 emissions from mining and transportation compared to remaining 89% from methane leakage; upstream emissions account for 7.3% of GHG emissions in the study. While estimates may seem contradictory to Spath et al (1999), these studies analyze CO2 emission from rail transport in relatively small nations compared to the U.S. While South Africa appears to be an exception the first study (i.e. it is a relatively large nation), the majority of coal comes from the New Largo coal reserve—an area extremely close to the station—in this particular case (Nkambule and Blignaut (2012).

A15
Estimating the amount and cost of CO2 emissions from shipping coal by rail is essential for calculating the correct royalty rate (if considering the broadest definition of fair market value). A first step would be to adjust the emission calculations from Spath et al (1999) using the factor of 49 (calculated above using the ratio of ton-miles of Wyoming coal to Pennsylvania coal). However, the emission calculations for Spath et al (1999) and EIA (2015)—i.e., the source of the data used to calculate our adjust factor for the Powder River Basin—only account for domestic travel distances, and do not factor international travel. GHG emissions from international export should also be accounted for in externality estimates. Ideally, a more thorough calculation of CO2 emissions from the transportation of Powder River Basin coal would be calculated.
Other air pollution. Trains also contribute significant costs from other air pollutants, though air pollution from the transportation of coal is given less emphasis in the lifecycle literature due to the oversized impact of combustion. In 2006, trains caused 3,400 deaths and 290,000 lost working days by releasing approximately a million tons of ozone forming oxides of nitrogen (COX )—7.2% of transportation sector emission—and 32,000 tons of PM2.5 -5.6% of transportation emissions (EDF, 2006). According to EDF (2006), these impacts imply $23.2 billion in damages in 2006 USD. Assuming that 40% of U.S. trains are freight and 40% of freight is coal (approximately 43% according to NRC (2010)), an approximate cost of air pollution from U.S. coal transport is $4 per ton of coal in 2015 USD. It is unclear if this is an overestimate or an underestimate. On the one hand, coal shipping from Wyoming travels a much farther distance than average U.S. freight. If we adjust this estimate to account for the fact that Wyoming coal represents 80% of U.S. coal’s ton-miles by rail, we find that the average cost of air pollution from transportation per ton of Wyoming coal is over $7. This should be viewed as our upper estimate. On the one hand, these estimates are dated given EPA’s 2008 rule to clean up diesel pollution from trains starting in 2015 (though they only impact engines built in 2015 or later)—that reduce PM by up to 90% and NOX by up to 80%. Assuming further that 50% of emissions are reduced over the relevant time period, this external cost estimate per ton of Wyoming coal declines to $3.5.54 While this is an approximation, it indicates that the cost of non-GHG emissions (and GHG emissions) may be quite high for shipping Wyoming coal, and should be calculated more accurately.
Given the importance of this impact, future work is necessary to more accurately estimate the cost of air pollution from trains. One potential method is to utilize output from Spath et al (1999) for a benefit-transfer calculation. In this case, the estimates would need to be adjusted for the above average travel distance of Wyoming coal. Alternatively, estimates based on the EPA’s cost-benefit analysis for their 2008 regulation of diesel fired train engines could be utilized.
Public Fatalities. All of the recommended studies account for public mortality and morbidity from the transport of coal, though only ExternE, Lee et al (1995), NRC (2010), and Epstein et al. (2011) monetize them (Burtraw et al., 2012).
Each study calculates the external cost of train fatalities differently. Extending Lee et al.’s (1995) calculation method to our study, their recommended method for the cost of mortality is:
where train-miles is their proxy for risk.55 Essentially, the authors believe that train speed is unlikely different for coal compared to other freight and that train length is unimportant in determinants of fatalities (since the vast majority of
( )Cost Per Unit = VSLUS * Fatalities total freight, US * train – miles coal, US
train – miles total freight, US
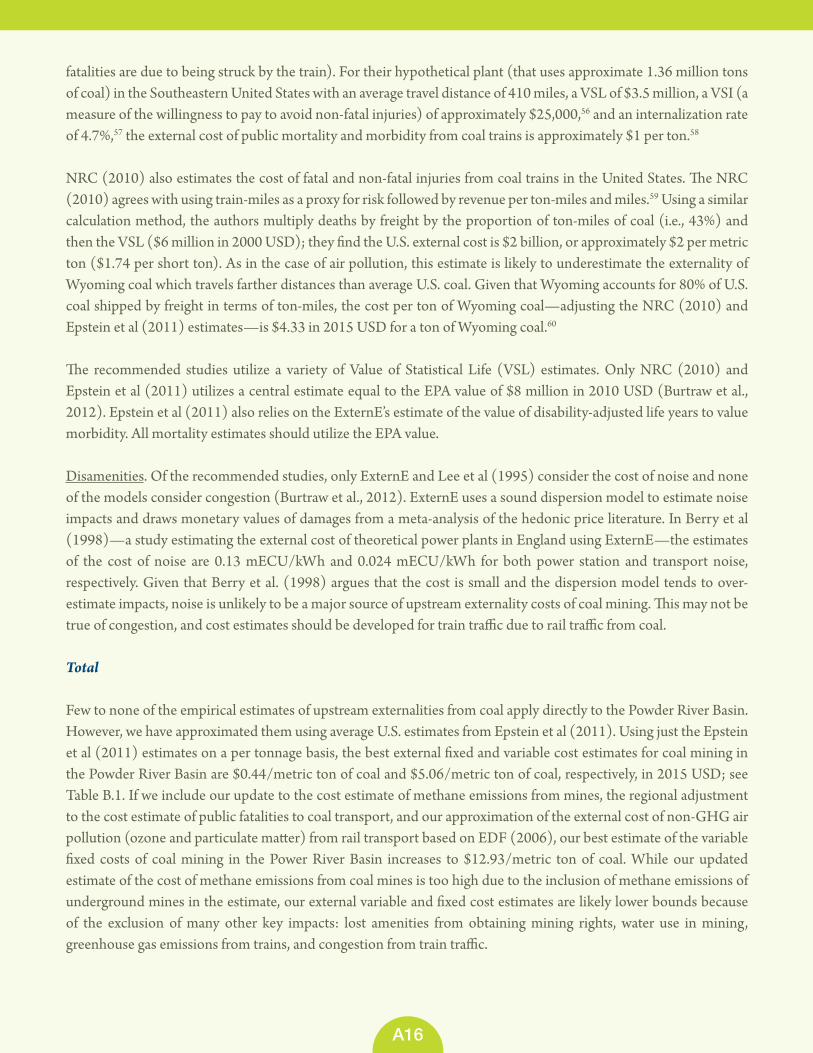
A16
fatalities are due to being struck by the train). For their hypothetical plant (that uses approximate 1.36 million tons of coal) in the Southeastern United States with an average travel distance of 410 miles, a VSL of $3.5 million, a VSI (a measure of the willingness to pay to avoid non-fatal injuries) of approximately $25,000,56 and an internalization rate of 4.7%,57 the external cost of public mortality and morbidity from coal trains is approximately $1 per ton.58
NRC (2010) also estimates the cost of fatal and non-fatal injuries from coal trains in the United States. The NRC (2010) agrees with using train-miles as a proxy for risk followed by revenue per ton-miles and miles.59 Using a similar calculation method, the authors multiply deaths by freight by the proportion of ton-miles of coal (i.e., 43%) and then the VSL ($6 million in 2000 USD); they find the U.S. external cost is $2 billion, or approximately $2 per metric ton ($1.74 per short ton). As in the case of air pollution, this estimate is likely to underestimate the externality of Wyoming coal which travels farther distances than average U.S. coal. Given that Wyoming accounts for 80% of U.S. coal shipped by freight in terms of ton-miles, the cost per ton of Wyoming coal—adjusting the NRC (2010) and Epstein et al (2011) estimates—is $4.33 in 2015 USD for a ton of Wyoming coal.60
The recommended studies utilize a variety of Value of Statistical Life (VSL) estimates. Only NRC (2010) and Epstein et al (2011) utilizes a central estimate equal to the EPA value of $8 million in 2010 USD (Burtraw et al., 2012). Epstein et al (2011) also relies on the ExternE’s estimate of the value of disability-adjusted life years to value morbidity. All mortality estimates should utilize the EPA value.
Disamenities. Of the recommended studies, only ExternE and Lee et al (1995) consider the cost of noise and none of the models consider congestion (Burtraw et al., 2012). ExternE uses a sound dispersion model to estimate noise impacts and draws monetary values of damages from a meta-analysis of the hedonic price literature. In Berry et al (1998)—a study estimating the external cost of theoretical power plants in England using ExternE—the estimates of the cost of noise are 0.13 mECU/kWh and 0.024 mECU/kWh for both power station and transport noise, respectively. Given that Berry et al. (1998) argues that the cost is small and the dispersion model tends to over-estimate impacts, noise is unlikely to be a major source of upstream externality costs of coal mining. This may not be true of congestion, and cost estimates should be developed for train traffic due to rail traffic from coal.
Total
Few to none of the empirical estimates of upstream externalities from coal apply directly to the Powder River Basin. However, we have approximated them using average U.S. estimates from Epstein et al (2011). Using just the Epstein et al (2011) estimates on a per tonnage basis, the best external fixed and variable cost estimates for coal mining in the Powder River Basin are $0.44/metric ton of coal and $5.06/metric ton of coal, respectively, in 2015 USD; see Table B.1. If we include our update to the cost estimate of methane emissions from mines, the regional adjustment to the cost estimate of public fatalities to coal transport, and our approximation of the external cost of non-GHG air pollution (ozone and particulate matter) from rail transport based on EDF (2006), our best estimate of the variable fixed costs of coal mining in the Power River Basin increases to $12.93/metric ton of coal. While our updated estimate of the cost of methane emissions from coal mines is too high due to the inclusion of methane emissions of underground mines in the estimate, our external variable and fixed cost estimates are likely lower bounds because of the exclusion of many other key impacts: lost amenities from obtaining mining rights, water use in mining, greenhouse gas emissions from trains, and congestion from train traffic.
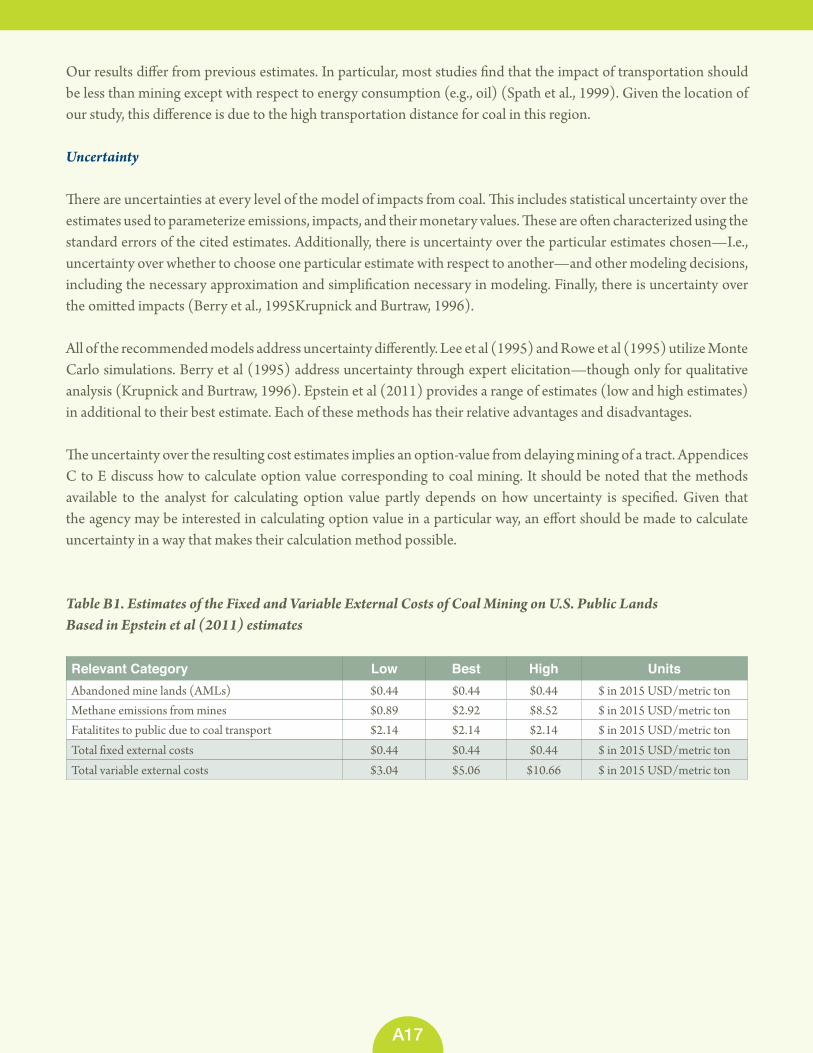
A17
Our results differ from previous estimates. In particular, most studies find that the impact of transportation should be less than mining except with respect to energy consumption (e.g., oil) (Spath et al., 1999). Given the location of our study, this difference is due to the high transportation distance for coal in this region.
Uncertainty
There are uncertainties at every level of the model of impacts from coal. This includes statistical uncertainty over the estimates used to parameterize emissions, impacts, and their monetary values. These are often characterized using the standard errors of the cited estimates. Additionally, there is uncertainty over the particular estimates chosen—I.e., uncertainty over whether to choose one particular estimate with respect to another—and other modeling decisions, including the necessary approximation and simplification necessary in modeling. Finally, there is uncertainty over the omitted impacts (Berry et al., 1995Krupnick and Burtraw, 1996).
All of the recommended models address uncertainty differently. Lee et al (1995) and Rowe et al (1995) utilize Monte Carlo simulations. Berry et al (1995) address uncertainty through expert elicitation—though only for qualitative analysis (Krupnick and Burtraw, 1996). Epstein et al (2011) provides a range of estimates (low and high estimates) in additional to their best estimate. Each of these methods has their relative advantages and disadvantages.
The uncertainty over the resulting cost estimates implies an option-value from delaying mining of a tract. Appendices C to E discuss how to calculate option value corresponding to coal mining. It should be noted that the methods available to the analyst for calculating option value partly depends on how uncertainty is specified. Given that the agency may be interested in calculating option value in a particular way, an effort should be made to calculate uncertainty in a way that makes their calculation method possible.
Table B1. Estimates of the Fixed and Variable External Costs of Coal Mining on U.S. Public LandsBased in Epstein et al (2011) estimates Relevant Category Low Best High UnitsAbandoned mine lands (AMLs) $0.44 $0.44 $0.44 $ in 2015 USD/metric tonMethane emissions from mines $0.89 $2.92 $8.52 $ in 2015 USD/metric tonFatalitites to public due to coal transport $2.14 $2.14 $2.14 $ in 2015 USD/metric tonTotal fixed external costs $0.44 $0.44 $0.44 $ in 2015 USD/metric tonTotal variable external costs $3.04 $5.06 $10.66 $ in 2015 USD/metric ton

A18
Table B2. Estimates of the Fixed and Variable External Costs of Coal Mining on U.S. Public Lands Based on Adjustments to Epstein et al (2011) and EDF (2006) Impact Estimates
Relevant Category Low Best High UnitsObtaining Mining RightsAmenities - - - $ in 2015 USD/metric tonAbandoned mine lands (AMLs) $0.44 $0.44 $0.44 $ in 2015 USD/metric tonProductionMethane emissions from mines $1.14 $4.93 $31.84 $ in 2015 USD/metric tonWater use - - - $ in 2015 USD/metric tonTransportationFatalitites to public due to coal transport $4.33 $4.33 $4.60 $ in 2015 USD/metric tonGHG emissions from trains - - - $ in 2015 USD/metric tonAir pollution from trains $1.47 $3.66 $7.33 $ in 2015 USD/metric tonCongestion - - - $ in 2015 USD/metric tonTotal costsFixed external costs $0.44 $0.44 $0.44 $ in 2015 USD/metric tonVariable external costs $6.94 $12.93 $43.77 $ in 2015 USD/metric ton
A19
Appendix C. Measuring Option Value
T here are two types of option value: real option value—also known as, Dixit-Pindyck option value—and quasi-option value—also known as, Arrow-Fisher-Hanemann-Henry option value. The former option value is the full value of future flexibility—the complete value of maintaining the option to invest—while
the latter is the value of future learning conditional on delaying the leasing decision. Mathematically, in a discrete investment problem, real option value is “the maximal value that can be derived from the option to invest now or later (incorporating learning) less the maximal value that can be derived from the possibility to invest now or never (Traeger, 2014).”61 Alternatively, quasi option value is mathematically equal to the value of preservation to the decision maker who anticipates learning less the value of preservation to the decision maker who anticipates only the ability to delay his/her decision, and not learning (Traeger, 2014). The two values are related, but not identical.62
Using option values, we can define when the Department of the Interior (DOI) should delay development of a coal tract. A necessary and sufficient condition for preservation, which we will define as society being strictly better off by postponing a mining project, is
NPV < QOV + SOV.
where QOV is quasi-option value of an investment, SOV is simple option value of an investment,63 and NPV is the expected net present value of an investment.64 In other words, if the expected net present value from drilling is strictly less than the “full value of sophistication,” society is strictly better off when DOI preserves the corresponding coal tract. Alternatively, a sufficient condition for society being strictly better from preservation is that the real option value is positive: i.e.,
DPOV > 0.
where DPOV is the real option value of an investment. It is easy to see that the former condition (which includes quasi-option value) is a slight modification of the traditional net present value rule (i.e., develop if NPV > 0), while the latter applies an additional condition to the traditional net present value rule.
Requirements for Option Values
The conditions for each option value to arise are irreversibility (e.g., the leasing decision and mining cannot be undone), uncertainty (e.g., uncertainty in market, environmental, and social prices and costs), and the ability to delay (e.g., the Department of the Interior (DOI) can postpone leasing until a future period). Additionally, quasi-option value requires the decision variable to be discrete (e.g., the DOI decides whether to allow or delay mining of a coal tract). Neither option value requires risk aversion—they exist under the assumption of a risk neutral society.
Given that uncertainty is one of the key drivers of option value, DOI should be careful to consider all relevant types of uncertainty because their decisions can influence the magnitude of the option value. There are multiple types
A20
of uncertainty that the DOI faces when making a leasing decision for a coal tract. In terms of market uncertainty, the DOI faces an uncertain price of coal, fixed cost of drilling (i.e., development costs), marginal cost of drilling (i.e., extraction costs), and quantity of coal. In so far as the government is unlikely to learn new information about the quantity of coal without exploration—which is directly associated with allowing leasing in that particular coal tract—the latter type of uncertainty does not apply to the government leasing decision; an expected quantity of coal should be utilized instead. With respect to externalities, the DOI faces uncertainty with respect to the fixed social cost of coal extraction (e.g., the value of externalities associated with obtaining mining rights) and the marginal social cost of coal extraction (e.g., the value of externalities associated with mining and transportation of coal). With respect to environmental and health externalities associated with mining, there are uncertainties with respect to the effect of mining on the environment and health65 and their corresponding prices.66 Finally, the DOI also faces uncertainty with respect to the level and value of amenities from the coal tract. To the extent that this type of uncertainty can be folded into the marginal and fixed social costs of extraction, this latter type of uncertainty, like the quantity of coal, does not need to be explicitly modeled.
In previous comments to DOI on the option value associated with approving oil extraction in the intercontinental shelf (IPI, 2015), the Institute for Policy Integrity argued that DOI should explicitly model the risk of oil spills, and the option value associated with the corresponding uncertainty over the probability of spills and the magnitude of costs when an event occurs. In coal mining, there are also risks of spills—in particular a risk of spillage releases from impoundments, as discussed above. However, instead of explicitly modeling the risk of spillage from impoundments, DOI should model the expected cost of spills and the uncertainty surrounding this expected costs because: (1) spillage and impoundment is less of an issue in the Powder River Basin due to the lack of coal processing, and (2) the expected costs of spillage (in the case of coal) are small relative to the overall external cost of coal mining (whereas oil spills are the primary social cost of oil drilling). This absorption of the costs of spillage into the marginal social cost component simplifies the overall modeling.
Methodologies for Integrating Option Value into Department of the Interior’s Decision Making
The option value associating with mining a particular tract of land for coal should be included in the minimum bid price for a tract of land. If DOI interprets “fair market value” narrowly, as defined in Appendix A, the DOI of should calculate the option value associated with uncertainty in coal and natural gas prices. This would correspond to the analysis currently conducted for offshore drilling leases done in OCS regions by the DOI. If DOI interprets “fair market value” more broadly, as defined in Appendix A, DOI should also calculate the option value associated with the uncertainty in externalities. The calculated option values—regardless of the definition of “fair market value”—should be added to the minimum bid for coal tracts.
There are several well established methodologies that the agency can use to capture the full option value: contingent valuation, engineering-economic approach, or programming model. The following sections discuss each of the available methods for integrating the real option value associated with the preservation of a coal tract into DOI’s leasing decisions.
Contingent Valuation. To estimate real option value or quasi-option value, DOI could use contingent valuation techniques. In particular, they could survey various regulators involved in the relevant coal-environmental planning

A21
decisions to determine the value that they place on waiting (Fisher and Hanemann, 1990; Jakobsson and Dragun, 1996).67 Specifically, to elicit a willingness to pay estimate corresponding to quasi-option value, Fisher and Hanemann (1990) suggest asking the relevant regulator:
“What would you (as a decision maker concerned to use the resources of a site efficiently) be willing to pay for information about future benefits of preservation and development, information that would be available before you had to decide whether to preserve or develop in the future, assuming you do not foreclose the option to preserve in the future by choosing to develop now?”68
While this question may appear difficult at first sight, the regulators responsible for natural resources leasing decisions are highly sophisticated. Given their ability to understand the question’s nuances, they will likely be able to provide a comprehensive answer (Fisher and Hanemann, 1990).
Although straightforward to implement, this methodology is not ideal for use in this instance. While DOI clearly has the welfare of U.S. citizens in mind when making its leasing decision, this methodology requires that the relevant planner optimize net social welfare in its decision making process. However, given that it is nearly impossible to prove that any agency does so, it is difficult to know if such a methodology accurately captures option value without comparing estimates from the second and third methodologies outlined below. More importantly, contingent valuation is a stated preference technique, and only provides a subjective estimate of option value. Given that the relevant planning agency (i.e., the DOI) is also the agency that would be conducting the estimate, the subjectivity of the resulting estimates would be even more problematic.
Engineering Economic Approach. To estimate quasi-option value and simple option value, an “engineering-economic approach” could be applied whereby the theoretical model developed by Arrow and Fisher is parameterized using studies from the literature, additional analysis (using the available data), and surveys of experts (Fisher and Hanemann, 1990).69 In the simplest case, DOI could develop a model with two periods and two future states. In this problem, the first period represents the current planning period (typically five years) while the second period can be interpreted as all future periods covered by a sequence of (five year) plans (Mensink and Requate, 2005).70 The two future states represent the most likely scenarios where preservation (i.e., not developing the coal resources this period) is and is not optimal; the corresponding probabilities of each state would require specification.
Given that the simple assumptions made in our two-period, two future state model may be overly simplistic, analysts can extend the model to consider additional future states and time periods. As the dimensions of the problem increase, the use of a programming model to find a solution will become necessary. In particular, the DOI could develop and parameterize a numerical (i.e., simulation)model, instead of a simple theoretical model (Mahul and Gohin, 1999, and Ha-Duong, 1998), such as they have done for the optimal stopping problem for oil drilling in the OCS with WEB2 (discussed more below). Using this new model, simulations could be run under different future scenarios (e.g. low drilling cost, high drilling cost, etc.). The agency, and the U.S. government more generally, are familiar with such scenario-based simulations.71 Calculating quasi-option value would require only one more step in which the value of the additional information can be calculated by comparing the results of these simulations that are run under certainty to those that are run under uncertainty using the formulas established in the literature.
A22
Choosing the engineering-economic approach has some clear advantages. The main advantage of this method is that it allows for a simple adjustment to the minimum bid price—it can be simply added to the minimum bid price to reflect the social option value of developing the tract. Furthermore, this method is objective to the extent that a reliable method can be developed to specify the values of the random parameters (the price of fossil resources and the social costs of leasing) and the corresponding probabilities using studies from the literature, available data, and surveys of experts. If some of the parameters for such a model (e.g. probabilities of various scenarios) cannot be determined, Monte Carlo simulations, which are frequently used in physical sciences and finance when there is significant uncertainty, can be used.
Optimal Stopping Model. The final approach to incorporating the real option value, as it relates to the social value of information, is to utilize an optimal stopping model. This is the approach taken by DOI in their hurdle price analysis for offshore oil drilling in OCS regions, which solely considers the option value corresponding to the uncertainty of oil price. For oil drilling in OCS regions, DOI uses an in-house dynamic programming model—When Exploration Begins, version 2 (WEB2)—to conduct their hurdle price analysis. In their analysis, the hurdle price is the lowest price at which delaying development is greater than the value of exploration for the largest potential undiscovered field—the field with the highest net value per equivalent barrel. The inputs into WEB2 are the expected quantity of oil and natural gas,72 costs,73 and prices.74 (BOEM, 2012).
In using a hurdle price analysis, the agency only accounts for the real option value as it relates to market price uncertainty. Thus, they exclude market uncertainty as it relates to the market costs of drilling (e.g., exploration, development, and extraction)75 and the social costs of drilling (e.g., environmental, infrastructure, and catastrophic oil spills). By ignoring the possibility of acquiring further information about the consequences of a development action on the environment,76 DOI inevitably underestimates the net benefits of delaying the leasing of the land for resource extraction and initiates leases prematurely. While Policy Integrity in no way advocates that the hurdle price is the best methodology, if DOI chooses to utilize an optimal stopping model, a social hurdle price should be calculated by modifying the agency’s dynamic programming model (WEB2) to include externalities of drilling and the corresponding uncertainty underlying them and market costs.77 Similarly, an optimal stopping model developed for coal mining—specifically to estimate option value corresponding to coal leases to augment minimum bid prices—should also account for the uncertainties of externalities and extraction costs in addition to the uncertainty in coal prices.
The main advantage of this estimation strategy is it provides a clear method to estimate the stochastic processes underlying uncertain price and cost variables. In actual application, long time series data exists for only some random variables, such as oil, gas, and coal prices, to estimate the parameters of the stochastic processes and to test between the alternative processes proposed in the literature.78 In the case of market cost and externality cost data, there may be only short time-series data or no data available; this is particularly true for regional data pertaining to particular coal tracts that have not undergone leasing. In some cases, data for related process may be available to estimate the stochastic process.79 If data are unavailable, experts can be surveyed to parameterize the model. When short-time series data or expert opinions are utilized, the use of sensitivity analysis over the assumed stochastic processes and Monte Carlo simulations over the parameters is suggested.
A23
Appendix D. Integrating Externalities and Option Value into Minimum Bid and Royalty Rates
T o summarize, the Department of the Interior must obtain at least the fair market value for the development of fossil fuels—including coal and natural gas—on public lands. If we interpret “fair market value” narrowly, we can interpret this as the market price of all fossil resources—coal and natural gas—on the land. This
narrow interpretation implies that option values (corresponding to commodity prices and market costs, only) should be added to the minimum bids for coal tract leases, while the value of natural gas should be added to royalty rates. If we interpret “fair market value” more broadly, we can interpret this as maximizing the social return of mining; this includes the fair market price of fossil fuel resources—e.g., coal and natural gas - and the social cost of mining—i.e., the cost to American consumers of mining on public lands due to non-internalized externalities. This broad interpretation implies that fixed social costs and option values (corresponding to commodity prices, market costs, and social costs) should be added to the minimum bids and internal fair market calculations for coal tract leases, while the value of natural gas resources and variable social costs should be added to royalty rates.
There are several additional issues that should be addressed when integrating these values into minimum bid prices and royalty rates. Each of these issues are discussed in the report, but reviewed here.
Ensuring a fair market price of coal
To calculate the adjustment to royalty rates for externalities—when utilizing the broadest definition—it is essential to define market price. This is because royalty rates are determined as a share of this price. As argued above, this fair market price should be either (1) the sales price of coal to power plants (i.e., the total value of upstream production), or (2) the sale price of coal to power plants less the cost of transportation (i.e., the total revenue from producing coal realized by the coal mine). Using this price, the adjustment to the royalty rate for coal equals the external variable cost of producing coal on public lands divided by the fair market price of coal. If an alternative price is realized (i.e., a lower price is utilized based on sales at an earlier stage in the production process), the adjustment to the royalty rate should instead be the external variable cost of producing coal on public land divided by this realized price.
Leakage
Increasing the minimum bid and royalty rates on public coal lands may result in leakage. This leakage is likely to take the form of shifting coal production to private lands—particularly the Eastern United States –or increasing demand for other fossil fuels (oil and natural gas), biofuels, or renewables (wind and solar) on public and private lands; the externalities from these alternative energy sources may be higher or lower than the production of coal on public lands. With regards to shifting to other energy sources on public lands, the U.S. government should also account for their upstream externalities when determining their minimum bidding prices and royalty rates instead of adjusting the minimum bids and royalty rates of coal to account for this type of leakage. Given that coal has one of the highest levels of externalities according to most lifecycle analyses and that agencies do not consider modifying the minimum bids and royalty rates of all public resources simultaneously, coal is a reasonable resource with which to start this update in bid prices and royalty rates. To the extent that production shifts to private lands where externalities are

A24
unaccounted for in land values and production decisions, minimum bids and royalty rates should be adjusted accordingly. In order to do this, a study on the leakage rates must be conducted. We believe that the leakage rate to private coal will be relatively limited due to the lower production costs and sulfur content (which is regulated under the Clean Air Act) of Western coal (UCS, 2015).
Next best use
In our analysis above, we implicitly assume that the next best use is non-commercial use (i.e., open public space). In some cases, this may not be true—such as if the land is leased for cattle ranching. While these alternative uses may produce externalities—i.e., cattle produce methane—this is best dealt with by charging these alternative uses higher minimum bid prices and royalty rates (or lease rates) to account for their externalities, rather than attempting to adjust the minimum bid price and royalty rates of coal for alternative uses; this is consistent with our opinion on how to address leakage to other energy resources on public lands discussed in the previous paragraph. Otherwise, the agency is faced with determining what it believes to be the next best use, as well as complicated valuation questions (e.g., determining whether the cattle ranch exists in alternative location if the mining rights are granted).
Adjusting For Externality Reduction Measures
Ideally coal mining companies would reduce their externalities through changing their production methods or investing in technologies. If such investments are made, the royalty rates should be adjusted downwards to account for this reduction in externalities. The most likely example of this type of investment by coal companies is investment in methane capture technologies. To incentivize such an investment, royalty rates should be reduced to reflect the decrease in methane emissions due to this capture. If such reductions are allowed by the agency, the agency should utilize the average cost of gross methane emissions instead of the average costs of net methane emissions.80
Present Value Calculation for the Minimum Bid
The minimum bid is a one-time price paid by the coal company for the mining rights on a particular tract of land. Given its one time nature, all fixed external costs should be adjusted to their present value. Then, the adjustment to the minimum bid price is the sum of the present value of natural gas resources, the present value of fixed external costs, and the option value corresponding to the uncertainty in coal prices, natural gas prices, and the value of externalities.
A25
Endnotes1 Lee et al. (1995) argue that occupational hazards are not
fully compensated for by wages, though they believe that there is insufficient evidence of what that share may be. Similarly, while Epstein et al (2011) do not quantify the value of these hazards, they support a similar argument in their statement that worker “deaths and illnesses are reflect-ed in wages and workers’ comp, costs considered internal to the coal industry, but long-term support often depends on state and federal funds.” Others disagree, such as NRC (2010), by clearly stating that traditionally workplace inju-ries and death are not considered an externality.
2 According to Epstein et al (2011), unfunded Abandoned Mine Land projects since the passing of the Surface Mine Control and Reclamation Act in 1977 to the end 2007 to-taled to $8.8 billion. Given that only $7.4 million had been collected between 1978 and the end of 2005, up to 54% (approximately 50%) of reclamation projects were unfund-ed in 2007.
3 Land reclamation releases additional GHG emissions in the process (Odeh and Cockerill, 2008; Spath et al., 1999)
4 Instead of adjusting the minimum bid, the rental rate—the annual payment made by the mining company when min-ing has not begun—can be set to account for the social fixed cost of lost public access during this pre-mining pe-riod. If the rental rate is adjusted in this way, the minimum bid must still be adjusted to account for the social fixed costs of mining in the post mining period—i.e., ALL lost public amenities from when mining begins until reclama-tion and the public cost of reclamation.
5 There are several estimates in the literature of the percent-age of CO2e emissions from methane leakage relative to total upstream and downstream GHG emissions from coal: Spath et al (1999) estimates it at 1.9% for the U.S.; Hondo (2005) estimates it to be 5.4% for Japan; and Odeh and Cockerill (2008) put this percentage higher at 6.5% for South Africa.
6 This was up from 71 million tons of CO2e in 2007 (Epstein et al., 2011).
7 Using the currently accepted GWP of 34 (IPCC, 2013. Pages 713 to 714), methane emissions from coal mines was actually 117 million metric tons CO2e of methane with an emission rate of 0.12 metric tons of CO2e per metric ton of coal.
8 The EPA (2015) estimates a significantly lower GHG emis-sions level than EIA (2011) in 2009 at 70.7 million mega-tons from mining.
9 Spath et al (1999, page 21) cites a study of 1.91 grams of methane emissions for a kilogram of received coal from surface mining in Illinois versus 4.23 g from underground mining. Spath et al (1999) also conducted sensitivity analy-sis changing these numbers to 0.84 and 9.21, respectively. In 2009, the EPA (2015) estimates coal mine capture to be 19.6 million megatonnes—approximately 25% of total emissions—from underground mining; this percentage in-creased to approximately 30% by 2013.
10 For surface coal mines, Spath et al (1999) estimates are based on the assumption that annual electricity and fuel (and oil) demands are 14,300 MWh and 269 m3 per MM tonne of coal mined.
11 There are alternative estimates in the literature of the per-centage of CO2e emissions from non-methane leakage in mining: Hondo (2005) estimates it to be 1% for Japan and Odeh and Cockerill (2008) estimate it to be 0.8% for South Africa.
12 Appendix B of Spath et al (1999) documents the various types of air pollutants from the lifecycle of coal, including emissions from surface mining.
13 Epstein (2011) cites a 2008 study that provides new evi-dence that coal mining significantly increases toxins and heavy metals—including arsenic—in waterways surround-ing mines.
14 Approximately half of the water pollution comes from min-ing according to Spath et al. (1999, pages 40 and 45), and the remaining half was attributed to the power generation subsystem (i.e., downstream).
15 Underground minds can also increase acidity of surround-ing water ways (NRC, 2010).
16 There is evidence that increased mining decreases fish populations (Lee et al., 1995). In Wyoming, this could po-tentially have an economic effect through decreased tour-ism. A portion of external cost of water pollution could be captured using the travel cost method to estimate the cost of loss tourism from decreased fishing stocks from mining (Lee et al., 1995).

A26
17 Groundwater water is a common resource—and as such suffers from a tragedy of the commons (Feeny et al, 1990). There is some evidence that mining is leading to the drain-ing of some aquifers that are used for alternative uses: drinking and livestock (http://www.powderriverbasin.org/assets/Uploads/files/coal-mining/PRB-coal-fact-sheet.pdf).
18 Slurry pipelines transport coal slurry—a mixture of coal and water (UCS, 2015).
19 98% of Wyoming coal is destined for power plants (EIA, 2015).
20 NRC (2010) computes this estimate “by multiplying the total number of occupational and public injuries occurring on freight railroads16 in 2007 by the proportion of ton-miles of commercial freight activity on domestic railroads accounted for by coal (43%). This estimate is then mul-tiplied by the percent of coal transported that is used for electric power generation (91%).” We ignore this latter step because we are interested in all coal.
21 Adjusting the EPA’s recommended VSL of 7.4 million in 2006 for inflation (an inflation factor of 1.17 according to the U.S. government’s CPI calculator), the cost to society of these impacts are approximately $2.2 billion in 2014 dol-lars.
22 In the United States, SO2 is regulated using a tradable per-mit market. As a consequence, sulfur dioxide should not be considered an externality from train emissions because a decrease in their emissions from trains will merely re-sult in an increase in another U.S. sector of the economy (Krupnick and Burtraw, 1996).
23 Appendix B in Spath et al (1999) documents the various types of air pollutants from the lifecycle of coal, including from transportation.
24 There are alternative estimates in the literature of the per-centage of CO2e emissions from coal transportation: Hon-do (2005) estimates it to be 1.6% for Japan and Odeh and Cockerill (2008) estimate it to be 3.5% (including some additional sources) for South Africa.
25 Additional states that produce coal include: West Virginia, Kentucky, Pennsylvania, Illinois, Texas, Montana, Indiana, North Dakota, Ohio, Colorado, New Mexico, Alabama, Utah, Virginia, Arizona, Mississippi, Louisiana, Maryland, Alaska, Oklahoma, Tennessee, Missouri, Arkansas, and Kansas (EIA, 2015).
26 39% of coal was mined in Wyoming in 2013 compared to 41% of coal came from East of the Mississippi includ-ing West Virginia (11%), Kentucky (8%), and Pennsyl-vania (5%) where underground mining is more common (http://www.eia.gov/coal/data.cfm).
27 At a minimum, BLM should qualitative consider these ad-ditional costs if they utilize this average cost estimate of mining on U.S. public lands in leasing decisions that con-sider different locations and mining methods than strip mining in the Powder River Basin.
28 For surface coal mining, Spath et al (1999) assumes annual emissions of ammonia nitrate of 2,070 Mg per MM tonne of coal mined.
29 Epstein et al (2011) specified 6 million metric tons of CO2e from loss of forests as a lower and best estimate of addition-al GHG emissions from mountaintop removal, and 37 mil-lion metric tons as an upper bound estimate.
30 Theoretically, some portion of this cost could be internal-ized through insurance payments and other means. While it is difficult to determine what portion, it is clearly less than 100% (Berry et al., 1995).
31 According to Epstein et al (2011), mountaintop removal results in the loss of aquatic species some of which have yet to be identified.
32 East of the Mississippi, 14% of coal is shipped by truck, 46% by rail, 35% by water, and 4% using other methods. West of the Mississippi, 10% of coal is shipped by truck, 80% by rail, 0% by water, and 10% by other methods [EIA, 2015 April]. In general, trucks are generally used to move coal for shorter distances (Lee et al., 1995).
33 The wear and tear of private roads—such as at the coal mining site—should not be included as an externality be-cause they are built and maintained by the mining company (Krupnick and Burtraw, 1996). Additionally, some portion of wear and tear on private roads is partially internalized through fees (Krupnick and Burtraw, 1996); this portion should also not be included as an externality.
34 This step includes determining all externalities from coal production and use, and then prioritizing those that are sig-nificant and that can be measured and valued (Berry et al., 1998).
35 Lee et al (1995) focuses on lifecycle costs—including the upstream costs of mining, processing, and transporta-tion—of seven fuels for a hypothetical power plant built
A27
in 1990. The locations of their hypothetical coal plants are Eastern Tennessee and Northwestern New Mexico—the former being more densely populated than the latter (Bur-traw and Krupnick, 2012).
36 A report for New York state that estimated the external cost of pollution from various new and existing electric resource options in three NY state locations (urban, suburban, and rural) using the damage function approach.
37 ExternE focuses on estimating the external costs of new and existing power plants—including coal—in representa-tive European sites.
38 NRC (2010) studies the upstream and downstream exter-nalities of the U.S. coal fuel cycle. Most upstream are quali-tatively studied, while some air pollution emissions are quantified and the costs of health impacts from transport-ing coal are estimated.
39 Epstein et al (2011) estimates the upstream and down-stream external costs of U.S. coal.
40 Spath et al (1999) estimates the non-monetary impacts of coal in a lifecycle analysis of an average U.S. coal-fired pow-er plants assuming two different types of mining (surface and underground) and three different forms of transporta-tion (railroad, water, and trucks).
41 Odeh and Cockerill (2008) is a quantitative analysis of the upstream and downstream impacts—particularly focusing on GHG emissions—of UK coal power plants.
42 Nkambule and Blignaut (2012) estimate the upstream ex-ternalities for the Kusile coal-fired power station—a pro-posed coal fired power plant in South Africa.
43 Burtraw et al. (2012) emphasize the superiority of the dam-age cost approach over the abatement cost approach. For application of the damage function approach, a specific lo-cation should be specified (Berry et al., 1995).
44 In cases where this is not true, we will emphasize the dis-crepancy.
45 While Epstein et al (2011) is the only published article of the recommended studies, Krupnick and Burtraw (1996) emphasize that the earliest three recommended models are comprehensive and peer-reviewed.
46 Nkambule and Blignaut (2012) account for lost ecosystem services (only carbon storage) and agricultural production from land conversion due to the mine. The loss of agricul-
tural production—specifically maize production—is the third highest cost in the study. However, the South African study is irrelevant with respect to lost amenities in Wyo-ming’s Powder River Basin.
47 For example, Berry et al (1998) assume that GHG emis-sions from their UK reference site are 300 g/GJ.
48 Technically, they are the cost of 2007 emissions if they were omitted in 2015. We utilize the 2015 SC to make the esti-mates more current, and utilize the 2007 average amount of methane per ton of coal as a proxy for average emissions in 2015.
49 These estimates include impacts from nitrogen oxides, Sul-phur dioxide, and particulate matter (PM2.5). Due to exist-ing regulations that cap Sulphur dioxide emissions, only nitrogen oxides and particulate matter apply in the United States.
50 Given the difficulty of valuing ecosystems, it is unsurprising that only three of the recommended models consider the value of ecosystems (Burtraw et al., 2012) and mostly qual-itatively. To capture the full value of ecosystems—includ-ing the value of biodiversity and non-use values—stated preference methods are necessary (Berry et al., 1995).
51 Specifically, Row et al (1995) find an external cost of water equal to 0.022 mills/kWh from upstream and downstream pollution. This is compares to an external cost of air pollu-tion of 71.555 mills/kWh.
52 For trains, Spath et al (1999, p. 22) assumes that the aver-age transportation distance by rail is 483 km with a longest distance travelled being 1,538 km. They also assume 48 km of train transport when coal is moved by barge.
53 We calculate the travel distance and ton-miles of coal using EIA (2015) data. To make these calculations, we assumed rail distances between states were approximately equal to driving distance on google map between the sending and receiving states’ largest cities. For within state transporta-tion, we assumed that travel distances were equal to the minimum inter-state travel distance—33 miles between Pennsylvania and Delaware.
54 If we assume that impacts reduce to 20% due to the EPA regulation, the externality impact is $1.47 per ton of Wyo-ming coal produced.
55 This can be rewritten as: Cost Per Unit = VSL * Avg Fatalities Per Train – Miles Total Freight, US * Train – Miles Coal, US .
A28
56 The authors calculate VSI utilizing the average cost of non-fatal railroad injuries (from the late 80s) reported in Rail-road Injury and Illness (Pindus, Miller, and Douglas, 1991).
57 Assuming that “$165 million is paid out by the freight in-dustry in claims and suits to the public each year”, they esti-mate that approximately 4.7% of total damages is internal-ized by coal companies.
58 Using a similar method, they find a cost of $0.23 per ton of coal for their hypothetical plant (that uses approximate 1.9 million tons of coal) in the Southwestern United States with an average shipping distance by truck of 30 miles; this cost is over $3 per ton if trucks have to drive 410 miles like trains. Additionally, they estimate between $0.37 and $0.56 per ton of road damage (approximately $5.10 to $7.60 per ton for a 410 mile trip). This implies that the externalities of trucks are much higher on a per ton-mile basis—a result that is also true for GHG emissions.
59 Citing the NRC (2010) numbers in their study, Epstein et al (2011) argues NRC (2010) utilizes the share of revenue-ton-miles instead of ton-miles as their proxy for risk.
60 If Wyoming and Montana are considered together, they make up 85% of U.S. coal ton-miles. In this case, the exter-nal cost per ton of coal mined in the Powder River Basin due to rail accidents is $4.60.
61 See equation (5) in Traeger (2014).
62 See Traeger (2014) and Mensink and Requate (205).
63 While quasi-option value is the “the value of learning under postponement” defined above, simple option value is “the value of the option to carry out the project in the second period, conditional on not carrying out the project in the first period, in the absence of information flow (Traeger, 2014).”
64 See equation (9) in Traeger (2014).
65 In many cases, the modeling of mining impacts take vari-ous steps from emission of impacts take various steps. For example, the effect of emission on crop yields require: (1) the modeling of key emissions from mining (i.e., the emis-sion factors), the modeling of emission pollution formation and dispersion (i.e., models of atmospheric transport and chemistry), modeling of crop growth, and a model of yield change (i.e., a dose response function) (Berry et al., 1995). Similarly, the effects of air and water pollution on health and the environment require at a minimum: (1) emission factors, dispersion models, and dose-response functions. At each of these steps, there is uncertainty.
66 The prices of impacts are captured through prices estimates (e.g., the social cost of carbon or the value of statistical life) or impact equations. Like the physical effects of drill-ing, prices are uncertain. While we may learn the effects of drilling (i.e. learn what state of the world we are in), we are unlikely to learn the price of the environmental services. In-stead, as more estimates become available, the distribution of estimates will potentially center on a particular value; this should be thought of the variance of a meta-analysis declining over time as more points become available, and should not be thought of as uncertainty surrounding a point estimate which will always be there.
67 According to Jakobsson and Dragun (1996), “Option price [real option value plus consumer surplus] can be deter-mined using surveys.”
68 Similarly, decision makers could be elicited for willingness to accept estimates.
69 Examples include Fisher and Hanemann (1990), Albers and Robinson (2007), Adger et al. (1994), and Tegene et al. (1999).
70 Under this interpretation, the second period value function represents the expected present value of all future net ben-efits from the optimal leasing decision.
71 See BOEM (2012) and the recently released White House (2014).
72 To estimate the quantity of oil, the DOI uses “field counts at various levels of uncertainty (BOEM, 2012).” Based on this analysis, the DOI’s hurdle price analysis uses supply estimates for “the mean probability, an accepted and un-biased statistical approach in the presence of uncertainty (BOEM, 2012).”
73 The cost inputs are from the commercial FieldPlan and MAG-Plan, and may not include externality cost estimates.
74 By using the price model specified in WEB2, DOI assumes the oil price follows a mean reversion process. Presumably the DOI estimated the mean-reversion parameters using oil price data.
75 “Once the largest field size is set, the WEB2 model requires estimates of costs associated with that field. Cost inputs for the WEB2 model came from the commercial Que$tor cost modeling system and from data collected by BOEM for the socioeconomic analysis of the Five-Year Program (i.e., the economic impact model MAG-PLAN). The Que$tor soft-ware allows BOEM to calculate the expected costs of devel-

A29
opments, specifically for the size of the largest geologic field in the planning area (BOEM, 2015).”
76 For example, as more data on the environmental effects of drilling become available (i.e. as we learn more about the state of the world we live in), the uncertainty surrounding the net social benefits of drilling would be less, leading to more precise environmental damage estimates. The addi-tional value of this information—also known as quasi-op-tion value—is always nonnegative (Fisher and Hanemann, 1990).
77 A possible starting point could be Conrad and Kotani (2005).
78 As demonstrated in Conrad and Kotani (2005) and Fackler (2007), the resulting option value estimate depends on the assumed stochastic process(es).
79 For example, in the forestry literature, the value of forest amenities is unobservable. By assuming that visitation rates to the forests are proportional to the level of ameni-ties, Conrad (1997) demonstrates that visitation rates and amenities are governed by identical stochastic processes. This allows Conrad (1997) and Forsyth (2000) to estimate parameters in the stochastic process governing forest ame-nities using availability visitation data.
80 Currently (i.e., in Appendix B), we calculate the average cost of net methane in the United States, which equals the product of the social cost of methane (currently calculat-ed in this paper as the product of the SCC and the global warming potential of methane) and U.S. net methane emis-sions (U.S. gross methane emission less U.S. methane cap-ture) divided by total U.S. coal production. If we make a reduction in royalty rates due to methane capture, the ap-propriate average cost of methane calculation is the average cost of gross methane emissions, which equals the product of the social cost of methane and U.S. gross methane emis-sions of methane divided by total U.S. coal production.
A30
References
Adger, N., Brown, K., Cervigni, R., & Moran, D. (1994). Towards estimating total economic value of forests in Mexico. Centre for Social and Economic Research on the Global Environment.
Albers, H. J., & Robinson, E. J. (2007). Spatial-temporal aspects of cost-benefit analysis for park management: An example from Khao Yai National Park, Thailand. Journal of Forest Economics, 13(2), 129-150.
Andersson, H. (2007). Are commodity prices mean reverting?. Applied Financial Economics, 17(10), 769-783.
Arrow, K. J., & Fisher, A. C. (1974). Environmental preservation, uncertainty, and irreversibility. The Quarterly Journal of Economics, 312-319.
Berry, J., Holland, M., & Lee, D. (1995). ExternE: Externalities of energy Vol. 3. Coal and lignite. European Commission, Directorate-General XII, Science, Research and Development (Luxembourg).
Berry, J. E., Holland, M. R., Watkiss, P. R., Boyd, R., & Stephenson, W. (1998). Power generation and the environment—a UK perspective. ExternE Project, 1.
Bickel, P., Friedrich, R., Droste-Franke, B., Bachmann, T. M., Gressmann, A., Rabl, A., ... & Tidblad, J. (2005). ExternE Externalities of Energy Methodology 2005 Update.
[BOEM, 2015] Bureau of Ocean Energy Management, Department of the Interior. (2015). 2017—2022 Outer Continental Shelf Oil and Gas Leasing - Draft Proposed Program. Revised January, 2015.
[BOEM, 2012] Bureau of Ocean Energy Mgmt., Department of the Interior. (2012). Forecasting Environmental and Social Externalities Associated with OCS Oil and Gas Development: The Revised Offshore. Revised June, 2012. Department of the Interior JA4517.
Burtraw, D., Krupnick, A., & Sampson, G. (2012). The True Cost of Electric Power: An Inventory of Methodologies to Support Future Decision-making in Comparing the Cost and Competitiveness of Electricity Generation Technologies. Resources for the Future (RFF), Washington, DC.
Chikkatur, A. P., Chaudhary, A., & Sagar, A. D. (2011). Coal power impacts, technology, and policy: connecting the dots. Annual Review of Environment and Resources, 36, 101-138.
Conrad, J. M. (1997). On the option value of old-growth forest. Ecological Economics, 22(2), 97-102.
Conrad, J. M., & Kotani, K. (2005). When to drill? trigger prices for the arctic national wildlife refuge. Resource and Energy Economics, 27(4), 273-286.
[CRS, 2013] Humphries, M., & Sherlock, M. (2013). U.S. and World Coal Production, Federal Taxes, and Incentives. Congressional Report, (R43011). Available at http://fas.org/sgp/crs/misc/R43011.pdf.
Dias, M. A. G., & Rocha, K. M. C. (1999, June). Petroleum concessions with extendible options using mean reversion with jumps to model oil prices. In 3rd Real Options Conference (pp. 1-27).

A31
Dikos, G. and S.P. Sgouridis. (2008). On the optimal timing of the oil pollution act: Is there more value in waiting than acting?, International Journal of Ocean Systems Management 1(3):100-117.
Dixit, A.K., Pindyck, R.S., 1994. Investment Under Uncertainty. Princeton University Press, Princeton, NJ.
[DOE, 2006] DoE, U. S. (2006). Energy demands on water resources: Report to Congress on the interdependency of energy and water. Washington DC: U.S. Department of Energy, 1.
Dones, R., Heck, T., Bauer, C., Hirschberg, S., Bickel, P., Preiss, P., ... & De Vlieger, I. (2005). ExternE-Pol Externalities of Energy: Extension of Accounting Framework and Policy Applications. Paul Scherer Institute.
[Duke, 2013] Duke Nicholas School of the Environment. (2013). Wyoming Water Law - A Summary. January 8. Available at http://sites.nicholas.duke.edu/charlespodolak/files/2013/01/Wyoming-Water-Law-Issues.pdf.
[EC, 1995] European Commission. (1995). Externalities of Energy: ExternE Project. For the Directorate General XII. Prepared by Metroeconomica, IER, Eyre Energy-Environment, ETSU, and Ecole des Mines. Luxembourg: Office for Official Publications of the European Communities
[EDF, 2006] Scott, J., & Sinnamon, H. (2006). Smokestacks on Rails: Getting Clean Air Solutions for Locomotives on Track. Environmental Defense Fund. New York.
[EIA, 2009] Young, P. (2010). Annual coal report 2009. U.S. energy administration. Washington, DC: U.S. Department of Energy.
[EIA, 2011] Conti, J., Holtberg, P., & Lindstrom, P. (2011). Emissions of greenhouse gases in the United States 2009. Washington: U.S. Energy Information Administration, U.S. Department of Energy.
[EIA, 2015] Energy Information Administration. (2015). Annual Coal Distribution Report 2013. Washington, DC. Available at http://www.eia.gov/coal/distribution/annual/.
[EPA, 2015] EPA, A. (2011). Inventory of U.S. greenhouse gas emissions and sinks: 1990-2009. EPA 430-R-15-004.
[EPA, 2015b] EPA. (2015). “Understanding Global Warming Potentials.” Available at http://www.epa.gov/climatechange/ghgemissions/gwps.html.
Epstein, P. R., Buonocore, J. J., Eckerle, K., Hendryx, M., Stout Iii, B. M., Heinberg, R., ... & Glustrom, L. (2011). Full cost accounting for the life cycle of coal. Annals of the New York Academy of Sciences, 1219(1), 73-98.
Fackler, P. L. (2007). Comment on Conrad and Kotani. Resource and Energy Economics, 29(2), 159-164.
Feeny, D., Berkes, F., McCay, B. J., & Acheson, J. M. (1990). The tragedy of the commons: twenty-two years later. Human ecology, 18(1), 1-19.
Fischer, C., Withagen, C., & Toman, M. (2004). Optimal investment in clean production capacity. Environmental and Resource Economics, 28(3), 325-345.
Fisher, A. C., & Hanemann, W. M. (1990). Option value: theory and measurement. European Review of Agricultural Economics, 17(2), 167-180.
Forsyth, M. (2000). On estimating the option value of preserving a wilderness area. Canadian Journal of Economics/Revue canadienne d’économique, 33(2), 413-434.

A32
Fox, J. F., & Campbell, J. E. (2010). Terrestrial Carbon Disturbance from Mountaintop Mining Increases Lifecycle Emissions for Clean Coal. Environ. Sci. Technol, 44, 2144-2149.
Freeman, A. M., & Rowe, R. D. (1995). Ranking electric generating technologies with external costs. The Electricity Journal, 8(10), 48-53.
Geman, H. (2007). Mean reversion versus random walk in oil and natural gas prices. In Advances in Mathematical finance (pp. 219-228). Birkhäuser Boston.
Grafton, R. Q., Libecap, G., McGlennon, S., Landry, C., & O’Brien, B. (2011). An integrated assessment of water markets: a cross-country comparison. Review of Environmental Economics and Policy, 5(2), 219-239.
Ha-Duong, M. (1998). Quasi-option value and climate policy choices. Energy Economics, 20(5), 599-620.
[Headwaters, 2015] Headwater Economics. (2015). The Impact of Federal Coal Royalty Reform on Prices, Production, and State Revenue. May. Available at http://headwaterseconomics.org/wphw/wp-content/uploads/Report-Coal-Royalty-Reform-Impacts.pdf.
Hondo, H. (2005). Life cycle GHG emission analysis of power generation systems: Japanese case. Energy, 30(11), 2042-2056.
Industrial Economics, Inc. (2012). Energy alternatives and the environment. U.S. Department of the Interior, Bureau of Ocean Energy Management. OCS Study BOEM 2012-021. JA 4807-48774
Insley, M., & Lei, M. (2007). Hedges and trees: incorporating fire risk into optimal decisions in forestry using a no-arbitrage approach. Journal of Agricultural and Resource Economics, 492-514.
[IPI, 2015] The Institute for Policy Integrity. (2015). Comments on the Draft Proposed 2017-2022 Outer Continental Shelf (OCS) Oil and Gas Leasing Program, BOEM-2014-0059. March 30. Available at http://policyintegrity.org/documents/Comments_to_BOEM_2017-2022_Offshore_Program.pdf.
[IPCC, 2014] Qin, D., Plattner, G. K., Tignor, M., Allen, S. K., Boschung, J., Nauels, A., ... & Midgley, P. M. (2014). Climate change 2013: The physical science basis (p. 1535). T. Stocker (Ed.). Cambridge, UK, and New York: Cambridge University Press.
[IWG, 2013] Interagency Working Group on Social Cost of Carbon. (2013). Social Cost of Carbon for Regulatory Impact Analysis under Executive Order 12866. Revised July 2015. United States Government.
Jakobsson, K. M., & Dragun, A. K. (1996). Contingent valuation and endangered species: methodological issues and applications. Edward Elgar Publishing.
King. (2007). Economic Analysis for the OCS 5-Year Program 2007-2012: Theory and Methodology, JA 5304.
Krupnick, A. J., & Burtraw, D. (1996). The social costs of electricity: do the numbers add up?. Resource and Energy Economics, 18(4), 423-466.
Lee, R., Krupnick, A. J., & Burtraw, D. (1995). Estimating Externalities of Electric Fuel Cycles: Analytical Methods and Issues, and Estimating Externalities of Coal Fuel Cycles. Washington, D.C.: The National Academies Press.

A33
Libecap, G. D. (2010, September). Water Rights and Markets in the U.S. Semi-Arid West: Efficiency and Equity Issues. In Conference on “The Evolution of Property Rights Related to Land and Natural Resources.
Lovelace, J. K. (2009). Methods for estimating water withdrawals for mining in the United States, 2005. U. S. Geological Survey.
Mahul, O., & Gohin, A. (1999). Irreversible decision making in contagious animal disease control under uncertainty: an illustration using FMD in Brittany. European review of agricultural economics, 26(1), 39-58.
Marten, A. L., Kopits, E. A., Griffiths, C. W., Newbold, S. C., & Wolverton, A. (2015). Incremental CH4 and N2O mitigation benefits consistent with the U.S. Government’s SC-CO2 estimates. Climate Policy, 15(2), 272-298.
Mensink and Requate. (2005). The Dixit-Pindyck and the Arrow-Fisher-Hanemann-Henry Option Values are not Equivalent, Resource and Energy Economics, 27, 83-88.
Mielke, E., Anadon, L. D., & Narayanamurti, V. (2010). Water consumption of energy resource extraction, processing, and conversion. Belfer Center for Science and International Affairs.
Nkambule, N. P., & Blignaut, J. (2012). The external costs of coal mining: the case of collieries supplying Kusile power station. Journal of Energy in Southern Africa, 23(4), 85-93.
[NRC, 2010] National Research Council (U.S.). Committee on Health, Environmental, and Other External Costs and Benefits of Energy Production and Consumption. (2010). Hidden costs of energy: unpriced consequences of energy production and use. National Academies Press.
Odeh, N. A., & Cockerill, T. T. (2008). Life cycle analysis of UK coal fired power plants. Energy conversion and management, 49(2), 212-220.
[Peabody, 2012] Eric Fry. (2012). Coal Mining and Water. September. Available at http://water.epa.gov/action/importanceofwater/upload/14-Fry.pdf.
Pindyck, R. S., & Rubinfeld, D. L. (1991). Econometric models and economic forecasts (Vol. 3). New York: McGraw-Hill.
Pindyck, R. S. (1999). The long-run evolution of energy prices. The Energy Journal, 1-27.
Power, T. M. (2005). The supply and demand for natural amenities: An overview of theory and concepts. Amenities and rural development: Theory, methods and public policy, 63-77.
Rafaj, P., & Kypreos, S. (2007). Internalisation of external cost in the power generation sector: Analysis with Global Multi-regional MARKAL model. Energy Policy, 35(2), 828-843
Radwan, A. E., & Alexander, L. (1983). IMPACT OF COAL TRAIN MOVEMENT ON STREET TRAFFIC FLOWS: A CASE STUDY. Transportation Research Record, (917).
Reed, W. J. (1984). The effects of the risk of fire on the optimal rotation of a forest. Journal of environmental economics and management, 11(2), 180-190.
Revesz, R. L., Howard, P. H., Arrow, K., Goulder, L. H., Kopp, R. E., Livermore, M. A., ... & Sterner, T. (2014). Global warming: Improve economic models of climate change. Nature, 508(7495), 173-175.

A34
[RFF/ORNL, 1995] Lee, R., Krupnick, A. J., & Burtraw, D. (1995). Estimating Externalities of Electric Fuel Cycles: Analytical Methods and Issues, and Estimating Externalities of Coal Fuel Cycles. Washington, D.C.: The National Academies Press.
Rowe, R. D., Lang, C. M., & Smolinsky, J. (1997). The magnitude of electricity externalities through time. In Social Costs and Sustainability (pp. 184-199). Springer Berlin Heidelberg.
Schwartz, E. S. (1997). The stochastic behavior of commodity prices: Implications for valuation and hedging. The Journal of Finance, 52(3), 923-973.
[Seattle, 2012] Parametrix. (2012). Coal Train Traffic Impact Study. October. Available at http://www.seattle.gov/transportation/docs/121105PR-CoalTrainTrafficImpactStudy.pdf
Spath, P. L., Mann, M. K., & Kerr, D. R. (1999). Life Cycle Assessment of Coal-fired Power Production (No. NREL/TP-570-25119). National Renewable Energy Lab., Golden, CO (U.S.).
Sun, Q., Xu, W., & Xiao, W. (2013). An empirical estimation for mean-reverting coal prices with long memory. Economic Modelling, 33, 174-181.
Tegene, A., Wiebe, K., & Kuhn, B. (1999). Irreversible investment under uncertainty: Conservation easements and the option to develop agricultural land. Journal of Agricultural Economics, 50(2), 203-219.
Tol, R. S. (2011). The social cost of carbon. Annu. Rev. Resour. Econ., 3(1), 419-443.
Traeger, C. P. (2014). On option values in environmental and resource economics. Resource and Energy Economics, 37, 242-252.
[UCS, 2015] The Union for Concerned Scientists. (2015). “How Coal Works.” Accessed September, 2015. Available at: http://www.ucsusa.org/clean_energy/our-energy-choices/coal-and-other-fossil-fuels/how-coal-works.html#.Vdc_FvlVhHw.
[USGS, 1999] Zelt, R. B., Boughton, G. K., Miller, K. A., Mason, J. P., & Gianakos, L. M. (1999). Environmental setting of the Yellowstone River basin, Montana, North Dakota, and Wyoming (No. 98-4269). U.S. Dept. of the Interior, U.S. Geological Survey; Branch of Information Services [distributor]. Available at http://pubs.usgs.gov/wri/wri984269/anthropo.html.
[WB, 2011] Grausz, S. (2011). The Social Cost of Coal: Implications for the World Bank. Washington, DC: The Climate Advisers.
The White House. (2014). The Cost of Delaying Action to Stem Climate Change. http://www.whitehouse.gov/sites/default/files/docs/the_cost_of_delaying_action_to_stem_climate_change.pdf

Institute for Policy IntegrityNew York University School of Law
Wilf Hall, 139 MacDougal Street, New York, New York 10012www.policyintegrity.org
NEW YORK UNIVERSITY SCHOOL OF LAW
Related Documents