Recommendations on Zero Ratings in the Value-Added Tax System 2018 INDEPENDENT PANEL OF EXPERTS FOR THE REVIEW OF ZERO RATING IN SOUTH AFRICA RECOMMENDATIONS TO THE MINISTER OF FINANCE 6 August 2018

Welcome message from author
This document is posted to help you gain knowledge. Please leave a comment to let me know what you think about it! Share it to your friends and learn new things together.
Transcript

Recommendations on Zero Ratings in the Value-Added Tax
System
2018
INDEPENDENT PANEL OF EXPERTS FOR THE REVIEW OF ZERO RATING IN SOUTH AFRICA
RECOMMENDATIONS TO THE MINISTER OF FINANCE
6 August 2018

2
Contents
1 EXECUTIVE SUMMARY ................................................................................ 7
2 INTRODUCTION ........................................................................................... 9 2.1 BACKGROUND .......................................................................................................................................... 9 2.2 TERMS OF REFERENCE ........................................................................................................................... 9 2.3 COMPOSITION OF THE PANEL ........................................................................................................... 10 2.4 CONSULTATIONS .................................................................................................................................. 11
3 A GUIDE TO EVALUATING TAX POLICY ............................................... 12 3.1 ASSESSING TAX POLICY PROPOSALS .................................................................................................. 12
4 PROCESS AND METHODOLOGY ............................................................. 15 4.1 THE TAX REVENUE LANDSCAPE ...................................................................................................... 15 4.2 PRINCIPLES ............................................................................................................................................ 16
5 DATA ANALYSIS ........................................................................................... 23 5.1 AIMS ........................................................................................................................................................ 23 5.2 METHODOLOGY ................................................................................................................................... 23 5.3 RESULTS OF THE DATA ANALYSIS ..................................................................................................... 30
6 ANALYSIS OF EIGHT ITEMS REVIEWS FOR ZERO RATING ............. 40 6.1 BREAD ..................................................................................................................................................... 40 6.2 WHITE BREAD FLOUR AND CAKE FLOUR (CONSIDERED COLLECTIVELY) ............................... 43 6.3 SCHOOL UNIFORMS .............................................................................................................................. 48 6.4 BABY FORMULA (MILK-BASED BABY FOOD) .................................................................................... 50 6.5 INDIVIDUALLY QUICK FROZEN POULTRY PARTS ........................................................................... 53 6.6 SANITARY PADS ..................................................................................................................................... 57 6.7 NAPPIES .................................................................................................................................................. 60
7 RECOMMENDATIONS ............................................................................... 63 7.1 ITEMS RECOMMENDED FOR ZERO RATING ..................................................................................... 63 7.2 ITEMS NOT RECOMMENDED FOR ZERO RATING ............................................................................ 64 7.3 DISAGREEMENT ON OTHER ITEMS ................................................................................................... 64
8 ALTERNATIVE WAYS TO MITIGATE THE VAT INCREASE ............... 66 8.1 IN-KIND SUPPORT PROGRAMMES ...................................................................................................... 67 8.2 NUTRITIONAL SUPPORT ...................................................................................................................... 67 8.3 PROVISION OF SANITARY PRODUCTS ................................................................................................ 69 8.4 CASH TRANSFER PROGRAMMES ......................................................................................................... 69 8.5 LOWER POSITIVE VAT RATES ON SOME ITEMS .............................................................................. 73 8.6 CONCLUSION: ........................................................................................................................................ 74
9 APPENDIX ..................................................................................................... 75

3
9.1 APPENDIX 1 – LIST OF SUBMISSIONS RECEIVED ............................................................................ 75 9.2 APPENDIX 2 – CALCULATION TABLES .............................................................................................. 80 9.3 APPENDIX 2 – EXTRACTS FROM THE NATIONAL FOOD AND NUTRITION SECURITY PLAN
FOR SOUTH AFRICA 2018 – 2023 ...................................................................................................................... 91

4
Tables in the Report
Table 1: Comparison of total expenditure figures in the LCS with CPI and GDP data ............................... 25
Table 2: Data summary for eight items considered in detail (Rand million), 2018 prices ............................. 30
Table 3: Annual VAT revenue forgone (VAT relief) per household on existing zero-rated basket in Rand (2018 prices), by decile ................................................................................................................................... 32
Table 4: VAT revenue savings on existing zero-rated basket in Rand (2018 prices), by decile .................... 33
Table 5: Proportional expenditure and equity gain ratio of eight vatable items, by decile ............................ 33
Table 6: VAT revenue paid per decile on vatable expenditure items in Rand (2018 prices), data, by decile ............................................................................................................................................................................ 34
Table 7: Annual Difference in VAT paid per household on existing vatable items in Rand (2018 prices), LCS data, by decile .......................................................................................................................................... 34
Table 8: VAT paid (in Rand million) at 15% rate on selected existing vatable items, by decile ................... 36
Table 9: VAT paid (in Rand million) at 15% rate on selected existing vatable items, by decile, scaled for LCS undercounting ......................................................................................................................................... 36
Table 10: Proportional expenditure on bread ....................................................................................................... 41
Table 11: Flour price comparison .......................................................................................................................... 45
Table 12: Wheat production figures ....................................................................................................................... 46
Table 13: Proportional expenditure on flour ........................................................................................................ 46
Table 14: VAT revenue - flour ................................................................................................................................ 46
Table 15. Data on school uniforms by decile ....................................................................................................... 49
Table 16: Revenue cost of zero rating proposals (R million in 2018 prices, adjusted for LCS undercount) ............................................................................................................................................................................ 64
Table 17: Cash transfers, 2018/19 fiscal year ....................................................................................................... 70
Table 18: Percentage of households receiving social assistance grants, by decile (2014/15) ........................ 71
Table 19: List of submissions received .................................................................................................................. 75
Table 20: Spending on zero-rated items as percentage of total consumption expenditure .......................... 80
Table 21: Benefit cost ratios for existing zero-rated items (VAT rate = 15%) ............................................... 83
Table 22: Total VAT relief on existing zero-rated items (Rand million), 2018 prices ................................... 85
Table 23: Submissions received .............................................................................................................................. 90

5
Figures in the Report
Figure 1: Total gross tax revenue as a percentage of the GDP for the fiscal year and in constant Rand ... 15Figure 2: Share of different types of tax in total revenue from 1990/2000 ..................................................... 16Figure 3: Average household income and expenditure by decile, 2014/5 ....................................................... 17Figure 4: Incidence of the increase in VAT by household decile, in 2017 Rand and compared to household
income and expenditure ................................................................................................................................. 18Figure 5: Share of expenditure on zero-rated and other goods by decile, 2014/5 ......................................... 19Figure 6: National budget deficit as percentage of the GDP, 1990 to 2018 ................................................... 21Figure 7: The average difference in price between white and brown bread (600g and 700g loaves), 2000 to
January 2017 ..................................................................................................................................................... 22Figure 8: Average household income and average household consumption expenditure by decile, April 2018
prices ................................................................................................................................................................. 26Figure 9: Household spending on major expenditure group items as percentage of total expenditure, by
decile ................................................................................................................................................................. 27Figure 10: Household spending on selected zero-rated items as percentage of total expenditure, by decile
............................................................................................................................................................................ 31Figure 11: Equity gain ratio for existing zero-rated items .................................................................................. 32Figure 12: Benefit cost ratios for existing eight vatable items (BCR1) ............................................................. 35Figure 13: Average VAT relief on (existing vatable) items as percentage of average income: poultry, by
decile ................................................................................................................................................................. 37Figure 14: Average VAT relief on (existing vatable) items as percentage of average income: white bread,
cake flour and bread flour, by decile ............................................................................................................ 38Figure 15: Average VAT relief on (existing vatable) items as percentage of average income: disposable
nappies, sanitary products, school uniform, by decile ............................................................................... 38Figure 16: Average VAT relief on (existing vatable) items as proportional of average income: baby food
predominantly milk, by decile ....................................................................................................................... 39Figure 17: Retail prices for chicken, average for 2017 ........................................................................................ 53Figure 18: Expenditure on all poultry as percentage of household expenditure and estimated VAT paid on
IQF in 2017 Rand (a) by household expenditure decile ........................................................................... 54Figure 19: Chicken production, consumption and imports ............................................................................... 56Figure 20: Composition of chicken inputs ............................................................................................................ 56Figure 19: Expenditure on sanitary pads as percentage of household expenditure and estimated VAT paid
in 2017 Rand (a) by household expenditure decile .................................................................................... 58Figure 20: Average household expenditure required to meet the need for sanitary pads of women aged 13
to 55 compared to reported expenditure by expenditure decile, in 2017 Rand .................................... 59
6
Figure 21: VAT paid (in Rand million at 15%) .................................................................................................... 62Figure 24. Cost of the increase in VAT by household expenditure decile, total and average per household
(in 2018 Rand terms) ...................................................................................................................................... 66Figure 25. Share of households not receiving any grant by decile .................................................................... 72Figure 26. UIF membership by earnings level, 2016 ........................................................................................... 73
7
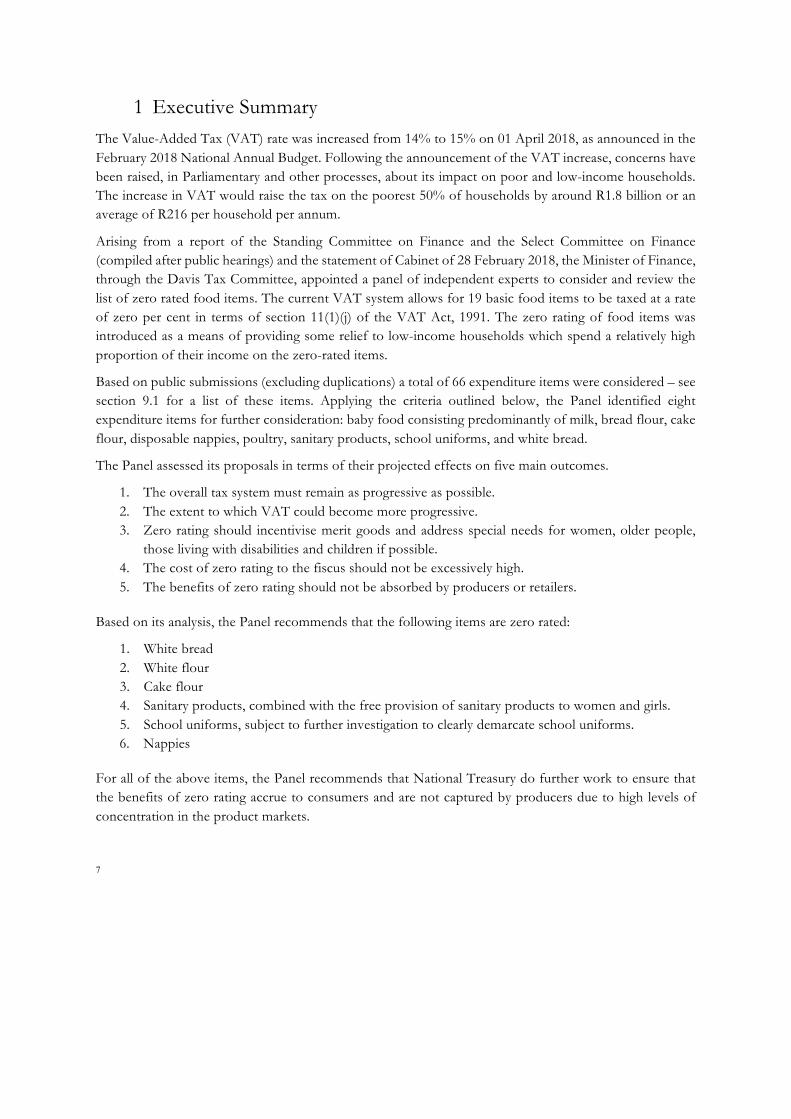
1 Executive Summary The Value-Added Tax (VAT) rate was increased from 14% to 15% on 01 April 2018, as announced in the February 2018 National Annual Budget. Following the announcement of the VAT increase, concerns have been raised, in Parliamentary and other processes, about its impact on poor and low-income households. The increase in VAT would raise the tax on the poorest 50% of households by around R1.8 billion or an average of R216 per household per annum.
Arising from a report of the Standing Committee on Finance and the Select Committee on Finance (compiled after public hearings) and the statement of Cabinet of 28 February 2018, the Minister of Finance, through the Davis Tax Committee, appointed a panel of independent experts to consider and review the list of zero rated food items. The current VAT system allows for 19 basic food items to be taxed at a rate of zero per cent in terms of section 11(1)(j) of the VAT Act, 1991. The zero rating of food items was introduced as a means of providing some relief to low-income households which spend a relatively high proportion of their income on the zero-rated items.
Based on public submissions (excluding duplications) a total of 66 expenditure items were considered – see section 9.1 for a list of these items. Applying the criteria outlined below, the Panel identified eight expenditure items for further consideration: baby food consisting predominantly of milk, bread flour, cake flour, disposable nappies, poultry, sanitary products, school uniforms, and white bread.
The Panel assessed its proposals in terms of their projected effects on five main outcomes.
1. The overall tax system must remain as progressive as possible. 2. The extent to which VAT could become more progressive. 3. Zero rating should incentivise merit goods and address special needs for women, older people,
those living with disabilities and children if possible. 4. The cost of zero rating to the fiscus should not be excessively high. 5. The benefits of zero rating should not be absorbed by producers or retailers.
Based on its analysis, the Panel recommends that the following items are zero rated:
1. White bread 2. White flour 3. Cake flour 4. Sanitary products, combined with the free provision of sanitary products to women and girls. 5. School uniforms, subject to further investigation to clearly demarcate school uniforms. 6. Nappies
For all of the above items, the Panel recommends that National Treasury do further work to ensure that the benefits of zero rating accrue to consumers and are not captured by producers due to high levels of concentration in the product markets.
8
The Panel recommends that the following items are not zero rated: baby food (predominantly milk), that is baby formula, should not be zero rated based on public health recommendations.
The Panel was unable to reach consensus on whether or not to recommend the following products be zero rated: individually quick frozen (IQF) poultry parts. This report gives the arguments behind each of these proposals.
In addition to these recommendations, and in line with the Terms of Reference, the Panel provides possibilities on alternative ways to mitigate the VAT increase, including;
1. Nutritional support 2. Free provision of sanitary products 3. Cash transfer programmes, especially through the social grants system 4. Lower (non-zero) VAT rates on the items that the Panel identified.
The Panel is of the view that expenditure programmes have a role to play in mitigating the impact of the VAT increase on poor households. In theory, it would be cheaper to return the cost of the VAT increase to the poorest households than to extend zero rating. The challenge is to ensure that expenditure actually increases above the baseline, and that it is reaches the bulk of low-income households. In addition, as noted above, experience internationally indicates that in the long run, improving income distribution requires a strongly overall progressive incidence for taxation (although each individual tax instrument need not be progressive), irrespective of the progressivity of government expenditure.
9
2 Introduction
2.1 Background The Value-Added Tax (VAT) rate was increased from 14% to 15% on 01 April 2018, as announced in the February 2018 National Annual Budget. The increase is expected to raise additional revenue of R22.9 billion in 2018/19. It formed part of a package of other tax increases aimed at raising the R36 billion required to provide sustainable funding for government programmes during 2018/19. Other components include below-inflation adjustments to personal income tax brackets (particularly for higher-income individuals), increases in excise duties, and a higher rate of estate duty imposed on wealthy individuals. In addition, personal income tax rates, particularly for higher earners, were increased in the 2017/18 Budget, and the VAT increase should be considered as part of a series of tax changes being enacted over a number of years.
The current VAT system allows for 19 basic food items to be taxed at a rate of zero per cent in terms of section 11(1)(j) of the VAT Act, 1991. The zero rating of food items was introduced as a means of providing some relief to low-income households which spend a relatively high proportion of their income on the zero-rated items.
Since the increase in the VAT rate was announced, concerns have been raised, in Parliamentary and other processes, about its impact on poor and low-income households. Following the report of the Standing Committee on Finance and the Select Committee on Finance (compiled after public hearings) and the statement of Cabinet of 28 February 2018, the Minister of Finance, through the Davis Tax Committee, appointed a panel of independent experts to consider and review the list of zero rated food items. The Terms of Reference were subsequently revised to broaden the scope to include non-food items.
2.2 Terms of Reference The Panel’s terms of reference are as follows.
2.2.1 Evaluation of the current zero rated food items:
• Evaluate whether the current list of 19 zero rated food items achieves the objective for which it was implemented, including examining the consumption patterns of low income households as opposed to higher income households and the benefits derived from the zero rating by these households respectively;
• Consider whether the policy objective underlying zero rating may be better achieved through disaggregation of those items (which are currently expressed as broad categories) to more specific targeting of products.

10
2.2.2 Consideration of inclusion of additional zero rated food items1:
• Identify any food items other than the current zero rated food items that may be considered for inclusion for zero rating that will achieve the policy intention of providing relief to poor and low-income households taking into account:
o The absolute and proportional benefit likely to accrue to low-income households,
o Market structure, to determine likelihood of producers passing benefit on to customers,
o Ease of administration,
o Potential for abuse,
o Estimated revenue loss.
2.2.3 Consideration of other mitigatory measures:
• To explore whether the outcome of zero rating of food items cannot be better achieved by a government expenditure programme; whether a government expenditure programme is more efficient in targeting poor and lower income households than the zero rating of food items; and whether specific current government programmes as determined by or agreed with National Treasury, can be better tailored to achieve the same or a better outcome than the zero rating of food items.
2.3 Composition of the Panel
• Professor Ingrid Woolard (Chair) • Ayabonga Cawe • Professor Ada Jansen • Dr Thabi Leoka • Dr Neva Makgetla • Lynn Moeng-Mahlangu • Cecil Morden • Prenesh Ramphal • Professor Imraan Valodia
The Panel would like to thank Mashekwa Maboshe and David Francis for their research assistance in compiling this report.
1 As noted above, non-food items were subsequently included in the Terms of Reference.

11
2.4 Consultations The Panel was initially required to deliver a report with recommendations to the Minister of Finance and the Davis Tax Committee (DTC) by 30 June 2018. This date was extended to provide the panel an opportunity for greater deliberations and consultations, and to account for changes in scope.
The Panel requested inputs from the public and the NEDLAC constituencies both in written form and through meetings. This section outlines who spoke and wrote to the Panel and what suggestions, inputs and contributions they made to the process. The Panel received over 2 000 submissions and held meetings with various groups. The full list of all submissions received is available as Appendix 12.
The Panel received submissions from individuals (like Kathy Bouwer who submitted an email on her Android device suggesting that flour, basic stationery and sugar should be zero rated). Kumbula Nogantshi from King William’s Town suggested that tinned fish products be zero rated to mitigate the impact of the VAT increase on lower income households. Many of the individual submissions included merit goods like school uniforms and books and necessities like sanitary products. The latter was undoubtedly the most suggested addition to the list of items already zero rated. Ramola Naidoo suggested some segments of small business such as professional services and those engaged in public benefit initiatives and the services they provide be exempt from value added tax.
The Panel also received submissions from the private sector. Pieter Joubert from Tzaneen, a farmer and mango atchar manufacturer suggested that the Panel recommend that atchar be zero rated. His suggestion was also supported by a submission from the South African Subtropical Growers’ Association. Tiger Brands proposed that oats and sorghum be zero rated. The Panel also received submissions from industry bodies and producer associations. The Sorghum Forum proposed the zero rating of sorghum and sorghum products. The South African Poultry Producers Association’s submission suggested the inclusion of bone-in-chicken in the list of zero rated items. The commercial farmers’ association AgriSA suggested that all forms of meat (including pork and red meat), all forms of bread (brown and white) and flour be included in the list of zero rated items. Government entities also made their submissions. The Department of Finance in the North West Provincial Government recommended the inclusion of cereal products, meat products, milk, eggs, water and electricity and liquid fuels.
The Panel was also able to receive a wide range of submissions from civil society bodies, including change.org, which suggested the removal of VAT on sanitary products. We had an in-person engagement with the Budget Justice Coalition (a coalition including Section27, the Alternative Information and Development Centre, Amandla.mobi, the Studies in Poverty and Inequality Institute, Pietermaritzburg Agency for Community Social Action, the Institute for Economic Justice and the Teddy Bear Clinic).
2 This list does not include the 1 397 submissions from Amandla.Mobi. However, the products detailed in these submissions were included in the Panel’s analysis.

12
The Panel also received presentations from the social partners at NEDLAC. These discussions brought together the submissions of organized business and labour, community and government constituencies. The Panel considered every submission, whether presented in meetings or in writing. The Panel evaluated the various proposals against a common set of criteria, as described in section 5.3 below. For products that enjoyed the greatest support, we undertook a more in-depth analysis, as described in section 6.
3 A guide to evaluating tax policy
3.1 Assessing tax policy proposals The evaluation of VAT in this report requires a broader understanding of tax policies in general, in order to understand how VAT fits into the tax mix. As Grown (2014) argues, VAT is a central aspect of the revenue systems in over 125 countries, and its widespread use raises important questions of equity in particular, along with efficiency and ease of administration. Indeed, VAT raises the challenge of how to generate adequate public funding in a way that does not place an unfair and undue burden on the poor and marginalised3.
Later in this report we present our detailed methodology for identifying and evaluating particular goods which, if zero rated, would improve the equity of VAT in South Africa. However, before we do this, it is important to give a brief exposition of the conceptual and theoretical approach to evaluating tax proposals more broadly. When considering tax policy proposals, there are three main areas of concern, known as the “Three Es” of tax policy: equity, efficiency and ease of administration. We discuss each of these very briefly here.
3.1.1 Equity
When examining the equity of a tax, there are two main issues that we must consider: vertical and horizontal equity. The focus of equity discussions, such as the debate about whether VAT is progressive or regressive, is generally on vertical equity. A tax that is vertically equitable is one where the rich pay a greater share of their income in tax. However, there is an additional equity consideration that must be addressed when examining tax proposals: horizontal equity. Horizontal equity is concerned with the fact that households which look the same, or very similar, in financial terms (i.e. they are in the same income decile) might in fact be very different for a number of reasons. Broadly, these are: the gender composition of the household; the number of dependents; the number of employed people in the household; and other differences such as location. As Grown (2014) notes, indirect taxes such as VAT are often horizontally equitable, but vertically inequitable. They are horizontally equitable because equally wealthy (or poor) people tend to
3 Grown, C. 2014. “Taxation and gender equality: a conceptual framework”, in Grown and Valodia (eds), Taxation and Gender Equity. Routledge, London and New York.

13
consume equal amounts of goods and services and thus pay the same indirect taxes. They are vertically inequitable, however, because the poor generally spend a larger proportion of their income than do the rich, so they pay relatively more tax as a share of their income.4
While it is important, then, to take horizontal equity considerations into account, our focus is understanding how to evaluate the vertical equity considerations of VAT. One of the central considerations when evaluating taxes is to examine the distributional effects of each instrument. That is, to ascertain whether the incidence of the tax falls, proportionally, more on the rich, the poor or whether it is evenly spread across the income distribution. In this regard, there are two important aspects to consider: both how much of the tax burden (in absolute terms), falls on each income group and how much tax each income group pays relative to their ability to pay (their income). A tax is progressive if the relative tax burden increases as income increase, and thus falls mainly on the rich; regressive if the relative tax burden declines as income increases, and thus falls mainly on the poor; and neutral if the burden is spread equally across all income groups. There is a further and very important caveat to this analysis – while we need to know, for each tax instrument, whether it is progressive, regressive or neutral, what is ultimately important is that the tax system as a whole is progressive, even if some of its constituent parts are not.
In the simplest terms, how do we calculate if a tax is progressive, regressive or neutral? To do this, we need to calculate the share of tax that each income group pays relative to its income (this is the tax incidence). By way of illustration, let us compare two citizens, A and B. A, a low-income South African earns R30,000 per annum and spends all her income because she finds it difficult to save. B, a high-income South African, earns R3 million per annum and, being wealthy, spends 50% of her income, saving and investing the rest.
For simplicity, we assume that all of A’s and B’s expenditure is on goods that attract VAT. At 15% VAT, A pays R4,500 in VAT (15% of her income) while B pays R225, 000 in VAT (7.5% of income). In this scenario, VAT is said to be regressive because, although A contributes significantly more to the VAT pool, relative to their incomes, A is paying more than B. A is paying 15c in each Rand earned while B is paying only 7.5 cents in each Rand earned. In theory, and in this simple scenario, VAT is regressive because it is a tax on consumption and, compared to the rich, the poor consume a larger proportion of their income. Without any zero rating or exemptions, VAT is regressive if considered in isolation and without taking the life-cycle approach (for example, savings today will be spent later in life – consumption smoothing) for the reasons outlined above. However, in reality the impact of VAT is determined by how it is implemented and what goods are Vatable and which not. In South Africa, we have zero rating of a wide range of basic food items and petroleum products (paraffin, petrol and diesel) which means that VAT becomes less regressive and could even be more or less proportional.
4 Ibid. p.14.
14
3.1.2 Ease of Administration, and Efficiency
From an ease of administration perspective, VAT is a transparent tax – consumers can work out how much VAT they are paying on any item. From an administrative efficiency perspective, there are two considerations – how much money does the state collect for a small change in the rate of tax, and how much of what the state should collect does it actually collect (i.e. how easy is it to evade the tax). VAT has great advantages in this regard. The gap between what should be collected and what is actually collected is very small indeed – it is much smaller in South Africa than in comparable countries. For these reasons, VAT is an extremely attractive option when it is important to quickly and cost-effectively raise revenue. VAT does, however, raise important equity considerations, which are outlined briefly above and discussed extensively in this report. Finally, some economists argue that taxes should minimise the effects on economic decision-making, and from that standpoint, VAT is desirable because it affects almost all products equally.
15
4 Process and Methodology The Panel aimed to balance the need to mitigate the impact of the VAT increase on the poor against the need to maintain government revenue, and by extension, its service provision. This section first reviews the trends in VAT revenue. It then describes the principles that guided the Panel’s analysis of the effects and desirability of zero rating specific products. Those principles in turn inform both its evaluation of inputs from the public and its economic analysis.
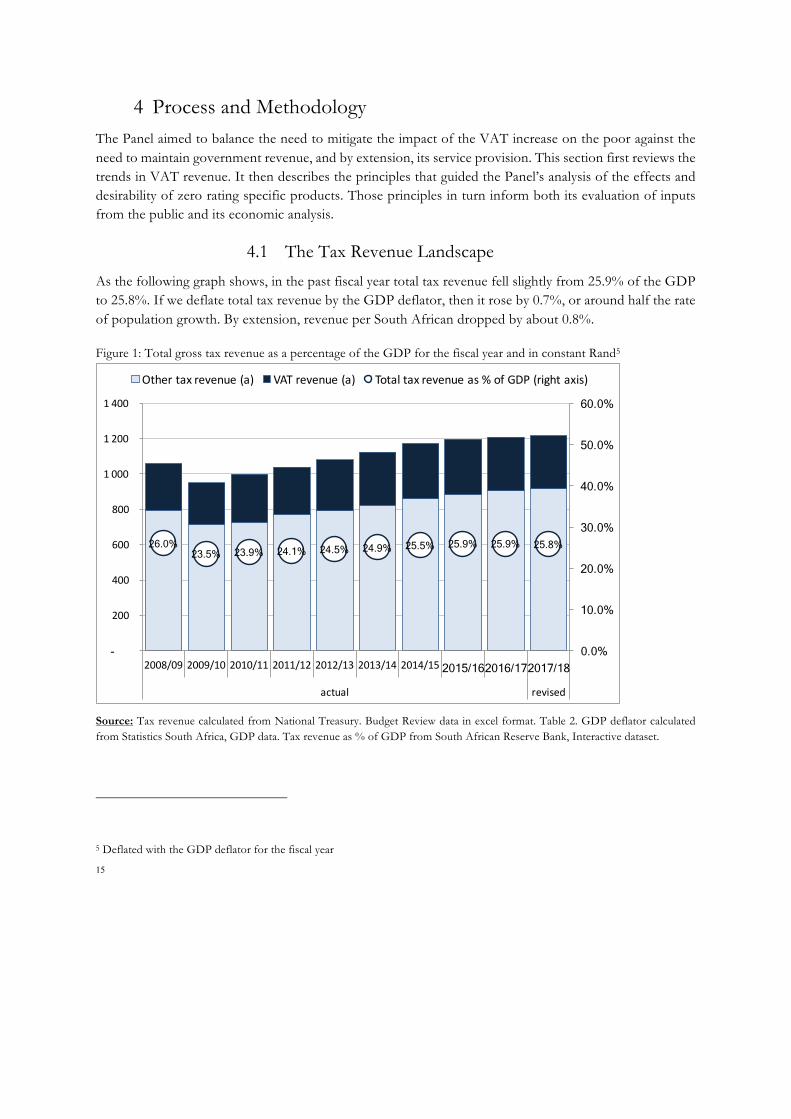
4.1 The Tax Revenue Landscape As the following graph shows, in the past fiscal year total tax revenue fell slightly from 25.9% of the GDP to 25.8%. If we deflate total tax revenue by the GDP deflator, then it rose by 0.7%, or around half the rate of population growth. By extension, revenue per South African dropped by about 0.8%.
Figure 1: Total gross tax revenue as a percentage of the GDP for the fiscal year and in constant Rand5
Source: Tax revenue calculated from National Treasury. Budget Review data in excel format. Table 2. GDP deflator calculated from Statistics South Africa, GDP data. Tax revenue as % of GDP from South African Reserve Bank, Interactive dataset.
5 Deflated with the GDP deflator for the fiscal year
26.0% 23.5% 23.9% 24.1% 24.5% 24.9% 25.5% 25.9% 25.9% 25.8%
0.0%
10.0%
20.0%
30.0%
40.0%
50.0%
60.0%
-
200
400
600
800
1 000
1 200
1 400
2008/09 2009/10 2010/11 2011/12 2012/13 2013/14 2014/15 2015/16 2016/17 2017/18 actual revised
Othertaxrevenue(a) VATrevenue(a) Totaltaxrevenueas%ofGDP(rightaxis)
16
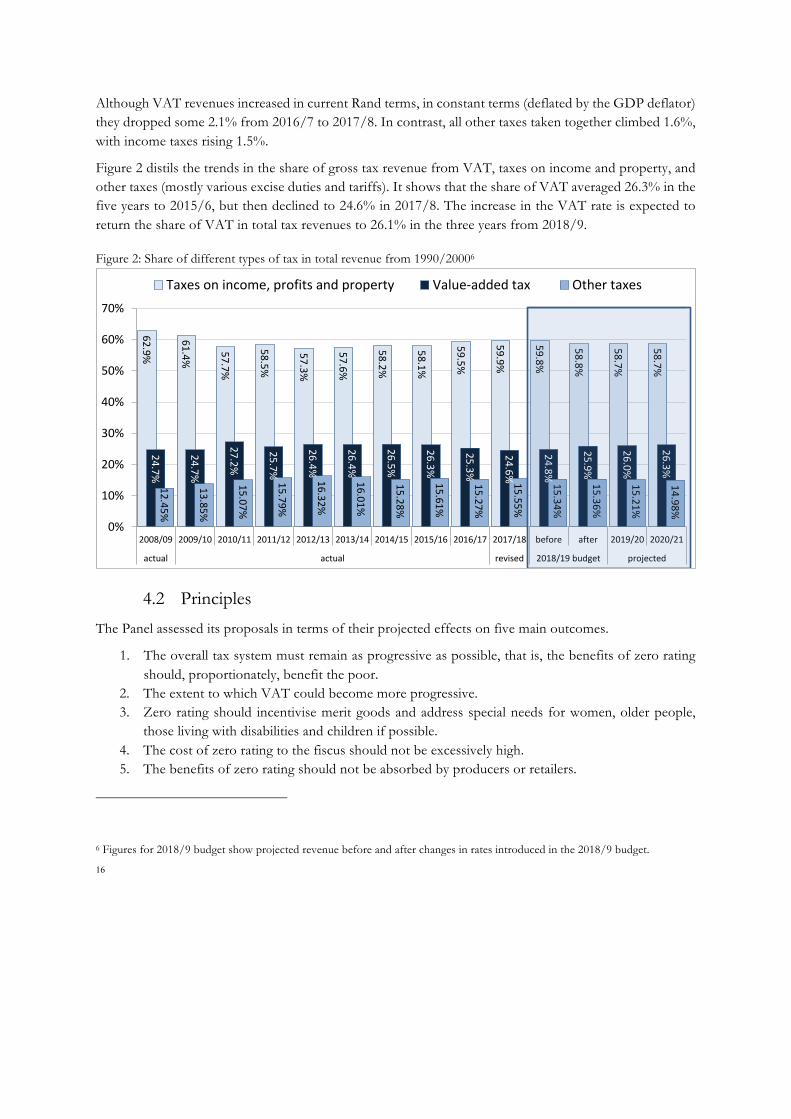
Although VAT revenues increased in current Rand terms, in constant terms (deflated by the GDP deflator) they dropped some 2.1% from 2016/7 to 2017/8. In contrast, all other taxes taken together climbed 1.6%, with income taxes rising 1.5%.
Figure 2 distils the trends in the share of gross tax revenue from VAT, taxes on income and property, and other taxes (mostly various excise duties and tariffs). It shows that the share of VAT averaged 26.3% in the five years to 2015/6, but then declined to 24.6% in 2017/8. The increase in the VAT rate is expected to return the share of VAT in total tax revenues to 26.1% in the three years from 2018/9.
Figure 2: Share of different types of tax in total revenue from 1990/20006
4.2 Principles The Panel assessed its proposals in terms of their projected effects on five main outcomes.
1. The overall tax system must remain as progressive as possible, that is, the benefits of zero rating should, proportionately, benefit the poor.
2. The extent to which VAT could become more progressive. 3. Zero rating should incentivise merit goods and address special needs for women, older people,
those living with disabilities and children if possible. 4. The cost of zero rating to the fiscus should not be excessively high. 5. The benefits of zero rating should not be absorbed by producers or retailers.
6 Figures for 2018/9 budget show projected revenue before and after changes in rates introduced in the 2018/9 budget.
62.9%
61.4%
57.7%
58.5%
57.3%
57.6%
58.2%
58.1%
59.5%
59.9%
59.8%
58.8%
58.7%
58.7%
24.7%
24.7%
27.2%
25.7%
26.4%
26.4%
26.5%
26.3%
25.3%
24.6%
24.8%
25.9%
26.0%
26.3%
12.45%
13.85%
15.07%
15.79%
16.32%
16.01%
15.28%
15.61%
15.27%
15.55%
15.34%
15.36%
15.21%
14.98%
0%
10%
20%
30%
40%
50%
60%
70%
2008/09 2009/10 2010/11 2011/12 2012/13 2013/14 2014/15 2015/16 2016/17 2017/18 before after 2019/20 2020/21
actual actual revised 2018/19budget projected
Taxesonincome,profitsandproperty Value-addedtax Othertaxes

17
4.2.1 The overall tax system must remain as progressive as possible
South Africa remains amongst the most unequal countries in the world. According to Statistics South Africa's Living Conditions Survey, the richest 10% of households accounted for over 40% of all household spending in 2014/5 and the next decile, for almost 20%. The poorest 30% accounted for less than 10% of total household purchases. Due to under-counting in the Living Conditions Survey, as discussed in this report, the expenditure figures in this figure are somewhat understated, mostly for spending on food.
Figure 3: Average household income and expenditure by decile, 2014/5
Source: Statistics South Africa. Living Conditions Survey 2014/5. Electronic database.
International experience shows that inequality at the very profound levels found in South Africa fuels social and political divisions and conflict. That in turn slows down growth and reduces prosperity for all citizens. As a result, the government has a role in ensuring greater equity both
• in the short run, through tax policies and spending on services that favour low-income households, and;
• in the longer run, by promoting a more equitable economy in terms of both greater economic opportunities and more equality in remuneration, asset ownership and education.
The standard measure of redistribution through the state is the extent to which taxation and expenditure are progressive. A tax is defined as progressive when richer people pay a higher share of their income than poor people, as is the case with personal income tax.
Currently, even with zero rating, according to the latest Living Conditions Survey the increase in the VAT across the entire population is not regressive; it is more or less proportional. However, relative to the rich,
35600 42400 50400 56000 6730080900
104600
159800
267700
516800
18500 28000 34300 40600 47300 57500 73600 108500 191700 432600-
50000
100000
150000
200000
250000
300000
350000
400000
450000
500000
550000
poorest 2 3 4 5 6 7 8 9 richest
rand
spe
ryear
averageincome averageexpenditure
18
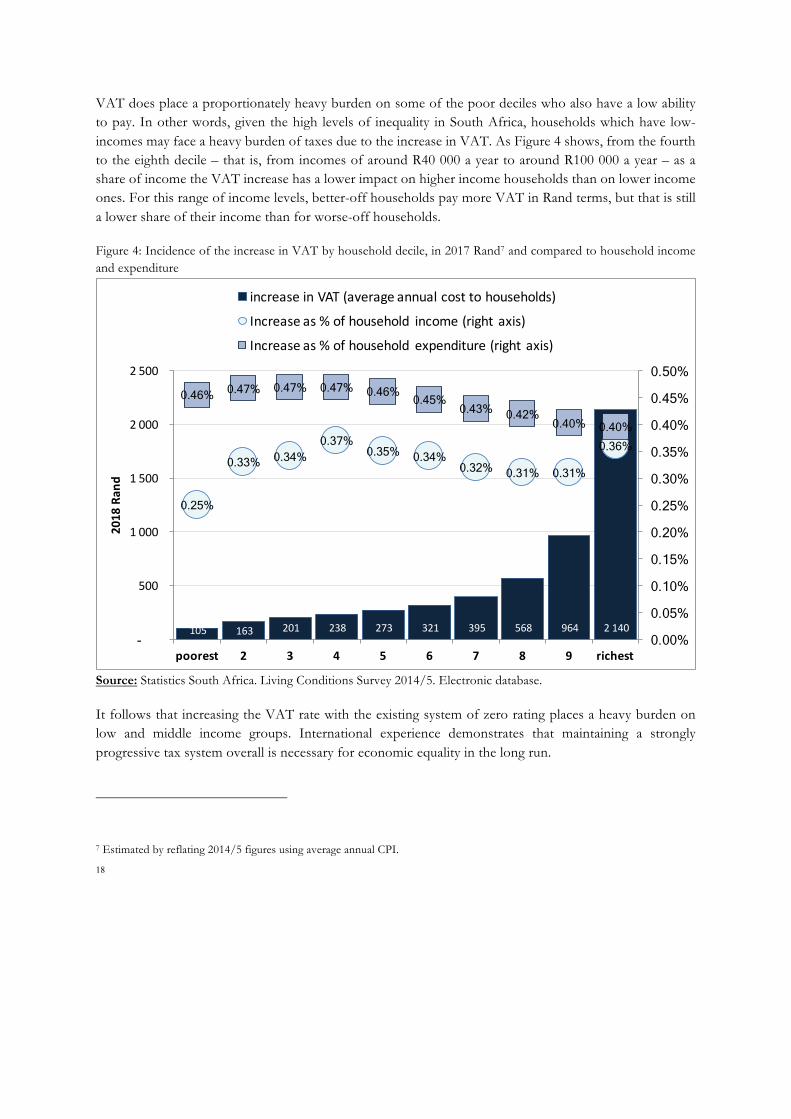
VAT does place a proportionately heavy burden on some of the poor deciles who also have a low ability to pay. In other words, given the high levels of inequality in South Africa, households which have low-incomes may face a heavy burden of taxes due to the increase in VAT. As Figure 4 shows, from the fourth to the eighth decile – that is, from incomes of around R40 000 a year to around R100 000 a year – as a share of income the VAT increase has a lower impact on higher income households than on lower income ones. For this range of income levels, better-off households pay more VAT in Rand terms, but that is still a lower share of their income than for worse-off households.
Figure 4: Incidence of the increase in VAT by household decile, in 2017 Rand7 and compared to household income and expenditure
Source: Statistics South Africa. Living Conditions Survey 2014/5. Electronic database.
It follows that increasing the VAT rate with the existing system of zero rating places a heavy burden on low and middle income groups. International experience demonstrates that maintaining a strongly progressive tax system overall is necessary for economic equality in the long run.
7 Estimated by reflating 2014/5 figures using average annual CPI.
105 163 201 238 273 321 395 568 964 2 140
0.25%
0.33% 0.34% 0.37%
0.35% 0.34% 0.32% 0.31% 0.31%
0.36%
0.46% 0.47% 0.47% 0.47% 0.46% 0.45% 0.43% 0.42% 0.40% 0.40%
0.00% 0.05% 0.10% 0.15% 0.20% 0.25% 0.30% 0.35% 0.40% 0.45% 0.50%
-
500
1 000
1 500
2 000
2 500
poorest 2 3 4 5 6 7 8 9 richest
2018Ran
d
increaseinVAT(averageannualcosttohouseholds)Increaseas%ofhousehold income(rightaxis)Increaseas%ofhousehold expenditure(rightaxis)

19
In 2017, Statistics South Africa set the food poverty line at R531 per person per month. Around one in four households lived on incomes that were at or below the food poverty line, according to the 2017 General Household Survey. One in three South Africans lived below the lower-bound poverty line of R758, which allows for limited non-food expenditure. In these circumstances, it is not desirable to broaden the tax base by making low-income households pay more tax. Rather, the tax base should be broadened by promoting more inclusive growth so that more households can afford to contribute to the fiscus.
4.2.2 Progressivity of VAT
Zero rating could potentially make the incidence of VAT more progressive – that is, as defined above, low-income households should pay a smaller share of their income in tax than rich ones. That means that goods should be zero rated if poor households spend a larger share of their income on them than rich ones do. South Africa's unusually deep income inequalities mean that the majority of households can be considered low income. The Panel agreed that zero rating should be measured in terms of the benefits to the poorest 70% of households (deciles one to seven). In functional terms, that means essentially combining
• households with no employed people, most of whom depend on remittances and social grants; • informal-sector workers; and • the working poor in the formal sector, such as farm and domestic workers.
In the event, as Figure 5 shows, the current list of zero-rated goods already targets the main products with the most progressive impact – that is, where poor households spend a significantly larger share of their income than rich ones, as the following graph shows. There are relatively few products remaining that would improve the progressivity of the VAT.
Figure 5: Share of expenditure on zero-rated and other goods by decile, 2014/5
Source: Statistics South Africa. Living Conditions Survey 2014/5. Electronic database.
0%
10%
20%
30%
40%
50%
60%
70%
80%
90%
100%
poorest
2 3 4 5 6 7 8 9 richest
%ofe
xpen
diture totalzerorated
other

20
4.2.3 Administrative efficiency and simplicity
One of the biggest practical problems of allowing a zero VAT rate for goods or services is related to the definition. Unless the scope of the zero rate has been well-considered, and a definition is crafted which clearly lays down the ambit of the zero rate in the legislation, the important policy goals of administrative efficiency and simplicity will not be achieved for both the supplier and SARS, if not also for the consumer/buyer of those goods or services. In addition, a long list of zero-rated items may add to the compliance costs for vendors due to the additional administrative and accounting requirements.
Ambiguous wording can result in numerous queries as to the proper treatment of items lying on the borderline between distinct categories, open the door for disputes or even lend itself to abuse and VAT fraud where items are deliberately misclassified. This will ultimately result in onerous requirements which must be met to substantiate the zero rating, increasing the administrative and compliance burden on the vendor, as well as the auditing and controls costs of SARS which must ensure that only qualifying goods or services are zero rated. Furthermore, the scope of zero rating should not incentivise undesirable or unjustified changes in consumer or producer preferences.
4.2.4 Merit goods
On the whole, goods should only be considered for zero rating if increased consumption would benefit, or at least not harm, economic and social development. This principle can be understood through the economic concept of external costs and benefits. Consumption of these goods generates costs and benefits to society that are not captured by the consumers themselves. For instance, higher consumption of cigarettes or sugar imposes health costs that society as a whole ends up paying. In contrast, more consumption of, say, food, education and primary healthcare benefits society by improving individuals’ well-being and productivity, reducing demands on government services over time. Many merit goods are consumed primarily by the high-income group. In these circumstances, zero rating would have a regressive impact. For instance, the richest 10% of households spends over half a percent of their income on books, compared to less than a 20th of a percent for the poorest 70%. In this kind of case, zero rating would not be the best way to incentivise higher consumption. Instead, more targeted measures should be considered to promote increased use by low-income households. In addition, some vulnerable or disadvantaged groups have specific needs that consume a disproportionate share of their incomes. These groups include women, particularly for their reproductive health, the elderly, children, and people living with disabilities. The Panel agreed to pay particular attention to these goods.
4.2.5 Cost of zero rating
Zero rating goods imposes two kinds of cost on the state:
• It reduces tax revenue from the high-income group in particular, and • It can impose an administrative burden

21
In Rand terms, the rich almost always benefit more from zero rating than the poor, because they account for a much larger share of total spending. Even when the poor spend a larger share of their income on a good, zero rating it usually means high-income households get more tax relief in money terms. For currently zero-rated goods, households in the poorest 10% spent around R830 million in 2014, while households in the richest 10% spent R1.3 billion. For goods that were not zero rated, the poorest decile spent R3 billion, while the richest spent R87 billion.
South Africa today has a relatively high fiscal deficit, so cutting revenues excessively may end up constraining government services. The budget is still recovering from the aftermath of the global financial crisis in 2008/9, as Figure 6 shows. As a result, the deficit in 2018 was 4.5%, which is large by historical and international standards. Zero rating products to benefit the poor must be balanced against the need to avoid large reductions in tax revenue which could compromise government expenditures aimed at the very poor.
Figure 6: National budget deficit as percentage of the GDP, 1990 to 2018
Source: Reserve Bank, interactive dataset. Downloaded in July 2018.
In addition, zero rating a long list of relatively minor products can increase the possibility of abuse and thereby a reduction in tax revenue. Abusive practices commonly entail suppliers deliberately misclassifying their sales to be zero rated when they should be standard rated, or collecting the VAT from their customers and not paying it over by misrepresenting these sales to SARS. Generating undue refunds as a result of misclassifying sales as zero rated is also a common abusive and non-compliant practice. SARS is constantly under pressure to analyse VAT refunds where zero-rated products are supplied. A typical case of substantial VAT revenue loss that was unearthed by SARS relates to the agricultural sector where some suppliers (some farmers) deliberately misrepresented the sale of a standard rated product as zero rated thus generating substantial VAT refunds.
-8%
-7%
-6%
-5%
-4%
-3%
-2%
-1%
0%
1%
2%
19901991199219931994199519961997199819992000200120022003200420052006200720082009201020112012201320142015201620172018

22
4.2.6 Ensuring zero rating benefits consumers
Consumers only benefit from zero rating if sellers in fact reduce prices by the amount of the VAT saved. The extent to which zero rating has in fact benefited consumers remains unclear. We can understand this problem by comparing the consumer price of brown and white bread. Brown bread is zero rated; white bread is not. Since these are very similar products, in principle, this means the consumer price for brown bread should have been 12.3% lower than for white bread. In fact, as the following graph shows, the differential varied substantially over the past 17 years. The average price for a 700-gram brown bread loaf was only 11% lower than white bread over the past decade, and the differential tended to decline from 2012 to 2017. In contrast, the price of a 600-gram loaf was 15% lower, or slightly more than the VAT relief.
Figure 7: The average difference in price between white and brown bread (600g and 700g loaves), 2000 to January 2017
Source: Statistics South Africa data, downloaded from www.sagis.org.za in July 2018.
With the limited time at the disposal of the Panel, the Panel was unable to give more targeted consideration to some of the market structure issues that explain VAT relief pass-through, or lack thereof, and account, as one example, for the differences in prices between white and brown bread. It is very important to note that South Africa is characterised by highly concentrated product and retail markets, which means producers and retailers may not face competitive pressure to pass on the benefits of zero rating. In more competitive markets, sellers would compete down the price to attract customers; in the concentrated markets, in contrast, they do not face pressure to avoid being undercut. The Panel is therefore very concerned about the possibility of any savings from additional zero rating being captured by producers and retailers instead of being passed onto the consumer. In future, government should establish mechanisms to ensure that retailers pass the full value of the VAT relief through to consumers. Mechanisms to achieve this aim could include, for instance, investigations by the Competition Commission and publication by Statistics South Africa of reference prices for zero-rated goods as part of the Consumer Price Index (CPI) data.
0%2%4%6%8%
10%12%14%16%18%20%22%24%
2000
2001
2002
2003
2004
2005
2006
2007
2008
2009
2010
2011
2012
2013
2014
2015
2016
2017
2018
600gr
700gr
23
5 Data analysis
5.1 Aims The Panel analysed the impact of VAT zero rating on:
• Goods that are already zero rated, and • Items included in submissions from the public.
For the analysis, it first undertook an assessment of household consumption of the relevant goods by income level using the Living Conditions Survey (LCS) of 2014/5, the most recent large-scale study of consumer spending. This section outlines the methodology utilised for that purpose. That methodology was applied to currently zero-rated goods and to submissions from the public.
The data analysis pointed to eight items from public submissions that were both significant costs to low-income households, reasonably progressive in terms of expenditure, and merit goods. In section 0, these items are analysed in greater detail, using more information about total consumption and socio-economic implications as well as the structure of consumption by income level.
5.2 Methodology
5.2.1 The Living Conditions Survey 2014/5
The LCS provides detailed information on household expenditure on individual items by overall expenditure and income level. It is a household expenditure survey conducted by Statistics South Africa with the primary purpose of providing information on expenditure patterns to update the consumer price index (CPI) basket of goods and services (Statistics South Africa, 2017(a)).
The survey uses three data collection instruments: • a household questionnaire that includes questions on the structure and composition of the
household, and then mainly questions that are expenditure-related; • weekly diaries: households received two weekly diaries to track expenditures of households • a summary questionnaire to assist survey officers in coding expenditure items according
to the Classification of Individual Consumption According to Purpose (COICOP), and to summarise weekly household consumption expenditure (Statistics South Africa, 20178).
8 Statistics South Africa. 2017. Living Conditions of Households in South Africa. An analysis of household expenditure and income data using the LCS 2014/2015. Statistical Release: P0310. Statistics South Africa. Available: http://www.statssa.gov.za.

24
The LCS is nationally representative, with 27 527 households participating in the 2014/5 survey (Statistics South Africa, 20179). The expenditure items are classified according to 13 major group expenditure items, but the survey also provides information on 780 individual budget items.
It is important to note that the LCS undercounts expenditure in certain categories of goods and services, which may lead to an underestimation of the effects of zero rating for these products. Reasons for the undercount include the following.10
• Frequent purchases: Despite the various techniques used to capture expenditure, experience in many countries shows that survey respondents fail to record their full spending on items such as groceries and food and drink away from home that are purchased often, usually by several household members.
• Stigmatized purchases: Households often under report products that they find in some way embarrassing. This affects alcoholic beverages, tobacco and gambling, but could also influence reporting on sanitary pads (see section 6.6 below).
• Methodological differences: In certain cases, the concepts underlying the economic scope of expenditure for the CPI are not easily applied in a survey. For example, a net payments approach is applied to insurance and gambling. Here the money received back (in refunds or winnings) is deducted from the total expenditure to avoid double counting. Different estimates for owner occupied housing in the LCS and CPI are a result of different methods used to estimate this category.
• Survey response: The LCS shows poor response rates in affluent areas in general, and in Gauteng in particular. In 2014/5, expenses incurred mainly by higher-income households (such as vehicles and tertiary education) reported lower levels of expenditure than the previous survey, a finding that was not borne out in other data sources.
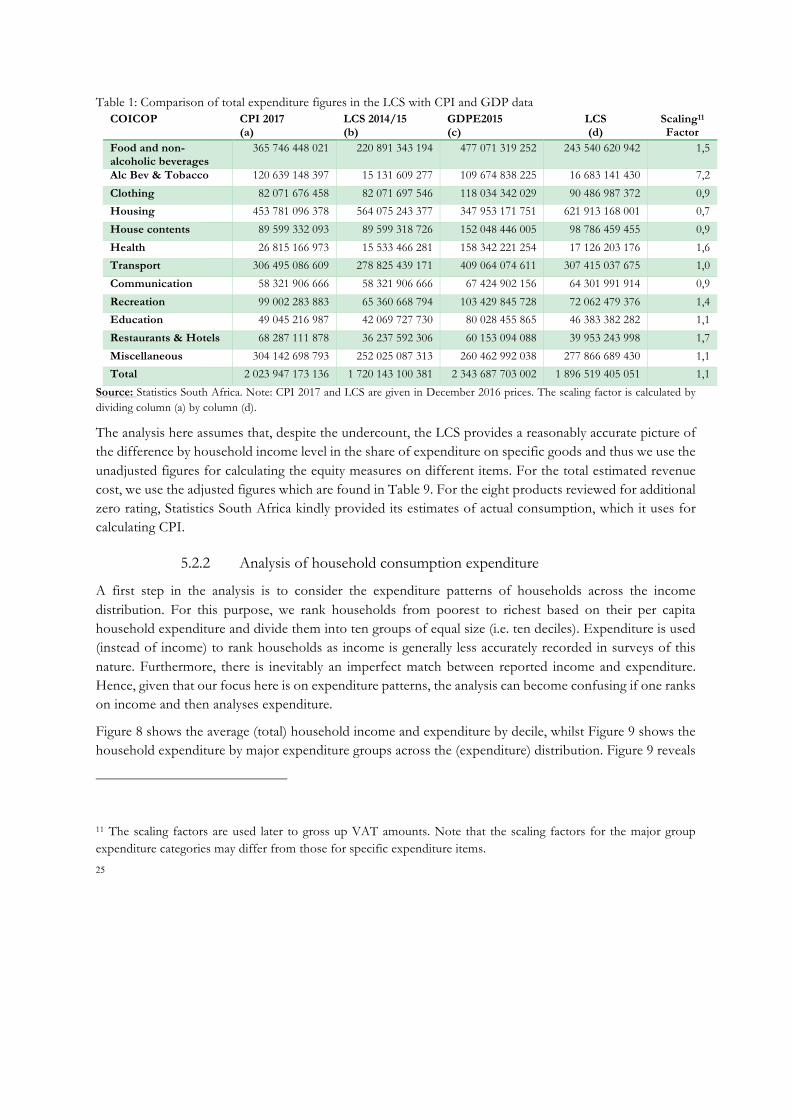
Table 1 compares the LCS data with other sources, including the Consumer Price Index for 2015 (which Statistics South Africa adjusts using additional data sources, for instance reports on production and sales) and the GDP data. It shows that the LCS data are considered reliable for most categories except food, alcoholic beverages and tobacco. Food is the only significant category for the analysis here.
9 Statistics South Africa. 2017b. Living Conditions Survey 2014/2015. Metadata. Report No. P0310, Statistics South Africa. Available: http://www.statssa.gov.za.
10 Source: http://www.statssa.gov.za/cpi/documents/Introduction_of_2016_CPI_weights_and_basket.pdf
25
Table 1: Comparison of total expenditure figures in the LCS with CPI and GDP data COICOP CPI 2017
(a) LCS 2014/15 (b)
GDPE2015 (c)
LCS (d)
Scaling11 Factor
Food and non-alcoholic beverages
365 746 448 021 220 891 343 194 477 071 319 252 243 540 620 942 1,5
Alc Bev & Tobacco 120 639 148 397 15 131 609 277 109 674 838 225 16 683 141 430 7,2 Clothing 82 071 676 458 82 071 697 546 118 034 342 029 90 486 987 372 0,9 Housing 453 781 096 378 564 075 243 377 347 953 171 751 621 913 168 001 0,7 House contents 89 599 332 093 89 599 318 726 152 048 446 005 98 786 459 455 0,9 Health 26 815 166 973 15 533 466 281 158 342 221 254 17 126 203 176 1,6 Transport 306 495 086 609 278 825 439 171 409 064 074 611 307 415 037 675 1,0 Communication 58 321 906 666 58 321 906 666 67 424 902 156 64 301 991 914 0,9 Recreation 99 002 283 883 65 360 668 794 103 429 845 728 72 062 479 376 1,4 Education 49 045 216 987 42 069 727 730 80 028 455 865 46 383 382 282 1,1 Restaurants & Hotels 68 287 111 878 36 237 592 306 60 153 094 088 39 953 243 998 1,7 Miscellaneous 304 142 698 793 252 025 087 313 260 462 992 038 277 866 689 430 1,1 Total 2 023 947 173 136 1 720 143 100 381 2 343 687 703 002 1 896 519 405 051 1,1
Source: Statistics South Africa. Note: CPI 2017 and LCS are given in December 2016 prices. The scaling factor is calculated by dividing column (a) by column (d).
The analysis here assumes that, despite the undercount, the LCS provides a reasonably accurate picture of the difference by household income level in the share of expenditure on specific goods and thus we use the unadjusted figures for calculating the equity measures on different items. For the total estimated revenue cost, we use the adjusted figures which are found in Table 9. For the eight products reviewed for additional zero rating, Statistics South Africa kindly provided its estimates of actual consumption, which it uses for calculating CPI.
5.2.2 Analysis of household consumption expenditure
A first step in the analysis is to consider the expenditure patterns of households across the income distribution. For this purpose, we rank households from poorest to richest based on their per capita household expenditure and divide them into ten groups of equal size (i.e. ten deciles). Expenditure is used (instead of income) to rank households as income is generally less accurately recorded in surveys of this nature. Furthermore, there is inevitably an imperfect match between reported income and expenditure. Hence, given that our focus here is on expenditure patterns, the analysis can become confusing if one ranks on income and then analyses expenditure.
Figure 8 shows the average (total) household income and expenditure by decile, whilst Figure 9 shows the household expenditure by major expenditure groups across the (expenditure) distribution. Figure 9 reveals
11 The scaling factors are used later to gross up VAT amounts. Note that the scaling factors for the major group expenditure categories may differ from those for specific expenditure items.

26
that proportional expenditure increases across the deciles for three of the categories shown (transport; housing, water, electricity, gas and other fuels; education) – meaning that the higher expenditure deciles spends a large share on these items, whilst the poor spends a greater proportion on food and non-alcoholic beverages and to a lesser extent of clothing and footwear.
Figure 8: Average annual household income and average household consumption expenditure by decile, April 2018 prices
Source: Calculated from Statistics South Africa, Living Conditions Survey. Interactive database. Analysis of LCS data kindly supplied by Ada Jansen of Stellenbosch University.
0 100 000 200 000 300 000 400 000 500 000 600 000 700 000
poorest
2
3
4
5
6
7
8
9
richest
Rands per year
Hou
seho
ld d
ecile
(per
cap
ita e
xpen
diur
e)
Average hh income
Average hh consumption expenditure

27
Figure 9: Household spending on major expenditure group items as percentage of total expenditure, by decile
Source: Calculated from Statistics South Africa, Living Conditions Survey. Interactive database. Analysis of LCS data kindly supplied by Ada Jansen of Stellenbosch University.
5.2.3 Criteria used in the data analysis
The initial data analysis draws on the following criteria, which reflect the principles outlined in section 4.2.
5.2.3.1 Proportional expenditure An important consideration is whether the poor disproportionately consume specific expenditure items. Hence, we calculate the proportional household expenditure on individual expenditure items captured in the LCS12. We also set a floor to ensure that only products which account for a significant share of expenditure are included, requiring that an item should constitute at least 0.2% of total household spending.
We calculate an equity-gain ratio by dividing the proportional expenditure of the poor by the proportional expenditure of the non-poor. This ratio provides a measure of disproportionate consumption by the poor. In our calculation of the equity gain ratio, we compare households in deciles 1 to 4 to households in deciles 9 and 10. For example, if the equity gain ratio exceeds five, then the proportional spending of households in the lowest four deciles is five times that of the households in deciles 9 and 10. Together, these two criteria aid us in identifying items that are disproportionately consumed by the poor.
12 Some expenditure items have been removed, such as those goods and services that are currently VAT exempt (given that the focus is on zero rating).
0%
5%
10%
15%
20%
25%
30%
35%
40%
poorest 2 3 4 5 6 7 8 9 richestHousehold decile (per capita expendiure)
Transport
Alcoholic beverages; tobacco and narcoticsClothing and footwear
Housing; water; electricity; gas and other fuelsEducation
28
5.2.3.2 Additional measures of the impact on households by income level To further evaluate the impact of zero rating, we analyse the benefits of zero rating in the form of the tax reduction to the poor against the costs of zero rating, defined as the VAT revenue foregone to the non-poor. The latter is usually higher in Rand terms than the benefits to the poor, because the non-poor usually spend a much larger amount in absolute terms on expenditure items. We present two alternative definitions of the poor, and determine the benefit cost ratios (BCR) as follows:
• BCR1: VAT savings to households in deciles 1 to 4, divided by VAT revenue foregone to households in deciles 5 to 10.
• BCR2: VAT savings to households in deciles 1 to 7, divided by VAT revenue foregone to households in deciles 8 to 10.
Calculation of the VAT revenues foregone differs between already zero-rated goods, where the LCS figures do not include VAT, and goods proposed for zero rating, where expenditure figures include VAT paid. The following methods are used in each of these cases.
• Existing basket of zero-rated items (food and non-food items): the expenditure on all items are multiplied by the old VAT rate (14%) and the new VAT rate (15%). This gives the VAT savings for both rates, and also allows us to determine increased VAT savings on existing zero-rated items.
• The VAT paid13 on currently-vatable expenditure items: this is calculated by multiplying the expenditure on all items by the old VAT rate (14/114).14 To determine the VAT paid at the rate of 15%, we deduct from total expenditure the VAT paid at 14%, as derived above (to obtain expenditure before VAT). Expenditure before VAT is then multiplied by 15% to obtain the VAT paid at the new rate. Note that the calculations assume that expenditure remains constant; hence, we ignore behavioural responses to VAT-induced price changes. From these calculations, we determine the VAT revenues foregone, and the increased VAT paid on existing vatable items.
Using the BCR1 as one criterion, we consider an item for possible zero rating if the gain to the non-poor (the foregone VAT revenues to deciles 5 to 10) is not more than twice the benefit to the poor (the VAT savings to deciles 1 to 4).
For the zero rating of items to have a progressive impact, the VAT savings for a specific expenditure item must constitute a larger share of income for the poor than for the non-poor. Using the VAT paid across the expenditure distribution as the proxy for VAT savings if an item is zero rated, we can determine the progressive impact by calculating the average tax rate (i.e. the VAT paid on an expenditure item as a
13 Throughout the analysis, we assume that the VAT is passed fully to consumers.
14 Some expenditure items such as cigarettes also include excise duties, but we ignore these taxes in the calculations.
29
proportion of income). If the difference in the average tax rates between the poor and the non-poor (divided by the difference in the average income of the groups) is negative, zero rating (and hence VAT relief) will have a progressive impact, and vice versa.
5.2.3.3 Socio-economic considerations The committee also considered items that are beneficial to the welfare of the poor, with the qualification that de-merit goods would not receive any consideration. For this reason, we excluded alcohol, tobacco and sugar.
5.2.4 Items considered
Based on public submissions (excluding duplications) a total of 66 expenditure items were considered – see section 9.1 for a list of these items. Not all items on the submission list could be matched with the LCS data, which for example does not list yoghurt separately. Furthermore, some of the submissions suggested broad categories, such as basic food expenditure, or items that are already zero rated (such as eggs).
Applying the criteria outlined above we identified eight expenditure items (baby food consisting predominantly of milk, bread flour, cake flour, disposable nappies, poultry, sanitary products and tampons15, school uniforms, and white bread) for further consideration. The results of this exercise are presented in Table 2.
15 Sanitary products are considered a merit good, and do not necessarily meet the data criteria specified. It is included for further consideration based on goods consumed by vulnerable groups.

30
Table 2: Data summary for eight items considered in detail (Rand million), 2018 prices
Item Progressivity Index BCR1 Equity gain ratio
Average proportional
spending (deciles 1 to 4)
Baby food Predominantly milk
-0,07 0,535 7,126 0,283%
Bread flour -0,05 1,432 35,046 0,204% Cake flour -0,14 0,951 12,849 0,562% Disposable nappies -0,19 0,672 8,240 0,720% Poultry (incl heads and feet) -0,88 0,505 5,351 4,354% Sanitary products and tampons
-0,01 0,254 1,859 0,057%
School uniform -0,19 0,637 8,321 0,829% White bread -0,26 0,489 6,005 1,269% Criteria: Progressivity index (difference in
average tax rates between the poor and non-poor (divided by the difference in average income of two groups)) is negative. VAT relief will be progressive.
Gain to deciles 5 to 10 is not more than twice the gain to deciles 1 to 4.
Average proportional spending of poor (deciles 1 to 4) is 5 times that of non-poor (deciles 9 to 10).
Average proportional expenditure of deciles 1 to 4 greater than 0.20%.
Source: Calculated from Statistics South Africa, Living Conditions Survey. Interactive database. Analysis of LCS data kindly supplied by Ada Jansen of Stellenbosch University.
Each of these items was then analysed in more detail (see section 6). In the rest of this section, we present the statistics from the LCS for these eight items. Section 9.2 summarises the main data on other items submitted.
5.3 Results of the data analysis
5.3.1 Zero-rated items
Table 20 in the appendix shows the expenditure on zero-rated items as a proportion of total consumption expenditure16. Figure 10 shows the proportional spending for selected zero-rated items, as well as some vatable items. Most of the items in the zero-rated basket are disproportionately consumed by poorer households. Mealie meal and brown bread are two examples. The first four deciles spend on average 2.85% of their total expenditure basket on brown bread, and 3.85% on mealie meal.
16 The proportional expenditure on vatable items is available on request – inclusion in the report was not feasible due to the large number of items (593) on the list.

31
Figure 10: Household spending on selected zero-rated items as percentage of total expenditure, by decile17
Source: Calculated from Statistics South Africa, Living Conditions Survey. Interactive database. Analysis of LCS data kindly supplied by Ada Jansen of Stellenbosch University.
Figure 11 shows that the equity gain ratio – that is, as defined in section 5.2.3.1, the ratio of spending by the poorest four deciles to spending by the richest two deciles – varies widely amongst currently zero rated goods. As Table 21 shows, items such as fresh cabbage, cooking fat, mealie meal and paraffin provide a larger gain to poor households, while the rich save more from zero rating of some fruits and vegetables.
17 Spending on brown bread and mealie meal on the left axis. Spending on samp, canned pilchards and fresh full cream milk on the right axis.
0.0%
0.1%
0.2%
0.3%
0.4%
0.5%
0.6%
0.7%
0.8%
0.0%
1.0%
2.0%
3.0%
4.0%
5.0%
6.0%
poorest 2 3 4 5 6 7 8 9 richestHousehold decile (per capita expendiure)
Brown bread Mealie meal/Maize flour SampCanned pilchards Fresh full cream milk

32
Figure 11: Equity gain ratio for existing zero-rated items
Source: Calculated from Statistics South Africa, Living Conditions Survey. Interactive database. Analysis of LCS data kindly supplied by Ada Jansen of Stellenbosch University.
Table 3 shows the VAT relief per household for the two VAT rates. In Rand terms, the average gain for the richest 10% of households is approximately seven times the gain to the poorest 10% of households. The food items combine all the zero-rated items listed in the LCS (see Table 20 for the complete list of zero-rated items included). Because of the undercount of food in the LCS, the benefits per household will be substantially higher than shown in this table.
Table 3: Annual VAT revenue forgone (VAT relief) per household on existing zero-rated basket in Rand (2018 prices), by decile
Decile
VAT rate = 14% VAT rate = 15%
Total VAT savings: food
items
Total VAT savings: Paraffin
Total Total VAT savings: food
items
Total VAT savings: Paraffin
Total
Poorest 562 15 577 602 16 618 2 719 17 736 770 18 789 3 753 18 771 807 19 826 4 771 16 787 826 17 844 5 763 16 779 817 17 835 6 733 13 746 785 14 799 7 728 8 736 780 9 789 8 751 7 758 805 8 812 9 808 5 813 866 5 871
Richest 957 2 959 1 026 2 1 028 Total 7 546 118 7 663 8 085 126 8 211
Source: Calculated from Statistics South Africa, Living Conditions Survey. Interactive database. Analysis of LCS data kindly supplied by Ada Jansen of Stellenbosch University.
3122
2018
1713
11101010
999
87
0 5 10 15 20 25 30 35 40 45 50
ParaffinCabbage fresh
Cooking fat: vegetable (eg Holsum)Mealie meal/Maize flour
SampBeans dried
Sour milk/maasEdible oils (eg cooking oils)+P58
Canned pilchardsBrown bread
PotatoesPowdered milk
Spinach/morogo freshRice
Medium eggs

33
Table 4 shows that total cost to the fiscus, according to the LCS, of the existing zero ratings. Again, because of the undercount in the LCS, the actual cost is higher than shown here.
Table 4: VAT revenue savings on existing zero-rated basket in Rand (2018 prices), by decile Decile
VAT rate = 14% VAT rate = 15% Total VAT
savings: food items
Total VAT savings: Paraffin
Total Total VAT savings: food
items
Total VAT savings: Paraffin
Total
Poorest 933 678 737 24 386 520 958 065 257 1 000 370 075 26 128 414 1 026 498 489 2 1 194 041 225 28 663 730 1 222 704 955 1 279 329 884 30 711 139 1 310 041 023 3 1 253 026 336 29 131 907 1 282 158 243 1 342 528 217 31 212 758 1 373 740 975 4 1 281 317 179 27 121 167 1 308 438 346 1 372 839 834 29 058 394 1 401 898 228 5 1 267 465 637 27 107 143 1 294 572 780 1 357 998 897 29 043 368 1 387 042 265 6 1 216 797 685 21 979 495 1 238 777 180 1 303 711 805 23 549 459 1 327 261 264 7 1 211 113 846 13 877 787 1 224 991 633 1 297 621 978 14 869 057 1 312 491 035 8 1 248 144 614 11 837 607 1 259 982 221 1 337 297 801 12 683 151 1 349 980 952 9 1 341 751 470 8 153 836 1 349 905 306 1 437 590 861 8 736 253 1 446 327 114
Richest 1 592 926 792 3 158 782 1 596 085 574 1 706 707 278 3 384 410 1 710 091 688 Total 12 540 263 521 195 417 974 12 735 681 495 13 435 996 629 209 376 401 13 645 373 031
Source: Calculated from Statistics South Africa, Living Conditions Survey. Interactive database. Analysis of LCS data kindly supplied by Ada Jansen of Stellenbosch University.
5.3.2 Other items
Table 5 below shows the proportional expenditure by household expenditure decile for the eight items submitted that both constitute a significant area of expenditure for low-income households and have a reasonably progressive impact. The average proportional spending on these items for the first four deciles in shown in the second last column.
Table 5: Proportional expenditure and equity gain ratio of eight vatable items, by decile Item Decile
1 Decile
2 Decile
3 Decile
4 Decile
5 Decile
6 Decile
7 Decile
8 Decile
9 Decile
10 Avg.
Deciles 1 to 4
Equity gain ratio
Poultry (incl. heads and feet) 4.43% 4.60% 4.26% 4.13% 3.86% 3.48% 3.01% 2.02% 1.14% 0.49% 4.35% 5.351
White bread 1.37% 1.37% 1.18% 1.16% 1.01% 0.91% 0.85% 0.57% 0.32% 0.10% 1.27% 6.005 School uniform 1.28% 0.87% 0.68% 0.49% 0.37% 0.30% 0.25% 0.17% 0.14% 0.06% 0.83% 8.321 Baby food Predominantly milk
0.27% 0.34% 0.30% 0.22% 0.25% 0.23% 0.16% 0.05% 0.06% 0.02% 0.28% 7.126
Disposable nappies 0.64% 0.75% 0.86% 0.63% 0.48% 0.37% 0.29% 0.15% 0.13% 0.04% 0.72% 8.240
Cake flour 0.51% 0.67% 0.58% 0.49% 0.38% 0.27% 0.22% 0.14% 0.07% 0.02% 0.56% 12.849 Bread flour 0.22% 0.23% 0.18% 0.18% 0.13% 0.09% 0.05% 0.03% 0.01% 0.00% 0.20% 35.046 Sanitary products 0.05% 0.06% 0.05% 0.07% 0.05% 0.07% 0.06% 0.05% 0.04% 0.02% 0.06% 1.859
Source: Calculated from Statistics South Africa, Living Conditions Survey. Interactive database. Analysis of LCS data kindly supplied by Ada Jansen of Stellenbosch University.
34
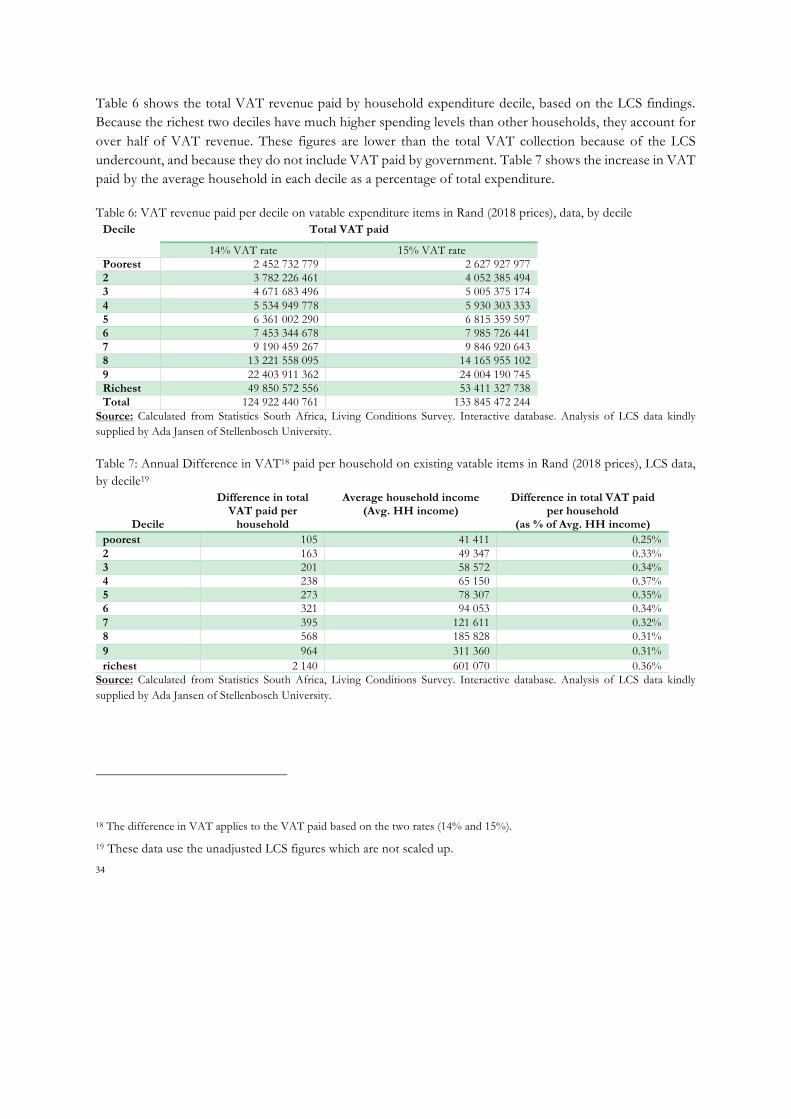
Table 6 shows the total VAT revenue paid by household expenditure decile, based on the LCS findings. Because the richest two deciles have much higher spending levels than other households, they account for over half of VAT revenue. These figures are lower than the total VAT collection because of the LCS undercount, and because they do not include VAT paid by government. Table 7 shows the increase in VAT paid by the average household in each decile as a percentage of total expenditure.
Table 6: VAT revenue paid per decile on vatable expenditure items in Rand (2018 prices), data, by decile Decile Total VAT paid
14% VAT rate 15% VAT rate Poorest 2 452 732 779 2 627 927 977 2 3 782 226 461 4 052 385 494 3 4 671 683 496 5 005 375 174 4 5 534 949 778 5 930 303 333 5 6 361 002 290 6 815 359 597 6 7 453 344 678 7 985 726 441 7 9 190 459 267 9 846 920 643 8 13 221 558 095 14 165 955 102 9 22 403 911 362 24 004 190 745 Richest 49 850 572 556 53 411 327 738 Total 124 922 440 761 133 845 472 244
Source: Calculated from Statistics South Africa, Living Conditions Survey. Interactive database. Analysis of LCS data kindly supplied by Ada Jansen of Stellenbosch University.
Table 7: Annual Difference in VAT18 paid per household on existing vatable items in Rand (2018 prices), LCS data, by decile19
Decile
Difference in total VAT paid per
household
Average household income (Avg. HH income)
Difference in total VAT paid per household
(as % of Avg. HH income) poorest 105 41 411 0.25% 2 163 49 347 0.33% 3 201 58 572 0.34% 4 238 65 150 0.37% 5 273 78 307 0.35% 6 321 94 053 0.34% 7 395 121 611 0.32% 8 568 185 828 0.31% 9 964 311 360 0.31% richest 2 140 601 070 0.36%
Source: Calculated from Statistics South Africa, Living Conditions Survey. Interactive database. Analysis of LCS data kindly supplied by Ada Jansen of Stellenbosch University.
18 The difference in VAT applies to the VAT paid based on the two rates (14% and 15%).
19 These data use the unadjusted LCS figures which are not scaled up.

35
Figure 12 shows BCR1 for the eight items considered for zero rating. The relative benefits to the poorest four deciles are greatest for bread flour and lowest for sanitary pads. Overall, the BCR1 is lower for the eight items reviewed than for existing zero-rated products.
Figure 12: Benefit cost ratios for existing eight vatable items (BCR1)
Source: Calculated from Statistics South Africa, Living Conditions Survey. Interactive database. Analysis of LCS data kindly supplied by Ada Jansen of Stellenbosch University.
Table 8 and Table 9 present estimates of the total VAT paid on each of the eight items selected for analysis. Table 8 shows the “raw” LCS data which are not adjusted for the undercount discussed above (in 2018 prices). Table 9 shows the VAT paid (in 2018 prices) for the eight items based on the adjusted LSC findings. These figures are calculated by inflating food items by a factor of 1.5, miscellaneous items by 1.1 and school uniforms by a factor of 0.920. We use these figures to arrive at the estimated revenue cost of zero rating each of these items in the following sections. The total VAT revenue foregone if these eight items were zero rated (in 2018 adjusted prices) amounts to R10.4 billion. The first four deciles would gain a total of R3.6 billion, compared to R5.6 billion for deciles 6 to 10.
20 These scaling factors were calculated from the CPI data kindly provided by STATS SA to the Panel.
1.43
0.95
0.67
0.64
0.53
0.50
0.49
0.25
0.00 0.20 0.40 0.60 0.80 1.00 1.20 1.40 1.60
Breadflour
Cakeflour
Disposablenappies
Schooluniform
BabyfoodPredominantlymilk
Poultry(inclheadsandfeet)
Whitebread
Sanitarytowelsandtampons
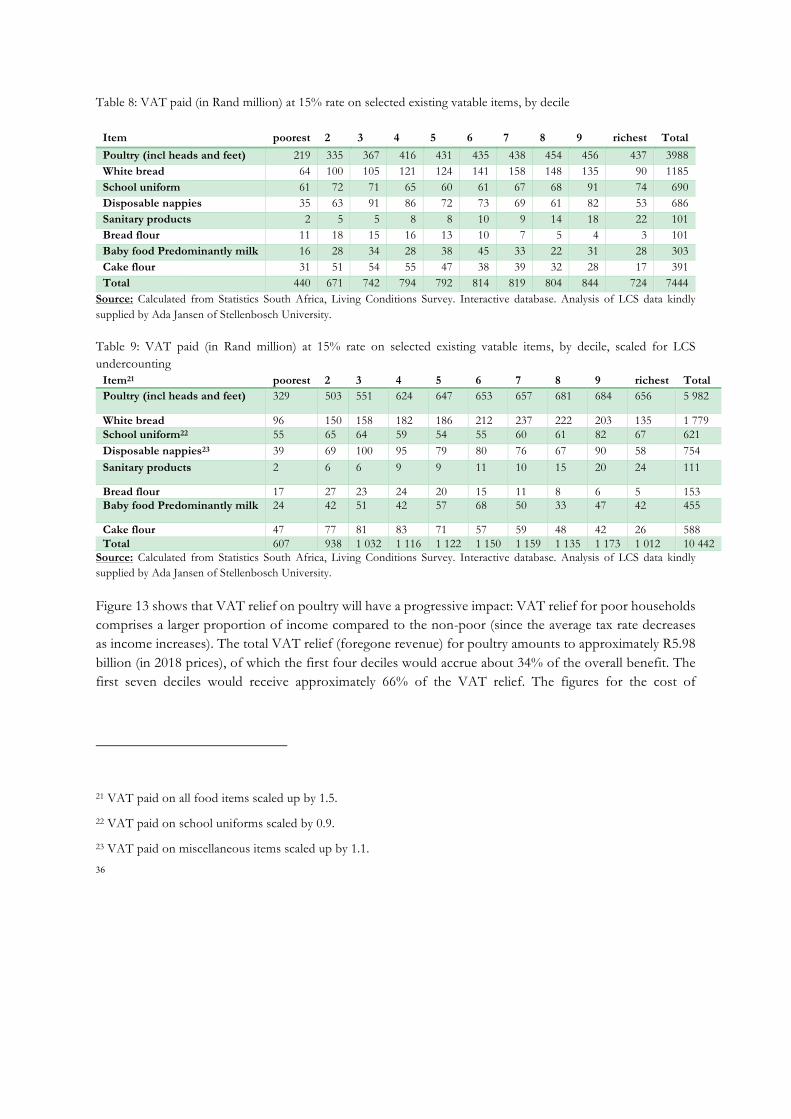
36
Table 8: VAT paid (in Rand million) at 15% rate on selected existing vatable items, by decile
Item poorest 2 3 4 5 6 7 8 9 richest Total Poultry (incl heads and feet) 219 335 367 416 431 435 438 454 456 437 3988 White bread 64 100 105 121 124 141 158 148 135 90 1185 School uniform 61 72 71 65 60 61 67 68 91 74 690 Disposable nappies 35 63 91 86 72 73 69 61 82 53 686 Sanitary products 2 5 5 8 8 10 9 14 18 22 101 Bread flour 11 18 15 16 13 10 7 5 4 3 101 Baby food Predominantly milk 16 28 34 28 38 45 33 22 31 28 303 Cake flour 31 51 54 55 47 38 39 32 28 17 391 Total 440 671 742 794 792 814 819 804 844 724 7444
Source: Calculated from Statistics South Africa, Living Conditions Survey. Interactive database. Analysis of LCS data kindly supplied by Ada Jansen of Stellenbosch University.
Table 9: VAT paid (in Rand million) at 15% rate on selected existing vatable items, by decile, scaled for LCS undercounting
Item21 poorest 2 3 4 5 6 7 8 9 richest Total Poultry (incl heads and feet) 329 503 551 624 647 653 657 681 684 656 5 982
White bread 96 150 158 182 186 212 237 222 203 135 1 779 School uniform22 55 65 64 59 54 55 60 61 82 67 621 Disposable nappies23 39 69 100 95 79 80 76 67 90 58 754 Sanitary products 2 6 6 9 9 11 10 15 20 24 111
Bread flour 17 27 23 24 20 15 11 8 6 5 153 Baby food Predominantly milk 24 42 51 42 57 68 50 33 47 42 455
Cake flour 47 77 81 83 71 57 59 48 42 26 588 Total 607 938 1 032 1 116 1 122 1 150 1 159 1 135 1 173 1 012 10 442
Source: Calculated from Statistics South Africa, Living Conditions Survey. Interactive database. Analysis of LCS data kindly supplied by Ada Jansen of Stellenbosch University.
Figure 13 shows that VAT relief on poultry will have a progressive impact: VAT relief for poor households comprises a larger proportion of income compared to the non-poor (since the average tax rate decreases as income increases). The total VAT relief (foregone revenue) for poultry amounts to approximately R5.98 billion (in 2018 prices), of which the first four deciles would accrue about 34% of the overall benefit. The first seven deciles would receive approximately 66% of the VAT relief. The figures for the cost of
21 VAT paid on all food items scaled up by 1.5.
22 VAT paid on school uniforms scaled by 0.9.
23 VAT paid on miscellaneous items scaled up by 1.1.
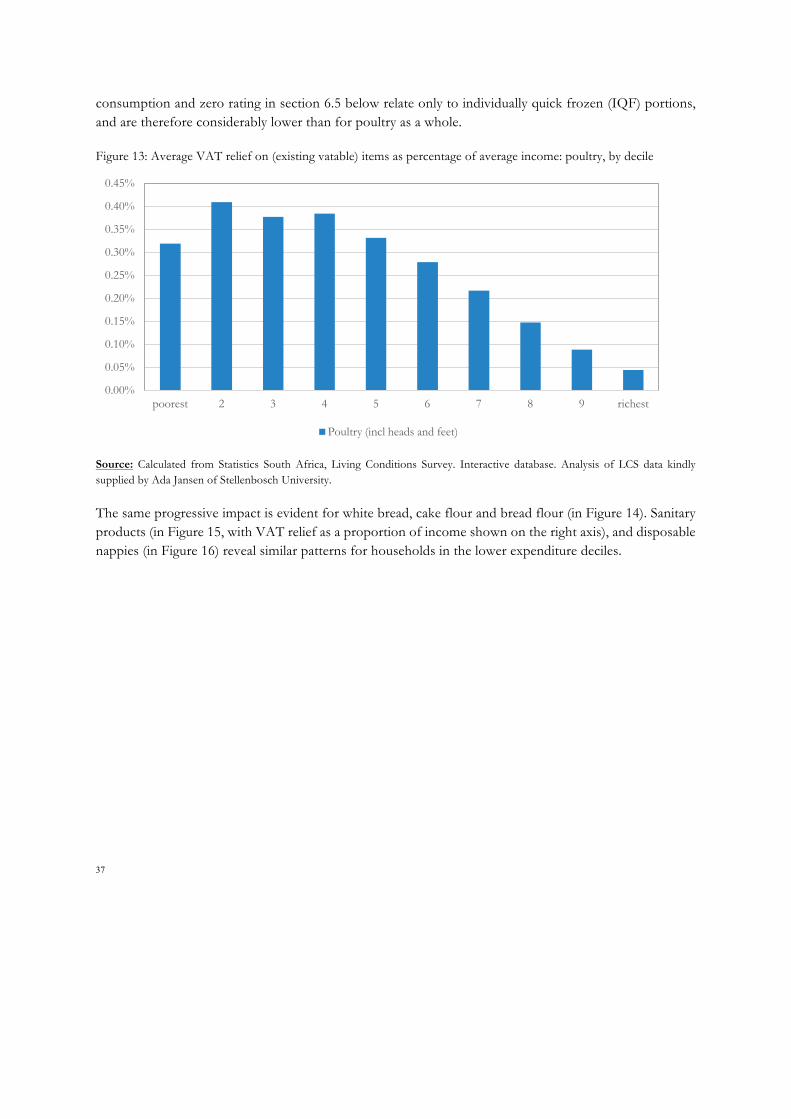
37
consumption and zero rating in section 6.5 below relate only to individually quick frozen (IQF) portions, and are therefore considerably lower than for poultry as a whole.
Figure 13: Average VAT relief on (existing vatable) items as percentage of average income: poultry, by decile
Source: Calculated from Statistics South Africa, Living Conditions Survey. Interactive database. Analysis of LCS data kindly supplied by Ada Jansen of Stellenbosch University.
The same progressive impact is evident for white bread, cake flour and bread flour (in Figure 14). Sanitary products (in Figure 15, with VAT relief as a proportion of income shown on the right axis), and disposable nappies (in Figure 16) reveal similar patterns for households in the lower expenditure deciles.
0.00%
0.05%
0.10%
0.15%
0.20%
0.25%
0.30%
0.35%
0.40%
0.45%
poorest 2 3 4 5 6 7 8 9 richest
Poultry (incl heads and feet)

38
Figure 14: Average VAT relief on (existing vatable) items as percentage of average income: white bread, cake flour and bread flour, by decile
Source: Calculated from Statistics South Africa, Living Conditions Survey. Interactive database. Analysis of LCS data kindly supplied by Ada Jansen of Stellenbosch University.
Figure 15: Average VAT relief on (existing vatable) items as percentage of average income: disposable nappies, sanitary products, school uniform, by decile
Source: Calculated from Statistics South Africa, Living Conditions Survey. Interactive database. Analysis of LCS data kindly supplied by Ada Jansen of Stellenbosch University.
0.00%
0.01%
0.01%
0.02%
0.02%
0.03%
0.00%
0.02%
0.04%
0.06%
0.08%
0.10%
0.12%
0.14%
poorest 2 3 4 5 6 7 8 9 richest
Breadflour Whitebread Cakeflour
0.00%
0.00%
0.00%
0.00%
0.00%
0.01%
0.01%
0.01%
0.01%
0.00%
0.01%
0.02%
0.03%
0.04%
0.05%
0.06%
0.07%
0.08%
0.09%
0.10%
poorest 2 3 4 5 6 7 8 9 richestSanitary towels and tampons Disposable nappies School uniform

39
Figure 16: Average VAT relief on (existing vatable) items as proportional of average income: baby food predominantly milk, by decile
Source: Calculated from Statistics South Africa, Living Conditions Survey. Interactive database. Analysis of LCS data kindly supplied by Ada Jansen of Stellenbosch University.
0.00%
0.01%
0.01%
0.02%
0.02%
0.03%
0.03%
0.04%
0.04%
poorest 2 3 4 5 6 7 8 9 richest
Baby food Predominantly milk
40
6 Analysis of eight items reviews for zero rating
6.1 Bread
6.1.1 Introduction
The different types of bread made from wheat are regulated by the “Regulation relating to the grading, packing and marking of wheat products intended for sale in the Republic of South Africa”, as issued in the Government Notice No. R.405 and published in the Government Gazette No. 40828 on 5 May 2017 (the Regulation). This Regulation provides detailed information/guidelines as to the various requirements that each specific product must comply with, including the composition and packaging/marketing of the product.
This paragraph will only address the possible zero rating of white bread, in reference to the Regulation. There are many types of breads made from wheat, non-wheat as well as a combination of wheat and non-wheat products. This paragraph is limited to breads made from wheat products as defined in the Regulation.
6.1.2 Definitional issues
Section 11(1)(j) read with Item 1 in Part B of Schedule 2 to the Value-Added Tax Act 89 of 1991 (the VAT Act24) currently allows for the zero rating of the supply of “Brown Bread” as defined in the Regulation.
The Regulation classifies bread as white wheat bread, brown wheat bread and speciality bread. Wheat bread refers to a baked or partially baked product consisting mainly of wheat products and which is normally sold as bread, under the designation of bread or which is intended to be used as bread, in any form, size or shape and has a mass of more than 100g. Wheat products intended to be used as confectionary (such as a banana loaf, date loaf etc.) are not regarded as “bread”, notwithstanding the fact that these products may have descriptive designations which include the word “bread” or “loaf”.
White bread is in essence made with white wheat flour, water, yeast and may include other ingredients providing additional nutritional value. Brown wheat bread contains similar ingredients, made with brown wheat flour, whole-wheat flour, whole-wheat brown flour or high bran brown wheat flour respectively. A speciality bread specifically excludes white wheat bread and brown wheat bread, and consists of wheat flour or composite cereal flour and may contain additional ingredients for purposes of sensory, functional or nutritional value (such as whole/crushed kernels, seeds etc.).
24 All references to sections are to sections of the VAT Act unless otherwise stated.

41
6.1.3 Impact on households by income level
The proportional expenditure is calculated by dividing the consumption of the individual item by the total consumption expenditure. The table below shows the proportional expenditure by decile for white bread.
Table 10: Proportional expenditure on bread Product Decile
1 Decile 2
Decile 3
Decile 4
Decile 5
Decile 6
Decile 7
Decile 8
Decile 9
Decile 10
White bread 1.37% 1.37% 1.18% 1.16% 1.01% 0.91% 0.85% 0.57% 0.32% 0.10% Source: Calculated from Statistics South Africa, Living Conditions Survey. Interactive database. Analysis of LCS data kindly supplied by Ada Jansen of Stellenbosch University.
The total amount of VAT linked to the sales of white bread to the ultimate consumer is estimated by Statistics South Africa at R8,6 billion in 2016. Zero rating white bread would provide an estimated tax benefit to poor households (deciles 1 to 7) of R812 million.
Due to the different names given to breads in the market, the labelling of a product must be carefully considered. The fact that the Regulation specifies in detail the classes, standards and marking requirements for wheat bread, interpretational difficulties will be minimised where the items in Part B of Schedule 2 are defined with reference to the relevant defined terms in the Regulation. However, even though a product is marketed (labelled) as falling within one of the classes listed in the Regulation, the definitions of the bread products stipulate that certain standards must be met.
These standards entail the scientific make-up of the products which will not be readily available for inspection by SARS. Although the packaging will contain the nutritional value or ingredients, it will not contain the scientific make-up of the product prescribed by the Regulation such as ash or moisture content. It will therefore be a challenge for auditors to prove that an item has been mislabelled. Paragraphs 16 to 20 of the Regulation contain various methods of analysis to confirm whether certain prescribed standards are met, such as the ash or moisture content and the bran content of brown wheat flour. The Regulation also allows for tolerances for moisture, bran and ash contents for the various classes of wheat products25. A person contravening or failing to comply with a provision of the Regulation is guilty of an offence and upon conviction liable to a fine not exceeding R50 000 or imprisonment for a period not exceeding two years, or to a combination thereof26. Assignees are appointed by the Minister of the Department of Agriculture, Forestry and Fisheries (Department of Agriculture), to undertake inspections at the point of
25 Paragraph 22 of the Regulation.
26Paragraph 23 of the Regulation.

42
sale, manufacture, packing or export in order to ensure the standards and requirements prescribed in the Regulation are met, and the benefits of classification, grading and marking reach the consumer27.
Under section 3(1) of the Agricultural Product Standards Act 119 of 1990 (the APS Act), no regulated agricultural product may be sold in South Africa, unless the product, amongst others, complies with the prescribed standards regarding the quality, class or grade, and the product is packed, marked and labelled in the prescribed manner28. On the basis that the grading, packing and marking of wheat products are highly regulated, SARS should be able to accept that mislabelling will generally not occur, or refer the matter for investigation to the Department of Agriculture.
6.1.4 Merit
Various studies have been conducted on malnutrition of the poor, highlighting the need to improve availability and affordability of more nutritious food to the poor. One of these studies reflects that the poor easily exchange nutritious foods for cheaper, more readily available foods which are energy-dense but are nutritionally poor (such as pap, bread or sugar)29. All wheat products are energy-dense, the nutritional value thereof mostly consisting of carbohydrates. However, due to brown wheat flour consisting of the entire wheat kernel, it contains significantly more minerals and other micro-nutrients.
White bread consists of refined carbohydrates and is not necessarily the healthiest food option. The fact that white bread is generally low in fibre makes it a suboptimal food to be highly consumed. It is for this reason that white bread flour is currently mandatorily fortified30.
Refined carbohydrate foods are linked to increased obesity and high risk of the development of Non-Communicable Diseases (NCDs). However, changing consumer behaviour to increase consumption of whole-wheat bread is a long-term project (not necessarily focussed only on the poor). Therefore, it makes economic sense to zero rate white bread to relieve the financial stress of the poor population while the government, Department of Health (DoH) in particular, is attempting to influence the South African population across the life-cycle to make informed, healthy food and nutrition decisions. The aforementioned is supported by the submission received from the South African Chamber of Baking, received 1 June 2018.
27http://www.daff.gov.za/daffweb3/Branches/Agricultural-Production-Health-Food-Safety/Food-Safety-Quality-Assurance
28Questions and Answers (Q&A) on assignees designated in terms of the SPA Act, http://www.nda.agric.za/doaDev/sideMenu/foodSafety/doc/Q%20&%20A%20on%20Designated%20Assignees%20under%20the%20APS%20Act%20-%2028%20March%20'17.pdf accessed 26 July 2018.
29 http://www.plaas.org.za/sites/default/files/publications-pdf/Policy%20Brief%2048_Florian%20Kroll.pdf/ accessed 26 July 2018.
30 Fortification of food refers to the adding of vitamins and minerals to prevent nutritional deficiencies.

43
6.1.5 Conclusions
There are good equity reasons to zero rate bread, due to its proportional consumption by the lower income deciles. Relying on the definitions as contained in the Regulation, a highly-regulated environment, the administration of the zero rating of the supply of additional wheat products will be minimal. Relying on the Regulation for classification and the Agricultural industry for the adherence to the Regulation, will limit interpretational differences or mislabelling of products in order to gain an unfair VAT advantage. The only considerations to be had will be legislative amendments and ensuring that the scope of the current zero rating is not broadened out of context to the original policy intent.
6.2 White bread Flour and Cake Flour (considered collectively)
6.2.1 Introduction
The different types of flour made from wheat are regulated by the “Regulation relating to the grading, packing and marking of wheat products intended for sale in the Republic of South Africa”, as issued in the Government Notice No. R.405 and published in the Government Gazette No. 40828 on 5 May 2017 (the Regulation). This Regulation provides detailed information/guidelines as to the various requirements that each specific product must comply with, including the composition and packaging/marketing of the product.
The Regulation only deals with flours made from wheat and do not regulate the requirements for any other flour-alternatives, such as coconut flour, potato flour or any other gluten-free products. The potential zero rating of the supply of flour following the definitions in the Regulation should therefore not include the latter products. However, as the price or cost of the gluten-free alternatives seems to be much higher than their wheat counterparts (refer to the respective tables contained in the paragraphs below), it is unlikely that such products will commonly be purchased by the poor. The supply of chickpea powder (flour), soy powder (flour) and peanut powder (flour) (common gluten-free alternatives) are in any event zero rated under Item 19 of Part B of Schedule 2 to the VAT Act.
Based on the above, this paragraph will only address the possible zero rating of the additional flour items being white bread flour and cake flour, made from wheat, in reference to the Regulation. There are many types of flours made from wheat, non-wheat as well as a combination of wheat and non-wheat products. This paragraph is limited to flours made from wheat products as defined in the Regulation.
6.2.2 Definitional issues
The Regulation classifies flours as “white wheat flour” (including cake wheat flour or cake flour made from wheat), “brown wheat flour” and “self-raising flour”. The regulation also defines “stabilised wheat bran” (part of the class “stabilised wheat products”). The main difference between cake flour (being regarded to be a “weak” flour) and bread flour (generally regarded as a “strong” flour) is the ash content (or mineral matter) contained in the flour, based on the Regulation and a quick internet search. Flours are also

44
differentiated based on the protein content; bread flours have a higher protein content whereas cake flour has a much lower protein content, resulting in a softer baked product31.
White wheat flour is categorised in the Regulation into the following classes:
• White bread wheat flour which is ideal for baked products lighter in colour, strong proteins and good volume.32
• Cake wheat flour which is whiter than other flours, gives better baking potential and results in finer whiter textures. It is applied in puff pastry and other baked goods requiring a high-performance flour.33
• Soft wheat flour which is typically packaged as cake or pastry flour, best used for cakes, cookies and pastry.34
• Industrial flour which is primarily used in the production of biscuits and rusks.35 • All-purpose wheat flour which is suitable for baking either breads, cakes or pastries.36
The Regulation divides “brown wheat flour” in four classes being:
• Brown bread wheat flour which is ideal for baked goods requiring a darker colour and higher bran content.37
• Whole-wheat brown flour adds a nutty flavour to baked goods, suitable for bread, pies, pancakes and other multi-grain baked goods.38
• High bran brown wheat flour which is added for high-fibre content to baked goods.39 • Whole wheat flour which is coarser, higher in fibre and more nutritious than white flour40.
31 http://www.differencebetween.net/object/difference-between-all-purpose-flour-and-cake-flour/ accessed on 26 July 2018.
32 https://supremeflour.co.za/product/white-bread-wheat-flour/ accessed on 26 July 2018.
33 https://supremeflour.co.za/product/cake-wheat-flour/ accessed on 26 July 2018.
34
https://www.google.com/search?source=hp&ei=HolZW7f1NtHjsAfmzaKAAQ&q=soft+wheat+flour&oq=soft+wheat+flour&gs_l=psy-ab.3...963.3610.0.3697.18.9.0.0.0.0.460.799.3-1j1.2.0....0...1c.1.64.psy-ab..16.2.795...0j0i131k1j0i10k1.0.HAtWpQUqQIE accessed 26 July 2018.
35 https://supremeflour.co.za/product/industrial-wheat-flour/ accessed on 26 July 2018.
36 http://www.berkeleywellness.com/healthy-eating/food/article/types-wheat-flour accessed on 26 July 2018.
37 https://supremeflour.co.za/product/brown-bread-wheat-flour/ accessed 26 July 2018.
38 http://www.goldencloud.co.za/golden-cloud-whole-wheat-brown-flour-krakley-wheat/ accessed on 26 July 2018.
39 www.snowflake.co.za accessed on 26 July 2018.
40 https://supremeflour.co.za/product/whole-wheat-flour/ accessed 26 July 2018.

45
“Stabilised wheat flour” (part of the class “stabilised wheat products”) refers to a wheat flour that is premixed with leavening agent or raising agent complying with certain requirements prescribed in the Regulation. A quick internet search indicates that stabilised wheat flour is a common ingredient in premixed baking products such as cake and muffin mixes.41
“Self-raising wheat flour” is in a separate class in the Regulation. Uses of self-raising flour are similar to that of cake or all-purpose flour set out above. Quick, informal research discussions held showed that cake flour is often used in traditional cooking by the poor to make dumplings, biscuits, “vetkoeke” (or “fat cakes”) and steam breads – items often used to “bulk up” a meal in order to feed more people with less food. For the same reason bread is generally added to every meal; it is often cheaper to purchase bread flour and make your own bread than buying a loaf of bread. A quick internet search on price comparisons yielded the following:
Table 11: Flour price comparison Retailer Retailer 1 Retailer 2
Type of flour VAT inclusive VAT exclusive VAT inclusive VAT exclusive Bread flour White bread flour 1kg 17.19 14.95 Brown bread flour 1 kg 15.19 15.19 Whole-Wheat flour Cake Flour 1 kg 12.09 10.51 12.60 10.96 All-purpose flour Self-raising flour White flour 1kg 16.13 14.03 15.69 13.64 Bran flour 1kg 16.19 14.08 Maizena Cornflour 500g 24.20 21.04 Wheat bran 500g 11.29 9.82 Gluten-free all-purpose flour 500g 46.39 40.34
In considering the potential zero rating of flour, the complexities of defining this product should not be an issue if the Regulation relating to this product is used to define this product for the potential zero rating of this product. Based on production figures published by the South African Grain Information Services (SAGIS)42, the production of the various wheat flours can be summarised as follows:
41 http://www.fastmoving.co.za/fmcg-suppliers/golden-cloud-276/food-9/golden-cloud-438/cake-mix-vanilla-700g-box-7795 accessed on 26 July 2018.
42 http://www.sagis.org.za/Forum_Wheat_20171027.pdf/ accessed 27 July 2018; and http://www.sagis.org.za/Forum_Wheat_20161021.pdf/ accessed 27 July 2018.

46
Table 12: Wheat production figures Wheaten products Manufactured (ton) Oct 2016 to Sep 2017 Sep 2015 to Aug 2016 Cake flour 859 666 26.96% 819 800 26.13% Self-raising flour 17 845 0.56% 16 141 0.51% White bread flour 1 086 256 34.07% 1 113 522 35.50% Brown bread flour 427 996 13.42% 399 615 12.74% Other flour (industrial) 143 889 4.51% 141 390 4.51% Whole wheat meal 3 566 0.11% 3 120 0.10% Bran 630 287 19.77% 627 587 20.01% Semolina 18 782 0.59% 15 905 0.51% Total 3 188 287 3 137 080
6.2.3 Impact on households by income level
The proportional expenditure is calculated by dividing the consumption of the individual item by the total consumption expenditure, by decile. The table below shows the proportional expenditure by decile cake and bread flour.
Table 13: Proportional expenditure on flour Product Decile
1 Decile 2
Decile 3
Decile 4
Decile 5
Decile 6
Decile 7
Decile 8
Decile 9
Decile 10
Cake flour 0.51% 0.67% 0.58% 0.49% 0.38% 0.27% 0.22% 0.14% 0.07% 0.02% Bread flour 0.22% 0.23% 0.18% 0.18% 0.13% 0.09% 0.05% 0.03% 0.01% 0.00%
Source: Calculated from Statistics South Africa, Living Conditions Survey. Interactive database. Analysis of LCS data kindly supplied by Ada Jansen of Stellenbosch University.
The total amount of VAT linked to the sales of bread and cake flour to the ultimate consumer, calculated from the production figures above (using the year Oct 2016-Sep 2017 as point of reference) as well as the price comparison above, are summarised in the following table. It should be noted that Statistics South Africa estimates final consumption of cake flour alone at R2 billion, which is a substantially higher figure than estimated here.
Table 14: VAT revenue - flour Product Units Price per unit (incl
of VAT) VAT component
per unit Total VAT foregone
Cake flour (kg) 779 717 062 12.60 1.64 1 281 448 041.03 White Bread flour (kg) 985 234 192 17.19 2.24 2 209 066 403.54 Total R 3 490 514 444.57
*Based on a conversion of 907kg per ton.
Zero rating these items would provide an estimated tax benefit to poor households (deciles 1 to 7) of the following magnitude: bread flour, R90 million; and cake flour R314 million. Due to the different names given to flours and breads in the market, the labelling of a product must be carefully considered. The fact that the Regulation specifies in detail the classes, standards and marking requirements for wheat bread and

47
flours, interpretational difficulties will be minimised where the items in Part B of Schedule 2 are defined with reference to the relevant defined terms in the Regulation. However, even though a product is marketed (labelled) as falling within one of the classes listed in the Regulation, the definitions of the bread and flour products stipulate that certain standards must be met. These standards entail the scientific make-up of the products which will not be readily available for inspection by SARS. Although the packaging will contain the nutritional value or ingredients, it will not contain the scientific make-up of the product prescribed by the Regulation such as ash or moisture content. It will therefore be a challenge for auditors to prove that an item has been mislabelled.
Paragraphs 16 to 20 of the Regulation contain various methods of analysis to confirm whether certain prescribed standards are met, such as the ash or moisture content and the bran content of brown wheat flour. The Regulation also allows for tolerances for moisture, bran and ash contents for the various classes of wheat products43. A person contravening or failing to comply with a provision of the Regulation is guilty of an offence and upon conviction liable to a fine not exceeding R50 000 or imprisonment for a period not exceeding two years, or to a combination thereof44. Assignees are appointed by the Minister of the Department of Agriculture, Forestry and Fisheries (Department of Agriculture), to undertake inspections at the point of sale, manufacture, packing or export in order to ensure the standards and requirements prescribed in the Regulation are met, and the benefits of classification, grading and marking reach the consumer45.
Under section 3(1) of the Agricultural Product Standards Act 119 of 1990 (the APS Act), no regulated agricultural product may be sold in South Africa, unless the product, amongst others, complies with the prescribed standards regarding the quality, class or grade, and the product is packed, marked and labelled in the prescribed manner46. On the basis that the grading, packing and marking of wheat products are highly regulated, SARS should be able to accept that mislabelling will generally not occur, or refer the matter for investigation to the Department of Agriculture.
6.2.4 Merit
White bread flour and cake flour are refined carbohydrates and are not necessarily the healthiest food option. However, consumption data from the LCS indicate that these two flour products are highly consumed by many South Africans especially the low deciles. In the case of bread flour, the average
43 Paragraph 22 of the Regulation.
44Paragraph 23 of the Regulation.
45http://www.daff.gov.za/daffweb3/Branches/Agricultural-Production-Health-Food-Safety/Food-Safety-Quality-Assurance
46Questions and Answers (Q&A) on assignees designated in terms of the SPA Act, http://www.nda.agric.za/doaDev/sideMenu/foodSafety/doc/Q%20&%20A%20on%20Designated%20Assignees%20under%20the%20APS%20Act%20-%2028%20March%20'17.pdf accessed 26 July 2018.

48
proportional consumption of the first four deciles is 0.20%, compared to 0.01% for deciles nine and ten. For cake flour, the percentages are 0.56% and 0.04%, respectively (see figures for white bread below). Many households use them to bake homemade bread, make steam bread and “fat cakes”. The fact that white bread is generally low in fibre makes it a suboptimal food to be highly consumed. It is for this reason that white bread flour is currently mandatorily fortified47 and the current fortification regulations are being amended to include, among other things, cake flour. The decision to include cake flour was based on the increased consumption of cake flour and the uses thereof by the poor.
6.2.5 Conclusions
Flour amongst other types of foodstuffs is consumed proportionally more by the lower income deciles. There are thus good economic and social reasons that it be zero rated. Relying on the definitions as contained in the Regulation, a highly-regulated environment, the additional administrative burden of the zero rating of the supply of additional wheat products will be minimal. Relying on the Regulation for classification and the Agricultural industry for the adherence to the Regulation, will limit interpretational differences or mislabelling of products in order to gain an unfair VAT advantage. The only administrative considerations to be had will be legislative amendments and ensuring that the scope of the current zero rating is not broadened out of context to the original policy intent.
6.3 School Uniforms Table 15 summarises the key data to consider for evaluating the case for zero rating school uniforms. According to the LCS, total expenditure on school uniforms in South Africa is approximately R4.5 billion per year. Others estimate expenditure on school uniforms in South Africa to be in the order of R10 billion48 more than twice the estimate from the LCS. Statistics South Africa does not estimate sales of school uniforms, which are included instead in various categories of clothing for CPI purposes.
47 Fortification of food refers to the adding of vitamins and minerals to prevent nutritional deficiencies.
48 Competition Commission, see: https://businesstech.co.za/news/business/148119/148119/

49
Table 15. Data on school uniforms by decile
6.3.1 Expenditure by income level
As a proportion of total expenditure of households, school uniforms make up a relatively small proportion of the consumption basket of households in South Africa. However, it is a good case to consider for zero rating because its forms a larger proportion of expenditure for low-income households (1.28% for decile 1 households) than it does for high income households (0.06% for decile 10 households). The table shows that while the increase in VAT from 14% to 15% means an absolute additional VAT payment that is a significantly larger proportional amount for poor households compared to rich households. As outlined earlier, with an equity gain ratio of 8, school uniforms are a good case to consider – zero rating will have a disproportionately positive impact on low-income households. Zero rating school uniforms would provide estimated VAT relief of approximately R412 million to households in deciles 1 to 7.
Furthermore, the argument could be made that school uniforms are a merit good and therefore worthy of support from public finances. Uniforms are also a compulsory purchase for all households that have school going children, and therefore low-income households have no choice but to purchase uniforms. Thus, the case for zero rating school uniforms is strong and the Panel believes that government should seriously consider zero rating this item. However, there are a number of complications which need further investigation and finalization before this can feasibly be done.
6.3.2 Definitional issues
The item “school uniforms” is made up of expenditure on, among others, shirts, shoes, socks, jerseys, dresses and blazers. On a practical basis, it would be difficult clearly to demarcate these clothing items that apply specifically to the category “school uniforms”. For example, the shirt that makes up most school uniforms is a plain white shirt. However, plain white shirts may also be purchased and used for wearing with casual clothing and business attire (mainly by individuals from high income households). To further complicate the matter, some schools may have a blue shirt as an item of a school uniform. It would similarly be very difficult to demarcate a school sock from a sock purchased for a purpose other than as part of a
1 2 3 4 5 6 7 8 9 10 Total Expenditure
R401 648 117
R467 884 899
R464 051 028
R421 593 963
R393 156 656
R401 791 704
R439 569 786
R442 461 479
R592 583 857
R485 353 723
VAT Paid (VAT 14%)
R49 325 207
R57 459 549
R56 988 722
R51 774 697
R48 282 396
R49 342 840
R53 982 254
R54 337 374
R72 773 456
R59 604 843
As % of Expenditure
1.28% 0.87% 0.68% 0.49% 0.37% 0.30% 0.25% 0.17% 0.14% 0.06%
Expenditure (VAT 15%)
R405 171 346
R471 989 152
R468 121 651
R425 292 156
R396 605 398
R405 316 193
R443 425 661
R446 342 720
R597 781 961
R489 611 211
VAT Paid (VAT 15%)
R52 848 436
R61 563 802
R61 059 345
R55 472 889
R51 731 138
R52 867 329
R57 838 129
R58 218 615
R77 971 560
R63 862 331
Increase in VAT
R3 523 229
R4 104 253
R4 070 623
R3 698 192
R3 448 742
R3 524 488
R3 855 875
R3 881 241
R5 198 104
R4 257 488
50
school uniform. It may be somewhat easy for consumers to define a shoe as a “school shoe” but even for shoes it would be very difficult for retailers to separate and distinguish a ‘school shoe’ from a general-purpose shoe. The complexity of the definitional problem is both that school uniforms are made up of a number of different items but also because it is impossible to exclude someone from purchasing and using an item of school uniform for another purpose. Addressing the definitional issues is complex but the Panel does believe that it may be possible to demarcate an item or items of school uniform for zero rating. This will, however, require engagement with the Department of Basic Education to implement policy for a standard uniform in all public schools.
6.3.3 Revenue foregone
Zero rating of school uniforms would, based on the data from the LCS, cost the fiscus approximately R610 million (in 2018 prices). In absolute terms, this cost would be spread relatively equally among expenditure classes but the benefits would accrue proportionately more to low-income households. Given that the estimate of the market per the LCS is about 50% of other estimates, the cost to the fiscus could, at the extreme, be in the order of R1.2 billion. Furthermore, unless the complexities of defining items of school uniform are properly addressed, there is likely to be significant additional losses to the fiscus. Zero rating uniforms would provide VAT relief of R412 million to households in deciles 1 to 7, and R210 million for households in deciles 8 to 10.
6.3.4 Market structure
The Panel is aware that the Competition Commission is investigating the school uniform industry due to concerns about high prices and market power. There is thus some justifiable concern that zero rating may not necessarily result in lower prices for consumers. The Panel recommends that these concerns should be addressed with the Commission.
Furthermore, informal producers and small businesses (such as women’s sewing groups) have been able to enter the market for school uniforms, especially as suppliers to schools in low-income areas. It is important to note that zero rating school uniforms might, if the market structure is addressed, result in lower prices in the formal economy alone. In other words, small and informal producers may well be rendered less competitive as a result of zero rating school uniform as such informal traders (not registered VAT vendors) will not be able to claim back the VAT paid on the materials and other inputs they have bought.
6.4 Baby formula (milk-based baby food)
6.4.1 Definitional issues
Infant formula is a manufactured food designed and marketed for feeding to infants under 12 months of age, usually prepared for bottle-feeding or cup-feeding from powder which must be mixed with water or as a ready-to-drink product. Its dietary use is intended solely as a food for infants by reason of its suitability as a complete or partial substitute for breast milk. It would be fairly straightforward to define this item in the legislation although care would need to be taken to exclude ‘follow-on’ milk products intended for

51
children over the age of 12 months. For CPI purposes, Statistics South Africa estimates sales of formula at around R6 billion a year in 2018 Rands.
6.4.2 Impact on households
Households in deciles 1 to 7 spend about 0.28% of their total expenditure on baby formula whereas households in deciles 9 and 10 spend about 0.04% of total expenditure on this item. In 2018 Rand terms, the average household spent about R140 per year on baby formula, with the highest average expenditure in decile 6 (R206 per household per year) and the lowest in decile 1 (R72 per household per year). Statistics South Africa estimates total consumption of formula at R5.3 billion.
6.4.3 Merit
Concerns have been raised that use of formula can affect the health of babies. Formula use is associated with higher death rates in low-income countries, where households do not have access to clean water and where the high cost may lead parents to dilute it excessively. At the same time, it is recognised that many mothers cannot rely exclusively on breastfeeding, because they do not produce sufficient milk; because they have to work; or because they are HIV positive with a significant viral load.
The global value of the breastmilk substitute (BMS) market is projected to reach US$70.6 billion by 2019. In many low-income and middle-income countries, growth in sales of BMS exceeds 10% annually. “Promotion and marketing have turned infant formula, which should be seen as a specialised food that is vitally important for those babies who cannot be breastfed, into a normal food for any infant”49. The industry is dominated by a few multinationals such as Nestle, Danone, Mead Johnson, Abbott, Friesland Campina, and Heinz.
According to a submission received from a group of public health experts (Sanderson et al.), in low resource settings non-breastfed children are at least six times more likely to die in the early months than breastfed children; and optimal breastfeeding and improved complementary feeding has the potential to prevent almost 20% of under-five deaths. This group raised a concern that a reduction in the price of baby formula (e.g. through a VAT zero rating) might undermine efforts to promote exclusive breastfeeding. They did, however, also acknowledge that infant formula is an essential food item for those children whose mothers are unable to breastfeed – and lower costs may reduce the risk of it being watered down, avoiding the health dangers of milk dilution by cash-strapped carers.
In 2011, the government of South Africa took a policy decision to promote breastfeeding as the method of choice to reduce the rate of malnutrition. This decision was taken following a National consultative meeting which was held in August, 2011. The consultative meeting had representatives from various stakeholders including; health experts, academics, traditional leaders and traditional health practitioners,
49 “Spotlight on infant formula: coordinated global action needed”. McFadden, Alison et al. The Lancet, Volume 387, Issue 10017, 413 - 415
52
NGOs, civil society, UN bodies both local and global UNICEF and WHO. The Minister of Health, Deputy Minister of Health, MECs, DGs, HODs, and health managers attended the meeting. Scientific evidence was presented on the benefits of breastfeeding and the risk of formula feeding using a population based approach.
South Africa has declared itself as a country that actively promotes, protects and supports exclusive breastfeeding. Legislation and policies were amended and regulations past to protect and support breastfeeding. According to the Department of Health, the implementation of these policies resulted in an increase in exclusive breastfeeding rates and a decrease in malnutrition in provinces that are actively monitoring implementation of the policy. Strengthening breastfeeding promotion and support is one of the key strategic areas of focus of the under-five campaign which includes nutrition as one of the pillars. Nutrition messages including HIV and infant feeding are promoted. The newly revised Road to Health booklet includes breastfeeding and complementary feeding message to caregivers.
Programmes and initiatives to strengthen support for breastfeeding in the workplace are also a key focus within national and provincial departments of health. The National Department of Health, in collaboration with United Nations Children’s Fund (UNICEF) and South African Civil Society for Women’s Adolescents’ and Children’s Health (SACSoWACH) has developed a resource pack to guide employers within a large and small businesses (public and private) to create an enabling environment to promote, protect and support breastfeeding in the workplace. This is aligned with existing laws in South Africa that governs support for breastfeeding in the workplace, including the basic condition of employment act, employment equity, and the code of good practice etc.
However, employment is not the only barrier to successful breastfeeding. In 2008, a review of the Baby Friendly Hospital Initiative showed that the majority (63%) of the 314 women included in the study were unemployed (not looking for work/ looking for work). About 74% of these women were between 20 to 34 years old. Among these women, 72% were breastfeeding their infants six weeks after discharge, and 47% were using infant formula. The 2016 South African Demographic and Health Survey (SADHS) showed a significant improvement in exclusive breastfeeding (breastmilk only) rates for the first six months from 8% in 2003 to 32% in 2016. The DHS showed breastfeeding rates of 44% during the first month but it drops to 27% at four to five months. One of the contributing factors to this progress are policies, including ceasing to issue free infant formula to HIV infected mothers.
The fear of mothers in passing on HIV is a major hindrance to breastfeeding promotion. In 2016 WHO release updated guidelines on breastfeeding and infant feeding in the context of HIV. This followed a review of evidence of the value of lifelong ARV throughout the breastfeeding period to improve HIV-free survival. This is important especially in setting where replacement feeding is not guaranteed to be safe. South Africa adopted the WHO 2016 recommendation to increase duration of breastfeeding up to two years with full adherence to antiretroviral. The fear of HIV infection during the breastfeeding period is still one of the drivers of use of infant formula in South Africa. It is acknowledged that there are gaps in the postnatal care support for women in terms of strengthening adherence to treatment and hence viral load suppression for breastfeeding women living with HIV is of concern. One of the efforts is strengthening the postnatal care and support for women for adherence, viral load monitoring and suppression is on the

53
current agenda. The draft PMTCT guidelines (2018) are clear on strengthening these components of postnatal PMTCT through provision of additional AZT for high risk women with viral load of more than 400 copies.
6.4.4 Foregone revenue
According to the LCS data, total household consumption of milk-based formula is estimated at R2.3 billion in 2018 Rands. Simulations based on the Living Conditions Survey suggests that the cost to the fiscus of zero rating formula would be R122 million (in 2018 prices).
6.5 Individually quick frozen poultry parts
6.5.1 Definitional issues
Chicken is sold to households in various forms, from whole fresh and processed products to frozen parts. As the following graph shows, individually quick frozen (IQF) parts have the lowest retail price. These are deep-frozen parts sold loose in plastic bags, which are disproportionately consumed by low-income households. The category is easily distinguished and tracked by both industry sources and Statistics South Africa (for the CPI). Still, suppliers may be able to misclassify other chicken products if the definition of IQF is not sufficiently narrow and easy to monitor.
Figure 17: Retail prices for chicken, average for 2017
Source: SAPA. Key Market Signals in the Broiler Industry for the Fourth Quarter of 2017. Downloaded from www.sapoultry.co.za in July 2018. Figure 21, page 28. The industry estimates that IQF accounts for 57% of total consumption. (SAPA 2018, page 20) Around a quarter of IQF chicken is imported. (Calculated from SAPA 2018, pages 12, 17 and 20).
31.53
44.25 45.31
56.7
0
10
20
30
40
50
60
retail:2kgIQF freshwhole frozenportionsexcludingIQF
freshportions
Rand
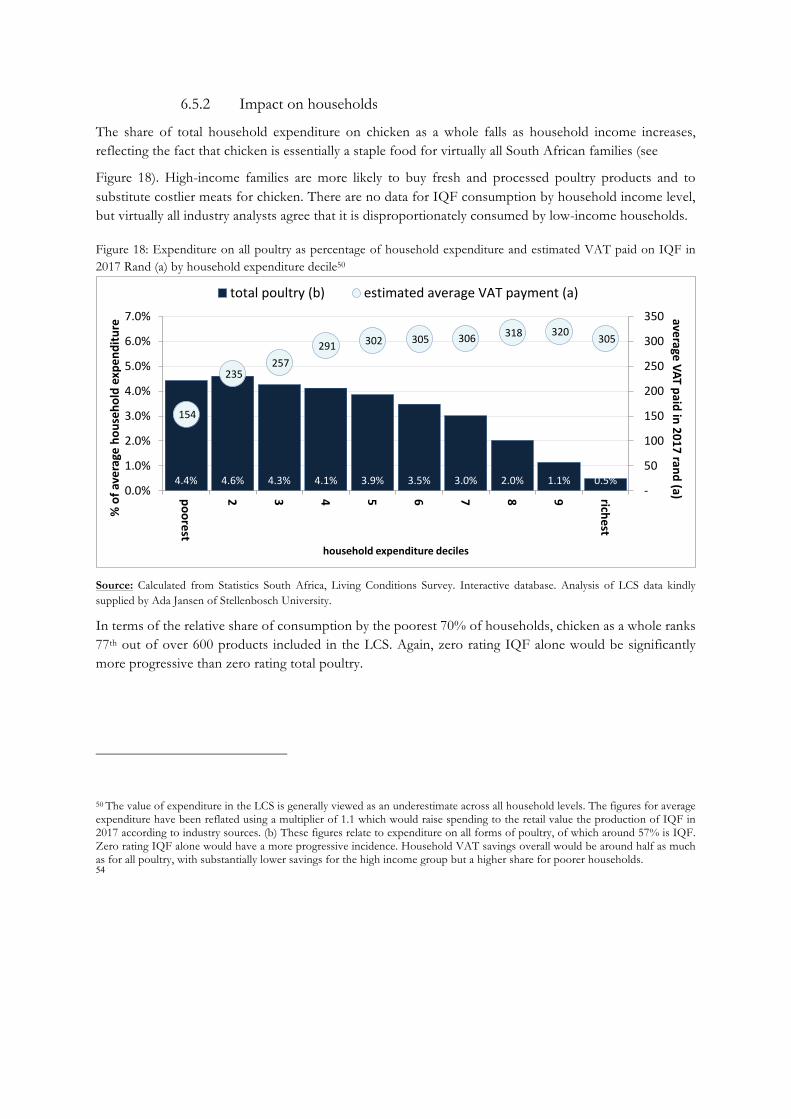
54
6.5.2 Impact on households
The share of total household expenditure on chicken as a whole falls as household income increases, reflecting the fact that chicken is essentially a staple food for virtually all South African families (see
Figure 18). High-income families are more likely to buy fresh and processed poultry products and to substitute costlier meats for chicken. There are no data for IQF consumption by household income level, but virtually all industry analysts agree that it is disproportionately consumed by low-income households.
Figure 18: Expenditure on all poultry as percentage of household expenditure and estimated VAT paid on IQF in 2017 Rand (a) by household expenditure decile50
Source: Calculated from Statistics South Africa, Living Conditions Survey. Interactive database. Analysis of LCS data kindly supplied by Ada Jansen of Stellenbosch University.
In terms of the relative share of consumption by the poorest 70% of households, chicken as a whole ranks 77th out of over 600 products included in the LCS. Again, zero rating IQF alone would be significantly more progressive than zero rating total poultry.
50 The value of expenditure in the LCS is generally viewed as an underestimate across all household levels. The figures for average expenditure have been reflated using a multiplier of 1.1 which would raise spending to the retail value the production of IQF in 2017 according to industry sources. (b) These figures relate to expenditure on all forms of poultry, of which around 57% is IQF. Zero rating IQF alone would have a more progressive incidence. Household VAT savings overall would be around half as much as for all poultry, with substantially lower savings for the high income group but a higher share for poorer households.
4.4% 4.6% 4.3% 4.1% 3.9% 3.5% 3.0% 2.0% 1.1% 0.5%
154
235257
291 302 305 306 318 320 305
-
50
100
150
200
250
300
350
0.0%
1.0%
2.0%
3.0%
4.0%
5.0%
6.0%
7.0%
poorest
2 3 4 5 6 7 8 9 richest
averageVATpaidin2017rand(a)%ofa
veragehou
seho
ldexpen
diture
householdexpendituredeciles
totalpoultry(b) estimatedaverageVATpayment(a)

55
6.5.3 Merit
Chicken is the largest staple protein for low-income households. From a nutritional and environmental standpoint, it is preferable to red meat and dairy. Fish is prohibitively expensive for low-income families. That said, concerns were raised by some Panel members that zero rating IQF chicken could have a perverse impact on domestic production, both enabling dominant firms to capture the benefits of lower taxes and effectively subsidising imports.
First, in the domestic market, poultry production is dominated by two main players – Rainbow Chicken Limited (RCL) and Astral Foods. The dominance enjoyed by these players has been subject to abuse in the past, bringing into question whether zero rating would indeed be passed on to low income consumers, or captured in the value chain. For instance, in 2012, the Competition Commission reached a settlement with Astral regarding its actions in fixing the price of fresh poultry in the Western Cape, the fixing of trading conditions (through the supply of parent breeding stock in its joint venture with Elite) and the abuse of dominance. There is no indication that such market conduct would not recur were IQF parts to be zero rated.
Second, since 2010, imports have accounted for a rising share of consumption growth. This is also borne out in joint 2016 study by the Industrial Development Corporation (IDC), the National Agricultural Marketing Council and the Bureau for Food and Agricultural Policy (BFAP). Imports, despite accounting for only approximately 20% of domestic consumption, have increased rapidly over the recent years51, as can be seen in the figure below. Arguably the increase in chicken imports explains the relatively low increases in prices in recent years, with chicken prices largely tracking the CPI. In contrast the prices of red meat, where import competition is limited, have risen well above inflation for the past decade.
51 National Agricultural Marketing Council, IDC and BFAP (2016) Evaluating the Competitiveness of the South African broiler value chain
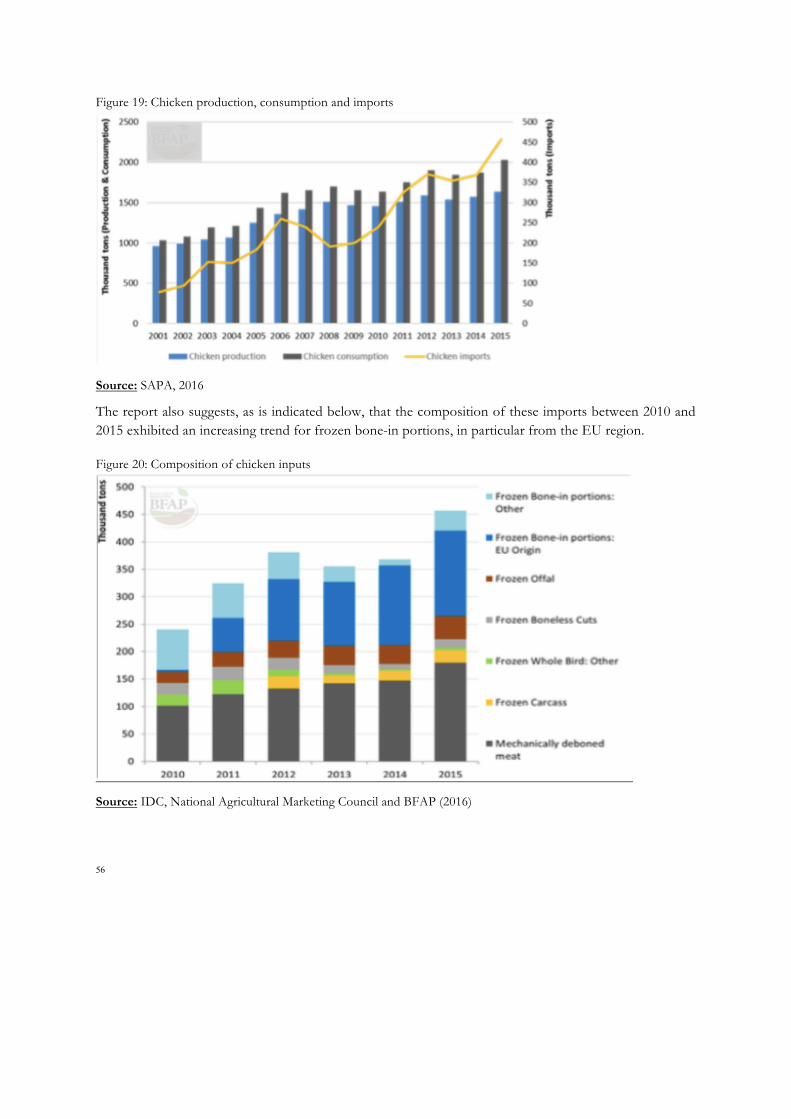
56
Figure 19: Chicken production, consumption and imports
Source: SAPA, 2016
The report also suggests, as is indicated below, that the composition of these imports between 2010 and 2015 exhibited an increasing trend for frozen bone-in portions, in particular from the EU region.
Figure 20: Composition of chicken inputs
Source: IDC, National Agricultural Marketing Council and BFAP (2016)

57
6.5.4 Foregone revenue
Statistics South Africa estimates final consumption of IQF chicken at R17 billion in 2016. By extension, zero rating IQF chicken would cost the fiscus R2.1 billion in foregone VAT revenue. Zero rating all frozen chicken would cost over R1 billion more. The cost of zero rating IQF alone would equal around 10% of the anticipated increase in VAT revenue, and 0.15% of total anticipated tax revenues. The cost in terms of foregone VAT could however climb over time because high-income households might switch to IQF if it is zero rated, although generally they consider it less desirable in terms of quality and convenience.
The figures for VAT foregone from zero rating should be reduced by the value of sales to fast-food outlets. Statistics are not available on fast-food purchases of chicken either in total or for only IQF portions, but the amount is likely relatively small. Around half of fast-food outlets specialise in chicken. Rough estimates suggest these franchises absorb around 5% of total chicken produced, but they often have dedicated suppliers (such as the dominant players in the value chain, Rainbow Chicken Limited (RCL) and Astral Foods) and do not use IQF products.
6.6 Sanitary pads
6.6.1 Definitional issues
Sanitary pads and tampons refer to products used by women when they are menstruating. For brevity, this document will refer to both products as sanitary products. Sanitary products are well defined for VAT purposes, so zero rating them should not be excessively difficult.
6.6.2 Impact on households
The LCS finds that expenditure on sanitary pads is fairly flat for the poorest 80% of households, then falls sharply. It is close to 0.05% of expenditure (that is, five thousandths of total expenditure) for the poorest 80% of households, although the percentage spent rises slightly for higher income households in this group. It drops sharply for the richest quintile, falling to 0.02% of household expenditure for the richest decile. In Rand terms, expenditure by the highest decile is ten times that of the poorest decile.

58
Figure 21: Expenditure on sanitary products as percentage of household expenditure and estimated VAT paid in 2017 Rand (a) by household expenditure decile
Source: Calculated from Statistics South Africa, Living Conditions Survey. Interactive database. Analysis of LCS data kindly supplied by Ada Jansen of Stellenbosch University.
Currently, higher prices for sanitary products due to VAT presumably constrain demand from low-income women. It follows that, in the longer run, zero rating them could lead to higher demand from poor households. That would make the impact of zero rating more progressive over time.
6.6.3 Foregone revenue
Statistics South Africa estimates sales of sanitary pads and tampons, including VAT, at R907 million in 2016, which would equal R1 billion in 2017 terms. The foregone revenue from zero rating would come to around R120 million. The LCS figure for consumption of sanitary products appears to be 50% understated. If we scale the figures for households up to the Statistics South Africa figure, zero rating sanitary pads would provide tax relief of approximately R75 million for households in deciles 1 to 7 (in 2018 prices). Ideally, the estimate for VAT foregone from zero rating would be reduced by the value of provision through the public health sector, for instance in hospitals and clinics. No estimate was available for the extent of this supply, however.
6.6.4 Merit
As a rule, women between around 13 and 55 need some form of sanitary product on a monthly basis except when they are pregnant. If they cannot afford commercial products, they must use alternatives that are typically far less convenient, efficient or hygienic. From this standpoint, levying VAT on sanitary products makes women pay additional taxes compared to men based on their biology.
0.047%
0.061%0.055%
0.066%
0.053%
0.067%
0.056%0.048%
0.041%
0.021%10
22 23
35 3442 40
60
80
98
-
10
20
30
40
50
60
70
80
90
100
0.00%
0.02%
0.04%
0.06%
0.08%
0.10%
poorest 2 3 4 5 6 7 8 9 richest
Expenditurein2017rand(a)%ofa
veragehou
seho
ldexpen
diture
%ofhhexpenditure expenditurein2017rand

59
The LCS findings suggest that in poor households, women cannot afford to buy all the sanitary products they require. In terms of its reported expenditure, women in the poorest 70% of households meet only 8% of their needs for sanitary products. The following graph compares expenditure reported in the LCS per woman by decile with the sum required to fully meet the needs of women aged 13 to 55. The share of women in this age group varies by decile from 30% to 33% of the total number of household members, with the highest share in the eighth decile.
Figure 22: Average household expenditure required to meet the need for sanitary pads of women aged 13 to 55 compared to reported expenditure by expenditure decile, in 2017 Rand52
Source: Calculated from Statistics South Africa. Labour Conditions Survey. Electronic database. Downloaded from Nesstar facility in May 2018. Series on gender, age and expenditure on sanitary pads by expenditure decile. Data on actual expenditure by decile kindly provided by Ada Jansen of Stellenbosch University.
The economic and social costs to women of inadequate access to commercial sanitary pads are obviously high, but difficult to quantify. Alternatives to commercial pads all require cleaning and care, often make it harder to move freely, and do not protect clothing as well. There is no question that women face a host of unfair obstacles to advancement in education and work, as well as often ending up with substantial care burdens in the family. In these circumstances, measures to improve their living conditions and reduce barriers to engagement in society must be given substantial weight. In effect, the externalities of promoting women’s advancement should be taken into account in weighing the costs and benefits of zero rating.
52 Reflated with CPI. Estimated at R1,50 per pad or tampon, and a requirement of 20 a month.
-
50
100
150
200
250
300
350
400
450
500
poorest 2 3 4 5 6 7 8 9 richest
Rand
required reported
60
6.6.5 Recommendations
The data above show that zero rating sanitary products will have only a limited impact on improving women’s access to sanitary products in low-income households. The Panel thus recommends that sanitary products be zero rated, but this should be done together with the provision of free access to sanitary products for low-income women.
6.7 Nappies
6.7.1 Definitional issues
The word diaper originally referred to the type of cloth rather than its use; "diaper" was the term for a pattern of repeated, diamond shapes, and later came to describe a white cotton or linen fabric with this pattern (Webster, 2013). This has over time been used to refer to the disposable napkin. The word nappy is a diminutive form of the word napkin and is often used to refer to cloth diapers.
An adult nappy is a diaper made to be worn by a person with a body larger than that of an infant or toddler. Diapers can be necessary for adults with various conditions, such as incontinence, mobility impairment, severe diarrhoea or dementia. Adult diapers are made in various forms, including those resembling traditional child diapers, underpants, and pads resembling sanitary products (incontinence pads).
In the medical community, professionals are trained to use alternative terms such as “briefs” rather than “diapers” for the sake of dignity, as the term “diapers” is associated with children and therefore may have a negative connotation. Most health care workers are accustomed to calling them diapers, especially those that resemble children’s diapers.
6.7.2 Merit
According to Unicef, an average of 1.1 million births are recorded in South Africa on an annual basis. A new born child is estimated to require a diaper change every 3 hours, consequently needing an average of 8 -10 disposable nappies per day. On an annual basis, infants would require 2,920 disposable diapers in their first year. The number of nappy changes decreases as a child grows up, with 2-year old children requiring approximately 3 diapers per day. Furthermore, infants up to the age of 3 years (or 36 months) on average use diapers before being taught to become independent.
A quick scan at the supermarket shelves and retail shops gives an indication of the high usage of the product. They are also more convenient especially when one is travelling or working hence preferred by most mothers as they are less bulky compared to the cloth ones. Disposable nappies are light and compact to carry. They are thrown away when they are dirty, which means no extra washing and no carrying of soiled nappies around in a changing bag. For single parents in poor communities, adding extra workloads in the form of washable reusable nappies can be an additional unwanted challenge. While cloth nappies are certainly an option for struggling families, most poor communities prefer disposable because of the lack of washing machines, electricity and water.

61
In day care, caregivers require the little ones to wear them as they can be changed with ease and are of high hygiene. Unlike the cloth nappies that take time to dry especially during rainy seasons, disposable diapers are always dry and available. Paediatricians also advice parents to use them so that the little ones can have undisturbed sleep with minimal interference especially at night as they do not require changing very often compared to cloth nappies.
In terms of adult nappies or briefs, people with medical conditions which cause them to experience urinary or faecal incontinence often require nappes or similar products because they are unable to control their bladders or bowels. People who are bedridden or in wheelchairs, including those with good bowel and bladder control, may also wear diapers because they are unable to access the toilet independently. Those with cognitive impairment, such as dementia, may require diapers because they may not recognise their need to reach a toilet.
Poor infrastructure and lack of funding have been blamed for water shortages in many parts of the country. According to StatsSA’s 2011 Census, 46.3% of households in South Africa have access to piped water and just over 85% have access to water that is of RDP-acceptable level. The level of access is, however, not reflected across all provinces in the country. In the Eastern Cape, for instance, 31% of households do not have access to water of a RDP-acceptable level while same is true for 27.2% of households in Limpopo. People living in drought-stricken parts of the country such as the Western Cape, have had little-to-no water. Disposable nappies provide are a more hygienic option.
Studies have shown that disposable diapers are associated with better hygiene. Research supports the premise that disposable diapers maintain skin health benefits and reduce the risk of diaper dermatitis. However, disposable nappies are also considered to be an environmental threat. Only some of the materials used in the nappies are biodegradable. Environmental concerns have been greatly affected by the residential and industrial expansion which has led to unplanned urbanization and demand for more land. This situation is aggravated by the fallen standards of urban services, increased pollution and increased health issues hence need for a new approach towards urban planning and management. The responsibility of waste management lies with the local authority that are generally financially, technically and institutionally weak. This includes a poor on site storage, lack of onsite separation facilities, poor or unavailable transport system, poor formal recycling practices and plants and lack of appropriate waste disposal sites hence leading to crude dumping and open burning of waste.
6.7.3 Foregone revenue
Whilst the size of the local adult nappy market is unclear, the local disposable nappy market is about R 2.4 billion in sales with over 1 billion nappies sold in South Africa. The average baby uses at least 10 diapers per day for an average of two years. Statistics South Africa however estimates 2016 sales at R5.3 billion. At that rate, nappies would cost the fiscus R795 million in foregone VAT revenue, of which the first four deciles would gain relief of about 40% compared to the decile 8 to 10 at 29%. According to the LCS, zero rating nappies would provide tax relief of approximately R538 million (71% of the total VAT relief) to households in deciles 1 to 7 (in 2018 prices). Administratively, zero rating nappies should not be costly.

62
Figure 23: VAT paid (in Rand million at 15%)
35
63
9186
72 7369
61
82
53
0
10
20
30
40
50
60
70
80
90
100
poorest 2 3 4 5 6 7 8 9 richest

63
7 Recommendations
7.1 Items recommended for zero rating Based on its analysis, the Panel recommend that the following items are zero rated.
7.1.1 White bread, bread flour and cake flour.
The Panel recommends that white bread, bread flour and cake flour be added to the list of zero-rated food items.
7.1.2 Sanitary products
The Panel was unanimous in its proposal that sanitary products be zero rated. Despite the fact that sanitary products do not meet all of the criteria, as outlined in Table 2, there are overwhelming merit reasons to zero rate sanitary products, outlined in section 6.6.4, to address the unfair gender tax currently imposed on sanitary products through the imposition of VAT. However, merely zero rating sanitary products does not address the fact that many women will still be unable to afford them even when zero rated, and the Panel urges the government in the strongest terms to expedite the delivery of free sanitary pads to the poor.
7.1.3 School Uniforms
The Panel is of the view that there is a good case for zero rating school uniforms, notwithstanding the important definitional issues. This could, however, only be done after further investigations to address the complexities that we have raised in section 6.3.
7.1.4 Nappies
The Panel recommends zero rating nappies for babies, cloth nappies and adult nappies.
7.1.5 Cost estimates for zero rating recommendations
The cost estimate for these proposals calculated from the LCS is displayed in Table 16, below. The total cost is estimated at R4.0 billion. This would provide VAT relief to households in deciles 1 to 7 of approximately R2.8 billion.

64
Table 16: Revenue cost of zero rating proposals (R million in 2018 prices, adjusted for LCS undercount53)
Item poorest 2 3 4 5 6 7 8 9 richest Total
White bread 96 150 158 182 186 212 237 222 203 135 1 779 School uniform 55 65 64 59 54 55 60 61 82 67 621
Sanitary towels and tampons
2 6 6 9 9 11 10 15 20 24 111
Bread flour 17 27 23 24 20 15 11 8 6 5 153
Cake flour 47 77 81 83 71 57 59 48 42 26 588
Disposable nappies
39 69 100 95 79 80 76 67 90 58 754
Total 255 393 431 450 418 430 452 421 442 314 4 006
Source: Calculated from Statistics South Africa, Living Conditions Survey. Interactive database. Analysis of LCS data kindly supplied by Ada Jansen of Stellenbosch University.
7.2 Items not recommended for zero rating
7.2.1 Baby food (predominantly milk)
Given the arguments presented by the Department of Health, the sub-committee does not recommend the zero rating of infant formula. There is insufficient evidence to recommend zero rating infant formula on financial grounds of progressivity.
7.3 Disagreement on other items The Panel was unable to come to consensus regarding the IQF poultry parts. The majority of Panel members argued that IQF chicken should not be zero rated.
The arguments against zero rating IQF parts centre on the following.
1. Some Panel members argued that the definition is not sufficiently rigorous to avoid the inclusion of other poultry products by retailers and producers, which would inflate the cost to the fiscus without substantial benefit to lower-income households.
2. The cost in terms of foregone VAT would be relatively high. 3. Zero rating could encourage imports of IQF chicken, while the benefits would likely be captured
by highly concentrated local producers rather than low-income households. 4. Nutritional programmes could help offset the higher cost to low-income households more
efficiently.
The arguments in favour of zero rating IQF parts are the following.
53 See Table 9 for a discussion on scaling methodology.
65
1. It is a staple food for low-income households, so measures to hold down the price would be desirable even if that entails a significant share of imports (currently around 25%).
2. Zero rating would have a progressive impact. 3. Some panel members argued that the definition is sufficiently rigorous and easy to monitor,
since IQF differs visually from other forms of frozen and processed chicken, and is a well-known industry and statistical category.

66
8 Alternative ways to mitigate the VAT increase Paragraph 2.3 of the Terms of Reference for the independent panel of experts for the review of the current list of VAT zero-rated food items also requested the panel: “To explore whether the outcome of zero rating of food items cannot be better achieved by a government expenditure programme; whether a government expenditure programme is more efficient in targeting poor and lower income households than the zero rating of food items; and whether specific current government programmes as determined by or agreed with National Treasury, can be better tailored to achieve the same or a better outcome than the zero rating of food items.”
As demonstrated above, VAT zero rating results in a reduction in the tax paid by all households, not just poorer households, making this a blunt instrument for the pursuit of equity objectives. Its bluntness stems from the fact that tax relief measures implemented through zero rating mostly benefit, in absolute (Rand) terms, those who consume the most, i.e. those who belong to the higher-ranking deciles of the expenditure distribution. In effect, VAT zero rating is the equivalent of a non-targeted subsidy.
Based on the adjusted LCS data, the total cost of the VAT increase to the poorest 70% of households comes to R3.1 billion in 2018 Rands, or an average of R267 per household a year. For the poorest 50%, the aggregate cost is R1,8 billion, or just under R216 per household.
Figure 24. Cost of the increase in VAT by household expenditure decile, total and average per household (in 2018 Rand terms)
Source: Calculated from Statistics South Africa, Living Conditions Survey. Interactive database. Analysis of LCS data kindly supplied by Ada Jansen of Stellenbosch University.
0.18 0.27 0.33 0.40 0.45 0.53 0.660.94
1.60
3.56
105 163 201 238 273 321 395568
964
2140
-
500
1000
1500
2000
2500
3000
3500
4000
-
0.50
1.00
1.50
2.00
2.50
3.00
3.50
4.00
poorest 2 3 4 5 6 7 8 9 richest
randbillion
sof2
018rand
totalcostinRbns averagecostperhouseholdinrand(rightaxis)

67
Taken together, the products the Panel proposed for zero rating would cost the fiscus around R4,0 billion in total, using the adjusted LCS data. Of that, the poorest 50% of households would see benefits equal to R1.9 billion, and the poorest 70% would get R2,8 billion in relief (at 2018 prices). This section outlines, in turn, in-kind support programmes (that is, programmes that provide goods and services such as food, housing and education) and cash-transfer options.
Potential candidates as alternative relief measures are interventions that increase the disposable income of the poor and low-come households – these can take the form of cash grants or in-kind relief, such as the direct provision of food to the needy. The government has already implemented a number of initiatives that are pro-poor that focus on improved nutrition and food security. The effectiveness of these programme can be improved and a number of them could be up-scaled.
Possible alternatives to VAT zero rating could include:
• Lower positive VAT rates on some items • Increases in all the monthly social grants, including the old age social pension • Food vouchers – where cash grants might not be feasible or practical • Upscaling the various feeding schemes (e.g. the National Schools Feeding Scheme, including
pre-school (ECD)) • The provision of free sanitary pads to girls and poor women.
8.1 In-kind support programmes National government transfers a large share of tax revenue to the poor amongst others through nutritional support; provision of subsidised housing; greater subsidies to education in low-income areas; public employment schemes; and the provision of free healthcare for low-income families.
Using in-kind support programmes to mitigate the impact of the VAT increase on the poorest 50% would require an expansion in these programmes
• by R1.8 billion above the amount they would have grown in any case, as measured for instance by the MTEF projections; and
• in ways that ensure virtually all households in the poorest seven deciles benefit.
The Panel did not have sufficient time to analyse all of the in-kind support programmes available or desirable. We here review nutritional support programmes and the provision of sanitary products.
8.2 Nutritional support
There a number of government policy documents that elaborates on the South African Government’s initiatives with regard to improved nutrition and food security. The latest draft policy paper (2017) list the strategic objectives of the NFNSP (National Food and Nutrition Security Plan for South Africa 2018 - 2023) as:
68
• Establish a multi-sectoral Food and Nutrition Security Council to oversee alignment of policies, coordination and implementation of programmes and services which address food and nutrition security.
• Establish inclusive local food value chains to support access to nutritious and affordable food. • Expand targeted social protection measures and sustainable livelihood programmes • Scale up high impact nutrition interventions targeting women, infants and children. • Influence people across the life-cycle to make informed food and nutrition decisions through
an integrated communications strategy. • Develop a monitoring and evaluation system for FNS, including an integrated risk
management system for monitoring FNS related risks.
One example which are already being implemented and referred to in the above document is the National School Nutrition Programme (NSNP) which reaches over nine million learners to primary and secondary schools in poor communities throughout the country. It aims to improve both nutritional and educational outcomes through addressing short term hunger and thereby also improving concentration in class by providing at least one meal per day. While no rigorous evaluation of the NSNP has been conducted54, studies have found a positive effect on children’s nutritional status, their school attendance and educational performance.
Current expenditure on NSNP comes to R6,4 billion. Increasing it to compensate for the VAT increase for the poorest 50% of households would thus require that its expenditure grow by around a third. That said, the Panel did not have data on what share of children the programme reaches per household expenditure decile. Overall, the programmes reached almost three quarters of learners in ordinary public schools. In addition, the programme does not reach households without school-going children
There are several ways in which the programme could be strengthened if additional resources were available. For example, currently less than half of NSNP schools have a food garden, despite evidence that school food gardens “can increase children’s consumption of fruit and vegetables and function as outdoor classrooms”55. The roll-out of the other initiatives as part of the NFNSP will require considerable additional resources and will take some time to be realised.
54 Devereux et al. (June 2018), “School Feeding in South Africa: What we know, what we don’t know, what we need to know, what we need to do” Food Security SA Working Paper Series No. 004. DST-NRF Centre of Excellence in Food Security, South Africa.
55 Ibid.

69
8.3 Provision of sanitary products As discussed above in section 7.1.2, the zero rating of sanitary products may not result in a sufficiently large price reduction to make them affordable to the poor. It is therefore proposed that sanitary products should be made available to all poor girls and women through a programme on the expenditure side of the budget.
While it sounds straightforward to provide free sanitary products (for example through schools and government clinics), in practice the state has been unable to deliver on this, despite commitments going back at least seven years. In the 2011 State of the Nation Address56, President Zuma announced the free provision of sanitary products to indigent women. In September 2017, the Department of Women reported that “there is currently no national policy guiding the provision of sanitary products to indigent persons. As a result, the provision of sanitary products is inconsistent, uncoordinated and would seem to depend on provincial priorities.”57
The inability of government to design, fund and implement a programme that would procure and distribute readily available, non-perishable items through an existing network of distribution points demonstrates the need for a significant upscaling of the capacity of government to implement pro-poor policies where deemed necessary as a compensatory mechanism for the VAT increase.
Providing an average of 20 sanitary pads every month for woman aged 13 to 55 in households in the poorest 50% of households would cost around R240 per household, or a total of R2.6 billion. For the poorest 70%, the cost would come to a total of R3.2 billion. The average relief per household would average R315 per annum for the poorest 50% of households but actual relief would vary depending on the number of women in a household.
The panel therefore strongly recommended that the roll-out of free sanitary products be given a higher priority as the zero rating of these products will befit mostly those in the middle and upper income groups. It is the view of many panel members that the zero rating of sanitary products is proposed largely on gender equity grounds but that this gesture on its own will not be sufficient to ensure that the needs of the poor are adequately catered for in this instance.
8.4 Cash transfer programmes The national government has a number of systems that register poor individuals and have the capacity to transfer cash payments to them. The largest by far are the systems for social grants and the Unemployment Insurance Fund (UIF). The challenge however is that:
56 http://www.sahistory.org.za/archive/2011-president-zuma-state-nation-address-10-february-2011
57 http://pmg-assets.s3-website-eu-west-1.amazonaws.com/180612Sanitary_Dignity_Policy.pdf

70
• Except for social grants, many of those registered never have to receive payments from these systems - most of those who pay for UIF do not have to claim;
• The systems do not indicate household income, so although they provide broad coverage of most low-income households, they would not permit transfers equal to the average payment per decile;
• Household expenditure patterns vary substantially, so providing households with an amount more or less equal to the average cost of VAT for the poor would overcompensate some and undercompensate others; and
• Informal workers and self-employed people do not pay either UIF or tax, so they are not included in these systems. Most, however, belong to households to get some kind of social grant.
We here review the social grant and UIF systems.
8.4.1 The Social Grants System
South Africa has an extensive system of social assistance with almost half of all households receiving some form of grant. Social grants are targeted at categories of individuals who generally face particular obstacles in providing for their own needs, namely the elderly, the disabled and children – essentially the “deserving poor”. Working-age adults who are not disabled are not eligible for any social grants, but often benefit indirectly from cash transfers to other people in their households.
Over the past decade, the number of social-grant beneficiaries had grown by 44% from 12.0 million in 2007/08 to 17.2 million in 2017/18 (National Treasury, 2018), largely due to the change in the age eligibility rules of the child support grant. Currently, roughly one in three South Africans receives a cash transfer. According to World Bank data, South Africa has the second-largest share of households receiving state transfers in the world (after Iran).
Table 17: Cash transfers, 2018/19 fiscal year Average monthly value of the
grant (p.m.) Number of beneficiaries (thousands)
Annual expenditure (in R millions)
Child Support Grant R405 12 402 60,631 State Old Age Pension
R1 695 (R1 715 if over 75) 3 513 76,751
Disability Grant R1 695 1 050 22,105 Foster Care Grant R960 398 5,132 Care Dependency Grant
R1 695 160 3,138
Source: National Treasury (2018) As shown in Table 18, the grants are well-targeted, with four-fifths of households in the poorest decile receiving some form of grant versus less than one in ten households in the richest decile. The grants are the main source of income for about one-fifth of households. That said, they are not sufficient to lift households out of poverty by themselves – the old-age pension and disability grants equal 2.7 times Statistics South Africa’s food poverty line (that is, they would buy sufficient food and not much else for 2.7 people), while the child support grant provides around two thirds of the food poverty line.
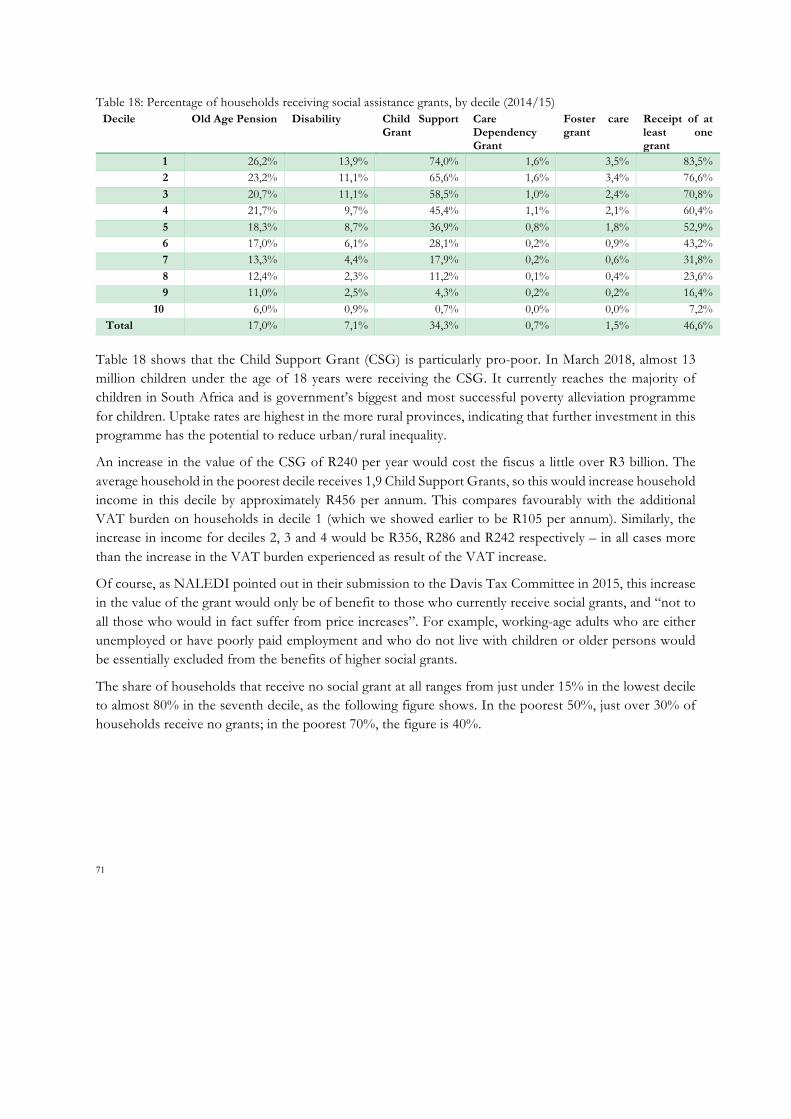
71
Table 18: Percentage of households receiving social assistance grants, by decile (2014/15) Decile Old Age Pension Disability Child Support
Grant Care Dependency Grant
Foster care grant
Receipt of at least one grant
1 26,2% 13,9% 74,0% 1,6% 3,5% 83,5% 2 23,2% 11,1% 65,6% 1,6% 3,4% 76,6% 3 20,7% 11,1% 58,5% 1,0% 2,4% 70,8% 4 21,7% 9,7% 45,4% 1,1% 2,1% 60,4% 5 18,3% 8,7% 36,9% 0,8% 1,8% 52,9% 6 17,0% 6,1% 28,1% 0,2% 0,9% 43,2% 7 13,3% 4,4% 17,9% 0,2% 0,6% 31,8% 8 12,4% 2,3% 11,2% 0,1% 0,4% 23,6% 9 11,0% 2,5% 4,3% 0,2% 0,2% 16,4% 10 6,0% 0,9% 0,7% 0,0% 0,0% 7,2% Total 17,0% 7,1% 34,3% 0,7% 1,5% 46,6%
Table 18 shows that the Child Support Grant (CSG) is particularly pro-poor. In March 2018, almost 13 million children under the age of 18 years were receiving the CSG. It currently reaches the majority of children in South Africa and is government’s biggest and most successful poverty alleviation programme for children. Uptake rates are highest in the more rural provinces, indicating that further investment in this programme has the potential to reduce urban/rural inequality.
An increase in the value of the CSG of R240 per year would cost the fiscus a little over R3 billion. The average household in the poorest decile receives 1,9 Child Support Grants, so this would increase household income in this decile by approximately R456 per annum. This compares favourably with the additional VAT burden on households in decile 1 (which we showed earlier to be R105 per annum). Similarly, the increase in income for deciles 2, 3 and 4 would be R356, R286 and R242 respectively – in all cases more than the increase in the VAT burden experienced as result of the VAT increase.
Of course, as NALEDI pointed out in their submission to the Davis Tax Committee in 2015, this increase in the value of the grant would only be of benefit to those who currently receive social grants, and “not to all those who would in fact suffer from price increases”. For example, working-age adults who are either unemployed or have poorly paid employment and who do not live with children or older persons would be essentially excluded from the benefits of higher social grants.
The share of households that receive no social grant at all ranges from just under 15% in the lowest decile to almost 80% in the seventh decile, as the following figure shows. In the poorest 50%, just over 30% of households receive no grants; in the poorest 70%, the figure is 40%.
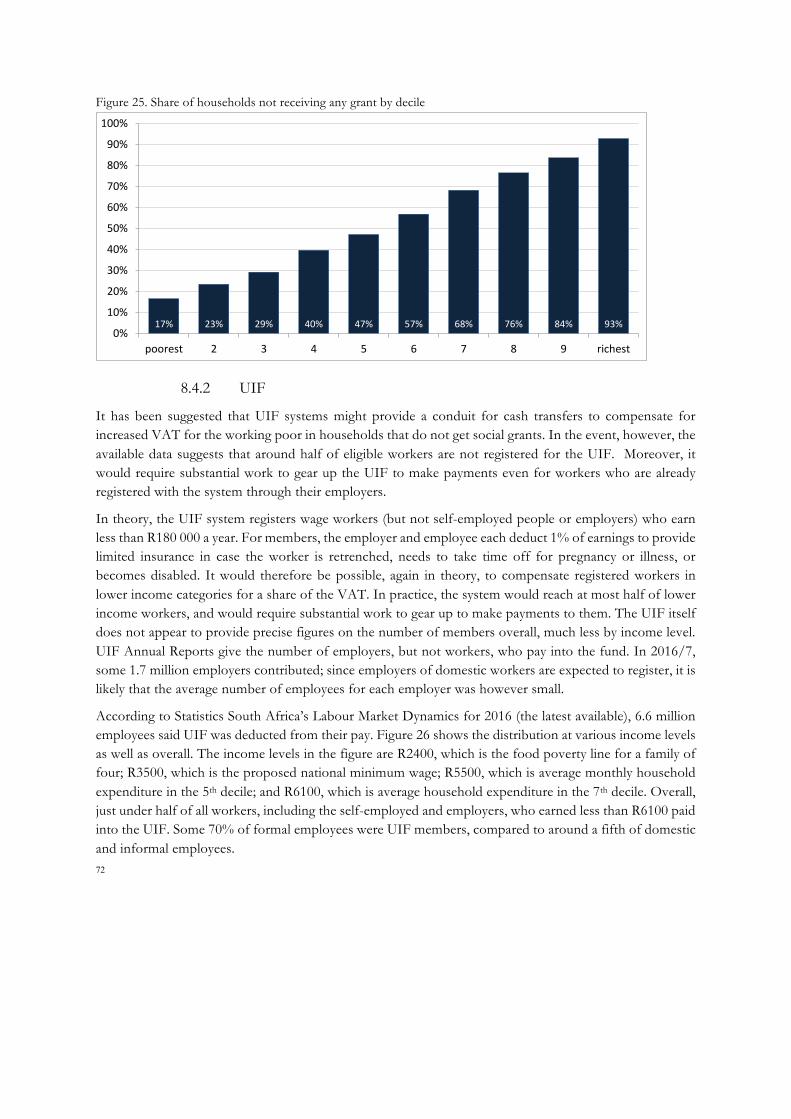
72
Figure 25. Share of households not receiving any grant by decile
8.4.2 UIF
It has been suggested that UIF systems might provide a conduit for cash transfers to compensate for increased VAT for the working poor in households that do not get social grants. In the event, however, the available data suggests that around half of eligible workers are not registered for the UIF. Moreover, it would require substantial work to gear up the UIF to make payments even for workers who are already registered with the system through their employers.
In theory, the UIF system registers wage workers (but not self-employed people or employers) who earn less than R180 000 a year. For members, the employer and employee each deduct 1% of earnings to provide limited insurance in case the worker is retrenched, needs to take time off for pregnancy or illness, or becomes disabled. It would therefore be possible, again in theory, to compensate registered workers in lower income categories for a share of the VAT. In practice, the system would reach at most half of lower income workers, and would require substantial work to gear up to make payments to them. The UIF itself does not appear to provide precise figures on the number of members overall, much less by income level. UIF Annual Reports give the number of employers, but not workers, who pay into the fund. In 2016/7, some 1.7 million employers contributed; since employers of domestic workers are expected to register, it is likely that the average number of employees for each employer was however small.
According to Statistics South Africa’s Labour Market Dynamics for 2016 (the latest available), 6.6 million employees said UIF was deducted from their pay. Figure 26 shows the distribution at various income levels as well as overall. The income levels in the figure are R2400, which is the food poverty line for a family of four; R3500, which is the proposed national minimum wage; R5500, which is average monthly household expenditure in the 5th decile; and R6100, which is average household expenditure in the 7th decile. Overall, just under half of all workers, including the self-employed and employers, who earned less than R6100 paid into the UIF. Some 70% of formal employees were UIF members, compared to around a fifth of domestic and informal employees.
17% 23% 29% 40% 47% 57% 68% 76% 84% 93%0%
10%
20%
30%
40%
50%
60%
70%
80%
90%
100%
poorest 2 3 4 5 6 7 8 9 richest
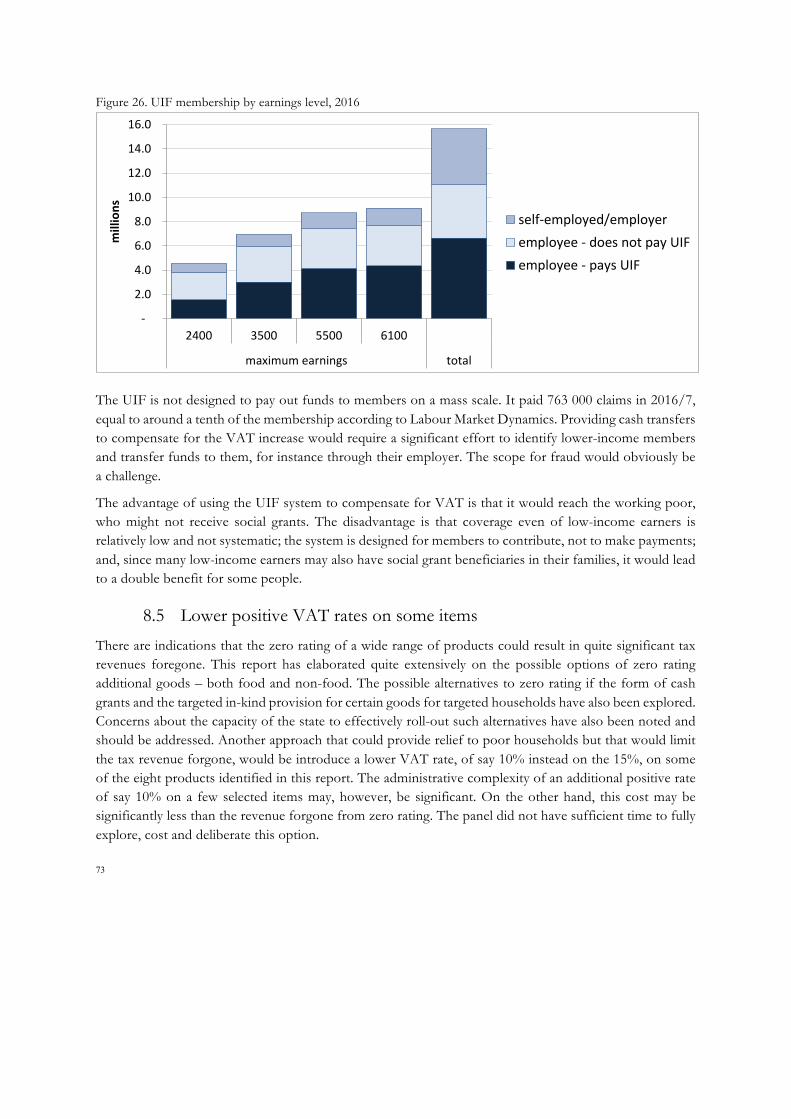
73
Figure 26. UIF membership by earnings level, 2016
The UIF is not designed to pay out funds to members on a mass scale. It paid 763 000 claims in 2016/7, equal to around a tenth of the membership according to Labour Market Dynamics. Providing cash transfers to compensate for the VAT increase would require a significant effort to identify lower-income members and transfer funds to them, for instance through their employer. The scope for fraud would obviously be a challenge.
The advantage of using the UIF system to compensate for VAT is that it would reach the working poor, who might not receive social grants. The disadvantage is that coverage even of low-income earners is relatively low and not systematic; the system is designed for members to contribute, not to make payments; and, since many low-income earners may also have social grant beneficiaries in their families, it would lead to a double benefit for some people.
8.5 Lower positive VAT rates on some items There are indications that the zero rating of a wide range of products could result in quite significant tax revenues foregone. This report has elaborated quite extensively on the possible options of zero rating additional goods – both food and non-food. The possible alternatives to zero rating if the form of cash grants and the targeted in-kind provision for certain goods for targeted households have also been explored. Concerns about the capacity of the state to effectively roll-out such alternatives have also been noted and should be addressed. Another approach that could provide relief to poor households but that would limit the tax revenue forgone, would be introduce a lower VAT rate, of say 10% instead on the 15%, on some of the eight products identified in this report. The administrative complexity of an additional positive rate of say 10% on a few selected items may, however, be significant. On the other hand, this cost may be significantly less than the revenue forgone from zero rating. The panel did not have sufficient time to fully explore, cost and deliberate this option.
-
2.0
4.0
6.0
8.0
10.0
12.0
14.0
16.0
2400 3500 5500 6100
maximumearnings total
millions
self-employed/employeremployee-doesnotpayUIFemployee-paysUIF
74
8.6 Conclusion: As a rule, experience shows that commitments to increase expenditure on poor households in return for increasing their taxes have been implemented only in part if at all. Moreover, neither in-kind programmes nor cash-transfer systems are designed to reach all poor households, and especially the working poor. In addition, as noted above, experience internationally indicates that in the long run, improving income distribution requires a strongly overall progressive incidence for taxation (although that does not mean that each individual tax instrument must be progressive), irrespective of the progressivity of government expenditure.
Nevertheless, the Panel is of the view that expenditure programmes have a role to play in mitigating the impact of the VAT increase on poor households. In theory, it would be cheaper to return the cost of the VAT increase to the poorest households than to extend zero rating. The challenge is to ensure that expenditure actually increases above the baseline, and that it is reaches the bulk of low-income households.

75
9 Appendix
9.1 Appendix 1 – List of submissions received
Table 19: List of submissions received Submissions on VAT Increase
No Society Comment
1 Individual Sanitary products
2 Individual Fibre
3 Individual Luxury Goods
4 Individual Chronic and Life Saving Medicines
5 Grain SA Sorghum and Sorghum Meal
6 Individual Low GI Bread
7 Red Meat Research and Development SA 8 Individual Query schedule of work of the Review Panel
9 Tiger Brands Sorghum and Oats
10 UCT Prescription medication
11 Individual Vat on property, Rent
12 Individual Complaint
13 Red Meat Industry Forum Red Meat / Animal Proteins
14 RPO National Red Meat
15 Individual Complaint
16 Pensioner Medicines and foodstuffs for the poor and pensioners
17 BXC Sanitary products
18 Individual VAT charges in rural shops
19 Tax Practitioner Comments on VAT rate: Complaint
20 Individual Sanitary products
21 Individual List of Various Items
22 Individual List of Various Items
23 Individual List of Various Items
24 Individual List of Various Items
25 Individual Sanitary products
26 Individual Water
27 Individual Environmentally friendly products
28 Individual List of Various Items
29 Individual List of Various Items
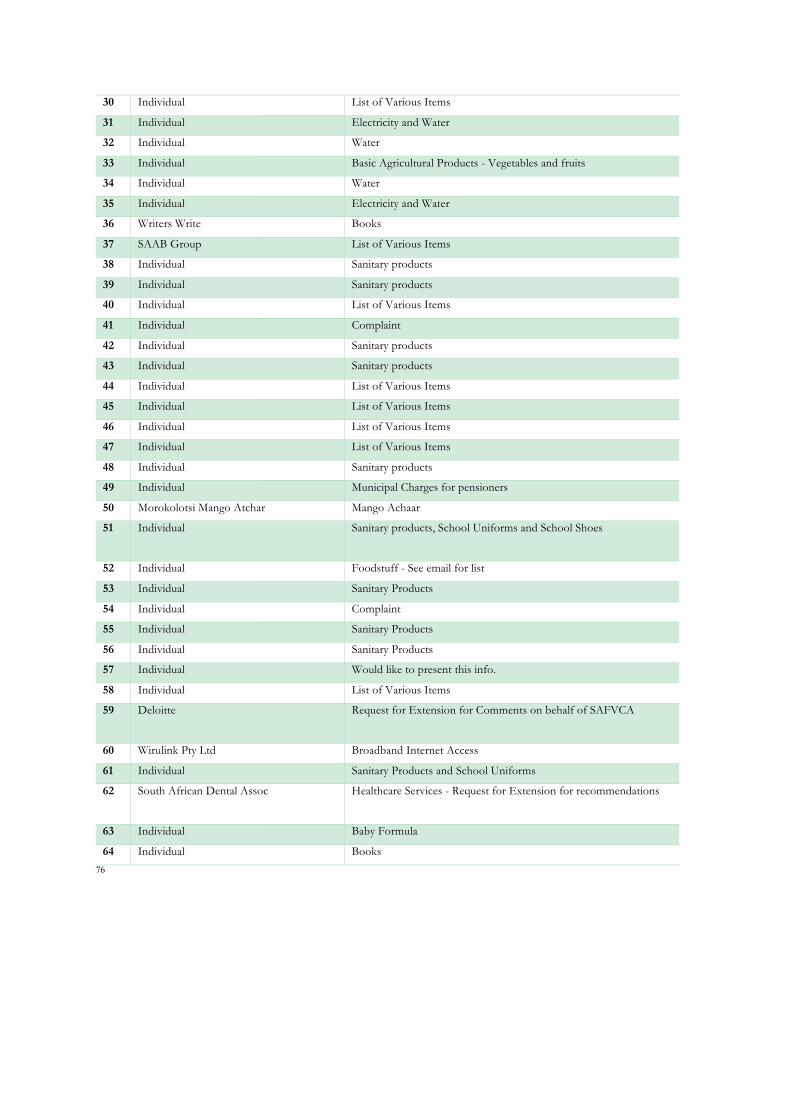
76
30 Individual List of Various Items
31 Individual Electricity and Water
32 Individual Water
33 Individual Basic Agricultural Products - Vegetables and fruits
34 Individual Water
35 Individual Electricity and Water
36 Writers Write Books
37 SAAB Group List of Various Items
38 Individual Sanitary products
39 Individual Sanitary products
40 Individual List of Various Items
41 Individual Complaint
42 Individual Sanitary products
43 Individual Sanitary products
44 Individual List of Various Items
45 Individual List of Various Items
46 Individual List of Various Items
47 Individual List of Various Items
48 Individual Sanitary products
49 Individual Municipal Charges for pensioners
50 Morokolotsi Mango Atchar Mango Achaar
51 Individual Sanitary products, School Uniforms and School Shoes
52 Individual Foodstuff - See email for list
53 Individual Sanitary Products
54 Individual Complaint
55 Individual Sanitary Products
56 Individual Sanitary Products
57 Individual Would like to present this info.
58 Individual List of Various Items
59 Deloitte Request for Extension for Comments on behalf of SAFVCA
60 Wirulink Pty Ltd Broadband Internet Access
61 Individual Sanitary Products and School Uniforms
62 South African Dental Assoc Healthcare Services - Request for Extension for recommendations
63 Individual Baby Formula
64 Individual Books
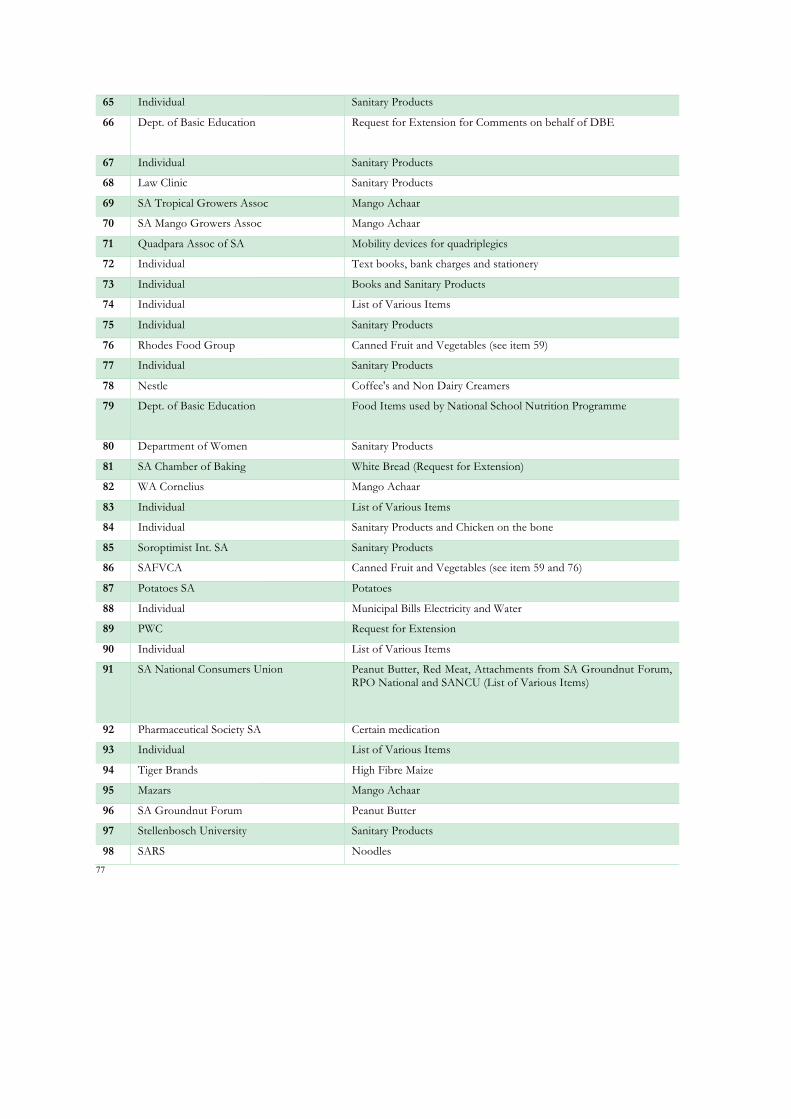
77
65 Individual Sanitary Products
66 Dept. of Basic Education Request for Extension for Comments on behalf of DBE
67 Individual Sanitary Products
68 Law Clinic Sanitary Products
69 SA Tropical Growers Assoc Mango Achaar
70 SA Mango Growers Assoc Mango Achaar
71 Quadpara Assoc of SA Mobility devices for quadriplegics
72 Individual Text books, bank charges and stationery
73 Individual Books and Sanitary Products
74 Individual List of Various Items
75 Individual Sanitary Products
76 Rhodes Food Group Canned Fruit and Vegetables (see item 59)
77 Individual Sanitary Products
78 Nestle Coffee's and Non Dairy Creamers
79 Dept. of Basic Education Food Items used by National School Nutrition Programme
80 Department of Women Sanitary Products
81 SA Chamber of Baking White Bread (Request for Extension)
82 WA Cornelius Mango Achaar
83 Individual List of Various Items
84 Individual Sanitary Products and Chicken on the bone
85 Soroptimist Int. SA Sanitary Products
86 SAFVCA Canned Fruit and Vegetables (see item 59 and 76)
87 Potatoes SA Potatoes
88 Individual Municipal Bills Electricity and Water
89 PWC Request for Extension
90 Individual List of Various Items
91 SA National Consumers Union Peanut Butter, Red Meat, Attachments from SA Groundnut Forum, RPO National and SANCU (List of Various Items)
92 Pharmaceutical Society SA Certain medication
93 Individual List of Various Items
94 Tiger Brands High Fibre Maize
95 Mazars Mango Achaar
96 SA Groundnut Forum Peanut Butter
97 Stellenbosch University Sanitary Products
98 SARS Noodles
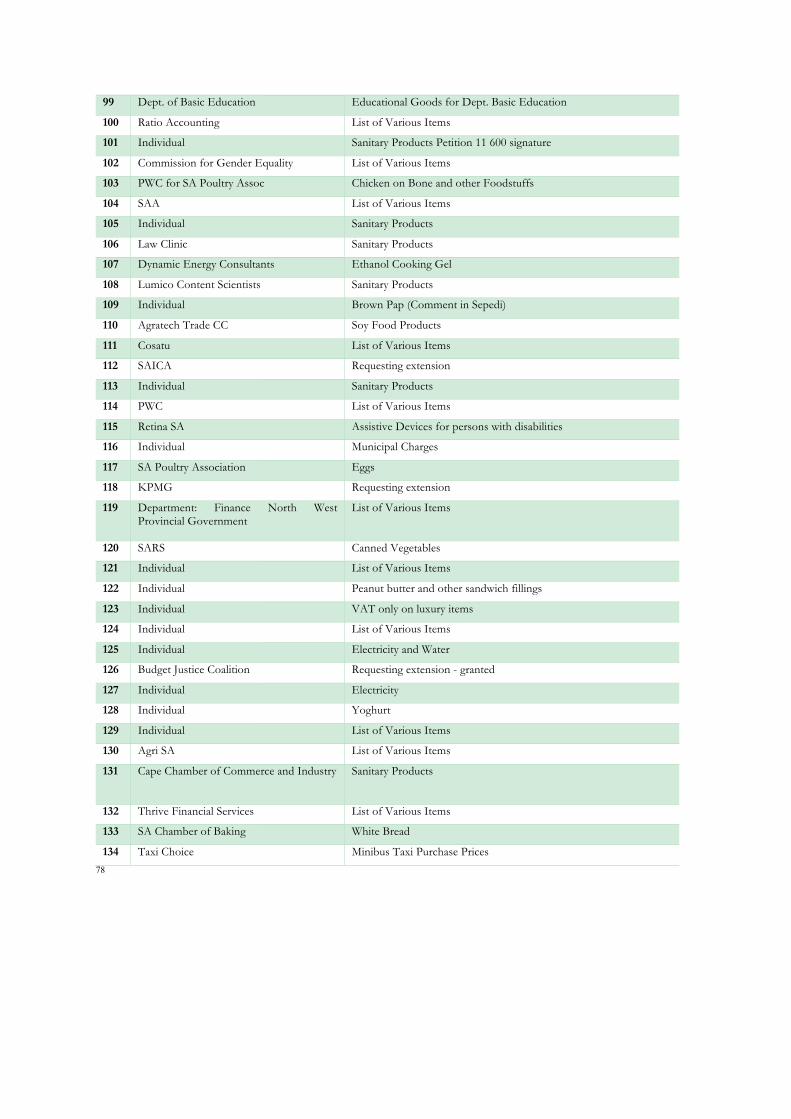
78
99 Dept. of Basic Education Educational Goods for Dept. Basic Education
100 Ratio Accounting List of Various Items
101 Individual Sanitary Products Petition 11 600 signature
102 Commission for Gender Equality List of Various Items
103 PWC for SA Poultry Assoc Chicken on Bone and other Foodstuffs
104 SAA List of Various Items
105 Individual Sanitary Products
106 Law Clinic Sanitary Products
107 Dynamic Energy Consultants Ethanol Cooking Gel
108 Lumico Content Scientists Sanitary Products
109 Individual Brown Pap (Comment in Sepedi)
110 Agratech Trade CC Soy Food Products
111 Cosatu List of Various Items
112 SAICA Requesting extension
113 Individual Sanitary Products
114 PWC List of Various Items
115 Retina SA Assistive Devices for persons with disabilities
116 Individual Municipal Charges
117 SA Poultry Association Eggs
118 KPMG Requesting extension
119 Department: Finance North West Provincial Government
List of Various Items
120 SARS Canned Vegetables
121 Individual List of Various Items
122 Individual Peanut butter and other sandwich fillings
123 Individual VAT only on luxury items
124 Individual List of Various Items
125 Individual Electricity and Water
126 Budget Justice Coalition Requesting extension - granted
127 Individual Electricity
128 Individual Yoghurt
129 Individual List of Various Items
130 Agri SA List of Various Items
131 Cape Chamber of Commerce and Industry Sanitary Products
132 Thrive Financial Services List of Various Items
133 SA Chamber of Baking White Bread
134 Taxi Choice Minibus Taxi Purchase Prices
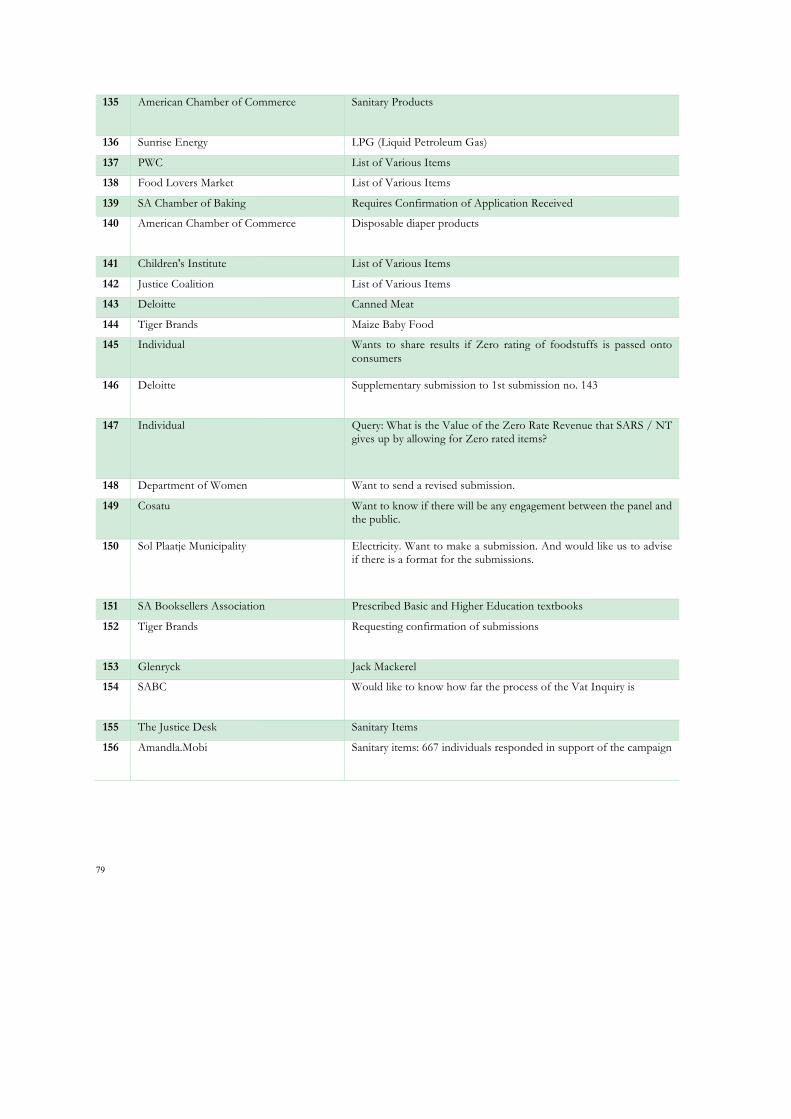
79
135 American Chamber of Commerce Sanitary Products
136 Sunrise Energy LPG (Liquid Petroleum Gas)
137 PWC List of Various Items
138 Food Lovers Market List of Various Items
139 SA Chamber of Baking Requires Confirmation of Application Received
140 American Chamber of Commerce Disposable diaper products
141 Children's Institute List of Various Items
142 Justice Coalition List of Various Items
143 Deloitte Canned Meat
144 Tiger Brands Maize Baby Food
145 Individual Wants to share results if Zero rating of foodstuffs is passed onto consumers
146 Deloitte Supplementary submission to 1st submission no. 143
147 Individual Query: What is the Value of the Zero Rate Revenue that SARS / NT gives up by allowing for Zero rated items?
148 Department of Women Want to send a revised submission.
149 Cosatu Want to know if there will be any engagement between the panel and the public.
150 Sol Plaatje Municipality Electricity. Want to make a submission. And would like us to advise if there is a format for the submissions.
151 SA Booksellers Association Prescribed Basic and Higher Education textbooks
152 Tiger Brands Requesting confirmation of submissions
153 Glenryck Jack Mackerel
154 SABC Would like to know how far the process of the Vat Inquiry is
155 The Justice Desk Sanitary Items
156 Amandla.Mobi Sanitary items: 667 individuals responded in support of the campaign
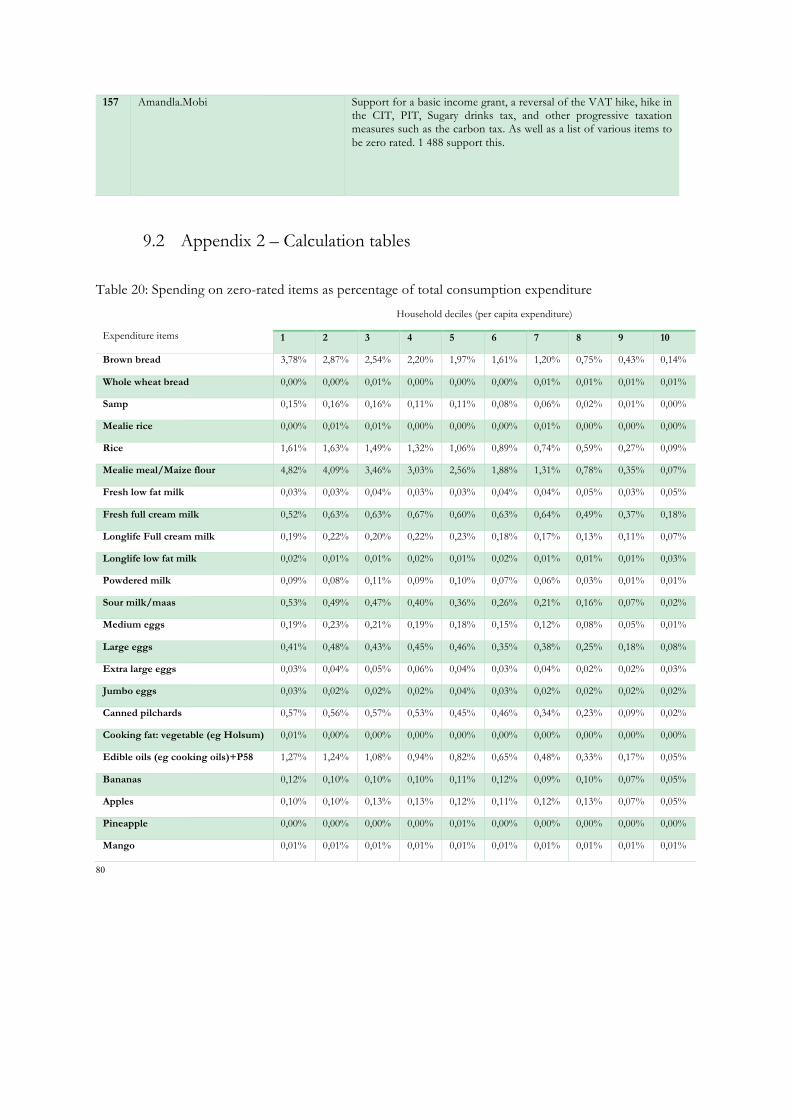
80
157 Amandla.Mobi Support for a basic income grant, a reversal of the VAT hike, hike in the CIT, PIT, Sugary drinks tax, and other progressive taxation measures such as the carbon tax. As well as a list of various items to be zero rated. 1 488 support this.
9.2 Appendix 2 – Calculation tables Table 20: Spending on zero-rated items as percentage of total consumption expenditure
Expenditure items
Household deciles (per capita expenditure)
1 2 3 4 5 6 7 8 9 10
Brown bread 3,78% 2,87% 2,54% 2,20% 1,97% 1,61% 1,20% 0,75% 0,43% 0,14%
Whole wheat bread 0,00% 0,00% 0,01% 0,00% 0,00% 0,00% 0,01% 0,01% 0,01% 0,01%
Samp 0,15% 0,16% 0,16% 0,11% 0,11% 0,08% 0,06% 0,02% 0,01% 0,00%
Mealie rice 0,00% 0,01% 0,01% 0,00% 0,00% 0,00% 0,01% 0,00% 0,00% 0,00%
Rice 1,61% 1,63% 1,49% 1,32% 1,06% 0,89% 0,74% 0,59% 0,27% 0,09%
Mealie meal/Maize flour 4,82% 4,09% 3,46% 3,03% 2,56% 1,88% 1,31% 0,78% 0,35% 0,07%
Fresh low fat milk 0,03% 0,03% 0,04% 0,03% 0,03% 0,04% 0,04% 0,05% 0,03% 0,05%
Fresh full cream milk 0,52% 0,63% 0,63% 0,67% 0,60% 0,63% 0,64% 0,49% 0,37% 0,18%
Longlife Full cream milk 0,19% 0,22% 0,20% 0,22% 0,23% 0,18% 0,17% 0,13% 0,11% 0,07%
Longlife low fat milk 0,02% 0,01% 0,01% 0,02% 0,01% 0,02% 0,01% 0,01% 0,01% 0,03%
Powdered milk 0,09% 0,08% 0,11% 0,09% 0,10% 0,07% 0,06% 0,03% 0,01% 0,01%
Sour milk/maas 0,53% 0,49% 0,47% 0,40% 0,36% 0,26% 0,21% 0,16% 0,07% 0,02%
Medium eggs 0,19% 0,23% 0,21% 0,19% 0,18% 0,15% 0,12% 0,08% 0,05% 0,01%
Large eggs 0,41% 0,48% 0,43% 0,45% 0,46% 0,35% 0,38% 0,25% 0,18% 0,08%
Extra large eggs 0,03% 0,04% 0,05% 0,06% 0,04% 0,03% 0,04% 0,02% 0,02% 0,03%
Jumbo eggs 0,03% 0,02% 0,02% 0,02% 0,04% 0,03% 0,02% 0,02% 0,02% 0,02%
Canned pilchards 0,57% 0,56% 0,57% 0,53% 0,45% 0,46% 0,34% 0,23% 0,09% 0,02%
Cooking fat: vegetable (eg Holsum) 0,01% 0,00% 0,00% 0,00% 0,00% 0,00% 0,00% 0,00% 0,00% 0,00%
Edible oils (eg cooking oils)+P58 1,27% 1,24% 1,08% 0,94% 0,82% 0,65% 0,48% 0,33% 0,17% 0,05%
Bananas 0,12% 0,10% 0,10% 0,10% 0,11% 0,12% 0,09% 0,10% 0,07% 0,05%
Apples 0,10% 0,10% 0,13% 0,13% 0,12% 0,11% 0,12% 0,13% 0,07% 0,05%
Pineapple 0,00% 0,00% 0,00% 0,00% 0,01% 0,00% 0,00% 0,00% 0,00% 0,00%
Mango 0,01% 0,01% 0,01% 0,01% 0,01% 0,01% 0,01% 0,01% 0,01% 0,01%
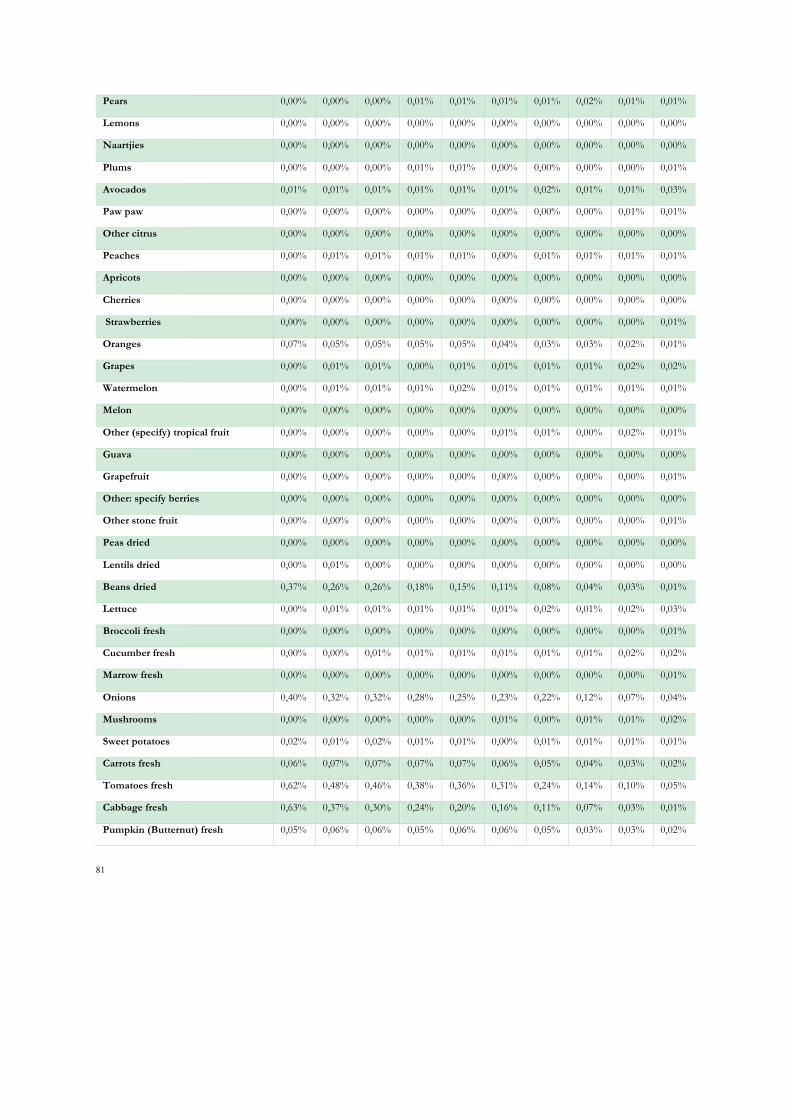
81
Pears 0,00% 0,00% 0,00% 0,01% 0,01% 0,01% 0,01% 0,02% 0,01% 0,01%
Lemons 0,00% 0,00% 0,00% 0,00% 0,00% 0,00% 0,00% 0,00% 0,00% 0,00%
Naartjies 0,00% 0,00% 0,00% 0,00% 0,00% 0,00% 0,00% 0,00% 0,00% 0,00%
Plums 0,00% 0,00% 0,00% 0,01% 0,01% 0,00% 0,00% 0,00% 0,00% 0,01%
Avocados 0,01% 0,01% 0,01% 0,01% 0,01% 0,01% 0,02% 0,01% 0,01% 0,03%
Paw paw 0,00% 0,00% 0,00% 0,00% 0,00% 0,00% 0,00% 0,00% 0,01% 0,01%
Other citrus 0,00% 0,00% 0,00% 0,00% 0,00% 0,00% 0,00% 0,00% 0,00% 0,00%
Peaches 0,00% 0,01% 0,01% 0,01% 0,01% 0,00% 0,01% 0,01% 0,01% 0,01%
Apricots 0,00% 0,00% 0,00% 0,00% 0,00% 0,00% 0,00% 0,00% 0,00% 0,00%
Cherries 0,00% 0,00% 0,00% 0,00% 0,00% 0,00% 0,00% 0,00% 0,00% 0,00%
Strawberries 0,00% 0,00% 0,00% 0,00% 0,00% 0,00% 0,00% 0,00% 0,00% 0,01%
Oranges 0,07% 0,05% 0,05% 0,05% 0,05% 0,04% 0,03% 0,03% 0,02% 0,01%
Grapes 0,00% 0,01% 0,01% 0,00% 0,01% 0,01% 0,01% 0,01% 0,02% 0,02%
Watermelon 0,00% 0,01% 0,01% 0,01% 0,02% 0,01% 0,01% 0,01% 0,01% 0,01%
Melon 0,00% 0,00% 0,00% 0,00% 0,00% 0,00% 0,00% 0,00% 0,00% 0,00%
Other (specify) tropical fruit 0,00% 0,00% 0,00% 0,00% 0,00% 0,01% 0,01% 0,00% 0,02% 0,01%
Guava 0,00% 0,00% 0,00% 0,00% 0,00% 0,00% 0,00% 0,00% 0,00% 0,00%
Grapefruit 0,00% 0,00% 0,00% 0,00% 0,00% 0,00% 0,00% 0,00% 0,00% 0,01%
Other: specify berries 0,00% 0,00% 0,00% 0,00% 0,00% 0,00% 0,00% 0,00% 0,00% 0,00%
Other stone fruit 0,00% 0,00% 0,00% 0,00% 0,00% 0,00% 0,00% 0,00% 0,00% 0,01%
Peas dried 0,00% 0,00% 0,00% 0,00% 0,00% 0,00% 0,00% 0,00% 0,00% 0,00%
Lentils dried 0,00% 0,01% 0,00% 0,00% 0,00% 0,00% 0,00% 0,00% 0,00% 0,00%
Beans dried 0,37% 0,26% 0,26% 0,18% 0,15% 0,11% 0,08% 0,04% 0,03% 0,01%
Lettuce 0,00% 0,01% 0,01% 0,01% 0,01% 0,01% 0,02% 0,01% 0,02% 0,03%
Broccoli fresh 0,00% 0,00% 0,00% 0,00% 0,00% 0,00% 0,00% 0,00% 0,00% 0,01%
Cucumber fresh 0,00% 0,00% 0,01% 0,01% 0,01% 0,01% 0,01% 0,01% 0,02% 0,02%
Marrow fresh 0,00% 0,00% 0,00% 0,00% 0,00% 0,00% 0,00% 0,00% 0,00% 0,01%
Onions 0,40% 0,32% 0,32% 0,28% 0,25% 0,23% 0,22% 0,12% 0,07% 0,04%
Mushrooms 0,00% 0,00% 0,00% 0,00% 0,00% 0,01% 0,00% 0,01% 0,01% 0,02%
Sweet potatoes 0,02% 0,01% 0,02% 0,01% 0,01% 0,00% 0,01% 0,01% 0,01% 0,01%
Carrots fresh 0,06% 0,07% 0,07% 0,07% 0,07% 0,06% 0,05% 0,04% 0,03% 0,02%
Tomatoes fresh 0,62% 0,48% 0,46% 0,38% 0,36% 0,31% 0,24% 0,14% 0,10% 0,05%
Cabbage fresh 0,63% 0,37% 0,30% 0,24% 0,20% 0,16% 0,11% 0,07% 0,03% 0,01%
Pumpkin (Butternut) fresh 0,05% 0,06% 0,06% 0,05% 0,06% 0,06% 0,05% 0,03% 0,03% 0,02%
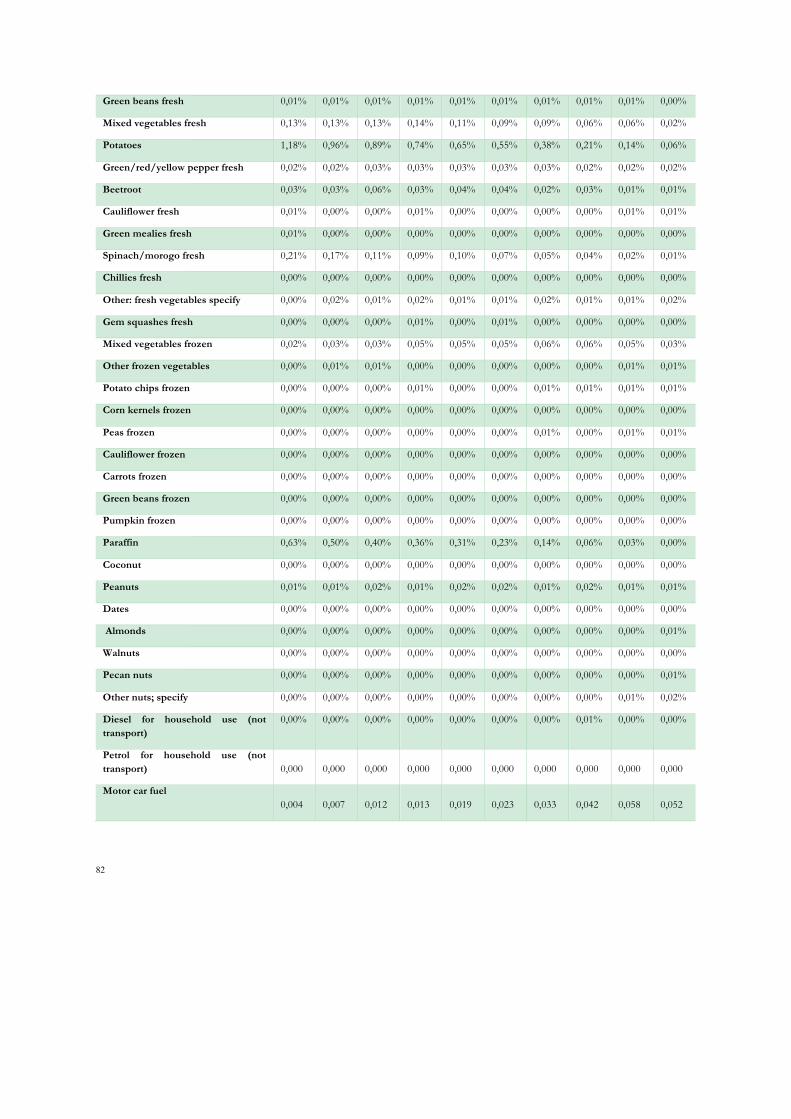
82
Green beans fresh 0,01% 0,01% 0,01% 0,01% 0,01% 0,01% 0,01% 0,01% 0,01% 0,00%
Mixed vegetables fresh 0,13% 0,13% 0,13% 0,14% 0,11% 0,09% 0,09% 0,06% 0,06% 0,02%
Potatoes 1,18% 0,96% 0,89% 0,74% 0,65% 0,55% 0,38% 0,21% 0,14% 0,06%
Green/red/yellow pepper fresh 0,02% 0,02% 0,03% 0,03% 0,03% 0,03% 0,03% 0,02% 0,02% 0,02%
Beetroot 0,03% 0,03% 0,06% 0,03% 0,04% 0,04% 0,02% 0,03% 0,01% 0,01%
Cauliflower fresh 0,01% 0,00% 0,00% 0,01% 0,00% 0,00% 0,00% 0,00% 0,01% 0,01%
Green mealies fresh 0,01% 0,00% 0,00% 0,00% 0,00% 0,00% 0,00% 0,00% 0,00% 0,00%
Spinach/morogo fresh 0,21% 0,17% 0,11% 0,09% 0,10% 0,07% 0,05% 0,04% 0,02% 0,01%
Chillies fresh 0,00% 0,00% 0,00% 0,00% 0,00% 0,00% 0,00% 0,00% 0,00% 0,00%
Other: fresh vegetables specify 0,00% 0,02% 0,01% 0,02% 0,01% 0,01% 0,02% 0,01% 0,01% 0,02%
Gem squashes fresh 0,00% 0,00% 0,00% 0,01% 0,00% 0,01% 0,00% 0,00% 0,00% 0,00%
Mixed vegetables frozen 0,02% 0,03% 0,03% 0,05% 0,05% 0,05% 0,06% 0,06% 0,05% 0,03%
Other frozen vegetables 0,00% 0,01% 0,01% 0,00% 0,00% 0,00% 0,00% 0,00% 0,01% 0,01%
Potato chips frozen 0,00% 0,00% 0,00% 0,01% 0,00% 0,00% 0,01% 0,01% 0,01% 0,01%
Corn kernels frozen 0,00% 0,00% 0,00% 0,00% 0,00% 0,00% 0,00% 0,00% 0,00% 0,00%
Peas frozen 0,00% 0,00% 0,00% 0,00% 0,00% 0,00% 0,01% 0,00% 0,01% 0,01%
Cauliflower frozen 0,00% 0,00% 0,00% 0,00% 0,00% 0,00% 0,00% 0,00% 0,00% 0,00%
Carrots frozen 0,00% 0,00% 0,00% 0,00% 0,00% 0,00% 0,00% 0,00% 0,00% 0,00%
Green beans frozen 0,00% 0,00% 0,00% 0,00% 0,00% 0,00% 0,00% 0,00% 0,00% 0,00%
Pumpkin frozen 0,00% 0,00% 0,00% 0,00% 0,00% 0,00% 0,00% 0,00% 0,00% 0,00%
Paraffin 0,63% 0,50% 0,40% 0,36% 0,31% 0,23% 0,14% 0,06% 0,03% 0,00%
Coconut 0,00% 0,00% 0,00% 0,00% 0,00% 0,00% 0,00% 0,00% 0,00% 0,00%
Peanuts 0,01% 0,01% 0,02% 0,01% 0,02% 0,02% 0,01% 0,02% 0,01% 0,01%
Dates 0,00% 0,00% 0,00% 0,00% 0,00% 0,00% 0,00% 0,00% 0,00% 0,00%
Almonds 0,00% 0,00% 0,00% 0,00% 0,00% 0,00% 0,00% 0,00% 0,00% 0,01%
Walnuts 0,00% 0,00% 0,00% 0,00% 0,00% 0,00% 0,00% 0,00% 0,00% 0,00%
Pecan nuts 0,00% 0,00% 0,00% 0,00% 0,00% 0,00% 0,00% 0,00% 0,00% 0,01%
Other nuts; specify 0,00% 0,00% 0,00% 0,00% 0,00% 0,00% 0,00% 0,00% 0,01% 0,02%
Diesel for household use (not transport)
0,00% 0,00% 0,00% 0,00% 0,00% 0,00% 0,00% 0,01% 0,00% 0,00%
Petrol for household use (not transport)
0,000
0,000
0,000
0,000
0,000
0,000
0,000
0,000
0,000
0,000
Motor car fuel 0,004
0,007
0,012
0,013
0,019
0,023
0,033
0,042
0,058
0,052
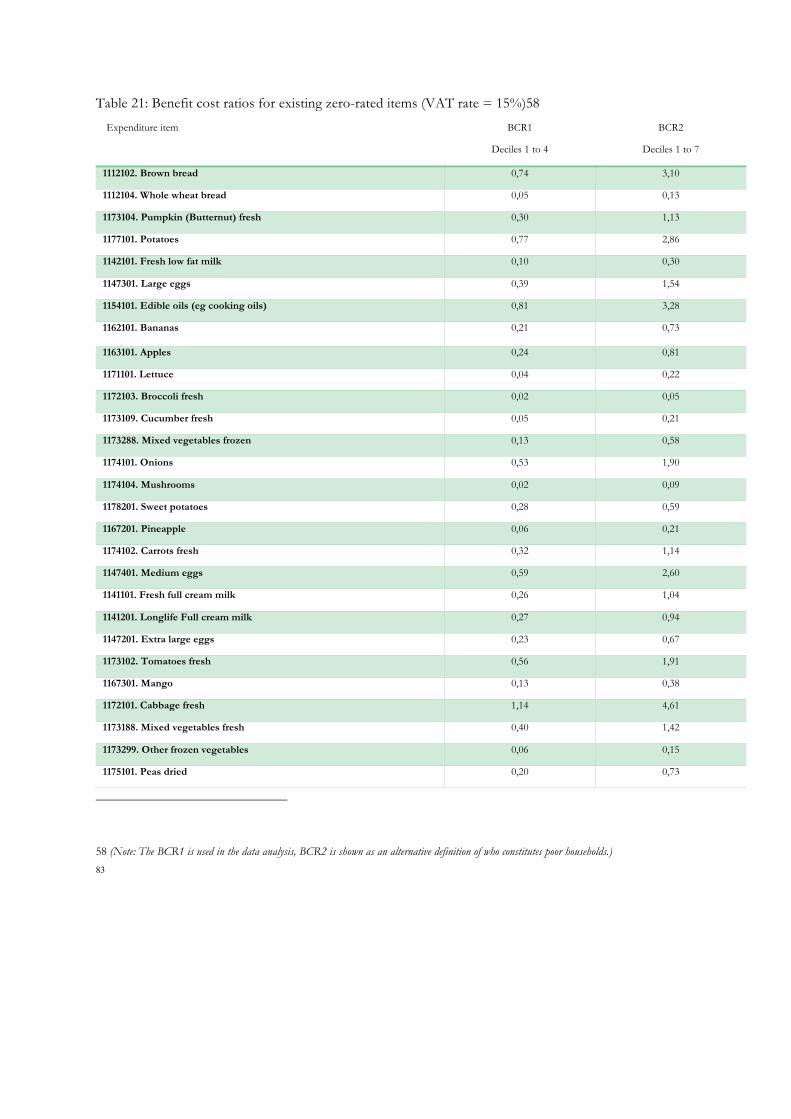
83
Table 21: Benefit cost ratios for existing zero-rated items (VAT rate = 15%)58
Expenditure item BCR1
Deciles 1 to 4
BCR2
Deciles 1 to 7
1112102. Brown bread 0,74 3,10
1112104. Whole wheat bread 0,05 0,13
1173104. Pumpkin (Butternut) fresh 0,30 1,13
1177101. Potatoes 0,77 2,86
1142101. Fresh low fat milk 0,10 0,30
1147301. Large eggs 0,39 1,54
1154101. Edible oils (eg cooking oils) 0,81 3,28
1162101. Bananas 0,21 0,73
1163101. Apples 0,24 0,81
1171101. Lettuce 0,04 0,22
1172103. Broccoli fresh 0,02 0,05
1173109. Cucumber fresh 0,05 0,21
1173288. Mixed vegetables frozen 0,13 0,58
1174101. Onions 0,53 1,90
1174104. Mushrooms 0,02 0,09
1178201. Sweet potatoes 0,28 0,59
1167201. Pineapple 0,06 0,21
1174102. Carrots fresh 0,32 1,14
1147401. Medium eggs 0,59 2,60
1141101. Fresh full cream milk 0,26 1,04
1141201. Longlife Full cream milk 0,27 0,94
1147201. Extra large eggs 0,23 0,67
1173102. Tomatoes fresh 0,56 1,91
1167301. Mango 0,13 0,38
1172101. Cabbage fresh 1,14 4,61
1173188. Mixed vegetables fresh 0,40 1,42
1173299. Other frozen vegetables 0,06 0,15
1175101. Peas dried 0,20 0,73
58 (Note: The BCR1 is used in the data analysis, BCR2 is shown as an alternative definition of who constitutes poor households.)
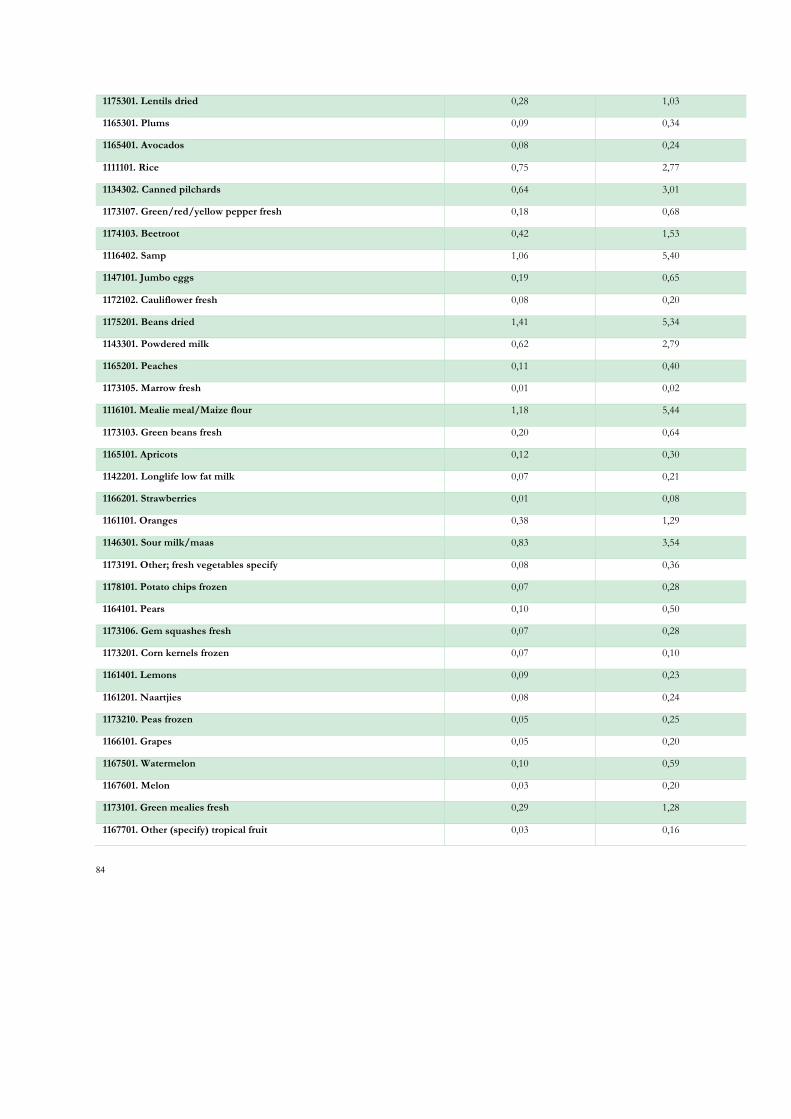
84
1175301. Lentils dried 0,28 1,03
1165301. Plums 0,09 0,34
1165401. Avocados 0,08 0,24
1111101. Rice 0,75 2,77
1134302. Canned pilchards 0,64 3,01
1173107. Green/red/yellow pepper fresh 0,18 0,68
1174103. Beetroot 0,42 1,53
1116402. Samp 1,06 5,40
1147101. Jumbo eggs 0,19 0,65
1172102. Cauliflower fresh 0,08 0,20
1175201. Beans dried 1,41 5,34
1143301. Powdered milk 0,62 2,79
1165201. Peaches 0,11 0,40
1173105. Marrow fresh 0,01 0,02
1116101. Mealie meal/Maize flour 1,18 5,44
1173103. Green beans fresh 0,20 0,64
1165101. Apricots 0,12 0,30
1142201. Longlife low fat milk 0,07 0,21
1166201. Strawberries 0,01 0,08
1161101. Oranges 0,38 1,29
1146301. Sour milk/maas 0,83 3,54
1173191. Other; fresh vegetables specify 0,08 0,36
1178101. Potato chips frozen 0,07 0,28
1164101. Pears 0,10 0,50
1173106. Gem squashes fresh 0,07 0,28
1173201. Corn kernels frozen 0,07 0,10
1161401. Lemons 0,09 0,23
1161201. Naartjies 0,08 0,24
1173210. Peas frozen 0,05 0,25
1166101. Grapes 0,05 0,20
1167501. Watermelon 0,10 0,59
1167601. Melon 0,03 0,20
1173101. Green mealies fresh 0,29 1,28
1167701. Other (specify) tropical fruit 0,03 0,16
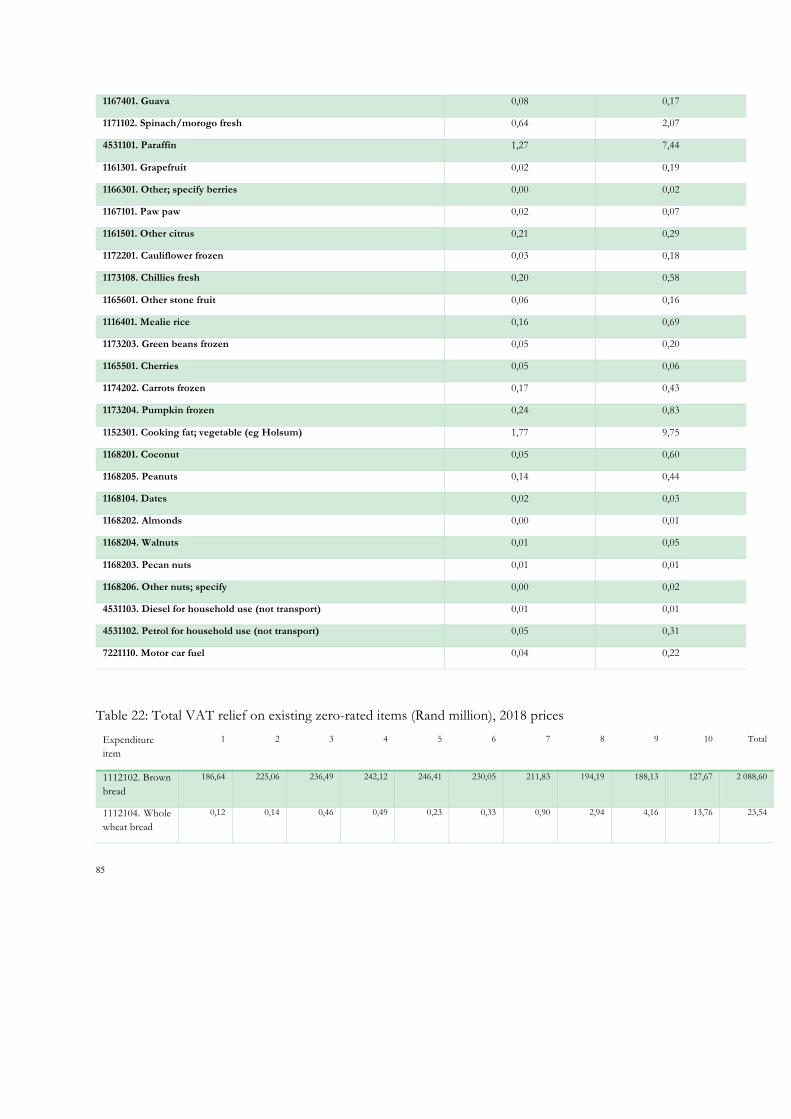
85
1167401. Guava 0,08 0,17
1171102. Spinach/morogo fresh 0,64 2,07
4531101. Paraffin 1,27 7,44
1161301. Grapefruit 0,02 0,19
1166301. Other; specify berries 0,00 0,02
1167101. Paw paw 0,02 0,07
1161501. Other citrus 0,21 0,29
1172201. Cauliflower frozen 0,03 0,18
1173108. Chillies fresh 0,20 0,58
1165601. Other stone fruit 0,06 0,16
1116401. Mealie rice 0,16 0,69
1173203. Green beans frozen 0,05 0,20
1165501. Cherries 0,05 0,06
1174202. Carrots frozen 0,17 0,43
1173204. Pumpkin frozen 0,24 0,83
1152301. Cooking fat; vegetable (eg Holsum) 1,77 9,75
1168201. Coconut 0,05 0,60
1168205. Peanuts 0,14 0,44
1168104. Dates 0,02 0,03
1168202. Almonds 0,00 0,01
1168204. Walnuts 0,01 0,05
1168203. Pecan nuts 0,01 0,01
1168206. Other nuts; specify 0,00 0,02
4531103. Diesel for household use (not transport) 0,01 0,01
4531102. Petrol for household use (not transport) 0,05 0,31
7221110. Motor car fuel 0,04 0,22
Table 22: Total VAT relief on existing zero-rated items (Rand million), 2018 prices
Expenditure item
1 2 3 4 5 6 7 8 9 10 Total
1112102. Brown bread
186,64 225,06 236,49 242,12 246,41 230,05 211,83 194,19 188,13 127,67 2 088,60
1112104. Whole wheat bread
0,12 0,14 0,46 0,49 0,23 0,33 0,90 2,94 4,16 13,76 23,54
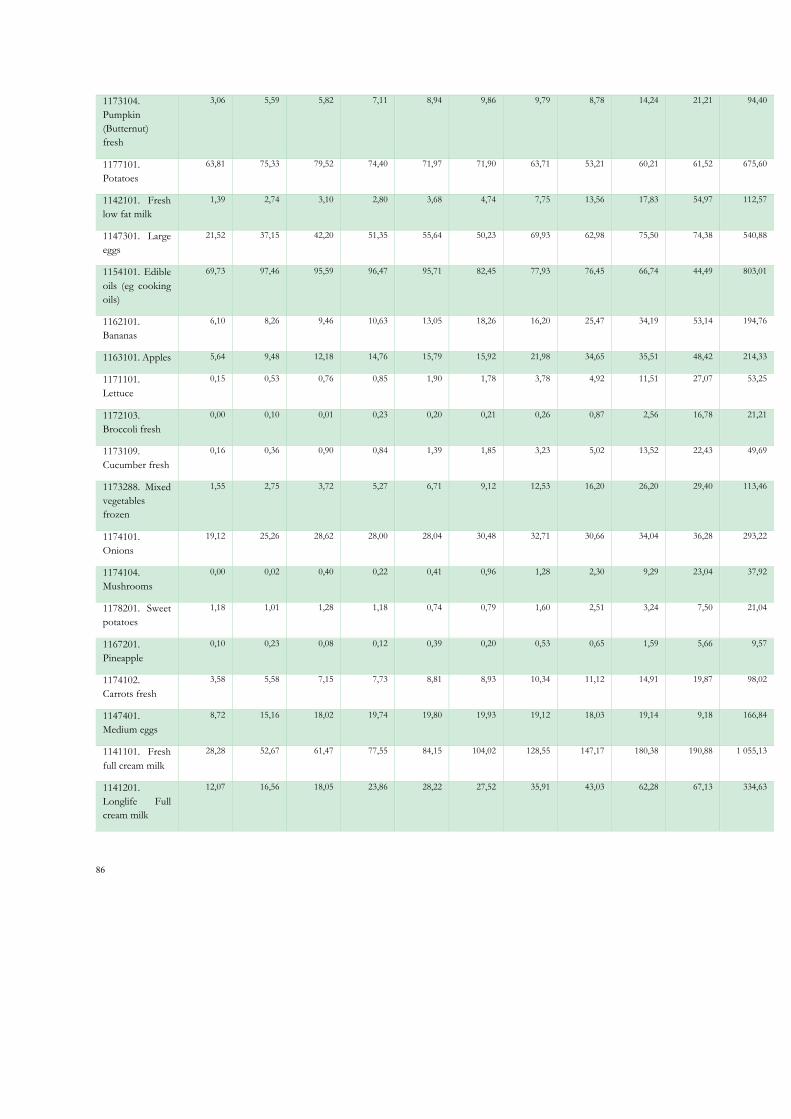
86
1173104. Pumpkin (Butternut) fresh
3,06 5,59 5,82 7,11 8,94 9,86 9,79 8,78 14,24 21,21 94,40
1177101. Potatoes
63,81 75,33 79,52 74,40 71,97 71,90 63,71 53,21 60,21 61,52 675,60
1142101. Fresh low fat milk
1,39 2,74 3,10 2,80 3,68 4,74 7,75 13,56 17,83 54,97 112,57
1147301. Large eggs
21,52 37,15 42,20 51,35 55,64 50,23 69,93 62,98 75,50 74,38 540,88
1154101. Edible oils (eg cooking oils)
69,73 97,46 95,59 96,47 95,71 82,45 77,93 76,45 66,74 44,49 803,01
1162101. Bananas
6,10 8,26 9,46 10,63 13,05 18,26 16,20 25,47 34,19 53,14 194,76
1163101. Apples 5,64 9,48 12,18 14,76 15,79 15,92 21,98 34,65 35,51 48,42 214,33
1171101. Lettuce
0,15 0,53 0,76 0,85 1,90 1,78 3,78 4,92 11,51 27,07 53,25
1172103. Broccoli fresh
0,00 0,10 0,01 0,23 0,20 0,21 0,26 0,87 2,56 16,78 21,21
1173109. Cucumber fresh
0,16 0,36 0,90 0,84 1,39 1,85 3,23 5,02 13,52 22,43 49,69
1173288. Mixed vegetables frozen
1,55 2,75 3,72 5,27 6,71 9,12 12,53 16,20 26,20 29,40 113,46
1174101. Onions
19,12 25,26 28,62 28,00 28,04 30,48 32,71 30,66 34,04 36,28 293,22
1174104. Mushrooms
0,00 0,02 0,40 0,22 0,41 0,96 1,28 2,30 9,29 23,04 37,92
1178201. Sweet potatoes
1,18 1,01 1,28 1,18 0,74 0,79 1,60 2,51 3,24 7,50 21,04
1167201. Pineapple
0,10 0,23 0,08 0,12 0,39 0,20 0,53 0,65 1,59 5,66 9,57
1174102. Carrots fresh
3,58 5,58 7,15 7,73 8,81 8,93 10,34 11,12 14,91 19,87 98,02
1147401. Medium eggs
8,72 15,16 18,02 19,74 19,80 19,93 19,12 18,03 19,14 9,18 166,84
1141101. Fresh full cream milk
28,28 52,67 61,47 77,55 84,15 104,02 128,55 147,17 180,38 190,88 1 055,13
1141201. Longlife Full cream milk
12,07 16,56 18,05 23,86 28,22 27,52 35,91 43,03 62,28 67,13 334,63
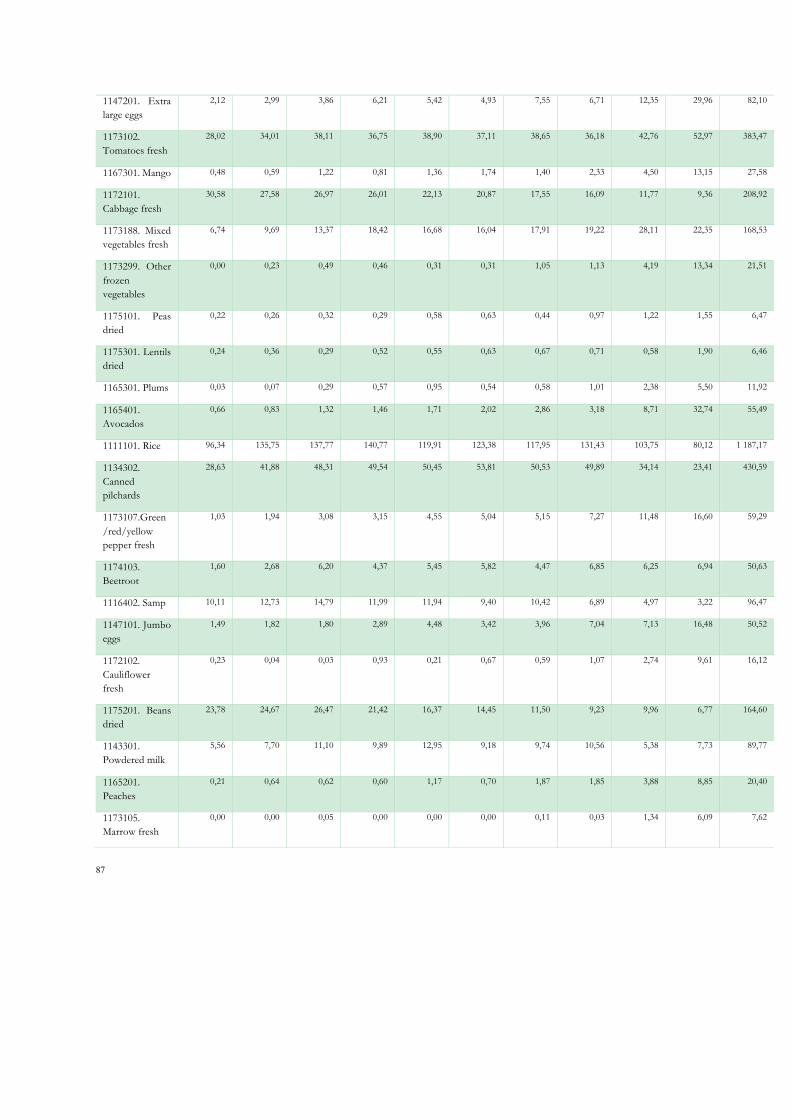
87
1147201. Extra large eggs
2,12 2,99 3,86 6,21 5,42 4,93 7,55 6,71 12,35 29,96 82,10
1173102. Tomatoes fresh
28,02 34,01 38,11 36,75 38,90 37,11 38,65 36,18 42,76 52,97 383,47
1167301. Mango 0,48 0,59 1,22 0,81 1,36 1,74 1,40 2,33 4,50 13,15 27,58
1172101. Cabbage fresh
30,58 27,58 26,97 26,01 22,13 20,87 17,55 16,09 11,77 9,36 208,92
1173188. Mixed vegetables fresh
6,74 9,69 13,37 18,42 16,68 16,04 17,91 19,22 28,11 22,35 168,53
1173299. Other frozen vegetables
0,00 0,23 0,49 0,46 0,31 0,31 1,05 1,13 4,19 13,34 21,51
1175101. Peas dried
0,22 0,26 0,32 0,29 0,58 0,63 0,44 0,97 1,22 1,55 6,47
1175301. Lentils dried
0,24 0,36 0,29 0,52 0,55 0,63 0,67 0,71 0,58 1,90 6,46
1165301. Plums 0,03 0,07 0,29 0,57 0,95 0,54 0,58 1,01 2,38 5,50 11,92
1165401. Avocados
0,66 0,83 1,32 1,46 1,71 2,02 2,86 3,18 8,71 32,74 55,49
1111101. Rice 96,34 135,75 137,77 140,77 119,91 123,38 117,95 131,43 103,75 80,12 1 187,17
1134302. Canned pilchards
28,63 41,88 48,31 49,54 50,45 53,81 50,53 49,89 34,14 23,41 430,59
1173107.Green/red/yellow pepper fresh
1,03 1,94 3,08 3,15 4,55 5,04 5,15 7,27 11,48 16,60 59,29
1174103. Beetroot
1,60 2,68 6,20 4,37 5,45 5,82 4,47 6,85 6,25 6,94 50,63
1116402. Samp 10,11 12,73 14,79 11,99 11,94 9,40 10,42 6,89 4,97 3,22 96,47
1147101. Jumbo eggs
1,49 1,82 1,80 2,89 4,48 3,42 3,96 7,04 7,13 16,48 50,52
1172102. Cauliflower fresh
0,23 0,04 0,03 0,93 0,21 0,67 0,59 1,07 2,74 9,61 16,12
1175201. Beans dried
23,78 24,67 26,47 21,42 16,37 14,45 11,50 9,23 9,96 6,77 164,60
1143301. Powdered milk
5,56 7,70 11,10 9,89 12,95 9,18 9,74 10,56 5,38 7,73 89,77
1165201. Peaches
0,21 0,64 0,62 0,60 1,17 0,70 1,87 1,85 3,88 8,85 20,40
1173105. Marrow fresh
0,00 0,00 0,05 0,00 0,00 0,00 0,11 0,03 1,34 6,09 7,62
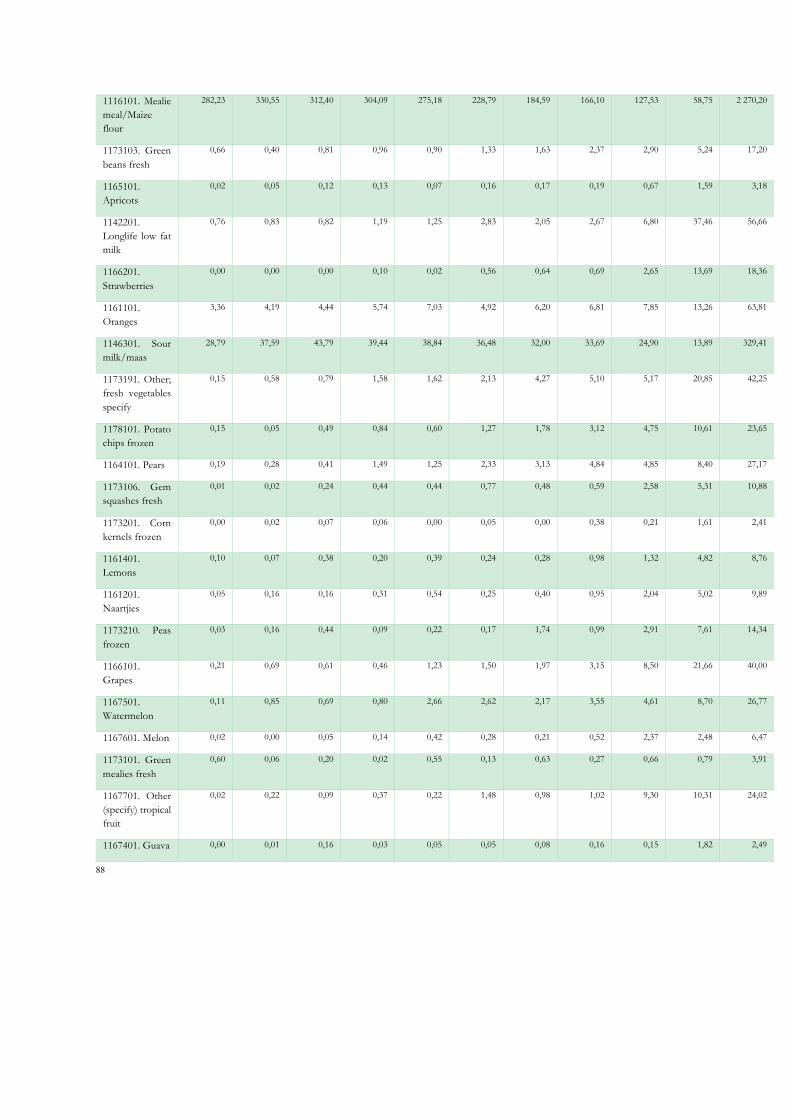
88
1116101. Mealie meal/Maize flour
282,23 330,55 312,40 304,09 275,18 228,79 184,59 166,10 127,53 58,75 2 270,20
1173103. Green beans fresh
0,66 0,40 0,81 0,96 0,90 1,33 1,63 2,37 2,90 5,24 17,20
1165101. Apricots
0,02 0,05 0,12 0,13 0,07 0,16 0,17 0,19 0,67 1,59 3,18
1142201. Longlife low fat milk
0,76 0,83 0,82 1,19 1,25 2,83 2,05 2,67 6,80 37,46 56,66
1166201. Strawberries
0,00 0,00 0,00 0,10 0,02 0,56 0,64 0,69 2,65 13,69 18,36
1161101. Oranges
3,36 4,19 4,44 5,74 7,03 4,92 6,20 6,81 7,85 13,26 63,81
1146301. Sour milk/maas
28,79 37,59 43,79 39,44 38,84 36,48 32,00 33,69 24,90 13,89 329,41
1173191. Other; fresh vegetables specify
0,15 0,58 0,79 1,58 1,62 2,13 4,27 5,10 5,17 20,85 42,25
1178101. Potato chips frozen
0,15 0,05 0,49 0,84 0,60 1,27 1,78 3,12 4,75 10,61 23,65
1164101. Pears 0,19 0,28 0,41 1,49 1,25 2,33 3,13 4,84 4,85 8,40 27,17
1173106. Gem squashes fresh
0,01 0,02 0,24 0,44 0,44 0,77 0,48 0,59 2,58 5,31 10,88
1173201. Corn kernels frozen
0,00 0,02 0,07 0,06 0,00 0,05 0,00 0,38 0,21 1,61 2,41
1161401. Lemons
0,10 0,07 0,38 0,20 0,39 0,24 0,28 0,98 1,32 4,82 8,76
1161201. Naartjies
0,05 0,16 0,16 0,31 0,54 0,25 0,40 0,95 2,04 5,02 9,89
1173210. Peas frozen
0,03 0,16 0,44 0,09 0,22 0,17 1,74 0,99 2,91 7,61 14,34
1166101. Grapes
0,21 0,69 0,61 0,46 1,23 1,50 1,97 3,15 8,50 21,66 40,00
1167501. Watermelon
0,11 0,85 0,69 0,80 2,66 2,62 2,17 3,55 4,61 8,70 26,77
1167601. Melon 0,02 0,00 0,05 0,14 0,42 0,28 0,21 0,52 2,37 2,48 6,47
1173101. Green mealies fresh
0,60 0,06 0,20 0,02 0,55 0,13 0,63 0,27 0,66 0,79 3,91
1167701. Other (specify) tropical fruit
0,02 0,22 0,09 0,37 0,22 1,48 0,98 1,02 9,30 10,31 24,02
1167401. Guava 0,00 0,01 0,16 0,03 0,05 0,05 0,08 0,16 0,15 1,82 2,49

89
1171102. Spinach/morogo fresh
9,91 11,90 9,53 8,58 11,44 9,27 8,64 9,95 8,92 14,53 102,68
1161301. Grapefruit
0,03 0,02 0,00 0,16 0,67 0,56 0,35 0,59 1,70 7,25 11,34
1166301. Other; specify berries
0,00 0,03 0,00 0,00 0,00 0,07 0,04 0,06 0,28 7,36 7,85
1167101. Paw paw
0,04 0,02 0,10 0,05 0,06 0,18 0,37 0,79 2,90 8,69 13,20
1161501. Other citrus
0,00 0,02 0,29 0,06 0,07 0,04 0,00 0,22 0,15 1,29 2,13
1172201. Cauliflower frozen
0,00 0,04 0,00 0,01 0,00 0,00 0,21 0,32 0,10 1,05 1,73
1173108. Chillies fresh
0,16 0,22 0,28 0,39 0,33 0,30 0,64 1,22 0,93 1,84 6,31
1165601. Other stone fruit
0,10 0,21 0,17 0,14 0,18 0,52 0,23 0,53 0,70 8,49 11,27
1116401. Mealie rice
0,12 0,56 0,54 0,44 0,54 0,92 1,68 1,50 1,16 4,25 11,69
1173203. Green beans frozen
0,09 0,08 0,07 0,06 0,10 0,46 0,13 0,41 0,77 3,75 5,91
1165501. Cherries
0,15 0,00 0,00 0,00 0,00 0,03 0,00 0,15 0,19 2,82 3,34
1174202. Carrots frozen
0,17 0,01 0,19 0,11 0,04 0,12 0,37 0,50 0,48 1,32 3,30
1173204. Pumpkin frozen
0,04 0,06 0,29 0,27 0,26 0,08 0,56 0,56 0,56 0,76 3,44
1152301. Cooking fat; vegetable (eg Holsum)
0,46 0,16 0,40 0,15 0,07 0,14 0,28 0,08 0,08 0,01 1,83
1168201. Coconut
0,00 0,03 0,09 0,01 0,25 0,01 0,57 0,71 0,43 0,49 2,59
1168205. Peanuts
0,59 1,25 1,62 1,11 2,26 2,30 2,51 5,93 6,39 14,14 38,10
1168104. Dates 0,00 0,00 0,01 0,00 0,00 0,01 0,00 0,07 0,20 0,51 0,80
1168202. Almonds
0,00 0,00 0,00 0,00 0,00 0,01 0,08 0,43 1,04 8,44 10,01
1168204. Walnuts
0,00 0,00 0,00 0,05 0,01 0,06 0,08 0,00 0,19 3,78 4,16
1168203. Pecan nuts
0,05 0,04 0,00 0,00 0,01 0,01 0,00 0,09 0,25 11,61 12,06
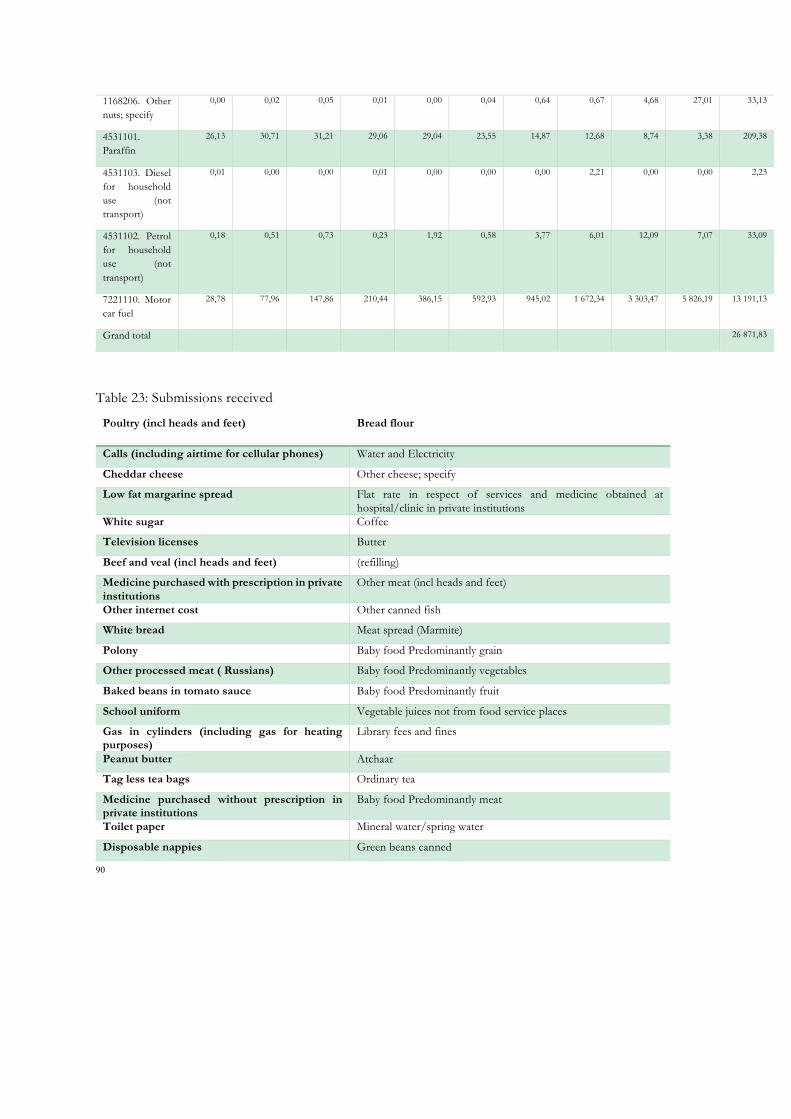
90
1168206. Other nuts; specify
0,00 0,02 0,05 0,01 0,00 0,04 0,64 0,67 4,68 27,01 33,13
4531101. Paraffin
26,13 30,71 31,21 29,06 29,04 23,55 14,87 12,68 8,74 3,38 209,38
4531103. Diesel for household use (not transport)
0,01 0,00 0,00 0,01 0,00 0,00 0,00 2,21 0,00 0,00 2,23
4531102. Petrol for household use (not transport)
0,18 0,51 0,73 0,23 1,92 0,58 3,77 6,01 12,09 7,07 33,09
7221110. Motor car fuel
28,78 77,96 147,86 210,44 386,15 592,93 945,02 1 672,34 3 303,47 5 826,19 13 191,13
Grand total 26 871,83
Table 23: Submissions received
Poultry (incl heads and feet) Bread flour
Calls (including airtime for cellular phones) Water and Electricity
Cheddar cheese Other cheese; specify
Low fat margarine spread Flat rate in respect of services and medicine obtained at hospital/clinic in private institutions
White sugar Coffee
Television licenses Butter
Beef and veal (incl heads and feet) (refilling)
Medicine purchased with prescription in private institutions
Other meat (incl heads and feet)
Other internet cost Other canned fish
White bread Meat spread (Marmite)
Polony Baby food Predominantly grain
Other processed meat ( Russians) Baby food Predominantly vegetables
Baked beans in tomato sauce Baby food Predominantly fruit
School uniform Vegetable juices not from food service places
Gas in cylinders (including gas for heating purposes)
Library fees and fines
Peanut butter Atchaar
Tag less tea bags Ordinary tea
Medicine purchased without prescription in private institutions
Baby food Predominantly meat
Toilet paper Mineral water/spring water
Disposable nappies Green beans canned
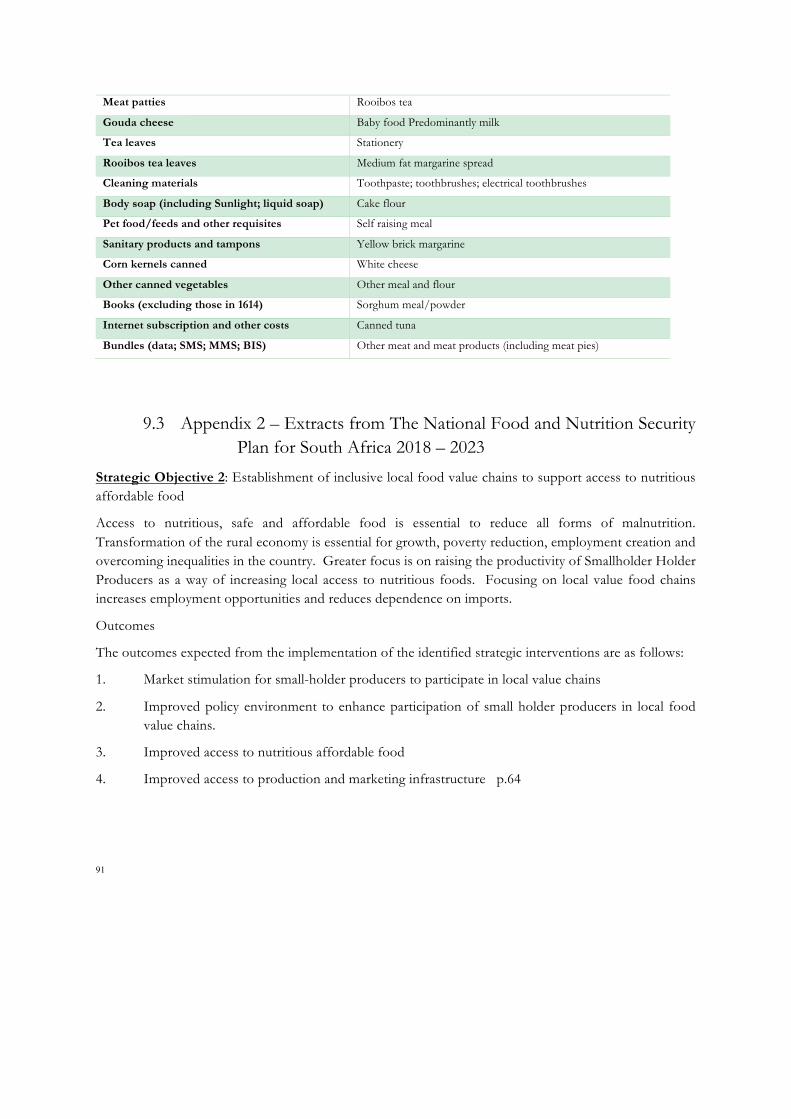
91
Meat patties Rooibos tea
Gouda cheese Baby food Predominantly milk
Tea leaves Stationery
Rooibos tea leaves Medium fat margarine spread
Cleaning materials Toothpaste; toothbrushes; electrical toothbrushes
Body soap (including Sunlight; liquid soap) Cake flour
Pet food/feeds and other requisites Self raising meal
Sanitary products and tampons Yellow brick margarine
Corn kernels canned White cheese
Other canned vegetables Other meal and flour
Books (excluding those in 1614) Sorghum meal/powder
Internet subscription and other costs Canned tuna
Bundles (data; SMS; MMS; BIS) Other meat and meat products (including meat pies)
9.3 Appendix 2 – Extracts from The National Food and Nutrition Security Plan for South Africa 2018 – 2023
Strategic Objective 2: Establishment of inclusive local food value chains to support access to nutritious affordable food
Access to nutritious, safe and affordable food is essential to reduce all forms of malnutrition. Transformation of the rural economy is essential for growth, poverty reduction, employment creation and overcoming inequalities in the country. Greater focus is on raising the productivity of Smallholder Holder Producers as a way of increasing local access to nutritious foods. Focusing on local value food chains increases employment opportunities and reduces dependence on imports.
Outcomes
The outcomes expected from the implementation of the identified strategic interventions are as follows:
1. Market stimulation for small-holder producers to participate in local value chains
2. Improved policy environment to enhance participation of small holder producers in local food value chains.
3. Improved access to nutritious affordable food
4. Improved access to production and marketing infrastructure p.64
Related Documents