Recombination Blurs Phylogenetic Groups Routine Assignment in Escherichia coli: Setting the Record Straight Marı ´a-Carmen Turrientes 1,2 , Jose ´-Marı´a Gonza ´ lez-Alba 1,2 , Rosa del Campo 1,3 , Marı ´a-Rosario Baquero 4 , Rafael Canto ´n 1,3 , Fernando Baquero 1,2 *, Juan Carlos Gala ´n 1,2 * 1 Servicio de Microbiologı ´a, Hospital Universitario Ramo ´ n y Cajal, Instituto Ramo ´ n y Cajal de Investigacio ´ n Sanitaria (IRYCIS), Madrid, Spain, 2 CIBER en Epidemiologı ´a y Salud Pu ´ blica (CIBERESP), Madrid, Spain, 3 Red Espan ˜ ola para la Investigacio ´ n en Enfermedades Infecciosas (REIPI), Madrid, Spain, 4 Universidad Alfonso X El Sabio, Villanueva de la Can ˜ ada, Madrid, Spain Abstract The characterization of population structures plays a main role for understanding outbreaks and the dynamics of bacterial spreading. In Escherichia coli, the widely used combination of multiplex-PCR scheme together with goeBURST has some limitations. The purpose of this study is to show that the combination of different phylogenetic approaches based on concatenated sequences of MLST genes results in a more precise assignment of E. coli phylogenetic groups, complete understanding of population structure and reconstruction of ancestral clones. A collection of 80 Escherichia coli strains of different origins was analyzed following the Clermont and Doumith’s multiplex-PCR schemes. Doumith’s multiplex-PCR showed only 1.7% of misassignment, whereas Clermont’s-2000 protocol reached 14.0%, although the discrepancies reached 30% and 38.7% respectively when recombinant C, F and E phylogroups were considered. Therefore, correct phylogroup attribution is highly variable and depends on the clonal composition of the sample. As far as population structure of these E. coli strains, including 48 E. coli genomes from GenBank, goeBURST provides a quite dispersed population structure; whereas NeighborNet approach reveals a complex population structure. MLST-based eBURST can infer different founder genotypes, for instance ST23/ST88 could be detected as the founder genotypes for STC23; however, phylogenetic reconstructions might suggest ST410 as the ancestor clone and several evolutionary trajectories with different founders. To improve our routine understanding of E. coli molecular epidemiology, we propose a strategy based on three successive steps; first, to discriminate three main groups A/B1/C, D/F/E and B2 following Doumith’s protocol; second, visualization of population structure based on MLST genes according to goeBURST, using NeighborNet to establish more complex relationships among STs; and third, to perform, a cost-free characterization of evolutionary trajectories in variants emerging along the clonal expansion using parsimony methods of phylogenetic analysis. Citation: Turrientes M-C, Gonza ´lez-Alba J-M, del Campo R, Baquero M-R, Canto ´ n R, et al. (2014) Recombination Blurs Phylogenetic Groups Routine Assignment in Escherichia coli: Setting the Record Straight. PLoS ONE 9(8): e105395. doi:10.1371/journal.pone.0105395 Editor: Dongsheng Zhou, State Key Laboratory of Pathogen and Biosecurity, Beijing Institute of Microbiology and Epidemiology, China Received March 17, 2014; Accepted July 24, 2014; Published August 19, 2014 Copyright: ß 2014 Turrientes et al. This is an open-access article distributed under the terms of the Creative Commons Attribution License, which permits unrestricted use, distribution, and reproduction in any medium, provided the original author and source are credited. Data Availability: The authors confirm that all data underlying the findings are fully available without restriction. The data from the 80 strains are included in Supplementary Material (Table S2 in File S1). GenBank Accession Numbers of the sequences used in the 80 strains are included in material and methods. Funding: MCT PhD is supported by the European Union (EvoTAR-FP7-Health-2011-282004) and JMGA is supported by a fellowship from the Regional Government of Madrid in Spain (PROMT-S2010/BMD2414). The funders had no role in study design, data collection and analysis, decision to publish, or preparation of the manuscript. Competing Interests: The authors have declared that no competing interests exist. * Email: [email protected] (FB); [email protected] (JCG) Introduction One of the most promising fields in bacterial molecular epidemiology is the characterization of the dynamics of changes in bacterial populations across spatial and/or temporal frames. Pulse-field gel electrophoresis techniques are useful for determin- ing local clonal outbreaks but the current reconstructions of population structures in Escherichia coli are based on the combined results of two different analytical approaches. The first identifies macro-evolutionary events based on the assignment of particular strains to phylogenetic lineages; these macro-evolution- ary events reflect bacterial ‘‘speciation-like’’ processes along large scales of time and space [1]. The second approach detects micro- evolutionary events, reflecting recent variations involved in local adaptations. These detections are based in practice on the identification of allelic variants in short fragments of sequence corresponding to seven selected housekeeping genes (MultiLocus Sequence Typing (MLST) patterns) [2,3]. The combination of micro-and macro-evolutionary analyses has obvious applications for the understanding of the recent local spread of particular clones and can be applied to infer the evolution when the nucleotide background of the lineages is defined. The most common approach for assigning phylogenetic lineages of E. coli is the simple and rapid multiplex PCR technique, used in microbial epidemiology laboratories for routine assignment of E. coli phylogroups [4,5]. With this basic multiplex PCR-based method, E. coli strains can be classified into four phylogenetic groups (A, B1, B2, D) based on the presence or absence of the genes: chuA, and yjaA and the DNA fragment TSP4.C2, encoding a putative lipase esterase gene [6]. This multiplex PCR strategy is PLOS ONE | www.plosone.org 1 August 2014 | Volume 9 | Issue 8 | e105395

Welcome message from author
This document is posted to help you gain knowledge. Please leave a comment to let me know what you think about it! Share it to your friends and learn new things together.
Transcript

Recombination Blurs Phylogenetic Groups RoutineAssignment in Escherichia coli: Setting the RecordStraightMarıa-Carmen Turrientes1,2, Jose-Marıa Gonzalez-Alba1,2, Rosa del Campo1,3, Marıa-Rosario Baquero4,
Rafael Canton1,3, Fernando Baquero1,2*, Juan Carlos Galan1,2*
1 Servicio de Microbiologıa, Hospital Universitario Ramon y Cajal, Instituto Ramon y Cajal de Investigacion Sanitaria (IRYCIS), Madrid, Spain, 2 CIBER en Epidemiologıa y
Salud Publica (CIBERESP), Madrid, Spain, 3 Red Espanola para la Investigacion en Enfermedades Infecciosas (REIPI), Madrid, Spain, 4 Universidad Alfonso X El Sabio,
Villanueva de la Canada, Madrid, Spain
Abstract
The characterization of population structures plays a main role for understanding outbreaks and the dynamics of bacterialspreading. In Escherichia coli, the widely used combination of multiplex-PCR scheme together with goeBURST has somelimitations. The purpose of this study is to show that the combination of different phylogenetic approaches based onconcatenated sequences of MLST genes results in a more precise assignment of E. coli phylogenetic groups, completeunderstanding of population structure and reconstruction of ancestral clones. A collection of 80 Escherichia coli strains ofdifferent origins was analyzed following the Clermont and Doumith’s multiplex-PCR schemes. Doumith’s multiplex-PCRshowed only 1.7% of misassignment, whereas Clermont’s-2000 protocol reached 14.0%, although the discrepancies reached30% and 38.7% respectively when recombinant C, F and E phylogroups were considered. Therefore, correct phylogroupattribution is highly variable and depends on the clonal composition of the sample. As far as population structure of these E.coli strains, including 48 E. coli genomes from GenBank, goeBURST provides a quite dispersed population structure; whereasNeighborNet approach reveals a complex population structure. MLST-based eBURST can infer different founder genotypes,for instance ST23/ST88 could be detected as the founder genotypes for STC23; however, phylogenetic reconstructionsmight suggest ST410 as the ancestor clone and several evolutionary trajectories with different founders. To improve ourroutine understanding of E. coli molecular epidemiology, we propose a strategy based on three successive steps; first, todiscriminate three main groups A/B1/C, D/F/E and B2 following Doumith’s protocol; second, visualization of populationstructure based on MLST genes according to goeBURST, using NeighborNet to establish more complex relationships amongSTs; and third, to perform, a cost-free characterization of evolutionary trajectories in variants emerging along the clonalexpansion using parsimony methods of phylogenetic analysis.
Citation: Turrientes M-C, Gonzalez-Alba J-M, del Campo R, Baquero M-R, Canton R, et al. (2014) Recombination Blurs Phylogenetic Groups Routine Assignment inEscherichia coli: Setting the Record Straight. PLoS ONE 9(8): e105395. doi:10.1371/journal.pone.0105395
Editor: Dongsheng Zhou, State Key Laboratory of Pathogen and Biosecurity, Beijing Institute of Microbiology and Epidemiology, China
Received March 17, 2014; Accepted July 24, 2014; Published August 19, 2014
Copyright: � 2014 Turrientes et al. This is an open-access article distributed under the terms of the Creative Commons Attribution License, which permitsunrestricted use, distribution, and reproduction in any medium, provided the original author and source are credited.
Data Availability: The authors confirm that all data underlying the findings are fully available without restriction. The data from the 80 strains are included inSupplementary Material (Table S2 in File S1). GenBank Accession Numbers of the sequences used in the 80 strains are included in material and methods.
Funding: MCT PhD is supported by the European Union (EvoTAR-FP7-Health-2011-282004) and JMGA is supported by a fellowship from the RegionalGovernment of Madrid in Spain (PROMT-S2010/BMD2414). The funders had no role in study design, data collection and analysis, decision to publish, orpreparation of the manuscript.
Competing Interests: The authors have declared that no competing interests exist.
* Email: [email protected] (FB); [email protected] (JCG)
Introduction
One of the most promising fields in bacterial molecular
epidemiology is the characterization of the dynamics of changes
in bacterial populations across spatial and/or temporal frames.
Pulse-field gel electrophoresis techniques are useful for determin-
ing local clonal outbreaks but the current reconstructions of
population structures in Escherichia coli are based on the
combined results of two different analytical approaches. The first
identifies macro-evolutionary events based on the assignment of
particular strains to phylogenetic lineages; these macro-evolution-
ary events reflect bacterial ‘‘speciation-like’’ processes along large
scales of time and space [1]. The second approach detects micro-
evolutionary events, reflecting recent variations involved in local
adaptations. These detections are based in practice on the
identification of allelic variants in short fragments of sequence
corresponding to seven selected housekeeping genes (MultiLocus
Sequence Typing (MLST) patterns) [2,3]. The combination of
micro-and macro-evolutionary analyses has obvious applications
for the understanding of the recent local spread of particular
clones and can be applied to infer the evolution when the
nucleotide background of the lineages is defined.
The most common approach for assigning phylogenetic lineages
of E. coli is the simple and rapid multiplex PCR technique, used in
microbial epidemiology laboratories for routine assignment of E.coli phylogroups [4,5]. With this basic multiplex PCR-based
method, E. coli strains can be classified into four phylogenetic
groups (A, B1, B2, D) based on the presence or absence of the
genes: chuA, and yjaA and the DNA fragment TSP4.C2, encoding
a putative lipase esterase gene [6]. This multiplex PCR strategy is
PLOS ONE | www.plosone.org 1 August 2014 | Volume 9 | Issue 8 | e105395

still widely used due to its simplicity and low price although the
results present several limitations. In fact phylogenetic analyses of
data from both whole genome sequencing and MLST have
established the existence of at least seven E. coli phylogroups
sensu-stricto [7–12].
The precise characterization of bacterial strains based on alleles
and allelic profiles inferred for MLST (micro-evolutionary events)
results in patterns easily comparable between different labs around
the world. This method allows comparisons among strains from
different places facilitating hospital-based, intra-country or inter-
national epidemiological studies. Analyzing all allelic profiles,
eBURST and global optimal eBURST (goeBURST) algorithms
are able to identify simple patterns of genetic relations in the
population structure buffering the effect of recombination [13,14].
The goeBURST representation enables allocation of particular
strains within clones or clonal complexes eventually associated
with different ecological ensembles [14]. This type of representa-
tion is easy to obtain, has a good discriminatory power, especially
when applied to populations with a high clonality followed along a
short period of time, and founder genotypes are faithfully detected.
The main limitations of goeBURST representation is that it
cannot be used for inferring phylogenetic reconstructions sensu-stricto [13], and does not distinguish whether the allelic profiles are
the result of point mutations (single or multiple) or recombination
event(s). In bacterial species, such as E. coli, with relatively high
recombination rates [15–17] goeBURST could lead to interpre-
tative mistakes. Both sequencing technologies and evolutionary
bioinformatics software are now increasingly available, and their
integration provides new possibilities for increasing our under-
standing of evolutionary relationships in population structures. For
instance, creation of phylogenetic reconstructions to determine the
ancestral genotype, or phylodynamic analysis for following
changes in population structure during an clonal expansion, or
phylogeographical methods for defining the dispersion routes.
In this work, the combination of the widely used protocols based
on multiplex PCR techniques and MLST-based goeBURST
algorithm was compared to phylogenetic analysis using the same
nucleotide information of E. coli MLST genes. Although this
phylogenetic approach can significantly improve our understand-
ing of evolutionary relationships, a wide surveillance of E. coliphylogroups characterization is still dependent on the availability
of simple methods, such as the multiplex PCR mentioned above.
Therefore, we would like to suggest a stepwise approach
supplementing these widely used methods with accurate phyloge-
netic analysis, without additional economic cost.
Material and Methods
Ethics StatementE. coli strains isolated from sheep belong to a bacterial
collection deposited in the Veterinary Hospital of Alfonso X el
Sabio University. The samples were recovered from rectum in
natural flocks of sheep, using routine protocols. This veterinarian
activity was included in the routine surveillance protocol. The
veterinarians did not use drugs, special procedures and no sheep
were sacrificed. This part of the work was supervised by Maria-
Rosario Baquero (co-author in this manuscript).
The strains obtained from wastewater belonging to VISAVET
collection (Centre for Veterinary Health Surveillance) were
donated by Lucas Domınguez (Head of Department of VISA-
VET). We have an agreement about the use of strains from
VISAVET Centre.
Bacterial strains and genomic DNA extractionEighty E. coli strains from different origins and 48 E. coli
complete genomes downloaded from GenBank (Table S1 in File
S1) were included in the collection analysed in this study. Forty-
one clinical strains of 80 strains recovered from extra-intestinal
infections (bacteraemia and urinary infections) and 17/80
commensal E. coli strains obtained from healthy volunteers were
collected at Ramon y Cajal University Hospital in Madrid, Spain.
This collection was supplemented with five strains isolated from
sheep faecal samples and, 17 strains isolated from wastewater. All
80 E. coli strains were incubated in 5 ml Luria Bertani broth in a
shaking incubator for 24 h at 37uC. Genomic DNA was obtained
using 1 mL of overnight bacterial growth, following manual
extraction protocols as recommended by the manufacturers
(QIAamp DNA Mini Kit. QIAGEN GmbH, Hilden, Germany).
Determination of phylogroups, and sequencing of MLSTgenes for population analysis and evolutionaryreconstructions
Initial determination of the phylogenetic groups in our E. colistrain collection was performed following two different, common
multiplex PCR protocols based on the presence/absence of three
genes: chuA, yjaA and TSPE4.C2 [4,5]. Primers and PCR
conditions for the seven housekeeping genes commonly used in E.coli MLST schemes (adk, fumC, icd, mdh, purA, recA and gyrB)
were obtained from databases at the Warwick University website
(http://mlst.warwick.ac.uk/mlst/dbs/Ecoli). Sizes of the amplifi-
cation products were 583, 806, 878, 932, 816, 780, and 911 bp
respectively. PCR products were purified for sequencing with the
QIAquick PCR purification kit (QIAGEN GmbH, Hilden,
Germany). Both the forward and reverse strands were sequenced
with the PCR primers set. Sequencing was performed at
Macrogen, Korea (Gsan-dong Geumchen-gu, Seoul, Korea). Only
MLST gene fragments with sizes around 450–530 bp were used in
the eBURST and goeBURST reconstructions [2,14]. The
amplified complete nucleotide sequence for each gene was used
in the phylogenetic reconstructions. The concatenated-MLST
phylogenetic tree (Con-MLST) was based on a total of 5,384 bp in
comparison to only 3,423 bp considered in eBURST and
goeBURST. The Accession Numbers of the sequenced gene
fragments are the following: KJ858688-KJ858767 (adk),
KJ868241-KJ868320 (fumC), KJ868321-KJ868400 (gyrB),
KJ868401-KJ868480 (icd), KJ868481-KJ868560 (mdh),
KJ868561-KJ868640 (purA) and KJ868641-KJ868720 (recA).
Bayesian phylogenetic analysis based on Con-MLST anddetection of recombination events
Sequences of the seven genes of the MLST scheme (http://mlst.
warwick.ac.uk/mlst/dbs/Ecoli) were used for the reconstruction of
phylogenetic trees in our sampling. Phylogenies were obtained
using a Bayesian Markov Chain Monte Carlo (MCMC) method
implemented in BEAST v1.5.4 program [18]. Analysis was
performed using the best-fit model of nucleotide substitution
selected using the jModelTest program [19]. The TN93 model
with a proportion of invariable sites plus rates vary over sites
according to a gamma distribution was chosen for icd, gyrB and
recA genes. The TN93 model with rates vary over sites according
to a gamma distribution for adk and mdh genes, with a strict
molecular clock model. The GTR model with a proportion of
invariable sites plus rates vary over sites according to a gamma
distribution for fumC and purA genes. Analysis was performed
with a Bayesian Skyline piecewise-constant coalescent tree prior,
using a strict molecular clock model and a random starting tree.
Recombination Blurs Phylogenetic E. coli Groups
PLOS ONE | www.plosone.org 2 August 2014 | Volume 9 | Issue 8 | e105395

Ta
ble
1.
Ph
ylo
gro
up
ing
dis
cre
pan
cie
so
bse
rve
db
etw
ee
ntw
om
ult
iple
xP
CR
pro
toco
ls.
Am
pli
fica
tio
np
att
ern
by
Cle
rmo
nt’
sp
roto
col
Am
pli
fica
tio
np
att
ern
by
Do
um
ith
’sp
roto
col
Gro
up
ass
ign
ed
by
Gro
up
ass
ign
ed
by
Se
qu
en
cety
pe
by
Iso
late
chu
Ayj
aAT
SP
4.C
2C
lerm
on
t’s
pro
toco
lch
uA
yjaA
TS
P4
.C2
Do
um
ith
’sp
roto
col
ML
ST
T6
+2
2D
22
2A
ST3
98
U6
82
+2
A2
++
B1
ST3
37
2
B1
6+
+2
B2
2+
2A
ST5
40
H4
3+
2+
D2
2+
B1
ST3
59
B4
4+
2+
D2
2+
B1
ST6
02
E9+
++
B2
2+
+B
1ST
29
73
C1
7+
2+
D2
2+
B1
ST5
8
T2
2+
2+
D2
2+
B1
ST5
8
T3
0+
++
B2
2+
+B
1ST
15
5
E48
++
+B
22
++
B1
ST3
45
E76
+2
+D
++
+B
2ST
53
7
E42
22
+B
1+
++
B2
ST9
78
E33
22
+B
1+
++
B2
ST3
36
6
do
i:10
.13
71
/jo
urn
al.p
on
e.0
10
53
95
.t0
01
Recombination Blurs Phylogenetic E. coli Groups
PLOS ONE | www.plosone.org 3 August 2014 | Volume 9 | Issue 8 | e105395

Three separate MCMC chains were run for 400,000,000
generations, sampled every 40,000th generation and combined
after a 10% burn-in. BEAST output was analysed using TRACER
v1.5 values of more than 200 of the effective sample size (ESS)
were accepted for convergence and maximum clade credibility
tree was generated after burning 10% samples with posterior
probability limit .0.5 using TreeAnnotator. Species tree was
established using a full sequence (5,384 bp) from the MLST genes,
and species phylogroups were defined by a posterior probability .
0.95 using referenced strains, known to belong to these groups.
To detect recombination events between phylogroups, the
sequence of each individual gene served to construct gene trees
using a Bayesian MCMC method as stated previously. Two
separate MCMC chains were run for 100,000,000 generations,
sampled every 10,000th generation and combined after a 10%
burn-in. Gene phylogroups, defined by a posterior probability .
0.95, were then compared with species phylogroups. We defined a
recombination event as any incongruence detected between the
topology of the consensus Con- MLST tree and individual gene
tree (location of individual genes in different branches with regard
to the expected location).
Determination of population structure, identification offounder clone and reconstruction of ancestral clone
The population structure of the collection of strains was
obtained with the goeBURST analysis program considering the
triple locus variant (TLV) approach, accessed at http://
goeBURST.phyloviz.net, visualizing the relationship between
sequence types (STs), previously determined by MLST using
http://mlst.warwick.ac.uk/mlst/dbs/Ecoli. The founder clone,
the one with most single locus variant links, was identified in ST
complexes (STC) detected in the E. coli collection.
Evolutionary histories with inclusion of recombination events
are represented in reticulate networks. Phylogenetic inferences
were obtained, using the NeighborNet algorithm in SplitsTree v.4
based on spectral analysis from distances, using the same
alignment both in BEAST and SplitsTree programs [20].
When the population structure could be defined using
goeBURST algorithm and phylogenetic approaches, the evolu-
tionary history of characters was reconstructed in order to infer the
ancestral states using MESQUITE software V.2.75 among all STs
belonging to the same STC23. Sequences from the STs
phylogenetically more closely related to STC23 clade (ST1837,
ST806 and ST3458) were downloaded from the MLST database
and served as outgroup for the tree construction.
Figure 1. E. coli population structure visualized using goeBURST. A) Phylogroups identified based on Clermont’s protocol. B) Phylogroupsidentified based on Doumith’s protocol. The phylogroups are identified by colors: blue, orange, green and red correspond to B1, A, D and B2respectively. ST numbers assigned are overprinted. STs with #3 differences (TLV) are connected by lines of different thickness (thicker linecorresponds to single locus variant, SLV).doi:10.1371/journal.pone.0105395.g001
Recombination Blurs Phylogenetic E. coli Groups
PLOS ONE | www.plosone.org 4 August 2014 | Volume 9 | Issue 8 | e105395
Ancestral reconstruction was inferred excluding STs where
recombination was suspected. Intra-gene recombination was
analysed using Recombination Detection Program (RDP) version
3. Later, inter-genome recombination was excluded when by
comparing the topology of individual genes versus Con-MLST
using the Tree-Puzzle program.
Results
Comparing multiplex PCR methods, MLST, and globaloptimal eBURST analysis
According to Clermont’s protocol [4] of multiplex PCR for
assignment of E. coli phylogroups, 19/80 strains in our collection
were group A (23.7%), 20/80 group B1 (25%), 21/80 were group
B2 (26.3%) and 20/80 group D (25%). However, following
Doumith’s method [5] 20/80 strains were group A (25.0%), 26/80
group B1 (32.5%), 20/80 were group B2 (25%) and 14/80 group
D (17.5%) (Table S2 in File S1). Therefore, 13/80 (16.2%) strains
were assigned to different phylogroups when using one or another
protocol (Table 1). The most common discrepancies between both
protocols were observed with the allocation of phylogroup D (6/
13; 46.1%). Strains identified as phylogroup D following
Clermont’s protocol were assigned as either B1, A, or B2
phylogroup in Doumith’s method.
Following the recommendations of MLST scheme, 50 different
STs were identified in our collection; the inferred population
structure was visualized using goeBURST where the phylogroups
identified based on Clermont and Doumith’s schemes are
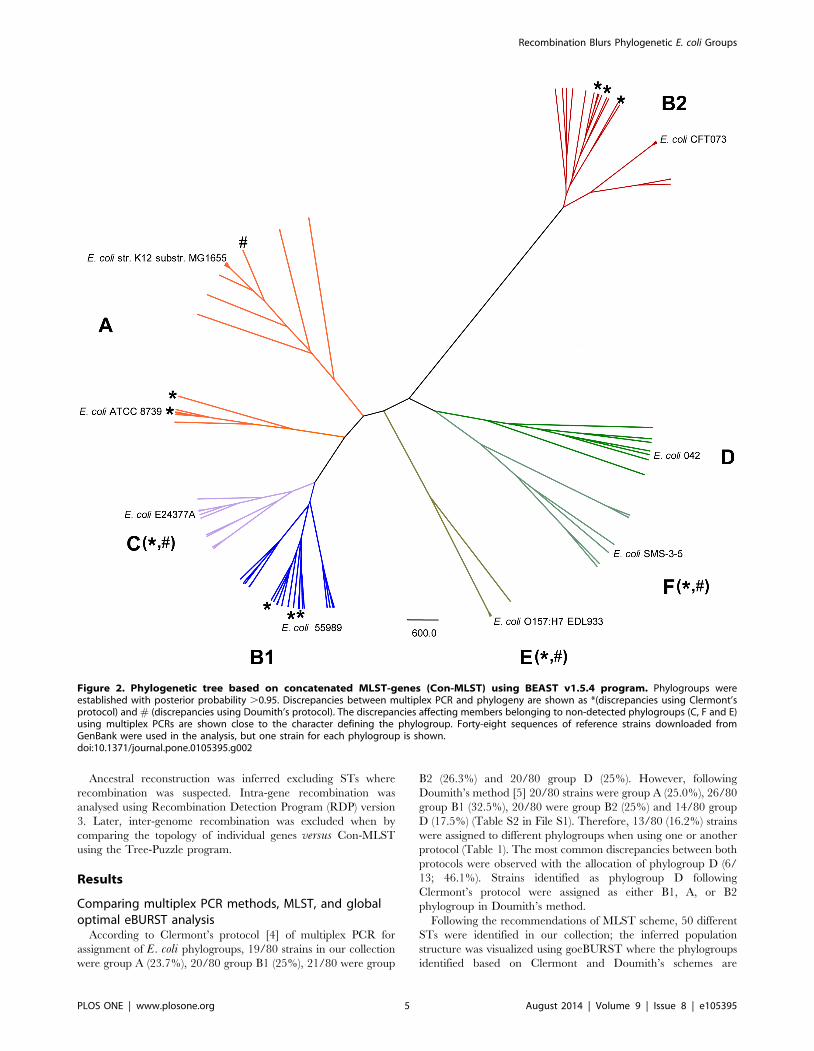
Figure 2. Phylogenetic tree based on concatenated MLST-genes (Con-MLST) using BEAST v1.5.4 program. Phylogroups wereestablished with posterior probability .0.95. Discrepancies between multiplex PCR and phylogeny are shown as *(discrepancies using Clermont’sprotocol) and # (discrepancies using Doumith’s protocol). The discrepancies affecting members belonging to non-detected phylogroups (C, F and E)using multiplex PCRs are shown close to the character defining the phylogroup. Forty-eight sequences of reference strains downloaded fromGenBank were used in the analysis, but one strain for each phylogroup is shown.doi:10.1371/journal.pone.0105395.g002
Recombination Blurs Phylogenetic E. coli Groups
PLOS ONE | www.plosone.org 5 August 2014 | Volume 9 | Issue 8 | e105395

overprinted (Fig. 1). According to the obtained representation,
Doumith’s scheme offers more coherent assignment that the
previous Clermont’s protocol. Close to 83% of the STs (10/12) in
which phylogroup discrepancies were found between both
schemes were apparently better assigned using Doumith’s
recommendations according to population structure inferred by
goeBURST representation. In any case it is patent that this
representation offers a quite dispersed population structure inside
each lineage with very few well-defined relations among different
STs, and is obviously insufficient to detect evolutionary relation-
ships among them. For instance, only two primary founder STs (in
STC23 and in STC10) could be suspected among the strains
belonging to phylogroup A (Fig. 1).
E. coli lineages and evolutionary relationships obtainedby phylogenetic reconstruction analysis versus multiplexPCR and goeBURST protocols
The phylogenetic tree of seven concatenated MLST-genes
(5,384 bp) was used to classify our E. coli collection of strains. The
Con-MLST-genes phylogenetic reconstruction fully depicted the
seven macro-evolutionary lineages of E. coli sensu stricto (A, B1,
C, B2, D, E and F) [7–12], allowing a more accurate definition of
lineages (Fig. 2) in comparison with the pattern obtained with the
concatenated fragment of 3,423 bp used in eBURST (Fig. S1). It
now became patent that E. coli strains of this collection were
distributed in seven evolutionary lineages, and strains belonging to
phylogroups C (14 strains), E (1 strain) and F (8 strains) were
identified (Fig. 2). According to the new reclassification observed
with Con-MLST phylogenetic reconstruction, globally Clermont’s
protocol reached 38.7% of misclassified phylogroups in our
collection; whereas following Doumith’s protocol the discrepancies
were 30%. These misclassifications are so high because these
multiplex PCR protocols were designed to classify only the main
phylogroups (A, B1, B2 and D). According to the Bayesian tree,
the strains allocated in phylogroup C were previously identified as
A (6/14) and B1 (8/14) using Doumith’s scheme, or as A (6/14),
B1 (4/14), B2 (2/14) or D (2/14) applying Clermont’s protocol.
Moreover the strains assigned to E and F phylogroups corre-
sponded to those identified as phylogroup D using any multiplex-
PCR protocol. When the results were re-analysed excluding non-
detected minority phylogroups, the misclassifications were 14.0%
and 1.7% for Clermont and Doumith protocols respectively,
confirming more accurate allocation following Doumith’s proto-
cols as was suggested in a previous section (Fig. 2).
When considering the results obtained with phylogenetic
reconstruction, the population structure represented in Figure 1
could be re-interpreted with more precision, combining an
approach between phylogeny and goeBURST (Fig. 3).
In order to improve our understanding of the evolutionary
relationships among strains of this collection a new approach was
generated using NeighbourNet algorithm (Fig. 4). This figure
shows a high rate of interaction at different levels in and between
different lineages, which enables a better establishment of
relationships among all sequences than with goeBURST [3].
Reticulations in the diagram are suggestive of recombination
events (although other options such as convergent evolution or
lack of resolution can be suspected). While strains assigned to
Figure 3. E. coli population structure of our collection visualized by using goeBURST in combination with Con-MLST phylogeneticanalysis. Up: Four phylogroups identified based on multiplex PCR techniques. Down: Seven phylogroups based on Con-MLST phylogenetic analysis.doi:10.1371/journal.pone.0105395.g003
Recombination Blurs Phylogenetic E. coli Groups
PLOS ONE | www.plosone.org 6 August 2014 | Volume 9 | Issue 8 | e105395

phylogroup B2 mostly indicated only intraclade recombination,
strains belonging to phylogroups A, B1 and C showed the highest
rate of homoplasy. These results emphasize the important weight
of recombination in shaping the evolutionary relationships
between E. coli isolates.
Discrepancies between phylogenetic and non-phylogenetic analysis of E. coli population structure aredue to recombination events
Phylogenetic trees obtained using individual genes from MLST
schema were compared with the consensus Con-MLST tree
revealing phylogenetic incongruences. We interpreted these
incongruences as resulting from acquisition of exogenous DNA
(Fig. 5). Table 2 shows the percentage of incongruences for
lineages and also the impact of recombination in individual
MLST genes. The B2 phylogroup showed the lowest intergroup
recombination frequencies (1.6%), while B1 phylogroup had the
highest ones (17.7%) among non-recombinant lineages (A, B1, B2
and D). On the other hand, the very high frequency of
incongruences for several genes in minority phylogroups (C, E
and F) suggested that these phylogroups could be the result of
ancient recombination events. According to these data, the
phylogroup C could be a new lineage derived from recombination
events that have occurred between members of phylogroups B1
and A. The results explain why phylogroup C was misclassified as
phylogroup A (8 strains) or B1 (6 strains) using the multiplex PCR
approach (see previous section). Similarly, we were able to identify
strains belonging to phylogroup F showing promiscuous gene
interactions with phylogroup D and other phylogroups. The high
frequency of incongruences observed within phylogroup F
identifies at least two different ancestral recombination events in
this phylogroup, suggesting the possibility of emergence of a new
branch (Fig. 5). To avoid overestimation in the recombination
frequencies in C, E and F phylogroups, we only recorded as true
recombination the cases where the donor phylogroup was different
to the phylogroup involved in ancestral recombination (Table 2).
Differences were observed even among non-recombinant
lineages in the recombination frequencies for the different MLST
genes. gyrB, mdh and recA genes showed the lowest frequencies of
incongruences (0%, 4.2% and 4.2% respectively), whereas adk and
purA genes showed the highest ones (17.9% and 15.8%
respectively). These results revealed the high interchange frequen-
cy affecting these genes in both recombinant and non-recombi-
nant lineages, suggesting that the selection of purA and adk genes
should be re-evaluated for the purposes of future MLST-typing.
Tracing the hypothetical evolutionary trajectories of thestrains using eBURST and phylogenetic reconstructions
In the combined representation using phylogeny and goe-
BURST, only A and C phylogroups showed a well-defined
population structure, thus allowing identification of the founder
clones (Fig. 3). According to the simplest evolutionary model, the
central position in the population structure corresponds to the
founder clone. In phylogroup C, the ST88 could be considered the
founder clone of ST23, ST791, ST410 (Fig. 6A), but at the MLST
database the founder clone corresponds to ST23 belonging to
Figure 4. Network phylogenetic analysis based on Con-MLST obtained with NeighborNet algorithm in SplitsTree v.4. Thisrepresentation allows inferring more complex interactions among the strains than goeBURST. The main phylogroups are differentiated in colouredcircles. Members belonging to phylogroup C are located in two positions in the tree as two different patterns of recombination between B1 and Aphylogroups were observed (see Figure 5).doi:10.1371/journal.pone.0105395.g004
Recombination Blurs Phylogenetic E. coli Groups
PLOS ONE | www.plosone.org 7 August 2014 | Volume 9 | Issue 8 | e105395

STC23 (Fig. 6B). This discrepancy could be the consequence of
the low representation of STC23 in our collection. In order to
resolve this discrepancy, all STs from the MLST database were
reanalyzed (Fig. S2 and Fig. S3), using MESQUITE (see material
and methods) for ancestor reconstruction, but surprisingly a new
ancestor clone was found (Fig. 6C). The ancestral position was
now occupied by ST410. In fact ST23 was identified as a
secondary founder clone of ST360 (evolved variant of ST410).
Now ST360 was ancestral clone of both secondary founders ST23
and ST88 both of which had different evolutionary trajectories.
Discussion
Escherichia coli is a good example of host-adaptable bacterial
species depicting a wide eco-pathological diversity. The population
structure of E. coli certainly reflects the ecogenetics of this
organism, which is highly dependent on recombinational and
mutational events, not only involving adaptive mobile genes, but
probably also housekeeping genes [1,7,8,21]. Misclassifications in
E. coli lineages or phylogenetic groups could be not only the
consequence of non-specific amplification (point mutations) but
also of horizontal gene transfer. In this paper a comparative
analysis of two different techniques (multiplex PCR plus MLST
and Con- and individual-MLST-phylogeny) for phylogroup
Figure 5. Consensus tree based on Con-MLST; overprinted, the concatenated trees of individual genes used in MLST analysis.Maximum clade credibility tree was generated after burning 10% samples with posterior probability limit .0.5 using TreeAnnotator. Each segment inthe figure corresponds to the seven genes used in MLST scheme in the following order: adk-icd-fumC-recA-mdh-gyrB-purA, being adk gene the innersegment. Recombination events in the different individual genes are shown. Phylogroups (A, B1, D, B2; U = unknown) were established with posteriorprobability .0.95. This approximation infers that most of the novel lineages could be the result of recombination events.doi:10.1371/journal.pone.0105395.g005
Recombination Blurs Phylogenetic E. coli Groups
PLOS ONE | www.plosone.org 8 August 2014 | Volume 9 | Issue 8 | e105395

assignment and population structure analysis was performed on a
selected E. coli strain collection.
In order to determine the impact of the mutations we compared
Doumith’s multiplex PCR protocol [5] updating the design of the
primers used in the 2000 Clermont’s method [4], reducing
unspecific annealing and promoting specific amplification, thus
improving coverage. Non-specific amplifications (as for an acetyl-
hydrolase gene) using conventional Clermont’s protocol have been
reported for B1 isolates [22], but this protocol has also occasionally
failed in the amplification of chuA and/or yjaA [5,23,24,25,26]. In
fact, in our series Clermont’s multiplex PCR approach provides a
worse assignment (14.0% misclassified) than Doumith’s schema
(1.7%), when C, E and F lineages were excluded. Both protocols
exhibited the highest discrepancies in the assignment of the
phylogroup D, as was previously observed [5,6]. Of course a
limitation of the tested multiplex PCR techniques is that they
cannot detect the minority phylogroups (C, E, F) and Escherichiaclade I, and the correct identification of minority or recombinant
phylogroups is clinically relevant [27]. There was a high rate of
wrong classifications in our collection, both for the tested
Clermont’s (38.7%) and Doumith’s protocols (30%), higher than
in previous publications [5,6]. Therefore, if in the sample under
study there is a substantial proportion of the minority phylogroups
the reliability for assigning relations among the members of the
population structure could be significantly impaired [28]. Does
Con-MLST phylogeny reflect whole genome phylogeny? Al-
though whole genome analysis should give the most precise
phylogenetic reconstruction, it is currently still out of reach for
routine molecular epidemiology. Though any gene could be
involved in horizontal gene transfer events [29], recombination
has not occurred at a sufficient level to disrupt the phylogenetic
signal present in whole genome datasets [17]. Phylogenetic
analysis based on Con-MLST showed better resolution than
concatenated fragment used in eBURST respect to whole genome
analysis (Fig. 2 and Fig. S1). Likewise it is remarkable how strains
belonging to clonal complexes (as STC66 and STC23) clearly
assigned to phylogroup C by phylogenetic reconstruction were
identified as members of phylogroup A by multiplex PCR in
previous works [10,27], assigned as B1 in MLST web page, and as
AxB1 in other publications [30]. This illustrates the difficulty in
the allocation of strains with recombinant phylogenetic origin.
The population structure E. coli using goeBURST based on
MLST sequences offers advantages in the characterization of
acute outbreaks, however a limitation of this approach is observed
in non-epidemic situations, in which population structure is very
dispersed and there is only scarce relation between STs.
Recombination events play an important role in the evolution of
E. coli [26,31,32,33], for instance individual genes-MLST
phylogeny confirmed a high recombination frequency among E.coli strains included in our collection. The most frequent gene
exchange was observed between the seemingly evolutionary close
phylogroups A and B1, in which the generation and selection of
new recombinant forms is more probable, such as C or F
phylogroups [30]. Therefore NeighbourNet phylogeny helps us to
understand the complex population structure of E. coli (Fig. 4),
because the reticulations could suggest the presence of recombi-
nation events.
Interestingly, the recombination events do not have a similar
distribution in the different phylogroups. Members of phylogroup
B2 showed 10-fold lower recombination events than phylogroup
B1. These results agreed with recently published whole genome
analysis [25,34]. Figure 2 shows that branches corresponding to
phylogroup B2 and E are very isolated with respect to other E. colilineages, illustrating few opportunities of recombination. In fact
Ta
ble
2.
MLS
Tg
en
es
reco
mb
inat
ion
fre
qu
en
cie
sin
ferr
ed
inth
ed
iffe
ren
tE.
coli
ph
ylo
ge
ne
tic
gro
up
s.
Ph
ylo
ge
ne
tic
gro
up
adk
icd
fum
Cre
cAm
dh
gyr
Bp
urA
To
tal
Cla
sso
fp
hy
log
en
eti
cg
rou
p(n
um
be
ro
fst
rain
s)%
%%
%%
%%
%
Mai
ng
rou
ps
(No
n-R
eco
mb
inan
t)B
2(n
=3
5)
00
08
.62
,90
01
.6
B1
(n=
25
)2
04
44
48
04
41
7.7
A(n
=2
8)
42
.90
17
.90
00
7.1
9.7
D(n
=7
)0
02
8.6
01
4.3
02
8.6
10
.2
TO
TA
L(n
=9
5)
17
.91
1.6
8.4
4.2
4.2
01
5.8
8.9
Min
ori
tyg
rou
ps
(Re
com
bin
ant)
C(n
=1
5)
6.7
6.7
b0
6.7
0b
20
46
.7c
12
.4
F(n
=1
1)
18
.20
63
.63
6.4
02
7.3
b5
4.5
d2
8.6
E(n
=7
)0
14
.3b
00
00
b0
b2
.1
TO
TA
L(n
=3
3)
9.1
6.1
21
.21
5.1
01
8.2
39
.41
6.4
Re
com
bin
atio
nfr
eq
ue
ncy
was
infe
rre
das
nu
of
ph
ylo
ge
ne
tic
inco
ng
rue
nce
sw
ith
resp
ect
toto
tal
nu
mb
er
of
stra
ins
ine
ach
ph
ylo
gro
up
.a
pu
rAg
en
eb
elo
ng
sto
ph
ylo
gro
up
Ain
seve
nst
rain
san
din
eig
ht
of
the
mb
elo
ng
sto
ph
ylo
gro
up
B1
.b
pu
rAg
en
be
lon
gs
top
hyl
og
rou
pD
infi
vest
rain
san
din
six
of
the
mb
elo
ng
sto
ph
ylo
gro
up
B2
.d
oi:1
0.1
37
1/j
ou
rnal
.po
ne
.01
05
39
5.t
00
2
Recombination Blurs Phylogenetic E. coli Groups
PLOS ONE | www.plosone.org 9 August 2014 | Volume 9 | Issue 8 | e105395

strains of phylogroup B2 tend not to coexist with strains of other
phylogroups [35]. Genetic isolation could explain the excellent
allocation of strains belonging to phylogroup B2 when using
multiplex PCR protocols (85% for Clermont’s method and 100%
for Doumith’s method, respectively). Those collections containing
a high proportion of more recombinogenic strains will be less
precisely analyzed by multiplex PCR [28].
Although a priori the main limitations of multiplex PCR+eBURST approaches are the non-identification of recombinant
lineages and very dispersed population structure, the eBURST
analysis can eventually generate discrepancies in the identification
of ST ancestor clones and in the recognition of evolutionary
trajectories, with consequences in the characterization of local
clonal invasions and outbreaks. For instance, among the STs
belonging to phylogroup C, two different founder clones were
identified according to MLST database and our collection (ST23
and ST88 respectively). In order to resolve this discrepancy, all
STs from the MLST database were reanalyzed (Fig. S2 and Fig.
S3). Following the eBURST algorithm, ST88 was identified as
founder clone (47 SLV); however, the ancestral phylogenetic
reconstruction identified ST410 as ancestral clone. Thus, the
evolutionary trajectories showed that ST88 and ST23 were clones
evolved from ST360 which derived directly from ST410 (Fig. 6C).
Our study suggests that ancestor’s reconstruction might be
relevant in the characterization of the emergent local clonal
invasions and epidemic outbreaks. In this respect, Con-MLST
phylogenetic analysis could help eBURST analysis to characterize
the evolutionary dynamics in clonal invasions, expansions and
outbreaks, especially those caused by pathogenic strains that can
be submitted to a fast evolution. Recombination constitutes a
severe limitation for the construction of reliable phylogenetic trees.
In fact, previously to perform a phylogenetic tree, recombination
must be excluded to the best of our possibilities.
The first caveat of our study is the relatively low sample size, but
our collection has a well-balanced representation of all phy-
logroups. A second limitation in our comparative study was the
lack of inclusion of the recently described multiplex PCR method
developed by Clermont et al. which is able to correctly assign
almost all lineages including non-recombinant phylogroups [11].
Nevertheless, even in the best possible scenario, multiplex PCR
techniques are expected to fail in allocating recombinant variants,
which might give rise to successful combinations between very
evolutionary related phylogroups such as A and B1.
Finally, we suggest a practical analytical approach based in
three successive complexity steps. First, assignment of phylogroups
following the Doumith’s protocol discriminating among A/B1/C,
Figure 6. Hypothetical evolutionary reconstruction of founder clone in STC23. A) eBURST of members belonging to STC23 present in ourcollection. B) eBURST of complete clonal complex STC23 according to information available in MLST database. C) Phylogenetic reconstruction ofancestral state in STC23 using MESQUITE v. 2.75. Numbers in bold type indicate non-synonymous changes. STs in grey box correspond to founder.According to this analysis ST410 could be the ancestral clone and ST88 a sub-founder clone derived from ST360, which was not recognised in eBURST asfounder clone, aeBURST shows the relation between ST with only one allelic variation (SLV). Box with? symbol indicates an unknown hypothetical ancestral.doi:10.1371/journal.pone.0105395.g006
Recombination Blurs Phylogenetic E. coli Groups
PLOS ONE | www.plosone.org 10 August 2014 | Volume 9 | Issue 8 | e105395

D/F/E and B2 lineages. Second, sequencing of MLST genes
helping to identify specific successful clones in outbreaks or clonal
expansions (goeBURST). Third, using phylogenetic reconstruc-
tions for the precise assignment of lineages, the characterization of
population networks and evolutionary dynamics, especially if
dealing with populations involving a high proportion of recom-
binants, fast-evolving strains, or isolates obtained along extended
periods of time. In spite of a slightly higher complexity, we
recommend the application of phylogenetic approaches based on
Con-MLST, as an affordable alternative to the more expensive
high-resolution studies based on complete genome sequencing.
Supporting Information
Figure S1 Phylogenetic tree based on concatenatedfragment of 3,423 bp used in eBURST. Phylogroups were
established with posterior probability .0.95. Forty-eight sequenc-
es of reference strains downloaded from GenBank were used in the
analysis, but one strain for each phylogroup is shown. The
phylogenetic tree was obtained using BEAST v1.5.4 program.
(TIF)
Figure S2 eBURST obtained with all STs available inMLST database closely related to STC23. In accordance
with the eBURST roles, ST88 is presumed to be the founder clone
(maximum number of SLVs) with 47 SLV. However the number
of SLV only reveals the clone with the most diversification rate,
but not necessarily the ancestor clone.
(TIF)
Figure S3 Bayesian phylogenetic tree with all STsavailable in MLST database closely related to STC23.The known STs most phylogenetically related to STC23 clade was
established as an outgroup of the tree, which was necessary in the
ancestral reconstruction approach. The STs into boxes correspond
to defined ST in MLST webpage as clonal complex STC23.
Maximum clade credibility tree was generated after burning 10%
samples with posterior probability limit .0.5 using TreeAnno-
tator.
(TIF)
File S1 Supporting tables.
(DOC)
Acknowledgments
MCT PhD is supported by the European Union (EvoTAR-FP7-Health-
2011-282004) and JMGA is supported by a fellowship from the Regional
Government of Madrid in Spain (PROMT-S2010/BMD2414). We are
grateful to Professor Lucas Domınguez and Aranzazu Valverde PhD for
their sewage decontamination plant strains and to Mary Harper for her
assistance in the preparation of the manuscript.
Author Contributions
Conceived and designed the experiments: JCG FB. Performed the
experiments: MCT JMGA. Analyzed the data: MCT JMGA FB JCG
MRB RC RDC. Contributed reagents/materials/analysis tools: RC MRB.
Wrote the paper: MCT JMGA FB JCG.
References
1. Wirth T, Falush D, Lan R, Colles F, Mensa P, et al. (2006) Sex and virulence in
Escherichia coli: an evolutionary perspective. Mol Microbiol 60: 1136–1151.
2. Maiden MC, Bygraves JA, Feil E, Morelli G, Russell JE, et al. (1998) Multilocus
sequence typing: a portable approach to the identification of clones within
populations of pathogenic microorganisms. Proc Natl Acad Sci U S A 95:
3140–3145.
3. Maiden MC, van Rensburg MJ, Bray JE, Earle SG, Ford SA, et al. (2013)
MLST revisited: the gene-by-gene approach to bacterial genomics. Nat Rev
Microbiol 11: 728–736. doi: 10.1038/nrmicro3093.
4. Clermont O, Bonacorsi S, Bingen E (2000) Rapid and simple determination of
the Escherichia coli phylogenetic group. Appl Environ Microbiol 66: 4555–4558.
5. Doumith M, Day MJ, Hope R, Wain J, Woodford N (2012) Improved multiplex
PCR strategy for rapid assignment of the four major Escherichia coliphylogenetic groups. J Clin Microbiol 50: 3108–3110. doi: 10.1128/
JCM.01468-12.
6. Gordon DM, Clermont O, Tolley H, Denamur E (2008) Assigning Escherichiacoli strains to phylogenetic groups: multi-locus sequence typing versus the PCR
triplex method. Environ Microbiol 10: 2484–2496. doi: 10.1111/j.1462-
2920.2008.01669.x.
7. Tenaillon O, Skurnik D, Picard B, Denamur E (2010) The population genetics
of commensal Escherichia coli. Nat Rev Microbiol 8: 207–17. doi: 10.1038/
nrmicro2298.
8. Jaureguy F, Landraud L, Passet V, Diancourt L, Frapy E, et al. (2008)
Phylogenetic and genomic diversity of human bacteremic Escherichia colistrains. BMC Genomics 9: 560. doi: 10.1186/1471-2164-9-560.
9. Clermont O, Gordon DM, Brisse S, Walk ST, Denamur E (2011)
Characterization of the cryptic Escherichia lineages: rapid identification and
prevalence. Environ Microbiol 13: 2468–2477. doi: 10.1111/j.1462-
2920.2011.02519.x.
10. Moissenet D, Salauze B, Clermont O, Bingen E, Arlet G, et al. (2010) Meningitis
caused by Escherichia coli producing TEM-52 extended-spectrum beta-
lactamase within an extensive outbreak in a neonatal ward: epidemiological
investigation and characterization of the strain. J Clin Microbiol 48: 2459–2463.
doi: 10.1128/JCM.00529-10.
11. Clermont O, Christenson JK, Denamur E, Gordon DM (2013) The Clermont
Escherichia coli phylo-typing method revisited: improvement of specificity and
detection of new phylo-groups. Environ Microbiol Rep 5: 58–65. doi: 10.1111/
1758-2229.12019.
12. Lescat M, Clermont O, Woerther PL, Glodt J, Dion S, et al. (2012) Commensal
Escherichia coli strains in Guiana reveal a high genetic diversity with host-
dependant population structure. Environ Microbiol Rep 5: 49–57. doi: 10.1111/
j.1758-2229.2012.00374.x.
13. Feil EJ, Li BC, Aanensen DM, Hanage WP, Spratt BG (2004) eBURST:
inferring patterns of evolutionary descent among clusters of related bacterial
genotypes from multilocus sequence typing data. J Bacteriol 186: 1518–1530.
14. Francisco AP, Bugalho M, Ramirez M, Carrico JA (2009) Global optimal
eBURST analysis of multilocus typing data using a graphic matroid approach.
BMC Bioinformatics 10: 152. doi: 10.1186/1471-2105-10-152.
15. Lawrence JG, Ochman H (2002) Reconciling the many faces of lateral gene
transfer. Trends Microbiol 10: 1–4.
16. Mau B, Glasner JC, Darling AE, Perna NT (2006) Genome-wide detection and
analysis of homologous recombination among sequenced strains of Escherichiacoli. Genome Biol 7: R44.
17. Touchon M, Hoede C, Tenaillon O, Barbe V, Baeriswyl S, et al. (2009)
Organised genome dynamics in Escherichia coli results in highly diverse adaptive
paths. PLoS Genet 5: e1000344. doi: 10.1371/journal.pgen.1000344.
18. Drummond A, Rambaut A (2007) BEAST: Bayesian evolutionary analysis by
sampling trees. BMC Evol Biol 7: 214.
19. Posada D (2008) jModelTest: phylogenetic model averaging. Mol Biol Evol 25:
1253–1256. doi: 10.1093/molbev/msn083.
20. Huson DH, Bryant D (2006) Application of phylogenetic networks in
evolutionary studies. Mol Biol Evol 23: 254–267.
21. Vos M, Didelot X (2009) A comparison of homologous recombination rates in
bacteria and archaea. ISME J 3: 199–208. doi: 10.1038/ismej.2008.93.
22. Ruiz del Castillo B, Ocampo-Sosa AA, Martınez-Martınez L (2011) Detection of
phylogenetic group B1 Escherichia coli by multiplex PCR: description of a new
amplification pattern. Enferm Infecc Microbiol Clin 29: 785–786. doi: 10.1016/
j.eimc.2011.07.004.
23. Mendonca N, Calhau V, Lin T, Boaventura L, Ribeiro G, et al. (2011) Unusual
genotype of a uropathogenic Escherichia coli strain assigned to the B2
phylogenetic group. J Clin Microbiol 49: 3105–3106. doi: 10.1128/
JCM.00585-11.
24. Molina-Lopez J, Aparicio-Ozores G, Ribas-Aparicio RM, Gavilanes-Parra S,
Chavez-Berrocal ME, et al. (2011) Drug resistance, serotypes, and phylogenetic
groups among uropathogenic Escherichia coli including O25-ST131 in Mexico
City. J Infect Dev Ctries 5: 840–849.
25. Smet A, Martel A, Persoons D, Dewulf J, Heyndrickx M, et al. (2010)
Characterization of extended-spectrum beta-lactamases produced by Escherich-ia coli isolated from hospitalized and nonhospitalized patients: emergence of
CTX-M-15-producing strains causing urinary tract infections. Microb Drug
Resist 16: 129–134. doi: 10.1089/mdr.2009.0132.
26. Rasko DA, Rosovitz MJ, Myers GS, Mongodin EF, Fricke WF, et al. (2008) The
pangenome structure of Escherichia coli: comparative genomic analysis of E. colicommensal and pathogenic isolates. J Bacteriol 190: 6881–6893. doi: 10.1128/
JB.00619-08.
Recombination Blurs Phylogenetic E. coli Groups
PLOS ONE | www.plosone.org 11 August 2014 | Volume 9 | Issue 8 | e105395

27. Lemaıtre C, Mahjoub-Messai F, Dupont D, Caro V, Diancourt L, et al. (2013) A
conserved virulence plasmidic region contributes to the virulence of themultiresistant Escherichia coli meningitis strain S286 belonging to phylogenetic
group C. PLoS One 8: e74423. doi: 10.1371/journal.pone.0074423.
28. Escobar-Paramo P, Grenet K, Le Menac’h A, Rode L, Salgado E, et al. (2004)Large-scale population structure of human commensal Escherichia coli isolates.
Appl Environ Microbiol 70: 5698–5700.29. Jain R, Rivera MC, Lake JA (1999) Horizontal gene transfer among genomes:
the complexity hypothesis. Proc Natl Acad Sci U S A 96: 3801–3806.
30. Homeier T, Semmler T, Wieler LH, Ewers C (2010) The GimA locus ofextraintestinal pathogenic E. coli: does reductive evolution correlate with habitat
and pathotype? PLoS ONE 5: e10877. doi:10.1371/journal.pone.0010877.31. Dobrindt U, Hochhut B, Hentschel U, Hacker J (2004) Genomic islands in
pathogenic and environmental microorganisms. Nat Rev Microbiol 2: 414–424.
32. Baquero F, Tobes R (2013) Bloody coli: a gene cocktail in Escherichia coliO104:H4. MBio 4: e00066–13. doi: 10.1128/mBio.00066-13.
33. Didelot X, Meric G, Falush D, Darling AE (2012) Impact of homologous and
non-homologous recombination in the genomic evolution of Escherichia coli.BMC Genomics 13: 256. doi: 10.1186/1471-2164-13-256.
34. Gonzalez-Gonzalez A, Sanchez-Reyes LL, Delgado Sapien G, Eguiarte LE,
Souza V (2013) Hierarchical clustering of genetic diversity associated to differentlevels of mutation and recombination in Escherichia coli: a study based on
Mexican isolates. Infect Genet Evol 13: 187–197. doi: 10.1016/j.meegid.
2012.09.003.35. Smati M, Clermont O, Le Gal F, Schichmanoff O, Jaureguy F, et al. (2013)
Real-Time PCR for quantitative analysis of human commensal Escherichia colipopulations reveals a high frequency of subdominant phylogroups. Appl Environ
Microbiol 79: 5005–5012. doi: 10.1128/AEM.01423-13.
Recombination Blurs Phylogenetic E. coli Groups
PLOS ONE | www.plosone.org 12 August 2014 | Volume 9 | Issue 8 | e105395
Related Documents