DOCTORAL THESIS Reclamation of Acid-Generating Waste Rock by In-Pit Backfilling and Sealing An Evaluation of the Kimheden Mine Site, Northern Sweden Lucile Villain Lucile Villain Reclamation of Acid-Generating Waste Rock by In-Pit Backfilling and Sealing

Welcome message from author
This document is posted to help you gain knowledge. Please leave a comment to let me know what you think about it! Share it to your friends and learn new things together.
Transcript
DOCTORA L T H E S I S
Department of Civil, Environmental and Natural Resources EngineeringDivision of Geosciences and Environmental Engineering Reclamation of Acid-Generating Waste Rock
by In-Pit Backfilling and SealingAn Evaluation of the Kimheden Mine Site,
Northern Sweden
Lucile Villain
ISSN 1402-1544ISBN 978-91-7583-085-8 (print)ISBN 978-91-7583-086-5 (pdf)
Luleå University of Technology 2014
Lucile Villain R
eclamation of A
cid-Generating W
aste Rock by In-Pit B
ackfilling and Sealing
ISSN: 1402-1544 ISBN 978-91-7583-XXX-X Se i listan och fyll i siffror där kryssen är

Reclamation of acid-generating waste rock by in-pit backfilling and sealing
An evaluation of the Kimheden mine site, northern Sweden
Lucile Villain
Luleå University of TechnologyDepartment of Civil, Environmental and Natural Resources Engineering
Division of Geosciences and Environmental Engineering
Doctoral thesis, December 2014

Printed by Luleå University of Technology, Graphic Production 2014
ISSN 1402-1544 ISBN 978-91-7583-085-8 (print)ISBN 978-91-7583-086-5 (pdf)
Luleå 2014
www.ltu.se
Cover image:
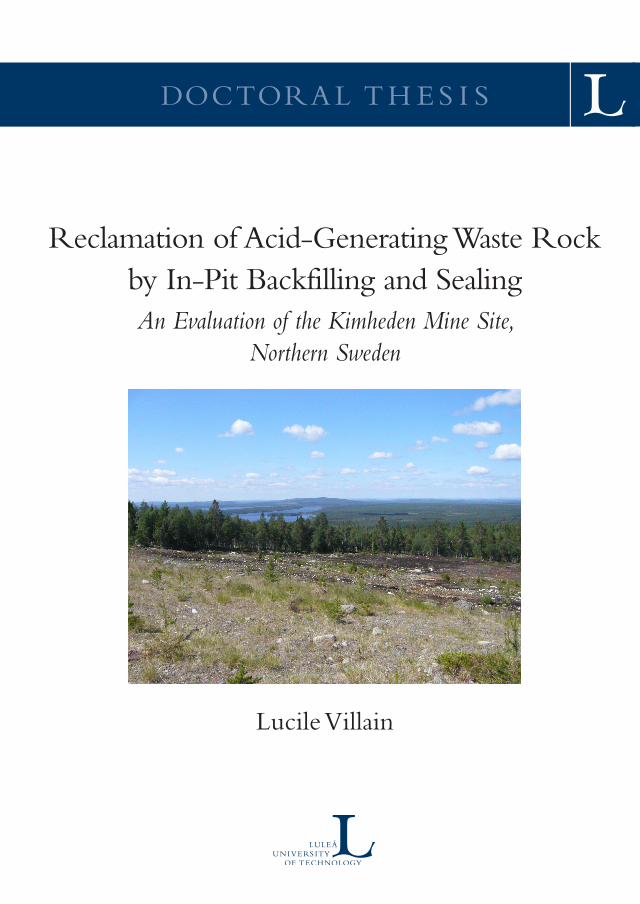
View from the Kimheden mine site over the hill Hornberget and the lake Hornträsket in the background. Photograph taken from the main covered backfilled open pit of the site (L.Villain).

À ma petite famille

ABSTRACT
The notion of mine site reclamation is very recent compared to the history of mining. In the past, mine sites were left as is following termination of the operations, but modern regulations require anticipation of long-term contamination of the surrounding environment and return of the land to a sustainable use. A primary concern for mines used to extract sulphide-rich ores is the generation of acid mine drainage (AMD), a low-pH and metal-rich solution formed when sulphidic mining wastes and mining surfaces come into contact with oxygen and water. AMD may be responsible for the contamination of watercourses and other receiving environments far downstream of the site. Thus, reclamation at such sites will usually involve measures intended to prevent or mitigate its generation. Despite their relatively recent introduction, the increasing time that has passed since the first prevention and mitigation programmes were applied at mine sites, some two to three decades ago, provides an invaluable opportunity to assess their long-term effects on the abatement of AMD.
Reclamation at the Kimheden copper mine in Västerbotten, northern Sweden, involved the progressive backfilling of two small open pits with waste rock and application of a dry cover in 1996, in order to reduce the influx of atmospheric oxygen into the waste. The objective of the studies this thesis is based upon, performed in 2009 – 2014, was to evaluate the effects of these reclamation measures on the abatement of Cu and Zn-rich AMD and to identify potential inad-equacies in them, using geochemical, geophysical and hydrogeological methods.
The results show that despite large reductions in Cu and Zn concentrations in the receiving stream following reclamation, its water quality has remained in a steady state for about a decade and is still not considered satisfactory for discharge into the natural environment. Steady-state moderately high concentrations in the stream, together with a relatively short turnover time for water in contact with the waste rock, indicate that sulphide oxidation is continuing in the backfill despite the cover. Hydrogeochemical modelling suggests that the rate of oxygen consumption by sulphide oxidation in the waste rock is higher than the expected rate of diffusion through the dry cover. Substantial ingress of oxygen into the waste was also corroborated by stable isotope mea-surements and direct measurements of dissolved oxygen concentrations in the groundwater of the backfill. According to sulphate isotope distributions in the mine drainage, oxidation of pyrite by Fe(III) constantly rejuvenated by oxidation of Fe(II) with oxygen is suspected to be an important process in the covered backfill.
Potential sources of oxygen transport into the waste have been explored. Mapping of the groundwater table in one of the backfilled open pits showed that up to 40 % of the waste rock is unsaturated during baseflow, providing pathways for oxygen to enter through unsaturated frac-tures in the pit walls. Two sources of deterioration of the dry cover were identified during geo-physical surveys: seepage of drainage water from the backfilled waste upwards into the dry cover

and insufficient thickness of the cover in some areas. Geophysical and hydrogeochemical studies showed that the collection ditch constructed to divert the contaminated water to a liming treat-ment station fails to retain a large fraction of the drainage.
Based on the results obtained, the sustainability of current approaches for AMD prevention and mitigation is discussed, and possible strategies for improving backfilling and sealing measures at similar sites are proposed.
Keywords Acid mine drainage or acid and metalliferous drainage (AMD) or acid rock drainage (ARD); mine site reclamation; open pit; sulphidic waste rock; backfilling; dry cover; performance; unsaturated.
ACKNOWLEDGEMENTS
The journey towards a PhD takes some years. In my case, the process has been associated in many ways with starting a new life in Sweden and founding a family. Clearly, my PhD degree has in-volved much more than just work.
Because the last part of the PhD project has been a trying time, both for me and for my family, I would like, first and foremost, to thank my mother-in-law and my companion without whom the completion of the work on time would not have been possible.
Kära Inga, du har inte deltagit i skrivandet av artiklarna i denna doktorsavhandling. Det är däremot tack vare dig som denna avhandling fått se dagens ljus vid planerad tid. Jag är oändligt tacksam, både för min, men speciellt för lillens skull som älskar att vara med sin farmor.
My Jocke, I have tried your patience more than I anticipated! I am lucky that you could handle it until the end. Thanks for being both dad and mum when it was needed and for carrying on believing in me.
Dr. Lena Alakangas and Prof. Björn Öhlander, my two supervisors, you have witnessed my first tentative steps in research; those that one probably would not want to show publicly. You have guided me both in the science and in my progression as a researcher. Thank you for so much contagious enthusiasm and for your genuine interest in my project.
Dr. Charles Cravotta, you have repeatedly offered your help as a resource since we met at the IMWA conference in Sydney, Nova Scotia. Your guidance and collaboration are very much ap-preciated.
Nicole, you have performed excellent work during your master’s project, which provided consid-erable data and important findings for the understanding of the reclamation at Kimheden. Thank you for a very nice collaboration!
The research investigations were financed by the European Union’s Structural Funds through the Georange organisation in Sweden, the CAMM (Center of Advanced Mining and Metallurgy) programme at Luleå University of Technology, and Boliden Mineral AB. Pia Lindström, Emma Rönnblom-Pärson, Marie Lindgren and Helena Lidhage at Boliden are thanked for their kind assistance in providing the site data.
I am grateful to Bert-Sive Lindmark at Bergteamet and Dr. Yu Jia previously at Luleå University of Technology for their invaluable help in the field, and to Milan Vnuk for giving form and colour to my research through his expertise with graphs and formatting. Thanks also to my colleagues and friends in Luleå, especially Saman, Dmytro, and Elsa, for always happily offering their help.

I am highly indebted to my dear friend Jackie, for wanting to follow me to Kimheden on dark and cold days to help me with sampling, and for taking care of me during the long days of writing.
Finally, I am naturally thinking about my family. Merci à tous pour votre soutien depuis si loin. Maman, tu as été une source d’inspiration et d’énergie incroyable. Sans toi, le chemin académique se serait sûrement arrêté depuis la classe prépa.
Mon garçon, maman revient bientôt.
Lucile Villain
Luleå, November 2014

LIST OF PAPERS
This thesis is based on the following appended papers:
I. The effects of backfilling and sealing the waste rock on water quality at the Kimheden open-pit mine, northern Sweden.
Villain, L., Alakangas, L., & Öhlander, B. (2013). Journal of Geochemical Exploration, 134, 99-110.
II. Evaluation of the effectiveness of backfilling and sealing at an open-pit mine using ground penetrating radar and geoelectrical surveys, Kimheden, northern Sweden.
Villain, L., Sundström, N., Perttu, N., Alakangas, L., & Öhlander, B. (2014). Environ-mental Earth Sciences, (Oct.), 1-15.
III. Iron speciation and stable oxygen isotopes in the acid mine drainage at a reclaimed open-pit mine site in Kimheden, northern Sweden.
Villain, L., Cravotta III, C. A., Alakangas, L., & Öhlander, B. (2014). Manuscript.
IV. Effects of water pathways on acid mine drainage at the reclaimed Kimheden open-pit mine, northern Sweden.
Villain, L., Breng, N., Lundberg, A., Alakangas, L., & Öhlander, B. (2014). Manuscript.

Paper I was reprinted with permission of Elsevier. Paper II was published open access.
The author’s contribution to the appended papers was:
I. Field sampling; results analysis and interpretation; writing.
II. Field investigations together with second and third authors; results analysis and inter-pretation together with second and third authors; most of the writing.
III. Field sampling; results analysis and interpretation; writing.
IV. Results analysis and interpretation together with second author; writing.
The following publications have been written within the PhD programme but are not included in this thesis:
Peer-reviewed conference proceedings:
Villain, L., Alakangas, L., & Öhlander, B. (2010). Geochemical evaluation of mine water quality in an open-pit site remediated by backfilling and sealing. In C. Wolkersdorfer & A. Freund (Eds.), Mine water & innovative thinking, proceedings of the IMWA (International Mine Water Associ-ation) Symposium (pp. 515-518). Sydney, Canada: Cape Breton University Press.
Villain, L., Sundström, N., Perttu, N., Alakangas, L., & Öhlander,, B. (2011). Geophysical inves-tigations to identify groundwater pathways at a small open-pit copper mine reclaimed by back-filling and sealing. In T. R. Rüde, A. Freund & C. Wolkersdorfer (Eds.), Mine water – Managing the challenges, proceedings of the IMWA (International Mine Water Association) Congress (pp. 71-76). Aachen, Germany: RWTH Aachen University.
Peer-reviewed conference abstract:
Villain, L., Alakangas, L., & Öhlander, B. (2011). Geochemical investigations of the success of a dry cover on backfilled pits at Kimheden copper mine, northern Sweden. In P. Sarala, V. J. Oja-la & M-L Porsanger (Eds.), Programme and abstracts of the 25th IAGS (International Applied Geochemistry Symposium) (p. 142). Rovaniemi: Finnish Association of Mining and Metallurgical Engineers.
Licentiate thesis:
Villain, L. (2011). Effectiveness of reclamation by backfilling and sealing at Kimheden open-pit mine, northern Sweden. Licentiate thesis, Luleå University of Technology, Sweden.
Contents
1. Introduction 11.1. Research objectives and scope of the thesis 21.2. Outline of the thesis 2
2. Current approaches for preventing and mitigating acid mine drainage 32.1. Formation of acid mine drainage 32.2. Mine wastes 32.3. Prevention and mitigation of acid mine drainage at the source 42.4. Open-pit backfilling 52.5. Mine waste dry covers – soil covers 72.6. Water-management interventions 8
3. Site description and methods 93.1. The Kimheden mine 9
Location, climate and geology 9Mining and reclamation 10
3.2. Methodology 10Water geochemistry 10Sampling 10Analysis 11Analysis of dissolved elements, sulphate and acidity in water 11Analysis of iron speciation in water 12Hydrogeological investigations (backfilled open pit 1 and its surroundings) 14Water balance 14Groundwater head and surface water discharge measurements 14Slug tests 14Turnover time 14Geophysical investigations 15Geoelectrical multiple-gradient array survey 15Ground penetrating radar survey 15
4. Summary of the findings 154.1. Evolution of the water quality since early reclamation stages 154.2. Post-reclamation water quality 16
Temporal and spatial variations of post-reclamation water quality at the site 16Assessment of the post-reclamation water quality 17
4.3. Nature of the AMD discharge in recent years 184.4. Performance of reclamation measures with regards to dry cover objectives 194.5. Possible pathways of oxygen ingress into the waste 21
Pathways through pit walls 21Pathways through the dry cover 21

Appended papers I to IV
4.6. Processes associated with the mine water discharge 24Downstream evolution of dissolved Fe(II) concentrations 24Performance of the collection ditch 24
5. Discussion 255.1. Challenges with backfilling and sealing techniques at surface mines 255.2. Lessons learned and opportunities for improving the investigated AMD prevention approach 265.3. Discussion of the research approach and suggestions for future research 28
6. Conclusions 30
. An evaluation of the Kimheden mine site, northern Sweden
1
1. Introduction The discipline of investigation of environmental impacts from mining operations is consid-erably new in comparison with the history of mining. While mining has witnessed all stages of the development of current civilisations, active international concern about the poor quality of water and lands around mining sites, prompting the introduction of appropriate mine closure regulations, only emerged about four decades ago (Clark and Cook Clark 2005; Wilson 2008; Hockley 2012). Initially, reclamation measures implemented at mine sites consisted of improving geotechnical stability and visual impacts through stabilisation and revegetation of waste rock piles and open pits (Wireman 2001; Hockley 2012). However, since the early 1990s, reclamation has encompassed many more activities (Clark and Cook Clark 2005; Hockley 2012) related in partic-ular to the decommissioning of infrastructures, water quality management, rehabilitation of mine waste deposits and remediation of contamination from mine waste (Wireman 2001).
One of the major challenges associated with mine closure today is management of water resources affected by the occurrence of acid mine drainage or acid and metalliferous drainage (AMD), also known as acid rock drainage (ARD), a low-pH and metal-rich water formed by oxidation of sulphide minerals upon exposure to air and water. Generation of AMD during and after operations at coal and hard rock mines, the main sources of exposure of sulphidic rocks, may be very detrimental to the health of ecosystems in the receiving environments and endanger water resources in areas of scarce water supplies. Due to the vast extent of effects of AMD, which have been exacerbated since the advances of the industrial age (Johnson 1998), they are global concerns for both current and future generations.
Most of the AMD prevention and mitigation approaches known today were developed in the 1990s. Since then, the preferred intervention approach has been to prevent AMD formation by limiting sulphide oxidation in the waste, although treatment of water that is already contaminated is still required (Hope 1992; Kuyucak 1999; INAP 2009). Due to the infancy of mine closure practices, much of the knowledge about the effectiveness of reclamation methods at mine sites is based on small-scale experiments and results of simulations with numerical models (Wilson 2008). However, the findings of desk and laboratory studies must be compared to field obser-vations in order to verify or refute established theories and improve reclamation practices. The increasing time that has passed since implementation of the first reclamation techniques some two to three decades ago is an excellent opportunity to evaluate their long-term effects on AMD generation, identify failures and risks they pose, and accumulate knowledge for future reclama-tion projects. Thus, increasing numbers of studies have specifically addressed effects of mine site reclamation measures on the decadal abatement of AMD production, including Holmström and Öhlander (1999), Holmström et al. (2001), Brake et al. (2001), Karlsson and Bäckström (2003), Bambic et al. (2006), Alakangas et al. (2007), Church et al. (2007), Runkel et al. (2009), Unruh et al. (2009), Mudd and Patterson (2010), Willscher et al. (2010) and Ayres et al. (2012). Nevertheless, current recommendations are still frequently based on results of small-scale tests and predictive simulations, which are much more abundant in the scientific literature. Thus, there is a clear need to improve field-scale monitoring of the effects of reclamation activities and apply the results in order to enhance both reclamation measures and assessments of possible mine closure strategies.
This thesis is based on evaluations of the effectiveness of backfilling and sealing with dry covers at the site of a small former open-pit copper mine at Kimheden, northern Sweden, for mitigating generation of Cu and Zn-rich AMD, 13 to 18 years after completion of reclamation measures. In backfilling, voids created by extraction operations are used as supposedly safe repositories for mine waste, and/or other problematic substances, thereby also reducing the contaminated area.

. An evaluation of the Kimheden mine site, northern Sweden
2
It is increasingly accepted as a ‘best practice’ reclamation strategy (Puhalovich and Coghill 2011). Dry cover techniques (including use of permeability barriers) are also common ‘best practice’ methods, for preventing AMD generation by limiting oxygen and/or water ingress into the un-derlying acid-generating waste. However, as mentioned above, rigorous evaluation of such mea-sures is required. Thus, the effectiveness of the reclamation measures applied at Kimheden was assessed by detailed integrated investigations including geochemical, geophysical and hydrogeo-logical analyses of AMD-related processes at the site.
1.1. The objectives of the studies this thesis is based upon were to evaluate effects of reclamation measures (in-pit backfilling and sealing with a dry cover) designed to mitigate Cu and Zn-rich AMD applied to the sulphidic waste rock at the Kimheden open-pit mine in northern Sweden, and to identify potential inadequacies in them, using geochemical, geophysical and hydrogeo- logical methods. The investigations were carried out between 2009 and 2014, 13 to 18 years after completion of the reclamation works. The effectiveness of the reclamation programme was evaluated in terms of mitigation of the formation of AMD, which was the programme’s fundamental goal. More specific questions addressed included:
• Have the reclamation works improved the drainage quality sufficiently to meet acceptable limits for metal concentrations and pH (a key long-term goal for all AMD prevention methods)?
• Is sulphide oxidation continuing in the backfilled waste, and if so how extensively (critical issues since AMD is initiated by the oxidation of sulphide minerals)?
• Has oxygen ingress into the covered mine waste been sufficiently limited (also critical since sulphide oxidation is ultimately controlled by the amount of oxygen in contact with sulphide minerals)?
• How well do effects of the reclamation measures match theoretical expectations for the dry cover performance, and what (if any) are the deficiencies in the reclamation works?
These investigations were based on multidisciplinary analyses using geochemical, geophysical, hydrogeological and modelling techniques. The findings are applied in this thesis to consider the performance of the reclamation measures, consider possible alternatives and formulate suggestions for improving reclamation strategies.
1.2. This thesis is based on studies reported in four appended papers (Papers I to IV). The first part relates the main findings described in the papers to the objectives defined above. Background information about AMD and common current approaches to deal with the problem is provided in Chapter 2 (following this introductory chapter). The investigated site is then described, and the methods used in the investigations are summarised in Chapter 3. The main findings from the investigations are summarised in Chapter 4. Finally, they are discussed and considered in a broader context in Chapter 5. The second part of the thesis consists of the appended papers.
. An evaluation of the Kimheden mine site, northern Sweden
3
2. Current approaches for preventing and mitigating acid mine drainage
2.1. Although acidic drainage may occur naturally in certain areas where sulphide minerals are abundant, human extractions and processing of ores massively increase its scale. Sulphide minerals are found at low concentrations in the Earth’s crust, but can be significantly enriched in certain geological formations, particularly those hosting metallic ores (e.g. Cu, Zn, Pb, Ni, Au, Ag, U) or coal deposits. The sulphide minerals are formed and remain stable in reducing environments in the absence of oxygen. As mining and processing activities expose large quantities of these min-erals to oxidising environments providing contact with oxygen and water, the minerals become unstable and start to oxidise. These phenomena usually occur on exposed faces of surface and underground mine workings and within mining and processing waste repositories. Of the many sulphide minerals occurring on Earth, pyrite (FeS
2) is usually the most abundant, and its oxidation
is commonly described according to the overall reaction:
(2.1)
producing ferrous iron, dissolved sulphate and proton acidity. In reality, the reaction is the net re-sult of complex and non-fully elucidated sequences of shorter reaction mechanisms (Nordstrom and Alpers 1999). Ferrous iron represented by Fe2+ in equation (2.1) can be further oxidised into ferric iron, hydrolysed and precipitated in various forms of hydroxides or hydroxysulphates de-pending on the pH and Eh of the solution. These ferric phases can be conveniently understood under the term hydrous ferric oxide (HFO), originally applied by Dzombak and Morel (1990) and used here in the sense given by Nordstrom (2009). The most common mineral representing these HFO phases is ferrihydrite, Fe(OH)
3, formed by equation (2.2).
(2.2)
Along with Fe produced by reaction (2.1), many other metals and metalloids such as Al, Pb, Cu, Zn, Ni, As and Cr may be leached out in the water, depending on the specific mineralogy of the exposed rocks. The resulting metal and sulphate-rich acidic solution is often called acid rock drainage (ARD) or acid mine drainage (AMD), the latter term denoting the specific connection to mining activities, which is agreed to be the most challenging environmental issue faced by the mining industry today (Younger et al. 2006; Lottermoser 2010).
2.2. Mine wastes comprise all types of uneconomic material produced during a mine’s life-cycle. They are considered to represent one of the largest sources of waste in the world by volume (Hudson-Edwards et al. 2011). Two major types of mine waste are waste rock and tailings. Waste rock is the uneconomic rocks removed to access the ore during mining and tailings are the waste produced during processing of the ore to extract the commodity. Waste rock is commonly depos-ited in piles close to the mine workings, if backfilling in mined-out voids is not practical. Tailings are generally pumped as a sandy slurry into constructed impoundments. Although a significant portion of the metal-bearing sulphides from the mineral deposit are meant to be selectively accumulated in the mineral concentrate for further processing, non-negligible fractions of sul-phides will usually be left in both the waste rock and the tailings, especially pyrite which is rarely
++ ++=++ (aq)-2
4(aq)2(aq)(l)22(g)2(s) 2H 2SO Fe OH 7/2O FeS
++ +=++ (aq)3(s)(l)22(g)2(aq) 2H Fe(OH) O5/2H 1/4O Fe
. An evaluation of the Kimheden mine site, northern Sweden
4
extracted as a commodity. Therefore, owing to their volume and exposed mineral areas, waste rock and tailings may generate large amounts of AMD if deposited without further control at mine sites.
The major difference in properties between waste rock and tailings is their grain size. Most tailings particles are less than 1 mm in diameter while most waste rocks are much larger (Younger et al. 2002), although some waste rock originating from (for example) coal mining may contain a large proportion of fines. Sulphidic tailings also tend to be more reactive than waste rock generally. However, some sulphidic waste rock may be highly reactive (Alakangas et al. 2013). Due to this important difference in granulometry, waste rock is a more permeable material than tailings. Thus, when deposited at mine sites, waste rock may allow much faster transport of water and oxygen within the waste deposit than tailings, and consequently higher sulphide oxidation rates although the tailings are initially more reactive (Mitchell 1999). Younger et al. (2002) estimated that surface mining accounts for more than 99 % of the waste rock produced worldwide. They also concluded that there have been marked increases in the volume of mine waste produced, and the severity of waste-related issues at mine sites, since surface mining has been greatly increasing since the mid-20th century.
‘The reclamation of abandoned waste rock piles, including the back-filling and restoration of surface mines, is one of the most important environmental management activities associated with mining’.
(Younger et al. 2002)
2.3. By the early 1990s it was recognised that AMD mitigation approaches involving treatment of the contaminated water to reduce AMD discharges from mines could not possibly be a cost- effective long-term solution as AMD-generating processes may last centuries or millennia (Hope 1992). Instead, the use of preventive methods to inhibit the formation of AMD in the first instance has been and is still recommended as a preferred solution (Kuyucak 1999; MEND 2001; Höglund et al. 2004; Johnson and Hallberg 2005; INAP 2009). However, prevention of AMD formation is not always practical or possible. In many cases the drainage has to be treated, either as an exclu-sive alternative or combined with the prevention of further acid metal loads. Also, interventions intended to inhibit AMD formation may not always be, strictly speaking, preventive and some-times may better be described as mitigation measures. For example, as suggested by INAP (2009), flooding of tailings may be considered a preventive method since it is intended to reduce their contact with oxygen, thus decreasing sulphide oxidation rates and subsequent release of AMD. However, when flooding is used to remediate already oxidised tailings, the term mitigation will be more appropriate, as the contaminated discharge has already been initiated, despite the aim of preventing further AMD production by decreasing sulphide oxidation rates. In this sense, preven-tion and mitigation are closely related concepts and will be considered collectively here, as both are intended to inhibit the generation of AMD rather than treat the drainage.
‘The primary goal of the prevention [and mitigation] is to stop contaminated drainage from leaving the mine site at its source by minimizing reaction rates, leaching, and the subsequent migration of weathering products from mine waste to the environment.’
(INAP 2009)
To achieve this goal, numerous types of reclamation techniques may potentially be applied at mine sites, depending particularly on the type of waste produced, the stage in the mine’s life-cycle
. An evaluation of the Kimheden mine site, northern Sweden
5
and site-specific conditions such as climate and topography. Regardless of this apparent variability, source prevention and mitigation activities commonly involve fundamental principles that are very similar among mine sites. In order to limit the generation of AMD they will be directed at limiting contact between reactants involved in sulphide oxidation – primarily oxygen, water and sulphides according to reaction (2.1) – and increasing effects of neutralising reactants that may reduce the solubility of protons and metals or metalloids.
A method that has been regarded as one of the most effective for controlling AMD is underwater disposal of mine waste, also called ‘water cover’. This can significantly reduce contact between ox-ygen and sulphidic minerals, in appropriate conditions, because oxygen diffusion is much slower in water than in air or unsaturated soil. Another method that is usually considered a robust option for reducing oxygen ingress into the waste is to apply a ‘dry cover’ over the surface of the waste (see further description in Section 2.5). Other common methods include blending sulphidic mine waste with acid-neutralising materials, typically calcium carbonate (CaCO
3) or lime, CaO or
Ca(OH)2, in order to reduce the AMD loadings by immobilising hazardous metals and buffering
the acidity. Instead of being mixed with the waste, the acid-buffering material may sometimes be placed in various configurations around the waste, such as layering or encapsulation arrangements.
Another method, specifically intended for tailings management, is desulphurisation. This involves an additional step in the ore processing circuit in order to separate the mining residue into a limited volume of high-sulphide tailings and a larger volume of low-sulphide tailings (thus reducing amounts of acid-producing tailings that require remediation). Other methods based on reducing permeability in the waste in order to limit the transport of oxygen and water, such as co-disposal of tailings with waste rock or compaction or thickening of tailings have been applied either at experimental or large scales (INAP 2009). Water management, through for instance diverting water from mine workings, is also a very common strategy at mine sites, often combined with other prevention methods (see further description in Section 2.6).
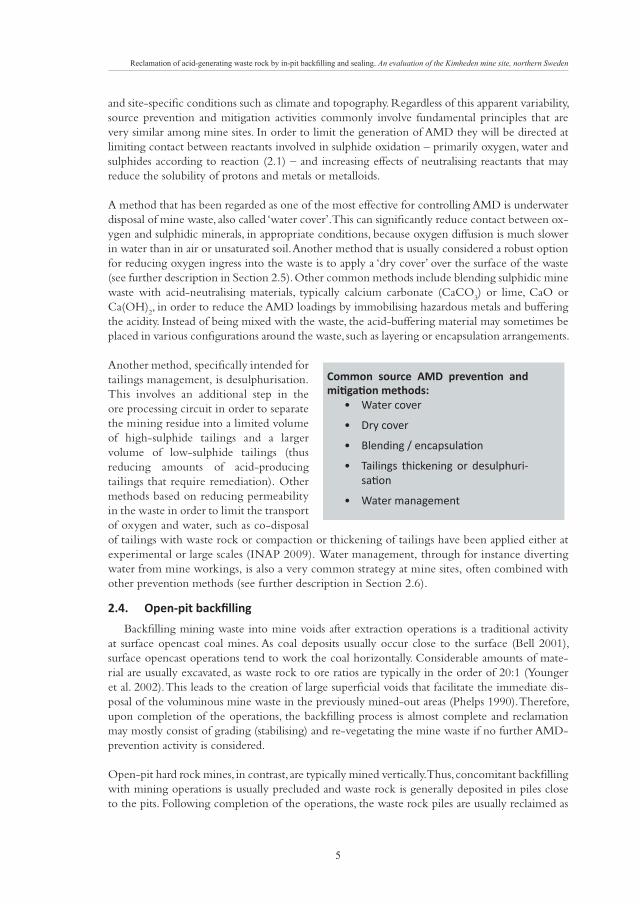
2.4. Backfilling mining waste into mine voids after extraction operations is a traditional activity at surface opencast coal mines. As coal deposits usually occur close to the surface (Bell 2001), surface opencast operations tend to work the coal horizontally. Considerable amounts of mate-rial are usually excavated, as waste rock to ore ratios are typically in the order of 20:1 (Younger et al. 2002). This leads to the creation of large superficial voids that facilitate the immediate dis-posal of the voluminous mine waste in the previously mined-out areas (Phelps 1990). Therefore, upon completion of the operations, the backfilling process is almost complete and reclamation may mostly consist of grading (stabilising) and re-vegetating the mine waste if no further AMD- prevention activity is considered.
Open-pit hard rock mines, in contrast, are typically mined vertically. Thus, concomitant backfilling with mining operations is usually precluded and waste rock is generally deposited in piles close to the pits. Following completion of the operations, the waste rock piles are usually reclaimed as
• Water cover
• Dry cover
•
• Tailings thickening or desulphuri-
• Water management

. An evaluation of the Kimheden mine site, northern Sweden
6
is but post-closure backfilling is also an option. In fact, backfilling is a common practice even at open-pit hard rock mines (MEND 2001). However, open-pit backfilling methods are evolving as objectives have expanded from mostly meeting immediate practical needs, improving stability for example, to include integrated roles in post-closure reclamation plans (MEND 2001; Puhalovich and Coghill 2011).
Beneficial effects of in-pit backfilling of sulphidic mine waste have been identified in various publications, notably Chapman et al. (1998), MEND (2001), Williams (2009) and Puhalovich and Coghill (2011). The main rationale for using in-pit disposal as an AMD-prevention technique is to provide a long-term physically and geochemically stable repository for acid-producing mine waste, particularly waste rock and tailings. This may be achieved when the waste can be isolated from the atmosphere by (for instance) water or dry covers and the occurrence of contamina-tion pathways leading to surrounding environmental receptors can be avoided, either naturally or through sealing techniques. The waste may also be isolated by various types of encapsulation methods. In the long term, mine voids are usually more stable geotechnically and will require less maintenance than above-ground engineered structures. Other favourable effects of in-pit disposal measures may include increases in the areas of land returned to original or other sustain-able uses, and avoidance of acid-generating pit walls, pit floors and pit lakes via reductions in areas of exposed surfaces. An illustration of in-pit backfilling combined with a water cover overlying a surface soil barrier is shown in Figure 2.1.
Figure 2.1
Water cover
Water cover
Clay barrierSoil
Acid-producingwaste rock
Mesa lime
Backfilled waste rock

. An evaluation of the Kimheden mine site, northern Sweden
7
The most important challenge with using in-pit backfilling as part of a mine closure programme is the risk of negative impacts on nearby aquifers and downstream en-vironmental receptors if the waste is not adequately isolated from the local en-vironment. Another problem related to geotechnical stability emphasised by Pu-halovich and Coghill (2011) is the ten-dency of tailings material to extensively consolidate over the long term, which may result in settlement of the surface after backfilling of tailings and thus a need for prolonged backfilling. In addition, open-pit backfilling may be an economic hindrance for mining companies as it may restrain future possibilities to mine potential deposits close to the pit. Further challenges associated with in-pit backfilling are explored in the Discussion (Section 5.1).
2.5. The term ‘dry cover’ is essentially used for any cover that does not include a top layer of water, although the effectiveness of many is based on retention and storage of water within the cover materials. Dry covers can have diverse forms, but their fundamental objective when used to cover sulphidic waste is to reduce the formation and/or transport of AMD. Other important advantages of dry covers are that they usually prevent erosion of the surface of waste deposits and promote establishment of vegetation (INAP 2009). Soil covers are dry covers composed of soil-type materials, as opposed to (for instance) synthetic covers, organic covers, and covers made of non-acid-producing mine waste or acid-neutralising material. Dry covers may be composed of either a single barrier or multiple layers of materials, e.g. a soil cover with a surface layer of organic material.
A commonly applied dry cover technique in areas with temperate and wet climates involves use of a ‘low-permeability barrier’ or ‘sealing layer’. These layers are composed of material with high water retention capacity that remains highly saturated and thus restricts oxygen diffusion, which is far slower in such material than in unsaturated or dry porous media. So, they can effectively reduce oxygen ingress into the underlying waste, and hence sulphide oxidation rates (Höglund et al. 2004). Sealing layers commonly consist of compacted clay-rich materials, geosynthetic liners or fine-textured by-products of various industrial processes. The high water retention capacity of sealing layers also promotes water saturation in the overlying protective layer, thereby enhancing the oxygen-diffusion barrier effect of the cover. The protective layer should be considered an integral part of the cover system and should be designed appropriately, since surficial effects of processes such as desiccation, freeze-thaw cycles and penetration by plant roots can damage seal-ing layers and impair the performance of the cover (INAP 2009). Another effect of sealing layers is the reduction of infiltration of meteoric water through the surface of the waste deposit, which may help to reduce AMD loads released by the waste. Typical water fluxes observed at covered mine waste deposits are schematically illustrated in Figure 2.2.
• Provision of a stable repository for mine waste
• AMD
• Avoidance of exposed surfaces and acidic pit lakes

. An evaluation of the Kimheden mine site, northern Sweden
8
In Sweden, dry cover applications involving the sealing layer principle are commonly used for reclamation of both waste rock and tailings deposits. Usually, the dry cover is a combination of a sealing layer of clayey glacial till overlain by a thicker layer of unsorted till as a protective layer. Lime amendments before placement of the sealing layer and addition of organic material as a vegetation substrate on the surface are also common practises. Materials such as bentonite or cement-stabilised by-products are sometimes used in sealing layers instead of clayey till. Sewage sludge from waste-water treatment processes (Nason et al. 2013), as well as both green liquor dregs and fly ash by-products of pulp and paper mills (Mäkitalo et al. 2014), have also been evaluated for use as low-permeability barriers.
2.6. Water pathways at mine sites strongly influence the extent of formation and transport of AMD. Water discharges through mine waste deposits, open pits and underground workings, together with the nature of the rocks present along the pathways, largely determine the extent and loca-tions of the contamination downstream. Thus, successful diversion of water pathways away from reactive areas can considerably decrease the loadings of contaminants to be treated or released into the receiving environment. Alternatively, water can be purposely directed into (for instance) tailings impoundments or open pits to promote their submergence and reduce contact between oxygen and acid-generating material. Similarly, water retention is a major objective when cov-ering mine waste with low-permeability barriers (see Section 2.5). In fact, water management is usually an essential part of mine closure programmes, either as the primary AMD prevention strategy (e.g. when water covers are used) or in conjunction with other techniques.
Typical water diversion and collection techniques at mine sites include ditching, implementation of hydrogeological controls, sealing and grouting (INAP 2009). Ditches can be used to divert wa-ter away from contaminated areas or to collect the contaminated water. Hydrogeological controls exploit the varying hydraulic conductivities of different materials to create artificial groundwater pathways. Seals are especially used in underground mines, in order to reduce air and water ingress into mine workings, or to promote flooding (INAP 2009). Grouting of fractures may also be used to divert groundwater flow paths or reduce infiltration of surface water.
The Whistle Mine in Ontario, Canada provides an interesting example of the integration of water management in a mine reclamation programme. Here, a large open pit was backfilled with acid-producing waste rock and covered with a complex inclined engineered cover. Water
Figure 2.2
Waste rock pile
Percolation
Protective layer
Sealing layerSealing layerSealing layer
Surface runoff Snow melt
Ponding Lateral runoffSpillway flow
Loss through slope
Exaggerated verticaldimension for the dry cover
Precipitation Evaporation
Groundwaterinflow
Drycover
Groundwaterloss
. An evaluation of the Kimheden mine site, northern Sweden
9
management involved the formation of a sustainable landform including erosion channels and a succession of three containment ponds to promote sedimentation of particles in the runoff from the cover before it reached downstream wetlands, until a vegetation cover has firmly established on the cover and erosion is reduced (Ayres et al. 2007).
3. Site description and methods
3.1.
Location, climate and geology
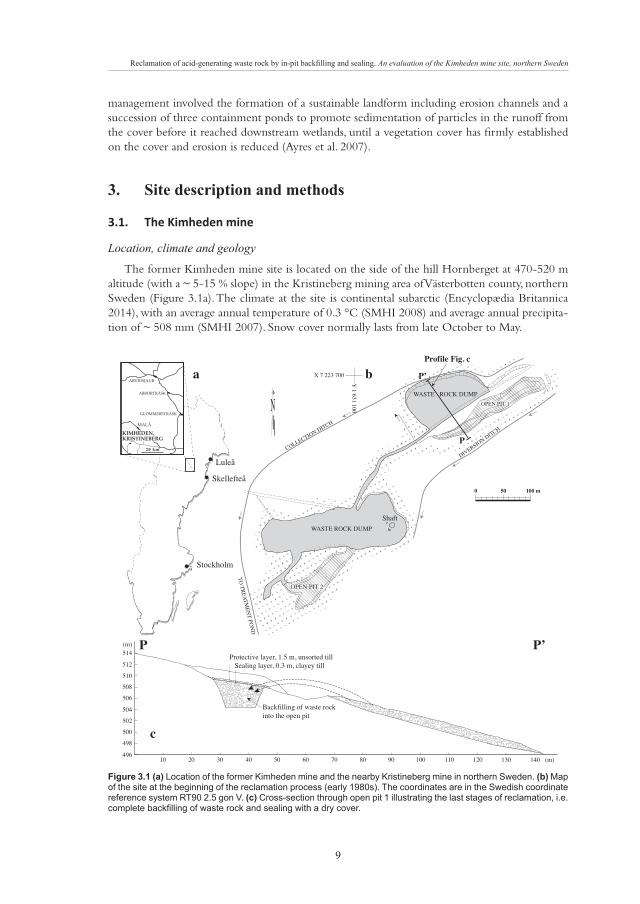
The former Kimheden mine site is located on the side of the hill Hornberget at 470-520 m altitude (with a ~ 5-15 % slope) in the Kristineberg mining area of Västerbotten county, northern Sweden (Figure 3.1a). The climate at the site is continental subarctic (Encyclopædia Britannica 2014), with an average annual temperature of 0.3 °C (SMHI 2008) and average annual precipita-tion of ~ 508 mm (SMHI 2007). Snow cover normally lasts from late October to May.
Figure 3.1 (a) (b)
(c)
DIVERSIO
N DITCH
COLLECTION DITCH
TO
TR
EA
TM
EN
T PO
ND
Shaft
OPEN PIT 1OPEN PIT 1
OPEN PIT 2OPEN PIT 2
WASTE ROCK DUMP
WASTE ROCK DUMP
N
Stockholm
Luleå
Profile Fig. c
X 7 223 700
Y 1 631 100
Skellefteå
a b
c
P
P
P’
P’
20 km
ARVIDSJAUR
ABBORTRÄSK
GLOMMERSTRÄSK
MALÅ
KRISTINEBERGKIMHEDEN,
0 50 100 m
Protective layer, 1.5 m, unsorted tillSealing layer, 0.3 m, clayey till
Backfilling of waste rockinto the open pit
10
512
514(m)
510
508
506
504
502
500
498
49620 30 40 50 60 70 80 90 100 110 120 130 140 (m)
. An evaluation of the Kimheden mine site, northern Sweden
10
The Kimheden deposit is one of the smaller pyrite-rich volcanogenic massive sulphide (VMS) deposits of the Kristineberg mining area, which is part of the Skellefte district. The bedrock in the area is composed of deformed and metamorphosed Palaeoproterozoic 1.9 Ga volcanic and sedimentary rocks hosting VMS deposits of varying sizes, the most important being the nearby Kristineberg deposit. These deposits are thought to have formed in a continental or mature exten-sional arc setting (Allen et al. 2002). Intense synvolcanic hydrothermal alteration has affected the volcanic rocks prior to metamorphism. The deposits are intercalated within a 2- to 3-km thick succession of felsic and minor mafic meta-volcaniclastic rocks (Hannington et al. 2003). The min-eralisation at Kimheden is principally composed of pyrite, chalcopyrite and sphalerite while the ore-hosting rocks are quartz–muscovite–chlorite ± biotite schists. The felsic volcanic rocks have been affected by Mg-rich chlorite alteration (Hannington et al. 2003). Both the deposits and the host rocks have been largely deformed.
Mining and reclamation
Copper ore was mined at Kimheden between 1968 and 1974, both underground and in two open pits designated open pits 1 and 2 (see Figure 3.1b for locations). These pits are 210 m and 140 m long, respectively, ~ 20 m wide and less than 15 m deep. The extraction operations, carried out by the mining company Boliden AB, produced 0.13 Mt of ore with 0.95 % Cu, 0.27 % Zn and 18.4 % S (Årebäck et al. 2005). Originally, the waste rock excavated during the operations was deposited on the ground surface close to the open pits (Figure 3.1b). Quickly, however, the waste rock dumps started to produce Cu and Zn-rich acidic drainage. Consequently, a network of diversion and collection ditches was constructed in 1981 – 1982 (Landström 1981; Andersson 1988), in order to reduce the ingress of meteoric water into the open pits and mine workings, and collect the contaminated water for treatment in a limed tailings pond of the Kristineberg mine situated at the bottom of the hill (Figures 3.1b and 3.2). Between 1984 and 1989, the waste rock was backfilled in several stages, together with some surface lime applications and attempts to cover the backfilled waste with unclassified glacial till, but these reclamation efforts met little success (Jönsson 1993). In 1995 – 1996, the reclamation was completed with the final backfilling of all sulphide-rich materials left at the site and application of a composite dry cover on the surface of the backfilled pits (Edström & Schönfeldt AB 1996) – Figure 3.1c. The design specifications of the dry cover were 0.3 m thick clayey till (sealing layer) overlain by 1.5 m thick unsorted till (protective layer). The dry cover was primarily intended to work as an oxygen-diffusion barrier over the backfilled waste rock.
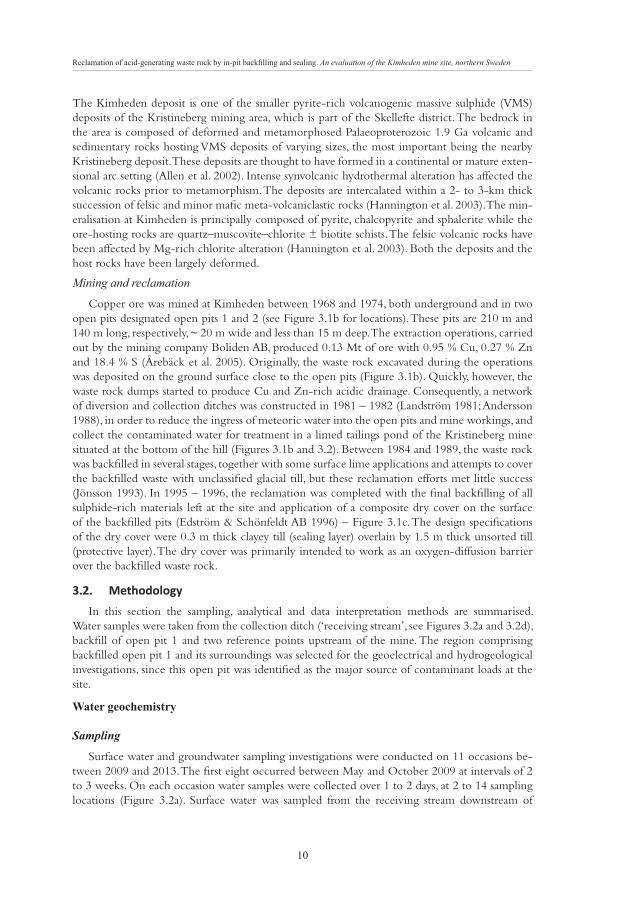
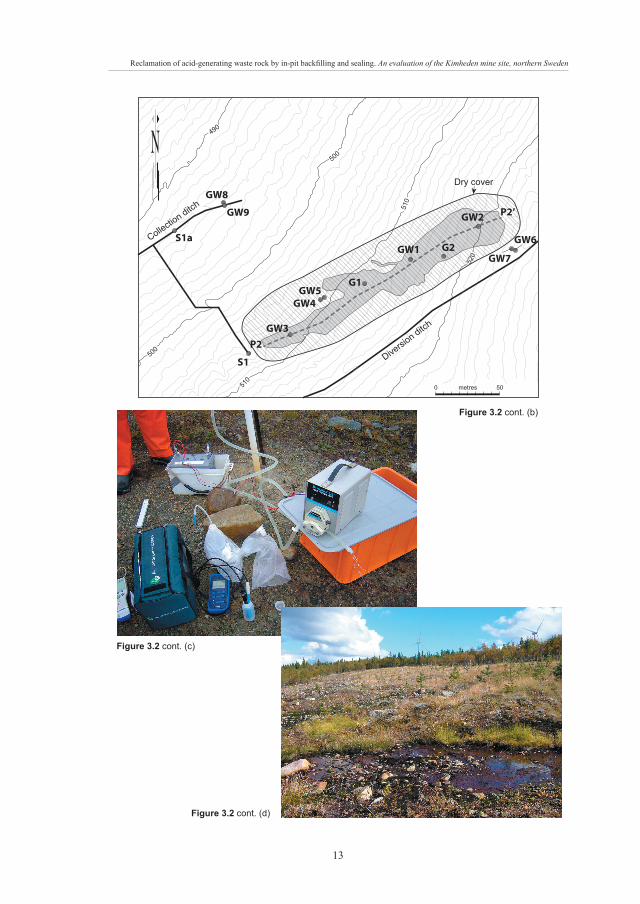
3.2. In this section the sampling, analytical and data interpretation methods are summarised. Water samples were taken from the collection ditch (‘receiving stream’, see Figures 3.2a and 3.2d), backfill of open pit 1 and two reference points upstream of the mine. The region comprising backfilled open pit 1 and its surroundings was selected for the geoelectrical and hydrogeological investigations, since this open pit was identified as the major source of contaminant loads at the site.
Water geochemistry
Sampling
Surface water and groundwater sampling investigations were conducted on 11 occasions be-tween 2009 and 2013. The first eight occurred between May and October 2009 at intervals of 2 to 3 weeks. On each occasion water samples were collected over 1 to 2 days, at 2 to 14 sampling locations (Figure 3.2a). Surface water was sampled from the receiving stream downstream of

. An evaluation of the Kimheden mine site, northern Sweden
11
the pits (= collection ditch) and one location upstream of the mine (SB = background surface water). SO is a sampling location at the outlet of the stream, which was mostly used for long-term monitoring by the mining company. Groundwater was sampled both from the covered backfill in open pit 1 (G1 and G2) and from the undisturbed substratum upstream of the mine (GB). In addition, surface water and groundwater quality monitoring data spanning between 1983 and 2014 provided by the mining company were used to assist interpretation of the results.
At G1 (groundwater in backfilled open pit 1), water was pumped continuously from a ground- water well (Figure 3.2c) through a PVC tube previously acid-washed with 5 % nitric acid. Sampling commenced when electrical conductivity (EC), the electrode potential and/or temperature had stabilised (typically after ~ 30 – 50 min). At G2, the water was sampled with a bailer, due to very low groundwater levels. The first water volumes collected were discarded. Background groundwater (GB) was sampled from a free-flowing old exploration drill casing upstream of the mine.
The pH and temperature were measured with a Metrohm 704 portable pH meter; EC was mea-sured with a WTW Multi 350i multimeter. Dissolved oxygen was measured on three occasions between 2009 and 2011, using a Mettler Toledo SevenGo pro dissolved oxygen meter with an InLab 605 sensor. The electrode potential was measured with a Mettler Toledo SevenGo meter equipped with an InLab 501 (platinum) electrode and the measurements were corrected accord-ing to Nordstrom (1977).
Water was filtered on-site through 0.22 μm nitrocellulose membranes into sampling bottles. The syringes used for filtration had been washed in 5 % nitric acid and the filters in 5 % acetic acid. Sampling bottles for element analyses were high-density polyethylene bottles that had been previously washed in 50 % hydrochloric acid followed by 1 % nitric acid. The bottles for iron speciation analyses were 282 mL capacity brown glass bottles with 2.82 mL of 25 % sulphuric acid added before sampling (1 % of the total volume when the bottles were completely filled). Water samples were kept cool in ice bags and placed in a fridge or freezer within a couple of hours of collection. Laboratory and field blank samples were occasionally collected and analysed to ensure the reliability of the analytical results.
Analysis
Analysis of dissolved elements, sulphate and acidity in water
Analysis of dissolved element concentrations in the water was carried out at the SWEDAC- accredited ALS Scandinavia laboratory in northern Sweden, after acidification with 1 mL ultra-high purity nitric acid per 100 mL of sample. Ca, K, Mg, Na, S and Si analyses were con-ducted with ICP-AES, and Fe, Al, As, Ba, Cd, Co, Cr, Cu, Mn, Mo, Ni, P, Pb, Sb, Sr, U, V and Zn analyses with ICP-SFMS. The ICP-AES analyses were performed using a Perkin Elmer Optima DV 5300 instrument according to US EPA Method 200.7 (modified). The ICP-SFMS analyses were performed using a Thermo Scientific Element instrument according to US EPA Method 200.8 (modified). Sulphate concentrations were also determined, using ion chromatography (IC). However, data screening showed that this method was less accurate than the determination of S by ICP-AES. Therefore, concentrations of S determined by ICP-AES were consistently used instead of IC-determined concentrations of SO
4. Total acidity was measured by titration with
sodium hydroxide and phenolphthalein indicator to pH 8.3 (cold acidity without hydrogen peroxide).
. An evaluation of the Kimheden mine site, northern Sweden
12
Analysis of iron speciation in water
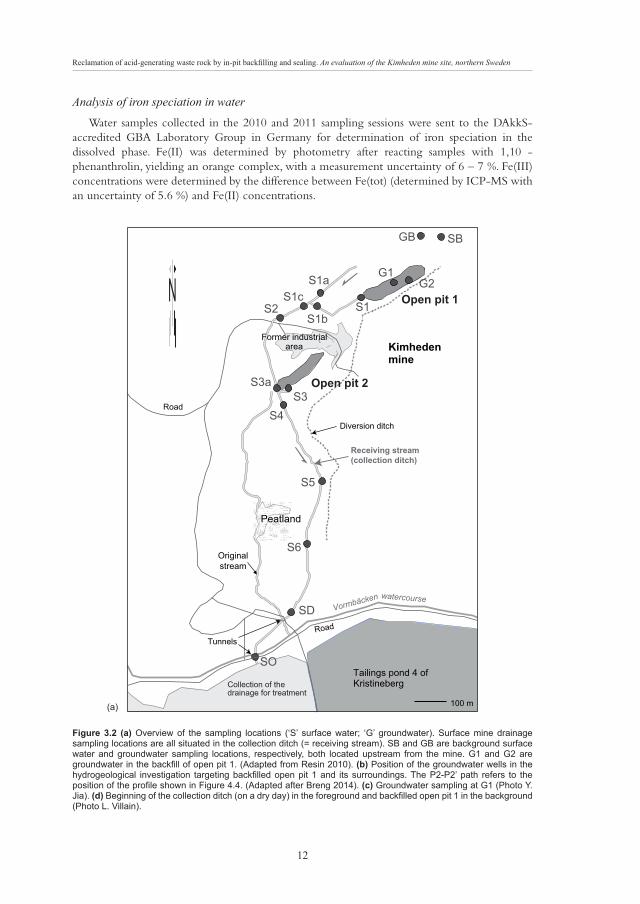
Water samples collected in the 2010 and 2011 sampling sessions were sent to the DAkkS- accredited GBA Laboratory Group in Germany for determination of iron speciation in the dissolved phase. Fe(II) was determined by photometry after reacting samples with 1,10 - phenanthrolin, yielding an orange complex, with a measurement uncertainty of 6 – 7 %. Fe(III) concentrations were determined by the difference between Fe(tot) (determined by ICP-MS with an uncertainty of 5.6 %) and Fe(II) concentrations.
Figure 3.2 (a)
(b)
(c)
(d)
S1a
S1
G1G2
S1b
S1cS2
S3a
S4
S5
S6
SD
SOSO
GB SB
Open pit 1
Open pit 2
Former industrial area
Road
Road
Vormbäcken watercourse
Diversion ditch
Tunnels
Tailings pond 4 of Kristineberg
Kimheden mine
100 m
Collection of the drainage for treatment
N
Originalstream
Peatland
S3
Receiving stream(collection ditch)
. An evaluation of the Kimheden mine site, northern Sweden
13
Figure 3.2
Figure 3.2
Figure 3.2
500
490
510
520
500
490
510
520
500
500
500
500
490
510
510
510
510
520
Diversio
n ditch
Collection ditch
Diversio
n ditch
Collection ditch
N
metres 500
Dry coverDry coverGW8
GW9
GW3
GW4GW5
GW1GW7
GW6
GW2 P2’
P2
G1
G2S1a
S1

. An evaluation of the Kimheden mine site, northern Sweden
14
Water balance
A water balance for backfilled open pit 1 was obtained from precipitation data provided by the Swedish Meteorological and Hydrological Institute (SMHI 2014a) at two weather stations located within 13 km of the site, Malå-Brännan and Malåträsk. The data, encompassing 45 complete years of precipitation records, were subsequently corrected for measurement errors, due (for instance) to evaporation and wind as well as data reading and transmission. A real annual evapotranspiration of 300 mm (SMHI 2014b) was also used.
Groundwater head and surface water discharge measurements
Groundwater heads were measured in 11 HDPE groundwater wells placed in backfilled open pit 1 and its vicinity (Figure 3.2b). The groundwater wells all comprised a screen 1 to 4 m long at the bottom of the pipe surrounded by a sand filter pack. Above the filter pack, bentonite was placed. Groundwater heads were measured manually with an electric tape on seven occasions with 1- to 2-week intervals from the beginning of May 2014 to the end of June 2014, and several additional occasions between 2009 and 2014. Measurements of discharge in the collection ditch were acquired occasionally between 2009 and 2011, using either the ‘bucket and stopwatch’ (volumetric measurement) method or the ‘float’ method (Gordon et al. 2004).
Slug tests
Slug tests were performed – following recommendations of Weight and Sonderegger (2001) and Cunningham and Schalk (2011) – in the groundwater wells to evaluate the hydraulic con-ductivity of the waste rock backfill and both the surrounding bedrock and till. Changes in water levels during the tests were recorded by Schlumberger Mini-Divers together with Baro-Divers, and the acquired data were analysed using the method developed by Hvorslev (1951).
Turnover time
Knowing the volumetric flow rate of water through a system (Q) and the volume of mobile water in the system (V), a turnover time T (representing the mean age of water leaving the sys-tem), can be calculated as follows (Małoszewski and Zuber 1982):
(3.1)
Another method for estimating the turnover time uses the velocity of water through the system and the distance along the system. For formations with multiple hydraulic conductivities, an equivalent hydraulic conductivity taking into account the variations in hydraulic conductivity can be calculated (Payne et al. 2010). For flows across (perpendicular to) layers of different hy-draulic conductivities, the equivalent hydraulic conductivity is:
(3.2)
where d is the sum of the thicknesses of the n layers, di is the thickness of each layer i, and K
i is the
hydraulic conductivity for the layer i. The velocity of water is then determined from:
(3.3)
T =VQ
KE =d
di
Ki
ni
i . KEv =
. An evaluation of the Kimheden mine site, northern Sweden
15
where i is the hydraulic gradient along the flow path. The turnover time T is finally derived from the velocity and the total thickness of the layers:
(3.4)
Geophysical investigations
Both a geoelectrical multiple-gradient array survey and a ground penetrating radar (GPR) survey were performed at the site. The GPR survey was carried out at the beginning of June 2010 and the geoelectrical survey at the beginning of October 2010.
Geoelectrical multiple-gradient array survey
Geoelectrical data were collected using the ABEM Lund Imaging system (Dahlin and Zhou 2006) with a multiple gradient array and a minimum electrode distance of 2 m. This configu-ration with the SAS4000 Terrameter permits multi-channel measurements, with four potential readings for each pair of current electrodes. Each measurement was stacked two to four times. The data were inverted to direct current (DC) resistivity using RES2DINV (Geotomo Software) with the robust L1- norm sharp boundary inversion constraint (Loke et al. 2003).
Ground penetrating radar survey
The GPR survey was carried out using a RAMAC GPR system from Malå Geoscience with a shielded 250 MHz antenna. Measurements, triggered using a ‘hip chain’, were made every 5 cm along each survey line on the two backfilled open pits. In addition, reference measurements in air were made for the time-zero correction.
4.
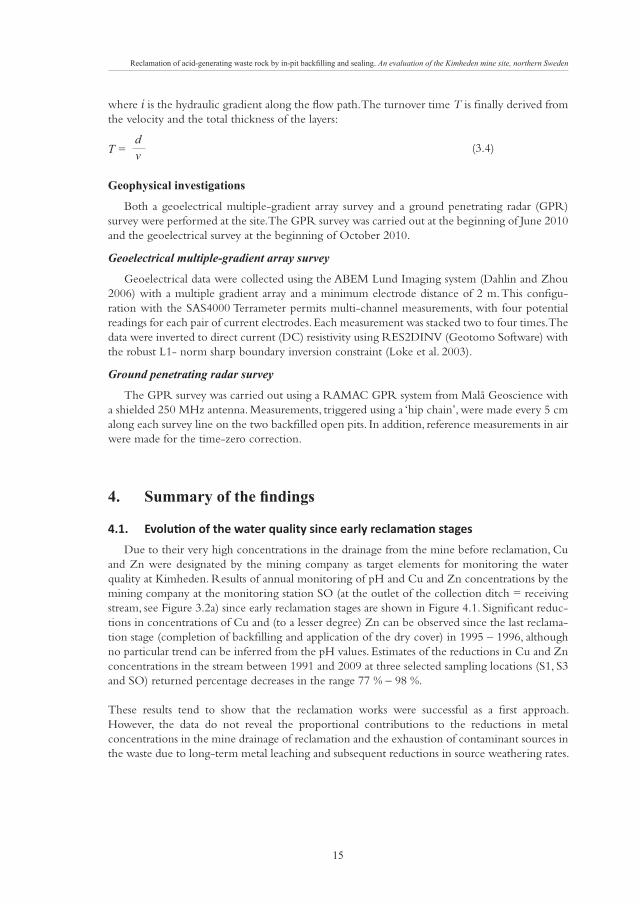
4.1. Due to their very high concentrations in the drainage from the mine before reclamation, Cu and Zn were designated by the mining company as target elements for monitoring the water quality at Kimheden. Results of annual monitoring of pH and Cu and Zn concentrations by the mining company at the monitoring station SO (at the outlet of the collection ditch = receiving stream, see Figure 3.2a) since early reclamation stages are shown in Figure 4.1. Significant reduc-tions in concentrations of Cu and (to a lesser degree) Zn can be observed since the last reclama-tion stage (completion of backfilling and application of the dry cover) in 1995 – 1996, although no particular trend can be inferred from the pH values. Estimates of the reductions in Cu and Zn concentrations in the stream between 1991 and 2009 at three selected sampling locations (S1, S3 and SO) returned percentage decreases in the range 77 % – 98 %.
These results tend to show that the reclamation works were successful as a first approach. However, the data do not reveal the proportional contributions to the reductions in metal concentrations in the mine drainage of reclamation and the exhaustion of contaminant sources in the waste due to long-term metal leaching and subsequent reductions in source weathering rates.
T =dv
. An evaluation of the Kimheden mine site, northern Sweden
16
4.2.
Temporal and spatial variations of post-reclamation water quality at the site
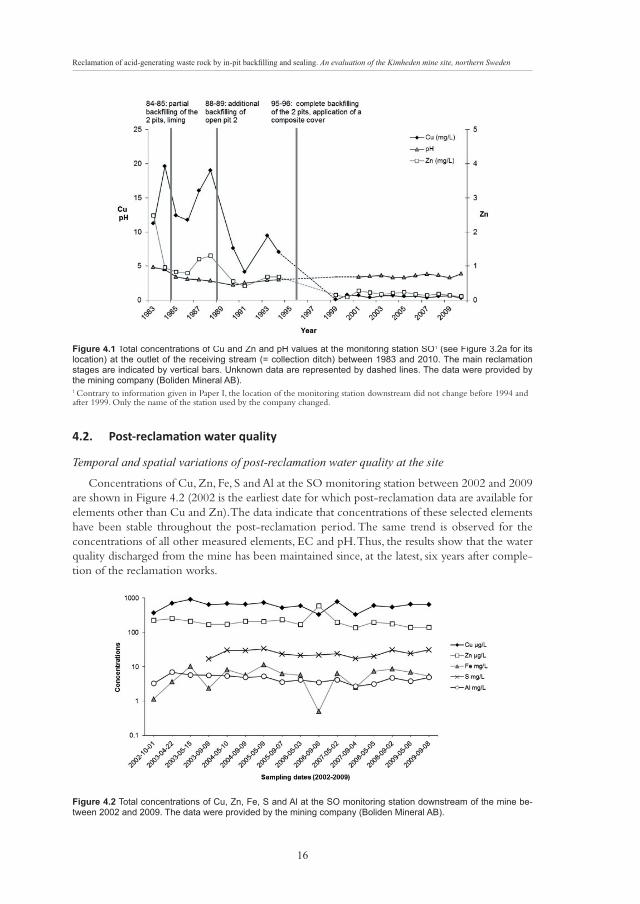
Concentrations of Cu, Zn, Fe, S and Al at the SO monitoring station between 2002 and 2009 are shown in Figure 4.2 (2002 is the earliest date for which post-reclamation data are available for elements other than Cu and Zn). The data indicate that concentrations of these selected elements have been stable throughout the post-reclamation period. The same trend is observed for the concentrations of all other measured elements, EC and pH. Thus, the results show that the water quality discharged from the mine has been maintained since, at the latest, six years after comple-tion of the reclamation works.
Figure 4.1
44 1
Figure 4.2 -
1 Contrary to information given in Paper I, the location of the monitoring station downstream did not change before 1994 and after 1999. Only the name of the station used by the company changed.
. An evaluation of the Kimheden mine site, northern Sweden
17
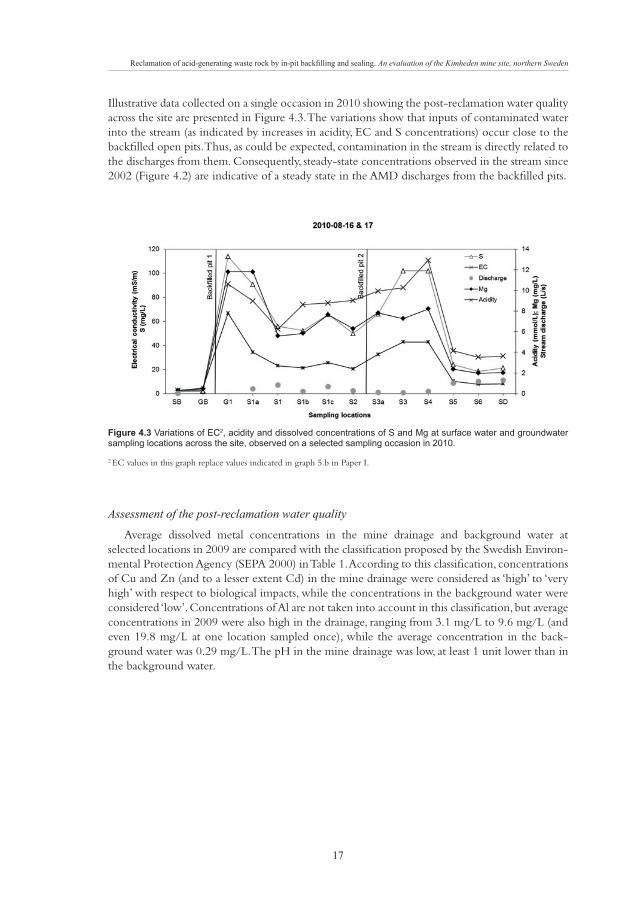
Illustrative data collected on a single occasion in 2010 showing the post-reclamation water quality across the site are presented in Figure 4.3. The variations show that inputs of contaminated water into the stream (as indicated by increases in acidity, EC and S concentrations) occur close to the backfilled open pits. Thus, as could be expected, contamination in the stream is directly related to the discharges from them. Consequently, steady-state concentrations observed in the stream since 2002 (Figure 4.2) are indicative of a steady state in the AMD discharges from the backfilled pits.
Figure 4.3
Assessment of the post-reclamation water quality
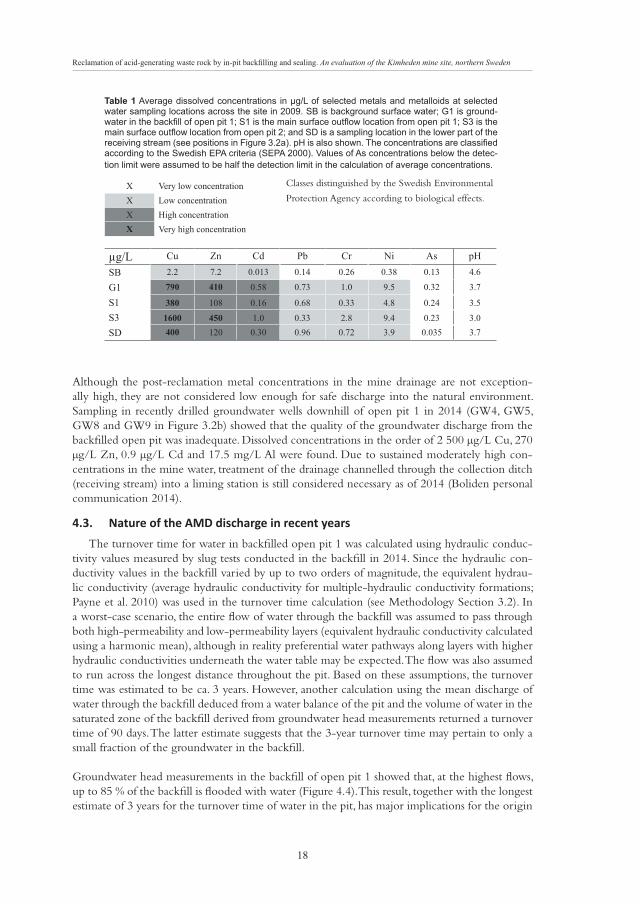
Average dissolved metal concentrations in the mine drainage and background water at selected locations in 2009 are compared with the classification proposed by the Swedish Environ-mental Protection Agency (SEPA 2000) in Table 1. According to this classification, concentrations of Cu and Zn (and to a lesser extent Cd) in the mine drainage were considered as ‘high’ to ‘very high’ with respect to biological impacts, while the concentrations in the background water were considered ‘low’. Concentrations of Al are not taken into account in this classification, but average concentrations in 2009 were also high in the drainage, ranging from 3.1 mg/L to 9.6 mg/L (and even 19.8 mg/L at one location sampled once), while the average concentration in the back-ground water was 0.29 mg/L. The pH in the mine drainage was low, at least 1 unit lower than in the background water.
2 EC values in this graph replace values indicated in graph 5.b in Paper I.
. An evaluation of the Kimheden mine site, northern Sweden
18
Table 1 -
-
X Very low concentrationX Low concentrationX High concentrationX Very high concentration
μg/L Cu Zn Cd Pb Cr Ni As pHSB 2.2 7.2 0.013 0.14 0.26 0.38 0.13 4.6
G1 790 410 0.58 0.73 1.0 9.5 0.32 3.7
S1 380 108 0.16 0.68 0.33 4.8 0.24 3.5
S3 1600 450 1.0 0.33 2.8 9.4 0.23 3.0
SD 400 120 0.30 0.96 0.72 3.9 0.035 3.7
Although the post-reclamation metal concentrations in the mine drainage are not exception-ally high, they are not considered low enough for safe discharge into the natural environment. Sampling in recently drilled groundwater wells downhill of open pit 1 in 2014 (GW4, GW5, GW8 and GW9 in Figure 3.2b) showed that the quality of the groundwater discharge from the backfilled open pit was inadequate. Dissolved concentrations in the order of 2 500 μg/L Cu, 270 μg/L Zn, 0.9 μg/L Cd and 17.5 mg/L Al were found. Due to sustained moderately high con-centrations in the mine water, treatment of the drainage channelled through the collection ditch (receiving stream) into a liming station is still considered necessary as of 2014 (Boliden personal communication 2014).
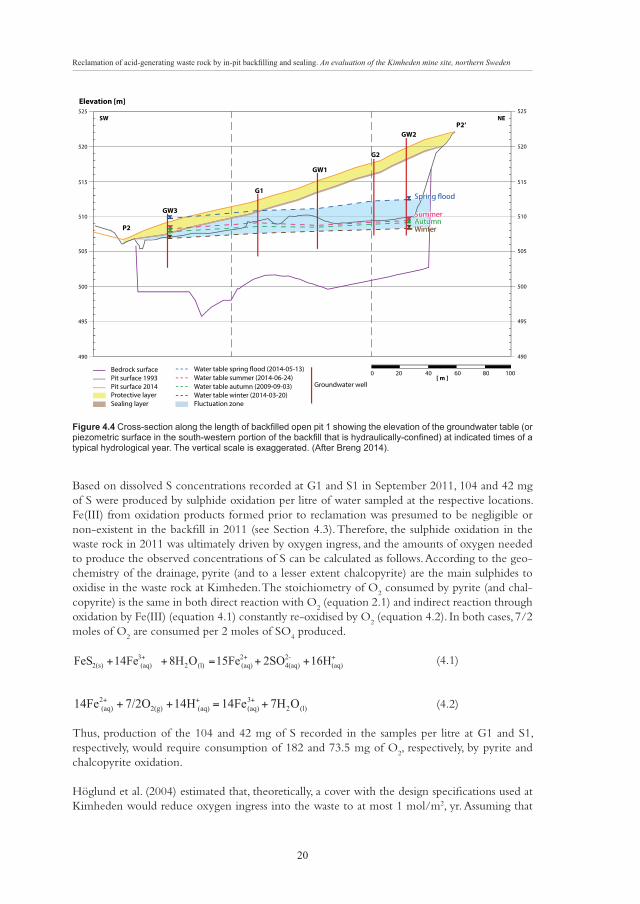
4.3. The turnover time for water in backfilled open pit 1 was calculated using hydraulic conduc-tivity values measured by slug tests conducted in the backfill in 2014. Since the hydraulic con-ductivity values in the backfill varied by up to two orders of magnitude, the equivalent hydrau-lic conductivity (average hydraulic conductivity for multiple-hydraulic conductivity formations; Payne et al. 2010) was used in the turnover time calculation (see Methodology Section 3.2). In a worst-case scenario, the entire flow of water through the backfill was assumed to pass through both high-permeability and low-permeability layers (equivalent hydraulic conductivity calculated using a harmonic mean), although in reality preferential water pathways along layers with higher hydraulic conductivities underneath the water table may be expected. The flow was also assumed to run across the longest distance throughout the pit. Based on these assumptions, the turnover time was estimated to be ca. 3 years. However, another calculation using the mean discharge of water through the backfill deduced from a water balance of the pit and the volume of water in the saturated zone of the backfill derived from groundwater head measurements returned a turnover time of 90 days. The latter estimate suggests that the 3-year turnover time may pertain to only a small fraction of the groundwater in the backfill.
Groundwater head measurements in the backfill of open pit 1 showed that, at the highest flows, up to 85 % of the backfill is flooded with water (Figure 4.4). This result, together with the longest estimate of 3 years for the turnover time of water in the pit, has major implications for the origin
Classes distinguished by the Swedish Environmental
Protection Agency according to biological effects.

ecla ation o acid generating waste roc by in pit bac lling and sealing. An evaluation of the Kimheden mine site, northern Sweden
19
of the AMD discharge from the site today. Based on extensive experience with flooding in under-ground mines and opencast mine backfills, Younger and Sapsford (2004) estimated that flushing out previously formed AMD oxidation products from a freshly deposited backfill would take at most four times longer than the initial flooding. As of 2014, 30 years have passed since the first stage of backfilling at Kimheden in 1984, and 18 years since the final reclamation of the waste by dry cover application in 1996, i.e. more than four times the 3-year turnover time estimate. These oxidation products or ‘acid-generating salts’, as listed by Younger and Sapsford (2004), comprise a range of sulphate and hydroxysulphate minerals that have the potential to store sulphide oxidation products and release them later upon dissolution. Their dissolution may also result in the contin-uation of sulphide oxidation under the water table, as they may contain substantial amounts of ferric iron. Younger and Sapsford (2004) also reported that contaminant concentrations generally peak after rebound of the groundwater table in a typical backfill, due to flushing of the oxida-tion products, then exponentially decline towards asymptotically lower concentrations. As shown in Section 4.2, such asymptotic levels were reached at Kimheden by 2002 at the latest. Conse-quently, oxidation products formed prior to reclamation are expected to have been mostly (if not completely) washed out from the waste rock. This implies that only the ongoing oxidation of sulphides in the covered backfill can explain the moderately high concentrations of S and metals observed during the investigations in 2009 – 2014 (Section 4.2).
The continuation of sulphide oxidation in mine waste deposits after dry cover application is not uncommon (INAP 2009), and adequate performance of covers will depend on their ability to reduce oxidation rates sufficiently for AMD loadings to be handled by the receiving environment in the long term. However, the evaluation of post-reclamation water quality at the site (see Sec-tion 4.2) shows that the reclamation works at Kimheden have not been completely successful.
4.4. Results presented in Section 4.3 show that S concentrations in the discharge from the open pits at Kimheden in recent years can only be explained by ongoing sulphide oxidation in the covered backfill. Nevertheless, storage and release of oxidation products formed after reclamation may still affect concentrations of elements in the drainage, since significant fluctuations in the groundwater table occur throughout the year (Figure 4.4). In order to quantify the extent of sulphide oxidation in the backfill of open pit 1, sampling locations G1 and S1 (groundwater in the backfill and main outflow from the backfill, respectively) were selected. The lowest observed S concentrations at the two locations (both measured in September 2011) were used, in order to quantify the extent of sulphide oxidation with the least risk of influence from the release of stored oxidation products.
ecla ation o acid generating waste roc by in pit bac lling and sealing. An evaluation of the Kimheden mine site, northern Sweden
20
Based on dissolved S concentrations recorded at G1 and S1 in September 2011, 104 and 42 mg of S were produced by sulphide oxidation per litre of water sampled at the respective locations. Fe(III) from oxidation products formed prior to reclamation was presumed to be negligible or non-existent in the backfill in 2011 (see Section 4.3). Therefore, the sulphide oxidation in the waste rock in 2011 was ultimately driven by oxygen ingress, and the amounts of oxygen needed to produce the observed concentrations of S can be calculated as follows. According to the geo-chemistry of the drainage, pyrite (and to a lesser extent chalcopyrite) are the main sulphides to oxidise in the waste rock at Kimheden. The stoichiometry of O
2 consumed by pyrite (and chal-
copyrite) is the same in both direct reaction with O2 (equation 2.1) and indirect reaction through
oxidation by Fe(III) (equation 4.1) constantly re-oxidised by O2 (equation 4.2). In both cases, 7/2
moles of O2 are consumed per 2 moles of SO
4 produced.
(4.1)
(4.2)
Thus, production of the 104 and 42 mg of S recorded in the samples per litre at G1 and S1, respectively, would require consumption of 182 and 73.5 mg of O
2, respectively, by pyrite and
chalcopyrite oxidation.
Höglund et al. (2004) estimated that, theoretically, a cover with the design specifications used at Kimheden would reduce oxygen ingress into the waste to at most 1 mol/m2, yr. Assuming that
Figure 4.4 - - -
20 40 60 80 100[ m ]
0
495
500
505
510
515
520
525
490
495
500
505
510
515
520
525
490
NESWP2‘
P2
Elevation [m]
Bedrock surfacePit surface 1993Pit surface 2014
Water table spring flood (2014-05-13)Water table summer (2014-06-24)
Groundwater wellWater table autumn (2009-09-03)Protective layerSealing layer
Water table winter (2014-03-20)Fluctuation zone
GW3
G1
GW1
G2
GW2
Spring flood
SummerAutumnWinter
Spring flood
SummerAutumnWinter
+++ ++=++ (aq)-2
4(aq)2(aq)(l)2(aq)
32(s) 16H 2SO 15Fe O8H 14Fe FeS
(l)23(aq)(aq)2(g)(aq)
2 O7H 14Fe 14H 7/2O 14Fe +=++ +++

ecla ation o acid generating waste roc by in pit bac lling and sealing. An evaluation of the Kimheden mine site, northern Sweden
21
all the oxygen entering the waste dissolves in the groundwater in the backfill, with a mean water discharge through the backfill of 1.3 L/s and surface area of 4 600 m2, this implies that at most 3.6 mg of O
2 would be available for sulphide oxidation per litre of water. This is much less than
the amounts required to account for the observed S concentrations by stoichiometric pyrite and chalcopyrite oxidation (182 and 73.5 mg per litre of water at G1 and S1, respectively). Even if we assume that the water discharge measurements are inaccurate, and the true mean discharge is just 0.5 L/s (less than half the estimated discharge for dry years: 1.09 L/s), if the cover met the performance criterion the maximum concentration of oxygen in the water in the backfill would still only be 9.3 mg/L. Further, since the oxygen saturation of groundwater in the backfill is expected to lie in the range 7-13 mg/L (according to calculations using DOTABLES software; USGS 2014), at least 14 and 5.7 reoxygenations of the water would have been required to pro-duce the S concentrations observed at G1 and S1, respectively.
These results clearly imply that the dry cover has not met its design performance criterion in terms of restricting oxygen ingress. Therefore, pathways that may account for the apparently high rates of oxygen transport into the waste were explored.
4.5.
Pathways through pit walls
Variations in the elevation of the groundwater table (or piezometric surface in hydraulically- confined zones) in the backfill of open pit 1 over a typical hydrological year are shown in Figure 4.4. The data indicate that during periods of relatively low flows (typically autumn and winter) up to 35 - 39 % of the waste may be unsaturated. Oxygen transport by diffusion and advection- convection in waste rock deposits is favoured by low degrees of saturation in the deposits (e.g. Lefebvre et al. 2001; Ritchie 2003; Fala et al. 2005). Therefore, the large extent of the unsatu-rated zone during baseflow provides preferential pathways for oxygen within the backfill. Slug tests showed that hydraulic conductivities in the bedrock surrounding the pit were around 10-6 m/s. This corroborates a previous observation that the bedrock is fractured, by Rosén and Wilske (1994), who also reported that the pit walls are fractured. Clearly, the combination of partly unsaturated waste rock and enclosure by fractured bedrock greatly increases the likelihood of oxygen reaching the sulphidic material from the sides, despite the dry cover on top.
Pathways through the dry cover
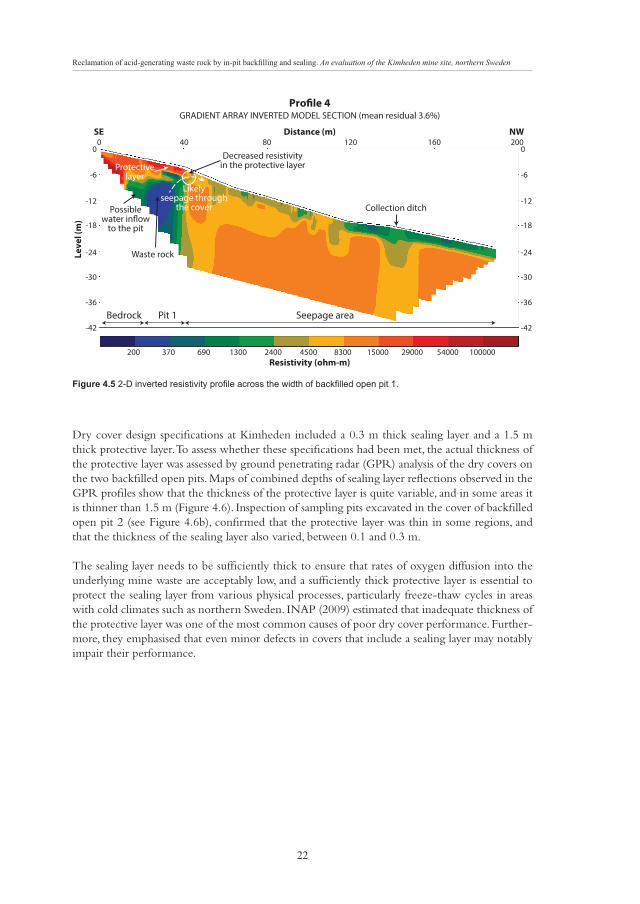
A geoelectrical profile recorded across the width of backfilled open pit 1 shows that electrical resistivity is relatively low in the waste rock backfill and on the ground surface downstream of the pit (Figure 4.5). These regions correspond to zones affected by AMD, in contrast with the bedrock and the dry cover, where the electrical resistivity is higher. However, the resistivity is also relatively low across the protective layer above the lower edge of the pit, suggesting that water seeps from the backfill into the dry cover towards the surface. Accordingly, multiple groundwater seepages with high EC values are visible on the surface of the dry cover at these points during high flow periods. Such seepages through the dry cover are almost certainly due to the pressure exerted on water in the south-western portion of the backfill that is hydraulically confined (Figure 4.4), which forces the water to penetrate through the dry cover. Seepage of water from the backfill into the dry cover implies risks of erosion for both the sealing layer and the protective layer, which might cause increases in oxygen diffusion and/or advection through the dry cover during low flow periods.
ecla ation o acid generating waste roc by in pit bac lling and sealing. An evaluation of the Kimheden mine site, northern Sweden
22
Dry cover design specifications at Kimheden included a 0.3 m thick sealing layer and a 1.5 m thick protective layer. To assess whether these specifications had been met, the actual thickness of the protective layer was assessed by ground penetrating radar (GPR) analysis of the dry covers on the two backfilled open pits. Maps of combined depths of sealing layer reflections observed in the GPR profiles show that the thickness of the protective layer is quite variable, and in some areas it is thinner than 1.5 m (Figure 4.6). Inspection of sampling pits excavated in the cover of backfilled open pit 2 (see Figure 4.6b), confirmed that the protective layer was thin in some regions, and that the thickness of the sealing layer also varied, between 0.1 and 0.3 m.
The sealing layer needs to be sufficiently thick to ensure that rates of oxygen diffusion into the underlying mine waste are acceptably low, and a sufficiently thick protective layer is essential to protect the sealing layer from various physical processes, particularly freeze-thaw cycles in areas with cold climates such as northern Sweden. INAP (2009) estimated that inadequate thickness of the protective layer was one of the most common causes of poor dry cover performance. Further-more, they emphasised that even minor defects in covers that include a sealing layer may notably impair their performance.
Figure 4.5 -
Decreased resistivityin the protective layer
Likelyseepage through
the cover
Protectivelayer
Collection ditchPossiblewater inflow
to the pit
Waste rock
Seepage areaBedrock Pit 1
0 40
200 370 690 1300 2400 4500 8300 15000 29000 54000 100000
80 120
Profile 4GRADIENT ARRAY INVERTED MODEL SECTION (mean residual 3.6%)
Distance (m)SE NW
Resistivity (ohm-m)
Leve
l (m
)
160
-12
-18
-30
-24
-36
-42
-6
0
-12
-18
-30
-24
-36
-42
-6
0200

ecla ation o acid generating waste roc by in pit bac lling and sealing. An evaluation of the Kimheden mine site, northern Sweden
23
The body of evidence gathered from hydrogeological and geophysical studies at Kimheden demonstrated flaws in the design and realisation of the reclamation measures undertaken. Both existent and potential deficiencies in the reclamation works have been identified. Probable path-ways that allow excessive rates of oxygen ingress have been identified both at the backfill/bedrock interface and in the dry cover. However, it is not possible, with the available data, to determine the relative contributions of these two sources to the overall transport of oxygen into the waste.
Figure 4.6 (a) (b)
Thickness of the protective layer (m)Measurement pointsPit boundaryReference point
Thickness of the protective layer (m)Measurement pointsPit boundaryThickness of the protective layerobserved in sample pits
1.70 m
1.40 m
1.60 m
1.25 m
Dis
tanc
e on
the
y-ax
is (m
)D
ista
nce
on th
e y-
axis
(m)
Distance on the x-axis (m)
Distance on the x-axis (m)
a. Backfilled open pit 1a. Backfilled open pit 1
b. Backfilled open pit 2
Thic
knes
s of
the
prot
ectiv
e la
yer (
m)
Thic
knes
s of
the
prot
ectiv
e la
yer (
m)
ecla ation o acid generating waste roc by in pit bac lling and sealing. An evaluation of the Kimheden mine site, northern Sweden
24
4.6.
Downstream evolution of dissolved Fe(II) concentrations
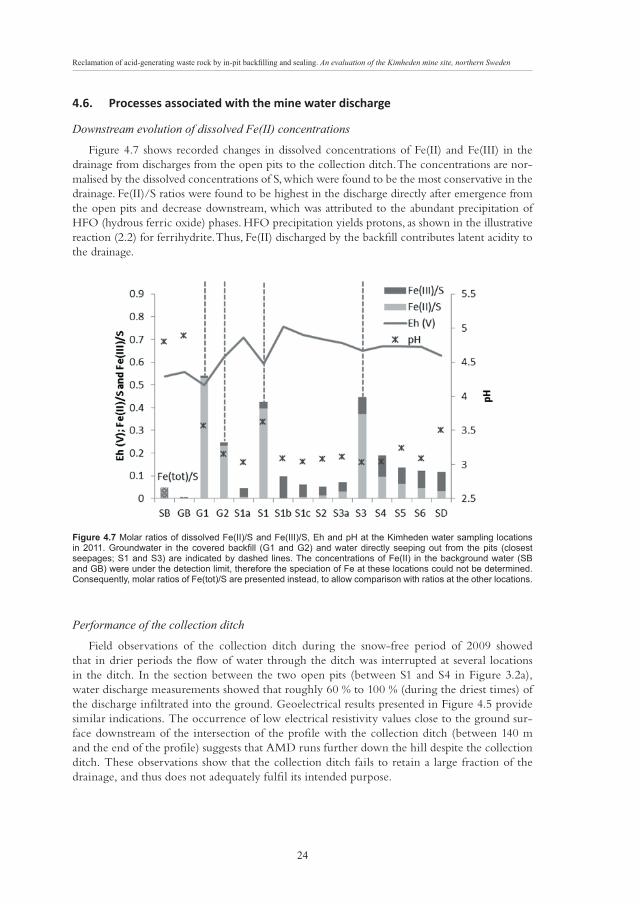
Figure 4.7 shows recorded changes in dissolved concentrations of Fe(II) and Fe(III) in the drainage from discharges from the open pits to the collection ditch. The concentrations are nor-malised by the dissolved concentrations of S, which were found to be the most conservative in the drainage. Fe(II)/S ratios were found to be highest in the discharge directly after emergence from the open pits and decrease downstream, which was attributed to the abundant precipitation of HFO (hydrous ferric oxide) phases. HFO precipitation yields protons, as shown in the illustrative reaction (2.2) for ferrihydrite. Thus, Fe(II) discharged by the backfill contributes latent acidity to the drainage.
Figure 4.7
Performance of the collection ditch
Field observations of the collection ditch during the snow-free period of 2009 showed that in drier periods the flow of water through the ditch was interrupted at several locations in the ditch. In the section between the two open pits (between S1 and S4 in Figure 3.2a), water discharge measurements showed that roughly 60 % to 100 % (during the driest times) of the discharge infiltrated into the ground. Geoelectrical results presented in Figure 4.5 provide similar indications. The occurrence of low electrical resistivity values close to the ground sur-face downstream of the intersection of the profile with the collection ditch (between 140 m and the end of the profile) suggests that AMD runs further down the hill despite the collection ditch. These observations show that the collection ditch fails to retain a large fraction of the drainage, and thus does not adequately fulfil its intended purpose.
ecla ation o acid generating waste roc by in pit bac lling and sealing. An evaluation of the Kimheden mine site, northern Sweden
25
5. Discussion
5.1. Surface-mined lands are inevitably affected by the loss of some of their original natural value, and the restoration of ground surfaces may substantially help to alleviate depreciation and pre-serve some sustainable future use of the land (Amezaga et al. 2011). Thus, as surface mine oper-ations have constantly increased worldwide since the second half of the 20th century (Younger et al. 2002), backfilling and re-contouring of disturbed mined-out surfaces is likely to become a prevalent post-closure practice at open-pit and opencast mine sites.
However, although backfilling may enable restoration of the land surface, it may not always be sufficient to achieve long-term environmental targets. Notably, for reactive sulphidic mine wastes it is crucial to ensure that the drainage from the waste is isolated from downstream environmen-tal receptors, unless the leachate quality can be viably ameliorated by (for instance) blending the backfill with alkaline additives. According to MEND (2001), pits with low-permeability walls and a water table with a minor hydraulic gradient are particularly suitable for deposition of reactive mine waste, as both of these properties will help to minimise contaminant loadings that reach surrounding receptors. Nevertheless, far from all open pits meet these requirements, and environmentally safe in-pit disposal of reactive waste will generally require further AMD preven-tion/mitigation actions, when economically viable. Appropriate AMD prevention methods for backfilled pits have been described by MEND (2001), and mostly consist of various configura-tions of water and dry cover systems. The optimal method will usually depend on the position of the post-rebound groundwater table in the backfill. As with mine waste impoundments, water covers derived from natural or assisted flooding are usually considered an environmentally safe solution for sulphidic mine waste in backfilling settings. However, unlike closed systems such as tailings dams, backfilled pits surrounded by fractured rock strata may be crossed by important groundwater discharges. For acid-producing waste rock, this may have two major consequences: the ingress of oxygen-bearing water into the waste may be faster than in the presence of a cover of still water and the AMD loads released by the backfilled waste may be higher. Furthermore, as noted by Williams (2009), oxidation products formed during exposure of waste at the surface, which usually occurs when backfilling is part of a post-closure plan (in contrast with backfilling concomitant with operations in opencast settings), may result in intensified contamination due to dissolution of these products during initial flooding of the backfill.
Challenges associated with dry covers on backfilled mine waste are mostly the same as those encountered with dry covers on waste rock piles and tailings deposits. Some complications, such as their instability on the steep slopes often associated with waste rock piles may not always be relevant in backfilling settings, although some backfilled surfaces may also have significant slopes, depending on the surrounding topography. An example of a backfilled open-pit mine reclaimed by an inclined dry cover is Whistle Mine in Ontario, Canada, where a comprehensive programme was previously undertaken to predict future impacts of runoff erosion on the cover, which result-ed in the design of an innovative landform for minimising effects of long-term erosion (Ayres et al. 2005; Ayres et al. 2012). An important aspect of dry covers on sulphidic mine waste is that the sulphide oxidation will probably not be completely halted by oxygen-diffusion barriers (INAP 2009). However, AMD loads may still be reduced in the long term, due to reductions in sulphide oxidation and water infiltration rates. Such reductions in AMD release may allow the achievement of some goals, notably loads of metals and acidity in the mine water may be reduced sufficiently for safe release of the drainage into the surrounding environment, or at least alleviate treatment
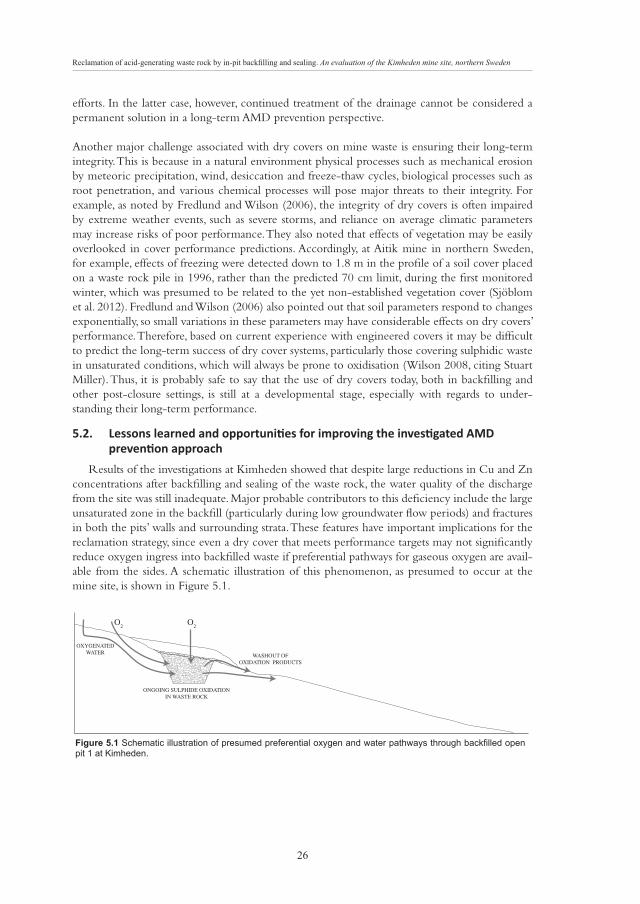
ecla ation o acid generating waste roc by in pit bac lling and sealing. An evaluation of the Kimheden mine site, northern Sweden
26
efforts. In the latter case, however, continued treatment of the drainage cannot be considered a permanent solution in a long-term AMD prevention perspective.
Another major challenge associated with dry covers on mine waste is ensuring their long-term integrity. This is because in a natural environment physical processes such as mechanical erosion by meteoric precipitation, wind, desiccation and freeze-thaw cycles, biological processes such as root penetration, and various chemical processes will pose major threats to their integrity. For example, as noted by Fredlund and Wilson (2006), the integrity of dry covers is often impaired by extreme weather events, such as severe storms, and reliance on average climatic parameters may increase risks of poor performance. They also noted that effects of vegetation may be easily overlooked in cover performance predictions. Accordingly, at Aitik mine in northern Sweden, for example, effects of freezing were detected down to 1.8 m in the profile of a soil cover placed on a waste rock pile in 1996, rather than the predicted 70 cm limit, during the first monitored winter, which was presumed to be related to the yet non-established vegetation cover (Sjöblom et al. 2012). Fredlund and Wilson (2006) also pointed out that soil parameters respond to changes exponentially, so small variations in these parameters may have considerable effects on dry covers’ performance. Therefore, based on current experience with engineered covers it may be difficult to predict the long-term success of dry cover systems, particularly those covering sulphidic waste in unsaturated conditions, which will always be prone to oxidisation (Wilson 2008, citing Stuart Miller). Thus, it is probably safe to say that the use of dry covers today, both in backfilling and other post-closure settings, is still at a developmental stage, especially with regards to under- standing their long-term performance.
5.2.
Results of the investigations at Kimheden showed that despite large reductions in Cu and Zn concentrations after backfilling and sealing of the waste rock, the water quality of the discharge from the site was still inadequate. Major probable contributors to this deficiency include the large unsaturated zone in the backfill (particularly during low groundwater flow periods) and fractures in both the pits’ walls and surrounding strata. These features have important implications for the reclamation strategy, since even a dry cover that meets performance targets may not significantly reduce oxygen ingress into backfilled waste if preferential pathways for gaseous oxygen are avail-able from the sides. A schematic illustration of this phenomenon, as presumed to occur at the mine site, is shown in Figure 5.1.
Figure 5.1
ONGOING SULPHIDE OXIDATIONIN WASTE ROCK
WASHOUT OFOXIDATION PRODUCTS
O2
O2
OXYGENATEDWATER

ecla ation o acid generating waste roc by in pit bac lling and sealing. An evaluation of the Kimheden mine site, northern Sweden
27
In order to increase the effectiveness of the waste rock backfilling and sealing works at Kimheden, closure of preferential pathways for oxygen and water would have been required, possibly using one or more of the approaches described below.
Grouting of fractures surrounding the pit is one option that had been suggested before applica-tion of the dry cover at Kimheden (Rosén and Wilske 1994), although to reduce water (rather than oxygen) ingress into the waste. In fact some local sealing was applied, using clayey till, to the walls of backfilled open pit 1 at a specific zone around the main point of groundwater inflow, according to Lindvall (1999). However, the large current short-term fluctuations in the water table observed in the backfill (Figure 4.4) suggest that either this hydrogeological control measure had minor effects or the sealing has washed away with time.
In order for groundwater and oxygen-transport diversion techniques to be effective in the long run, alternative pathways have to be provided for groundwater. In the context of in-pit mine waste disposal, this issue has been promisingly approached though the ‘pervious surround’ concept (MEND 2001), involving use of high-permeability envelope layers surrounding low- permeability reactive tailings. Because of the difference in permeability, ground-water will tend to flow in the high-permeability envelope rather than through the tailings. Based on this concept, it is suggested that solidification of the waste rock through (forinstance) blending with alkaline cement material or tailings (‘Paste Rock’; Longo and Wilson 2007) could lower the hydraulic conductivity of acid-generating waste rock back-fills. Thus, placing a layer of coarse sand or gravel around the solidified waste may both re-duce oxygen ingress (due to lower permeability of the waste) and inflows of groundwater into the waste. Consequently, sulphide oxidation rates in the waste and transport of contamination products could be substantially lowered. The suggested reclamation approach based on applying the ‘pervious surround’ concept to backfilling of waste rock is illustrated (using open pit 1 at Kimheden as an example) in Figure 5.2.
Investigations of the reclamation works’ performance at Kimheden highlighted the importance of carefully considering hydrogeology for successful reclamation. Water is the transport medium for the sulphide oxidation products, thus its flow rates and paths govern the loads and fate of the contaminants. Hence, thorough characterisation of the hydrogeology during initial stages of a mine’s life-cycle is likely to greatly facilitate post-closure reclamation programmes, and is a major component of the ‘defensive mine planning’ approach proposed by Younger and Robins (2002). However, the hydrogeology at mine sites and around mine waste deposits is often still poorly understood or insufficiently considered in mine waste reclamation projects (Younger and Robins 2002; Dold 2008; Miller and Zégre 2014).
In similar defensive approaches for increasing mining sustainability, various types of adjustments to current practices have been suggested for all stages of a mine’s life-cycle in order to decrease the environmental burden at closure while increasing economic benefits (Dold 2008). Examples include comprehensive geochemical characterisation of the rocks from an environmental impact perspective already during the exploitation stage, and implementation of optimised ore process-ing systems to minimise metal concentrations in the tailings. However, since the production of mine waste with uneconomical value that poses some environmental risks cannot be avoided, final deposition of the waste still requires adequate management to limit the risks. Building on knowledge of the performance of state-of-the-art methods employed for two to three decades, several authors have reviewed innovative options for mine waste management (e.g. Wilson 2008; Lottermoser 2010; Sahoo et al. 2013). These include use of thickened or desulphurised tailings
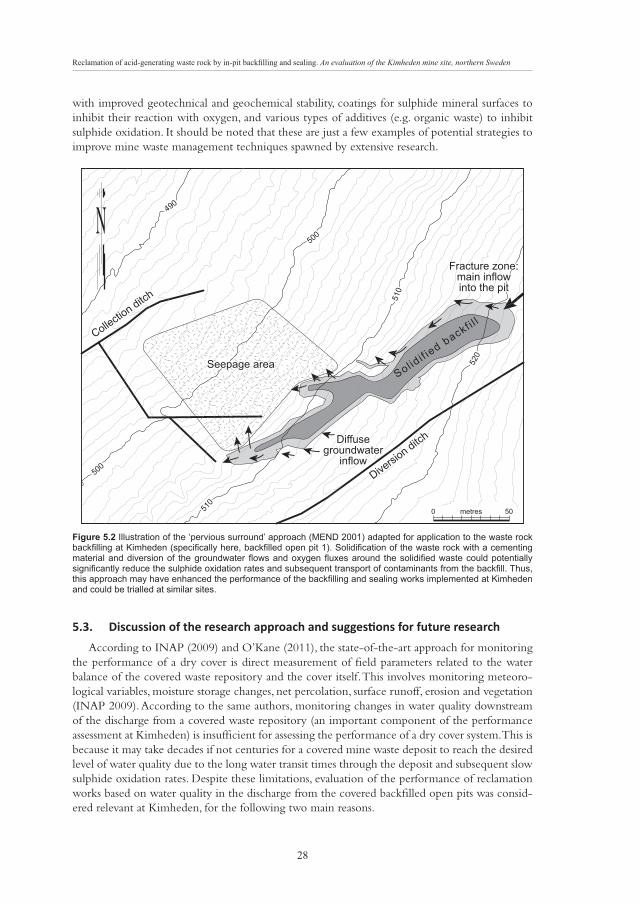
ecla ation o acid generating waste roc by in pit bac lling and sealing. An evaluation of the Kimheden mine site, northern Sweden
28
with improved geotechnical and geochemical stability, coatings for sulphide mineral surfaces to inhibit their reaction with oxygen, and various types of additives (e.g. organic waste) to inhibit sulphide oxidation. It should be noted that these are just a few examples of potential strategies to improve mine waste management techniques spawned by extensive research.
Figure 5.2
500
490
510
520
500
490
510
520
500
500
500
500
490
510
510
510
510
520
Diversio
n ditch
Collection ditch
Diffusegroundwater
inflow
Seepage area
Fracture zone:main inflowinto the pit
Diversio
n ditch
Sol idi f ie
d backf i l lCollectio
n ditch
Diffusegroundwater
inflow
Seepage area
Fracture zone:main inflowinto the pit
N
metres 500
5.3. According to INAP (2009) and O’Kane (2011), the state-of-the-art approach for monitoring the performance of a dry cover is direct measurement of field parameters related to the water balance of the covered waste repository and the cover itself. This involves monitoring meteoro-logical variables, moisture storage changes, net percolation, surface runoff, erosion and vegetation (INAP 2009). According to the same authors, monitoring changes in water quality downstream of the discharge from a covered waste repository (an important component of the performance assessment at Kimheden) is insufficient for assessing the performance of a dry cover system. This is because it may take decades if not centuries for a covered mine waste deposit to reach the desired level of water quality due to the long water transit times through the deposit and subsequent slow sulphide oxidation rates. Despite these limitations, evaluation of the performance of reclamation works based on water quality in the discharge from the covered backfilled open pits was consid-ered relevant at Kimheden, for the following two main reasons.
ecla ation o acid generating waste roc by in pit bac lling and sealing. An evaluation of the Kimheden mine site, northern Sweden
29
At high water flow periods, contact between the backfilled waste rock at Kimheden and subsur-face water flows is substantially more extensive than in traditional (generally unsaturated) waste rock piles. Hence, changes in water quality resulting from application of the dry cover are pre-sumed to have been much faster than typical responses in above-ground waste rock deposits. As shown by the hydrogeological results, most of the waste in backfilled open pit 1 is submerged sometimes (usually during spring flood periods, although exceptionally high groundwater heads in the backfill have been observed on other occasions) – see Figure 4.4. In addition, the turn-over time for water in the backfill was estimated to be up to 3 years (see Section 4.3), although probably shorter for most of the water, as indicated by early stabilisation of the water quality in the discharge following reclamation and relatively quick responses of the water table to changes in precipitation observed in the field. This explains why the timing of the water quality response after capping of the waste was not considered an issue in the investigations this thesis is based upon.
Another important reason why direct field measurements on the dry cover were not consid-ered most appropriate at Kimheden is that it was only one of several possible interfaces allowing exchanges with the atmosphere. Usually dry covers of waste rock piles are applied over the whole surface of the waste (except for the bottom of the piles, which are not usually considered a potential source of oxygen). However, the capping at Kimheden left large waste surfaces with potentially higher than desirable contact with oxygen adjacent to the pits’ walls. Thus, surround-ing the waste rock with permeable bedrock would still compromise long-term isolation of the waste from oxygen, even if the dry cover worked perfectly.
Despite these observations, direct field monitoring of the dry cover’s performance could still be beneficial for understanding effects of such a reclamation approach. For example, it may have facilitated assessment of the relative importance of oxygen ingress through the dry cover and the fractured bedrock (which was not possible using the data acquired). Since composite dry covers composed of combinations of clayey and unsorted till are commonly used in Sweden and various other countries, data acquired from monitoring the performance of such a cover system might also be applicable to other sites, and thus may be warranted in future investigations.
The main objectives of the studies this thesis is based upon were to assess the effectiveness of the in-pit backfilling and sealing reclamation approach applied at Kimheden mine and identify possi-ble flaws in it. A major finding was that sealing the waste with a dry cover may not be sufficient, depending on the nature of the waste and the open-pit settings. The next logical step would be to explore alternative reclamation options in this context. Based on the conditions observed at Kimheden, application of a ‘pervious surround’ approach has been suggested (see Section 5.2). However, this approach has been mainly applied in the in-pit disposal of tailings (MEND 2001), thus trials of its utility for treating solidified backfilled waste rock at meso- or full-scale could provide valuable information.
With regards to controlling oxygen contact with sulphides, a PhD project has just commenced at Luleå University of Technology with the aim of developing inhibition/stabilisation techniques to prevent sulphide oxidation of unoxidised reactive waste rock during mining operations. The project will include experiments to assess the inhibition/stabilisation capacities of by-products of other industries, such as cement kiln dust, blast furnace slag and fly ash. The economic, environ-mental and technical implications of using these materials will also be assessed. This project is part of a recently initiated programme (‘StopOx’) investigating the potential of industrial by-products for use in the prevention of sulphide oxidation in mine waste.
ecla ation o acid generating waste roc by in pit bac lling and sealing. An evaluation of the Kimheden mine site, northern Sweden
30
In more general terms, investigations at previously reclaimed mine sites are encouraged. The peer-reviewed literature related to AMD prevention is still largely dominated by laboratory and pilot-scale studies, but detailed understanding of post-reclamation hydrogeochemical processes is clearly essential for improving the long-term performance of AMD-prevention measures at mine sites.
6. Conclusions In-pit backfilling of acid-generating waste rock and sealing with a dry cover at the Kimheden mine was followed by large reductions in concentrations of Cu and Zn in the drainage from the site. However, the water quality rapidly stabilised at a level that is still too poor to allow uncon-trolled discharge into the surrounding natural environment. Between 13 to 18 years after comple-tion of the reclamation works average dissolved concentrations of selected metals in the drainage across the site were: 380–2 000 μg/L Cu; 108–450 μg/L Zn; 0.16–1 μg/L Cd; and 3.1–17 mg/L Al.
The steady-state metal concentrations observed in the mine water in recent years were shown to be caused by ongoing sulphide oxidation driven by oxygen ingress into the backfilled mine waste, despite the dry cover. Effects of leaching of oxidation products stored in the waste since pre- reclamation times – and thus their contributions to ongoing sulphide oxidation by Fe(III) – were judged to be negligible. Concentrations of dissolved S in the drainage seeping out from the covered backfill in recent years showed that the sulphide oxidation rates in the backfilled waste rock were at least an order of magnitude higher than expected from dry cover design specifica-tions.
Ingress of oxygen into the backfilled waste was presumed to be primarily due to a large unsatu-rated zone in the waste rock (especially during low flow periods) and fractures in the enclosing bedrock. However, deficiencies in the integrity of the dry cover were also identified. The results of the investigations prompted suggestions for an alternative reclamation approach in the context of in-pit backfilling and sealing of waste rock, based on application of the ‘pervious surround’ concept, which has already been employed to treat tailings at other sites.
References
Alakangas, L., Lundberg, A., & Öhlander, B. (2007). Changes of the groundwater quality in sul-phide-bearing mine-tailings as a result of remediation at Kristineberg, northern Sweden. In Proceedings of Mining and the Environment International Conference IV, Sudbury, Canada.
Alakangas, L., Andersson, E., & Mueller, S. (2013). Neutralization/prevention of acid rock drain-age using mixtures of alkaline by-products and sulfidic mine wastes. Environmental Science and Pollution Research, 20(11), 7907-7916.
Allen, R. L., Weihed, P., & The Global VHMS Research Project Team (2002). Global comparisons of volcanic-associated massive sulphide districts. Geological Society, London, Special Publications, 204(1), 13-37.
Amezaga, J. M., Rötting, T. S., Younger, P. L., Nairn, R. W., Noles, A. J., Oyarzún, R., & Quint-anilla, J. (2011). A rich vein? Mining and the pursuit of sustainability. Environmental Science & Technology, 45(1), 21-26.
ecla ation o acid generating waste roc by in pit bac lling and sealing. An evaluation of the Kimheden mine site, northern Sweden
31
Andersson, G. (1988). Kimheden, miljöåtgärder. Boliden Mineral AB’s internal report.
Årebäck, H., Barrett, T. J., Abrahamsson, S., & Fagerström, P. (2005). The Palaeoproterozoic Kris-tineberg VMS deposit, Skellefte district, northern Sweden, part I: geology. Mineralium Deposita, 40(4), 351-367.
Ayres, B., Lanteigne, L., & O’Kane, M. (2005). Design and construction of the backfilled pit cover system at Whistle Mine, Canada: a case study. In Proceedings of Securing the Future: International Conference on Mining and the Environment, Metals and Energy Recovery, Skellefteå, Sweden.
Ayres, B. K., Lanteigne, L., Smith, Q., & O’Kane, M. (2007). Closure planning and implemen-tation at CVRD Inco’s Whistle Mine, Ontario, Canada. In Proceedings of Mine Closure 2007, Second International Seminar on Mine Closure, Santiago, Chile.
Ayres, B. K., Lanteigne, L., O’Kane, M. & Meiers, G. (2012). Whistle Mine backfilled pit dry cover case study – Performance based on six years of field monitoring. In Proceedings of the 9th ICARD (International Conference on Acid Rock Drainage), Ottawa, Canada.
Bambic, D. G., Alpers, C. N., Green, P. G., Fanelli, E., & Silk, W. K. (2006). Seasonal and spatial patterns of metals at a restored copper mine site. I. Stream copper and zinc. Environmental Pol-lution, 144(3), 774-782.
Bell, F. G. (2001). Some environmental impacts of mining. In P. G. Marinos, G. C. Koukis, G. C. Tsiambaos & G. C. Stournaras (Eds.), Engineering geology and the environment (Vol. 4, pp. 3519-3559). Lisse, The Netherlands: A.A. Balkema.
Brake, S., Connors, K., & Romberger, S. (2001). A river runs through it: impact of acid mine drainage on the geochemistry of West Little Sugar Creek pre- and post-reclamation at the Green Valley coal mine, Indiana, USA. Environmental Geology, 40(11-12), 1471-1481.
Breng N. (2014). Hydrogeological studies of the reclamation measures at the Kimheden open-pit mine, northern Sweden. M.Sc. thesis in preparation. Luleå University of Technology, Sweden.
Chapman, J., Hockley, D., Sevick, J., Dachel, R., & Paul, M. (1998). Pit backfilling on two conti-nents: Comparison of recent experiences in the Wismut and Flambeau projects. In Tailings and Mine Waste ’98. Proceedings of the 5th Conference on Tailings and Mine Waste (pp. 55-65). Rotter-dam, The Netherlands: A.A. Balkema.
Church, S. E., Owen, J. R., von Guerard, P., Verplanck, P. L., Kimball, B. A., & Yager, D. B. (2007). The effects of acidic mine drainage from historical mines in the Animas River watershed, San Juan County, Colorado – What is being done and what can be done to improve water quality? Reviews in Engineering Geology, 17, 47-83.
Clark, A. L., & Cook Clark, J. (2005). An international overview of legal frameworks for mine closure. Environmental Law Alliance Worldwide. http://www.elaw.org/node/7123. Last Accessed 3 November 2014.
ecla ation o acid generating waste roc by in pit bac lling and sealing. An evaluation of the Kimheden mine site, northern Sweden
32
Cunningham, W. L., & Schalk, C. W. (2011). Groundwater technical procedures of the U.S. Geological Survey. U.S. Geological Survey techniques and methods 1–A1. US Department of the Interior, US Geological Survey. http://pubs.usgs.gov/tm/1a1/. Last Accessed 3 November 2014.
Dahlin, T., & Zhou, B. (2006). Multiple-gradient array measurements for multichannel 2D resis-tivity imaging. Near Surface Geophysics, 4(2), 113-123.
Dold, B. (2008). Sustainability in metal mining: from exploration, over processing to mine waste management. Reviews in Environmental Science and Bio/Technology, 7(4), 275-285.
Dzombak, D. A., & Morel, F. M. M. (1990). Surface complexation modeling: hydrous ferric oxide. John Wiley & Sons.
Edström & Schönfeldt AB (1996). Kristinebergsgruvan, Efterbehandlingsarbeten. Edström & Schön-feldt AB and Boliden Mineral AB, Sweden. Boliden Mineral AB’s internal report.
Encyclopædia Britannica (2014) Continental subarctic climate. In Encyclopædia Britannica online. http://global.britannica.com/EBchecked/topic/134997/continental-subarctic-climate. Last Accessed 24 Oct 2014.
Fala, O., Molson, J., Aubertin, M., & Bussière, B. (2005). Numerical modelling of flow and capillary barrier effects in unsaturated waste rock piles. Mine Water and the Environment, 24(4), 172-185.
Fredlund, D. G., & Wilson, G. W. (2006). Are we doing it right? Geotechnical News, March, 43-48.
Gordon, N. D., McMahon, T. A., Finlayson, B. L., Gippel, C. J., & Nathan, R. J. (2004). Stream hy-drology: an introduction for ecologists (2nd ed.). Chichester: John Wiley & Sons.
Hannington, M. D., Kjarsgaard, I. M., Galley, A. G., & Taylor, B. (2003). Mineral-chemical studies of metamorphosed hydrothermal alteration in the Kristineberg volcanogenic massive sulfide district, Sweden. Mineralium Deposita, 38(4), 423-442.
Hockley, D. (2012). Mine and facility closure trends. SRK Consulting’s International Newsletter No. 45, 1-2.
Höglund L. O. , Herbert R. (Eds.), Lövgren L., Öhlander B., Neretnieks I., Moreno L., Malm-ström M., Elander P., Lindvall M., & Lindström B. (2004). MiMi – Performance assessment: main report. MiMi 2003:3, Mitigation of the environmental impact from mining waste programme (MiMi). Luleå, Sweden: MiMi Print.
Holmström, H., & Öhlander, B. (1999). Oxygen penetration and subsequent reactions in flooded sulphidic mine tailings: a study at Stekenjokk, northern Sweden. Applied Geochemistry, 14(6), 747-759.
Holmström, H., Salmon, U. J., Carlsson, E., Petrov, P., & Öhlander, B. (2001). Geochemical inves-tigations of sulfide-bearing tailings at Kristineberg, northern Sweden, a few years after reme-diation. Science of the Total Environment, 273(1), 111-133.

ecla ation o acid generating waste roc by in pit bac lling and sealing. An evaluation of the Kimheden mine site, northern Sweden
33
Hope, G. (1992). AMD prevention and control methods used in Canada. In Proceedings of the 13th Annual West Virginia Surface Mine Drainage Task Force Symposium. Morgantown, West Virginia, West Virginia University.
Hudson-Edwards, K. A., Jamieson, H. E., & Lottermoser, B. G. (2011). Mine wastes: Past, present, future. Elements, 7(6), 375-380.
Hvorslev, M. J. (1951). Time lag and soil permeability in ground-water observations (Bulletin No. 36). Vicksburg, USA: Waterways Experiment Station, U.S. Army Corps of Engineers.
INAP (The International Network for Acid Prevention) (2009). Global Acid Rock Drainage Guide (GARD Guide). Chapter 6. http://www.gardguide.com/. Last Accessed 2nd Novem-ber 2014.
Johnson, D. B. (1998). Biodiversity and ecology of acidophilic microorganisms. FEMS Microbiology Ecology, 27(4), 307-317.
Johnson, D. B., & Hallberg, K. B. (2005). Acid mine drainage remediation options: a review. Science of the Total Environment, 338(1), 3-14.
Jönsson, H. (1993). Efterbehandlingsprojekt – Kristineberg, Kimheden. Boliden Mineral AB’s internal report.
Karlsson, S., & Bäckström, M. (2003). Surface water quality in Bersbo, Sweden – fifteen years after amelioration of sulphidic waste. In Proceedings of Mining and the Environment International Conference III, Sudbury, Canada.
Kuyucak, N. (1999). Acid mine drainage prevention and control options. In R. Fernández Rubio (Ed.), Mine, Water & Environment (Vol. II, pp. 599-606). Proceedings of IMWA (International Mine Water Association) Congress, Sevilla, Spain.
Landström, J. A. (1981). Boliden Mineral AB, Kristinebergs anrikningsområde. Dag- och dräneringsvatten – kartläggning. Boliden Mineral AB’s internal report.
Lefebvre, R., Hockley, D., Smolensky, J., & Lamontagne, A. (2001). Multiphase transfer processes in waste rock piles producing acid mine drainage: 2. Applications of numerical simulation. Journal of Contaminant Hydrology, 52(1), 165-186.
Lindvall, M., Eriksson, N., & Ljungberg, J. (1999). Decommissioning at Kristineberg mine, Sweden. In Proceedings of Sudbury ‘99, Mining and the Environment International Conference II, Sudbury, Canada.
Loke, M. H., Acworth, I., & Dahlin, T. (2003). A comparison of smooth and blocky inversion methods in 2D electrical imaging surveys. Exploration Geophysics, 34(3), 182-187.
Longo, S., & Wilson, W. (2007). “Paste rock”: Part of the future for mine waste management? Canadian Mining Journal, October.
ecla ation o acid generating waste roc by in pit bac lling and sealing. An evaluation of the Kimheden mine site, northern Sweden
34
Lottermoser, B. (2010). Mine wastes: characterization, treatment and environmental impacts. Springer Berlin Heidelberg.
Mäkitalo, M., Maurice, C., Jia, Y., & Öhlander, B. (2014). Characterization of green liquor dregs, potentially useful for prevention of the formation of Acid Rock Drainage. Minerals, 4(2), 330-344.
Małoszewski, P., & Zuber, A. (1982). Determining the turnover time of groundwater systems with the aid of environmental tracers: 1. Models and their applicability. Journal of Hydrology, 57(3), 207-231.
MEND (Mine Environment Neutral Drainage) (2001). MEND manual, volume 4 – Prevention and control. Canadian Mine Environment Neutral Drainage Program, MEND 5.4.2d.
Miller, A. J., & Zégre, N. P. (2014). Mountaintop Removal Mining and Catchment Hydrology. Water, 6(3), 472-499.
Mitchell, P. (1999). Prediction, prevention, control, and treatment of acid rock drainage. In A. Warhurst & L. Noronha (Eds.), Environmental policy in mining: Corporate strategy and planning for closure (pp. 117-143). London: Lewis Publishers.
Mudd, G. M., & Patterson, J. (2010). Continuing pollution from the Rum Jungle U–Cu project: A critical evaluation of environmental monitoring and rehabilitation. Environmental Pollution, 158(5), 1252-1260.
Nason, P., Alakangas, L., & Öhlander, B. (2013). Using sewage sludge as a sealing layer to reme-diate sulphidic mine tailings: a pilot-scale experiment, northern Sweden. Environmental Earth Sciences, 70(7), 3093-3105.
Nordstrom, D. K. (1977). Thermochemical redox equilibria of ZoBell’s solution. Geochimica et Cosmochimica Acta, 41(12), 1835-1841.
Nordstrom, D. K. (2009). Pitfalls and limitations of mineral equilibrium assumptions for geo-chemical modeling of water-rock interactions at mine sites. In Proceedings of Securing the Future and 8th ICARD (International Conference on Acid Rock Drainage), Skellefteå, Sweden.
Nordstrom, D. K., & Alpers, C. N. (1999). Geochemistry of acid mine waters. In G. S. Plumlee & M. J. Logsdon (Eds.), The environmental geochemistry of mineral deposits (Vol. 6A, pp. 133-160). Society of Economic Geologists.
O’Kane, M. (2011). State-of-the-art performance monitoring of cover systems – Moving from point scale to macro scale approaches. In Proceedings of the 7th Australian Workshop on Acid and Metalliferous Drainage (AMD), Darwin, Australia.
Payne, F. C., Quinnan, J. A., & Potter, S. T. (2010). Remediation hydraulics. Boca Raton, USA: CRC Press.
Phelps, L. B. (1990). Unit operations of reclamation. In B. A. Kennedy (Ed.), Surface Mining (2nd ed.) (pp. 770-776). Littleton, Colorado, USA: Society for Mining, Metallurgy and Exploration.
ecla ation o acid generating waste roc by in pit bac lling and sealing. An evaluation of the Kimheden mine site, northern Sweden
35
Puhalovich, A. A., & Coghill, M. (2011). Management of mine wastes using pit void backfilling methods – current issues and approaches. In C. D. McCullough (Ed.), Mine pit lakes: closure and management (pp. 3-14). Australia: Australian Centre for Geomechanics, The University of Western Australia.
Resin, E. (2010). Vattenbalanser för tre nedlagda gruvor. MSc thesis. Umeå University, Sweden.
Ritchie, A. I. M. (2003). Oxidation and gas transport in piles of sulfidic material. In J. L. Jambor, D. W. Blowes & A. I. M. Ritchie (Eds.), Environmental aspects of mine wastes, short course series (Vol. 31., pp. 73-94). Ontario, Canada: Mineralogical Association of Canada.
Rosén, L., & Wilske, Å. (1994). Beräkningar av metallflöden och förslag till åtgärder vid Kimhedengruvan, Kristineberg. Scandiaconsult Väst AB, Sweden. Boliden Mineral AB’s internal report.
Runkel, R. L., Bencala, K. E., Kimball, B. A., Walton-Day, K., & Verplanck, P. L. (2009). A compar-ison of pre- and post-remediation water quality, Mineral Creek, Colorado. Hydrological Processes, 23(23), 3319-3333.
Sahoo, P. K., Kim, K., Equeenuddin, S. M., & Powell, M. A. (2013). Current approaches for miti-gating acid mine drainage. In D. M. Whitacre (Ed.), Reviews of Environmental Contamination and Toxicology (Vol. 226, pp. 1-32). New York: Springer.
SEPA (Swedish Environmental Protection Agency) (2000). Environmental quality criteria – lakes and watercourses. Report 5050. Kalmar, Sweden: Lenanders.
Sjöblom, Å., Christensen, D., Mueller S., & Taylor T. (2012). Evaluation of the function of the dry cover system at WRD5 at the Boliden Aitik copper mine, northern Sweden. In Proceedings of the 9th ICARD (International Conference on Acid Rock Drainage), Ottawa, Ontario, Canada.
SMHI (2007). Nederbörd. Normalvärden (1961-1990). http://data.smhi.se/met/climate/time_series/month_year/normal_1961_1990/SMHI_month_year_normal_61_90_precipita-tion_mm.txt. Last Accessed 21 May 2014.
SMHI (2008). Temperatur. Normalvärden (1961-1990). http://data.smhi.se/met/climate/time_series/month_year/normal_1961_1990/SMHI_month_year_normal_61_90_tempera-ture_celsius.txt. Last Accessed 21 May 2014.
SMHI (2014a). SMHI Öppna Data | Meteorologiska Observationer. http://opendata-down-load-metobs.smhi.se/explore/. Last Accessed 21 May 2014.
SMHI (2014b). Årsavdunstning medelvärde 1961-1990. http://www.smhi.se/klimatdata/hy-drologi/vattenstand/arsavdunstning-medelvarde-1961-1990-1.4096. Last Accessed 21 May 2014.
Unruh, D. M., Church, S. E., Nimick, D. A., & Fey, D. L. (2009). Metal contamination and post-re-mediation recovery in the Boulder River watershed, Jefferson County, Montana. Geochemistry: Exploration, Environment, Analysis, 9(2), 179-199.
USGS (U.S. Geological Survey) (2014). DOTABLES (Version 3.5) [Software]. Available from URL: http://water.usgs.gov/software/DOTABLES/. Last accessed 2nd November 2014.
ecla ation o acid generating waste roc by in pit bac lling and sealing. An evaluation of the Kimheden mine site, northern Sweden
36
Weight, W. D., & Sonderegger, J. L. (2001). Manual of applied field hydrogeology. New York: Mc-Graw-Hill.
Williams, R. D. (2009). Backfilling. In D. N. Castendyk & L. E. Eary (Eds.), Mine pit lakes: character-istics, predictive modeling, and sustainability (Vol. 3, pp. 225-237). Littleton, Colorado, USA: Society for Mining, Metallurgy and Exploration.
Willscher, S., Hertwig, T., Frenzel, M., Felix, M., & Starke, S. (2010). Results of remediation of hard coal overburden and tailing dumps after a few decades: Insights and conclusions. Hydro-metallurgy, 104(3), 506-517.
Wilson, G. W. (2008). Why are we still struggling [with] acid rock drainage. Geotechnical News, 26(2), 51-56.
Wireman, M. (2001). Potential water-quality impact of hard-rock mining. Groundwater Monitoring & Remediation, 21(3), 40-51.
Younger P. L., Banwart S. A., & Hedin R. S. (2002). Mine water: hydrology, pollution, remediation. Dordrecht: Kluwer Academic Publishers.
Younger, P. L., & Robins, N. S. (2002). Challenges in the characterization and prediction of the hydrogeology and geochemistry of mined ground. Geological Society, London, Special Publications, 198(1), 1-16.
Younger, P. L., & Sapsford, D. J. (2004). Evaluating the potential impact of opencast coal mining on water quality (Groundwater Regulations 1998): An assessment framework for Scotland. Scottish En-vironment Protection Agency.
Younger, P. L., Wolkersdorfer, C., Bowell, R. J., & Diels, L. (2006). Partnership for Acid Drainage Remediation in Europe (PADRE): building a better future founded on research and best prac-tice. In R. I. Barnhisel (Ed.), Proceedings of the 7th ICARD (International Conference on Acid Rock Drainage). Kentucky, USA: American Society of Mining and Reclamation (ASMR).
PAPER I
The effects of backfilling and sealing the waste rock on water quality at the Kimheden open-pit mine,
northern Sweden
Lucile Villain, Lena Alakangas and Björn Öhlander
Published in:Journal of Geochemical Exploration, 134, 99-110. (2013)

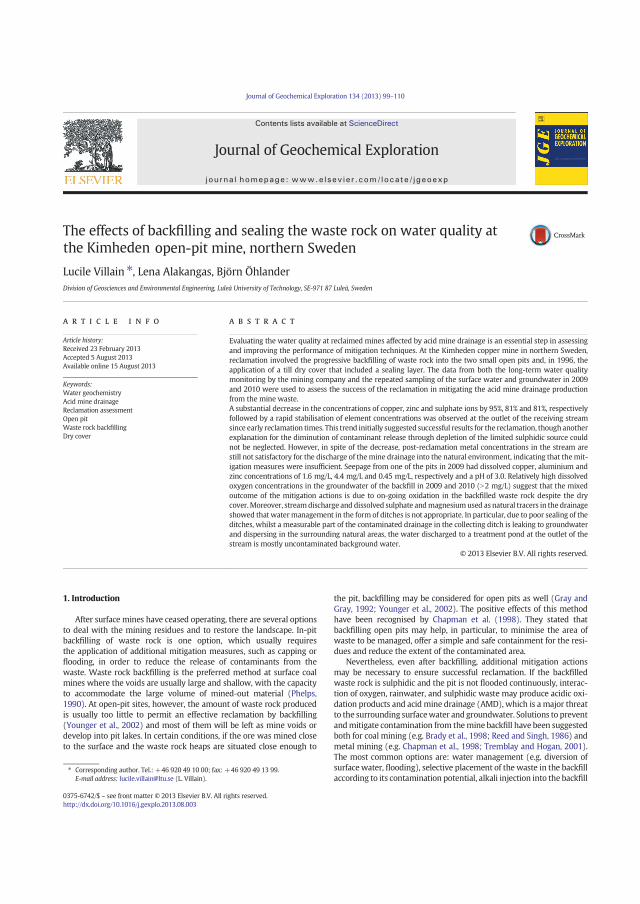
The effects of backfilling and sealing the waste rock on water quality atthe Kimheden open-pit mine, northern Sweden
Lucile Villain ⁎, Lena Alakangas, Björn ÖhlanderDivision of Geosciences and Environmental Engineering, Luleå University of Technology, SE-971 87 Luleå, Sweden
a b s t r a c ta r t i c l e i n f o
Article history:Received 23 February 2013Accepted 5 August 2013Available online 15 August 2013
Keywords:Water geochemistryAcid mine drainageReclamation assessmentOpen pitWaste rock backfillingDry cover
Evaluating the water quality at reclaimed mines affected by acid mine drainage is an essential step in assessingand improving the performance of mitigation techniques. At the Kimheden copper mine in northern Sweden,reclamation involved the progressive backfilling of waste rock into the two small open pits and, in 1996, theapplication of a till dry cover that included a sealing layer. The data from both the long-term water qualitymonitoring by the mining company and the repeated sampling of the surface water and groundwater in 2009and 2010 were used to assess the success of the reclamation in mitigating the acid mine drainage productionfrom the mine waste.A substantial decrease in the concentrations of copper, zinc and sulphate ions by 95%, 81% and 81%, respectivelyfollowed by a rapid stabilisation of element concentrations was observed at the outlet of the receiving streamsince early reclamation times. This trend initially suggested successful results for the reclamation, though anotherexplanation for the diminution of contaminant release through depletion of the limited sulphidic source couldnot be neglected. However, in spite of the decrease, post-reclamation metal concentrations in the stream arestill not satisfactory for the discharge of themine drainage into the natural environment, indicating that themit-igation measures were insufficient. Seepage from one of the pits in 2009 had dissolved copper, aluminium andzinc concentrations of 1.6 mg/L, 4.4 mg/L and 0.45 mg/L, respectively and a pH of 3.0. Relatively high dissolvedoxygen concentrations in the groundwater of the backfill in 2009 and 2010 (N2 mg/L) suggest that the mixedoutcome of the mitigation actions is due to on-going oxidation in the backfilled waste rock despite the drycover.Moreover, streamdischarge and dissolved sulphate andmagnesiumused as natural tracers in the drainageshowed that watermanagement in the form of ditches is not appropriate. In particular, due to poor sealing of theditches, whilst a measurable part of the contaminated drainage in the collecting ditch is leaking to groundwaterand dispersing in the surrounding natural areas, the water discharged to a treatment pond at the outlet of thestream is mostly uncontaminated background water.
© 2013 Elsevier B.V. All rights reserved.
1. Introduction
After surface mines have ceased operating, there are several optionsto deal with the mining residues and to restore the landscape. In-pitbackfilling of waste rock is one option, which usually requiresthe application of additional mitigation measures, such as capping orflooding, in order to reduce the release of contaminants from thewaste. Waste rock backfilling is the preferred method at surface coalmines where the voids are usually large and shallow, with the capacityto accommodate the large volume of mined-out material (Phelps,1990). At open-pit sites, however, the amount of waste rock producedis usually too little to permit an effective reclamation by backfilling(Younger et al., 2002) and most of them will be left as mine voids ordevelop into pit lakes. In certain conditions, if the ore was mined closeto the surface and the waste rock heaps are situated close enough to
the pit, backfilling may be considered for open pits as well (Gray andGray, 1992; Younger et al., 2002). The positive effects of this methodhave been recognised by Chapman et al. (1998). They stated thatbackfilling open pits may help, in particular, to minimise the area ofwaste to be managed, offer a simple and safe containment for the resi-dues and reduce the extent of the contaminated area.
Nevertheless, even after backfilling, additional mitigation actionsmay be necessary to ensure successful reclamation. If the backfilledwaste rock is sulphidic and the pit is not flooded continuously, interac-tion of oxygen, rainwater, and sulphidic waste may produce acidic oxi-dation products and acid mine drainage (AMD), which is a major threatto the surrounding surfacewater and groundwater. Solutions to preventandmitigate contamination from themine backfill have been suggestedboth for coal mining (e.g. Brady et al., 1998; Reed and Singh, 1986) andmetal mining (e.g. Chapman et al., 1998; Tremblay and Hogan, 2001).The most common options are: water management (e.g. diversion ofsurfacewater, flooding), selective placement of the waste in the backfillaccording to its contamination potential, alkali injection into the backfill
Journal of Geochemical Exploration 134 (2013) 99–110
⁎ Corresponding author. Tel.: +46 920 49 10 00; fax: +46 920 49 13 99.E-mail address: [email protected] (L. Villain).
0375-6742/$ – see front matter © 2013 Elsevier B.V. All rights reserved.http://dx.doi.org/10.1016/j.gexplo.2013.08.003
Contents lists available at ScienceDirect
Journal of Geochemical Exploration
j ourna l homepage: www.e lsev ie r .com/ locate / jgeoexp
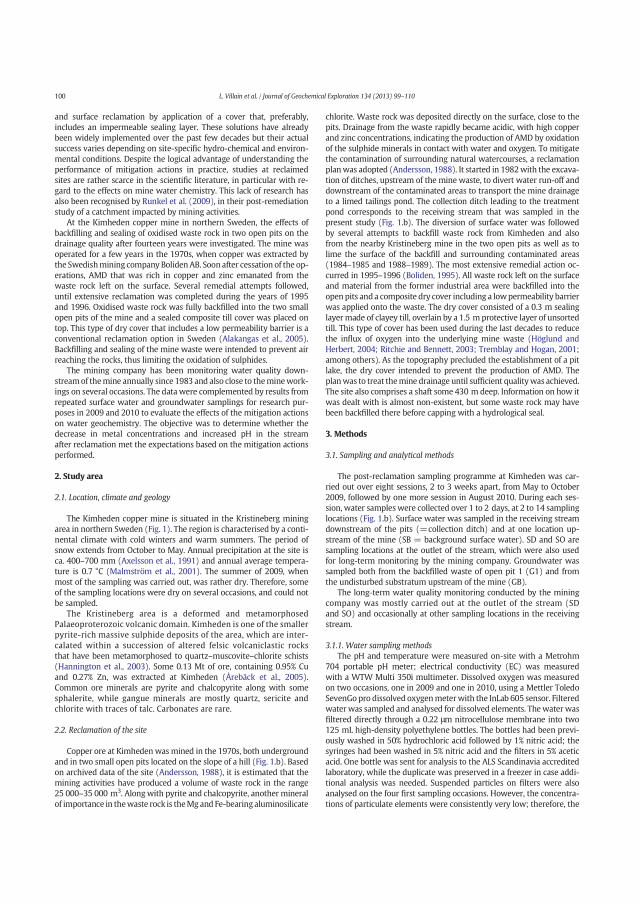
and surface reclamation by application of a cover that, preferably,includes an impermeable sealing layer. These solutions have alreadybeen widely implemented over the past few decades but their actualsuccess varies depending on site-specific hydro-chemical and environ-mental conditions. Despite the logical advantage of understanding theperformance of mitigation actions in practice, studies at reclaimedsites are rather scarce in the scientific literature, in particular with re-gard to the effects on mine water chemistry. This lack of research hasalso been recognised by Runkel et al. (2009), in their post-remediationstudy of a catchment impacted by mining activities.
At the Kimheden copper mine in northern Sweden, the effects ofbackfilling and sealing of oxidised waste rock in two open pits on thedrainage quality after fourteen years were investigated. The mine wasoperated for a few years in the 1970s, when copper was extracted bythe Swedishmining company BolidenAB. Soon after cessation of the op-erations, AMD that was rich in copper and zinc emanated from thewaste rock left on the surface. Several remedial attempts followed,until extensive reclamation was completed during the years of 1995and 1996. Oxidised waste rock was fully backfilled into the two smallopen pits of the mine and a sealed composite till cover was placed ontop. This type of dry cover that includes a low permeability barrier is aconventional reclamation option in Sweden (Alakangas et al., 2005).Backfilling and sealing of the mine waste were intended to prevent airreaching the rocks, thus limiting the oxidation of sulphides.
The mining company has been monitoring water quality down-streamof themine annually since 1983 and also close to theminework-ings on several occasions. The data were complemented by results fromrepeated surface water and groundwater samplings for research pur-poses in 2009 and 2010 to evaluate the effects of the mitigation actionson water geochemistry. The objective was to determine whether thedecrease in metal concentrations and increased pH in the streamafter reclamation met the expectations based on the mitigation actionsperformed.
2. Study area
2.1. Location, climate and geology
The Kimheden copper mine is situated in the Kristineberg miningarea in northern Sweden (Fig. 1). The region is characterised by a conti-nental climate with cold winters and warm summers. The period ofsnow extends from October to May. Annual precipitation at the site isca. 400–700 mm (Axelsson et al., 1991) and annual average tempera-ture is 0.7 °C (Malmström et al., 2001). The summer of 2009, whenmost of the sampling was carried out, was rather dry. Therefore, someof the sampling locations were dry on several occasions, and could notbe sampled.
The Kristineberg area is a deformed and metamorphosedPalaeoproterozoic volcanic domain. Kimheden is one of the smallerpyrite-rich massive sulphide deposits of the area, which are inter-calated within a succession of altered felsic volcaniclastic rocksthat have been metamorphosed to quartz–muscovite–chlorite schists(Hannington et al., 2003). Some 0.13 Mt of ore, containing 0.95% Cuand 0.27% Zn, was extracted at Kimheden (Årebäck et al., 2005).Common ore minerals are pyrite and chalcopyrite along with somesphalerite, while gangue minerals are mostly quartz, sericite andchlorite with traces of talc. Carbonates are rare.
2.2. Reclamation of the site
Copper ore at Kimhedenwas mined in the 1970s, both undergroundand in two small open pits located on the slope of a hill (Fig. 1.b). Basedon archived data of the site (Andersson, 1988), it is estimated that themining activities have produced a volume of waste rock in the range25 000–35 000 m3. Alongwith pyrite and chalcopyrite, another mineralof importance in thewaste rock is theMgand Fe-bearing aluminosilicate
chlorite. Waste rock was deposited directly on the surface, close to thepits. Drainage from the waste rapidly became acidic, with high copperand zinc concentrations, indicating the production of AMD by oxidationof the sulphide minerals in contact with water and oxygen. To mitigatethe contamination of surrounding natural watercourses, a reclamationplanwas adopted (Andersson, 1988). It started in 1982with the excava-tion of ditches, upstream of the mine waste, to divert water run-off anddownstream of the contaminated areas to transport the mine drainageto a limed tailings pond. The collection ditch leading to the treatmentpond corresponds to the receiving stream that was sampled in thepresent study (Fig. 1.b). The diversion of surface water was followedby several attempts to backfill waste rock from Kimheden and alsofrom the nearby Kristineberg mine in the two open pits as well as tolime the surface of the backfill and surrounding contaminated areas(1984–1985 and 1988–1989). The most extensive remedial action oc-curred in 1995–1996 (Boliden, 1995). All waste rock left on the surfaceand material from the former industrial area were backfilled into theopenpits and a composite dry cover including a lowpermeability barrierwas applied onto the waste. The dry cover consisted of a 0.3 m sealinglayermade of clayey till, overlain by a 1.5 m protective layer of unsortedtill. This type of cover has been used during the last decades to reducethe influx of oxygen into the underlying mine waste (Höglund andHerbert, 2004; Ritchie and Bennett, 2003; Tremblay and Hogan, 2001;among others). As the topography precluded the establishment of a pitlake, the dry cover intended to prevent the production of AMD. Theplanwas to treat themine drainage until sufficient qualitywas achieved.The site also comprises a shaft some 430 m deep. Information on how itwas dealt with is almost non-existent, but some waste rock may havebeen backfilled there before capping with a hydrological seal.
3. Methods
3.1. Sampling and analytical methods
The post-reclamation sampling programme at Kimheden was car-ried out over eight sessions, 2 to 3 weeks apart, from May to October2009, followed by one more session in August 2010. During each ses-sion, water samples were collected over 1 to 2 days, at 2 to 14 samplinglocations (Fig. 1.b). Surface water was sampled in the receiving streamdownstream of the pits (=collection ditch) and at one location up-stream of the mine (SB = background surface water). SD and SO aresampling locations at the outlet of the stream, which were also usedfor long-term monitoring by the mining company. Groundwater wassampled both from the backfilled waste of open pit 1 (G1) and fromthe undisturbed substratum upstream of the mine (GB).
The long-term water quality monitoring conducted by the miningcompany was mostly carried out at the outlet of the stream (SDand SO) and occasionally at other sampling locations in the receivingstream.
3.1.1. Water sampling methodsThe pH and temperature were measured on-site with a Metrohm
704 portable pH meter; electrical conductivity (EC) was measuredwith a WTW Multi 350i multimeter. Dissolved oxygen was measuredon two occasions, one in 2009 and one in 2010, using a Mettler ToledoSevenGo pro dissolved oxygenmeterwith the InLab 605 sensor. Filteredwater was sampled and analysed for dissolved elements. Thewaterwasfiltered directly through a 0.22 μm nitrocellulose membrane into two125 mL high-density polyethylene bottles. The bottles had been previ-ously washed in 50% hydrochloric acid followed by 1% nitric acid; thesyringes had been washed in 5% nitric acid and the filters in 5% aceticacid. One bottle was sent for analysis to the ALS Scandinavia accreditedlaboratory, while the duplicate was preserved in a freezer in case addi-tional analysis was needed. Suspended particles on filters were alsoanalysed on the four first sampling occasions. However, the concentra-tions of particulate elements were consistently very low; therefore, the
100 L. Villain et al. / Journal of Geochemical Exploration 134 (2013) 99–110
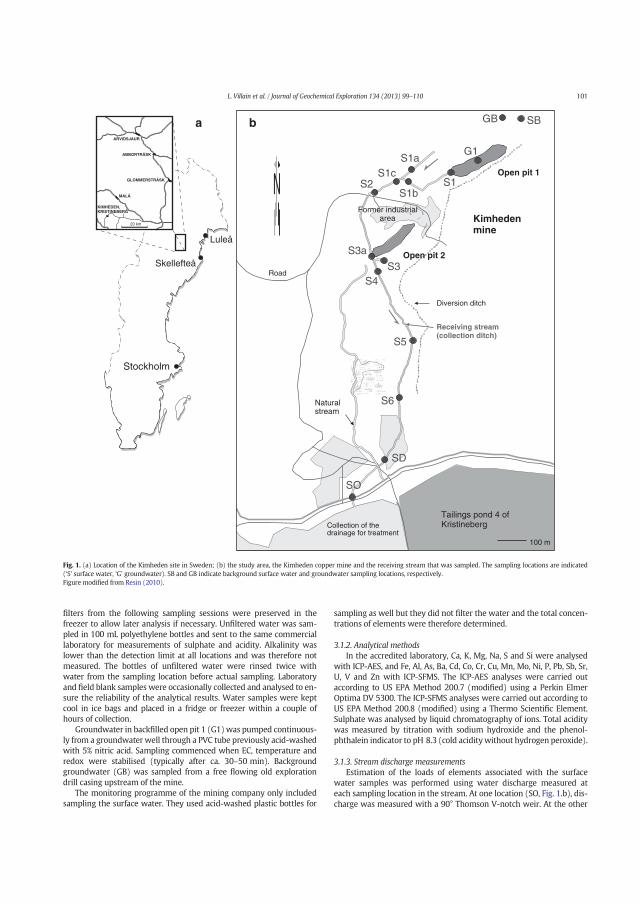
filters from the following sampling sessions were preserved in thefreezer to allow later analysis if necessary. Unfiltered water was sam-pled in 100 mL polyethylene bottles and sent to the same commerciallaboratory for measurements of sulphate and acidity. Alkalinity waslower than the detection limit at all locations and was therefore notmeasured. The bottles of unfiltered water were rinsed twice withwater from the sampling location before actual sampling. Laboratoryand field blank samples were occasionally collected and analysed to en-sure the reliability of the analytical results. Water samples were keptcool in ice bags and placed in a fridge or freezer within a couple ofhours of collection.
Groundwater in backfilled open pit 1 (G1)was pumped continuous-ly from a groundwater well through a PVC tube previously acid-washedwith 5% nitric acid. Sampling commenced when EC, temperature andredox were stabilised (typically after ca. 30–50 min). Backgroundgroundwater (GB) was sampled from a free flowing old explorationdrill casing upstream of the mine.
The monitoring programme of the mining company only includedsampling the surface water. They used acid-washed plastic bottles for
sampling as well but they did not filter the water and the total concen-trations of elements were therefore determined.
3.1.2. Analytical methodsIn the accredited laboratory, Ca, K, Mg, Na, S and Si were analysed
with ICP-AES, and Fe, Al, As, Ba, Cd, Co, Cr, Cu, Mn, Mo, Ni, P, Pb, Sb, Sr,U, V and Zn with ICP-SFMS. The ICP-AES analyses were carried outaccording to US EPA Method 200.7 (modified) using a Perkin ElmerOptima DV 5300. The ICP-SFMS analyses were carried out according toUS EPA Method 200.8 (modified) using a Thermo Scientific Element.Sulphate was analysed by liquid chromatography of ions. Total aciditywas measured by titration with sodium hydroxide and the phenol-phthalein indicator to pH 8.3 (cold acidity without hydrogen peroxide).
3.1.3. Stream discharge measurementsEstimation of the loads of elements associated with the surface
water samples was performed using water discharge measured ateach sampling location in the stream. At one location (SO, Fig. 1.b), dis-charge was measured with a 90° Thomson V-notch weir. At the other
Stockholm
Luleå
Skellefteå
20 km
ARVIDSJAUR
ABBORTRÄSK
GLOMMERSTRÄSK
MALÅ
KRISTINEBERGKIMHEDEN,
a
S1a
S1
G1
S1b
S1cS2
S3a
S3S4
S5
S6
SD
SO
GB SB
Open pit 1
Open pit 2
Former industrial area
Road
Diversion ditch
Receiving stream (collection ditch)
Tailings pond 4 ofKristineberg
Kimhedenmine
Naturalstream
100 m
Collection of the drainage for treatment
N
b
Fig. 1. (a) Location of the Kimheden site in Sweden; (b) the study area, the Kimheden copper mine and the receiving stream that was sampled. The sampling locations are indicated(‘S’ surface water, ‘G’ groundwater). SB and GB indicate background surface water and groundwater sampling locations, respectively.Figure modified from Resin (2010).
101L. Villain et al. / Journal of Geochemical Exploration 134 (2013) 99–110
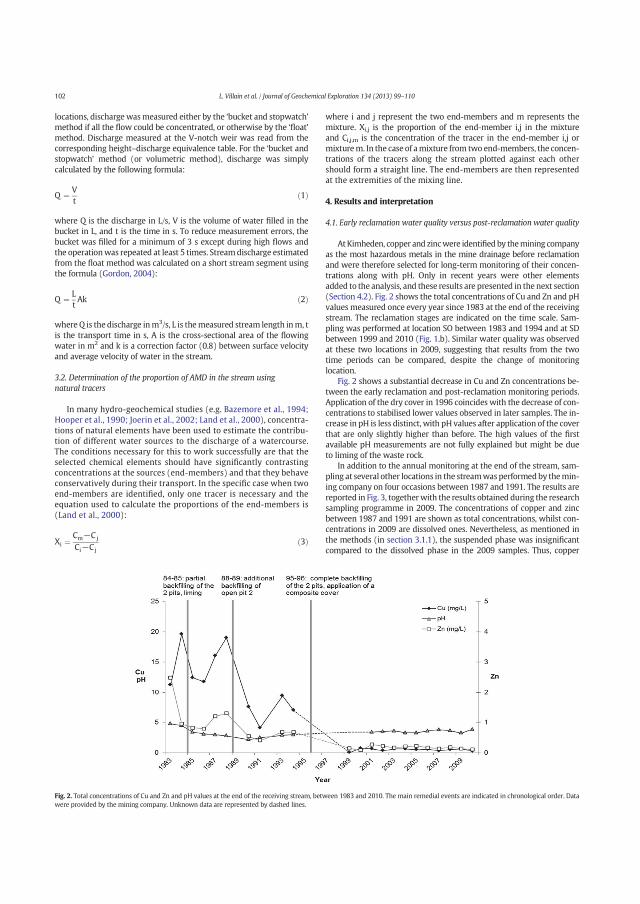
locations, discharge wasmeasured either by the ‘bucket and stopwatch’method if all the flow could be concentrated, or otherwise by the ‘float’method. Discharge measured at the V-notch weir was read from thecorresponding height–discharge equivalence table. For the ‘bucket andstopwatch’ method (or volumetric method), discharge was simplycalculated by the following formula:
Q ¼ Vt
ð1Þ
where Q is the discharge in L/s, V is the volume of water filled in thebucket in L, and t is the time in s. To reduce measurement errors, thebucket was filled for a minimum of 3 s except during high flows andthe operationwas repeated at least 5 times. Streamdischarge estimatedfrom the float method was calculated on a short stream segment usingthe formula (Gordon, 2004):
Q ¼ LtAk ð2Þ
where Q is the discharge inm3/s, L is themeasured stream length inm, tis the transport time in s, A is the cross-sectional area of the flowingwater in m2 and k is a correction factor (0.8) between surface velocityand average velocity of water in the stream.
3.2. Determination of the proportion of AMD in the stream usingnatural tracers
In many hydro-geochemical studies (e.g. Bazemore et al., 1994;Hooper et al., 1990; Joerin et al., 2002; Land et al., 2000), concentra-tions of natural elements have been used to estimate the contribu-tion of different water sources to the discharge of a watercourse.The conditions necessary for this to work successfully are that theselected chemical elements should have significantly contrastingconcentrations at the sources (end-members) and that they behaveconservatively during their transport. In the specific case when twoend-members are identified, only one tracer is necessary and theequation used to calculate the proportions of the end-members is(Land et al., 2000):
Xi ¼Cm−Cj
Ci−Cjð3Þ
where i and j represent the two end-members and m represents themixture. Xi,j is the proportion of the end-member i,j in the mixtureand Ci,j,m is the concentration of the tracer in the end-member i,j ormixturem. In the case of amixture from two end-members, the concen-trations of the tracers along the stream plotted against each othershould form a straight line. The end-members are then representedat the extremities of the mixing line.
4. Results and interpretation
4.1. Early reclamation water quality versus post-reclamation water quality
AtKimheden, copper and zincwere identifiedby themining companyas the most hazardous metals in the mine drainage before reclamationand were therefore selected for long-term monitoring of their concen-trations along with pH. Only in recent years were other elementsadded to the analysis, and these results are presented in the next section(Section 4.2). Fig. 2 shows the total concentrations of Cu and Zn and pHvalues measured once every year since 1983 at the end of the receivingstream. The reclamation stages are indicated on the time scale. Sam-pling was performed at location SO between 1983 and 1994 and at SDbetween 1999 and 2010 (Fig. 1.b). Similar water quality was observedat these two locations in 2009, suggesting that results from the twotime periods can be compared, despite the change of monitoringlocation.
Fig. 2 shows a substantial decrease in Cu and Zn concentrations be-tween the early reclamation and post-reclamation monitoring periods.Application of the dry cover in 1996 coincides with the decrease of con-centrations to stabilised lower values observed in later samples. The in-crease in pH is less distinct, with pH values after application of the coverthat are only slightly higher than before. The high values of the firstavailable pH measurements are not fully explained but might be dueto liming of the waste rock.
In addition to the annual monitoring at the end of the stream, sam-pling at several other locations in the streamwasperformedby themin-ing company on four occasions between 1987 and 1991. The results arereported in Fig. 3, togetherwith the results obtained during the researchsampling programme in 2009. The concentrations of copper and zincbetween 1987 and 1991 are shown as total concentrations, whilst con-centrations in 2009 are dissolved ones. Nevertheless, as mentioned inthe methods (in section 3.1.1), the suspended phase was insignificantcompared to the dissolved phase in the 2009 samples. Thus, copper
Fig. 2. Total concentrations of Cu and Zn and pH values at the end of the receiving stream, between 1983 and 2010. The main remedial events are indicated in chronological order. Datawere provided by the mining company. Unknown data are represented by dashed lines.
102 L. Villain et al. / Journal of Geochemical Exploration 134 (2013) 99–110
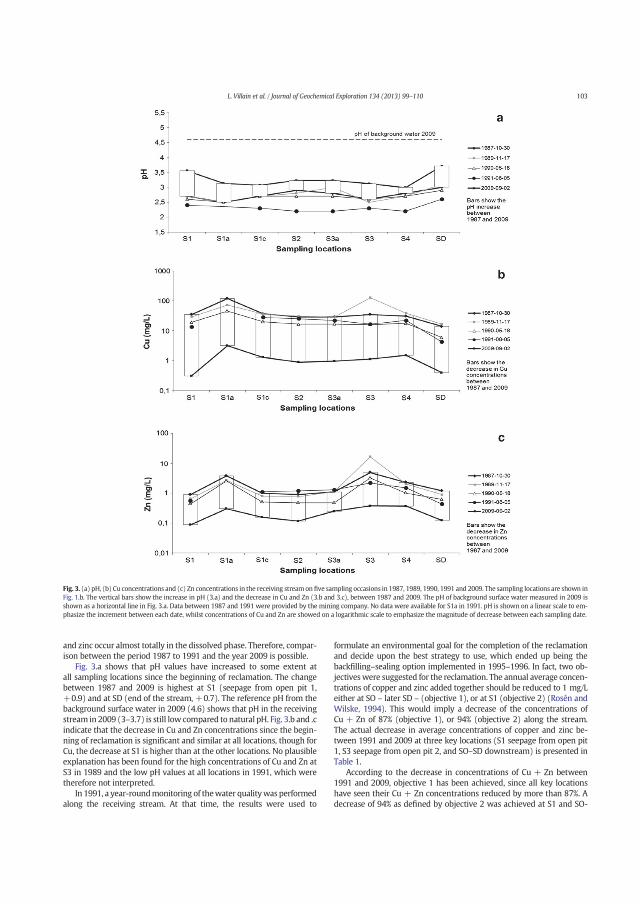
and zinc occur almost totally in the dissolved phase. Therefore, compar-ison between the period 1987 to 1991 and the year 2009 is possible.
Fig. 3.a shows that pH values have increased to some extent atall sampling locations since the beginning of reclamation. The changebetween 1987 and 2009 is highest at S1 (seepage from open pit 1,+0.9) and at SD (end of the stream, +0.7). The reference pH from thebackground surface water in 2009 (4.6) shows that pH in the receivingstream in 2009 (3–3.7) is still low compared to natural pH. Fig. 3.b and .cindicate that the decrease in Cu and Zn concentrations since the begin-ning of reclamation is significant and similar at all locations, though forCu, the decrease at S1 is higher than at the other locations. No plausibleexplanation has been found for the high concentrations of Cu and Zn atS3 in 1989 and the low pH values at all locations in 1991, which weretherefore not interpreted.
In 1991, a year-roundmonitoring of thewater qualitywas performedalong the receiving stream. At that time, the results were used to
formulate an environmental goal for the completion of the reclamationand decide upon the best strategy to use, which ended up being thebackfilling–sealing option implemented in 1995–1996. In fact, two ob-jectiveswere suggested for the reclamation. The annual average concen-trations of copper and zinc added together should be reduced to 1 mg/Leither at SO – later SD – (objective 1), or at S1 (objective 2) (Rosén andWilske, 1994). This would imply a decrease of the concentrations ofCu + Zn of 87% (objective 1), or 94% (objective 2) along the stream.The actual decrease in average concentrations of copper and zinc be-tween 1991 and 2009 at three key locations (S1 seepage from open pit1, S3 seepage from open pit 2, and SO–SD downstream) is presented inTable 1.
According to the decrease in concentrations of Cu + Zn between1991 and 2009, objective 1 has been achieved, since all key locationshave seen their Cu + Zn concentrations reduced by more than 87%. Adecrease of 94% as defined by objective 2 was achieved at S1 and SO-
Fig. 3. (a) pH, (b) Cu concentrations and (c) Zn concentrations in the receiving streamon five sampling occasions in 1987, 1989, 1990, 1991 and 2009. The sampling locations are shown inFig. 1.b. The vertical bars show the increase in pH (3.a) and the decrease in Cu and Zn (3.b and 3.c), between 1987 and 2009. The pH of background surface water measured in 2009 isshown as a horizontal line in Fig. 3.a. Data between 1987 and 1991 were provided by the mining company. No data were available for S1a in 1991. pH is shown on a linear scale to em-phasize the increment between each date, whilst concentrations of Cu and Zn are showed on a logarithmic scale to emphasize the magnitude of decrease between each sampling date.
103L. Villain et al. / Journal of Geochemical Exploration 134 (2013) 99–110

SD, but has yet to be reached at S3. The decrease in concentrations ofseparate ions at the outlet of the stream (SO-SD) is 95% for Cu and81% for Zn.
In 1983, sulphate concentrations were measured on several occa-sions downstream of the mine (at SO). Comparison of the average totalconcentration in 1983 (458 mg/L) with the average total concentrationat SD in 2009 (89 mg/L) indicates an 81% decrease in sulphate concen-trations since the earliest reclamation stage.
4.2. Evolution of the water composition downstream of themine since 2002
Since 2002, the mining company has increased its sampling down-stream of the mine to twice a year. EC and concentrations of several el-ements have been included in the monitoring in addition to pH andconcentrations of Cu and Zn. Fig. 4 shows some selected parameters.
All parameters sampled since 2002 (concentrations of Ca, Fe, K, Mg,Na, S, Al, Ba, Cd, Co, Cr, Cu, Mn, Ni, Pb, Zn; EC and pH values) suggest astabilisation. No increase or decrease has been observed since thattime. The improvement in water quality coinciding with reclamation(cf. 4.1) quickly reached an equilibrium. This improvement may beinterpreted as a result of the mitigation measures. However, the ob-served decrease in concentrations followed by stabilisation could alsobe interpreted as the exhaustion of the sulphidic source. Indeed, therate of oxidation of sulphideminerals and the resulting release of oxida-tion products in the drainage is probably not constant over time, butrather proportional to the mass of sulphides left in the waste rock(Younger et al., 2002) and it is suspected that the volume of backfill atKimheden is relatively small compared to the estimated flow of waterthrough the pits. Due to poor data on the composition of the backfilledwaste rock, however, it was not possible to reliably confirm one of thetwo hypotheses through modelling.
4.3. Mine water geochemical composition in 2009
The pH in the mine drainage in 2009 was low at all sampling loca-tions, with average values ranging from 3.0 to 3.7 (Table 2). Backgroundwater (SB and GB) was also relatively acidic (4.6), but the pH in thedrainage was 0.9 to 1.6 units lower than in the background water. Theaverage concentrations of Cu, Zn, Cd, Pb, Cr, Ni and As are shown inTable 2, where they are classified in accordance with the Swedish EPAcriteria (SEPA, 2000) which relates metal concentrations to biologicaleffects. According to this classification, Cu and Zn primarily, with Cd toa lesser extent, exhibited high concentrations in the stream, whichwere not observed in the background water. Aluminium is not takeninto account in this classification but it was also present inhigh average concentrations in the stream in 2009 (9.6 mg/L at G1,3.6 mg/L at S1, 4.4 mg/L at S3 and 3.1 mg/L at SD). S1a seeping belowopen pit 1 was sampled once only in 2009, but showed the highest con-centration of Al (19.8 mg/L), and its value in 2010 was also the highest(19.1 mg/L).
4.4. Geochemical processes in the backfill groundwater and insurface seepage
Dissolved oxygen concentrations measured in the groundwater inthe backfill of open pit 1 (G1) in 2009–2010 presented values between2 and 3 mg/L. This indicates that anoxic conditionswere not establishedin the backfill in 2009–2010, in spite of sealing with the dry cover. Oxi-dation of pyrite and chalcopyrite could therefore still occur in the back-fill. The stoichiometric relationship between the O2 consumed and theSO4 ions produced by pyrite oxidation under acidic conditions is gener-ally given as 3.5 mol of O2 producing 2 mol of SO4 according to thefollowing reaction (Höglund and Herbert, 2004; INAP, 2009):
FeS2 sð Þ þ 7=2O2 gð Þ þH2O 1ð Þ ¼ Fe2þaqð Þ þ 2SO2‐4 aqð Þ þ 2Hþ
aqð Þ: ð4Þ
From this relationship, it was estimated that the average total sul-phate concentration of 4.6 mmol/L at G1 in 2009–2010 required for itsproduction a concentration of oxygen of 8.1 mmol/L in the water,which is impossible to achieve. Indeed, according to computation withthe programme DOTABLES (USGS, 2013) with an average temperatureof 7.6 °C and average conductivity of 820 μS/cm, the oxygen solubilityin water is 12.1 mg/L, i.e. 0.38 mmol/L. This implies that, either oxygenis replenished through inflows of air into the backfill, or pyrite oxidationis maintained due to the presence of ferric ions originating from the dis-solution of iron-sulphate minerals. The importance of secondary iron-sulphate minerals from previously oxidised mine waste in sustainingpyrite oxidation under anoxic conditions has been demonstrated byCravotta (1994) in his modelling of geochemical reactions in coalmine drainage.
In order to identify themain geochemical processes occurring in theproximity of the pits, molar ratios of S/Fewere calculated in the ground-water in the backfill of open pit 1 (G1) and in the seepage from bothopen pits (S1, S1a, S1b, S3, S3a). The results are presented in Table 3.
At G1, the ratio is smaller than expected from the pyrite oxidation(S/Fe = 2) which might be due to dissolution of Fe-rich chlorite orother iron-bearing minerals. Ratios in the seepage from the backfilledpits increase with the distance away from the pits. This may indicatethe depletion of aqueous Fe by precipitation of ferric hydroxides or Fe-rich iron-sulphate minerals as groundwater comes to the surface.
4.5. Spatial variations in water composition in 2009–2010
The Pearson correlation coefficient was calculated between the con-centrations of dissolved elements assumed to be related to the genera-tion of mine drainage. It was found that S and Mg are the elements thatare best correlated, with a coefficient of 0.96 for 62 samples from allsampling locations. They also show a high correlation to titrated acidity(Pearson correlation coefficient of 0.98 (S) and 0.95 (Mg), for 34 sam-ples) which demonstrates their direct relation with AMD. Sulphur is in-troduced into water as sulphate from the oxidation of sulphidic wasteand magnesium is expected to originate from the increased dissolutionof chlorite as it buffers the acid generated by the sulphide oxidation(Höglund and Herbert, 2004). The dependence of the two reactions ex-plains the strong positive correlation between the two species. The highcorrelation was observed throughout the stream even downstream ofAMD producing areas, which indicates that the two species are ratherconservative in the lower part of the stream. Close to the pits, possibleprecipitation of sulphate minerals, as mentioned in Section 4.4, may re-move some sulphate ions from the streamwater. However, as explainedby Nordstrom (2011), the amount of sulphate removed by precipitationin minewater of pH b 3.5 is usually small compared to the amount thatremains dissolved in the water phase. Therefore, sulphate can be con-sidered conservative throughout the stream. The weight ratio Mg/Swas rather close to 0.1 throughout the stream in 2009–2010. Ratios ofCu/S, Zn/S, Fe/S and Al/S weremore variable, indicating that themineral
Table 1Average concentrations of Cu, Zn and Cu + Zn at S1 (seepage from open pit 1), S3(seepage from open pit 2) and SO-SD (downstream) in 1991 and 2009. Because thesampling in 1991 was performed over the whole year while the sampling in 2009 wasperformed over the snow-free period only, selected concentrations from each year wereused in the calculation of the averages. The percentage decrease between 1991 and 2009is indicated. Table modified from Rosén and Wilske (1994).
Cu(mg/L)
Zn(mg/L)
Cu + Zn(mg/L)
Percentage decrease (%)
Cu Zn Cu + Zn
1991 S1 15.24 0.51 15.75S3 16.10 1.95 18.05SO-SD 7.04 0.59 7.63
2009 S1 0.36 0.12 0.48 98 76 97S3 1.60 0.45 2.05 90 77 89SO-SD 0.36 0.11 0.47 95 81 94
104 L. Villain et al. / Journal of Geochemical Exploration 134 (2013) 99–110
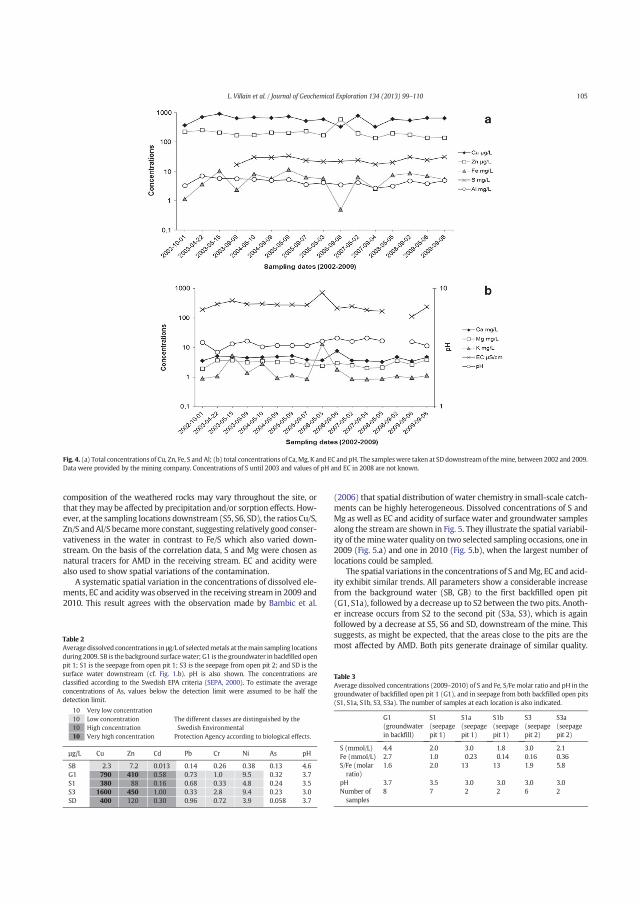
composition of the weathered rocks may vary throughout the site, orthat theymay be affected by precipitation and/or sorption effects. How-ever, at the sampling locations downstream (S5, S6, SD), the ratios Cu/S,Zn/S andAl/S becamemore constant, suggesting relatively good conser-vativeness in the water in contrast to Fe/S which also varied down-stream. On the basis of the correlation data, S and Mg were chosen asnatural tracers for AMD in the receiving stream. EC and acidity werealso used to show spatial variations of the contamination.
A systematic spatial variation in the concentrations of dissolved ele-ments, EC and acidity was observed in the receiving stream in 2009 and2010. This result agrees with the observation made by Bambic et al.
(2006) that spatial distribution of water chemistry in small-scale catch-ments can be highly heterogeneous. Dissolved concentrations of S andMg as well as EC and acidity of surface water and groundwater samplesalong the stream are shown in Fig. 5. They illustrate the spatial variabil-ity of theminewater quality on two selected sampling occasions, one in2009 (Fig. 5.a) and one in 2010 (Fig. 5.b), when the largest number oflocations could be sampled.
The spatial variations in the concentrations of S andMg, EC and acid-ity exhibit similar trends. All parameters show a considerable increasefrom the background water (SB, GB) to the first backfilled open pit(G1, S1a), followed by a decrease up to S2 between the two pits. Anoth-er increase occurs from S2 to the second pit (S3a, S3), which is againfollowed by a decrease at S5, S6 and SD, downstream of the mine. Thissuggests, as might be expected, that the areas close to the pits are themost affected by AMD. Both pits generate drainage of similar quality.
Fig. 4. (a) Total concentrations of Cu, Zn, Fe, S and Al; (b) total concentrations of Ca, Mg, K and EC and pH. The sampleswere taken at SD downstreamof themine, between 2002 and 2009.Data were provided by the mining company. Concentrations of S until 2003 and values of pH and EC in 2008 are not known.
Table 2Average dissolved concentrations in μg/L of selectedmetals at themain sampling locationsduring 2009. SB is the background surfacewater; G1 is the groundwater in backfilled openpit 1; S1 is the seepage from open pit 1; S3 is the seepage from open pit 2; and SD is thesurface water downstream (cf. Fig. 1.b). pH is also shown. The concentrations areclassified according to the Swedish EPA criteria (SEPA, 2000). To estimate the averageconcentrations of As, values below the detection limit were assumed to be half thedetection limit.
μg/L
SB
G1
S1
S3
SD
Cu
2.3
790380
1600400
Zn
7.2
41088
450120
Cd
0.013
0.58
0.16
1.00
0.30
Pb
0.14
0.73
0.68
0.33
0.96
Cr
0.26
1.0
0.33
2.8
0.72
Ni
0.38
9.5
4.8
9.4
3.9
As
0.13
0.32
0.24
0.23
0.058
pH
4.6
3.7
3.5
3.0
3.7
The different classes are distinguished by the
Swedish Environmental
Protection Agency according to biological effects.
Very low concentration
Low concentration
High concentration
Very high concentration
10
10
10
10
Table 3Average dissolved concentrations (2009–2010) of S and Fe, S/Fe molar ratio and pH in thegroundwater of backfilled open pit 1 (G1), and in seepage from both backfilled open pits(S1, S1a, S1b, S3, S3a). The number of samples at each location is also indicated.
G1(groundwaterin backfill)
S1(seepagepit 1)
S1a(seepagepit 1)
S1b(seepagepit 1)
S3(seepagepit 2)
S3a(seepagepit 2)
S (mmol/L) 4.4 2.0 3.0 1.8 3.0 2.1Fe (mmol/L) 2.7 1.0 0.23 0.14 0.16 0.36S/Fe (molarratio)
1.6 2.0 13 13 1.9 5.8
pH 3.7 3.5 3.0 3.0 3.0 3.0Number ofsamples
8 7 2 2 6 2
105L. Villain et al. / Journal of Geochemical Exploration 134 (2013) 99–110
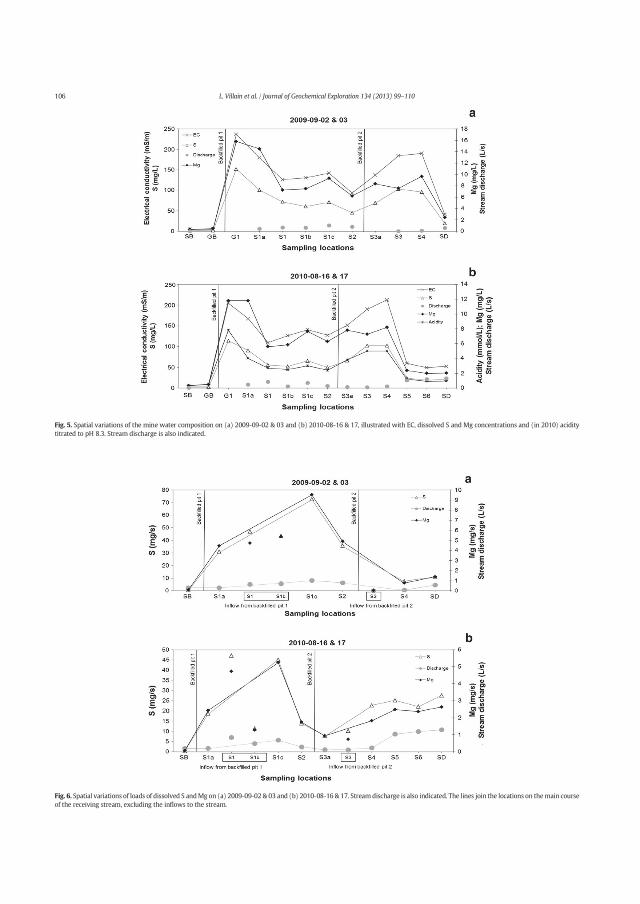
Fig. 5. Spatial variations of the mine water composition on (a) 2009-09-02 & 03 and (b) 2010-08-16 & 17, illustrated with EC, dissolved S and Mg concentrations and (in 2010) aciditytitrated to pH 8.3. Stream discharge is also indicated.
Fig. 6. Spatial variations of loads of dissolved S andMg on (a) 2009-09-02 & 03 and (b) 2010-08-16 & 17. Streamdischarge is also indicated. The lines join the locations on themain courseof the receiving stream, excluding the inflows to the stream.
106 L. Villain et al. / Journal of Geochemical Exploration 134 (2013) 99–110
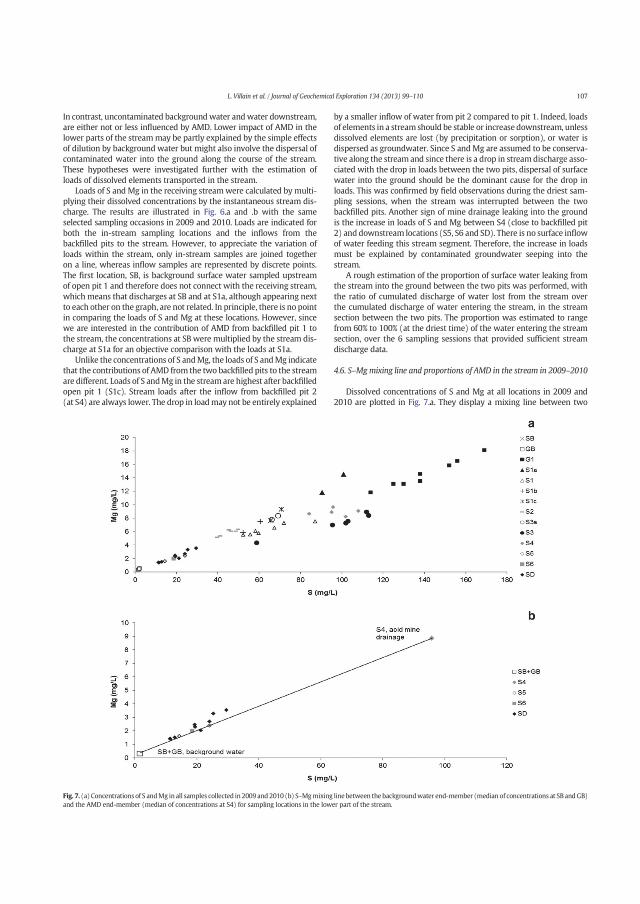
In contrast, uncontaminated backgroundwater andwater downstream,are either not or less influenced by AMD. Lower impact of AMD in thelower parts of the streammay be partly explained by the simple effectsof dilution by background water but might also involve the dispersal ofcontaminated water into the ground along the course of the stream.These hypotheses were investigated further with the estimation ofloads of dissolved elements transported in the stream.
Loads of S and Mg in the receiving streamwere calculated bymulti-plying their dissolved concentrations by the instantaneous stream dis-charge. The results are illustrated in Fig. 6.a and .b with the sameselected sampling occasions in 2009 and 2010. Loads are indicated forboth the in-stream sampling locations and the inflows from thebackfilled pits to the stream. However, to appreciate the variation ofloads within the stream, only in-stream samples are joined togetheron a line, whereas inflow samples are represented by discrete points.The first location, SB, is background surface water sampled upstreamof open pit 1 and therefore does not connect with the receiving stream,which means that discharges at SB and at S1a, although appearing nextto each other on the graph, are not related. In principle, there is no pointin comparing the loads of S and Mg at these locations. However, sincewe are interested in the contribution of AMD from backfilled pit 1 tothe stream, the concentrations at SB were multiplied by the stream dis-charge at S1a for an objective comparison with the loads at S1a.
Unlike the concentrations of S andMg, the loads of S andMg indicatethat the contributions of AMD from the two backfilled pits to the streamare different. Loads of S andMg in the streamare highest after backfilledopen pit 1 (S1c). Stream loads after the inflow from backfilled pit 2(at S4) are always lower. The drop in loadmay not be entirely explained
by a smaller inflow of water from pit 2 compared to pit 1. Indeed, loadsof elements in a stream should be stable or increase downstream, unlessdissolved elements are lost (by precipitation or sorption), or water isdispersed as groundwater. Since S andMg are assumed to be conserva-tive along the stream and since there is a drop in streamdischarge asso-ciated with the drop in loads between the two pits, dispersal of surfacewater into the ground should be the dominant cause for the drop inloads. This was confirmed by field observations during the driest sam-pling sessions, when the stream was interrupted between the twobackfilled pits. Another sign of mine drainage leaking into the groundis the increase in loads of S and Mg between S4 (close to backfilled pit2) and downstream locations (S5, S6 and SD). There is no surface inflowof water feeding this stream segment. Therefore, the increase in loadsmust be explained by contaminated groundwater seeping into thestream.
A rough estimation of the proportion of surface water leaking fromthe stream into the ground between the two pits was performed, withthe ratio of cumulated discharge of water lost from the stream overthe cumulated discharge of water entering the stream, in the streamsection between the two pits. The proportion was estimated to rangefrom 60% to 100% (at the driest time) of the water entering the streamsection, over the 6 sampling sessions that provided sufficient streamdischarge data.
4.6. S–Mgmixing line and proportions of AMD in the stream in 2009–2010
Dissolved concentrations of S and Mg at all locations in 2009 and2010 are plotted in Fig. 7.a. They display a mixing line between two
Fig. 7. (a) Concentrations of S andMg in all samples collected in 2009 and 2010 (b) S–Mgmixing line between the backgroundwater end-member (median of concentrations at SB andGB)and the AMD end-member (median of concentrations at S4) for sampling locations in the lower part of the stream.
107L. Villain et al. / Journal of Geochemical Exploration 134 (2013) 99–110
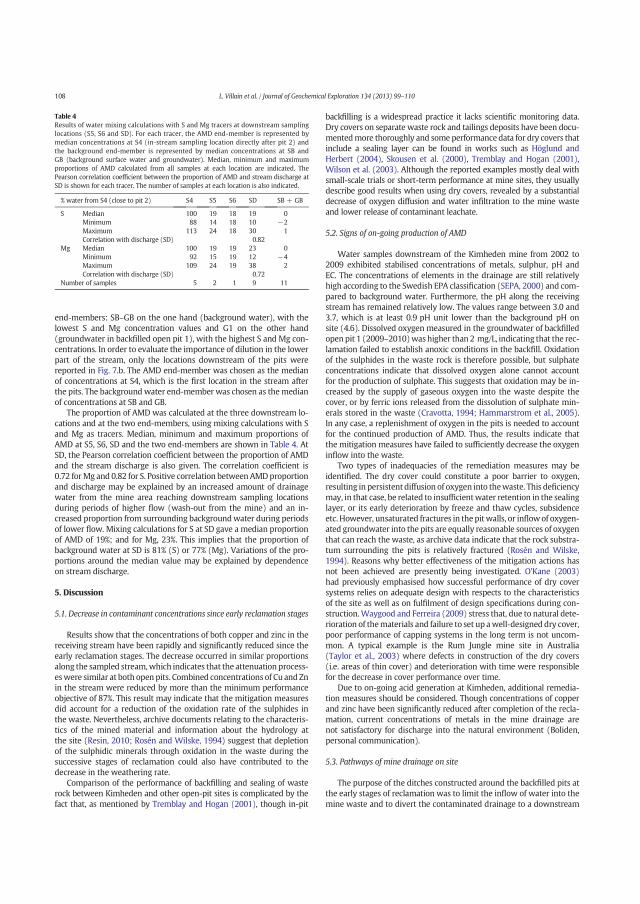
end-members: SB–GB on the one hand (background water), with thelowest S and Mg concentration values and G1 on the other hand(groundwater in backfilled open pit 1), with the highest S and Mg con-centrations. In order to evaluate the importance of dilution in the lowerpart of the stream, only the locations downstream of the pits werereported in Fig. 7.b. The AMD end-member was chosen as the medianof concentrations at S4, which is the first location in the stream afterthe pits. The backgroundwater end-member was chosen as themedianof concentrations at SB and GB.
The proportion of AMD was calculated at the three downstream lo-cations and at the two end-members, using mixing calculations with Sand Mg as tracers. Median, minimum and maximum proportions ofAMD at S5, S6, SD and the two end-members are shown in Table 4. AtSD, the Pearson correlation coefficient between the proportion of AMDand the stream discharge is also given. The correlation coefficient is0.72 forMg and 0.82 for S. Positive correlation between AMDproportionand discharge may be explained by an increased amount of drainagewater from the mine area reaching downstream sampling locationsduring periods of higher flow (wash-out from the mine) and an in-creased proportion from surrounding backgroundwater during periodsof lower flow. Mixing calculations for S at SD gave a median proportionof AMD of 19%; and for Mg, 23%. This implies that the proportion ofbackground water at SD is 81% (S) or 77% (Mg). Variations of the pro-portions around the median value may be explained by dependenceon stream discharge.
5. Discussion
5.1. Decrease in contaminant concentrations since early reclamation stages
Results show that the concentrations of both copper and zinc in thereceiving stream have been rapidly and significantly reduced since theearly reclamation stages. The decrease occurred in similar proportionsalong the sampled stream,which indicates that the attenuation process-eswere similar at both open pits. Combined concentrations of Cu andZnin the stream were reduced by more than the minimum performanceobjective of 87%. This result may indicate that the mitigation measuresdid account for a reduction of the oxidation rate of the sulphides inthe waste. Nevertheless, archive documents relating to the characteris-tics of the mined material and information about the hydrology atthe site (Resin, 2010; Rosén and Wilske, 1994) suggest that depletionof the sulphidic minerals through oxidation in the waste during thesuccessive stages of reclamation could also have contributed to thedecrease in the weathering rate.
Comparison of the performance of backfilling and sealing of wasterock between Kimheden and other open-pit sites is complicated by thefact that, as mentioned by Tremblay and Hogan (2001), though in-pit
backfilling is a widespread practice it lacks scientific monitoring data.Dry covers on separate waste rock and tailings deposits have been docu-mentedmore thoroughly and some performance data for dry covers thatinclude a sealing layer can be found in works such as Höglund andHerbert (2004), Skousen et al. (2000), Tremblay and Hogan (2001),Wilson et al. (2003). Although the reported examples mostly deal withsmall-scale trials or short-term performance at mine sites, they usuallydescribe good results when using dry covers, revealed by a substantialdecrease of oxygen diffusion and water infiltration to the mine wasteand lower release of contaminant leachate.
5.2. Signs of on-going production of AMD
Water samples downstream of the Kimheden mine from 2002 to2009 exhibited stabilised concentrations of metals, sulphur, pH andEC. The concentrations of elements in the drainage are still relativelyhigh according to the Swedish EPA classification (SEPA, 2000) and com-pared to background water. Furthermore, the pH along the receivingstream has remained relatively low. The values range between 3.0 and3.7, which is at least 0.9 pH unit lower than the background pH onsite (4.6). Dissolved oxygen measured in the groundwater of backfilledopenpit 1 (2009–2010)was higher than 2 mg/L, indicating that the rec-lamation failed to establish anoxic conditions in the backfill. Oxidationof the sulphides in the waste rock is therefore possible, but sulphateconcentrations indicate that dissolved oxygen alone cannot accountfor the production of sulphate. This suggests that oxidation may be in-creased by the supply of gaseous oxygen into the waste despite thecover, or by ferric ions released from the dissolution of sulphate min-erals stored in the waste (Cravotta, 1994; Hammarstrom et al., 2005).In any case, a replenishment of oxygen in the pits is needed to accountfor the continued production of AMD. Thus, the results indicate thatthe mitigation measures have failed to sufficiently decrease the oxygeninflow into the waste.
Two types of inadequacies of the remediation measures may beidentified. The dry cover could constitute a poor barrier to oxygen,resulting in persistent diffusion of oxygen into thewaste. This deficiencymay, in that case, be related to insufficientwater retention in the sealinglayer, or its early deterioration by freeze and thaw cycles, subsidenceetc. However, unsaturated fractures in thepitwalls, or inflowof oxygen-ated groundwater into the pits are equally reasonable sources of oxygenthat can reach the waste, as archive data indicate that the rock substra-tum surrounding the pits is relatively fractured (Rosén and Wilske,1994). Reasons why better effectiveness of the mitigation actions hasnot been achieved are presently being investigated. O'Kane (2003)had previously emphasised how successful performance of dry coversystems relies on adequate design with respects to the characteristicsof the site as well as on fulfilment of design specifications during con-struction.Waygood and Ferreira (2009) stress that, due to natural dete-rioration of thematerials and failure to set up awell-designed dry cover,poor performance of capping systems in the long term is not uncom-mon. A typical example is the Rum Jungle mine site in Australia(Taylor et al., 2003) where defects in construction of the dry covers(i.e. areas of thin cover) and deterioration with time were responsiblefor the decrease in cover performance over time.
Due to on-going acid generation at Kimheden, additional remedia-tion measures should be considered. Though concentrations of copperand zinc have been significantly reduced after completion of the recla-mation, current concentrations of metals in the mine drainage arenot satisfactory for discharge into the natural environment (Boliden,personal communication).
5.3. Pathways of mine drainage on site
The purpose of the ditches constructed around the backfilled pits atthe early stages of reclamation was to limit the inflow of water into themine waste and to divert the contaminated drainage to a downstream
Table 4Results of water mixing calculations with S and Mg tracers at downstream samplinglocations (S5, S6 and SD). For each tracer, the AMD end-member is represented bymedian concentrations at S4 (in-stream sampling location directly after pit 2) andthe background end-member is represented by median concentrations at SB andGB (background surface water and groundwater). Median, minimum and maximumproportions of AMD calculated from all samples at each location are indicated. ThePearson correlation coefficient between the proportion of AMD and stream discharge atSD is shown for each tracer. The number of samples at each location is also indicated.
% water from S4 (close to pit 2) S4 S5 S6 SD SB + GB
S Median 100 19 18 19 0Minimum 88 14 18 10 −2Maximum 113 24 18 30 1Correlation with discharge (SD) 0.82
Mg Median 100 19 19 23 0Minimum 92 15 19 12 −4Maximum 109 24 19 38 2Correlation with discharge (SD) 0.72
Number of samples 5 2 1 9 11
108 L. Villain et al. / Journal of Geochemical Exploration 134 (2013) 99–110
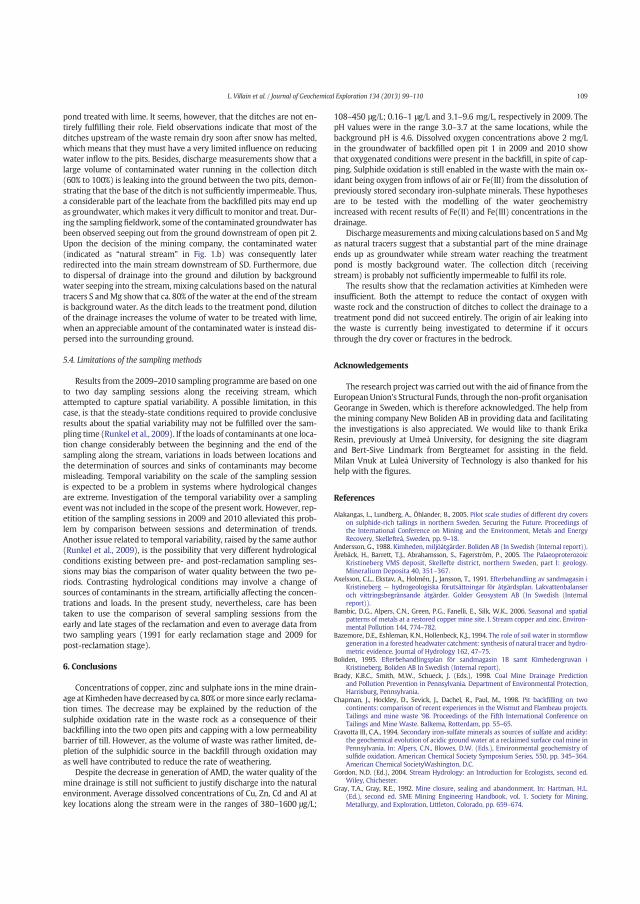
pond treated with lime. It seems, however, that the ditches are not en-tirely fulfilling their role. Field observations indicate that most of theditches upstream of the waste remain dry soon after snow has melted,which means that they must have a very limited influence on reducingwater inflow to the pits. Besides, discharge measurements show that alarge volume of contaminated water running in the collection ditch(60% to 100%) is leaking into the ground between the two pits, demon-strating that the base of the ditch is not sufficiently impermeable. Thus,a considerable part of the leachate from the backfilled pits may end upas groundwater, whichmakes it very difficult tomonitor and treat. Dur-ing the sampling fieldwork, some of the contaminated groundwater hasbeen observed seeping out from the ground downstream of open pit 2.Upon the decision of the mining company, the contaminated water(indicated as “natural stream” in Fig. 1.b) was consequently laterredirected into the main stream downstream of SD. Furthermore, dueto dispersal of drainage into the ground and dilution by backgroundwater seeping into the stream, mixing calculations based on the naturaltracers S andMg show that ca. 80% of the water at the end of the streamis background water. As the ditch leads to the treatment pond, dilutionof the drainage increases the volume of water to be treated with lime,when an appreciable amount of the contaminated water is instead dis-persed into the surrounding ground.
5.4. Limitations of the sampling methods
Results from the 2009–2010 sampling programme are based on oneto two day sampling sessions along the receiving stream, whichattempted to capture spatial variability. A possible limitation, in thiscase, is that the steady-state conditions required to provide conclusiveresults about the spatial variability may not be fulfilled over the sam-pling time (Runkel et al., 2009). If the loads of contaminants at one loca-tion change considerably between the beginning and the end of thesampling along the stream, variations in loads between locations andthe determination of sources and sinks of contaminants may becomemisleading. Temporal variability on the scale of the sampling sessionis expected to be a problem in systems where hydrological changesare extreme. Investigation of the temporal variability over a samplingevent was not included in the scope of the present work. However, rep-etition of the sampling sessions in 2009 and 2010 alleviated this prob-lem by comparison between sessions and determination of trends.Another issue related to temporal variability, raised by the same author(Runkel et al., 2009), is the possibility that very different hydrologicalconditions existing between pre- and post-reclamation sampling ses-sions may bias the comparison of water quality between the two pe-riods. Contrasting hydrological conditions may involve a change ofsources of contaminants in the stream, artificially affecting the concen-trations and loads. In the present study, nevertheless, care has beentaken to use the comparison of several sampling sessions from theearly and late stages of the reclamation and even to average data fromtwo sampling years (1991 for early reclamation stage and 2009 forpost-reclamation stage).
6. Conclusions
Concentrations of copper, zinc and sulphate ions in the mine drain-age at Kimheden have decreased by ca. 80% ormore since early reclama-tion times. The decrease may be explained by the reduction of thesulphide oxidation rate in the waste rock as a consequence of theirbackfilling into the two open pits and capping with a low permeabilitybarrier of till. However, as the volume of waste was rather limited, de-pletion of the sulphidic source in the backfill through oxidation mayas well have contributed to reduce the rate of weathering.
Despite the decrease in generation of AMD, the water quality of themine drainage is still not sufficient to justify discharge into the naturalenvironment. Average dissolved concentrations of Cu, Zn, Cd and Al atkey locations along the stream were in the ranges of 380–1600 μg/L;
108–450 μg/L; 0.16–1 μg/L and 3.1–9.6 mg/L, respectively in 2009. ThepH values were in the range 3.0–3.7 at the same locations, while thebackground pH is 4.6. Dissolved oxygen concentrations above 2 mg/Lin the groundwater of backfilled open pit 1 in 2009 and 2010 showthat oxygenated conditions were present in the backfill, in spite of cap-ping. Sulphide oxidation is still enabled in the waste with the main ox-idant being oxygen from inflows of air or Fe(III) from the dissolution ofpreviously stored secondary iron-sulphate minerals. These hypothesesare to be tested with the modelling of the water geochemistryincreased with recent results of Fe(II) and Fe(III) concentrations in thedrainage.
Dischargemeasurements andmixing calculations based on S andMgas natural tracers suggest that a substantial part of the mine drainageends up as groundwater while stream water reaching the treatmentpond is mostly background water. The collection ditch (receivingstream) is probably not sufficiently impermeable to fulfil its role.
The results show that the reclamation activities at Kimheden wereinsufficient. Both the attempt to reduce the contact of oxygen withwaste rock and the construction of ditches to collect the drainage to atreatment pond did not succeed entirely. The origin of air leaking intothe waste is currently being investigated to determine if it occursthrough the dry cover or fractures in the bedrock.
Acknowledgements
The research project was carried out with the aid of finance from theEuropeanUnion's Structural Funds, through the non-profit organisationGeorange in Sweden, which is therefore acknowledged. The help fromthe mining company New Boliden AB in providing data and facilitatingthe investigations is also appreciated. We would like to thank ErikaResin, previously at Umeå University, for designing the site diagramand Bert-Sive Lindmark from Bergteamet for assisting in the field.Milan Vnuk at Luleå University of Technology is also thanked for hishelp with the figures.
References
Alakangas, L., Lundberg, A., Öhlander, B., 2005. Pilot scale studies of different dry coverson sulphide-rich tailings in northern Sweden. Securing the Future. Proceedings ofthe International Conference on Mining and the Environment, Metals and EnergyRecovery, Skellefteå, Sweden, pp. 9–18.
Andersson, G., 1988. Kimheden, miljöåtgärder. Boliden AB (In Swedish (Internal report)).Årebäck, H., Barrett, T.J., Abrahamsson, S., Fagerström, P., 2005. The Palaeoproterozoic
Kristineberg VMS deposit, Skellefte district, northern Sweden, part I: geology.Mineralium Deposita 40, 351–367.
Axelsson, C.L., Ekstav, A., Holmén, J., Jansson, T., 1991. Efterbehandling av sandmagasin iKristineberg — hydrogeologiska förutsättningar för åtgärdsplan. Lakvattenbalanseroch vittringsbegränsande åtgärder. Golder Geosystem AB (In Swedish (Internalreport)).
Bambic, D.G., Alpers, C.N., Green, P.G., Fanelli, E., Silk, W.K., 2006. Seasonal and spatialpatterns of metals at a restored copper mine site. I. Stream copper and zinc. Environ-mental Pollution 144, 774–782.
Bazemore, D.E., Eshleman, K.N., Hollenbeck, K.J., 1994. The role of soil water in stormflowgeneration in a forested headwater catchment: synthesis of natural tracer and hydro-metric evidence. Journal of Hydrology 162, 47–75.
Boliden, 1995. Efterbehandlingsplan för sandmagasin 1B samt Kimhedengruvan iKristineberg. Boliden AB In Swedish (Internal report).
Brady, K.B.C., Smith, M.W., Schueck, J. (Eds.), 1998. Coal Mine Drainage Predictionand Pollution Prevention in Pennsylvania. Department of Environmental Protection,Harrisburg, Pennsylvania.
Chapman, J., Hockley, D., Sevick, J., Dachel, R., Paul, M., 1998. Pit backfilling on twocontinents: comparison of recent experiences in the Wismut and Flambeau projects.Tailings and mine waste '98. Proceedings of the Fifth International Conference onTailings and Mine Waste. Balkema, Rotterdam, pp. 55–65.
Cravotta III, C.A., 1994. Secondary iron-sulfate minerals as sources of sulfate and acidity:the geochemical evolution of acidic ground water at a reclaimed surface coal mine inPennsylvania. In: Alpers, C.N., Blowes, D.W. (Eds.), Environmental geochemistry ofsulfide oxidation. American Chemical Society Symposium Series, 550, pp. 345–364.American Chemical SocietyWashington, D.C.
Gordon, N.D. (Ed.), 2004. Stream Hydrology: an Introduction for Ecologists, second ed.Wiley, Chichester.
Gray, T.A., Gray, R.E., 1992. Mine closure, sealing and abandonment, In: Hartman, H.L.(Ed.), second ed. SME Mining Engineering Handbook, vol. 1. Society for Mining,Metallurgy, and Exploration, Littleton, Colorado, pp. 659–674.
109L. Villain et al. / Journal of Geochemical Exploration 134 (2013) 99–110

Hammarstrom, J.M., Seal II, R.R., Meier, A.L., Kornfeld, J.M., 2005. Secondary sulfate min-erals associated with acid drainage in the eastern US: recycling of metals and acidityin surficial environments. Chemical Geology 215, 407–431.
Hannington, M.D., Kjarsgaard, I.M., Galley, A.G., Taylor, B., 2003. Mineral–chemical studiesof metamorphosed hydrothermal alteration in the Kristineberg volcanogenic massivesulfide district, Sweden. Mineralium Deposita 38, 423–442.
Höglund, L.O., Herbert, R. (Eds.), 2004. MiMi — performance assessment. Main report.MiMi report 2003:3. MiMi Print, Luleå, Sweden.
Hooper, R.P., Christophersen, N., Peters, N.E., 1990. Modelling streamwater chemistry as amixture of soilwater end-members — an application to the Panola Mountain catch-ment, Georgia, U.S.A. Journal of Hydrology 116, 321–343.
INAP (the International Network for Acid Prevention), 2009. Global Acid Rock DrainageGuide (GARD Guide). http://www.gardguide.com/ (Last accessed 12th July 2013).
Joerin, C., Beven, K.J., Iorgulescu, I., Musy, A., 2002. Uncertainty in hydrograph separationsbased on geochemical mixing models. Journal of Hydrology 255, 90–106.
Land, M., Ingri, J., Andersson, P.S., Öhlander, B., 2000. Ba/Sr, Ca/Sr and 87Sr/86Sr ratios insoil water and groundwater: implications for relative contributions to stream waterdischarge. Applied Geochemistry 15, 311–325.
Malmström, M., Werner, K., Salmon, U., Berglund, S., 2001. MiMi— hydrogeology and geo-chemistry of mill tailings impoundment 1, Kristineberg, Sweden: Compilation and in-terpretation of pre-remediation data. MiMi report 2001:4. MiMi print, Luleå, Sweden.
Nordstrom, D.K., 2011. Hydrogeochemical processes governing the origin, transport andfate of major and trace elements from mine wastes and mineralized rock to surfacewaters. Applied Geochemistry 26, 1777–1791.
O'Kane, M., 2003. Evaluation of the long-term performance of dry cover systems — finalreport. OKC Report 684-02. International Network for Acid Prevention.
Phelps, L.B., 1990. Unit operations of reclamation, In: Kennedy, B.A. (Ed.), SurfaceMining, second ed. Society for Mining, Metallurgy, and Exploration, Littleton,Colorado, pp. 770–776.
Reed, S.M., Singh, R.N., 1986. Groundwater recovery problems associated with opencastmine backfills in the United Kingdom. International Journal of Mine Water 5, 47–74.
Resin, E., 2010. Vattenbalanser för tre nedlagda gruvor. MSc thesis Umeå University,Sweden (In Swedish).
Ritchie, A.I.M., Bennett, J.W., 2003. The Rum Jungle mine — a case study. In: Jambor, J.L.,Blowes, D.W., Ritchie, A.I.M. (Eds.), Environmental aspects of mine wastes. ShortourseSeries, 31. Mineralogical Association of Canada, Nepean, Ontario, pp. 385–405.
Rosén, L., Wilske, Å., 1994. Beräkningar av metallflöden och förslag till åtgärder vidKimhedengruvan, Kristineberg. Scandiaconsult Väst AB (In Swedish (Internal report)).
Runkel, R.L., Bencala, K.E., Kimball, B.A., Walton-Day, K., Verplanck, P.L., 2009. A compar-ison of pre- and post-remediation water quality, Mineral Creek, Colorado. Hydrolog-ical Processes 23, 3319–3333.
SEPA (Swedish Environmental Protection Agency), 2000. Environmental quality criteria —lakes and watercourse. Report 5050. Lenanders, Kalmar.
Skousen, J.G., Sexstone, A., Ziemkiewicz, P.F., 2000. Acid mine drainage control and treat-ment. In: Barnhisel, R.I., Darmody, R.G., Daniels, W.L. (Eds.), Reclamation of DrasticallyDisturbed Lands. Agronomy, 41. American Society of Agronomy, Madison, Wisconsin,pp. 131–168.
Taylor, G., Spain, A., Nefiodovas, A., Timms, G., Kuznetsov, V., Bennett, J., 2003. Determina-tion of the reasons for deterioration of the Rum Jungle waste rock cover. AustralianCentre for Mining Environmental Research. Brisbane, Australia.
Tremblay, G.A., Hogan, C.M. (Eds.), 2001. Volume 4 — Prevention and Control. MEND Re-port 5.4.2d. Mine Environment Neutral Drainage (MEND) Program.
USGS, 2013. DOTABLES (Version 3.5) [Software]. Available from URL: http://water.usgs.gov/software/DOTABLES/ (Last accessed 12th July 2013).
Waygood, C.G., Ferreira, S., 2009. A Review of the Current Strategy for Capping MiningSpoils. Water Institute of Southern Africa and International Mine Water Association(IMWA), Pretoria, South Africa, pp. 738–745.
Wilson, G.W., Williams, D.J., Rykaart, E.M., 2003. The integrity of cover systems — anupdate. Proceedings of the Sixth International Conference on Acid Rock Drainage(ICARD), Cairns, Australia, pp. 445–451.
Younger, P.L., Banwart, S.A., Hedin, R.S., 2002. MineWater: Hydrology, Pollution, Remedi-ation. Kluwer Academic, Dordrecht, the Netherlands.
110 L. Villain et al. / Journal of Geochemical Exploration 134 (2013) 99–110

PAPER II
Evaluation of the effectiveness of backfilling and sealing at an open-pit mine using ground penetrating radar and
geoelectrical surveys, Kimheden, northern Sweden
Lucile Villain, Nils Sundström, Nils Perttu, Lena Alakangas and Björn Öhlander
Published in:Environmental Earth Sciences, (Oct.), 1-15. (2014)

ORIGINAL ARTICLE
Evaluation of the effectiveness of backfilling and sealingat an open-pit mine using ground penetrating radarand geoelectrical surveys, Kimheden, northern Sweden
Lucile Villain • Nils Sundstrom • Nils Perttu •
Lena Alakangas • Bjorn Ohlander
Received: 17 March 2014 / Accepted: 24 September 2014
� The Author(s) 2014. This article is published with open access at Springerlink.com
Abstract At Kimheden, a small copper mine in northern
Sweden, reclamation of the two open pits was investigated
using ground penetrating radar and geoelectrical multiple-
gradient array measurements. The pits had been backfilled
with waste rock, with a dry cover being applied on top in
1996 in order to reduce the influx of oxygen to the sul-
phidic mine waste and the subsequent production of acid
mine drainage. The dry cover consists of a sealing layer of
clayey till and a protective layer of unsorted till. As geo-
chemical sampling in the drainage from the pits had pre-
viously revealed the continued release of contaminating
oxidation products, the purpose of the geophysical survey
undertaken in 2010 was to identify deficiencies in the cover
or other pathways for oxygen to reach the waste rock. The
radar images did not reveal any damage in the sealing layer
but risks of deterioration of the cover in the long term were
identified with both the radar and geoelectrical data. The
radar localised regions of thinner protective layer where the
sealing layer could be exposed to frost action. The geo-
electrical measurements indicated the existence of seepage
through the dry cover that presented a risk of erosion of the
sealing layer. 2-D inversion of geoelectrical data also
imaged some pathways of groundwater around the main
pit. The results from the geophysical investigations were
used together with other site data in order to show that both
deficiencies in the cover and superficial fractures in the pit
walls may explain an ongoing influx of oxygen to the mine
waste.
Keywords Ground penetrating radar (GPR) � Directcurrent (DC) resistivity � Mine waste � Reclamation
assessment � Open pit � Dry cover
Introduction
Solutions to control contaminated drainage from mines
have been the subject of intense discussions over the last
few decades. Prevention and mitigation methods at the
source have been promoted as an economic and practical
alternative to treatment of the polluted water. In this
approach, efforts are concentrated on limiting the reactions
that generate contaminants and the subsequent leaching
and transport of the reaction products (INAP 2009), rather
than treating the contaminants in the drainage.
At coal and hard rock mines, toxic metal-rich acid mine
drainage (AMD) may be produced from the oxidation of
sulphide rocks as they are exposed to water and oxygen.
Prevention and mitigation, in this case, generally includes
the reduction of water and/or oxygen contact with the
sulphidic mining residues. Different measures may be
applied, including diversion of surface water from reactive
areas or other types of water management, conditioning of
the tailings through e.g. compaction or desulphurisation,
disposal of the waste under water or various types of soil
covers to limit oxygen ingress (INAP 2009).
Monitoring the effects of the mitigation actions on the
quality of the mine drainage gives essential data when
evaluating the need for further reclamation and improve-
ments in remediation techniques. Monitoring programmes
at reclaimed sites often consist of regular hydrogeochem-
ical studies including sampling of surface water, ground-
water, sediments and mine waste as well as measurement
of water flows and groundwater levels. Some post-
L. Villain (&) � N. Sundstrom � N. Perttu � L. Alakangas �B. Ohlander
Division of Geosciences and Environmental Engineering,
Lulea University of Technology, 971 87 Lulea, Sweden
e-mail: [email protected]
123
Environ Earth Sci
DOI 10.1007/s12665-014-3737-0

reclamation studies can be found in the peer-reviewed lit-
erature, such as Holmstrom et al. (2001), Brake et al.
(2001), Bambic et al. (2006) and Runkel et al. (2009). A
carefully planned sampling programme may provide
detailed data about the generation, transport and mitigation
processes affecting the contaminants. Common hydrogeo-
chemical studies, nevertheless, usually generate local
results, making it difficult to appreciate water properties
and quality across the entire site. In this regard, indirect
geophysical methods that have the potential to image the
contaminated drainage can be used to increase the under-
standing of the distribution of contaminants at the site and
to support local sampling results. Moreover, they can
provide other types of information about the subsurface,
such as the presence of fractures in the bedrock, the depth
of the soil–bedrock interface or the location of under-
ground workings.
Provided that good background site data are available,
geophysical techniques have the advantage of being non-
intrusive and cost-efficient. In water-related studies, they
may be used for hydrogeological mapping, estimation of
hydrological parameters and monitoring of hydrological
processes (Rubin and Hubbard 2005). Due to the ability of
electrical and electromagnetic techniques to image
groundwater and sometimes determine its quality, they
have proven useful in environmental studies. Electrical
resistivity imaging, ground penetrating radar and induced
polarisation methods have been widely employed in studies
of leachate transport from landfills (Nobes et al. 2000;
Abu-Zeid et al. 2004; Porsani et al. 2004; Dahlin et al.
2010). They have also been used in mining environmental
studies, in order to image AMD plumes (Buselli and Lu
2001; Rucker et al. 2009), tailings ponds (Placiencia-
Gomez et al. 2010; Martın-Crespo et al. 2010) or waste
rock piles (Van Dam et al. 2005; Poisson et al. 2009;
Anterrieu et al. 2010; Mele et al. 2013). This study uses
ground penetrating radar (GPR) and geoelectrical multiple-
gradient array surveying to examine the effectiveness of
the backfilling and sealing of mine waste at a small open-
pit copper mine in northern Sweden. The investigation is in
line with the previous studies cited, although it differs in
the objects surveyed, as the geophysical combined study of
a backfilled open pit and its dry cover has not been covered
by any of these studies.
Mitigation of AMD generation at the Kimheden open-
pit mine involved the progressive backfilling of waste rock
into two small open pits and the deposition, in 1996, of a
composite till dry cover on top to reduce the influx of
oxygen into the waste. A previous geochemical study at the
site (Villain et al. 2013) demonstrated that, in spite of the
large decrease of Cu and Zn concentrations in the mine
drainage since the beginning of the reclamation, water
quality at the mine is still unsatisfactory, which may be due
to inadequacies of the mitigation methods used. It is sus-
pected that the control of oxygen transport to the backfilled
waste has failed to decrease the rate of sulphide oxidation
in the rocks to an acceptable level. In this case, it is
important to know what has prevented an effective reduc-
tion of oxygen intrusion to the waste.
The purpose of the study was to identify potential
pathways for oxygen to reach the sulphidic waste despite
backfilling and sealing, as well as other possible deficien-
cies of the mitigation measures. In this regard, two objec-
tives were set: (1) characterise the dry cover and its
integrity and (2) image the location of the mine waste,
groundwater, contaminated water and potential fractures in
the pit walls at backfilled open pit 1, the pit that generates
the greatest quantity of contaminants.
Study site
Site location, geological and hydrological context
Kimheden is a small copper mine situated in the Kris-
tineberg mining area (Fig. 1a) in the county of Vasterbot-
ten, northern Sweden. The local climate is cold, with a
yearly average air temperature of 0.7 �C and 5 months with
an average temperature below 0 �C (Malmstrom et al.
2001). Annual precipitation at the site is *400 to 800 mm
(Axelsson et al. 1991), accumulating in the form of snow
from October to May.
The bedrock in the Kristineberg area is composed of
deformed and metamorphosed Palaeoproterozoic 1.9 Ga
volcanic and sedimentary rocks hosting several volcanic
massive sulpide (VMS) deposits of varying size, the most
important being the Kristineberg deposit. These deposits
are thought to have formed in a continental or mature
extensional arc setting (Allen et al. 2002). Intense syn-
volcanic hydrothermal alteration has affected the volcanic
rocks prior to metamorphism. The Kimheden deposit, of
interest in this study, formed during the early stages of
felsic volcanism (Hannington et al. 2003). It is one of the
smaller pyrite-rich massive sulphide deposits in the area,
which are intercalated within a succession of felsic and
minor mafic meta-volcaniclastic rocks. The mineralisation
is principally composed of pyrite, chalcopyrite and sphal-
erite while the ore-hosting rocks are quartz–muscovite–
chlorite ± biotite schists. Both the deposits and the host
rocks have been largely deformed.
The mine lies on the side of a hill, with an altitude range
of 470 to 520 m. The mineralisation is striking in the
northeastern direction, which is also the direction of the
two open pits of the site (Fig. 1b). The bedrock is covered
by 1 to 2 m thick glacial till, locally overlain by a thin layer
of peat (Hellman and Lokrantz 2008).
Environ Earth Sci
123
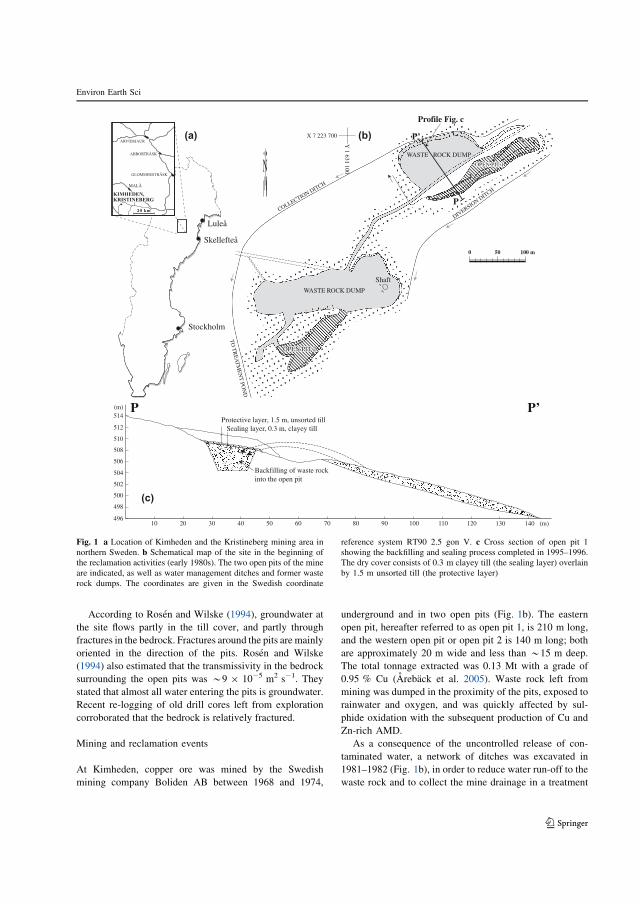
According to Rosen and Wilske (1994), groundwater at
the site flows partly in the till cover, and partly through
fractures in the bedrock. Fractures around the pits are mainly
oriented in the direction of the pits. Rosen and Wilske
(1994) also estimated that the transmissivity in the bedrock
surrounding the open pits was *9 9 10-5 m2 s-1. They
stated that almost all water entering the pits is groundwater.
Recent re-logging of old drill cores left from exploration
corroborated that the bedrock is relatively fractured.
Mining and reclamation events
At Kimheden, copper ore was mined by the Swedish
mining company Boliden AB between 1968 and 1974,
underground and in two open pits (Fig. 1b). The eastern
open pit, hereafter referred to as open pit 1, is 210 m long,
and the western open pit or open pit 2 is 140 m long; both
are approximately 20 m wide and less than *15 m deep.
The total tonnage extracted was 0.13 Mt with a grade of
0.95 % Cu (Areback et al. 2005). Waste rock left from
mining was dumped in the proximity of the pits, exposed to
rainwater and oxygen, and was quickly affected by sul-
phide oxidation with the subsequent production of Cu and
Zn-rich AMD.
As a consequence of the uncontrolled release of con-
taminated water, a network of ditches was excavated in
1981–1982 (Fig. 1b), in order to reduce water run-off to the
waste rock and to collect the mine drainage in a treatment
DIVERSIO
N DITCH
COLLECTION DITCH
TO
TR
EA
TM
EN
T PO
ND
Shaft
OPEN PIT 1OPEN PIT 1OPEN PIT 1
OPEN PIT 2OPEN PIT 2OPEN PIT 2
WASTE ROCK DUMP
WASTE ROCK DUMP
N
Stockholm
Luleå
Profile Fig. c
X 7 223 700
Y 1 631 100
Skellefteå
(a) (b)
(c)
P
P
P’
P’
20 km
ARVIDSJAUR
ABBORTRÄSK
GLOMMERSTRÄSK
MALÅ
KRISTINEBERGKIMHEDEN,
0 50 100 m
Protective layer, 1.5 m, unsorted tillSealing layer, 0.3 m, clayey till
Backfilling of waste rockinto the open pit
10
512
514(m)
510
508
506
504
502
500
498
49620 30 40 50 60 70 80 90 100 110 120 130 140 (m)
Fig. 1 a Location of Kimheden and the Kristineberg mining area in
northern Sweden. b Schematical map of the site in the beginning of
the reclamation activities (early 1980s). The two open pits of the mine
are indicated, as well as water management ditches and former waste
rock dumps. The coordinates are given in the Swedish coordinate
reference system RT90 2.5 gon V. c Cross section of open pit 1
showing the backfilling and sealing process completed in 1995–1996.
The dry cover consists of 0.3 m clayey till (the sealing layer) overlain
by 1.5 m unsorted till (the protective layer)
Environ Earth Sci
123
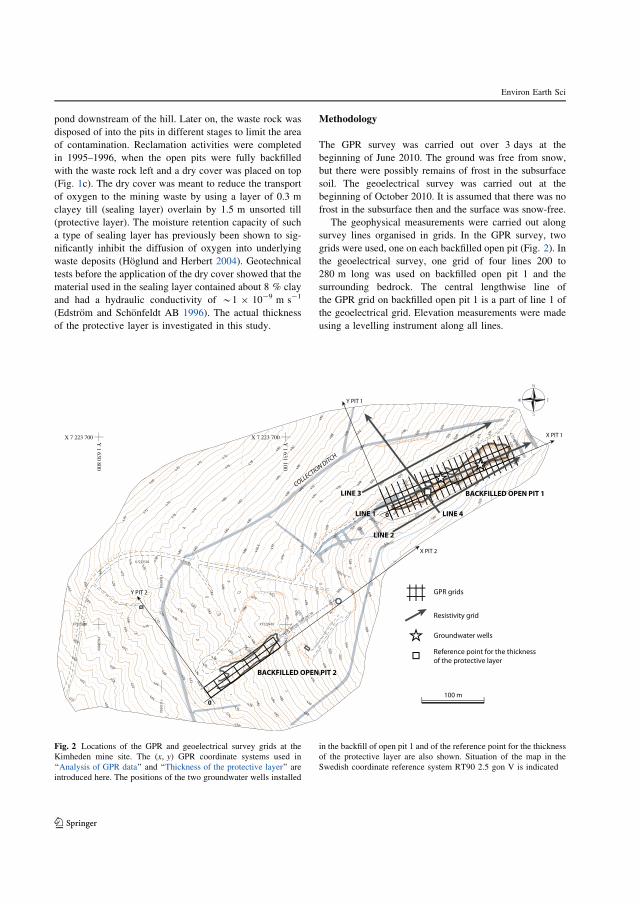
pond downstream of the hill. Later on, the waste rock was
disposed of into the pits in different stages to limit the area
of contamination. Reclamation activities were completed
in 1995–1996, when the open pits were fully backfilled
with the waste rock left and a dry cover was placed on top
(Fig. 1c). The dry cover was meant to reduce the transport
of oxygen to the mining waste by using a layer of 0.3 m
clayey till (sealing layer) overlain by 1.5 m unsorted till
(protective layer). The moisture retention capacity of such
a type of sealing layer has previously been shown to sig-
nificantly inhibit the diffusion of oxygen into underlying
waste deposits (Hoglund and Herbert 2004). Geotechnical
tests before the application of the dry cover showed that the
material used in the sealing layer contained about 8 % clay
and had a hydraulic conductivity of *1 9 10-9 m s-1
(Edstrom and Schonfeldt AB 1996). The actual thickness
of the protective layer is investigated in this study.
Methodology
The GPR survey was carried out over 3 days at the
beginning of June 2010. The ground was free from snow,
but there were possibly remains of frost in the subsurface
soil. The geoelectrical survey was carried out at the
beginning of October 2010. It is assumed that there was no
frost in the subsurface then and the surface was snow-free.
The geophysical measurements were carried out along
survey lines organised in grids. In the GPR survey, two
grids were used, one on each backfilled open pit (Fig. 2). In
the geoelectrical survey, one grid of four lines 200 to
280 m long was used on backfilled open pit 1 and the
surrounding bedrock. The central lengthwise line of
the GPR grid on backfilled open pit 1 is a part of line 1 of
the geoelectrical grid. Elevation measurements were made
using a levelling instrument along all lines.
X PIT 2
GPR grids
Resistivity grid
Groundwater wells
100 m
Reference point for the thicknessof the protective layer
BACKFILLED OPEN PIT 1LINE 3
LINE 1
LINE 2
0
0
LINE 4
BACKFILLED OPEN PIT 2
X PIT 1
Y PIT 2Y PIT 2Y PIT 2
Y PIT 1
COLLECTION DITCH
X 7 223 700X 7 223 700
Y 1 631 100
Y 1 631 1 00
X 7 223 700
Y 1 631 100
X 7 223 700X 7 223 700
Y 1 630 800
Y 1 6 30 8 00
X 7 223 700
Y 1 630 800
Fig. 2 Locations of the GPR and geoelectrical survey grids at the
Kimheden mine site. The (x, y) GPR coordinate systems used in
‘‘Analysis of GPR data’’ and ‘‘Thickness of the protective layer’’ are
introduced here. The positions of the two groundwater wells installed
in the backfill of open pit 1 and of the reference point for the thickness
of the protective layer are also shown. Situation of the map in the
Swedish coordinate reference system RT90 2.5 gon V is indicated
Environ Earth Sci
123
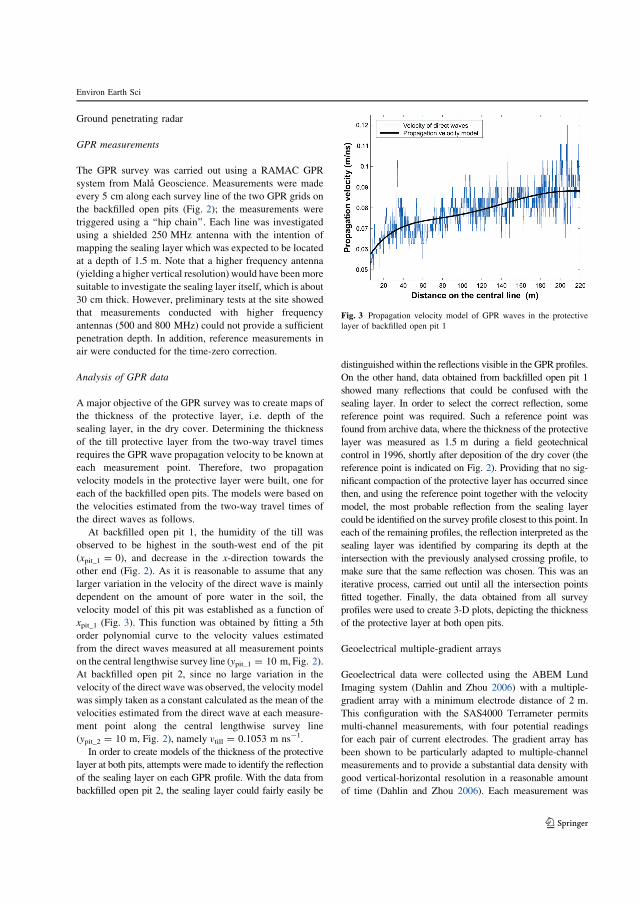
Ground penetrating radar
GPR measurements
The GPR survey was carried out using a RAMAC GPR
system from Mala Geoscience. Measurements were made
every 5 cm along each survey line of the two GPR grids on
the backfilled open pits (Fig. 2); the measurements were
triggered using a ‘‘hip chain’’. Each line was investigated
using a shielded 250 MHz antenna with the intention of
mapping the sealing layer which was expected to be located
at a depth of 1.5 m. Note that a higher frequency antenna
(yielding a higher vertical resolution) would have been more
suitable to investigate the sealing layer itself, which is about
30 cm thick. However, preliminary tests at the site showed
that measurements conducted with higher frequency
antennas (500 and 800 MHz) could not provide a sufficient
penetration depth. In addition, reference measurements in
air were conducted for the time-zero correction.
Analysis of GPR data
A major objective of the GPR survey was to create maps of
the thickness of the protective layer, i.e. depth of the
sealing layer, in the dry cover. Determining the thickness
of the till protective layer from the two-way travel times
requires the GPR wave propagation velocity to be known at
each measurement point. Therefore, two propagation
velocity models in the protective layer were built, one for
each of the backfilled open pits. The models were based on
the velocities estimated from the two-way travel times of
the direct waves as follows.
At backfilled open pit 1, the humidity of the till was
observed to be highest in the south-west end of the pit
(xpit_1 = 0), and decrease in the x-direction towards the
other end (Fig. 2). As it is reasonable to assume that any
larger variation in the velocity of the direct wave is mainly
dependent on the amount of pore water in the soil, the
velocity model of this pit was established as a function of
xpit_1 (Fig. 3). This function was obtained by fitting a 5th
order polynomial curve to the velocity values estimated
from the direct waves measured at all measurement points
on the central lengthwise survey line (ypit_1 = 10 m, Fig. 2).
At backfilled open pit 2, since no large variation in the
velocity of the direct wave was observed, the velocity model
was simply taken as a constant calculated as the mean of the
velocities estimated from the direct wave at each measure-
ment point along the central lengthwise survey line
(ypit_2 = 10 m, Fig. 2), namely vtill = 0.1053 m ns-1.
In order to create models of the thickness of the protective
layer at both pits, attempts were made to identify the reflection
of the sealing layer on each GPR profile. With the data from
backfilled open pit 2, the sealing layer could fairly easily be
distinguished within the reflections visible in the GPR profiles.
On the other hand, data obtained from backfilled open pit 1
showed many reflections that could be confused with the
sealing layer. In order to select the correct reflection, some
reference point was required. Such a reference point was
found from archive data, where the thickness of the protective
layer was measured as 1.5 m during a field geotechnical
control in 1996, shortly after deposition of the dry cover (the
reference point is indicated on Fig. 2). Providing that no sig-
nificant compaction of the protective layer has occurred since
then, and using the reference point together with the velocity
model, the most probable reflection from the sealing layer
could be identified on the survey profile closest to this point. In
each of the remaining profiles, the reflection interpreted as the
sealing layer was identified by comparing its depth at the
intersection with the previously analysed crossing profile, to
make sure that the same reflection was chosen. This was an
iterative process, carried out until all the intersection points
fitted together. Finally, the data obtained from all survey
profiles were used to create 3-D plots, depicting the thickness
of the protective layer at both open pits.
Geoelectrical multiple-gradient arrays
Geoelectrical data were collected using the ABEM Lund
Imaging system (Dahlin and Zhou 2006) with a multiple-
gradient array with a minimum electrode distance of 2 m.
This configuration with the SAS4000 Terrameter permits
multi-channel measurements, with four potential readings
for each pair of current electrodes. The gradient array has
been shown to be particularly adapted to multiple-channel
measurements and to provide a substantial data density with
good vertical-horizontal resolution in a reasonable amount
of time (Dahlin and Zhou 2006). Each measurement was
Fig. 3 Propagation velocity model of GPR waves in the protective
layer of backfilled open pit 1
Environ Earth Sci
123
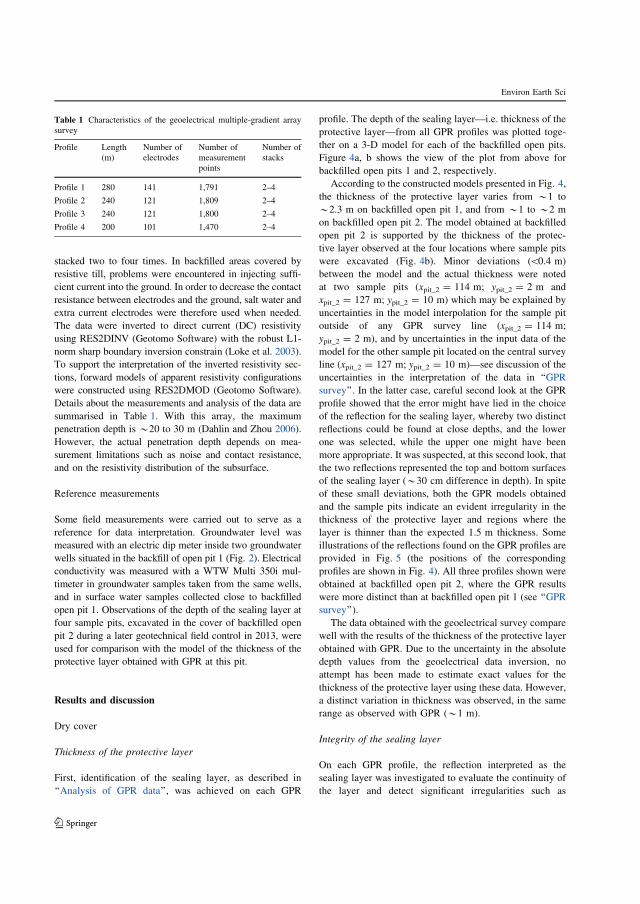
stacked two to four times. In backfilled areas covered by
resistive till, problems were encountered in injecting suffi-
cient current into the ground. In order to decrease the contact
resistance between electrodes and the ground, salt water and
extra current electrodes were therefore used when needed.
The data were inverted to direct current (DC) resistivity
using RES2DINV (Geotomo Software) with the robust L1-
norm sharp boundary inversion constrain (Loke et al. 2003).
To support the interpretation of the inverted resistivity sec-
tions, forward models of apparent resistivity configurations
were constructed using RES2DMOD (Geotomo Software).
Details about the measurements and analysis of the data are
summarised in Table 1. With this array, the maximum
penetration depth is *20 to 30 m (Dahlin and Zhou 2006).
However, the actual penetration depth depends on mea-
surement limitations such as noise and contact resistance,
and on the resistivity distribution of the subsurface.
Reference measurements
Some field measurements were carried out to serve as a
reference for data interpretation. Groundwater level was
measured with an electric dip meter inside two groundwater
wells situated in the backfill of open pit 1 (Fig. 2). Electrical
conductivity was measured with a WTW Multi 350i mul-
timeter in groundwater samples taken from the same wells,
and in surface water samples collected close to backfilled
open pit 1. Observations of the depth of the sealing layer at
four sample pits, excavated in the cover of backfilled open
pit 2 during a later geotechnical field control in 2013, were
used for comparison with the model of the thickness of the
protective layer obtained with GPR at this pit.
Results and discussion
Dry cover
Thickness of the protective layer
First, identification of the sealing layer, as described in
‘‘Analysis of GPR data’’, was achieved on each GPR
profile. The depth of the sealing layer—i.e. thickness of the
protective layer—from all GPR profiles was plotted toge-
ther on a 3-D model for each of the backfilled open pits.
Figure 4a, b shows the view of the plot from above for
backfilled open pits 1 and 2, respectively.
According to the constructed models presented in Fig. 4,
the thickness of the protective layer varies from *1 to
*2.3 m on backfilled open pit 1, and from *1 to *2 m
on backfilled open pit 2. The model obtained at backfilled
open pit 2 is supported by the thickness of the protec-
tive layer observed at the four locations where sample pits
were excavated (Fig. 4b). Minor deviations (\0.4 m)
between the model and the actual thickness were noted
at two sample pits (xpit_2 = 114 m; ypit_2 = 2 m and
xpit_2 = 127 m; ypit_2 = 10 m) which may be explained by
uncertainties in the model interpolation for the sample pit
outside of any GPR survey line (xpit_2 = 114 m;
ypit_2 = 2 m), and by uncertainties in the input data of the
model for the other sample pit located on the central survey
line (xpit_2 = 127 m; ypit_2 = 10 m)—see discussion of the
uncertainties in the interpretation of the data in ‘‘GPR
survey’’. In the latter case, careful second look at the GPR
profile showed that the error might have lied in the choice
of the reflection for the sealing layer, whereby two distinct
reflections could be found at close depths, and the lower
one was selected, while the upper one might have been
more appropriate. It was suspected, at this second look, that
the two reflections represented the top and bottom surfaces
of the sealing layer (*30 cm difference in depth). In spite
of these small deviations, both the GPR models obtained
and the sample pits indicate an evident irregularity in the
thickness of the protective layer and regions where the
layer is thinner than the expected 1.5 m thickness. Some
illustrations of the reflections found on the GPR profiles are
provided in Fig. 5 (the positions of the corresponding
profiles are shown in Fig. 4). All three profiles shown were
obtained at backfilled open pit 2, where the GPR results
were more distinct than at backfilled open pit 1 (see ‘‘GPR
survey’’).
The data obtained with the geoelectrical survey compare
well with the results of the thickness of the protective layer
obtained with GPR. Due to the uncertainty in the absolute
depth values from the geoelectrical data inversion, no
attempt has been made to estimate exact values for the
thickness of the protective layer using these data. However,
a distinct variation in thickness was observed, in the same
range as observed with GPR (*1 m).
Integrity of the sealing layer
On each GPR profile, the reflection interpreted as the
sealing layer was investigated to evaluate the continuity of
the layer and detect significant irregularities such as
Table 1 Characteristics of the geoelectrical multiple-gradient array
survey
Profile Length
(m)
Number of
electrodes
Number of
measurement
points
Number of
stacks
Profile 1 280 141 1,791 2–4
Profile 2 240 121 1,809 2–4
Profile 3 240 121 1,800 2–4
Profile 4 200 101 1,470 2–4
Environ Earth Sci
123

fractures and deformations. The attention was turned to
backfilled open pit 2 where the sealing layer reflections
were more clearly recognisable. No obvious sign of inter-
ruption or displacement of the sealing layer could be dis-
tinguished. Small-scale fractures can be recognised as
hyperbolas in radargrams. Nevertheless, this signature may
also characterise bigger boulders in the uppermost till layer
or in the underlying waste rock, and it should therefore not
be systematically interpreted as a fracture. The same cau-
tion in not over-interpreting hyperbolic patterns was
expressed by Bergstrom (1997). Although in a few profiles
some hyperbolas were seen close to the sealing layer
reflection, no additional pattern such as vertical
displacement of the reflection was observed, so these pro-
files were not interpreted as ones with fractures.
Due to the limited thickness of the sealing layer
(*0.3 m) and insufficient petrophysical contrast with the
surrounding material, the layer could not be visualised in the
resistivity models. However, variations in resistivity in the
uppermost protective layer may reveal zones of erosion in
the sealing layer. Profile 4 crossing open pit 1 exhibits a zone
of reduced resistivity affecting the protective layer above
the lower edge of the pit (Fig. 6d). The position and shape of
the resistivity anomaly suggest that, at this location, drain-
age water may be seeping out from the mine waste up to the
surface (or subsurface) through the sealing layer.
Thickness of the protective layer (m)Measurement pointsPit boundaryReference point
Thickness of the protective layer (m)Measurement pointsPit boundaryThickness of the protective layerobserved in sample pitsSelected profilesshown in Fig.5
1.70 m
1.40 m
1.60 m
1.25 m
Dis
tanc
e on
the
y-ax
is (m
)D
ista
nce
on th
e y-
axis
(m)
Distance on the x-axis (m)
Distance on the x-axis (m)
(a) Backfilled open pit 1
(b) Backfilled open pit 2
Thic
knes
s of
the
prot
ectiv
e la
yer (
m)
Thic
knes
s of
the
prot
ectiv
e la
yer (
m)
Fig. 5c
Fig. 5b
Fig. 5a
Fig. 4 Map of the thickness of
the protective layer in the dry
cover on a backfilled open pit 1
and b backfilled open pit 2. The
(x, y) coordinate systems
employed are the ones
introduced for the GPR grids in
Fig. 2. The GPR survey lines
did not cover the whole surface
of backfilled open pit 2, which
explains why there are blank
areas in the pit. In b, the profilesshown in Fig. 5 are positioned
and the actual thickness of the
protective layer observed at the
four sample pits of backfilled
open pit 2 is provided
Environ Earth Sci
123
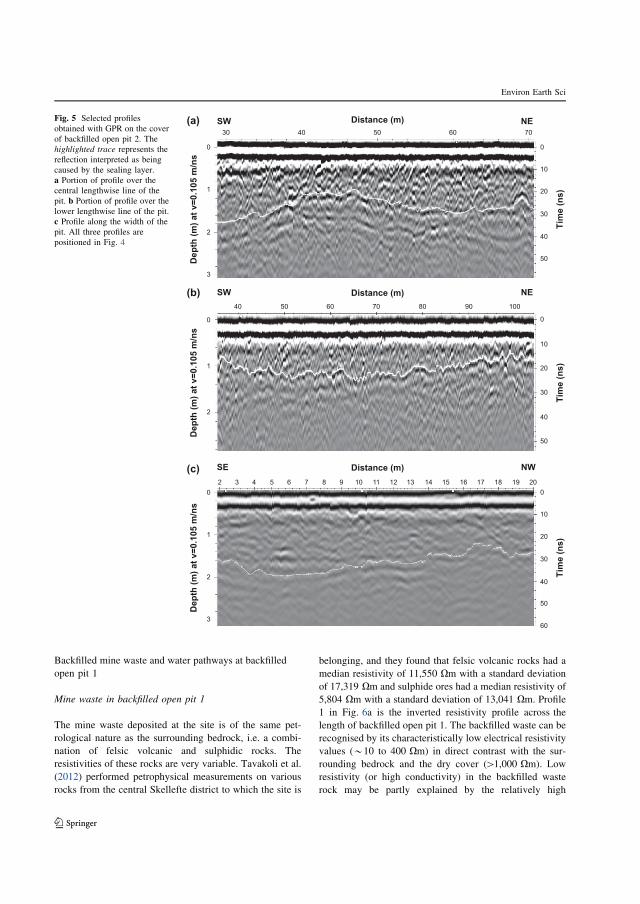
Backfilled mine waste and water pathways at backfilled
open pit 1
Mine waste in backfilled open pit 1
The mine waste deposited at the site is of the same pet-
rological nature as the surrounding bedrock, i.e. a combi-
nation of felsic volcanic and sulphidic rocks. The
resistivities of these rocks are very variable. Tavakoli et al.
(2012) performed petrophysical measurements on various
rocks from the central Skellefte district to which the site is
belonging, and they found that felsic volcanic rocks had a
median resistivity of 11,550 Xm with a standard deviation
of 17,319 Xm and sulphide ores had a median resistivity of
5,804 Xm with a standard deviation of 13,041 Xm. Profile
1 in Fig. 6a is the inverted resistivity profile across the
length of backfilled open pit 1. The backfilled waste can be
recognised by its characteristically low electrical resistivity
values (*10 to 400 Xm) in direct contrast with the sur-
rounding bedrock and the dry cover ([1,000 Xm). Low
resistivity (or high conductivity) in the backfilled waste
rock may be partly explained by the relatively high
(a) NESW
NESW
NWSE
Distance (m)
Tim
e (n
s)
Dep
th (m
) at v
=0.1
05 m
/ns
30
0
0
1
2
0
10
20
30
40
50
1
2
3
07060504
Distance (m)
Tim
e (n
s)
Dep
th (m
) at v
=0.1
05 m
/ns
40
10
0
20
30
40
50
00108070605 90
0
1
2
3
Distance (m)
Tim
e (n
s)
Dep
th (m
) at v
=0.1
05 m
/ns
2 3 4
10
0
20
30
40
50
60
5 6 7 8 9 10 11 12 13 14 15 18 19 2016 17
(b)
(c)
Fig. 5 Selected profiles
obtained with GPR on the cover
of backfilled open pit 2. The
highlighted trace represents the
reflection interpreted as being
caused by the sealing layer.
a Portion of profile over the
central lengthwise line of the
pit. b Portion of profile over the
lower lengthwise line of the pit.
c Profile along the width of the
pit. All three profiles are
positioned in Fig. 4
Environ Earth Sci
123
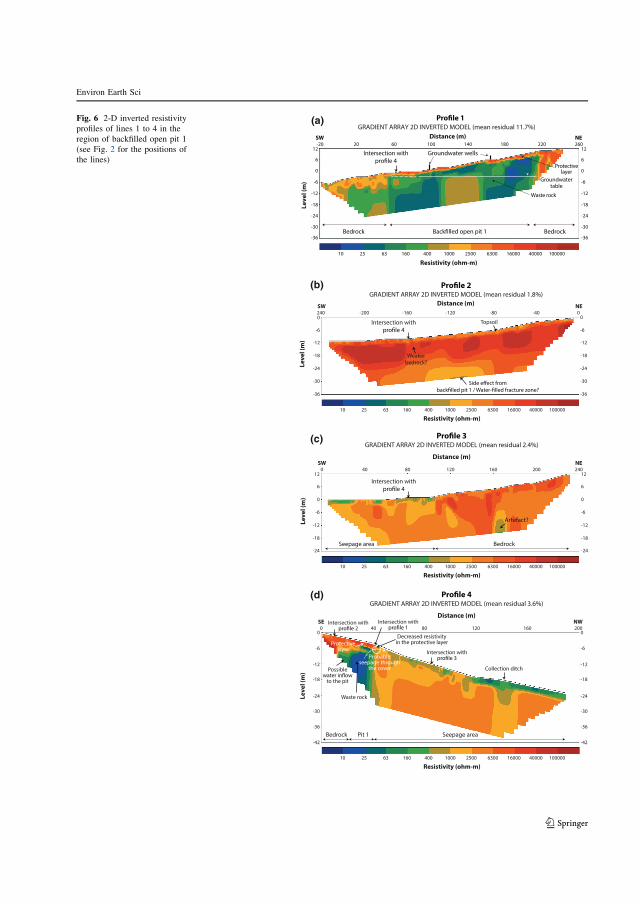
Intersection with Intersection with
Decreased resistivityin the protective layer
Probableseepage through
the cover
Protectivelayer Intersection with
Collection ditchPossible
to the pit
Waste rock
Seepage areaBedrock Pit 1
0 40 80 120
GRADIENT ARRAY 2D INVERTED MODEL (mean residual 3.6%)
Distance (m)SE NW
Leve
l (m
)
160
-12
-18
-30
-24
-36
-42
-6
0
-12
-18
-30
-24
-36
-42
-6
0200
Intersection with
Weakerbedrock?
Topsoil
240 -200 -160 -120 -80 -40 0
10 25 63 160 400 1000 2500 6300 16000 40000 100000
GRADIENT ARRAY 2D INVERTED MODEL (mean residual 1.8%)Distance (m)SW NE
Resistivity (ohm-m)
10 25 63 160 400 1000 2500 6300 16000 40000 100000
Resistivity (ohm-m)
10 25 63 160 400 1000 2500 6300 16000 40000 100000
Resistivity (ohm-m)
Leve
l (m
) -12
-18
-24
-30
-36
-6
-12
-18
-24
-30
-36
-6
0 0
Intersection with
Artefact?
kcordeBaeraegapeeS
40 021080
(d)
(b)
(c)GRADIENT ARRAY 2D INVERTED MODEL (mean residual 2.4%)
Distance (m)SW NE
Leve
l (m
)
160 20012
-12
-18
-24
6
-6
0
12
-12
-18
-24
6
-6
0
240
-20 20 60 100
Intersection with Groundwater wells
Protectivelayer
Waste rock
Groundwatertable
kcordeBkcordeB
140
GRADIENT ARRAY 2D INVERTED MODEL (mean residual 11.7%)Distance (m)SW NE
Leve
l (m
)
180 22012
-12
-18
-24
-30
-36
6
-6
0
12
-12
-18
-24
-30
-36
6
-6
0
260
10 25 63 160 400 1000 2500 6300 16000 40000 100000
Resistivity (ohm-m)
(a)Fig. 6 2-D inverted resistivity
profiles of lines 1 to 4 in the
region of backfilled open pit 1
(see Fig. 2 for the positions of
the lines)
Environ Earth Sci
123
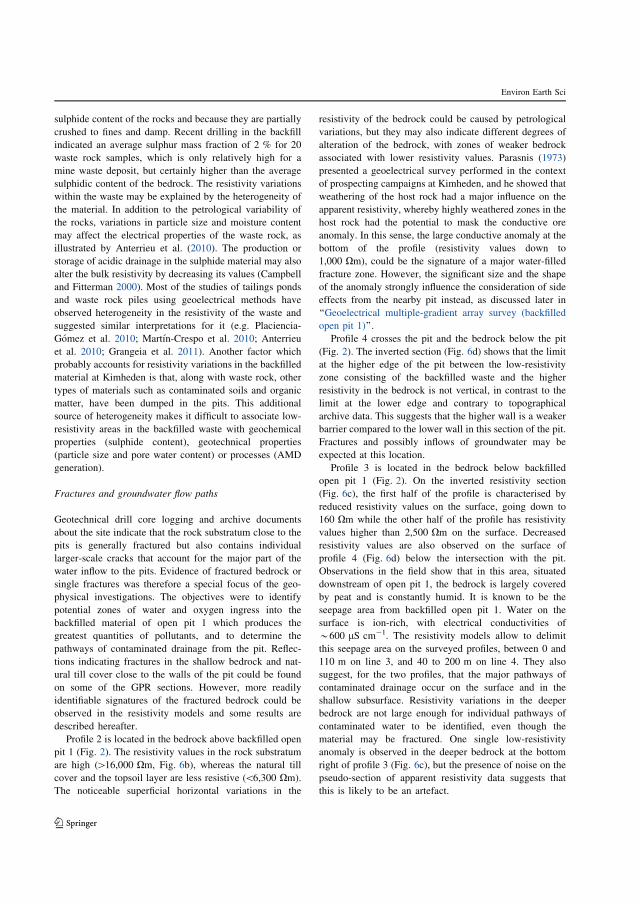
sulphide content of the rocks and because they are partially
crushed to fines and damp. Recent drilling in the backfill
indicated an average sulphur mass fraction of 2 % for 20
waste rock samples, which is only relatively high for a
mine waste deposit, but certainly higher than the average
sulphidic content of the bedrock. The resistivity variations
within the waste may be explained by the heterogeneity of
the material. In addition to the petrological variability of
the rocks, variations in particle size and moisture content
may affect the electrical properties of the waste rock, as
illustrated by Anterrieu et al. (2010). The production or
storage of acidic drainage in the sulphide material may also
alter the bulk resistivity by decreasing its values (Campbell
and Fitterman 2000). Most of the studies of tailings ponds
and waste rock piles using geoelectrical methods have
observed heterogeneity in the resistivity of the waste and
suggested similar interpretations for it (e.g. Placiencia-
Gomez et al. 2010; Martın-Crespo et al. 2010; Anterrieu
et al. 2010; Grangeia et al. 2011). Another factor which
probably accounts for resistivity variations in the backfilled
material at Kimheden is that, along with waste rock, other
types of materials such as contaminated soils and organic
matter, have been dumped in the pits. This additional
source of heterogeneity makes it difficult to associate low-
resistivity areas in the backfilled waste with geochemical
properties (sulphide content), geotechnical properties
(particle size and pore water content) or processes (AMD
generation).
Fractures and groundwater flow paths
Geotechnical drill core logging and archive documents
about the site indicate that the rock substratum close to the
pits is generally fractured but also contains individual
larger-scale cracks that account for the major part of the
water inflow to the pits. Evidence of fractured bedrock or
single fractures was therefore a special focus of the geo-
physical investigations. The objectives were to identify
potential zones of water and oxygen ingress into the
backfilled material of open pit 1 which produces the
greatest quantities of pollutants, and to determine the
pathways of contaminated drainage from the pit. Reflec-
tions indicating fractures in the shallow bedrock and nat-
ural till cover close to the walls of the pit could be found
on some of the GPR sections. However, more readily
identifiable signatures of the fractured bedrock could be
observed in the resistivity models and some results are
described hereafter.
Profile 2 is located in the bedrock above backfilled open
pit 1 (Fig. 2). The resistivity values in the rock substratum
are high ([16,000 Xm, Fig. 6b), whereas the natural till
cover and the topsoil layer are less resistive (\6,300 Xm).
The noticeable superficial horizontal variations in the
resistivity of the bedrock could be caused by petrological
variations, but they may also indicate different degrees of
alteration of the bedrock, with zones of weaker bedrock
associated with lower resistivity values. Parasnis (1973)
presented a geoelectrical survey performed in the context
of prospecting campaigns at Kimheden, and he showed that
weathering of the host rock had a major influence on the
apparent resistivity, whereby highly weathered zones in the
host rock had the potential to mask the conductive ore
anomaly. In this sense, the large conductive anomaly at the
bottom of the profile (resistivity values down to
1,000 Xm), could be the signature of a major water-filled
fracture zone. However, the significant size and the shape
of the anomaly strongly influence the consideration of side
effects from the nearby pit instead, as discussed later in
‘‘Geoelectrical multiple-gradient array survey (backfilled
open pit 1)’’.
Profile 4 crosses the pit and the bedrock below the pit
(Fig. 2). The inverted section (Fig. 6d) shows that the limit
at the higher edge of the pit between the low-resistivity
zone consisting of the backfilled waste and the higher
resistivity in the bedrock is not vertical, in contrast to the
limit at the lower edge and contrary to topographical
archive data. This suggests that the higher wall is a weaker
barrier compared to the lower wall in this section of the pit.
Fractures and possibly inflows of groundwater may be
expected at this location.
Profile 3 is located in the bedrock below backfilled
open pit 1 (Fig. 2). On the inverted resistivity section
(Fig. 6c), the first half of the profile is characterised by
reduced resistivity values on the surface, going down to
160 Xm while the other half of the profile has resistivity
values higher than 2,500 Xm on the surface. Decreased
resistivity values are also observed on the surface of
profile 4 (Fig. 6d) below the intersection with the pit.
Observations in the field show that in this area, situated
downstream of open pit 1, the bedrock is largely covered
by peat and is constantly humid. It is known to be the
seepage area from backfilled open pit 1. Water on the
surface is ion-rich, with electrical conductivities of
*600 lS cm-1. The resistivity models allow to delimit
this seepage area on the surveyed profiles, between 0 and
110 m on line 3, and 40 to 200 m on line 4. They also
suggest, for the two profiles, that the major pathways of
contaminated drainage occur on the surface and in the
shallow subsurface. Resistivity variations in the deeper
bedrock are not large enough for individual pathways of
contaminated water to be identified, even though the
material may be fractured. One single low-resistivity
anomaly is observed in the deeper bedrock at the bottom
right of profile 3 (Fig. 6c), but the presence of noise on the
pseudo-section of apparent resistivity data suggests that
this is likely to be an artefact.
Environ Earth Sci
123

Profile 4 gives additional information about the path-
ways of mine drainage. The profile runs along the slope and
intersects a ditch downstream of pit 1 (Figs. 2, 6d) that was
designed to divert contaminated water to a treatment pond
located at the bottom of the hill. Low-resistivity values of
less than 160 Xm are found on the surface of the profile
below the intersection with the ditch (from 150 m to the
end of the profile), indicating that contaminated surface
water runs beyond the ditch. This observation implies that
the ditch fails to retain all the drainage, which is in
agreement with water flow data previously obtained in the
stream (Villain et al. 2013).
Implications for the evaluation of the reclamation
Dry cover
The results obtained using geophysical methods at Ki-
mheden did not reveal any major fracture or vertical dis-
placement in the sealing layer. However, two types of risk
of deterioration of the sealing layer were recognised.
The variations in the thickness of the protective layer
observed with the GPR and geoelectrical surveys could be
the result of an attempt to level the irregular surface of the
spoil during deposition of the dry cover. In the Kristineberg
mining area where the Kimheden mine is located, the limit
of frost penetration in the protective layers made of local
till has been estimated to be less than 1.5 m deep (Hoglund
and Herbert 2004), which is why a thickness of 1.5 m was
selected for the protective layer at the site. Protection of the
sealing layer from frost action is essential, as freezing and
thawing effects in clayey till layers may lead to increased
hydraulic conductivity (Carlsson and Elander 2001).
Results from the GPR survey indicated, however, regions
of the pits where the protective layer is thinner than 1.5 m,
which could imply decreased performance of the cover
over the long term through enhanced permeability in the
sealing layer, resulting in increased oxygen diffusion.
Experience with dry covers at other sites has shown that
deterioration and increased permeability of sealing layers
with time are not uncommon (Waygood and Ferreira
2009).
The geoelectrical results at backfilled open pit 1 indi-
cated seepage of mine drainage through the dry cover
(Fig. 6d), which is explained by the sloping topography of
the terrain. In this area, patches of oxidation or actual
seepage during periods of higher water flow can be
observed on the surface of the cover. It is assumed that
these oxidation patches are caused by precipitation of iron,
which is dissolved in the drainage seeping through the
cover, when it comes into contact with air and oxidises.
Seepage through the dry cover generates a risk of erosion
for the sealing layer. One option to reduce this risk would
have been to include an oxygen-controlled drainage system
underneath the sealing layer to allow the drainage from the
mine waste to run out freely above the lower edge of the pit
without letting the oxygen reach the waste.
Fractures and groundwater flow pathways
Data from a previous study (Rosen and Wilske 1994) and
both the resistivity and GPR sections obtained in this study
indicate that the upper rock substratum surrounding back-
filled open pit 1 is fractured. Therefore, it is reasonable to
think that the pit walls are pervious to oxygen and/or
oxygen-containing water. A continuous flow of water and
oxygen through the pits may therefore result in persistent
oxidation of the sulphidic waste and washout of the oxi-
dation products. Failure to keep the backfilled waste in
oxygen-poor conditions inevitably compromises the per-
formance of the backfilling and sealing work. That may
explain the ongoing production of AMD from the waste
rock 14 years after reclamation of the site (Villain et al.
2013). The problem with fractured bedrock surrounding the
pits had already been raised by Rosen and Wilske (1994)
before completion of the reclamation, as they suggested
sealing of the fractures as a reclamation alternative to the
application of a dry cover. They recognised that this option
would result in a much more effective reduction of the
water inflow into the pits compared to the dry cover, as
most of the inflow occurs as groundwater. They considered,
however, that restriction of the oxygen contact with the
waste using a dry cover would work better in decreasing
AMD generation than decreasing water inflow, as they
assumed that groundwater does not usually contain a large
amount of oxygen. However, as the fractures in the pit
walls are relatively superficial, transport of air or oxygen-
containing groundwater cannot be ruled out.
Limitations of the study
GPR survey
When evaluating the thickness of the protective layer and
the integrity of the sealing layer using GPR, potential
sources of error must be taken into account, arising mainly
from uncertainties in the interpretation of the data and in
the propagation velocity models. The two types of uncer-
tainties are discussed separately.
Uncertainties in the interpretation of the data lie in the
choice of the correct reflection for the sealing layer. Multiple
superficial reflections were observed on most of the GPR
profiles, which, according to the velocity model and the
expected thickness of the protective layer (1.5 m), turned
Environ Earth Sci
123
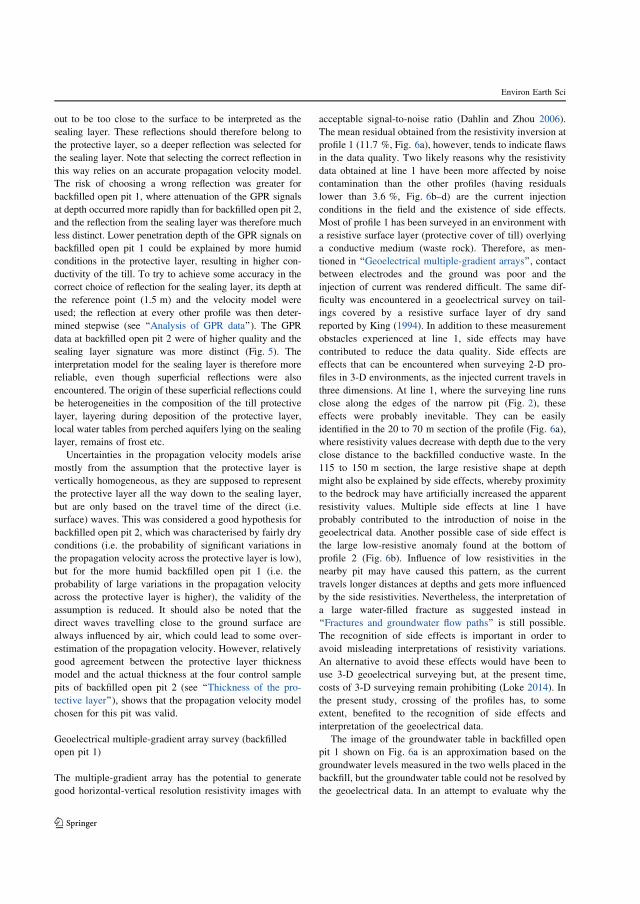
out to be too close to the surface to be interpreted as the
sealing layer. These reflections should therefore belong to
the protective layer, so a deeper reflection was selected for
the sealing layer. Note that selecting the correct reflection in
this way relies on an accurate propagation velocity model.
The risk of choosing a wrong reflection was greater for
backfilled open pit 1, where attenuation of the GPR signals
at depth occurred more rapidly than for backfilled open pit 2,
and the reflection from the sealing layer was therefore much
less distinct. Lower penetration depth of the GPR signals on
backfilled open pit 1 could be explained by more humid
conditions in the protective layer, resulting in higher con-
ductivity of the till. To try to achieve some accuracy in the
correct choice of reflection for the sealing layer, its depth at
the reference point (1.5 m) and the velocity model were
used; the reflection at every other profile was then deter-
mined stepwise (see ‘‘Analysis of GPR data’’). The GPR
data at backfilled open pit 2 were of higher quality and the
sealing layer signature was more distinct (Fig. 5). The
interpretation model for the sealing layer is therefore more
reliable, even though superficial reflections were also
encountered. The origin of these superficial reflections could
be heterogeneities in the composition of the till protective
layer, layering during deposition of the protective layer,
local water tables from perched aquifers lying on the sealing
layer, remains of frost etc.
Uncertainties in the propagation velocity models arise
mostly from the assumption that the protective layer is
vertically homogeneous, as they are supposed to represent
the protective layer all the way down to the sealing layer,
but are only based on the travel time of the direct (i.e.
surface) waves. This was considered a good hypothesis for
backfilled open pit 2, which was characterised by fairly dry
conditions (i.e. the probability of significant variations in
the propagation velocity across the protective layer is low),
but for the more humid backfilled open pit 1 (i.e. the
probability of large variations in the propagation velocity
across the protective layer is higher), the validity of the
assumption is reduced. It should also be noted that the
direct waves travelling close to the ground surface are
always influenced by air, which could lead to some over-
estimation of the propagation velocity. However, relatively
good agreement between the protective layer thickness
model and the actual thickness at the four control sample
pits of backfilled open pit 2 (see ‘‘Thickness of the pro-
tective layer’’), shows that the propagation velocity model
chosen for this pit was valid.
Geoelectrical multiple-gradient array survey (backfilled
open pit 1)
The multiple-gradient array has the potential to generate
good horizontal-vertical resolution resistivity images with
acceptable signal-to-noise ratio (Dahlin and Zhou 2006).
The mean residual obtained from the resistivity inversion at
profile 1 (11.7 %, Fig. 6a), however, tends to indicate flaws
in the data quality. Two likely reasons why the resistivity
data obtained at line 1 have been more affected by noise
contamination than the other profiles (having residuals
lower than 3.6 %, Fig. 6b–d) are the current injection
conditions in the field and the existence of side effects.
Most of profile 1 has been surveyed in an environment with
a resistive surface layer (protective cover of till) overlying
a conductive medium (waste rock). Therefore, as men-
tioned in ‘‘Geoelectrical multiple-gradient arrays’’, contact
between electrodes and the ground was poor and the
injection of current was rendered difficult. The same dif-
ficulty was encountered in a geoelectrical survey on tail-
ings covered by a resistive surface layer of dry sand
reported by King (1994). In addition to these measurement
obstacles experienced at line 1, side effects may have
contributed to reduce the data quality. Side effects are
effects that can be encountered when surveying 2-D pro-
files in 3-D environments, as the injected current travels in
three dimensions. At line 1, where the surveying line runs
close along the edges of the narrow pit (Fig. 2), these
effects were probably inevitable. They can be easily
identified in the 20 to 70 m section of the profile (Fig. 6a),
where resistivity values decrease with depth due to the very
close distance to the backfilled conductive waste. In the
115 to 150 m section, the large resistive shape at depth
might also be explained by side effects, whereby proximity
to the bedrock may have artificially increased the apparent
resistivity values. Multiple side effects at line 1 have
probably contributed to the introduction of noise in the
geoelectrical data. Another possible case of side effect is
the large low-resistive anomaly found at the bottom of
profile 2 (Fig. 6b). Influence of low resistivities in the
nearby pit may have caused this pattern, as the current
travels longer distances at depths and gets more influenced
by the side resistivities. Nevertheless, the interpretation of
a large water-filled fracture as suggested instead in
‘‘Fractures and groundwater flow paths’’ is still possible.
The recognition of side effects is important in order to
avoid misleading interpretations of resistivity variations.
An alternative to avoid these effects would have been to
use 3-D geoelectrical surveying but, at the present time,
costs of 3-D surveying remain prohibiting (Loke 2014). In
the present study, crossing of the profiles has, to some
extent, benefited to the recognition of side effects and
interpretation of the geoelectrical data.
The image of the groundwater table in backfilled open
pit 1 shown on Fig. 6a is an approximation based on the
groundwater levels measured in the two wells placed in the
backfill, but the groundwater table could not be resolved by
the geoelectrical data. In an attempt to evaluate why the
Environ Earth Sci
123
geoelectrical data could not identify the position of the
water in the backfilled open pit, a 2-D conceptual model of
the true resistivity distribution in and around the pit was
created. The model included the resistivity of the water-
saturated waste rock deduced from electrical conductivity
measurements of the groundwater in the backfill and
expected porosity and cementation grade of the waste rock.
The apparent resistivity values from this distribution were
then calculated with the forward modelling software
RES2DMOD for the multiple-gradient array and later
inverted in RES2DINV. The modelling results indicate that
the groundwater table cannot be resolved, since the inter-
mediate resistivity values of the water-saturated and
unsaturated waste rock are suppressed between the low and
high-resistivity bodies observed in the pit. Placiencia-
Gomez et al. (2010) observed that low resistivity in mine
waste is more likely to be related to high ion concentrations
in the pore water rather than to moisture of the waste. It is,
therefore, reasonable to assume that regions of active sul-
phide oxidation and generation of ion-rich pore water in the
backfilled waste are better mapped by the geoelectrical data
than the presence of groundwater.
According to aerial mapping over the mine before
completion of the reclamation, the floor of the pit should be
found at a depth of 10 to 20 m below the current surface of
the dry cover. However, it was not imaged by the geo-
electrical data, suggesting that the actual penetration depth
of the signals has to be lower than indicated on the inverted
sections. Other geoelectrical studies of mine tailings and
waste rock deposits have succeeded in imaging the floor of
the tailings impoundments or the underlying bedrock
(Placiencia-Gomez et al. 2010; Martın-Crespo et al. 2010;
Gomez-Ortiz et al. 2010; Martınez-Pagan et al. 2011; Mele
et al. 2013). Forward modelling of the resistivities in the pit
under perfect measuring conditions (no noise) allowed
detection of the underlying bedrock, which shows that this
is probably a practical issue in this study. The most rea-
sonable explanation is that, due to high resistivity in the
upper till layer, the contact resistance between the elec-
trodes and the ground was very high (see ‘‘Geoelectrical
multiple-gradient arrays’’ and earlier in this section),
making it impossible to inject the necessary current in
order to penetrate beneath the conductive zone of the pit.
Conclusions
This study illustrated how GPR and geoelectrical multiple-
gradient array surveying can be used to provide beneficial
information about the effectiveness of reclamation of an
open pit. The survey carried out at the Kimheden mine site
identified weaknesses in the reclamation measures 14 years
after their application.
1. Risks of damage to the sealing layer in the dry cover
over the long term were recognised with both methods.
Models constructed with GPR data showed variations
of up to 1 m in the thickness of the protective layer on
backfilled open pits, which could also be observed in
the resistivity models. In some areas of the pits, the
thickness was lower than 1.5 m, which implies a risk
of deterioration of the underlying sealing layer by frost
action. Seepage from the backfilled waste through the
cover was identified with the geoelectrical survey,
which may be a source of erosion of the sealing layer.
Some portions of the cover may therefore already now,
or in the future, allow an increased diffusion of oxygen
to the backfilled waste.
2. Resistivity models at backfilled open pit 1 showed a
possible inflow of shallow groundwater through the pit
wall. Outflow of contaminated water from the pit was
observed in the upper bedrock and on the ground
surface. Extension of the contaminated seepage area
beyond the collection ditch demonstrated its inefficacy
in retaining the drainage. Shallow fractures in the pit
walls are suggested to be possible pathways for oxygen
into the backfilled mine waste.
Although geophysical data on their own cannot be
expected to provide a complete picture of the effects of a
reclamation approach, their integration with reference data
allowed identification of deficiencies that compromised the
performance of the reclamation at the Kimheden open-pit
site, which may therefore provide insights for further
improvement of mitigation practices.
Acknowledgments This study was financed by the European
Union’s Structural Funds through the non-profit organisation Georange
in Sweden. The authors also would like to thank Bert-Sive Lindmark at
Bergteamet for his help in the field, Carl-Axel Triumf, formerly at
GeoVista, for valuable advice on the design of the survey and in the
interpretation of the data, Peter Liikamaa at MRM for realising the
geotechnical control of the cover, Prof. Thorkild Maack Rasmussen at
Lulea University of Technology (LTU) for kindly offering to review
the manuscript, an anonymous reviewer for his beneficial comments
and Milan Vnuk at LTU for helping with the figures.
Open Access This article is distributed under the terms of the
Creative Commons Attribution License which permits any use, dis-
tribution, and reproduction in any medium, provided the original
author(s) and the source are credited.
References
Abu-Zeid N, Bianchini G, Santarato G, Vaccaro C (2004) Geochem-
ical characterisation and geophysical mapping of Landfill
leachates: the Marozzo canal case study (NE Italy). Environ
Geol 45:439–447
Allen RL, Weihed P, The Global VHMS Research Project Team
(2002) Global comparison of volcanic-associated massive
sulphide districts. J Geol Soc Lond Spec Publ 204:13–37
Environ Earth Sci
123

Anterrieu O, Chouteau M, Aubertin M (2010) Geophysical charac-
terization of the large-scale internal structure of a waste rock pile
from a hard rock mine. Bull Eng Geol Environ 69:533–548
Areback H, Barrett TJ, Abrahamsson S, Fagerstrom P (2005) The
Palaeoproterozoic Kristineberg VMS deposit, Skellefte district,
northern Sweden, part I: geology. Miner Deposita 40:351–367
Axelsson C-L, Ekstav A, Holmen J, Jansson T (1991) Efterbehandling
av sandmagasin i Kristineberg, Hydrogeologiska forutsattningar
for atgardsplan. Lakvattenbalanser och vittringsbegransande
atgarder. Golder Geosystem AB, Uppsala, Sweden. Internal
report (in Swedish)
Bambic DG, Alpers CN, Green PG, Fanelli E, Silk WK (2006)
Seasonal and spatial patterns of metals at a restored copper mine
site. I. Stream copper and zinc. Environ Pollut 144:774–782
Bergstrom J (1997) Development of a geophysical method for
investigating and monitoring the integrity of sealing layers on
mining waste deposits. Final report. AFR-report 164, SEPA,
Stockholm, Sweden
Brake SS, Connors KA, Romberger SB (2001) A river runs through it:
impact of acid mine drainage on the geochemistry of West Little
Sugar Creek pre- and post-reclamation at the Green Valley coal
mine, Indiana, USA. Environ Geol 40:1471–1481
Buselli G, Lu KL (2001) Groundwater contamination monitoring with
multichannel electrical and electromagnetic methods. J Appl
Geophys 48:11–23
Campbell DL, Fitterman DV (2000) Geoelectrical methods for
investigating mine dumps. In: ICARD 2000—proceedings from
the fifth international conference on acid rock drainage, Denver,
USA, pp 1513–1523
Carlsson E, Elander P (2001) Investigation of repeated cycles of
freezing and thawing effects on a clayey till used as sealing layer
over sulphide-rich tailings at the Kristineberg mine, northern
Sweden. In: Proceedings of securing the future. International
conference on mining and the environment, Skelleftea, 25 June–
1 July, vol 1, pp 58–71
Dahlin T, Zhou B (2006) Multiple-gradient array measurements for
multichannel 2D resistivity imaging. Near Surf Geophys
4:113–123
Dahlin T, Rosqvist H, Leroux V (2010) Resistivity-IP mapping for
landfill applications. Near Surf Geosci 28:101–105
Edstrom and Schonfeldt AB (1996) Kristinebergsgruvan, Ef-
terbehandlingsarbeten. Edstrom & Schonfeldt AB and Boliden
AB, Sweden. Internal report (in Swedish)
Gomez-Ortiz D, Martın-Crespo T, Esbrı JM (2010) Geoenvironmen-
tal characterization of the San Quintın mine tailings, Ciudad
Real (Spain). Dyna 161:131–140
Grangeia C, Avila P, Matias M, da Silva EF (2011) Mine tailings
integrated investigations: the case of Rio tailings (Panasqueira
Mine, Central Portugal). Eng Geol 123:359–372
Hannington MD, Kjarsgaard IM, Galley AG, Taylor B (2003)
Mineral-chemical studies of metamorphosed hydrothermal alter-
ation in the Kristineberg volcanogenic massive sulfide district,
Sweden. Miner Deposita 38:423–442
Hellman H, Lokrantz H (2008) Kimhedengruvan, Installation av
grundvattenror vid nedlagt och igenfyllt dagbrott vid Kimheden.
Berggeologiska Undersokningar AB, Sweden. Internal report (in
Swedish)
Hoglund LO, Herbert R (Eds), Lovgren L, Ohlander B, Neretnieks I,
Moreno L, Malmstrom M, Elander P, Lindvall M, Lindstrom B
(2004) MiMi—performance assessment: main report. MiMi
report 2003:3, Mitigation of the environmental impact from
mining waste programme (MiMi). MiMi Print, Lulea, Sweden
Holmstrom H, Salmon UJ, Carlsson E, Petrov P, Ohlander B (2001)
Geochemical investigations of sulfide-bearing tailings at Kris-
tineberg, northern Sweden, a few years after remediation. Sci
Total Environ 273:111–133
INAP (The International Network for Acid Prevention) (2009) Global
Acid Rock Drainage Guide (GARD Guide). Chapter 6. http://
www.gardguide.com/. Last Accessed 11th July 2014
King A (1994) Application of geophysical methods for monitoring
acid mine drainage. MEND Project 4.6.1. CANMET, Ottawa,
Ontario, Canada
Loke MH (2014) Tutorial: 2-D and 3-D electrical imaging surveys.
Geotomo Software, Malaysia
Loke MH, Acworth I, Dahlin T (2003) A comparison of smooth and
blocky inversion methods in 2D electrical imaging surveys.
Explor Geophys 34:182–187
Malmstrom M, Werner K, Salmon U, Berglund S (2001) Hydroge-
ology and geochemistry of mill tailings impoundment 1,
Kristineberg, Sweden: Compilation and interpretation of pre-
remediation data. MiMi report 2001:4, Mitigation of the
environmental impact from mining waste programme (MiMi).
MiMi Print, Lulea, Sweden
Martın-Crespo T, De Ignacio-San Jose C, Gomez-Ortiz D, Martın-
Velazquez S, Lillo-Ramos J (2010) Monitoring study of the mine
pond reclamation of Mina Concepcion, Iberian Pyrite Belt
(Spain). Environ Earth Sci 59:1275–1284
Martınez-Pagan P, Faz A, Acosta JA, Carmona DM, Martınez-
Martınez S (2011) A multidisciplinary study for mining land-
scape reclamation: a study case on two tailing ponds in the
Region of Murcia (SE Spain). Phys Chem Earth Parts A/B/C
36:1331–1344
Mele M, Servida D, Lupis D (2013) Characterisation of sulphide-
bearing waste-rock dumps using electrical resistivity imaging:
the case study of the Rio Marina mining district (Elba Island,
Italy). Environ Monit Assess 185:5891–5907
Nobes DC, Armstrong MJ, Close ME (2000) Delineation of a landfill
leachate plume and flow channels in coastal sands near
Christchurch, New Zealand, using a shallow electromagnetic
survey method. Hydrogeol J 8:328–336
Parasnis DS (1973) Mining geophysics: methods in geochemistry and
geophysics series (3), 2nd edn. Elsevier, Amsterdam
Placiencia-Gomez E, Parviainen A, Hokkanen T, Loukola-Ruskeeni-
emi K (2010) Integrated geophysical and geochemical study on
AMD generation at the Haveri Au–Cu mine tailings, SW
Finland. Environ Earth Sci 61:1435–1447
Poisson J, Chouteau M, Aubertin M, Campos D (2009) Geophysical
experiments to image the shallow internal structure and the
moisture distribution of a mine waste rock pile. J Appl Geophys
67:179–192
Porsani JL, Filho WM, Elis VR, Shimeles F, Dourado JC, Moura HP
(2004) The use of GPR and VES in delineating a contamination
plume in a landfill site: a case study in SE Brazil. J Appl
Geophys 55:199–209
Rosen L, Wilske A (1994) Berakningar av metallfloden och forslagtill atgarder vid Kimhedengruvan, Kristineberg. Scandiaconsult
Vast AB, Sweden. Internal report (in Swedish)
Rubin Y, Hubbard SS (2005) Introduction to hydrogeophysics. In:
Rubin Y, Hubbard SS (eds) Hydrogeophysics. Springer, Dordr-
echt, pp 3–21
Rucker DF, Glaser DR, Osborne T, Maehl WC (2009) Electrical
resistivity characterization of a reclaimed gold mine to delineate
acid rock drainage pathways. Mine Water Environ 28:146–157
Runkel RL, Bencala KE, Kimball BA, Walton-Day K, Verplanck PL
(2009) A comparison of pre- and post-remediation water quality,
Mineral Creek, Colorado. Hydrol Process 23:3319–3333
Tavakoli S, Elming S-A, Thunehed H (2012) Geophysical modelling
of the central Skellefte district, Northern Sweden; an integrated
model based on the electrical, potential field and petrophysical
data. J Appl Geophys 82:84–100
Van Dam R, Gutierrez L, McLemore V, Wilson GW, Hendrickx J,
Walker B (2005) Near surface geophysics for the structural
Environ Earth Sci
123

analysis of a mine rock pile, northern New Mexico. In: The 2005
National Meeting of the American Society of Mining and
Reclamation, ASMR Lexington, USA, pp 1178–1201
Villain L, Alakangas L, Ohlander B (2013) The effects of backfilling
and sealing the waste rock on water quality at the Kimheden
open-pit mine, northern Sweden. J Geochem Explor 134:99–110
Waygood CG, Ferreira S (2009) A review of the current strategy for
capping mining spoils. In: Proceedings of the International Mine
Water Conference. Water Institute of Southern Africa and
International Mine Water Association (IMWA), Pretoria, South
Africa, pp 738–745
Environ Earth Sci
123


PAPER III
Iron speciation and stable oxygen isotopes in the acid mine drainage at a reclaimed open-pit mine site in
Kimheden, northern Sweden
Lucile Villain, Charles A. Cravotta III, Lena Alakangas and Björn Öhlander
Manuscript(2014)


1
Iron speciation and stable oxygen isotopes in the acid mine drainage at a reclaimed open-pit mine site in Kimheden,
northern Sweden
Lucile Villain1, Charles A. Cravotta III2, Lena Alakangas1, Björn Öhlander1
1Luleå University of Technology, Division of Geosciences and Environmental Engineering, SE-971 87 Luleå, Sweden
2USGS, Pennsylvania Water Science Center, 215 Limekiln Road, New Cumberland, PA 17070, USA
AbstractAt mine sites with sulphidic rocks exposed on the surface oxygen is the ultimate driver of sul-phide oxidation that may result in long-term production of acid mine drainage (AMD). Thus, many mine closure plans include measures to isolate sulphidic mine waste deposits from con-tact with oxygen. At the Kimheden mine in northern Sweden, post-closure reclamation mea-sures included progressive in-pit backfilling of partially oxidised waste rock and sealing with an oxygen-barrier cover. However, ca. 15 years later monitoring suggested that sulphide oxidation was continuing in the covered backfilled waste. Thus, in the present study iron speciation and the isotopic composition of sulphate in the dissolved phase of the mine drainage, together with PHREEQC modelling of the water chemistry were used to probe the geochemical processes occurring in the mine water. Analysis of iron speciation in the drainage revealed significant Fe(II) oxidation and precipitation at the discharge points of the backfilled open pits and in the receiving stream. In addition, the iron speciation data strongly correlated with field electrode potential (Eh) measurements of the water when Fe(III) was assumed to be in equilibrium with a ferric solid phase. The correlation was weaker when dissolved Fe(III) concentrations were used in the cal-culations, suggesting the presence of errors in the Fe(III) concentrations. Correction of dissolved Fe(III) concentrations using field Eh measurements suggested that the dissolved Fe phase was in equilibrium with a schwertmannite-like solid phase. According to geochemical modelling, the sulphide oxidation rates in the covered backfill were at least an order of magnitude higher than expected from cover design specifications. Interpretation of the oxygen isotopic abundances in dissolved sulphate suggested that Fe(III) was a major oxidant of pyrite in the backfill, although some direct oxidation by oxygen was also inferred.
2
1. Introduction In sulphidic mine waste exposed to atmospheric conditions, oxygen is the main oxidant responsible for the oxidation of sulphides, which may result in the well-known environmen-tal issue of acid mine drainage (AMD). Unsurprisingly, therefore, restricting contact between acid-producing mine waste and oxygen is considered one of the most important prevention and mitigation options at mine sites (INAP 2009). Two commonly employed methods to limit ox-ygen ingress into mine waste are under-water disposal (water cover) and disposal under various types of engineered soil or dry covers, including oxygen-ingress barriers. Details of the design and processes associated with these two methods can be found in INAP (2009), Lottermoser (2010), MEND (2001) and Höglund et al. (2004). Both methods are based on the principle that oxygen diffuses much more slowly in water than in air or unsaturated soil. Thus, covering the surface of the waste deposit with a water column or water-saturated layer may significantly decrease oxygen ingress into it.
The ultimate goal of limiting contact between oxygen and the waste is to decrease the rate of sulphide oxidation sufficiently for the resulting discharges of metals, sulphate and acidity in the mine drainage to meet defined acceptable limits, usually based on guidelines formulated by en-vironmental agencies and other regulatory authorities. As every site presents unique conditions in terms of mineralogy, hydrology, climate etc., the conditions in the background water at the site (i.e. water unaffected by mining and reclamation operations) may also be beneficially used to determine achievable target concentration limits at specific sites.
At the site of a former copper mine at Kimheden in northern Sweden with two small open pits, reclamation measures consisted of backfilling acid-generating waste rock into the pits and appli-cation of a dry cover, including a permeability barrier. The reclamation works were completed in 1996, more than 20 years after mining operations ceased. Previous monitoring of the water qual-ity in the drainage collection ditch showed that Cu and Zn concentrations significantly decreased after reclamation, but post-reclamation water quality was not sufficient to allow uncontrolled release into the environment (Villain et al. 2013). It was suspected that sulphide oxidation was continuing in the covered backfilled waste, although more slowly than before reclamation. Clear-ly, thorough understanding of the geochemical processes responsible for the continuing formation of AMD was needed to evaluate the adequacy of the reclamation approach. Equally clearly, this would require thorough analysis of the nature and extent of the processes leading to the ongoing leaching of metals and acidification in the water.
Iron is involved in most geochemical processes governing the formation of AMD and it can be found in numerous forms at mine sites. The speciation of iron between its Fe(II) ferrous and Fe(III) ferric forms has been demonstrated to govern the oxidation-reduction (redox) state of many acidic mine waters (Nordstrom et al. 1979; Nordstrom 2011). Therefore, analyses of iron speciation and measurements of electrode potentials in AMD have been effectively used in char-acterisation of the environmental geochemistry of mine sites (Wisotzky 2000; Sracek et al. 2004; Hallberg et al. 2005; Pellicori et al. 2005; Sánchez España et al. 2005). They have also been used more specifically to investigate geochemical processes affecting the drainage, such as the rate of oxidation of Fe(II) (Nordstrom 1985; Kirby et al. 1999; Sánchez España et al. 2007) and the formation of ferric colloids (Nordstrom 2011). In addition, analyses of the stable isotopic com-position of water and sulphate are being increasingly used in geochemical studies of mine sites, particularly investigations of sulphide oxidation environments (Haubrich and Tichomirowa 2002; Knöller et al. 2004; Sracek et al. 2004; Pellicori et al. 2005; Nordstrom et al. 2007; Migaszewski et al. 2008; Seal et al. 2008). Geochemical modelling is also highly valuable in these investigations, for interpreting acquired data and testing hypotheses (Alpers and Nordstrom 1999).
3
Thus, in the present study detailed information was acquired on the iron speciation and stable isotope compositions of sulphate and water in the mine drainage at the Kimheden site. This infor-mation was then used, in conjunction with geochemical modelling, to evaluate the key geochem-ical processes compromising the reclamation measures’ effectiveness. More specifically, the follow-ing questions were addressed. Firstly, what kinds of information do the concentrations of dissolved ferrous and ferric iron provide about the reactions occurring in the mine water? Secondly, is the amount of oxygen consumed by sulphide oxidation in the backfill consistent with the expected diffusion of oxygen through the dry cover? Thirdly, to what extent is molecular oxygen directly involved in the sulphide oxidation, and can this information be used to characterise the sulphide oxidation environment in the waste rock?
2. Site descriptionClimate and geological settings
Kimheden is the site of a small former copper mine situated on a hillside at 470 – 520 m altitude in the Kristineberg mining area of northern Sweden (Fig. 1a). The climate at the site is continental subarctic (Encyclopedia Britannica 2014), with short summers and cold winters. The average annual temperature is 0.3 °C (SMHI 2008) and the average precipitation is 508 mm/yr (SMHI 2007).
The Kristineberg mining area is a deformed and metamorphosed Palaeoproterozoic 1.9 Ga vol-canic domain in the western part of the Skellefte mining district (Hannington et al. 2003). It hosts several volcanogenic massive sulphide (VMS) deposits of varying sizes that are believed to have formed in a continental or mature extensional arc setting (Allen et al. 2002). The Kimheden deposit is one of the smaller deposits of the area. It is located in a succession of felsic and minor mafic volcaniclastic rocks that have been metamorphosed to quartz–muscovite–chlorite ± bi-otite schists. All exposed volcanic rocks in the area have been intensely affected by synvolcanic hydrothermal alteration and subsequent metamorphism (Hannington et al. 2003). Felsic volcanic rocks between the ore horizons have been affected by Mg-rich chlorite alteration. Based on the composition of chlorite at the Kimheden site reported by Hannington et al. (2003), the stoichi-ometry of chlorite was assumed to be Mg
4FeAl
2Si
3O
10(OH)
8 for use in geochemical modelling
in the present study. According to exploration drill core archive documents, talc is also present at the site. The ore primarily consists of pyritic lenses (Hannington et al. 2003), together with some chalcopyrite and sphalerite.
Mining and post-closure events
Mining at Kimheden took place between 1968 and 1974, both underground and in two open pits (Fig. 1b). During this time the mining company Boliden AB produced 0.13 Mt of copper ore with average grades of 0.95 % Cu, 0.27 % Zn and 18.4 % S (Årebäck et al. 2005). The two pits, located to the north-east and south-west of a former industrial area, designated open pits 1 and 2, respectively, are 140 – 210 m long, ~ 20 m wide and less than 15 m deep. The waste rock brought to the surface during the operations was first deposited on the ground by the open pits. However, due to the release of highly acidic Cu and Zn-rich drainage from the waste rock piles, the mining company had to consider remediation options for the contaminated drainage by the beginning of the 1980s. In 1981 – 1982, a network of diversion/collection ditches was excavated around the waste rock piles and the mine workings (Landström 1981; Andersson 1988) to reduce the inflow of meteoric water into the acid-generating material and ensure that the contaminated drainage was collected for treatment in a limed tailings pond downstream. The collection ditch

4
(= receiving stream) is still in use today, and was a major focus of the surface water investigations reported here (see Fig. 1b). Between 1984 and 1995, progressive backfilling of the waste rock into the pits was carried out, along with some surficial applications of lime (Jönsson 1993; Edström & Schönfeldt 1996). Some vegetation and glacial till material would also have been deposited along with the waste rock. In 1996, the reclamation works were completed by placing an oxygen- diffusion barrier on top of the backfilled pits to reduce oxygen ingress into the underlying waste. The dry cover design specifications were a 0.3 m thick sealing layer composed of clayey till overlain by a 1.5 m thick protective layer of unsorted till (Fig. 2).
Fig. 1. (a) (b)
-
Stockholm
Luleå
Skellefteå
20 km
ARVIDSJAUR
ABBORTRÄSK
GLOMMERSTRÄSK
MALÅ
KRISTINEBERGKIMHEDEN,
a
S1a
S1
G1G2
S1b
S1cS2
S3a
S4
S5
S6
SD
SOSO
GB SB
Open pit 1
Open pit 2
Former industrial area
Road
Road
Vormbäcken watercourse
Diversion ditch
Tunnels
Tailings pond 4 of Kristineberg
Kimheden mine
100 m
Collection of the drainage for treatment
N
b
Originalstream
Peatland
S3
Receiving stream(collection ditch)

5
3. Methods
3.1. Water sampling
Water was sampled for determination of iron speciation in the mine drainage during two two-day sessions, in August 2010 and September 2011, and for isotope determinations during a two-day session in October 2013, at a selected area around backfilled open pit 1. On each oc-casion, both surface water and groundwater samples were collected (Fig. 1b). Groundwater was sampled through groundwater wells placed in the covered backfill (G1 and G2 in Fig. 1b), using a peristaltic pump and a PVC tube at G1, and a bailer at G2 (as the groundwater level was very low). In each case the first volumes of water were discarded, and samples were collected after sta-bilisation of the water temperature. Groundwater at GB (background groundwater) was sampled from a free flowing old exploration drill casing.
The water samples’ temperature and pH were recorded with a Metrohm 704 portable pH meter, and their electrical conductivity was measured with a Multi 350i multimeter. In addition, their electrode potential was measured using a Mettler Toledo SevenGo meter equipped with an InLab 501 (platinum) electrode, followed by correction according to Nordstrom (1977). The samples were then filtered on-site using 0.22 μm nitrocellulose membranes and plastic syringes that had been washed in 5 % acetic acid and 5 % nitric acid, respectively, then rinsed in Milli-Q water (Millipore). The bottles used to collect samples for metal, isotope and iron speciation analyses were respectively: high-density polyethylene bottles washed in 50 % hydrochloric acid followed by 1 % nitric acid; non acid-washed high-density polyethylene bottles; and 282 mL capacity brown glass bottles with 2.82 mL of 25 % sulphuric acid added before sampling (1 % of the total volume when the bottles were completely filled). The latter treatments were intended to ensure that the sampled water would be preserved at a low pH (inhibiting precipitation of ferric hydrox-ides), in oxygen-free conditions (preventing oxidation of Fe(II)) and dark conditions (inhibiting photoreduction of Fe(III)) before analysis. After sampling, all sample bottles were kept cold (either in the refrigerator or freezer) until analysis.
The groundwater sampled from the G1 location in 2010 for iron speciation analysis was filtered in a glovebox under a constant influx of argon to reduce risks of oxidation of Fe(II) to Fe(III) during the sampling, as the Fe(II) concentrations in the groundwater of the backfill were con-sidered more critical than at the other locations. However, the results obtained for G1 in 2010 indicated a poor fit between the iron speciation data and the measured electrode potential value, giving an anomalously high Fe(III) concentration. Therefore, to accelerate the sampling, no glove-box was used for the filtration in 2011, and a much better fit between iron speciation data and the measured electrode potential value was observed at G1. Poorer results obtained with the glovebox
Fig. 2.
Protective layer, 1.5 m, unsorted tillSealing layer, 0.3 m, clayey till
Backfilling of waste rockinto the open pit
10
512
514(m)
510
508
506
504
502
500
498
49620 30 40 50 60 70 80 90 100 110 120 130 140 (m)
6
in 2010 may have been related to a longer filtration time and leaks of air into the glovebox, which may have resulted in unanticipated oxidation of the Fe(II) during sampling.
3.2.
Analysis of dissolved elements in water
Concentrations of dissolved elements in the water samples were determined at the ALS Scan-dinavia laboratory in northern Sweden (accredited in accordance with ISO/IEC 17025:2005; Swedish Board for Accreditation and Conformity Assessment – SWEDAC), after acidification with 1 mL ultra-high purity nitric acid per 100 mL of sample. Ca, K, Mg, Na, S and Si were determined with ICP-AES, and Fe, Al, As, Ba, Cd, Co, Cr, Cu, Mn, Mo, Ni, P, Pb, Sb, Sr, U, V and Zn with ICP-SFMS. The ICP-AES analyses were performed using a Perkin Elmer Optima DV 5300 instrument, according to US EPA Method 200.7 (modified). The ICP-SFMS analyses were performed using a Thermo Scientific Element instrument according to US EPA Method 200.8 (modified). Sulphate concentrations were also determined, using liquid ion chromatog-raphy. However, as markedly better charge imbalance values (as defined in Section 3.4.1) were obtained with S than with SO
4, S rather than SO
4 concentrations were preferred in all types of
data interpretation.
Analysis of iron speciation in water
Iron speciation in the dissolved phase was analysed by the GBA Laboratory Group in Ger-many (accredited in accordance with ISO/IEC 17025:2005; The Deutsche Akkreditierungsstelle GmbH). Fe(II) was determined by photometry after reaction with 1,10-phenanthrolin, yielding an orange-coloured complex, with a measurement uncertainty of 6 – 7 %. Fe(III) was determined by the difference between Fe(tot) (determined by ICP-MS with an uncertainty of 5.6 %) and Fe(II).
18 2 18 34S in dissolved sulphate
The results of the isotopic analyses are provided in -notation defined as:
(3.1)
where R is the 18O/16O or 2H/1H abundance ratio relative to the Vienna-Standard Mean Ocean Water (VSMOW) standard or 34S/32S relative to the Vienna-Canyon Diablo Troilite (VCDT) standard.
Water samples for isotopic determinations were shipped to the University of Waterloo Environ-mental Isotope Laboratory (uwEILAB) in Canada. 18O in water was measured by HT-EA-IRMS after H
2O-CO
2 equilibration, giving a reproducibility value of ± 0.2 ‰. 2H was measured by
EA-IRMS after H2O-Cr reduction (± 0.8 ‰). For determining 18O and 34S in dissolved sul-
phate, the procedure was as follows. Sulphate was extracted by precipitation with the addition of BaCl
2. Carbonate was acidified and subsequently dried at 80 °C for removal. Purified BaSO
4 was
mixed with Nb2O
5 and weighed into a tin capsule prior to combustion at 1000 °C in a Costech
elemental analyser to produce SO2. The SO
2 was carried by a helium stream into a Micromass
IsoChrom-IRMS to determine 34S (± 0.3 ‰). Alternatively, the purified BaSO4 was weighed
into a tin capsule prior to combustion in a HEKAtech pyrolysis furnace (1350 °C) to produce CO. The CO was then carried by a helium stream to a GVI IsoPrime-IRMS to determine 18O (± 0.5 ‰).
. 1000 (‰)– 1Rsample
Rstandardδ =
7
3.3.
The electrode potential relative to the standard hydrogen electrode (Eh) for the Fe(II)/Fe(III) couple is given by the activities of Fe2+ and Fe3+ in solution according to the Nernst equation, provided that the electrode-solution system is at equilibrium:
(3.2)
where E0 is the standard electrode potential for the Fe(II)/Fe(III) couple based on the standard hydrogen electrode, R is the gas constant, T is the temperature in Kelvin, F is the Faraday constant, 2.303 is a natural logarithm to common logarithm conversion factor, and [ ] refers to the activity of the ion.
If the concentrations of Fe(III) in solution are in equilibrium with ferrihydrite according to the reaction
(3.3)
the -log[Fe3+] can be deduced from the pH of the solution and the solubility product of ferrihy-drite K
s,F according to the mass action expression, giving:
-log[Fe3+] = 3pH - log Ks,F
(3.4)
Thus, if the Eh of the solution is controlled by the iron system the Eh can be expressed as:
(3.5)
Similarly, if the solution is in equilibrium with goethite:
(3.6)
the Eh expression can be written as a function of pH, log Ks,G
(logarithm of the solubility product of goethite) and log[Fe2+]. Whether ferrihydrite, goethite, or another form of hydroxide or hydroxysulphate is more likely to form in the drainage depends on the pH and Eh of the solution. These ferric phases can be conveniently understood under the term hydrous ferric oxide (HFO), originally applied by Dzombak and Morel (1990) and used here in the sense given by Nordstrom (2009). According to Bigham et al. (1996), HFO phases that are relevant to most acid mine waters are jarosite, ferrihydrite, schwertmannite and goethite.
Similar expressions of the Nernst equation as in equation (3.5) can be derived from the equilibrium with schwertmannite either as the end-member Fe
8O
8(OH)
6SO
4 (3.7) or
Fe8O
8(OH)
4.5(SO
4)1.75
(3.8) (end-members proposed by Bigham et al. 1996) or jarosite (3.9), which, together with ferrihydrite and goethite, were selected as the HFO phases considered most likely to precipitate at the site.
(3.7)
(3.8)
(3.9)
Using the modified expressions of the Nernst equation following the above procedure, the hy-pothesis that Fe(III) solubility in the water sample is controlled by a selected HFO phase can be tested by comparing measured Eh values to computed values. The log K
s values used in the
Fe(OH)3+ 3H+ Fe3++ 3H2O
- 2.303 log [ Fe2+])(3pH - log Ks,F +RTFEh=E0
FeOOH + 3H+ Fe3+ + 2H2O
+ H+ 22 SO4(OH)6O8Fe8 OH2 14SO42- 8Fe3+ ++
+ H+ 20.5 (SO4)1.75(OH)4.5O8Fe8 OH2 12.5SO42-1.75 8Fe3+ ++
KFe3 (SO4)2 (OH)6 + 6H+ 3Fe3++2SO42-
+ K+ + 6H2O
−=[ Fe3+][ Fe2+]log 303.2
FRTE0Eh
8
calculations were 4.891 for amorphous ferrihydrite (Ball and Nordstrom 1991), -1 for goethite (Nordstrom et al. 1990), 18 for schwertmannite (Bigham et al. 1996) and -9.21 for jarosite (Alpers et al. 1989).
3.4.
Geochemical modelling was performed with PHREEQC version 3 (Parkhurst and Appelo 2013) using the phreeqc.dat database, extended with thermodynamic data for chalcopyrite and sphalerite in the llnl.dat database and hydronium jarosite in the wateq4f.dat database (also available in the PHREEQC package). Thermodynamic data for schwertmannite and chlorite presented by Bigham et al. (1996) and Ball and Nordstrom (1991), respectively, were also used.
3.4.1. Speciation modelling
Speciation in all collected water samples was modelled. Activities of the major ions obtained were then used in the calculation of theoretical Eh values (see Section 3.3). For each considered mineral speciation modelling also returned a saturation index, defined as:
(3.10)
where IAP is the ion activity product and Ks is the solubility product of the mineral considered.
The charge imbalance (CI) value was also computed, according to:
(3.11)
where ‘cations’ and ‘anions’ refer to the molalities of cationic (anionic) species multiplied by their charge.
3.4.2. Inverse (mass-balance) modelling
Geochemical inverse modelling, or mass-balance modelling, calculates the mass transfers be-tween two or more phases along a flow path between an initial and a final location at a site (Zhu and Anderson 2002). Here, the flow paths investigated were located between an initial location represented by the background water (SB or GB), and a final location represented by one of four AMD locations (G1, G2, S1 and S3; Fig. 1b). Use of these flow paths was justified by the assumption that water at all AMD locations originated from some background water that can be represented by SB or GB, which exhibited very similar geochemistry. Formulated assumptions regarding the minerals present along the flow path between background water and AMD (i.e. in the backfilled waste rock) were supported by a review of old exploration drill core reports and published literature about the site and the nearby Kristineberg tailings mineralogy (Holmström et al. 2001; Höglund et al. 2004).
3.4.3. Forward modelling
Forward modelling was carried out, on the same flow paths as for the inverse model-ling, to determine the geochemistry of the mine water at the site assuming that the amount of oxygen available for sulphide oxidation is reduced to a defined value. For this, the EQUILIBRIUM_PHASES option of PHREEQC was applied, to allow equilibrium between
= log ( )KsIAPSI
= 100 x (cations – anions )(cations + anions )CI
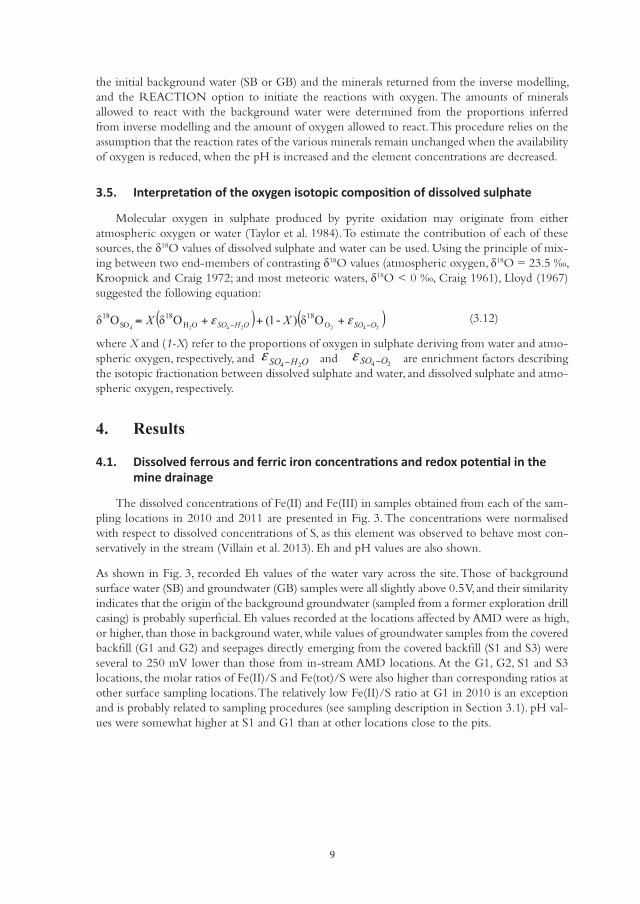
9
the initial background water (SB or GB) and the minerals returned from the inverse modelling, and the REACTION option to initiate the reactions with oxygen. The amounts of minerals allowed to react with the background water were determined from the proportions inferred from inverse modelling and the amount of oxygen allowed to react. This procedure relies on the assumption that the reaction rates of the various minerals remain unchanged when the availability of oxygen is reduced, when the pH is increased and the element concentrations are decreased.
3.5.
Molecular oxygen in sulphate produced by pyrite oxidation may originate from either atmospheric oxygen or water (Taylor et al. 1984). To estimate the contribution of each of these sources, the 18O values of dissolved sulphate and water can be used. Using the principle of mix-ing between two end-members of contrasting 18O values (atmospheric oxygen, 18O = 23.5 ‰, Kroopnick and Craig 1972; and most meteoric waters, 18O < 0 ‰, Craig 1961), Lloyd (1967) suggested the following equation:
(3.12)
where X and (1-X) refer to the proportions of oxygen in sulphate deriving from water and atmo-spheric oxygen, respectively, and and are enrichment factors describing the isotopic fractionation between dissolved sulphate and water, and dissolved sulphate and atmo-spheric oxygen, respectively.
4. Results
4.1.
The dissolved concentrations of Fe(II) and Fe(III) in samples obtained from each of the sam-pling locations in 2010 and 2011 are presented in Fig. 3. The concentrations were normalised with respect to dissolved concentrations of S, as this element was observed to behave most con-servatively in the stream (Villain et al. 2013). Eh and pH values are also shown.
As shown in Fig. 3, recorded Eh values of the water vary across the site. Those of background surface water (SB) and groundwater (GB) samples were all slightly above 0.5 V, and their similarity indicates that the origin of the background groundwater (sampled from a former exploration drill casing) is probably superficial. Eh values recorded at the locations affected by AMD were as high, or higher, than those in background water, while values of groundwater samples from the covered backfill (G1 and G2) and seepages directly emerging from the covered backfill (S1 and S3) were several to 250 mV lower than those from in-stream AMD locations. At the G1, G2, S1 and S3 locations, the molar ratios of Fe(II)/S and Fe(tot)/S were also higher than corresponding ratios at other surface sampling locations. The relatively low Fe(II)/S ratio at G1 in 2010 is an exception and is probably related to sampling procedures (see sampling description in Section 3.1). pH val-ues were somewhat higher at S1 and G1 than at other locations close to the pits.
( ) ( )2422424 O
18OH
18SO
18 Oδ)-1(OδOδ OSOOHSO XX −− +++= εε
24 OHSO 24 OSO
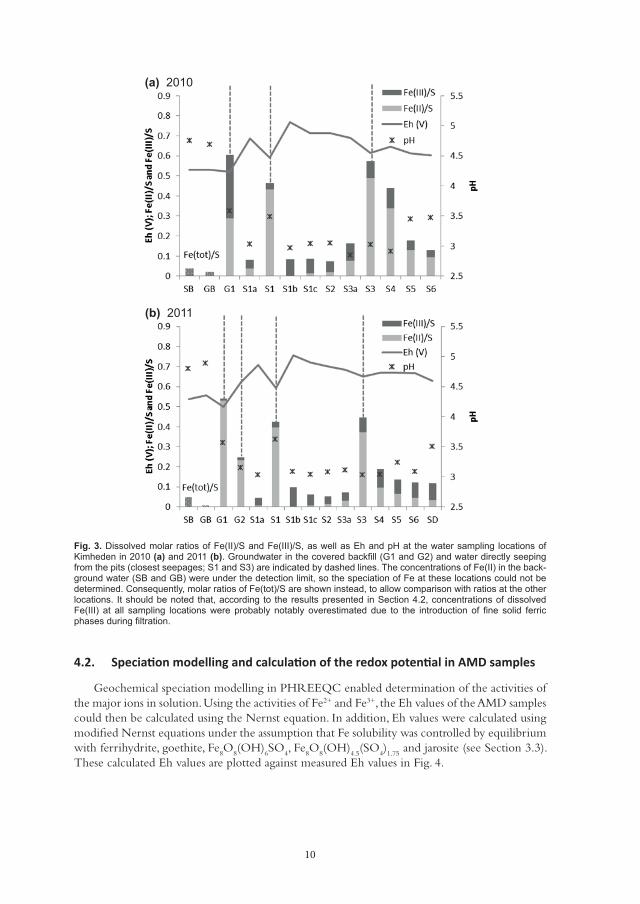
10
4.2.
Geochemical speciation modelling in PHREEQC enabled determination of the activities of the major ions in solution. Using the activities of Fe2+ and Fe3+, the Eh values of the AMD samples could then be calculated using the Nernst equation. In addition, Eh values were calculated using modified Nernst equations under the assumption that Fe solubility was controlled by equilibrium with ferrihydrite, goethite, Fe
8O
8(OH)
6SO
4, Fe
8O
8(OH)
4.5(SO
4)1.75
and jarosite (see Section 3.3). These calculated Eh values are plotted against measured Eh values in Fig. 4.
(a) 2010
Fig. 3. Dissolved molar ratios of Fe(II)/S and Fe(III)/S, as well as Eh and pH at the water sampling locations of Kimheden in 2010 (a) and 2011 (b) ro ndwater in the covered ac ll ( 1 and 2) and water directl seeping from the pits (closest seepages S1 and S ) are indicated dashed lines he concentrations of Fe(II) in the ac -ground water (SB and GB) were under the detection limit, so the speciation of Fe at these locations could not be determined onse uentl , molar ratios of Fe(tot)/S are shown instead, to allow comparison with ratios at the other locations. It should be noted that, according to the results presented in Section 4.2, concentrations of dissolved Fe(III) at all sampling locations were probabl notabl overestimated due to the introduction of ne solid ferric phases during ltration.
(b) 2011
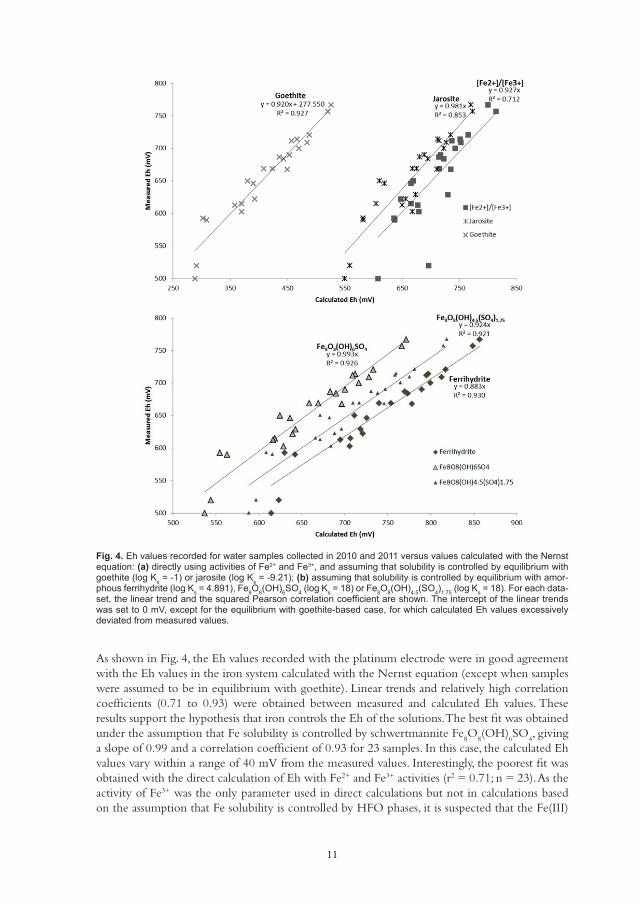
11
As shown in Fig. 4, the Eh values recorded with the platinum electrode were in good agreement with the Eh values in the iron system calculated with the Nernst equation (except when samples were assumed to be in equilibrium with goethite). Linear trends and relatively high correlation coefficients (0.71 to 0.93) were obtained between measured and calculated Eh values. These results support the hypothesis that iron controls the Eh of the solutions. The best fit was obtained under the assumption that Fe solubility is controlled by schwertmannite Fe
8O
8(OH)
6SO
4, giving
a slope of 0.99 and a correlation coefficient of 0.93 for 23 samples. In this case, the calculated Eh values vary within a range of 40 mV from the measured values. Interestingly, the poorest fit was obtained with the direct calculation of Eh with Fe2+ and Fe3+ activities (r2 = 0.71; n = 23). As the activity of Fe3+ was the only parameter used in direct calculations but not in calculations based on the assumption that Fe solubility is controlled by HFO phases, it is suspected that the Fe(III)
Fig. 4. Eh values recorded for water samples collected in 2010 and 2011 versus values calculated with the Nernst equation: (a) directl using activities of Fe2+ and Fe3+, and assuming that solubilit is controlled b equilibrium with goethite (log Ks = -1) or jarosite (log Ks = -9.21); (b) assuming that solubilit is controlled b equilibrium with amor-phous ferrih drite (log Ks = 4.891), Fe8O8(OH)6SO4 (log Ks = 18) or Fe8O8(OH)4.5(SO4)1.75 (log Ks = 18). For each data-set, the linear trend and the squared earson correlation coef cient are shown. he intercept of the linear trends was set to 0 m , e cept for the equilibrium with goethite-based case, for which calculated Eh values e cessivel deviated from measured values.
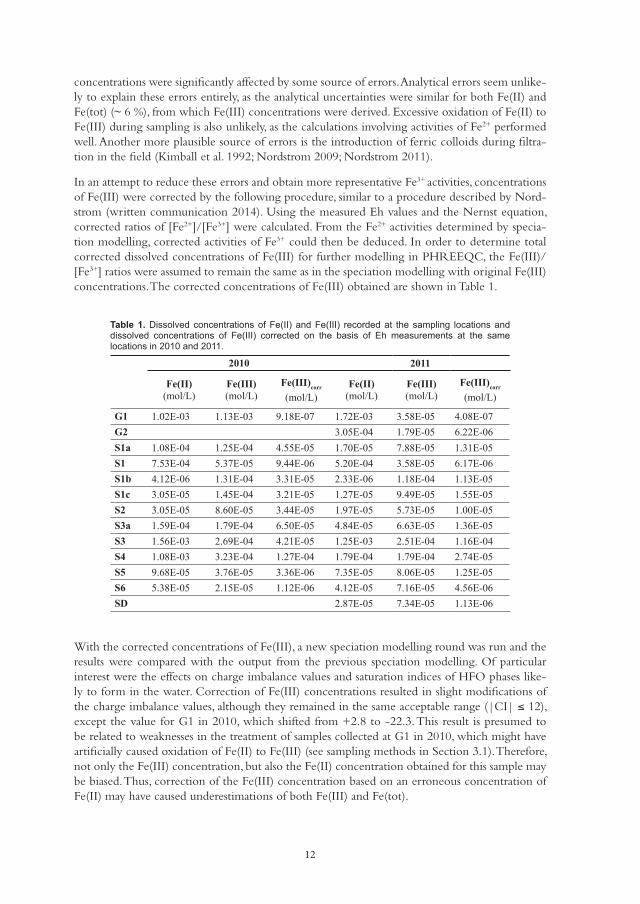
12
concentrations were significantly affected by some source of errors. Analytical errors seem unlike-ly to explain these errors entirely, as the analytical uncertainties were similar for both Fe(II) and Fe(tot) (~ 6 %), from which Fe(III) concentrations were derived. Excessive oxidation of Fe(II) to Fe(III) during sampling is also unlikely, as the calculations involving activities of Fe2+ performed well. Another more plausible source of errors is the introduction of ferric colloids during filtra-tion in the field (Kimball et al. 1992; Nordstrom 2009; Nordstrom 2011).
In an attempt to reduce these errors and obtain more representative Fe3+ activities, concentrations of Fe(III) were corrected by the following procedure, similar to a procedure described by Nord-strom (written communication 2014). Using the measured Eh values and the Nernst equation, corrected ratios of [Fe2+]/[Fe3+] were calculated. From the Fe2+ activities determined by specia-tion modelling, corrected activities of Fe3+ could then be deduced. In order to determine total corrected dissolved concentrations of Fe(III) for further modelling in PHREEQC, the Fe(III)/[Fe3+] ratios were assumed to remain the same as in the speciation modelling with original Fe(III) concentrations. The corrected concentrations of Fe(III) obtained are shown in Table 1.
Table 1. Dissolved concentrations of Fe(II) and Fe(III) recorded at the sampling locations and dissolved concentrations of Fe(III) corrected on the basis of Eh measurements at the same locations in 2010 and 2011.
2010 2011
Fe(II)(mol/L)
Fe(III)(mol/L)
Fe(III)corr
(mol/L)Fe(II)
(mol/L)Fe(III)(mol/L)
Fe(III)corr
(mol/L)
G1 1.02E-03 1.13E-03 9.18E-07 1.72E-03 3.58E-05 4.08E-07G2 3.05E-04 1.79E-05 6.22E-06S1a 1.08E-04 1.25E-04 4.55E-05 1.70E-05 7.88E-05 1.31E-05S1 7.53E-04 5.37E-05 9.44E-06 5.20E-04 3.58E-05 6.17E-06S1b 4.12E-06 1.31E-04 3.31E-05 2.33E-06 1.18E-04 1.13E-05S1c 3.05E-05 1.45E-04 3.21E-05 1.27E-05 9.49E-05 1.55E-05S2 3.05E-05 8.60E-05 3.44E-05 1.97E-05 5.73E-05 1.00E-05S3a 1.59E-04 1.79E-04 6.50E-05 4.84E-05 6.63E-05 1.36E-05S3 1.56E-03 2.69E-04 4.21E-05 1.25E-03 2.51E-04 1.16E-04S4 1.08E-03 3.23E-04 1.27E-04 1.79E-04 1.79E-04 2.74E-05S5 9.68E-05 3.76E-05 3.36E-06 7.35E-05 8.06E-05 1.25E-05S6 5.38E-05 2.15E-05 1.12E-06 4.12E-05 7.16E-05 4.56E-06SD 2.87E-05 7.34E-05 1.13E-06
With the corrected concentrations of Fe(III), a new speciation modelling round was run and the results were compared with the output from the previous speciation modelling. Of particular interest were the effects on charge imbalance values and saturation indices of HFO phases like-ly to form in the water. Correction of Fe(III) concentrations resulted in slight modifications of the charge imbalance values, although they remained in the same acceptable range (|CI| 12), except the value for G1 in 2010, which shifted from +2.8 to -22.3. This result is presumed to be related to weaknesses in the treatment of samples collected at G1 in 2010, which might have artificially caused oxidation of Fe(II) to Fe(III) (see sampling methods in Section 3.1). Therefore, not only the Fe(III) concentration, but also the Fe(II) concentration obtained for this sample may be biased. Thus, correction of the Fe(III) concentration based on an erroneous concentration of Fe(II) may have caused underestimations of both Fe(III) and Fe(tot).
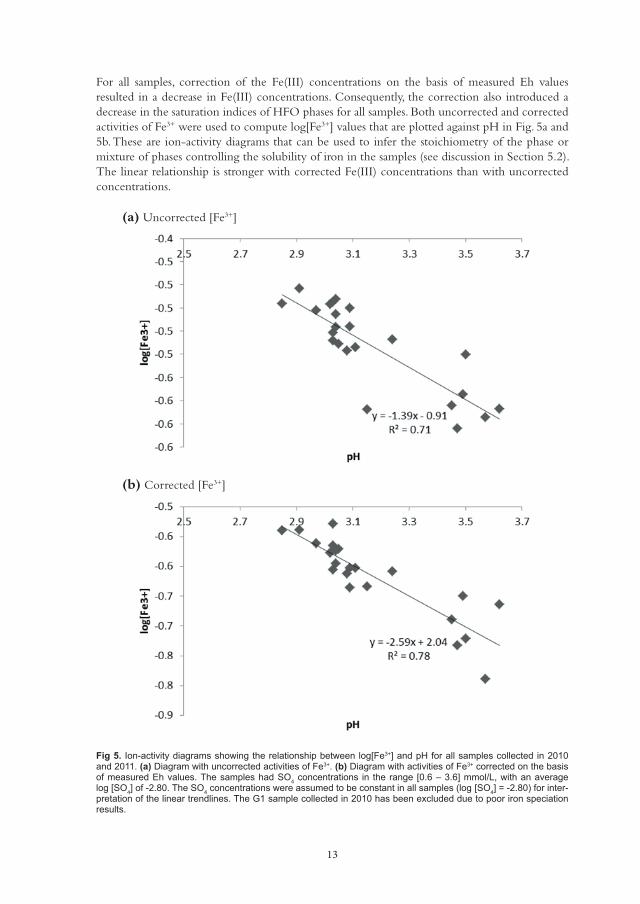
13
For all samples, correction of the Fe(III) concentrations on the basis of measured Eh values resulted in a decrease in Fe(III) concentrations. Consequently, the correction also introduced a decrease in the saturation indices of HFO phases for all samples. Both uncorrected and corrected activities of Fe3+ were used to compute log[Fe3+] values that are plotted against pH in Fig. 5a and 5b. These are ion-activity diagrams that can be used to infer the stoichiometry of the phase or mixture of phases controlling the solubility of iron in the samples (see discussion in Section 5.2). The linear relationship is stronger with corrected Fe(III) concentrations than with uncorrected concentrations.
Fig 5. Ion-activit diagrams showing the relationship between log Fe3+] and pH for all samples collected in 2010 and 2011. (a) Diagram with uncorrected activities of Fe3+. (b) Diagram with activities of Fe3+ corrected on the basis of measured Eh values. he samples had SO4 concentrations in the range 0.6 3.6] mmol/ , with an average log SO4] of -2.80. he SO4 concentrations were assumed to be constant in all samples (log SO4] = -2.80) for inter-pretation of the linear trendlines. he G1 sample collected in 2010 has been e cluded due to poor iron speciation results.
(a) Uncorrected [Fe3+]
(b) Corrected [Fe3+]
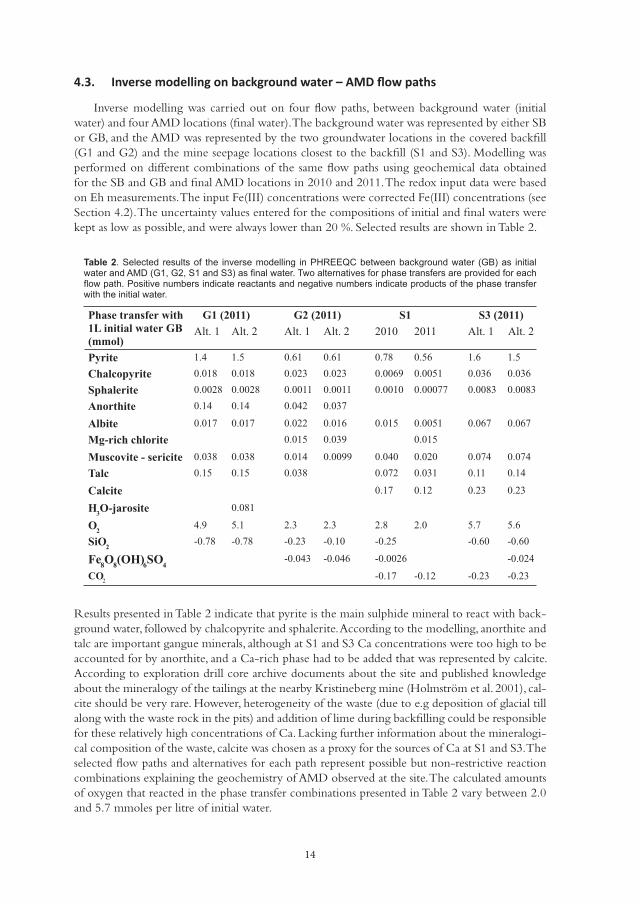
14
4.3.
Inverse modelling was carried out on four flow paths, between background water (initial water) and four AMD locations (final water). The background water was represented by either SB or GB, and the AMD was represented by the two groundwater locations in the covered backfill (G1 and G2) and the mine seepage locations closest to the backfill (S1 and S3). Modelling was performed on different combinations of the same flow paths using geochemical data obtained for the SB and GB and final AMD locations in 2010 and 2011. The redox input data were based on Eh measurements. The input Fe(III) concentrations were corrected Fe(III) concentrations (see Section 4.2). The uncertainty values entered for the compositions of initial and final waters were kept as low as possible, and were always lower than 20 %. Selected results are shown in Table 2.
Table 2. Selected results of the inverse modelling in PHREEQC between background water (GB) as initial water and D (G1, G2, S1 and S3) as nal water. wo alternatives for phase transfers are provided for each ow path. Positive numbers indicate reactants and negative numbers indicate products of the phase transfer
with the initial water.
Phase transfer with 1L initial water GB (mmol)
G1 (2011) G2 (2011) S1 S3 (2011)Alt. 1 Alt. 2 Alt. 1 Alt. 2 2010 2011 Alt. 1 Alt. 2
Pyrite 1.4 1.5 0.61 0.61 0.78 0.56 1.6 1.5Chalcopyrite 0.018 0.018 0.023 0.023 0.0069 0.0051 0.036 0.036Sphalerite 0.0028 0.0028 0.0011 0.0011 0.0010 0.00077 0.0083 0.0083Anorthite 0.14 0.14 0.042 0.037
Albite 0.017 0.017 0.022 0.016 0.015 0.0051 0.067 0.067Mg-rich chlorite 0.015 0.039 0.015
Muscovite - sericite 0.038 0.038 0.014 0.0099 0.040 0.020 0.074 0.074Talc 0.15 0.15 0.038 0.072 0.031 0.11 0.14
Calcite 0.17 0.12 0.23 0.23
H3O-jarosite 0.081
O24.9 5.1 2.3 2.3 2.8 2.0 5.7 5.6
SiO2-0.78 -0.78 -0.23 -0.10 -0.25 -0.60 -0.60
Fe8O8(OH)6SO4-0.043 -0.046 -0.0026 -0.024
CO2 -0.17 -0.12 -0.23 -0.23
Results presented in Table 2 indicate that pyrite is the main sulphide mineral to react with back-ground water, followed by chalcopyrite and sphalerite. According to the modelling, anorthite and talc are important gangue minerals, although at S1 and S3 Ca concentrations were too high to be accounted for by anorthite, and a Ca-rich phase had to be added that was represented by calcite. According to exploration drill core archive documents about the site and published knowledge about the mineralogy of the tailings at the nearby Kristineberg mine (Holmström et al. 2001), cal-cite should be very rare. However, heterogeneity of the waste (due to e.g deposition of glacial till along with the waste rock in the pits) and addition of lime during backfilling could be responsible for these relatively high concentrations of Ca. Lacking further information about the mineralogi-cal composition of the waste, calcite was chosen as a proxy for the sources of Ca at S1 and S3. The selected flow paths and alternatives for each path represent possible but non-restrictive reaction combinations explaining the geochemistry of AMD observed at the site. The calculated amounts of oxygen that reacted in the phase transfer combinations presented in Table 2 vary between 2.0 and 5.7 mmoles per litre of initial water.
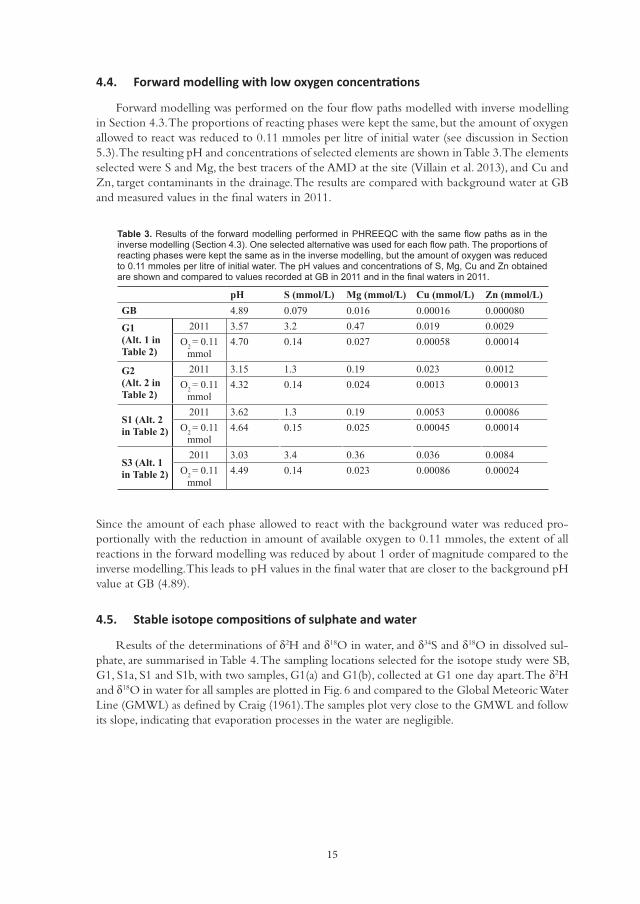
15
4.4.
Forward modelling was performed on the four flow paths modelled with inverse modelling in Section 4.3. The proportions of reacting phases were kept the same, but the amount of oxygen allowed to react was reduced to 0.11 mmoles per litre of initial water (see discussion in Section 5.3). The resulting pH and concentrations of selected elements are shown in Table 3. The elements selected were S and Mg, the best tracers of the AMD at the site (Villain et al. 2013), and Cu and Zn, target contaminants in the drainage. The results are compared with background water at GB and measured values in the final waters in 2011.
Table 3. Results of the forward modelling performed in PHREEQC with the same ow paths as in the inverse modelling (Section 4.3). One selected alternative was used for each ow path. he proportions of reacting phases were kept the same as in the inverse modelling, but the amount of o gen was reduced to 0.11 mmoles per litre of initial water. he pH values and concentrations of S, g, Cu and n obtained are shown and compared to values recorded at GB in 2011 and in the nal waters in 2011.
pH S (mmol/L) Mg (mmol/L) Cu (mmol/L) Zn (mmol/L)GB 4.89 0.079 0.016 0.00016 0.000080
G1(Alt. 1 in Table 2)
2011 3.57 3.2 0.47 0.019 0.0029O2 = 0.11
mmol4.70 0.14 0.027 0.00058 0.00014
G2(Alt. 2 in Table 2)
2011 3.15 1.3 0.19 0.023 0.0012O2 = 0.11
mmol4.32 0.14 0.024 0.0013 0.00013
S1 (Alt. 2 in Table 2)
2011 3.62 1.3 0.19 0.0053 0.00086O2 = 0.11
mmol4.64 0.15 0.025 0.00045 0.00014
S3 (Alt. 1 in Table 2)
2011 3.03 3.4 0.36 0.036 0.0084O2 = 0.11
mmol4.49 0.14 0.023 0.00086 0.00024
Since the amount of each phase allowed to react with the background water was reduced pro-portionally with the reduction in amount of available oxygen to 0.11 mmoles, the extent of all reactions in the forward modelling was reduced by about 1 order of magnitude compared to the inverse modelling. This leads to pH values in the final water that are closer to the background pH value at GB (4.89).
4.5.
Results of the determinations of 2H and 18O in water, and 34S and 18O in dissolved sul-phate, are summarised in Table 4. The sampling locations selected for the isotope study were SB, G1, S1a, S1 and S1b, with two samples, G1(a) and G1(b), collected at G1 one day apart. The 2H and 18O in water for all samples are plotted in Fig. 6 and compared to the Global Meteoric Water Line (GMWL) as defined by Craig (1961). The samples plot very close to the GMWL and follow its slope, indicating that evaporation processes in the water are negligible.
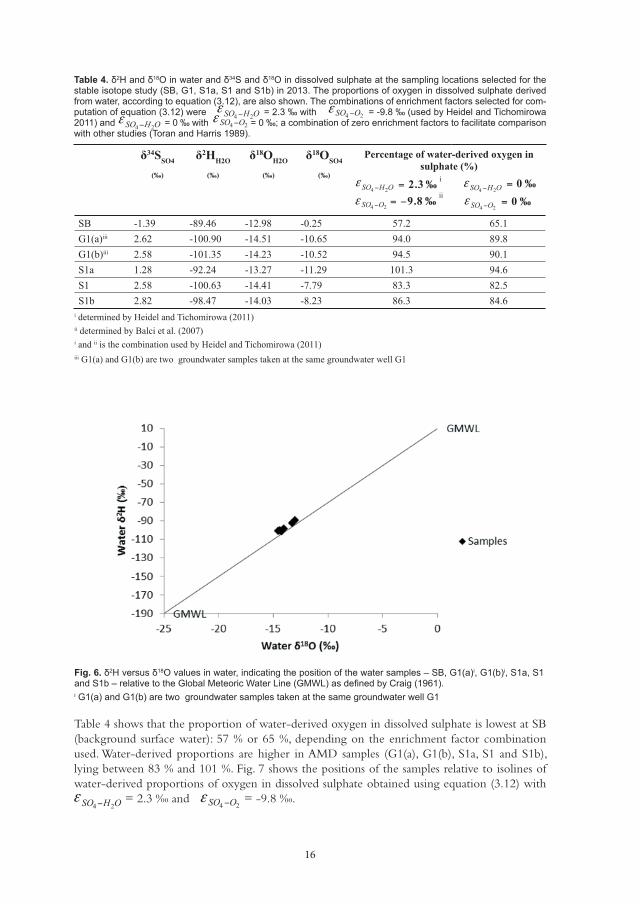
16
Table 4 shows that the proportion of water-derived oxygen in dissolved sulphate is lowest at SB (background surface water): 57 % or 65 %, depending on the enrichment factor combination used. Water-derived proportions are higher in AMD samples (G1(a), G1(b), S1a, S1 and S1b), lying between 83 % and 101 %. Fig. 7 shows the positions of the samples relative to isolines of water-derived proportions of oxygen in dissolved sulphate obtained using equation (3.12) with = 2.3 ‰ and = -9.8 ‰.
Table 4. 2H and 18O in water and 34S and 18O in dissolved sulphate at the sampling locations selected for the stable isotope stud (SB, G1, S1a, S1 and S1b) in 2013. he proportions of o gen in dissolved sulphate derived from water, according to equation (3.12), are also shown. he combinations of enrichment factors selected for com-putation of equation (3.12) were = 2.3 with = -9.8 (used b Heidel and ichomirowa 2011) and = 0 ‰ with = 0 ‰; a combination of zero enrichment factors to facilitate comparison with other studies ( oran and Harris 1989).
i determined by Heidel and Tichomirowa (2011)ii determined by Balci et al. (2007)i and ii is the combination used by Heidel and Tichomirowa (2011)iii G1(a) and G1(b) are two groundwater samples taken at the same groundwater well G1
δ34SSO4
(‰)
δ2HH2O
(‰)
δ18OH2O
(‰)
δ18OSO4
(‰)
Percentage of water-derived oxygen in sulphate (%)
i
ii
SB -1.39 -89.46 -12.98 -0.25 57.2 65.1G1(a)iii 2.62 -100.90 -14.51 -10.65 94.0 89.8G1(b)iii 2.58 -101.35 -14.23 -10.52 94.5 90.1S1a 1.28 -92.24 -13.27 -11.29 101.3 94.6S1 2.58 -100.63 -14.41 -7.79 83.3 82.5S1b 2.82 -98.47 -14.03 -8.23 86.3 84.6
‰3.224=− OHSOε
‰8.924
−=−OSOε‰0
24=− OHSOε
‰024=−OSOε
Fig. 6. 2H versus 18O values in water, indicating the position of the water samples SB, G1(a)i, G1(b)i, S1a, S1 and S1b relative to the Global eteoric ater ine (G ) as de ned b Craig (1961).i G1(a) and G1(b) are two groundwater samples taken at the same groundwater well G1
24 OHSO 24 OSO
24 OHSO 24 OSO24 OHSO 24 OSO
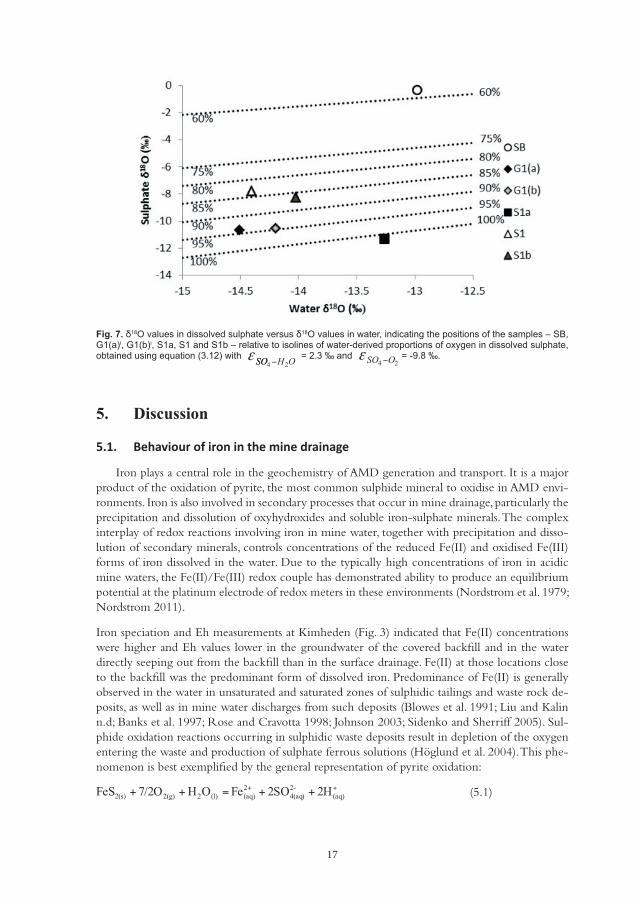
17
5. Discussion
5.1.
Iron plays a central role in the geochemistry of AMD generation and transport. It is a major product of the oxidation of pyrite, the most common sulphide mineral to oxidise in AMD envi-ronments. Iron is also involved in secondary processes that occur in mine drainage, particularly the precipitation and dissolution of oxyhydroxides and soluble iron-sulphate minerals. The complex interplay of redox reactions involving iron in mine water, together with precipitation and disso-lution of secondary minerals, controls concentrations of the reduced Fe(II) and oxidised Fe(III) forms of iron dissolved in the water. Due to the typically high concentrations of iron in acidic mine waters, the Fe(II)/Fe(III) redox couple has demonstrated ability to produce an equilibrium potential at the platinum electrode of redox meters in these environments (Nordstrom et al. 1979; Nordstrom 2011).
Iron speciation and Eh measurements at Kimheden (Fig. 3) indicated that Fe(II) concentrations were higher and Eh values lower in the groundwater of the covered backfill and in the water directly seeping out from the backfill than in the surface drainage. Fe(II) at those locations close to the backfill was the predominant form of dissolved iron. Predominance of Fe(II) is generally observed in the water in unsaturated and saturated zones of sulphidic tailings and waste rock de-posits, as well as in mine water discharges from such deposits (Blowes et al. 1991; Liu and Kalin n.d; Banks et al. 1997; Rose and Cravotta 1998; Johnson 2003; Sidenko and Sherriff 2005). Sul-phide oxidation reactions occurring in sulphidic waste deposits result in depletion of the oxygen entering the waste and production of sulphate ferrous solutions (Höglund et al. 2004). This phe-nomenon is best exemplified by the general representation of pyrite oxidation:
(5.1)
Fig. 7. 18O values in dissolved sulphate versus 18O values in water, indicating the positions of the samples SB, G1(a)i, G1(b)i, S1a, S1 and S1b relative to isolines of water-derived proportions of o gen in dissolved sulphate, obtained using equation (3.12) with = 2.3 ‰ and = -9.8 ‰.
24 OHSOSO 24 OSO
++ ++=++ (aq)-2
4(aq)2(aq)(l)22(g)2(s) 2H 2SO Fe OH 7/2O FeS
18
This reaction will produce 0.5 molar ratios of Fe(II)/S. This is the ratio observed in water direct-ly seeping from the backfill when no further oxidation has occurred during sampling (Fig. 3), which is consistent with the hypothesis that ongoing pyrite oxidation is occurring in the backfill. In mildly acidic (pH>3.5) and well-oxygenated mine waters, the ferrous iron produced can be further oxidised, hydrolysed and precipitated in various types of HFO phases, among which the most general representation is ferrihydrite (Fe(OH)
3), according to the reaction:
(5.2)
This reaction will decrease the Fe(II)/S ratios to varying degrees depending on the extent of the reaction. At Kimheden lower ratios were found in surface drainage than in groundwater and seepages close to the backfill (see Fig. 3), illustrating effects of precipitation of HFO when water leaves the waste deposit. Another typical effect of the reaction is the decrease in pH due to the generation of protons. The separation in time and place of reactions (5.1) and (5.2) explains why higher concentrations of Fe(II) in the groundwater backfill contribute latent acidity (Höglund et al. 2004) to the mine water. This phenomenon is common in mine waste deposits, thus the higher concentrations of Fe(II) and lower Eh values at sampling locations close to the pits do not provide evidence for the inhibition of oxygen ingress by the dry cover.
5.2.
As emphasised by Nordstrom (2000), valid application of the Nernst equation relating the Eh of a solution to the activities of the reduced and oxidised species of a particular redox couple requires fulfilment of several assumptions related to the attainment of equilibrium in the system consisting of the electrode and ions in the solution. This implies practical limitations concerning the electrode itself, which should be an electrochemically conductive but non-reactive metal, typically platinum, that is not covered by coatings. However, as Nordstrom (2000) points out, the greatest limitation lies in the ability of the species in solution to attain electrochemical equilib-rium with the metal, which, in the case of the Fe(II)/Fe(III) couple, requires concentrations of dissolved Fe of at least ca. 10-5 mol/L. In the measurements reported here this prerequisite should have been satisfied, as the concentrations of dissolved Fe in the mine drainage are higher than 10-5 mol/L, typically around 10-4 mol/L. The condition was not satisfied, however, at background sampling locations SB and GB (where Fe concentrations are 10-6 mol/L or lower). At low con-centrations of Fe in water, the iron species are not sufficiently electroactive and the effects of mixed potentials, particularly with oxygen, may affect the measured Eh (Nordstrom 2000). At concentrations above 10-5 mol/L, these effects will be weaker and the Fe(II)/Fe(III) couple can be expected to control the redox potential of the solution.
The comparison of measured and calculated Eh values at Kimheden (Fig. 4) indicated that the iron system dominated the redox state of the water. The Eh measurements enabled a correction of Fe(III) concentrations, which seemed to be affected by an important source of error (see Section 4.2). Correction resulted in lower saturation indices for all HFOs considered. Apparent excessive supersaturation in water samples due to the introduction of colloids may in fact be a common phenomenon in acidic mine waters (Kimball et al. 1992; Nordstrom 2009; Nordstrom 2011). Correction of the Fe(III) concentrations also resulted in a stronger linear relationship between log[Fe3+] and pH (Fig. 5; r2 = 0.78 compared to r2 = 0.71 before correction). The equation of the trendline obtained:
log[Fe3+] = 2.04 – 2.59 pH (5.3)
++ +=++ (aq)3(s)(l)22(g)2(aq) 2H Fe(OH) O5/2H 1/4O Fe

19
is very close to the one proposed by Bigham et al. (1996) for schwertmannite (log[Fe3+] = 2.67 – 2.60 pH). In the cited study the slope of 2.60 corresponded to the mean observed stoichiometry of schwertmannite: Fe
8O
8(OH)
4.8(SO
4)1.6
. The intercept of 2.04 obtained here, together with an average log[SO
42-] of -2.80 in the samples and a slope of 2.59, gives a log IAP of 11.7 which falls
into the solubility window of schwertmannite, log IAP = 10.5 ± 2.5, proposed by Yu et al. (1999).
The hypothesis that the solubility of schwertmannite controls the iron chemistry of the mine drainage at Kimheden seems quite reasonable, as schwertmannite is a widespread secondary min-eral in AMD environments (Bigham 1994; Bigham et al. 1994). Furthermore, the range of pH observed in the mine drainage at the site in 2010 – 2011 (2.9 to 3.7) is within the range of 2.5 to 5.5 proposed by Bigham et al. (1996) for acidic mine waters predominantly influenced by schwertmannite precipitation. According to these authors, the lower pH limit is governed by jarosite precipitation, and the upper limit by ferrihydrite precipitation. The precipitates present in the sediments of a stream draining a tailings pond at the nearby Kristineberg mine (where the tailings are presumed to have similar mineralogy to the waste rock in the backfill at Kimheden) are reportedly dominated by schwertmannite, evolving with time into goethite (Lindegren et al. 2011). Nevertheless, with limited numbers of samples to derive the log equilibrium constant equation (5.3) at Kimheden (n = 23), any conclusion about the hypothesis that schwertmannite with a stoichiometry of Fe
8O
8(OH)
4.8(SO
4)1.6
is the primary phase controlling the solubility of iron in all samples would be too hasty. Mixtures of phases with different stoichiometries (Bigham and Nordstrom 2000) or variations in stoichiometries across the site could also produce the ion-activity plot observed in Fig. 5b. However, regardless of the exact nature of the HFO phase(s) affecting the solubility of iron in the mine water at Kimheden, the important effects of these phases on the geochemistry of water remain similar. HFO minerals generate protons upon pre-cipitation in the mine drainage (see Section 5.1) and, when dissolved, they may be a source of Fe(III) that participates in sulphide oxidation (see Section 5.4).
5.3.
Rosén and Wilske (1994) formulated objectives for the planned completion of reclamation at Kimheden in terms of maximum target Cu and Zn concentrations in the drainage (combined concentrations under 1 mg/L at SO or S1, see Fig. 1b). Based on performance models for com-posite till covers provided by the Swedish Environmental Protection Agency (SEPA 1993), they concluded that applying such a cover over the backfilled pits would be the best alternative to fulfil the long-term objectives. Comparison of the target concentrations with geochemical data ob-tained in 2009 – 2010, 14 years after completion of the reclamation measures, showed that these objectives were partially fulfilled, but despite large reductions in Cu and Zn concentrations the geochemistry of the drainage from the mine had been in a steady-state for at least a decade, and concentrations discharged to the surrounding environment were still not acceptable (Villain et al. 2013). As the primary aim of the reclamation measures was to limit amounts of oxygen reaching the sulphidic waste through backfilling and capping, knowledge of the actual amounts consumed by the sulphides in the waste is essential to assess the adequacy of the works. Höglund et al. (2004) estimated the rate of oxygen diffusion through a well-functioning 0.3 m sealing layer of the type used at Kimheden to be ~ 1 mol/m2, yr. In what we will call ‘ideal conditions’, diffusion through the cover will provide all the oxygen reaching the backfilled waste, and migration through frac-tures in the pit walls will contribute negligible amounts, as assumed by Rosén and Wilske (1994). Furthermore, we assume that all the oxygen that diffuses through the dry cover will eventually be dissolved in the groundwater of the backfill and available for sulphide oxidation. For backfilled open pit 1, with a surface area of 4 560 m2 and a mean water discharge rate of 1.3 L/s, derived

20
from a water balance using 45-year precipitation data (Villain et al. 2014), this implies that the maximum concentration of oxygen in the groundwater of the backfill would be ca. 0.11 mmol/L in ‘ideal conditions’. Besides, a range of feasible oxygen saturation values in the backfill ground-water of 0.22 - 0.41 mmol/L was determined using DOTABLES (USGS 2014) software, based on recorded temperatures and electrical conductivities of the water sampled in the backfill and atmospheric data in the region (SMHI 2014). Given this range, a dissolved oxygen concentration of 0.11 mmol/L in the groundwater is feasible. Furthermore, some of the oxygen would probably be consumed by respiration of organic matter in the cover and the backfill, as backfill samples collected in 2014 had an average total organic carbon (TOC) content of 4.5 % (unpublished data). Therefore, the concentration of dissolved oxygen available for sulphide oxidation in ‘ideal conditions’ would certainly be even lower.
In contrast with the 0.11 mmol/L of oxygen available in the backfill under ‘ideal’ conditions, in-verse modelling performed on background water – AMD flow paths at Kimheden indicated that more than 2 mmoles of oxygen was consumed by sulphide oxidation per litre of reacted water (Table 2). The AMD locations selected for modelling were either wells for sampling groundwater in the backfill (G1 and G2) or sites of direct seepage from the backfill (S1 and S3). Thus, the sul-phide oxidation reactions inferred from inverse modelling are expected to have occurred within the covered backfill. Villain et al. (2014) showed that oxidation products formed in the waste rock prior to reclamation are unlikely to have had any measurable influence on the quality of the drainage released from the backfilled open pits in recent years. However, they observed increased concentrations of metals and sulphate in periods of high flows punctuating low-flow periods, typically due to snow melting (so-called spring floods), indicative of store-and-release effects in the backfill. The 2010 and 2011 samplings were conducted during autumn, and concentrations of S and Fe at S1 and G1 in September 2011 were the lowest observed at these locations at any sampling time from 2009 to 2013. This was presumably due to dilution processes, as August and September were remarkably wet that year. Thus, it was assumed that the concentrations in 2010 and 2011 used in inverse modelling could represent steady-state concentrations in the water from the backfill, with little risk of overestimation due to store-and-release effects. Therefore, the extent of sulphide oxidation per litre of water inferred from the S concentrations used in the inverse modelling could be fairly safely related to oxygen-controlled sulphide oxidation (regardless of the nature of the oxidant directly reacting with sulphides). Consequently, more than 2 mmoles of oxygen was consumed by sulphide oxidation per litre of reacted water according to the inverse modelling, implying that the amount of oxygen available for sulphide oxidation in the backfill is at least an order of magnitude higher than in ‘ideal conditions’.
Forward modelling on the same flow paths as in the inverse modelling with a reduced amount of oxygen of 0.11 mmoles per litre of initial water allowed determination of the characteristics of the mine water under ‘ideal conditions’ (Table 3). The results show that if the dissolved oxygen concentration available for sulphide oxidation was limited to 0.11 mmol/L and the proportions of other phases allowed to react were reduced proportionately, the pH of the mine water in the backfill and close seepages would be roughly 1 unit higher than observed in 2011 and concen-trations of the selected elements would be at least an order of magnitude lower. These ‘ideal’ con-centrations are classified as ‘low’ to ‘moderately high’ concentrations for groundwater according to the Geological Survey of Sweden (SGU 2013). Furthermore, the considerable increase in pH would result in larger proportions of Cu and Zn being retained by sorption (Lee et al. 2002), which would further reduce the concentrations. However, these modelled concentrations should only be regarded as trends to be compared with actual concentrations rather than specific attain-able objectives.
21
5.4.
The 34S values of the dissolved sulphate in the samples (Table 4) all lie within the range of published values (-2.3 ‰ to 4.7 ‰) for sulphide deposits in the Skellefte district, which includes the Kimheden site (Wagner et al. 2004). As sulphide oxidation generally results in minor frac-tionation of sulphur isotopes (Seal 2003), this finding is consistent with the assumption that most of the dissolved sulphate in water samples at Kimheden was produced by oxidation of sulphides. Furthermore, the obtained 2H and 18O ratios in water are very close to the GWML (Fig. 6), indicating that evaporation of the water was negligible, as required for use of sulphate isotope distributions to interpret sulphide oxidation environments (Seal 2003). Thus, the stable isotope data obtained were deemed suitable for evaluating processes involved in the oxidation of pyrite, the dominant sulphide mineral reacting in the waste rock (see Section 4.3) at the site.
The proportions of oxygen derived from water and atmospheric oxygen in dissolved sulphate (Table 4) depend on the values of the enrichment factors SO
4-H
2O and SO
4-O
2 according to
equation (3.12). As specific enrichment factors for the samples at the site are not known, sev-eral combinations of published values for stable isotopes in pyrite oxidation were tested. The
SO4-H
2O values used in the combinations were from Heidel and Tichomirowa (2011) (2.3 ‰, for
abiotic anaerobic oxidation) and Balci et al. (2007) (2.8 ‰, for abiotic aerobic oxidation; 3.6 ‰, for biological anaerobic oxidation; 4 ‰, for biological aerobic oxidation). The SO
4-O
2
values used were from Balci et al. (2007) (-9.8 ‰, for abiotic aerobic oxidation; -10.8 ‰, for biological aero-bic oxidation) and Taylor et al. (1984) (-4.3 ‰, for abiotic aerobic oxidation). SO
4-H
2O and SO
4-O
2
enrichment factors of 0 ‰ were also used, as recommended by Toran and Harris (1989), to allow comparison between different studies. Enrichment factors SO
4-H
2O > 3 ‰ seemed too high,
as the water sample at S1a would have proportions of water-derived oxygen excessively higher than 100 %. Heidel and Tichomirowa (2011), who used a combination of enrichment factors of
SO4-H
2O = 2.3 ‰ and SO
4-O
2 = -9.8 ‰, drew the same conclusion from analyses of pyrite oxida-
tion in anaerobic and low-oxygen conditions with, in particular, low and moderate Fe(III) con-centrations, which are likely to represent conditions in the backfilled waste rock at Kimheden. Thus, the same combination was used for interpreting the results obtained for the Kimheden site (Table 4).
A classical interpretation of the proportions of water-derived oxygen in sulphate in AMD systems is based on aeration of the environment hosting pyrite (Taylor et al. 1984; Taylor and Wheeler 1994; Haubrich and Tichomirowa 2002; Seal 2003; Pellicori et al. 2005; Balci et al. 2007). In this context, high proportions of water-derived oxygen in sulphate indicate a strong influence of pyrite oxidation with Fe(III) and limited oxygen availability, while lower proportions indicate stronger influence of direct oxidation by oxygen and hence more aerated conditions. However, the boundary between ‘high’ and ‘low’ proportions of water-derived oxygen is unclear: Taylor and Wheeler (1994) suggested that high water-derived proportions of oxygen found in sulphate in oxygen-depleted environments should fall between 50 % and 80 %, but Balci et al. (2007) found that proportions were consistently higher than this under aerobic conditions.
The samples collected at Kimheden represented groundwater in the covered backfill (G1(a) and G1(b)), surface water draining from the backfill (S1a, S1 and S1b) and background surface water (SB). Thus, with the exception of SB, situated upstream of the open pits, the dissolved sulphate in all the sampled waters is assumed to originate from pyrite oxidation in the backfill. Thus, the proportions of water-derived oxygen (83 % to 101 %) in the dissolved sulphate in these samples (Table 4) indicate that conditions in the backfill range from aerated to anoxic, according to the
22
studies cited above. In addition, the proportion of water-derived oxygen in dissolved sulphate in water sampled at the background surface location SB (57 %), is clearly indicative of aerated conditions.
Recent studies have sometimes revealed contradictions using this classical interpretation in terms of aeration of the oxidation environment. Indeed, in some instances, high proportions of water-derived oxygen in sulphate may be better explained by high concentrations of Fe(III) rather than anoxic conditions (Nordstrom et al. 2007; Seal et al. 2008). The work of Heidel and Tichomirowa (2011) is instructive in this regard. These authors found that high proportions of water-derived oxygen in sulphate correlated most strongly with high Fe(III)/pyrite surface ratios. They suggested that at AMD sites high 18O values (and hence low proportions of water-derived oxygen) in sulphate may indicate unsaturated conditions that allow oxygen adsorption on pyrite surfaces. For the sampling locations used in the present study, this would pertain to SB and, to a lesser extent, S1 and S1b. In contrast, 18O values implying that nearly all of the sulphate oxygen was water-derived – as found for G1(a), G1(b) and S1a samples – would indicate high Fe(III)/pyrite surface ratios. However, oxidation products in the form of iron-sulphate minerals or HFO minerals formed prior to reclamation and stored in the backfilled waste rock are expected to have mostly or completely washed out by 2010 (Villain et al. 2014). Therefore, high Fe(III)/pyrite surface ratios would still necessitate constant rejuvenation of the Fe(III) through ongoing oxygen supply in the backfill.
The isotopic results tend to indicate that conditions in the covered backfill are aerated to some extent, in agreement with previous dissolved oxygen concentration measurements in the ground-water at G1 (2 – 3 mg/L, Villain et al. 2013), and the discussion in Section 5.3.
6. Conclusions Iron speciation data and measurements of Eh in the AMD at Kimheden some 15 years after reclamation showed that the Eh in the water is governed by the iron system. Field Eh measure-ments showed good correlation with calculated Eh values when Fe(III) was assumed to be in equilibrium with several selected HFO phases. Calculations directly involving Fe(III) concentra-tions returned poorer fits, possibly due to the introduction of fine ferric solid phases (colloids) in the sample water despite on-site filtration.
Following a correction of dissolved Fe(III) concentrations based on field Eh measurements, the relationship between Fe3+ activities and pH moved closer to a theoretical relationship based on the equilibrium of Fe with a schwertmannite-like phase or a mixture of HFOs. A clear decrease in dissolved concentrations of Fe(II) with downstream progression of the mine drainage in the collection ditch also indicated precipitation of HFOs in the water. This phenomenon results in the expression of latent acidity stored in Fe(II) in the backfill as pH reductions in the stream.
Quantification of sulphide oxidation rates inferred from inverse modelling computations in groundwater and water seeping out from the open pits showed that rates in the backfill are at least an order of magnitude higher than calculated rates based on the dry cover design specifications. If the design requirements had been met, the pH in the mine water would be higher and the metal concentrations would notably decrease in the long term, according to forward modelling results.
The isotopic composition of dissolved sulphate in the groundwater and water seeping from one of the backfilled open pits suggests that Fe(III) is a major oxidant of the pyrite oxidation in the backfill, and thus may be constantly rejuvenated. However, the results also suggest that non- negligible fractions of oxygen directly react with pyrite in some regions of the backfill.
23
Acknowledgements The 2010 – 2011 geochemical investigations presented in this study were financed by the European Union’s Structural Funds through the non-profit organisation Georange in Sweden. The 2013 isotope investigation study was financed by the CAMM programme at Luleå University of technology (LTU) in Sweden. We would like to thank Dr. D. Kirk Nordstrom for graciously providing us with a clarification of some important redox mechanisms. We are grateful for the help provided by Bert-Sive Lindmark at Bergteamet and Dr. Yu Jia previously at LTU during sampling at the site in 2010 and 2011. Milan Vnuk at LTU is thanked for his help with the figures.
ReferencesAllen, R. L., Weihed, P., & The Global VHMS Research Project Team (2002). Global comparisons
of volcanic-associated massive sulphide districts. Geological Society, London, Special Publications, 204(1), 13-37.
Alpers, C. N., Nordstrom, D. K., & Ball, J. W. (1989). Solubility of jarosite solid solutions precip-itated from acid mine waters, Iron Mountain, California, USA. Sciences Géologiques. Bulletin, 42(4), 281-298.
Alpers, C. N., & Nordstrom, D. K. (1999). Geochemical modeling of water-rock interactions in mining environments. The environmental geochemistry of mineral deposits. Part A: processes, tech-niques, and health issues. Reviews in Economic Geology A, 6, 289-323.
Andersson, G. (1988). Kimheden, miljöåtgärder. Boliden Mineral AB’s internal report.
Årebäck, H., Barrett, T. J., Abrahamsson, S., & Fagerström, P. (2005). The Palaeoproterozoic Kris-tineberg VMS deposit, Skellefte district, northern Sweden, part I: geology. Mineralium Deposita, 40(4), 351-367.
Balci, N., Shanks III, W. C., Mayer, B., & Mandernack, K. W. (2007). Oxygen and sulfur isotope systematics of sulfate produced by bacterial and abiotic oxidation of pyrite. Geochimica et Cos-mochimica Acta, 71(15), 3796-3811.
Ball J. W. and Nordstrom D. K. (1991) User’s manual for WATEQ4F, with revised thermodynamic data base and test cases for calculating speciation of major, trace, and redox elements in natural waters. USGS Open-File Report 91-183.
Banks, D., Burke, S. P., & Gray, C. G. (1997). Hydrogeochemistry of coal mine drainage and other ferruginous waters in north Derbyshire and south Yorkshire, UK. Quarterly Journal of Engineer-ing Geology and Hydrogeology, 30(3), 257-280.
Bigham, J. M. (1994). Mineralogy of ochre deposits formed by sulfide oxidation. In D. W. Blowes, J. L. Jambor, & C. N. Alpers. Environmental Geochemistry of Sulfide Mine-Wastes, Short Course Series (Vol. 22, pp. 103-132). Waterloo, Ontario, Canada: Mineralogical Association of Canada.
Bigham, J. M., Carlson, L., & Murad, E. (1994). Schwertmannite, a new iron oxyhydroxysulphate from Pyhäsalmi, Finland, and other localities. Mineralogical Magazine, 58(393), 641-648.
Bigham, J. M., Schwertmann, U., Traina, S. J., Winland, R. L., & Wolf, M. (1996). Schwertman-nite and the chemical modeling of iron in acid sulfate waters. Geochimica et Cosmochimica Acta, 60(12), 2111-2121.
24
Bigham, J. M., & Nordstrom, D. K. (2000). Iron and aluminum hydroxysulfates from acid sulfate waters. Reviews in Mineralogy and Geochemistry, 40(1), 351-403.
Blowes, D. W., Reardon, E. J., Jambor, J. L., & Cherry, J. A. (1991). The formation and potential importance of cemented layers in inactive sulfide mine tailings. Geochimica et Cosmochimica Acta, 55(4), 965-978.
Craig, H. (1961). Isotopic variations in meteoric waters. Science, 133(3465), 1702-1703.
Dzombak, D. A., & Morel, F. M. M. (1990). Surface complexation modeling: hydrous ferric oxide. John Wiley & Sons.
Edström & Schönfeldt AB (1996). Kristinebergsgruvan, Efterbehandlingsarbeten. Edström & Schönfeldt AB and Boliden Mineral AB, Sweden. Boliden Mineral AB’s internal report.
Encyclopedia Britannica (2014) Continental subarctic climate. In Encyclopedia Britannica online. http://global.britannica.com/EBchecked/topic/134997/continental-subarctic-climate. Last Accessed 24 Oct 2014.
Hallberg, R. O., Granhagen, J. R., & Liljemark, A. (2005). A fly ash/biosludge dry cover for the mitigation of AMD at the Falun mine. Chemie der Erde – Geochemistry, 65, 43-63.
Hannington, M. D., Kjarsgaard, I. M., Galley, A. G., & Taylor, B. (2003). Mineral-chemical studies of metamorphosed hydrothermal alteration in the Kristineberg volcanogenic massive sulfide district, Sweden. Mineralium Deposita, 38(4), 423-442.
Haubrich, F., & Tichomirowa, M. (2002). Sulfur and oxygen isotope geochemistry of Acid Mine Drainage – The polymetallic sulfide deposit “Himmelfahrt fundgrube” in Freiberg (Germany). Isotopes in Environmental and Health Studies, 38(2), 121-138.
Heidel, C., & Tichomirowa, M. (2011). The isotopic composition of sulfate from anaerobic and low oxygen pyrite oxidation experiments with ferric iron – New insights into oxidation mechanisms. Chemical Geology, 281(3), 305-316.
Höglund L. O. , Herbert R. (Eds.), Lövgren L., Öhlander B., Neretnieks I., Moreno L., Malm-ström M., Elander P., Lindvall M., & Lindström B. (2004). MiMi – Performance assessment: main report. MiMi 2003:3, Mitigation of the environmental impact from mining waste programme (MiMi). Luleå, Sweden: MiMi Print.
Holmström, H., Salmon, U. J., Carlsson, E., Petrov, P., & Öhlander, B. (2001). Geochemical inves-tigations of sulfide-bearing tailings at Kristineberg, northern Sweden, a few years after reme-diation. Science of the Total Environment, 273(1), 111-133.
INAP (The International Network for Acid Prevention) (2009) Global Acid Rock Drainage Guide (GARD Guide). Chapter 6. http://www.gardguide.com/. Last Accessed 2nd Novem-ber 2014.
Johnson, D. B. (2003). Chemical and microbiological characteristics of mineral spoils and drainage waters at abandoned coal and metal mines. Water, Air and Soil Pollution: Focus, 3(1), 47-66.
Jönsson, H. (1993). Efterbehandlingsprojekt – Kristineberg, Kimheden. Boliden Mineral AB’s internal report.
25
Kimball, B. A., McKnight, D. M., Wetherbee, G. A., & Harnish, R. A. (1992). Mechanisms of iron photoreduction in a metal-rich, acidic stream (St. Kevin Gulch, Colorado, USA). Chemical Geology, 96(1), 227-239.
Kirby, C. S., Thomas, H. M., Southam, G., & Donald, R. (1999). Relative contributions of abiotic and biological factors in Fe (II) oxidation in mine drainage. Applied Geochemistry, 14(4), 511-530.
Knöller, K., Fauville, A., Mayer, B., Strauch, G., Friese, K., & Veizer, J. (2004). Sulfur cycling in an acid mining lake and its vicinity in Lusatia, Germany. Chemical Geology, 204(3), 303-323.
Kroopnick, P., & Craig, H. (1972). Atmospheric oxygen: isotopic composition and solubility frac-tionation. Science, 175(4017), 54-55.
Landström, J. A. (1981). Boliden Mineral AB, Kristinebergs anrikningsområde. Dag- och dräneringsvatten – kartläggning. Boliden Mineral AB’s internal report.
Lee, G., Bigham, J. M., & Faure, G. (2002). Removal of trace metals by coprecipitation with Fe, Al and Mn from natural waters contaminated with acid mine drainage in the Ducktown Mining District, Tennessee. Applied Geochemistry, 17(5), 569-581.
Lindegren M., Hedlund T., & Lövgren L. (2011). Metal transport and precipitation of iron min-erals in acid mine drainage. In Proceedings of Sudbury 2011, Mining and the Environment Interna-tional Conference V, June 25 – 30 2011. Sudbury, Ontario, Canada.
Liu, J. Y., & Kalin, M. A. (n.d). A study of the ferrous oxidation process in acid mine seepage. Toronto, Ontario.
Lloyd, R. M. (1967). Oxygen-18 composition of oceanic sulfate. Science, 156(3779), 1228-1231.
Lottermoser, B. (2010). Mine wastes: characterization, treatment and environmental impacts. Springer Berlin Heidelberg.
MEND (Mine Environment Neutral Drainage) (2001). MEND manual, volume 4 – Prevention and control. Canadian Mine Environment Neutral Drainage Program, MEND 5.4.2d.
Migaszewski, Z. M., Gałuszka, A., Hałas, S., Dołęgowska, S., Dąbek, J., & Starnawska, E. (2008). Geochemistry and stable sulfur and oxygen isotope ratios of the Podwiśniówka pit pond wa-ter generated by acid mine drainage (Holy Cross Mountains, south-central Poland). Applied Geochemistry, 23(12), 3620-3634.
Nordstrom, D. K. (1977). Thermochemical redox equilibria of ZoBell’s solution. Geochimica et Cosmochimica Acta, 41(12), 1835-1841.
Nordstrom, D. K. (1985). The rate of ferrous iron oxidation in a stream receiving acid mine efflu-ent. Selected Papers in the Hydrologic Sciences, 113-119.
Nordstrom, D. K. (2000). Aqueous redox chemistry and the behavior of iron in acid mine waters. In R. T. Wilkin, R. D. Ludwig & R. G. Ford (Eds.), Proceedings of the Workshop on Monitoring Ox-idation-reduction Processes for Ground-water Restoration (pp. 43–47). EPA/600/R-02/002. Dallas, Texas: US EPA.

26
Nordstrom, D. K. (2009). Pitfalls and limitations of mineral equilibrium assumptions for geo-chemical modeling of water rock interactions. In Proceedings of Securing the Future and 8th ICARD (International Conference on Acid Rock Drainage). Skellefteå, Sweden.
Nordstrom, D. K. (2011). Hydrogeochemical processes governing the origin, transport and fate of major and trace elements from mine wastes and mineralized rock to surface waters. Applied Geochemistry, 26(11), 1777-1791.
Nordstrom, D. K., Jenne, E. A., & Ball, J. W. (1979). Redox equilibria of iron in acid mine waters. Chemical Modeling in Aqueous Systems, 93, 51-80.
Nordstrom, D. K., Plummer, L. N., Langmuir, D., Busenberg, E., May, H. M., Jones, B. F., & Parkhurst, D. L. (1990). Revised chemical equilibrium data for major water-mineral reactions and their limitations. In D. C. Melchior & R. L. Bassett (Eds.).Chemical Modeling of Aqueous Systems II, ACS symposium series (Vol. 416, pp. 398-413). Washington, DC: American Chemical Society.
Nordstrom, D. K., Wright, W. G., Mast, M. A., Bove, D. J., & Rye, R. O. (2007). Aqueous-sulfate stable isotopes – a study of mining-affected and undisturbed acidic drainage. US Geological Survey Professional Paper, 1651, 387-416.
Parkhurst, D. L., & Appelo, C. A. J. (2013). Description of input and examples for PHREEQC version 3 – A computer program for speciation, batch-reaction, one-dimensional transport, and inverse geochemical calculations. U.S. Geological Survey Techniques and Methods, Book 6, Chap. A43. Available only at http://pubs.usgs.gov/tm/06/a43/.
Pellicori, D. A., Gammons, C. H., & Poulson, S. R. (2005). Geochemistry and stable isotope composition of the Berkeley pit lake and surrounding mine waters, Butte, Montana. Applied Geochemistry, 20(11), 2116-2137.
Resin, E. (2010). Vattenbalanser för tre nedlagda gruvor. MSc thesis. Umeå University, Sweden.
Rose, A. W., & Cravotta III, C. A. (1998). Geochemistry of coal mine drainage. In K. B .C. Brady, M.W. Smith & Schueck, J. (Eds.) Coal mine drainage prediction and pollution prevention in Pennsyl-vania (pp. 1.1-1.22). Harrisburg, Pennsylvania: Department of Environmental Protection.
Rosén, L., & Wilske, Å. (1994). Beräkningar av metallflöden och förslag till åtgärder vid Kimhedengruvan, Kristineberg. Scandiaconsult Väst AB, Sweden. Boliden Mineral AB’s internal report.
Sánchez España, J., López Pamo, E., Santofimia, E., Aduvire, O., Reyes, J., & Barettino, D. (2005). Acid mine drainage in the Iberian Pyrite Belt (Odiel river watershed, Huelva, SW Spain): geo-chemistry, mineralogy and environmental implications. Applied Geochemistry, 20(7), 1320-1356.
Sánchez España, J., López Pamo, E., & Santofimia Pastor, E. (2007). The oxidation of ferrous iron in acidic mine effluents from the Iberian Pyrite Belt (Odiel Basin, Huelva, Spain): field and laboratory rates. Journal of Geochemical Exploration, 92(2), 120-132.
Seal II, R. R. (2003). Stable-isotope geochemistry of mine waters and related solids. In J. L. Jam-bor, D. W. Blowes and A. I. M. Ritchie (Eds.), Environmental aspects of mine wastes, short course series (Vol. 31., pp. 303-334). Ontario, Canada: Mineralogical Association of Canada.
Seal II, R. R., Hammarstrom, J. M., Johnson, A. N., Piatak, N. M., & Wandless, G. A. (2008). Envi-ronmental geochemistry of a Kuroko-type massive sulfide deposit at the abandoned Valzinco mine, Virginia, USA. Applied Geochemistry, 23(2), 320-342.
27
SEPA (Swedish Environmental Protection Agency) (1993). Gruvavfall från sulfidmalmsbrytning – metaller och surt vatten på drift. Rapport 4202. Stockholm, Sweden: Naturvårdsverket.
SGU (Geological Survey of Sweden) (2013). Bedömningsgrunder för grundvatten. SGU-rapport 2013:01. Uppsala, Sweden: Sveriges geologiska undersökning (SGU).
Sidenko, N. V., & Sherriff, B. L. (2005). The attenuation of Ni, Zn and Cu, by secondary Fe phases of different crystallinity from surface and ground water of two sulfide mine tailings in Mani-toba, Canada. Applied Geochemistry, 20(6), 1180-1194.
SMHI (2007). Nederbörd. Normalvärden (1961-1990). http://data.smhi.se/met/climate/time_series/month_year/normal_1961_1990/SMHI_month_year_normal_61_90_precipitation_mm.txt. Last Accessed 21 May 2014.
SMHI (2008). Temperatur. Normalvärden (1961-1990). http://data.smhi.se/met/climate/time_series/month_year/normal_1961_1990/SMHI_month_year_normal_61_90_temperature_celsius.txt. Last Accessed 21 May 2014.
SMHI (2014). Lufttryck. Normalvärden (1961-1990). http://www.smhi.se/klimatdata/meteo-rologi/lufttryck. Last Accessed 2 November 2012.
Sracek, O., Choquette, M., Gélinas, P., Lefebvre, R., & Nicholson, R. V. (2004). Geochemical characterization of acid mine drainage from a waste rock pile, Mine Doyon, Quebec, Canada. Journal of Contaminant Hydrology, 69(1), 45-71.
Taylor, B. E., Wheeler, M. C., & Nordstrom, D. K. (1984). Stable isotope geochemistry of acid mine drainage: Experimental oxidation of pyrite. Geochimica et Cosmochimica Acta, 48(12), 2669-2678.
Taylor, B. E., & Wheeler, M. C. (1994). Sulfur- and oxygen-isotope geochemistry of acid mine drainage in the Western United States: Field and experimental studies revisited. In C. N. Alpers & D. W. Blowes (Eds.), Environmental geochemistry of sulfide oxidation, ACS Symposium Series (Vol. 550, pp. 481-514). Washington, DC: American Chemical Society.
Toran, L., & Harris, R. F. (1989). Interpretation of sulfur and oxygen isotopes in biological and abiological sulfide oxidation. Geochimica et Cosmochimica Acta, 53(9), 2341-2348.
USGS (U.S. Geological Survey) (2014). DOTABLES (Version 3.5) [Software]. Available from URL: http://water.usgs.gov/software/DOTABLES/. Last accessed 2nd November 2014.
Villain, L., Alakangas, L., & Öhlander, B. (2013). The effects of backfilling and sealing the waste rock on water quality at the Kimheden open-pit mine, northern Sweden. Journal of Geochemical Exploration, 134, 99-110.
Villain, L., Breng, N., Lundberg, A., Alakangas, L., & Öhlander, B. (2014). Effects of water pathways on acid mine drainage at the reclaimed Kimheden open-pit mine, northern Sweden. Manuscript in preparation.
Wagner, T., Boyce, A. J., Jonsson, E., & Fallick, A. E. (2004). Laser microprobe sulphur isotope analysis of arsenopyrite: experimental calibration and application to the Boliden Au–Cu–As massive sulphide deposit. Ore Geology Reviews, 25(3), 311-325.
Wisotzky, F. (2000). Redox reactions, multi-component stability diagrams and isotopic investiga-tions in sulfur-and iron-dominated groundwater systems. In J. Schüring et al. (Eds.) Redox (pp. 175-188). Springer Berlin Heidelberg.

28
Yu, J. Y., Heo, B., Choi, I. K., Cho, J. P., & Chang, H. W. (1999). Apparent solubilities of schwert-mannite and ferrihydrite in natural stream waters polluted by mine drainage. Geochimica et Cosmochimica Acta, 63(19), 3407-3416.
Zhu, C., & Anderson, G. (2002). Environmental applications of geochemical modeling. Cambridge University Press.

PAPER IV
Effects of water pathways on acid mine drainage at the reclaimed Kimheden open-pit mine,
northern Sweden
Lucile Villain, Nicole Breng, Angela Lundberg, Lena Alakangas and Björn Öhlander
Manuscript(2014)

1
Effects of water pathways on acid mine drainage at the reclaimed Kimheden open-pit mine, northern Sweden
Lucile Villain1, Nicole Breng1, Angela Lundberg1, Lena Alakangas1, Björn Öhlander1
1Luleå University of Technology, Division of Geosciences and Environmental Engineering, SE-971 87 Luleå, Sweden
Abstract
At many mine sites metals and acidity produced by sulphide oxidation in reactive waste are trans-ported by water to the surrounding environment, with detrimental consequences. Thus, mitigat-ing the process is a key aim of restoration programmes. At Kimheden, northern Sweden, attempts to mitigate acid mine drainage involved backfilling sulphidic waste rock into two small open pits and sealing them with dry covers to reduce oxygen ingress into the waste. Investigation of water pathways within and around the main open pit 18 years after reclamation provided insights into the performance of the reclamation measures and complemented information gathered from previous geochemical and geophysical investigations. In particular, measurements of groundwater head variations in the backfill showed that up to 40 % of the waste is unsaturated during baseflow periods, which dramatically increases potential transport rates of gaseous oxygen into the waste through the surrounding fractured bedrock. Calculation of water turnover times in the back-filled pit using either the recharge obtained from a water balance of the pit or measurements of hydraulic conductivity in the backfill indicated that oxidation products formed prior to reclama-tion have presumably been completely washed out. Using groundwater head measurements, zones where the backfill is hydraulically confined by the overlying dry cover were identified, explaining the occurrence of groundwater seepage from the backfill into the dry cover that was previously revealed by a geoelectrical investigation. Seepage mapping demonstrated that this phenomenon extends along most of the lower edge of the pit. Estimated timeframes for contamination from the pit, based on current loads, are in the order of several hundred years. Hence improvement of the reclamation works may be considered relevant.
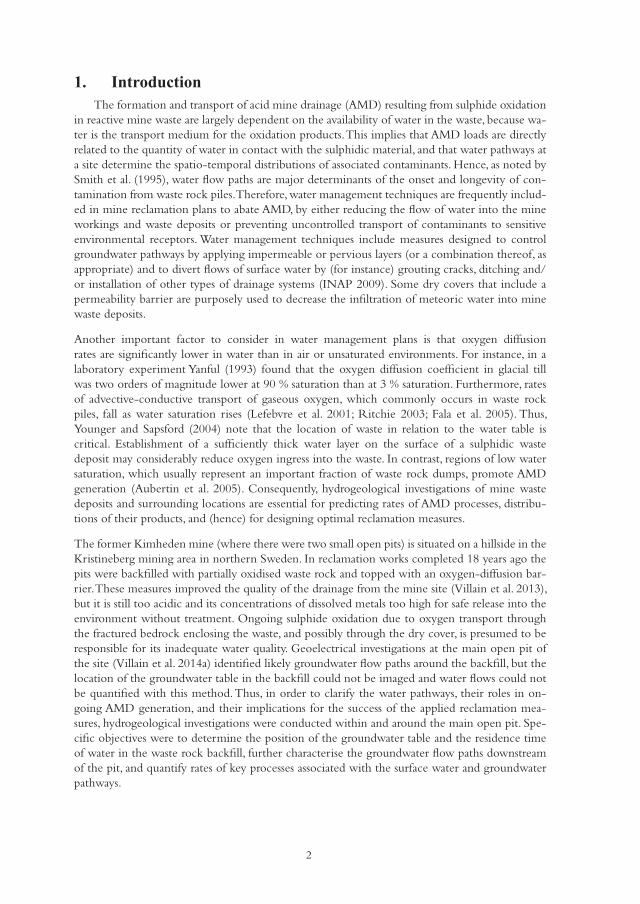
2
1. Introduction The formation and transport of acid mine drainage (AMD) resulting from sulphide oxidation in reactive mine waste are largely dependent on the availability of water in the waste, because wa-ter is the transport medium for the oxidation products. This implies that AMD loads are directly related to the quantity of water in contact with the sulphidic material, and that water pathways at a site determine the spatio-temporal distributions of associated contaminants. Hence, as noted by Smith et al. (1995), water flow paths are major determinants of the onset and longevity of con-tamination from waste rock piles. Therefore, water management techniques are frequently includ-ed in mine reclamation plans to abate AMD, by either reducing the flow of water into the mine workings and waste deposits or preventing uncontrolled transport of contaminants to sensitive environmental receptors. Water management techniques include measures designed to control groundwater pathways by applying impermeable or pervious layers (or a combination thereof, as appropriate) and to divert flows of surface water by (for instance) grouting cracks, ditching and/or installation of other types of drainage systems (INAP 2009). Some dry covers that include a permeability barrier are purposely used to decrease the infiltration of meteoric water into mine waste deposits.
Another important factor to consider in water management plans is that oxygen diffusion rates are significantly lower in water than in air or unsaturated environments. For instance, in a laboratory experiment Yanful (1993) found that the oxygen diffusion coefficient in glacial till was two orders of magnitude lower at 90 % saturation than at 3 % saturation. Furthermore, rates of advective-conductive transport of gaseous oxygen, which commonly occurs in waste rock piles, fall as water saturation rises (Lefebvre et al. 2001; Ritchie 2003; Fala et al. 2005). Thus, Younger and Sapsford (2004) note that the location of waste in relation to the water table is critical. Establishment of a sufficiently thick water layer on the surface of a sulphidic waste deposit may considerably reduce oxygen ingress into the waste. In contrast, regions of low water saturation, which usually represent an important fraction of waste rock dumps, promote AMD generation (Aubertin et al. 2005). Consequently, hydrogeological investigations of mine waste deposits and surrounding locations are essential for predicting rates of AMD processes, distribu-tions of their products, and (hence) for designing optimal reclamation measures.
The former Kimheden mine (where there were two small open pits) is situated on a hillside in the Kristineberg mining area in northern Sweden. In reclamation works completed 18 years ago the pits were backfilled with partially oxidised waste rock and topped with an oxygen-diffusion bar-rier. These measures improved the quality of the drainage from the mine site (Villain et al. 2013), but it is still too acidic and its concentrations of dissolved metals too high for safe release into the environment without treatment. Ongoing sulphide oxidation due to oxygen transport through the fractured bedrock enclosing the waste, and possibly through the dry cover, is presumed to be responsible for its inadequate water quality. Geoelectrical investigations at the main open pit of the site (Villain et al. 2014a) identified likely groundwater flow paths around the backfill, but the location of the groundwater table in the backfill could not be imaged and water flows could not be quantified with this method. Thus, in order to clarify the water pathways, their roles in on- going AMD generation, and their implications for the success of the applied reclamation mea-sures, hydrogeological investigations were conducted within and around the main open pit. Spe-cific objectives were to determine the position of the groundwater table and the residence time of water in the waste rock backfill, further characterise the groundwater flow paths downstream of the pit, and quantify rates of key processes associated with the surface water and groundwater pathways.
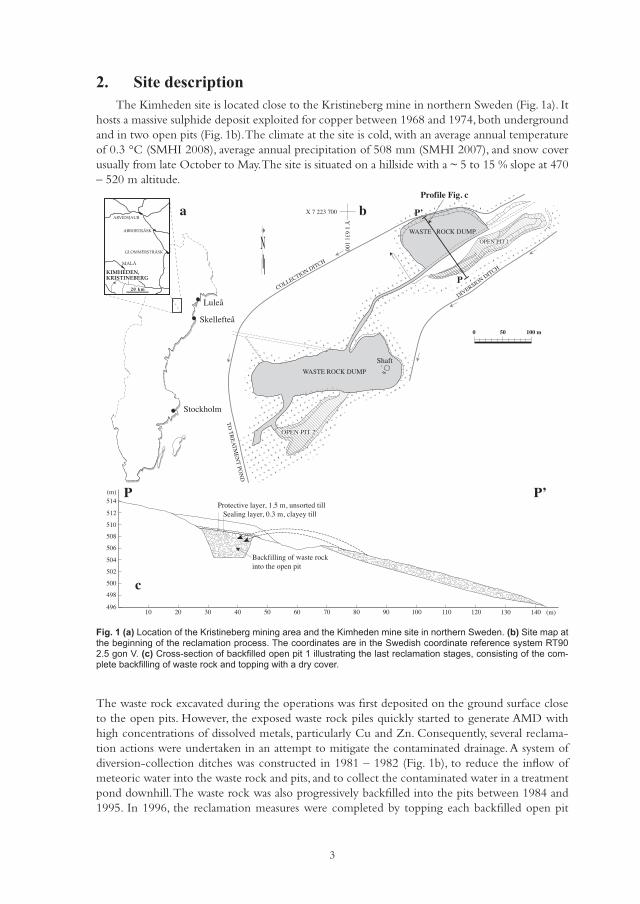
3
2. Site description The Kimheden site is located close to the Kristineberg mine in northern Sweden (Fig. 1a). It hosts a massive sulphide deposit exploited for copper between 1968 and 1974, both underground and in two open pits (Fig. 1b). The climate at the site is cold, with an average annual temperature of 0.3 °C (SMHI 2008), average annual precipitation of 508 mm (SMHI 2007), and snow cover usually from late October to May. The site is situated on a hillside with a ~ 5 to 15 % slope at 470 – 520 m altitude.
Fig. 1 (a) Location of the Kristineberg mining area and the Kimheden mine site in northern Sweden. (b) Site map at the beginning of the reclamation process. The coordinates are in the Swedish coordinate reference system RT90 2.5 gon V. (c) Cross-section of back lled open pit 1 illustrating the last reclamation stages, consisting of the com-plete back lling of waste rock and topping with a dry cover.
DIVERSIO
N DITCH
COLLECTION DITCH
TO
TR
EA
TM
EN
T PO
ND
Shaft
OPEN PIT 1OPEN PIT 1
OPEN PIT 2OPEN PIT 2
WASTE ROCK DUMP
WASTE ROCK DUMP
N
Stockholm
Luleå
Profile Fig. c
X 7 223 700
Y 1 631 100
Skellefteå
a b
c
P
P
P’
P’
20 km
ARVIDSJAUR
ABBORTRÄSK
GLOMMERSTRÄSK
MALÅ
KRISTINEBERGKIMHEDEN,
0 50 100 m
Protective layer, 1.5 m, unsorted tillSealing layer, 0.3 m, clayey till
Backfilling of waste rockinto the open pit
10
512
514(m)
510
508
506
504
502
500
498
49620 30 40 50 60 70 80 90 100 110 120 130 140 (m)
The waste rock excavated during the operations was first deposited on the ground surface close to the open pits. However, the exposed waste rock piles quickly started to generate AMD with high concentrations of dissolved metals, particularly Cu and Zn. Consequently, several reclama-tion actions were undertaken in an attempt to mitigate the contaminated drainage. A system of diversion-collection ditches was constructed in 1981 – 1982 (Fig. 1b), to reduce the inflow of meteoric water into the waste rock and pits, and to collect the contaminated water in a treatment pond downhill. The waste rock was also progressively backfilled into the pits between 1984 and 1995. In 1996, the reclamation measures were completed by topping each backfilled open pit
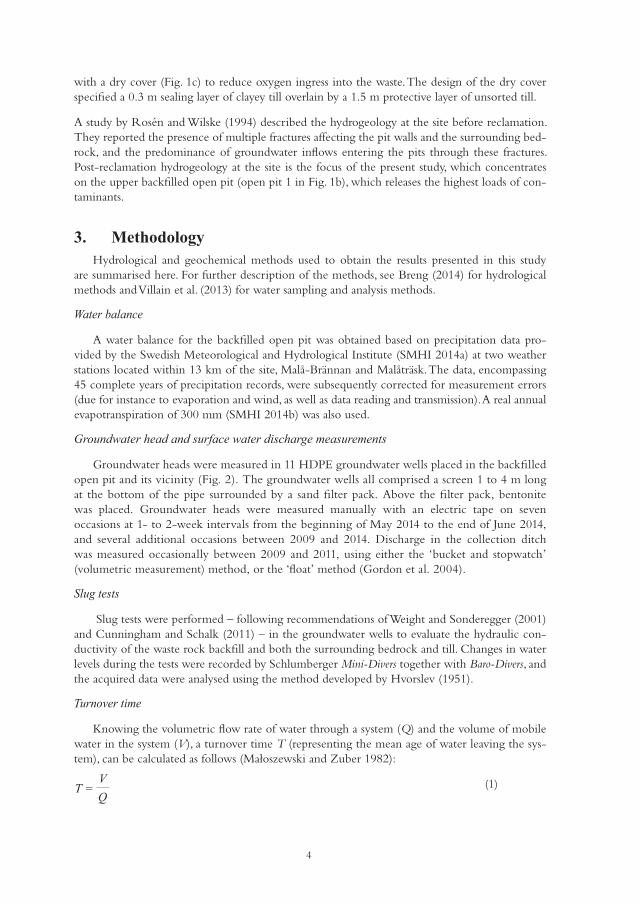
4
with a dry cover (Fig. 1c) to reduce oxygen ingress into the waste. The design of the dry cover specified a 0.3 m sealing layer of clayey till overlain by a 1.5 m protective layer of unsorted till.
A study by Rosén and Wilske (1994) described the hydrogeology at the site before reclamation. They reported the presence of multiple fractures affecting the pit walls and the surrounding bed-rock, and the predominance of groundwater inflows entering the pits through these fractures. Post-reclamation hydrogeology at the site is the focus of the present study, which concentrates on the upper backfilled open pit (open pit 1 in Fig. 1b), which releases the highest loads of con-taminants.
3. Methodology Hydrological and geochemical methods used to obtain the results presented in this study are summarised here. For further description of the methods, see Breng (2014) for hydrological methods and Villain et al. (2013) for water sampling and analysis methods.
Water balance
A water balance for the backfilled open pit was obtained based on precipitation data pro-vided by the Swedish Meteorological and Hydrological Institute (SMHI 2014a) at two weather stations located within 13 km of the site, Malå-Brännan and Malåträsk. The data, encompassing 45 complete years of precipitation records, were subsequently corrected for measurement errors (due for instance to evaporation and wind, as well as data reading and transmission). A real annual evapotranspiration of 300 mm (SMHI 2014b) was also used.
Groundwater head and surface water discharge measurements
Groundwater heads were measured in 11 HDPE groundwater wells placed in the backfilled open pit and its vicinity (Fig. 2). The groundwater wells all comprised a screen 1 to 4 m long at the bottom of the pipe surrounded by a sand filter pack. Above the filter pack, bentonite was placed. Groundwater heads were measured manually with an electric tape on seven occasions at 1- to 2-week intervals from the beginning of May 2014 to the end of June 2014, and several additional occasions between 2009 and 2014. Discharge in the collection ditch was measured occasionally between 2009 and 2011, using either the ‘bucket and stopwatch’ (volumetric measurement) method, or the ‘float’ method (Gordon et al. 2004).
Slug tests
Slug tests were performed – following recommendations of Weight and Sonderegger (2001) and Cunningham and Schalk (2011) – in the groundwater wells to evaluate the hydraulic con-ductivity of the waste rock backfill and both the surrounding bedrock and till. Changes in water levels during the tests were recorded by Schlumberger Mini-Divers together with Baro-Divers, and the acquired data were analysed using the method developed by Hvorslev (1951).
Turnover time
Knowing the volumetric flow rate of water through a system (Q) and the volume of mobile water in the system (V), a turnover time T (representing the mean age of water leaving the sys-tem), can be calculated as follows (Małoszewski and Zuber 1982):
(1)T =VQ
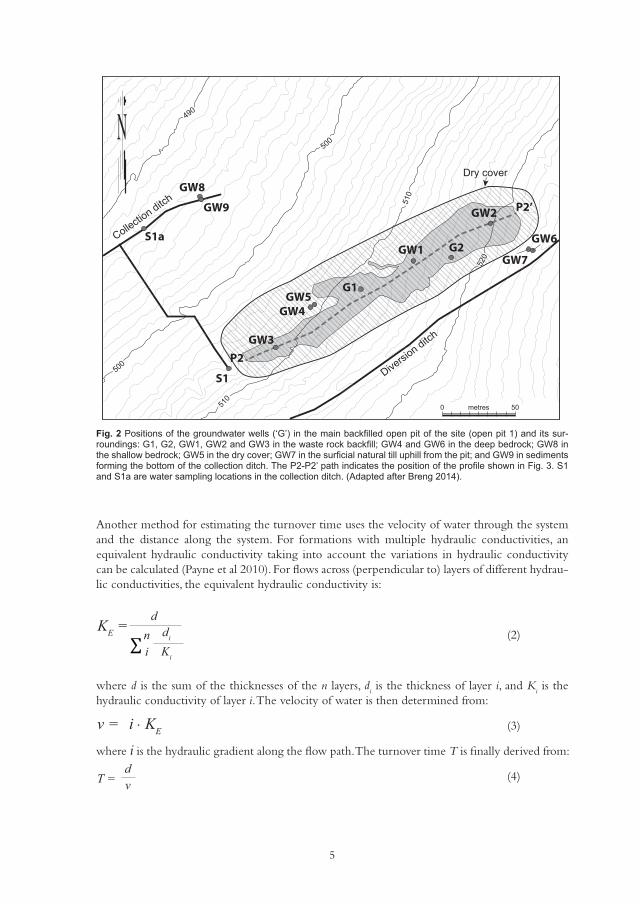
5
Another method for estimating the turnover time uses the velocity of water through the system and the distance along the system. For formations with multiple hydraulic conductivities, an equivalent hydraulic conductivity taking into account the variations in hydraulic conductivity can be calculated (Payne et al 2010). For flows across (perpendicular to) layers of different hydrau-lic conductivities, the equivalent hydraulic conductivity is:
(2)
where d is the sum of the thicknesses of the n layers, di is the thickness of layer i, and K
i is the
hydraulic conductivity of layer i. The velocity of water is then determined from:
(3)
where i is the hydraulic gradient along the flow path. The turnover time T is finally derived from:
(4)
Fig. 2 Positions of the groundwater wells ( G ) in the main back lled open pit of the site (open pit 1) and its sur-roundings: G1, G2, G 1, G 2 and G 3 in the waste rock back ll; G 4 and G 6 in the deep bedrock; G 8 in the shallow bedrock; G 5 in the dry cover; G 7 in the sur cial natural till uphill from the pit; and G 9 in sediments forming the bottom of the collection ditch. The P2-P2 path indicates the position of the pro le shown in Fig. 3. S1 and S1a are water sampling locations in the collection ditch. ( dapted after Breng 2014).
500
490
510
520
500
490
510
520
500
500
500
500
490
510
510
510
510
520
Diversio
n ditch
Collection ditch
Diversio
n ditch
Collection ditch
N
metres 500
Dry coverDry coverGW8
GW9
GW3
GW4GW5
GW1GW7
GW6
GW2 P2’
P2
G1
G2S1a
S1
KE =d
di
Ki
ni
i . KEv =
T =dv
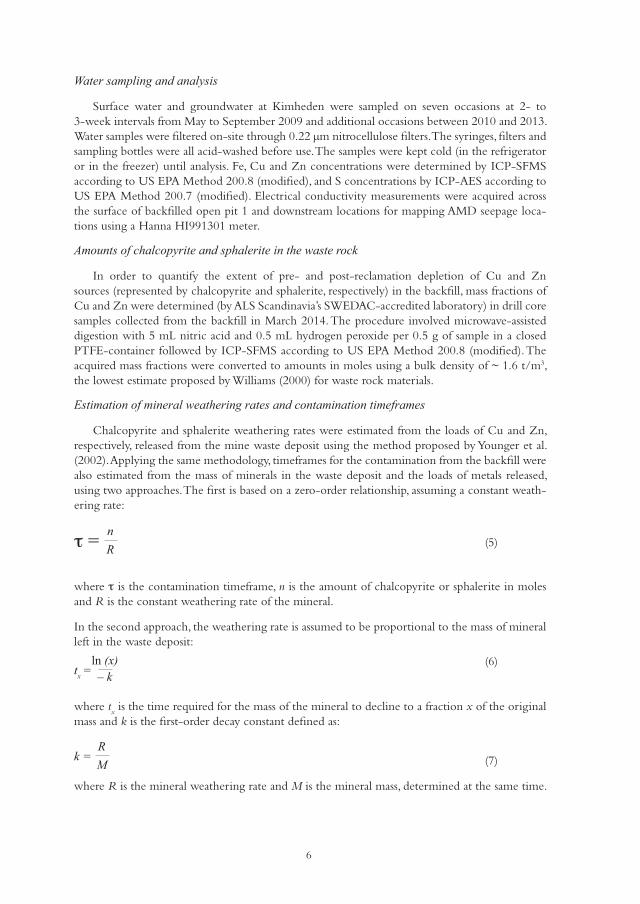
6
Water sampling and analysis
Surface water and groundwater at Kimheden were sampled on seven occasions at 2- to 3-week intervals from May to September 2009 and additional occasions between 2010 and 2013. Water samples were filtered on-site through 0.22 μm nitrocellulose filters. The syringes, filters and sampling bottles were all acid-washed before use. The samples were kept cold (in the refrigerator or in the freezer) until analysis. Fe, Cu and Zn concentrations were determined by ICP-SFMS according to US EPA Method 200.8 (modified), and S concentrations by ICP-AES according to US EPA Method 200.7 (modified). Electrical conductivity measurements were acquired across the surface of backfilled open pit 1 and downstream locations for mapping AMD seepage loca-tions using a Hanna HI991301 meter.
Amounts of chalcopyrite and sphalerite in the waste rock
In order to quantify the extent of pre- and post-reclamation depletion of Cu and Zn sources (represented by chalcopyrite and sphalerite, respectively) in the backfill, mass fractions of Cu and Zn were determined (by ALS Scandinavia’s SWEDAC-accredited laboratory) in drill core samples collected from the backfill in March 2014. The procedure involved microwave-assisted digestion with 5 mL nitric acid and 0.5 mL hydrogen peroxide per 0.5 g of sample in a closed PTFE-container followed by ICP-SFMS according to US EPA Method 200.8 (modified). The acquired mass fractions were converted to amounts in moles using a bulk density of ~ 1.6 t/m3, the lowest estimate proposed by Williams (2000) for waste rock materials.
Estimation of mineral weathering rates and contamination timeframes
Chalcopyrite and sphalerite weathering rates were estimated from the loads of Cu and Zn, respectively, released from the mine waste deposit using the method proposed by Younger et al. (2002). Applying the same methodology, timeframes for the contamination from the backfill were also estimated from the mass of minerals in the waste deposit and the loads of metals released, using two approaches. The first is based on a zero-order relationship, assuming a constant weath-ering rate:
(5)
where is the contamination timeframe, n is the amount of chalcopyrite or sphalerite in moles and R is the constant weathering rate of the mineral.
In the second approach, the weathering rate is assumed to be proportional to the mass of mineral left in the waste deposit:
(6)
where tx is the time required for the mass of the mineral to decline to a fraction x of the original
mass and k is the first-order decay constant defined as:
(7)
where R is the mineral weathering rate and M is the mineral mass, determined at the same time.
τ = nR
tx =ln (x)– k
k =RM
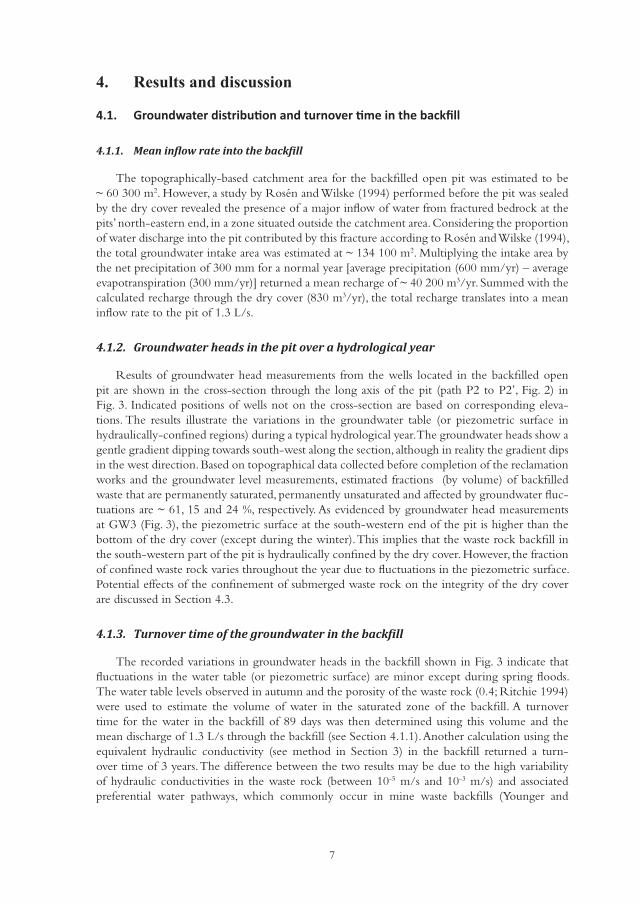
7
4. Results and discussion
4.1.
4.1.1.
The topographically-based catchment area for the backfilled open pit was estimated to be ~ 60 300 m2. However, a study by Rosén and Wilske (1994) performed before the pit was sealed by the dry cover revealed the presence of a major inflow of water from fractured bedrock at the pits’ north-eastern end, in a zone situated outside the catchment area. Considering the proportion of water discharge into the pit contributed by this fracture according to Rosén and Wilske (1994), the total groundwater intake area was estimated at ~ 134 100 m2. Multiplying the intake area by the net precipitation of 300 mm for a normal year [average precipitation (600 mm/yr) – average evapotranspiration (300 mm/yr)] returned a mean recharge of ~ 40 200 m3/yr. Summed with the calculated recharge through the dry cover (830 m3/yr), the total recharge translates into a mean inflow rate to the pit of 1.3 L/s.
4.1.2.
Results of groundwater head measurements from the wells located in the backfilled open pit are shown in the cross-section through the long axis of the pit (path P2 to P2’, Fig. 2) in Fig. 3. Indicated positions of wells not on the cross-section are based on corresponding eleva-tions. The results illustrate the variations in the groundwater table (or piezometric surface in hydraulically-confined regions) during a typical hydrological year. The groundwater heads show a gentle gradient dipping towards south-west along the section, although in reality the gradient dips in the west direction. Based on topographical data collected before completion of the reclamation works and the groundwater level measurements, estimated fractions (by volume) of backfilled waste that are permanently saturated, permanently unsaturated and affected by groundwater fluc-tuations are ~ 61, 15 and 24 %, respectively. As evidenced by groundwater head measurements at GW3 (Fig. 3), the piezometric surface at the south-western end of the pit is higher than the bottom of the dry cover (except during the winter). This implies that the waste rock backfill in the south-western part of the pit is hydraulically confined by the dry cover. However, the fraction of confined waste rock varies throughout the year due to fluctuations in the piezometric surface. Potential effects of the confinement of submerged waste rock on the integrity of the dry cover are discussed in Section 4.3.
4.1.3.
The recorded variations in groundwater heads in the backfill shown in Fig. 3 indicate that fluctuations in the water table (or piezometric surface) are minor except during spring floods. The water table levels observed in autumn and the porosity of the waste rock (0.4; Ritchie 1994) were used to estimate the volume of water in the saturated zone of the backfill. A turnover time for the water in the backfill of 89 days was then determined using this volume and the mean discharge of 1.3 L/s through the backfill (see Section 4.1.1). Another calculation using the equivalent hydraulic conductivity (see method in Section 3) in the backfill returned a turn-over time of 3 years. The difference between the two results may be due to the high variability of hydraulic conductivities in the waste rock (between 10-5 m/s and 10-3 m/s) and associated preferential water pathways, which commonly occur in mine waste backfills (Younger and
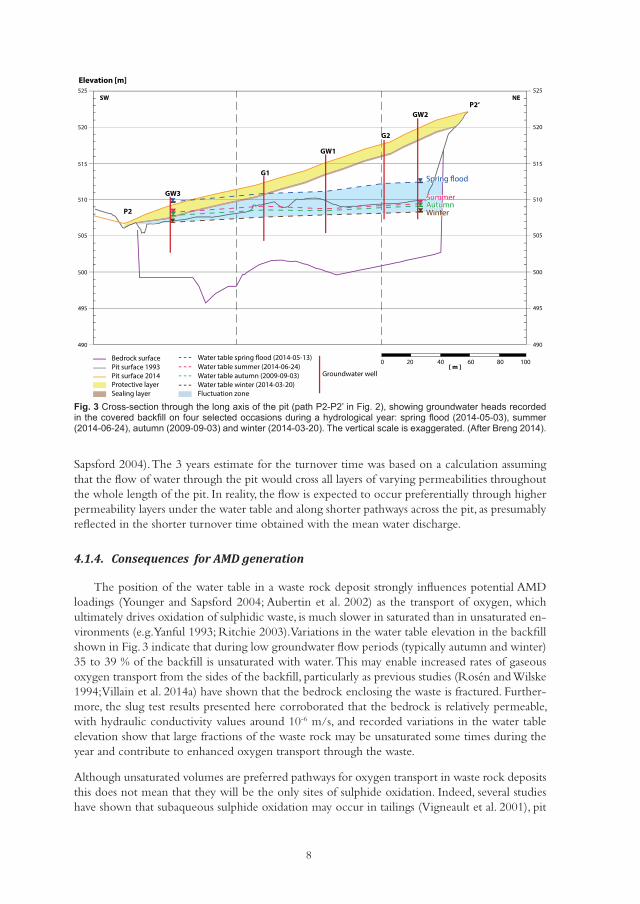
8
Sapsford 2004). The 3 years estimate for the turnover time was based on a calculation assuming that the flow of water through the pit would cross all layers of varying permeabilities throughout the whole length of the pit. In reality, the flow is expected to occur preferentially through higher permeability layers under the water table and along shorter pathways across the pit, as presumably reflected in the shorter turnover time obtained with the mean water discharge.
4.1.4.
The position of the water table in a waste rock deposit strongly influences potential AMD loadings (Younger and Sapsford 2004; Aubertin et al. 2002) as the transport of oxygen, which ultimately drives oxidation of sulphidic waste, is much slower in saturated than in unsaturated en-vironments (e.g. Yanful 1993; Ritchie 2003). Variations in the water table elevation in the backfill shown in Fig. 3 indicate that during low groundwater flow periods (typically autumn and winter) 35 to 39 % of the backfill is unsaturated with water. This may enable increased rates of gaseous oxygen transport from the sides of the backfill, particularly as previous studies (Rosén and Wilske 1994; Villain et al. 2014a) have shown that the bedrock enclosing the waste is fractured. Further-more, the slug test results presented here corroborated that the bedrock is relatively permeable, with hydraulic conductivity values around 10-6 m/s, and recorded variations in the water table elevation show that large fractions of the waste rock may be unsaturated some times during the year and contribute to enhanced oxygen transport through the waste.
Although unsaturated volumes are preferred pathways for oxygen transport in waste rock deposits this does not mean that they will be the only sites of sulphide oxidation. Indeed, several studies have shown that subaqueous sulphide oxidation may occur in tailings (Vigneault et al. 2001), pit
Fig. 3 Cross-section through the long a is of the pit (path P2-P2 in Fig. 2), showing groundwater heads recorded in the covered back ll on four selected occasions during a hydrological year: spring ood (2014-05-03), summer (2014-06-24), autumn (2009-09-03) and winter (2014-03-20). The vertical scale is e aggerated. ( fter Breng 2014).
20 40 60 80 100[ m ]
0
495
500
505
510
515
520
525
490
495
500
505
510
515
520
525
490
NESWP2‘
P2
Elevation [m]
Bedrock surfacePit surface 1993Pit surface 2014
Water table spring flood (2014-05-13)Water table summer (2014-06-24)
Groundwater wellWater table autumn (2009-09-03)Protective layerSealing layer
Water table winter (2014-03-20)Fluctuation zone
GW3
G1
GW1
G2
GW2
Spring flood
SummerAutumnWinter
Spring flood
SummerAutumnWinter

9
lakes (Gammons 2009) and mine spoils (Cravotta 1994), if oxygen is leaking into the system. A possibility of particular interest in the present study is that unsaturated zones of a waste deposit may supply Fe(III) formed by oxygen-driven sulphide oxidation to saturated zones through downwards water percolation and groundwater rises in periods with higher flows (as reportedly detected in a coal mine spoil in western Pennsylvania; Cravotta 1994). Previously reported sulphate isotope compositions in the groundwater of the backfill at Kimheden also suggest that oxidation of pyrite by Fe(III) is an important process in the backfilled waste rock (Villain et al. 2014b).
In contrast to periods of relatively low flows, up to 85 % of the waste is submerged in periods of higher flows. As shown above, the turnover time for complete renewal of water in the backfill has been estimated to range between ~ 90 days to 3 years, depending on the method used. These turnover times may provide information on the origin of the contaminants released in the mine drainage today. Based on extensive experience with flooding in underground mines and opencast mine backfills, Younger and Sapsford (2004) estimated that flushing out previously formed AMD oxidation products from a freshly deposited backfill would take at most four times longer than the initial flooding. As the backfilling works at Kimheden finished (with final sealing by the dry cover) 18 years before the current investigations it is very unlikely that acid-generating products formed before placement of the cover still affect the geochemistry of the discharge. Younger and Sapsford (2004) also reported that contaminant concentrations generally peak after rebound of the groundwater table in a typical backfill, due to flushing of the oxidation products, then expo-nentially decline towards asymptotically lower concentrations. Such steady-state discharge quality has been observed at Kimheden for more than a decade (Villain et al. 2013). Therefore, only the ongoing oxidation of sulphides in the covered backfill may contribute to the release of AMD from the site today.
Although pre-reclamation acid-generating products are no longer expected to affect the quality of the mine drainage at Kimheden, store-and-release effects from constantly renewed acid-generating products in the backfill cannot be excluded. Such effects may be particularly strong during and after spring floods, when there are large fluctuations in the water discharge from the backfill (Fig. 3) that are likely to promote periodic washout of oxidation products formed during low-flow periods. Accordingly, such washout effects have been observed in both the groundwater in the backfill (G1) and surface water outflow from the backfill (S1) during the spring flood in 2009 (Fig. 4). Increased concentrations of contaminants from early June to late July mirrored the rise in the water table with a slight time lag, while from late June until early September they changed opposite to the water table variations, suggesting that processes of dilution prevailed instead.
Fig. 4 Concentrations of dissolved S (a) and dissolved Fe (b) at G1 and S1 (see positions in Fig. 2) during the snow-free sampling period in 2009. The increasing concentrations from early une to late uly re ect the effects of washout of stored elements in the back ll.
515180
160140120100
806040
200
13-M
ay-09
13-Ju
n-09
13-Ju
l-09
13-A
ug-09
514513512511510509508507506505
Sampling date
a b
Gro
undw
ater
ele
vatio
n (m
)
S (m
g/L)
515200180160140120100
80604020
0
13-M
ay-09
13-Ju
n-09
13-Ju
l-09
13-A
ug-09
514513512511510509
G1S1GW level
508507506505
Sampling date
Gro
undw
ater
ele
vatio
n (m
)
Fe (m
g/L)
10
4.2.
4.2.1.
Water quality monitoring since early reclamation stages has identified dissolved Cu and Zn ions as major contaminants in the drainage at Kimheden (Villain et al. 2013). Clearly, therefore, before attempting any improvement in mitigating measures it is important to understand the origins of these contaminants. As explained in the Methodology section, loads of dissolved Cu and Zn in the drainage may be tightly linked to oxidation rates of chalcopyrite and sphalerite, respectively. Thus, weathering rates of these minerals in the backfill of open pit 1 was estimated before and after reclamation, following the method described in Section 3. This required several assumptions (in addition to the general assumption that these minerals were the major sources of Cu and Zn in the AMD). Firstly, oxidation rates were directly estimated from loads of dissolved Cu and Zn concentrations in the drainage, regardless of potential concentration attenuation pro-cesses. A possible caveat is that oxidation rates may be underestimated due to sorption processes that reduce concentrations of ions in the drainage. However, at the pH of the seepage water emerging from the backfill (~ 3), these effects are considered minor (Lee et al. 2002). Besides, based on the discussion in Section 4.1.4, oxidation of the two sulphide minerals and subsequent release of Cu and Zn were assumed to occur throughout the volume of the backfill, regardless of the position of the water table.
Another assumption regards current amounts of chalcopyrite and sphalerite in the backfill, which were estimated from mass fractions of the Cu and Zn elements found in backfill samples in 2014. This assumption does not take into account the possibility that non-negligible fractions of these elements may be associated with phases other than the sulphide minerals, in particular as ions sorbed on other mineral surfaces (Carlsson et al. 2002). Nevertheless, sorbed fractions of Cu and Zn are expected to originate from sulphide oxidation and also contribute to AMD loads. Therefore, fractions of Cu and Zn determined by elemental analyses were considered as total leachable fractions available in the backfill, and were simplistically represented as ‘chalcopyrite’ and ‘sphalerite’.
Stream discharge measurements performed in 2009 – 2011 and the water balance presented in Section 4.1.1 suggest that the outflow from the backfilled open pit may be divided into two ap-proximately equal outflow fractions. One enters the collection ditch at S1 (Fig. 2) and the other one leaves the pit as groundwater running further down the hill towards wells GW8 and GW9. The water quality of the latter fraction is very similar to that of the drainage in the collection ditch at S1a (Fig. 2). Therefore, Cu and Zn loads from the backfill were represented by aver-age concentrations of dissolved Cu and Zn, respectively, at S1 and S1a multiplied by the water discharge through the pit. The discharge through the waste rock was considered to be the same (1.3 L/s) during both the pre- and post-reclamation periods, since the acquired water balance was based on precipitation data spanning 45 years, and the influence of the placement of the dry cover on the recharge was estimated to be negligible.
4.2.2.
The reclamation measures undertaken at Kimheden occurred progressively, with successive phases of backfilling the waste rock before final application of the dry cover. However, for mod-elling purposes, the year of construction of the cover (1996) is considered here as the year of
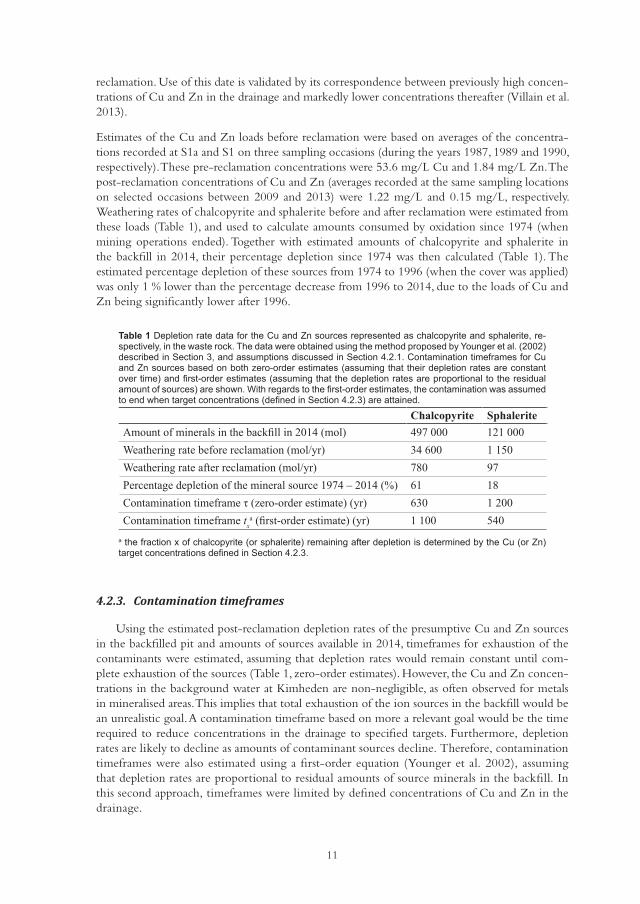
11
reclamation. Use of this date is validated by its correspondence between previously high concen-trations of Cu and Zn in the drainage and markedly lower concentrations thereafter (Villain et al. 2013).
Estimates of the Cu and Zn loads before reclamation were based on averages of the concentra-tions recorded at S1a and S1 on three sampling occasions (during the years 1987, 1989 and 1990, respectively). These pre-reclamation concentrations were 53.6 mg/L Cu and 1.84 mg/L Zn. The post-reclamation concentrations of Cu and Zn (averages recorded at the same sampling locations on selected occasions between 2009 and 2013) were 1.22 mg/L and 0.15 mg/L, respectively. Weathering rates of chalcopyrite and sphalerite before and after reclamation were estimated from these loads (Table 1), and used to calculate amounts consumed by oxidation since 1974 (when mining operations ended). Together with estimated amounts of chalcopyrite and sphalerite in the backfill in 2014, their percentage depletion since 1974 was then calculated (Table 1). The estimated percentage depletion of these sources from 1974 to 1996 (when the cover was applied) was only 1 % lower than the percentage decrease from 1996 to 2014, due to the loads of Cu and Zn being significantly lower after 1996.
Chalcopyrite SphaleriteAmount o minerals in the back ll in 2014 (mol) 497 000 121 000
eathering rate be ore reclamation (mol/yr) 34 600 1 150eathering rate a ter reclamation (mol/yr) 780 97
Percentage depletion o the mineral source 1974 2014 ( ) 61 18Contamination timeframe ( ero-order estimate) (yr) 630 1 200Contamination timeframe tx
a ( rst-order estimate) (yr) 1 100 540
4.2.3.
Using the estimated post-reclamation depletion rates of the presumptive Cu and Zn sources in the backfilled pit and amounts of sources available in 2014, timeframes for exhaustion of the contaminants were estimated, assuming that depletion rates would remain constant until com-plete exhaustion of the sources (Table 1, zero-order estimates). However, the Cu and Zn concen-trations in the background water at Kimheden are non-negligible, as often observed for metals in mineralised areas. This implies that total exhaustion of the ion sources in the backfill would be an unrealistic goal. A contamination timeframe based on more a relevant goal would be the time required to reduce concentrations in the drainage to specified targets. Furthermore, depletion rates are likely to decline as amounts of contaminant sources decline. Therefore, contamination timeframes were also estimated using a first-order equation (Younger et al. 2002), assuming that depletion rates are proportional to residual amounts of source minerals in the backfill. In this second approach, timeframes were limited by defined concentrations of Cu and Zn in the drainage.
a the fraction of chalcopyrite (or sphalerite) remaining after depletion is determined by the Cu (or n) target concentrations de ned in Section 4.2.3.
Table 1 Depletion rate data for the Cu and n sources represented as chalcopyrite and sphalerite, re-spectively, in the waste rock. The data were obtained using the method proposed by ounger et al. (2002) described in Section 3, and assumptions discussed in Section 4.2.1. Contamination timeframes for Cu and n sources based on both zero-order estimates (assuming that their depletion rates are constant over time) and rst-order estimates (assuming that the depletion rates are proportional to the residual amount of sources) are shown. ith regards to the rst-order estimates, the contamination was assumed to end when target concentrations (de ned in Section 4.2.3) are attained.
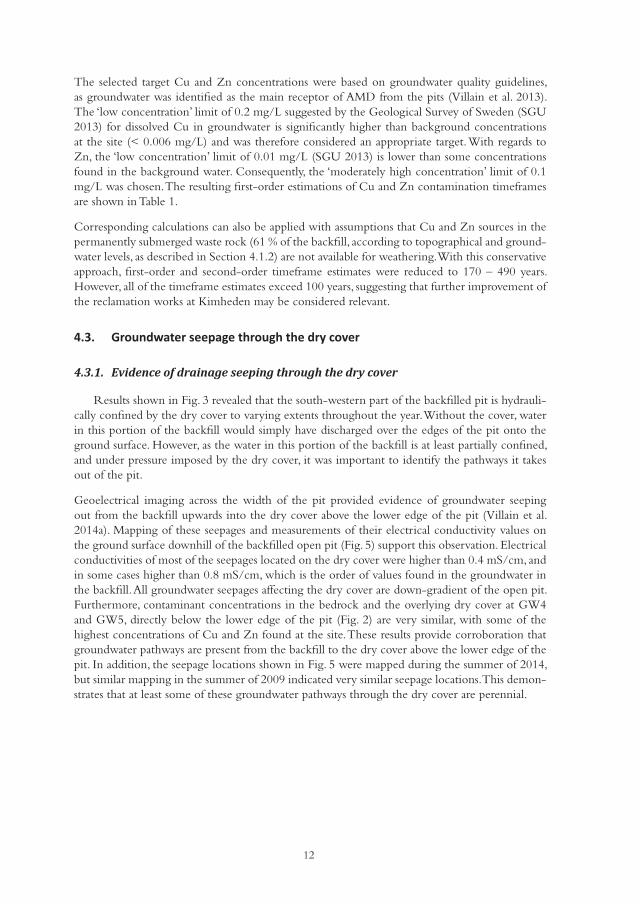
12
The selected target Cu and Zn concentrations were based on groundwater quality guidelines, as groundwater was identified as the main receptor of AMD from the pits (Villain et al. 2013). The ‘low concentration’ limit of 0.2 mg/L suggested by the Geological Survey of Sweden (SGU 2013) for dissolved Cu in groundwater is significantly higher than background concentrations at the site (< 0.006 mg/L) and was therefore considered an appropriate target. With regards to Zn, the ‘low concentration’ limit of 0.01 mg/L (SGU 2013) is lower than some concentrations found in the background water. Consequently, the ‘moderately high concentration’ limit of 0.1 mg/L was chosen. The resulting first-order estimations of Cu and Zn contamination timeframes are shown in Table 1.
Corresponding calculations can also be applied with assumptions that Cu and Zn sources in the permanently submerged waste rock (61 % of the backfill, according to topographical and ground-water levels, as described in Section 4.1.2) are not available for weathering. With this conservative approach, first-order and second-order timeframe estimates were reduced to 170 – 490 years. However, all of the timeframe estimates exceed 100 years, suggesting that further improvement of the reclamation works at Kimheden may be considered relevant.
4.3.
4.3.1.
Results shown in Fig. 3 revealed that the south-western part of the backfilled pit is hydrauli-cally confined by the dry cover to varying extents throughout the year. Without the cover, water in this portion of the backfill would simply have discharged over the edges of the pit onto the ground surface. However, as the water in this portion of the backfill is at least partially confined, and under pressure imposed by the dry cover, it was important to identify the pathways it takes out of the pit.
Geoelectrical imaging across the width of the pit provided evidence of groundwater seeping out from the backfill upwards into the dry cover above the lower edge of the pit (Villain et al. 2014a). Mapping of these seepages and measurements of their electrical conductivity values on the ground surface downhill of the backfilled open pit (Fig. 5) support this observation. Electrical conductivities of most of the seepages located on the dry cover were higher than 0.4 mS/cm, and in some cases higher than 0.8 mS/cm, which is the order of values found in the groundwater in the backfill. All groundwater seepages affecting the dry cover are down-gradient of the open pit. Furthermore, contaminant concentrations in the bedrock and the overlying dry cover at GW4 and GW5, directly below the lower edge of the pit (Fig. 2) are very similar, with some of the highest concentrations of Cu and Zn found at the site. These results provide corroboration that groundwater pathways are present from the backfill to the dry cover above the lower edge of the pit. In addition, the seepage locations shown in Fig. 5 were mapped during the summer of 2014, but similar mapping in the summer of 2009 indicated very similar seepage locations. This demon-strates that at least some of these groundwater pathways through the dry cover are perennial.
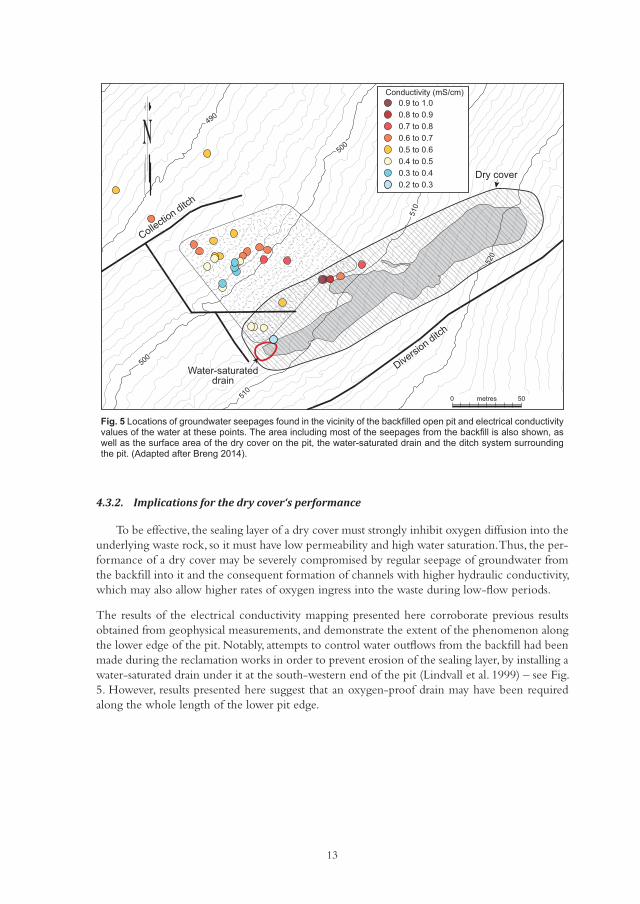
13
4.3.2.
To be effective, the sealing layer of a dry cover must strongly inhibit oxygen diffusion into the underlying waste rock, so it must have low permeability and high water saturation. Thus, the per-formance of a dry cover may be severely compromised by regular seepage of groundwater from the backfill into it and the consequent formation of channels with higher hydraulic conductivity, which may also allow higher rates of oxygen ingress into the waste during low-flow periods.
The results of the electrical conductivity mapping presented here corroborate previous results obtained from geophysical measurements, and demonstrate the extent of the phenomenon along the lower edge of the pit. Notably, attempts to control water outflows from the backfill had been made during the reclamation works in order to prevent erosion of the sealing layer, by installing a water-saturated drain under it at the south-western end of the pit (Lindvall et al. 1999) – see Fig. 5. However, results presented here suggest that an oxygen-proof drain may have been required along the whole length of the lower pit edge.
500
490
510
520
500
490
510
520
500
500
500
500
490
510
510
510
510
520
Diversio
n ditch
Collection ditch
Diversio
n ditch
Collection ditch
Dry coverDry cover
Water-saturateddrain
Water-saturateddrain
N
metres 500
Conductivity (mS/cm)0.9 to 1.00.8 to 0.90.7 to 0.80.6 to 0.70.5 to 0.60.4 to 0.50.3 to 0.40.2 to 0.3
Fig. 5 Locations of groundwater seepages found in the vicinity of the back lled open pit and electrical conductivity values of the water at these points. The area including most of the seepages from the back ll is also shown, as well as the surface area of the dry cover on the pit, the water-saturated drain and the ditch system surrounding the pit. ( dapted after Breng 2014).
14
5. Conclusions Investigations of water pathways at the reclaimed Kimheden open-pit mine site provided information contributing to overall understanding of effects of the applied reclamation measures on AMD-related processes and abatement, which can be summarised as follows:
• Recorded distributions of saturated and unsaturated zones in the backfill of open pit 1 showed that during low-flow periods a large fraction of the waste rock (35 – 40 %) is unsaturated and thus subject to increased oxygen ingress from the surrounding fractured bedrock, despite the dry cover.
• Turnover time estimates, ranging from 90 days to 3 years, suggest that acid-generating products formed in the waste rock prior to reclamation have been completely washed out and current metal loads in the discharge probably exclusively originate from post-reclamation sulphide oxidation.
• Estimated post-reclamation depletion rates of Cu and Zn sources in the waste rock backfill indicate that release of contaminated drainage from the site may continue for more than 100 years. Thus, further improvement of the reclamation works may be considered relevant.
Acknowledgements The hydrogeological investigations presented in this study were financed by the mining company Boliden Mineral AB and the CAMM programme at Luleå University of Technology (LTU) in Sweden. The water geochemistry investigations were financed by the European Union’s Structural Funds through the non-profit organisation Georange in Sweden. We would like to thank Dr. Dmytro Siergieiev at LTU for valuable insights into the hydrogeological processes discussed and the interest he showed in the project, and Milan Vnuk at LTU for his help with the
figures.
ReferencesAubertin, M., Fala, O., Bussière, B., Martin, V., Campos, D., Gamache-Rochette, A., ... & Chapuis,
R. P. (2002). Analyse des écoulements de l’eau en conditions non saturées dans les haldes à sté-riles. In Proceedings of the Symposium sur l’Environnement et les Mines, Rouyn-Noranda, Canada.
Aubertin, M., Fala, O., Molson, J., Gamache-Rochette, A., Lahmira, B., Martin, V., ... & Wilson, G. W. (2005). Évaluation du comportement hydrogéologique et géochimique des haldes à stériles. In Proceedings of the Symposium sur l’Environnement et les Mines, Rouyn-Noranda, Canada.
Breng N. (2014). Hydrogeological studies of the reclamation measures at the Kimheden open-pit mine, northern Sweden. M.Sc. thesis in preparation. Luleå University of Technology, Sweden.
Carlsson, E., Thunberg, J., Öhlander, B., & Holmström, H. (2002). Sequential extraction of sul-fide-rich tailings remediated by the application of till cover, Kristineberg mine, northern Swe-den. Science of the Total Environment, 299(1), 207-226.
Cravotta III, C. A. (1994). Secondary iron-sulfate minerals as sources of sulfate and acidity: Geo-chemical evolution of acidic ground water at a reclaimed surface coal mine in Pennsylvania. In C. N. Alpers & D. W. Blowes (Eds.), Environmental geochemistry of sulfide oxidation, ACS Sympo-sium Series (Vol. 550, pp. 345-364). Washington, DC: American Chemical Society.
15
Cunningham, W. L., & Schalk, C. W. (2011). Groundwater technical procedures of the U.S. Geological Survey. U.S. Geological Survey techniques and methods 1–A1. US Department of the Interior, US Geological Survey. http://pubs.usgs.gov/tm/1a1/. Last Accessed 3 November 2014.
Fala, O., Molson, J., Aubertin, M., & Bussière, B. (2005). Numerical modelling of flow and capillary barrier effects in unsaturated waste rock piles. Mine Water and the Environment, 24(4), 172-185.
Gammons C. (2009). Subaqueous oxidation of pyrite in pit lakes. In D. N. Castendyk & L. E. Eary (Eds.), Mine pit lakes: characteristics, predictive modeling, and sustainability (Vol. 3, pp. 137-145). Litt-leton, Colorado, USA: Society for Mining, Metallurgy and Exploration.
Gordon, N. D., McMahon, T. A., Finlayson, B. L., Gippel, C. J., & Nathan, R. J. (2004). Stream hy-drology: an introduction for ecologists (2nd ed.). Chichester: John Wiley & Sons.
Hvorslev, M. J. (1951). Time lag and soil permeability in ground-water observations (Bulletin No. 36). Vicksburg, USA: Waterways Experiment Station, U.S. Army Corps of Engineers.
INAP (The International Network for Acid Prevention) (2009). Global Acid Rock Drainage Guide (GARD Guide). Chapter 6. http://www.gardguide.com/. Last Accessed 2nd No-vember 2014.
Lee, G., Bigham, J. M., & Faure, G. (2002). Removal of trace metals by coprecipitation with Fe, Al and Mn from natural waters contaminated with acid mine drainage in the Ducktown Mining District, Tennessee. Applied Geochemistry, 17(5), 569-581.
Lefebvre, R., Hockley, D., Smolensky, J., & Lamontagne, A. (2001). Multiphase transfer processes in waste rock piles producing acid mine drainage: 2. Applications of numerical simulation. Journal of Contaminant Hydrology, 52(1), 165-186.
Lindvall, M., Eriksson, N., & Ljungberg, J. (1999). Decommissioning at Kristineberg mine, Swe-den. In Proceedings of Sudbury ‘99, Mining and the Environment International Conference II, Sudbury, Canada.
Małoszewski, P., & Zuber, A. (1982). Determining the turnover time of groundwater systems with the aid of environmental tracers: 1. Models and their applicability. Journal of Hydrology, 57(3), 207-231.
Payne, F. C., Quinnan, J. A., & Potter, S. T. (2010). Remediation hydraulics. Boca Raton, USA: CRC Press.
Ritchie, A. I. M. (1994). The waste-rock environment. In D. W. Blowes & J. L. Jambor (Eds.), Environmental geochemistry of sulfide mine-wastes, short course handbook (Vol. 22, pp. 201-245). Ontario, Canada: Mineralogical Association of Canada.
Ritchie, A. I. M. (2003). Oxidation and gas transport in piles of sulfidic material. In J. L. Jambor, D. W. Blowes & A. I. M. Ritchie (Eds.), Environmental aspects of mine wastes, short course series (Vol. 31., pp. 73-94). Ontario, Canada: Mineralogical Association of Canada.
Rosén, L., & Wilske, Å. (1994). Beräkningar av metallflöden och förslag till åtgärder vid Kimhedengruvan, Kristineberg. Scandiaconsult Väst AB, Sweden. Boliden Mineral AB’s internal report.
SGU (Geological Survey of Sweden) (2013). Bedömningsgrunder för grundvatten. SGU-rapport 2013:01. Uppsala, Sweden: Sveriges geologiska undersökning (SGU).
16
SMHI (2007). Nederbörd. Normalvärden (1961-1990). http://data.smhi.se/met/climate/time_series/month_year/normal_1961_1990/SMHI_month_year_normal_61_90_precipitation_mm.txt. Last Accessed 21 May 2014.
SMHI (2008). Temperatur. Normalvärden (1961-1990). http://data.smhi.se/met/climate/time_series/month_year/normal_1961_1990/SMHI_month_year_normal_61_90_temperature_celsius.txt. Last Accessed 21 May 2014.
SMHI (2014a). SMHI Öppna Data | Meteorologiska Observationer. http://opendata-down-load-metobs.smhi.se/explore/. Last Accessed 21 May 2014.
SMHI (2014b). Årsavdunstning medelvärde 1961-1990. http://www.smhi.se/klimatdata/hydro-logi/vattenstand/arsavdunstning-medelvarde-1961-1990-1.4096. Last Accessed 21 May 2014.
Smith, L., López, D.L., Beckie, R., Morin, K., Dawson, R., Price, W., (1995). Hydrogeology of waste rock dumps. MEND Associate Project PA-1. Final Report to Department of Natural Resources Canada, Natural Resources Canada.
Vigneault, B., Campbell, P. G., Tessier, A., & De Vitre, R. (2001). Geochemical changes in sulfidic mine tailings stored under a shallow water cover. Water Research, 35(4), 1066-1076.
Villain, L., Alakangas, L., & Öhlander, B. (2013). The effects of backfilling and sealing the waste rock on water quality at the Kimheden open-pit mine, northern Sweden. Journal of Geochemical Exploration, 134, 99-110.
Villain, L., Sundström, N., Perttu, N., Alakangas, L., & Öhlander, B. (2014a). Evaluation of the effectiveness of backfilling and sealing at an open-pit mine using ground penetrating radar and geoelectrical surveys, Kimheden, northern Sweden. Environmental Earth Sciences, 1-15.
Villain, L., Cravotta III, C. A., Alakangas, L., & Öhlander, B. (2014b). Iron speciation and stable oxygen isotopes in the acid mine drainage at a reclaimed open-pit mine site in Kimheden, northern Sweden. Manuscript in preparation.
Weight, W. D., & Sonderegger, J. L. (2001). Manual of applied field hydrogeology. New York: McGraw-Hill.
Williams, D. J. (2000). Assessment of embankment parameters. In W. A. Hustrulid, M. K. McCarter & D. J. A. van Zyl (Eds.), Slope stability in surface mining. Littleton, Colorado, USA: Society for Mining, Metallurgy and Exploration.
Yanful, E. K. (1993). Oxygen diffusion through soil covers on sulphidic mine tailings. Journal of Geotechnical Engineering, 119(8), 1207-1228.
Younger P. L., Banwart S. A., & Hedin R. S. (2002). Mine water: hydrology, pollution, remediation. Dordrecht: Kluwer Academic Publishers.
Younger, P. L., & Sapsford, D. J. (2004). Evaluating the potential impact of opencast coal mining on water quality (Groundwater Regulations 1998): An assessment framework for Scotland. Scottish Environment Protection Agency.


Related Documents


![International Journal of Mining, Reclamation and Environment … · 2013-04-25 · metal mining [2]. Over the last three decades, the largest open pit mining activities worldwide](https://static.cupdf.com/doc/110x72/5f02529a7e708231d403b32d/international-journal-of-mining-reclamation-and-environment-2013-04-25-metal.jpg)