Recidivism rates and the impact of treatment programs September 2014

Welcome message from author
This document is posted to help you gain knowledge. Please leave a comment to let me know what you think about it! Share it to your friends and learn new things together.
Transcript

Recidivism rates and the impact of treatment programs
September 2014www.oics.wa.gov.au
Level 5, Albert Facey House, 469 Wellington Street Perth, Western Australia 6000Telephone: +61 8 6551 4200 Facsimile: +61 8 6551 4216
7272 OIC A3 Review Recidivism Rates.indd 1 8/9/14 10:33 AM

ISSN 1445-3134
This report is available on the Office’s website and will be made available, upon request, in alternate formats.
7272 OIC A3 Review Recidivism Rates.indd 2 8/9/14 10:33 AM

Contents
Inspector’s Overview .............................................................................................................................................. i 1
The rate and cost of recidivism .......................................................................................................................... i
Better functioning prisons have better outcomes ..................................................................................... ii
Factors associated with recidivism ................................................................................................................. ii
Treatment programs ............................................................................................................................................ iii
Availability and allocation .................................................................................................................................. iii
What works? ............................................................................................................................................................ iii
Women in prison .................................................................................................................................................... iv
Conclusion .................................................................................................................................................................. v
Recommendations ................................................................................................................................................. vi 2
Background ................................................................................................................................................................ 1 3
Measuring recidivism ............................................................................................................................................ 2
What is happening in Western Australia ...................................................................................................... 4 4
Recidivism rates ....................................................................................................................................................... 4
Who returns to prison? ......................................................................................................................................... 6
What impact is the Department having? ....................................................................................................... 8 5
Prison performance ................................................................................................................................................ 8
Young people .......................................................................................................................................................... 11
Women ...................................................................................................................................................................... 17
Treatment programs ........................................................................................................................................... 21 6
‘What Works’ principles .................................................................................................................................... 21
Who is recommended for which program? ............................................................................................... 22
What programs are available and who gets access? ............................................................................. 26
Program effectiveness ........................................................................................................................................ 29
Summary .................................................................................................................................................................. 33 7
Appendix A: Key findings ............................................................................................................................................. 36
Appendix B: Department of Corrective Services response to recommendations ............................... 37
Appendix C: Methodology ............................................................................................................................................ 39
Data Collection ....................................................................................................................................................... 39
Description of Recidivism Analysis ............................................................................................................... 39
Treatment Program Analyses .......................................................................................................................... 39
Appendix D: Findings of multivariate recidivism analysis ............................................................................ 40
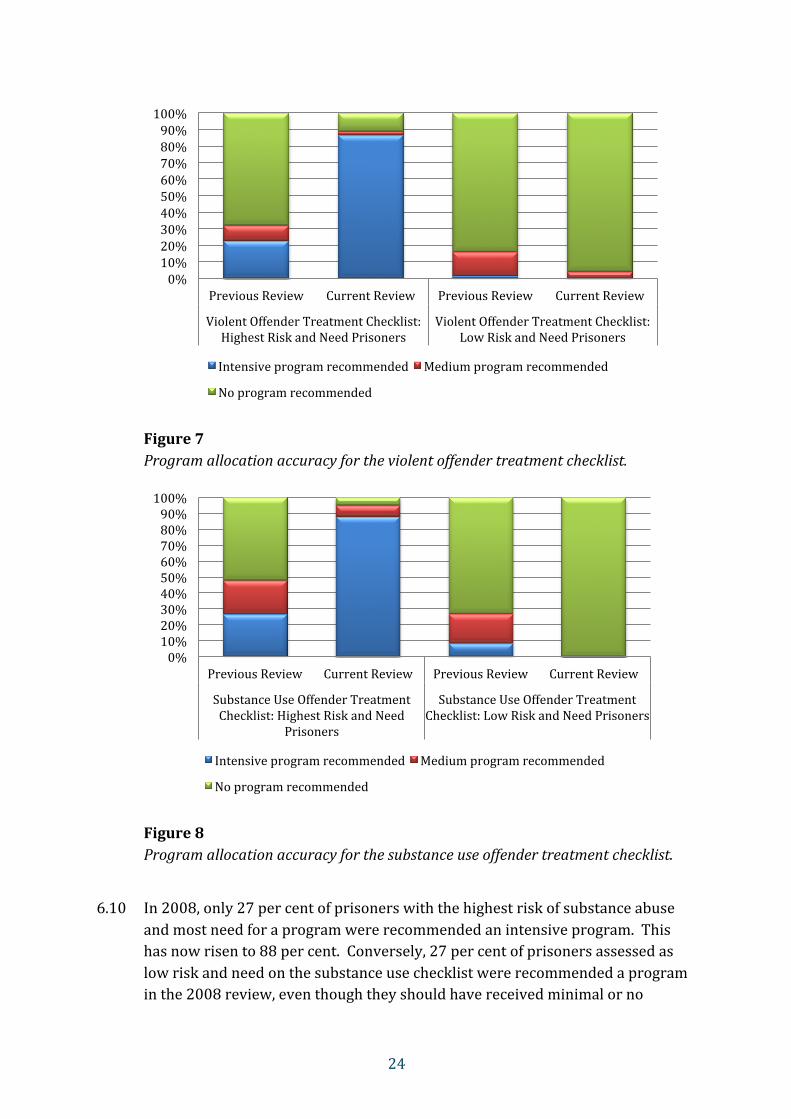
Appendix E: Rate of return for prisoner cohorts released in 2009/10 .................................................... 43

i
Inspector’s Overview 1
Tackling Western Australia’s high recidivism rates: a community and financial necessity
The rate and cost of recidivism Western Australia has high recidivism rates. On average over the past decade, 40 to 45 per cent of people have returned to prison within two years of being released. The figures are worse for some groups, especially younger people and Aboriginal people. Recidivism means more crime, more victims and more financial costs to the state. It places enormous pressures on the prison system, increasing prisoner numbers, overcrowding, and costs.
Given Western Australia has a prisoner population of approximately 5000, a recidivism rate of 40 per cent equates to approximately 2000 people returning to prison in under two years. It costs, on average, around $120,000 per annum to keep one prisoner in prison. Thus, for every ten prisoners who do not return to prison for just one year, the projected saving in direct costs alone is over $1 million. If these ten prisoners never return to prison, the savings are multiplied many times.1 In addition to these direct costs, there are usually additional financial costs (for example, social security support for affected families) and immeasurable social costs.
There was a noticeable decrease in WA’s recidivism rate to 36 per cent for prisoners released in 2009/10. However, there is no clear explanation for what caused the decline and therefore no indication of whether it is likely to continue. One contributing factor was the increase in people being denied early release orders (EROs) from 2009. This caused a small shift in the demographics of all released prisoners. It also meant that prisoners at higher risk of recidivism were less likely to be released in 2009/10 compared to the year before. However, this only delayed the release of these prisoners and the longer term effects of this delay are yet to be seen.
The government has indicated it is focused on reducing recidivism, noting that preventing re-‐offending is the most effective way to cut crime, improve public safety, and reduce the cost to taxpayers.2 In responding to this report, the Department of Corrective Services (‘the Department’) sets itself the commendable target to reduce recidivism by six per cent per year. Meeting this challenge requires a good understanding of what measures work for which prisoners and why, so that investment can be properly utilised.
1 This is based on Departmental estimates of each prisoner costing $317 per day. See Department of Corrective Services. Annual Report 2012/2013 (September 2013).
2 Hon Joe Francis MLA, Minister for Corrective Services, Extra $2m on prisoner rehabilitation programs, media statement (12 August 2014).

ii
Better functioning prisons have better outcomes This review confirmed our belief that well-‐run prisons are more likely to make a positive impact on prisoners’ lives. We found that prisons which had been performing well against the standards of this Office were returning lower recidivism rates than those that were struggling to provide services and to meet standards. It follows that there is a serious risk that increasing prisoner numbers without increasing supporting infrastructure and services will trigger a higher rate of return to prison.
Decisions about how to invest limited public resources are always prioritised. However, it would be a false economy to drive financial saving in prisons at the cost of strategies related to reducing recidivism. These strategies must be valued as highly as the resources needed for managing the day to day running of corrections facilities if we are to alleviate pressure on all resources in the long term.
Factors associated with recidivism This review found that the three factors most strongly linked to recidivism are age, prior prison admissions, and problematic substance use. Over half of sentenced prisoners released in 2008/09 and 2009/10 were identified as having highly problematic substance use.3 The review also found that males, Aboriginal prisoners, and prisoners with low educational attainment were more likely to reoffend. All these findings correspond with national and international research.4
The younger an offender, the more likely they are to return to prison. As they get older, the influence of education and training on reoffending declines, and with each additional admission into prison, the likelihood of returning increases. Therefore the potential to break the cycle of reoffending before it becomes entrenched is highest for young people. Yet they are underrepresented in accessing corrections opportunities to reduce reoffending.
For young Aboriginal people the rate of return to prison is particularly alarming, being 25 percentage points higher than the non-‐Aboriginal recidivism rate. Only 26 per cent of Aboriginal prisoners less than 24 years old were in prison for the first time, compared to 74 per cent of non-‐Aboriginal prisoners in the same age group.
The Department has taken positive steps to start to address the needs of younger male prisoners at the Wandoo Re-‐integration Facility (Wandoo). This facility is currently restricted to 18-‐24 year olds, and has a specialised focus on life skills, education, and training. Post-‐release support is provided, including providing confirmed employment upon release. A recent inspection of this facility found that it was high performing, with its provision of programs and re-‐entry services considered best-‐practice. However,
3 These prisoners were assessed as ‘high’ or ‘highest’ risk on the substance use offender treatment checklist. 4 NSW Department of Corrective Services, Recidivism in NSW: General Study, Research Publication No. 31 (May 1995); Payne, J. Recidivism in Australia: Findings and Future Research (Australian Institute of Criminology, Research and Public Policy Series No. 80, 2007); Australian Bureau of Statistics. An analysis of repeat imprisonment trends in Australia using prisoner census data from 1994 to 2007 (2010). ABS Catalogue no. 1351.0.55.031; Jhi, K & Hee-‐Jong J. ‘Predictors of Recidivism across Age Groups of Parolees in Texas’ (2009) 6(1) Justice Policy Journal.

iii
Wandoo is not yet full and therefore its potential has yet to be maximised. In addition young Aboriginal men are under-‐represented in the facility.
The issues run far deeper in that Wandoo, at present, sits too much apart from the mainstream. First, most prisoners will simply never access the specialised services that it offers. It houses only highly selected minimum security men and there is nothing equivalent for women, and the majority of young men who are in most need of re-‐entry support will not reach minimum security status.
If recidivism is to be reduced, there must be more investment in the large number of young men and women housed in mainstream prisons. Too many of them pass the day in mindless and unconstructive ways. There are no specific strategies in place to target and engage this cohort, treatment programs are lacking, and they are specifically excluded from some programs due to their cognitive immaturity and due to concerns of the influence of older participants.5 Fortunately, the Department is moving to try and address these issues.
Treatment programs While many risk factors are outside the Department’s control, one area where it has invested heavily, with the aim of reducing recidivism, is the provision of treatment programs. However this has not achieved good results.
Availability and allocation
International research shows that treatment programs are effective only if the right program is provided to the right person. If the program is not aligned to the correct person, treatment programs can be harmful. This is exactly what occurred for Western Australian prisoners released in 2008/09 and 2009/10. Those who had completed a program were more likely to return to prison within two years than those who did not complete a program.6
Since then, the Department has made substantial progress in delivering programs to the right prisoners but some major problems remain: too few programs are available for women prisoners and for women and men held in the Aboriginal-‐dominated prisons of Broome, Roebourne, Greenough and Eastern Goldfields.
What works?
Despite more than twenty years of program delivery, and despite criticism dating back many years of the lack of evaluations, the Department does not have any robust evaluations which can explain what works for whom, and why, by way of programs in the Western Australian context.
5 Department of Corrective Services. Offender Services Program Guide (Version 4, December 2011). 6 These results aligned to findings from an OICS review on treatment programs in 2008 which showed that most prisoners at this time were allocated the wrong program or were not allocated a program at all: see OICS, Report into the Review of Assessment and Classification within the Department of Corrective Services, Report No. 51 (Jun 2008).

iv
Programs aimed at reducing recidivism need to be reviewed regularly and refined to adapt to changes in prisoner needs and to maximise their chance of success. Unfortunately, most of the Department’s evaluations have been short term, assessing progress by reference to prisoners’ feedback and surveys and staff assessments at the time. More outcome-‐based evaluations are required.
At the time we compiled this review, only two long term evaluations had been conducted. Both had proved so negative that the programs in question had to be withdrawn.
I strongly encourage innovation, and welcome the Department’s aim to implement evidence-‐based programs which more accurately target the needs and risk profiles of specific prisoner cohorts. However, the Department must also find ways to balance the need for innovation with the need to properly measure effectiveness.
Women in prison It is rare of late that I release a report without making comment on the plight of women in our corrections system. Once again, it is necessary. This review found that the recidivism rate of women was lower than men and appeared to be declining. This may be partly explained by differences in the demographics of female prisoners, who on average were older, better educated, had a lower security rating, and had fewer prior admissions.
While the recidivism rates for women are generally lower than for men, the real question is whether the distinct needs of women are being met. The answer is that they are not. As I have charted in other reports, the prison system as a whole has badly neglected the needs of female prisoners in recent years.7 Specifically, this report found that the Department’s program interventions were not meeting the specific needs of women, particularly those at high risk of returning. Men deemed to be at high risk of substance use had a lower recidivism rate if they completed a treatment program while high risk women who had completed programs showed a greatly increased rate of reoffending.
The reasons for these findings are not entirely clear but it is very clear that programs need to be developed and delivered specifically for female offenders, and especially for those assessed to be at high risk. The dynamics than underpin their offending are not the same as for men.8
7 OICS, Female Prisons in Western Australia and the Greenough Women’s Precinct, Report No. 91 (July 2014); OICS, Report of an Announced Inspection of Bandyup Woman’s Prison, to be published, November 2014.
8 The Department plans to redevelop the ‘Choice, Change, and Consequences’ program to target women who are high risk on the violent offending checklist, which is likely to help. An intensive substance abuse program specifically for women should also be considered.

v
Conclusion Numerous factors affect the likelihood of a person returning to prison, including growing insight and maturity, employment, improved mental health, drug rehabilitation, or ‘finding’ religion or love. Many of these are beyond the Department’s control but some can be addressed by treatment in prison or by support and assistance on release.
Some people, both in and out of corrections, are sceptical of the prospects of reducing recidivism. However, New Zealand is having some success in this area. It has set clear targets for reducing recidivism and is implementing initiatives which are both prison and community-‐based. They include increasing participation in treatment programs, education and employment. Importantly, the New Zealand plan recognises at its core the role of families, non-‐government organisations and private sector service providers as well as the public sector. The results to date are very promising. Two years into the five year plan, New Zealand Corrections have reduced the recidivism rate by 11 per cent.9 Western Australia can also reduce recidivism and therefore improve community safety but this will not occur without sharp planning, innovation, efficiency and community engagement.
Neil Morgan
1 September 2014
9 NZ Department of Corrections, Annual Report 1 July 2012 – 30 June 2013 (September 2013).

vi
Recommendations 2
1
Improve opportunities for young men and women at all the state’s prisons to be involved in meaningful activities, skill development opportunities and education.
13
2 Ensure that the population of Wandoo is increased and that the benefits to the community are evaluated and maximised. In order to achieve this, the Department should: (a) improve the opportunities for young men at mainstream prisons and assist them to meet the Wandoo criteria; and (b) examine amendments to its security classification tool, to allow a more nuanced assessment of youth risk.
16
3 Implement specific strategies targeted at reducing recidivism amongst young female prisoners.
17
4 For interventions governed and justified by the ‘what works’ principles, ensure that these principles are properly followed for program design and allocation.
25
5 Increase the availability of treatment programs in the Aboriginal-‐dominated prisons of West Kimberley, Greenough, Eastern Goldfields and Roebourne.
29
6 Develop appropriate treatment programs for female prisoners, particularly those at high risk of substance abuse and violent offending, and improve access to treatment programs for female prisoners across the state.
29
7 Develop a comprehensive plan and timeline for the long-‐term evaluation of programs.
32
8 As a long term efficiency measure, the government and the Department ensure that adequate resourcing is prioritised for strategies aimed at reducing recidivism.
34
9 For both adult justice and youth justice, the Department publish clear recidivism targets with a corresponding action plan and clear methods for measuring effectiveness.
35

1
Background 33.1 Crime costs Australia approximately $36 billion dollars per year.10 Government
spending on the criminal justice system accounts for approximately one quarter of these costs, distributed between the police, the courts, and corrective services. National trends show an increasing expenditure on the criminal justice system and Western Australia reflects this. Over the past five years, the yearly cost of Corrective Services has increased by nearly $200 million (34%), with an additional $655 million used on capital expenditure.11
3.2 Cost increases in the Western Australian correctives services system coincide with an unprecedented increase in prisoner population. The number of prisoners in adult prisons has increased from approximately 3000 in 2004 to over 5000 in 2014. Not only has the population risen but the cost per prisoner is also rising. In Western Australia, five years ago the cost per prisoner each day was $303.62. Now it is $341.64.12 For 5000 prisoners that is a rise of over $190,000 per day.13
3.3 These cost and population pressures underline the importance of an effective corrective services system. In an effective system, imprisonment will positively influence a prisoner’s life by making them less likely to reoffend in the future. Every 10 less prisoners in the system represents an annual saving of one million dollars.14
3.4 Research has shown that a prison sentence increases the likelihood of reoffending; however, reoffending is less likely if a person undertakes a relevant treatment program (e.g. drug treatment, sexual offender treatment). 15 Other effectively proven rehabilitative measures for reducing reoffending include:16
• Prison-‐based educational and vocational training programs; • Prison-‐based employment programs; • Post-‐release services that aid community re-‐integration; • Drug courts; and • Mental health diversionary programs.
10 Rollings, K, Counting the costs of crime in Australia. Research and Public Policy Series no. 91 (2008), Australian Institute of Criminology.
11 Western Australian Department of Treasury and Finance, 2009-‐10 Budget Statements (Budget Paper 2, Volume 3, May 2009), ISSN 1448–2630; Western Australian Department of Treasury, 2013-‐14 Budget Statements (Budget Paper 2, Volume 2, August 2013), ISSN 1448–2630; DCS Department of Corrective Services. Annual Report 2012/2013 (September 2013).
12 SCRGSP (Steering Committee for the Review of Government Service Provision) 2014, Report on Government Services 2014, Chapter 8 Corrective Services, Productivity Commission, Canberra. Figure provided is the total net operating expenditure and capital costs per prisoner per day.
13 Cost per prisoner from previous years has been adjusted for inflation. 14 This is based on Departmental estimates of each prisoner costing $317 per day. See Department of Corrective Services. Annual Report 2012/2013 (September 2013). If data from ROGS was used, this figure would be slightly higher.
15 Marsh, K., Fox, C. and Sarmah, R, ‘Is custody an effective sentencing option for the UK? Evidence from a meta-‐analysis of existing studies’ (2009) 56 Probation Journal 129.
16 Przybylski, R. What works: Effective recidivism reduction and risk-‐based prevention programs: A compendium of evidence-‐based options for persisting new and persistent criminal behaviour (February 2008). Colorado Department of Public Safety; Borzycki M & Baldry E, Promoting integration: The provision of prisoner post-‐release services, Australian Institute of Criminology, Trends and Issues in Crime and Criminal Justice (no. 262, September 2003)
2
3.5 Recently, the Department’s Commissioner announced an intention to reduce reoffending by five to six per cent per year.17
Measuring recidivism 3.6 Evaluating the effectiveness of correctional interventions requires the
measurement of reoffending. However, actually measuring reoffending (otherwise referred to as recidivism) is not a straightforward process. There is no generally agreed upon definition of recidivism and there are countless approaches to measuring it.18 For example, recidivism could be defined as: an individual being re-‐arrested, having a court appearance, or being convicted and receiving a community-‐based sentence and/or prison sentence. . Alternatively, it may be based on self-‐reported involvement in criminal behaviour.
3.7 Each approach has advantages and disadvantages. Self-‐reported data may be vulnerable to the interviewee misleading the interviewer or failing to recall information; however, it may provide a more accurate picture given that many criminal acts are never reported to the police.19 Overall, the further along in the criminal justice system a data source is, the more likely it is to underestimate the recidivism rate, since many crimes may not be reported, or result in charges being laid. Conversely, using data earlier on in the criminal justice process leads to a greater possibility of recidivism being overestimated, as an individual may be arrested or have a court appearance and not be guilty.20
3.8 The length of time that prisoners are followed-‐up post-‐release also impacts on recidivism estimates. A 10 year return to prison rate will undoubtedly be higher than a 6 month return to prison rate. The period of two years is generally accepted locally, nationally and internationally. Specific counting rules, such as excluding people who return to prison on fine defaults or parole suspensions will also impact the recidivism rate.
3.9 Therefore, rates vary considerably depending on the data source and time frame specified, making it extremely important to clearly describe the method of data collection and analysis undertaken so that appropriate comparisons can be made.21
3.10 Unless otherwise stated, recidivism in this review consists of the return rate of sentenced prisoners who exit prison and return to prison within two years. The calculation:
17 <https://au.news.yahoo.com/thewest/a/23747418/266-‐more-‐inmates-‐for-‐jails/> 18 Payne, J. Recidivism in Australia: Findings and Future Research (Australian Institute of Criminology, Research and Public Policy Series No. 80, 2007).
19 ibid 20 ibid 21 ibid

3
• Excludes prisoners on fine-‐default-‐only-‐sentences and those who return to prison due to a suspended early release order.
• Includes prisoners who return to prison due to a cancelled early release order.
• Counts prisoners multiple times if they are sentenced and released multiple times in the timeframe.
3.11 This definition is in line with what is reported in the Productivity Commission’s annual Report on Government Services (ROGS).22 Return to prison was used as it is far more costly for the state to imprison someone ($342 per day) than to supervise them in the community ($47 per day).23 Returning to prison rather than returning to some form of community supervision also typically indicates more serious or repeated reoffending occurring. Reducing more serious and costly reoffending is of greatest benefit to Western Australia.
3.12 There is a necessary delay in reporting recidivism, as the length of time prisoners are followed-‐up post-‐release must pass before the rate can be calculated. Given the two-‐year follow-‐up period, the latest available data at the time of this review’s commencement was the recidivism rate for 2009/10.
22 SCRGSP (Steering Committee for the Review of Government Service Provision) 2014, Report on Government Services 2014, Chapter 8 Corrective Services, Productivity Commission, Canberra.
23 ibid

4
What is happening in Western Australia 4
Recidivism rates 4.1 Recidivism rates in Western Australia have been relatively stable over the past
decade, with the return to prison rate typically between 40 and 45 per cent. However, for prisoners released in 2009/10, there was a sharp decrease in recidivism. There is no clear explanation for what caused this decline.
Figure 1 Annual recidivism rates for prisoners released from 2001/02 to 2009/1024
4.2 This decline is in contrast to other jurisdictions, none of whom have experienced a rate drop of this magnitude during the past decade. With the exception of the Northern Territory, Western Australia’s recidivism rate has typically been higher than all other states. Western Australia went from having a recidivism rate 4.4 percentage points higher than the national average for prisoners released in 2008/09, to being 3.2 percentage points lower than the national average for prisoners released in the following year.25
4.3 A potential contributing factor to this decline was a change in the manner in which prisoners were released during this period. In 2008/09, 66 per cent of prisoners released from prison were discharged through an early release order -‐ otherwise known as parole. This dropped to 34 per cent in the following year.26 The drop was caused by an increase in applications being denied,27 coinciding with a change in the Chair of the Prisoner’s Review Board.
24 This was the latest available data at the time of the review’s commencement. 25 SCRGSP (Steering Committee for the Review of Government Service Provision) 2014, Report on Government Services 2014, Chapter 8 Corrective Services, Productivity Commission, Canberra.
26 While not technically ‘parole’, prisoners released on a ‘re-‐entry release order’ were counted as being released via an early release order in these analyses.
27 In 2008/09, 855 ERO applications were denied. This increased to 2112 in 2009/10. See Prisoners Review Board, Annual report for the year ended 30 June 2010 (September 2010).
41.13%
43.59%
44.45%
43.29%
42.27%
44.66%
45.29% 44.15%
36.15%
0% 5% 10% 15% 20% 25% 30% 35% 40% 45% 50%
2001/02 2002/03 2003/04 2004/05 2005/06 2006/07 2007/08 2008/09 2009/10
Return to Prison Rate (%
)
Year Prisoner Released

5
4.4 All prisoner cohorts were affected by the drop in parole provision, though some cohorts were more acutely affected:
• 45 per cent of maximum security prisoners released in 2008/09 were discharged via parole. In 2009/10 this declined to 4 per cent.
• 57 per cent of Aboriginal prisoners released in 2008/09 were discharged via parole. In 2009/10 this declined to 18 per cent.
• 51 per cent of prisoners with over 10 prior prison admissions released in 2008/10 were discharged via parole. In 2009/10 this declined to 11 per cent.
4.5 Prisoners most affected by the decline in parole provision were those with factors that increased their risk of reoffending.28 Effectively, those most likely to attain parole were those least likely to reoffend.
4.6 Yet, despite over a 1000 more parole applications being denied in 2009/10, there were only 190 fewer prisoners released compared to the previous year. Therefore a near equivalent increase in the number of prisoners being released without parole occurred in 2009/10.
4.7 The effect of the decline in parole attainment was a small shift in the demographics of all released prisoners. Prisoners at a higher risk of recidivism were less likely to be released in 2009/10 compared to the year before. However these demographic changes were not to the extent that explains the entire decline in recidivism.
4.8 Other factors potentially contributing to the decline were therefore examined. These included:
• Court finalisation times: There was no evidence of courts taking longer to finalise matters after 2009/10 compared to the year before.29 It is unlikely that court finalisation times contributed to the decrease in the recidivism.
• Police sanction rates: 30 Broadly speaking, the police use the term ‘sanction rate’ to refer to what was previously called the ‘clear-‐up’ rate. The sanction rate in the two years following 2009/10 was lower compared to the year before.31 This may have resulted in fewer offenders released in 2009/10 being apprehended and sent to prison. It is possible that this contributed to the decline in the recidivism rate.
4.9 Overall, there are innumerable factors potentially contributing to recidivism, many of which are outside of the Department’s control. While the recidivism rate did drop at the same time as a drop in the number of people on parole, it
28 See para 4.11 29 Department of the Attorney General (WA), Annual Report 2011/12 (September 2012). 30 The sanction rate is the proportion of verified offences where an offender has either been apprehended, processed, or where the police investigation is not able to be continued (e.g. the complaint is withdrawn). See WA Police, Annual Report 2012 (September 2012).
31 WA Police, Annual Report 2012 (September 2012).

6
would be premature to conclude that there is any link. Other studies have generally shown that prisoners released on parole, and under supervision, are less likely to reoffend, and that if they do re-‐offend, there is a longer period before re-‐offending.32 It is possible the next few years will see the recidivism rate climb back up, especially as those prisoners denied parole are released straight into the community. This is clearly an area in which further research is needed.
Who returns to prison?
4.10 Some prisoners are more likely to return to prison than others. A multivariate analysis33 of prisoners released in the 2008/09 and 2009/10 financial years showed several prisoner characteristics34 associated with recidivism. A detailed description of the analysis, the measurement of factors, and findings are outlined in appendices C, D, and E. Potential reasons for non-‐significant results are also discussed.
4.11 Key factors increasing the risk of reoffending included the following:
• Age: as age increases the likelihood of recidivism declines.
• Prior prison admissions: each additional admission into prison increases the likelihood of further admissions occurring.
• Gender: males were more likely to reoffend compared to females.
• Aboriginal status: Aboriginal prisoners were more likely to reoffend compared to non-‐Aboriginal prisoners.
• Security Rating: maximum security prisoners were more likely to reoffend compared to medium security prisoners, who in turn were more likely to reoffend compared to minimum security prisoners.
• Educational attainment: prisoners who had completed part secondary education without pursuing further qualifications were more likely to reoffend compared to prisoners who had completed secondary schooling or who had pursued some sort of post-‐secondary qualification (e.g. tertiary education or an apprenticeship).
• Substance use risk rating: prisoners who were classified as high or highest risk on the substance use offender treatment checklist were more likely to reoffend compared to prisoners who were either low or moderate risk, or who did not complete the checklist.35
32 Han, R.G., William, G.H. and Pease, K. ‘Does parole reduce the risk of reconviction?’ (1991) 30(1) The Howard Journal 66; Ellis, T. and Marshall, P. ‘Does Parole Work? A Post-‐Release Comparison of Reconviction Rates for Paroles and Non-‐Paroled Prisoners’ (2000)33(3) The Australian and New Zealand Journal of Criminology 300.
33 A multivariate analysis assesses the association between multiple factors and an outcome variable. See Appendix C for further information.
34 Factors were chosen based on theoretical rationale and their availability in the Department’s databases, it was not intended as an exhaustive list. There are many other factors that contribute to reoffending that were not available to be examined in the analysis, such as the availability of housing, employment, and family dynamics.
35 Prisoner intervention needs are assessed via treatment checklists. Prisoners serving a sentence of less than 6 months duration are typically not assessed. In addition, prisoners would only complete checklists related to their offending behaviour.

7
• Treatment program completion: prisoners who completed at least one treatment program prior to release were more likely to reoffend compared to prisoners who did not complete a treatment program.
4.12 A number of factors did not appear to be significantly associated with recidivism. They included:
• Mental illness; • Intellectual disability; and
• Violent offending risk rating (those rated a high or highest risk of violent reoffending were no more likely to re-‐offend than other prisoner groups).
4.13 Sex offender risk ratings also proved interesting: prisoners classified as high risk on the sex offender checklist were actually less likely to reoffend than other prisoner groups. Prisoners classified as highest risk were no more likely to reoffend compared to other prisoner groups.
4.14 Of the factors associated with recidivism, the three strongest relationships were with age, prior prison admissions, and problematic substance use. Over half of sentenced prisoners released in 2008/09 and 2009/10 were identified as having highly problematic substance use.36 These findings along with the findings that males, Aboriginal prisoners, and prisoners with low educational attainment were more likely to reoffend, corresponds with national and international research.37
4.15 The analysis found that prisoners who completed a treatment program had an increased likelihood of returning to prison.38 This is not supported by national and international research. These results are discussed further in chapter six.
36 These prisoners were assessed as ‘high’ or ‘highest’ risk on the substance use offender treatment checklist. 37 NSW Department of Corrective Services, Recidivism in NSW: General Study, Research Publication No. 31 (May 1995); Payne, J. Recidivism in Australia: Findings and Future Research (Australian Institute of Criminology, Research and Public Policy Series No. 80, 2007); Australian Bureau of Statistics. An analysis of repeat imprisonment trends in Australia using prisoner census data from 1994 to 2007 (2010). ABS Catalogue no. 1351.0.55.031; Jhi, K & Hee-‐Jong J. ‘Predictors of Recidivism across Age Groups of Parolees in Texas’ (2009) 6(1) Justice Policy Journal.
38 A likely argument may be that prisoners who present a higher risk to the community are more likely to undertake a treatment program; however, the type of analysis undertaken accounted for the prisoner’s risk and so negates this explanation.

8
What impact is the Department having? 55.1 It remains to be seen whether the drop in the recidivism rate for 2009/10 can be
sustained and its causes are not clear. However, the stability of the recidivism rate prior to 2009/10 suggests that Departmental initiatives have had little impact on reducing recidivism. Recidivism rates vary greatly between prisons. Not surprisingly, after accounting for differing prisoner characteristics and risk factors, the prisons that have performed poorly during OICS inspections are also the prisons where recidivism rates have been much higher than expected. Further inquiry is needed to better understand the different opportunities for reducing recidivism that are available to prisoners in different prisons. At a minimum it is clear the Department is missing opportunities to target prisoners who are most likely to return to prison.
Prison performance 5.2 Prisons in Western Australia are designed for different purposes and have
different levels of security. Some prisons are best described as pure maximum, medium, or minimum facilities based on their design, philosophy, and operational procedures. These prisons can hold prisoners of a lower security classification (for example, the vast majority of prisoners at Bandyup Women’s Prison are minimum or medium security). Some prisons are best described as ‘multi-‐security’ as they are designed and intended for prisoners of all security ratings. With the exception of Bunbury Regional Prison, multi-‐security prisons hold both males and females.
5.3 The security rating of the facility influenced recidivism rates, with maximum security prisons having the highest recidivism rate, closely followed by multi-‐security facilities. Minimum security facilities had the lowest recidivism rate. Facilities were categorised by their maximum allowable security rating.

9
Table 1 Recidivism rate for each Departmental facility for prisoners released in 2009/10
Prison39 Returned to Prison Maximum 41.5%
Albany Regional Prison 39.3% Bandyup Women’s Prison 36.6% Casuarina Prison 44.6% Hakea Prison 42.7%
Medium 36.3% Acacia Prison 36.3%
Minimum40 25.0% Boronia Pre-‐release Centre 18.8% Karnet Prison Farm 22.4% Wooroloo Prison Farm 27.5%
Multi-‐Security 38.1% Broome Regional Prison 32.4% Bunbury Regional Prison 39.4% Eastern Goldfields Regional Prison 44.8% Greenough Regional Prison 33.1% Roebourne Regional Prison 42.3%
5.4 However, simple comparisons between facilities are misleading as they do not take into account differences in prisoner profiles. For example, the Boronia Pre-‐release Centre and Karnet Prison Farm have the lowest recidivism rate yet they also have older prisoners and the highest proportion of prisoners who have never been to prison before, two crucial risk mitigating factors. Comparisons between facilities with different security ratings are also problematic as there are differences in the characteristics of prisoners who attain minimum security versus prisoners who are maximum security.41 Consequently, a 40 per cent recidivism rate may be a great achievement for some prisons, while for others a 25 per cent recidivism rate may be greatly concerning.
5.5 Accounting for the characteristics of each prison’s population gives a more accurate indication of the effectiveness of each facility. Prisons were ranked by the proportion of prisoners released in 2009/10 with high-‐risk factors for recidivism.42 This ‘risk index’ was then compared against the recidivism rate ranking of each prison. This revealed which prisons were performing at, above or below expectations based on their prisoner cohort.
39 Prisoners who were not in the facility for at least a week prior to release were not included in the calculation of recidivism rates. This primarily affected the recidivism rate of regional prisons as it is common for a prisoner to spend most of their sentence in a metropolitan prison (due to the availability of programs) before being returned to their ‘home’ prison immediately prior to release.
40 Pardelup Prison Farm was removed from the comparisons as it had only six prisoners released in the timeframe. 41 Minimum security prisoners are less likely to be young, have prior prison admissions and prison disciplinary convictions as these are considered risk factors in the Department’s security classification tool.
42 High risk cohorts included: males, Aboriginal prisoners, 18-‐24 year old prisoners, prisoners who were medium/maximum security, prisoners with low educational attainment, prisoners who were not high risk on the sex offending checklist, prisoners who had been in prison previously and prisoners who had a high/highest substance use risk rating. Prisoners who were at the prison for less than a week prior to release were excluded from the analysis. Refer to appendices C and D for more information.

10
Table 2 Prison performance based on prisoner characteristics and recidivism rate
Prison Performance Rating Maximum
Albany Regional Prison Above expectations Bandyup Women’s Prison Below expectations Casuarina Prison As expected Hakea Prison Well below expectations
Medium Acacia Prison Well above expectations
Minimum Boronia Pre-‐release Centre As expected Karnet Prison Farm As expected Wooroloo Prison Farm As expected
Multi-‐Security Broome Regional Prison Above expectations Bunbury Regional Prison Below expectations Eastern Goldfields Regional Prison Well below expectations Greenough Regional Prison Well above expectations Roebourne Regional Prison As expected
5.6 Acacia Prison and Greenough Regional Prison performed well above expectations. These prisons had a very high-‐risk prisoner cohort yet achieved recidivism rates that were close to the state average. These findings were consistent with inspections conducted around the 2009/10 period, which had concluded that both of these prisons were operating well. Acacia was considered one of the highest performing prisons in the state,43 and Greenough was described as a well performing, ‘quiet achiever’.44
5.7 Conversely, Eastern Goldfields Regional Prison and Hakea Prison performed well below expectations. While these prisons had very different prisoner profiles, their recidivism rates were higher than what would be expected based on the characteristics of prisoners released. Again this is consistent with inspection findings. In 2009, overcrowding across the state resulted in sentenced prisoners being unable to transfer out of Hakea Prison, placing a strain on education, employment, and treatment programs within the facility and limiting access for prisoners.45 Similarly, Eastern Goldfields Regional Prison was described as neglected, with limited services available.46
5.8 The key conclusion, then, is that prisoners are more likely to reoffend when they are released from prisons that have identified deficiencies in service provision.
43 OICS, Report of an announced inspection of Acacia Prison, Report No. 71 (March 2011). 44 OICS, Report of an announced inspection of Greenough Regional Prison, Report No. 66 (June 2010). 45 OICS, Report of an announced inspection of Hakea Prison, Report No. 63 (April 2010). 46 OICS, Report of an announced inspection of Eastern Goldfields Regional Prison, Report No. 72 (June 2011).

11
Young people 5.9 The younger an offender, the more likely they are to return to prison. As they get
older, the influence of education and training on reoffending declines, and with each additional admission into prison, the likelihood of returning increases. Therefore the potential to break the cycle of reoffending before it becomes entrenched is highest for young people. Yet they are underrepresented in accessing corrections opportunities to reduce reoffending.
5.10 There are undoubtedly some uncontrollable factors contributing to the higher recidivism rate of young people. The still maturing brain of a young person results in poorer impulse control, riskier decision making processes, and a heightened sensitivity to social pressures.47 The 18-‐24 age group had the highest rate of reoffending, with 60 per cent of 18 and 19 year olds returning to prison. If recidivism was measured as a prisoner returning to corrections generally rather than returning to prison, the 18-‐19 year old recidivism rate approached 90 per cent. These findings reflect previous research which has found that offending peaks in late adolescence.48
Figure 2 Recidivism rates of Aboriginal and non-‐Aboriginal prisoners based on age
5.11 For young Aboriginal people in the 18-‐24 age group the rate of return to prison is particularly alarming:
47 Richards K . ‘What makes juvenile offenders different from adult offenders? ‘Trends & Issues in Crime and Criminal Justice, Issue no. 409 (Canberra: Australian Institute of Criminology, 2011).
48 Watt B, Howells K & Delfabbro P. ‘Juvenile recidivism: Criminal propensity, social control and social learning theories' (2004) 11 (1) Psychiatry, Psychology and Law 141.
0%
10%
20%
30%
40%
50%
60%
70%
18 19 20 21 22 23 24 25 26 27 28 29 30 31 32 33 34 35 36 37 38 39 40 41 42 43 44 45 46 47 48 49 50
Return to Prison Rate (%
)
Age
Aboriginal Non-‐Aboriginal

12
• The Aboriginal recidivism rate is 25 percentage points higher than the non-‐Aboriginal recidivism rate.
• Only 26 per cent of Aboriginal prisoners were in prison for the first time. This compares with 74 per cent of non-‐Aboriginal prisoners in the same age group. 49
5.12 This Office has noted numerous times that service provision in mainstream prisons does not meet the needs of young adults, particularly Aboriginal young adults. There are no specific strategies in place to target and engage this cohort.50 In particular, positive meaningful activities and treatment programs for young people are lacking, and they are specifically excluded from some programs due to their cognitive immaturity and due to concerns of the influence of older participants.51
5.13 Research has found that education and training programs are generally a cost-‐effective method to reduce recidivism,52 and are more effective in reducing reoffending among younger prisoners than older prisoners.53 This is likely due to the lesser criminal history of young people. As prisoners get older and their criminal history grows, the potential for education and training to improve job prospects and therefore alter a person’s life trajectory appears to diminish. In addition, younger prisoners typically learn faster, and due to their higher baseline recidivism rate, have a more substantial decline in their likelihood of returning to prison compared to older prisoners.54 Put simply, you get more ‘bang for your buck’ targeting young people with educational and training programs.
5.14 Our analysis corroborates previous research. When the relationship between educational attainment and recidivism was compared across age groups, we found 18-‐24 year old prisoners were the only group with a significant association between education and recidivism. As people got older, the effect of education and training appeared to have less of an effect.
5.15 It is clear there needs to be further effort to engage young people in meaningful activity within mainstream prisons. As noted in the latest inspection of Casuarina Prison, it is an all too common sight to see young men sitting idly by in prisons as
49 Only adult prison admissions were included in this comparison. Given that 70% of juvenile detainees are Aboriginal, the overall disparity between Aboriginal and non-‐Aboriginal prior incarceration is likely even more pronounced.
50 See OICS, Report of an announced inspection of Casuarina Prison, Report No. 88 (March 2014); OICS, Report of an announced inspection of Hakea Prison, Report No. 81 (January 2013); OIC S, Report of an announced inspection of Albany Regional Prison, Report No. 78 (August 2012); OICS, The diminishing quality of prison life: Deaths at Hakea Prison 2001 -‐ 2003, Report No. 22 (March 2004); OICS, Annual Report 2011-‐2012 (September 2012).
51 Department of Corrective Services. Offender Services Program Guide (Version 4, December 2011). 52 Przybylski, R. What works: Effective recidivism reduction and risk-‐based prevention programs: A compendium of evidence-‐based options for persisting new and persistent criminal behaviour (Colorado Department of Public Safety, February 2008).
53 Jhi, K & Joo H. ‘Predictors of Recidivism across Age Groups of Parolees in Texas’ (2009), Justice Policy Journal. Vol.6, No.1; Criminal Justice Policy Council, Impact of Educational Achievement of Inmates in the Windham School District on Recidivism (August 2000) < http://www.lbb.state.tx.us/Public_Safety_Criminal_Justice/Reports/WSDREC10.PDF>
54 Criminal Justice Policy Council, Impact of Educational Achievement of Inmates in the Windham School District on Recidivism (August 2000) < http://www.lbb.state.tx.us/Public_Safety_Criminal_Justice/Reports/WSDREC10.PDF>

13
there is nothing available for them to do. 55 This lack of engagement in meaningful activity is evident by the proportion of young people engaged in prison employment or education:56
• 18-‐24 year olds comprise 31 per cent of all sentenced prisoners who are classified as ‘not working’ despite making up only 18 per cent of sentenced prisoners across the state.
• ‘Work’ includes full time education, but twice as many 18-‐24 year old sentenced prisoners are ‘not working’ compared with those in full time education.
• Even when employed, young people are overrepresented in lower gratuity level jobs such as unit workers (i.e. cleaners). Only seven per cent of sentenced prisoners receiving the highest level of gratuities are 18-‐24 years old.
5.16 In summary, the findings are very clear: too many young people are not accessing opportunities in mainstream prisons to reduce their chance of reoffending. A targeted approach in reducing recidivism for this age group will have exponential benefits in later years, and consequently the greatest impact in long term reduction in recidivism rates. At a minimum, opportunities for young people to be engaged in meaningful activity needs to be improved.
Recommendation 1
Improve opportunities for young men and women at all the state’s prisons to be involved in meaningful activities, skill development opportunities and education.
5.17 While mainstream prisons lack targeted services for young adults in prison, the specialised Wandoo Re-‐integration Facility (Wandoo) has been developed explicitly to meet the needs of this group. This privately run facility began operations in November 2012 and is specifically designed to reduce reoffending in the 18-‐24 year old age group through a focus on life skills, education, and training. Post-‐release support is provided by Mission Australia. The contract for services includes a number of performance measures that aim to reduce recidivism, including a focus on people having confirmed employment upon release.
5.18 It will not be known how effective Wandoo is in preventing recidivism until at least the 2014/15 financial year (if assessed using a two-‐year prison return rate). It is also not yet known whether Wandoo is fulfilling its potential as an educational and training hub for young people. An inspection of the facility occurred mid-‐2014 and found that it was a high performing facility, with its
55 OICS, Report of an announced inspection of Casuarina Prison, Report No. 88 (March 2014). 56 Data extracted on the 7 February, 2014.

14
provision of programs and re-‐entry services considered best-‐practice. Wandoo is not yet full and its potential has yet to be maximised.
5.19 The ability to fill Wandoo is restricted by the relatively small number of young people who attain a minimum security rating. Only 20 per cent of sentenced prisoners aged 18-‐24 are rated as minimum security, in comparison to 52 per cent of sentenced prisoners over the age of 50.
5.20 Of particular concern is the underrepresentation of Aboriginal people in the facility. Despite constituting 55 per cent of the 18-‐24 year old cohort, they represent only 30 per cent of Wandoo’s population as of February 2014. This reflects systemic issues, not Wandoo’s policies. Aboriginal prisoners across the state are less likely to attain a minimum security rating and therefore access Wandoo, with only 15 per cent of 18-‐24 year old Aboriginal prisoners rated minimum security compared to 24 per cent of non-‐Aboriginal prisoners. These low numbers can be attributed to the Department’s security classification tool, which in addition to age, considers prior prison admissions, prison charges, and parole denials as risk factors that decrease the likelihood of a person achieving minimum security.57 Young Aboriginal prisoners are more likely to have these additional risk factors and therefore are less likely to attain minimum security. The under-‐representation of Aboriginal prisoners at Wandoo therefore reflects system-‐wide inequity in security ratings between Aboriginal and non-‐Aboriginal prisoners.
5.21 Non-‐Aboriginal prisoners with no prior admissions in the 18-‐24 age group are at a very low risk of re-‐offending compared to the rest of the 18-‐24 year old prisoner cohort. Yet, they constitute close to 50 per cent of Wandoo’s current population.58 A low recidivism rate at Wandoo may therefore be a product of its prisoner characteristics rather than its specially designed interventions.
57 See OICS, Report on the Flow of Prisoners to Minimum Security, Section 95 and Work Camps (January 2013). 58 Non-‐Aboriginal prisoner with prior prison admissions made up 22% of Wandoo’s population.
15
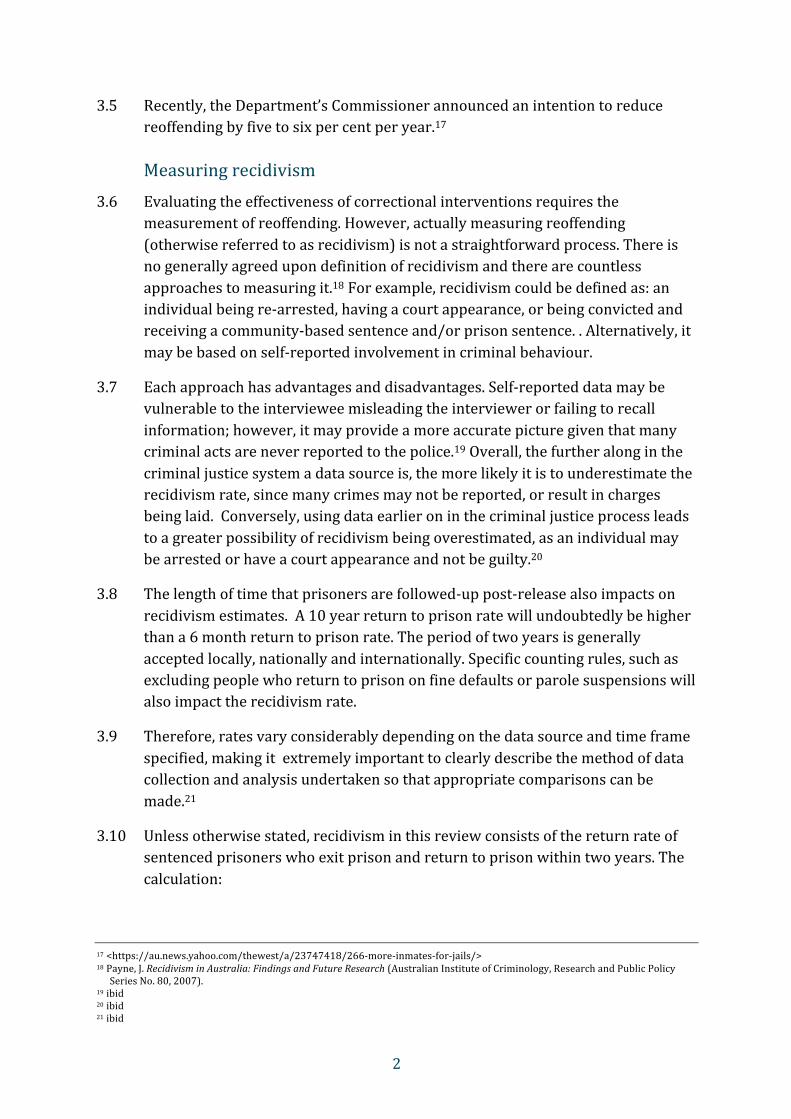
Figure 3 Recidivism rate of 18-‐24 year olds versus their current representation in Wandoo
5.22 Despite being open since November 2012, Wandoo is only operating at 60 per cent capacity. If it is not filled to capacity, and if it is predominately populated by prisoners who are unlikely to reoffend, then potential benefits to the community are not being maximised.
5.23 Very similar concerns have been raised at the other specialised minimum security facility reintegration facility, the publicly-‐run Boronia Pre-‐Release Centre for Women.59 Boronia has by far the lowest risk prisoner population in the state. Currently, 56 per cent of Boronia’s population are non-‐Aboriginal women with no prior admissions. This cohort has a 17 per cent recidivism rate. Aboriginal women with prior admissions comprise 15 per cent of the population while having a 33 per cent recidivism rate. No analyses have ever been undertaken to determine if Boronia actually works in reducing reoffending.60
5.24 There are a number of potential measures to address the under-‐use of Wandoo, some of which are currently being considered by the Department.61 The most straightforward approach would be to increase the age limit of Wandoo by a couple of years. The Department’s classification tool is strictest on those between the ages of 18 and 24, and so increasing the age limit will result in many 25 and 26 year olds being eligible for Wandoo. This is a low risk, low cost option for the Department. However, as previously noted, in terms of reducing recidivism,
59 See OICS, Report of an inspection of Boronia Pre-‐release Centre for Women, Report No. 71 (July 2012). 60 ibid 61 Standing Committee on Public Administration, Standing Order 5.3(a)(i) Inquire into and report on -‐ the structure, efficiency and effectiveness of the system of public administration – Transcript of evidence (9 April 2014).
0%
10%
20%
30%
40%
50%
60%
70%
Aboriginal -‐ Prior Prison Admissions
Aboriginal -‐ No Prior Prision Admissions
Non-‐Aboriginal -‐ Prior Prison Admissions
Non-‐Aboriginal -‐ No Prior Prision Admissions
Prisoner characteris-cs
Return to Prison Rate Proportion of Wandoo's Population

16
there are diminishing returns as prisoners get older. Raising the age profile of the facility will therefore limit the potential benefits to the community.
5.25 Irrespective of whether the Wandoo age range is increased, it is vital to ensure there is sufficient access for people aged 18-‐24. There are two components to this. First, in line with recommendation 1, more needs to be done for young people in mainstream prisons to help equip them for potential transfer to Wandoo. Secondly, consideration should be given to modifying the security classification tool so as to promote a more nuanced assessment of security rating for young people. While age is a risk factor for escape and public risk needs to be managed, an adjustment to the tool would not be without precedent. The New Zealand Department of Corrections identified similar difficulties in getting young people to participate in re-‐integrative activities and so lowered the weighting for age and introduced a separate risk of harm score.62 As a result, more young people began participating in re-‐integrative activities while any increased risk was mitigated.
Recommendation 2 Ensure that the population of Wandoo is increased and that the benefits to the community are evaluated and maximised. In order to achieve this, the Department should: (a) improve the opportunities for young men at mainstream prisons and assist them to meet the Wandoo criteria; and (b) examine amendments to its security classification tool, to allow a more nuanced assessment of youth risk.
5.26 It is also important to ensure an adequate focus on young women. Wandoo has enormous potential but is limited to young men. No young offender facility exists for women, and none has been seriously considered, despite this group having a similarly increased propensity for reoffending compared to older women. The situation for women is exacerbated by the lack of female minimum security options. This results in many young minimum security women being placed at Bandyup, an overcrowded, under-‐stress, maximum security facility, where access to reintegration activities is severely limited. Due to the small number of 18-‐24 year old female prisoners, 63 a dedicated young female facility is unlikely to be built, but future Departmental planning need to factor this in. This Office has already made recommendations in this area64 but the issue is of such importance that the need for urgent reform is reiterated.
62 New Zealand Department of Corrections, Annual Report 1 July 2012 – 30 June 2013 (September 2013). 63 In 2009/10, 51 women aged 18-‐24 were released from prison. Approximately half were minimum security. 64 See OICS, The management of young women and girls at Banksia Hill Detention Centre, Report no. 86 (October 2013) recommendation 2; OICS, A review of women’s imprisonment and Greenough as a prison for women (forthcoming report) recommendation 2.

17
Recommendation 3 Implement specific strategies targeted at reducing recidivism amongst young female prisoners.
Women 5.27 Women in prison have very different needs compared to men. A survey of
Western Australian women in prison found that 96 per cent had a history of mental illness, substance abuse, or were a victim of abuse.65 Aboriginal women were found to be particularly disadvantaged. The criminal offences of women also tend to occur in different circumstances to men, with women more likely to be charged with drug, theft, and fraud offences.66 Prisons with women therefore need to reflect the biological, social, and cultural distinctions of women if interventions are to be effective.
5.28 While the recidivism rate of women was lower than men and appeared to be declining, the Department’s interventions were not meeting the specific needs of women, particularly those at high risk of returning.
5.29 More than a quarter of women (28 per cent) released in 2009/10 returned to prison within two years, compared to 37 per cent of men. There is little research consensus on why women reoffend less than men. In the current dataset, the difference between male and female recidivism can partly be explained by differences in the demographics of female prisoners, who on average are older, better educated, have a lower security rating, and have fewer prior admissions. Research has also found that women are less likely to commit serious crimes and are less likely to receive terms of imprisonment when sentenced,67 and so this may result in fewer women returning to prison and being counted as recidivating. However, there are likely other individual and societal factors contributing to the lower recidivism rate of women.
5.30 The female recidivism rate has been steadily declining since the mid-‐2000’s. This differs to the male recidivism rate, which has generally been stable until the sudden decline in 2009/10 (see Figure 4).
65 Western Australian Department of Justice, Profile of women in prison: Main findings of the prisoner characteristics and needs survey of adult female prisoners in Western Australia (June 2002).
66 Australian Bureau of Statistics, Prisoners in Australia (December 2011), 4517.0. 67 Ross, S, Forster, K. Female prisoners: Using imprisonment statistics to understand the place of women in the criminal justice system, Paper presented at the Women in Corrections: Staff and Clients Conference convened by the Australian Institute of Criminology in conjunction with the Department for Correctional Services SA and held in Adelaide, 31 October – 1 November 2000.
18
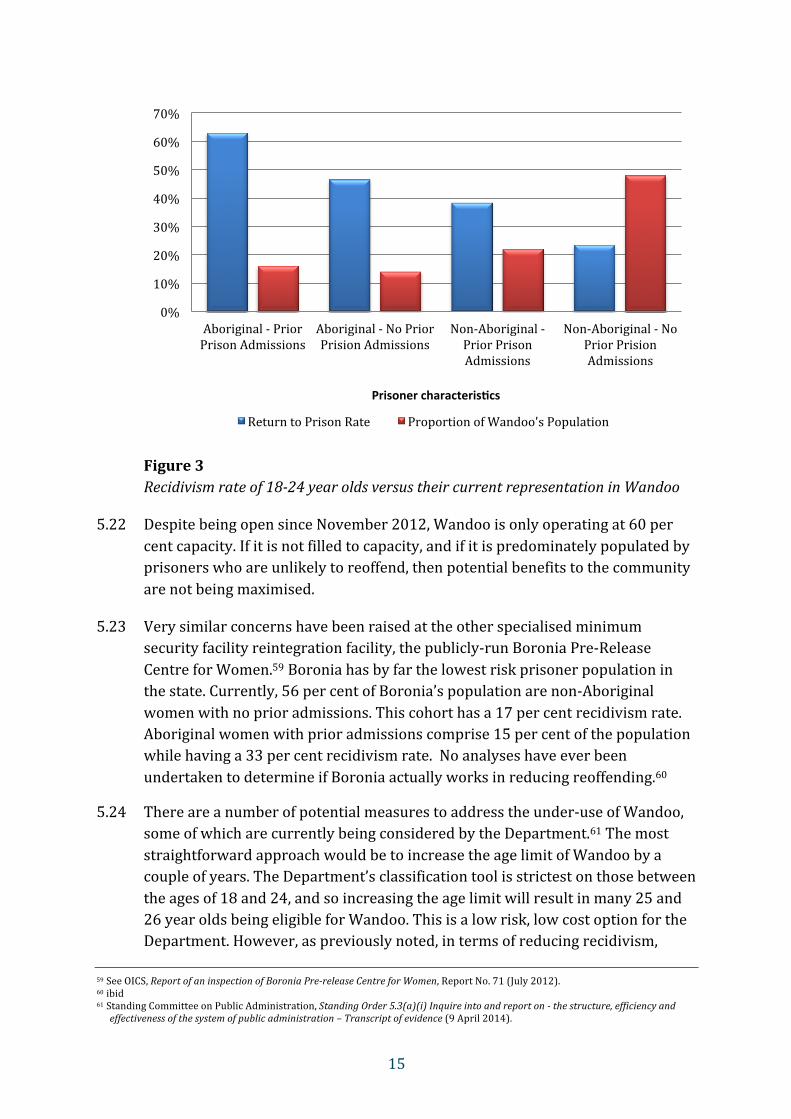
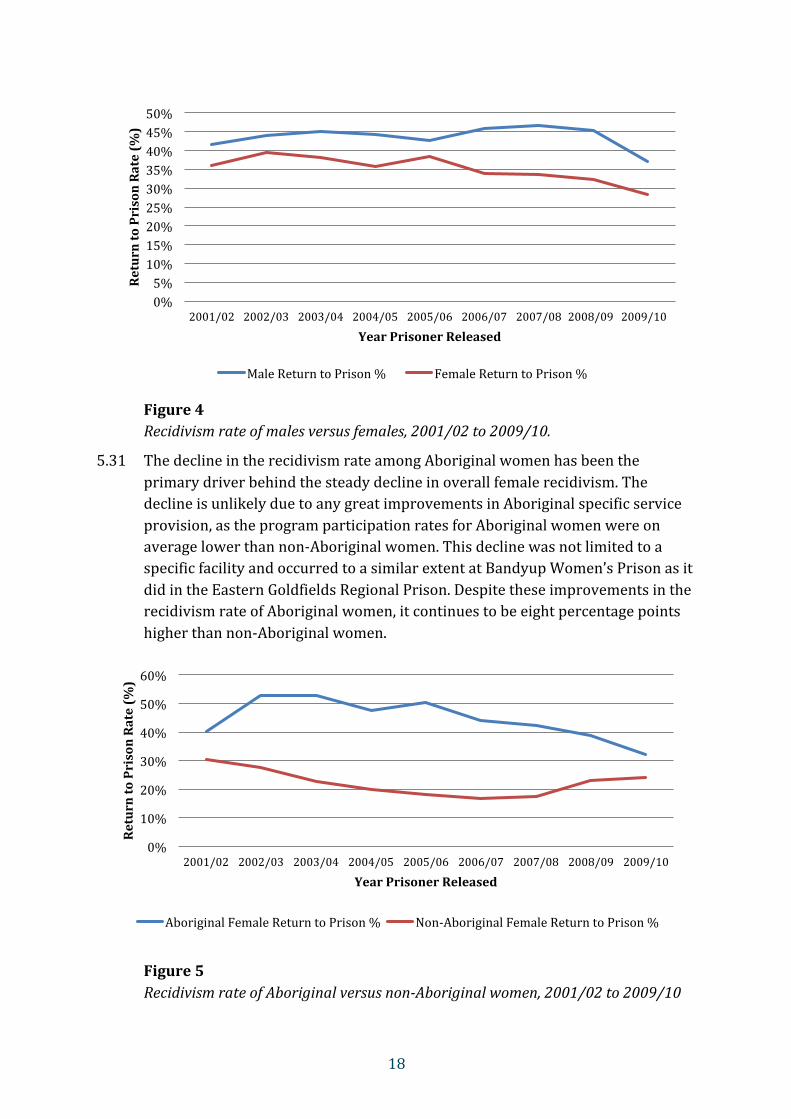
Figure 4 Recidivism rate of males versus females, 2001/02 to 2009/10.
5.31 The decline in the recidivism rate among Aboriginal women has been the primary driver behind the steady decline in overall female recidivism. The decline is unlikely due to any great improvements in Aboriginal specific service provision, as the program participation rates for Aboriginal women were on average lower than non-‐Aboriginal women. This decline was not limited to a specific facility and occurred to a similar extent at Bandyup Women’s Prison as it did in the Eastern Goldfields Regional Prison. Despite these improvements in the recidivism rate of Aboriginal women, it continues to be eight percentage points higher than non-‐Aboriginal women.
Figure 5 Recidivism rate of Aboriginal versus non-‐Aboriginal women, 2001/02 to 2009/10
0% 5% 10% 15% 20% 25% 30% 35% 40% 45% 50%
2001/02 2002/03 2003/04 2004/05 2005/06 2006/07 2007/08 2008/09 2009/10
Return to Prison Rate (%
)
Year Prisoner Released
Male Return to Prison % Female Return to Prison %
0%
10%
20%
30%
40%
50%
60%
2001/02 2002/03 2003/04 2004/05 2005/06 2006/07 2007/08 2008/09 2009/10
Return to Prison Rate (%
)
Year Prisoner Released
Aboriginal Female Return to Prison % Non-‐Aboriginal Female Return to Prison %

19
The decline in female recidivism appears to be despite, rather than because of the interventions provided to women in prison. An analysis of the impact of treatment programs for prisoners released in 2009/10 showed the recidivism rate for women who completed a treatment program was nearly six percentage points higher than for those who did not complete a treatment program. Males completing a treatment program had a one percentage point higher recidivism rate than males who did not complete a treatment program. Women who completed a treatment program were less likely to be deemed a high risk of reoffending compared to men on Departmental risk assessment instruments. Hence, different risk profiles of male and female program completers cannot be used to explain these results.
Table 3 Gender comparisons in recidivism rates among program completers and non-‐completers.
Cohort Return to prison % (did not complete
program)
Return to prison % (completed program)
Overall Males 36.96% 37.63% Females 26.47% 32.22%
Substance Abuse Checklist High/Highest Risk Males 44.27% 41.93% High/Highest Risk Females 33.33% 39.68%
Violent Offending Checklist High/Highest Risk Males 45.49% 43.18% High/Highest Risk Females 40.74% 44.44%
5.32 Issues relating to the effect of programs are discussed in the next chapter but it is important to reflect here on the situation for women. Men deemed to be at high or highest risk of substance use had a lower recidivism rate if they completed a treatment program. For women the reverse occurred. Those in the high risk categories reoffended more frequently if they completed a program. Similarly, higher risk males who completed a program for violent offending were slightly less likely to reoffend if they completed a program but the women who completed a program were significantly more likely to reoffend.
5.33 These findings are of serious concern. It is unclear why treatment program completion was associated with greatly increased reoffending among high-‐risk women. Potentially, the content of the programs was the cause given there are no treatment programs available designed specifically for high risk women. The Department plans to redevelop the ‘Choice, Change, and Consequences’ program to target women who are high risk on the violent offending checklist.68 These
68 Department of Corrective Services. Offender Services Program Guide (Version 4, December 2011).

20
results support a targeted approach for female violent offenders. An intensive substance abuse program specifically for women should also be considered.69
69 Previous recommendations to develop and enhance programs for women have not been adequately actioned by the Department: see OICS, Report of an announced inspection of Bandyup Women’s Prison, Report no. 73 (August 2011); OICS, Report of an announced inspection of Bandyup Women’s Prison (forthcoming report).

21
Treatment programs 66.1 While many risk factors are outside the Department’s control, one area where it
has invested heavily, with the aim of reducing recidivism, is the provision of treatment programs. International research generally accepts that treatment programs are an effective method of reducing recidivism if the right program is delivered to the right person. Treatment programs that are incorrectly allocated or delivered can be harmful, increasing the likelihood of reoffending.70 This is what occurred for prisoners released in 2008/09 and 2009/10, resulting in the recidivism rate being higher for those that completed a program than those that did not.
6.2 A review conducted by this Office in 2008 showed that most prisoners were allocated the wrong program or were not allocated a program at all. 71 Even if a prisoner was allocated a program, staff shortages prevented the program actually taking place. Since this time, the Department has made substantial progress in delivering programs to the right prisoners but two major problems remain. First, too few programs are available for women prisoners and for people held in the Aboriginal-‐dominated prisons of Broome, Roebourne, Greenough and Eastern Goldfields. Secondly, despite more than twenty years of program delivery, and despite criticism dating back many years, the Department does not have any robust evaluations which can explain what works for whom, and why, by way of programs in the Western Australian context.
‘What Works’ principles 6.3 Programs in the Department are guided by the ‘What Works’ principles.72 These
psychologically-‐based principles are based on decades of international research on the characteristics of effective treatment programs. Research has found that programs that adhere to the ‘What Works’ principles are most likely to be effective.73 The principles include risk, need and responsivity:
• ‘Risk’ refers to prisoners being allocated to treatment programs reflective of their level of risk. Prisoners who are at a high risk of reoffending should be allocated to intensive programs, moderate risk prisoners should be allocated medium intensity programs, while low risk prisoners should receive minimal or no treatment.
• ‘Need’ refers to programs addressing criminogenic needs. Criminogenic needs are those that are amenable to change and are associated with recidivism, such as antisocial attitudes, dysfunctional family environments, or
70 Andrews, D. A., Zinger, I., Hoge, R. D., Bonta, J., Gendreau, P., & Cullen, F. T. ‘Does correctional treatment work? A psychologically informed meta-‐analysis’ (1990) 28 Criminology 369.
71 OICS, Report into a review of assessment and classification within the Department of Corrective Services, Report No. 51 (June 2008). 72 Department of Corrective Services, Offender Services Program Guide (Version 4, December 2011). 73 Bonta, J. & Andrews, D. A. Risk-‐Need-‐Responsivity Model for Offender Assessment and Rehabilitation (Public Safety Canada Report No. PS3-‐1/2007-‐06).
22
substance misuse.74 The higher number of criminogenic needs addressed in a program, the more effective it is likely to be. Addressing factors not associated with recidivism alternatively reduces the effectiveness of a program.
• ‘Responsivity’ refers to the importance of programs matching the specific characteristics of offenders. Not all offenders are the same in terms of their level of motivation, gender, cognitive ability, or culture. Effective programs will be responsive to these characteristics in their content and delivery in order to maximise learning by participants.
6.4 If these principles are ignored, treatment programs will increase the likelihood of recidivism.75 If only one principle is followed then the program will have minimal positive effects. Effectiveness has been found to increase with each additional principle that is followed.76
Who is recommended for which program? 6.5 In 2008/09 the Department was poorly allocating prisoners to programs and
people who completed a program were more likely to reoffend (50%) than those who did not (43%). These findings align with the ’What Works’ literature, in that ill-‐directed treatment programs have the potential to be harmful.
6.6 The Department determines prisoner placement in treatment programs, based on the information from three treatment checklists measuring risk, need, and motivation.77 These checklists are the:
• Sex Offender Treatment Checklist (SOTC); • Violent Offender Treatment Checklist (VOTC); and • Substance Use Offender Treatment Checklist (SUOTC).
6.7 Relevant checklists are conducted for each prisoner by a tertiary qualified treatment assessor within 28 days of sentencing as part of their individual management plan (IMP). Prisoners who have an expected custody time under sentence of less than six months are typically excluded from this process, as their time in prison is considered too short for programmatic intervention to occur.78 Slightly over half of all prisoners in the state (54%) have an approved IMP.79
6.8 The Department’s use of the three checklists to assess prisoner risk, need, and motivation is in line with the ‘What Works’ principles. However the Department
74 Ohio Department of Rehabilitation and Correction, What works? General principles, characteristics, and examples of effective programs (January 2010).
75 Andrews D, Zinger I, Hoge R, Bonta J, Gendreau P, & Cullen, F, ‘Does correctional treatment work? A psychologically informed meta-‐analysis’ (1990), Criminology, 28, 369-‐404.
76 Bonta, J. & Andrews, D. A. Risk-‐Need-‐Responsivity Model for Offender Assessment and Rehabilitation (Public Safety Canada Report No. PS3-‐1/2007-‐06).
77 A cognitive skills checklist may also be provided to prisoners however it does not provide scores on risk, need, or motivation. 78 For prisoners serving an effective sentence of less than 6 months, an IMP can be developed at the discretion of the Assistant Superintendent.
79 Data extracted on 13/06/2014.

23
did not always recommend an appropriate program based on this assessment. In 2008, prisoners who were low risk, low need, or who had low motivation were incorrectly being recommended to programs. In some cases, low risk and need prisoners were allocated intensive programs. High risk and need prisoners were conversely not being allocated to programs at all.80
6.9 Since 2008 there has been a substantial improvement in program allocation accuracy (see Appendix C for details of methodology). Highest risk and need prisoners were predominately being recommended intensive programs while low risk and need prisoners were, correctly, not being recommended programs. Figures 6-‐8 depict the improvements in program allocation accuracy for each of the treatment checklists.
Figure 6 Program allocation accuracy for the sex offender treatment checklist.
80 OICS, Report into a review of assessment and classification within the Department of Corrective Services, Report No. 51 (June 2008).
0% 10% 20% 30% 40% 50% 60% 70% 80% 90% 100%
Previous Review Current Review Previous Review Current Review
Sex Offender Treatment Checklist: Highest Risk Highest Need Prisoners
Sex Offender Treatment Checklist: Low Risk Low Need Prisoners
Intensive program recommended Medium program recommended
No program recommended
24
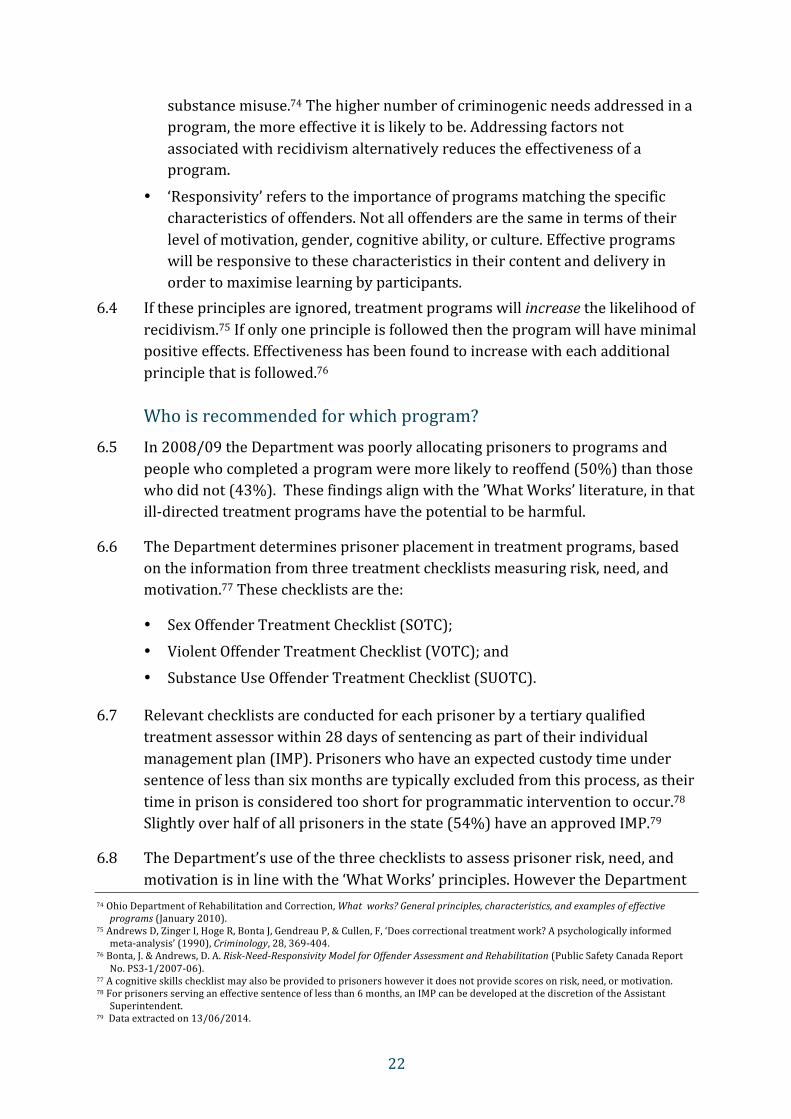
Figure 7 Program allocation accuracy for the violent offender treatment checklist.
Figure 8 Program allocation accuracy for the substance use offender treatment checklist.
6.10 In 2008, only 27 per cent of prisoners with the highest risk of substance abuse and most need for a program were recommended an intensive program. This has now risen to 88 per cent. Conversely, 27 per cent of prisoners assessed as low risk and need on the substance use checklist were recommended a program in the 2008 review, even though they should have received minimal or no
0% 10% 20% 30% 40% 50% 60% 70% 80% 90% 100%
Previous Review Current Review Previous Review Current Review
Violent Offender Treatment Checklist: Highest Risk and Need Prisoners
Violent Offender Treatment Checklist: Low Risk and Need Prisoners
Intensive program recommended Medium program recommended
No program recommended
0% 10% 20% 30% 40% 50% 60% 70% 80% 90% 100%
Previous Review Current Review Previous Review Current Review
Substance Use Offender Treatment Checklist: Highest Risk and Need
Prisoners
Substance Use Offender Treatment Checklist: Low Risk and Need Prisoners
Intensive program recommended Medium program recommended
No program recommended

25
treatment. Since the 2008 review, no low risk and need prisoners completing the substance use checklist were recommended a program. Similar patterns exist across the other two checklists.
6.11 These results reflect positively on the Department’s Clinical Governance Unit (CGU), which is responsible for the governance, development, and evaluation of programs. At the time of the 2008 review the CGU had only just been established.
6.12 However, despite these improvements some prisoners are still being allocated to unsuitable treatment programs. Highest risk and highest need prisoners continue to be recommended medium intensity programs, such as the Indigenous Men’s Managing Anger and Substance Abuse program (IMMASU), and the Indigenous Family Violence program (IFV). Approximately 250 highest risk and need prisoners were recommended to these programs since the 2008 review. While the proportion of highest risk and need prisoners being recommended medium intensity programs is far lower than what was recorded in the 2008 review, more progress needs to be made to safe guard the community from the negative effects of inappropriate program allocation. Potentially, the lack of Aboriginal specific intensive programs has led to some prisoners being recommended medium intensity Aboriginal specific programs instead.
6.13 It is also unclear how the assessment of motivation to undertake a program is used by the Department when allocating programs. It is perilous to include prisoners with low motivation into programs, particularly intensive programs. Research has found that prisoners who withdraw from a program before completion are more likely to reoffend compared to those who do not complete a program at all.81 Treatment readiness is therefore critically important. The 2008 review found that information on motivation was used poorly. While some improvements have been made, as of December 2013 prisoners who were assessed as having low motivation are still being allocated to programs. Of the 180 prisoners assessed as low motivation on the substance use checklist, 143 (70%) were recommended a program. In 85 per cent of these cases the program was intensive. This occurred to a similar extent to prisoners who completed the other checklists. The Departments appears to ignore the motivation score of prisoners, a practice which is not in line with the ‘responsivity’ principle of the ‘What Works’ literature and is potentially harmful.
Recommendation 4
For interventions governed and justified by the ‘what works’ principles, ensure that these principles are properly followed for program design and allocation.
81 Cann J, Falshaw L, Nugent F & Friendship C, Understanding what works: Accredited cognitive skills programmes for adult men and young offenders (London Home Office Research Finding No. 226, 2003); Robinson, D. The impact of cognitive skills on training on post release recidivism among Canadian federal offenders (Correctional Service Canada, No. R–41,1995).

26
What programs are available and who gets access? 6.14 Not everyone who is recommended to a program is able to get access, nor is
access equitable across the state. Prisoners in predominantly Aboriginal regional prisons have a higher proportion of unmet treatment needs due to program unavailability than prisoners in metropolitan prisons. Female prisoners also have less access to relevant programs than males.
6.15 The Department provides 21 treatment programs. Sixteen of these programs are provided within prisons, and five in the community. The Department’s treatment program suite covers five general areas, including:
• Risk factors for violence • Sex offending • Substance abuse • General offending • Cognitive skills
6.16 The 2008 review found that many programs were not being delivered due to a lack of staff, with 50 per cent of scheduled intensive programs for 2006/07 not occurring.82 Since then, improvements have been made which is reflected in program completion rates.
6.17 Between 2007 and 2010, the proportion of the sentenced prisoner population completing a program prior to release was the lowest it had been for a decade. The completion rate is affected by program availability and individual prisoner motivation.
82 OICS, Report into a review of assessment and classification within the Department of Corrective Services, Report No. 51 (June 2008).

27
Figure 9 Proportion of released prisoners completing at least one treatment program.
6.18 In 2010/11 there was a substantial improvement in program completion rates with 37 per cent of the prison population released that year completing a program. Completion figures for all prisoners (not just those who have been released) also demonstrate considerable improvement. In 2012/13, 1694 prisoners completed a treatment program compared to 783 in 2007/08.83
6.19 However improvements in program availability have not been equitably distributed. In 2013 the gap between treatment needs and program availability was markedly different between metropolitan and regional ‘Aboriginal’ prisons (those where the proportion of Aboriginal prisoners is 75 per cent or more). Prisoners released from ‘Aboriginal’ prisons were far more likely to have treatment needs unaddressed due to programs being unavailable.
83 Department of Corrective Services, Annual Report 2012/13 (September 2013); Department of Corrective Services, Annual Report 2007/08 (September 2008).
38.17%
31.50%
31.88% 28.47%
27.34%
30.05%
22.66%
20.63%
25.72%
0% 5% 10% 15% 20% 25% 30% 35% 40% 45%
2001/02 2002/03 2003/04 2004/05 2005/06 2006/07 2007/08 2008/09 2009/10
% Released prisoners completed treatment program prior to release

28
Table 4 Proportion of unmet treatment needs due to program unavailability for prisoners released in 2013.
Release facility % Treatment needs not met due to lack of available program84
Eastern Goldfields Regional Prison 52.22% West Kimberley Regional Prison 49.57% Greenough Regional Prison 46.54% Broome Regional Prison 39.22% Roebourne Regional Prison 37.31% Bandyup Women’s Prison 29.05% Hakea Prison 28.57% Acacia Prison 26.32% Casuarina Prison 25.12% Wandoo Reintegration Facility 20.51% Bunbury Regional Prison 20.26% Pardelup Prison Farm 18.18% Albany Regional Prison 16.36% Wooroloo Prison Farm 15.98% Karnet Prison Farm 13.09% Boronia Pre-‐Release Centre 5.38% Total 25.26%
6.20 The five facilities with the highest proportion of unmet treatment needs due to program unavailability were all regional ‘Aboriginal’ prisons. In Eastern Goldfields Regional Prison for example, two thirds of all substance abuse treatment needs and 79 per cent of all violent offending treatment needs were not addressed as programs were unavailable.
6.21 Four out of the five facilities with the lowest proportion of unmet treatment needs were in the metropolitan area and were all minimum security facilities. Facilities in the south-‐west such as Albany Regional Prison (maximum security) and Bunbury Regional Prison (multi-‐security) also performed well. The better performance of minimum security facilities can partially be explained by the fact that program completion is taken into account when determining security status. However, security rating does not explain why Albany Regional Prison has less than a third of the unmet treatment needs as Eastern Goldfields despite having a far lower proportion of minimum security prisoners being released.
6.22 While it is inherently more difficult and resource intensive to provide programs in the more remote areas of Western Australia there is clearly room for
84 Treatment needs where the program status was ‘unavailable’, ‘identified’ or where no suitable program existed was included in this column.

29
improvement when it comes to service provision in Aboriginal prisons. The soon to be built new Eastern Goldfields prison presents an opportunity to remedy this current state of inequity between Aboriginal and non-‐Aboriginal prisons.
Recommendation 5
Increase the availability of treatment programs in the Aboriginal-‐dominated prisons of West Kimberley, Greenough, Eastern Goldfields and Roebourne.
6.23 Women are also highly disadvantaged in their access to programs, given Bandyup Women’s Prison is the worst performing metropolitan prison in terms of treatment program availability. Men have many more prison options available to address their treatment needs, while women are left with the unenviable choice of the under-‐serviced and overcrowded Bandyup Women’s Prison or the extremely under-‐serviced regional facilities. Most women are unable to access the minimum security Boronia Pre-‐Release Centre unless they address their treatment needs beforehand.
6.24 The lack of access to programs is compounded when programs do not meet the needs of women, as discussed previously. This results in the untenable situation of women being disadvantaged not only in getting access to programs, but in gaining access to the right program.
Recommendation 6
Develop appropriate treatment programs for female prisoners, particularly those at high risk of substance abuse and violent offending, and improve access to treatment programs for female prisoners across the state.
Program effectiveness 6.25 Since the inception of CGU the Department’s program suite has been completely
transformed. More than half of the programs delivered in the 2006/07 financial year have been removed. Many of the programs removed were short, low intensity programs which were of highly questionable effectiveness.85 The CGU have also revised the content of many programs, with staff noting that they preferred to keep programs in a pilot phase and refine them for long periods of time.
6.26 In addition, many more new programs are scheduled to be released in the next couple of years. Many of the in-‐development programs are Aboriginal specific, and include:
85 A one-‐hour individual counselling session or a two hour anger management workshop would be unlikely to lead to lasting behavioural change.

30
• Aboriginal Pathways: an adaptation of the existing high intensity substance abuse program for Aboriginal prisoners; and
• Aboriginal Family Violence: a new community and prison based family violence program for Aboriginal prisoners.
6.27 Evaluation of Maori-‐specific programs in New Zealand has demonstrated that culturally attuned treatment programs are more effective in reducing recidivism.86 The development of programs specific to Aboriginal prisoners is a positive step in line with the ‘responsivity’ principle of the ‘What Works’ literature, provided the programs are responsive to the different Aboriginal cultures present in Western Australia.
6.28 However, the Department still lacks comprehensive evaluation of the programs they deliver, which is a significant risk. Without this evaluation it is impossible to determine if one or more programs delivered by the Department works as intended or makes the prisoner more likely to reoffend. This issue was raised in the Mahoney Inquiry in 2005, where it was stated that the Department is “unable to advise with any confidence that its rehabilitation programs are working”.87 Nearly a decade later, this still has not been adequately addressed.
6.29 The CGU evaluates the programs in three stages. The first stage is about integrity not impact and only the third of these stages is truly outcome-‐focused:88
• Program Integrity: Includes site audits and the accreditation of programs and facilitators.
• Short Term Impact: Includes analysing whether prisoners are placed in programs relative to their risk, identifying potential improvements to the program or facilitation via focus group feedback and surveys, and the comparison of pre and post program criminogenic needs and risk.
• Long Term Impact: The analysis of the effect of the program on recidivism rates.
6.30 Out of the 21 treatment programs that are currently operating in the Department,89 only eight have had an evaluation study completed by CGU that have examined short or long term impacts and only one has been the subject of long term evaluation. None of these evaluation studies have been publicly released.
86 Macgregor, S. Sex offender treatment programs: effectiveness of prison and community based programs in Australia and New Zealand (Indigenous Justice Clearinghouse, Brief 3, April 2008).
87 His Honour Dennis Mahoney AO QC, Inquiry into the Management of Offenders in Custody and in the Community (November 2005). 88 Department of Corrective Services. Research and Evaluation Framework: Clinical Governance Unit. (September 2013). 89 This does not include treatment programs provided to juveniles. However, no juvenile program has been evaluated to date, and there does not appear to be any plans to do so in the future.

31
Table 5 Evaluation study status of treatment programs currently provided by the Department
Name of Program Evaluation study by CGU?
Evaluation Type
Pathways Program Yes Short Term Indigenous Men Managing Anger and Substance use
No -‐
Breaking Out No -‐ Think First Yes Short Term Legal and Social Awareness No -‐ Cognitive Brief Intervention No -‐ Choice, Change and Consequences Program No -‐ Change and Emotions Program No -‐ Intensive Sex Offending Treatment Program Yes Short term Medium Sex Offender Program Yes Short term Indigenous Sex Offending Treatment Program Yes Long term Sex Offending Denier Program Yes Short term Sex Offending Intellectual Disabilities Program No -‐ Community Based Program No -‐ Maintenance Program No -‐ Combined Program No -‐ Violent Offender Treatment Program Yes Short term Medium Intensity Rehabilitation Program Yes Short term Aboriginal Family Violence Program No -‐ Domestic Violence Program No -‐ Stopping Family Violence Program No -‐
6.31 All of the evaluations bar one are short-‐term in nature -‐ examining prisoner’s treatment gains via self-‐reported survey results and the accuracy of prisoner placement based on treatment checklist scores. This type of evaluation measures the impact of the program on the prisoner and is may be useful to allow improvements in the way a program is delivered. However, this type of evaluation provides no information on the effectiveness of a program. Long term, outcome evaluation is needed.
6.32 Only two long term evaluation studies of programs have been completed by CGU.90 One program was found to be ineffective and was discontinued. The other program was designed for medium risk sex offenders. The evaluation found that some high risk prisoners were incorrectly allocated to this program. Paradoxically, the program decreased reoffending among high risk sex offenders and increased reoffending among medium risk sex offenders. CGU staff stated that when these results became known, they removed the program immediately.
90 A study examining the long-‐term impacts of the Think First program is expected to be released in the first half of 2014.

32
The Department currently provides a revised version of the program and it is not yet known whether this version has the same adverse effect on prisoners. Unfortunately, an earlier independent evaluation of a previous version of sex offender treatment programs also produced rather negative results.91
6.33 Programs aimed at reducing recidivism need to be reviewed regularly and refined to adapt to changes in prisoner needs and to maximise their chance of success. Since the creation of CGU the Department has rightly made significant changes to the suite of programs that are available to prisoners, however the by-‐product of introducing new programs is that outcome evaluation has rarely been possible. It will be a number of years until definitive results are available on the effectiveness of many Departmental programs. While new programs which more accurately target the needs and risk profiles of specific prisoner cohorts is welcomed, the Department must now consider ways to balance the need for innovation with the need to ensure effectiveness.
6.34 The lack of robust evaluations is not acceptable for reasons of community protection and resource management. Unfortunately it is also a longstanding problem. Without good evaluations, scarce resources cannot be effectively targeted. Furthermore, key decision makers such as the Prisoners Review Board are making decisions, sometimes to release a person into the community, and sometimes to keep them in prison at considerable financial cost, on the basis of programs that have not been shown to be effective. A comprehensive plan for program evaluation needs to be developed to ensure that established programs are subject to long term, outcome evaluation and changes to the program suite do not stifle the ability to measure effectiveness.
Recommendation 7
Develop a comprehensive plan and timeline for the long-‐term evaluation of programs.
91 Greenberg, DM, Da Silva, J-‐A and Loh, N, Evaluation of the Western Australian Sex Offender Treatment Unit (1987-‐1999): A quantitative analysis (University of Western Australia, 2002).

33
Summary 77.1 The prison population in Western Australia is rising rapidly. Over the past five
years, the number of men in prison has risen by around 25 per cent and the number of women by around 50 per cent. Some of the increase is driven by ‘new’ prisoners and some by a clampdown on parole but, as this report has shown, a large proportion of people have previously been in prison. For reasons of community safety, it is obviously important to reduce the rate of return to prison. Meeting this challenge requires a good understanding of what measures work for which prisoners and why, so that investment can be properly targeted.
7.2 There are also strong financial imperatives to target investment at reducing recidivism. In 2012-‐13, the average ‘direct’ cost of imprisonment per prisoner per year in Western Australia, excluding capital costs, was close to $120,000.92 The ‘indirect’ financial, community and social costs are invariably much more.93 For every ten prisoners who do not return to prison for just one year, the projected saving in direct costs alone will therefore be in the region of $1 million. If these ten prisoners never return to prison, the savings are multiplied many times.
7.3 Different researchers have used different tests of ‘recidivism’ and the Department itself applies different tests for adults and juveniles. This review has used the test of a ‘return to prison within two years of release’.
7.4 One of the key findings of this report is that rates of recidivism varied between prisons, even after taking account of the risk profiles of their prisoners. Significantly, recidivism rates were also linked to the provision of services. Those prisons which had been performing well against the standards of this Office were returning lower recidivism rates that those that were struggling to provide services and to meet standards. Given this link, there is a risk that the consequence of increasing prisoner numbers without increasing supporting infrastructure and services will trigger a higher rate of return to prison. The logical conclusion is that the cost of intelligent targeted investment in service provision to address the risks and needs of different cohorts of prisoners will be outweighed by future benefits.
7.5 Regardless, decisions about how to invest limited public resources are always prioritised. Often in times of fiscal tightening prevention activities are undervalued in favour of delivering ‘core’ services. In the case of corrections, strategies related to reducing recidivism may not be as highly valued as the resources needed for managing the day to day running of corrections facilities
92 Department of Corrective Services, Annual Report 2012/2013 (September 2013). 93 The additional financial costs include the fact ‘breadwinners’ or primary care givers are incarcerated, leading to increased welfare dependency and costs and well as social consequences.

34
even though the long term benefits can alleviate pressure on these resources. It is therefore essential that the benefits to any strategy are clearly demonstrated through having clear, quantifiable and transparent ways to measure costs, benefits and outcomes. In particular, where the Department can show that an initiative has reduced recidivism, it should be encouraged to re-‐invest some of the savings in proven and improved strategies to reduce reoffending.
Recommendation 8
As a long term efficiency measure, the government and the Department ensure that adequate resourcing is prioritised for strategies aimed at reducing recidivism.
7.6 Numerous factors affect the likelihood of a person returning to prison, including growing insight and maturity, employment, improved mental health, drug rehabilitation, or ‘finding’ religion or love. Many of these are beyond the Department’s control but some can be addressed by treatment in prison or by support and assistance on release.
7.7 One area that has seen significant investment, with the explicit aim of reducing the risk of re-‐offending, is the provision of psychologically-‐based ‘offender treatment programs’. These programs are also an influential factor in Prisoners Review Board decisions; the Board will be more likely to release people who have successfully completed recommended programs and to deny or defer the release of those who have not.94
7.8 However, despite programs being a key plank in the Department’s interventions and the Board’s decisions, the Department has carried out very few long term evaluations of individual programs. Unfortunately, too, the results of those programs that have been subject to long term evaluation have not been positive.
7.9 One of the potential challenges for successful program delivery is to ensure that the right people access the right program as often as possible. The international evidence is that incorrect program allocation may be more harmful than helpful. This report found that problems relating to program allocation have impacted on success in Western Australia too.
7.10 The Department has made significant improvements in targeting its delivery of treatment programs in recent years, with fewer people now allocated to the wrong programs. However, there is room for further improvement. The areas of greatest shortfall are programs for Aboriginal people (male and female) in regional prisons and female prisoners.
94 Prisoners Review Board, Annual Report 2012/13 (August 2013).

35
7.11 The Department can also influence recidivism rates through the effective delivery of education and training, with the most benefit being gained by targeting young people. However, with the exception of the Wandoo Reintegration Facility, the Department has certainly not maximised the opportunities to target young people.
7.12 In order to improve outcomes and reduce the rate at which people return to prison, the Department needs to adopt a holistic but carefully targeted approach. This will require clear goals, well-‐funded strategies for improvement, and continuous measuring of effectiveness so that alterations can be made where needed.
7.13 New Zealand Department of Corrections are currently achieving this. They have set a clear target of reducing recidivism by 25 per cent from 2012 to 2017. They aim to have 600 fewer prisoners returning to prison, 4000 fewer offenders reconvicted after a community-‐based sentence, and 18,500 fewer victims of crime.
7.14 The NZ action plan contains a wide range of initiatives to reduce reoffending, a specific target for each initiative (e.g. 4000 additional drug and alcohol treatment places per year), and the anticipated net effect of each initiative in terms of re-‐imprisonments and community reconvictions. These initiatives are both prison and community-‐based and include increasing participation in treatment programs, education and employment.
7.15 Importantly, the New Zealand plan recognises at its core the role of families, non-‐government organisations and private sector service providers as well as the public sector. This is seen as the most effective and efficient model and the results to date are very promising. Two years into the five year plan, New Zealand Corrections have reduced the recidivism rate by 11 per cent.95 Logically, a similar approach would be beneficial in Western Australia.
Recommendation 9
For both adult justice and youth justice, the Department publish clear recidivism targets with a corresponding action plan and clear methods for measuring effectiveness.
95 NZ Department of Corrections, Annual Report 1 July 2012 – 30 June 2013 (September 2013).

36
Appendix A: Key findings
• There was a substantial decline in the recidivism rate for prisoners released after the 2008/09 financial year. While there is no clear explanation for this decline, one contributing factor is the increase in early release order (ERO) denials from 2009.
• Risk factors most important in predicting recidivism in Western Australia include: • Age; • Number of prior prison admissions; • Gender; • Aboriginal status; • Security rating; • Educational attainment; • Substance use risk rating; • Sex offender risk rating; and • Treatment program completion.
• Prisons with identified deficiencies in service provision have higher recidivism rates.
• Over half of 18 to 19 year olds returned to prison within two years, with nearly 90 per cent returning to corrective services within two years.
• Female prisoners demonstrated a low and declining recidivism rate. • Poorly targeted programs have the potential to be harmful. • There has been a substantial improvement in program provision in recent years;
however, areas of improvement still exist. • There is a lack of evidence supporting the effectiveness of Departmental treatment
programs.

37
Appendix B: Department of Corrective Services response to recommendations
Recommendation Response
1. Improve opportunities for young men and women at all the state’s prisons to be involved in meaningful activities, skill development opportunities and education.
Supported The Department recognises the unique needs of the 18 to 24 year old cohort and is currently reviewing service delivery models to this group.
2. Ensure that the population of Wandoo is increased and that the benefits to the community are evaluated and maximised. In order to achieve this, the Department should: (a) improve the opportunities for young men at mainstream prisons and assist them to meet the Wandoo criteria; and (b) examine amendments to its security classification tool, to allow a more nuanced assessment of youth risk.
Supported a) Refer to response to Recommendation 1 b) It is acknowledged that the management of young people is complex and there are unique challenges for managing the risk of young adult prisoners. The terms of reference for the review of the classification system are currently being developed and will be presented for endorsement.
3. Implement specific strategies targeted at reducing recidivism amongst young female prisoners.
Supported The Department is committed to implementing Individualised Integrated Case Management (IICM) which is designed to reduce recidivism and will have a specific focus on female offenders.
4. For interventions governed and justified by the ‘what works’ principles, ensure that these principles are properly followed for program design and allocation.
Supported IICM is underpinned by the 'what works' principles.
5. Increase the availability of treatment programs in the Aboriginal-‐dominated prisons of West Kimberley, Greenough, Eastern Goldfields and Roebourne.
Supported The Department is developing a Western Australian Intervention Map. This will include a focus on Aboriginal prisoners at Regional Prisons (within fiscal constraints).
6. Develop appropriate treatment programs for female prisoners, particularly those at high risk of substance abuse and violent offending, and improve access to treatment programs for female prisoners across the state.
Supported The Department is developing a Western Australian Intervention Map. This will include a particular emphasis on prioritising women at risk across the state (within fiscal constraints).

38
7. Develop a comprehensive plan and timeline for the long-‐term evaluation of programs.
Supported The Department has an existing plan of long-‐term evaluations of programs within adult facilities. Youth Justice is developing a plan and timeline for the evaluation of programs.
8. As a long term efficiency measure, the government and the Department ensure that adequate resourcing is prioritised for strategies aimed at reducing recidivism.
Supported The Department is committed to prioritising strategies aimed at reducing recidivism.
9. For both adult justice and youth justice, the Department publish clear recidivism targets with a corresponding action plan and clear methods for measuring effectiveness.
Supported The Department has set a target to reduce recidivism by 6% per year.

39
Appendix C: Methodology Data Collection
The Department provided recidivism datasets for prisoners released from 2001/02 until 2009/10. These datasets included the details of each sentenced prisoner that was released in each financial year, including name, Aboriginal status, gender, exit facility, program completion, discharge type, and whether they returned to prison or corrections. Additional information was obtained using structured query language (SQL) data extraction from the Total Offender Management Solution (TOMS) database. This provided data on all other factors included in recidivism analyses.
Description of Recidivism Analysis
To determine the association between selected risk factors and the likelihood of reoffending, a multivariate analysis known as ‘logistic regression’ was undertaken. The advantage of multivariate analysis is that it can determine whether a factor independently predicts recidivism while accounting for the influence of all other factors included in the analysis. For example, a simple analysis may suggest that prisoners with higher educational attainment have a lower chance of recidivism. However, this relationship may be due to prisoners with a higher educational attainment being less likely to be Aboriginal, male, or younger for example. A multivariate analysis could determine whether educational attainment is associated with recidivism after accounting for the influence of Aboriginal status, gender, and age in this example.
Treatment Program Analyses
In the determination of program allocation accuracy, all treatment program allocation results since the time of the 2008 review was extracted from the TOMS database using SQL data extraction. This comprised 42,582 checklist results from 8154 distinct prisoners between September 2007 and December 2013. Only the most recent treatment checklist for each prisoner was included in the analysis. In the determination of unmet treatment needs for recently released prisoners, data was extracted from the TOMS database using the ‘custom reports and data extraction’ feature. The Department provided details on all programs they provided and supplied all evaluations that have been conducted on treatment programs. An interview was also conducted with the Clinical Governance Unit.

40
Appendix D: Findings of multivariate recidivism analysis
Factor Measurement Findings
Age Age groups of 18-‐24, 25-‐34, 35-‐44, 45-‐54, 55-‐64, and 65+.
As age increases, the likelihood of recidivism decreased.
Prior Prison Admissions Prior prison admission groups of 0, 1-‐3, 4-‐6, 7-‐9, and 10+.
As number of prior prison admissions increased, the likelihood of returning to prison increased.
Substance Use Risk Rating Risk rating determined by treatment assessor for the prisoner’s most recent substance use checklist prior to release. Comparisons were made between prisoners who were not required to do the checklist, and those who were rated as low risk, moderate risk, high risk, and highest risk.
Prisoners identified as high or highest substance use risk were more likely to reoffend compared to those with a low or moderate risk rating or who were not offered the checklist. Nearly two-‐thirds of prisoners completed this checklist in both years, compared to the violent offending checklist (40%) and the sex offending checklist (7%), reflecting the role of substance abuse as a key driver of offending.
Security Rating Security rating of prisoners on the day prior to release. Prisoners could either be rated minimum, medium, or maximum security.
Prisoners who were medium security were more likely to reoffend compared to prisoners who were minimum security. Maximum security prisoners had an even higher likelihood of returning to prison.
Aboriginal status Comparison between Aboriginal and non-‐Aboriginal prisoners.
Aboriginal prisoners had an increased likelihood of reoffending compared to non-‐Aboriginal prisoners. While Aboriginal prisoners tended to be younger, have a higher security rating, and have a substance abuse problem, the analysis indicated that even after all these risk factors were accounted for, Aboriginal prisoners still reoffended at a greater rate compared to non-‐Aboriginal prisoners. These enduring differences are likely due to other social disadvantage risk factors that were not included in the analysis.
Gender Comparison between male and female prisoners. Male prisoners were more likely to reoffend compared to female prisoners.
Sex Offender Risk Rating Risk rating determined by treatment assessor for Prisoners assessed as high risk on the checklist had a lower

41
the prisoner’s most recent sex offender treatment checklist prior to release. Comparisons were made between prisoners who were not required to do the checklist, and those who were rated as low risk, moderate risk, high risk, and highest risk.
likelihood of reoffending compared to prisoners who did not complete the checklist (i.e. non sex offenders). This reflects previous research which has found that sex offenders are far less likely to reoffend compared to other offender types.96 However, prisoners rated as highest risk on the checklist were equally as likely to reoffend as non sex offenders.
Educational Attainment Comparisons were made between prisoners who did no secondary schooling, those who did some secondary schooling (but no other qualifications after leaving school), and those who completed secondary schooling and/or acquired tertiary or vocational qualifications.
Prisoners who completed secondary education or pursued post-‐secondary qualifications (including vocational or tertiary) had a lower likelihood of recidivism compared to prisoners who completed some secondary education yet did not pursue further qualifications. Prisoners with less than secondary education had poorer outcomes, but this did not reach statistical significance.
Treatment Program Completion
Status of whether a prisoner had completed at least one treatment program prior to release.
Prisoners who completed a treatment program had an increased likelihood of reoffending. While prisoners who present more risk to the community are more likely to undertake a treatment program, risk was accounted for in the analysis and so it cannot be used to explain this result. Those who did not complete programs would include those who refused to complete a program, prisoners where suitable programs were not available, or prisoners who were not in prison long enough to complete a program (such as property offenders, who typically have a high recidivism rate).97 Regardless of the effectiveness of programs themselves, it would therefore be expected that prisoners who completed a program would be less likely to reoffend. This was not the case, and indicated that the treatment programs provided were harmful to prisoners.
Mental Illness Comparisons were made between prisoners with a psychiatric care flag on TOMS (determined by medical staff) and prisoners without the flag.
No statistically significant difference was found between prisoners with the psychiatric care flag and those who didn’t. However, the relationship did approach statistical significance and so should not be completely discounted.
96 NZ Department of Corrections, Annual Report 1 July 2012 – 30 June 2013 (September 2013). 97 Hanson, K & Harris, A. Dynamic predictors of sexual recidivism 1998-‐1. (Department of Solicitor General Canada, 1998); Payne, J. Recidivism in Australia: Findings and Future Research (Australian Institute of Criminology, Research and Public Policy Series, No. 80, 2007).

42
Prisoners with a mental illness have been found to be far more likely to have a substance abuse problem and have prior prison admissions,98 and so this may have diminished the independent effect of this factor. In addition, this flag is known to be inconsistently used in the state’s prisons and so some caution should be applied to this result.
Violent Offending Risk Rating Risk rating determined by treatment assessor for the prisoner’s most recent violent offending checklist prior to release. Comparisons were made between prisoners who were not required to do the checklist, and those who were rated as low risk, moderate risk, high risk, and highest risk.
No significant difference was found between prisoners with different risk ratings. The independent effect of this factor rating may have been diminished by the fact that violent offending risk rating and substance use risk rating were highly correlated (r = 0.50).
Intellectual Impairment Comparisons were made between prisoners with an intellectual impairment flag (assessed by medical staff) and those without the flag.
No significant difference was found between prisoners with the intellectual impairment flag and those who didn’t. The intellectual impairment flag demonstrated no evidence at all of an association with recidivism, with the data suggesting that prisoners with an intellectual impairment do not have an increased likelihood of reoffending when other risk factors are taken into account.
98 Peters, Roger H., Bartoi, Molly G., & Sherman, Patti B, Screening and assessment of co-‐occurring disorders in the justice system (CMHS National GAINS Center, 2008).
43
Appendix E: Rate of return for prisoner cohorts released in 2009/10
Cohort Two-‐year rate of return to prison
Gender Male Female
37.13% 28.23%
Race Aboriginal Non-‐Aboriginal
44.11% 29.55%
Treatment Program Completion Did not complete program
35.88%
Completed Program 36.92% Age Group 18-‐24
46.11%
25-‐34 39.63% 35-‐44 31.45% 45-‐54 20.70% 55-‐64 11.29% Over 65 6.67% Security Rating Minimum Medium
29.21% 43.35%
Maximum 55.81% Identified Mental Illness No Yes
35.52% 40.41%
Identified Intellectual Impairment No Yes
35.96% 44.83%
Prior Prison Admissions None 1-‐3
23.10% 32.92%
4-‐6 44.12% 7-‐9 48.80% Over 10 43.56% Sex Offending Risk Rating Did not complete checklist Low
37.13% -‐
Moderate 30.77% High 23.53% Highest 21.43% Substance Use Risk Rating Did not complete checklist Low
28.16% 23.19%
Moderate 30.73% High 41.03% Highest 44.44%

44
Violent Offending Risk Rating Did not complete checklist Low
31.53% 33.33%
Moderate 38.79% High 44.92% Highest 44.40% Educational Attainment Completed secondary schooling and/or tertiary/vocational qualification
24.6%
Part secondary education Less than secondary education
39.7% 35.7%

www.oics.wa.gov.au
Level 5, Albert Facey House, 469 Wellington Street Perth, Western Australia 6000Telephone: +61 8 6551 4200 Facsimile: +61 8 6551 4216
7252 OICS A4 Review AW.indd 2 30/7/14 10:19 AM
Related Documents