Recidivism of Minnesota Felons CHAPTER 3 A lthough there is a significant body of research literature on the subject of recidivism, there is a limited amount of information about the recidivism of Minnesota offenders. The Minnesota Department of Corrections annu- ally reports on the reimprisonment rates of felons released from state correctional facilities, but it has not analyzed rates of rearrest and reconviction for these offend- ers. Also, no agency has conducted a statewide analysis of recidivism for the large group of felons who are placed on probation rather than sentenced to prison. The 1996 Legislature requested that our office conduct this study to provide a comprehensive picture of reoffense rates among Minnesota felons. We asked: • To what extent are Minnesota felons arrested for new offenses, convicted of those offenses, and imprisoned? How do recidivism rates differ among probationers and released prisoners? • How do recidivism rates vary among different categories of offenders, such as burglars and sex offenders? What types of new offenses do recidivists commit? • How is recidivism related to offenders’ criminal history, personal characteristics, program participation, and other factors? We attempted to track (1) all felons released from Minnesota prisons in 1992, and (2) all felons sentenced to probation (rather than prison) in 1992. 1 Of these 8,901 offenders, we excluded about 3 percent from our analysis because we could find no record of them in the Bureau of Criminal Apprehension (BCA) files. 2 Thus, our analysis measured recidivism for a total of 1,879 released prisoners and 6,791 1 We limited our prisoner analysis to the group of offenders who were released for the first ti me in 1992 from their current prison sentence. We did not include prisoners who had been release d prior to 1992, violated the terms of their release, returned to incarceration, and were relea sed again in 1992. 2 Nearly all of the excluded cases were probationers. The Sentencing Guidelines Commission- - whose records we used to identify felons sentenced to probation in 1992--does not have inform ation on offenders’ BCA or FBI identification numbers, and this made it difficult to locate some offend- ers’ BCA records.

Welcome message from author
This document is posted to help you gain knowledge. Please leave a comment to let me know what you think about it! Share it to your friends and learn new things together.
Transcript

Recidivism of Minnesota FelonsCHAPTER 3
Although there is a significant body of research literature on the subject ofrecidivism, there is a limited amount of information about the recidivismof Minnesota offenders. The Minnesota Department of Corrections annu-
ally reports on the reimprisonment rates of felons released from state correctionalfacilities, but it has not analyzed rates of rearrest and reconviction for these offend-ers. Also, no agency has conducted a statewide analysis of recidivism for thelarge group of felons who are placed on probation rather than sentenced to prison.The 1996 Legislature requested that our office conduct this study to provide acomprehensive picture of reoffense rates among Minnesota felons.
We asked:
• To what extent are Minnesota felons arrested for new offenses,convicted of those offenses, and imprisoned? How do recidivism ratesdiffer among probationers and released prisoners?
• How do recidivism rates vary among different categories of offenders,such as burglars and sex offenders? What types of new offenses dorecidivists commit?
• How is recidivism related to offenders’ criminal history, personalcharacteristics, program participation, and other factors?
We attempted to track (1) all felons released from Minnesota prisons in 1992, and(2) all felons sentenced to probation (rather than prison) in 1992.1 Of these 8,901offenders, we excluded about 3 percent from our analysis because we could findno record of them in the Bureau of Criminal Apprehension (BCA) files.2 Thus,our analysis measured recidivism for a total of 1,879 released prisoners and 6,791
1 We limited our prisoner analysis to the group of offenders who were released for the first timein 1992 from their current prison sentence. We did not include prisoners who had been releasedprior to 1992, violated the terms of their release, returned to incarceration, and were released againin 1992.
2 Nearly all of the excluded cases were probationers. The Sentencing Guidelines Commission--whose records we used to identify felons sentenced to probation in 1992--does not have informationon offenders’ BCA or FBI identification numbers, and this made it difficult to locate some offend-ers’ BCA records.

probationers.3 We tracked these offenders’ subsequent arrests and convictions forfelonies and gross misdemeanors, not for lesser offenses.4 Our research reliedmainly on records from BCA’s official criminal history database, but selectedanalyses in this chapter also incorporate (1) information from BCA’s ‘‘suspensefile,’’ which houses records of Minnesota convictions that BCA has not yet placedin its official criminal history database, and (2) Federal Bureau of Investigation(FBI) records of arrests in states other than Minnesota. We tracked each offenderfor exactly three years, beginning from a prisoner’s date of release or a proba-tioner’s date of sentencing. The appendix provides additional information on ourresearch methods.
Overall, we found that about 59 percent of the offenders released from prison in1992 were arrested for a new felony or gross misdemeanor in Minnesota withinthree years, and an additional 5 percent were rearrested for a felony or gross mis-demeanor outside of Minnesota during the three-year follow-up period. Duringthe three years, 45 percent were convicted of a new offense in Minnesota, and 40percent were imprisoned for new offenses or technical violations of their super-vised release. Felons sentenced to probation had lower recidivism rates, largely re-flecting their shorter criminal records. The reoffense rates we found appear to bewithin the broad range of rates reported in other recidivism studies. We foundhigher recidivism rates among young offenders, property offenders, and offendersin Hennepin and Ramsey counties. The overall recidivism rates of prison programparticipants were similar to the rates of non-participants, although it is possiblethat some programs reduced recidivism rates among some types of participants.
OFFENDER CHARACTERISTICS
Most of the felons released from prison in 1992 were young, single males. Table3.1 shows that among our sample of released prisoners, 92 percent were men, and73 percent were less than 35 years old at the time of their release. The sample in-cluded 38 offenders who were certified as adults for crimes committed when theywere juveniles.5 Eighty-one percent of the released prisoners were either nevermarried, divorced, or separated from their spouses. About 58 percent were white,and 29 percent were black.
We examinedthe criminalrecords of eachoffender forexactly threeyears.
48 RECIDIVISM OF ADULT FELONS
3 We found records in the criminal history file for all but four released prisoners. For one of thefour, we found a record in BCA’s ‘‘suspense file,’’ described in this chapter and the appendix. Wefound records in BCA’s criminal history file for 6,363 of 7,019 probationers (91 percent), and wefound records for an additional 428 probationers in BCA’s suspense file.
4 A felony is a crime that, under statute, may result in a prison sentence of more than one year. Agross misdemeanor is an offense for which a jail sentence of 91 days to one year may be imposed.An example of a common gross misdemeanor is repeat driving while intoxicated. To determine thelevel of offense for which offenders were reconvicted, we considered felonies to be offenses withpronounced sentences exceeding one year, and gross misdemeanors to be offenses with pronouncedsentences between 91 and 365 days.
5 Before 1994, a juvenile who was believed to have committed an offense after becoming age 14could be certified as an adult only if the prosecuting authority demonstrated that the child was notsuitable for treatment or that public safety would not be served by keeping the case in juvenile court.The law now presumes certification for certain offenses, and it authorizes prosecutors to seek certifi-cation in cases where juvenile court proceedings would not serve public safety.

Table 3.1: Descriptive Characteristics - ReleasedPrisoners and Probationers
Released Prisoners Probationers
Number Percent Number Percent
TOTAL OFFENDERS 1,879 6,791
GENDERMale 1,737 92% 5,518 81%Female 142 8 1,273 19
RACEWhite 1,093 58% 4,742 70%Black 545 29 1,400 21Native American 153 8 306 5Hispanic 70 4 243 4Other 18 1 100 1
AGEa
15-24 546 29% 2,926 43%25-34 833 44 2,350 3535-44 370 20 1,124 1745-54 97 5 276 455 and over 33 2 115 2
MARITAL STATUSb
Never Married 1,247 66% NASeparated/Divorced 289 15 NAMarried/Widowed 330 18 NAUnknown 13 1 NA
EDUCATIONAL ATTAINMENTb
Less than 12th grade 659 35% NAHigh school diploma 511 27 NAGED 415 22 NAPostsecondary 247 13 NAOther 47 3 NA
TYPE OF OFFENSEc
Violent 700 37% 1,497 22%Property 875 47 3,553 52Drug 248 13 1,475 22Other 56 3 266 4
CRIMINAL HISTORY SCOREd
0 367 21% 4,236 62%1-3 687 39 2,236 334-6 523 30 279 47 and over 190 11 40 0
Source: Program Evaluation Division analysis of Department of Corrections and Sentencing Guide-lines Commission data.
aAt time of release from prison or time of sentence to probation.
bAt time of admission to prison.
cMost serious offense for which the prisoner was committed or the probationer was sentenced.
dThe criminal history score is computed in accordance with Minnesota’s sentencing guideline s and re-flects offenders’ criminal history prior to the current conviction. Lower scores generally indicate fewerprior offenses. We were unable to determine a criminal history score for 112 released priso ners.
Prisonerstended to havelonger criminalhistories thanprobationers.
RECIDIVISM OF MINNESOTA FELONS 49

The released prisoners had diverse educational backgrounds at the time they en-tered prison. While 35 percent had not earned a high school diploma, 13 percenthad some type of postsecondary training. Twenty-seven percent had graduatedfrom high school and an additional 22 percent had earned a general educational de-velopment (GED) certificate.
Nearly half of the former inmates had been sentenced to prison for a propertycrime, such as burglary, theft, forgery, or fraud. Thirty-seven percent were impris-oned for a violent offense, such as criminal sexual conduct, assault, robbery, homi-cide, or kidnapping. Thirteen percent were committed to prison for a drug-relatedoffense.
Figure 3.1 shows that 77 percent of the released prisoners we tracked had been inprison for less than two years before their release.6 Some of the released prisonerswho had short stays behind bars were not initially sentenced to prison but were in-carcerated for violating the terms of their probation. Minnesota has had a determi-nate sentencing system since 1980, so the Department of Corrections has littlecontrol over offenders’ dates of release from prison.7
In comparison with released prisoners, our sample of probationers sentenced in1992 included higher percentages of women, white offenders, and felons underage 25. In addition,
45%
4%6%
13%
31%
Less than 1 year
1-2 years
2-3 years
More than 5 years3-5 years
Figure 3.1: Length of Time Served in Prison,Prisoners Released in 1992
Source: Program Evaluation Division analysis of Department of Corrections data.
Most of theprisoners westudied hadbeenimprisoned forless than twoyears.
50 RECIDIVISM OF ADULT FELONS
6 Although a felony is defined as an offense for which a prison sentence of more than one yearmay be imposed, an offender may be imprisoned for as little as two-thirds of the sentence--or eightmonths for a pronounced sentence of a year and a day. In addition to the prison time shown in thefigure, offenders may have received credit for jail time served prior to sentencing.
7 The department may extend the period of confinement for offenders who violate prison rules,and it may also determine how long to confine offenders whose supervised release has been revoked.

• Perhaps the most important differences between released prisonersand probationers were the types of offenses they had committed andthe lengths of their prior criminal records.
These differences largely reflect Minnesota’s sentencing guidelines, which weredeveloped partly to reserve prison space for more serious felony offenders. Com-pared with the released prisoner population, the probation population includedmore drug offenders and property offenders, but proportionally fewer violent of-fenders. In addition, probationers had committed fewer prior offenses than re-leased prisoners. For example, using the sentencing guidelines system fordetermining prior offenses, 61 percent of probationers had no prior convictions (ornot enough to result in one criminal history ‘‘point’’), compared with 21 percent ofreleased prisoners.8 We discuss these differences further in a later section of thischapter.
RECIDIVISM OF RELEASED PRISONERS
Overall RatesWe measured recidivism by calculating the percentage of released prisoners whowere rearrested, reconvicted, and reimprisoned. It is reasonable to expect rearrestrates for felonies and gross misdemeanors to exceed reconviction rates because (1)not all arrested offenders are prosecuted and convicted (or are convicted of misde-meanors, despite having been arrested for more serious offenses), and (2) not allconvictions occur during the standard follow-up period (in this case, three years).Likewise, reconviction rates should exceed rates of imprisonment because someconvicted offenders are sentenced to probation instead of prison. Many recidivismresearchers think that rearrest rates present a more accurate measure of true of-fender criminality than either reconviction or imprisonment rates. We examinedrecidivism using all of these measures, although some of our discussions highlightselected measures.
Figure 3.2 presents several three-year recidivism rates for the 1,879 inmates re-leased from state correctional facilities in 1992. BCA records for this sample of of-fenders showed that:
• About 59 percent of released prisoners were arrested in Minnesotawithin three years for a new felony or gross misdemeanor, and 45percent were convicted within three years.
We determinedoffenders’ ratesof rearrest,reconviction,and reimprison-ment.
RECIDIVISM OF MINNESOTA FELONS 51
8 The Minnesota Sentencing Guidelines Commission does not count fractions when determiningan offender’s criminal history points. For instance, an offender whose criminal history consisted ofthree gross misdemeanor convictions would have a criminal history score of zero because it takesfour such convictions to equal one criminal history point.

In addition, we found that 45 percent of released prisoners were rearrested for afelony in Minnesota in the three years following release, and 34 percent were re-convicted of a felony.9
We also examined FBI records to determine the extent to which Minnesota offend-ers committed new crimes in other states. The records showed that an additional 5percent of the prisoners released from Minnesota correctional facilities in 1992were rearrested for out-of-state offenses (but not Minnesota offenses) in the three-year follow-up period. Thus, a total of 64 percent of Minnesota’s prisoners wererearrested in the United States within three years of release.
We used data from the Department of Corrections and BCA to determine howmany released inmates returned to prison within three years. Some offenders re-turn to prison because they commit new offenses and are sentenced to prisonagain. Others are reimprisoned by the Department of Corrections for violating theterms of their supervised release--perhaps by failing a drug test, committing a mi-nor offense, or refusing to participate in a community treatment program. Depart-ment staff told us that they view reimprisonment for technical violations as a way
0
10
20
30
40
50
60
70 59%
45% 45%
34%28%
12%
RearrestRate *
ReconvictionRate *
FelonyRearrest Rate
FelonyReconviction
Rate
ImprisonmentRate - NewOffense **
ImprisonmentRate - Technical
Violation Only
Percent
Type of Recidivism Measure
Figure 3.2: Three-Year Recidivism Rates forPrisoners Released in 1992, Based on MinnesotaOffenses Only
Source: Program Evaluation Division analysis of BCA and Department of Corrections data.
* For a felony or gross misdemeanor.
** Some of these offenders were imprisoned for both a new offense and a technical violation of su-pervised release.
WithinMinnesota, 59percent ofprisoners wererearrested, anda total of 40percent werereimprisonedfor newoffenses ortechnicalviolations.
52 RECIDIVISM OF ADULT FELONS
9 The general reoffense rates presented in this section include arrests and convictions from boththe BCA criminal history file and the suspense file. The felony reoffense rates given here might un-derstate the actual felony rearrest and reconviction rates by 1 or 2 percentage points because we didnot search the suspense file for offenders who had only a gross misdemeanor conviction in the BCAofficial criminal history records. Some of these offenders might have had a felony arrest or convic-tion record in the suspense file.

to hold offenders accountable before they commit more serious offenses. Wefound that:
• A total of 40 percent of released inmates returned to prison inMinnesota within three years-- 28 percent for a new offense andanother 12 percent solely for technical violations of the terms of theirsupervised release, not for new offenses.
We compared these findings with return rates that have been calculated by the de-partment. We found that the department’s method of computing return rates hasunderstated the percentage of inmates who returned to prison with a new sentence.This occurred because the department has categorized inmates’ returns to prisonbased on only their first return. For example, a prisoner who was released in1992 and first returned as a technical violator in 1993 would be counted by the de-partment as a return without a new sentence. Even if he were subsequently sen-tenced to prison for a new offense within the follow-up period, the departmentwould still not count the offender as having returned to prison for a new offense.Applying the department’s methodology, only 22 percent of inmates released in1992 returned to prison with a new sentence within three years, rather than the ac-tual rate of 28 percent. Because the department often provides legislators with in-formation on the percentage of inmates who returned to prison for new offenses,we think that it is important for this return rate to reflect complete information forthe follow-up period.
Chapter 2’s review of previous studies observed that three-year recidivism ratesfor released prisoners have usually fallen within the following ranges: 50 to 70percent rearrest rates, 35 to 55 percent reconviction rates, and 25 to 45 percent re-imprisonment rates for new offenses and technical violations. The recidivismrates that we found for Minnesota were within these broad ranges, and the rearrestand reconviction rates were very similar to those found in a federal study of 11states. Minnesota’s overall reimprisonment rate was higher than the rates of manystates for which we found comparable data. But the data from other states usuallydid not differentiate between imprisonments for new offenses and imprisonmentsfor technical violations, so it is unclear which type of imprisonment accounted forthese states’ lower reimprisonment rates.
Recidivism Rates, by Conviction OffenseBesides measuring overall recidivism rates for released prisoners, we also ana-lyzed inmate reoffense patterns based on the original offense that resulted in im-prisonment.10 We found that:
• Property offenders were more likely to reoffend than other types ofoffenders.
TheDepartment ofCorrections hasunderstated thenumber ofoffendersreturning toprison for newcrimes.
RECIDIVISM OF MINNESOTA FELONS 53
10 Our analysis of reoffense rates by offense type did not include suspense file records, so the ar-rest and conviction percentages in this section probably understate the actual rates by several percent-age points.

As Figure 3.3 shows, 66 percent of the property offenders in the released prisonersample were arrested for a new offense within three years of release, and 52 per-cent were convicted in that time span. In contrast, 45 percent of violent offenderswere arrested within the follow-up period, and 30 percent were convicted. Fifty-nine percent of drug offenders were arrested within three years, and 40 percentwere convicted of new crimes. In addition, we found that:
• Violent, property, and drug offenders were about equally likely to bearrested for violent felonies after their release from prison.
About 18 percent of violent offenders, 15 percent of property offenders, and 16percent of drug offenders were arrested for violent felonies within three years oftheir release from prison. On the other hand, felons originally sent to prison forproperty offenses were more likely than other offenders to be arrested for a prop-erty felony after their release from prison. Forty-one percent of the property of-fenders in the released prisoner sample were rearrested for a property felony,compared with 15 percent of violent offenders and 22 percent of drug offenders.
Most released prisoners did not commit the exact same offense that had landedthem in prison. Table 3.2 presents recidivism rates for released prisoners who hadbeen imprisoned for offenses in selected categories. As the table shows, offendersimprisoned for forgery/fraud were most likely to be rearrested for the same of-fense; 32 percent were rearrested for forgery or fraud within three years of their re-lease from prison. In contrast, no homicide offenders released in 1992 were
0
10
20
30
40
50
60
70
Violent Property Drugs Other
Arrested Arrested for Felony Convicted
Percent
Original Offense Type
Figure 3.3: Reoffense Rates of Prisoners Releasedin 1992, By Original Offense Type
Note: "Violent" offenses are sometimes called "person" offenses.
Source: Program Evaluation Division analysis of BCA criminal history data.
Propertyoffenders hadthe highestrecidivismrates.
54 RECIDIVISM OF ADULT FELONS

arrested for a new homicide, and only 10 percent of released sex offenders were ar-rested for a new sex offense.
Research has shown that many recidivists commit a variety of offenses, not just asingle type, as we discussed in Chapter 2. Thus, we examined which types of pris-oners were most likely to be rearrested for any type of felony or gross misde-meanor after their release, not just the type of crime for which they wereimprisoned. Among felons released from prison in 1992, we found that:
• Sex offenders and homicide offenders were the least likely to bearrested for new crimes, and vehicle thieves were the most likely.
Thirty percent of sex offenders and 34 percent of homicide offenders were ar-rested for a new felony or gross misdemeanor within three years of their releasefrom prison. In comparison, certain types of property offenders were much morelikely to be rearrested, particularly vehicle thieves (81 percent), burglars (68 per-cent), and people imprisoned for other types of theft (66 percent).
Based on our analysis, Department of Corrections officials observed that many re-leased prisoners were not arrested in the follow-up period or were arrested for of-fenses that were less serious than the offenses for which they were sent to prison.For instance, although all of the released prisoners in our sample had originallybeen sent to prison for felony convictions, our analysis showed that 55 percentwere not arrested for felonies in the three-year follow-up period (and 66 percentwere not convicted of felonies). However, these findings do not necessarily meanthat prisons transformed offenders into less serious criminals or law-abiding citi-
Table 3.2: Reoffense Patterns For Selected Categories of OffendersReleased from Prison in 1992
Percent Rearrested for: PercentConvicted of
Any Felony Any FelonyNumber of Same Violent Property Any or Gross or Gross
Original Offense Offenders Offense Felony Felony Felony Misdemeanor Misdemeanor
Violent CrimesHomicide 41 0% 10% 10% 24% 34% 15%Kidnapping 11 9 27 18 45 64 45Sex Offense 263 10 17 7 24 30 17Robbery 153 10 20 25 47 58 43Assault 230 14 20 17 39 54 37
Property CrimesBurglary 345 28 16 41 54 68 52Theft 201 20 16 40 52 66 52Vehicle Theft 108 28 23 52 65 81 65Forgery/Fraud 130 32 8 38 43 57 45Receiving Stolen Property 61 5 10 41 49 59 48Property Damage 22 14 23 41 59 68 50
Note: The data shown here are based solely on records from the BCA’s criminal history file. The reoffense rates do not include data fromBCA’s "suspense file" or FBI data on offenses committed in states other than Minnesota.
Source: Program Evaluation Division analysis of BCA criminal history data.
Offendersimprisoned forsex offensesand homicidehad relativelylow recidivismrates.
RECIDIVISM OF MINNESOTA FELONS 55

zens. For instance, offenders in our sample may have committed serious offensesthat did not result in arrests.11 In addition, as we discussed in Chapter 2, it is nor-mal for some offenders to stop committing crimes as they grow older, rather thanas a result of particular sanctions or programs.
Recidivism Rates, by Prisoner CharacteristicsWe examined the relationship between recidivism rates and offender charac-teristics such as age, gender, race, and educational attainment. Table 3.3 presentsrearrest and reconviction rates based on various demographic factors for prisonersreleased from Minnesota correctional facilities in 1992. Consistent with previousrecidivism research, our data showed that:
• Young released prisoners were more likely to reoffend than olderinmates.
Figure 3.4 demonstrates that both rearrest and reconviction rates were higher foryounger released prisoners. About 61 percent of inmates age 39 and under at thetime of release were arrested for a new offense in Minnesota within three years,but only 31 percent of offenders 40 and older were rearrested in the same period.
0
10
20
30
40
50
60
70
80
17-19 20-24 25-29 30-34 35-39 40-44 45-49 50-54 55-59 60 and over
Rearrest Rate Reconviction Rate
Percent
Age at Release
Figure 3.4: Recidivism Rates of PrisonersReleased in 1992, By Age of Prisoner at Release
Source: Program Evaluation Division analysis of Department of Corrections and BCA data.
Recidivismrates declinedwith age.
56 RECIDIVISM OF ADULT FELONS
11 Any group of released prisoners is a ‘‘biased’’ sample because it consists entirely of offenderswho were caught for their crimes and given the most serious possible sanction (imprisonment).Many crimes do not result in arrests, so it is likely that less than 100 percent of released prisonerswould be arrested and convicted in a follow-up period even if they all continued to commit crimes.Also, it is possible that some offenders eluded arrest or prosecution for serious offenses but were ar-rested for lesser offenses.

Table 3.3: Reoffense Rates of Prisoners Released in1992, By Age, Gender, Race, Educational Attainment,and Marital Status
Rearrested Offenders Reconvicted OffendersTotal
Offenders Number Percent Number Percent
AGEa
17-19 51 38 75% 28 55%20-24 495 315 64 227 4625-29 460 290 63 219 4830-34 372 221 59 160 4335-39 228 115 50 84 3740-44 142 49 35 31 2245-49 60 23 38 16 2750-54 37 6 16 5 1455-59 21 5 24 2 1060+ 12 1 8 1 8
GENDERMale 1,736 989 57% 723 42%Female 142 74 52 50 35
RACEWhite 1,093 536 49% 397 36%Black 545 381 70 276 51Native American 153 100 65 73 48Hispanic 69 38 55 24 35Other 18 8 44 3 17
EDUCATIONAL ATTAINMENTb
Less than 12th grade 658 388 59% 270 41%High school diploma 511 260 51 188 37Postsecondary 247 121 49 90 36GED 415 270 65 208 50Otherc 47 24 51 17 36
MARITAL STATUSd
Never married 1,246 767 62% 564 45%Separated/divorced 289 137 47 94 33Married/widowed 330 154 47 112 34
Note: The reoffense rates shown here are based solely on records from the BCA’s criminal histor y file.They do not include data from BCA’s "suspense file" or FBI data on offenses committed in states otherthan Minnesota.
aAge at time of release from prison.
bHighest grade completed at time of incarceration.
cIncludes special education, vocational school, and unknown.
dMarital status was unknown for 13 prisoners released in 1992.
Source: Program Evaluation Division analysis of data from the Department of Corrections an d BCA’scriminal history file.
RECIDIVISM OF MINNESOTA FELONS 57

We also found that a very high percentage (76 percent) of the released prisonerswho had been certified for offenses committed before age 18 were arrested withinthree years following their release from prison in 1992. One-half of the certifiedoffenders were convicted of a new offense during the follow-up period.
We compared the recidivism rates of the men and women in our sample and foundthat:
• Among released prisoners, men had somewhat higher reoffense ratesthan women.
About 57 percent of the male prisoners and 52 percent of the female inmates wererearrested within three years of their release. Reconviction rates followed a simi-lar pattern, with 42 percent of men and 35 percent of women convicted of a newoffense within three years. However, there was a greater difference between thereoffense rates of male and female violent offenders. Forty-six percent of themale violent offenders in our sample were rearrested within three years, versus 25percent of the women who originally committed violent offenses. The overallreoffense rates masked this disparity because a higher proportion of female offend-ers than male offenders were imprisoned for property offenses or drug offenses.12
As we noted in the previous section, property and drug offenders generally hadhigher reoffense rates than violent offenders.
We analyzed recidivism rates by racial/ethnic group and found that:
• Black, Native American, and Hispanic released prisoners had higherrearrest and reconviction rates than whites.
About 70 percent of blacks, 65 percent of Native Americans, and 55 percent ofHispanic offenders in our released prisoner sample were rearrested within threeyears, compared with 49 percent of whites.
In addition, we found that 51 percent of the released prisoners who had enteredprison with a high school diploma were rearrested within three years of their re-lease, compared with 59 percent of those who had not completed high school. In-terestingly, 65 percent of those who entered prison with a GED were rearrestedafter their release, although this high rate might be partially explained by theirhigher criminal history scores.13
Finally, we found that inmates who had not been married before entering prisonwere more likely to reoffend in the three years after release than inmates whowere married, divorced, or separated (62 percent rearrested vs. 47 percent). Thisfinding was explained in part by the fact that inmates who had never been marriedtended to be younger, and, as we mentioned previously, younger inmates tended to
Men hadhigherrecidivismrates thanwomen, andblack offendershad higherrates thanwhites.
58 RECIDIVISM OF ADULT FELONS
12 About 78 percent of the female prisoners in our sample had been incarcerated for property ordrug crimes, compared with 58 percent of the male inmates. In contrast, while 39 percent of the menwere violent offenders, only 20 percent of the women represented this type of offender.
13 Fifty percent of the released prisoners who entered prison with a GED had criminal historyscores of four or higher, compared with 35 percent of the offenders with a regular high school de-gree and 32 percent of those who had not completed high school.

have higher reoffense rates.14 Nevertheless, even when we controlled for the ageof the inmate, released prisoners who had never been married had higher rearrestrates than married prisoners or prisoners who had once been married.
RECIDIVISM OF PROBATIONERS
Overall RatesWe computed rearrest, reconviction, and imprisonment rates for 6,791 offenderswho were placed on probation in 1992. Figure 3.5 shows that:
• Forty-two percent of felony offenders sentenced to probation in 1992were arrested for a felony or gross misdemeanor within a three-yearperiod, and 28 percent were reconvicted.
0
10
20
30
40
50
60
42%
28%31%
20%
11%
4%
RearrestRate *
ReconvictionRate *
FelonyRearrest
Rate
FelonyReconviction
Rate
ImprisonmentRate - NewOffense **
ImprisonmentRate -
TechnicalViolation Only
Percent
Type of Recidivism Measure
Figure 3.5: Three-Year Recidivism Rates forProbationers Sentenced in 1992, Based onMinnesota Offenses Only
Source: Program Evaluation Division analysis of BCA and Sentencing Guidelines Commissiondata.
* For a felony or gross misdemeanor.
** Some of these offenders were imprisoned for both a new offense and a technical violation ofprobation.
Forty-twopercent offelonyprobationerswere rearrestedfor felonies orgrossmisdemeanorsin Minnesota,and 28 percentwerereconvicted.
RECIDIVISM OF MINNESOTA FELONS 59
14 The median age for inmates who had never been married was 26, while the median age for in-mates who were or had been married was 35.

We also calculated the rate at which probationers were arrested and convicted fornew felony offenses.15 About 31 percent of the probationers were arrested for anew felony offense within three years, and 20 percent were convicted of a felonyin the follow-up period.
We were able to calculate rates of imprisonment from BCA’s criminal history dataand ‘‘suspense file’’ records. In addition, we looked at Sentencing GuidelinesCommission records to determine the percentage of probationers who went toprison within the three-year follow-up period for violating the terms of their proba-tion. A probation officer can recommend that an offender’s probation be revokedfor violations such as repeatedly failing drug tests or missing scheduled appoint-ments at the probation office. We found that 11 percent of probationers committeda new offense and were imprisoned at a Department of Corrections facility withinthree years of their original sentencing date. An additional 4 percent of probation-ers went to prison for violating the terms of their probation, not for a new convic-tion.16
The recidivism rates we found for Minnesota probationers appear to be within thebroad range of rates cited in studies of probationers in other states. For instance, anational study found that a median of 34 percent of probationers in selectedurban counties (excluding California counties) were arrested within their homestates for a felony within three years of sentencing.17 This is similar to the 31 per-cent felony rearrest rate that we found for Minnesota probationers statewide.
Recidivism Rates, by Conviction OffenseFigure 3.6 shows recidivism rates for the four general types of probation offend-ers, based on the original offense that resulted in a probation sentence. We foundthat:
• Property offenders were more likely to reoffend than other categoriesof probationers.
As Table 3.4 shows, 43 percent of the property offenders, 35 percent of violent of-fenders, 38 percent of drug offenders, and 37 percent of other offenders sentencedto probation in 1992 were arrested for a new felony or gross misdemeanor within
A total of 15percent ofprobationerswereimprisonedwithin threeyears ofsentencing.
60 RECIDIVISM OF ADULT FELONS
15 The general reoffense rates presented in this section include arrests and convictions from boththe BCA criminal history file and the suspense file, but the analyses of recidivism by conviction of-fense and offender characteristics count only arrests and convictions in the BCA criminal historyfile. The felony reoffense rates given here might understate the actual felony rearrest and reconvic-tion rates by 1 or 2 percentage points because we did not search the suspense file for offenders whohad only a gross misdemeanor arrest or conviction in the BCA official criminal history records.Some of these offenders might have had a felony arrest or conviction record in the suspense file.
16 Data on probation revocations for 1995 were not available at the time of our analysis. Also, wedid not determine whether 428 offenders whose criminal records appeared only in BCA’s ‘‘suspensefile’’ went to prison for technical violations of the terms of their probation.
17 Patrick A. Langan and Mark A. Cunniff, Recidivism of Felons on Probation, 1986-89 (Washing-ton, D.C.: U.S. Bureau of Justice Statistics, February 1992). Supplemental data are reported inMark A. Cunniff and Mary K. Shilton, Variations in Felony Probation: Persons Under Supervisionin 32 Urban and Suburban Counties (Washington, D.C.: National Association of Criminal JusticePlanners, March 1991).

three years of their sentencing. Twenty-seven percent of property offenders, 20percent of violent offenders, 22 percent of drug offenders, and 23 percent of otheroffenders were convicted of a new felony or gross misdemeanor. In general, therecidivism rates of these four types of probationers were more similar than therates we found among these types of released prisoners.
We also looked at the types of new offenses for which probationers were arrested.We found that:
• Persons sentenced to probation for violent offenses were more likelythan other probationers to be arrested for new violent felonies, andpersons placed on probation for property offenses were more likelyto be arrested for new property felonies within three years of theirsentence.
Twenty percent of felons placed on probation for violent offenses were arrestedfor violent felonies within three years of their sentence. In comparison, 8 percentof felons placed on probation for property offenses and 7 percent of felons placedon probation for drug offenses were arrested for violent felonies within threeyears. This pattern is different from our findings for released prisoners. Earlier,we noted that released prisoners who had committed violent, property, and drug of-fenses were about equally likely to commit a new violent offense.
0
10
20
30
40
50
Violent Property Drugs Other
Arrested Arrested for Felony Convicted
Percent
Original Offense Type
Figure 3.6: Reoffense Rates of ProbationersSentenced in 1992, By Original Offense Type
Source: Program Evaluation Division analysis of BCA criminal history data.
Felons placedon probationfor violentcrimes weremore likelythan otherprobationers tobe arrested fornew violentfelonies.
RECIDIVISM OF MINNESOTA FELONS 61

Persons originally placed on probation for a property offense were the type of of-fender most likely to be arrested for a property offense within three years of sen-tencing. We found that 28 percent of property offenders, 8 percent of violentoffenders, and 10 percent of drug offenders were arrested for a new property felony.
As was the case with released prisoners, most probationers were not rearrested forthe exact same category of offense that had landed them on probation. Table 3.4shows the recidivism patterns in more detail, based on the original crime for
Table 3.4: Reoffense Patterns of Offenders Sentenced to Probation in1992, By Original Offense Type
Percent Rearrested For: PercentReconvicted
Any Felony of Any FelonyTotal Same Violent Property Any or Gross or Gross
Original Offense Offenders Offense Felony Felony Felony Misdemeanor Misdemeanor
Violent CrimesHomicidea 14 14% 14% 0% 14% 21% 21%Kidnapping 19 11 21 5 21 21 16Sex Offense 498 18 18 3 21 25 13Robbery 145 28 34 19 46 55 36Assault 710 17 19 10 27 40 23Other Violent Crime 31 3 6 10 16 23 6
Total Violent 1,417 18% 20% 8% 27% 35% 20%
Property CrimesArson 46 11% 4% 20% 22% 28% 15%Burglary 801 26 8 33 39 49 31Theft 670 16 11 27 35 44 30Vehicle Theft 305 20 12 36 46 57 38Forgery/Fraud 1,044 21 4 23 26 34 21Receiving Stolen Property 247 8 8 25 32 41 24Damage to Property 149 11 6 28 33 47 27Other Property Crime 33 3 3 12 24 30 24
Total Property 3,295 19% 8% 28% 34% 43% 27%
Drug Crimes 1,396 16% 7% 10% 26% 38% 22%
Other CrimesFamily Offenses 15 13% 7% 7% 20% 33% 7%Gambling 39 10 3 13 26 41 26Obstruction of Justice 29 7 10 3 21 21 14Weapons Offenses 82 9 10 20 29 48 27Escape 33 12 18 15 39 55 45DUI Resulting in Injury 45 7 7 4 9 20 16Miscellaneous 12 9 8 0 8 8 0
Total Other Crimes 255 9% 9% 12% 24% 37% 23%
TOTAL 6,363 18% 10% 19% 30% 40% 25%
Note: The data shown here are based solely on records from the BCA’s criminal history file. The reoffense rates do not include data fromBCA’s "suspense file" or FBI data on offenses committed in states other than Minnesota.
Source: Program Evaluation Division analysis of BCA criminal history data.
aTwelve of the 14 homicide offenders were sentenced to probation for criminal vehicular hom icide involving alcohol or other con-trolled substances and one each for second degree manslaughter and second degree murder. Tw o of the offenders originally sentencedto probation for criminal vehicular homicide were rearrested for the same offense within th ree years.
62 RECIDIVISM OF ADULT FELONS
which the offenders received probation.18 Robbers and burglars were the catego-ries of offenders most likely to be rearrested for the exact same offense that hadlanded them on probation (28 and 26 percent, respectively).
In general, we found that violent offenders sentenced to probation were morelikely to be rearrested for the same category of offense than violent offenders re-leased from prison. For instance, 18 percent of sex offenders sentenced to proba-tion were arrested for a new sex offense, while 10 percent of sex offendersreleased from prison were arrested for a new sex offense.
We also examined which categories of probationers were most likely to be rear-rested for any type of felony or gross misdemeanor. Among those offenses with atleast 50 individuals sentenced to probation in 1992, we found that:
• Sex offenders were the least likely to be arrested for a new felony orgross misdemeanor and vehicle thieves and robbers were the mostlikely.
Twenty-five percent of sex offenders sentenced to probation in 1992 were arrestedfor a new felony or gross misdemeanor within three years of their sentence.19 Incontrast, probationers with the highest rearrest rates were vehicle thieves (57 per-cent), robbers (55 percent), burglars (49 percent), violators of weapons laws (48percent), and property damage offenders (47 percent).
Recidivism Rates, by Probationer CharacteristicsTable 3.5 shows the recidivism rates of probationers sentenced in 1992 by severaldemographic characteristics (age, gender, and race).20 We found that:
• Young offenders sentenced to probation in 1992 had higher rearrestand reconviction rates than older probationers.
For example, 43 percent of probationers between the ages of 20 and 24 at the timeof sentencing were rearrested within three years, but only 22 percent of probation-ers ages 45 to 49 had new arrests in the same time period. This inverse relation-ship between age and reoffense rate resembles the pattern we found amongprisoners released in 1992.
When we analyzed the recidivism rates of men and women probationers in oursample, we found that:
• Male offenders sentenced to probation were more likely to reoffendthan female probationers.
Car thieves,robbers, andburglars werethe types ofprobationersmost likely tobe rearrested.
RECIDIVISM OF MINNESOTA FELONS 63
18 Inmates convicted of more than one offense were categorized under their most serious offense.For example, violent offenses were considered more serious than property offenses.
19 Homicide offenders and kidnappers both had rearrest rates of 21 percent, but fewer than 20 peo-ple were sentenced to probation for each of these offenses in 1992.
20 Analyses of recidivism rates by age, gender, and race do not include convictions recorded inBCA’s ‘‘suspense file.’’

Table 3.5 compares the rearrest and reconviction rates of men and women sen-tenced to probation in 1992. Forty-one percent of men were rearrested withinthree years of sentencing, and 26 percent were reconvicted. In comparison, 33 per-cent of women were rearrested in the follow-up period, and 20 percent were recon-victed.
Finally, we compared probationers’ reoffense rates by race and found that:
• Black, Native American, Asian, and Hispanic probationers were morelikely to be rearrested and reconvicted than white probationers.
Table 3.5 shows that the three-year rearrest rate among white probationers (33 per-cent) was lower than the rearrest rates for black (59 percent), Native American (52percent), Asian (45 percent), and Hispanic probationers (38 percent).
Table 3.5: Reoffense Rates of Probationers Sentencedin 1992, By Age, Gender, and Race
Rearrested Offenders Reconvicted OffendersTotal
Offenders Number Percent Number PercentAGE
15-19 919 489 53% 278 30%20-24 1,822 789 43 487 2725-29 1,238 498 40 311 2530-34 982 359 37 234 2435-39 664 232 35 154 2340-44 385 106 28 57 1545-49 170 38 22 22 1350-54 81 20 25 12 1555-59 52 2 4 1 260+ 50 6 12 3 6
GENDERMale 5,224 2,161 41% 1,333 26%Female 1,139 378 33 226 20
RACEWhite 4,372 1,444 33% 885 20%Black 1,378 812 59 500 36Native American 296 153 52 92 31Hispanic 221 85 38 54 24Asian/Pacific Islander 74 33 45 19 26Other 22 12 55 9 41
Note: The rearrest and reconviction rates shown here are based solely on records from the BCA ’scriminal history file. The percentages do not include data from BCA’s "suspense file" or FBI data on of-fenses committed in states other than Minnesota.
Source: Program Evaluation Division analysis of BCA’s criminal history data and Minnesota Sentenc-ing Guidelines Commission records.
64 RECIDIVISM OF ADULT FELONS

SENTENCING FACTORS AND RECIDIVISM
In 1978, the Legislature reformed sentencing policy by abolishing indeterminatesentencing in Minnesota and replacing it with a sentencing guidelines system.The new law created the Minnesota Sentencing Guidelines Commission and di-rected it to: (1) determine the circumstances under which imprisonment would bea proper sentence, and (2) set guidelines for the length of imprisonment. The com-mission created a sentencing grid that judges now use to determine sentences forfelony offenders in Minnesota. A sentence is based on two dimensions: the ‘‘se-verity level’’ of the offense and the offender’s ‘‘criminal history index score.’’ Forany combination of offense severity and criminal history, the grid indicates a pre-sumptive sentence for the offender. A judge may depart from the presumed dura-tion and type of sentence, but only under ‘‘substantial and compellingcircumstances.’’21
Offense SeverityAccording to the Sentencing Guidelines Commission, the offense of conviction is‘‘the primary factor . . . in dispositional decisions.’’22 The commission has dividedfelony offenses into ten levels of severity. Severity Level I encompasses the leastsevere offenses, for example the sale of a simulated controlled substance, and Se-verity Level X contains the most severe offenses, such as second degree murder.23
If an offender is convicted of two or more felonies, the most severe offense deter-mines the severity level on the sentencing grid.
We used sentencing records to analyze the reoffense rates of released prisonersand probationers by the severity levels of their original conviction offenses.24 Thedata showed that:
• Felons convicted of less severe crimes were more likely to be arrestedwithin three years of release than those convicted of more severecrimes.
Figure 3.7 shows that 65 percent of released prisoners with less severe convictionoffenses (severity levels I - IV) were rearrested in Minnesota during the follow-upperiod, but among prisoners convicted of the most severe crimes (severity levels
According tostateguidelines,felonysentencesshould usuallyreflect theseverity of thecrime and theoffender’sprior criminalrecord.
RECIDIVISM OF MINNESOTA FELONS 65
21 Minnesota Sentencing Guidelines Commission, Minnesota Sentencing Guidelines and Commen-tary (St. Paul, August 1, 1995), 20.
22 Minnesota Sentencing Guidelines and Commentary, 5.
23 Since first degree murder carries a mandatory life imprisonment sentence, it is not ranked on thesentencing guidelines grid.
24 We were able to match 94 percent of our released prisoners (1,766 out of 1,878) and 100 per-cent of probationers to sentencing records. Eight of the prisoners in our sample were never assignedcriminal history scores or severity levels because they were sentenced prior to 1980, when the sen-tencing guidelines took effect. Missing or erroneous data probably account for the remaining offend-ers for whom we could not locate sentencing records.

VII - X), 38 percent were rearrested within three years of release.25 Reconvictionrates also decreased as the severity level of the released prisoners’ offenses in-creased. This pattern is consistent with our finding that property offenders hadhigher rearrest rates than other types of offenders, since most of the offenses atlower severity levels are property crimes.26 We found that prisoners incarceratedfor less serious crimes were rearrested more often for property offenses than vio-lent offenses after their release, while prisoners originally convicted of more seri-ous crimes were more likely to be arrested for violent offenses than propertyoffenses.
Figure 3.8 presents the reoffense rates for probationers convicted of offenses at dif-ferent severity levels. The graph shows that 41 percent of probationers convictedat the lowest severity levels were rearrested within three years, while 29 percent ofprobationers convicted at the highest severity levels had new arrests within the follow-up period.
0 10 20 30 40 50 60 70 80
I-IV V-VI VII-XSeverity Level of Original Offense
Rearrest Rate Reconviction Rate
Percent
Figure 3.7: Reoffense Patterns of PrisonersReleased in 1992, By Severity of Original Offense
Source: Program Evaluation Division analysis of BCA and Sentencing Guidelines Commissiondata.
Offendersconvicted ofless severecrimes tendedto have higherrecidivismrates.
66 RECIDIVISM OF ADULT FELONS
25 For statistical reporting purposes, the Sentencing Guidelines Commission divides offense sever-ity levels into three groups (I-IV, V-VI, and VII-X).
26 Seventy percent of released prisoners with original offenses between severity levels I and IVwere property offenders, compared with 8 percent for prisoners whose offenses ranked in the highestseverity group (VII - X).

Criminal HistoryThe second dimension of the sentencing guidelines grid, the criminal history indexscore, summarizes the offender’s criminal record prior to the current offense. Anoffender is assigned criminal history points for three types of prior convictions:adult felonies, adult misdemeanors or gross misdemeanors, and crimes committedas a juvenile that would have been felonies if committed by an adult.27 For exam-ple, the guidelines assign 0.5 to 2.0 points per adult felony, depending on its sever-ity, and they assign 0.5 points for each juvenile conviction.28 The guidelinesassign an additional point if the most recent offense occurred while the offenderwas on probation, on supervised release, or incarcerated.
We compared the rearrest and reconviction rates for felons with different criminalhistory scores at the time of sentencing. In general, we found that:
0 10 20 30 40 50 60 70 80
I-IV V-VI VII-XSeverity Level of Original Offense
Rearrest Rate Reconviction Rate
Percent
Figure 3.8: Reoffense Patterns of ProbationersSentenced in 1992, By Severity of Original Offense
Source: Program Evaluation Division analysis of BCA and Sentencing Guidelines Commissiondata.
Criminalhistory scoresare a way ofmeasuring theextent ofoffenders’previouscriminalrecords.
RECIDIVISM OF MINNESOTA FELONS 67
27 A criminal history point for juvenile offenses is generally given only when: (1) the juvenile of-fenses occurred after the offender’s 14th birthday; (2) the offender was under age 25 when the cur-rent felony was committed; and (3) the juvenile court made its findings after an admission in court orafter trial.
28 A prior felony at severity level I - II equals 1/2 point; severity level III - V equals 1 point; sever-ity level VI - VII equals 1 1/2 points; and severity level VIII - X equals 2 points. Likewise, a priorconviction for first degree murder equals 2 points. This system of weighting prior felonies was im-plemented in 1989. Before that time, 1 point was assigned for each prior felony, regardless of sever-ity. In most cases, four prior convictions for misdemeanors or gross misdemeanors equal 1 point.

• Among both released prisoners and probationers, felons with longercriminal records were more likely to be rearrested than those withshorter records.
As shown in Table 3.6, the three-year rearrest rate for released prisoners who hada criminal history score of zero was 39 percent, but it climbed to 55 percent forprisoners with a score of two, and reached 68 percent for those with a score of sixor higher. The trend was the same among felons sentenced to probation. Thirty-two percent of probationers with no criminal history were rearrested within threeyears, compared with 66 percent of probationers with history scores of six orabove. Reconviction rates followed a similar pattern for both samples of offenders.
This pattern is partially explained by the fact that felons who had higher criminalhistory scores were more likely to be property offenders than violent offenders.For example, 26 percent of released prisoners who had a history score of zerowere property offenders, but 73 percent of those with scores of six or higher hadbeen imprisoned for property offenses. As we described in a previous section,property offenders were more likely to reoffend than violent offenders.
Table 3.6 also demonstrates that:
• Probationers and released prisoners with the same criminal historyscores had similar rearrest rates.
Prisoners released in 1992 had much higher overall rates of recidivism than proba-tioners (59 percent vs. 42 percent), but these differences narrowed or disappearedwhen we compared offenders who had similar criminal records. For instance, 55percent of released prisoners who had a criminal history score of two at the timeof sentencing were rearrested within three years of release, and 52 percent of
Table 3.6: Three-Year Recidivism Rates of Released Prisoners andProbationers, By Criminal History Score
Prisoners Released in 1992 Probationers Sentenced in 1992
History Total Percent Percent Total Percent PercentScore Offenders Rearrested Reconvicted Offenders Rearrested Reconvicted
0 366 39% 23% 3,865 32% 18% 1 201 48 33 1,019 46 29 2 224 55 38 781 52 34 3 262 63 44 383 60 38 4 240 67 51 162 62 49 5 164 66 50 86 70 57 6+ 309 68 56 67 66 49
Note: The reoffense rates shown here are based solely on records from the BCA’s criminal histor y file. They do not include data fromBCA’s ‘‘suspense file’’ or FBI data on offenses committed in states other than Minnesota.
Source: Program Evaluation Division analysis of data from the Department of Corrections, s entencing records, and BCA’s criminal historyfile.
68 RECIDIVISM OF ADULT FELONS

probationers with this criminal history score were rearrested within three years.Probationers had lower overall rates of recidivism because, in general, they hadshorter criminal records than released prisoners. Sixty-one percent of the proba-tioners we tracked had a criminal history score of zero, but only 21 percent of re-leased prisoners had such a score.
Departures from Sentencing GuidelinesUnder Minnesota’s sentencing guidelines, judges are to use the presumptive sen-tences provided in the sentencing guidelines grid unless the individual circum-stances of a case are ‘‘substantial and compelling.’’29 When such circumstancesexist, a judge may depart from the presumptive sentence but must file written rea-sons for the departure.30 An aggravated dispositional departure occurs if ajudge pronounces a prison sentence when the guidelines indicate a stayed sen-tence. If a judge places an offender on probation when the guidelines presumeprison, this is known as a mitigated, or downward dispositional departure . In1994, downward dispositional departures far outnumbered aggravated disposi-tional departures (893 to 318). Downward departures constituted 9 percent of allfelony sentences pronounced in that year, or 34 percent of the presumptive prisoncommitments recommended by the guidelines.31
We looked at the recidivism rates of offenders in our probation sample who wouldhave been sent to prison under the guidelines but instead received probation. Wefound that there was little difference between the overall rearrest rates of offenderswith downward dispositional departures and the rearrest rates of other offenderswho received probation. As Table 3.7 indicates, 41 percent of the 702 offenderswith downward dispositional departures in 1992 were rearrested for a felony orgross misdemeanor in Minnesota within three years of sentencing. The rearrestrate for all other probationers was very similar (40 percent). Reconviction rateswere also comparable between the two groups of probationers.
However, we also found that:
• Property offenders who were placed on probation instead of receivingprison sentences as recommended by sentencing guidelines were muchmore likely to be rearrested than other property offenders sentencedto probation in 1992.
For example, among burglars who had presumptive prison sentences but insteadreceived probation, 65 percent were rearrested within three years. Among theother burglars in our probation sample, 48 percent had new arrests in the follow-up period. Seventy percent of the thieves with downward dispositional departureswere rearrested in three years, compared with 43 percent of the other thieves in
Propertyoffenders givenlightersentences thancalled for in theguidelines hadhigh recidivismrates.
RECIDIVISM OF MINNESOTA FELONS 69
29 Minnesota Sentencing Guidelines and Commentary, 20.
30 Minn. Stat. §244.10, Subd. 2.
31 Minnesota Sentencing Guidelines Commission, Sentencing Practices: Highlights and Statisti-cal Tables, Felony Offenders Sentenced in 1994 (St. Paul, February 1996), 35-37.

our sample. Property offenders with downward dispositional departures were alsofar more likely to be reconvicted than other property offenders.
These results show that judges’ dispositional departure decisions for property of-fenders placed the public at greater risk, since property offenders with downwarddepartures committed new crimes at a much higher rate than other property offend-ers on probation. In contrast, violent and drug offenders with presumptive prisonsentences had recidivism rates similar to or lower than those of other violent anddrug offenders on probation. Altogether, offenders with downward dispositionaldepartures were arrested for 517 felonies and gross misdemeanors (and convictedof 260 such offenses) during the subsequent three years, and some of these newcrimes might have been avoided or delayed had these offenders been sentenced toprison.
Jail SentencesWe compared recidivism rates for probationers who were sentenced to serve timein jail and those who were not. About 84 percent of the probationers in our sam-ple were sentenced to jail time. We found that:
Table 3.7: Recidivism of Probationers with Downward DispositionalDepartures, By Original Offense Type
Offenders Granted DownwardDispositional Departures
All Other OffendersSentenced to Probation
Original Total Percent Percent Total Percent PercentOffense Type Offenders Rearrested Reconvicted Offenders Rearrested ReconvictedViolent Offenses Homicide 14 21% 21% 0 NA NA Sex Offense 118 19 10 380 27% 14% Robbery 48 50 33 97 58 37 Assault 226 39 23 484 40 23Property Offenses Arson 11 55 27 35 20 11 Burglary 54 65 46 747 48 30 Theft 27 70 56 643 43 29 Vehicle Theft 12 83 75 293 56 37 Forgery/Fraud 15 40 27 1,029 34 21 Receiving Stolen Property 17 47 41 230 40 23Drug Offenses 145 40 23 1,251 38 22All Other Offenses 15 53 53 472 38 22TOTAL 702 41% 26% 5,661 40% 24%
Note: The reoffense rates shown here are based solely on records from BCA’s criminal history fi le. They do not include data from BCA’s‘‘suspense file’’ or FBI data on offenses in other states.
Source: Program Evaluation Division analysis of sentencing records and BCA criminal histo ry data.
70 RECIDIVISM OF ADULT FELONS

• Probationers sentenced to jail had higher rearrest and reconvictionrates than non-jailed probationers with similar criminal history andoffense severity scores.
For example, among probationers with a criminal history score of zero, 33 percentof jailed offenders were rearrested, compared with 27 percent of offenders not sentto jail. Among probationers with a criminal history score of one, 47 percent ofjailed offenders were rearrested, compared with 34 percent of probationers notsent to jail.32
Similarly, among probationers with an offense severity score of two, 41 percent ofjailed offenders were rearrested, compared with 32 percent of non-jailed offend-ers. Among all probationers convicted of property offenses, 46 percent of jailedoffenders were rearrested, compared with 30 percent of non-jailed offenders.33
VARIATION IN COUNTY RECIDIVISMRATES
Legislators asked us to compare the recidivism rates of offenders under correc-tional supervision in different Minnesota counties. Specifically, they wanted toknow whether there were differences between the reoffense rates of offenders incounties that participate in Minnesota’s Community Corrections Act (CCA) andoffenders in other counties.
In 1973 the Legislature passed the Community Corrections Act (CCA) in order toprotect society ‘‘more effectively’’ and ‘‘to promote efficiency and economy in thedelivery of correctional services.’’34 Counties that choose to participate in CCA re-ceive state block grants that help to fund a wide variety of community correctionalservices, ranging from crime prevention programs and probation services to cor-rectional facilities.35 CCA counties design their correctional programs with assis-tance from a local advisory board, and these plans must be approved by theCommissioner of Corrections. There are currently 31 counties participating inCCA, and they represent about 71 percent of the state’s population.36
Seventy-seven percent of prisoners released in 1992 and 75 percent of probation-ers sentenced in that year were supervised in CCA counties. We compared the re-arrest and reconviction rates of offenders, based on the county that wasresponsible for supervision. We found that, for both released prisoners and proba-tioners, offenders in CCA counties were more likely to be rearrested than those in
Probationerssentenced tojail had higherrecidivismrates thannon-jailedprobationers.
RECIDIVISM OF MINNESOTA FELONS 71
32 About three-fourths of probationers in our sample had criminal history scores of zero or one.
33 Twenty-nine percent of probationers in our sample were at severity level two, making it themost common severity level. About 52 percent of probationers were property offenders.
34 Minn. Laws (1973), Ch. 354, Sec. 1.
35 Counties supplement the state block grants with local funds from property tax revenues.
36 Stearns County became a CCA county in 1994. We counted Stearns among the CCA countieshere. The inclusion of Stearns as a CCA county made no difference in the reoffense rates shown inTable 3.8.
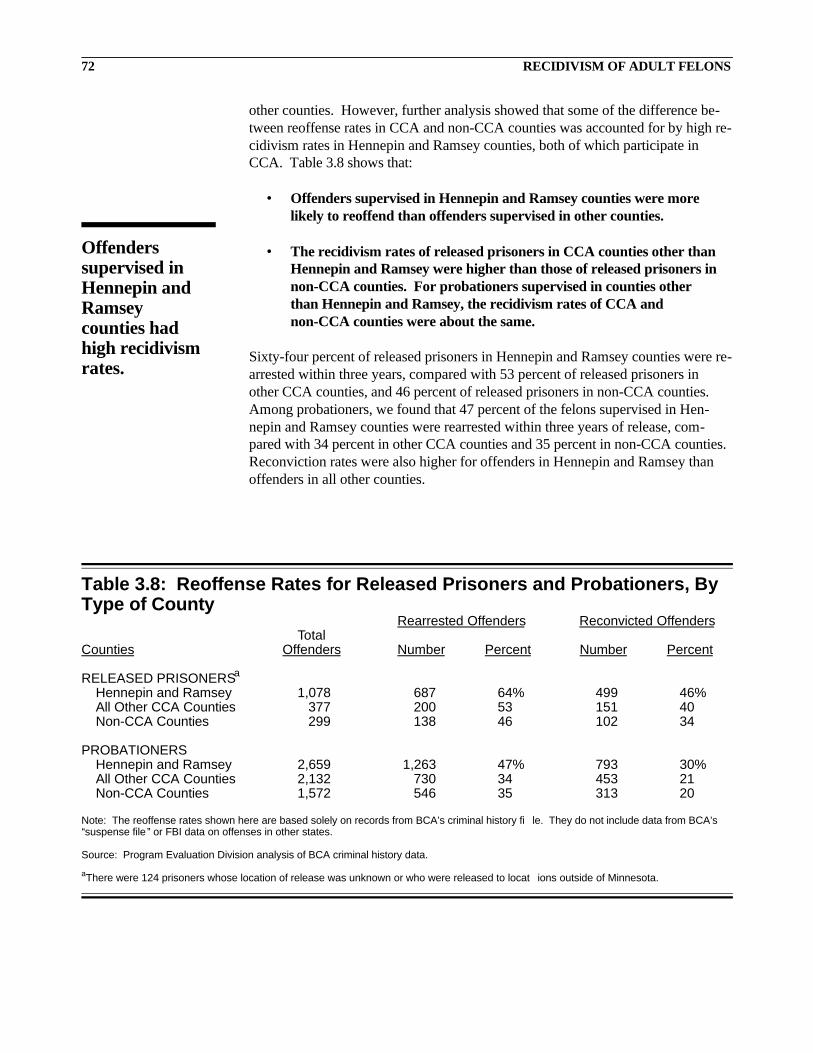
other counties. However, further analysis showed that some of the difference be-tween reoffense rates in CCA and non-CCA counties was accounted for by high re-cidivism rates in Hennepin and Ramsey counties, both of which participate inCCA. Table 3.8 shows that:
• Offenders supervised in Hennepin and Ramsey counties were morelikely to reoffend than offenders supervised in other counties.
• The recidivism rates of released prisoners in CCA counties other thanHennepin and Ramsey were higher than those of released prisoners innon-CCA counties. For probationers supervised in counties otherthan Hennepin and Ramsey, the recidivism rates of CCA andnon-CCA counties were about the same.
Sixty-four percent of released prisoners in Hennepin and Ramsey counties were re-arrested within three years, compared with 53 percent of released prisoners inother CCA counties, and 46 percent of released prisoners in non-CCA counties.Among probationers, we found that 47 percent of the felons supervised in Hen-nepin and Ramsey counties were rearrested within three years of release, com-pared with 34 percent in other CCA counties and 35 percent in non-CCA counties.Reconviction rates were also higher for offenders in Hennepin and Ramsey thanoffenders in all other counties.
Table 3.8: Reoffense Rates for Released Prisoners and Probationers, ByType of County
Rearrested Offenders Reconvicted OffendersTotal
Counties Offenders Number Percent Number Percent
RELEASED PRISONERSa
Hennepin and Ramsey 1,078 687 64% 499 46%All Other CCA Counties 377 200 53 151 40Non-CCA Counties 299 138 46 102 34
PROBATIONERSHennepin and Ramsey 2,659 1,263 47% 793 30%All Other CCA Counties 2,132 730 34 453 21Non-CCA Counties 1,572 546 35 313 20
Note: The reoffense rates shown here are based solely on records from BCA’s criminal history fi le. They do not include data from BCA’s‘‘suspense file’’ or FBI data on offenses in other states.
Source: Program Evaluation Division analysis of BCA criminal history data.
aThere were 124 prisoners whose location of release was unknown or who were released to locat ions outside of Minnesota.
Offenderssupervised inHennepin andRamseycounties hadhigh recidivismrates.
72 RECIDIVISM OF ADULT FELONS

RECIDIVISM AMONG CORRECTIONALPROGRAM PARTICIPANTS
At the outset of our study, legislators expressed interest in information on the ef-fectiveness of correctional programs. The cost of prison programs is one of sev-eral factors that may contribute to Minnesota’s relatively high costs per prisoninmate, and some legislators wondered whether the programs have helped to re-duce recidivism rates.
We obtained lists of inmates who participated in selected Department of Correc-tions programs while in prison, identified the offenders who were released in1992, and looked at their rearrest and reconviction rates. Specifically, we selectedprograms that existed in 1992 and still exist today, although some of the programshave been revised. We picked programs for which department staff could identifyall inmates who completed the programs before 1993.37
For several reasons, we were unable to determine precisely how participation in aspecific prison program affected an inmate’s likelihood of rearrest and reconvic-tion after release. First, offenders usually spent time in more than one facility andoften participated in more than one program. Thus, we could not isolate the effectof a single program apart from the others. Second, it was impossible to isolate theimpact of prison from external factors (such as family background and participa-tion in community programs after release) that might relate to recidivism. Third,it was unclear how much the treatment outcome was due to the individual’s moti-vation to change (or lack of motivation) rather than the treatment program itself.38
Finally, without a ‘‘control group’’ of randomly selected offenders who did not re-ceive treatment, it is impossible to know how many of the program participantswould have reoffended after their release if they had not participated in treat-ment.39 With these qualifications in mind, we found that:
• Recidivism rates of inmates who participated in prison programs wereusually similar to the rates of those who did not, although someprograms may have reduced recidivism among some types ofparticipants.
In the remainder of this section, we review specific program results.
We examinedthe recidivismrates ofparticipants inprisonprograms, butit is difficult tomeasure theimpact ofprograms apartfrom otherfactors.
RECIDIVISM OF MINNESOTA FELONS 73
37 With the exception of sex offender programs, DOC does not keep a centralized database indicat-ing the programs in which inmates participate. We did not request records of inmate participation inprison industry programs partly because inmates do not ‘‘complete’’ the programs as they do treat-ment and education programs. We also did not examine some programs that were relatively new in1992.
38 Similarly, programs may select clients based on their perceived amenability to treatment. This‘‘selection bias’’ can be overcome by randomly assigning individuals to treatment and controlgroups. However, random assignment is rarely done in correctional settings because it results inwithholding treatment from some offenders who seek it.
39 Instead of using a control group, we compared inmates who completed programs with other in-mates released in 1992. However, even where the results indicated that program participants had re-arrest and reconviction rates similar to non-participants, it is possible that program participantswould have had even higher rearrest and reconviction rates if they had not participated in program-ming.

Atlantis Chemical Dependency ProgramThe Atlantis Chemical Dependency Program is a 90-day residential treatment pro-gram at the Stillwater correctional facility. The program consists primarily ofgroup therapy sessions, supplemented with lectures, recreation, and motivationalreading. We examined recidivism for 81 offenders who were discharged from theprogram between 1990 and 1992 and released from prison in 1992. Table 3.9 pre-sents their rearrest and reconviction rates. We found that:
• Among prisoners released in 1992, offenders who participated in theAtlantis chemical dependency program had recidivism rates similar tonon-participants.
Fifty-five percent of the offenders who completed chemical dependency treatmentwere rearrested within three years of release, compared with 57 percent of all maleprisoners released in 1992.40 Program completers were less likely to be recon-victed than all male prisoners released in 1992 (35 versus 42 percent), but most ofthis difference is attributable to the high proportion of violent offenders in thetreated group (65 percent). We found that 54 percent of violent offenders whocompleted the Atlantis program were rearrested, and 28 percent were reconvicted,compared with 46 percent rearrested and 31 percent reconvicted among all maleviolent prisoners released in 1992. For property offenders who completed the At-lantis program, 69 percent were rearrested and 54 percent reconvicted, comparedwith 67 percent rearrested and 53 percent reconvicted for all male property offend-ers released from prison in 1992.
Table 3.9: Recidivism of Inmates Who Attended theAtlantis Chemical Dependency Treatment Program atMCF-Stillwater
Number of Percent PercentType of Release/Original Offense Offenders Rearrested Reconvicted
Completed Program Violent Offenders 39 54% 28% Property Offenders 13 69 54 Drug and Other Offenders 8 38 38 All Program Completers 60 55% 35%
Quit Treatment or Were Terminatedby Staff 21 57 24All Program Participants 81 56 32All Male Prisoners Released in 1992 1,736 57% 42%
Sources: Program Evaluation Division analysis of BCA criminal history data and list of progr am partici-pants provided by the Department of Corrections.
Inmates whocompletedStillwater’schemicaldependencyprogram hadrecidivismrates similar tothose of non-participants.
74 RECIDIVISM OF ADULT FELONS
40 With the exception of sex offender treatment programs, the recidivism rates presented in thissection do not include offenses from BCA’s ‘‘suspense file’’ and the FBI’s database on offenses inother states.

Offenders who entered the Atlantis program had somewhat higher criminal historyscores than all offenders released from prison in 1992. Inmates with criminal his-tory scores of four or higher accounted for a majority of Atlantis’ completers, andtheir rearrest percentage was identical to that of other male prisoners with criminalhistory scores of four or higher (67 percent).41 Among offenders with a criminalhistory score less than four, 42 percent of the offenders who completed the Atlan-tis program were rearrested, compared with 50 percent of all 1992 released prisoners.
Prison Treatment Programs for Sex OffendersAs discussed in Chapter 2, a review of recent sex offender treatment studies foundevidence of small reductions in recidivism rates for treated sex offenders com-pared with untreated offenders. But treatment programs have used a variety of ap-proaches with a variety of types of sex offenders, so findings should be interpretedwith caution.
The Department of Corrections provided us with treatment participation informa-tion for the 257 male sex offenders released from prison in 1992. Ninety-two ofthose offenders participated in sex offender treatment at Oak Park Heights, Stillwa-ter, and Lino Lakes, and 69 completed the programs. Table 3.10 shows recidivismrates for the male sex offenders.42 We found that:
• Sex offenders who completed treatment had lower overall rearrest andreconviction rates than those who never entered treatment, but theirrearrest rates for new sex offenses were about the same.
Table 3.10: Recidivism of Sex Offenders, By Treatment ParticipationWhile in Prison
Percent PercentRearrested for Reconvicted
Any Felony Percent of Any FelonyNumber of or Gross Rearrested for or Gross
Treatment Experience Offenders Misdemeanor Sex Offense Misdemeanor
Never Entered Treatment 160 42% 11% 26%Quit Treatment or Were Terminated by Staff 23 43 22 26Completed Treatment 69 19 12 12
Sources: Program Evaluation Division analysis of BCA criminal history data and list of progr am participants provided by the Department ofCorrections.
Twenty-sevenpercent of sexoffendersreleased in1992 hadcompleted a sexoffenderprogram inprison.
RECIDIVISM OF MINNESOTA FELONS 75
41 Fifty-five percent of the 1992 releasees who completed the Atlantis program had a criminal his-tory score of four or higher, compared with 40 percent of all male prisoners released in 1992.
42 A few sex offenders enrolled in more than one treatment program. We counted them as com-pleters if they completed at least one program. We excluded five offenders from this analysis whowere committed to the Minnesota Security Hospital as sexual psychopaths and were therefore not atrisk to commit new offenses. We also excluded six female sex offenders because there were no De-partment of Corrections sex offender treatment programs for women in 1992. None of the six wererearrested for any crime within three years of their release from prison.

Age differences between program completers and untreated sex offenders maypartly explain the difference in overall rearrest rates. Sex offenders who com-pleted treatment were, on average, 36 years old when they were released fromprison, compared with 32 years old for sex offenders who did not complete treat-ment. We found that older sex offenders were less likely to be rearrested for anyoffense than younger sex offenders, although age was not closely related to thelikelihood of rearrest for a sex offense.43
On the other hand, differences in the criminal histories of treated and untreated of-fenders may have masked some positive effects of treatment. Forty-one percentof the sex offenders who completed treatment had at least one felony sex offenseconviction before the one that landed them in prison, compared with only 17 per-cent of the sex offenders who never entered treatment. Table 3.11 shows the rela-tionship between treatment and rearrest based on the individual’s sex offensehistory prior to the offense that resulted in imprisonment. We found that:
• Treated offenders with no sex offense convictions before their currentoffense were less likely to be rearrested than similar untreatedoffenders.
Of the 40 offenders who were in prison for their first felony sex offense convictionand completed treatment, only one (3 percent) was arrested for a new sex offense
Table 3.11: Rearrest Rates of Sex Offenders, By SexOffense History and Treatment Program Participation
Number of Previous Sex Offense Convictions/Participation in Treatment Program
PercentRearrested
for Any Felony Percentor Gross Rearrested for
Number Misdemeanor Sex Offense
No Previous Sex Offense Felony Convictions
Never Entered Treatment 127 41% 9%Quit or Terminated by Staff 15 33 7Completed Treatment 40 8 3Total 182 33% 7%
One or More Previous Sex Offense Felony Convictions
Never Entered Treatment 26 46% 27%Quit or Terminated by Staff 8 63 50Completed Treatment 28 32 25Total 62 42% 29%
Sources: Program Evaluation Division analysis of BCA criminal history data and list of progr am partici-pants provided by the Department of Corrections.
Of 40 offendersimprisoned andtreated for afirst sex offenseconviction, onlyone wasrearrested for anew sex offensewithin threeyears of release.
76 RECIDIVISM OF ADULT FELONS
43 Among sex offenders released in 1992, the median age was 32. Forty-seven percent of sex of-fenders under 32 years old were rearrested for any felony or gross misdemeanor within three yearsof prison release. In contrast, 25 percent of sex offenders age 32 and older were rearrested in the fol-low-up period.

within three years of release from prison, and 8 percent were arrested for any fel-ony or gross misdemeanor. Untreated offenders in prison for their first convictionalso had low rates of sex offense rearrest (9 percent) but much higher rates of rear-rest for any felony or gross misdemeanor (41 percent). Among offenders with atleast one prior felony sex offense conviction, those who completed treatment wereabout as likely to be arrested for a new sex offense as those who never enteredtreatment (25 versus 27 percent).
We also examined the recidivism rates of various categories of sex offenders.44
We found that rapists and ‘‘other’’ sex offenders who completed treatment wereless likely to be rearrested than offenders who committed similar sex offenses butwho did not receive treatment. Only one (6 percent) of the 16 rapists and ‘‘other’’sex offenders who completed treatment was subsequently rearrested for a sex of-fense, compared with 18 percent of the rapists and ‘‘other’’ sex offenders who didnot undergo treatment. Among incest offenders and child molesters, however,those who completed sex offender treatment were more likely to be arrested for anew sex offense (13 percent) than those who never entered treatment (6 percent).
Finally, we examined sex offenders who quit treatment or were terminated bystaff. We found that:
• Among sex offenders, those who entered but failed to completetreatment were the most likely to be rearrested for a new sex offense.
As shown in Table 3.10, 22 percent of sex offenders who started but failed to com-plete treatment were arrested for a new sex offense within three years of their re-lease from prison, compared with 12 percent of the sex offenders who completedtreatment and 11 percent of those who never entered treatment.45 Forty-three per-cent of the offenders who began but failed to complete treatment were arrested forsome new felony or gross misdemeanor within three years of their release.
Prison Education ProgramsWe obtained lists of inmates who obtained general education development (GED)or vocational certificates from the St. Cloud and Shakopee correctional facilitiesbetween January 1990 and December 1992. Table 3.12 presents rearrest and re-conviction rates for offenders who earned certificates in these programs and werereleased from prison in 1992. We found that:
We examinedrecidivismrates ofinmates whocompletededucationprograms attwo prisons.
RECIDIVISM OF MINNESOTA FELONS 77
44 Sex offender types were determined by sex offender treatment program staff based on inter-views, psychological tests, and sex offense histories. In general, rapists use force or coercion whencommitting sexual assaults, incest offenders use persuasion and their position of authority to inducethe participation of their children or other family members, and child molesters use persuasion ortheir position of authority to induce cooperation from children who are not family members.‘‘Other’’ sex offenses include statutory rape and recruiting children to participate in pornography orprostitution.
45 Program participants were terminated for overly aggressive behavior or for failing to fulfill therequirements of the treatment program.

• Inmates who completed education programs were rearrested andreconvicted after their release at about the same rates as the generalinmate population.
Seventy-one percent of the male inmates who earned a GED and 62 percent whoearned a vocational certificate at St. Cloud were rearrested within three years oftheir release from prison, compared with 65 percent of all male prisoners under 25years old who were released in 1992. The rearrest rate for female inmates who ob-tained their GED at Shakopee (44 percent) was somewhat below that of all fe-males released in 1992 (52 percent). However, 42 percent of the Shakopeeinmates who obtained an education certificate were in prison for violent offenses,a group that had lower recidivism rates than property or drug offenders. By con-trast, only 20 percent of all females released in 1992 were in prison for a violentoffense. Thus, when offense is considered, females who completed education pro-grams were about as likely as other female inmates to be rearrested after their release.
Residential Programs for Released PrisonersFinally, we looked at recidivism for released prisoners identified by the Depart-ment of Corrections as ‘‘public risks’’ who required special monitoring. Specifi-cally, we examined offenders placed in two large residential programs, 180Degrees and Reentry Services. The Department of Corrections contracts withthese programs to help offenders in the Twin Cities metropolitan area make amore successful transition to community living. Most people were in these half-way houses for two months or less. In general, we found that:
Table 3.12: Rearrest Rates of Inmates Released in1992 Who Earned an Education Certificate atMinnesota Correctional Facilities at St. Cloud andShakopee
Percent PercentFacility/Type of Certificate Number Rearrested Reconvicted
MCF-St. CloudGED certificate 68 71% 50%Vocational certificatea 34 62 47
All Male Prisoners Under 25 Released in 1992 512 65 47
MCF-ShakopeeGED certificate 16 44 38Desktop publishing vocational certificate 3 0 0
All Female Prisoners Released in 1992 142 52 35
Sources: Program Evaluation Division analysis of BCA criminal history data and list of progr am partici-pants provided by the Department of Corrections. Information was not available on partici pants whofailed to complete the programs.aIncludes (1) certificates of completion and (2) certificates of accomplishment given to in mates whomade progress but did not complete the course before release. Recidivism rates were virtual ly thesame for both groups.
Some offendersare placed inhalfway houseswhen they arereleased fromprison.
78 RECIDIVISM OF ADULT FELONS

• Recidivism rates for inmates assigned to the residential programs wereslightly higher than recidivism rates for all inmates released in 1992.
Table 3.13 presents rearrest and reconviction rates for inmates assigned to the 180Degrees and Reentry Services residential programs after their release from prison.About half of the 180 Degrees inmates had served sentences for sex offenses.Their rearrest and reconviction rates, 35 and 22 percent respectively, were slightlyabove the rates for all sex offenders released in 1992 (30 percent rearrested and 17percent reconvicted).46
Seventy-five percent of the non-sex offenders in the 180 Degrees program and 80percent of the offenders in the Reentry program had been in prison for violentcrimes. Their rates of rearrest, 71 and 61 percent respectively, were higher thanthe rearrest rate for all prisoners released in 1992 (57 percent) and well above therearrest rate for all violent offenders (45 percent).
Many offenders did not ‘‘complete’’ their stay at a halfway house, usually becausethey absconded or were terminated by the facility’s staff for rule violations. Table3.13 shows that released prisoners who completed residential programming hadlower recidivism rates than those who entered but did not complete it.47
Table 3.13: Rearrest Rates of Offenders Assigned toTransitional Residential Programs After Release fromPrison
Percent PercentNumber Rearrested Reconvicted
180 Degrees Program forSex Offenders:
Completed Program 59 27% 15%Did Not Complete Program 19 58 44Total 78 35% 22%
180 Degrees Program forOther Offenders:
Completed Program 37 65% 43%Did Not Complete Program 39 77 46Total 76 71% 45%
Reentry Program:Completed Program 30 47% 35%Did Not Complete Program 26 77 62Total 56 61% 41%
Sources: Program Evaluation Division analysis of BCA criminal history data and lists of prog ram partici-pants provided by the residential programs.
Offenders whocompletedhalfway houseprograms hadlowerrecidivismrates thaninmates whoentered butfailed tocomplete theprograms.
RECIDIVISM OF MINNESOTA FELONS 79
46 We also found that 9 percent of the sex offenders in the 180 Degrees program were rearrestedfor new sex offenses, compared to 10 percent of all sex offenders released in 1992.
47 Among offenders at 180 Degrees, rearrest rates were higher for offenders who absconded (81percent) than for those who were terminated by program staff (59 percent). At Reentry, the oppositewas true; 54 percent of the absconders were subsequently rearrested, but the rate was 100 percent forthose who were terminated by staff.
ADEQUACY OF CRIMINAL HISTORYRECORDS
Our study relied considerably on BCA’s official criminal history database, whichis the main BCA information system used by Minnesota’s criminal justice offi-cials. State law requires Minnesota law enforcement agencies to take fingerprintsof all persons arrested for felonies or gross misdemeanors and forward such re-cords to the BCA within 24 hours.48 When BCA receives a fingerprint arrest re-cord that is properly completed, it adds the record to the state’s official criminalhistory database, either matching the new information to an offender who has anexisting criminal record, or creating a new record for a first-time offender. Sub-sequent information about the disposition, or outcome, of the case is sent to theBCA from either the court or the county attorney’s office, and BCA appends thisdata to the correct arrest record.
In numerous cases, however, disposition data received by the BCA cannot belinked to an arrest record on file and are not added to the official criminal historysystem. According to a 1996 draft report on the completeness and accuracy of thecriminal history database, 37 percent of the disposition data received by BCA can-not be matched to arrest data.49 The report stated that BCA had 159,000 un-matched court disposition records, with each record representing one criminal‘‘count’’ from a court proceeding. These unmatched records of court dispositionsare maintained by the BCA in a separate database, known as the ‘‘suspense file.’’
We searched the suspense file to find records for the felons in our probation and re-leased prisoner samples who did not have a conviction listed in the official crimi-nal history file. In general, our search confirmed that:
• BCA’s official criminal history database is an incomplete source ofinformation on arrests and convictions in Minnesota.
We reviewed records for a large group of released prisoners and probationers andfound that 54 percent had some type of record in the suspense file, although manyof these records preceded or succeeded the three-year follow-up period we usedfor our recidivism analysis.50 Many of the suspense file records were for convic-tions that have not been recorded on BCA’s official criminal history database.51
In the three-year follow-up period alone, the suspense file contained records of
The Bureau ofCriminalApprehension issupposed toreceiveinformation onall arrests andconvictions.
BCA’s maincriminalhistorydatabase isincomplete.
80 RECIDIVISM OF ADULT FELONS
48 Minn. Stat. §299C.10.
49 Minnesota Bureau of Criminal Apprehension, Report to the Legislature on Compliance withM.S. §299C.10, Draft Report (St. Paul, January 1996), 1.
50 We searched the suspense file for records of offenders who did not have a conviction for a fel-ony or gross misdemeanor within the three-year follow-up period. There were nearly 6,600 releasedprisoners and probationers in this category.
51 For example, we found that about half of the 1992-95 suspense file records we examined wereconvictions, not other dispositions.

about 1,500 arrests and 700 convictions for offenders in our samples.52 If we hadrelied solely on BCA’s official criminal history file, we would not have knownabout these actions, and the rearrest and reoffense rates we calculated would haveunderestimated the actual rates of recidivism by a few percentage points. Further-more, even after checking BCA’s criminal history and suspense files, we stillfound no BCA records of criminal activity for more than 200 probationers whowere sentenced in 1992 for felonies committed in Minnesota.
A national expert in criminal history information systems told us many other stateshave similar problems with their criminal history records. Nevertheless, we thinkthat the absence of comprehensive information in BCA’s criminal history databaseshould be addressed as soon as possible. In our view, it is a serious problem that:
• Criminal justice agencies and other users cannot obtain completeinformation about offenders’ criminal records from the BCA’scriminal history database.
Researchers trying to study patterns of recidivism or convictions in Minnesotawould underestimate the actual levels of criminality if they relied solely on thecriminal history database. More important, without full criminal records in BCA’sofficial criminal history database, criminal background checks might not identifyinstances of known criminal conduct. In addition, community corrections officialsmight inaccurately calculate the criminal history scores on which judges relywhen making sentencing decisions, and inappropriate pre-trial release and bail de-cisions might be made.
BCA officials are aware of the problems with the criminal history database andhave taken several steps to address them. For instance, they have helped coordi-nate training for law enforcement, prosecution, and court officials about proper re-porting of criminal history information, and they are seeking federal funding forcontinued local implementation of technology that would transmit fingerprint in-formation electronically to BCA. Still, we think this problem is serious enough torequire ongoing monitoring, and we offer several recommendations in Chapter 4.
SUMMARY
Almost two-thirds of the inmates released from Minnesota prisons in 1992 wererearrested for a felony or gross misdemeanor within three years, and nearly halfwere reconvicted. Felony probationers had lower overall recidivism rates, but thislargely reflected their shorter criminal records. We found relatively high recidi-vism rates among property offenders, young offenders, and offenders in Hennepinand Ramsey counties. Property offenders who were placed on probation ratherthan receiving the prison sentence presumed by the state’s sentencing guidelineshad much higher recidivism rates than other property offenders placed on proba-
Lawenforcementagencies,courts, andothers rely onBCA to havecomplete,accessiblecriminalhistoryinformation.
RECIDIVISM OF MINNESOTA FELONS 81
52 We counted only dispositions in the suspense file that were at the felony or gross misdemeanorlevel. The suspense file does not contain arrest records, but in cases where an offender had a disposi-tion in the suspense file within the three-year window, we assumed that the offender had an arrestwithin that period as well.

tion. It is difficult to evaluate whether correctional programs caused recidivism tobe lower than it otherwise would have been, but we found that the recidivism ratesof program participants were often similar to the rates of non-participants.
Minnesota’s recidivism rates appear to be within the broad range of rates reportedin other recidivism studies. But evaluating whether Minnesota’s rates are satisfac-tory requires some judgment about the expected level of recidivism. On the onehand, previous chapters suggested that Minnesota’s corrections system has somecharacteristics that might be expected to reduce offender recidivism rates--for in-stance, higher levels of spending per inmate than most states, and inmates who arebetter educated, have fewer prior arrests, and are more likely to be violent offend-ers than inmates in other states. On the other hand, because Minnesota imprisonsa smaller percentage of its population than all but one other state, perhaps its in-mate population has a relatively high proportion of intractable criminals who donot want to change their behaviors. Unfortunately, there is no definitive way to determine whether Minnesota’s inmates and probationers are more or less ‘‘predis-posed’’ to recidivism than offenders in other states.
82 RECIDIVISM OF ADULT FELONS
Related Documents