Recharge and Aquifer Response: Manukan Island , s Aquifer, Sabah, Malaysia Sarva Mangala Praveena a , Mohd Harun Abdullah a , Ahmad Zaharin Aris b and Kawi Bidin a a School of Science and Technology, Universiti Malaysia Sabah, 88999 Kota Kinabalu, Sabah, Malaysia. b Department of Environmental Sciences, Faculty of Environmental Studies, Universiti Putra Malaysia, 43400 UPM Serdang, Selangor, Malaysia Abstract Manukan Island is a small island located in North-West of Sabah, Malaysia was used as a case study area for numerical modeling of an aquifer response to recharge and pumping rates. The results in this study present the variations of recharge into the aquifer under the prediction simulations. The recharge rate increases the water level as indicated by hydraulic heads. This shows that it can alter groundwater of Manukan Island which has been suffering from an overexploration in its unconfined the aquifer. The increase in recharge rate (from 600 mm/year to 750 mm/year) increases the water level indicated by hydraulic heads. A reduction in pumping rate (from 0.072 m 3 /day to 0.058 m 3 /day) not only increases the amount of water levels in aquifer but also reduces the supply hence a deficit in supply. The increase in hydraulic heads depends on the percentage reduction of pumping and recharges rates. The well water has 1978.3 mg/L chloride with current pumping (0.072 m 3 /day) and recharge rates (600 mm/year). However, with an increased of recharge rate and current pumping rate it has decreased about 1.13%. In addition, reduction in pumping rate made the chloride concentration decreased about 2.8%. In general, a reduction in pumping with an increase in recharge rate leads to a decreased in chloride concentrations within the vicinity of cone of depression. Next, to further develop the numerical model, the model should focus on climate change variables such as consequences of climate change are increase in air temperature, increase in sea surface temperature, and more extreme weather conditions. These parameters are considered critical parameters for climate change impact modeling in aquifers. The behavior of the aquifer and its sustainable pumping rate can be done by applying a computer modeling component. Keywords: small island; recharge rate; pumping rate; groundwater sustainability Available online at www.tshe.org/EA EnvironmentAsia 3(1) (2010) 72-81 The international journal published by the Thai Society of Higher Education Institutes on Environment Environment Asia 1. Introduction Most of tropical small islands have limited sources of freshwater, no surface water or streams and fully reliant on rainfall and groundwater recharge. The inhabitants of these islands mostly depend on groundwater to meet their needs, particularly for drinking and tourism purposes. The demand for fresh water has been rising in response to the increase of activities and development in tourism sector (Singh and Gupta, 1999; Aris et al., 2007). Many small islands are experiencing water stress at the current levels of groundwater extraction at an outstripping supply. The freshwater lens on small islands may easily be overexploited or polluted and vulnerable to climate change, pressure of island resources and the associated impacts to freshwater resources (Griggs and Peterson, 1993; Singh and Gupta, 1999; Climate Change, 2007). The most significant and immediate consequences of climate change are increase in air temperature, increase in sea surface temperature, changes in rainfall (precipitation) patterns and more extreme weather conditions (Tompkins et al., 2005). Vulnerable to climate change has become more frequent in many countries in the recent decade and Malaysia is not excluded from this phenomena. Effects of climate change will alter the global hydrological cycle in terms of distribution and availability of regional water resources. A warmer climate with its increased climate variability will increase the risk of floods and droughts (Climate Change, 2007; Intergovernmental Panel on Climate Change, 1997). One of the significant consequences is climate variability which causes changes in rainfall patterns and groundwater recharge in coastal environment especially to small islands (Intergovernmental Panel on Climate Change, 1997). Changes in rainfall during rainy season reflect the groundwater recharge, as a sensitive function of the climatic factors, local geology, topography and land use (Dragoni and Sukhija, 2008). The islands complex and dynamic system will response vigorously in variable and complex ways to climate change (Watson et al., 1998). Most research on the potential impacts of climate change to the hydrologic cycle has been

Welcome message from author
This document is posted to help you gain knowledge. Please leave a comment to let me know what you think about it! Share it to your friends and learn new things together.
Transcript
Recharge and Aquifer Response: Manukan Island,s Aquifer, Sabah, Malaysia
Sarva Mangala Praveena a, Mohd Harun Abdullah a, Ahmad Zaharin Aris b and Kawi Bidin a
a School of Science and Technology, Universiti Malaysia Sabah, 88999 Kota Kinabalu, Sabah, Malaysia.bDepartment of Environmental Sciences, Faculty of Environmental Studies, Universiti Putra Malaysia, 43400
UPM Serdang, Selangor, Malaysia
Abstract
Manukan Island is a small island located in North-West of Sabah, Malaysia was used as a case study area for numerical
modeling of an aquifer response to recharge and pumping rates. The results in this study present the variations of recharge
into the aquifer under the prediction simulations. The recharge rate increases the water level as indicated by hydraulic
heads. This shows that it can alter groundwater of Manukan Island which has been suffering from an overexploration in its
unconfined the aquifer. The increase in recharge rate (from 600 mm/year to 750 mm/year) increases the water level indicated
by hydraulic heads. A reduction in pumping rate (from 0.072 m3/day to 0.058 m3/day) not only increases the amount of
water levels in aquifer but also reduces the supply hence a deficit in supply. The increase in hydraulic heads depends on the
percentage reduction of pumping and recharges rates. The well water has 1978.3 mg/L chloride with current pumping
(0.072 m3/day) and recharge rates (600 mm/year). However, with an increased of recharge rate and current pumping rate it
has decreased about 1.13%. In addition, reduction in pumping rate made the chloride concentration decreased about 2.8%.
In general, a reduction in pumping with an increase in recharge rate leads to a decreased in chloride concentrations within
the vicinity of cone of depression. Next, to further develop the numerical model, the model should focus on climate change
variables such as consequences of climate change are increase in air temperature, increase in sea surface temperature, and
more extreme weather conditions. These parameters are considered critical parameters for climate change impact modeling
in aquifers. The behavior of the aquifer and its sustainable pumping rate can be done by applying a computer modeling
component.
Keywords: small island; recharge rate; pumping rate; groundwater sustainability
Available online at www.tshe.org/EA
EnvironmentAsia 3(1) (2010) 72-81The international journal published by the Thai Society of Higher Education Institutes on Environment
EnvironmentAsia
1. Introduction
Most of tropical small islands have limited sources
of freshwater, no surface water or streams and fully
reliant on rainfall and groundwater recharge. The
inhabitants of these islands mostly depend on
groundwater to meet their needs, particularly for
drinking and tourism purposes. The demand for fresh
water has been rising in response to the increase of
activities and development in tourism sector (Singh and
Gupta, 1999; Aris et al., 2007). Many small islands
are experiencing water stress at the current levels of
groundwater extraction at an outstripping supply. The
freshwater lens on small islands may easily be
overexploited or polluted and vulnerable to climate
change, pressure of island resources and the associated
impacts to freshwater resources (Griggs and Peterson,
1993; Singh and Gupta, 1999; Climate Change, 2007).
The most significant and immediate consequences
of climate change are increase in air temperature,
increase in sea surface temperature, changes in rainfall
(precipitation) patterns and more extreme weather
conditions (Tompkins et al., 2005). Vulnerable to
climate change has become more frequent in many
countries in the recent decade and Malaysia is not
excluded from this phenomena. Effects of climate
change will alter the global hydrological cycle in terms
of distribution and availability of regional water
resources. A warmer climate with its increased climate
variability will increase the risk of floods and droughts
(Climate Change, 2007; Intergovernmental Panel
on Climate Change, 1997). One of the significant
consequences is climate variability which causes
changes in rainfall patterns and groundwater recharge
in coastal environment especially to small islands
(Intergovernmental Panel on Climate Change, 1997).
Changes in rainfall during rainy season reflect the
groundwater recharge, as a sensitive function of the
climatic factors, local geology, topography and land
use (Dragoni and Sukhija, 2008). The islands complex
and dynamic system will response vigorously in
variable and complex ways to climate change (Watson
et al., 1998). Most research on the potential impacts
of climate change to the hydrologic cycle has been
directed at forecasting the potential impacts to surface
water, river discharge and quality. Study done by
Sophocleous and Devlin (2004) as well as Devlin and
Sophocleous (2005) showed that sustainability is a
function of recharge. Recharge rates cannot be ignored
despite to the fact that sustainable pumping rates can
be estimated without them. Climate Change (2007)
indicated that in warmer climate there is a risk of flood
impacts by climate changes. Relatively little research
has been undertaken to determine the sensitivity of
aquifers to changes in critical input parameters such
as increase in precipitation and recharge (Vaccaro,
1992; Loaiciga et al., 2000). Globally, studies have
been reported in the literature on the decrease in
recharge which gives problems to groundwater
resources (Zhou et al., 2003; Moustadraf et al., 2008;
Puraji and Soni, 2008). Moreover, pressure of island
resources deals with overdrafts of fresh water by
pumping well distort the natural recharge-discharge
equilibrium causes drawdown of the watertable a rise
or upconing of the saltwater interface. Greater
withdrawals create localized upconing and also result
in a regional reduction in thickness of the freshwater
lens (Rejani et al., 2008). According to Hamza (2006),
when an aquifer contains an underlying layer of saline
water being pumped, only the upper portion of the
aquifer is penetrates. A stable cone below the bottom
will develop of the well at some depth in the interface,
and the well will still discharge freshwater. Continuous
or overpumping the cone will be unstable and the
interface will rise abruptly to the bottom of the well.
This will cause the water extracted from the well
become salty. Evaluation of seawater intrusion is
critical for maintaining a long term supply of
groundwater resource of good quality to its
management.
Present study is concerned with using a three-
dimensional finite-difference numerical model to
develop an understanding of groundwater sustainability
under current aquifer conditions. Secondary objectives
include evaluating the groundwater resource affected
by vulnerable to climate change (recharge rate) and
pressure of island resources (increased in pumping
rates) using variable density SEAWAT-2000 code (Guo
and Langevin, 2002), a combined version of
MODFLOW and MT3D. This output is to gain insights
about the future changes in groundwater due to
vulnerable to climate change (recharge rate) and
pressure of island resources (pumping rates) in
hydraulic levels and chloride concentrations. The
results of this study are foundation for more evaluations
of the groundwater system in this tropical island. It is
vital to study the impact of groundwater withdrawal
and work out a comprehensive scheme of groundwater
exploitation consistent with the natural constraints
existing on the island.
2. Materials and Methods
2.1. Study area
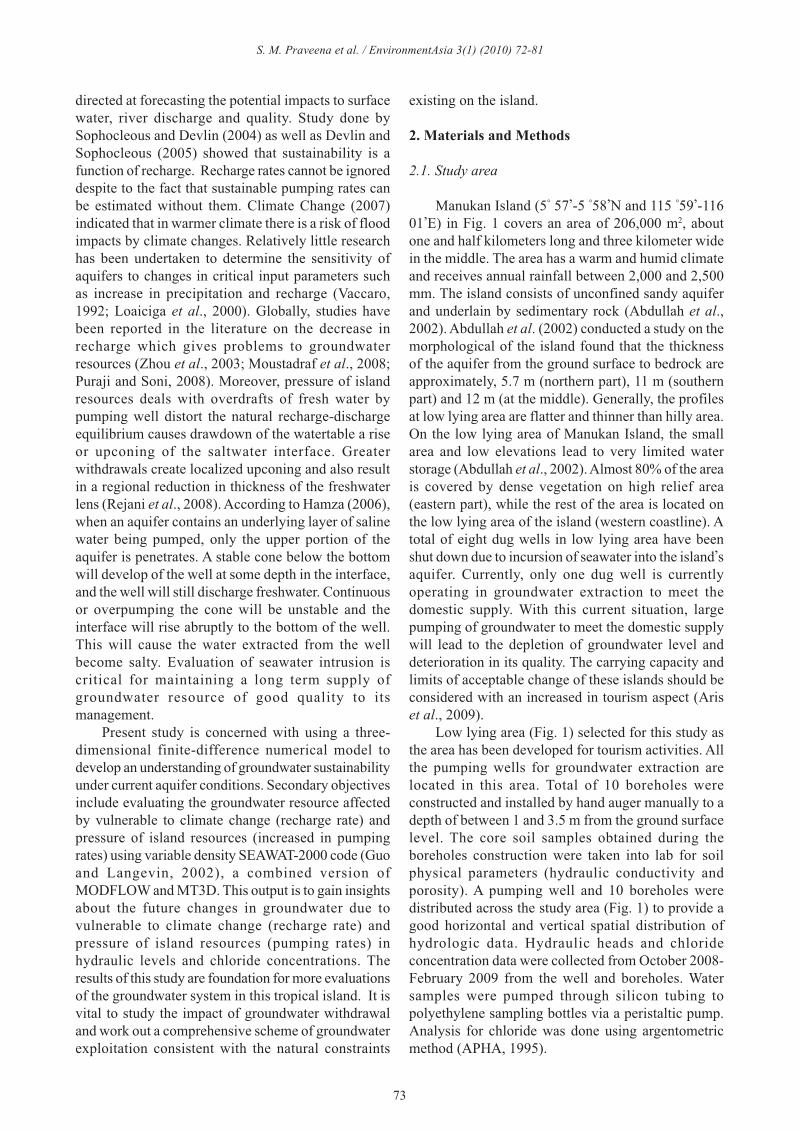
Manukan Island (5° 57,-5 °58
,N and 115 °59
,-116
01,E) in Fig. 1 covers an area of 206,000 m2, about
one and half kilometers long and three kilometer wide
in the middle. The area has a warm and humid climate
and receives annual rainfall between 2,000 and 2,500
mm. The island consists of unconfined sandy aquifer
and underlain by sedimentary rock (Abdullah et al.,
2002). Abdullah et al. (2002) conducted a study on the
morphological of the island found that the thickness
of the aquifer from the ground surface to bedrock are
approximately, 5.7 m (northern part), 11 m (southern
part) and 12 m (at the middle). Generally, the profiles
at low lying area are flatter and thinner than hilly area.
On the low lying area of Manukan Island, the small
area and low elevations lead to very limited water
storage (Abdullah et al., 2002). Almost 80% of the area
is covered by dense vegetation on high relief area
(eastern part), while the rest of the area is located on
the low lying area of the island (western coastline). A
total of eight dug wells in low lying area have been
shut down due to incursion of seawater into the island,s
aquifer. Currently, only one dug well is currently
operating in groundwater extraction to meet the
domestic supply. With this current situation, large
pumping of groundwater to meet the domestic supply
will lead to the depletion of groundwater level and
deterioration in its quality. The carrying capacity and
limits of acceptable change of these islands should be
considered with an increased in tourism aspect (Aris
et al., 2009).
Low lying area (Fig. 1) selected for this study as
the area has been developed for tourism activities. All
the pumping wells for groundwater extraction are
located in this area. Total of 10 boreholes were
constructed and installed by hand auger manually to a
depth of between 1 and 3.5 m from the ground surface
level. The core soil samples obtained during the
boreholes construction were taken into lab for soil
physical parameters (hydraulic conductivity and
porosity). A pumping well and 10 boreholes were
distributed across the study area (Fig. 1) to provide a
good horizontal and vertical spatial distribution of
hydrologic data. Hydraulic heads and chloride
concentration data were collected from October 2008-
February 2009 from the well and boreholes. Water
samples were pumped through silicon tubing to
polyethylene sampling bottles via a peristaltic pump.
Analysis for chloride was done using argentometric
method (APHA, 1995).
S. M. Praveena et al. / EnvironmentAsia 3(1) (2010) 72-81
73
(Eq. 2.1)
Where;
Xi = ith orthogonal coordinate
Kf = equivalent freshwater hydraulic conductivity
(L/T)
Sf = equivalent freshwater specific storage (1/L)
hf = equivalent freshwater head
t = time (T)θ = effective porosity (dimensionless)ρs = density of source and sink (M/L
3)
qs = volumetric flow rate of sources and sinks per
unit volume of aquifer (1/T)
The transport equation is as followed:
(Eq. 2.2)
[ρKf( + )]=ρS
f +
θ +
∂
_ ρsq
s
SEAWAT-2000 is the latest modeling software
available in groundwater modeling that couples flow
and transport together (Guo and Langevin, 2002).
SEAWAT-2000 couples the flow and transport
equations of two widely accepted codes MODFLOW
(Mcdonald and Harbaugh, 1988; Harbaugh et al., 2000)
and MT3DS (Zheng and Wang, 1999) with some
modifications to include density effects based on the
extended Boussinesq assumptions. The governing flow
and transport equations in SEAWAT-2000 are as in Eqs
2.1 and 2.2. This package has been very useful to
simulate variable density flow through complex
geological. One advantage of SEAWAT-2000 is that it
uses MT3DMS to represent solute-transport, the
program contains several methods for solving the
transport equation. Hence, SEAWAT-2000 software
package was selected in the present study to simulate
the groundwater flow and solute transport to predict
the behavior of groundwater of Manukan Island aquifer.
Figure 1. Location of Manukan Island focusing at low lying area and the spatial discretization for three dimensional
numerical model
∂__∂xi
∂hf__∂xi
ρ-ρf___ρ
f
∂x__
∂xi
∂hf__∂t
∂hf__∂t
∂ρ__∂t
= (θDif )_ (θvick) +
ρ
sCk
s +∑Rx
∂(θck)____∂t
∂__∂xj
∂__∂x
∂ck___∂xj
S. M. Praveena et al. / EnvironmentAsia 3(1) (2010) 72-81
74
Where:Ck
= dissolved concentration of species, k (M/L3)Dif = hydrodynamics dispersion tensor (L2/T)Ck
s = concentration of the source or sink flux for
species, k (M/L3)∑Rx = the chemical reaction term (ML3/T)
The conceptual model for this study was developed
based on the surface elevation contour map,
information collected during boreholes construction
and data from Abdullah et al. (2002). The low lying
area of Manukan Island unconfined aquifer is consist
of fine to coarse sand mixed with gravel. The model
grid consists of 28 columns and 30 rows with grid
spacing of 1093 (x-direction) and 906 m (y-direction)
and divided into 2 layers based on the hydrogeological
information. The top elevation of layer one corresponds
with island land elevation. The bottom of layer two is
set at an elevation of 7.0 m below the mean sea level.
Model input parameters are given in Table 1. Based on
groundwater data availability, one day was chosen as
the time step in this study and to be increased by a
multiplier factor by 1.2 within which all the
hydrological stresses can be assumed constant.
According to Spitz and Moreno (1996), time step is
required for transient state. Generally, the smaller the
time step, the more accurate the predicted results
although it will require excessive computation time.
Temporally, the simulation numerical model is transient
with a total simulation time of five months from
October 2008-February 2009 was used in the model,
with each stress period representing one month of
simulation month. In this study, model calibration is
achieved through trial and error approach by adjusting
the value of hydraulic conductivity as done in various
groundwater modeling studies (Rejani et al., 2008).
Predictive simulations were performed after the
model has been calibrated and validated. In predictive
simulation, the parameters optimized during calibration
are used to predict the system response to future events.
Recharge rate was selected as precipitation patterns are
significantly influenced by changes in the global-
circulation patterns induced by climate change.
Changes in precipitation have important implications
for all aspects of the hydrologic cycle including
groundwater resources (Allen et al., 2004). Due to this
fact, reduced pumping has been selected with an aim
of assessing the groundwater resources. The reduced
pumping rate by 25% was selected as the number of
tourists plunged year by year, it is crucial to meet the
demand of groundwater in the island. Ong,or et al.
(2007) showed that reduced pumping rate by 25% was
acceptable range compared to other pumping rates in
terms of groundwater management. Predictive
simulations were performed to minimize the
overexploration in the unconfined aquifer of Manukan
Island. Scenarios selected for this study are presented
in Table 2:
Table 1. Input parameters for the model and simulation strategies for this study
Parameter Value
Hydraulic conductivity (Kx, K
y & K
z)
Layer 1 5.42E-4, 1E-5, 1E-5
Layer 2 (Sedimentary rock) 3.4E-7, 1E-5, 1E-5
Total porosity 0.30
Effective porosity 0.15
Specific storage 0.0014
Specific yield 0.35
Longitudinal dispersivity 1 m
Horizontal transverse dispersivity 0.1 m
Vertical transverse dispersivity 0.01 m
Constant head 0 m
Recharge concentration 0 mg/L
Constant head concentration 19999 mg/L
Initial Concentration Based October 2008
Evapotranspiration 0.3-0.35 mm/year
S. M. Praveena et al. / EnvironmentAsia 3(1) (2010) 72-81
75
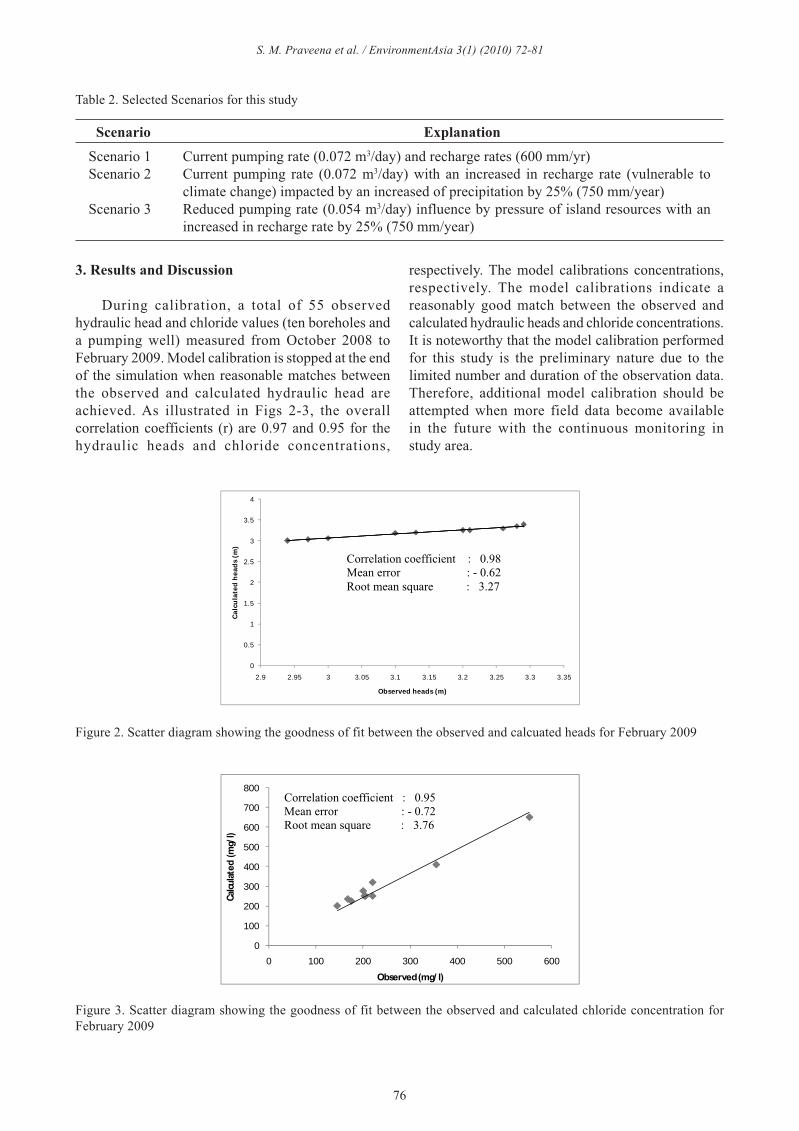
Table 2. Selected Scenarios for this study
Scenario Explanation
Scenario 1 Current pumping rate (0.072 m3/day) and recharge rates (600 mm/yr)
Scenario 2 Current pumping rate (0.072 m3/day) with an increased in recharge rate (vulnerable to
climate change) impacted by an increased of precipitation by 25% (750 mm/year)
Scenario 3 Reduced pumping rate (0.054 m3/day) influence by pressure of island resources with an
increased in recharge rate by 25% (750 mm/year)
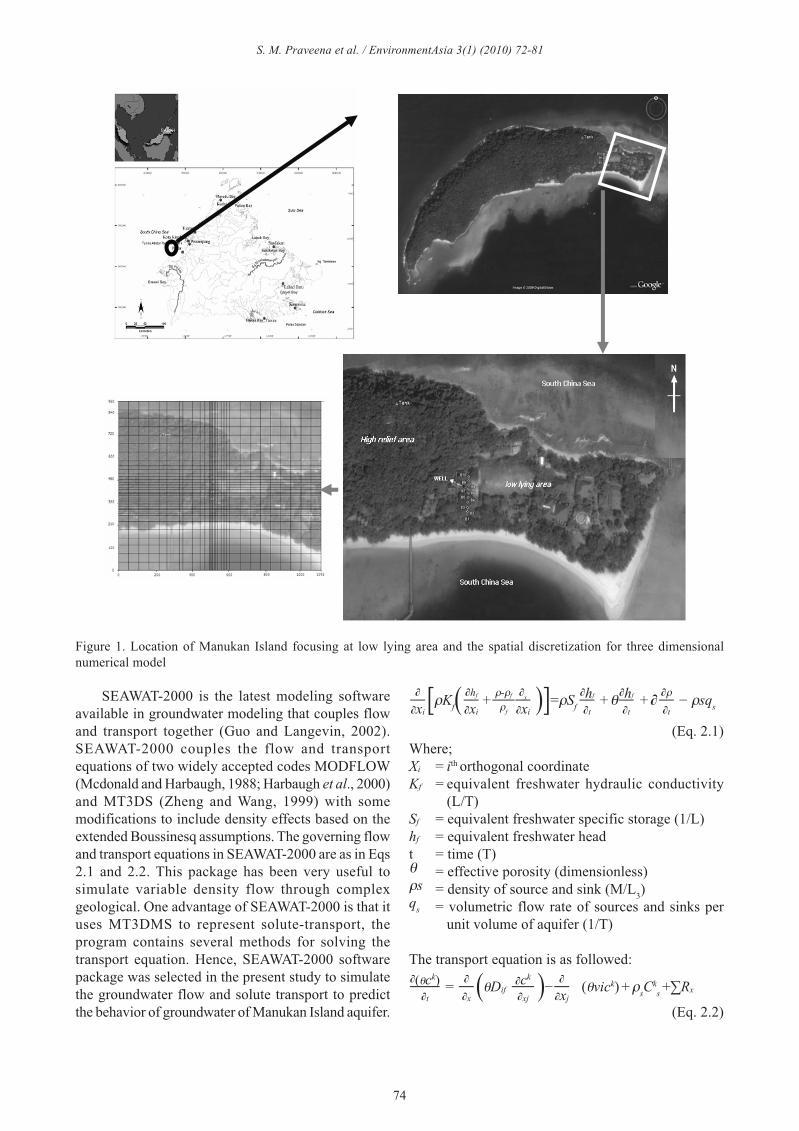
3. Results and Discussion
During calibration, a total of 55 observed
hydraulic head and chloride values (ten boreholes and
a pumping well) measured from October 2008 to
February 2009. Model calibration is stopped at the end
of the simulation when reasonable matches between
the observed and calculated hydraulic head are
achieved. As illustrated in Figs 2-3, the overall
correlation coefficients (r) are 0.97 and 0.95 for the
hydraulic heads and chloride concentrations,
0
0.5
1
1.5
2
2.5
3
3.5
4
2.9 2.95 3 3.05 3.1 3.15 3.2 3.25 3.3 3.35
Ca
lcu
late
d h
ead
s (
m)
Observed heads (m)
Correlation coefficient : 0.98
Mean error : - 0.62
Root mean square : 3.27
respectively. The model calibrations concentrations,
respectively. The model calibrations indicate a
reasonably good match between the observed and
calculated hydraulic heads and chloride concentrations.
It is noteworthy that the model calibration performed
for this study is the preliminary nature due to the
limited number and duration of the observation data.
Therefore, additional model calibration should be
attempted when more field data become available
in the future with the continuous monitoring in
study area.
Correlation coefficient :
0.96
Mean error :
0
100
200
300
400
500
600
700
800
0 100 200 300 400 500 600
Calc
ulat
ed (
mg/
l)
Observed (mg/ l)
Correlation coefficient : 0.95
Mean error : - 0.72
Root mean square : 3.76
Figure 2. Scatter diagram showing the goodness of fit between the observed and calcuated heads for February 2009
Figure 3. Scatter diagram showing the goodness of fit between the observed and calculated chloride concentration for
February 2009
S. M. Praveena et al. / EnvironmentAsia 3(1) (2010) 72-81
76
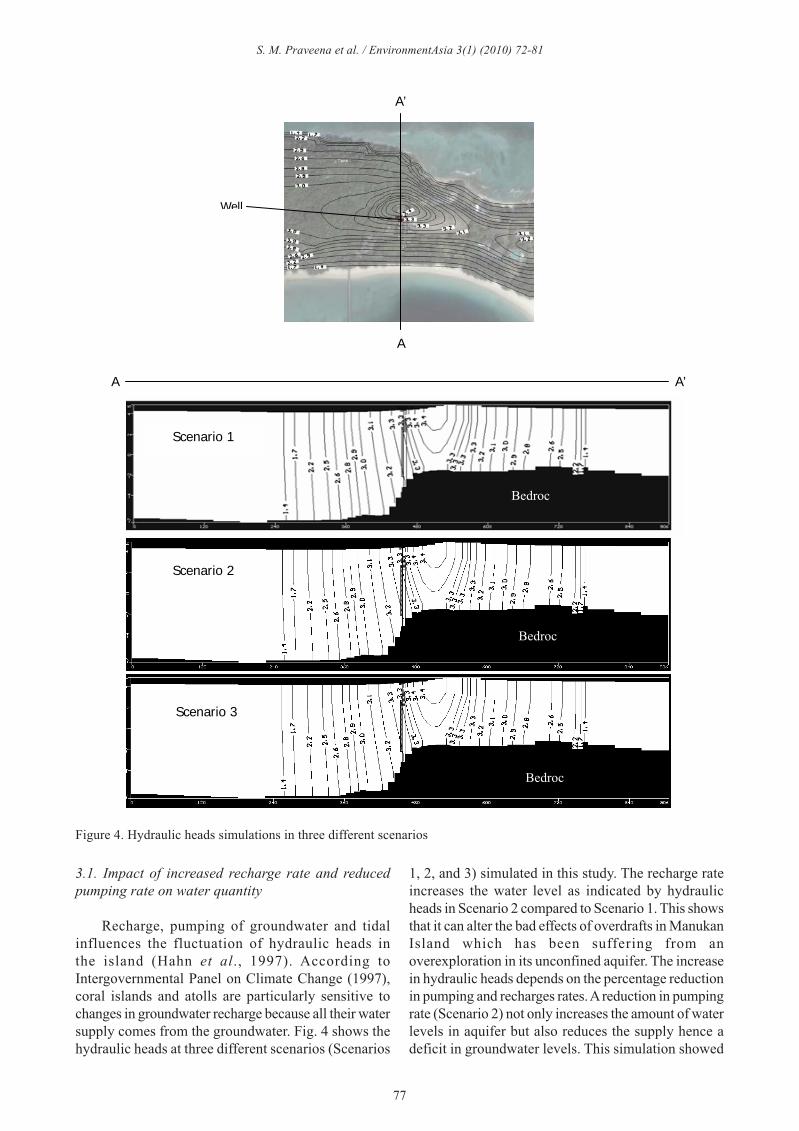
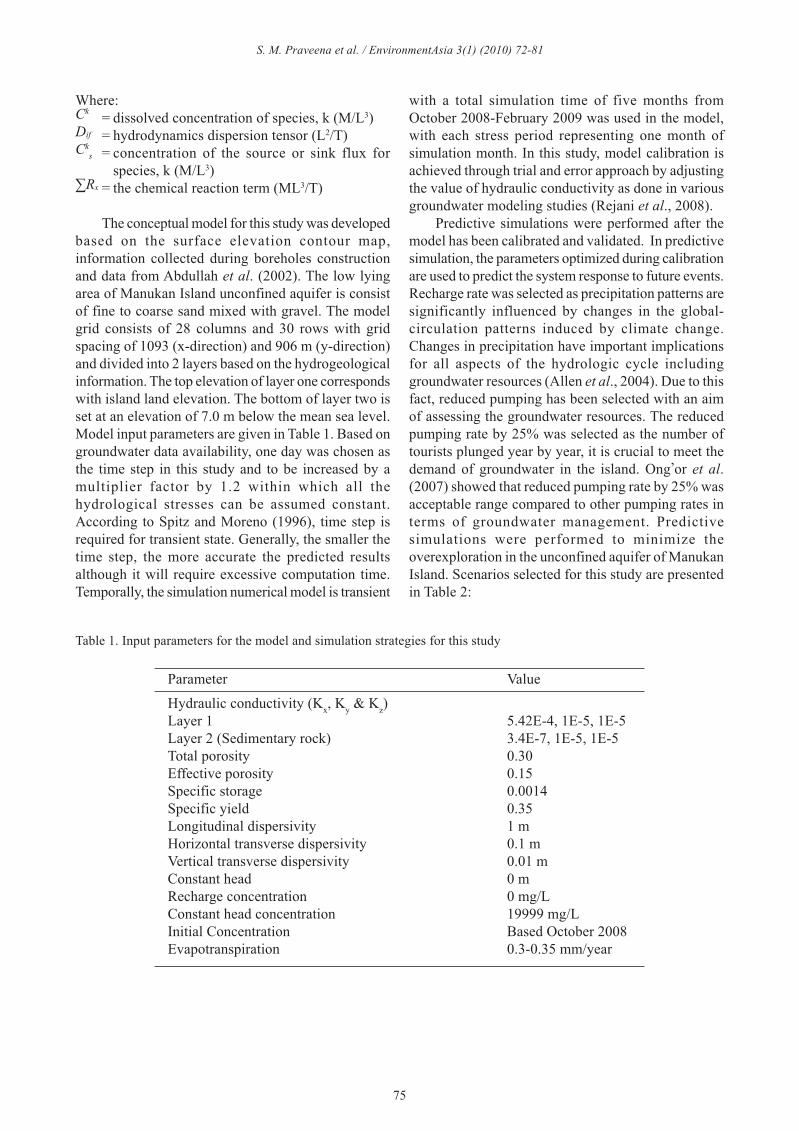
3.1. Impact of increased recharge rate and reduced
pumping rate on water quantity
Recharge, pumping of groundwater and tidal
influences the fluctuation of hydraulic heads in
the island (Hahn et al., 1997). According to
Intergovernmental Panel on Climate Change (1997),
coral islands and atolls are particularly sensitive to
changes in groundwater recharge because all their water
supply comes from the groundwater. Fig. 4 shows the
hydraulic heads at three different scenarios (Scenarios
1, 2, and 3) simulated in this study. The recharge rate
increases the water level as indicated by hydraulic
heads in Scenario 2 compared to Scenario 1. This shows
that it can alter the bad effects of overdrafts in Manukan
Island which has been suffering from an
overexploration in its unconfined aquifer. The increase
in hydraulic heads depends on the percentage reduction
in pumping and recharges rates. A reduction in pumping
rate (Scenario 2) not only increases the amount of water
levels in aquifer but also reduces the supply hence a
deficit in groundwater levels. This simulation showed
A’
Well
A
A’A
Scenario 1
Bedroc
Bedroc
Bedroc
Scenario 2
Scenario 3
Figure 4. Hydraulic heads simulations in three different scenarios
S. M. Praveena et al. / EnvironmentAsia 3(1) (2010) 72-81
77
that with 25% reduction of pumping rate allows
groundwater level increase hence addressing the
environmental restoration issues with significant
water volume stored within the given time limit. Even
though 50% reduction of pumping rate with an
increase in recharge rate leads to increase of hydraulic
heads but it is unacceptable. This is because the water
is needed to cater tourism and domestic uses in this
touristic island. A combination of reduction in pumping
rate and increase in recharge rate (due to climate
change) in Scenario 3, which embraces not only the
quantity but also quality for both environmental
restoration and island aquifer, is desired. Recent
studies conducted by Chen et al. (2004) and
Moustadraf et al. (2008) showed that groundwater
level fluctuations have a strong correlation with
climatic trends. According to Climate Change (2007),
groundwater recharge may increase in areas
where heavy precipitations are major sources of
groundwater recharge. Similarly in this study, the
output showed the recharge rate increases water level
as indicated by the hydraulic heads. However,
according to Moustadraf et al. (2008), groundwater
recharge is less efficient when the rainfall pattern is
short and intense. Moreover, inconsistency in climate
change in terms of precipitation influences the
groundwater recharge.
3.2. Impact of increased recharge rate and reduced
pumping rate on water quality
The prognosis of chloride in groundwater due to
pumping and recharge rates was carried out using the
calibrated model. The chloride concentration in
groundwater was investigated at local scale within the
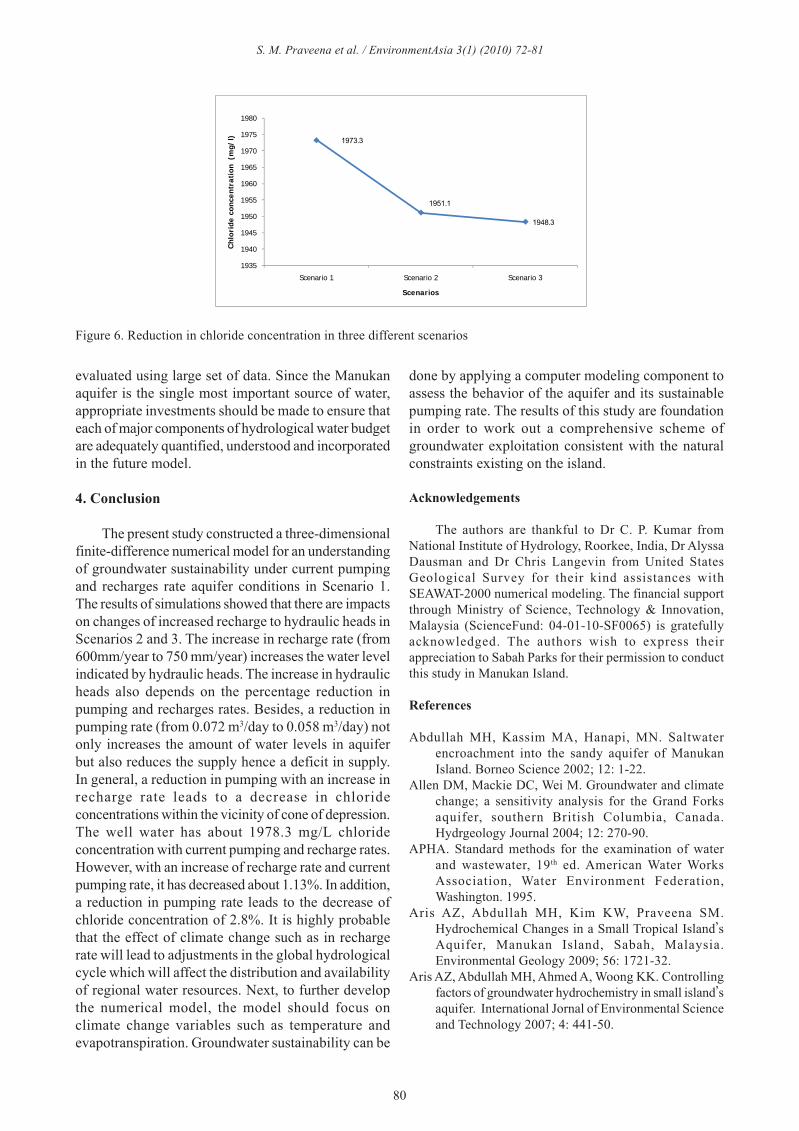
vicinity of cone of depression. The well water has about
1978.3 mg/L chloride with current pumping and
recharge rates in Scenario 1. However, with an increase
of recharge rate and current pumping rate (Scenario 2)
has decreased about 1.13% or 22.2 mg/L. In addition,
reduction in pumping rate made the chloride
concentration decreased about 2.8% or 2.8 mg/L. In
general, a reduction in pumping with an increase in
recharge rate (Scenario 3) leads to a decreased in
chloride concentrations within the vicinity of cone of
depression (Figs 5-6). Similarly, a study done by Ong,
or et al. (2007) in Jining, China showed a reduction in
pumping rates by 15-25% and increased artificial
recharge has decreased the chloride concentration in
water quality. In general, the modeling output showed
that chloride concentrations in pumping well are far
higher than the limit of (WHO, 2004) of 250 mg/L in
pumping well. The decrease in chloride concentrations
due to reduction in pumping rate (25%) with an increase
in recharge rate can be attributed to the dilution of
precipitated minerals, modifying its permeability by
widening the pores/fractures allowing more water of
lower chloride concentrations and diluting it (Ong, or
et al., 2007). According to Samsudin et al. (2008),
heavy rainfall that directly recharges the aquifer had
flushed out most of the salts from the aquifer. Moreover
at 25% reduced pumping with an increase in recharge
rate and with an increased of recharge rate seems to be
the better risk option as it offers an optimum in terms
of both water quality and quantity combined for the
most visited tourist island, such as in this study. It is
worth noting that even though reduction about 50% in
pumping rate with an increased in recharge rate will
lead to reduction in chloride concentrations, but it is
unacceptable in this tourist island. Devlin and
Sophocleous (2005) stated that recharge could affect
the quality of the water in the aquifer thus also
impacting associated ecological communities.
3.3. Groundwater sustainability
According to Allen et al. (2004), as a part of the
hydrologic cycle, it can be anticipated that groundwater
systems will be affected by changes in recharge
(encompasses changes in precipitation). It is highly
probable that the effect of climate change such as in
recharge rate will lead to adjustments in the global
hydrological cycle which will affect the distribution
and availability of regional water resources. According
to Sen (2008), the direct groundwater recharge mode
is more sensitive to direct natural recharge than indirect
natural recharge. Direct natural recharge is such as an
increase of precipitation due to climate change whereas
indirect natural recharge is water fulfills the soil
moisture and evapotranspiration process before
reaching groundwater reservoir. Many researchers
believe that climate change mainly governs the
groundwater recharge compare to vegetation and
evapotranspiration. On the other hand, high recharge
rate areas (areas with highly pervious soils) may be at
risk for contamination. Rainwater can percolate through
coarse-grained deposits so rapidly that surface
contaminants are not “filtered out” before water enters
the aquifer. Shallow aquifers or areas with shallow soils
may also be at risk for contamination. In shallow
groundwater, rainwater may not move through enough
sub-surface material to “filter out” contaminants before
the water enters the aquifer (Alley, 1993). Briefly, the
Water Budget Myth is the idea that sustainable pumping
must not exceed the recharge rate in a given aquifer
(Bredehoeft, 2002). As a result, efforts should be made
to measure recharge rates as accurately as possible
when an evaluation of sustainability is the objective.
Any modern assessment of groundwater sustainability
can be done by applying a computer modeling
component to assess the behavior of the aquifer and its
sustainable pumping rate.
S. M. Praveena et al. / EnvironmentAsia 3(1) (2010) 72-81
78
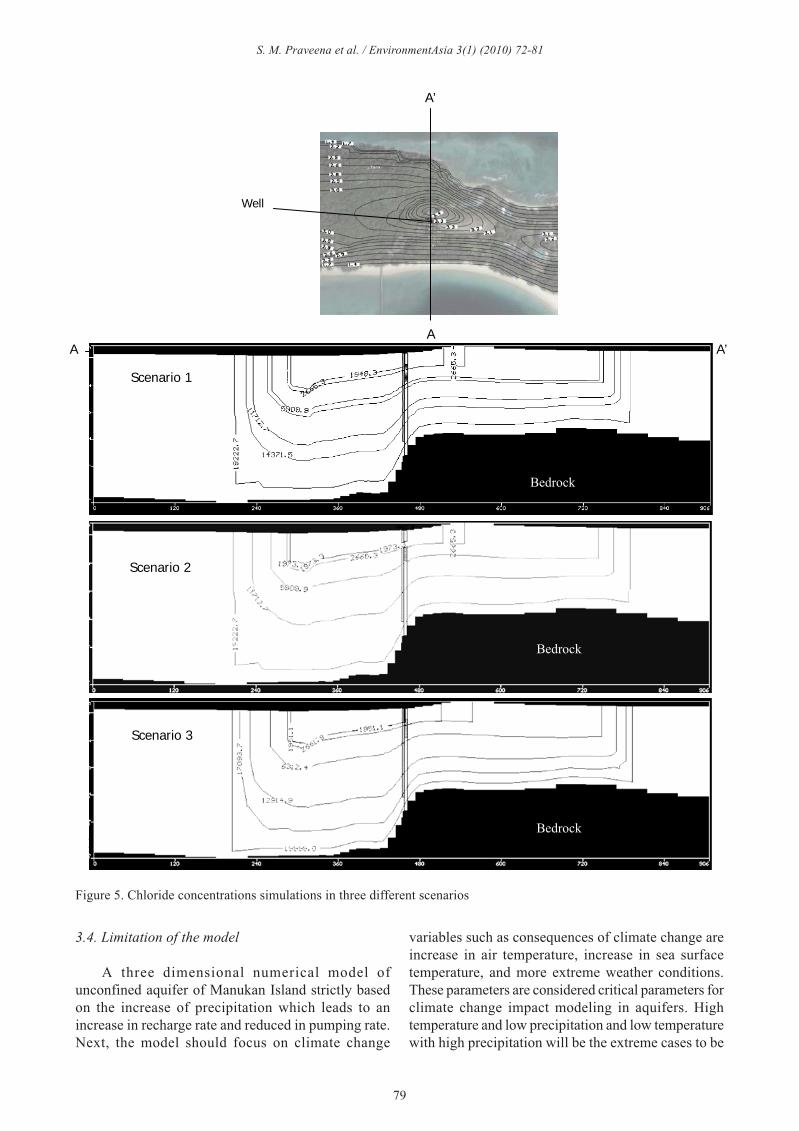
Figure 5. Chloride concentrations simulations in three different scenarios
A
A’
Well
A’A Bedrock
Bedrock
Bedrock
Bedrock
Scenario 2
Scenario 3
Scenario 1
Figure 5. Chloride concentrations simulations in three different scenarios
3.4. Limitation of the model
A three dimensional numerical model of
unconfined aquifer of Manukan Island strictly based
on the increase of precipitation which leads to an
increase in recharge rate and reduced in pumping rate.
Next, the model should focus on climate change
variables such as consequences of climate change are
increase in air temperature, increase in sea surface
temperature, and more extreme weather conditions.
These parameters are considered critical parameters for
climate change impact modeling in aquifers. High
temperature and low precipitation and low temperature
with high precipitation will be the extreme cases to be
S. M. Praveena et al. / EnvironmentAsia 3(1) (2010) 72-81
79
evaluated using large set of data. Since the Manukan
aquifer is the single most important source of water,
appropriate investments should be made to ensure that
each of major components of hydrological water budget
are adequately quantified, understood and incorporated
in the future model.
4. Conclusion
The present study constructed a three-dimensional
finite-difference numerical model for an understanding
of groundwater sustainability under current pumping
and recharges rate aquifer conditions in Scenario 1.
The results of simulations showed that there are impacts
on changes of increased recharge to hydraulic heads in
Scenarios 2 and 3. The increase in recharge rate (from
600mm/year to 750 mm/year) increases the water level
indicated by hydraulic heads. The increase in hydraulic
heads also depends on the percentage reduction in
pumping and recharges rates. Besides, a reduction in
pumping rate (from 0.072 m3/day to 0.058 m3/day) not
only increases the amount of water levels in aquifer
but also reduces the supply hence a deficit in supply.
In general, a reduction in pumping with an increase in
recharge rate leads to a decrease in chloride
concentrations within the vicinity of cone of depression.
The well water has about 1978.3 mg/L chloride
concentration with current pumping and recharge rates.
However, with an increase of recharge rate and current
pumping rate, it has decreased about 1.13%. In addition,
a reduction in pumping rate leads to the decrease of
chloride concentration of 2.8%. It is highly probable
that the effect of climate change such as in recharge
rate will lead to adjustments in the global hydrological
cycle which will affect the distribution and availability
of regional water resources. Next, to further develop
the numerical model, the model should focus on
climate change variables such as temperature and
evapotranspiration. Groundwater sustainability can be
done by applying a computer modeling component to
assess the behavior of the aquifer and its sustainable
pumping rate. The results of this study are foundation
in order to work out a comprehensive scheme of
groundwater exploitation consistent with the natural
constraints existing on the island.
Acknowledgements
The authors are thankful to Dr C. P. Kumar from
National Institute of Hydrology, Roorkee, India, Dr Alyssa
Dausman and Dr Chris Langevin from United States
Geological Survey for their kind assistances with
SEAWAT-2000 numerical modeling. The financial support
through Ministry of Science, Technology & Innovation,
Malaysia (ScienceFund: 04-01-10-SF0065) is gratefully
acknowledged. The authors wish to express their
appreciation to Sabah Parks for their permission to conduct
this study in Manukan Island.
References
Abdullah MH, Kassim MA, Hanapi, MN. Saltwater
encroachment into the sandy aquifer of Manukan
Island. Borneo Science 2002; 12: 1-22.
Allen DM, Mackie DC, Wei M. Groundwater and climate
change; a sensitivity analysis for the Grand Forks
aquifer, southern British Columbia, Canada.
Hydrgeology Journal 2004; 12: 270-90.
APHA. Standard methods for the examination of water
and wastewater, 19th ed. American Water Works
Association, Water Environment Federation,
Washington. 1995.
Aris AZ, Abdullah MH, Kim KW, Praveena SM.
Hydrochemical Changes in a Small Tropical Island,s
Aquifer, Manukan Island, Sabah, Malaysia.
Environmental Geology 2009; 56: 1721-32.
Aris AZ, Abdullah MH, Ahmed A, Woong KK. Controlling
factors of groundwater hydrochemistry in small island,s
aquifer. International Jornal of Environmental Science
and Technology 2007; 4: 441-50.
1973.3
1951.1
1948.3
1935
1940
1945
1950
1955
1960
1965
1970
1975
1980
Scenario 1 Scenario 2 Scenario 3
Ch
lori
de
co
nce
ntr
ati
on
(m
g/
l)
Scenarios
Figure 6. Reduction in chloride concentration in three different scenarios
S. M. Praveena et al. / EnvironmentAsia 3(1) (2010) 72-81
80
Bredehoeft JD. The water budget myth revisited: Why
hydrogeologists model. Ground Water 2002; 40: 340-
45.
Chen BF, Hsu SM. Numerical study of tidal effects on
seawater intrusion in confined and unconfined aquifers
by time-independent finite-difference method. Journal
of Waterway, Port, Coastal and Ocean Engineering
2004; 130; 191-206.
Climate Change. Working Group II Contribution to the
Fourth Assessment Report of the Intergovernmental
Panel on Climate Change. Cambridge University Press.
United Kingdom. 2007.
Dragoni W, Sukhija BS. Climate change and groundwater:
a short review. Geological Society, London, Special
Publications 2008; 288: 1-12.
Devlin JF, Sophocleous M. The persistence of the water
budget myth and its relationship to sustainability.
Hydrogeology Journal 2005; 13: 549-54.
Griggs CP, Peterson FL. Flow regime associated with
partially penetrating large diameter wells in hard rocks.
Journal of Hydrology 1993; 103: 209-17.
Guo W, Langevin CD. User,s Guide to SEAWAT-2000: A
computer program for simulation of three-dimensional
variable-density groundwater flow: technique of water
resources investigation. Technique of Water-Resources
Investigations. Book 6. 2002.
Hahn J, Lee Y, Kim N, Han C, Lee S. The groundwater
resources and sustainable yield of Cheju volcanic
island, Korea. Environmental Geology 1997; 33: 43-
53.
Hamza KI. Numerical analysis of saltwater upconing
beneath pumping well. Tenth International Water
Technology Conference, IWTC10, Alexandria, Egypt.
2006.
Intergovernmental Panel on Climate Change. Climate
Change 2007: Impacts, adapatations and vulnerbality.
Contribution of Working Group II to the Fourth
Assessment Report of the Intergovernmental panel on
Climate Change. Cambridge University Press. United
Kingdom. 1997.
Loaiciga HA, Maidment D. Valdes JB. Climate change
impacts in a regional karst aquifer. Journal of
Hydrology 2000; 227: 173-94.
McDonald MG, Harbaugh AW. A modular three-dimensional
finite difference groundwater flow model. In: US
Geological Survey Technique of water Resources.
1988.
Moustadraf J, Razack M, Sinan M. Evaluation of the impacts
of climate changes on the coastal Chaouia aquifer,
Morocco, using numerical modeling. Hydrogeology
Journal 2008; 16: 1411-26.
Ong,or BTL, Shu L, Liu P. Environmental impact assessment
of risk associated with groundwater overdraft
remedition in cone of depression, Jining, China.
Environmental Geology 2007; 53: 751-62.
Puraji PR, Soni AK. Seawater intrusion studies near Kovaya
limestone mine, Saurashtra coast, India. Environmental
Monitoring and Assessment 2008; DOI 10.1007/
s10661-008-0380-9.
´
Rejani R, Jha MK, Panda SN, Mull R. Simulation Modeling
for efficient groundwater management in Balasore
coastal basin, India. Water Resources Management
2008; 22: 23-50.
Samsudin AR, Haryono A, Hamzah U, Rafek AG. Salinity
mapping of coastal groundwater aquifers using
hydrogeochemical methods: a case study from north
Kelantan, Malaysia. Environmental Geology 2008; 55:
1737-43.
Sen K. Wadi Hydrology. CRC Press. ISBN 1420061542,
9781420061543, 2008.
Singh VS, Gupta CP. Feasibility of groundwater withdrawal
in a coral island. Hydrological Sciences Journal 1999;
44: 173-182.
Sophocleous M, Devlin JF. Is natural recharge relevant to
groundwater sustainable development? Groundwater
2004; 42: 618.
Spitz K, Moreno J. A Practical Guide to Groundwater and
Solute Transport Modeling. John Wiley and Sons,
New York. 1996.
Tompkins EL, Nicholson-Cole, SA, Hurlson L-A, Boyd E,
Hodge GB, Clarke J, Gray G, Trotz N, Varlack L.
Surviving Climate change in small islands- A
Guidebook. http://www.tyndall.ac.uk. 2005.
Vaccaro JJ. Sensitivity of groundwater recharge estimates
to climate variability and change, Columbia Plateau,
Washington. Journal of Geophysical Research 1992;
97: 2821-33.
Watson RT, Zinyowera MC, Moss RH. The regional impacts
of climate change. Intergovernmental Panel on Climate
Change Working Group II. Cambridge University
Press. ISBN 0521634555. 1998.
Zheng C, Wang PP. A modular three dimensional multi
species model for simulation of advection, dispersion
and chemical reactions of contaminants in groundwater
systems: documentation and user guide. US Army
Engineer Research and Development Center, United
States of America. 1999.
Zhou X, Chen M, Liang C. Optimal schemes of groundwater
exploitation for prevention of seawater intrusion in the
Leizhou Penisula in Southern China. Environmental
Geology 2003; 43: 987-85.
Received 30 May 2009
Accepted 2 July 2009
Correspondence to
Dr. Sarva Mangala Praveena
School of Science and Technology,
Universiti Malaysia Sabah,
88999 Kota Kinabalu, Sabah,
Malaysia.
E-mail: [email protected]
S. M. Praveena et al. / EnvironmentAsia 3(1) (2010) 72-81
81
Related Documents