Recent Trends in Gonorrhea in the United States Lori M. Newman, MD Division of STD Prevention CDC Jacksonville, FL May 9, 2006

Recent Trends in Gonorrhea in the United States Lori M. Newman, MD Division of STD Prevention CDC Jacksonville, FL May 9, 2006.
Dec 17, 2015
Welcome message from author
This document is posted to help you gain knowledge. Please leave a comment to let me know what you think about it! Share it to your friends and learn new things together.
Transcript

Recent Trends in Gonorrhea in the United States
Lori M. Newman, MDDivision of STD Prevention
CDCJacksonville, FL
May 9, 2006

Neisseria gonorrhoeae
Sequelae of untreated infection include Pelvic inflammatory disease Infertility Chronic pelvic pain
Increases risk of HIV transmission and acquisition
Gonorrhea is second most common reported notifiable disease
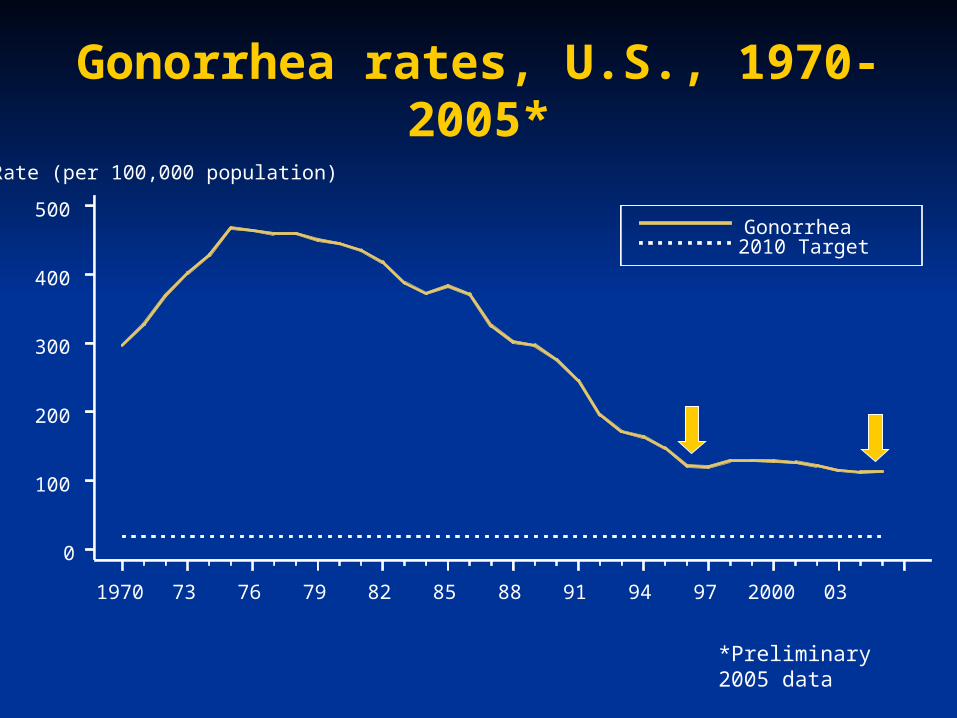
Gonorrhea rates, U.S., 1970-2005*
*Preliminary 2005 data
Rate (per 100,000 population)
Gonorrhea2010 Target
0
100
200
300
400
500
1970 73 76 79 82 85 88 91 94 97 2000 03

Gonorrhea rates by sex, 1981-2005*
*Preliminary 2005 data
Rate (per 100,000 population)
MaleFemale2010 Target
0
120
240
360
480
600
1981 83 85 87 89 91 93 95 97 99 2001 03 05

Gonorrhea rates by age and sex, 2005*
*Preliminary 2005 data
Men Rate (per 100,000 population) Women
Age750 600 450 300 150 0 0 150 300 450 600 750
Total 65+55-6445-5440-4435-3930-3425-2920-2415-1910-145.9
Men Rate (per 100,000 population) Women
Age750 600 450 300 150 0 0 150 300 450 600 750
Total 65+55-6445-5440-4435-3930-3425-2920-2415-1910-14 34.8
Men Rate (per 100,000 population) Women
Age750 600 450 300 150 0 0 150 300 450 600 750
Total 65+55-6445-5440-4435-3930-3425-2920-2415-1910-14
257.2
Men Rate (per 100,000 population) Women
Age750 600 450 300 150 0 0 150 300 450 600 750
Total 65+55-6445-5440-4435-3930-3425-2920-2415-1910-14
611.5
Men Rate (per 100,000 population) Women
Age750 600 450 300 150 0 0 150 300 450 600 750
Total 65+55-6445-5440-4435-3930-3425-2920-2415-1910-14
428.6
Men Rate (per 100,000 population) Women
Age750 600 450 300 150 0 0 150 300 450 600 750
Total 65+55-6445-5440-4435-3930-3425-2920-2415-1910-14
566.1
Men Rate (per 100,000 population) Women
Age750 600 450 300 150 0 0 150 300 450 600 750
Total 65+55-6445-5440-4435-3930-3425-2920-2415-1910-14
300.8
Men Rate (per 100,000 population) Women
Age750 600 450 300 150 0 0 150 300 450 600 750
Total 65+55-6445-5440-4435-3930-3425-2920-2415-1910-14
270.5
Men Rate (per 100,000 population) Women
Age750 600 450 300 150 0 0 150 300 450 600 750
Total 65+55-6445-5440-4435-3930-3425-2920-2415-1910-14
173.1
Men Rate (per 100,000 population) Women
Age750 600 450 300 150 0 0 150 300 450 600 750
Total 65+55-6445-5440-4435-3930-3425-2920-2415-1910-14
112.9
Men Rate (per 100,000 population) Women
Age750 600 450 300 150 0 0 150 300 450 600 750
Total 65+55-6445-5440-4435-3930-3425-2920-2415-1910-14
124.7
Men Rate (per 100,000 population) Women
Age750 600 450 300 150 0 0 150 300 450 600 750
Total 65+55-6445-5440-4435-3930-3425-2920-2415-1910-14
60.6
Men Rate (per 100,000 population) Women
Age750 600 450 300 150 0 0 150 300 450 600 750
Total 65+55-6445-5440-4435-3930-3425-2920-2415-1910-14
89.4
Men Rate (per 100,000 population) Women
Age750 600 450 300 150 0 0 150 300 450 600 750
Total 65+55-6445-5440-4435-3930-3425-2920-2415-1910-14
33.2
Men Rate (per 100,000 population) Women
Age750 600 450 300 150 0 0 150 300 450 600 750
Total 65+55-6445-5440-4435-3930-3425-2920-2415-1910-14
48.4
Men Rate (per 100,000 population) Women
Age750 600 450 300 150 0 0 150 300 450 600 750
Total 65+55-6445-5440-4435-3930-3425-2920-2415-1910-14
11.8
Men Rate (per 100,000 population) Women
Age750 600 450 300 150 0 0 150 300 450 600 750
Total 65+55-6445-5440-4435-3930-3425-2920-2415-1910-14
16.9
Men Rate (per 100,000 population) Women
Age750 600 450 300 150 0 0 150 300 450 600 750
Total 65+55-6445-5440-4435-3930-3425-2920-2415-1910-14
2.4
Men Rate (per 100,000 population) Women
Age750 600 450 300 150 0 0 150 300 450 600 750
Total 65+55-6445-5440-4435-3930-3425-2920-2415-1910-14
4.0
Men Rate (per 100,000 population) Women
Age750 600 450 300 150 0 0 150 300 450 600 750
Total 65+55-6445-5440-4435-3930-3425-2920-2415-1910-14
0.6
Men Rate (per 100,000 population) Women
Age750 600 450 300 150 0 0 150 300 450 600 750
Total 65+55-6445-5440-4435-3930-3425-2920-2415-1910-14
109.8
Men Rate (per 100,000 population) Women
Age750 600 450 300 150 0 0 150 300 450 600 750
Total 65+55-6445-5440-4435-3930-3425-2920-2415-1910-14
116.5

Proportion of reported gonorrhea cases from STD clinics by sex,1984-2005*
0
10
20
30
40
50
60
70
80
90
1984 86 88 90 92 94 96 98 2000 2002 2004
*Preliminary 2005 data
Males
Females
% from STD clinics

Gonorrhea rates by race/ethnicity, 1981-2005*
*Preliminary 2005 data
Rate (per 100,000 population)
WhiteBlackHispanicAsian/Pacific IslanderAm Indian/AK Native2010 Target
0
500
1,000
1,500
2,000
2,500
1981 83 85 87 89 91 93 95 97 99 2001 03 05

Gonorrhea rates by state, United States and outlying
territories, 2004
Rate per 100,000population
<=19.019.1-100.0>100.0
VT 13.9 NH 10.3 MA 47.5 RI 75.8 CT 82.2 NJ 77.5 DE 109.4 MD 150.6
Guam 69.7
Puerto Rico 6.9 Virgin Is. 68.9
(n= 8)(n= 25)(n= 20)
182.3
87.4
72.8151.8
85.0 67.1
109.2
181.7
94.9
7.5
162.8 110.6
42.4
93.367.0
234.4
16.1
172.4
58.4
248.6
161.6
9.6
65.9137.3
69.7
97.6
180.7
17.4
179.0
126.8
36.6
90.9
221.1
39.8
145.1
110.2
25.6
116.0
45.8
49.3
92.3
11.8

Gonorrhea rates by county: United States, 2004
Rate per 100,000population
<=19.0 (n= 1,330)
19.1-100.0 (n= 1,139)
>100.0 (n= 670)

Gonorrhea rates by region, 1981-2005*
*Preliminary 2005 data
Rate (per 100,000 population)
WestMidwestNortheastSouth2010 Target
0
120
240
360
480
600
1981 83 85 87 89 91 93 95 97 99 2001 03 05

Female gonorrhea rates for 15-19 year olds by region and
race/ethnicity, 2005*
*Preliminary 2005 data
0500
10001500
20002500
30003500
40004500
5000
Black Hispanic White
West
Midwest
South
Northeast
Rate (per 100,000 population)

Male gonorrhea rates for 20-24 year olds by region and
race/ethnicity, 2005*
0
500
1000
1500
2000
2500
3000
3500
4000
Black Hispanic White
West
Midwest
South
Northeast
*Preliminary 2005 data
Rate (per 100,000 population)

A closer look at increases in gonorrhea in the West……..


How to define the area of interest?
States with increases in number of reported gonorrhea cases of >= 25%
from 2000 to 2005
AND
States with at least 500 cases in 2005

States with >25% increase in reported gonorrhea cases
from 2000 to 2005* and > 500 cases in 2005*
Cases 2000
Cases 2005*
2000 to 2005
Utah 231 707 206%Hawaii 483 1,002 107%California 21,595 33,555 55%Washington 2,418 3,697 53%Oregon 1,038 1,559 50%Alaska 361 533 48%Nevada 1,553 2,169 40%
*Preliminary 2005 data, as of Jan 2006

Gonorrhea rates by sex, 7 western states, 2000-2005*
*Preliminary 2005 data for AK, CA, HI, NV, OR, UT, WA
0
20
40
60
80
100
2000 2001 2002 2003 2004 2005
Rat
e pe
r 10
0,00
0
Male Female
+48%
+58%

Gonorrhea rates by age, 7 western states, 2000-2005*
0
50
100
150
200
250
300
350
2000 2001 2002 2003 2004 2005
Rat
e pe
r 10
0,00
0
15-19 20-24 25-29 30-34 35-39 40-44
*Preliminary 2005 data for AK, CA, HI, NV, OR, UT, WA
+71%
+58%
+47%
+39%+49%+69%

Gonorrhea rates by race/ethnicity,
7 western states, 2000-2005*
0
100
200
300
400
500
600
2000 2001 2002 2003 2004 2005
Rat
e pe
r 10
0,00
0
White Black Hispanic Asian/Pac Isl Am Ind/AK Nat
*Preliminary 2005 data for AK, CA, HI, NV, OR, UT, WA
+18%
+61%
+89%+80%+45%

Have providers in the West adopted more sensitive, less
specific, gonorrhea test technology than other
states?
AND/OR
Are providers in the West screening more than in other
states?

Comparison states with greatest number of gonorrhea
cases in 2005*
Cases 2000
Cases 2005*
2000 to 2005
Texas 32,919 24,527 -25%Florida 22,781 19,702 -14%Ohio 19,303 19,356 0%Illinois 20,671 18,711 -9%New York 20,067 17,099 -15%North
Carolina 17,823 14,578 -18%Georgia 20,265 13,987 -31%
*Preliminary 2005 data, as of Jan 2006

Proportion of gonorrhea tested by nucleic acid amplification tests (NAATs), and gonorrhea test
volume, American Public Health Laboratory Survey,2000 and 2004 (N=30 labs)
West*(n=20)
Comparison**(n=10)
% of gonorrhea tested by
NAATs
2000 53% 8%
2004 88% 73%
Gonorrhea test volume
2000 311,603 1,222,248
2004 593,192 1,088,608
*West: AK, CA, NI, NV, OR, UT, WA**Comparison: FL, GA, IL, NY, NC, OH, TX Source: APHL laboratory survey, unpublished data, CDC, 2001 & 2004. Methods published in: Webster Dicker L et al. Laboratory Tests Used in U.S. Public Health Laboratories for STDs, 2000. STD 2004; 31:259-264.

Hypotheses
Artifactual increases Use of more sensitive and less specific
test technology Gonorrhea screening
Increased dual gonorrhea/chlamydia testing
Outreach and screening efforts

Hypotheses, cont.
Real increases due to Increased risk behavior Reduced disease control efforts Increases in resistant gonorrhea Predominance of a more transmissible
or more virulent gonococcal strain

Other analyses
Local in-depth analyses of case report data
Enhanced gonorrhea surveillance Evaluation of laboratory test volume
and positivity Case control study Review of other data sources (DIS
interviews, STD clinics, HMOs)

Summary
National rate remains stable, but still far from HP 2010 goal of 19 per 100,000
Concerning racial disparities for gonorrhea High burden of disease among black
adolescents and young adults in all regions
Large increases in West, unclear cause, further investigation is underway

Current activities
Working with project areas to investigate AND respond to increases in the West
STD Surveillance Network (SSuN) 6 collaborating sites Enhanced gonorrhea surveillance
STD clinics Sample of cases in neighboring counties
Expanded behavioral, clinical, and lab data NEDSS and STD Program Area Module Translation of data into action

Acknowledgements
Statistics and Data Management Branch, Division of STD Prevention, CDC Rob Nelson
Epidemiology and Surveillance Branch, Division of STD Prevention, CDC Katrina Park Hillard Weinstock
The many participants in the “GC in the West” working group
Contact informationLori Newman, MD
Epidemiology and Surveillance BranchDivision of STD Prevention
Centers for Disease Control and PreventionAtlanta, GA
(404) [email protected]
For more information: http://www.cdc.gov/std/Gonorrhea/
The findings and conclusions in this presentation havenot been formally disseminated by the CDC and should not
be construed to represent any agency determination or policy.

Related Documents