Recent Trends for Crude Oil Increasing Supply & Declining Prices Joint Lead Commissioner Workshop on Inputs and Assumptions for Transportation Energy Demand Forecasts March 19, 2015 Gordon Schremp Energy Assessments Division California Energy Commission [email protected] California Energy Commission

Recent Trends for Crude Oil Increasing Supply & Declining Prices Joint Lead Commissioner Workshop on Inputs and Assumptions for Transportation Energy Demand.
Dec 22, 2015
Welcome message from author
This document is posted to help you gain knowledge. Please leave a comment to let me know what you think about it! Share it to your friends and learn new things together.
Transcript
Recent Trends for Crude OilIncreasing Supply & Declining Prices
Joint Lead Commissioner Workshop on Inputsand Assumptions for
Transportation Energy Demand Forecasts
March 19, 2015
Gordon SchrempEnergy Assessments Division
California Energy [email protected]
California Energy Commission
Purpose
• Show the extent of the recent collapse in crude oil prices• Provide an explanation of the factors that may have
contributed to the rapid decline• Illustrate some of the impacts in the United States that are a
consequence of declining oil prices• Provide a description of additional factors that could have an
impact oil prices during the remainder of 2015
3/19/2015 2California Energy Commission

Crude Oil Prices
• Crude oil is an international commodity
• Prices “benchmarked” to specific crude oil types– U.S. – West Texas Intermediate or
WTI– North Sea – Dated Brent or Brent– Middle East – Dubai/Oman
• Adjustments made for:– Sulfur content– Density (API gravity)– Other properties
• Prices steady for several years, through June 2014
3/19/2015 3California Energy Commission

0
20
40
60
80
100
120
140
Jan
Feb
Mar
Ap
r
May
Jun
e
July
Au
g
Sep
t
Oct
No
v
Dec
Dol
lars
Per
Bar
rel
2011 2012
2013 2014
2015
47.2 percent lower than same time last year.
Daily Brent Crude Oil Prices (2011 – 3/12/15)
California Energy Commission
Source: Energy Information Administration & OPIS.
3/19/2015 4
Crude oil prices were remarkably stable between 2011 and June of 2014
30
40
50
60
70
80
90
100
110
120
3/12
/201
4
3/26
/201
4
4/9/
2014
4/23
/201
4
5/7/
2014
5/21
/201
4
6/4/
2014
6/18
/201
4
7/2/
2014
7/16
/201
4
7/30
/201
4
8/13
/201
4
8/27
/201
4
9/10
/201
4
9/24
/201
4
10/8
/201
4
10/2
2/20
14
11/5
/201
4
11/1
9/20
14
12/3
/201
4
12/1
7/20
14
12/3
1/20
14
1/14
/201
5
1/28
/201
5
2/11
/201
5
2/25
/201
5
3/11
/201
5
Dol
lars
Per
Bar
rel
Alaska North Slope Brent North Sea
West Texas Intermediate San Joaquin Valley
Sources: ANS - Alaska Department of Revenue, SJV & Brent - OPIS, WTI - EIA.
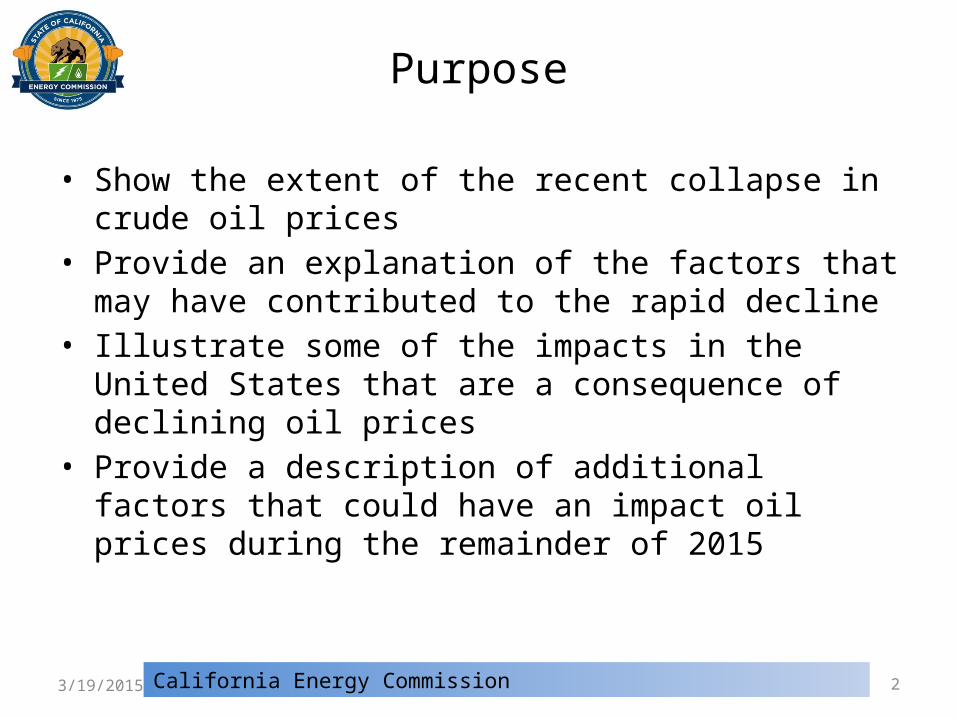
Crude Oil Prices – West Coast, Brent & WTI
California Energy Commission3/19/2015 5

Steep Price Decline
• Crude oil prices peaked during June of 2014– June 19, 2014 – Brent - $115.06 per barrel– June 20, 2014 – Alaska North Slope (ANS) - $114.51 per barrel– June 20, 2014 – WTI - $107.95 per barrel– June 24, 2014 – San Joaquin Valley (SJV) - $99.65 per barrel
• Prices dropped at least 50 percent within 7 months– Brent down 59.5 percent to $46.59 on 1/13/15– ANS down 60.6 percent to $45.10 on 1/28/15– WTI down 59.2 percent to $44.08 on 1/28/15– SJV down 68.7 percent to $31.14 on 1/21/15
• Prices have since rebounded a bit before easing back down
3/19/2015 6California Energy Commission

Factors Associated with Oil Price Collapse
• Less robust global demand growth• Rising domestic & global production• Growing crude oil supply imbalance• OPEC cannot agree to cut output• Export restrictions• Inventory levels rise• Currency markets
3/19/2015 7California Energy Commission
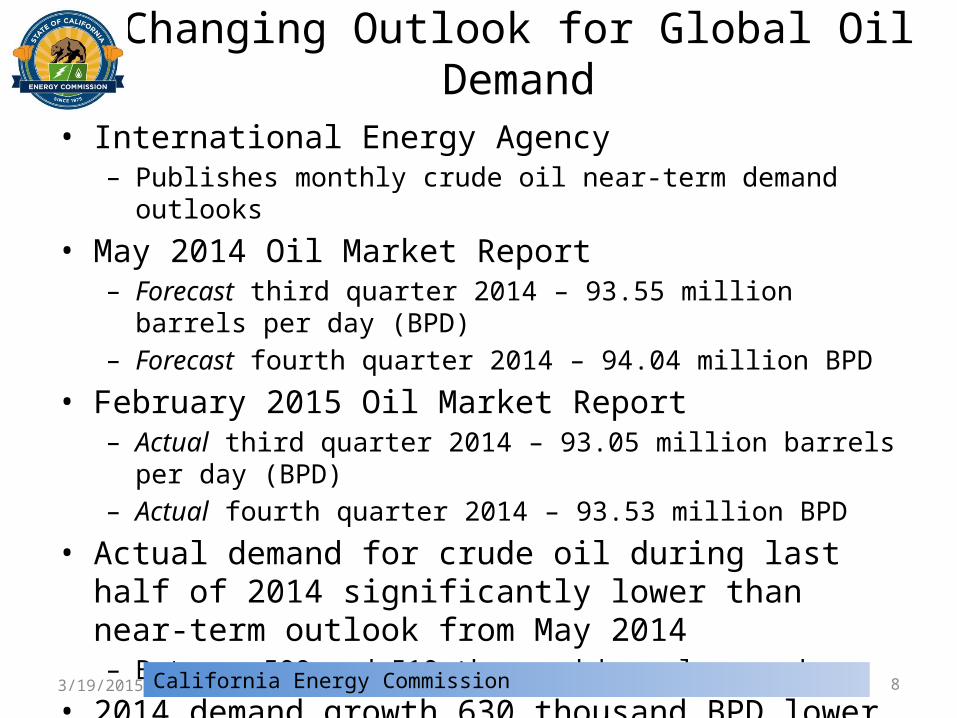
Changing Outlook for Global Oil Demand
• International Energy Agency– Publishes monthly crude oil near-term demand outlooks
• May 2014 Oil Market Report– Forecast third quarter 2014 – 93.55 million barrels per day (BPD)– Forecast fourth quarter 2014 – 94.04 million BPD
• February 2015 Oil Market Report– Actual third quarter 2014 – 93.05 million barrels per day (BPD)– Actual fourth quarter 2014 – 93.53 million BPD
• Actual demand for crude oil during last half of 2014 significantly lower than near-term outlook from May 2014– Between 500 and 510 thousand barrels per day
• 2014 demand growth 630 thousand BPD lower than 2013
3/19/2015 8California Energy Commission
California Energy Commission
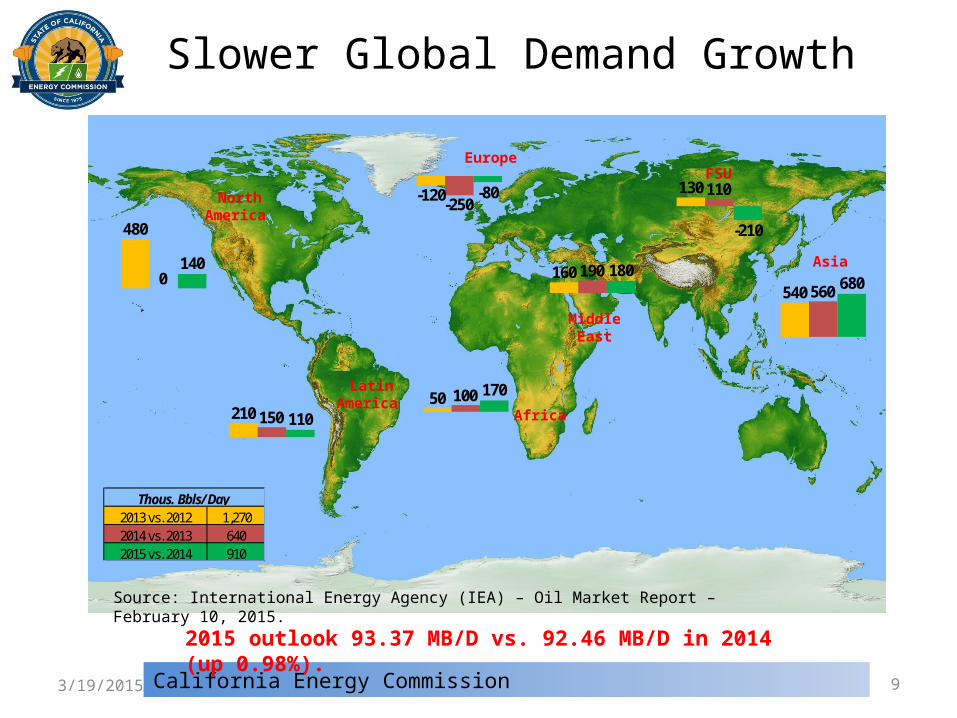
Slower Global Demand Growth
Source: International Energy Agency (IEA) – Oil Market Report – February 10, 2015.
3/19/2015 9
2015 outlook 93.37 MB/D vs. 92.46 MB/D in 2014 (up 0.98%).
Latin America
North America
Africa
Europe FSU
Asia
Middle East
480
0140
540 560 680160 190 180
210 150 110
130 110
-210
50 100 170
-120-250-80
2013 vs. 2012 1,2702014 vs. 2013 6402015 vs. 2014 910
Thous. Bbls/Day

1,314,727
1,715,878
1,929,450
0
500,000
1,000,000
1,500,000
2,000,000
2,500,000
Jan-
07
May
-07
Sep-
07
Jan-
08
May
-08
Sep-
08
Jan-
09
May
-09
Sep-
09
Jan-
10
May
-10
Sep-
10
Jan-
11
May
-11
Sep-
11
Jan-
12
May
-12
Sep-
12
Jan-
13
May
-13
Sep-
13
Jan-
14
May
-14
Sep-
14
Jan-
15
Barr
els
Per D
ay
Bakken Eagle FordPermian
Source: EIA Drilling Productivity Report
U.S. Tight Oil Production – Jan. ’07-Feb. ‘15
California Energy Commission3/19/2015 10
Ghawar (Saudi Arabia) – Peak 5.0 MM BPD in 2005, now 4.5 MM BPD Samotlor (Russia) – Peak 3.0 MM BPD in 1980, now 0.84 MM BPD Burgan (Kuwait) – Peak 2.4 MM BPD in 1972, now 1.7 MM BPD Cantarell (Mexico) – Peak 2.1 MM BPD in 2003, now 0.41 MM BPD Rumaila (Iraq) – Peak 1.6 MM BPD in 1980, now 1.3 MM BPD Safaniya (Saudi Arabia) – Peak 1.5 MM BPD in 1990s, now 1.2 MM BPD Kirkuk (Iraq) – Peak 1.2 MM BPD in 1980, now 0.23 MM BPD Daqing (China) – Peak 1.1 MM BPD in 1997, now 0.75 MM BPD
3 U.S. fields each exceed 1 million barrels per dayCombined 4.96 million barrels per day.
0
1,000
2,000
3,000
4,000
5,000
6,000
7,000
8,000
9,000
10,000
Jan-
1981
Dec
-198
1
Nov
-198
2
Oct
-198
3
Sep-
1984
Aug-
1985
Jul-1
986
Jun-
1987
May
-198
8
Apr-
1989
Mar
-199
0
Feb-
1991
Jan-
1992
Dec
-199
2
Nov
-199
3
Oct
-199
4
Sep-
1995
Aug-
1996
Jul-1
997
Jun-
1998
May
-199
9
Apr-
2000
Mar
-200
1
Feb-
2002
Jan-
2003
Dec
-200
3
Nov
-200
4
Oct
-200
5
Sep-
2006
Aug-
2007
Jul-2
008
Jun-
2009
May
-201
0
Apr-
2011
Mar
-201
2
Feb-
2013
Jan-
2014
Dec
-201
4
Thou
sand
s of
Bar
rels
Per
Day
US Crude Oil Production Alaska
North Dakota Texas
California + OCS Rest of US
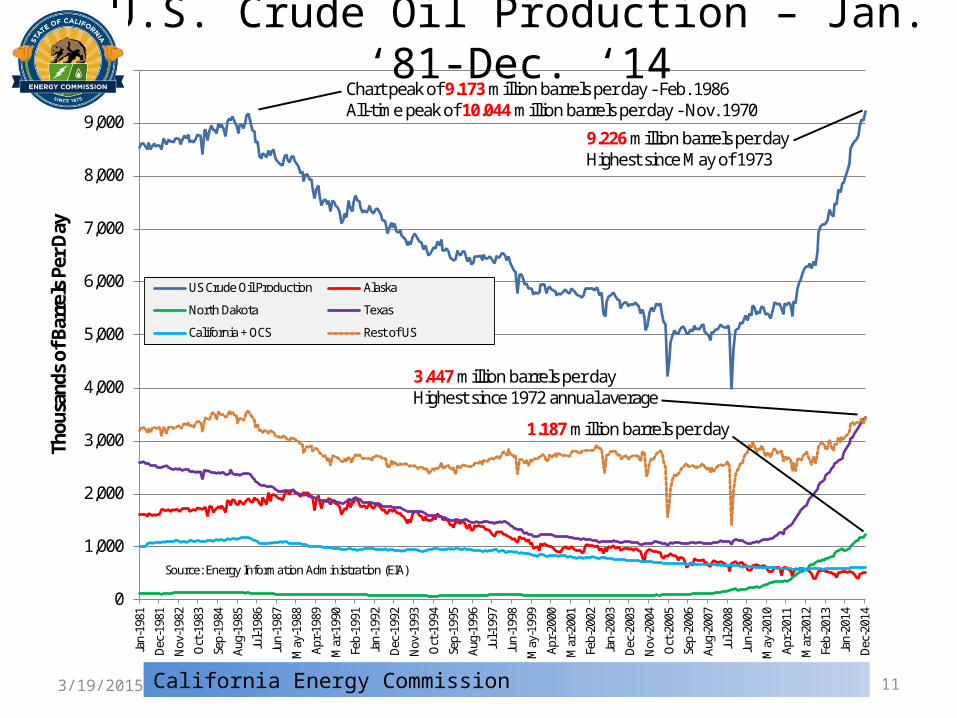
Source: Energy Information Administration (EIA)
9.226 million barrels per dayHighest since May of 1973
3.447 million barrels per dayHighest since 1972 annual average
Chart peak of 9.173 million barrels per day - Feb. 1986All-time peak of 10.044 million barrels per day - Nov. 1970
1.187 million barrels per day
U.S. Crude Oil Production – Jan. ‘81-Dec. ‘14
California Energy Commission3/19/2015 11

2,349
991
608
-5 -120
-500
0
500
1,000
1,500
2,000
2,500
Texas North Dakota Rest of U.S. California Alaska
Thou
sand
s of
Bar
rels
Per
Day
Change in Crude Oil ProductionJanuary 2010 vs. December 2014
Source: Energy Information Administration (EIA)
U.S. crude oil production has increased from 5.403 million barrels per day in January 2010 to 9.226 million barrels per day during December 2014
California Energy Commission3/19/2015 12

California Energy Commission3/19/2015 13
863 838
3,220
-838
366
-599
741
-291
621
341
-629
713
209
-395 -100
219
-832-689
259
546
-123
-1,500
-1,000
-500
0
500
1,000
1,500
2,000
2,500
3,000
3,500
Saud
i Ara
bia
Russ
ian
Fede
ratio
n US
Iran
Chin
a
Vene
zuel
a
Cana
da
Mex
ico
Uni
ted
Arab
Em
irat
es
Kuw
ait
Nor
way
Iraq
Nig
eria
Alge
ria
Ango
la
Braz
il
Liby
a
Uni
ted
King
dom
Kaza
khst
an
Qat
ar
Indo
nesi
a
Thou
sand
s of
Bar
rels
Per
Day
Sources: 2014 BP Statistical Review and Energy Commission Analysis
Global Crude Oil Production Change2013 vs. 2008
U.S. increase greater than combined production growth from Saudi Arabia, Russia, Canada and Iraq.

-0.05 -0.07
-0.76
-0.94
0.34
1.24
0.85
0.77
-1.5
-1.0
-0.5
0.0
0.5
1.0
1.5
88
89
90
91
92
93
94
95
1Q 2
013
2Q 2
013
3Q 2
013
4Q 2
013
1Q 2
014
2Q 2
014
3Q 2
014
4Q 2
014
Mill
ions
of B
arre
ls P
er D
ay
Mill
ions
of B
arre
ls P
er D
ay
Axis Title
Supply
Demand
Supply Imbalance
Source: California Energy Commission analysis of IEA data.
California Energy Commission3/19/2015 14
Growing Global Crude Supply ImbalanceExcess global crude oil supplies during all of 2014.

OPEC Cannot Agree to Cut Output
• Organization of Petroleum Exporting Countries met on November 27, 2014
• No consensus on reducing country-specific production quotas
• Saudi Arabia unwilling to disproportionately lose market share so other member countries benefit from firming prices
• OPEC unable to convince other non-OPEC exporting countries to cooperate, such as Russia
3/19/2015 15California Energy Commission
Source: David Butler, Boston Globe.
Source: Heinz- Peter Bader, Reuters.

Crude Oil – Export Restrictions
3/19/2015 16California Energy Commission
• Domestically produced crude oil exports to foreign destinations allowed ‐under specific "license exceptions" identified under federal statute - primary exceptions include:
• Alaska crude oil shipped on the Trans Alaska Pipeline System (TAPS) and ‐exported via a Jones Act vessel directly from Valdez Harbor
• California heavy crude oil production with API gravity of 20.0 degrees or lower, limit of no more than 25,000 barrels per day
• First export license for California heavy crude oil was granted on December 9, 1991 – no heavy crude oil exports for several years
• Exports of domestic crude oil to Canada for processing by Canadian refineries• Exports in connection with refining or exchange of Strategic Petroleum
Reserve crude oil• Companies can also apply to the federal Bureau of Industry and Security
(BIS) for an export license that basically requires Presidential approval
Recent export licenses for “processed” condensate approved.

California Energy Commission
Crude Oil – Inventory Rising
U.S. crude oil inventories at 448.9 million barrels as of 3/6/15 • Highest level since November of 1930
• 78.9 million barrels more than same time last year
• Record level of 545.186 million barrels during October 1929
3/19/2015 17
Source: Energy Information Administration, This Week in Petroleum.

Crude Oil Futures Outlook
• Crude oil futures markets are now in contango, rising over time
• Price rise could be sufficient to cover expense of temporarily storing crude oil, an incentive for elevated stock levels
3/19/2015 18California Energy Commission
Source: Howard Weil Weekly Refinery Update 3/11/15.

California Energy Commission
Crude Oil & Currency Markets
• Declining US dollar would increase purchasing power for non-dollar importers – Japan and India – increasing demand & oil price
• Strengthening dollar would have the opposite impact – declining demand & lower oil price
• Negative correlation between crude oil prices & US Dollar exchange rate– Dollar strengthens, crude oil prices
decline– Dollar weakens, crude oil prices rise
• But this relationship only a recent phenomenon– Little to no correlation prior to 2001
• What might be at work?
3/19/2015 19
California Energy Commission
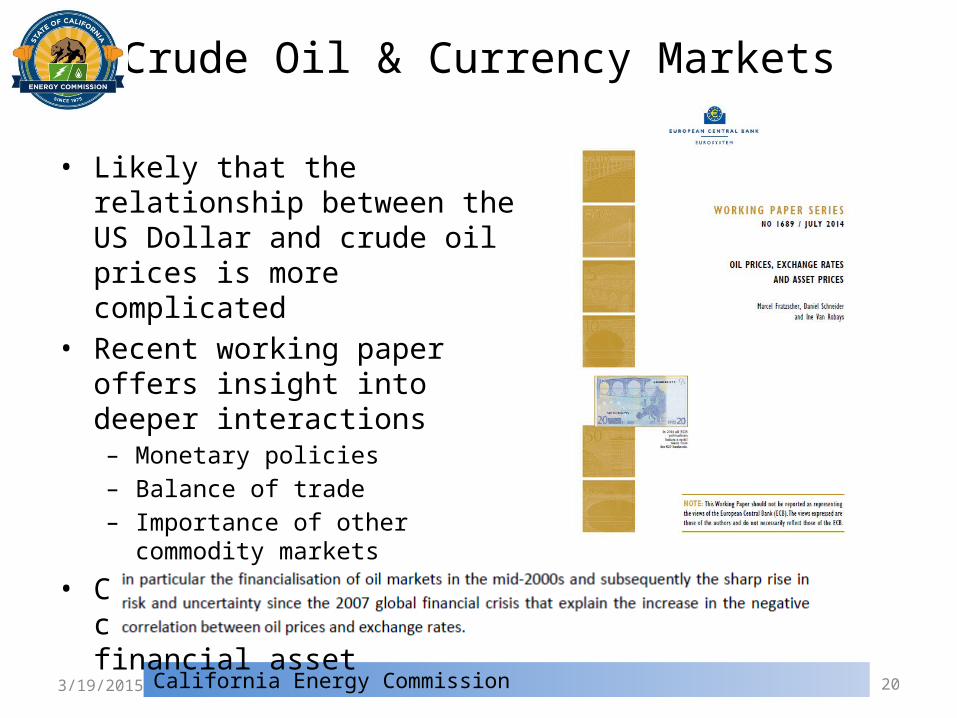
Crude Oil & Currency Markets
• Likely that the relationship between the US Dollar and crude oil prices is more complicated
• Recent working paper offers insight into deeper interactions– Monetary policies– Balance of trade– Importance of other commodity
markets
• Crude oil price behavior could be more akin to a financial asset
3/19/2015 20

Impacts of Increased U.S. Crude Oil Output & Declining Global Prices
• U.S. crude oil imports drop off• Drilling activity for crude oil declines
3/19/2015 21California Energy Commission

3,696
2,678
0
500
1,000
1,500
2,000
2,500
3,000
3,500
4,000
1910
1914
1918
1922
1926
1930
1934
1938
1942
1946
1950
1954
1958
1962
1966
1970
1974
1978
1982
1986
1990
1994
1998
2002
2006
2010
2014
Mill
ions
of B
arre
ls
Source: Energy Information Administration.
U.S. Imports of Crude Oil Decline
California Energy Commission3/19/2015 22
Source: Energy Information Administration, This Week in Petroleum.
2014 oil imports 2.79 million BPD lower than 2005 peak of 10.13 million BPD.

179
1,609
866
0
200
400
600
800
1,000
1,200
1,400
1,600
1,800
7/17
/198
73/
18/1
988
11/1
8/19
887/
21/1
989
3/23
/199
011
/23/
1990
7/26
/199
13/
27/1
992
11/2
7/19
927/
30/1
993
3/31
/199
412
/02/
1994
8/04
/199
54/
05/1
996
12/0
6/19
968/
08/1
997
4/10
/199
812
/11/
1998
8/13
/199
94/
08/2
000
12/1
5/20
008/
17/2
001
4/19
/200
212
/20/
2002
8/22
/200
34/
23/2
004
12/2
3/20
048/
26/2
005
4/28
/200
612
/29/
2006
8/31
/200
75/
02/2
008
1/02
/200
99/
04/2
009
5/07
/201
01/
07/2
011
9/09
/201
15/
11/2
012
1/11
/201
39/
13/2
013
5/16
/201
41/
16/2
015
Drill Rig Deployment Declines with Price
California Energy Commission3/19/2015 23
Source: Baker Hughes data – through March 13, 2015.
Number of rigs deployed specifically for U.S. oil drilling 46.2 percent lower than the peak level on October 10, 2014
Gradual impact on oil production likely to manifest itself over the next several months
Biggest drops in Permian (-255), Williston (-90), and Eagle Ford (-75) basins

Other Factors that Could Impact Near-term Oil Prices
• Seasonal increase for global crude oil demand• Increased exports from countries experiencing difficulties
– Libyan violence has reduced oil export capability
• U.S. crude oil storage capacity has limits
3/19/2015 24California Energy Commission

90.691.3
92.6 92.891.7 91.6
93.193.5
92.6 92.5
94.094.5
83.985.2
86.4 86.1 85.5
88.389.1
90.691.8
92.593.4
75
80
85
90
95
100
1Q 2
013
2Q 2
013
3Q 2
013
4Q 2
013
1Q 2
014
2Q 2
014
3Q 2
014
4Q 2
014
1Q 2
015
2Q 2
015
3Q 2
015
4Q 2
015
2005
2006
2007
2008
2009
2010
2011
2012
2013
2014
2015
Mill
ions
of B
arre
ls P
er D
ay
Quarterly Oil Demand - World
California Energy Commission
Source: IEA – Oil Market Report – February 10, 2015.
3/19/2015 25
Near-term Factors – Seasonal Demand
• Crude oil demand is seasonal• Demand normally rises during
last two quarters of each year– 1st Q refinery maintenance– 4th Q global heating demand
• IEA forecast for 2015– Global demand for crude oil forecast
to increase by 2.0 million barrels per day between 2nd and 4th quarters of 2015
• Normal seasonal trend will likely put upward pressure on oil prices during last half of 2015

23.123.2
23.7 23.7
23.223.0
23.6
23.9
23.523.3
23.723.9
25.5 25.4 25.5
24.2
23.3
23.523.3
23.0
23.4 23.423.6
21.5
22.0
22.5
23.0
23.5
24.0
24.5
25.0
25.5
26.0
1Q 2
013
2Q 2
013
3Q 2
013
4Q 2
013
1Q 2
014
2Q 2
014
3Q 2
014
4Q 2
014
1Q 2
015
2Q 2
015
3Q 2
015
4Q 2
015
2005
2006
2007
2008
2009
2010
2011
2012
2013
2014
2015
Mill
ions
of B
arre
ls P
er D
ayQuarterly Oil Demand - North America
United States 19.21
California Energy Commission
Source: IEA – Oil Market Report – February 10, 2015.
3/19/2015 26
About 31 percent of this seasonal rise will come from North America – 620 thousand barrels per day.
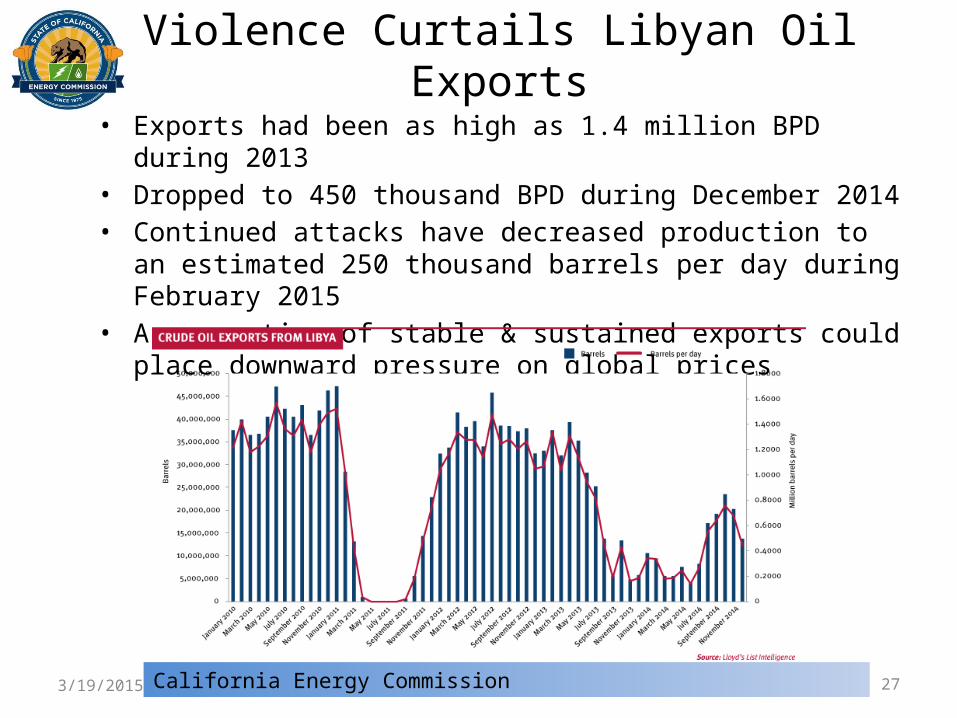
Violence Curtails Libyan Oil Exports• Exports had been as high as 1.4 million BPD during 2013• Dropped to 450 thousand BPD during December 2014• Continued attacks have decreased production to an estimated 250
thousand barrels per day during February 2015• A resumption of stable & sustained exports could place downward
pressure on global prices
3/19/2015 27California Energy Commission

U.S. Crude Oil Storage Has Limits
• Spare working storage capacity for crude oil estimated to be:– 54.0 percent for end of September 2014 – 40.0 percent for the week ending February 20, 2015 (see chart above)– 37.2 percent for the week ending March 6, 2015
• Decreasing spare storage capacity could place downward pressure on crude oil prices
3/19/2015 28California Energy Commission

Additional Q & A
California Energy Commission3/19/2015 29
Related Documents