Dear Readers, We are honored to present our new scientific book entitled “Recent Researches in Engineering Studies/2021” to you. This technical book covers recent selected studies in 2021 related to engineering numerical simulations and experiments. We believe that this reports will help young academicians and lead to further studies. In this book, we aimed to bring respected researchers overall the world and to share their recent researchers with the literature. Also, it is aimed to provide a fundamental reference source for administrative and technical personnel working at the research centre, universities and different technical sector. This work includes different scientific researchers, design and practical applications, is also a base work published in english for researchers and academicians who study in engineering fields and want to specialize in this field. The resulting work is also part of a common library pool for the international digital library, universities library, companies and its business partners and other industry stakeholders where they can always refer to technical knowledge. This fundamental work on different engineering fields is the first part of our work for the first quarter of 2021 and will continue to develop with the support of you, as our readers, with new editions and chapters. In order for our work to become widespread, it will be highly honored for you to announce to your surroundings and to convey your opinions and thoughts to us. As editor and authors of this book, we would like to send our warmest greetings to all of you and looking forward to having your contributions to future publications, pandemic- free and peaceful word. With warm regards,

Welcome message from author
This document is posted to help you gain knowledge. Please leave a comment to let me know what you think about it! Share it to your friends and learn new things together.
Transcript

livredelyon.com
livredelyon
livredelyon
livredelyon
Recent Researchesin
ENGINEERING SCIENCES
2021
Assoc. Prof. Dr. Hasan KOTENEditor
Engineering Sciences
RECENT RESEARCHES IN ENGINEERING SCIENCES
Dear Readers,
We are honored to present our new scientific book entitled “Recent Researches in Engineering Studies/2021” to you. This technical book covers recent selected studies in 2021 related to engineering numerical simulations and experiments. We believe that this reports will help young academicians and lead to further studies. In this book, we aimed to bring respected researchers overall the world and to share their recent researchers with the literature. Also, it is aimed to provide a fundamental reference source for administrative and technical personnel working at the research centre, universities and different technical sector. This work includes different scientific researchers, design and practical applications, is also a base work published in english for researchers and academicians who study in engineering fields and want to specialize in this field. The resulting work is also part of a common library pool for the international digital library, universities library, companies and its business partners and other industry stakeholders where they can always refer to technical knowledge. This fundamental work on different engineering fields is the first part of our work for the first quarter of 2021 and will continue to develop with the support of you, as our readers, with new editions and chapters. In order for our work to become widespread, it will be highly honored for you to announce to your surroundings and to convey your opinions and thoughts to us. As editor and authors of this book, we would like to send our warmest greetings to all of you and looking forward to having your contributions to future publications, pandemic-free and peaceful word.
With warm regards,

Recent Researches in
ENGINEERING SCIENCES
EditorAssoc. Prof. Dr. Hasan KOTEN
Lyon 2021

Editor • Assoc. Prof. Dr. Hasan KOTEN • ORCID: 0000-0002-1907-9420Cover Design • Mirajul KayalLayout • Mirajul KayalFirst Published • May 2021, Lyon
ISBN: 978-2-38236-155-9
Copyright © 2021 by Livre de LyonAll rights reserved. No part of this publication may be reproduced, stored in a retrieval system, or transmitted in any form or by an means, electronic, mechanical, photocopying, recording, or otherwise, without prior written permission from the the Publisher.
Publisher • Livre de LyonAddress • 37 rue marietton, 69009, Lyon Francewebsite • http://www.livredelyon.come-mail • [email protected]

I
PREFACE
Dear Readers,We are honored to present our new scientific book entitled “Recent
Researches in Engineering Sciences - 2021” to you. In this book, we aimed to bring respected researchers overall the world and to share their recent researchers with the literature. Also, it is aimed to provide a fundamental reference source for administrative and technical personnel working at the research centre, universities and different technical sector. This work includes different scientific researchers, design and practical applications, is also a base work published in english for researchers and academicians who study in engineering fields and want to specialize in this field. The resulting work is also part of a common library pool for the international digital library, universities library, companies and its business partners and other industry stakeholders where they can always refer to technical knowledge. This fundamental work on different engineering fields is the first part of our work for the first quarter of 2021 and will continue to develop with the support of you, as our readers, with new editions and chapters. In order for our work to become widespread, it will be highly honored for you to announce to your surroundings and to convey your opinions and thoughts to us. As editor and authors of this book, we would like to send our warmest greetings to all of you and looking forward to having your future contribution to the future publications, pandemic-free and peaceful word. (1st May 2021, Istanbul)
With warm regards,
Assoc. Prof. Dr. Hasan KÖTEN Head of Mechanical Engineering Department
Istanbul Medeniyet University TURKEY
E-mail: [email protected]


III
ContEnts
Preface IChapter 1 1
Chapter 2 20
Chapter 3 52
Chapter 4 63
Chapter 5 79
Chapter 6 106
Chapter 7
122
Chapter 8 136
Chapter 9
Phase Change Materials (Pcm) And Their Applications
Examination of Usage of Natural Gas/Diesel Dual Fuels in Series-Driven Hybrid Vehicles
Critical Velocity for Flow-Induced Instability in Pipes – A Simulation Approach
A Look Over the Acoustic Silencer & Muffler Studies
Traffic-Induced Road Noise Reduction: A Case Study in Izmir
Methane Emission Modeling Technics
Some Reliability Significance Measures and a Numerical Application for These Importance Measures
Investigation of the Usage of Organic Rankine Cycle in Internal Combustion Engines
The Effect of Using Metallic Nanoparticles as Coolant in Tractor and Construction Machinery Engines on Performance and Emissions 158


1
C H A P T E R 1
PHAsE CHAnGE MAtERIALs (PCM) AnD tHEIR APPLICAtIons
Bilal ANWAR1 & Muhammad Adnan Aslam NOON2
Hasan KOTEN3
1(Mr) International Islamic University, PakistanE-mail: [email protected]
Orcid: 0000-0002-9147-9787
2(Assist. Prof. Dr.) International Islamic University, PakistanE-mail: [email protected]
Orcid: 0000-0002-0986-1312
3(Assoc. Prof. Dr.) Istanbul Medeniyet University, Department of Mechanical Engineering, Kadikoy, Istanbul.
E-mail: [email protected] Orcid: 0000-0002-1907-9420
1. Introduction
Energy has played a vital role role in emerging technology. It has also helped in saving the many natural resources. But with the passage of time, the demand of energy has become more. The methods of
saving energy has been developing such as solar energy and hydro energy storage etc.
The solar is further developed into solar thermal and solar phtovoltaic and hydro energy is also advanced to meet the current energy need of the world. But the availibilty of the solar energy for only some specicfic hours complled researcher towars energy storage and there is always dream of finding new methods for storing the energy. One of the best methods for energy storage is thermal energy storage by Phase Change Material (PCM). These materials have been studied since several decads and a lot of research has been done on it.

2 ¨ ¨ PHAsE CHAnGE MAtERIALs (PCM) AnD tHEIR APPLICAtIons
Abhat worked on thermal energy storage (TES), thermal energy conduction and application of PCM(Abhat, 1983). In 2003, Zalba wrote about substances used for TES and classified the substances as shown in figure below.
Figure 1 Classification of Thermal Energy Storage SystemComparison of laten energy stored by PCM with other substances is given in the following figuure(Nazir et al., 2019).
Figure 2 Comparison of laten energy stored by PCM with other substances
Recent Researches in EnGInEERInG sCIEnCEs ¨ ¨ 3
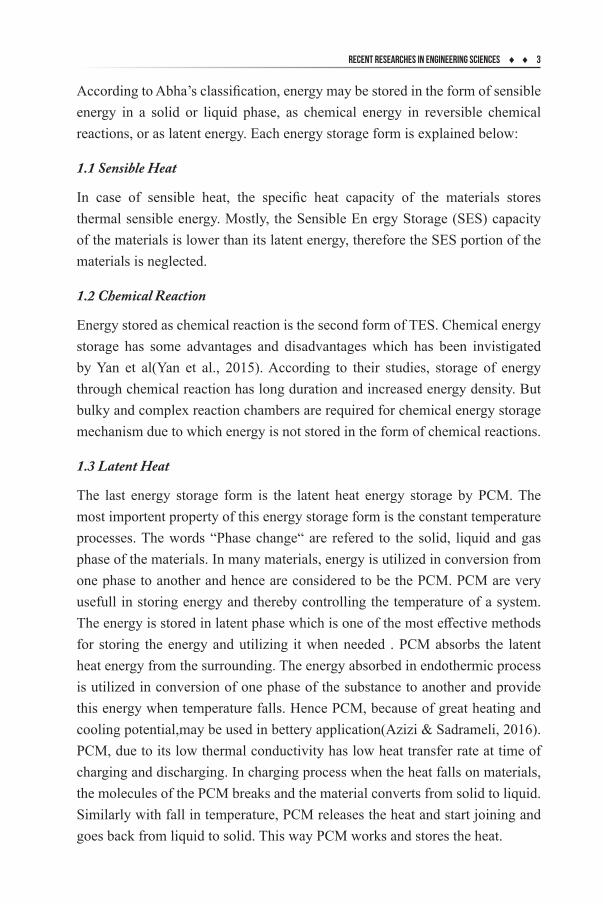
According to Abha’s classification, energy may be stored in the form of sensible energy in a solid or liquid phase, as chemical energy in reversible chemical reactions, or as latent energy. Each energy storage form is explained below:
1.1 Sensible Heat
In case of sensible heat, the specific heat capacity of the materials stores thermal sensible energy. Mostly, the Sensible En ergy Storage (SES) capacity of the materials is lower than its latent energy, therefore the SES portion of the materials is neglected.
1.2 Chemical Reaction
Energy stored as chemical reaction is the second form of TES. Chemical energy storage has some advantages and disadvantages which has been invistigated by Yan et al(Yan et al., 2015). According to their studies, storage of energy through chemical reaction has long duration and increased energy density. But bulky and complex reaction chambers are required for chemical energy storage mechanism due to which energy is not stored in the form of chemical reactions.
1.3 Latent Heat
The last energy storage form is the latent heat energy storage by PCM. The most importent property of this energy storage form is the constant temperature processes. The words “Phase change“ are refered to the solid, liquid and gas phase of the materials. In many materials, energy is utilized in conversion from one phase to another and hence are considered to be the PCM. PCM are very usefull in storing energy and thereby controlling the temperature of a system. The energy is stored in latent phase which is one of the most effective methods for storing the energy and utilizing it when needed . PCM absorbs the latent heat energy from the surrounding. The energy absorbed in endothermic process is utilized in conversion of one phase of the substance to another and provide this energy when temperature falls. Hence PCM, because of great heating and cooling potential,may be used in bettery application(Azizi & Sadrameli, 2016). PCM, due to its low thermal conductivity has low heat transfer rate at time of charging and discharging. In charging process when the heat falls on materials, the molecules of the PCM breaks and the material converts from solid to liquid. Similarly with fall in temperature, PCM releases the heat and start joining and goes back from liquid to solid. This way PCM works and stores the heat.

4 ¨ ¨ PHAsE CHAnGE MAtERIALs (PCM) AnD tHEIR APPLICAtIons
2. Types of PCMPCM haves intensity variation charecterisitics for working in different environmental conditions. PCM selection is based on the melting point, heat stoaging capacity, heat density, durability and heat transfer rate of the materials. PCM research is continued from several decades and a number of PCMs Such as organic, non-organic compounds, polymers and hydrated salts has been discoverd till date. PCM based on temperature and physical states are divided into verious types.
2.1 Classification Of PCM Based On Temperature
Classification of PCM Based on Temperature is Given Below(Ghoghaei et al., 2020).
Table 1. PCM temperature-based classificationLow temperature PCM Here transition temperature is < 15 °C. These are mainly
used in air refrigeration systems.Medium temperature PCM
Here temperature ranges from 15 to 90°C. These PCM are mainly used in medical, textile and electronic industries.
High temperature PCM These PCMs are applied in temperature < 90 °C such as, cooking, aerospace industry etc.
2.2 Classification Of PCM Based On Physical state of Materials
Classification of PCM Based On physical state Is Given Below
Table 2. PCM division based on physical state(Patel et al., 2017).Physical State Properties
Gas-liquid Here liquid to gas and vice versa conversion of PCM take place. This system has higher magnitude of latent energy than Solid-liquid. The system, because of volumetric expansion is less practical.
Solid-solid Here phase of PCM is not changed. Only the crystalline form of PCM is changed
Solid gas These PCM need high latent energy. Hence limited in application.
Solid-liquid Here phase of PCM is changed from solid to liquid and vice versa and is the most widely used system.

Recent Researches in EnGInEERInG sCIEnCEs ¨ ¨ 5
2.3 Classifi cation Of PCM Based On Chemical Nature of PCM:
PCM are divided as follows:
Figure 3 PCM Classifi cationEach of them is explained below:
2.3.1 Organic
Organic PCM are further divided into:a) Paraffi ns Paraffi nes are long alkane chain mixture with general formula of
CH CH CH3 2 3( )n . Here n is the number of alkane chains. The melting
temperature point of paraffi nes is inversely proportional to the chain length. The main disadvantage of the paraffi nes is its low thermal conductivity of 0.2 W/m.K(Zhong et al., 2012).
Figure 4 Paraffi ne

6 ¨ ¨ PHAsE CHAnGE MAtERIALs (PCM) AnD tHEIR APPLICAtIons
b) Fatty acids Fatty acids have general formula of CH CH COOH
3 2( )n with n is the num-ber of alkane chains. Their main difference of fatty acids from paraffines is its high cyclic stabilization. Their temperature range is from 20 to 30 °C.
Figure 5 Fatty acid PCM c) Non-paraffines These are PCM other than paraffines and fatty acids.
2.3.2 Properties of Organic PCM
Properties of organic PCM are explained below.a) They are stable and have latent heat of fusion > 180 kj/kg (Patel et al., 2017). b) Temperature range is from 15 to 45°C. Therefore these materials are com-
patible with building materials(Souayfane et al., 2016). c) These are flammable in nature.d) Example: Paraffins, waxes and fitty acids.
2.3.3 Inorganic PCM
These materials are made of inorganic molecules and are divided into the following two types.a) Hydrated salt PCM These are the combination of salt and water. These materials are consid-
ered to be the oldest and the best TES PCM due to wide thermal range from 5 to 130 °C. Examples of hydrated salt PCM is disodium hydrogen phosphate dodecahydrate and sodium sulphate decahydrate. These PCM are also subjected to corrosion and segregation.

Recent Researches in EnGInEERInG sCIEnCEs ¨ ¨ 7
Figure 6 Hydrated salt PCMb) Metallic PCM These are PCM with superior thermal conductivity of 15W/m.K(Li et al.,
2014). Their specific speed is 185kj/kg(Mills et al., 2006). The only dis-advantage of these PCM is their high cost. Zhanga et al. done the experi-mental and numerical analyses of a metallic PCM made of paraffines and copper(Javadi et al., 2020). According to him, only minor temperature dif-ference exists between the materials after melting.
Figure 7 Metalic PCM

8 ¨ ¨ PHAsE CHAnGE MAtERIALs (PCM) AnD tHEIR APPLICAtIons
2.3.4 Properties of inorganic PCM
Properties of inorganic PCM are explained below.
a) These materials have high melting temperature ranging from 5 to 130 °C.
b) Here phase of PCM is not changed. Only the crystalline form of PCM is changed.
c) Their long-term stability at elevated temperature is insufficient. The insta-bility is due to materials thermal cycling and corrosion of container keep-ing the PCM.
d) There latent heat is > 220 220 kJ/kg(Jaguemont et al., 2018).
Figure 8 Inorganic PCM
2.3.5 Eutectic PCM
These are mixture of organic and inorganic PCM in specific ratio. The ratio of PCM is selected in such a way that the mixture melts as a whole. Here PCM of desired characteristics can be produced by changing the compounds and their ratio.

Recent Researches in EnGInEERInG sCIEnCEs ¨ ¨ 9
3. Applications of PCMPCM are used as energy storage materials in many applications suuch as cooking, building temperature controlling, liquid carrying pipes temperature controlling etc. Some of their applications are explained below:
3.1 PCM Application in Cooking
Energy crisis are rising day by day and everybody is thinking to resolve these emergencies. The straight promising way to combat energy shortage is to improve the use of PCM in industrialized and business sectors. Solar cooking method is energy proficient and atmosphere friendly, having no emanation of Chlorofloro Carbon “CFC”. Passing on an estimation by means of TES from solar system through PCM, the power consumption can be decreased by 30%(Mawire et al., 2020). It gives us a cleaner, drier, more comfortable environment with no fuel consumption or no electricity. The difficulty of energy storage throuugh PCM from solar system is that it’s only working on the sunlight hours’ when the light reach to its peak and cannot be used in the absence of light. The main purpose of the study is to make the solar energy able to be used at the night time when the sunlight is not present. This is achievable only when we store the heat and then use this heat for cooking and heating purposes. So various compositions are made for heat storage and one among them is called solar heat cell. This is a special cell and is explained below in detail.
3.1.1 Solar heat cell
This cell is able to store heat during sunlight hours (called charging of cell) and provides heat during nighttime (called discharging of cell). This cell contains special chemicals called phase change materials. These materials have the ability to store heat energy for a long time and provide heat when needed. These materials have high melting point of about 217 degree centigrade. The cell is placed in specially designed parabolic structure for charging. This structure focuses light on cell. When temperature of the materials reach to its melting point, the materials melts and its phase changes from solid to liquid form. Here cell stores latent energy. When cell is fully charged, it is removed from the parabolic collector trough. Now this heat will be stored in the cell for 8 hours. When the cell is used for cooking the temperature of cell decreases and the state of materials changes from liquid to solid again. Consequently, upon charging,

10 ¨ ¨ PHAsE CHAnGE MAtERIALs (PCM) AnD tHEIR APPLICAtIons
the state of materials is changed from solid to liquid and vice versa. Energy stored in the cell is used for cooking and heating.
Figure 9 Solar CellMoreover some smaller cells are also available which are placed in stove after charging for cooking. The charging mechanism of the PCM is shown in the following figure.
Figure 9 Solar Stove

Recent Researches in EnGInEERInG sCIEnCEs ¨ ¨ 11
The charging mechanism of the PCM is shown in the following figure.
Figure 10 PCM Charging Mechanism
In-organic mixture of KNO3 and NaNO3, having the potential for energy storage is selected as PCM in the ratio of 40 to 60% respectively(Liu et al., 2012). The mixture of KNO3 and NaNO3 has a melting point of 220°C(Roget et al., 2013). Latent heat energy can be stored at nearly isothermal conditions and over a narrow range of temperature.
Q mC dT ma H mC dTT
T
p m mT
T
p
i
m
m
f
= + +ò òD (1)
Sensible heat energy is stored by increasing the temperature of PCM.
Q mC dT mc T TT
T
p p f i
i
f
= = -ò ( ) (2)
Mixture of KNO3 and NaNO3 can store both sensible and latent heat energy(Singh et al., 2016). Initially, the temperature of the mixture increases and store sensible

12 ¨ ¨ PHAsE CHAnGE MAtERIALs (PCM) AnD tHEIR APPLICAtIons
heat energy. After some time, the temperature remains constant and only state of the mixture changes from solid to liquid. Here mixture of PCM stores latent heat energy.
Figure 11 Thermal energy- Temperature Graph
3.2 PCM Application In Heat Load Control Of Buildings
Energy demand has increased extraordinarily in last few decades, especially in building sector around the world. The key use of energy in this sector involves space heating and cooling. Therefore, there is need to reduce the demand of conventional resources for thermal comfort in view of their rapid depletion along with severe environmental issues causing global warming. In this section, an innovative passive energy efficiency idea based on phase change materials (PCMs) in building envelope is discussed. PCM envelope is the evident solution to overcome the increasing energy demand in building sector. However, the performance of such energy efficient buildings strongly dependent on building’s geometry and type of PCMs used in a specific climate zone. PCMs can be used in building envelope (walls) for energy saving and compared with the conventional buildings. Thermal stability is an important factor in PCMs research and applications for the determination of the durability at the higher temperature. This study

Recent Researches in EnGInEERInG sCIEnCEs ¨ ¨ 13
will give clear understanding about how to choose the perfect solution to reach the energy performance of PCMs through optimization of an objective including energy, environment and economy. The study will be helpful for saving significant amount of energy through retrofitting of existing buildings along with future new constructions. This study will also guide the policy makers to improve their energy efficient building standards regarding building envelope.
ExplanationSolar thermal energy storage systems using PCMs, in the building material, is an energy-efficient solution for cooling load reduction(de Gracia, 2019). It has gained significance among researchers in recent years as it can control the daily fluctuations in the indoor temperature (Akeiber et al., 2017) and, as a result, reduces the energy required for space cooling and heating as shown in the following figures.
Figure 13 Daily Indoor Temperature

14 ¨ ¨ PHAsE CHAnGE MAtERIALs (PCM) AnD tHEIR APPLICAtIons
Figure 12 PCM and wall
MethodologyPCM can be used in building by designing, model-based simulation, and development of innovative passive techniques for enhancement of indoor thermal comfort. The building envelope consists of PCMs based walls. After design and simulation, an existing building room is retrofitted and tested through experimentation under real climate and operating conditions. Following step-wise methodology is adopted for use of PCM in buildings.
Step 1: Literature review and data collection
Literature review and preliminary study is performed to analyze various design and development aspects of PCM based buildings envelope. The study of energy demand for conventional building and PCMs selection for walls is also performed in this step. Solar radiation data is gathered which provide feed for design basis.

Recent Researches in EnGInEERInG sCIEnCEs ¨ ¨ 15
Step 2: Geometric design of building envelope
In order to design and develop PCMs based building envelope under identical external operating parameters. A detailed mathematical model is developed related to implementation of PCMs on building envelope. Important factors of this design are selection of PCMs, its thickness, and orientation of building.
Step 3: Simulation and Optimization
The system model is developed and simulated by any simulation software like ANSYS and TRNSYS etc. Phase transformation of PCMs is analyzed for thermal performance in various climates of the desired area. On the basis of the simulation results, key design parameters are optimized to get maximum system performance.
Step 4: Constructional Design, Fabrication
The design of the building is based on the above stages. The important factors at this stage is materials selection, constructability, portability and cost. This setup has arrangement to easily change the different PCMs for experimentation. The fabrication is done by technical expertise. Necessary instrumentation is be applied for experimentation and data collection. Two test rooms are considered generally: (1) the first test room is an already built office room having maximum design thermal load. It is retrofitted by PCMs in walls and (2) is a conventional room for comparative analysis.
Step 5: Testing and Validation
The designed building is tested under the local climate conditions to exploit the thermal behavior of PCMs. The experimental data, in terms of temperature of PCMs, its thermal capacity/enhancement, and thermal efficiency is collected under different operating conditions. The experimental data is also explored for the sustainability of the retrofit building.
3.3 PCM Application In Transportation of Food
PCM is kept in a specific container called phase cooler or ice plate. The container is kept in freezer for 1 hour for charging. After charging it used for maintaining food temperature constant in transportation.

16 ¨ ¨ PHAsE CHAnGE MAtERIALs (PCM) AnD tHEIR APPLICAtIons
Figure 15 Ice Plate
3.4 PCM Application In Refrigeration
Non-toxic solution of PCM, called the PCM are kept in refrigerator for maintaining the temperature constant even in the absence of power. Thus, these materials provide cold energy storage.
Figure 16 Ice Packes

Recent Researches in EnGInEERInG sCIEnCEs ¨ ¨ 17
3.5 PCM Application In LPG Transportation
Liquified Petroleum Gases are sometime transported from country to country in pipelines. During transportation, pipeline passes through different climate conditions and there is a chance of condensation of gas. So PCM can be overlapped around the pipe to maintain the pipeline temperature.
RefrencesAbhat, A. (1983). Low temperature latent heat thermal energy storage:
Heat storage materials. Solar Energy, 30(4), 313–332. https://doi.org/10.1016/0038-092X(83)90186-X
Akeiber, H. J., Ehsan, S., Hussen, H. M., & Wahid, M. A. (2017). Thermal performance and economic evaluation of a newly developed phase change material for e ff ective building encapsulation. Energy Conversion and Management, 150(March), 48–61. https://doi.org/10.1016/j.enconman.2017.07.043
Azizi, Y., & Sadrameli, S. M. (2016). Thermal management of a LiFePO4 battery pack at high temperature environment using a composite of phase change materials and aluminum wire mesh plates. Energy Conversion and Management, 128, 294–302. https://doi.org/10.1016/j.enconman.2016.09.081
De Gracia, A. (2019). Dynamic building envelope with PCM for cooling purposes – Proof of concept. Applied Energy, 235(September 2018), 1245–1253. https://doi.org/10.1016/j.apenergy.2018.11.061
Ghoghaei, M. S., Mahmoudian, A., Mohammadi, O., Shafii, M. B., Jafari Mosleh, H., Zandieh, M., & Ahmadi, M. H. (2020). A review on the applications of micro-/nano-encapsulated phase change material slurry in heat transfer and thermal storage systems. Journal of Thermal Analysis and Calorimetry, 0123456789. https://doi.org/10.1007/s10973-020-09697-6
Jaguemont, J., Omar, N., Van den Bossche, P., & Mierlo, J. (2018). Phase-change materials (PCM) for automotive applications: A review. Applied Thermal Engineering, 132, 308–320. https://doi.org/10.1016/j.applthermaleng.2017.12.097
Javadi, F. S., Metselaar, H. S. C., & Ganesan, P. (2020). Performance improvement of solar thermal systems integrated with phase change materials (PCM),
18 ¨ ¨ PHAsE CHAnGE MAtERIALs (PCM) AnD tHEIR APPLICAtIons
a review. Solar Energy, 206(May), 330–352. https://doi.org/10.1016/j.solener.2020.05.106
Li, W. Q., Qu, Z. G., He, Y. L., & Tao, Y. B. (2014). Experimental study of a passive thermal management system for high-powered lithium ion batteries using porous metal foam saturated with phase change materials. Journal of Power Sources, 255, 9–15. https://doi.org/10.1016/j.jpowsour.2014.01.006
Liu, M., Saman, W., & Bruno, F. (2012). Review on storage materials and thermal performance enhancement techniques for high temperature phase change thermal storage systems. Renewable and Sustainable Energy Reviews, 16(4), 2118–2132. https://doi.org/10.1016/j.rser.2012.01.020
Mawire, A., Lentswe, K., Owusu, P., Shobo, A., Darkwa, J., Calautit, J., & Worall, M. (2020). Performance comparison of two solar cooking storage pots combined with wonderbag slow cookers for off-sunshine cooking. Solar Energy, 208(September), 1166–1180. https://doi.org/10.1016/j.solener.2020.08.053
Mills, A., Farid, M., Selman, J. R., & Al-Hallaj, S. (2006). Thermal conductivity enhancement of phase change materials using a graphite matrix. Applied Thermal Engineering, 26(14–15), 1652–1661. https://doi.org/10.1016/j.applthermaleng.2005.11.022
Nazir, H., Batool, M., Bolivar Osorio, F. J., Isaza-Ruiz, M., Xu, X., Vignarooban, K., Phelan, P., Inamuddin, & Kannan, A. M. (2019). Recent developments in phase change materials for energy storage applications: A review. International Journal of Heat and Mass Transfer, 129, 491–523. https://doi.org/10.1016/j.ijheatmasstransfer.2018.09.126
Patel, J. H., Darji, P. H., & Qureshi, M. N. (2017). Phase Change Material with Thermal Energy Storage System and its Applications: A Systematic Review. Indian Journal of Science and Technology, 10(13), 1–10. https://doi.org/10.17485/ijst/2017/v10i13/112365
Roget, F., Favotto, C., & Rogez, J. (2013). Study of the KNO3-LiNO3 and KNO3-NaNO3-LiNO3 eutectics as phase change materials for thermal storage in a low-temperature solar power plant. Solar Energy, 95, 155–169. https://doi.org/10.1016/j.solener.2013.06.008
Singh, J., Bhuddhi, D. D., Singh, M. H., & Rajpoot, M. M. S. (2016). Experimental Study on Effect of PCM Material used in Chocolate Freezer. International Journal of Advanced Engineering Research and Science, 3(9), 205–210. https://doi.org/10.22161/ijaers/3.9.28

Recent Researches in EnGInEERInG sCIEnCEs ¨ ¨ 19
Souayfane, F., Fardoun, F., & Biwole, P. H. (2016). Phase change materials (PCM) for cooling applications in buildings: A review. Energy and Buildings, 129, 396–431. https://doi.org/10.1016/j.enbuild.2016.04.006
Yan, T., Wang, R. Z., Li, T. X., Wang, L. W., & Fred, I. T. (2015). A review of promising candidate reactions for chemical heat storage. Renewable and Sustainable Energy Reviews, 43, 13–31. https://doi.org/10.1016/j.rser.2014.11.015
Zhong, J. Q., Fragoso, A. T., Wells, A. J., & Wettlaufer, J. S. (2012). Finite-sample-size effects on convection in mushy layers. In Journal of Fluid Mechanics (Vol. 704). https://doi.org/10.1017/jfm.2012.219

20
C H A P T E R 2
EXAMInAtIon oF UsAGE oF nAtURAL GAs/DIEsEL DUAL
FUELs In sERIEs-DRIVEn HYBRID VEHICLEs
Yasin KARAGOZ1 & Tarkan SANDALCI2 & Hasan KOTEN3
1(Assist. Prof. Dr.) Istanbul Medeniyet University, Mechanical Engineering Department, Kadikoy, Istanbul.
E-mail: [email protected] Orcid: 0000-0001-5271-9015
2(Prof. Dr.), Yildiz Technical University, Mechanical Engineering Department, Besiktas, IstanbulE-mail: [email protected] Orcid: 0000-0001-6675-7442
3(Assoc. Prof. Dr.) Istanbul Medeniyet University, Mechanical Engineering Department, Kadikoy, Istanbul.
E-mail: [email protected] Orcid: 0000-0002-1907-9420
1. Introduction
Despite the all the precautions that have taken under the Kyoto Protocol, CO2 emissions increased by 27% between 1990-2004 years and transportation sourced CO2 emission amount increased by 37%. (Sopena
et al., 2010). Also, according to a White Paper Report, transportation sourced greenhouse gas emission is targeted to reduce by 60% at 2050 compared to 1990. (EEA Report, 2013). Although the consumption of renewable energy in the transportation sector increased from 3.5% to 3.8% between 2010-2011 years,

Recent Researches in EnGInEERInG sCIEnCEs ¨ ¨ 21
it has stated that this ratio should be at least 4.1% in order to reach to determined target based on the RED( Renewable Energy Directive)( EEA Report, 2013). Although the diesel engines are commonly used in transportation sector, in spite of they have the superior features which are the high thermal efficiency and low HC, CO and CO2 values, the disadvantage is that they release high amounts of PM and NOx emissions are the disadvantages. (Yoon et al, 2010). According to 2013 Air Quality Report, NO2 emissions exceeded the limit value in the 42% of the measurements that made at traffic control points in Europe in 2011, particulate matter emissions ( <=10 μm) exceeded the 38% limit for urban areas (Istanbul is the among the cities that exceeding limit values in the report).( EEA Report, 2013). The main reason of the increment of NOx and PM emissions is that the increasement in the number of diesel engine vehicles (EEA Report, 2013). It has predicted in 2035, that the number of vehicles in the world could double the number of vehicles in 2010(Ott et al, 2013). The buses that used in public transport have negative effects on environmental pollution and human health and as is known that diesel engines are used in almost all the public transportation vehicles. For example, in Beijing China, although the public transportation buses includes only 0.5% of the total vehicle population, they include for 19% of vehicle sourced NOx emissions. (Zhang et al, 2014). Especially alternative drive systems technologies (hybrid drive systems, electrical drive systems) are needed for urban freight and passenger transportation, heavy and light commercial vehicles such as buses, minibuses, midibuses, and trucks and there is a need to use alternative fuel in current engines (Uçarol & Kural, 2009).
Nowadays, it does not seem possible to commercialize of electrical driven vehicles in the near future due to need for improvement in battery technologies (need to increase power density, charging times etc.) Serial hybrid driven systems can be considered as an alternative way to changing battery electrical vehicles. Because serial hybrid driven systems are a combination of electrical driven system and energy storage systems (Barbosa, 2012). Serial hybrid driven system are quite suitable for especially in frequent start-stop conditions as heavy traffic in the city (Barbosa, 2012). Because of this reason, serial hybrid driven systems are quite suitable urban passenger transportation (Soylu, 2014). Nowadays, serial hybrid driven systems are used by different bus firms in world market. For example, a lot of Eletra (Eletra, 2005) serial hybrid driven system bus are used in Sao Paulo city. Also, UAE serial hybrid driven system buses of

22 ¨ ¨ EXAMInAtIon oF UsAGE oF nAtURAL GAs/DIEsEL DUAL FUELs In sERIEs-DRIVEn HYBRID VEHICLEs
Orion Bus Company (that is a commercial bus company of Daimler Chrysler in North America) are used in New York City.
As is known, IYM technologies of serial hybrid buses are different from conventional IYM technologies. Since IYM’s of serial hybrid systems are connected to generator and not connected to drive wheels, they must be operated with maximum thermal efficiency in operating zone. Because of this reason, it is necessary to develop EKU that will keep the diesel engine in the working area where the highest thermal efficiency and optimum emission values will be obtained by controlling speed at different load levels for serial hybrid vehicles. Low C: H ratio, clean and environmental friendly alternative fuels such as natural gas and biogas should be used with dual fuel mode in the diesel engine. Ignition can be provided with gas fuel injection in intake manifold (fumigation method) and with pilot diesel injection. Hybrid-EKU software must be developed to control both diesel injector and gas injector by engine control unit. Optimum emission values in maximum thermal efficiency condition of diesel engine and parameters to run (pilot diesel injection advance and pressure, biogas (or natural gas))/ diesel ratio, excess air factor) must be determined experimentally by hybrid EKU which developed for serial hybrid vehicle engines. At the same time, PCCI (partial HCCI) which is another alternative ignition cycle should be tried. Also, parameters which are heat release rate, fuel ignition rate, emissions, cycle differences etc. must be modelled according to dual-fuel engines. Hybrid EKU software must be developed for the IYMs of the serial hybrid driven system that can operate with both only diesel engine and biogas (or natural gas) - diesel dual-fuel. Hybrid-EKU, by controlling both the diesel injector and the gas injector depending on the engine load, should operate the diesel engine in such a way that the lowest specific fuel consumption remains in the working area and reaches the optimum emission values. Also, multi-zone ignition model by using in-cylinder pressure data and serial hybrid driven for sample vehicle must be developed. Orion hybrid system buses in the New York City are known to release 38%, 49%, 60% and 38% lower CO, NOx, HC and CO2 respectively than conventional diesel powered buses (Barnitt, 2008). Another study shows that, buses with CNG were compared with Euro III and Euro IV and released NOx and PM emissions 75.2% and 85% lower than Euro III buses respectively and 72% and 82.3% improvement have obtained compared to Euro IV respectively. With the proposed method, it is predicted that a great improvement will be observed

Recent Researches in EnGInEERInG sCIEnCEs ¨ ¨ 23
in terms of both fuel economy and emissions with the development of a series hybrid ECU in which alternative fuels (biogas / natural gas) can be used and its use in buses.
2. Literature ResearchingRoad transport is a responsible of released world-wide emissions approximately 17 % (International Energy Agency, 2011). Despite of the precautions that have taken in United Nations Framework Convention on Climate Change with Kyoto Protocol, CO2 emission amount increased by 27% and transportation sourced CO2 emission amount increased by 37% between 1990-2004 dates. (Sopena et al., 2010). According to European Commission Directive (2009/28/EC), transportation sourced consuming fuels is targeted to consist of 10% biologically sourced fuels until the 2020. (Köse & Cinviz, 2013). Also, according to an European Commission White Paper Report, transportation sourced greenhouse gas emission is targeted to reduce by 60% at 2050 compared to 1990. (EEA Report, 2013). Although the consumption of renewable energy consumption in the transportation sector increased from %3.5 to %3.8 values, it is indicated that this value must be 4.1% to achieve determined target. (EEA Report, 2013). Although the diesel engines are commonly used in transportation sector, in spite of they have the superior features which are the high thermal efficiency and low HC, CO and CO2 values, the disadvantage is that they release high amounts of PM and NOx emissions are the disadvantages. (Yoon et al, 2010). NOx causes to form photochemical smog and acid rains. Smog particulate emissions increase cardiovascular deaths, adversely affect lung development of children and cause other health problems (McTaggart et al, 2001).According to 2013 Air Quality Report, NO2 emissions exceeded the limit value in the 42% of the measurements that made at traffic control points in Europe in 2011, particulate matter emissions (<=10 μm) exceeded the 38% limit for urban areas, exceeded 25% limit for industrial areas and exceeded 15% limit for rural areas. Istanbul is the among the cities that exceeding limit values and in high dangers in the report. (EEA Report, 2013, Sayin, 2013).
In the same applied studies, it has predicted in 2035, that the number of vehicles in the world could double the number of vehicles in 2010 (Ott et al, 2013). The majority of these vehicles are diesel vehicles. Especially public transportation buses adverse impacts on environmental pollution and human

24 ¨ ¨ EXAMInAtIon oF UsAGE oF nAtURAL GAs/DIEsEL DUAL FUELs In sERIEs-DRIVEn HYBRID VEHICLEs
health. For example, in Beijing China, although the public transportation buses includes only 0.5% of the total vehicle population, they include for 19% of vehicle sourced NOx emissions. (Zhang et al., 2014). On the other hand, diesel fuel prices which have increased due to the rapid depletion of fossil fuels in recent years, have closed to gasoline. Also, stricter emission regulations are forced to develop both diesel and positive ignition (Otto) end gas technologies. NOx emission release amount wanted to be near 0 by the striker regulations (Garg et al, 2013). In the last years, cost of after treatment system is nearly made similar to engine cost to cope with high emission norms and the searches for alternative fuel are gained momentum. Diesel engines use SCR and DPF respectively to reduce particulate emissions. However, due to high costs of catalyst materials, usage of alternative gas fuel become compulsory (Zhou et al., 2014). Automotive sector accelerated to study on various hybrid configurations and alternative fuels on current engines to increase both energy efficiency and fuel economy and to decrease pollutant gas emissions. ( Bose & Maji, 2009, Kose and Cinviz, 2013). Despite the all taken precautions in Europe Renewable Energy Directive (RED), In the road transport sector, the usage rates of alternative driven systems such as hybrid vehicles and electric vehicles and alternative fuels such as natural gas, biogas and hydrogen are far from expectations and the use of alternative fuels is largely due to LPG and biodiesel; It has been stated that the use of alternative fuels such as natural gas, biogas and ethanol, especially alternative driven systems such as hybrid and electricity, will become indispensable in the coming years (EEA Report, 2013). According to these developments, especially alternative drive systems technologies (hybrid drive systems, electrical drive systems) are needed for urban freight and passenger transportation, heavy and light commercial vehicles such as buses, minibuses, midibuses, and trucks. (Ucarol & Kural, 2009).
Hybrid and electrical cars are classified as 3 separate categories: Hybrid electrical cars, plug-in hybrid electrical cars and electrical cars (US Department of Energy, 2014). There is no need to use plug to charge hybrid electrical cars, they can be charged the batteries by regenerative brake and internal combustion engine. Plug-in hybrid electrical cars can charge batteries with the help of both mains electricity and ICE (Internal combustion engine.) Batteries are charged by only mains electricity.
The high costs electrical cars are restricted to availability in the car market. Other disadvantages are that critical parts such as batteries have an average

Recent Researches in EnGInEERInG sCIEnCEs ¨ ¨ 25
lifespan of 3 to 5 years and long battery charging times such as 5 to 8 hours (even in fast charging systems, this period cannot go below 3-4 hours).( Ünlü et al., 2003). In addition, due to the limited range of electric vehicles,especially in heavy commercial freight and passenger transportation it does not seem possible to use them commercially in the near future, , until the development of battery technology is completed and the energy density of the batteries is increased (Barbosa, 2012).
Hybrid electrical cars are developed in order to eliminate the disadvantages of electrical cars due to the electrical cars have limited range and charging problems and cannot be transferred directly to the electrical cars. (Ünlü et al., 2003). Hybrid electrical cars have some advantages compared to conventional engine cars which are the minimizing energy loses with regerenative brake, reduction the size of ICE, fuel efficiency and the improvement of emissions (Ucarol & Kural, 2009).
3 basic configurations are used in commercial vehicles as system design. These are: i) series hybrid system where there is no connection between ICM and drive wheels, ii) there are parallel hybrid systems where both ICM and electric motor are connected to the wheels, iii) both ICM and the electric motor are connected with the planetary gear system, dual hybrid systems are available where the electric motor and IYM drive are constantly changing (Barbosa, 2012).
Electric engine ensures the driving power to wheels. ICM connected to generators and it ensures electricity to batteries and/or electrical engine by forming electrical energy. There is no power transform between ICM and wheels. (Ünlü et al., 2003). Flow diagram of serial hybrid driven system are given in Figure 1.
Figure 1. Serial hybrid driven system

26 ¨ ¨ EXAMInAtIon oF UsAGE oF nAtURAL GAs/DIEsEL DUAL FUELs In sERIEs-DRIVEn HYBRID VEHICLEs
As shown in figure 2, in the parallel driven system, the power for the drive is ensured from more sources. ICM directly transfers the power to the wheels with the help of transmission, electrical engine transfers the power the to the wheels with the help of stored energy in the battery (Ünlü et al, 2003).
Figure 2. Parallel hybrid driven system
Serial hybrid driven systems can be considered as alternative way to pass to the electrical cars. Because, it is a combination of electrical driven system and energy storage system (Barbosa, 2012). Serial hybrid driven system is appropriate for star-stop conditions in urban traffic conditions. Also, serial hybrid driven system is the easiest configuration in all hybrid driven systems (Barbosa, 2012). Because of that, serial hybrid systems are appropriate for using urban passenger transport (Soylu, 2014).
Nowadays, different bus firms use hybrid driven systems in global market. For example, a lot of Eletra (Eletra, 2005) serial hybrid driven system bus are used in Sao Paulo city. Ekstra lessened 80 HP engine is used with the help of serial hybrid system. Also, BAE serial hybrid driven system buses of Orion Bus Company (that is a commercial bus company of Daimler Chrysler in North America) are used in New York City. A smaller 5.9 Cummins ISB diesel engine is used thanks to the serial hybrid configuration (Barnitt, 2008). Figure 3 shows the serial hybrid drive system of Orion Bus Company. In addition, Allison buses in the vehicle market use a diesel hybrid system. It is also known that Volvo Company uses a diesel hybrid system in buses in the vehicle market (Barbosa, 2012).

Recent Researches in EnGInEERInG sCIEnCEs ¨ ¨ 27
Figure 3. Serial hybrid driven system of Orion Bus Production Company in North America
Hybrid driven system buses are used in various countries, mainly in Europe and America. In New York City, 375 serial hybrid driven buses from Orion brand (Gen I and Gen II) are currently in use and hundreds of themhave been placed to order (Barnitt, 2008). As of 2006, 900 hybrid buses are in service in North America and many of them have been placed to order (EESI, 2014). The city of New York taken place on the top with a fleet of 385 vehicles and an order of 500, Seatle city ordered 214 and Washington DC ordered 100 diesel hybrid electric buses. 15 more states have ordered hybrid buses in America (EESI, 2014). While there were 10 hybrid, 221 CNG and 4258 conventional diesel buses in the vehicle fleet of New York City in 1999, the vehicle fleet in 2006 consisted of 385 hybrid, 646 CNG and 3458 conventional diesel buses (Chandler et al., 2014). It is also known that in Beijing, it aims to increase the number of buses with 2000 diesel hybrid systems and 3000 CNG as of 2012, and to increase the rate of these buses to 65% of all buses in 2017 (Zhang et al., 2014).
Figure 4. Performance map of typical conventional internal combustion engine and working zone in maximum thermal efficiency

28 ¨ ¨ EXAMInAtIon oF UsAGE oF nAtURAL GAs/DIEsEL DUAL FUELs In sERIEs-DRIVEn HYBRID VEHICLEs
Engine maps of conventional vehicles are calibrated to respond to peak power demands (acceleration, maximum slope output, etc.) as seen in Figure 4. However, they operate at peak loads in very short duration under urban driving cycle conditions. In addition, specific fuel consumption seems to be largely dependent on engine torque and engine speed (Barbosa, 2012). However, serial hybrid vehicle engines are operated to stay in the working area with maximum efficiency as shown in Figure 4.
Figure 5. Performance graphs of ICE (left) and electrical engine (right)
Ideally, maximum drive power is independent of vehicle speed. However, as can be seen from Figure 5, ICE power and torque are functions of speed. Electric motors are very close to the traction curve required for the ideal drive in terms of power characteristics, as they can produce maximum torque even at almost 0 speed (Barbosa, 2012). Series hybrid engines are operated in the region where they have the lowest specific fuel consumption, slightly above the maximum torque zone and slightly below the maximum power zone, as can be seen in Figure 5.
Figure 6. Power consumption demand depending on the running cycle for typical public transportation vehicle

Recent Researches in EnGInEERInG sCIEnCEs ¨ ¨ 29
Since driving power is provided by the electric motor in series hybrid vehicles, ICM dimensions and weight can be reduced (downsizing) so that the engine can be operated in the efficient operating zone at higher loads. Because, as seen in Figure 6, the electric motor can respond to peak load demands with the help of batteries. The serial hybrid driven system can improve thermal efficiency and emissions due to 3 main reasons: i) use of smaller volumes of ICM, ii) regenerative braking, iii) power on-off mode (Start-stop systems-low load demands of ICM and by turning it off in cases and meeting the required power directly from the batteries) provides an advantage in terms of fuel consumption and emissions within the city (Barbosa, 2012).
Another advantage of using the serial hybrid system in city buses is that under suddenly variable conditions (transient conditions) that require peak load demands such as acceleration, the motor can be operated in more stable and stable (stationary) conditions, as the battery and supercapacitors step in and provide electrical energy to the electric motor (Clark, 2001). By avoiding starting the engine under suddenly variable operating conditions, they release less emissions under more stable (stationary) conditions and they can be operated at higher efficiency points. Therefore, it is known that, by using conventional motor vehicles in urban heavy traffic conditions, frequent stop-start conditions will occur, resulting in sudden peak load conditions such as acceleration, causing a high amount of pollutant emission and will be negatively affected in terms of fuel economy. It is known that the engines of series hybrid vehicles are less exposed to variable operating conditions (Clark, 2001).
Figure 7. FTP running cycle (Clark, 2001)
In the agreement made with the engine manufacturer companies in the United Nations, today’s vehicle engines are required to provide both FTP and 13 mode

30 ¨ ¨ EXAMInAtIon oF UsAGE oF nAtURAL GAs/DIEsEL DUAL FUELs In sERIEs-DRIVEn HYBRID VEHICLEs
Euro III cycles (Clark, 2001). However, FTP cycle is a running cycle in which operating conditions are quite high, as can be seen in Figure 7. It is known that some heavy service class engines cannot provide EPA’s FTP cycle in terms of PM emissions , but some additional post combustion recovery (post-treatment) systems can provide this situation (Clark, 2001). It is known that FTP conversion can be achieved more easily with lower-power engines. As is known, size and power reduction can be achieved in serial hybrid systems in terms of ICE.
Figure 8. 13-mod Euro III test cycle (Clark, 2001)
Also, the FTP cycle is more suitable for bus engines operating under variable operating conditions. It is more appropriate to test serial hybrid buses with a running cycle that examines more stable (steady-state) operating conditions, rather than ICE’s FTP cycle (Clark, 2001). Cycles of internal combustion engines operating under constant conditions: 5-mode test cycle, 8-mode test cycle, test cycles of E-4 and E-5 ship engines, 13-mode Japanese test cycle and 13-mode Euro III test cycle. The 5 mode test cycle is more suitable for constant speed motors such as generator motor. The 8-mode test cycle is more suitable for off-road applications. E-4 and E-5 test cycles are more suitable for tests of ship engines where torque and speed increase together. Although the 13 mode Japanese test cycle and the 13 mode Euro III test cycle are more suitable for hybrid vehicles as they are operated at different load levels within a wider engine operating range, the idle operating conditions in the Japanese test cycle are not very suitable for hybrid vehicle engines due to the long test period. As a result, the 13 mode Euro III test cycle shown in Figure 8 is more suitable since the operating characteristics of the series hybrid vehicle engines do not fully comply with the continuously variable operating conditions as well as the continuous constant speed conditions. In addition, in the 13-mode Euro III test

Recent Researches in EnGInEERInG sCIEnCEs ¨ ¨ 31
cycle, the longer the engine’s running conditions around the maximum torque zone, and therefore the longer the engine runs in the operating conditions zone with maximum efficiency, is very attractive for testing series hybrid vehicle engines.
In the literature, there are many models and studies about hybrid vehicles created in computer environment. These are: Barrero et al. (Barrero et al., 2009) have modeled hybrid vehicles with various power transmission methods and, according to the results they obtained, regenerative braking and reduction of the engine size, up to 32.6% with the most efficient operation of the engine, and 40% with the opening and closing of the ICE fuel economy has been achieved. Ahn et al. (Ahn et al., 2009) modeled a hybrid vehicle with a regenerative braking system and achieved fuel economy between 20% and 50%. Xrang et al. (Xiong et al., 2009) worked on modeling the energy management system of a hybrid vehicle and achieved an improvement in fuel consumption of up to 30%.
There are also many more studies in the literature on the use of hybrid driven systems in vehicles (especially buses). These are: Barbosa (Barbosa, 2012) prepared a feasibility report on the use of serial hybrid buses in the city. He examined the effects of 60 serial hybrid buses which produced with local opportunities in Sau Paola on urban passenger transportation. The engine used in the buses was chosen with an extra small power and an 80 HP engine was used. According to the results, an improvement between 10% and 25% in fuel consumption was observed, while an improvement in maintenance costs was observed between 20% and 30%. Barnitt (Barnitt, 2008), as the National Renewable Energy Laboratory in the United States, compared conventional diesel-powered buses, CNG buses and serial hybrid buses in city buses in New York City in terms of fuel consumption and operating costs. As a serial hybrid buses, 2 different models of Gen I and Gen II buses of Orion Company were examined. Gen IIs are the new generation hybrid buses, and improvements have been made in ICE, electric motor and battery systems. According to the results, although Gen II buses have 24% lower maintenance costs than Gen I buses, their fuel consumption is 5.9% higher. Because although the revised engines of the Gen II buses are superior in terms of emissions, they perform worse than the Gen I bus in terms of fuel consumption due to the addition of EGR. In addition, Gen II buses provide 43% and 22% better fuel economy than CNG and conventional diesel buses, respectively. Zhang et al. (Zhang et al, 2014), measured the NOx emissions of 2 Euro V, 2 Euro IV conventional diesel, 2 Euro IV diesel hybrid, 9

32 ¨ ¨ EXAMInAtIon oF UsAGE oF nAtURAL GAs/DIEsEL DUAL FUELs In sERIEs-DRIVEn HYBRID VEHICLEs
CNG and 2 LNG buses with the PEM (portable emission measurement) device in Beijing, China. In China, the Euro IV emission standard has been applied in buses since 2008 and it has been observed that the application of SCR (selective catalyst reduction) to diesel engines is insufficient to prevent NOx emissions (Zhang et al, 2014). Upon these developments, Beijing Environmental Protection Agency applied portable emission measurement on buses. According to the results, Euro IV diesel hybrid buses released 4.4 g / km NOx emission, resulting in 63% and 44% less NOx emissions than Euro IV and Euro V conventional diesel buses, respectively. In addition, while CNG buses released 5.7 g / km of NOx (considerably lower than conventional diesel Euro IV and Euro V engines. Also CNG buses released 5.7 g / km of NOx (lower than diesel Euro IV and Euro V engines after treatment), while LNG released 3.2 g / km of NOx (even lower than hybrids) (Zhang et al, 2014). Briggs et al. (Brigs et al., 2014) studied the effect of installing a turbogenerator in the exhaust line on fuel consumption and emissions in hybrid buses. By installing a 2.4 L, 4-cylinder, turbo-charged Ford Duratorque engine of the city buses on the 159 London route, a 2.4% increase was achieved in fuel consumption, and they observed an improvement in fuel consumption by nearly 3% with the optimization of the ICM / generator control strategy. Even if only 3% fuel consumption was observed in this line, it was found that at least 1200 ₤ profit would be obtained per bus per year. Soylu (Soylu, 2014) collected data in real-time over the bus by making micro-cycles on the Sakarya Campus route. In their work with Temsa Company, a 6.7 L Euro V Cummins diesel engine hybrid bus was tested. According to the results obtained, it was predicted that the advantages gained by the use of hybrid buses will vary greatly depending on the cruising cycle and energy management. Ott et al. (1001) used natural gas-diesel dual-fuel in a 2 L, 4-cylinder, common-rail fuel system, EGR and turbocharged diesel engine. Later, he examined the effect of using a dual fuel engine with a hybrid driven system on fuel consumption and emissions. According to their results, a decrease in CO2 emissions between 2.4% and 9% was observed with the use of natural gas-diesel fuel in diesel engines. With the hybridization of the dual fuel engine, the reduction in CO2 emissions has increased from 13.1% to 18.4%. In addition, with the use of a natural gas-diesel dual fuel diesel engine in the hybrid vehicle, almost no NOx was released at low loads, while NOx was released under medium and full load conditions. However, it is predicted that the NOx emission released can be prevented with a 3-way catalytic converter. As can be understood from the literature, a great

Recent Researches in EnGInEERInG sCIEnCEs ¨ ¨ 33
advantage can be obtained in terms of fuel economy and pollutant emissions by using hybrid vehicles. In addition, gasoline, diesel, natural gas, biofuels or other alternative fuels can be used in ICEs of hybrid vehicles (Barbosa, 2012).
Another method that can be used to improve pollutant exhaust emissions and provide fuel economy in vehicles is to use alternative fuels in conventional engines. Among the alternative fuels, alcohols, vegetable oil, LPG, CNG, LNG, air gas, biogas and hydrogen come forward. Alternative fuels should be examined with this angles ; resource and potential, fuel supply, safety, toxicity and harmfulness to health, engine performance and emissions, storage, fuel tank and easy availability anywhere desired. Natural gas is one of the important alternative fuels that can be used as fuel in internal combustion engines as it ensures many of these criteria. Natural gas is an extremely favorable alternative fuel thanks to its easy availability, higher reserves than petroleum, low cost, clean combustion characteristics and lower vehicle emissions in addition to the existence of distribution systems. The majority of natural gas is 90-96% CH4 (methane) gas. The remaining part consists of 2.411% C2H6 (ethane), 0.736% C3H6 (propane), 0.371% C4H10 (butane), 0.776% N2 (nitrogen), 0.164% C5H12 (pentane) and 0.085% CO2 (carbon dioxide)(Çeper,2009). However, due to its high methane content, the properties of methane in natural gas come forward. One way to achieve current emission standards in diesel engines is to replace diesel fuel with a cleaner, low-carbon alternative fuel (McTaggart et al., 2006). In addition, although CNG (pressurized natural gas) is a fossil fuel, it can cause a reduction of greenhouse gases up to 25% due to the low C: H atom ratio of methane (Königsson,2011). Methane has narrow flammability limits and low flame velocity in lean mixtures (Zhou et al., 2014). Since the carbon content is lower than gasoline and diesel fuel, CO2 emissions decrease according to the same energy value (Umierski, 2000). Although CNG (compressed natural gas under high pressure) is a clean fuel, consisting mostly of methane gas, it has been used in diesel engines for reasons such as 540oC self-ignition temperature and narrow flammability limits (5% to 15%) (Garg et al, 2013).
On the other hand, biogas is colorless, odorless, low density air (0.83 density ratio compared to air) and octane number 110, burning with bright blue flame and consist of 54-80%(CH4) methane and 20-46% carbon dioxide (CO2). Biogas is released as a result of the anaerobic (airless) fermentation of organic substances. As is known, at least 60% of the current energy consumption in our country is ensure by imports (Kaya et al., 2009).

34 ¨ ¨ EXAMInAtIon oF UsAGE oF nAtURAL GAs/DIEsEL DUAL FUELs In sERIEs-DRIVEn HYBRID VEHICLEs
According to 2006 data from Turkey Statistical Institute, calculations made for ovine, cattle and poultry, the amount of animal waste used in Turkey, found as 1.8 Mtoe (million tons of petroleum equivalent) (Kumar et al, 2009). According to data from another source, the amount of energy that can be obtained from agricultural wastes in our country every year corresponds to 5.4 Mtoe, the amount of energy that can be obtained from forest and industrial wastes to 5.9 Mtoe, and the amount of energy that can be obtained from animal wastes to 1.5 Mtoe (Koçer et al., 2006). This corresponds to a total value of 12.8 Mtoe. Only agricultural, forest industry and available energy obtained from animal waste in Turkey seems to be between 22% to 27% of the annual energy consumption. In Turkey, at least 2,000 biogas plant has the capacity to work with animal waste (The IEA Bioenergy Task 37, 2011) (Ertem, 2014). However, we currently have 85 biogas plants and only 36 are operating. It is known that the nutritional value of the plant is increased up to 20% with the excellent fertilizer which released after biogas production (Alçiçek and Demirulus, 1994).
Biogas, an alternative, clean fuel for diesel engines, is quite clean compared to fossil fuels, considering that its main component is methane (CH4) (Soon and Lee, 2011) Due to the high CO2 content in low loads , the problem of low flame velocity and low thermal efficiency is encountered (Cacua, 2012). Due to the presence of CO2 and other gases, it has a lower energy content than natural gas. Also, because of this, the flame speed decreases and the ignition delay time increases. In addition, in studies conducted with biogas, an increase in the amount of CO and a slight decrease in the amount of NOx were observed compared to natural gas (Mustafi and Raine, 2008).
Due to its economic and environmental advantages, it is very advantageous to use biogas with dual- fuel mode in diesel engines (Soon & Lee, 2011). The use of biogas or natural gas in diesel engines together with a diesel fuel such as diesel or biodiesel with the dual fuel method, provides a reduction in both NOx and PM emissions, and they are also very advantageous in terms of fuel costs. Biogas and natural gas cannot be used directly in diesel engines due to their high self-ignition temperature. Therefore, ignition is provided by pilot diesel injection. At the same time, since biogas is a gaseous fuel with wide flammability limits, NOx emissions can be kept under control by lowering local end-of-combustion temperatures in the lean and dilute mixture (Soon and Lee, 2011). The solution may be to provide ignition with a high reactivity fuel and send it through a low reactivity fuel port. In addition, thanks to its high octane number and high

Recent Researches in EnGInEERInG sCIEnCEs ¨ ¨ 35
CO2 content, biogas can easily be used in dual mode in diesel engines without EGR (Liu et al, 2008). While biogas or natural gas is used as the main fuel, it is possible to carry out ignition with some diesel pilot injection, but it is the most useful method in terms of combustion stability. For this reason, methods such as port or manifold injection, direct biogas injection and continuous manifold injection have been used. In the port or manifold injection method, there is sometimes the possibility of abnormal combustion (knocking, pre-ignition, and flareback). In addition, both in the port or in the manifold injection method and in the continuous manifold injection method, due to the displacement of some of the intake air and methane, there is a decrease in volumetric efficiency, but a slight decrease in engine power. These difficulties can be overcome with direct gas injection. However, in the direct methane injection method, it is necessary to make modifications in the diesel engine and to place an extra high pressure methane injector in the cylinder head. In addition, although this high pressure methane injector is not available in the market, a special design is needed, but it must be resistant to high combustion temperatures. For this reason, the use of biogas in diesel engines with pilot diesel injection in dual mode with port or manifold injection method comes forward and is widely used by many researchers (Köse and Cinviz, 2013). This method is also called fumigation method and can be easily used in diesel engines with minor modifications. In this method, air and biogas (or natural gas) are mixed before entering the combustion chamber and, as mentioned above, ignition is provided with pilot diesel injection towards the end of the compression stock (Bedova et al., 2009; Duc & Wattenauchien, 2007). According to Karim (Karim et al., 1999), the combustion of gas fuel and diesel in dual mode takes place in 3 modes: 1) Combustion of pilot diesel, 2) Combustion of methane around the diesel spray, 3) Progression of the flame in the biogas-air mixture. However, at low loads, as can be seen from the figure below, in the 3rd mode with the mixture being extremely poor at partial loads (Königsson, 2011), an increase in the THC (total hydrocarbon) emissions can be observed as a result of the increase in flame extinction zones and incomplete combustion. However, in engines where biogas / natural gas is used as the main fuel and pilot diesel injection method is used, the total greenhouse gas pollutants decrease as can be seen in Figure 10 in poorly mixed combustion conditions (high air excess coefficients). As can be seen in Figure 9, the lean-mixed biogas / natural gas-diesel dual fuel engine provides a great advantage in terms of emissions, especially PM and NOx, compared to conventional diesel engines

36 ¨ ¨ EXAMInAtIon oF UsAGE oF nAtURAL GAs/DIEsEL DUAL FUELs In sERIEs-DRIVEn HYBRID VEHICLEs
and otto-cycle engines (positive ignition). Solely, as stated above, in the ultra-lean mixture, some increase in THC emissions is observed due to the increase in flame extinction zones, but most of the THC emissions released are unburned methane. Moreover, considering that there are after-treatment equipment in Otto and Diesel engines and there is no after-treatment system in natural gas / biogas-diesel dual fuel engine, it is understood that the difference will increase much more with the use of after-treatment equipment in biogas / natural gas-diesel dual engine.
Figure 9. Comparison of emission values of lean mixed natural gas / biogas-diesel dual fuel engines with the emission values
of conventional gasoline and diesel engines (Umierski and Stommel, 2000)
The use of biogas or natural gas together with a diesel fuel such as diesel or biodiesel in diesel engines provides a reduction in NOx and PM emissions, and is also very advantageous in terms of fuel costs. As can be seen in Figure 10, the comparison of the emission value of the Euro V diesel engine with post-combustion improvement system and the natural gas-diesel dual fuel engine without any emission improvement system is given. As can be seen from the figure, the natural gas / diesel dual fuel diesel engine is far below the Euro V emission standard requirement. In this method, where natural gas is injected from the port (fumigation) and ignition is provided by pilot diesel injection method, a great improvement has been achieved in CO, NOx and PM emissions without the need for post-combustion emission improvement systems. In particular, it is important to reduce PM and NOx emissions, which are important in diesel engines, together and that these values are well below the Euro V regulation criteria. However, a slight increase has been observed in THC (total hydrocarbon) emissions with the increase of flame extinction zones, as the poor mixture conditions (λ> 1) were studied. However, it is seen that most of the

Recent Researches in EnGInEERInG sCIEnCEs ¨ ¨ 37
THCs released are methane (CH4) instead of unburned hydrocarbon. In addition, the total fuel consumption of natural gas / biogas-diesel dual fuel is calculated by calculating the equivalent diesel fuel consumption and compared with the diesel fuel consumption of a conventional diesel engine, although a slight decrease is observed in fuel consumption, natural gas / biogas fuels are more economical than diesel fuel.
Figure 10. Comparison of the emissions of a diesel engine with a natural gas-diesel dual fuel after-treatment system and a conventional
diesel engine with an after-treatment system (Umierski and Stommel, 2000)
On the other hand, in reducing both NOx and smog emissions, HCCI (homogeneously charged compression ignition) engines can be the solution because they have ultra-low NOx emissions and almost 0 smog particle emissions. HCCI engines have the superior features of diesel and otto engines. They have many advantages such as low emission, high thermal efficiency and high heat release rate, as the premixed and lean mixture is self-igniting with a high compression ratio. However, the major disadvantage of HCCI engines is the difficulty in controlling the starting point of ignition over a wide range of speeds and loads (Garg et al., 2013). In order to overcome the difficulty of controlling the combustion of HCCI engines, it was tried to control the combustion phase with VVT and EGR. However, one of the most effective methods of controlling combustion in HCCI engines is to injection a very small amount of pilot diesel (PCCI or partial HCCI method) to start combustion (Garg et al., 2013). Due to the high self-ignition temperature and narrow flammability limits of methane, it is the most appropriate method to provide ignition with pilot diesel injection in diesel engines and to use the PCCI method for alternative cycles. (Garg et al, 2013).

38 ¨ ¨ EXAMInAtIon oF UsAGE oF nAtURAL GAs/DIEsEL DUAL FUELs In sERIEs-DRIVEn HYBRID VEHICLEs
The application of natural gas in vehicles is difficult due to the need for high pressure tanks and low range, but it is more suitable for use in buses. The use of gaseous fuels in urban traffic is advantageous in terms of low emission and smog particles. In addition, when using natural gas in SI engines, if it is assumed that the compression ratio is between 10 and 12, the internal cylinder pressure is around 30 bar, and in a supercharged engine at full load, 90 bar in-cylinder pressure values are reached, so the spark plug gap tension is approximately three times. In order to overcome this problem, it is more appropriate to provide ignition with a small amount of pilot diesel injection (Unierski, 2000). In addition, the use of natural gas in SI engines at partial loads reduces efficiency and performance due to the presence of throttle valves and low compression ratios in Otto engines, so it is more appropriate to use biogas and natural gas in diesel engines with dual fuel method (Unierski, 2000).
Many different results have been obtained in studies on engine performance in biogas. Some researchers found that motor power decreased (Zhang et al., 2001), some of them found that no change (Wong et al., 1991), others found that motor power increased (Selim, 2004; Slawomir, 2001; (Chengaji, 1999). Kusaka et al, 1998; Hountalis et al, 2000), some of them found high thermal efficiency (Abd-Alla et al., 2002; Abd-Alla et al., 2000, Shinichi et al., 1992; Sudhir et al., 2003; William et al., 1990); and a decrease in thermal efficiency at medium loads (Poonia et al., 1998; Dong-Jian et al., 2001; Ishida et al., 2001, Chengaji, 1999). However, the all researchers concluded that the use of biogas has improved emissions, particularly NOx and PM. Cacua et al. (Cacua et al., 2012) revealed that the ignition delay period may be prolonged in dual fuel diesel engines where biogas is used as the main fuel, which has a significant effect on emission and performance. In another study, it was stated that there may be problems in thermal efficiency and the amount of pollutant emission released in low-load dual fuel engines due to the long ignition delay period (Cacua et al., 2012). Some decrease in thermal efficiency due to the displacement of high amounts of diesel and biogas at partial loads (especially at low loads); It is concluded that there will be some increase in CO and HC emissions (Bedova et al., 2009). On the other hand, Nathan et al. (Nathan et al., 2010) stated that in dual fuel diesel engines where biogas is used as the main fuel, low thermal efficiency may occur due to the high amount of CO2 in the biogas. In another study, it was claimed that with the addition of biogas at low power, thermal efficiency could decrease up to 10% depending on the CH4/CO2 ratio (Luijten &
Recent Researches in EnGInEERInG sCIEnCEs ¨ ¨ 39
Kerkhof, 2011). However, some decrease in thermal efficiency does not cause any disadvantage since biogas is a very economical fuel, fuel consumption is still more economical when biogas is used as fuel.
Karim et al. (Karim et al., 1999) examined the use of various gas fuels as dual fuel in diesel engines and claimed that engine load, diesel / gas fuel ratio, injection advance, intake air temperature and EGR significantly affect the exhaust gas emissions and combustion characteristics of the engine.In diesel engines, the fumigation method is the most reliable and applicable method while spraying CNG from the port (Tomita et al., 2002). Especially in diesel engines, in partial loads and in extremely poor mixture, low flame speed and high amount of THC and CO emission due to flame extinction zones and low efficiency are the most important problems. In order to solve the problems in partial loads, methods such as changing the filling temperature and pressure, changing the amount of liquid fuel, changing the air excess coefficient, changing the diesel injection characteristic can be used (Cacua et al., 2012). Some researchers studied the diesel / biogas exchange rate (Papagiannikis & Hountalos, 2003), some heated the gas fuel-air mixture (Poonia et al., 1998; Abd Alla et al., 2001), some enriched the mixture with air butterfly (Poonia et al, 1998), some of them worked on changing the filling temperature with EGR (Pirouzparah et al 2007), some worked on direct gas injection to cylinders (Carlucci et al., 2008) and some of them studied pilot fuel injection parameters (Nwafar, 2007). In addition, it is known that the type, properties and quality of the injected pilot diesel fuel, especially the cetane number, will affect the pre-mixed combustion period and thus the thermal efficiency and emissions by directly affecting the ignition delay period (Gunea et al. 1998, Bedova et al., 2009). In addition, subjects such as HC problem, which occur especially in partial loads, hot and cold EGR, preheating, gradual filling, auxiliary fuel (H2 or gasoline) or reducing engine speed have been studied (Tomita et al., 2002).
The properties of biogas varies depending on its composition. For example, the volumetric lower calorific value of a biogas containing 60% methane is 21.5 MJ / m3, while the volumetric lower calorific value of a biogas containing 96% methane is 35 MJ / m3 (Makareviciene et al., 2013). Also, biogas is used in public transport in some countries. For example, in the city of Lipkoping (Sweden), biogas with a concentration of 97% methane is used in 64 buses and many passenger cars and commercial vehicles. With the project, which was implemented in Sweden in 2002 and is still in effect, CO2 emission

40 ¨ ¨ EXAMInAtIon oF UsAGE oF nAtURAL GAs/DIEsEL DUAL FUELs In sERIEs-DRIVEn HYBRID VEHICLEs
in the transportation sector has decreased by approximately 9000 tons / year, and a significant gain has been achieved in terms of fuel costs (IEA Bioenergy, 2014). Although there is no international standard regarding the use of biogas in the transportation sector, some developed countries (Germany, France, the Netherlands, Sweden, Austria and Switzerland) have published their own standards for the use of biogas in the transportation sector (Sahoo et al., 2009). While the methane concentration is at least 96% in many countries, the CO2 concentration does not exceed 4%. From these values, biogas is separated from gases such as CO2, sulfur and water vapor with various technologies, and almost natural gas is obtained and used in the transportation sector. High Wobbe index has been used as another evaluation criterion for biogas depending on the upper calorific value. Since hydrogen sulfide and water vapor concentration can corrode the engine, it is removed by Soretion technology (Subramanian et al., 2013; Yang et al., 2008; Yuan ve Bandajz, 2007). The CO2 content in biogas can also be removed or reduced, but as is known, the most energy is spent in reducing the biogas concentration (Mokareviciene et al., 2013). In addition, it is known that natural gas in compressed form is widely used in vehicles in Europe, in countries such as Argentina, Iran, India and Pakistan (Chandra et al., 2011). In our country, it is known that some municipalities (Istanbul, Kocaeli) use urban transportation vehicles with natural gas. Some researchers have studied the use of biogas as dual fuel in diesel engines together with diesel fuel. Duc and Wattenauchien (Duc and Wattenauchien, 2007) operated an agricultural diesel engine with a small split combustion chamber on biogas-diesel dual fuel. With the use of biogas in dual mode, there was almost no decrease in engine performance. In addition, while a decrease in thermal efficiency is observed in dual mode at low loads, the decrease in thermal efficiency decreases as the amount of load increases. In addition, in the results obtained, it was found that, due to the low cost of biogas, despite some decrease in thermal efficiency, it is quite economical in terms of fuel cost compared to diesel fuel. Barik and Murugan (Barik and Murugan, 2014) sent different amounts of biogas (0.3 kg / h, 0.6 kg / h, 0.9 kg / h and 1.2 kg / h) in a diesel engine by fumigation method and examined in terms of engine performance and emission. According to the results, in dual mode, there was a 39% and 49% decrease in NO and smog emissions, respectively, compared to diesel fuel alone.
Some researchers, used biodiesel fuel as dual fuel together with biogas. Bedoya et al. (Bedoya et al., 2009) worked on a biogas-diesel dual fuel engine
Recent Researches in EnGInEERInG sCIEnCEs ¨ ¨ 41
simulated with a mixture of 60% CH4 and 40% CO2 gases, at a fixed engine speed of 1500 rpm, at four different load levels. According to the results, by using biodiesel fuel with the supercharged system, thermal efficiency increased and the amount of CO and CH4 in emissions decreased (Bedoya et al., 2009). Yoon and Lee (Yoon & Lee, 2011) compared only diesel and only biodiesel fuels with diesel-biogas and biodiesel-biogas dual fuels. The result is that NOx emissions increase but smog emissions decrease under all dual fuel operating conditions (Yoon & Lee, 2011.) Some researchers examined the effect of biogas (different CH4 / CO2 ratios) of different contents on engine performance and emissions. Luijten and Kerkhof (Luijten & Kerkhof, 2011) sent biogas at various CH4 / CO2 ratios from the intake air by fumigation method in a 12 kW diesel engine-generator set, and according to their results, the decrease of thermal efficiency in low loads observed up to 10 %.Makareviciene et al. (Makareviciene et al., 2013) examined the effect of CO2 concentration in biogas on engine operating characteristics and exhaust emissions. As the rate of methane in the biogas increased, the injection advance also increased. Thus, an increase in thermal efficiency and a decrease in CO, HC and smog emission have been achieved. Mustafi and Raine (Mustafi & Raine, 2008) worked with dual fuel in a single cylinder, 4 stroke, direct injection Lister Petter PHW1 diesel engine, in a way that ignition would occur with pilot diesel injection and send gas fuel through the needle valve through the intake manifold. While the natural gas taken from the pipeline is used as the gas fuel, CO2 has been added in various proportions to various natural gas to simulate the biogas. The biogas used in the experimental study has 3 separate biogas, which are 80% CH4 and 20% CO2, 67% CH4 and 33% CO2 and 58% CH4 and 42% CO2 by volume. In all studies carried out, a decrease was observed in all emissions compared to diesel fuel alone, except THC emissions, with the use of biogas types or natural gas. Some researchers have tried to overcome the problems of high THC and CO emissions and low thermal efficiency at partial loads by enriching the intake air with O2 in a diesel engine operating with biogas dual fuel. Cacua et al. (Cacua, 2012) used dual-mode biogas and diesel fuels in a 4-stroke, naturally aspirated, 2-cylinder, air-cooled, direct injection Lister Petter diesel engine. Then, by sending O2 to the intake manifold, they examined the effect of enriching the oxygen content of the engine intake air by volume on the combustion efficiency and emissions under various partial load conditions and compared with each other. With 27% O2 enrichment, CH4 emissions were reduced by 35%.

42 ¨ ¨ EXAMInAtIon oF UsAGE oF nAtURAL GAs/DIEsEL DUAL FUELs In sERIEs-DRIVEn HYBRID VEHICLEs
Some researchers used natural gas or methane gas fuel as dual fuel with diesel fuel. Aroonsrisopon et al. (Aroonsrisopon et al., 2009) ignited natural gas fuel with pilot diesel injection in a 4-stroke, naturally aspirated, Ricardo Hydra diesel engine with common rail direct injection system. In the study, although the natural gas sent constitutes 70% as fuel energy content, the effect of single-stage and 2-stage pilot diesel injection and various injection advance on combustion characteristics and emissions has been investigated. While 2-stage injection has an advantage in terms of engine noise, single-stage injection has an advantage in terms of CO emissions. Liu et al. (Liu et al., 2008) sent CNG to the intake manifold with a mixer in a 6-cylinder, tubo-charged, common rail fuel system direct injection engine, while the ignition provided with pilot diesel injection. 3 different diesel injection advance and diesel amount were investigated at 3 different speeds of the ESC cycle at 50, 75 and 100% load levels. CO emissions have increased with the use of CNG in the engine. NOx emissions have been reduced by up to 30% compared to diesel fuel with the optimum amount of diesel injection advance.
Some researchers have injected pilot diesel fuel (between 1% and 5% of the total fuel) as a very low energy content and called this method micro diesel injection. Umierski & Stommel (Umierski and Stommel, 2000) worked on the ignition of methane (CH4) gas by micro diesel pilot injection in a prototype direct injection diesel engine with 6 cylinders, 4 strokes, turbocharged, common rail fuel system. While CH4 is sent from the manifold with the help of a compressor, the common rail injector system is used for direct diesel injection. Since the amount of diesel sent is equivalent to a very small value of 1-5% of the energy value of the total fuel, the method is called micro diesel pilot injection method. While almost no smog emissions were produced, a significant reduction in NOx emissions was also observed.
Some researchers examined the effect of early pilot diesel injection method and EGR on combustion characteristics and emissions in an engine operating with a methane-diesel dual fuel. Tomita et al. (Tomita et al., 2002), in a single-cylinder, 4-stroke, water-cooled, direct-injection diesel engine, started the diesel engine with dual fuel by sending diesel to the cylinders for ignition and sending methane at the intake manifold. Diesel injection advance has been changed between ÜÖN before 50oKMA and ÜÖN and especially the effect of early pilot diesel injection method and EGR on combustion characteristics and emissions has been investigated. In the exhaust emissions, while the smog emissions were

Recent Researches in EnGInEERInG sCIEnCEs ¨ ¨ 43
close to 0 in almost all injection advance, NOx emissions increased and CO and HC emissions decreased while proceeding from10oKMA ÜÖN before to 50oKMA before. Some researchers used methane-diesel dual fuel with different running cycles such as HCCI and PCCI.
Königsson et al. operated a single cylinder (Königsson et al., 2011), 4 stroke, direct injection engine with common rail injector system with CH4 and diesel fuels. They used 3 different methods in the studies. These are: 1) Fumigation method and pilot diesel injection, 2) HCCI method, 3) PCCI method. In HCCI and PCCI methods, HC and CO are considerably decreased compared to dual fuel mode. In PCCI mode, CO and HC emissions are relatively higher than HCCI. Also, NOx emissions are also relatively high in PCCI mode. Garg et al. (Garg et al., 2013) operated methane and diesel fuel in dual mode in a single cylinder, 4 stroke, direct injection diesel engine with homogeneous filled compression ignition method. In the HCCI method, while methane is sent from a venturi placed in the intake manifold, a very small amount of diesel is injected directly into the cylinder during compression, furthermore, pilot diesel is injected into the cylinder close to ÜÖN and the actual ignition is achieved. While the highest thermal efficiency was found in CNG-HCCI, the lowest value in terms of NOx emissions was revealed in CNG-HCCI with water injection.
Some researchers studied the effect on engine performance and emissions with the pilot diesel injection method by enriching methane gas into hydrogen. Zhou et al. (Zhou et al., 2014) investigated the dual-mode pilot diesel injection method of H2, CH4 and H2-CH4 gas mixtures in a 4-stroke, 4-cylinder, naturally aspirated Isuzu brand diesel engine. CH4, H2, 30% H2, 70% CH4, 50% H2, 70% CH4 and 70% H2 30% CH4 were used as gas fuels. With the increase in the amount of CH4 in the H2-CH4 mixture, the increase in NOx decreased especially at high loads, but still remained above the working conditions only with diesel. A significant improvement in smog particle emissions has been observed with the use of all gas and gas mixtures in dual mode and all load conditions.
Some researchers sent the CH4-H2 gas mixture directly into the cylinder with the direct gas injection method and ignited it with pilot diesel injection. McTaggart-Cowan et al. (McTaggart-Cowan et al., 2001) investigated the ignition of the CH4-H2 gas mixture by pilot diesel injection in a Cummins brand, 6-cylinder, 4-stroke, direct injection engine. With the Westport high pressure gas injector, they sent the CH4-H2 gas mixture into the cylinder by direct gas injection method towards the end of the compression stroke. It was observed

44 ¨ ¨ EXAMInAtIon oF UsAGE oF nAtURAL GAs/DIEsEL DUAL FUELs In sERIEs-DRIVEn HYBRID VEHICLEs
that the higher the H2 ratio in the gas mixture, the shorter the ignition delay time (20% decrease) and the better the smog emissions.
From the results obtained, it has been seen that the use of biogas or natural gas in diesel engines has an advantage in terms of engine performance, emissions and combustion characteristics. Because of the widespread use of natural gas, its accessibility, being an economical and widely used fuel, and biogas being an alternative fuel that countries can obtain with their owns, it has been predicted that using it together with the pilot diesel injection method in diesel engines can be a solution to emission problems. It is foreseen that by developing ECU software for the serial hybrid for the engine, it is predicted that electronically controlled diesel injectors control the amount of pilot diesel injection amount and injection of biogas / natural gas fuel to the intake manifold with gas injectors (fumigation method) can be a solution.
3. ConclusionAs detailed above, especially in city buses, serial hybrid drive system can be used easily with the appropriate ECU software to be developed. In addition, natural gas fuel can be used by injection of pilot diesel fuel in internal combustion engines in buses with serial hybrid drive. Again, in the dual fuel (natural gas - diesel) engine, which will operate at fixed speed and different loads, improvement in thermal efficiency can be achieved by using cycles such as HCCI or PCCI. In this way, it is predicted that an improvement in fuel consumption and emissions can be achieved by using the method such as HCCI, which is not used commercially due to the inability to control combustion at wide engine speeds, in serial hybrid drive buses which operating at fixed cycle.
ReferencesAbd-Alla, G.H., Soliman, H.A., Badr, O.A., Abd-Rabbo, M.F. 2000 “Effect
of pilot fuel quantity on the performance of a dual fuel engine”, Energy Conversion and Management, 41, 559–72.
Abd-Alla, G.H., Soliman, H.A., Badr, O.A., Abd-Rabbo, M.F., 2001. “Effects of diluent admissions and intake air temperature in exhaust gas recirculation on the emissions of an indirect injection dual fuel engine”, Energy Conversion and Management, 42, 1033–1045.

Recent Researches in EnGInEERInG sCIEnCEs ¨ ¨ 45
Abd-Alla, G.H., Soliman, H.A., Badr, O.A., Abd-Rabbo, M.F. 2002. “Effect of injection timing on the performance of a dual fuel engine”, Energy Conversion and Management, 43, 269–77.
Ahn, J.K., Jung, K.H., Kim, D.H., Jin, H.B., Kim, H.S., Hwang, S.H. 2009.“Analysis of a regenerative braking system for hybrid electric vehicles using an electro-mechanical brake”, Int J Automot Technol, 10, 229–234.
Alçiçek, A., Demiruluş, H. 1994. “Çiftlik Gübrelerinin Biyogaz Teknolojisinde Kullanılması”, Ekoloji Çevre Dergisi, 13, 5:9.
Alibaş, K. “Biyogaz Nedir ve Nasıl Üretilir”, Ziraat Uludağ Üniversitesi. http://ziraat.uludag.edu.tr/ureticiler/BiyogazNedirveNasilUretilir.pdf Son erişim tarihi:27.12.2014
Aroonsrisopon, T., Salad, M., Wirojsakunchai, E, Wannatong, K., Siangsanorth, S., Akarapanjavit, N. 2009. “Injection Strategies for Operational Improvement of Diesel Dual Fuel Engines under Low Load Conditions”, SAE paper no. 2009-01-1855.
Barbosa, F.C. 2012. “Hybrid transit bus technology assessment - a feasibility approach”, SAE, paper no. 2012-36-0139.
Bari, S., Esmail, M. 2010. “Effect of H2/O2 addition in increasing the thermal efficiency of a diesel engine”, Fuel, 89, 378–383
Barik, D., Murugan, S. 2014, “Investigation on combustion performance and emission characteristics of a DI (direct injection) diesel engine fueled with biogasediesel in dual fuel mode”, Energy, 72, 760-771.
Barnitt, R.A. 2008. “In-Use Performance Comparison of Hybrid Electric, CNG, and Diesel Buses at New York City Transit”, SAE, paper no. 2008-01-1556.
Barrero, R., Coosemans, T., Van-Mierlo, J. 2009. “Hybrid buses: defining the power flow management strategy and energy storage system needs”, World Electr Veh J, 3, 2032–6653.
Bedoya, I.D., Arrieta A.A., Cadavid F.J. 2009. “Effects of mixing system and pilot fuel quality on diesel–biogas dual fuel engine performance”, Bioresource Technology, 100, 6624:6629.
Bose, P.K., D. Maji, D. 2009. “An experimental investigation on engine performance and emissions of a single cylinder diesel engine using hydrogen as inducted fuel and diesel as injected fuel with exhaust gas recirculation”, Int. J. Hydrogen Energy, 34, 4847-4854.

46 ¨ ¨ EXAMInAtIon oF UsAGE oF nAtURAL GAs/DIEsEL DUAL FUELs In sERIEs-DRIVEn HYBRID VEHICLEs
Briggs, I., McCullough G., Spence, S., Douglas, R. 2014. “Whole-vehicle modelling of exhaust energy recovery on a diesel-electric hybrid bus”, Energy, 65, 172-181.
Cacua K., Amell, A., Cadavid, F. 2012. ” Effects of of Oxygen Enriched Air on The Operation and Performance of a Diesel-biogas Dual Fuel Engine”, Biomass and Bioenergy, 45, 159-167.
Carlucci, A.P., de Risi, A., Laforgia, D., Naccarato, F. 2008. “Experimental investigation and combustion analysis of a direct injection dual-fuel diesel–natural gas engine”, Energy, 33, 256–263.
Chandler, K., Kalkowicz, K., Eudy, L.“New York City Transit Diesel Hybrid-Electric Buses: Final Results”
http://www.afdc.energy.gov/pdfs/nyct_diesel_hybrid_final.pdf Son erişim tarihi:27.12.2014
Chandra, R., Vijay V.K., Subbarao P.M.V., Khura T.K. 2011. “Performance Evaluation of a Constant Speed IC Engine on CNG, Methane Enriched Biogas and Biogas”, Applied Energy, 88,3969-3977.
Chengji, Z.M.Y. 1999. “Operating characteristics and description of a dual fuel engine for diesel–NG heavy-duty operation” SAE paper no. 1999-01-3523.
Clark, N.N., Azu, A., Jarrett, R., Balon T., Moynihan, P., Lynch, S., Webb, T. 2001“Operating Envelopes of Hybrid Bus Engines”, SAE, paper no. 2000-01-3537.
Çeper, B.A. 2009. “Hidrojen-doğal gaz karışımlarının içten yanmalı motorlarda kullanılması” Erciyes üniversitesi Doktora Tezi
Dong-Jian, G.X., Li G., Zhang, X. 2001. “Study on diesel–LPG dual fuel engines”, SAE paper no. 2001-01-3679.
Duc, P.M., Wattanavichien K. 2007. “Study on biogas premixed charge diesel dual fuelled engine”, Energy Conversion and Management, 48, 2286-2308.
EEA (European Environment Agency) Report. “Trends and projections in Europe 2013: Tracking progress towards Europe’s climate and energy targets until 2020.” Report No 10/2013, 2013
EESI.“Hybrid Buses Costs And Benefits”, EESI http://www.eesi.org/files/eesi_hybrid_bus_032007.pdfSon erişim tarihi:15.12.2014Eletra, 2005. “Presentation of Hybrid Bus in Operation” Sao Paulo.Ertem, F.C. “Türkiye’de biyogaz yatırımları için geçerli koşulların ve
potansiyelin değerlendirilmesi”, Biyogaz (Türk-Alman Biyogaz Projesi)

Recent Researches in EnGInEERInG sCIEnCEs ¨ ¨ 47
http://www.biyogaz.web.tr/files/docs/dbfz_turkiye_biyogaz_potansiyel_raporu.pdf Son erişim tarihi:10.12.2014
Garg, S., Parmar, A.J., Puri, S., Kumar, N. 2013. “Potential Utilization of CNG in Stationary HCCI Engine” SAE paper no. 2013-01-2508.
Gunea, C., Razavi, M.R., Karim, G.A. 1998. The Effects of Pilot Fuel Quality on Dual Fuel Engine Ignition Delay. SAE Paper no. 982453.
Hartmann, H., Angelidaki, I., Ahring, B K. 2002.“Co-digestion of The Organic Fraction Municipal Waste With Other Waste Types, In: Biomethanization of The Organic Fraction Municipal Waste” IWA Publishing, London, UK, 2002.
Hairuddin, A. A., Yusaf, T., Wandel, A.P. 2014. “A review of hydrogen and natural gas addition in diesel HCCI engines”, Renewable and Sustainable Energy Reviews, 32, 739–761
Hountalas, D.T., Papagiannakis, R.G. 2000. “Development of a simulation model for direct injection dual fuel diesel–NG engines”, SAE paper no. 2000-01-0286.
IEA Bioenergy. 100% biogas for urban transport in Linköping. Sweden biogas in buses, cars and trains. Biogas in the society Information from IEA bioenergy task 37 energy from biogas and landfill gas.
http://www.iea-biogas.net/_download/ Son erişim tarihi:27.12.2014IEA Bioenergy Task 37. 2011. “Anaerobic Digestion Report Turkey’s Situation in
Biogas”. IEA Biogas. http://www.ieabiogas.net/_download/publications/countryreports/april2011/Turkey_Country_Report.pdf
Son erişim tarihi:27.12.2014International Energy Agency.2011. CO2 Emissions From Fuel Combustion,
2011”, IEA Publications, Paris, France.Ishida, M., Amimoto, N., Tagai, T., Sakaguchi D. 2001. “Effect of EGR and
preheating on NG combustion assisted with gas–oil in a diesel engine”, In: Proceedings of the COMODIA, Nagoya, Japan; 2001.
İ.E.T.T. İşletmeleri Genel Müdürlüğü. “İ.E.T.T. Stratejik Plan 2008-2012” Strateji Geliştirme Daire Başkanlığı.
http://www.iett.gov.tr/webimage/file/iett_stratejik_plan_2008_2012.pdfSon erişim tarihi:27.12.2014Karim, G.A., Badr, O., Liu, B. 1999. “An examination of the flame spread
limits in a dual fuel engine”, Applied Thermal Engineering, 19, 1071–1080.

48 ¨ ¨ EXAMInAtIon oF UsAGE oF nAtURAL GAs/DIEsEL DUAL FUELs In sERIEs-DRIVEn HYBRID VEHICLEs
Kaya, D., Çağman, S., Eyidoğan, M., Aydoner, C., Çoban, V., Tırıs, M. 2009.”Türkiye’nin Hayvansal Atık Kaynaklı Biyogaz Potansiyeli ve Ekonomisi”, Atık Teknolojileri Dergisi, 1, 48:51
Koçer, N. N., Öner, C., Sugözü İ. 2006. “Türkiye’de Hayvancılık Potansiyeli ve Biyogaz Üretimi”, Doğu Anadolu Bölgesi Araştırmaları, 17:20.
Königsson, F.P.S., H. A., Combustion modes in a diesel-CNG dual fuel engine SAE paper no. 2011-01-1962; 2011
Köse, H., M. Cinviz, M.. 2013. “An experimental investigation of effect on diesel engine performance and exhaust emissions of addition at dual fuel mode of hydrogen”, Fuel Processing Technology, 114, 26–34.
Kusaka, J., Daisho, Y., Kihara, R., Saito, T. 1998. “Combustion and exhaust gas emissions characteristics of a diesel engine dual-fueled with NG”, In:Proceedings of the COMODIA, Japan.
Liu, J., Yang, F., Wang, H., Ouyang, M., Hao, S. 2013. “Effects of pilot fuel quantity on the emissions characteristics of a CNG/diesel dual fuel engine with optimized pilot injection timing”, Applied Energy, 110, 201–206
Luijten, C.C.M., Kerkhof, E. 2011. “Jatropha Oil and Biogas in a Dual Fuel CI Engine for Rural Electrification”, Energy Conversion and Management, 52, 1426-1438.
Makareviciene, V., Sendzikiene, E.,Pukalskas, S., Rimkus, A., Vegneris, R. 2013.“Performance and Emission Characteristics of Biogas Used in Diesel Engine Operation”, Energy Conversion and Management, 75, 224-233.
McTaggart-Cowan, G.P., Jones, H.L., Rogak, S.N., Bushe, W.K., Hill, P.G., Munshi, S.R. 2006. “Direct-injected hydrogen-methane mixtures in a heavy-duty compression ignition engine”, SAE paper no. 2006-01-065.
Mustafi, N.N., Raine, R.R. 2008. “A Study of the Emissions of a Dual Fuel Engine Operating with Alternative Gaseous Fuels”, SAE paper no. 2008-01-1394.
Nathan, S.S., Mallikarjuna J.M., Ramesh, A. 2010. ”An experimental study of the biogasediesel HCCI mode of engine operation”, Energy Conversion and Management, 51, 1347-1753.
Nwafor, O.M.I. 2007. “Effect of advanced injection timing on emission characteristic of diesel engine running on natural gas”, Renewable Energy, 32, 2361–2368.
Ott, T., Onder, C., Guzzela, L. 2013. “Hybrid-Electric Vehicle with Natural Gas-Diesel Engine”, Energies, 6, 3571-3592.

Recent Researches in EnGInEERInG sCIEnCEs ¨ ¨ 49
Papagiannakis, R.G., Hountalas, D.T., 2003. Experimental investigation concerning the effect of natural gas percentage on performance and emissions of a DI dual fuel diesel engine. Applied Thermal Engineering 23, 353–365.
Pirouzpanah, V., Saray, R., Sohrabi, A., Niaei, A. 2007. “Comparison of thermal and radical effects of EGR gases on combustion process in dual fuel engines at part loads”, Energy Conversion and Management, 48, 1909–1918.
Poonia, M.P., Ramesh, A., Gaur R.R. 1998. “Effect of intake air temperature and pilot fuel quantity on the combustion characteristics of a LPG diesel dual fuel engine” SAE paper no. 982455.
(RED) Renewable Energy Directive. “Directive 2009/28/EC on the promotion of the use of energy from renewable sources” European Union-2009/28/EC, http://eurlex.europa.eu/LexUriServ/LexUriServ.do?uri=OJ:L:2009:140:0016:0062:EN:PDF
Son erişim tarihi:15.12.2014Sahoo B.B., Sahoo N., Saha U.K. Effect of engine parameters and type of
gaseous fuel on the performance of dual-fuel gas diesel engines – a critical review. Renew Sust Energy Rev 2009;13:1151–84.
Sayın, C. 2013. “Diesel engıne emissions improvements by the use of sun flower methyl ester /diesel blends”, Isı Bilimi ve Tekniği Dergisi - J. of Thermal Science and Technology, 33, 83-88.
Selim M.Y.E. 2004. “Sensitivity of dual fuel engine combustion and knocking limits to gaseous fuel composition”, Energy Conversion and Management, 45, 411–425.
Shinichi, G., Hirohide, F., Rafael, D.D. 1992. “Dual fuel dieselsel engine using Butane” SAE paper no. 920690.
Slawomir, L. 2001. “The influence of regulating parameters of dual fuel compression ignition engine fuelled with LPG on its maximum torque, overall efficiency and emission”, SAE paper no. 2001-01-3264.
Sopena, C., Dieguez, P. M., Sainz, D., Urroz, J.C., Guelbenzu, E.i Gandia, L.M. 2010. “Conversion of a commercial spark ignition engine to run on hydrogen: Performance comparison using hydrogen and gasoline”, Int. J. Hydrogen Energy 35:1420-1429.
Soylu, S. 2014. “The effects of urban driving conditions on the operating characteristics of conventional and hybrid electric city buses”, Applied Energy, 2014, 472-482.

50 ¨ ¨ EXAMInAtIon oF UsAGE oF nAtURAL GAs/DIEsEL DUAL FUELs In sERIEs-DRIVEn HYBRID VEHICLEs
Subramanian, K.A., Vinaya, C., Mathad, V.K., Vijay, P., Subbarao, M.V. 2013. “Comparative evaluation of emission and fuel economy of an automotive spark ignition vehicle fuelled with methane enriched biogas and CNG using chassis dynamometer”, Applied Energy, 105, 17–29.
Sudhir, C.V., Desai, V., Kumar, S.Y., Mohanan, P. 2003. “Performance and emission studies on the effect of injection timing and diesel replacement on a 4-S LPG–diesel dual-fuel engine” SAE paper no. 2003-01-3087.
TÜİK, Basın Odası Haberleri. “Son on yılda motorlu kara taşıtı sayısı %75,3 artış gösterdi” 2014/9 TÜİK.
http://www.tuik.gov.tr/basinOdasi/haberler/2014_9_20140227.pdfSon erişim tarihi:15.12.2014Uçarol, H., Kural, E. 2009. “Ulaşımda Enerji Verimliliği İçin Hibrid ve Elektrikli
Araçlar”, Mühendis ve Makine, 50, 66-71.US Department of Energy. “Vehicle Technologies Program”, AFDC
ENERGY http://www.afdc.energy.gov/pdfs/52723.pdf Son erişim tarihi:12.12.2014
Umierski, M., Stommel, P. 2000. “Fuel Efficient Natural Gas Engine with Common-Rail Micro-Pilot Injection. SAE paper no. 2000-01-3080.
Ünlü, N., Karahan, Ş., Tür, O., Uçarol, H., Özsu, E., Yazar, A., Turhan, L., Akgün, F., Tırıs, M. “Elektrikli Araçlar”, TÜBİTAK – Marmara Araştırma Merkezi Enerji Sistemleri ve Çevre Araştırma Enstitüsü, Gebze-Kocaeli, 2003
Wang, A., Ge, Y., Tan, J., Fu, M., Shah A.N., Ding, Y., Zhao, H., Liang, B. “On-road pollutant emission and fuel consumption characteristics of buses in Beijing J of Environmental Science” 2011;23:419-426.
William, P.J., John, B.N., Van der Lee, A., Lovkov, O., Koshin, V.K., Piatov, I.S. 1990. “All electronic dual fuel injection system for the Belarus D-144 diesel engine”, SAE paper no. 901502.
Wong W.Y., Clark M.K., Stuart R.B. 1991. “Performance and emissions of a NG dual-fueled, indirect injected diesel engine”, SAE paper no. 911766.
Xiong, W., Zhang, Y., Yin, C. 2009. “Optimal energy management for a series–parallel hybrid electric bus”, Energy Convers Management, 50, 1730–8.
Yang, H., Xu, Z., Fan, M., Gupta, R., Slimane, R., Wright, I. 2008. “Progress in carbon dioxide separation and capture: a review” Journal of Environmental Science 2008;20:14–27.

Recent Researches in EnGInEERInG sCIEnCEs ¨ ¨ 51
Yıldız, Ş., Saltabaş, F., Balahorli V., Sezer K., Yağmur K. 2009. “Organik Atıklardan Biyogaz Üretimi (Biyometanizasyon) Projesi – İstanbul Örneği”, Türkay 2009, 1:8.
Yoon, S.H., Lee, C.S. 2011. “Experimental Investigation on The Combustion and Exhaust Emission Characteristics of Biogas–Biodiesel Dual-Fuel Combustion in a CI Engine”, Fuel Processing Technology, 92, 992-1000.
Yuan, W., Bandosz, T.J. 2007. “Removal of hydrogen sulphide from biogas on sludgederived Adsorbents”, Fuel, 86, 2736–2746.
Zhang, S., Wu, Y., Hu, J., Huang, R., Zhou, Y., Bao, X., Fu, L., Hao, J. 2014. “Can Euro V Heavy-Duty Diesel Engines, Diesel Hybrid and Alternative Fuel Technologies Mitigate NOX Emissions? New Evidence from On-Road Tests of Buses in China”, Applied Energy, 132, 118–126.
Zhang, Y., Liu, X., Yang, Q., Han, X., Cheng C. 2001. “The studies of an electronically controlled CNG system for dual fuel engines” SAE paper no. 2001-01-0145.
Zhou, J.H., Cheung, C.S. , Leung, C.W. 2014. “Combustion, performance and emissions of a diesel engine with H2, CH4 and H2-CH4 addition” Int. J. Hydrogen Energy, 39,4611-4621.

52
C H A P T E R 3
CRItICAL VELoCItY FoR FLoWInDUCED InstABILItY In
PIPEs A sIMULAtIon APPRoACH
Mohammad Rasidi RASANI1 & Hasan KOTEN2
1 (Ir. Dr.), Department of Mechanical and Manufacturing Engineering, Faculty of Engineering and Built Environment,
Universiti Kebangsaan Malaysia, e-mail: [email protected]
Orcıd: 0000-0003-4212-1911
2 (Assoc. Prof. Dr.) Istanbul Medeniyet University, Department of Mechanical Engineering, Kadikoy, Istanbul.
E-mail: [email protected] Orcid: 0000-0002-1907-9420
1. Introduction
Pipes or tubes conveying fluids are important components found extensively in many engineering applications and equipments, for example - oil and gas pipelines, nuclear reactor pipings, power plant pipe
networks, aircraft/rocket pipings, heat exchanger tubes and many more. These slender structures are exposed to vibrations induced by either (i) internal or external flow (i.e. flow-induced vibrations – FIV) or (ii) sound energy generated in the flow (i.e. acoustic-induced vibrations – AIV), both of which may lead to fatigue or catastrophic failures on these pipes. FIV draws the interaction between the fluid dynamics and structural vibrations in the piping system, while AIV involves the additional coupling with the acoustics in the piping system.
Incidents and consequences of failures due to pipe vibrations have motivated many studies and literatures related to flow-induced vibrations in

Recent Researches in EnGInEERInG sCIEnCEs ¨ ¨ 53
pipes (see for example, Energy Institute, 2008; Harper, 2016; Kaneko et al, 2008). Flow-induced pipe vibrations have been shown to produce rich and interesting dynamic behaviours. A number of in-depth reviews on this field have been published (Miwa & Hibiki, 2020; Païdoussis & Li, 1993; Wang & Ni, 2009), and various studies have been explored experimentally (Bamidele et al, 2019; Takahashi et al, 2016; Thompson et al, 2010), analytically or semi-analytically (Gorman et al, 2000; Maxit et al, 2020; Zhao & Sun, 2018) and numerically (Pittard et al, 2004; Zhang et al, 2015).
One of the important topic in this field is related to the stability in the pipe vibrations. Natural frequency corresponding to the pipe fundamental modes was found to decrease as fluid velocity in the pipe increases (Kaneko et al, 2008). If the flow velocity is sufficiently high, the flow-induced pipe vibration may lose its stability either through a static (ie. divergence or buckling) mechanism or a dynamic (ie. flutter) mechanism (Païdoussis, 1987). This critical flow velocity is influenced by the mass ratio (ratio of fluid mass per unit length to the total mass per unit length of the fluid and pipe), pipe length, pipe stiffness and pipe boundary conditions. Instability for pipes under cantilevered boundary conditions were studied for example in (Doaré & de Langre, 2002; Schouveiler & Chermette, 2018; Tornabene et al, 2010), while instability for various pinned, clamped or free pipe boundary conditions were analyzed for example in (Liang et al, 2018; Ojetola et al, 2011).
Above the critical flow velocities, pipe deflection amplitudes increases over time and may lead to excessive pipe response. As a result, prediction of pipe stability is of practical importance in the design and optimization of pipelines. Although critical velocity equations for pipes under various end boundary conditions are available, these are predicted based on a simple, either straight or curved pipe. In practice, some pipelines are perhaps more complex and may include pipe branches, small bore connections, dead legs, flanges or various instrumentation attachments. Therefore, more accurate prediction of critical flow velocity is perhaps necessary.
Therefore, in the present chapter, we aim to propose a simulation approach to predict critical flow velocity of pipe-conveying fluids, which may be practical for more complex pipe configurations. Towards that end, a fluid-structure interaction simulation that coupled a computaional fluid dynamics (CFD) solver to a structural finite element (FEM) solver was undertaken, using a commercial ANSYS Workbench release 2020 R1 software (Ansys Inc, 2020).

54 ¨ ¨ CRItICAL VELoCItY FoR FLoWInDUCED InstABILItY In PIPEs A sIMULAtIon APPRoACH
2. MethodologyIn order to validate the proposed method, we considered simulating a pipe configuration, of which its critical flow velocity may also be determined theoretically. As a result, a straight circular pipe that was fixed at both ends was used in the present study, as shown in Figure 1.
Figure 1: Straight pipe-conveying fluid fixed at both ends - overall geometry.
We considered a fluid-structure system where air (fluid density r = 1.185 kg/m3 and dynamic viscosity m = 1.83×10⁻⁵ kg/ms) is flowing inside a pipe made of rubber (elastic modulus E = 10 MPa, structural density rs = 1100 kg/m3 and dimensions summarised in Table 1).
Table 1: Pipe dimensions
Parameter Values UnitsLength, L 1000 mmWall thickness, h 1.0 mmInternal diameter, D 10.0 mm
2.1 Theoretical analysis
Stability analysis for a straight pipe-conveying fluid is derived by considering balance of forces in the lateral (y) direction - between the inertia of the fluid-pipe mass, change in momentum of the fluid following the curvature of the pipe, lateral component of pressure on the fluid and restoring internal pipe bending forces, as the pipe vibrates in the lateral direction (Kaneko et al, 2008; Wang & Ni, 2009).
Assuming small lateral deformation and constant fluid velocity, the resulting linear equation of motion may be transformed into a characteristic

Recent Researches in EnGInEERInG sCIEnCEs ¨ ¨ 55
eigenvalue problem (Ojetola, 2011). Solving for the complex eigenfrequencies yields both the real Re(w) and imaginary Im(w) components, which represent the oscillating frequency and damping of the system respectively. Dynamic instability (flutter) of the system occurs when Im(w) < 0, while static instability (divergence) of the system occurs when Re(w) = 0 (Kaneko et al, 2008). The critical velocity corresponding to the onset of these instability conditions for a pipe supported at both ends may be given by Eq. (1) below (Kaneko et al, 2008; Maalawi & Ziada, 2004).
u UL AEI
=r
(1)
where u is the dimensionless flow velocity, U denotes the flow velocity, L is the pipe length, r is the fluid density, A represents the pipe internal cross-scetional area, E is the elastic modulus of the pipe and I denotes the area second moment of inertia of pipe wall. For pipes supported at both ends, the critical dimensionless velocity may be summarised as shown in Table 2 (Ojetola, 2011; Wang & Ni, 2009).
Table 2: Dimensionless critical flow velocity for pipes supported at both ends (S = simply supported, C = clamped)
End conditions
ucr1st mode 2nd mode 3rd mode
S-S p 2p 6.3751
C-C 2p 9.31 4p
1 coupled-mode flutter
Table 2 indicates that the lowest critical velocity corresponds to a static or divergence instability, where the pipe experience a buckling mode. Based on linear theory, a dynamic instability (ie. a coupled-mode flutter) is predicted to occur at higher flow velocity after the divergence instability. However, as the pipe undergo large deformation post-divergence, linear theory may not be representative and the axial tension that develops along a pipe that is supported at both ends may help to stabilise its lateral deformation. Instead, non-linear theory and experiments indicate that post-divergence flutter may not occur (Wang & Ni, 2009).

56 ¨ ¨ CRItICAL VELoCItY FoR FLoWInDUCED InstABILItY In PIPEs A sIMULAtIon APPRoACH
2.2 Numerical/simulation approach
In order to determine the critical flow velocity based on a simulation or numerical approach, we considered modelling the fluid-structure behaviour as an initial value problem - where a small lateral perturbation is applied on the pipe and observe if the perturbation grows or decays (ie. instability and stability respectively). The following simulation approach is proposed:
Step 1: Model fluid and pipe wall geometriesStep 2: Apply a small lateral force on the pipe to initiate a lateral pertubation
Step 3:Apply a uniform inlet flow velocity (Uin) and complete a steady fluid-structure interaction (FSI) simulation with the small lateral force in step 2 maintained on the pipe.
Step 4:Perform an unsteady fluid-structure interaction (FSI) using the results in step 3 as the initial condition, and relieving the small lateral force in step 2.
Step 5:Monitor pipe deflection result over time and assess if the deflection is growing or decaying
Step 6:Decision: If deflection grows then at flow velocity Uin, pipe-fluid system is unstable (and go to step 7). If instead deflection decays then at flow velocity Uin, pipe-fluid system is stable (and go to step 8).
Step 7:As the system is unstable, repeat step 3 onwards, but apply lower Uin than previously used. However, stop if in step 6 system is now stable at current Uin. Go to step 9.
Step 8:As the system is stable, repeat step 3 onwards but apply higher Uin than previously used. However, stop if in step 6 system is now unstable at current Uin. Go to step 9.
Step 9:Assessment: critical velocity should fall in the bracket or range between previous Uin and current Uin, where there is a change in stability conditions.
In the present study, the fluid-stucture interaction between the pipe and air flow was implemented in the ANSYS 2020 R1 Workbench integrated platform. The unsteady, incompressible, laminar Navier-Stokes and conservation of mass equations were solved using a finite volume method for the fluid domain (ie. air) subjected to the boundary conditions prescribed in Table 3.

Recent Researches in EnGInEERInG sCIEnCEs ¨ ¨ 57
Table 3: Boundary conditions for fl uid domain
Boundary ConditionsInlet Uniform velocity Uin Outlet Atmospheric pressure (0 Pa)Pipe wall interface No slip wall
The resulting fl uid pressure and shear forces from the fl ow solver were mapped to the interfacing inner wall of the pipe, which represented the external forces imposed on the structural equation of motion of the pipe. The pipe defl ection or motion was then solved using a fi nite element method and this would in turn redefi ne the geometry or shape of the fl uid domain that is bounded by the pipe walls. The fl ow solver then re-solves the fl ow equations with the updated fl ow domain geometry. This exchange is iterated a number of times until convergence of the fl uid-structure coupling is satisfi ed at every timestep.
Figure 2 shows the meshing on each fl ow and structural domain used in the discretization for the respective solver. The fl uid domain consisted of 15500 hexahedral (8-noded) elements, with a number of layered mesh closer to the interfacing pipe wall to resolve the boundary layer fl ow. In addition, the pipe wall was meshed using 2400 hexahedral (8-noded) elements, with 2 layers of elements across the wall thickness to better model its fl exural behaviour.
(a) (b)
Figure 2: Straight pipe-conveying fl uid fi xed at both ends: (a) mesh of the fl uid domain; (b) mesh of the pipe wall
A timestep of 0.01s was used in all the computations. The unsteady fl uid-structure interaction (FSI) was initiated from a steady-state fl uid-structure solution, where the pipe was slightly defl ected using a small lateral force. Using a computer with 16GB RAM quad-core processor, the unsteady FSI simulation may run up
No-slip wall

58 ¨ ¨ CRItICAL VELoCItY FoR FLoWInDUCED InstABILItY In PIPEs A sIMULAtIon APPRoACH
to 75-560 minutes depending on the cases or whether the run were extended to justify the behaviour in pipe deflections.
3. Results and discussionSeveral cases at different inlet flow velocities (Uin) for the rubber pipe-air system were simulated. Figure 3 presents the midspan deflection history of the rubber pipe for several Uin. For the 20 m/s flow velocity case (denoted by the black ‘o’ markers in Fig. 3), the pipe midspan deflection is oscillating but with reducing amplitudes over time – indicating a stable pipe-air system. In particular, the distance between subsequent peaks is clearly observable to indicate the period and frequency of oscillation, which is not zero at this flow velocity.
Increasing the flow velocity to 40 m/s inside the rubber pipe (denoted by orange ‘x’ markers in Fig. 3), the pipe response is also oscillating but with a more pronounced amplitude reduction in comparison to the 20 m/s case. More importantly, the distance between subsequent peaks is larger than for the 20 m/s case, indicating increased period or reduced oscillation frequency compared to the 20 m/s case. This show good agreement with current theory that the pipe-fluid system natural frequency reduces with increasing flow velocities (Kaneko et al, 2008). In particular, this also indicates that at 40 m/s flow, the present rubber pipe-air system is approaching its divergence instability region.
-3.00E-05
-2.50E-05
-2.00E-05
-1.50E-05
-1.00E-05
-5.00E-06
0.00E+00
5.00E-06
1.00E-05
1.50E-05
0.0 1.0 2.0 3.0 4.0 5.0 6.0 7.0 8.0 9.0 10.0
Defle
ctio
n [m
]
Time [s]
u=20
u=40
u=45
u=46
u=48
Figure 3: Midspan deflection of pipe over time for several inlet flow velocity in [m/s] (denoted ‘u’ in legend)

Recent Researches in EnGInEERInG sCIEnCEs ¨ ¨ 59
Similar trend is observed as the fl ow velocity is increased to 45 m/s and 46 m/s (denoted by green solid line and blue dash-dotted line respectively in Fig. 3), where the pipe midspan defl ection is quickly dampened and the oscillating period appears larger than the 40 m/s fl ow case. Midspan defl ection for both cases do not indicate growth over time, suggesting the rubber pipe-air system is still stable but is close to losing its stability.
Further increase in flow velocity to 48 m/s (denoted by red dashed line in Fig. 3) shows the pipe midspan deflection undergoing increasing deflection over time. In particular, the pipe response do not show oscillatory motion, indicating a static instability or divergence mode has ensued. Figure 4 further shows the rubber pipe undergoing significant buckling deformation at time = 10s in comparison to the initially perturbed pipe deflection.
(a)
(b)
Figure 4: Pipe defl ection for case with inlet velocity = 48m/s: (a) initial; (b) time = 10s

60 ¨ ¨ CRItICAL VELoCItY FoR FLoWInDUCED InstABILItY In PIPEs A sIMULAtIon APPRoACH
As at flow velocity of 46 m/s the rubber pipe-air system is still stable, we may conclude that the critical flow velocity for the onset of instability in the present system is between 46 m/s to 48 m/s. Considering the mean, the critical flow velocity based on the fluid-structure simulation may be estimated as Ucr = 47±1 m/s. In comparison, based on the present rubber pipe-air dimensions and properties, using Eq. (1) and Table 2, the lowest theoretical critical flow velocity for the system to lose its stability is computed to be Ucr = 47.3 m/s, via a divergence mechanism. This agrees quite well with the critical velocity predicted using the proposed fluid-structure simulation approach.
4. ConclusionDynamic response of a straight pipe that is fixed at both ends to internal flow was simulated using a fluid-stucture interaction approach. The stability of the fluid-pipe system was studied by examining the system response to an initial perturbation. Critical velocity predicted from this simulation approach shows good agreement with theoretical value for the test case in the present study. The simulation approach may be potentially utilized to better predict critical velocities for more complex pipe configuration in practice.
ReferencesANSYS Inc. (2020). ANSYS Users Manual - Release 2020 R1. Canonsburg,
PA, USA: Ansys Inc.Bamidele, O.E., Ahmed, W.H & Hassan, M. (2019). Two-phase flow induced
vibration of piping structure with flow restricting orifices. International Journal of Multiphase Flow 113, 59-70.
Doaré, O. & de Langre, E. (2002). The flow-induced instability of long hanging pipes. European Journal of Mechanics A/Solids 21, 857–867.
Energy Institute. (2008). Guidelines for the avoidance of vibration induced fatigue failure in process pipework (2nd ed). London, UK: Energy Institute.
Gorman, D.G., Reese, J.M. & Zhang, Y.L. (2000). Vıbratıon of a flexible pipe conveying viscous pulsating fluid flow. Journal of Sound and Vibration 230(2), 379-392.
Harper, C.B. (2016). AIV and FIV in pipelines, plants, and facilities. Proceedings of the 2016 International Pipeline Conference & Exposition, IPC2016-64651.

Recent Researches in EnGInEERInG sCIEnCEs ¨ ¨ 61
Kaneko, S., Nakamura, T., Inada, F. & Kato, M. (2008). Flow induced vibrations: Classifications and lessons from practical experiences. Oxford, UK: Elsevier.
Liang, X., Zha, X., Jiang, X., Wang, L., Leng, J. & Cao, Z. (2018). Semi-analytical solution for dynamic behavior of a fluid-conveying pipe with different boundary conditions. Ocean Engineering 163, 183-190. Retrieved from https://doi.org/10.1016/j.oceaneng.2018.05.060
Maalawi, K.Y. & Ziada, M.A. (2004). Design of pipelines for maximum critical flow velocity. Journal of Engineering and Applied Science 51(2), 1-20.
Maxit, L., Karimi, M. & Guasch, O. (2020) Spatial coherence of pipe vibrations induced by an internal turbulent flow. Journal of Sound and Vibration, pp.115841. Retrieved from https://doi.10.1016/j.jsv.2020.115841
Miwa, S. & Hibiki, T. (2020). State-of-the-art in plant component flow-induced vibration (FIV). Experimental and Computational Multiphase Flow 2(1), 1-12. Retrieved from https://doi.org/10.1007/s42757-019-0030-1
Ojetola, A., Jameson, N.J. & Hamidzadeh, H.R. (2011). Flow induced vibration and critical velocities. Proceedings of the ASME 2011 International Design Engineering Technical Conferences, DETC2011-48767.
Païdoussis, M.P. & Li, G.X. (1993). Pipes conveying fluid: a model dynamical problem. Journal of Fluids and Structures 7, 137-204.
Païdoussis, M.P. (1987). Flow-induced instabilities of cylindrical structures. Applied Mechanics Reviews 40(2), 163-175.
Pittard, M.T., Evans, R.P., Maynes, D.R. & Blotter, J.D. (2004). Experimental and numerical investigation of turbulent flow induced pipe vibration in fully developed flow. Review of Scientific Instruments 75(24), 2393-241.
Schouveiler, L. & Chermette, F. (2018). Flutter instability of freely hanging articulated pipes conveying fluid. Physics of Fluids 30(3). Retrieved from https://doi.10.1063/1.5021160
Takahashi, S., Tamura, A., Sato, S., Goto, T., Kurosaki, M., Takamura, N. & Morita, R. (2016). Flow-induced vibrations in closed side branch pipes and their attenuation methods. Journal of Nuclear Science and Technology 53(8), 1164-1177.
Thompson, A.S., Maynes, D. & Blotter, J.D. (2010). Internal turbulent flow induced pipe vibrations with and without baffle plates. Proceedings of the ASME 3rd Joint US-European Fluids Engineering Summer Meeting, FEDSM-ICNMM2010.

62 ¨ ¨ CRItICAL VELoCItY FoR FLoWInDUCED InstABILItY In PIPEs A sIMULAtIon APPRoACH
Tornabene, F., Marzani, A. & Viola, E. (2010). Critical flow speeds of pipes conveying fluid using the generalized differential quadrature method. Adv. Theor. Appl. Mech. 3(3), 121-138.
Wang, L. & Ni, Q. (2009). Vibration of slender structures subjected to axial flow or axially towed in quiescent fluid. Advances in Acoustics and Vibration, Article ID 432340, 1-19. Retrieved from https://doi.10.1155/2009/432340
Zhang, T., Zhang, Y.O. & Ouyang, H.. (2015). Structural vibration and fluid-borne noise induced by turbulent flow through a 90° piping elbow with/without a guide vane. International Journal of Pressure Vessels and Piping 125, 66-77. Retrieved from https://doi.org/10.1016/j.ijpvp.2014.09.004.
Zhao, Q. & Sun, Z. (2018). Flow-induced vibration of curved pipe conveying fluid by a new transfer matrix method. Engineering Applications of Computational Fluid Mechanics 12(1), 780-790.

63
C H A P T E R 4
A LooK oVER tHE ACoUstIC sILEnCER & MUFFLER stUDIEs
Kamil KOCAK(Dr) Istanbul Medeniyet University,
e-mail: [email protected]: 0000-0001-9561-9858
1. Introduction
Mufflers or silencers are used to eliminate the vehicle noise which is an important part of the noise pollution. While designing the vehicle, the exhaust system including mufflers must meet certain criteria such as
noise level and exhaust emissions. In addition to the rules and regulations, there are also modeling constraints. For example, muffler dimensions hence volume is limited, or pressure loss needs to be minimum to prevent back pressure. Back pressure is undesirable for the engine because efficiency decreases, and the fuel consumption rate increases as the back pressure increases. Moreover, back pressure is generally inversely related with noise level which means decreasing noise level will increase the back pressure. Finally, mufflers operate under harsh conditions (frequent temperature changes, high velocity exhaust, road salt, etc.) which will limit and deteriorate their performance. These constraints make muffler design a challenging task which is attempted to be solved by various researchers.
Different categorizations are available in the muffler acoustics literature where different aspects of the mufflers are considered. For example, when the noise elimination principle is considered, there are three types of mufflers:
i) Purely reactive (reflective) mufflers: Noise elimination depends on destructive interference where reflected (out of phase) wave collides with the original wave, thus the sound amplitude decreases. If the phase

64 ¨ ¨ A LooK oVER tHE ACoUstIC sILEnCER & MUFFLER stUDIEs
difference is 180 degrees and the two waves have the same amplitude, it is called complete destructive interference where noise reduction is maximum.
ii) Purely absorptive (dissipative) mufflers: A type of absorbing material is used to eliminate the noise.
iii) Hybrid (partly reactive / partly absorptive) mufflers: The combination of absorptive and reactive mufflers (Selamet et al., 2003).
In this review study, although there are papers from all three categories, the focus is mostly on purely reactive mufflers.
Another common categorization method is to consider modeling tech-niques to identify muffler performance. This can also be divided into three types:
i) Frequency domain techniques: Frequency domain techniques include the transfer matrix method, finite element method (FEM) and boundary element method (BEM). The transfer matrix method was developed using the plane wave assumption which requires shorter computation time compared to the other two methods. (Yasuda et al., 2013). For this reason, it is one of the mostly used methods (Munjal, 1987). On the other hand, there is a tradeoff between computation time and accuracy of the results. There are also other disadvantages of transfer matrix method and these are stated by (Yasuda et al., 2010). The method is linear and one-dimensional does not allow nonlinear or higher dimensional wave propagation. It is also not possible to calculate the back pressure and the transient acoustic properties of a muffler.
ii) Time domain techniques: Computational fluid dynamics (CFD) includ-ing method of characteristics can predict the acoustic performance of mufflers in the time domain. Like the frequency domain techniques, time domain techniques have several advantages and disadvantages (Munjal, 2004). It is possible to calculate the exhaust noise and intake noise at the same time by using the method of characteristics. It can be employed for linear and time-invariant sources as well as nonlinear and time-variant sources. However, it requires longer computation time and it is not suitable for repetitious calculations like optimization studies where it is required to run the analysis multiple times (Yasuda et al., 2010).

Recent Researches in EnGInEERInG sCIEnCEs ¨ ¨ 65
iii) Hybrid approaches: The combination of frequency and time domain techniques to take advantage of both methods. Some of these studies will be reviewed in detail in the following pages.
2. Review PapersMuffler acoustics research was reviewed several times by various scholars with different focuses. (Munjal, 2004) presented a review paper that briefly discusses the developments to predict acoustic performances of commercial mufflers. The advantages and disadvantages of both time and frequency domain techniques were mentioned and the advancements and challenges in hybrid techniques were examined.
(Reddy, 2017) presented a review paper in which the acoustic approaches and materials of mufflers used in various fields such as automotive, aerospace, compressors and industrial noise were discussed. The focus of the review was mainly on sound absorbing materials that can be used in mufflers and important material properties such as thermal conductivity, stress and density. Examples of such materials are ceramic foams, metal foams and aerogels. These materials have desired properties in terms of sound absorption as well as safety, weight and structural strength which can help to reduce fuel consumption and increase energy efficiency. The paper concluded with emphasizing the importance of noise elimination research by innovative materials.
(Khairuddin et al., 2018) reviewed resonator and muffler configuration acoustics. Resonator is a type of reflective silencer that creates mismatch impedance to attenuate noise. In contrast to dissipative silencers, reflective silencers do not depend on any dissipative material to absorb noise. The recent resonator research enabled having wide attenuation bandwidth by using smaller size resonator with respect to the traditional ones. Various resonator configuration studies such as Helmholtz resonator, Quarter wave tube, Herschel-Quincke tube and helicoidal resonator were reviewed and areas with future research directions were identified.
There are several studies in muffler acoustics literature in recent years. In this study, combining with the earlier work, the recent developments in muffler acoustics research is reviewed by using the modeling techniques categorization: frequency domain techniques, time domain techniques and hybrid approaches. Figure 1 shows the number of studies for each 5-year interval that is reviewed in this study where the majority is published in the last ten years.

66 ¨ ¨ A LooK oVER tHE ACoUstIC sILEnCER & MUFFLER stUDIEs
Figure 1: Number of studies for each 5-year interval.
3. Frequency Domain TechniquesAs a frequency domain technique, the transfer matrix method is one of the mostly used methods because its low computation time requirement. Following review summarizes the basic principles of the transfer matrix method.
Transfer matrix method is a convenient way to model muffl er confi gurations because of the cascading property (Munjal, 1987). Considering a traditional muffl er with inlet and outlet ducts, which is shown in Figure 1, the transfer function of the muffl er can be shown with
pv
A BC D
pv
Tpv
1
1
2
2
2
2
é
ëê
ù
ûú =
é
ëê
ù
ûúé
ëê
ù
ûú =
é
ëê
ù
ûú
where p1 and v1 are the sound pressure and the normal particle velocity at the inlet, respectively, p2 and v2 are the sound pressure and the normal particle velocity at the outlet, respectively, A, B, C, and D are four-pole constants, and T is the transfer matrix. The four-pole constants can be computed using sound pressure and normal particle velocity boundary conditions at the inlet and outlet.
Figure 2: Schematic of a traditional muffl er.

Recent Researches in EnGInEERInG sCIEnCEs ¨ ¨ 67
If the muffler has a complex geometry which consists of different elements such as chambers, pipes, perforated tubes, etc. the transfer matrices of each element can be constructed and multiplied to acquire the transfer matrix of the entire muffler. Transmission loss of the muffler than can be calculated from the parameters of the product transfer matrix.
(Selamet et al., 2003) investigated the acoustic performance of a single-pass, perforated concentric muffler filled with continuous strand fibers which was an absorptive type muffler. The authors then extended their study to a hybrid (partly reactive / partly absorptive) muffler in which two perforated chambers were used with a Helmholtz resonator to take advantage of noise elimination capabilities of both absorptive and reactive mufflers. The acoustic performance of the muffler was predicted using one dimensional transfer matrix method and three-dimensional boundary element methods. The results showed that one-dimensional method provided a good estimate at lower frequencies. However, multi-dimensional BEM analysis was needed at higher frequencies for better estimations. It was also shown that the performance of the muffler is greatly improved with fiber absorption. According to the results, multi-dimensional BEM was a beneficial tool to predict the transmission loss of dissipative and hybrid mufflers. By using BEM, the effectiveness of the Helmholtz resonator, which was the reactive component of the design, was demonstrated especially at low frequencies. For the higher frequencies, the authors suggested using higher duct porosity to increase the transmission loss.
(Barbieri & Barbieri, 2006) used a transfer matrix method, specifically improved four parameters method that is developed by (Wu et al., 1998) along with numerical finite element method (FEM) to optimize muffler dimensions for a two-dimensional problem. The dimensions of the muffler were obtained for an objective function where the mean transmission loss (TL) was maximized in a specific frequency range. FEM was used to solve the Helmholtz’s equation numerically. The optimization was carried out using Zoutendijk’s feasible directions method because of its effectiveness for problems with nonlinear constraints. (De Lima et al., 2011) also conducted a similar study to optimize the shape and size of mufflers with extended inlet and outlet ducts. Size of the inlet and outlet ducts were optimized using parametric optimization and profile of these ducts were optimized using shape optimization. The TL calculation and objective function were similar to (Barbieri & Barbieri, 2006). However, for the optimization problem a genetic algorithm was used which is a commonly used
68 ¨ ¨ A LooK oVER tHE ACoUstIC sILEnCER & MUFFLER stUDIEs
mathematical method for strongly nonlinear problems. Results showed that TL can be increased in narrow frequency ranges including in the vicinity of the resonance frequencies.
(Feng & Weng, 2009) used the transmission matrix method to optimize the muffler structure of an engine for noise cancellation. The transmission matrices of muffler elements were improved by considering the effects of temperature gradient and mean flow. The effectiveness of the proposed model was sought to be enhanced by means of increasing the acoustic energy dissipation and sound wave reflection which in turn increased the transmission loss by 15 dB.
(Vijayasree & Munjal, 2012) developed an Integrated Transfer Matrix (ITM) method to analyze mufflers with complex configurations. The ITM method improved the common transfer matrix method to be able to analyze mufflers with multiple connections with or without dissipative elements, lined expansion chambers, acoustically lined ducts, and lined plenums. First, the transfer matrices of each element were found. These matrices then were used to construct a general transfer matrix for the whole system. This general matrix was used to calculate transmission loss, insertion loss, etc. The results of the ITM approach were compared with the results in the literature and there was a good agreement up to the cut-off frequency. Three-dimensional effects came into play at higher frequencies and caused differences with respect to the result in the literature. However, that was expected because of the limitations of the newly proposed one-dimensional approach.
(Chiu, 2013) proposed five types of hybrid mufflers which combine a reactive unit, an absorptive unit and Helmholtz resonator. Mufflers with multiple Helmholtz resonators both parallel and in series were also proposed to eliminate noise at the pure tone. A hybrid Helmholtz muffler was analyzed using transfer matrix method. The mathematical model was verified by experiments. Simulated annealing method was utilized to find the optimum design. Various design parameters such as pipe diameters and porosity percentage were considered. It was found that the accuracy highly depends on the cooling rate as well as the number of iterations.
(Kulkarni & Ingle, 2018) investigated pressure wave propagation in a reflective muffler with double expansion chamber. The finite element analysis of the muffler using pressure acoustics was described and the results were validated experimentally.

Recent Researches in EnGInEERInG sCIEnCEs ¨ ¨ 69
(Kheybari & Ebrahimi-Nejad, 2019) presented a design for the muffler internal baffles. Acoustic metamaterial baffles were used to increase the transmission loss at a specific frequency range. Resonators with different natural frequencies were used to study the effects of parameters such as the number and placement of baffles. Resonator dimensions and spacing of the baffles were two important parameters. The results showed that acoustic metamaterial baffles provided promising improvements for the transmission loss.
(Fu et al., 2019) adopted the finite element analysis method and acoustic theory to predict the acoustic performance of exhaust mufflers. A parametric study was carried out to detect the sensitivity of acoustic performance with respect to different structure parameters and then these parameters were optimized. Optimization process improved the average transmission loss by 9.8 dB compared to the original muffler.
(Lee et al., 2020) investigated various methods to predict acoustical performance of mufflers and suggested an evaluation method to reduce noise in a duct when the muffler was attached to a duct. After developing the mathematical expressions of three evaluation methods, parametric studies were carried out to measure the effects of various parameters on the noise attenuation performance. Topology optimization was used to maximize the transmission loss and insertion loss of a muffler whose performances were then compared when attached to a duct. In-duct broadband noise was sought to be minimized by conducting another topology optimization, where the results were compared with the experiments. Consequently, it was aimed to decrease the discrepancy between the acoustic performance of a muffler and a muffler that is attached to a duct in the study.
(Snakowska & Jurkiewicz, 2021) presented a new methodology using the acoustic multi-port networks theory. The proposed method improved the predictions for acoustic mufflers of complex geometry that consists of several sub-systems. Each sub-system can be analyzed as a separate multi-port in the presented method. Step by step execution of the procedure allowed the scattering matrix to stay at low dimensions during the analysis of mufflers of complex geometry without sacrificing accuracy of the results. The method was validated using mufflers of complex geometry from the literature.

70 ¨ ¨ A LooK oVER tHE ACoUstIC sILEnCER & MUFFLER stUDIEs
4. Time Domain Techniques(Yasuda et al., 2010) studied the tail pipe noise of a commercial automotive muffler. One dimensional computational fluid dynamics method was used to predict the transient acoustic characteristics of the muffler. The numerical results were validated by conducting tests in an anechoic chamber. The flow noise was not considered in the simulation which caused discrepancies between the numerical and experimental results at high order of engine speed in the high revolution range. A simplified method was proposed using one-dimensional CFD model to save execution time. The newly proposed method took less than 10% to execute compared to the traditional model which can be used for structural optimization studies where it is required to run the analysis multiple times.
(Parlar et al., 2013) investigated a reactive perforated muffler by using CFD analysis. The flow field analysis adopted to predict back pressure and both back pressure and transmission loss were validated experimentally.
(Pangavhane et al., 2013) investigated the effect of perforation diameter and internal tube porosity on back pressure using CFD analysis and experiments. For the mufflers with perforated tubes, back pressure highly depends on cross flow perforated tube. The most significant properties of the tube are porosity of the perforation and the diameter of the tube hole. Results of the study showed that back pressure variation is nonlinear with respect to the muffler dimensions and cannot be predicted. Porosity analysis showed that back pressure was reduced approximately 75% when the porosity was doubled. A slight change in hole diameter also affected the back pressure significantly.
(Gupta & Gupta, 2016) attached Helmholtz resonator to the inlet of a muffler to attenuate low frequency noise. Different resonator cavity shapes (such as spherical, cylindrical, and conical) with a fixed volume were considered. Among these shapes, cylindrical resonator was found to be the most effective one for the attenuation.
(Prajapati & Desai, 2016) presented several designs and compared their acoustical performance with a commercial muffler. One of the better performing designs had the same volume with the commercial muffler, but exhaust gas was split into two streams by two pipes. Moreover, the pipe in the middle chamber was designed with perforations which helps to reduce high frequency noise.

Recent Researches in EnGInEERInG sCIEnCEs ¨ ¨ 71
(Zhang et al., 2018) proposed a new muffler design in order to reduce the airflow velocity which is one of the dominant factors that affects turbulence noise and exhaust resistance in a muffler. The proposed design allowed the exhaust airflow of the engine to split into two streams and direct them to meet from two opposite-located holes which would reduce the exhaust airflow velocity. Although it was not a study with hybrid approach, both time and frequency domain techniques were used separately to simulate different properties. Computational fluid dynamics method was used to predict airflow velocity (inlet vs. outlet), pressure loss locations and quantification, and turbulent kinetic energy locations and quantification on both the proposed and traditional designs. According to the simulation results, the outlet velocity was reduced to half of the inlet velocity for the new design which was better compared to the traditional muffler. Both pressure loss and turbulent kinetic energy were reduced. On the other hand, the acoustic performance of the new muffler design was analyzed using transfer matrix method and one-dimensional wave theory. The noise reduction performance of the new design was found to be better in higher frequency range.
5. Hybrid Approaches(Sathyanarayana & Munjal, 2000) presented a hybrid approach to predict exhaust system noise. The method of characteristic was used for time domain analysis and the transfer matrix method was used for the frequency domain analysis. The exhaust mass flux history was calculated in the time domain by analyzing the engine which in turn helped to avoid tedious calculations. A correlation between the method of characteristics and the linear acoustic theory made it possible to use the proposed hybrid approach.
(Yasuda et al., 2013) proposed a muffler design by modifying the tail pipe to improve the muffler’s acoustic performance. Both frequency and time domain techniques are utilized to analyze the proposed design. The transfer matrix method was employed in the frequency domain analysis and a simplified CFD model (Yasuda et al., 2010) which has a shorter calculation time with respect to the traditional CFD analysis was employed in the time domain analysis. The muffler components and their properties are summarized in Table 1. The results showed that the interconnecting hole behaved like a Helmholtz resonator in terms of having a similar noise attenuation performance which enabled to reduce noise of both low frequency and middle frequency.

72 ¨ ¨ A LooK oVER tHE ACoUstIC sILEnCER & MUFFLER stUDIEs
Table 1: Acoustic components in the proposed muffler design in (Yasuda et al., 2013).Component Design PurposePerforated holes (on the inlet pipe)
as flow stream guide
to attenuate the flow generated noise and reduce pressure drops
Helmholtz resonance chamber
formed by one of the chambers and the inlet pipe
to attenuate specific low frequency noise
Expansion chamber chamber to cancel booming noise, smooth out the sharp pressure pulses, and reduce the individual pulse sounds
Extended tube resonator the set plate and the return pipe
to attenuate a specified frequency noise by using the destructive interference of the incoming sound and the reflection the set plate
Absorptive material Inside the tail pipe, contains glass wool
to attenuate noise over a higher frequency band
Tailpipe pipe to attenuate the low frequency noise
The authors also studied the acoustic effect of structure parameters of the new muffler. A design guideline was presented by using the results of the study. For example, increasing the length of the tail pipe decreased the cut-off frequency. Locating the continuous hole on the tail pipe as front as possible increased the attenuation performance at low frequencies. Finally, it was possible to tune the muffler to a specific frequency by the adjustment of the design parameters without great effect on the shape of the noise reduction curves.
(Montenegro et al., 2013) developed various nonlinear models to predict the muffler behavior in the time and frequency domains. The proposed models include a coupled 1D–multiD model and a coupled 1D-quasi-3D model. These two models were used to identify the transmission loss of reactive and absorptive mufflers. The pressure waves in these configurations can be highly non-planar, and higher order modes affects the acoustical performance. The transmission loss results were experimentally validated and the multi-dimensional effects were observed at higher frequencies. The simulation time analysis showed that the required calculation time increases with increasing complexity. The computation time of the 1D model was the lowest, whereas the computation time of the 3Dcell approach was directly related to the number of cells used

Recent Researches in EnGInEERInG sCIEnCEs ¨ ¨ 73
for the discretization. Increasing the number of cells and reducing the time step affected computation time.
(Siano et al., 2013) analyzed the acoustic performance of a multi-chamber muffler by using the boundary element method and a time domain method. The boundary element method was three-dimensional, and it was used to develop an accurate one-dimensional representation and the results were in good agreement with the experiments in the plane wave propagation regime. In the second part of the paper, the 1D model was used in two different optimization process. In the first one, a genetic algorithm was used to modify the internal muffler geometry and the objective was to maximize the transmission loss in the absence of mean flow averaged in 100–800 Hz frequency range. The second case was a multi-objective problem in which the transmission loss was aimed to be maximized and the back pressure was aimed to be minimized at the same time under a mean flow of 29 m/s exhaust gas. The frequency range of interest was 100–400 Hz in the second optimization procedure. The optimum solution depended on the relative weights of the two objectives. When the weight of the transmission loss is higher with respect to the back pressure, the average transmission loss was improved by up to 30%, and the pressure losses were reduced by up to 60% when the weight of the back pressure is higher with respect to the transmission loss. Transmission loss was increased by 19% and back pressure was decreased by 32% in the optimum compromise solution. These results were obtained by only changing the internal structure of the muffler, the external dimensions stayed the same.
(Jena & Panigrahi, 2017) examined the measurement techniques of muffler transmission loss both in the presence and absence of mean flow. The three-pole method in the frequency domain was used when the mean flow is not available. However, this method did not work accurately under mean flow. The time domain simulation of the same method was developed which resolved the issue. The proposed method was validated by comparing the results with experiments.
6. SummaryTable 2 shows the classification of the studies in this review by the objectives, modeling technique and muffler type. The objective of each study is divided into three parts: structural design, new methodology and optimization. “Structural design” is marked if the study presents a new structural design of a muffler.

74 ¨ ¨ A LooK oVER tHE ACoUstIC sILEnCER & MUFFLER stUDIEs
“New methodology” is marked if the study develops a new approach to evaluate acoustic performance of mufflers instead of using a commercial software or adopting from an earlier study. The modeling technique category consists of three parts (time domain, frequency domain and hybrid) which was already used in this study. Finally, the muffler type category also consists of three parts: reflective, absorptive and hybrid. These three categories differentiate the studies which analyze reflective (reactive), absorptive (dissipative), and hybrid (partly reactive / partly absorptive) mufflers.
Table 2: Classification of studies by objective, modeling technique and muffler type.
References ObjectiveModelingtechnique
Muffler type
Stru
ctur
al d
esig
n
New
m
etho
dolo
gyO
ptim
izat
ion
Tim
e do
mai
n
Freq
uenc
y do
mai
nH
ybrid
Refl
ectiv
e
Abs
orpt
ive
Hyb
rid
(Selamet et al., 2003)
(Barbieri & Barbieri, 2006)
(De Lima et al., 2011)
(Feng & Weng, 2009)
(Vijayasree & Munjal, 2012)
(Chiu, 2013)
(Kulkarni & Ingle, 2018)
(Kheybari & Ebrahimi-Nejad, 2019)
(Fu et al., 2019)
(Lee et al., 2020)
(Snakowska & Jurkiewicz, 2021)

Recent Researches in EnGInEERInG sCIEnCEs ¨ ¨ 75
(Yasuda et al., 2010)
(Parlar et al., 2013)
(Pangavhane et al., 2013)
(Gupta & Gupta, 2016)
(Prajapati & Desai, 2016)
(Zhang et al., 2018)
(Sathyanarayana & Munjal, 2000)
(Yasuda et al., 2013)
(Montenegro et al., 2013)
(Siano et al., 2013)
(Jena & Panigrahi, 2017)
(Mohiuddin et al., 2005)
(Shah et al., 2010)
ReferencesBarbieri, R., & Barbieri, N. (2006). Finite element acoustic simulation based
shape optimization of a muffler. Applied Acoustics, 67(4), 346–357. https://doi.org/10.1016/j.apacoust.2005.06.007
Chiu, M. C. (2013). Numerical assessment for a broadband and tuned noise using hybrid mufflers and a simulated annealing method. Journal of Sound and Vibration, 332(12), 2923–2940. https://doi.org/10.1016/j.jsv.2012.12.039
De Lima, K. F., Lenzi, A., & Barbieri, R. (2011). The study of reactive silencers by shape and parametric optimization techniques. Applied Acoustics, 72(4), 142–150. https://doi.org/10.1016/j.apacoust.2010.11.008

76 ¨ ¨ A LooK oVER tHE ACoUstIC sILEnCER & MUFFLER stUDIEs
Feng, L., & Weng, J. (2009). Analysis of Acoustic Characteristics of Exhaust Muffler and Its Optimum Design--《Noise and Vibration Control》2009年04期. Noise and Vibration Control, 4. https://en.cnki.com.cn/Article_en/CJFDTotal-ZSZK200904036.htm
Fu, J., Xu, M., Zhang, Z., Kang, W., & He, Y. (2019). Muffler structure improvement based on acoustic finite element analysis. Journal of Low Frequency Noise Vibration and Active Control, 38(2), 415–426. https://doi.org/10.1177/1461348418825200
Gupta, A. K., & Gupta, N. (2016). Development of Shape of Helmholtz Resonator Cavity for Attenuation of Low Frequency Noise of Pure Reactive Muffler. International Journal of Scientific Development and Research, 1(6), 37–42. www.ijsdr.org
Jena, D. P., & Panigrahi, S. N. (2017). Numerically estimating acoustic transmission loss of a reactive muffler with and without mean flow. Measurement: Journal of the International Measurement Confederation, 109, 168–186. https://doi.org/10.1016/j.measurement.2017.05.065
Khairuddin, M. H., Said, M. F. M., Dahlan, A. A., & Kadir, K. A. (2018). Review on resonator and muffler configuration acoustics. Archives of Acoustics, 43(3), 369–384. https://doi.org/10.24425/123909
Kheybari, M., & Ebrahimi-Nejad, S. (2019). Locally resonant stop band acoustic metamaterial muffler with tuned resonance frequency range. Materials Research Express, 6(2). https://doi.org/10.1088/2053-1591/aaed4b
Kulkarni, M. V., & Ingle, R. B. (2018). Attenuation analysis and acoustic pressure levels for double expansion chamber reactive muffler: Part 2. Noise and Vibration Worldwide, 49(6), 241–245. https://doi.org/10.1177/0957456518781859
Lee, J. K., Oh, K. S., & Lee, J. W. (2020). Methods for evaluating in-duct noise attenuation performance in a muffler design problem. Journal of Sound and Vibration, 464, 114982. https://doi.org/10.1016/j.jsv.2019.114982
Mohiuddin, A. K. M., Ideres, M. R., & Hashim, S. M. (2005). Experimental Study of Noise and Back Pressure for Silencer Design Characteristics. Journal of Applied Sciences, 5(7), 1292–1298. https://doi.org/10.3923/jas.2005.1292.1298
Montenegro, G., Onorati, A., & Della Torre, A. (2013). The prediction of silencer acoustical performances by 1D, 1D-3D and quasi-3D non-linear

Recent Researches in EnGInEERInG sCIEnCEs ¨ ¨ 77
approaches. Computers and Fluids, 71, 208–223. https://doi.org/10.1016/j.compfluid.2012.10.016
Munjal, M. (1987). Acoustics of ducts and mufflers with application to exhaust and ventilation system design. https://books.google.com/books?hl=en&lr=&id=Z-s50vk-U68C&oi=fnd&pg=PA1&dq=Munjal+ML.+Acoustics+of+ducts+and+mufflers.+John+Wiley+%26+Sons%3B+1987.&ots=lf9P3dxea2&sig=izBkwh9vTmWeR0-bQNtpA9IN5Uw
Munjal, M. L. (2004). ACOUSTIC CHARACTERIZATION OF AN ENGINE EXHAUST SOURCE – A REVIEW Approximations Impedance for Source Direct Measurement of Source Impedance. Proceedings of Acoustics, November, 117–122.
Pangavhane, S. D., Ubale, A. B., Tandon, V. A., & Pangavhane, D. R. (2013). Experimental and CFD analysis of a perforated inner pipe muffler for the prediction of Backpressure. International Journal of Engineering and Technology, 5(5), 3940–3950.
Parlar, Z., Ari, S., Yilmaz, R., Özdemir, E., & Kahraman, A. (2013). Acoustic and Flow Field Analysis of a Perforated Muffler Design. Proceedings of World Academy of Science, Engineering and Technology, 7(3), 603–607.
Prajapati, V. D., & Desai, A. J. (2016). Design and Analysis of Automotive Muffler. International Journal of Engineering Research And, V5(05), 384–389. https://doi.org/10.17577/ijertv5is050386
Reddy, K. A. (2017). A Critical Review on Acoustic Methods & Materials of a Muffler. Materials Today: Proceedings, 4(8), 7313–7334. https://doi.org/10.1016/j.matpr.2017.07.061
Sathyanarayana, Y., & Munjal, M. L. (2000). Hybrid approach for aeroacoustic analysis of the engine exhaust system. Applied Acoustics, 60(4), 425–450. https://doi.org/10.1016/S0003-682X(00)00008-6
Selamet, A., Lee, I. J., & Huff, N. T. (2003). Acoustic attenuation of hybrid silencers. Journal of Sound and Vibration, 262(3), 509–527. https://doi.org/10.1016/S0022-460X(03)00109-3
Shah, S., Kuppili, S., Hatti, K., & Thombare, D. (2010). A practical approach towards muffler design, development and prototype validation. SAE Technical Papers, September. https://doi.org/10.4271/2010-32-0021
Siano, D., Bozza, F., & Auriemma, F. (2013). Acoustic and fluid-dynamic optimization of an automotive muffler. Proceedings of the Institution of

78 ¨ ¨ A LooK oVER tHE ACoUstIC sILEnCER & MUFFLER stUDIEs
Mechanical Engineers, Part D: Journal of Automobile Engineering, 227(5), 735–747. https://doi.org/10.1177/0954407012465689
Snakowska, A., & Jurkiewicz, J. (2021). A new approach to the theory of acoustic multi-port networks with multimode wave and its application to muffler analysis. Journal of Sound and Vibration, 490, 115722. https://doi.org/10.1016/j.jsv.2020.115722
Vijayasree, N. K., & Munjal, M. L. (2012). On an Integrated Transfer Matrix method for multiply connected mufflers. Journal of Sound and Vibration, 331(8), 1926–1938. https://doi.org/10.1016/j.jsv.2011.12.003
Wu, T. W., Zhang, P., & Cheng, C. Y. R. (1998). Boundary element analysis of mufflers with an improved method for deriving the four-pole parameters. Journal of Sound and Vibration, 217(4), 767–779. https://doi.org/10.1006/jsvi.1998.1800
Yasuda, T., Wu, C., Nakagawa, N., & Nagamura, K. (2010). Predictions and experimental studies of the tail pipe noise of an automotive muffler using a one dimensional CFD model. Applied Acoustics, 71(8), 701–707. https://doi.org/10.1016/j.apacoust.2010.03.001
Yasuda, T., Wu, C., Nakagawa, N., & Nagamura, K. (2013). Studies on an automobile muffler with the acoustic characteristic of low-pass filter and Helmholtz resonator. Applied Acoustics, 74(1), 49–57. https://doi.org/10.1016/j.apacoust.2012.06.007
Zhang, Y., Wu, P., Ma, Y., Su, H., & Xue, J. (2018). Analysis on acoustic performance and flow field in the split-stream rushing muffler unit. Journal of Sound and Vibration, 430, 185–195. https://doi.org/10.1016/j.jsv.2018.04.025

79
C H A P T E R 5
tRAFFIC-InDUCED RoAD noIsE REDUCtIon: A CAsE stUDY In
IZMIR
Muhammed Enes YALçIN1 & Emre DEMIR2
1(BSc.) Antalya Bilim University, e-mail: [email protected]
Orcid: 0000-0002-3597-4329
2(Asst. Prof.), Antalya Bilim University, e-mail: [email protected]
Orcid: 0000-0003-0013-4482
1. Introduction
In this study, noise barriers and their suitability are investigated to reduce the traffic-induced road noise in a specific road in Izmir, Turkey. Undesired disturbing sounds caused by traffic are mainly made of a combination of
non-harmonic vibrations. Noise is a significant problem while improving the transportation network and thus increasing the traffic status of cities (Fujiwara et al. 1998; Government of Hong Kong 2003; Van Renterghem et al. 2015; Baldauf 2017). To fix the problem at this point, the technique of noise barrier installation is one of the efficient and successful methods. However, noise barriers generally create costs, such as blocking the view of road users or residents behind the barrier. Therefore, noise barriers should be constructed without additional distraction for road users or people living around. Moreover, they are expected to be sustainable and have a long life because they are expensive to build. For these reasons, materials used in the structure of the barriers should be adequately determined to reduce the maintenance cost. Accordingly, this study’s main objective is to investigate the traffic-induced road noise in a specific road in Izmir by applying the

80 ¨ ¨ tRAFFIC-InDUCED RoAD noIsE REDUCtIon: A CAsE stUDY In IZMIR
most technologically and aesthetically convenient noise barrier. Through a case study on Altinyol highway passing through Izmir’s city center, the application is based on considering many circumferential conditions. Information through the Turkish General Directorate of Highways is included to detect the barriers’ most appropriate status. As a result of the investigation, noise barrier applications are recommended according to the daily-based traffic flow along Altinyol.
Several methods have been investigated for many big cities to solve many problems arising from traffic. Some of these examine infrastructural issues due to traffic density and road networks (Demir 2018; Demir and Koçkal 2019; Demir and Aydoğdu 2021). Some studies provide solutions to the problems of parking spaces in the city center (Demir et al. 2020). Another study contributes to regulating traffic speed limits in the vicinity of residential areas (Demir and Çalışkan 2020). However, in this study, as mentioned above, a solution of a traffic-related problem such as traffic-induced noise for reducing the noise impact on settlements is presented.
Traffic and town planning can make significant contributions to the nuisance abatement from noise. Reducing the annoyment from road noise can be accomplished by ensuring a substantial distance between noise delicate housing areas and highways with heavy traffic. Moreover, moving traffic away from roads passing close by noise-delicate areas can be another effective solution. A noise barrier (also called a sound wall, noise wall, sound berm, sound barrier, or acoustical barrier) is an exterior structure designed to protect inhabitants of sensitive land use areas from noise pollution [4]. Noise barriers and noise embankments are often comparatively large and apparent structures that may not fit the surrounding environment. When a noise barrier is erected, it represents a considerable economic investment and can be expected to remain standing for several years. Moreover, people living near a noise barrier must face the noise barrier every day. Encountering the noise barrier every day is also true for pedestrians, cyclists who daily pass beside a noise barrier. Therefore, a noise barrier or noise hill could be regarded as a noise barrier that has two facades, one facing the highway and one the nearby town or landscape.
Various strategies for the adaptation of noise barriers to urban and rural surroundings can be used. One method is planting trees around the barrier and, in other words, vegetating so that the noise barrier fits in the surrounding environment. Another method is to allow the noise barrier to bringing out the landscape’s borders and forms the edges of a town next to the roadside. The barrier in Figure-1 shows transparent and 5 m high on a 1.5 m high embankment

Recent Researches in EnGInEERInG sCIEnCEs ¨ ¨ 81
at Highway M14 in Copenhagen, Denmark. A third method, such as in Figure-2, makes the noise barrier stand out as a visible addition to its surroundings through a conscious selection of colors (Bendtsen 2010). This chapter gives examples of noise barriers designed at the background of these different design methods.
Figure-1. Noise barriers have a “front” side facing the highway
(Bendtsen 2010).
Figure-2. Noise barriers have a “back” side facing a nearby town, transparent, 5 m
(Bendtsen 2010).
In connection with the planning and the design of noise barrier structures, they must be adapted to the road and its surroundings. An increasing proportion of people’s time is spent commuting on highways, and it is, therefore, an important task to make this time a positive experience, among other things, by seeking to ensure that roads pass through appealing surroundings.
Often, noise barriers are optically dominant structures that are high and can cause visual disturbances. Therefore, immediate attention should be paid to the appearance and design of noise barriers. The accepted and subjective perceived acoustic effects are more in noise protection systems appealing to commuters and residents. Noise barriers should be a part of roads. With this, the point of “Recommendations for Designing Noise Barriers on Highways” is discussed. Here are recommendations and information for an environmentally and aesthetically sound design of noise barriers.
2. Literature ReviewThis section introduces the basic concepts of noise barrier design and their research that have been conducted in many previous studies. The methodologies which were considered in the past are valuable to review and understand the aim of this study.

82 ¨ ¨ tRAFFIC-InDUCED RoAD noIsE REDUCtIon: A CAsE stUDY In IZMIR
2.1. Basic Noise Barrier Acoustics
The most significant fundamental acoustic factors related to the placing, shape, and design of noise barriers and noise embankments are presented in this part. The noise-decreasing effect of a noise barrier is derived from the formation of an acoustic “shadow.” Suppose a noise barrier is constructed between a noise source and an observer (or receiver). In that case, an acoustic shadow is produced behind the barrier, and the receiver perceives a reduction in noise levels. The noise reduction depends on many different factors. These are the height of the barrier and its placement position according to the location of the road. Further, the location of the land or the buildings to be protected from noise is essential (Watts et al. 1994). Regular possibilities of achieving various levels of noise reduction at the locations close to the barrier can be outlined as follows according to Noise Abatement along the State Highways (1999):
• 5 dB reduction in sound level is easy to obtain.• 10 dB reduction in sound level is attainable using barriers of critical size.• 15 dB reduction in sound level is hard to obtain.• 20 dB reduction in sound level is practically impossible to obtain.
With screening in realistic dimensions, it is thus ordinarily possible to achieve a noise reduction of up to approximately 5 to 10 dB. If a more prominent effect is desired, it is necessary to use very high barriers or undertake a full or partial covering of the road (Figures 3 and 4). For example, steel noise barriers are bent over the road to increase noise reduction in Vienna, Austria (Figure-3). Moreover, Figure-4 shows that a highway is covered at the roadside with white concrete noise barriers bending over the road in Barcelona, Spain.
Figure-3. Steel noise barrier in Vienna, Austria (Bendtsen 2010).
Figure-4. A road partly covered at the roadside (Bendtsen 2010).

Recent Researches in EnGInEERInG sCIEnCEs ¨ ¨ 83
Geometry between the noise source, the noise footpath, and the position of the receiver is critical. An optimal noise-decreasing effect is obtained if the screening is placed as close to the road as feasible. If the screening is placed close to the housing or outdoor areas, an optimal noise-decreasing effect is reached. Suppose a noise barrier is constructed midway between the road and the noise-sensitive areas. In that case, the noise-reducing effect is, in most cases, remarkably more minor than the aforementioned optimal placing. As another choice to increase noise reduction, a noise barrier can also be constructed along the road’s middle centerline. Implementation of the barriers on the outside of the roadway also increases the noise reduction (Figure-5).
Figure-5. High noise barriers erected both at the side of a road and the highway center in Italy (Bendtsen 2010).
2.2. Main Noise-Reducing Factors
The noise-decreasing effect of a barrier generally depends on many factors. These are the barrier’s efficient height, the distance between the noise source and barrier, the distance between barrier and receiver, length of the barrier, thickness of the barrier, and ingredients or materials used for the barrier (Anderson et al. 2017). Screening is carried out so that the noise transmitting through the barrier is minimum concerning the noise that passes over it. Barrier’s noise transmission capacity (or transmission loss) should be 10 dB more than the desired noise reduction. Because the regular highest feasible upper limit for noise reduction is ordinarily 8-12 dB, it is possible to use a barrier wall with a transmission loss of 20-25 dB or more. A single wall with a weight of about 20 kg/m2 has an adequate transmission loss capacity. A noise barrier, placed of 2.5 cm thick boards constructed one over two, weighs more than 20 kg/m2 typically. Therefore, in most cases, an acoustically satisfactory noise barrier is provided as solid. Noise barriers can be made of many different materials, as discussed in this chapter.

84 ¨ ¨ tRAFFIC-InDUCED RoAD noIsE REDUCtIon: A CAsE stUDY In IZMIR
On the other side, it is significant that the barrier should be completely solid. The materials chosen should not form cracks or other leaks because of loading or weathering. Even small gaps in a noise barrier led to an essential reduction of the noise-decreasing effect. It is so also important that noise barriers are placed so that they are fully connected with the surface of the ground or with the base on which they stand. If a noise barrier is thicker than 1-2 m, its noise-decreasing impact can be increased by applying a thin barrier with a thickness of between 5 and 50 cm (Kragh 2006). In some cases, increased noise reduction can be obtained through thick earth hills or by using structures, such as garages or outhouses as noise barriers. If the noise screening is interrupted by a sidewalk, driveway, or junction, its impact is significantly diminished. Therefore, highly significant that necessary interruptions are carried out correctly. A road can be led through a thin noise wall as a sluice running parallel to the road. A 2.5 m high wooden noise barrier in Denmark is depicted in Figure-6. It is a passage for pedestrians and bicyclists, where a transparent barrier is used behind the wooden barrier to be creating a noise sluice. The noise sluice’s sides should be made of noise-absorbent material to prevent the noise from being reflected from its sides.
Figure-6. A noise sluice in Denmark (Noise Barriers - Examples and Experiences, 1999).
2.3. Reflections and Absorbing Barriers
As mentioned earlier, noise screening achieves its impact by interrupting or blocking the direct path between the sound source and the receiver (Fujiwara et al. 1998). The barrier can also reflect the noise. Reflecting noise may have the unfortunate result of increasing the noise for the people living on the opposite side of a highway. Increasing the noise level on the opposite side of the highway depends on site conditions such as the height of the barrier and the

Recent Researches in EnGInEERInG sCIEnCEs ¨ ¨ 85
structures’ nature. If they consist of an unbroken line of multi-storied buildings, the erection of the barrier forms a closed canyon, where the sound is again and again thrown back and forth. Sound reflection can typically increase the noise level by up to 6 dB when reflecting surfaces on both sides of a highway (Noise Abatement along the State Highways 1999; Anderson et al. 2017). There are different solutions to reflection issues produced by noise screening installations. These solutions involve different visual effects, which can be detected in the surroundings of the highway. The barrier can be placed at an inclined surface; therefore, the noise is reflected in the air. The noise does not disturb anyone up in the air. In Figure-7, a 2 m high transparent noise barrier in Denmark is tilted to reflect the noise upwards for reducing the disturbance of residents on the other side of the highway. Figure-8 demonstrates a concrete noise barrier bent in the Netherlands, which has a tilted surface to reflect the noise upwards to decrease residents’ disturbance.
Figure-7. A tilted noise barrier (Noise Barriers - Examples and Experiences,
1999).
Figure-8. A concrete noise barrier bent with a tilted surface (Bendtsen
2010).
Vegetation may break noise into parts before and after reflection and be planted among the road and the barrier (Figure-9). Vegetation should be as dense all along the year, broad, and high as possible. Consequently, there is a third solution. A noise barrier is ensured with a sound-absorbent element on the side facing the highway so that reflection is reduced or entirely eliminated (Watts et al. 1994; Baldauf 2017). For instance, Figure-9 depicts a noise-absorbing barrier made of steel frame and steel grid in front (close up in the left corner) in Denmark. Figure-10 shows a 3 to 4 m high transparent steel and glass barrier along a highway in the same country. The glass is placed at an angle of 45° to reflect the noise up in the air.
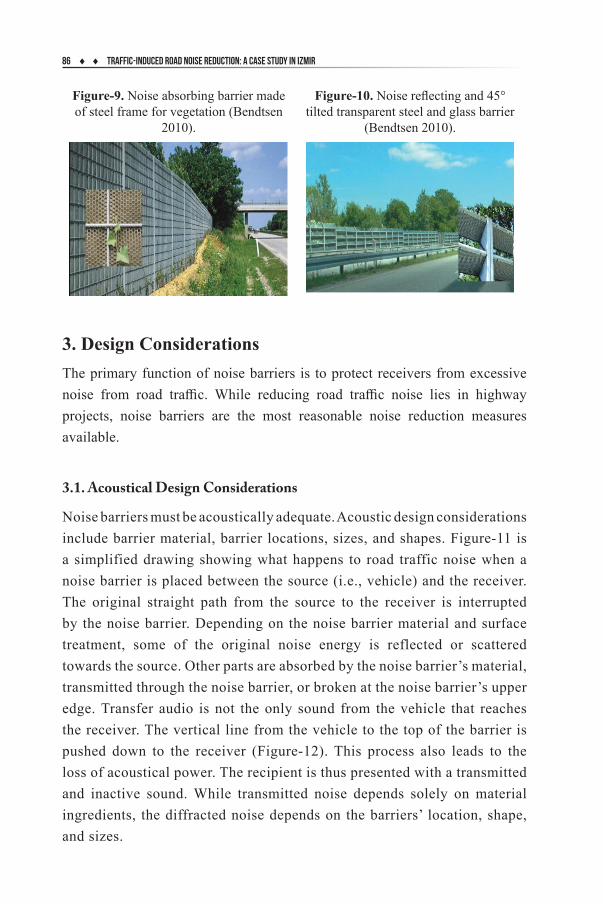
86 ¨ ¨ tRAFFIC-InDUCED RoAD noIsE REDUCtIon: A CAsE stUDY In IZMIR
Figure-9. Noise absorbing barrier made of steel frame for vegetation (Bendtsen
2010).
Figure-10. Noise reflecting and 45° tilted transparent steel and glass barrier
(Bendtsen 2010).
3. Design ConsiderationsThe primary function of noise barriers is to protect receivers from excessive noise from road traffic. While reducing road traffic noise lies in highway projects, noise barriers are the most reasonable noise reduction measures available.
3.1. Acoustical Design Considerations
Noise barriers must be acoustically adequate. Acoustic design considerations include barrier material, barrier locations, sizes, and shapes. Figure-11 is a simplified drawing showing what happens to road traffic noise when a noise barrier is placed between the source (i.e., vehicle) and the receiver. The original straight path from the source to the receiver is interrupted by the noise barrier. Depending on the noise barrier material and surface treatment, some of the original noise energy is reflected or scattered towards the source. Other parts are absorbed by the noise barrier’s material, transmitted through the noise barrier, or broken at the noise barrier’s upper edge. Transfer audio is not the only sound from the vehicle that reaches the receiver. The vertical line from the vehicle to the top of the barrier is pushed down to the receiver (Figure-12). This process also leads to the loss of acoustical power. The recipient is thus presented with a transmitted and inactive sound. While transmitted noise depends solely on material ingredients, the diffracted noise depends on the barriers’ location, shape, and sizes.

Recent Researches in EnGInEERInG sCIEnCEs ¨ ¨ 87
Figure-11. Alteration of noise roads by a noise barrier.
Figure-12. Barrier diffraction.
3.2. Main Barrier Materials
The following sections give a brief introduction to the various materials that can be used to construct noise barriers.
3.2.1. Reinforced Concrete
Reinforced concrete is used not only in a variety of ways for many structural purposes but also to create sound barriers (Grubeša et al. 2012; Pastor 2014; Aydogdu 2017; Wikipedia 2020a). Precast planks incorporated into H-shaped materials provide quicker construction methods and can be easily repaired. One type of concrete sound barrier is made of connected precast panels set in different ways to limit the need for separate post support. Identified sound barriers benefit from low adjustment, but pre-made sound barriers are expensive. Specially designed facial features can be used optimally to display sound at the desired angle, away from sensitive sound receivers. It may be economical to use in-situ concrete to create sound barriers in a highway design that includes reinforced concrete structures. Portable noise barriers are usually strong enough to withstand the impact of a motor vehicle crash. However, an unprotected metal barrier may need a crash cushion to decrease the damage to vehicles as the ground edge is too tight. For example, a reinforced concrete noise barrier is implemented along the M3 ring highway in Denmark (Figure-13). Alternatively,

88 ¨ ¨ tRAFFIC-InDUCED RoAD noIsE REDUCtIon: A CAsE stUDY In IZMIR
reinforced concrete profile barriers can be used to build the lower part of the noise barriers.
Figure-13. Reinforced concrete noise barrier (Noise Barriers - Examples and Experiences, 1999).
3.2.2. Metal
Sound barriers made of metal can be painted in a variety of colors. Metal is often used for foundations. The metal sheet can be made of bare pieces, which may contain fiberboard or mineral wool absorbers. Many types of composite barriers, including horizontal panels that connect between integrated steel posts, are available commercially. The metal sheet on one side can be cracked to allow sound to interact with the absorbers inside, and the tile profile provides structural strength. Aluminum is often used in composite systems due to its high strength in weight ratio; large panels can be easily constructed with a few supports, up to 5 m wide. For instance, Figure-14 depicts the application of 4 m high metal absorbing noise barriers bent 10° towards the road along both sides of a highway in Denmark. Here are some advantages of metal noise barriers (CIR Ambiente 2013).
• Stability: due to the material›s sturdiness and its unique corrugation construction, the barrier features excellent mechanical strength.
• Durability: outstanding resistance to weathering due to galvanizing and coloring treatments.
• Good value: Perfect performance is also guaranteed by the 10/10 mm version, positively impacting pricing.
• Resistance: wind- and impact-resistant.• Low maintenance: thanks to the patented heads and compensators, replacing
a damaged panel has never been so quick and easy.• Highly suitable for personalization: the plate metal can be painted in all
colors, matching the system.

Recent Researches in EnGInEERInG sCIEnCEs ¨ ¨ 89
Figure-14. Metal absorbing noise barriers bent 10° (Bendtsen 2010).
3.2.3. Transparent Materials
In addition to their use on transparent panels, plastics have also been used in water-absorbing panels and supporting plant systems. Plastics may be colorful as needed. Plastics are prone to fire damage and property damage, and so on, e.g., polyethylene becomes brittle after prolonged exposure to the sun (Asdrubali 2007; Wikipedia 2020a).
3.3. Barrier Shapes and Material Choice
The barrier may have a nominal thickness, but the deviation from the barrier’s upper edge is affected by its cross-section. It would be appropriate to use the same effective height of the most expansive barriers as structures. As shown in Figure 3.5, shortcuts with angular sections and curved shapes are not as effective in reducing noise as those with sharp edges. A wedge shape with internal angles greater than 90° and circular shapes is less effective. So, it would be good to use an acoustic screen on the mound’s top to increase efficiency.
Figure-15. Thick barrier and multiple edged barrier.
Attention should be paid to selecting materials used in the construction of sound barriers to reduce the need for maintenance. The quality of the materials used

90 ¨ ¨ tRAFFIC-InDUCED RoAD noIsE REDUCtIon: A CAsE stUDY In IZMIR
must be appropriate to the location. For example, barriers built in inaccessible areas or areas that may be exposed to adverse weather conditions require high durability materials. Care should be taken in construction details to remove moisture traps that could trigger rot or chemical attack. Alloy and metal coatings should be carefully selected to avoid differences in electrochemical strength that can accelerate corrosion. Plants selected for use in conjunction with noise barriers should usually have sturdy characteristics requiring low care.
3.4. Maintenance
3.4.1. Cleaning
Over time, noise barriers can become contaminated by chemicals such as water droplets from the road surface, bird droppings, plant-based liquids from hanging trees (Kotzen and English 2014). Reinforced concrete or stone masonry barriers may not need to be cleaned in certain areas as they are washed away with rainwater. However, ground areas are needed to be cleaned periodically, especially when contamination is efficacious and the visibility of the barrier is reduced. High-pressure water jets placed on top of purpose-built tanks or hand washing with brushes by low-pressure water are appropriate treatments. Additionally, it can be challenging to clean the exterior of sound barriers installed in high-quality structures; accordingly, zero maintenance barriers must be used.
3.4.2. Access Gates
The need for future maintenance should be considered when determining the nature of the noise barrier. The installation of the screens should be kept large enough to allow easy access for maintenance. Doors or spaces should be checked periodically to provide access to any side of the barrier. Frequent detection is required to clean both sides of the noise barrier. On bridges and viaducts, this may require the use of special equipment. Gates or spaces should be installed at approximately 200 m intervals to provide access to both sound barriers and any area behind the barrier. These access points should be available to access any traffic control and communication equipment (Government of Hong Kong 2003). For instance, Figure-16 demonstrates a 3.5 m high dark green steel noise barrier with pink steel posts adaptable to the typical construction styles of a region in Germany.

Recent Researches in EnGInEERInG sCIEnCEs ¨ ¨ 91
Figure-16. A noise barrier with an access gate in Germany (Bendtsen 2010).
4. Aesthetical AspectThere is no doubt that the roadside barriers protect residents from excessive road noise. However, the barriers themselves may interfere with the aesthetic appeal of road users and residents. The vehicle drivers see noise barriers as part of the roadway. Due to the driver’s presence and the need for concentration for driving, the structure in the vehicle road’s direction is perceived as a rough shape at first glance. Details disappear with increasing speed. Those living on land adjacent to a noise barrier see it as a permanent part of their immediate environment. This issue should be considered in the design of the side which does not look at the roadway. Therefore, the goal should be the noise barriers are designed to be harmoniously incorporated into their surroundings. They should not be perceived as foreign objects by the audience. A harmonious design and incorporation of the building into the landscape can be achieved by selecting the appropriate building shapes, construction types, building materials, and coloring that reflect the environment’s characteristics.
4.1. Architectural Concept
The general appearance of the barriers can be expressed further by applying architectural concepts (e.g., not in any order of priority) such as rhythm, proportion, order, harmony, and contrast. Such assessments are built using contrasting materials, where long or wide barrier lengths are required, especially in urban areas. Five concepts can be broadly interpreted as follows (Hong and Jeon 2014; Kotzen and English 2014; Wikipedia 2020a).

92 ¨ ¨ tRAFFIC-InDUCED RoAD noIsE REDUCtIon: A CAsE stUDY In IZMIR
• Rhythm: To repeat the forms in a sequential manner (Figure-17).• Proportion: To compare in size or number of two or more components in
the vicinity.• Order: To arrange the components in a systematic, logical, or controlled
manner (Figure-18).• Harmony: To put the components in an agreeably proportional or ordered
composition.• Contrast: To put in adjacency the strikingly different forms, colors, or
textures.
Figure-17. Rhythm. Figure-18. Order.
There should be a design solution appropriate for the environment to minimize the visible impacts of barriers. For example, direct barriers may be reduced by using other robust and transparent panels. Also, using color variations or softening sharp edges of barriers may work. In general, the importance of construction should be given to the protected side because the purpose of the barrier is to protect the environment enjoyed by humans. However, the formation of barriers must be considered from the perspective of the road’s sides, recognizing their role as the backside of the driver’s view.
4.2. Coordination with Road Furniture
Efforts should always be made to construct roads and bridges to ensure that their visual impact is acceptable. However, visible unity is often undermined by poorly planned elements such as road signs, lighting columns, and safety fencing. Therefore, the design of a barrier should be in line with road construction. Thus, it needs to be constructed as part of the overall concept. Consideration of the visual effect at the beginning of the construction process can help designers avoid unnecessary conflicts. The designer should also note the rhythm compatibility of the various elements on the road. There are several benefits to identify a suitable module for a barrier helps coordinating

Recent Researches in EnGInEERInG sCIEnCEs ¨ ¨ 93
it with other elements. Besides being cost-efficient in terms of installation and maintenance, the repetition of units can create a sense of order and harmony, contributing to highway safety.
4.3. Use of Transparent Barriers
Transparent noise barriers ensure a high level of noise protection along highways and railways. They are ideal for the construction of sound barriers that protect residents (Figure-19). Because of its transparency, such noise barriers leave drivers feeling unrestricted and indistinguishable from the surrounding. Transparent barrier panels are durable and easy to assemble, but the maintenance is quick and easy. High transparency, resistance to high static and dynamic loads, high sound insulation up to 32 dB, a wide range of colors, the potential for combining with other types of noise barrier panels are the main advantages of transparent noise barriers.
Figure-19. Transparent noise barrier sample (Multivario 2012).
4.4. Use of Vegetation and Color
Colors are essential in the appearance of noise barriers with the effect of light and shadows. Color is crucial to the inclusion of a barrier in the local and rural landscape. The less detailed coloration, the better the noise barrier adapts to its environment. Frequent color changes should be avoided. In any case, very light and very dark colors should be avoided. The choice of color should match each rural area’s character with natural and artificial elements as in Figure-20 (e.g., vegetation, rocks, soil, building facades, roofs). Special care should be taken to select green color tones, as they may leave an artificial impression compared to the colors found in nature (Watts et al. 1994; Haliç Environment Laboratory 2005; Baldauf 2017).
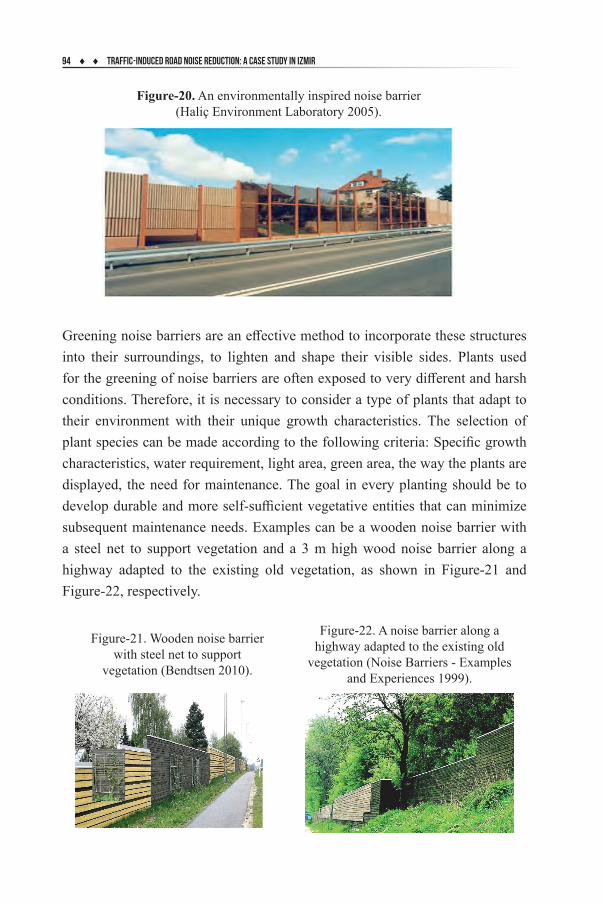
94 ¨ ¨ tRAFFIC-InDUCED RoAD noIsE REDUCtIon: A CAsE stUDY In IZMIR
Figure-20. An environmentally inspired noise barrier (Haliç Environment Laboratory 2005).
Greening noise barriers are an effective method to incorporate these structures into their surroundings, to lighten and shape their visible sides. Plants used for the greening of noise barriers are often exposed to very different and harsh conditions. Therefore, it is necessary to consider a type of plants that adapt to their environment with their unique growth characteristics. The selection of plant species can be made according to the following criteria: Specific growth characteristics, water requirement, light area, green area, the way the plants are displayed, the need for maintenance. The goal in every planting should be to develop durable and more self-sufficient vegetative entities that can minimize subsequent maintenance needs. Examples can be a wooden noise barrier with a steel net to support vegetation and a 3 m high wood noise barrier along a highway adapted to the existing old vegetation, as shown in Figure-21 and Figure-22, respectively.
Figure-21. Wooden noise barrier with steel net to support
vegetation (Bendtsen 2010).
Figure-22. A noise barrier along a highway adapted to the existing old
vegetation (Noise Barriers - Examples and Experiences 1999).

Recent Researches in EnGInEERInG sCIEnCEs ¨ ¨ 95
5. Size and PositionThere are a couple of crucial points on the size and positions of noise barriers. Noise barrier lengths below 2 m should be avoided for economic reasons. Very high barriers may require the costly design to integrate them in an environmentally friendly way, especially if the road runs over a dam. Firstly, the upper side of the barrier on slopes must follow a continuous stream of edges, and the entire surface of the barrier must be equally stepped. Moreover, it should have steps of greater length (Duncan 2016).
Regarding the length of the reinforced concrete foot elements, a measure should be chosen in proportion to the barrier’s height, considering the continuation of the slope. The longitudinal of a barrier occurs mainly by measuring the design elements, the type and arrangement of the posts, and the foot members. Thanks to the shape and colors of the poles, a more elegant longitudinal arrangement can be obtained. Changing the material, changing the surface structure, and applying different colors are also the means of design in long barriers. Changes in material, structure, color, and especially system should be avoided in short barriers. In exceptional cases, it can be ensured that the noise curtains are emphasized with particular elements within the residential areas’ boundaries or at distinct orientation points. A design that is noticeable but still not distracting must be of high quality to be accepted. The generally accepted method is that the barrier should extend to cover an angle of 160° from the receiver (Figure-23). When there is insufficient space to build a barrier long enough to provide attenuation, the effect can be increased by returning the walls’ ends (Figure-24).
Figure-23. Length of noise barrier. Figure-24. Noise barrier with the return.

96 ¨ ¨ tRAFFIC-InDUCED RoAD noIsE REDUCtIon: A CAsE stUDY In IZMIR
5.1. Connection at Overpasses and Underpasses
Usually, in noise barrier design, the starting and ending points and the connection point to the underpasses and overpasses present difficulties. The beginning and end portions of a noise barrier should be placed in underpasses, land glades, or other prominent land points, as long as the noise is technically and economically justified and local circumstances permit. It is not visually feasible to ensure that a barrier without any additional design measures begins and ends with all its dimensions.
The abundance of bridge piers in overpasses requires different connection models for noise barriers in many cases. Bridge piers at the level of the noise barrier, barrier connections, or situations where the noise barrier can be pulled under the bridge do not create any problems in terms of design. If the barrier cannot be connected at the bridge piers level, its connection to the bridge pier should be made with a transition connection if possible. As with barriers to poles, special attention should be paid. For example, Figure-25 shows a 5 m high steel and Plexiglas noise wall functioning as a visible addition to its surrounding with the help of a conscious selection of elements, colors, and forms. Figure-26 demonstrates a noise wall as a colorful urban material where a highway passes on a bridge over a road.
Figure-25. A 5 m high steel and Plexi-glas noise wall (Bendtsen 2010).
Figure-26. A noise wall as a colorful urban material (Bendtsen 2010).
5.2. Calculations for Design
This part is primarily focused on noise barrier design calculations. Barrier calculations are made by considering sound reduction rather than designing a barrier according to environmental conditions. At this point, a couple of parameters are included in the computations. They are the distance from the barrier to the center of the road, the distance from the receiver to the barrier, and

Recent Researches in EnGInEERInG sCIEnCEs ¨ ¨ 97
passing vehicles’ sound levels. The first section presents hourly equivalent sound level data ( LAeq h1 ) for geometries with a barrier 10 m away from the centerline of the highway. The second section presents LAeq h1 data for geometries with no barrier. Each value represents the LAeq h1 1000 vehicle pass-bys. To combine LAeq h1 values for mixed traffic volumes, Equation (1) may be used according to FHWA Traffic Noise Model (2017).
L Log V VAeq h
AutoL
MTAeq h Auto
1 101010
100010
10001
1
= ´é
ëêê
ù
ûúú+ ´
( )
00
100010
1
1
10
10
L
HTL
Aeq h MT
Aeq h HTV
( )
( )
é
ëêê
ù
ûúú
+ ´é
ëêê
ù
ûúú
ìíï
îï
++ ´é
ëêê
ù
ûúú+ ´éV VBus
LMC
LAeq h Bus Aeq h MC
100010
100010
1 1
10 10
( ) ( )
ëëêê
ù
ûúú
üýï
þï
Equation (1), LAeq h1 is the hourly equivalent sound level considering all input parameters. LAeq h Auto1 ( ) , LAeq h MT1 ( ) , LAeq h HT1 ( ) , LAeq h Bus1 ( ) , and LAeq h MC1 ( ) are
the hourly equivalent sound level associated with automobiles, medium trucks, heavy trucks, buses, and motorcycles, respectively. Also, VAuto , VMT , VHT , VBus , and VMC are the volume of automobile traffic, medium truck traffic, heavy truck traffic, bus traffic, motorcycle traffic, respectively.
6. Case Study6.1. Problem Definition
The noise problem due to traffic stream is not a new issue. Cities have always been noisy places, and traffic flows have been a source of the noise. However, with increasing traffic levels, noise has become a significant problem in road networks’ operation. As a result, sound barriers have become a necessity and essential feature of many modern road networks. In this part, considering the information mentioned previously, there will be a noise barrier recommendation for many people who are continuously disturbed by the noise created by heavy traffic flow.
6.2. Location Information
Izmir is a large city and has a very significant number of highways and streets. Highway D550 is one of them and passes through the city center. It is in the

98 ¨ ¨ tRAFFIC-InDUCED RoAD noIsE REDUCtIon: A CAsE stUDY In IZMIR
west of Turkey, extending along the north-south direction, starting from Havsa in Edirne and ending at Marmaris in Mugla. Its total length is 748 km. Highway D550 forms a part of E90 (73 km) and E87 (452 km) international highways [29]. The most crowded part of the D550 highway in Izmir city center is named Altinyol. Thus, it is the highway with the highest traffic flow in Izmir. Since the Altinyol is a highway, vehicles can travel at the highest permitted speed. As a result, much noise is created. On the other hand, there is a public recreation area called Bayrakli Beach Picnic Area (38°27’57.7” N, 27°09’39.1” E) with basketball courts, playgrounds, walking trails, bicycle ways, skating and picnic areas extending along Altinyol. Consequently, noise barrier installment is necessary to significantly reduce the traffic-induced noise which people are exposed to during recreational activities (Wikipedia 2020b).
6.3. Data Collection
For the most effective barrier installation, it is necessary to calculate the roadway’s maximum traffic noise. Therefore, noise calculations should be made by counting the cars passing by during the peak hours. For the data collection, five different vehicle types are determined to be included. The number of automobiles, medium trucks, heavy trucks, buses, and motorcycles consists of the traffic data. Automobiles include pickup trucks, jeeps, and vehicles with a total weight not exceeding 3.5 tons and vehicles with a passenger-carrying capacity of approximately 8-14 persons. Medium trucks include vehicles with a passenger-carrying capacity of approximately 14-25 people and trucks with a total laden weight of approximately 3.5-10 tons. Heavy trucks contain vehicles with a total load of more than 10 tons. Buses consist of vehicles with a passenger-carrying capacity of more than approximately 25 people.
The General Directorate of Highways provides many traffic data on its website. However, information about the traffic flow amount of Altinyol is missing. Therefore, the vehicle count was done manually and at peak times in Altinyol. The data gathered are presented in Table-1.
Table-1. Altinyol hourly vehicle pass
Date Time# Autos
# MTs # HTs# Buses
# MCs Total
30.12.2020 Wednesday
7.00-8.00 8,676 636 144 113 85 9,654
18.00-19.00 7,764 564 84 105 113 8,630

Recent Researches in EnGInEERInG sCIEnCEs ¨ ¨ 99
05.01.2021 Tuesday7.00-8.00 9,180 684 192 127 108 10,291
18.00-19.00 8,016 492 130 108 97 8,843
06.01.2021Wednesday
7.00-8.00 8,844 756 168 117 94 9,979
18.00-19.00 7,236 588 122 96 100 8,142
The affected area by the traffic-induced noise is 15-75 m from the center of the road. Since the area is in Izmir, it is exposed to sunlight for a long time in summer. In winters, heavy rain is encountered, but there is no snow. Moreover, the sea is adjacent to the park. The distance between the seaside and the center of the road is approximately 100 meters. The total length of barrier installation distance is 2.4 km where is the way between Highway D550 and the recreational area. Therefore, LAeq h1 (the hourly equivalent sound level considering all input parameters) without a barrier, computation is as follows according to FHWA Traffic Noise Model [28].
• For a receiver 30-m away, the LAeq h1 influence by automobiles traveling at 80 km/h is 65.6 dB,
• For a receiver 30-m away, the LAeq h1 influence by medium trucks traveling at 70 km/h is 71.7 dB,
• For a receiver 30-m away, the LAeq h1 influence by heavy trucks traveling at 60 km/h is 73.4 dB,
• For a receiver 30-m away, the LAeq h1 influence by buses traveling at 60 km/h is 71.0 dB,
• For a receiver 30-m away, the LAeq h1 influence by motorcycles traveling at 90 km/h is 75.7 dB.
Then, substitute the above LAeq h1 values and the traffic flow data into the following equation:
L LogAeq h1 10
65 6
10
71 7
10101000
100010
74
100010= ´
é
ëêê
ù
ûúú+ ´é
ëê
. .
êê
ù
ûúú
+ ´é
ëêê
ù
ûúú+ ´é
ëêê
ù
ûú
ìíï
îï
18
100010
16
100010
73 4
10
71 0
10
. .
úú+ ´é
ëêê
ù
ûúú
üýï
þï
12
100010
75 7
10
.
LAeq h1 = 67.6 dB

100 ¨ ¨ tRAFFIC-InDUCED RoAD noIsE REDUCtIon: A CAsE stUDY In IZMIR
6.4. Application and Main Results
There are essential criteria to be considered in the installation of noise barriers. These are the main factors such as the color of the road area, the region’s climatic conditions, and visual aesthetics. First, a transparent installation should be carried out not to distract the driver and not to deprive the environment’s visual beauty. Also, the transparent barrier is the most suitable design form so that the people taking part in recreational activities in the park do not feel restricted. Transparent barriers are subject to vandalism and shattering; therefore, these are to be avoided. Therefore, acrylic is the preferred material for transparent barriers for achieving high durability. The barrier should have a color that does not fade because the area is exposed to abundant sunlight during summer. Furthermore, since the plants’ water needs cannot be met during summer in this region, vegetation can be thought of as redundant. Barrier installation should be made away from the carriageway and with an appropriate angle to improve natural cleanliness from rain. The privacy of residential areas should not be compromised. For this reason, icing the undersides of transparent walls can be an effective way to provide privacy to people in the park. Gates or spaces should be provided at approximately 200 m intervals to provide access to both sound barriers and any area behind the barrier. Since the length of the installation zone is 2.4 km, a total of eleven gates are required.
Assuming installed barrier has 3 m height and 10 m offset. Now, LAeq h1 is computed with a barrier (at 10 m from the center of the roadway) using the FHWA Traffic Noise Model (2017).
• For a receiver 30-m away, the LAeq h1 influence by automobiles traveling at 80 km/h is 53.4 dB,
• For a receiver 30-m away, the LAeq h1 influence by medium trucks traveling at 70 km/h is 60.5 dB,
• For a receiver 30-m away, the LAeq h1 influence by heavy trucks traveling at 60 km/h is 65.7 dB,
• For a receiver 30-m away, the LAeq h1 influence by buses traveling at 60 km/h is 60.1 dB,
• For a receiver 30-m away, the LAeq h1 influence by motorcycles traveling at 90 km/h is 66.9 dB.

Recent Researches in EnGInEERInG sCIEnCEs ¨ ¨ 101
L LogAeq h1 10
53 4
10
60 5
10101000
100010
74
100010= ´
é
ëêê
ù
ûúú+ ´é
ëê
. .
êê
ù
ûúú
+ ´é
ëêê
ù
ûúú+ ´é
ëêê
ù
ûú
ìíï
îï
18
100010
16
100010
65 7
10
60 1
10
. .
úú+ ´é
ëêê
ù
ûúú
üýï
þï
12
100010
66 9
10
.
LAeq h1 = 56.4 dB
The resultant barrier insertion loss is computed by algebraically subtracting the with-barrier LAeq h1 from the without-barrier LAeq h1 :
Barrier Insertion Loss = 67.6 – 56.4 = 11.2 dBConsequently, 11.2 dB is a very reasonable value considering the population
and traffic flow in the area. With the application of the new noise barrier, people are exposed to less traffic-induced noise.
Now we can see the barrier installation made on the benchmark sample road based on FHWA Traffic Noise Model (2017). For this barrier placement, the distance between barrier and center of the road, vehicle speeds, offset distance are taken from section 6.3. These are the Altinyol barrier design parameters. The only differences are traffic density (LAeq h1 values) and the height of the barriers (4 m height).
LAeq h1 without a barrier,
L LogAeq h1 10
61
10
56 9
10101000
100010
200
100010= ´
é
ëêê
ù
ûúú+ ´é
ëêê
. ùù
ûúú+ ´é
ëêê
ù
ûúú
+ ´é
ëêê
ù
û
ìíï
îï
500
100010
50
100010
70 75
10
67 2
10
.
.
úúú+ ´é
ëêê
ù
ûúú
üýï
þï
50
100010
70 3
10
.
LAeq h1 = 69.5 dB
LAeq h1 with the barrier (at 10 m from the center of the roadway).
L LogAeq h1 10
50 7
10
57 6
10101000
100010
200
100010= ´
é
ëêê
ù
ûúú+ ´é
ë
. .
êêê
ù
ûúú+ ´é
ëêê
ù
ûúú
+ ´é
ëêê
ù
ìíï
îï
500
100010
50
100010
61 5
10
57 5
10
.
.
ûûúú+ ´é
ëêê
ù
ûúú
üýï
þï
50
100010
62 2
10
.

102 ¨ ¨ tRAFFIC-InDUCED RoAD noIsE REDUCtIon: A CAsE stUDY In IZMIR
LAeq h1 = 60.2 dB
Barrier Insertion Loss = 69.5 – 60.2 = 9.3 dBAs seen in the calculations, after the barrier is built, 9.3 dB a barrier
insertion loss is provided. When we compare the two values, we can get the following results,
• The traffic noise of the Altinyol is higher than the traffic noise of the highway where benchmark sample road is implemented.
• In the benchmark sample road, 9.3 dB noise loss was achieved by installing a 4 m barrier.
• 11.2 dB noise loss was achieved in the Altinyol barrier construction with a 3 m noise barrier.
• The barrier insertion on Altinyol is more effective than the benchmark sample road.
7. ConclusionThe central purpose of this study is to inspect the traffic-induced noise in a particular highway in Izmir. For this reason, an application of the most technically and appealingly suitable noise barrier is recommended. The application is demonstrated by a case on Altinyol main road traversing Izmir’s city center. In the analysis, several environmental conditions are regarded. Typical inputs from Turkish General Directorate of Highways are considered to identify the most applicable barrier type. Thus, noise barrier implementations are advised depending on the daily traffic flow along Altinyol. The net noise loss as a result of barrier insertion has been determined to be 9.3 dB.
Consequently, the following recommendations can be put forward. Barriers are constructed from a wide variety of materials and designs. However, all serve the same primary purpose: to reduce noise-sensitive receivers’ noise levels by influencing the propagation path between the source and the receiver. The noise reduction of 10 dB is obtainable at ground level in the area closely behind a considerable height barrier with sufficiently insulation value and absorption value. Noise barriers are relatively ineffective at more than 250 m distance from the road, the LAeq h1 reduction is limited to a few dB.
Regarding the noise barrier installation design, some of the road safety features to consider are as follows.

Recent Researches in EnGInEERInG sCIEnCEs ¨ ¨ 103
• Noise walls should not restrict the field of vision for highway users at crossroads, pedestrian crossings, bus stops, path intersections, and other traffic infrastructures.
• A high noise wall can cause a shadow effect and lead to icing and slippery conditions on the road.
• The installation of markers and lighting should be carefully considered.• On long stretches of road, noise barriers and earth embankments should not
create a monotonous visual setting. This kind of setting can be avoided by, for example, varying the colors, materials, and height of the installation.
• An embankment around the ground should indicate where the road is heading to prevent drivers from being distracted. An installation that is parallel to the direction of the road will typically have a nice effect.
• The surfaces of the noise barrier must not reflect light which may become a distraction. In choosing materials, colors, and surface structures, it is vital to consider reflected light.
• Suppose noise barriers are installed on both sides of the road over long distances. In that case, emergency access doors will need to be set up at regular intervals so that road users can leave the road immediately in the event of an accident. Emergency departments can also be used to give both repairs and emergency services access to the road.
This study aims to incorporate noise barriers into the urban or rural landscape as unobtrusively as possible. It is realized that noise can be reduced by the measures mentioned in this study but not wholly exterminated. Noise barriers can only fix the problem. Firstly, noise must be prevented at the source. Thus, there will be no effort to reduce the traffic-induced noise that does not occur. Nevertheless, the idea of creating a calm and quiet place of residence requires solutions for urban construction.
ReferencesAnderson, G. S., Lee, C. S. Y., Fleming, G. G., & Menge, C. W. (2017). FHWA
Traffic Noise Model, Version 1.0., <https://www.transportation.gov>, accessed on 23 October 2020.
Asdrubali, F., & Pispola, G. (2007). Properties of transparent sound-absorbing panels for use in noise barriers. The Journal of the Acoustical Society of America, 121(1), 214-221.

104 ¨ ¨ tRAFFIC-InDUCED RoAD noIsE REDUCtIon: A CAsE stUDY In IZMIR
Aydogdu, I. (2017). Cost optimization of reinforced concrete cantilever retaining walls under seismic loading using a biogeography-based optimization algorithm with Levy flights. Engineering Optimization, 49(3), 381-400.
Baldauf, R. (2017). Roadside vegetation design characteristics that can improve local, near-road air quality. Transportation research part D: Transport and environment, 52, 354-361.
Bendtsen, H. (2010). Noise Barrier Design: Danish and Some European Examples. Danish Road Institute, Report 174.
CIR Ambiente, (2013), Metal Noise Barriers, <http://www.cir-ambiente.it/en/>, accessed on 15 December 2020.
Demir, E. (2018). Assigning convenient paths by an approach of dynamic programming. Dedicated to Professor Gradimir V. Milovanović on the Occasion of his 70th Anniversary, pp. 196-199.
Demir E., & Aydoğdu İ. (2021) Transportation Path Assignment Within the Airports in Turkey. In: Nigdeli S.M., Kim J.H., Bekdaş G., Yadav A. (eds) Proceedings of 6th International Conference on Harmony Search, Soft Computing and Applications. ICHSA 2020. Advances in Intelligent Systems and Computing, vol 1275. Springer, Singapore.
Demir, E., & Çalışkan, B. (2020). An audit on application of traffic calming devices in Korkuteli-Tefenni road district. Proceedings Book of the 3rd International Congress on Academic Research, pp. 610-621.
Demir, E., & Koçkal, N.U. (2019). Relationship between traffic density and pavement deflections. Proceedings Book of the 2nd Mediterranean International Conference of Pure and Applied Mathematics and Related Areas, pp. 112-115.
Demir, E., Sandıkçıoğlu Deniz, T., & Deniz, C. (2020). Büyükşehirlerde alışveriş merkezi otopark girişi uygulaması: Antalya örneği. Proceedings Book of the 3rd International Congress on Academic Research, pp. 781-789.
Duncan, P., (2016), Noise Wall Design Guidelines, <https://www.nsw.gov.au/>, accessed on 24 October 2020.
Federal Highway Administration, (2017), FHWA Traffic Noise Model, <https://www.transportation.gov>, accessed on 10 November 2020.
Fujiwara, K., Hothersall, D. C., & Kim, C. H. (1998). Noise barriers with reactive surfaces. Applied acoustics, 53(4), 255-272.
Government of Hong Kong, (2003), Guidelines on Design of Noise Barriers, <https://www.epd.gov.hk>, accessed on 23 October 2020.

Recent Researches in EnGInEERInG sCIEnCEs ¨ ¨ 105
Grubeša, S., Jambrošić, K., & Domitrović, H. (2012). Noise barriers with varying cross-section optimized by genetic algorithms. Applied Acoustics, 73(11), 1129-1137.
Haliç Environment Laboratory, (2005), Designing Noise Barriers (“Gürültü Bariyerlerinin Tasarlanması” in Turkish language), <https://haliccevre.com/>, accessed on 24 October 2020.
Hong, J. Y., & Jeon, J. Y. (2014). The effects of audio–visual factors on perceptions of environmental noise barrier performance. Landscape and Urban Planning, 125, 28-37.
Kotzen, B., & English, C. (2014). Environmental noise barriers: a guide to their acoustic and visual design. CRC Press.
Kragh, J. (2006). User’s Guide Nord2000 Road, <http://www.cedex.es>, accessed on 23 October 2020.
Multivario, (2012), Transparent Noise Barrier Panels, <https://www.multivario.co.uk>, accessed on 20 October 2020.
Noise abatement along the state highways: Goal and strategy, (1999), (“Støjbekæmpelse langs statsvejene: Mål og strategi” in Danish language), <https://www.transportation.gov>, accessed on 23 October 2020.
Noise Barriers - Examples and Experiences, (1999), (“Støjskærme - Eksempler og Erfaringer” in Danish language), <https://www.transportation.gov>, accessed on 23 October 2020.
Pastor, J. M., García, L. D., Quintana, S., & Peña, J. (2014). Glass reinforced concrete panels containing recycled tyres: Evaluation of the acoustic properties of for their use as sound barriers. Construction and Building Materials, 54, 541-549.
Van Renterghem, T., Forssén, J., Attenborough, K., Jean, P., Defrance, J., Hornikx, M., & Kang, J. (2015). Using natural means to reduce surface transport noise during propagation outdoors. Applied Acoustics, 92, 86-101.
Watts, G. R., Crombie, D. H., & Hothersall, D. C. (1994). Acoustic performance of new designs of traffic noise barriers: full scale tests. Journal of Sound and Vibration, 177(3), 289-305.
Wikipedia, (2020a), Noise Barrier, <https://en.wikipedia.org wiki/Noise_barrier>, accessed on 15 December 2020.
Wikipedia, (2020b), D550 Highway, <https://en.wikipedia.org wiki/Noise_barrier>, accessed on 15 December 2020.

106
C H A P T E R 6
MEtHAnE EMIssIon MoDELInG tECHnICs
Gulnaz DALOGLUEskisehir Osmangazi Universty, Department of Mining
engineering, Eskisehir, Turkey.e-mail:[email protected]: 0000-0002-8646-7087
1) Introduction
A risk management method provides a decision-making support of human health and safety in under ground coal mine. The main elements of the risk management process is shown in Fig. 1 [1]
Fig. 1. The main elements of the risk management process [2].

Recent Researches in EnGInEERInG sCIEnCEs ¨ ¨ 107
In coal mines, 86 events were determined and divided in 8 categories of geomechanical, geochemical, electrical, mechanical, chemical, environmental, personnal and social, culture and managerial risks (Table 1). The highest negative risks are materials falling, catastrophic failure, instability of coal face and immediate roof, firedamp explosion, gas emission, misfire, stopping of ventilation system, wagon separation, asphyxiation, inadequate training and poor site management system [1].
Table 1. Risk types for human health and safety in coal mines [1].Risk type Event Geo-mechanical Outburst/rock burst
Struck by materials falling off from roof or ribWindblastCatastrophic failureCollapse or slump of wallFlyrock occurencesSpalling of ribs or sidesInstability of coalfaceTrapping/entanglement in caved areaFloor failure/heaveInstability of immediate roofsubsidenceIncomplete stowing
Geo-chemical Coal and sulfide ore dust explosionFiredamp explosionEmission of gases such as H2S, CO, NO etc.
Electrical ElectrocutionDealing with misfirePower disruptionsDead bulbs/fluorescent tubesEnergy from switches, power boards, generators etc.Blasting with nonstandart wire/firing lineElectricity problems of water pumps
Mechanical Tearing of pressure vesselsAcute jolts and whole body vibration via machinesUnintended operation of equipmentWater pressure from pump stations and reticulation

108 ¨ ¨ MEtHAnE EMIssIonMoDELInG tECHnICs
Hazards during maintenance and repairsSlipping belt conveyorStopping of ventilation systemTearing of towing wireWagons separation in inclinesTechnical defect of machinesJackshaft of the locomotiveOld vehicle seats and poor seating
Chemical Inappropiate firingUnbalanced oxygen of blastingNonstandart explosivesHazardous fuels and chemicals
Environmental Slippery floorPoorly lit areas and illumination problemsCaught between moving partsInrush of water, mud, gas etc.DrowningTire explosionAsphyxiation due to inspiration of coal dust and toxic gasesRadiation, reflection and excessive glareThermal heat sourcesBacteria in waterNoise pollutionRelease flammable gases such as acetylene and methaneHearing lossPoisoning due to fire and carbonmonoxideMisty and fumy conditions
Personal Smoking during refuelingInattention to safety signsNot using safety garmentUsing compressed air to clean clothesHandling batteries without cautionSlip/trip while entering or leaving equipmentSlip, trip or fall during operation /maintenanceFalling from heightsVehicle pedestrian collisionsFatigue or illness

Recent Researches in EnGInEERInG sCIEnCEs ¨ ¨ 109
Injuries due to contiguity with equipmentPutting detonator in pocketBackfall in gradient or even routesIncaution during transportation, storage and handling of explosives Depleting misfire blast holesUnfamiliarity with the emergency exit locations
Social, cultural and managerial Lack of safety garmentsLack of firefighting equipmentUnauthorized entry to the extraction areaTransportation of personnel by conveyor /wagonLack or deficiency of communication deviceBlasting without controlling methane/dust densityTraffic in excavation areaLack of knowledge and inaccessibilty of first aidInadequate trainingManual handlingPoor ergonomicsUsing unsuitable wood for supportPoor site management system
Methane a risk of ignition and/or explosion in mines. Methane risk factors include four areas. The methane hazard (17 factors), the methane ignition initiators (19 factors), detection and prevention of methane risk (16 factors) and human and material losses (13 factors) (Table 2) [3].
Table 2. Methane risk factors [3].The methane hazards
The methane ignition initiators
Detection and prevention of methane risk
Human and material losses
Methane drainage
The propability of fire Electrical equipment
Electrical equipment
The local mixture formation
The lack of information
The longwall advance
Disturbances of ventilaiton
The level of safety culture of employees
Work organization
Incorrect devices The tendency of workers
Ventilation conditions
The spark from electrical devices

110 ¨ ¨ MEtHAnE EMIssIonMoDELInG tECHnICs
According to Kause and Krzemien’ s study (2014), the human and material losses are maximum risk value and the detection methane risk is minimum risk value. A formation of methane hazard follows at below conditions:
• The lower limit of ignition and/or explosion of methane has reached in the air.
• The appropriate oxygen content has reached in the mixture of air and methane.• The personnal eff ect causes at the human factor [3].
2) Methane Emissions in Coal MinesThe methane is a dangerous explosive gas and pollutes the air. Accidents associated with the emission and accumulation of methane in old and abandoned places in mines. The methane is present in two forms in coal seams: 1) free gas, 2) sorbed gas [4]. Additionally, methane emissions originate from three sources in longwall mining. They are:
1) From the ribs surronding the bleeder ventilation system,2) From the active longwall face and mined coal on the conveyor belts,3) From the subsided strata [5].
In Fig. 2, methane emissions are shown in an under ground coal mines [6].
Fig. 2. Methane emissions in an under ground coal mines [7].

Recent Researches in EnGInEERInG sCIEnCEs ¨ ¨ 111
The first stage originates from the unmined coalbed next to the development entries of the bleeder system and from the solid coal ribs. The second state is the total of the gas content from the mined coal. The third state is the caved and fractured rock in the gob [8]. The time since abandonment, gas content, coal adsorption properties, methane flow capacity, mine floading, ventilation holes and mine seals influence to abandoned mine emissions [4].
Coalbed methane (CBM) is generated from two main sources. Biogenic and thermogenic. The biogenic methane occurs in the shallow coalbeds, whereas thermogenic methane occurs in deep coalbeds (Fig. 3). The biogenic methane depends on the temperature, ph value and the surface area. The thermogenic methane contents in high-rank coals.
Fig.3. Relation ship between biogenic and thermogenic methane [9].
The methane is stored in the coal matrix, other methane exists in the pores or cleats as free or solute. The coal adsorption tests are gravimetric and volumetric. The adsorption isotherm is the maximum gas-holding of coal at different reservoir pressures when the temperature is fixed (Fig.4). The adsorption isotherm is affected to coal temperature, moisture and rank.

112 ¨ ¨ MEtHAnE EMIssIonMoDELInG tECHnICs
Fig. 4. The methane adsorption isotherm test [10].
The Langmuir equation shows relationship between the pressure and adsorption content (Equ.1):
V G xpP
L
L=
+r (1)
Where; V is the methane adsorption content, GL is the Langmuir volume constant, PL is the Langmuir pressure constant.
The methane desorption is the opposite the adsorption. It has three parts of methane: lost (Q1), measured (Q2) and residual (Q3). Lost methane losts from the moment when the coal sample leaves the reservoir. Measured methane is desorbed in the canister. Residual methane is moved out of the canister [5].
There are some factors affecting a coal mine’ s methane emissions. “Specific emissions” are called that is amount of methane generated per unit amount of coal. Table 2 shows that affecting factors to methane emissions [11].
Table 3. Methane emission factors [11].Variables PCR1 PCR2 PCR3 PCR4 PCR5
Presence or absence of degasification
0.472 0.221 0.163 0.245 0.538
Basin -0.287 -0.007 0.917 -0.136 -0.145

Recent Researches in EnGInEERInG sCIEnCEs ¨ ¨ 113
State 0.002 0.049 0.915 -0.196 0.002Seam height 0.064 0.113 -0.093 0.925 -0.063Cut height 0.048 -0.027 -0.225 0.911 -0.043Panel width 0.036 0.798 -0.006 0.004 -0.029Panel length -0.248 0.701 0.093 -0.202 0.052Overburden thickness
0.808 -0.075 -0.129 0.108 0.121
Number of entries 0.271 -0.178 -0.045 -0.224 0.805Cut depth 0.125 0.745 0.056 0.142 -0.076Face conveyor speed
0.145 0.834 0.116 0.056 -0.167
Stage loader speed 0.147 0.811 -0.048 0.070 0.105Lost+debsorbed gas contents
0.954 0.024 -0.187 0.065 -0.011
Residual gas content -0.244 0.237 0.748 0.032 0.372Total gas content 0.960 0.077 -0.036 0.076 0.068Rank 0.907 0.031 -0.174 -0.091 0.186Coal production -0.221 0.688 0.251 0.114 0.036
According to Table3, the rank, the total gas content, cut height, face conveyor speed, cut depth, panel width, basin and state are the most in fluential variables for mine methane emissions. Positive numbers have positive correlance and negative numbers have negative correlation.
Coal gas content (lost, desorbed and residual) contributes to methane emissions. Rank increases with increasing depth. If the cutting depth increases, the more coal is produced and the greater the emissions. Thick, permeable and gassy coal beds generate more gas. Thus, the greater the mining height, the greater the potential for more gas [11].
Coalbed methane (CBM) emission control techniques fall in to two groups in the mine: 1) The ventilation dilution techniques, 2) the drainage techniques. They are generally used to China, USA and Australia [12].
2.1. Calculation methods of gas emission
The absolute gas emission is the total amount of emitted gasp er unit of time (Equ. 2):
q q qa em ex= + (2)

114 ¨ ¨ MEtHAnE EMIssIonMoDELInG tECHnICs
Where: qa is the absolute gas emission in the measurement area (m3/min), qem is the daily average gas emissions by wind in the measurement area (m3/min), qex is the monthly average gas extraction in the measurement area (m3/min).
qn
qn
Q C Q Cemi
n
emii
n
ri ri ei ei= = + - +( )= =å å1 1
1 1
(3)
Where: n is the working shift system, qemi is the emission of ventilation air methane (m3/min), Qri is the wind flow in the air return pathway in group i (m3/min), Cri is the gas density in the air return pathway in group i (m3/min), Qei is the wind flow in the intake airflow roadway in group i (m3/min), Cei is the gas density in the intake airflow roadway in group i (%). Relative gas emission is shown in Equ. (4):
q x qDra=1440 (4)
Where: qr is the relative gas emission (m3/t), qa is the absolute gas emission (m3/min), D is the monthly average Daily coal production (t/d), and 1440 is the number of minutes in a day.
EFn
qnational tt i
n
rti
t
, ==å11
(5)
Where: t is the type of underground coal mines of interest, i is the i-th coal mine in the t-type underground coal mine, qr is the relative gas emission (m3/min), EFnational,t is the national methane emission factor of t-type underground coal mines, nt is the number of t-type underground coal mines and qrti is the relative gas emission from the i-th coal mine in t- type underground coal mines.
EFn
qprovincial p tpt i
n
rpti
pt
, , ==å11
(6)
Where: p is the province, qr is the relative gas emission (m3/t), EFprovincial,p,t is the provincial methane emission factor of the t-type underground coal mines in p province, and qrpti is the relative gas emission from the i-th coal mine of the t-th type coal mine in the p province [6].

Recent Researches in EnGInEERInG sCIEnCEs ¨ ¨ 115
2.2. Empirircal CMM emissions prediction methods
Lunarzewski (1998) suggested an empirical model in Equ. 7:
Q y gCA
C Cy m y m
( ) =æ
èçç
ö
ø÷÷ + -
æ
èçç
ö
ø÷÷ +
æ
è
çç
ö
ø
÷÷
+
å å0
1
0
1 1 (7)
Where; Q(y) is the average methane emissions in a year, y of the mine’s existence (m3), CA is the coal production in the most recent year omly (tons), C is the coal production for the life of the mine up to year y (ton), g and m are the site-specific coefficients depend on geological and mining conditions.
Kirchgessner et al. (1993) presented a multi-linear regression model between coalbed methane contents, coal productions and mine emissions (Equ. 8):
Q y x CPXGC DV( ) = ( ) + - ( )1 08 10 31 44 26 767
. . . (8)
Where; Q(y) is the average methane emissions in a year, CP is the annual coal production (tons), GC is the gas content of the coal (m3/ton), and DV is a dummy variable that takes “1” if (CPxGC)<7.6x10⁵.
Creedy (1993) summed the contributions from the non-drainage mines in Equ. 9:
E LP D F RPD W t= + ( ) + +1 857. (9)
Where; ED ia the emission, Pw is the annual coal production from mines without methane drainage, Pt is the total annual deep mine coal production, D is the total annual methane drained from all mines, F is the difference between drain and utilized methane, L is the specific emission for mines without drainage.
Lunarzewski (1998) expressed to release from both the mined coal seam and adjacent strata in Equ. 10:
Q y QGC XDC xTA
TMGC xDC XTA
TMmfx f f f f f( ) = + +å å (10)
Where; Qy is the quantity of gas emission in to the mine per ton of mined coal, Qm is the gas quantity released from the mined coal seam, GC is the gas content in the floor (f) and roof (r), DC is the degassing coefficient for f and r, TA is the thickness of the mined coal [11].

116 ¨ ¨ MEtHAnE EMIssIonMoDELInG tECHnICs
Nowadays, many software programs are used to predict methane emissions than solution Equations. Because, they are basic, economic and saving time. There are computational fluid dynamics (CFD), fuzzy, TOPSIS, ANN, PCA, time series analysis, monte carlo simulation et al…
3. Modelling Methods The quality-heuristic models that using computer data and technology on the basis of the programming will warn imformation of the possibilty of the occurence of a hazardous phenomena. Thus, many methods were developed to prevent of methane risk.
Karacan and Goodman (2012), analyzed to methane emissions factors in a room and pillar mine in Lower Kittanning Coal, Pennsylvania by the principal component analyses (PCA) [13]. These factors contain Fe, Mn, Al, SO4, suspended solids, alkalinity, shale thickness, surface elevation, water level and water head data measured from the boreholes. Structural and depositional characterics, the gas content, permebeality, temporal water levels and specific gas emission rates were monitored. Karacan (2009) presented reservoir and elastic properties (Gammaray, density, sonic log analyses, in-situ porosities, fractures, shear, young’s and bulk moduli, poisson’s rate) of coal rocks in the Lower Monongahela Group in pennslvania to methane control [14]. Dougherty and Karacan (2011) developed on a new software MCP (methane control and prediction) in longwall coal mines [15]. It consists of dynamic link library (DLL), statistical and mathematical approaches, artificail neural networks (ANN) methods. MCP software calculates the elastic and shear moduli and total ventilation output of methane. It predicts the performance of gob gas ventholes and drilling lexhauster parameters, borehole location and mining parameters on gob gas ventholes (GGV) performance. Karacan (2008) predicted to methane emissions from 63 longwall mines in 10 states in US by artificial neural networks (ANN) and PCA [8]. 17 variables influenced the CH4 emission. They are degasification, basin, state, seam and cut height, panel depth and width, overburden, number of entries, cut depth, face conveyor and stage loader speed, lost+desorbed+residual gas, total gas, rank and coal production. The state, total gas, seam and cut heights, panel width, face conveyor and stage loader speed, number of entries, coal productions are the most effective parameters.

Recent Researches in EnGInEERInG sCIEnCEs ¨ ¨ 117
Hu et al. (2017) proposed to a coalbed methane emission (CBM) control strategy in the two working faces in Shigang Mine (China) [12]. Duda and Krzemien (2018) forecasted of methane emission from closed under ground coal mine in Poland to the longwall goafs [4]. Wang et al. (2021) modeled to methane explosion regions by a thermal balance method in the fire zone after sealing [16]. Woda et al. (2020) investigated to methane concentrations are highest in streams where oil, gas and coal regions [17]. Xu et al. (2020) modeled to CO and CH4 concentrations by COMSOL Multiphysics software package in a gob [18]. Palchik (2014) analyzed the time-dependent volumetric flow and volume of gas emission from vertical boreholes drilled to abandoned mine workings [19]. Mahdevari et al. (2014) classified under 8 categories for human health and safety risks groups by fuzzy TOPSIS in under ground coal mines [1]. They are geomechanical, geochemical, chemical, electrical, personal, environmental and social, culture and managerial risks. Yan et al. (2012) analyzed the risk factors of coal mining engineering by Fuzzy AHP method [20]. Geological, personnel, equipment and management factors are the risk factors. Fallahizad et al. (2019) estimated of methane gas emissions by LandGEM model in Yasuj municipal solid waste landfill (İran) [21]. The LandGEM model is used for methane production capacity, waste acceptance rate, methane production rate, land closure year. Radu et al. (2013) modeled of the coal mechanized face using fuzzy fication method to decision to many variants [22]. Variants are layer slope, worked off layer thickness, variation of the face level, angle of raising/descending in the mining face advancing, stregth of the coal cutting, coal hardness coefficient, stregth of the bottom/roof compression. Vlasin et al. (2013) modeled the methane quantities by CFD in a retreating coal longwall face [23].
Kurnia et al. (2014) stimulated to methane dispersion and air flow behaviour by CFD in a under ground mine [24]. To location of ventilation flow can reduce methane concentration to save energy usage and in turn carbon tax. Kurnia et al. (2014) predicted to airflow, oxygen and hazardous gas dispersion by CFD in under ground mines [25]. Kurnia et al. (2014) stimulated of a novel intermittent ventilation system for under ground mines by CFD to reduct the energy cost [26]. Energy savings are not only electricity but also obtain an optimum ventilation design. Deng et al. (2015) modeled of the mixture of CH4 and CO concentrations by FLACS software in a coal mine [27]. Excessive CO inhibits the gas explosion reaction. Luo et al. (2015) modeled airflow velocities in cross-section of the roadways in a longwall mine by CFD [28]. The high

118 ¨ ¨ MEtHAnE EMIssIonMoDELInG tECHnICs
airflow velocity region was located the floor of the roadway. Cheng et al. (2016) modeled a ventilation parameters by CFD to derive the optimum solution in the underground [29]. İmportant ventilation parameters include the air quantity in the mine working face, the negative velocity pressure in the roof roadway, airflow quantity in tailgate roadways. Ji et al. (2017) estimated CH4 emissions from the Yanma coal mine (China) by calculating the mining activity influence factor (MAIF) [30]. Salmachi and Yarmohammadtooski (2015) investigated to the time of occurence of peak of production by production data analysis (PDA) of coalbed CH4 wells [31].
Mottahedi and Ataei (2019) combinated of fuzzy theory and fault tree analysis for coal burst occurence probability analysis [32]. Shi et al. (2018) identified the risk factors of coal gas and dust explosions by fuzzy fault tree analysis (FFTA) [33]. The FFTA is a signifance in the analysis of coal mine explosions and provides a guidance for coal mine safety management. Li et al. (2020) used to fuzzy AHP and bayesian network method for risk assesment of gas explosion in coal mines [34]. Li et al. (2019) determined to mine ignition sources by fuzzy bayesian network (FBN) in Babao coal mine (China) [35]. The ignintion sources are divided in to electric and thermal source.
4) ConclusionsThis paper summarizes the information of methane emission sources and formulas. Nowadays, many software programs can be used for designers of ventilation systems. Because, they are basic, economic and useful. Additionaly, they can supply saving time. They can predict the riskly areas before explosion in mines. To sum up, these methods can effectively decision-maker for mine engineering.
References[1] Mahdevari S., Shahriar K., Esfahanipour A., 2014. Human health and safety
risks management in underground coal mines using fuzzy TOPSIS, Science of the Total environment, 488-489, 85-99.
[2] https://tr.pinterest.com/pin/314477986463553385/[3] Krause E., Krzemien K., 2014. Methane risk assessment in underground
mines by means of a survey by the panel of experts (sope), Journal of Sustainable Mining, 13,2, 6-13.

Recent Researches in EnGInEERInG sCIEnCEs ¨ ¨ 119
[4] Duda A., Krzemien A., 2018. Forecast of methane emission from closed underground coal mines exploited by longwall mining-a case study of anna coal mine, Journal of Sustainable Mining, 17, 184-194.
[5] Zheng C., Jiang B., Xue S., Chen Z., Li H., 2019. Coalbed methane emissions and drainage methods in underground mining for mining safety and environmental benefits: a review, Process safety and environmental protection, 127, 103-124.
[6] Wang K., Zhang J., Cai B., Yu S., 2019. Emission factors of fugitive methane from underground coal mines in China: estimation and uncertainty, Applied energy, 250, 273-282.
[7]https://www.researchgate.net/figure/A-schematic-plan-of-the-methane-emissions-in-an-underground-coal-mine_fig4_320105579.
[8] Karacan C. Ö., 2008. Modeling and prediction of ventilation methane emissions of U.S. Longwall mines using supervised artificial neural networks, Coal Geology, 73, 371-387.
[9]https://www.researchgate.net/figure/Figure-A12-Schematic-showing-biogenic-and-thermogenic-gas-generation-in-relation-to-coal_fig15_291972397.
[10] Special session 31 back to basic serias, 2021. https://slidetodoc.com/special-session-31-back-to-basic-series-an/
[11] Karacan C. Ö., Ruiz F. A., Cote M., Phipps S., 2011. Coal mine methane: a review of capture and utilization practices with benefits to mining safety and to greenhouse gas reduction, Coal Geology, 86, 121-156.
[12] Hu X., Yang S., Liu W.V., Zhou X., Sun J., Yu H., 2017. A methane emission control strategy in the initial mining range at a spountaneous combustion-prone longwall face: a case study in coal 15, Shigang Mine, China, jou. of Natural Gas Science and Engineering, 38, 504-515.
[13] Karacan C. Ö., Goodman G. V.R., 2012. Analyses of geological and hydrodynamic controls on methane emissions experienced in a Lower Kittanning coal mine, Coal Geology, 110-127.
[14] Karacan C. Ö., 2009. Reservoir rock properties of coal measure strata of the Lower Monongahela Group, Greene County (Southwestern Pennsylvania), from methane control and production perspectives, Coal Geology,78, 47-64.

120 ¨ ¨ MEtHAnE EMIssIonMoDELInG tECHnICs
[15] Dougherty H. N., Karacan C. Ö., 2011. A new methane control and prediction software süite for longwall mines, Computers&Geosciences, 37, 1490-1500.
[16] Wang G-Q., Shi G-Q., Wang Y-M., Shen H-Y., 2021. Numerical study on the evolution of methane explosion regions in the process of coal mine fire zone sealing, Fuel, 289, 119744.
[17] Woda J., Wen T., Lemon J., Marcon V., Keeports C.M., Zelt F., Steffy L.Y., Brantley S. L:, 2020. Methane concentrations in stream reveal gas leak discharges in regions of Oil, Gas and Coal Development, Science of the Total Environment, 737, 140105.
[18] Xu Y., Liu H., Zhai X., Li R., Song P., Jia M., 2020. A model for assessing the compound risk represented by spountaneous coal combustion and methane emission in a gob, Jou. of Cleaner Production, 273, 122925.
[19] Palchik V., 2014. Time-dependent methane emission from vertical prospecting boreholes drilled to abandoned mine workings at a shallow depth, Rosk Mechanics &Mining Sciences, 72, 1-7.
[20] Yan Z., Wang X., Fu Y., 2012. Study on early warning model of coal mining engineering with fuzzy AHP, Procedia, 5, 113-118.
[21] Fallahizadeh S., Rahmatinia M., Mohammaadi Z., Vaezzadeh M., Tajamiri A., soleimani H., 2019. Estimation of methane gas by LandGEM mıdel from Yasuj municipal solid waste landfill, İran, MethodsX., 6, 391-398.
[22] Radu S. M. Dolea G., Cretan R., . Modeling and simulation of coal winning process on the machanized face, Recent Advances in Civil and Mining Engineering, WSEAS Press, Antalya, Turkey October 8-10, 2013, 30-35.
[23] Vlasin N-I., Lupu C., Suvar M., Pasculescu V-M., Arad S., . Computerised modeling of methane releases exhaust from a retreating longwall face, Recent Advances in Civil and Mining Engineering, 2013, 274-277.
[24] Kurnia J.C., Sasmito A.P., Mujumdar A.S., 2014. CFD simulation of methane dispersion and innovative methane management in underground mining faces, Applied Mathematical Modelling, 38, 3467-3484.
[25] Kurnia J.C., Sasmito A.P., Wong W. Y., Mujumdar A.S., 2014. Prediction and innovative control strategies for oxgyen and hazardous gases from diesel emission in underground mines, Science of the Total Environment, 481, 317-334.

Recent Researches in EnGInEERInG sCIEnCEs ¨ ¨ 121
[26] Kurnia J.C., Sasmito A.P., Mujumdar A.S., 2014. Simulation of a novel intermittent ventilation system for underground mines, Tunnelling and Underground Space Technology, 42, 206-215.
[27] Deng J., Cheng F., Song Y., Luo Z., Zhang Y., 2015. Experimental and simulation studies on the influence of carbon monoxide on explosion characteristics of methane, Jou. of Loss Prevention in the Process Industries, 36, 45-53.
[28] Luo Y., Zhao Y., Wang Y., Chi M., Tang H., Wang S., 2015. Distributions of airflow in four rectangular section roadways with different supporting methods in underground coal mines, Tunnelling and Underground Space Technology, 46, 85-93.
[29] Cheng J., li S., Zhang F., Zhao C., Yang S., Ghosh A., 2016. CFD modelling of ventilation optimization for improving mine safety in longwall working faces, Kou. Of Loss Prevention in the Process Industries, 40, 285-297.
[30] Ji Z-M., Chen Z-J., Pan J-N., Niu Q-H., 2017. A novel method for estimating methane emissions from underground coal mines. The Yanma coal mine, China, Atmospheric Environment, 170, 96-107.
[31] Salmachi A., Yarmohammadtooski Z., 2015. Production data analysis of coalbed methane wells to estimate the time required to reach to peak of gas production, Coal Geology, 141-142, 33-41.
[32] Mottahedi A., Ataei M., 2019. Fuzzy fault tree analysis for coal burst occurence probabilty in underground coal mining, Tunnelling and Underground Space Technology, 83, 165-174.
[33] Shi A., Jiang B., Meng X., 2018. Assesment of gas and dust exploison in coal mines by means of fuzzy fault tree analysis, Int. Jou. of Mining Science and Technology, 28, 991-998.
[34] Li M., Wang H., Wang D., Shao Z., He S., 2020. Risk assessment of gas explosion in coal mines based on fuzzy AHP and bayesian network, Process Safety and Environmental Protection, 135, 207-218.
[35] Li M., Wang D., Shan H., 2019. Risk assessment of mine ignition sources using fuzzy bayesian network, Process safety and Environmental Protection, 125, 297-306.

122
C H A P T E R 7
soME RELIABILItY sIGnIFICAnCE MEAsUREs AnD A nUMERICAL
APPLICAtIon FoR tHEsE IMPoRtAnCE MEAsUREs
Nurettin MENTEŞ1 & Yunus BULUT2
2 (Asst. Prof.), Dicle University [email protected]: 0000-0002-5650-4342
3(Assoc.Prof. Dr.), İnönü University [email protected] Orcid: 0000-0002-9108-4937
1. Introduction
A collection of components that perform certain functions can be briefly expressed as a system. Importance measure is used to determine the importance levels of the components in the system (Kuo & Zhu,
2012, s. 5). Since the components integrated into a system directly affect the operation of the system, importance measures have an active role in determining the weaknesses of the system and calculating the relative importance of the components (Lin, Wang, Jia, & Li, 2017, s. 1). Determining the faulting aspects of a system or detecting the situations that may cause problems for the system in advance will help the system to run smoothly and to minimize the problems that may arise. Especially in terms of the systems which are difficult and costly to set up as encountered more often in the industry, it is very important to calculate the faulting aspects of the system in advance to prevent the cost and time loss that may be seen later (Menteş, 2018, s. 32). In general, importance measure gives the system designers an idea of which component or components to focus on to improve system reliability with the minimum cost and effort, and also has the capability to suggest the most effective method of diagnosing

Recent Researches in EnGInEERInG sCIEnCEs ¨ ¨ 123
the system failure by means of a follow-up list offered to the operator and a repair list required to be followed by the operator (Natvig, 2011, s. 133). The concept of importance measure, which started with the studies of Birnbaum, has become an increasingly important issue in industrial engineering in recent years. Birnbaum grouped the component importance in three categories, depending on the information needed to determine the importance measure. These categories are Structure Importance Measures that calculate the relative importance of components according to the position of components in the system, and Reliability Importance Measures that depend on the reliability of components along with the structure of the system, and Lifetime Importance Measures that are based on the lifetime distributions of components along with the structure of the system (Kuo & Zhu, 2012, s. 50). In addition, there are also importance measures defined in the literature other than those mentioned. The following importance measures can be indicated as examples: Hwang Index, Risk Achievement Worth (RAW), Risk Reduction Worth (RRW), Restore Criticality Index (RCI), Failure Criticality Index (FCI), Operational Criticality Index (OCI) and Joint Reliability Importance (JRI) and Joint Failure Importance (JFI) that calculates the importance measures of groups or pairs ( Amrutkar & Kamalja, 2017, s. 163,164). You can see the details of these importance measures in the studies (Hwang, 2001), (Cheok, Parry, & Sherry, 1998a), (Cheok, Parry, & Sherry, 1998b), (Wang, Loman, & Vassiliou, 2004), (Hong & Lie, 1993). In this study, the Birnbaum (B-Reliability Importance) Potential Reliability Importance, Critical Reliability Importance, Bayesian Reliability Importance and Fussel Vesseley’s Reliability Importance will be briefly introduced for the reliability importance measures. In addition, with the help of the simulation developed in Menteş’s study “Evaluation of Main Components of Conventional Thermal Power Plants According to the System Component Importance”, it will be investigated how these importance measures give results for the same system against the changing reliability values. In this study, Bayesian importance measure and the critical importance measures for the operation of the system were added to the previously developed simulation.
2. Component Importance MeasuresIn general, the performance of a system is directly related to the performance of its components. It is very important for the flawless operation of the system

124 ¨ ¨ soME RELIABILItY sIGnIFICAnCE MEAsUREs AnD A nUMERICAL APPLICAtIon FoR tHEsE IMPoRtAnCE MEAsUREs
to have the capability to predict the factors that will cause disruption in the system. Various importance measures have been defined to determine which component or components of a system are more important. Some of these are directly related to the reliability of the components themselves, while some are related to the structure of the system. Some of them depend on both the structure of the system and the reliability values of the components. In this study, the reliability-based importance measures that measure the change in the system reliability according to the change in reliability of a particular component were examined.
2.1. The Birnbaum (B –Reliability Importance) Reliability Importance Measure
This measure, which is calculated based on the reliability values of the components, is the first defined reliability importance measure. This importance measure which was put forward by Birnbaum takes into account the possibility that the component is critical to the system (Kuo & Zhu, 2012, s. 54).
I i E R RRpB i i i ii
; , , ,p( ) = ( ) - ( )( ) = ( ) - ( ) = ¶ ( )
f f1 0 1 0X X p pp
It is calculated using the equation above (Birnbaum, 1969). In this equation,I iB ;p( ) , refers to the Birnbaum importance of component i and R p( ) refers to the system reliability. The Birnbaum importance is an importance measure that has been studied and developed by researchers for many years. Some of these studies are the following: Barlow and Proschan proposed a new importance measure that would improve the Birnbaum importance (Barlow & Proschan, 1975). Boland and Al-Neweihi conducted a literature review on the importance measures in the reliability theory (Boland & El-Neweihi, 1995). Lee et al. put forward a calculation method to evaluate the importance measures of the gates in a fault tree(Lee, Lie, & Hong, 1997). Andews and Beeson presented the Birnbaum importance measures for non-coherent systems (Andrews & Beeson, 2003). On the other hand, Meng offered simple criteria for the Birnbaum importance measures used in the cases where the component reliability of the two-state coherent systems is unknown (Meng, 2004). Selwyn and Kesavan mentioned the Birnbaum importance of the components for the wind turbine (Selwyn & Kesavan, 2011). Bulut et al. examined the Birnbaum importance, for the consecutive k‐out‐of‐n G system, in terms of Monte Carlo simulations and various values (Bulut, Demiralp , & Şık, 2015).

Recent Researches in EnGInEERInG sCIEnCEs ¨ ¨ 125
2.2. Potential Reliability Importance Measure
When an element in a system is replaced with an element with a reliability of 1, the increase in the system is measured by the potential importance. To show the potential importance for the component i, I iIP ; p( ) is calculated with the following equation:
I i p I iIP i B; � ;p p( ) = -( ) ( )1
(Amrutkar & Kamalja, 2017, s. 155). For the potential importance, the studies (Freixas & Pons , 2008), (Aven & Nϕkland, 2010) can be reviewed.
2.3. Critical Reliability Importance Measure
The Birnbaum importance measure has been considered incomplete by the researchers because the importance level does not take into account the reliability value of the component whose importance level is measured, and hence alternative component importance measures have been studied to eliminate this deficiency. As a result of these studies, Kuo and Zuo proposed two separate importance measures for the operation or failure of the system and it was called as the Critical Reliability Importance Measure (Kuo & Zuo, 2003, s. 195). The critical reliability importance measure is calculated using the following equation in the case of failure of the system:
I i qR
I iCAi
B; ;pp
p( ) =- ( ) ( )1
and it is calculated using the following equation in the case of operation of the system:
I i pR
I iCÇi
B; ;pp
p( ) = ( ) ( )�
(Kuo & Zhu, 2012, s. 61). Critical reliability importance measure has been studied by many authors. The studies (Borgonovo, 2007)(Bisanovic, Hajro, & Samardzic, 2013) can be shown as examples.
2.4. Bayesian Reliability Importance Measure
It is an importance measure developed by Birnbaum to investigate which component causes system failure when the system fails and how important other components are to system failure (Kuo & Zhu, 2012, s. 62). Later, the formulation proposed by Birnbaum was developed by Singpurwalla and rendered more efficient using the folowing equation:

126 ¨ ¨ soME RELIABILItY sIGnIFICAnCE MEAsUREs AnD A nUMERICAL APPLICAtIon FoR tHEsE IMPoRtAnCE MEAsUREs
I i q pR
I iBy ii
B; ;pp
p( ) = +- ( ) ( )
æ
èçç
ö
ø÷÷� 1
1
(Singpurwalla, 2006).
2.5. Fussell - Vesely Reliability Importance Measure
When a minimal cutset fails, the components within the minimal cutset contribute to system failure. Considering this fact, Fussell and Vesely developed an importance measure based on cutsets. This importance measure can be calculated using the following equation:
I iq
RFVj
m
l C lij
;( )
pp
( ) »-= Îå Õ11
In this statement, Cij (cutset j including the component i) indicates the cutsets
(Rausand & Hoyland, 2004, s. 196).
3. Methodology A block diagram designed for the main components of a conventional thermal power plant will be used in the study. For this purpose, the reliability block diagram given for the design scheme of the main components of a 600MW conventional thermal power plant used in the 2016 study of Bisanovic et al. (Bisanovic, Samardzic, & Agano, 2016, s. 67) will be used. For this scheme, 11 representative components were used against the elements of the plant, and thus, the above-mentioned component importance measure methods and the importance measures of the components were tested for the reliability values to be obtained by these components. With the help of the simulation developed here, which component will be important in terms of system success or failure was tested by means of the given importance measures when reliability values p take 100, 1000, 10000, 100000 different values. The study was tested by ensuring that p values are assigned the values limited to the range of 0.8,1 based on the rationale that the system designers want to work with reliable elements. For the importance measure calculated with the help of the developed counter, it was reported which component obtained the highest value for how many times because of the measure. In the study, the simulation was prepared using Matlab R 2017a package program. One of the structural diagrams of the conventional power plant at the design stage is as follows.

Recent Researches in EnGInEERInG sCIEnCEs ¨ ¨ 127
J
BK
BK
IP
IP
II P
II P
ASP
ASP
BP
BP
T
600 MW
Figure 1: Structural scheme of a 600MW conventional thermal power plant at design stage (Bisanovic, Samardzic, & Agano, 2016, s. 66). ( I p , �II p represents the pipes of the fi rst and second fundamental loops respectively; ASP represents main circulation pump; BP represents feed pump; BK represents steam boiler and T represents turbine).
Although each component in the design is represented by the same components, since the reliability of the same two components under operating conditions is not necessarily the same, each component in the block diagram is considered as separate components. The corresponding symbols of the components in the block diagram are recoded as A1= IP , A2= ASP, A3= BK, A4= IIP , A5= BP, A6= IP , A7= ASP, A8= BK, A9= IIP , A10= BP and A11= T in terms of ease of operation and visuality. The block diagram is given below.
Figure 2: Reliability block diagram of the components for traditionalthermal power plant at the design stage (Bisanovic, Samardzic,
& Agano, 2016, s. 66) (Menteş, 2018, s. 50).

128 ¨ ¨ soME RELIABILItY sIGnIFICAnCE MEAsUREs AnD A nUMERICAL APPLICAtIon FoR tHEsE IMPoRtAnCE MEAsUREs
4. Results And DıscussıonThe simple simulation visual developed for the design whose block diagram is shown in Figure 2 is given in Annex 1.
The Birnbaum importance, Potential importance, Critical importance, Bayesian importance and Fussel-Veseley importance measures were calculated for reliability values p in the range of (0.8, 1) with the help of the processor defined as component values in the simulation. The results that are obtained for p values assigned randomly with the help of the developed counter are indicated in tables.
Table 1: Component Importance Measure Values as a Result of Different TrialsComponent
D(2)Number of Trials
D(3) D(4) D(5)
Impo
rtanc
e M
easu
res
Birn
baum
��I B
A1 0 0 0 0A2 0 0 0 0A3 0 0 0 0A4 0 0 0 0A5 0 0 0 0A6 0 0 0 0A7 0 0 0 0A8 0 0 0 0A9 0 0 0 0
A10 0 0 0 0A11 100 1000 10000 10000
% 100 100 100 100
Impo
rtanc
e M
easu
res
Pote
ntia
l I IP
A1 2 30 311 3099A2 5 23 328 3029A3 3 23 268 3091A4 3 22 340 3161A5 4 28 284 3056A6 4 30 306 3136A7 4 36 324 3151A8 2 33 285 3093A9 7 34 306 3135
A10 1 26 306 3183A11 65 715 6932 68866
% 65 71,5 69,3 68,9

Recent Researches in EnGInEERInG sCIEnCEs ¨ ¨ 129
Impo
rtanc
e M
easu
res
Crit
ical
ICA
A1 2 30 311 3099A2 5 23 328 3029A3 3 23 268 3091A4 3 22 340 3161A5 4 28 284 3056A6 4 30 306 3136A7 4 36 324 3151A8 2 33 285 3093A9 7 34 306 3135
A10 1 26 306 3183A11 65 715 6932 68866
% 65 71,5 69,3 68,9
Impo
rtanc
e M
easu
res
Bay
esye
n �I By
A1 3 34 417 4158A2 6 37 414 4035A3 3 32 371 4137A4 7 33 427 4161A5 4 35 371 4092A6 6 41 415 4100A7 5 35 418 4077A8 3 45 394 4093A9 6 40 391 4127
A10 2 42 415 4204A11 55 626 5967 58816
% 55 62,6 59,7 58,8
Impo
rtanc
e M
easu
res
Fuss
el-V
esel
ey IFV
A1 5 42 491 4677
A2 6 41 482 4585A3 6 41 444 4671
A4 5 36 491 4690A5 5 38 424 4594A6 6 51 461 4640A7 5 40 455 4624A8 2 50 438 4570

130 ¨ ¨ soME RELIABILItY sIGnIFICAnCE MEAsUREs AnD A nUMERICAL APPLICAtIon FoR tHEsE IMPoRtAnCE MEAsUREs
A9 7 50 449 4632A10 4 47 469 4759A11 49 564 5396 53558
% 49 56,4 53,9 53,6D(n) = 10n refers to the number of trials.* The percentage value is given for the component that was identified as the most important component as a result of the trial.
In all importance measures and all different trial results, the component A11 was identified as the most important component. For the first hundred p value randomly produced, the A11 component was determined as the most important component by 100% according to the Birnbaum importance measure, 65% according to the potential importance and critical measure, 55% according to the Bayesian importance measure and 49% according to the Fussel –Veseley importance measure. For the thousand p value randomly produced, the A11 component was determined as the most important component by 100% according to the Birnbaum importance measure, 71.5% according to the potential importance and critical measure, 62.6% according to the Bayesian importance measure and 56.4% according to the Fussel –Veseley importance measure. For the ten thousand p value randomly produced, the A11 component was determined as the most important component by 100% according to the Birnbaum importance measure, 69.3% according to the potential importance and critical measure, 59.7% according to the Bayesian importance measure and 53.9% according to the Fussel –Veseley importance measure. For the hundred thousand p value randomly produced, the A11 component was determined as the most important component by 100% according to the Birnbaum importance measure, 69.9% according to the potential importance and critical measure, 58.8% according to the Bayesian importance measure and 53.3% according to the Fussel–Veseley importance measure. Due to the structural scheme of the model, it is an expected result that the A11 component is the most important component. However, as the importance measures developed for the model vary, the percentage of being the most important component in the trial results decreases. When other components except the A11 component are examined, there is no distinguishing component. However, there is a distinguishing component as the second most important component after A11 for all importance measures for 100000 trials.

Recent Researches in EnGInEERInG sCIEnCEs ¨ ¨ 131
5. ConclusionsIn this study, using one of the commonly used design schemes of a conventional thermal power plant at the design stage, it was aimed to calculate which of the components is the most important component for the system. There are many importance measure calculation methods in the literature. Each of these importance measures tries to determine the importance of the component with different approaches for the same purpose. The importance measures used in the study are those based on reliability. In the reliability-based measures of importance, the component importance depends on both the structure of the system and the reliability of the components over a certain and fixed operation period (Amrutkar & Kamalja, 2017, s. 154). In the study, different reliability importance measures for the same data set and the component values for the entire system were calculated simultaneously. In addition, with the help of a counter added to the simulation, it was determined which component was found as the most important component for how many times, as a result of the measure, and the results were reported in Table 1. The Birnbaum importance measure is the first developed importance measure and identified the turbine component encoded with A11 as the most important component in all trials. The Birnbaum importance measure does not take into account the importance of the component itself during calculation. Therefore, it is natural to determine the turbine component connected to the system in series as the 100% most important component in all measurement results. Because the results are the same for potential importance and critical importance measures, it will be sufficient to interpret one. Potential importance measurement is interpreted as an increase in system performance when a component is an excellent component. In this case, the turbine component was calculated as the most important component by 65% for 100 p reliability value, 71.5% for 1000 p reliability value, 69.3% for 10000 p reliability value and 68.9% for 100000 p reliability value. The values obtained for the critical importance measure are the same as the values obtained for the potential importance measure. As a result of the Bayesian importance measurement, which was developed to determine the importance of the component that caused the system failure and the other components for system failure while the system fails, the turbine component was calculated as the most important component by 55% for 100 p reliability value, 62.6% for 1000 p reliability value, 59.7% for 10000 p reliability value and 58.8% for

132 ¨ ¨ soME RELIABILItY sIGnIFICAnCE MEAsUREs AnD A nUMERICAL APPLICAtIon FoR tHEsE IMPoRtAnCE MEAsUREs
100000 p reliability value. In the results of Fussell-Vesely importance measures developed using the cutsets, the turbine component was calculated as the most important component by 49% for 100 p reliability value, 56.4% for 1000 p reliability value, 53.9% for 10000 p reliability value and 53.6% for 100000 p reliability value.
Considering the functions of component importance measures in terms of the system, two main contributions draw our attention. First, it provides information about the component that should be focused on to improve system reliability. Second, it gives the operator the ability to predict possible system failures with the follow-up maintenance list it provides. When both elements were taken into account, the component to focus on was determined as the turbine component. Because for all measure results and all importance measure values, the turbine component was determined as the most important component. The developed measure simulation can be adapted to more complex systems. In order to guide the further studies, it can be tested, whether the turbine component remains the most important component, with the measurements to be obtained for different block diagrams of a conventional thermal power plant at the design stag
ReferencesAmrutkar, K. P., & Kamalja, K. K. (2017). An Overview of Various Importance
Measures of Reliability System. International Journal of Mathematical, Engineering and Management Sciences, 2(3), 150-171. DOI:10.33889/IJMEMS.2017.2.3-014
Andrews, J. D., & Beeson, S. (2003). Birnbaum’s Measure of Component Importance for Noncoherent Systems. IEEE Transactions on Reliability, 52(2), 213-219. DOI: 10.1109/TR.2003.809656
Aven, T., & Nϕkland, T. (2010). On the use of uncertainty importance mesaures in reliabilty and risk analysis. Reliabilty Engineering and System Safety(95), 127-133.. https://doi.org/10.1016/j.ress.2009.09.002
Barlow, R. E., & Proschan, F. (1975). Importance of the system coponent and Fault. Stochastic Processes and their Applications, 153-173. https://doi.org/10.1016/0304-4149(75)90013-7
Birnbaum, Z. (1969). On the importance of differrent component in multicomponent system. In Multivariate Analysis(2), 581-592.

Recent Researches in EnGInEERInG sCIEnCEs ¨ ¨ 133
Bisanovic, S., Hajro, M., & Samardzic, M. (2013). Component Criticality Importance Measures in Thermal Power Plants Design. World Academy of Science, Engineering and Technology International Journal of Electrical and Computer Engineering, 332-337. doi.org/10.5281/zenodo.1088656
Bisanovic, S., Samardzic, M., & Agano, D. (2016). Application of Component Criticality Importance Measures in Design Scheme of Power Plants. International Journal of Electrical and Computer Engineering (IJECE), 6(1), 63-70. DOI:10.11591/ijece.v6i1.9061
Boland, P. J., & El-Neweihi, E. (1995). Measures of component importance in reliability theory. Computers and Operations Research, 22, 455-463. https://doi.org/10.1016/0305-0548(94)00053-B
Borgonovo, E. (2007). Differential, criticality and Birnbaum importance measures:An application to basic event, groups and SSCs in event trees and binary decision diagrams. Reliability Engineering and System Safety, 92, 1458–1467. DOI: 10.1016/j.ress.2006.09.023
Bulut, Y., Demiralp , A., & Şık, M. Ş. (2015). Tutarlı Sistemlerin Birnbaum Bileşen Önem Ölçümü Üzerine. Eurasian Econometrics Statistics & Empical Economics Journal, 57-64. DOI: 10.17740/eas.stat.2015-V1-05
Cheok, M. C., Parry, G. W., & Sherry, R. R. (1998a). Response to ‘Supplemental viewpoints on the use of importance measures in risk-informed regulatory applications’. Reliability Engineering & System Safety, 60(3), 261.
Cheok, M. C., Parry, G. W., & Sherry, R. R. (1998b). Use of importance measures in risk-informed regulatory applications. Reliability Engineering & System Safety, 60(3), 213-226.
Freixas, J., & Pons , M. (2008). The İnfluence of the node criticality reliation on some measures of component impotance. Operations Research Letters(36), 557-560. DOI:10.1016/j.orl.2008.05.001
Hong, J. S., & Lie, C. H. (1993). Joint reliability-importance of two edges in an undirected network. IEEE Transactions on Reliability, 42(1), 17-23. DOI: 10.1109/24.210266
Hwang, F. K. (2001). A new index of component importance. Operations Research Letters, 28(2), 75-79. https://doi.org/10.1016/S0167-6377(01)00054-2
Kuo , W., & Zuo, M. J. (2003). Optimal Reliablty Modelling Principles and Applications. New York: John Wiley & Sons.

134 ¨ ¨ soME RELIABILItY sIGnIFICAnCE MEAsUREs AnD A nUMERICAL APPLICAtIon FoR tHEsE IMPoRtAnCE MEAsUREs
Kuo, W., & Zhu, X. (2012). Importance Mesaures in Reliabilty,Risk,and Optimization:Principles and Applications, First Edition. United Kingdom: John Wiley& Sons, Ltd.
Lee, H., Lie, C., & Hong, J. (1997). A computation method for evaluating importance-measures of gates in a fault tree. IEEE Transaction on Reliabilty(46), 360-365. DOI: 10.1109/24.664007
Lin, S., Wang, Y., Jia, L., & Li, Y. (2017). Component Importance Measure Computation Method Based Fuzzy Integral with Its Application. Hindawi Discrete Dynamics in Nature and Society, 1-18. https://doi.org/10.1155/2017/7842596
Meng, F. C. (2004). Comparıng Bırnbaum Importance Measure Of System Components. Probability in the Engineering and Informational Sciences, 18, 237–245. https://doi.org/10.1017/S0269964804182077
Menteş, N. (2018). Geleneksel Termik Santrallerin Ana Bileşenlerinin Sistem Bileşen Önem Ölçülerine Göre Değerlendirilmesi. Yayınlanmamış Doktora Tezi, 1-123. Malatya: İnönü Üniversitesi Sosyal Bilimler Enstitüsü.
Natvig, B. (2011). Multıstate Systems Relıabılıty Theory Wıth Applıcatıons. United Kingdom: John Wiley & Sons, Ltd.
Rausand, M., & Hoyland, A. (2004). System Reliabilty Theory:Models, Statistical Methods and Application 2nd Edition. New Jersey: John Wiley & Sons, Inc.
Selwyn, S. T., & Kesavan, R. (2011). Computation of Reliability and Birnbaum Importance of Components of a Wind Turbine at High Uncertain Wind. International Journal of Computer Applications, 32(4), 42-50. DOI 10.5120/3896-5459
Singpurwalla, N. (2006). Reliabilty and Risk: A Bayesian Perspective. Wiley Series in Probability and Statistics. New York: John Wiley & Sons.
Wang, W., Loman, J., & Vassiliou, P. (2004). Reliability importance of components in a complex system. 2004 Proceedings Annual Reliability and Maintainability Symposium, (s. 26). Los Angeles, California, USA,. DOI: 10.1109/RAMS.2004.1285415

Recent Researches in EnGInEERInG sCIEnCEs ¨ ¨ 135
Annex 1
Figure: Simulation İmage

136
C H A P T E R 8
InVEstIGAtIon oF tHE UsAGE oF oRGAnIC RAnKInE CYCLE In
IntERnAL CoMBUstIon EnGInEs
Yasin KARAGOZ1 & Hasan KOTEN2
1 (Asst. Prof. Dr.) Istanbul Medeniyet University, Department of Mechanical Engineering, Kadikoy, Istanbul.
E-mail: [email protected] Orcid: 0000-0001-5271-9015
2 (Assoc. Prof. Dr.) Istanbul Medeniyet University, Department of Mechanical Engineering, Kadikoy, Istanbul.
E-mail: [email protected] Orcid: 0000-0002-1907-9420
1. Introduction
In today’s tractor technology where internal combustion engines are used, only 30% -35% of the energy of the fuel used for combustion in the diesel engine can be utilized and transformed into useful mechanical energy. The
rest of the energy obtained from the fuel is thrown out as heat energy. In the use of tractors, 65% -70% of the total energy, which means most of the energy (more than 95%) defined as waste heat is discharged through exhaust gas, radiator water, and intercooler.
There are various methods in order to recycle the heat which thrown t into the environment and use it in different places. Stirling cycle, Ericsson Cycle, Thermoelectric, Thermoacoustic, and Rankine-Hirn cycle are the foremost among them. Organic Rankine Cycle is obtained by using different methods and different organic fluids in the Rankine cycle, which is one of the ways in these methods. The Organic Rankine Cycle is the only method used for waste heat recovery and

Recent Researches in EnGInEERInG sCIEnCEs ¨ ¨ 137
has also been applied commercially in recent years. However, this method is used commercially only in marine diesel engines and large generator engines.
With the study which aimed to be carried out, the Organic Rankine Cycle system will be applied to lower powered and small scale engines such as agricultural engines. In addition, the optimum heat exchanger size and type for the system and the best working fluids should be determined. Cascade cycle which is high temperature cycle and low temperature cycle can be used. In the high temperature cycle of the system, suitable ones from toluene, water and cyclohexane fluids can be used as working fluids, while in the low temperature cycle, suitable ones from ethanol, R1234yzf and R245fa can be tested and the highest efficiency of working fluids can be used.
In order to increase efficiency and save cost and space, the second heat exchanger used in the high temperature cycle should be selected to operate both as the condenser of the high temperature cycle and as the evaporator of the low temperature cycle. In this way, the waste heat during the condensation of the organic fluid in the high temperature cycle will be used, and there will be no need to use an additional condenser in the system. On the other hand, an automatic control system with microprocessor will be developed and the flow rates of the working fluids will be controlled by measuring the temperature, pressure and mass flow values of the system depending on the engine operating conditions (engine power and engine speed). In this way, with the application of this system on the tractor engine, the heat discharged to the outside will be recovered, the energy obtained from the recovered heat can be used in different places by converting it into mechanical energy, without increasing fuel consumption, an increase in the power obtained with the same fuel consumption will be provided and specific emission values (NOx, smog, CO, CO2, THC) significant reduction may occur. Thus, both fuel consumption will be improved and emissions will be reduced. Today, it is known that after treatment equipment bring an additional cost almost as much as the engine cost due to the high cost of catalyst materials. With the ORC system, it is anticipated that the reduction in emission values will result in an improvement in engine costs by using older technology systems and / or by not using some systems.
2. Literature SearchingInternal combustion engines has been the primary power source for automobiles, trucks, construction equipment, ships, etc. for years. During this time, concerns

138 ¨ ¨ InVEstIGAtIon oF tHE UsAGE oF oRGAnIC RAnKInE CYCLE In IntERnAL CoMBUstIon EnGInEs
over high fuel costs and foreign-sourced petroleum dependence have created a trend towards more and more complex engine designs to reduce fuel consumption. Engine manufacturers have applied techniques such as advanced fuel-air mixing and turbocharging to increase thermal efficiency. Despite this, as can be seen from Figure 1 in today’s engines, approximately 60% to 70% of the fuel energy is lost as waste heat through coolant or exhaust, and the effective power received remains around 35%. Moreover, increasingly stricter emission regulations are causing limitations to decrease combustion temperatures and pressures. It is seen that waste heat recovery from exhaust gas has the potential to reduce fuel consumption without increasing emissions, and thanks to the latest technological developments, these systems make usable and cost-effective. The waste heat that can be recovered from the engine is not limited to the exhaust gas only. Studies show that in and the heat from internal combustion engine is mostly dissipated by the exhaust gas and the cooling system (coolant or jacket cooling). While the exhaust gas temperature mainly depends on the maximum rated power of the internal combustion engine, the jacket water temperature is almost the same for each engine. Generally, the exhaust gas temperature is around 500oC, the outlet temperature for jacket water is between 90oC-95oC and the return temperature is between 70C-85oC. It is recognized that recovering waste heat from exhaust gas and jacket water provides valuable opportunities as it can significantly increase engine efficiency and bring significant economic and environmental benefits.
Figure 1. Typical energy distribution of internal combustion engine
The two main sources for waste heat from internal combustion engines are seen as exhaust gas and engine cooling water / water jacket. Other thermal source options for heat recovery are the exhaust gas recirculation (EGR) system and air charge. These sources provide relatively small amounts of waste heat. Looking at both main sources (exhaust gas and cooling water), although they

Recent Researches in EnGInEERInG sCIEnCEs ¨ ¨ 139
have similar energy content, the high temperature of the exhaust makes it a more thermodynamically efficient source. This results in a higher achievement of theoretical efficiency when connected to a heat engine. Previous research in this area shows that the alongside the potential for simultaneous heat recovery from both engine coolant and exhaust, as well as other heat sources are available and therefore systems need to be improved. To date, many methods have been developed in order to benefit from the waste heat of the engine. Some of these are Stirling cycle, Ericsson cycle, thermoelectricity, thermoacoustics and Rankine-Hirn / Rankine cycle.
The Stirling cycle is an external heat engine discovered by Rebort Stirling in 1816. A gas is chosen as fluid and the piston moves between the hot surface and the cold surface, thereby converting the gas pressure change to work. The Stirling cycle consists of four stages: isothermal compression, heat insertion process at a constant volume, isothermal expansion, and heat release process at constant volume. It is a simple and robust system. However, since they are not suitable for heat recovery especially in partial loads, they are not used in today’s vehicles. They are used in military and aerospace applications, for micro cogeneration, especially in croyogenic applications.Ericsson Engine is another external combustion engine found by John Ericsson in 1833 (Danel et al., 2015). Although the Ericsson cycle is an open cycle, it can also be used as a closed cycle when fluids other than air are used. In open cycle, air is compressed, heated and expanded for work; they are cooled after expansion in a closed cycle. A regenerator can also be used to increase the efficiency of the system. The Ericsson cycle consists of isothermal compression, compression at constant pressure, isothermal expansion, and release of heat at a constant pressure. While the Ericsson cycle is rarely used in vehicle applications, it is mostly used in micro-cogeneration applications.
Thermoelectiricity is the Seebeck effect found by Thomas Johann Seebeck in 1821. Electrical energy is produced by using heat flow from two different semiconductor metals (LeBlanc 2014). These two metals must also have different electrical conductivity. It has no mechanical parts and it is used in automotive applications thanks to its simplicity. However, their efficiency is low and their cost is very high. For this reason, they are widely used mostly in space applications.
Thermoacoustic is a technology that started to develop in the 1980s. The heat released due to the temperature difference amplifies an acoustic wave

140 ¨ ¨ InVEstIGAtIon oF tHE UsAGE oF oRGAnIC RAnKInE CYCLE In IntERnAL CoMBUstIon EnGInEs
(Haddad et al., 2014). The acoustic wave is converted into electrical energy through a microphone or a piston connected to the alternator. Although the absence of mechanical parts provides an advantage in terms of robust, they do not have industrial applications yet.
Rankine cycle is the oldest type of thermal machine which used in steam engines. It began to be used in the 18th century, and in 1781, James Watt’s steam engine was firstly used. Today, this system is used in large energy system plants operating with nuclear or coal energy. In recent years, the Rankine-Hirn cycle, whose schematic is given in Figure 2, is also used in small-scale heat recovery applications (Sprouse & Depcik, 2013). Although water is generally used as a smog fluid, different fluids are used for the temperatures of different heat sources. The Rankine cycle in which the organic working fluid is used is called the organic Rankine cycle. In the Rankine cycle, the fluid passes through the heat exchanger (evaporator) and passes into the vapor phase by drawing heat from the waste heat source. Work is obtained from the fluid that expands with the help of a steam turbine or a piston and is condensed in the condenser, pressurized with a pump and sent back to the evaporator. Diversity of the Rankine-Hirn cycle, the steam is also superheated. The Rankine cycle is the most widely used system in the automotive industry and industry. Most studies choose the Rankine cycle for waste heat recovery from the engine because of its simplicity and ability to operate with low to medium temperature differences.
Also, Bianchi and DePascale (Bianchi & DePascale, 2011) proved that the Rankine cycle gives the best performance. Therefore, in this study, the organic Rankine cycle will be used, and the waste heat sources in the internal combustion engine, the behavior of the engine in changing operating conditions, the design or selection of the components and the organic fluid selection have been examined for the establishment of the system. In the evaporator in the Rankine cycle, the source from which the fluid in the system draws heat can be exhaust gas, cooling water or other low waste heat sources. In order to make better use of low waste heat sources; as it can be seen in Figure 3, it is possible to design an organic Rankine cycle with more than one step. In a multi-step organic Rankine cycle, the first step is the high temperature cycle where using high waste heat sources, and the other step can be considered as the low temperature cycle where using low heat sources. Using such cascade systems, it is possible to obtain higher power and thermal efficiency from the waste heat of the motor compared to a single-step Rankine cycle.

Recent Researches in EnGInEERInG sCIEnCEs ¨ ¨ 141
Figure 2. Rankine cycle with a single heat source
Figure 3. Double-stage Rankine cycle system with exhaust gas and cooling water sources in internal combustion engine
The heat released from the engine differs considerably compared to thermal sources. It is important for research to examine these sources in order to understand the amount of waste heat that can be recovered. Although it varies according to the engine type, the most basic and highest temperature waste heat recovery source in an engine is the exhaust gas. Although the temperature of the exhaust gas varies between 200C and 500C depending on the operating conditions of the engine, it is possible to reach up to 700C in different engine types. In a system with high and low temperature sources, it will not be very

142 ¨ ¨ InVEstIGAtIon oF tHE UsAGE oF oRGAnIC RAnKInE CYCLE In IntERnAL CoMBUstIon EnGInEs
advantageous to create a single-stage cycle, as the temperature of the fluid in the cycle may be higher than the temperature of the waste heat source after a while. Such systems should use more than one step cycle and make the best use of high and low temperature sources. Therefore, different organic Rankine cycle (ORC) systems (simple ORC system (Srinivasan et al. 2010, Vaja & Gamborotta, 2010), regenerative ORC system (Vaja & Gamborotta, 2010, Larsen et al.2013) and pre-heated ORC system (Yu et al.2013), Song et al. 2015) were designed and used for waste heat recovery in engines. Further, dual stage ORC systems were used for waste heat recovery from both exhaust gases and cooling water. Shu et al. (Shu et al., 2014) suggested a dual stage ORC system and used water in the high temperature part and organic working fluid in the low temperature part. According to the analysis results, the maximum power increase reached 36.77 kW and the maximum energy efficiency reached 55.05%. Choi and Kim (Choi & Kim, 2013) used a double-stage waste heat recovery system and according to the results obtained, a thermal efficiency increase of 10.93% was achieved in the diesel engine. Zhang et al. (Zhang et al., 2013) analyzed the double-stage ORC system in the light duty diesel engine. According to the results, 16% power increase occurred. Panesar et al. (Panesar et al., 2014) analyzed it in a double-stage ORC system in a long tractor, mixture at high temperature level and hydroflorette at low temperature level were used and power increase was achieved up to 7.4%. Yu et al. (Yu et al., 2016), in his study, a 5.6% power increase is obtained from the waste heat of the exhaust gas. Yagli et al. (Yagli et al., 2016) recovered waste heat from the exhaust gas of the engine which using biogas fuel. In the subcritical ORC system, the optimum conditions have been achieved at the turbine inlet at 30bar pressure and 165oC temperature; net work was calculated as 79.23kW and thermal efficiency as 15.51%. In the Supercritical ORC system, the optimum conditions are obtained at the turbine inlet at 38bar pressure and 165oC temperature; net work 81.52kW, thermal efficiency 15.93%. Shu et al. (Shu et al., 2016) used the heavy-duty diesel engine’s exhaust gas and used cooling water, charge air and exhaust gas recirculation as waste heat source. Its maximum net power was 38.2kW and its thermal efficiency was 11.3%. Song and Gu (Song & Gu, 2015) designed a single ORC system using cooling water for preheating and engine exhaust gas for evaporation to study the waste heat recovery of a diesel engine, and a maximum net power of 78.3 kW was obtained from this system.

Recent Researches in EnGInEERInG sCIEnCEs ¨ ¨ 143
The net power and system efficiency obtained from the waste heat recovery system varies greatly depending on the operating conditions of the engine (load, torque, speed, etc.). The main reason for this is the change in the temperature of the waste heat sources and the mass flow rates of the fluids in the system depending on the changing operating conditions. Yu et al. (Yu et al., 2016), in the study, while the waste heat was 44.9kW at 1900rpm 60% load, it increased to 98.9 with an increase of 120% at full load. Mastrullo et al. (Mastrullo et al., 2015) used diesel engine and gasoline engine. For both, the powers obtained from the waste heat according to the varying operating conditions were examined. When the diesel engine is used, the maximum power that can be taken from the system is 13.79kW at 1300rpm at full load. When the load is reduced to 50% in the same cycle, the power decreases to 10.07kW. However, the power obtained at 2100rpm at full load drops to 13.42kW. While the load has an increasing effect on the waste heat in diesel engines, the increase in cycle has negligible effects and causes a decrease in the obtained power. Looking at the gasoline engine, the speed and torque have an effect on the power gain. While the power obtained under 240Nm, 3000rpm conditions is 5.07kW, when the cycle increases to 5000rpm, the power increases to 7.45kW. When the cycle is kept constant at 5000rpm and the torque is reduced to 150Nm, the net power received is 6.51kW. However, it should be noted that the change of torque at low speeds affects the power output much more. Galindo et al. (Galindo et al., 2015) tackled with different operating conditions by increasing the cycle from 1500rpm to 3000rpm, torque from 82.4Nm to 142, Nm in the gasoline engine operation, and the power output was at the lowest value with 0.21kW in the first case and 1.81kW in the last case and measured that it reached the highest value. Shu et al. (Shu et al., 2016) found that as the torque and speed increased, the waste heat from each source increased significantly. The net power obtained from the system reaches its highest values in areas where the torque is higher than 1800rpm and the torque is higher than 1050Nm. Net power varies between 30-34 kW in this operating range. The thermal efficiency of the system, on the other hand, varies between 7.6-11.3%, although it varies greatly according to operating conditions and power. It is understood from the studies that, due to the very high amount of waste heat in engines operating under severe conditions, these types of engines are suitable for integrating waste heat recovery systems. Tractors and work machines are engines that work under such severe conditions and have a very high waste heat recovery potential.

144 ¨ ¨ InVEstIGAtIon oF tHE UsAGE oF oRGAnIC RAnKInE CYCLE In IntERnAL CoMBUstIon EnGInEs
Shu et al. (Shu et al., 2016) examined how the system reacts according to the sudden change in engine load and speed on a system using a double-step organic Rankine cycle. When the system is running at 2200rpm and 100% load, it is reduced to 1200rpm and 20% load and restored again after a while, and according to the results, the change in power taken from the cycle is not very abrupt. The reason is that the thermal energy stored by the fluids in the double-stage cycle continues for a while and therefore, the waste heat recovery system to be integrated into passenger cars, commercial vehicles or work machines will work in harmony with the sudden load and cycle change of the engine, so it is appropriate to use it.
One of the most important points to be considered in order for the system integrated for waste heat recovery to be suitable both economically and dimensionally is heat exchangers. The type and dimensions of the heat exchanger are of great importance in heat transfer. Increasing the area will increase the amount of heat transfer, but it is undesirable due to the increase in cost and taking up a lot of space in the system. For this reason, optimization of heat exchanger areas has been the focus of many studies. Also, the type of heat exchanger will change the amount of heat transfer due to the change in the heat transfer coefficient. Heat exchangers used in places where fluid temperatures are high, should have a more compact design, made of materials that can withstand high temperatures and have high heat transfer coefficients. However, these features again increase the costs. Mastrullo et al. (Mastrullo et al., 2015) modeled the evaporator in a single-stage waste heat recovery cycle. For heavy-duty diesel engines, a fin-and-tube heat exchanger with an area of 180x449x840mm3 (0.06m2) and a gross weight of 14.8 kg that can be used to transfer approximately 200 kW of waste heat has been designed. For the light-duty gasoline engine, a fin-and-tube type heat exchanger with an area of 135x269x320mm3 (0.0116m2), which can be used to transfer waste heat up to 100 kW at high loads and speeds, has a gross weight of 3.0kg. Yang et al. (Yang et al., 2015) found that the preheating zone has the maximum heat transfer rate and surface area for the fin-and-tube type heat exchanger in his study where the maximum net power reached 13.84kW. The ratio of the effective heat transfer area to the real area in the entire operating range of the diesel engine is in the range of 16.46-69.19%. Yang et al. (Yang et al., 2016), in another study conducted with a double-step cycle, the heat exchanger using exhaust gas as a source was selected as fin-and-tube type due to its durability and high efficiency, and plate heat exchangers were used in parts where fluids at lower temperatures are used partially. Heat exchanger areas;

Recent Researches in EnGInEERInG sCIEnCEs ¨ ¨ 145
18.13m2 for the high temperature cycle evaporator (fin-and-tube), 0.63m2 for the evaporator in the low temperature cycle (plate heat exchangers), 1.11m2 for the intercooler, 1.69m2 for the preheater, and 4.48m2 for the condenser. Galindo et al. (2016) made an optimization in waste heat recovery with a single-step cycle and calculated a total area of heat exchangers of 0.48 m2 (3 plate heat exchangers are used in the system) according to the results.
One of the most important elements in system efficiency and power acquisition is the expanders that provide power. The pressure formed at the inlet and outlet of these elements directly affects the power obtained from the different fluid. The higher the pressure at the expander inlet and the higher the isentropic efficiency of the element, the more power will be obtained. The main reason for the pressure increase of the fluid in the cycle is the increase in the engine load and speed. As the engine load and speed increase, the amount of fuel sent into the cylinder will increase, so the mass flow and temperature of the exhaust gas will be high. Thanks to this effect, the total thermal load of the exhaust gas will increase, so the amount of waste heat will be high. The energy of the fluid in the cycle that will ensure for the increase will also increase more than low loads. The rise will cause an increase in pressure and temperature if the mass flow of the fluid remains unchanged. Condensing temperature, superheating temperature, condensing pressure etc. effects also change with the change of pressure and affect the net power gain. Galindo et al. (Galindo et al., 2016), it is seen that the maximum power that can be obtained, 2.5 kW, can be reached at the expander input pressure around 30bar. At this point, the superheating temperature is 60C. At lower superheating temperatures, the net power obtained decreases, even if the pressure remains the same. Yang et al. (Yang et al., 2016), in the study, the net power that can be obtained increases with the increase in pressure, and the maximum power is obtained at 3 MPa pressure around 20 kW.
Turbines are generally used to obtain power from the heat transferred fluid in the recovery of waste heat from the engine. Thanks to the turbines, the energy of the fluid is converted into mechanical work and made available in vehicles. Turbine numbers are used according to the number of steps of the cycle in the system. In some studies, screw compressors are also used instead of turbines. The screw compressor added to the system in reverse compared to the working press, instead of pressurizing the fluid, expands it and net power is obtained. In studies where turbine technology is insufficient, expansion valve can be used. Yu et al. (Yu et al., 2016), in the study, since a suitable turbine

146 ¨ ¨ InVEstIGAtIon oF tHE UsAGE oF oRGAnIC RAnKInE CYCLE In IntERnAL CoMBUstIon EnGInEs
design could not be found, an expansion valve was used to replace it. Thus, the net power that can be obtained by the pressure difference of the fluid passing through the expansion valve has been calculated. It has been observed that the fluid entering the expansion valve at 4000 kPa provides an increase in power of 5.6% compared to a diesel engine. In the study of Shu et al. (Shu et al., 2016), the maximum power output that can be obtained by using the expansion valve was calculated as 9.67 kW and the maximum thermal efficiency as 14.5%.
The most suitable method in waste heat recovery is the Rankine cycle, as mentioned earlier. Water and water vapor are used as fluids in the normal Rankine cycle. However, the boiling temperature of the water is very high, so it is suitable to be used in cycles where the temperature of the heat source is very high (such as exhaust gas). The use of alternative fluids instead of water was investigated in order to obtain higher thermal efficiency and higher net power by recovering heat from other low temperature sources in the engine. The Organic Rankine cycle is a cycle in which fluids with a lower boiling point can be used, the working principle of which is the same as the Rankine cycle. When the organic fluids that can be used here turn into superheated steam at low temperatures and pass through the turbine, power can be obtained from the system. However, it is seen that these organic fluids have some advantages and disadvantages with the researches. Therefore, fluid selection is one of the most important parameters for this study. Consideration should be given to environmental influences such as ODP (ozone depletion potential) and GWP (global warming potential) in fluid selection. In addition, parameters such as the thermodynamic properties, safety and chemical stability of the fluid should be considered (Yang et al., 2016).
The used organic fluids have some disadvantages. The most important of these is that the chemical structure of such fluids begins to decompose at lower temperatures than other fluids. As it is known, the highest heat source in engines is the exhaust gas that reaches very high temperatures and the heat potential to be gained from this is quite high. In order to bring this potential waste heat to the system, the organic Rankine cycle is usually integrated into the system in two steps. The first cycle can be called the high temperature cycle and the second cycle is the low temperature cycle. The fluid used in the high temperature cycle is used to extract heat from the exhaust gas, if any, from other high temperature sources, and is selected from fluids with a higher chemical decomposition temperature than the fluids used in the low temperature cycle. In the low temperature cycle, a selection is made among fluids that have a low

Recent Researches in EnGInEERInG sCIEnCEs ¨ ¨ 147
chemical decomposition temperature but can easily change phase. Thus, heat recovery is also provided from low temperature waste heat sources. The correct selection of fluids for each step in the Organic Rankine cycle plays an important role in the change of power and thermal efficiency obtained from the system.
The fluid used in the high temperature cycle can be fluids with high thermal capacity and high decomposition temperature, such as water or oil. Shu et al. (Shu et al., 2016) compared four fluids that can withstand high cycle temperatures. When choosing a fluid, it has been taken into account that it has a low critical temperature (to work in a transcritical state), its chemical decomposition temperature is high (because it is in contact with high temperature fluids), it has a high boiling point at atmospheric pressure (when it enters the condenser, it can easily release its heat to the low temperature cycle). Since Toluene, D4, decane, cyclohexane are organic fluids that ensures these criteria, it has been tested which of them performs better. When the results are compared, the fluids are listed as toluene, decane, cyclohexane, D4 from good to bad according to their performance and thermodynamic properties. Toluene is the fluid in which the best results can be obtained in this study, and if this fluid is used in the high temperature cycle of the organic Rankine cycle, it is seen that the net power obtained from the system outside the motor is 38.2kW and the thermal efficiency of the whole system is up to 11.3%. In the study by Yu et al. (Yu et al., 2016) that, water vapor was chosen as the high temperature cycle fluid. Total mechanical power can be obtained between 6.9kW and 12.7kW in the designed cascading system. When these results are compared with a normal diesel engine, it is seen that a power increase of 5.6% is achieved. The same system used in the study of Shu et al. (2016) that, an evaluation was made by changing the fluid in the high hot cycle. The fluid used in this system is toluene and the maximum power output that can be obtained is 9.67kW and the maximum thermal efficiency is around 14.5%.
There are many different organic fluids used in the literature in the low temperature cycle of stepped organic Rankine cycles. One of the important points in the selection of the organic fluid is the critical temperature of the organic fluid. As this cycle operates at low temperatures, it may be possible for the fluid to condense in the turbine or an expander element used for power generation. This will cause the system to malfunction and the expander element to be damaged. In order to avoid this undesirable situation, it should be ensured that the fluid expander element will leave in the vapor phase even if the heat that can be obtained from the cycle is minimum. The lower the critical temperature of the

148 ¨ ¨ InVEstIGAtIon oF tHE UsAGE oF oRGAnIC RAnKInE CYCLE In IntERnAL CoMBUstIon EnGInEs
selected fluid, this risk is minimized. There are some organic fluids encountered in the literature and frequently used in the organic Rankine cycle by those who work on this subject. Shu et al. (Shu et al., 2016) examined the fluids that can be used in the low temperature cycle of a double-step organic Rankine cycle system. The system was run for four fluids that can be used in waste heat recovery (R143a, R218, R41, and R125) and their performances were checked for each. The best performing fluid was found to be R143a. When R143a is used, the resulting net power reaches 33.9kW and thermal efficiency reaches 9.9%. R125 is seen to have better values than R218. The R41, on the other hand, had clearly the lowest performance. In the study of Yang et al. (Yang et al., 2016), a double-step organic Rankine cycle with using R245fa as an organic fluid in both steps was designed. The high chemical decomposition temperature of R245fa enables it to be used as an organic fluid in both steps and facilitates improvement studies due to the use of a single fluid in the system. In this system, it is seen that the net work obtained in different operating conditions of the motor varies between 0.49kW and 12.56kW in high temperature cycle and between 1.35-11.06kW in low temperature cycle, while the thermal efficiency of the whole system varies between 8.79-10.17.
The stepping of the organic Rankine cycle used, increases the complexity and cost of the system. A single-step organic Rankine cycle can also be used to obtain waste heat from engines in order to design a more sustainable and viable system, but this may require operating at slightly lower temperatures. In the applied study by Kosmadakis et al. (Kosmadakis et al., 2016) that, it was determined that there are systems with a net power output approaching 10kW even in systems with low source temperatures ranging from 70C to 100C. It is seen that the most preferred organic fluids to obtain power from such low welding temperatures are R134a, R245fa and R123.
The disadvantage of some organic fluids is their high flammability, which may limit the practical applicability of this system. In the study of Song and Gu (Song & Gu, 2015), a single organic Rankine cycle was designed for waste heat recovery from the engine. Cyclohexane, benzene and toluene were selected as pure working fluids and the net power taken from the system was 78.3 kW when cyclohexane was used with tests. However, it has been investigated to use it with other fluids to suppress high flammability. R141b and R11 were chosen as retarders and mixed with cyclohexane to suppress flammability. According to the simulation results, a 50% -50% cyclohexane-R141b mixture has achieved a net power of 88.7 kW with a power increase of 13.3%.

Recent Researches in EnGInEERInG sCIEnCEs ¨ ¨ 149
3. Application Methods and Solution Suggestions of ORC System in Tractor Engines
In the first stage of the work aimed to be developed, the power obtained as a result of the combustion of fuel in a tractor diesel engine and the amount of heat energy released should be obtained with test results depending on the cycle in which the engine is running. Then, the ratio of exhausting fluids and components such as exhaust gas, radiator water and intercooler to total waste heat should be examined. Depending on the temperature of the waste heat energy and waste heat source, the organic fluid should be selected separately for the high temperature cycle and the low temperature cycle, and it should be tested in the double-step organic Rankine cycle whose schematic is given in Figure 4. In the system, a total of five heat exchangers should be used in the high temperature cycle using the exhaust gas as a waste heat source and in the low temperature cycle using other waste heat sources as waste heat sources. While one of the heat exchangers passes through the intercooler, the other intake air can be used to transfer the waste heat resulting from the cooling of the radiator water to the low temperature cycle. The evaporator in the high temperature cycle will be used to superheat the fluid by utilizing the waste heat of the exhaust gas. A condenser must be used in both cycles in order to condense the fluid that expands through the turbine before it goes to the pump, so a condenser will be placed at the turbine outlet in the low temperature cycle. The second heat exchanger, which is used in the high temperature cycle in order to increase efficiency and save cost and space, works both as the condenser of the high temperature cycle and as the evaporator of the low temperature cycle. Thus, the waste heat during the condensation of the organic fluid in the high temperature cycle will also be used, and there will be no need to use an additional condenser (a sixth heat exchanger) in the system. By sending the heated superheated steam / gas to the expansion valve selected according to the system pressure and temperatures in both cycles, the potential of the mechanical energy that can be obtained from the system can be determined. After the organic fluid leaving the expansion valve losing its energy, is condensed at constant pressure in the condenser, it can be pressurized by a pump designed according to the system and the cycle can be continued. While designing the system, it should be one of the priorities that it does not have any negative effect on engine performance. It will be among the priorities that the reverse pressure in the exhaust gas disposal system is not affected, the fuel consumption does not increase, and the temperature of the exhaust gas discharged
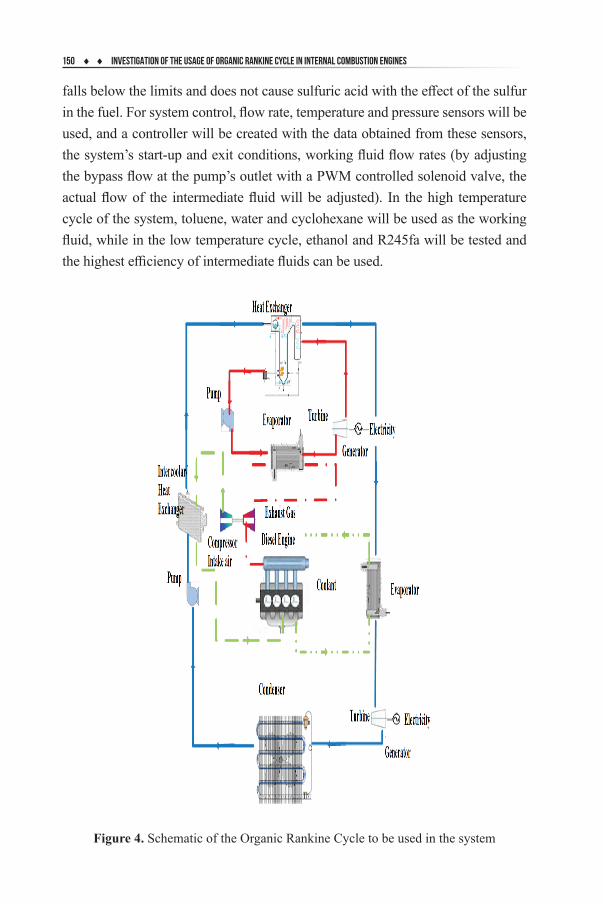
150 ¨ ¨ InVEstIGAtIon oF tHE UsAGE oF oRGAnIC RAnKInE CYCLE In IntERnAL CoMBUstIon EnGInEs
falls below the limits and does not cause sulfuric acid with the effect of the sulfur in the fuel. For system control, flow rate, temperature and pressure sensors will be used, and a controller will be created with the data obtained from these sensors, the system’s start-up and exit conditions, working fluid flow rates (by adjusting the bypass flow at the pump’s outlet with a PWM controlled solenoid valve, the actual flow of the intermediate fluid will be adjusted). In the high temperature cycle of the system, toluene, water and cyclohexane will be used as the working fluid, while in the low temperature cycle, ethanol and R245fa will be tested and the highest efficiency of intermediate fluids can be used.
Figure 4. Schematic of the Organic Rankine Cycle to be used in the system

Recent Researches in EnGInEERInG sCIEnCEs ¨ ¨ 151
Then, the electronic card to be developed will be able to control the ORC system depending on the cooling water temperature and the exhaust temperature by determining the appropriate PID control parameters depending on the engine mapping, a position sensor to be placed on the accelerator pedal and measuring the engine speed with an encoder. On the other hand, the flow rates of the fluids sent to the heat exchanger can be controlled with a frequency controlled solenoid valve system. After determining the appropriate algorithms and working principle with the ECU to be developed, software and hardware development will have a fully automatic control system. Thus, an ECU that will control the ORC cycle will be developed and placed on the engine. Then the developed system should be loaded on the dynamometer.
By examining the in-cylinder pressure and heat release rate, combustion will be interpreted in terms of both performance and emissions. With ESC 13 MOD Test, it should be worked at load and motor speeds specified in the standard. It is predicted that a tractor diesel engine with a mechanical fuel system, which normally has a Tier 3 fuel standard, was be converted to a higher emission standard such as Tier 4.
In the second phase of the studies, the optimum operating parameters for the ORC cycle should be determined by making use of the calibration algorithm obtained in the application conditions determined by the engine loading with the engine dynamometer. The schematic of the experiment set is given in Figure 5.
Figure 5. The schematic of the experiment set

152 ¨ ¨ InVEstIGAtIon oF tHE UsAGE oF oRGAnIC RAnKInE CYCLE In IntERnAL CoMBUstIon EnGInEs
In the experiments; the fuel consumption should be measured with a mass fuel meter and CO, CO2, THC, O2, NOx emissions should be measured with an exhaust gas analyzer, smog emissions should be measured with a smog emission device. The intake air flow should be measured with the help of mass air flow sensor.
Electronic Control Unit to be used in the study should be developed based on microcontroller. ECU principle diagram to be developed in the study is given in Figure 6.
As can be seen from the figure, card design and ECU software should be developed for the control of the ORC system, depending on different types of sensors. Depending on the different load conditions, the ECU programming and calibration to be developed should be performed after the appropriate cycle parameters are determined depending on the accelerator pedal position and the engine speed operating area.
Figure 6. Principle scheme of EKU
In addition, a theoretical model should be developed by modeling with one-dimensional software that is already in the market, and a theoretical model should be developed using the experimentally obtained data, and thus the most suitable working fluid and working parameters should be determined theoretically for maximum thermal efficiency parameters.
Tests should be carried out by collecting data such as the developed ECU and ORC cycle, operating parameters and total engine power, diesel consumption, emissions with the help of a data collection card.

Recent Researches in EnGInEERInG sCIEnCEs ¨ ¨ 153
4. ConclusionAs detailed above, the ORC system can be easily applied in internal combustion engines. Because, with the implementation of the ORC system in relatively smaller engines such as construction equipment and tractor engines, higher emission regulations and higher energy efficiency can be achieved. By using the ORC system, which is currently used in ship diesel engines, in diesel tractor engines called micro scale, fuel consumption will decrease, higher power will be obtained and specific regulation emission values (CO, HC, NOx, and PM) will decrease. It is predicted that by applying ORC systems to a tractor engine as described above, a more efficient and more environmentally friendly system will be developed.
ReferencesAmicabile, S., Lee, J., Kum, D. (2015). A comprehensive design methodology of
organic Rankine cycles for the waste heat recovery of automotive heavy-duty diesel engines. Applied Thermal Engineering, 87, 574-585.
Apostol, V., Pop, H., Dobrovicescu, A., Prisecaru, T., Alexandru, A., Prisecaru, M. (2015). Thermodynamic Analysis of ORC Configurations Used For WHR from a Turbocharged diesel engine. Procedia Engineering, 100, 549-558.
Bianchi, M., DePascale, A. (2011). Bottoming cycles for elektric energy generation: Parametric investigation of available and innovative solutions for the exploitation of low and medium temperature heat sources. Applied Energy, 88, 1500-1509
Choi, B. C., Kim, Y. M. (2013). Thermodynamic analysis of a dual loop heat recovery system with trilateral cycle applied to exhaust gases of internal combustion engine for propulsion of the 6800 TEU container ship. Energy, 58, 404-416.
Danel, Q., Perilhon, C., Lacour, S., Punov, S., Danlos, A. (2015). Waste heat recovery applied to a tractor engine. Energy Procedia, 74, 331-343.
Di-Battista, D., Mauriello, M., Cipollone, R. (2015). Waste heat recovery of an ORC-based power unit in a turbocharged diesel engine propelling a light duty vehicle. Applied Energy, 152, 109-120.
Dominigues, A., Santos, H., Costa, M. (2013). Analysis of vehicle exhaust waste heat recovery potential using a Rankine cycle. Energy, 49, 71-85.

154 ¨ ¨ InVEstIGAtIon oF tHE UsAGE oF oRGAnIC RAnKInE CYCLE In IntERnAL CoMBUstIon EnGInEs
Galindo, J., Climent, H., Dolz, V., Royo-Pascual, L. (2016). Multi-objective optimization of a bottoming Organic Rankine Cycle (ORC) of gasoline engine using swash-plate expander. Energy Conversion and Management, 126, 1054-1065.
Galindo, J., Ruiz, S., Dolz, V., Royo-Pascual, L., Haller, R., Nicolas, B., Glavatskaya, Y. (2015). Experimental and thermodynamic analysis of a bottoming Organic Rankine Cycle (ORC) of gasoline engine using swash-plate expander. Energy Conversion and Management, 103, 519-532
Haddad, C., Perilhon, C., Danlos, A., François, M. X., Descombes, G. (2014). Some Efficient Solutions to Recover Low and Medium Waste Heat: Competitiveness of the Thermoacoustic Technology. Enegy Procedia, 50, 1056-1069.
Jadhao, J. S. & Thombare, D. G. (2013). Review on Exhaust Gas Heat Recovery for I.C. Engine. International Journal of Engineering and Innovative Technology, 2, 93-100
Kosmadakis, G., Landelle, A., Lazova, M., Manolakos, D., Kaya, A., Huisseune, H., Karavas, C. S., Tauveron, N., Revellin, R., Haberschill, P., De Paepe, M. &Papadakis, G. (2016). Experimental testing of a low-temperature organic Rankine cycle (ORC) engine coupled with concentrating PV/thermal collectors: Laboratory and field tests. Energy, 117, 222-236
Larsen, U., Pierobon, L., Haglind, L., Gabrielii, C. (2013). Desing and optimisation of organic Rankine cycles for waste heat recovery in marine applications using the principles of natural selection. Energy, 55, 803-812
LeBlanc, S. (2014). Thermoelectric generators: Linking material properties and systems engineering for waste heat recovery applications. Sustainable Materials and Technologies, 1-2, 26-35
Lu, Y., Wang, Y., Dong, C., Wang, L., Roskilly, A. P. (2015). Design and assessment on a novel integrated system for power and refrigeration using waste heat from diesel engine. Applied Thermal Engineering, 91, 591-599.
Mastrullo, R., Mauro, A. W., Revellin, R. & Viscito, L. (2015). Modeling and optimization of a shell and louvered fin mini-tubes heat exchanger in an ORC powered by an internal combustion engine. Energy Convension and Management, 101, 697-712
Panesar, A. S., Morgen, R. E., Miche, N. D. & Heikal, M. R. (2014). A Novel Organic Rankine Cycle System with Improved Thermal Stability and Low

Recent Researches in EnGInEERInG sCIEnCEs ¨ ¨ 155
Global Warming Fluids. 4th International Conference on Production, Energy and Reliability, 17 July 2014.
Shu, G., Gao, Y., Tian, H., Wei, H. & Liang, X. (2014). Study of mixtures based on hydrocarbons used in ORC (Organic Rankine Cycle) for engine waste heat recovery. Energy, 74, 428-438
Shu, G., Liu, L., Tian, H., Wei, H. & Yu, G. (2014). Parametric and working fluid analysis of a dual-loop organic Rankine cycle (DORC) used in engine waste heat recovery”, Applied Energy, 113, 1188-1198
Shu, G., Yu, G., Tian, H., Wei, H., Liang, X. & Huang, Z. (2016). Multi-approach evaluations of a cascade-Organic Rankine Cycle (C-ORC) system driven by diesel engine waste heat: Part A – Thermodynamic evaluations. Energy Conversion and Management, 108, 579-595
Shu, G., Zhao, M., Tian, H., Wei, H., Liang, X., Huo, Y. & Zhu, W. (2016). Experimental investigation on thermal OS/ORC (Oil Storage/Organic Rankine Cycle) system for waste heat recovery from diesel engine. Energy, 107, 693-706
Song, J. & Gu, C. (2015). Anaylsis of ORC (Organic Rankine Cycle) systems with pure hydrocarbons and mixtures of hydrocarbon and retardant for engine waste heat recovery. Applied Thermal Engineering, 89, 693-702
Song, J. & Gu, C. (2015). Parametric analysis of a dual loop Organic Rankine Cycle (ORC) system for engine waste heat recovery. Energy Conversion and Management, 105, 995-1005
Song, J. & Gu, C. (2015). Performance analysis of a dual-loop organic Rankine cycle (ORC) system with wet steam expansion for engine waste heat recovery. Applied Energy, 156, 280-289
Song, J. & Gu, C. (2015). Thermodynamic analysis and performance optimization of an Organic Rankine Cycle (ORC) waste heat recovery system form arine diesel engines. Energy, 82, 976-985.
Sprouse, C. & Depcik, C. (2013). Review of organic Rankine cycles for internal combustion engine exhaust waste heat recovery. Applied Thermal Engineering, 51, 711-722.
Srinivasan, K. K., Mago, P. J. & Krishan, S. P. (2010). Analysis of exhaust wasta recovery from a dual fuel low temperature combustion engine using an Organik Rankine Cycle. Energy, 35, 2387-2399.

156 ¨ ¨ InVEstIGAtIon oF tHE UsAGE oF oRGAnIC RAnKInE CYCLE In IntERnAL CoMBUstIon EnGInEs
Tian, H., Shu, G., Wei, H., Liang, X. & Liu, L. (2012). Fluids and parameters optimization fort he organic Rankine cycles (ORCs) used in exhaust heat recovery of Internal Combustion Engine (ICE). Energy, 47, 125-136.
Vaja, I. & Gambarotta, A. (2010). Internal Combustion Engine (ICE) bottoming with Organic Rankine Cycles (ORCs). Energy, 35, 1084-1093.
Wang, E.H., Zhang, H.G., Fan, B.Y., Ouyang, M.G., Yang, F.Y., Yang, K., Wang, Z., Zhang, J. & Yang, F.B. (2014). Parametric analysis of a dual-lood ORC system for waste heat recovery of a diesel engine. Applied Thermal Engineering, 67, 168-178.
Yağlı, H., Koç, Y., Koç, A., Görgülü, A. & Tandıroğlu, A. (2016). Parametric optimization and exergetic analysis comparison of subcritical and supercritical organic Rankine cycle (ORC) for biogas fuelled combined heat and power (CHP) engine exhaust gas waste heat. Energy, 111, 923-932.
Yang, F., Dong, X., Zhang, H., Wang, Z., Yang K., Zhang, J., Wang, E., Liu,H. & Zhao, G. (2014). Performance analysis of waste heat recovery with a dual loop organic Rankine cycle (ORC) system for diesel engine under various operating conditions. Energy Convension and Management, 80, 243-255.
Yang, F., Zhang, H., Bei,C., Song, S. & Wang, E. (2015). “Parametric optimization and performance analysis of ORC (Organic Rankine cycle) for diesel engine waste heat recovery with a fin-and-tube evaporator. Energy, 91, 128-141.
Yang, F., Zhang, H., Yu, Z., Wang, E., Meng, F., Liu, H. & Wang, J. (2016). Parametric optimization and heat transfer analysis of a dual loop ORC (Organic Rankie cycle) system for CNG engine waste heat recovery. Energy, 1-23.
Yu, G., Shu, G., Tian, H., Huo, Y., Zhu, W. (2016). Experimental investigations on a cascaded steam-/organic-Rankie-cycle (RC/ORC) system for waste heat recovery (WHR) from diesel engine. Energy Conversion and Management, 129, 43-51.
Yu, G., Shu, G., Tian, H., Wei, H. & Liang, X. (2016). Multi-approach evaluations of a cascade-Organic Rankine Cycle (C-ORC) system driven by diesel engine waste heat: Part B – techno-economic evaluations. Energy Conversion and Management, 108, 596-608.

Recent Researches in EnGInEERInG sCIEnCEs ¨ ¨ 157
Yu, G., Shu, G., Tian, H., Wei, H. & Liu, L. (2013). Simulation and thermodynamic analysis of a bottoming Organic Rankine Cycle (ORC) of diesel engine (DE). Energy, 51, 281-290.
Zhang, H. G., Wang, E. H. & Fan, B. Y. (2013). A performance analysis of a novel system of a dual loop bottoming organic Rankine cycle (ORC) with a light-duty diesel engine. Applied Energy, 102, 1504-1513.
158
C H A P T E R 9
tHE EFFECt oF UsInG MEtALLIC nAnoPARtICLEs As CooLAnt In
tRACtoR AnD ConstRUCtIon MACHInERY EnGInEs on
PERFoRMAnCE AnD EMIssIons
Yasin KARAGOZ1 & Saban PUSAT2 Azade ATTAR3 & Hasan KOTEN4
1 (Assist. Prof. Dr.) Istanbul Medeniyet University, Department of Mechanical Engineering, Kadikoy, Istanbul.
E-mail: [email protected] Orcid: 0000-0001-5271-9015
2(Assoc. Prof. Dr.) Yildiz Technical University, Department of Mechanical Engineering, Besiktas, Istanbul. [email protected]
Orcid: 0000-0001-5868-45033(Assoc. Prof. Dr.), Yildiz Technical University, Department of
Bioengineering, Esenler, Istanbul. [email protected] Orcid: 0000-0001-6906-6989
4(Assoc. Prof. Dr.) Istanbul Medeniyet University, Department of Mechanical Engineering, Kadikoy, Istanbul.
E-mail: [email protected] Orcid: 0000-0002-1907-9420
1. Introduction
Energy consumption, which is one of the most important indicators of development, is increasing rapidly in the whole world. In the face of this increase, the inability to find new energy resources and the increase in

Recent Researches in EnGInEERInG sCIEnCEs ¨ ¨ 159
environmental problems arising from energy usage make it necessary to realize energy consumption in a more efficient way. The energy required in Turkey is obtained from petroleum and petroleum derivative products. Considering that the vast majority of the consumed oil is imported, Turkey’s foreign dependency has increased and it has a great financial response. Despite all the measures taken by the United Nations Framework Convention on Climate Change in the Kyoto Protocol, there was an increase of 27% in CO2 emissions between 1990 and 2004 (EEA Report, 2013). In the same report, it was stated that the energy consumption originating from the transportation sector increased by 37% in parallel with the increasing world population (Sopena et al., 2010). Under these conditions, improvements in the consumption of energy resources both worldwide and in Turkey have gained great importance.
In internal combustion engines, only 35% of the fuel used for combustion can be used efficiently, and the remaining part is lost through friction, 30% exhaust gas and 30% coolant, limiting the amount of effective power acquired. On the other hand, the energy consumed for the cooling fan in vehicles such as agricultural vehicles and construction machinery that cannot reach high speeds is quite high. For example, the power consumption of the fan in the tractor with a 44 kW diesel engine is approximately 7-8 kW. The recovery to be obtained from this significant loss will reduce the amount of fuel consumption by reducing the fan power and also reduce the engine size and the engine cost.
Today, water is generally used as a coolant in engine cooling systems. The low thermal conductivity of water compared to metals increases the amount of water needed and increases the size of the system. The thermal conductivity of the coolant and the amount of heat transferred increases by using metallic nanoparticle additives. In order to use nanoparticles as engine coolant, firstly, internal combustion engine (diesel engine) and engine cooling system model should be analyzed as 1D, which will be developed in a computer environment by preparing engine coolant with particulate additives such as nano-sized Al2O3 and multi-walled carbon nanotube and with a one-dimensional analysis software. For the first time in the literature, CuO nanoparticle synthesis from Sorbus acuparia fruits and CuO nanoparticle solution coolant can be used on the engine. In the cooling system test setup and engine test set to be prepared in line with the results obtained, the cooling system should be tested experimentally and the test data should be returned to the engine model and the best results should be tried to be obtained.

160 ¨ ¨ tHE EFFECt oF UsInG MEtALLIC nAnoPARtICLEs As CooLAnt In tRACtoR AnD ConstRUCtIon MACHInERY EnGInEs ...
Considering the data in the literature, the reduction in power consumption of equipment such as fan power, cooling water pumps, and a 5-10% improvement in the harmful components of exhaust gases is targeted. With the use of metal-based nanoparticles, the surface area will increase and parallel to this, thermal conductivity will increase by 3-5% and convective heat transfer will increase by 10%. This increase also allows the size of the radiator to be reduced, and with the high efficiency achieved and the possibility of downsizing the cooling water pump, less coolant can be used. In addition, in order to get more power from the engine, it will be possible to reach higher in-cylinder gas pressure and power increase will be achieved. With the decrease in the fan power and the decrease in the waste part in the effective power of the vehicle, it is aimed to decrease the amount of fuel consumption up to 5-10% (depending on the engine, cooling system and vehicle fluid used). It is aimed that the reduction in vehicle weight, the efficiency of the system cost, the nanoparticle-added coolant has a good metal protection and does not damage the pump during circulation, thus allowing it to be used as an engine coolant in vehicles.
Considering both the literature and the energy consumption on cooling system from the engines, when nanoparticles are added to the cooling fluids of internal combustion engines, it is predicted that the performance of the engine cooling system will significantly improve. On the other hand, it is known that a significant amount of energy is spent on the cooling system in tractor engines and construction machine engines. Because it is known that these engines operate under high torque and low or stationary vehicle speed conditions, therefore, a significant amount of heat energy must be discharged through the cooling system. It is known that a significant part of the energy consumption is formed by the fan power. In this regard, it is predicted that nanoparticle could be an important solution. In this study, by evaluating the studies in the literature up to now, the contribution of the nanoparticle materials to the engine cooling system in which ratios and amounts was examined to what extent they contribute to the engine cooling system.
2. Literature Review According to the White Paper Report of the European Union Commission, a 60% reduction is targeted in transportation-related greenhouse gas emissions in 2050 compared to 1990 (EEA Report, 2013). Although the consumption of

Recent Researches in EnGInEERInG sCIEnCEs ¨ ¨ 161
renewable energy in the transportation sector increased from 3.5% to 3.8% between 2010 and 2011, it remained far from the determined emission targets (EEA Report, 2013). diesel engines are widely used in the transportation sector while they have high thermal efficiency, low HC, CO and CO2 values, especially in automobiles, and their disadvantage is that they release high amounts of PM and NOx emissions (Yoon et al, 2010). NOx causes photochemical soot and acid rain. Soot particle emissions, on the other hand, increase cardiovascular mortality rates, negatively affect lung development in children, and lead to a number of other health problems (McTaggart et al., 2001). According to the 2013 Air quality report in Europe, NO2 emission exceeded the limit value in 42% of the measurements made at traffic control points in 2011 (EEA Report, 2013). In 2011, particulate matter (<= 10 μm) emissions exceeded the limit set at 43% in traffic areas, 38% in urban areas, 25% in industrial areas and 15% in rural areas (EEA Report, 2013). Again in the same report, Istanbul was mentioned among the cities on the high danger border. The main reason for the increase in NOx and especially particulate matter is the increase in the number of diesel engine vehicles in recent years (EEA Report, 2013; Sayın, 2013).
In some studies, it was predicted that the number of vehicles in 2035 could double the number of vehicles in 2010 (Ott et al., 2013). Most of these vehicles are diesel vehicles, because both the number of diesel engines and their rates increase according to gasoline. On the other hand, diesel fuel prices, which have increased due to the rapid depletion of fossil fuels in recent years, have come close to gasoline. In addition, increasingly heavier emission regulations have forced the development of end-of-combustion equipment technologies of both diesel and positive ignition (Otto) engines. It is targeted that the release of NOx emissions become zero with the increasing emission regulations (Garg et al., 2013). Especially in recent years, in order to meet the high emission norms, the cost of after-treatment systems has almost become close to the engine cost, increasing thermal efficiency and less fuel consumption in engines. Diesel engines use SCR and DPF respectively to reduce emissions of NOx and soot particles. However, due to the high cost of catalyst materials, the trend towards alternative gas fuels has become essential (Zhou et al., 2014). Upon these developments, the automotive sector has accelerated various R&D activities in order to both increase energy efficiency and fuel economy and reduce polluting exhaust emissions (Bose & Maji, 2009; Kose & Cinviz, 2013). It has been reported in the European Union Renewable

162 ¨ ¨ tHE EFFECt oF UsInG MEtALLIC nAnoPARtICLEs As CooLAnt In tRACtoR AnD ConstRUCtIon MACHInERY EnGInEs ...
Energy Directive (RED) that, despite all the measures taken, the use of alternative propulsion systems such as hybrid vehicles and electric vehicles and alternative fuels such as natural gas, biogas and hydrogen, remained far from expectations (EEA Report, 2013). Upon these developments, thermal efficiency increase and energy efficiency in currently used fossil fuel (gasoline and diesel) engines are of great importance.
Although internal combustion engines are still used today as the main drive system source for road vehicles such as automobiles, trucks, construction machinery, agricultural vehicles, they will continue to be used in the future. Depleted petroleum reserves cause concerns due to factors such as high fuel cost and foreign dependency, making it necessary to reduce fuel consumption and use existing propulsion systems more efficiently. In addition, approximately 22% of the emissions to the atmosphere worldwide are caused by road vehicles (Eurostat Statistics Explained, 2016). Despite all the measures taken with the United Nations Framework Convention on Climate Change in the Kyoto Protocol, an increase of 27% in CO2 emission was realized between 1990 and 2004 (EEA Report, 2013). In the same report, it was stated that the energy consumption originating from the transportation sector increased by 37% in parallel with the increasing world population (Sopena et al., 2010). Under these conditions, improvements in the consumption of energy resources and energy efficiency have gained great importance all over the world.
Conventional coolants such as water, ethylene glycol and glycerol are still used today despite their low thermal conductivity (Sidik et al., 2017). Although the idea of adding metal-based particles in order to increase the performance of these coolants is not new, it has been observed that micro-size particles cause precipitation in the applications that have been tried in the past, and successful coolants have not been obtained. Solids have higher thermal conductivity than conventional heat transfer fluids. For example, the thermal conductivity value of copper is approximately 3000 times higher than conventional coolants at room temperature. However, when solid particles are in millimeter or micrometer dimensions, they rapidly precipitate. With the development of nanotechnology in recent years, it has been realized that effective cooling fluids in terms of precipitation have been achieved by reducing particle sizes below 50 nm. These small particles can remain suspended in the prepared solution for an indefinite period of time (Choi et al., 2001).

Recent Researches in EnGInEERInG sCIEnCEs ¨ ¨ 163
Nanoparticle additive coolant production was first defined by Eastman et al. (1997). Accordingly, there are 2-step Kool-Aid Method and one-step method for the production of fluids. In the two-step method, the nanoparticles were first formed by the inert gas condensation process and then mixed into the base coolant. This process gave effective results in oxide nanoparticles such as Al2O3 and CuO, but it is not suitable for metal nanoparticles. One-step method is also called the Direct Evaporation Method. In this method, metallic nanoparticles were dispersed in low vapor pressure liquid (Choi et al., 2001; Mathivanan & Liu, 2016). Surfactants such as oleic acid can be added at the rate of 1-2% in commercial applications in order to maintain the stabilization of the prepared suspensions for a long time (Saripella et al., 2007; Teng & Yu, 2013; Li et al., 2016).
3. Applications 3.1. Green Method of Metallic Nanoparticle Production
Synthesis of nanoparticles by the green method has attracted great attention in recent years (Shikov et al., 2014). The studies showed that the use of plant tissues to synthesize oxide nanoparticles as well as metallic nanoparticles on an industrial scale has a significant effect. Since metal nanoparticles are widely used in human contact areas, it has become necessary to develop environmentally friendly methods for nanoparticle synthesis that do not use toxic chemicals. The green synthesis of copper nanoparticles is of great interest because of its many advantages since copper is highly conductive and at the same time cheaper than silver and gold (Suresh et al., 2014). Copper oxide (CuO) nanoparticles are important due to applications such as antimicrobials, gas sensors, batteries, high temperature superconductors, solar energy conversion tools and similar applications (Premkumar & Geckeler, 2006; Ren et al., 2009; Hsieh et al., 2003). Copper (Cu) and copper complexes have been used for various purposes such as water purifiers, algae, fungicides, and antibacterial and antifouling agents for centuries. Copper-based compounds are effective biocidal properties used in many health-related applications (Naika et al., 2015; Padil & Černík, 2013). The use of inactivated plant tissue, plant extract and other living plant parts is a modern alternative way of synthesizing metal nanoparticles. It is a very cost effective method and offers a possible commercial alternative for large scale production.

164 ¨ ¨ tHE EFFECt oF UsInG MEtALLIC nAnoPARtICLEs As CooLAnt In tRACtoR AnD ConstRUCtIon MACHInERY EnGInEs ...
Sorbus aucuparia plant naturally grows in Europe and Asia (Pesendorfer et al., 2019); it spreads within the forests in the Black Sea, Marmara and Eastern Anatolia regions of Turkey Asia (Pesendorfer et al., 2019; Yildirim et al., 2018). This plant, which loves sun and moisture, is resistant to polluted air, wind and cold climate conditions (Olszewska et al., 2019). Sorbus aucuparia fruit is yellow in color and turns light red at maturity. Fruit shaped as chickpea and sized in 7-8 mm around. The flowers seen in May-June are hermaphrodite, white in color, upright and in the form of an umbrella-like bunch. It is a valuable ornamental plant and is used in urban road afforestation. Its flowers are a good source of birdseed and fruit acid production. Its acidic fruits are rich in tannins and are used in jam making.
The flowers, leaves, and edible fruits of S. aucuparia are traditionally used for diuretic, antidiabetic, anti-inflammatory, antiatherogenic, vasoprotective, vasorelaxant and antidiarrheal properties (Shikov et al., 2014). These activities are mostly linked to polyphenolic components. Examples of these components are flavonoids, anthocyanins (cyanidin glycosides), tannin-type proanthocyanidins, which are found in many organs of the plant (Olszewska et al., 2012). Studies showed that all tissues of S. aucuparia plant are powerful antioxidants and flowers have high phenolic content (Olszewska et al., 2009).. The phenol levels of S. aucuparia flower extracts and their fractions refined with ethyl acetate and n-butanol are comparable to plant extracts effective in preventing oxidative stress-related diseases such as grape seed and green tea (Olszewska et al., 2012). Since S. aucuparia, which has medical importance, is a good choice for the biosynthesis of copper nanoparticles.
Among the coolants containing Al2O3, CuO and Cu, the greatest increase in thermal conductivity is over 40% in Cu additive. It was also found that Cu particles dispersed better in solution compared to oxides. Since the average Cu nanoparticle diameter is approximately 4 times smaller than the diameter of the oxide, the surface area increases considerably, increasing the amount of heat transferred. Teng and Yu (Teng & Yu, 2013) studied on a cooling fluid which was prepared using multi-walled carbon nanotube, and a 4.9% reduction in pumping power was obtained. Saripella et al. (Saripella et al., 2007) achieved a 40% increase in thermal conductivity with 4% CuO addition. While the pump speed was 1600 rpm at the reference condition, it was reduced by 50% to 800 rpm by the use of coolants with nanoparticle additive. The required pump power has decreased from 560 W

Recent Researches in EnGInEERInG sCIEnCEs ¨ ¨ 165
to 60 W by 88%. In addition, the radiator cross section area has been reduced by 5%. Choi et al. (Choi et al., 2001) compared the thermal conductivity of oxide and metallic nanoparticles in their study. As a result of the literature review, it was determined that substances such as multi-walled carbon nanotube, Al2O3, CuO, TiO2, SiC are appropriate to be added to the coolants (Mukkamala, 2017; Teng & Yu, 2013; Ali et al., 2014; Chen and Jia ; 2016; Li et al., 2016).
3.2. Determination of the Most Appropriate Nanoparticle Type and Rate in Tractor and Heavy Duty Machine Engine Coolants
As a result of the market research carried out, it was determined that motors operating under high torque and heavy load conditions and at low speeds, such as tractor and construction equipment engines, had a significant loss with the fan. Recent studies on the cooling system of internal combustion engines have been examined in recent years. It was concluded that nanoparticles can be used in subjects such as, different intermediate fluids used in the cooling system, size reduction (radiator surface area reduction and optimization), studies on the engine cooling water pump, studies on fan size and power consumption, etc. Coolants with nanoparticle additives used in internal combustion engines were investigated in the literature. Especially, solution preparation methods (single-stage method, double-stage method), ideal mixing ratios, suitable nanoparticles has been investigated. There are reports on nanoparticle additive coolants as well as systems developed for cooling in the literature. Teng and Yu (Teng & Yu, 2013), Saripella et al. (Saripella et al., 2007), Choi et al. (Choi et al., 2001). In addition, some projects carried out by automotive companies and universities related to this subject. The solution method suggested in means of the reasons dealt before is explained below.
In order for metallic nanoparticles to be used in engine coolants, firstly, a one-dimensional modeling of the engine should be performed with the theoretical model. It should be ensured that the experimental data and the three-dimensional drawings of the engine could be adapted to the theoretical model (the 3D drawings of the engine should be provided by contacting the manufacturer). The power consumption and size of the engine’s cooling system equipment must be entered in the model. The effect of coolant with nanoparticle additive on the heat transfer and coefficient values should be determined theoretically. Thus,

166 ¨ ¨ tHE EFFECt oF UsInG MEtALLIC nAnoPARtICLEs As CooLAnt In tRACtoR AnD ConstRUCtIon MACHInERY EnGInEs ...
the heat transfer coefficients of the coolant, pump power consumed and radiator dimensions could be defined.
Figure 1. Cooling system setup
First of all, the experimental set should be composed in the work that is aimed to be carried out. In the cooling system setup (Figure 1), the tests should be started by developing the product or purchasing the product directly from an engineering company. The effect of coolants with different proportions and different types of nanoparticle additives should be determined experimentally in means of performance of the cooling system. Thus, instead of testing directly on the engine, tests can be carried out directly on the cooling system. Hereby, measurement uncertainties in the engine test system will be less affected and the accuracy of the results will be ensured by the preliminary tests to be performed. Afterwards, an external cooling system should be integrated into the engine. Thus, different types and proportions of nanoparticle additive coolants can also be tested directly on the engine. In particular, its effect on direct emissions and specific fuel consumption on the engine can be examined. The schematic view of the experiment set is given in Figure 2. Finally, the calibration of the sensors and their integration into the data acquisition system should be ensured. It should also be ensured that the necessary calibrations were carried out by testing whether the system works correctly before the tests to be performed.

Recent Researches in EnGInEERInG sCIEnCEs ¨ ¨ 167
Figure 2. Schematic view of the experiment set
Then, the cooling system and engine tests should be performed. As described above, in the cooling water test setup installed, samples of different nanoparticles prepared in different proportions should be tested. The preparation of nanoparticle additive coolants can be carried out as previously mentioned. CuO biosynthesis could be carried out by biological methods as described above. Since S. aucuparia is an easily accessible plant, it was chosen for the biosynthesis of copper nanoparticles to be produced. The fruits should be washed several times with distilled water to remove dust particles and then dried in the oven to remove residual moisture. 10 g of fruit could be boiled in 100 ml of distilled water for 10 minutes. Then the mixture should be cooled to room temperature and filtered with Whatman No. 1 filter paper and stored in a refrigerator for further experiments.
3.3. Synthesis and Characterization of Copper Oxide Nanoparticles
100 ml of 1 mM copper sulfate dehydrate (CuSO4.5H2O) should be mixed with 10 ml of fruit extract and left on the magnetic stirrer for approximately 4 hours at room temperature. The formation time of the particles should be calculated by determining the color change. The solution should be aged for 15 hours. The

168 ¨ ¨ tHE EFFECt oF UsInG MEtALLIC nAnoPARtICLEs As CooLAnt In tRACtoR AnD ConstRUCtIon MACHInERY EnGInEs ...
prepared nanoparticles should be centrifuged, washed twice with distilled water and dried in a 60 °C oven (Figure 3).
Figure 3. The biosynthesis of CuO nanoparticles using Sorbus aucuparia extract.
Copper oxide nanoparticles synthesized by environmentally friendly method could be characterized by UV-Vis spectrophotometer, Fourier-transform infrared (FTIR-Shimadzu) spectrum, X-ray diffraction and TEM (Sharma et al., 2018). The analysis and stability of the nanoparticles formed with the UV-Vis spectrum to be taken in the range of 4000-400 cm-1 could be done (Dhineshbabu et al. 2016). Shape and grain size will be defined using scanning electron microscopy (SEM) (Altikatoğlu et al., 2017). X-ray diffraction analysis (XRD) patterns could be obtained with Cu-Kα radiation using a diffractometer equipped with a graphite monochromator (Singh et al., 2015). Measurements could be made using a step scan program with 0.02° per step and an acquisition time of 5 seconds per step. Transmission electron microscope (TEM) images for CuO nanoparticles could be recorded using a TEM operating at an acceleration voltage of 15 kV. Samples could be prepared by dropping 10-20 µL CuO nanoparticle solution onto a Cu grid and dried at room temperature for TEM measurements (Etefagh et al., 2013).
In the light of the data obtained, engine tests should be started. The determined ratio and type of coolant with nanoparticle additive could be tested in engine tests, and their effects on engine performance and emissions could be

Recent Researches in EnGInEERInG sCIEnCEs ¨ ¨ 169
determined. The most appropriate results in terms of stability and performance could be determined by examining the experimental data obtained. Subsequently, the theoretical model should be verified by entering the experimentally obtained data into the developed theoretical model and calibrating the theoretical model. After this stage, data such as pump power, fan power, radiator size and power consumption should be entered into the theoretical model, changed directly on the model, and analyzed for specific fuel consumption, performance and emissions (THC, NOx, soot and CO). Thus, the number of experiments could be reduced and so the reproduction costs of the equipment (radiator, water pump, fan). The best conditions could be determined by analyzing many working conditions on the one-dimensional theoretical model.
The model should be verified by performing motor tests in the light of the data obtained with the theoretical model. Thus, both the test phase could be repeated and the best results could obtained with the theoretical model will be tested and verified. Finally, it could be possible to compare the results in detail and determine the most appropriate results in terms of engine performance, specific fuel consumption, thermal efficiency and emissions (CO, CO2, THC, NOx and soot).
4. Results Today, most of the energy needs are met from fossil fuels. Since petroleum products used as fuel in internal combustion engines are a finite energy source, reducing losses during use will provide great effectiveness. Considering that the number of motor vehicles registered in traffic in Turkey is over 20 million as in 2017, the sum of the gains from cooling losses of each engine will reach a significant level. In line with the calculations made, assuming that the coolant to be developed is used in all vehicles in the country, fuel savings of 100 million TL will be achieved in a 1-year period.
The power values taken from the internal combustion engines are increasing as well as the temperature values reached in the combustion chamber and engine with the new technologies developed. If the existing coolant on the vehicle is used, the required fan power increases and the radiator size increases. Water-antifreeze mixed coolants currently used for vehicle engines exhibit low heat transfer performance. High thermal conductivity will be obtained and the amount of heat transfer from the unit amount of the coolant will be increased by

170 ¨ ¨ tHE EFFECt oF UsInG MEtALLIC nAnoPARtICLEs As CooLAnt In tRACtoR AnD ConstRUCtIon MACHInERY EnGInEs ...
using the high performance coolant suggested for internal combustion engines. Thus, it will be possible to reduce the size of the cooling system (radiator, fan, water pump) and reduce power consumption (fan and water pump). Also, higher in-cylinder pressure values will be reached and power values will increase with the effective cooling.
The fact that vehicle exhaust emission norms are constantly becoming stricter by the European Union (EEA) authorities makes it difficult for automotive companies to meet these norms. For this reason, engine manufacturers have focused their studies on this field. It is predicted that the engine size will be reduced by increasing the maximum pressure values in the cylinder by means of the coolant to be developed, thereby decreasing the engine cost and increasing the performance (emission and specific fuel consumption). As the power to be consumed by the cooling system will be reduced by significantly reducing the radiator, fan and water pump dimensions of the vehicle, a reduction in the amount of fuel consumption is aimed. In addition, it is a necessity to use after-treatment systems in order to ensure exhaust regulations in today’s engines. However, because these systems are advanced technology products and the catalysts required for reactions contain precious metals, they increase engine costs. Since the use of the coolant to be developed will provide an improvement in exhaust emissions, it is predicted that the use of an older technology post-combustion recovery system will be sufficient to achieve the same emission output, there will be a reduction in the cost of post-combustion improvement systems, and therefore a decrease in engine cost will be possible.
References Ali, M., El-Leathy, A.M. & Al-Sofyany, Z. (2014). The Effect of Nanofluid
Concentration on the Cooling System of Vehicles Radiator. Advances in Mechanical Engineering, 1 (1), 1-13.
Altikatoglu, M., Attar, A., Erci, F., Cristache, C. M., & Isildak, I. (2017). Green synthesis of copper oxide nanoparticles using Ocimum basilicum extract and their antibacterial activity. Fresenius Environ Bull, 25 (12), 7832-7837.
Bose, P.K., D. Maji, D. (2009). An experimental investigation on engine performance and emissions of a single cylinder diesel engine using hydrogen as inducted fuel and diesel as injected fuel with exhaust gas recirculation. Int. J. Hydrogen Energy, 34 (11), 4847-4854.

Recent Researches in EnGInEERInG sCIEnCEs ¨ ¨ 171
Chen, J. & Jia, J. (2016). Experimental Study of TiO2 Nanofluid Coolant for Automobile Cooling Applications. Materials Research Innovations. 21 (3), 177-181.
Choi, S.U.S., Yu, W., Hull, J.R., Zhang, Z.G. & Lockwood, F.E. (2001). Nanofluids for Vehicle Thermal Management. Vehicle Thermal Management Systems Conference & Exhibition, 14-17 May 2001, Tennessee.
Dhineshbabu, N., R., Rajendran, V., Nithyavathy, N., Vetumperumal, R. (2016). Study of structural and optical properties of cupric oxide nanoparticles. Applied Nanoscience, 6, pages933–939.
EEA (European Environment Agency) Report (2013). Trends and projections in Europe 2013: Tracking progress towards Europe’s climate and energy targets until 2020. Report No 10/2013, 2013.
Etefagh, R., Azhir, E., Shahtahmasebi, N. (2013). Synthesis of CuO nanoparticles and fabrication of nanostructural layer biosensors for detecting Aspergillus niger fungi. Scientia Iranica, 20 (3), 1055-1058.
EuroStat Statistics Explained, Greenhouse Gas Emission Statistics, (2017) http://ec.europa.eu/eurostat/statistics-explained/index.php/ Greenhouse gas emission_statistics, 04 September 2017.
Garg, S., Parmar, A.J., Puri, S., Kumar, N. (2013). Potential Utilization of CNG in Stationary HCCI Engine. SAE paper no. 2013-01-2508.
Hsieh, C.T., Chen, J.M., Lin, H.H. & Shih, H.C. (2003). Synthesis of well-ordered CuO nanofibers by a self-catalytic growth mechanism. Applied physics letters, 82 (1) 3316-3318.
Köse, H., M. Cinviz, M. (2013). An experimental investigation of effect on diesel engine performance and exhaust emissions of addition at dual fuel mode of hydrogen. Fuel Processing Technology, 114, 26–34.
Li, X., Zou, C. & Qi, A. (2016). Experimental Study on the Thermo-Physical Properties of Car Engine Coolant (Water/Ethylene Glycol Mixture Type) Based SiC Nanofluids. International Communication in Heat and Mass Transfer, 77 (1), 159-164.
Mathivanan, E. & Liu, L. (2016). Impact of Nanofluids on Heat Transfer Performance of a Motorcycle Radiator. SAE Technical Paper, 2016-01-0188.
Mukkamala, Y. (2017). Contemporary Trends in Thermo-Hydraulic Testing and Modeling of Automotive Radiators Deploying Nano-Coolants and Aerodynamically Efficient Air-Side Fins. Renewable and Sustainable Energy Reviews, 76 (1), 1208-1229.

172 ¨ ¨ tHE EFFECt oF UsInG MEtALLIC nAnoPARtICLEs As CooLAnt In tRACtoR AnD ConstRUCtIon MACHInERY EnGInEs ...
Naika, H.R., Lingaraju, K., Manjunath, K., Kumar, D., Nagaraju, G., Suresh, D. & Nagabhushana, H. (2015). Green synthesis of CuO nanoparticles using Gloriosa superba L. extract and their antibacterial activity, Journal of Taibah University for Science, 9 (1) 7-12.
Olszewska, M.A., Kolodziejczyk-Czepas, J., Rutkowska, M., Magiera, A., Michel, P., Rejman, M.W., Nowak, P. & Owczarek, A. (2019). The Effect of Standardised Flower Extracts of Sorbus aucuparia L. on Proinflammatory Enzymes, Multiple Oxidants, and Oxidative/Nitrative Damage of Human Plasma Components In Vitro, Oxidative Medicine and Cellular Longevity, 1 (1), 1-14.
Olszewska, M.A. & Michel P. (2009). Antioxidant activity of inflorescences, leaves and fruits of three Sorbus species in relation to their polyphenolic composition. Natural Product Research, 23 (1) 1507-1521
Olszewska, M.A., Presler, A. & Michel, P. (2012). Profiling of phenolic compounds and antioxidant activity of dry extracts from the selected Sorbus species, Molecules, 17 3093-3113.
Ott, T., Onder, C., Guzzela, L. (2013). Hybrid-Electric Vehicle with Natural Gas-Diesel Engine. Energies, 6 (1), 3571-3592.
Padil, V.V.T. & Černík, M. (2013). Green synthesis of copper oxide nanoparticles using gum karaya as a biotemplate and their antibacterial application. International journal of nanomedicine, 8 (1) 889.
Papagiannakis, R.G. & Hountalas, D.T. (2003). Experimental investigation concerning the effect of natural gas percentage on performance and emissions of a DI dual fuel diesel engine. Applied Thermal Engineering 23 (1), 353–365.
Pesendorfer, M.B., Bogdziewicz, M., Koenig, W.D., Ledwoń, M. & Żywiec, M. (2019). Declining fruit production before death in a widely distributed tree species, Sorbus aucuparia L. Annals of Forest Science, 76 (1) 11.
Premkumar, T. & Geckeler, K. (2006). Nanosized CuO particles via a supramolecular strategy. Nano-Micro Small, 2 (1) 616-620.
Ren, G., Hu, D., Cheng, E.W., Vargas-Reus, M.A., Reip, P. & Allaker, R.P. (2009). Characterisation of copper oxide nanoparticles for antimicrobial applications. International journal of antimicrobial agents, 33 (1) 587-590.
Saripella, S.K., Yu, W., Routbort, J.L., France, D.M. & Rizwan-uddin (2007). Effects of Nanofluid Coolant in a Class 8 Truck Engine. SAE Technical Paper, 2007-01-2141.

Recent Researches in EnGInEERInG sCIEnCEs ¨ ¨ 173
Sayın, C. (2013). Diesel engıne emissions improvements by the use of sun flower methyl ester /diesel blends. Isı Bilimi ve Tekniği Dergisi - J. of Thermal Science and Technology, 33 (1), 83-88.
Sharma, B., K., Shah, D.,V., Roy, D., R. (2018). Green synthesis of CuO nanoparticles using Azadirachta indica and its antibacterial activity for medicinal applications. Materials Research Express, 5 (9), 1-10.
Shikov, A.N., Pozharitskaya, O.N., Makarov, V.G., Wagner, H., Verpoorte, R. & Heinrich, M. (2014). Medicinal plants of the Russian Pharmacopoeia; their history and applications, Journal of ethnopharmacology, 154:481-536.
Sidik, N.A.C, Yazid, M.N.A.W.M. & Mamat, R. (2017). Recent Advancement of Nanofluids in Engine Cooling System. Renewable and Sustainable Energy Reviews, 75 (1), 137-144.
Singh, P., K., Kumar, P., Hussain, M., Das, A., K., Nayak, G.,C. (2016). Synthesis and characterization of CuO nanoparticles using strong base electrolyte through electrochemical discharge process. Bull. Mater. Sci., 39 (2), 469–478
Sopena, C., Dieguez, P.M., Sainz, D., Urroz, J.C., Guelbenzu, E. & Gandia, L.M. (2010). Conversion of a Commercial Spark Ignition Engine to Run on Hydrogen: Performance Comparison Using Hydrogen and Gasoline. Int. J. Hydrogen Energy, 35 (1), 1420-1429.
Suresh, Y., Annapurna, S., Singh, A., & Bhikshamaiah, G. (2014). Green synthesis and characterization of tea decoction stabilized copper nanoparticles. Int. J. Innov. Res. Sci. Eng. Technol., 3 (1) 11265-11270.
Teng, T.P. & Yu, C.C. (2013). Heat Dissipation Performance of MWCNTs Nano-Coolant for Vehicle. Experimental Thermal and Fluid Science, 49 (1), 22-30.
Yildirim, N., Atar, F., Turna, H., Bayraktar, A. & İ., Turna, (2018). Floristic characteristics of arbutus unedo l. And arbutus andrachne l. As medicinal plants. International Symposium People-Forest-Science, Sarajevo, Bosna-Hersek, 10 - 12 October 2018.
Yoon, S.H. & Lee, C.S. (2011). Experimental Investigation on The Combustion and Exhaust Emission Characteristics of Biogas–Biodiesel Dual-Fuel Combustion in a CI Engine. Fuel Processing Technology, 92 (1), 992-1000.
Zhou, J.H., Cheung, C.S. , Leung, C.W. (2014). Combustion, performance and emissions of a diesel engine with H2, CH4 and H2-CH4 addition. Int. J. Hydrogen Energy, 39 (1), 4611-4621.

Related Documents