Agenda Item B‐3 October 2013 Recent harvest and participation trends in the Gulf of Alaska Pacific cod fishery Introduction This paper provides a general overview of the Pacific cod fishery in the Gulf of Alaska (GOA), recent harvest during the state-waters, parallel, and federal seasons, and participation information. It is provided as supplemental information to policymakers in response to proposals to the Alaska Board of Fisheries (board) aimed at increasing the proportion of Pacific cod allocated to state-waters Pacific cod seasons in Kodiak, Chignik, Cook Inlet, and the South Alaska Peninsula (SAP) management areas. In Alaska, commercial groundfish resources are managed by the Alaska Department of Fish and Game (department) in state waters (0–3 miles from shore) under regulations developed by the board. The Magnuson-Stevens Fishery Conservation and Management Act (MSFCMA 2007) establishes fishery management authority for the National Marine Fisheries Service (NMFS) in the exclusive economic zone (3–200 miles from shore) off Alaska under management plans and guidelines developed by the North Pacific Fishery Management Council (council). State-waters fishery Acceptable biological catch (ABC) limits for GOA Pacific cod have been established by the council on an annual basis since 1986. 1 From 1989 through 1996, total allowable catch (TAC) was set equal to ABC. In October 1996, the board developed management plans for commercial Pacific cod seasons in state waters of the SAP, Chignik, Kodiak, Cook Inlet, and Prince William Sound management areas. The board established guideline harvest levels (GHL) for the state- waters seasons as a percentage of the ABC, which initially ranged from 15%–25% of the respective ABCs for federal management areas of the Western, Central, and Eastern GOA. Step- up provisions were included in the management plans such that a maximum of 25% of the ABC could be taken from each area (Western, Central, and Eastern GOA), which coincided with the average state water harvest in the Central and Western GOA Areas from 1994–1996. 2 Since 1997, the federal TAC has been set 15%–25% below ABC to account for the state’s GHL. When combined, the federal TAC and state-waters GHL do not exceed ABC. Pot and jig gear are the only legal gear types in the SAP, Chignik, Kodiak, and Cook Inlet state- waters Pacific cod fisheries. The GHLs are further allocated between pot and jig gear within each area, and in some instances, harvest is limited by vessel size. Gear limits, vessel size restrictions, and limitations on registration are also components in many of the state Pacific cod management plans. 1 A’mar, T., G. Thompson, M. Martin, and W. Palsson. Assessment of the Pacific cod (Gadus macrocephalus) stock in the Gulf of Alaska for 2013. National Marine Fisheries Service. 2 Alaska Board of Fisheries Findings: 97-169-FB. State Waters Pacific Cod Management Plans, Adopted October 29–31, 1996, at Wasilla.

Welcome message from author
This document is posted to help you gain knowledge. Please leave a comment to let me know what you think about it! Share it to your friends and learn new things together.
Transcript
Agenda Item B‐3
October 2013
Recent harvest and participation trends in the Gulf of Alaska Pacific cod fishery
Introduction
This paper provides a general overview of the Pacific cod fishery in the Gulf of Alaska (GOA), recent harvest during the state-waters, parallel, and federal seasons, and participation information. It is provided as supplemental information to policymakers in response to proposals to the Alaska Board of Fisheries (board) aimed at increasing the proportion of Pacific cod allocated to state-waters Pacific cod seasons in Kodiak, Chignik, Cook Inlet, and the South Alaska Peninsula (SAP) management areas. In Alaska, commercial groundfish resources are managed by the Alaska Department of Fish and Game (department) in state waters (0–3 miles from shore) under regulations developed by the board. The Magnuson-Stevens Fishery Conservation and Management Act (MSFCMA 2007) establishes fishery management authority for the National Marine Fisheries Service (NMFS) in the exclusive economic zone (3–200 miles from shore) off Alaska under management plans and guidelines developed by the North Pacific Fishery Management Council (council). State-waters fishery Acceptable biological catch (ABC) limits for GOA Pacific cod have been established by the council on an annual basis since 1986.1 From 1989 through 1996, total allowable catch (TAC) was set equal to ABC. In October 1996, the board developed management plans for commercial Pacific cod seasons in state waters of the SAP, Chignik, Kodiak, Cook Inlet, and Prince William Sound management areas. The board established guideline harvest levels (GHL) for the state-waters seasons as a percentage of the ABC, which initially ranged from 15%–25% of the respective ABCs for federal management areas of the Western, Central, and Eastern GOA. Step-up provisions were included in the management plans such that a maximum of 25% of the ABC could be taken from each area (Western, Central, and Eastern GOA), which coincided with the average state water harvest in the Central and Western GOA Areas from 1994–1996.2 Since 1997, the federal TAC has been set 15%–25% below ABC to account for the state’s GHL. When combined, the federal TAC and state-waters GHL do not exceed ABC. Pot and jig gear are the only legal gear types in the SAP, Chignik, Kodiak, and Cook Inlet state-waters Pacific cod fisheries. The GHLs are further allocated between pot and jig gear within each area, and in some instances, harvest is limited by vessel size. Gear limits, vessel size restrictions, and limitations on registration are also components in many of the state Pacific cod management plans. 1 A’mar, T., G. Thompson, M. Martin, and W. Palsson. Assessment of the Pacific cod (Gadus macrocephalus) stock in the Gulf of Alaska for 2013. National Marine Fisheries Service.
2 Alaska Board of Fisheries Findings: 97-169-FB. State Waters Pacific Cod Management Plans, Adopted October 29–31, 1996, at Wasilla.
2
Federal fishery Jig, pot, longline, and trawl gear are permitted during the federal season. Prior to 2012, the federal TAC was allocated on the basis of processor component whereby the inshore component, generally catcher processors less than 125 feet and catcher vessels (CVs) delivering shoreside, was allocated 90% of the TAC, and the remainder was allocated to the offshore component, generally catcher processor vessels (CPs). Within each of these processing sectors, all gear sectors and vessel size classes competed for a share of the allocation. Starting in 2012, the inshore/offshore allocations in the Western and Central GOA were replaced by more refined allocations to gear and operational sectors (CP/CV) under Amendment 83 to the Fishery Management Plan (FMP) for Groundfish in the GOA. In the Central GOA (CGOA), Pacific cod is now allocated to seven sectors: vessels using jig gear, catcher vessels less than 50 feet using longline gear, catcher vessels over 50 feet using longline gear, catcher processors using longline gear, catcher vessels using trawl gear, catcher processors using trawl gear, and vessels using pot gear. In the Western GOA (WGOA), Pacific cod is allocated to six sectors: vessels using jig gear, catcher vessels using longline gear, catcher processors using longline gear, catcher vessels using trawl gear, catcher processors using trawl gear, and vessels using pot gear. The annual jig sector allocations may increase to up to 6% of the annual WGOA and CGOA Pacific cod TACs, depending on the annual performance of the jig sector (See Table 1 of Amendment 83 to the FMP for a detailed discussion of the jig sector allocation process (76 FR 74670, December 1, 2011)). Federal sector allocations are further apportioned between ‘A’ and ‘B’ seasons, such that the combined A-season allocations do not exceed 60% of the TAC. The temporal dispersion of fishing effort is in direct response to a determination by NMFS in 2000 that some groundfish fisheries were likely jeopardizing the western population of Steller sea lions. The A season runs from January 1 through June 10, and the B season is from June 10 through December 31, although, except for jig gear, the directed B season does not open until September 1. The state-waters seasons generally open after the federal/parallel A season closes (e.g., the state-waters season opens for pot gear once the federal pot sector has reached their A season allocation). Parallel fishery in state waters The state also manages a parallel season in state waters that runs concurrently with the Pacific cod season in federal waters. Emergency orders establishing parallel Pacific cod seasons typically mirror federal fishing regulations for gear and vessel restrictions, area closures, bycatch limits, and other regulations the commissioner determines necessary to accommodate federal fishery management measures inside state waters. Harvest during the parallel season is deducted from the federal TAC.
3
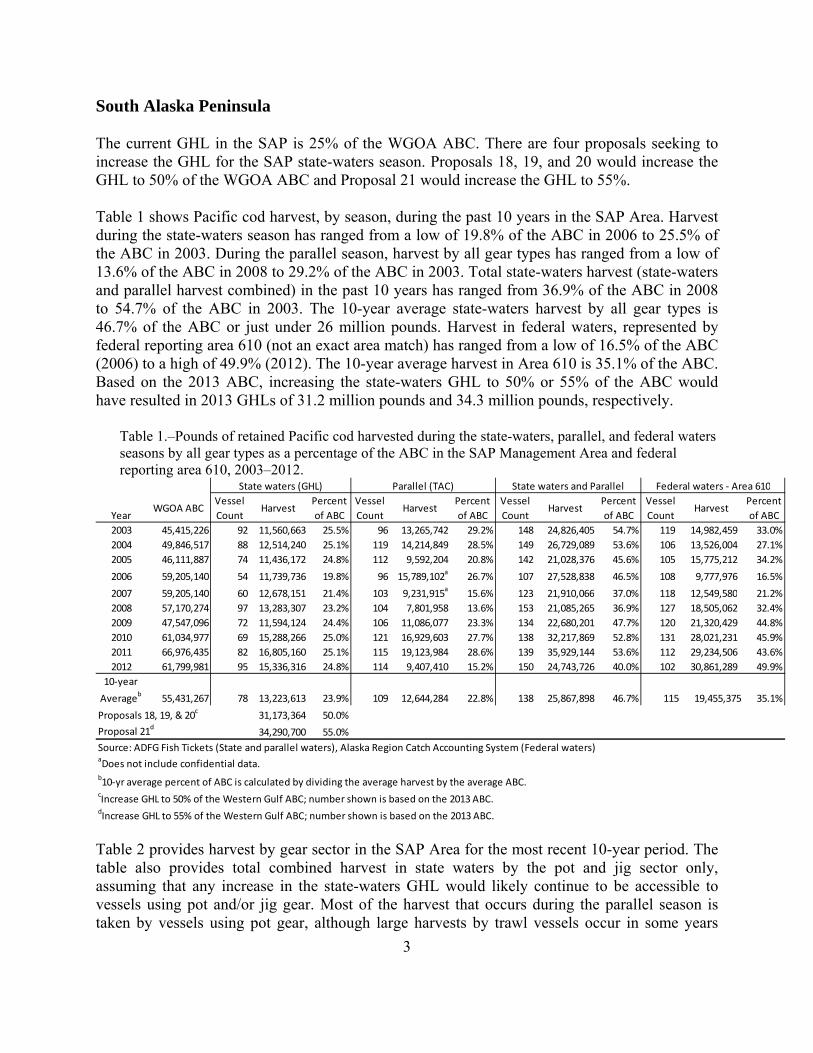
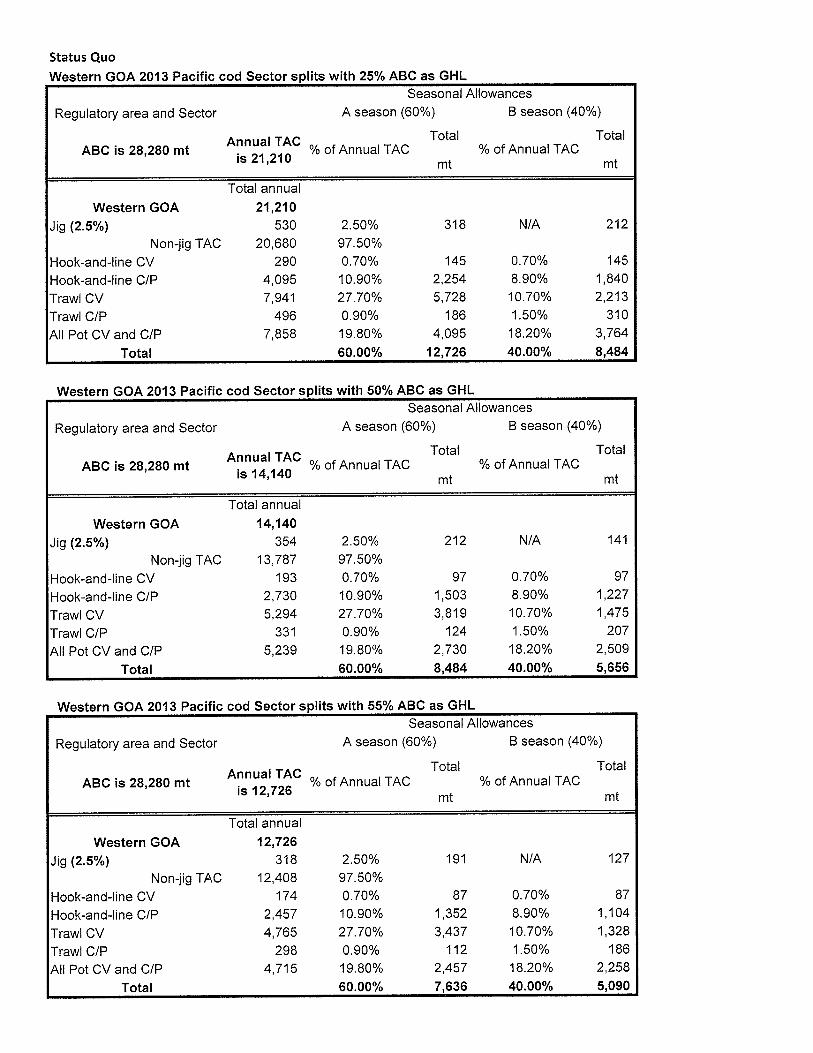
South Alaska Peninsula The current GHL in the SAP is 25% of the WGOA ABC. There are four proposals seeking to increase the GHL for the SAP state-waters season. Proposals 18, 19, and 20 would increase the GHL to 50% of the WGOA ABC and Proposal 21 would increase the GHL to 55%. Table 1 shows Pacific cod harvest, by season, during the past 10 years in the SAP Area. Harvest during the state-waters season has ranged from a low of 19.8% of the ABC in 2006 to 25.5% of the ABC in 2003. During the parallel season, harvest by all gear types has ranged from a low of 13.6% of the ABC in 2008 to 29.2% of the ABC in 2003. Total state-waters harvest (state-waters and parallel harvest combined) in the past 10 years has ranged from 36.9% of the ABC in 2008 to 54.7% of the ABC in 2003. The 10-year average state-waters harvest by all gear types is 46.7% of the ABC or just under 26 million pounds. Harvest in federal waters, represented by federal reporting area 610 (not an exact area match) has ranged from a low of 16.5% of the ABC (2006) to a high of 49.9% (2012). The 10-year average harvest in Area 610 is 35.1% of the ABC. Based on the 2013 ABC, increasing the state-waters GHL to 50% or 55% of the ABC would have resulted in 2013 GHLs of 31.2 million pounds and 34.3 million pounds, respectively.
Table 1.–Pounds of retained Pacific cod harvested during the state-waters, parallel, and federal waters seasons by all gear types as a percentage of the ABC in the SAP Management Area and federal reporting area 610, 2003–2012.
YearWGOA ABC
Vessel
CountHarvest
Percent
of ABC
Vessel
CountHarvest
Percent
of ABC
Vessel
CountHarvest
Percent
of ABC
Vessel
CountHarvest
Percent
of ABC
2003 45,415,226 92 11,560,663 25.5% 96 13,265,742 29.2% 148 24,826,405 54.7% 119 14,982,459 33.0%
2004 49,846,517 88 12,514,240 25.1% 119 14,214,849 28.5% 149 26,729,089 53.6% 106 13,526,004 27.1%
2005 46,111,887 74 11,436,172 24.8% 112 9,592,204 20.8% 142 21,028,376 45.6% 105 15,775,212 34.2%
2006 59,205,140 54 11,739,736 19.8% 96 15,789,102a
26.7% 107 27,528,838 46.5% 108 9,777,976 16.5%
2007 59,205,140 60 12,678,151 21.4% 103 9,231,915a
15.6% 123 21,910,066 37.0% 118 12,549,580 21.2%
2008 57,170,274 97 13,283,307 23.2% 104 7,801,958 13.6% 153 21,085,265 36.9% 127 18,505,062 32.4%
2009 47,547,096 72 11,594,124 24.4% 106 11,086,077 23.3% 134 22,680,201 47.7% 120 21,320,429 44.8%
2010 61,034,977 69 15,288,266 25.0% 121 16,929,603 27.7% 138 32,217,869 52.8% 131 28,021,231 45.9%
2011 66,976,435 82 16,805,160 25.1% 115 19,123,984 28.6% 139 35,929,144 53.6% 112 29,234,506 43.6%
2012 61,799,981 95 15,336,316 24.8% 114 9,407,410 15.2% 150 24,743,726 40.0% 102 30,861,289 49.9%
10‐year
Averageb
55,431,267 78 13,223,613 23.9% 109 12,644,284 22.8% 138 25,867,898 46.7% 115 19,455,375 35.1%
Proposals 18, 19, & 20c
31,173,364 50.0%
Proposal 21d
34,290,700 55.0%
Source: ADFG Fish Tickets (State and parallel waters), Alaska Region Catch Accounting System (Federal waters)aDoes not include confidential data.b10‐yr average percent of ABC is calculated by dividing the average harvest by the average ABC.cIncrease GHL to 50% of the Western Gulf ABC; number shown is based on the 2013 ABC.dIncrease GHL to 55% of the Western Gulf ABC; number shown is based on the 2013 ABC.
State waters and Parallel Federal waters ‐ Area 610State waters (GHL) Parallel (TAC)
Table 2 provides harvest by gear sector in the SAP Area for the most recent 10-year period. The table also provides total combined harvest in state waters by the pot and jig sector only, assuming that any increase in the state-waters GHL would likely continue to be accessible to vessels using pot and/or jig gear. Most of the harvest that occurs during the parallel season is taken by vessels using pot gear, although large harvests by trawl vessels occur in some years

4
(e.g., 2006). Under current regulations, pot gear is capped at 85% of the GHL. Harvests by gear sector for the federal waters in Area 610 are also provided. In federal waters, substantial harvests by longline, pot, and trawl vessels occur. Table 3 provides the percent of the annual ABC harvested by each gear sector. During the past 10 years, vessels using pot and/or jig gear harvested between 32.2% and 54.2% of the annual ABC in state waters.
Table 2–Pounds of retained Pacific cod harvested by season and sector in the South Alaska Peninsula Management Area.
Year Jig Pot Longline Jig Pot Trawl Longline Jig Pot Trawl
2003 3,633,007 7,927,656 46,165 92,528 12,966,344 160,705 24,619,535 3,769,399 with Pot 8,328,218 2,884,843
2004 1,671,461 10,842,778 15,069 397,702 12,882,834 919,244 25,794,775 1,609,786 with Pot 8,494,743 3,421,475
2005 1,229,832 10,206,340 536,983 100,691 6,128,240 2,826,290 17,665,103 630,822 with Pot 8,001,660 7,142,730
2006 99,552 11,640,183 216,514 * 9,319,648 6,252,940 21,059,383b
1,528,502 with Pot 3,665,231 4,584,243
2007 254,178 12,423,973 399,170 * 6,370,559 2,462,186 19,048,710b
1,236,009 with Pot 4,002,749 7,310,822
2008 1,382,268 11,901,039 555,457 114,599 6,387,463 744,439 19,785,369 1,728,168 with Pot 6,612,301 10,164,593
2009 1,093,382 10,500,742 2,280,326 417,515 8,054,281 333,954 20,065,920 11,264,580 0 5,146,407 4,909,441
2010 2,315,081 12,973,186 1,559,375 756,920 13,229,552 1,383,756 29,274,739 12,720,028 with Pot 9,717,345 5,583,857
2011 2,443,043 14,362,117 368,936 503,458 17,486,369 765,222 34,794,987 12,881,271 with Pot 10,740,073 5,613,163
2012 1,989,884 13,346,432 357,125 567,920 5,720,679 2,761,687 21,624,914 6,834,835 129,807 11,580,543 12,316,104
*Confidential due to less than three participants
'with pot' means that the sector's data was combined with pot harvest for confidentialityaFederal waters reported for Area 610bDoes not include confidential data.
State waters (GHL) Parallel (TAC) Federal watersa(TAC)
Total State
waters
pot + jig
Table 3.–Percent of ABC harvested by season and sector in the South Alaska Peninsula Management Area.
Year Jig Pot Longline Jig Pot Trawl Longline Jig Pot Trawl
2003 8.0% 17.5% 0.1% 0.2% 28.6% 0.4% 54.2% 8.3% with Pot 18.3% 6.4%
2004 3.4% 21.8% 0.0% 0.8% 25.8% 1.8% 51.7% 3.2% with Pot 17.0% 6.9%
2005 2.7% 22.1% 1.2% 0.2% 13.3% 6.1% 38.3% 1.4% with Pot 17.4% 15.5%
2006 0.2% 19.7% 0.4% * 15.7% 10.6% 35.6%b
2.6% with Pot 6.2% 7.7%
2007 0.4% 21.0% 0.7% * 10.8% 4.2% 32.2%b
2.1% with Pot 6.8% 12.3%
2008 2.4% 20.8% 1.0% 0.2% 11.2% 1.3% 34.6% 3.0% with Pot 11.6% 17.8%
2009 2.3% 22.1% 4.8% 0.9% 16.9% 0.7% 42.2% 23.7% 0.0% 10.8% 10.3%
2010 3.8% 21.3% 2.6% 1.2% 21.7% 2.3% 48.0% 20.8% with Pot 15.9% 9.1%
2011 3.6% 21.4% 0.6% 0.8% 26.1% 1.1% 52.0% 19.2% with Pot 16.0% 8.4%
2012 3.2% 21.6% 0.6% 0.9% 9.3% 4.5% 35.0% 11.1% 0.2% 18.7% 19.9%
*Confidential due to less than three participants
'with pot' means that the sector's data was combined with pot harvest for confidentialityaFederal waters reported for Area 610
bDoes not include confidential data.
State waters (GHL) Parallel (TAC) Federal watersa(TAC)
Total State
waters pot
+ jig
Table 4 describes recent participation trends by vessels using pot gear in the SAP Area in state waters. The board adopted a 58’ overall length vessel size restriction for the state-waters season in 1996 and extended that same restriction to the parallel season in 2010. This vessel size limit
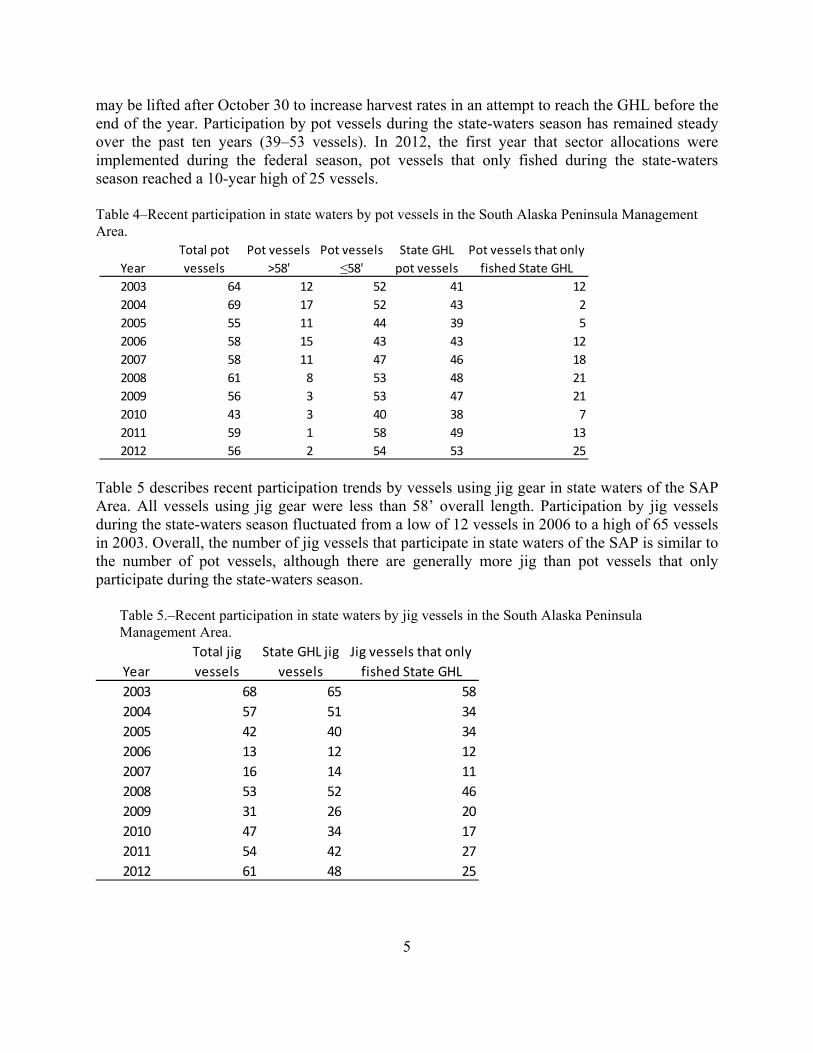
5
may be lifted after October 30 to increase harvest rates in an attempt to reach the GHL before the end of the year. Participation by pot vessels during the state-waters season has remained steady over the past ten years (39–53 vessels). In 2012, the first year that sector allocations were implemented during the federal season, pot vessels that only fished during the state-waters season reached a 10-year high of 25 vessels. Table 4–Recent participation in state waters by pot vessels in the South Alaska Peninsula Management Area.
Year
Total pot
vessels
Pot vessels
>58'
Pot vessels
≤58'State GHL
pot vessels
Pot vessels that only
fished State GHL
2003 64 12 52 41 12
2004 69 17 52 43 2
2005 55 11 44 39 5
2006 58 15 43 43 12
2007 58 11 47 46 18
2008 61 8 53 48 21
2009 56 3 53 47 21
2010 43 3 40 38 7
2011 59 1 58 49 13
2012 56 2 54 53 25 Table 5 describes recent participation trends by vessels using jig gear in state waters of the SAP Area. All vessels using jig gear were less than 58’ overall length. Participation by jig vessels during the state-waters season fluctuated from a low of 12 vessels in 2006 to a high of 65 vessels in 2003. Overall, the number of jig vessels that participate in state waters of the SAP is similar to the number of pot vessels, although there are generally more jig than pot vessels that only participate during the state-waters season.
Table 5.–Recent participation in state waters by jig vessels in the South Alaska Peninsula Management Area.
Year
Total jig
vessels
State GHL jig
vessels
Jig vessels that only
fished State GHL
2003 68 65 58
2004 57 51 34
2005 42 40 34
2006 13 12 12
2007 16 14 11
2008 53 52 46
2009 31 26 20
2010 47 34 17
2011 54 42 27
2012 61 48 25

6
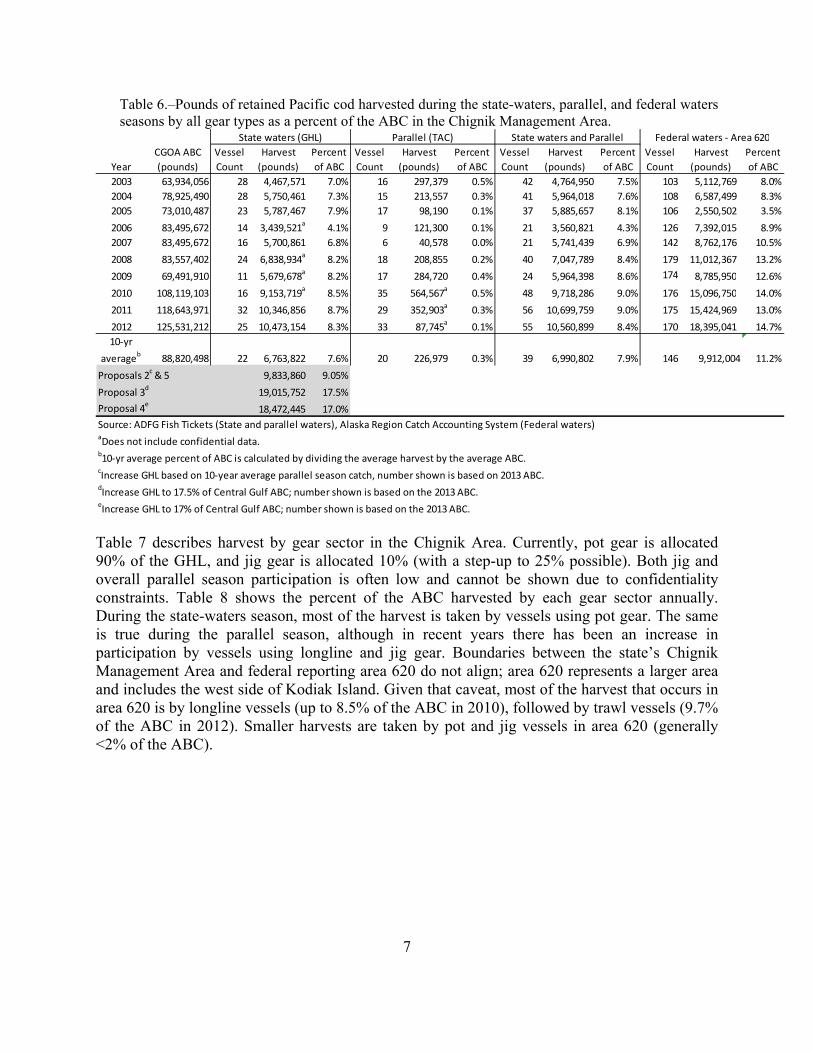
Chignik There are four proposals seeking to increase the Pacific cod GHL for the Chignik state-waters season. Proposal 2 would increase the GHL by adding the 10-year average parallel season harvest. Proposal 5 was not specific to the time period that should be used to increase the GHL and so was treated similarly to Proposal 2. Currently, the Chignik Area is allocated 8.75% of the CGOA ABC and the 10-year average parallel harvest is 0.3% of the ABC. Increasing the allocation by the 10-year average parallel harvest would raise the allocation to 9.05% of the CGOA ABC. Proposals 3 and 4 would increase the allocation to 17.5% and 17% of the CGOA ABC, respectively. Table 6 shows the amount of Pacific cod harvested by season during the past 10 years in the Chignik Area. The average harvest taken in the state-waters fishery represents 7.6% of the ABC. Harvest during the parallel season has not exceeded 0.5% of the ABC during the past 10 years and averages 0.3%. Total harvest from state waters has ranged from about 4% (2006) to 9% (2011) of the ABC, with a 10-year average harvest by all gear types of 7.9% of the ABC or just under seven million pounds. Total harvest from state waters using pot and jig gear has averaged about 7.8% of the CGOA ABC (Table 8). Harvest in federal waters is managed at the total CGOA catch (includes federal reporting areas 620 and 630). The Chignik area, represented by federal reporting area 620, has ranged from a low of 3.5% of the ABC in 2005 to a high of 14.7% of the ABC in 2012. The 10-year average federal waters harvest is 11.2% of the CGOA ABC. Based on the 2013 CGOA ABC, increasing the GHL to 9.05%, 17.5%, or 17% of the ABC would have resulted in a 2013 GHL of 9.8 million pounds, 19 million pounds, and 18.5 million pounds, respectively.
7
Table 6.–Pounds of retained Pacific cod harvested during the state-waters, parallel, and federal waters seasons by all gear types as a percent of the ABC in the Chignik Management Area.
Year
CGOA ABC
(pounds)
Vessel
Count
Harvest
(pounds)
Percent
of ABC
Vessel
Count
Harvest
(pounds)
Percent
of ABC
Vessel
Count
Harvest
(pounds)
Percent
of ABC
Vessel
Count
Harvest
(pounds)
Percent
of ABC
2003 63,934,056 28 4,467,571 7.0% 16 297,379 0.5% 42 4,764,950 7.5% 103 5,112,769 8.0%
2004 78,925,490 28 5,750,461 7.3% 15 213,557 0.3% 41 5,964,018 7.6% 108 6,587,499 8.3%
2005 73,010,487 23 5,787,467 7.9% 17 98,190 0.1% 37 5,885,657 8.1% 106 2,550,502 3.5%
2006 83,495,672 14 3,439,521a
4.1% 9 121,300 0.1% 21 3,560,821 4.3% 126 7,392,015 8.9%
2007 83,495,672 16 5,700,861 6.8% 6 40,578 0.0% 21 5,741,439 6.9% 142 8,762,176 10.5%
2008 83,557,402 24 6,838,934a
8.2% 18 208,855 0.2% 40 7,047,789 8.4% 179 11,012,367 13.2%
2009 69,491,910 11 5,679,678a
8.2% 17 284,720 0.4% 24 5,964,398 8.6% 174 8,785,950 12.6%
2010 108,119,103 16 9,153,719a
8.5% 35 564,567a
0.5% 48 9,718,286 9.0% 176 15,096,750 14.0%
2011 118,643,971 32 10,346,856 8.7% 29 352,903a
0.3% 56 10,699,759 9.0% 175 15,424,969 13.0%
2012 125,531,212 25 10,473,154 8.3% 33 87,745a
0.1% 55 10,560,899 8.4% 170 18,395,041 14.7%
10‐yr
averageb
88,820,498 22 6,763,822 7.6% 20 226,979 0.3% 39 6,990,802 7.9% 146 9,912,004 11.2%
Proposals 2c & 5 9,833,860 9.05%
Proposal 3d
19,015,752 17.5%
Proposal 4e
18,472,445 17.0%
Source: ADFG Fish Tickets (State and parallel waters), Alaska Region Catch Accounting System (Federal waters)aDoes not include confidential data.b10‐yr average percent of ABC is calculated by dividing the average harvest by the average ABC.cIncrease GHL based on 10‐year average parallel season catch, number shown is based on 2013 ABC.dIncrease GHL to 17.5% of Central Gulf ABC; number shown is based on the 2013 ABC.eIncrease GHL to 17% of Central Gulf ABC; number shown is based on the 2013 ABC.
Federal waters ‐ Area 620State waters and ParallelState waters (GHL) Parallel (TAC)
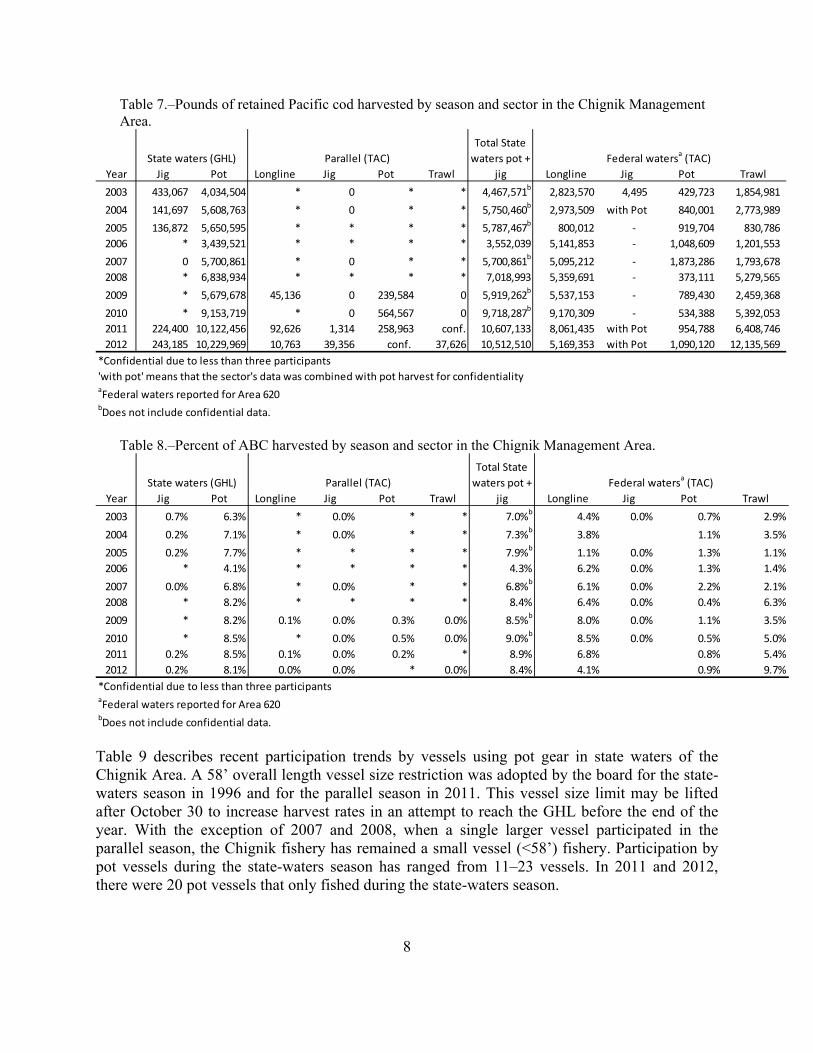
Table 7 describes harvest by gear sector in the Chignik Area. Currently, pot gear is allocated 90% of the GHL, and jig gear is allocated 10% (with a step-up to 25% possible). Both jig and overall parallel season participation is often low and cannot be shown due to confidentiality constraints. Table 8 shows the percent of the ABC harvested by each gear sector annually. During the state-waters season, most of the harvest is taken by vessels using pot gear. The same is true during the parallel season, although in recent years there has been an increase in participation by vessels using longline and jig gear. Boundaries between the state’s Chignik Management Area and federal reporting area 620 do not align; area 620 represents a larger area and includes the west side of Kodiak Island. Given that caveat, most of the harvest that occurs in area 620 is by longline vessels (up to 8.5% of the ABC in 2010), followed by trawl vessels (9.7% of the ABC in 2012). Smaller harvests are taken by pot and jig vessels in area 620 (generally <2% of the ABC).
8
Table 7.–Pounds of retained Pacific cod harvested by season and sector in the Chignik Management Area.
Year Jig Pot Longline Jig Pot Trawl Longline Jig Pot Trawl
2003 433,067 4,034,504 * 0 * * 4,467,571b
2,823,570 4,495 429,723 1,854,981
2004 141,697 5,608,763 * 0 * * 5,750,460b
2,973,509 with Pot 840,001 2,773,989
2005 136,872 5,650,595 * * * * 5,787,467b
800,012 ‐ 919,704 830,786
2006 * 3,439,521 * * * * 3,552,039 5,141,853 ‐ 1,048,609 1,201,553
2007 0 5,700,861 * 0 * * 5,700,861b
5,095,212 ‐ 1,873,286 1,793,678
2008 * 6,838,934 * * * * 7,018,993 5,359,691 ‐ 373,111 5,279,565
2009 * 5,679,678 45,136 0 239,584 0 5,919,262b
5,537,153 ‐ 789,430 2,459,368
2010 * 9,153,719 * 0 564,567 0 9,718,287b
9,170,309 ‐ 534,388 5,392,053
2011 224,400 10,122,456 92,626 1,314 258,963 conf. 10,607,133 8,061,435 with Pot 954,788 6,408,746
2012 243,185 10,229,969 10,763 39,356 conf. 37,626 10,512,510 5,169,353 with Pot 1,090,120 12,135,569
*Confidential due to less than three participants
'with pot' means that the sector's data was combined with pot harvest for confidentialityaFederal waters reported for Area 620bDoes not include confidential data.
State waters (GHL) Parallel (TAC) Federal watersa(TAC)
Total State
waters pot +
jig
Table 8.–Percent of ABC harvested by season and sector in the Chignik Management Area.
Year Jig Pot Longline Jig Pot Trawl Longline Jig Pot Trawl
2003 0.7% 6.3% * 0.0% * * 7.0%b
4.4% 0.0% 0.7% 2.9%
2004 0.2% 7.1% * 0.0% * * 7.3%b
3.8% 1.1% 3.5%
2005 0.2% 7.7% * * * * 7.9%b
1.1% 0.0% 1.3% 1.1%
2006 * 4.1% * * * * 4.3% 6.2% 0.0% 1.3% 1.4%
2007 0.0% 6.8% * 0.0% * * 6.8%b
6.1% 0.0% 2.2% 2.1%
2008 * 8.2% * * * * 8.4% 6.4% 0.0% 0.4% 6.3%
2009 * 8.2% 0.1% 0.0% 0.3% 0.0% 8.5%b
8.0% 0.0% 1.1% 3.5%
2010 * 8.5% * 0.0% 0.5% 0.0% 9.0%b
8.5% 0.0% 0.5% 5.0%
2011 0.2% 8.5% 0.1% 0.0% 0.2% * 8.9% 6.8% 0.8% 5.4%
2012 0.2% 8.1% 0.0% 0.0% * 0.0% 8.4% 4.1% 0.9% 9.7%
*Confidential due to less than three participantsaFederal waters reported for Area 620bDoes not include confidential data.
State waters (GHL) Parallel (TAC) Federal watersa(TAC)
Total State
waters pot +
jig
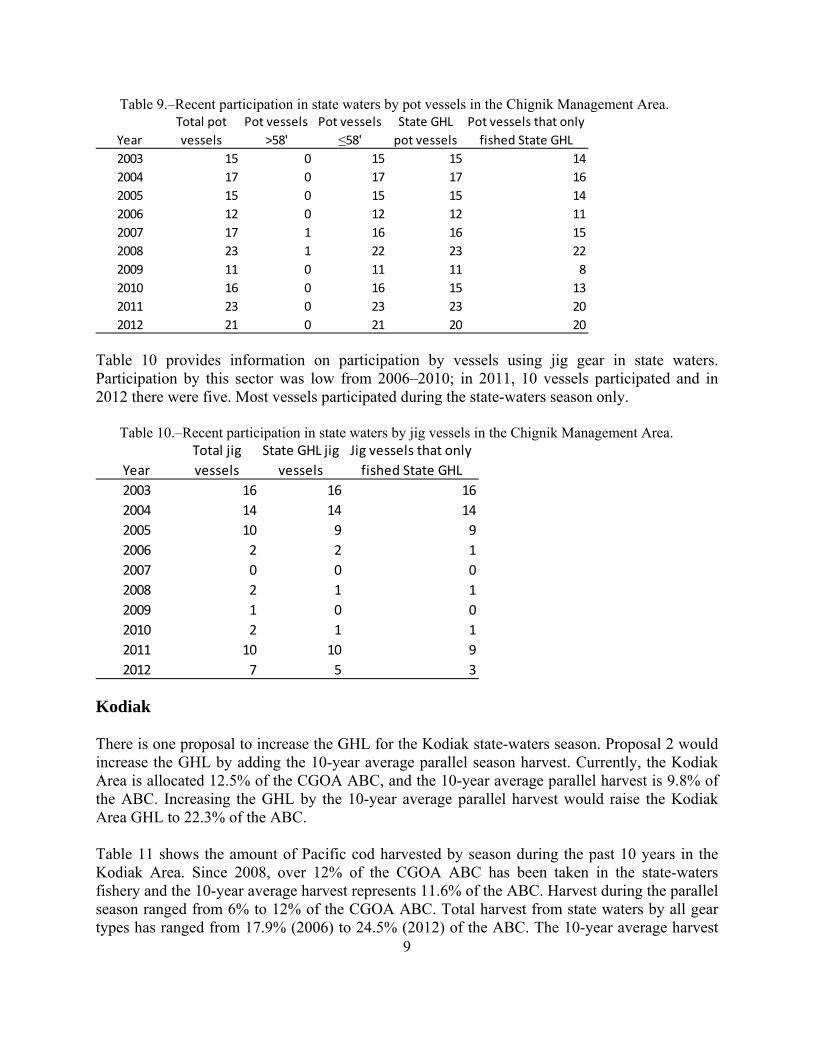
Table 9 describes recent participation trends by vessels using pot gear in state waters of the Chignik Area. A 58’ overall length vessel size restriction was adopted by the board for the state-waters season in 1996 and for the parallel season in 2011. This vessel size limit may be lifted after October 30 to increase harvest rates in an attempt to reach the GHL before the end of the year. With the exception of 2007 and 2008, when a single larger vessel participated in the parallel season, the Chignik fishery has remained a small vessel (<58’) fishery. Participation by pot vessels during the state-waters season has ranged from 11–23 vessels. In 2011 and 2012, there were 20 pot vessels that only fished during the state-waters season.
9
Table 9.–Recent participation in state waters by pot vessels in the Chignik Management Area.
Year
Total pot
vessels
Pot vessels
>58'
Pot vessels
≤58'State GHL
pot vessels
Pot vessels that only
fished State GHL
2003 15 0 15 15 14
2004 17 0 17 17 16
2005 15 0 15 15 14
2006 12 0 12 12 11
2007 17 1 16 16 15
2008 23 1 22 23 22
2009 11 0 11 11 8
2010 16 0 16 15 13
2011 23 0 23 23 20
2012 21 0 21 20 20
Table 10 provides information on participation by vessels using jig gear in state waters. Participation by this sector was low from 2006–2010; in 2011, 10 vessels participated and in 2012 there were five. Most vessels participated during the state-waters season only.
Table 10.–Recent participation in state waters by jig vessels in the Chignik Management Area.
Year
Total jig
vessels
State GHL jig
vessels
Jig vessels that only
fished State GHL
2003 16 16 16
2004 14 14 14
2005 10 9 9
2006 2 2 1
2007 0 0 0
2008 2 1 1
2009 1 0 0
2010 2 1 1
2011 10 10 9
2012 7 5 3 Kodiak There is one proposal to increase the GHL for the Kodiak state-waters season. Proposal 2 would increase the GHL by adding the 10-year average parallel season harvest. Currently, the Kodiak Area is allocated 12.5% of the CGOA ABC, and the 10-year average parallel harvest is 9.8% of the ABC. Increasing the GHL by the 10-year average parallel harvest would raise the Kodiak Area GHL to 22.3% of the ABC. Table 11 shows the amount of Pacific cod harvested by season during the past 10 years in the Kodiak Area. Since 2008, over 12% of the CGOA ABC has been taken in the state-waters fishery and the 10-year average harvest represents 11.6% of the ABC. Harvest during the parallel season ranged from 6% to 12% of the CGOA ABC. Total harvest from state waters by all gear types has ranged from 17.9% (2006) to 24.5% (2012) of the ABC. The 10-year average harvest
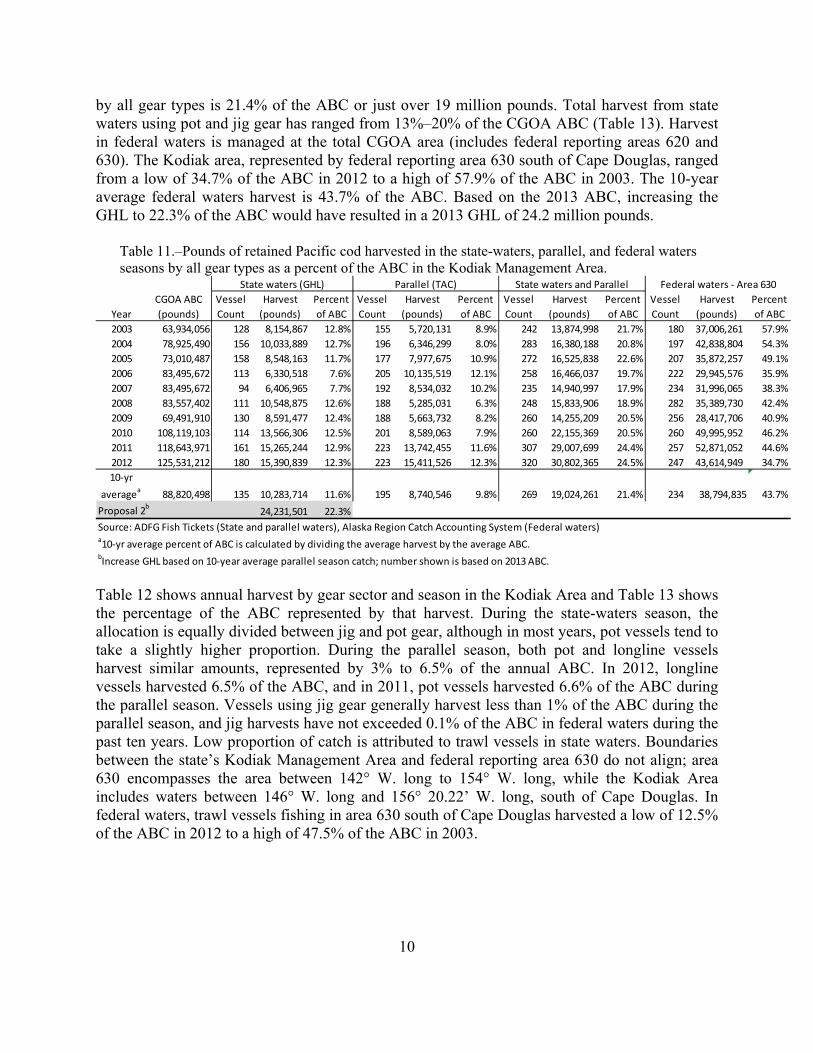
10
by all gear types is 21.4% of the ABC or just over 19 million pounds. Total harvest from state waters using pot and jig gear has ranged from 13%–20% of the CGOA ABC (Table 13). Harvest in federal waters is managed at the total CGOA area (includes federal reporting areas 620 and 630). The Kodiak area, represented by federal reporting area 630 south of Cape Douglas, ranged from a low of 34.7% of the ABC in 2012 to a high of 57.9% of the ABC in 2003. The 10-year average federal waters harvest is 43.7% of the ABC. Based on the 2013 ABC, increasing the GHL to 22.3% of the ABC would have resulted in a 2013 GHL of 24.2 million pounds.
Table 11.–Pounds of retained Pacific cod harvested in the state-waters, parallel, and federal waters seasons by all gear types as a percent of the ABC in the Kodiak Management Area.
Year
CGOA ABC
(pounds)
Vessel
Count
Harvest
(pounds)
Percent
of ABC
Vessel
Count
Harvest
(pounds)
Percent
of ABC
Vessel
Count
Harvest
(pounds)
Percent
of ABC
Vessel
Count
Harvest
(pounds)
Percent
of ABC
2003 63,934,056 128 8,154,867 12.8% 155 5,720,131 8.9% 242 13,874,998 21.7% 180 37,006,261 57.9%
2004 78,925,490 156 10,033,889 12.7% 196 6,346,299 8.0% 283 16,380,188 20.8% 197 42,838,804 54.3%
2005 73,010,487 158 8,548,163 11.7% 177 7,977,675 10.9% 272 16,525,838 22.6% 207 35,872,257 49.1%
2006 83,495,672 113 6,330,518 7.6% 205 10,135,519 12.1% 258 16,466,037 19.7% 222 29,945,576 35.9%
2007 83,495,672 94 6,406,965 7.7% 192 8,534,032 10.2% 235 14,940,997 17.9% 234 31,996,065 38.3%
2008 83,557,402 111 10,548,875 12.6% 188 5,285,031 6.3% 248 15,833,906 18.9% 282 35,389,730 42.4%
2009 69,491,910 130 8,591,477 12.4% 188 5,663,732 8.2% 260 14,255,209 20.5% 256 28,417,706 40.9%
2010 108,119,103 114 13,566,306 12.5% 201 8,589,063 7.9% 260 22,155,369 20.5% 260 49,995,952 46.2%
2011 118,643,971 161 15,265,244 12.9% 223 13,742,455 11.6% 307 29,007,699 24.4% 257 52,871,052 44.6%
2012 125,531,212 180 15,390,839 12.3% 223 15,411,526 12.3% 320 30,802,365 24.5% 247 43,614,949 34.7%
10‐yr
averagea
88,820,498 135 10,283,714 11.6% 195 8,740,546 9.8% 269 19,024,261 21.4% 234 38,794,835 43.7%
Proposal 2b
24,231,501 22.3%
Source: ADFG Fish Tickets (State and parallel waters), Alaska Region Catch Accounting System (Federal waters)a10‐yr average percent of ABC is calculated by dividing the average harvest by the average ABC.bIncrease GHL based on 10‐year average parallel season catch; number shown is based on 2013 ABC.
State waters (GHL) Parallel (TAC) State waters and Parallel Federal waters ‐ Area 630
Table 12 shows annual harvest by gear sector and season in the Kodiak Area and Table 13 shows the percentage of the ABC represented by that harvest. During the state-waters season, the allocation is equally divided between jig and pot gear, although in most years, pot vessels tend to take a slightly higher proportion. During the parallel season, both pot and longline vessels harvest similar amounts, represented by 3% to 6.5% of the annual ABC. In 2012, longline vessels harvested 6.5% of the ABC, and in 2011, pot vessels harvested 6.6% of the ABC during the parallel season. Vessels using jig gear generally harvest less than 1% of the ABC during the parallel season, and jig harvests have not exceeded 0.1% of the ABC in federal waters during the past ten years. Low proportion of catch is attributed to trawl vessels in state waters. Boundaries between the state’s Kodiak Management Area and federal reporting area 630 do not align; area 630 encompasses the area between 142° W. long to 154° W. long, while the Kodiak Area includes waters between 146° W. long and 156° 20.22’ W. long, south of Cape Douglas. In federal waters, trawl vessels fishing in area 630 south of Cape Douglas harvested a low of 12.5% of the ABC in 2012 to a high of 47.5% of the ABC in 2003.
11
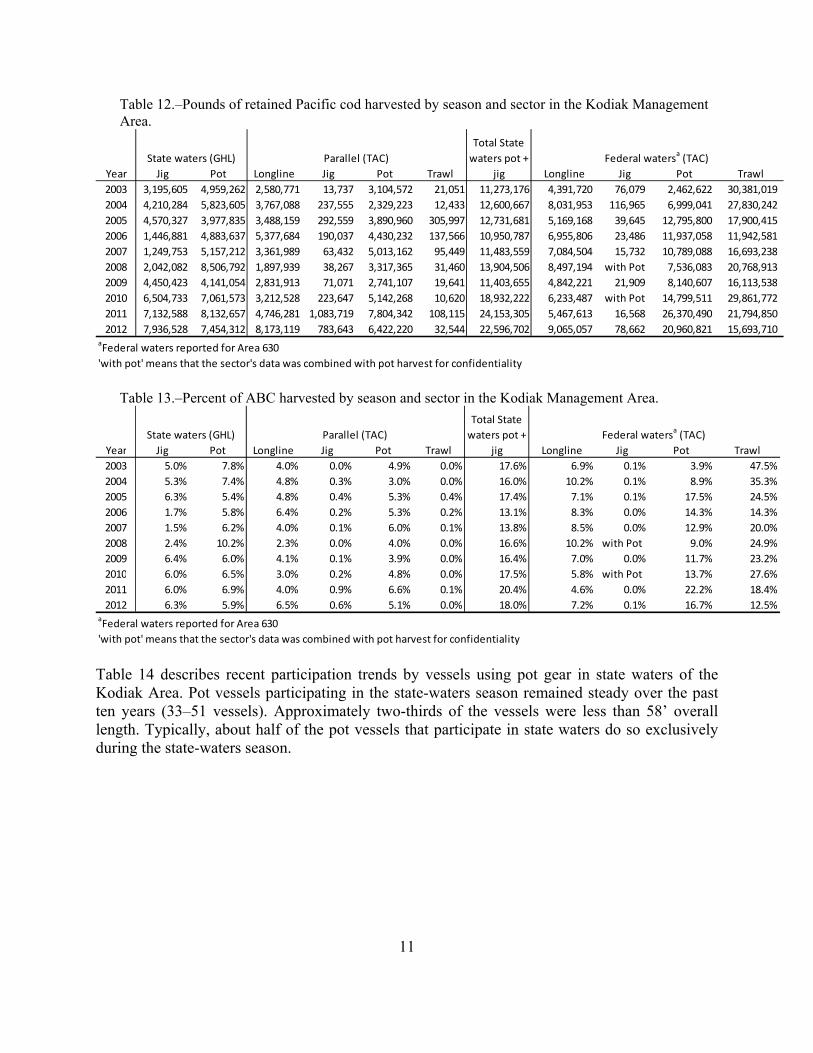
Table 12.–Pounds of retained Pacific cod harvested by season and sector in the Kodiak Management Area.
Year Jig Pot Longline Jig Pot Trawl Longline Jig Pot Trawl
2003 3,195,605 4,959,262 2,580,771 13,737 3,104,572 21,051 11,273,176 4,391,720 76,079 2,462,622 30,381,019
2004 4,210,284 5,823,605 3,767,088 237,555 2,329,223 12,433 12,600,667 8,031,953 116,965 6,999,041 27,830,242
2005 4,570,327 3,977,835 3,488,159 292,559 3,890,960 305,997 12,731,681 5,169,168 39,645 12,795,800 17,900,415
2006 1,446,881 4,883,637 5,377,684 190,037 4,430,232 137,566 10,950,787 6,955,806 23,486 11,937,058 11,942,581
2007 1,249,753 5,157,212 3,361,989 63,432 5,013,162 95,449 11,483,559 7,084,504 15,732 10,789,088 16,693,238
2008 2,042,082 8,506,792 1,897,939 38,267 3,317,365 31,460 13,904,506 8,497,194 with Pot 7,536,083 20,768,913
2009 4,450,423 4,141,054 2,831,913 71,071 2,741,107 19,641 11,403,655 4,842,221 21,909 8,140,607 16,113,538
2010 6,504,733 7,061,573 3,212,528 223,647 5,142,268 10,620 18,932,222 6,233,487 with Pot 14,799,511 29,861,772
2011 7,132,588 8,132,657 4,746,281 1,083,719 7,804,342 108,115 24,153,305 5,467,613 16,568 26,370,490 21,794,850
2012 7,936,528 7,454,312 8,173,119 783,643 6,422,220 32,544 22,596,702 9,065,057 78,662 20,960,821 15,693,710 aFederal waters reported for Area 630
'with pot' means that the sector's data was combined with pot harvest for confidentiality
State waters (GHL) Parallel (TAC) Federal watersa(TAC)
Total State
waters pot +
jig
Table 13.–Percent of ABC harvested by season and sector in the Kodiak Management Area.
Year Jig Pot Longline Jig Pot Trawl Longline Jig Pot Trawl
2003 5.0% 7.8% 4.0% 0.0% 4.9% 0.0% 17.6% 6.9% 0.1% 3.9% 47.5%
2004 5.3% 7.4% 4.8% 0.3% 3.0% 0.0% 16.0% 10.2% 0.1% 8.9% 35.3%
2005 6.3% 5.4% 4.8% 0.4% 5.3% 0.4% 17.4% 7.1% 0.1% 17.5% 24.5%
2006 1.7% 5.8% 6.4% 0.2% 5.3% 0.2% 13.1% 8.3% 0.0% 14.3% 14.3%
2007 1.5% 6.2% 4.0% 0.1% 6.0% 0.1% 13.8% 8.5% 0.0% 12.9% 20.0%
2008 2.4% 10.2% 2.3% 0.0% 4.0% 0.0% 16.6% 10.2% with Pot 9.0% 24.9%
2009 6.4% 6.0% 4.1% 0.1% 3.9% 0.0% 16.4% 7.0% 0.0% 11.7% 23.2%
2010 6.0% 6.5% 3.0% 0.2% 4.8% 0.0% 17.5% 5.8% with Pot 13.7% 27.6%
2011 6.0% 6.9% 4.0% 0.9% 6.6% 0.1% 20.4% 4.6% 0.0% 22.2% 18.4%
2012 6.3% 5.9% 6.5% 0.6% 5.1% 0.0% 18.0% 7.2% 0.1% 16.7% 12.5%aFederal waters reported for Area 630
'with pot' means that the sector's data was combined with pot harvest for confidentiality
State waters (GHL) Parallel (TAC) Federal watersa(TAC)
Total State
waters pot +
jig
Table 14 describes recent participation trends by vessels using pot gear in state waters of the Kodiak Area. Pot vessels participating in the state-waters season remained steady over the past ten years (33–51 vessels). Approximately two-thirds of the vessels were less than 58’ overall length. Typically, about half of the pot vessels that participate in state waters do so exclusively during the state-waters season.
12
Table 14.–Recent participation in state waters by pot vessels in the Kodiak Management Area.
Year
Total pot
vessels
Pot vessels
>58'
Pot vessels
≤58'State GHL
pot vessels
Pot vessels that only
fished State GHL
2003 43 13 30 42 29
2004 49 19 30 47 36
2005 57 20 37 51 35
2006 53 22 31 41 22
2007 45 16 29 33 10
2008 45 14 31 37 15
2009 42 15 27 38 25
2010 39 13 26 36 18
2011 49 16 33 46 26
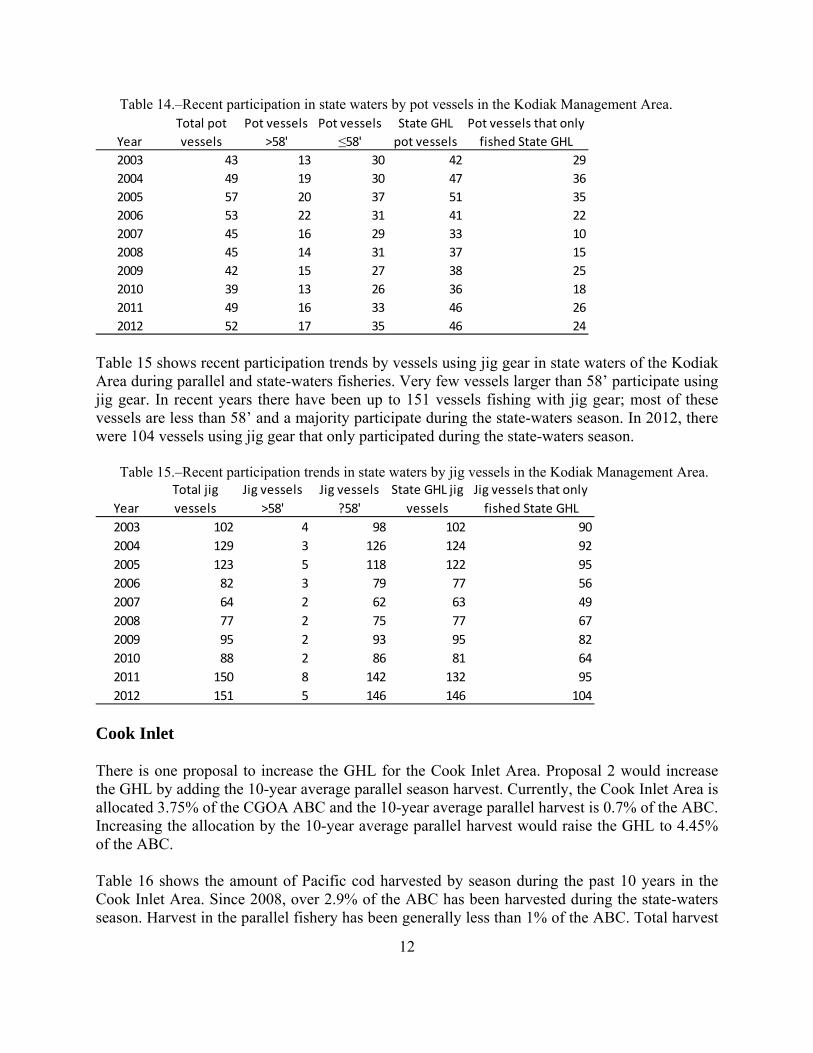
2012 52 17 35 46 24 Table 15 shows recent participation trends by vessels using jig gear in state waters of the Kodiak Area during parallel and state-waters fisheries. Very few vessels larger than 58’ participate using jig gear. In recent years there have been up to 151 vessels fishing with jig gear; most of these vessels are less than 58’ and a majority participate during the state-waters season. In 2012, there were 104 vessels using jig gear that only participated during the state-waters season.
Table 15.–Recent participation trends in state waters by jig vessels in the Kodiak Management Area.
Year
Total jig
vessels
Jig vessels
>58'
Jig vessels
?58'
State GHL jig
vessels
Jig vessels that only
fished State GHL
2003 102 4 98 102 90
2004 129 3 126 124 92
2005 123 5 118 122 95
2006 82 3 79 77 56
2007 64 2 62 63 49
2008 77 2 75 77 67
2009 95 2 93 95 82
2010 88 2 86 81 64
2011 150 8 142 132 95
2012 151 5 146 146 104 Cook Inlet There is one proposal to increase the GHL for the Cook Inlet Area. Proposal 2 would increase the GHL by adding the 10-year average parallel season harvest. Currently, the Cook Inlet Area is allocated 3.75% of the CGOA ABC and the 10-year average parallel harvest is 0.7% of the ABC. Increasing the allocation by the 10-year average parallel harvest would raise the GHL to 4.45% of the ABC. Table 16 shows the amount of Pacific cod harvested by season during the past 10 years in the Cook Inlet Area. Since 2008, over 2.9% of the ABC has been harvested during the state-waters season. Harvest in the parallel fishery has been generally less than 1% of the ABC. Total harvest
13
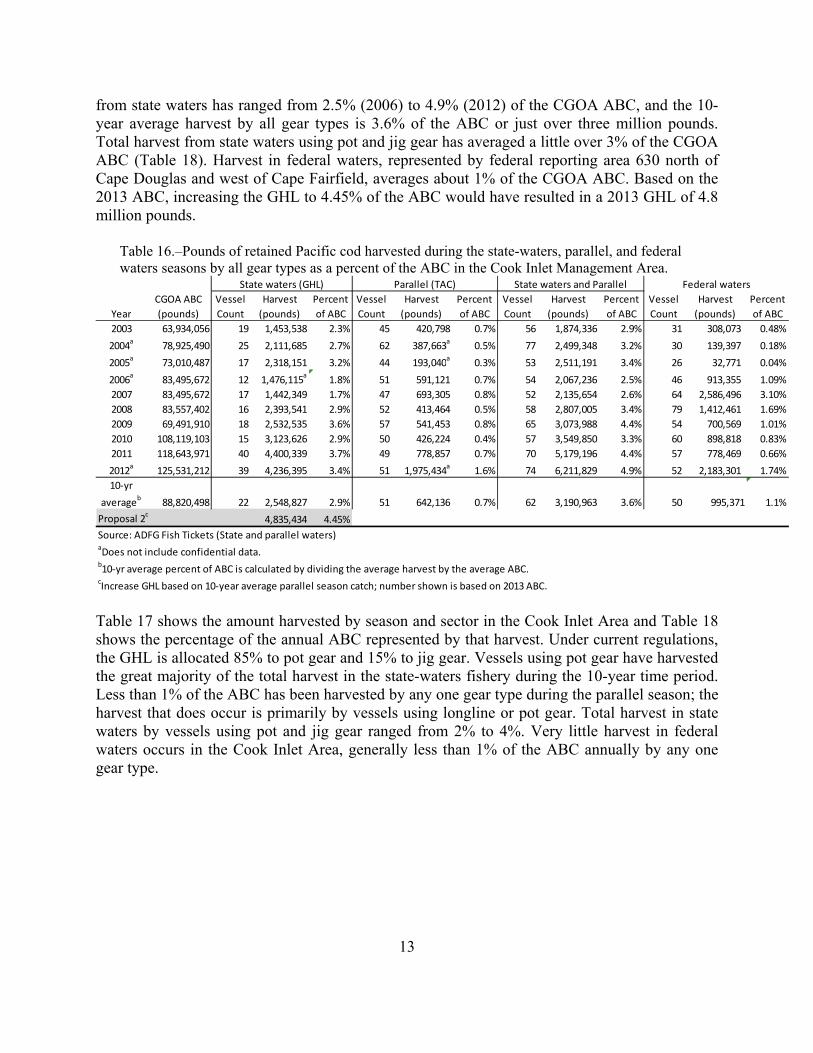
from state waters has ranged from 2.5% (2006) to 4.9% (2012) of the CGOA ABC, and the 10-year average harvest by all gear types is 3.6% of the ABC or just over three million pounds. Total harvest from state waters using pot and jig gear has averaged a little over 3% of the CGOA ABC (Table 18). Harvest in federal waters, represented by federal reporting area 630 north of Cape Douglas and west of Cape Fairfield, averages about 1% of the CGOA ABC. Based on the 2013 ABC, increasing the GHL to 4.45% of the ABC would have resulted in a 2013 GHL of 4.8 million pounds.
Table 16.–Pounds of retained Pacific cod harvested during the state-waters, parallel, and federal waters seasons by all gear types as a percent of the ABC in the Cook Inlet Management Area.
Year
CGOA ABC
(pounds)
Vessel
Count
Harvest
(pounds)
Percent
of ABC
Vessel
Count
Harvest
(pounds)
Percent
of ABC
Vessel
Count
Harvest
(pounds)
Percent
of ABC
Vessel
Count
Harvest
(pounds)
Percent
of ABC
2003 63,934,056 19 1,453,538 2.3% 45 420,798 0.7% 56 1,874,336 2.9% 31 308,073 0.48%
2004a
78,925,490 25 2,111,685 2.7% 62 387,663a
0.5% 77 2,499,348 3.2% 30 139,397 0.18%
2005a
73,010,487 17 2,318,151 3.2% 44 193,040a
0.3% 53 2,511,191 3.4% 26 32,771 0.04%
2006a
83,495,672 12 1,476,115a
1.8% 51 591,121 0.7% 54 2,067,236 2.5% 46 913,355 1.09%
2007 83,495,672 17 1,442,349 1.7% 47 693,305 0.8% 52 2,135,654 2.6% 64 2,586,496 3.10%
2008 83,557,402 16 2,393,541 2.9% 52 413,464 0.5% 58 2,807,005 3.4% 79 1,412,461 1.69%
2009 69,491,910 18 2,532,535 3.6% 57 541,453 0.8% 65 3,073,988 4.4% 54 700,569 1.01%
2010 108,119,103 15 3,123,626 2.9% 50 426,224 0.4% 57 3,549,850 3.3% 60 898,818 0.83%
2011 118,643,971 40 4,400,339 3.7% 49 778,857 0.7% 70 5,179,196 4.4% 57 778,469 0.66%
2012a
125,531,212 39 4,236,395 3.4% 51 1,975,434a
1.6% 74 6,211,829 4.9% 52 2,183,301 1.74%
10‐yr
averageb
88,820,498 22 2,548,827 2.9% 51 642,136 0.7% 62 3,190,963 3.6% 50 995,371 1.1%
Proposal 2c
4,835,434 4.45%
Source: ADFG Fish Tickets (State and parallel waters)aDoes not include confidential data.b10‐yr average percent of ABC is calculated by dividing the average harvest by the average ABC.cIncrease GHL based on 10‐year average parallel season catch; number shown is based on 2013 ABC.
State waters (GHL) Parallel (TAC) State waters and Parallel Federal waters
Table 17 shows the amount harvested by season and sector in the Cook Inlet Area and Table 18 shows the percentage of the annual ABC represented by that harvest. Under current regulations, the GHL is allocated 85% to pot gear and 15% to jig gear. Vessels using pot gear have harvested the great majority of the total harvest in the state-waters fishery during the 10-year time period. Less than 1% of the ABC has been harvested by any one gear type during the parallel season; the harvest that does occur is primarily by vessels using longline or pot gear. Total harvest in state waters by vessels using pot and jig gear ranged from 2% to 4%. Very little harvest in federal waters occurs in the Cook Inlet Area, generally less than 1% of the ABC annually by any one gear type.

14
Table 17.–Pounds of retained Pacific cod harvested by season and sector in the Cook Inlet Management Area.
Year Jig Pot Longline Jig Pot Trawl Longline Jig Pot Trawl
2003 429,684 1,023,854 126,168 0 294,630 0 1,748,168 10,981 with Pot 263,853 33,239
2004 326,298 1,785,386 27,026 * 360,637 0 2,472,321a
13,212 0 126,185 with Pot
2005 90,734 2,227,417 25,720 * 167,320 0 2,485,471a
17,956 with Pot 13,340 with Pot
2006 * 1,476,115 70,507 0 520,613 0 1,996,728a
315,300 0 598,055 0
2007 5,545 1,436,804 364,427 0 328,878 0 1,771,227 235,403 0 2,343,133 7,961
2008 14,456 2,379,085 267,991 0 145,473 0 2,539,014 366,707 0 1,045,754 with Pot
2009 138,960 2,393,574 452,796 0 88,657 0 2,621,191 94,831 0 605,738 with Pot
2010 48,754 3,074,871 197,795 0 228,429 0 3,352,055 97,005 0 801,813 with Pot
2011 498,185 3,902,154 199,613 237 579,007 0 4,979,582 113,665 0 664,804 with Pot
2012 192,847 4,043,548 1,018,217 * 957,217 0 5,193,612a
970,128 0 1,213,174 with Pot
*Confidential due to less than three participants
'with pot' means that the sector's data was combined with pot harvest for confidentialityaDoes not include confidential data.
State waters (GHL) Parallel (TAC) Federal waters (TAC)
Total State
waters pot +
jig
Table 18.–Percent of ABC harvested by season and sector in the Cook Inlet Management Area.
Year Jig Pot HAL Jig Pot Trawl HAL Jig Pot Trawl
2003 0.7% 1.6% 0.2% 0.0% 0.5% 0.0% 2.7% 0.0% with Pot 0.4% 0.1%
2004 0.4% 2.3% 0.0% * 0.5% 0.0% 3.1%a
0.0% 0.0% 0.2% with Pot
2005 0.1% 3.1% 0.0% * 0.2% 0.0% 3.4%a
0.0% with Pot 0.0% with Pot
2006 * 1.8% 0.1% 0.0% 0.6% 0.0% 2.4%a
0.4% 0.0% 0.7% 0.0%
2007 0.0% 1.7% 0.4% 0.0% 0.4% 0.0% 2.1% 0.3% 0.0% 2.8% 0.0%
2008 0.0% 2.8% 0.3% 0.0% 0.2% 0.0% 3.0% 0.4% 0.0% 1.3% with Pot
2009 0.2% 3.4% 0.7% 0.0% 0.1% 0.0% 3.8% 0.1% 0.0% 0.9% with Pot
2010 0.0% 2.8% 0.2% 0.0% 0.2% 0.0% 3.1% 0.1% 0.0% 0.7% with Pot
2011 0.4% 3.3% 0.2% 0.0% 0.5% 0.0% 4.2% 0.1% 0.0% 0.6% with Pot
2012 0.2% 3.2% 0.8% * 0.8% 0.0% 4.1%a
0.8% 0.0% 1.0% with Pot
*Confidential due to less than three participants
'with pot' means that the sector's data was combined with pot harvest for confidentialityaDoes not include confidential data.
State waters (GHL) Parallel (TAC) Federal waters (TAC)
Total State
waters pot +
jig
Table 19 provides annual participation trends by vessels using pot gear in state waters of the Cook Inlet Area. Most of the vessels that participate are less than or equal to 58’ overall length. During the past 10 years, a maximum of 13 pot vessels have participated during the state-waters season, and the number of vessels that participate exclusively during the state-waters season has declined slightly since 2009.
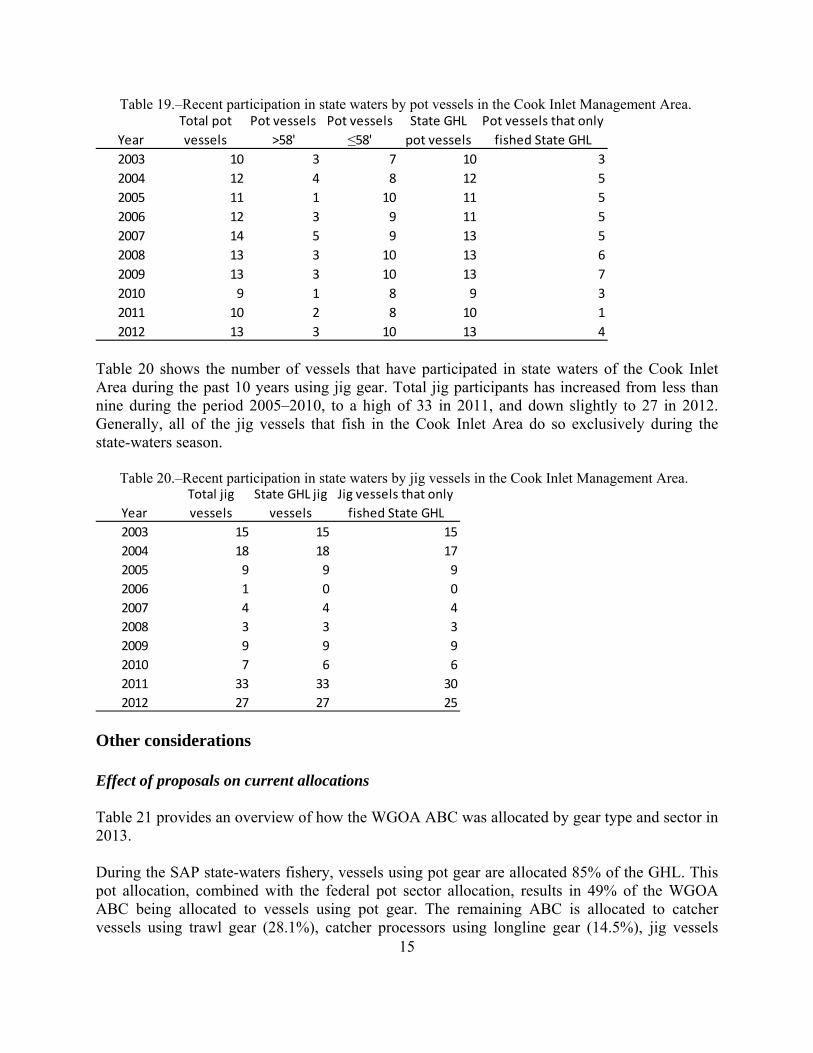
15
Table 19.–Recent participation in state waters by pot vessels in the Cook Inlet Management Area.
Year
Total pot
vessels
Pot vessels
>58'
Pot vessels
≤58'State GHL
pot vessels
Pot vessels that only
fished State GHL
2003 10 3 7 10 3
2004 12 4 8 12 5
2005 11 1 10 11 5
2006 12 3 9 11 5
2007 14 5 9 13 5
2008 13 3 10 13 6
2009 13 3 10 13 7
2010 9 1 8 9 3
2011 10 2 8 10 1
2012 13 3 10 13 4 Table 20 shows the number of vessels that have participated in state waters of the Cook Inlet Area during the past 10 years using jig gear. Total jig participants has increased from less than nine during the period 2005–2010, to a high of 33 in 2011, and down slightly to 27 in 2012. Generally, all of the jig vessels that fish in the Cook Inlet Area do so exclusively during the state-waters season.
Table 20.–Recent participation in state waters by jig vessels in the Cook Inlet Management Area.
Year
Total jig
vessels
State GHL jig
vessels
Jig vessels that only
fished State GHL
2003 15 15 15
2004 18 18 17
2005 9 9 9
2006 1 0 0
2007 4 4 4
2008 3 3 3
2009 9 9 9
2010 7 6 6
2011 33 33 30
2012 27 27 25 Other considerations Effect of proposals on current allocations Table 21 provides an overview of how the WGOA ABC was allocated by gear type and sector in 2013. During the SAP state-waters fishery, vessels using pot gear are allocated 85% of the GHL. This pot allocation, combined with the federal pot sector allocation, results in 49% of the WGOA ABC being allocated to vessels using pot gear. The remaining ABC is allocated to catcher vessels using trawl gear (28.1%), catcher processors using longline gear (14.5%), jig vessels

16
(5.6%), catcher processors using trawl gear (1.75%), and finally, catcher vessels using longline gear (~1%).
Table 21.–Percent of the 2013 Western Gulf of Alaska ABC allocated by gear type.
Gear
Operation
type Total
Jig CV/CP 1.87% 3.75% 5.62%
Pot CV/CP 27.79% 21.25% 49.04%
Longline CV 1.03% n/a 1.03%
CP 14.48% n/a 14.48%
Trawl CV 28.08% n/a 28.08%
CP 1.75% n/a 1.75%
Federal TAC
(75%)
State GHL
South Alaska
Peninsula
(25%)
Table 22 shows the effects of proposal 21 on the 2013 allocations, which would increase the state GHL to 55% of the WGOA ABC (proposals 18, 19, and 20 would increase the allocation to 50% of the ABC, so anticipated effects would be slightly less). Proposal 21 would shift 14.4% more of the 2013 ABC to vessels using pot gear, 3.8% more to vessels using jig gear, and reduce the allocation to longline gear by 6.2% and to trawl gear by 12%.
Table 22.–Percent of the 2013 ABC allocated by gear type based on Proposal 21 and effect of the change on status quo allocations.
Gear
Operation
type Total
Change from
status quo
Jig CV/CP 1.13% 8.25% 9.38% 3.76%
Pot CV/CP 16.67% 46.75% 63.42% 14.38%
Longline CV 0.61% n/a 0.61% ‐0.42%
CP 8.69% n/a 8.69% ‐5.79%
Trawl CV 16.85% n/a 16.85% ‐11.23%
CP 1.05% n/a 1.05% ‐0.70%
Federal TAC
(45%)
State GHL
South Alaska
Peninsula
(55%)
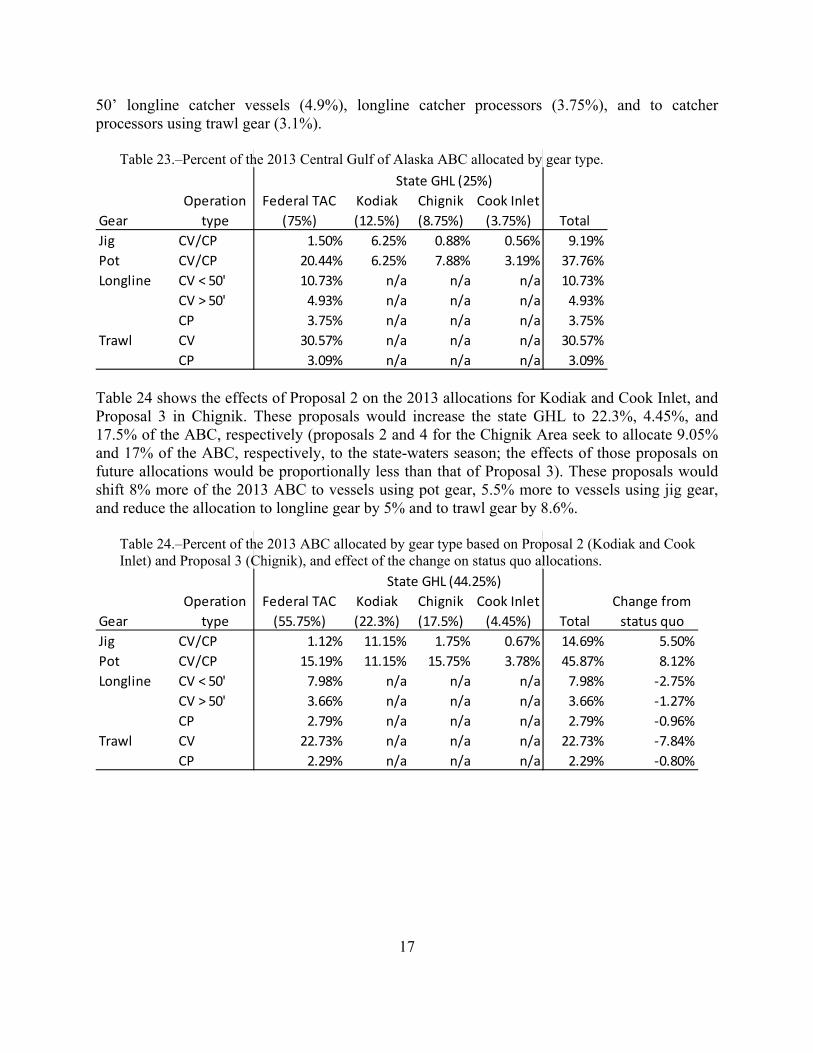
Table 23 provides an overview of how the CGOA ABC was allocated to each gear type and sector in 2013. In the GOA, registration is limited during state-waters Pacific cod seasons (exclusive or superexclusive), and vessels can only participate in one management area per calendar year. Therefore, the total allocation to the pot or jig sector does not represent what may be available to any single vessel, but rather to the overall gear type. In 2013, most of the CGOA ABC was allocated to the pot sector (37.8%) and to catcher vessels using trawl gear (30.6%). Catcher vessels less than 50’ overall length using longline gear were allocated 10.7% of the ABC and 9.2% of the ABC was allocated to the jig sector. Smaller amounts were allocated to the over
17
50’ longline catcher vessels (4.9%), longline catcher processors (3.75%), and to catcher processors using trawl gear (3.1%).
Table 23.–Percent of the 2013 Central Gulf of Alaska ABC allocated by gear type.
Gear
Operation
type
Kodiak
(12.5%)
Chignik
(8.75%)
Cook Inlet
(3.75%) Total
Jig CV/CP 1.50% 6.25% 0.88% 0.56% 9.19%
Pot CV/CP 20.44% 6.25% 7.88% 3.19% 37.76%
Longline CV < 50' 10.73% n/a n/a n/a 10.73%
CV > 50' 4.93% n/a n/a n/a 4.93%
CP 3.75% n/a n/a n/a 3.75%
Trawl CV 30.57% n/a n/a n/a 30.57%
CP 3.09% n/a n/a n/a 3.09%
State GHL (25%)
Federal TAC
(75%)
Table 24 shows the effects of Proposal 2 on the 2013 allocations for Kodiak and Cook Inlet, and Proposal 3 in Chignik. These proposals would increase the state GHL to 22.3%, 4.45%, and 17.5% of the ABC, respectively (proposals 2 and 4 for the Chignik Area seek to allocate 9.05% and 17% of the ABC, respectively, to the state-waters season; the effects of those proposals on future allocations would be proportionally less than that of Proposal 3). These proposals would shift 8% more of the 2013 ABC to vessels using pot gear, 5.5% more to vessels using jig gear, and reduce the allocation to longline gear by 5% and to trawl gear by 8.6%.
Table 24.–Percent of the 2013 ABC allocated by gear type based on Proposal 2 (Kodiak and Cook Inlet) and Proposal 3 (Chignik), and effect of the change on status quo allocations.
Gear
Operation
type
Kodiak
(22.3%)
Chignik
(17.5%)
Cook Inlet
(4.45%) Total
Change from
status quo
Jig CV/CP 1.12% 11.15% 1.75% 0.67% 14.69% 5.50%
Pot CV/CP 15.19% 11.15% 15.75% 3.78% 45.87% 8.12%
Longline CV < 50' 7.98% n/a n/a n/a 7.98% ‐2.75%
CV > 50' 3.66% n/a n/a n/a 3.66% ‐1.27%
CP 2.79% n/a n/a n/a 2.79% ‐0.96%
Trawl CV 22.73% n/a n/a n/a 22.73% ‐7.84%
CP 2.29% n/a n/a n/a 2.29% ‐0.80%
Federal TAC
(55.75%)
State GHL (44.25%)
1
Alaska Region discussion of fishery impacts from
October 18‐22, 2013 BOF proposals Proposal 1: No impact
Proposal 2 – 5:
1. An increased GHL would require a change in harvest specification total allowable catch (TAC)
tables.
2. An increased GHL may not allow enough TAC to manage smaller Federal GOA Pacific cod
allocations.
3. An increased GHL may allow more harvest in Steller Sea Lion (SSL) areas closed by Federal
regulation but open during State fisheries. (i.e. The State does not currently follow 50 CFR 679,
Table 5 closure areas in the GOA GHL fisheries.)
Proposal 6:
1. NMFS would need to create a catch accounting system (CAS) account for hook‐and‐line gear.
2. It may cause issues with prohibited species catch (PSC). For example, if the hook‐and‐line halibut
PSC limit is reached and it is necessary to close hook‐and‐line gear due to halibut PSC.
Proposal 7: No impact
Proposal 8 ‐ 12:
1. These may slow down the pace of the fishery causing more overlap in dates of Federal and State
fisheries. This would be a minor impact since overlapping fisheries are already dealt with in
some areas.
Proposal 13:
1. It would cause overlap in dates of Federal and State fisheries. This would be a minor impact
since overlapping fisheries are already dealt with in some areas.
Proposal 14:
1. It may potentially increase participation in State jig fisheries in other areas. No impact on
Federal fisheries.
Proposal 15:
1. The State fishery may potentially be harvested at a faster rate. No impact on Federal fisheries.
Proposal 16 ‐ 17:
1. These proposals would base part of the Western GOA GHL fishery area on the BSAI ABC. It is
unclear if it would be a separate GHL fishery or if it would be combined with a State GHL Bering
2
Sea fishery (should it be created). If the State includes part of the Western GOA in Bering Sea
fishery but takes a portion of the BSAI ABC to set the Bering Sea fishery then NMFS will have no
way to determine how much GHL will be harvested from BS vs WGOA. Since NMFS will have no
way to determine where the catch may occur then the State GHL will need to be deducted from
both the WGOA ABC and the BSAI ABC before setting the TAC. If it is a separate GHL fishery then
NMFS would have to deduct the GHL from the WGOA ABC regardless of whether or not the
WGOA GHL was derived from the BSAI ABC.
2. It may potentially allow more harvest in SSL areas closed by Federal regulation but open during
State fisheries.
3. It would require changes to the CAS to accommodate new area description and catch
accounting.
Proposal 18 ‐ 21:
1. An increased GHL would require a change in harvest specification TAC tables.
2. An increased GHL may not allow enough TAC to manage smaller Federal GOA Pacific cod
allocations.
3. An increased GHL may allow more harvest in SSL areas closed by Federal regulation but open
during State fisheries. (i.e. State does not currently follow 50 CFR 679, Table 5 closure areas in
the GOA GHL fisheries.)
Proposal 22:
1. Change in registration may potentially lower participation in State Pacific cod fishery which may
cause overlap in dates of Federal/State fisheries. This would be a minor impact since
overlapping fisheries are already dealt with in some areas.
Proposal 23:
1. The start date of the South AK Peninsula Pacific cod fishery would change to seven days after
closure of the Federal fishery. This would eliminate chance of overlap in dates of Federal and
State fisheries. No impact on Federal fishery.
Proposal 24:
1. The start date of the South AK Peninsula Pacific cod fishery would change to seven days after
closure of Federal fishery or on March 12 whichever comes later. This may cause overlap in
dates of Federal and State fisheries. This would be a minor impact since overlapping fisheries
are already dealt with in some areas.
Proposal 25: No impact
Proposal 26 ‐ 27:

3
1. This may create a situation where pot gear is being stored inside three miles while the Federal
fishery is occurring. This would be more of an enforcement issue as there may be both pot
fishing in the parallel fishery and pots being stored for the State fishery inside three miles.
However, there are other areas in the GOA that already operate under these regulations.
Proposal 28:
1. This would close two areas to non‐pelagic trawl gear. No impact to Federal fisheries.
Proposal 29:
1. An increased GHL would require a change in the harvest specification TAC tables.
2. An increased GHL may not allow enough TAC to open directed fishing for the Federal AIeutian
Islands Pacific cod fisheries.
3. It may allow more harvest in SSL areas closed by Federal regulation but open during State
fisheries. (i.e. State follows 50 CFR 679, Table 5 closure areas from 2004).
Proposal 30: ADF&G housekeeping proposal. No impact.
Proposal 31:
1. This potentially allows for the State to set their own bycatch limits (maximum retainable
amounts (MRAs)) inside three miles instead of following Federal MRAs.
Proposal 32: ADF&G housekeeping proposal. No impact.
Proposal 33:
1. The way the proposal currently is written, Federal regulations for the Seguam Foraging Area and
Table 12 (no fishing/no transit zones which includes Kanaga Island/Ship Rock) would be
referenced in ADF&G regulation to NMFS most current regulations instead of to a specific
Federal Register citation. Table 5 would still reference NMFS 2004 SSL regulations. No federal
fisheries impact.
Proposal 34:
1. This would prevent creation or expansion of BSAI State Pacific cod fisheries unless they undergo
a more rigorous review process. No federal impact.
Proposal 35‐36:
1. Increased GHL may require a change in the harvest specification TAC tables.
2. A new State GHL fishery would require an additional account created in the CAS.
3. It may allow more harvest in SSL areas closed by Federal regulation but open during State
fisheries. If they mirror South AK Peninsula regulations then only Table 12 SSL closures would be
applied to the GHL fishery.
4
4. The State may open the Federal Bogoslof exemption area to the Bering Sea State GHL fishery
then the 113 mt annual TAC limit for that area may be exceeded.
1. The State may allow pot fishing in the Bogoslof exemption area which is currently prohibited
under Federal regulation. Federal regulations allow directed fishing for Pacific cod by catcher
vessels less than 60 ft (18.3 m) LOA using jig or hook‐and‐line gear.
2. The State may open all of the Bogoslof area that is currently closed to Pacific cod directed
fishing under Federal regulation.
Proposal 37:
1. An Atka mackerel GHL may require change in the harvest specification TAC tables.
2. A new State GHL would require an additional account created in the CAS.
3. The GHL fishery would follow SSL regulations in the Seguam Foraging Area and Table 12. No
other SSL regulations would apply since NMFS does not address the use of seine gear.
4. Other Federal Atka mackerel sector allocations would have decreased TACs (Amendment 80 and
BSAI trawl limited access).
BOF proposals for later meeting dates
Proposal 43:
1. An increase in GHLs would require a change in the harvest specification TAC tables.
2. It may not allow enough TAC to manage other GOA trawl fisheries.
3. It may allow more harvest in SSL areas closed by Federal regulation but open during State
fisheries.
4. It may violate Federal regulations enforcing season dates.
5. It may cause PSC concerns such as an increase in salmon bycatch.
Proposal 44:
1. Would require a change in the harvest specification TAC tables.
2. May not leave enough TAC to manage Central GOA Federal pollock allocations.
3. May allow more harvest in SSL areas closed by Federal regulation but open during State
fisheries.
4. May violate Federal regulations enforcing season dates.
5. May cause PSC concerns such as an increase in salmon bycatch.
Proposal 45:
1. Would require 100% observer coverage in all trawl fisheries inside State waters in the Central
GOA. However, the State currently does not have a groundfish observer program so NMFS may
be asked to be responsible for providing observers.
Proposal 101:
5
1. It would close Alitak Bay to all trawl fishing. No impact to federal fisheries.
Proposal 102:
1. It would close an undefined area of ADF&G’s Kodiak area to non‐pelagic trawl. Impact on
Federal fisheries depends on the exact area to be closed.
Proposal 342:
1. It changes the start date of the State Tanner crab GHL fishery from January 15 to January 3. This
may potentially cause earlier participation in the Federal Western GOA pot Pacific cod fishery
than in recent years. This would cause minimal Federal impact as NMFS should be able to react
appropriately inseason.
Proposal 349:
1. It changes the Aleutian Islands Golden King Crab fishery dates from August 15 – May 15 to May
15 – February 15 which does not match up with NMFS IFQ crab seasons.
Related Documents