www.cerf-jcr.org Recent Coastal Dune Development: Effects of Sand Nourishments Marcel A.J. Bakker { , Sytze van Heteren { , Laura M. Vonho ¨gen { , Ad J.F. van der Spek { , and Bert van der Valk 1 { TNO Geological Survey of the Netherlands P.O. Box 80015, NL-3508 TA Utrecht, The Netherlands [email protected] { Deltares Unit Subsurface and Groundwater Systems P.O. Box 85467, NL-3508 AL Utrecht, The Netherlands 1 Deltares Unit Marine and Coastal Systems P.O. Box 177, NL-2600 MH, Delft, The Netherlands ABSTRACT BAKKER, M.A.J.; VAN HETEREN, S.; VONHO ¨ GEN, L.M.; VAN DER SPEK, A.J.F., and VAN DER VALK, L., 2012. Recent coastal dune development: effects of sand nourishments. Journal of Coastal Research, 28(3), 587–601. West Palm Beach (Florida), ISSN 0749-0208. Much of the Dutch coast has been subject to structural erosion. From 1990 onward, sand nourishments have been used under a government policy of dynamic preservation. Annual monitoring and field inspections show that the structural erosion has decreased or even turned into coastal progradation after 1990. The monitoring data concern only morphodynamics and thus supply limited information on system-related geological processes driving the observed changes. Recently acquired ground-penetrating radar (GPR) data help establish the origin of sedimentary elements within the beach-foredune area, determine their decadal-scale preservation potential under the present nourishment policy, and demonstrate temporal and spatial accretion/erosion variability along nourished coasts. GPR images from a nonnourished retrograding barrier section show historical storm surge deposits within the eroding foredune and accumulations of natural eolian sediment farther landward. GPR images from a heavily nourished, prograding site show that the accreted foredune and beach consist of nourishment embankments (20%), wind-blown units derived from nourished sand (70%), and progradational beach deposits (10%). The net volume of accretion at this site is approximately 200 m 3 /m. Remarkably, almost all sand nourished before 2000 has been washed away, except for embankments constructed in 1990. Analysis of meteorological data suggests that 1999 storm surges are responsible for this erosion. The relative longevity of post-2000 nourishments can be attributed to a combination of shoreface nourishment and favorable meteorological conditions. During a storm surge in 2007, water-lain embankments proved to be more resistant against wave erosion than nourished sand redistributed by wind, indicating the importance of grain size, roundness and packing in the durability of nourishments. ADDITIONAL INDEX WORDS: Foredune, beach, coastal zone management, storm surge, meteorology, sediment dynamics. INTRODUCTION The Dutch coast has been subject to persistent erosion and landward retrogradation throughout at least the last centuries, presumably for up to 1500 years. The long-term erosional trend and the damage caused by a series of storm surges in 1990 prompted the definition of the ‘‘Reference Coast Line,’’ which corresponds roughly with the position of the coastline at that moment. The Reference Coast Line concept defines a minimum sediment volume in the beach-foredune area that is to be maintained. Maintenance takes place in the form of sand nourishments. Locations and volumes of these nourishments are determined on the basis of year-to-year trends as derived from coastal monitoring. A precondition is that, in controlling structural erosion, the natural behavior of the sandy coastline is maintained as much as possible. The so-called ‘‘dynamic preservation’’ of the coastline is achieved by the application of shoreface and beach nourishments (Rijkswaterstaat, 1990). At places where safety is not at risk, nourishments are rarely or not applied, and limited breaching, scarp formation, and blowout of foredunes is allowed or even stimulated. On an annual basis, about 12 Mm 3 of sand has been nourished at selected places along the Dutch coastline since the year 2000. Before 2000, this volume was about 6 Mm 3 . This sand was used for raising and widening the beach itself and for constructing embankments (erosion buffers or ‘‘shoulders’’) up against the foredunes. After later insights (evaluated by Nourtec, 1997), sand has since also been placed on the shoreface around the 5–6-m isobath (adjoining the outer beaker bar), allowing currents, waves and wind to redistribute the sand to adjacent areas. Since 1965, the development of the coastal zone has been monitored by means of coastal profiling (called Jarkus). Decadal shoreface, beach, and foredune development can be analyzed using this morphometric database. The Jarkus database contains elevations for cross sections spaced 250 m apart (corresponding with the beach-pole grid). These eleva- tions are measured annually along the entire Dutch coast (cf. Arens and Wiersma, 1984). The profiles stretch from about 1000 m seaward of the low-tide line up to and including the DOI: 10.2112/JCOASTRES-D-11-00097.1 received 20 May 2011; accepted in revision 24 October 2011. Published Pre-print online 19 March 2012. ’ Coastal Education & Research Foundation 2012. Journal of Coastal Research 28 3 587–601 West Palm Beach, Florida May 2012

Welcome message from author
This document is posted to help you gain knowledge. Please leave a comment to let me know what you think about it! Share it to your friends and learn new things together.
Transcript

www.cerf-jcr.org
Recent Coastal Dune Development: Effects ofSand Nourishments
Marcel A.J. Bakker{, Sytze van Heteren{, Laura M. Vonhogen{, Ad J.F. van der Spek{,and Bert van der Valk1
{TNO Geological Survey of the NetherlandsP.O. Box 80015, NL-3508 TA Utrecht,The [email protected]
{DeltaresUnit Subsurface and Groundwater SystemsP.O. Box 85467, NL-3508 AL Utrecht,The Netherlands
1DeltaresUnit Marine and Coastal SystemsP.O. Box 177, NL-2600 MH, Delft,The Netherlands
ABSTRACT
BAKKER, M.A.J.; VAN HETEREN, S.; VONHOGEN, L.M.; VAN DER SPEK, A.J.F., and VAN DER VALK, L., 2012. Recentcoastal dune development: effects of sand nourishments. Journal of Coastal Research, 28(3), 587–601. West Palm Beach(Florida), ISSN 0749-0208.
Much of the Dutch coast has been subject to structural erosion. From 1990 onward, sand nourishments have been usedunder a government policy of dynamic preservation. Annual monitoring and field inspections show that the structuralerosion has decreased or even turned into coastal progradation after 1990. The monitoring data concern onlymorphodynamics and thus supply limited information on system-related geological processes driving the observedchanges. Recently acquired ground-penetrating radar (GPR) data help establish the origin of sedimentary elementswithin the beach-foredune area, determine their decadal-scale preservation potential under the present nourishmentpolicy, and demonstrate temporal and spatial accretion/erosion variability along nourished coasts. GPR images from anonnourished retrograding barrier section show historical storm surge deposits within the eroding foredune andaccumulations of natural eolian sediment farther landward. GPR images from a heavily nourished, prograding site showthat the accreted foredune and beach consist of nourishment embankments (20%), wind-blown units derived fromnourished sand (70%), and progradational beach deposits (10%). The net volume of accretion at this site is approximately200 m3/m. Remarkably, almost all sand nourished before 2000 has been washed away, except for embankmentsconstructed in 1990. Analysis of meteorological data suggests that 1999 storm surges are responsible for this erosion. Therelative longevity of post-2000 nourishments can be attributed to a combination of shoreface nourishment and favorablemeteorological conditions. During a storm surge in 2007, water-lain embankments proved to be more resistant againstwave erosion than nourished sand redistributed by wind, indicating the importance of grain size, roundness and packingin the durability of nourishments.
ADDITIONAL INDEX WORDS: Foredune, beach, coastal zone management, storm surge, meteorology, sedimentdynamics.
INTRODUCTION
The Dutch coast has been subject to persistent erosion and
landward retrogradation throughout at least the last centuries,
presumably for up to 1500 years. The long-term erosional trend
and the damage caused by a series of storm surges in 1990
prompted the definition of the ‘‘Reference Coast Line,’’ which
corresponds roughly with the position of the coastline at that
moment. The Reference Coast Line concept defines a minimum
sediment volume in the beach-foredune area that is to be
maintained. Maintenance takes place in the form of sand
nourishments. Locations and volumes of these nourishments
are determined on the basis of year-to-year trends as derived
from coastal monitoring. A precondition is that, in controlling
structural erosion, the natural behavior of the sandy coastline
is maintained as much as possible. The so-called ‘‘dynamic
preservation’’ of the coastline is achieved by the application of
shoreface and beach nourishments (Rijkswaterstaat, 1990). At
places where safety is not at risk, nourishments are rarely
or not applied, and limited breaching, scarp formation, and
blowout of foredunes is allowed or even stimulated. On an
annual basis, about 12 Mm3 of sand has been nourished at
selected places along the Dutch coastline since the year 2000.
Before 2000, this volume was about 6 Mm3. This sand was used
for raising and widening the beach itself and for constructing
embankments (erosion buffers or ‘‘shoulders’’) up against the
foredunes. After later insights (evaluated by Nourtec, 1997),
sand has since also been placed on the shoreface around the
5–6-m isobath (adjoining the outer beaker bar), allowing
currents, waves and wind to redistribute the sand to adjacent
areas.
Since 1965, the development of the coastal zone has been
monitored by means of coastal profiling (called Jarkus).
Decadal shoreface, beach, and foredune development can be
analyzed using this morphometric database. The Jarkus
database contains elevations for cross sections spaced 250 m
apart (corresponding with the beach-pole grid). These eleva-
tions are measured annually along the entire Dutch coast (cf.
Arens and Wiersma, 1984). The profiles stretch from about
1000 m seaward of the low-tide line up to and including the
DOI: 10.2112/JCOASTRES-D-11-00097.1 received 20 May 2011;accepted in revision 24 October 2011.Published Pre-print online 19 March 2012.’ Coastal Education & Research Foundation 2012.
Journal of Coastal Research 28 3 587–601 West Palm Beach, Florida May 2012

frontal dune. The supratidal part of the profiles has been
measured by airborne laser altimetry (LIDAR) since 1996.
Earlier profiling of the land part was achieved by topographic
levelers and aerial photography. Annual measurements extend
landward to at least the top of the (fore)dune. Year-to-year
variability in measuring and processing techniques occasion-
ally complicate straightforward analyses of the annual net
changes in profiles (Arens, 2009). Additionally, the Jarkus
database solely represents annual registrations of the topog-
raphy of the beach–dune profile. Hence, little can be said on
the actual processes resulting in the observed year-to-year
variability.
This paper addresses these processes by linking Jarkus
with ground-penetrating radar (GPR) and meteorological
observations. This approach was applied to data from a
nonnourished beach that has been subject to long-term net
erosion and from an actively and frequently nourished beach
that has experienced recent coastline progradation. The
primary aims of this study are to determine (1) the origin of
sedimentary elements within the upper beach and foredune
area, (2) the fate of the sand volumes nourished in the past,
and (3) the decadal-scale preservation potential of sand in
the dune foot and on the adjacent backshore in light of the
established nourishment policy. A secondary aim is to
demonstrate temporal and spatial accretion and erosion
variability along nourished coasts.
STUDY SITES
The two study sites discussed in this paper are located along
the west coast of the Netherlands, in a region where the coast is
orientated roughly north–south (Figure 1). The tidal range is
,2 m, with spring tide around 1.2 m above mean sea level
(+MSL). Prevailing winds, mostly moderate in strength, are
from the southwest. Strong winds, occasionally gale force or
stronger, reach the coastline from southwesterly to northwest-
erly directions. Storm surges, with significant water level set-
up, accompany westerly to northwesterly storm wind regimes.
Water level monitoring shows extremes of 3.50 to 3.85 m +MSL,
with associated offshore significant wave heights of approxi-
mately 7 m.
Site 1. Nonnourished Beach (Heemskerk aan Zee)
Longshore redistribution of past nourishments has likely
influenced any stretch of beach in one way or another, even
when beaches and the adjacent shoreface have not been
nourished themselves. This is the case for the Heemskerk site
(Figure 1). Nourishments were carried out just south of the
study site in 1996–97 and just north of the site in 2005.
However, the first nourishment at the study site itself was not
put into place until after completion of our study. In a situation
of limited sediment availability, coastline retrogradation has
Figure 1. The study sites of Heemskerk and Bergen along the southern North Sea coast.
588 Bakker et al.
Journal of Coastal Research, Vol. 28, No. 3, 2012

taken place, resulting in narrowing and steepening of the
foredune (Figure 2) and, thus, in landward exceedance of the
local Reference Coast Line. Because no economically valuable
built structures or infrastructure are present near the coastline
at this site and because the total dune area is wide and high
enough to ensure safety, this coastline recession has not been
considered a problem to date. During and immediately after
each storm surge event, erosion is taking place in the form of
bluff formation and slumping, exposing older eolian and storm
surge deposits that date from the 17th and 18th century
(Cunningham et al., 2011; Van Heteren et al., 2008).
The coastline recession near Heemskerk aan Zee and the
formation of large blowouts in the foredune are a consequence
of the nonnourishment policy at this beach section and of the
practice of dynamic preservation. It opens up the dune area to
sand being blown inland from the present-day beach and from
the exposed foredune (Figure 2).
Site 2. Heavily Nourished Beach (Bergen aan Zee)
The coastal resort of Bergen aan Zee (see Figure 1 for
location) experienced strong and prolonged coastal erosion in
the past. Twentieth century aerial photographs of Bergen
typically show a distinct escarpment along the foredune, most
pronounced after the impact of storm surges (Figure 3). The
historical development of the coastline near Bergen is best
demonstrated by the reconstructions published by Schoorl
(1990) showing the retrogradation of the coastline at Egmond
aan Zee, a village about 5 km south of Bergen aan Zee.
The storm surges of early 1990 destroyed part of the Bergen
aan Zee boulevard (Figure 3). Sand nourishments were applied
shortly after these erosional events. They include a large
embankment (dune face nourishment). Additional nourish-
ments were put into place in 1992, 1995, 1997, 1999, 2000, and
2005 (see Table 1 for details). The nourishments before 2000
were carried out solely on the beach, whereas those of 2000 and
2005 were placed in part on the shoreface. Although the main
goal of the nourishments is maintenance of the position of the
coastline, they also result in a wider beach for the benefit of
recreational activities.
METHODOLOGY
This paper focuses on data from two main methodologies.
GPR data from transects perpendicular to the coast, starting at
the upper beach and extending into the area behind the frontal
dune, are compared with Jarkus profiles across the same
environments. The resulting dataset is analyzed to understand
Figure 2. Foredune near Heemskerk aan Zee (view to the north on November 22, 2007). In the absence of nourishments, erosion has caused a steep,
slumping foredune front that is subject to wind erosion and wave attack during water levels above 2 m +MSL. The back-dune drop has become oversteepened
because of sand entrapment in the marram grass tussocks.
Recent Coastal Dune Development 589
Journal of Coastal Research, Vol. 28, No. 3, 2012

the role of actual processes in nourished beach-foredune
environments.
Ground-penetrating radar has proven to be a significant
technique in coastal studies, as demonstrated in many papers
(e.g., Jol, Smith, and Meyers, 1996; Van Heteren et al., 1998).
In this study, GPR data were collected using PulseEkko PRO
equipment (Sensors & Software Inc.), using unshielded 100-
and 200-MHz antennae and 250-MHz shielded antennae. The
acquisition settings are listed in Table 2.
The velocity of the radar signal in the sediment, needed to
convert the measurements (conducted in two-way travel time)
to depth, was established in various ways. Velocity information
was obtained directly by analyzing the shape of diffraction
hyperbolae. This information was supplemented by data from
indirect comparisons of reflection travel time and reflector
(reflecting feature) depth. The depth to prominent reflecting
features (lithological units and the groundwater table) was
determined by hand augering. Common-midpoint surveys
were not conducted. The unsaturated zone was marked by
signal velocities of 0.11–0.12 m/ns. Below the groundwater
table, the velocity typically dropped to 0.07–0.08 m/ns.
Penetration depth was generally on the order of 12–15 m for
the unshielded 100-MHz profiles, 7–8 m for the unshielded 200-
MHz profiles, and 6–7 m for the shielded 250-MHz profiles. In
very steep terrain, the penetration depth was reduced. In the
processing of radar data, topographic correction is needed to
assess the geometry and depth of subsurface units. Position
and elevation data were gathered by a real-time kinematic
global positioning system (RTK-GPS) with centimeter accura-
cy. Additional processing steps included dewowing, horizontal
and vertical filtering, and the application of an automatic gain
control to better view deeper reflections.
Figure 3. Oblique aerial photo of Bergen aan Zee looking north, taken shortly after the storm surges of 1990 (source: photo archive Rijkswaterstaat). Part of
the boulevard was destroyed. At the beach, in front of the boulevard, Roman-age peat beds were exposed (dark patches). The positions of images and cross-
sections shown in Figures 6–8 are indicated; Jarkus transect 32.750 is represented by the line labeled Figure 8.
590 Bakker et al.
Journal of Coastal Research, Vol. 28, No. 3, 2012

After processing, the GPR images were interpreted on the
basis of radar facies identified on the profiles, following the
concept of Van Heteren et al. (1998). In this concept, radar
facies are defined as spatial units within GPR profiles in
which the reflection configuration is uniform. The lithological
characteristics of the radar facies were verified by hand
augering and are listed in Table 3, which includes a short
description of their appearance, indications of their position
and an environmental interpretation.
The second research methodology involves analysis of Jarkus
coastal profiles through time and comparison of the observed
changes with the sedimentary architecture visible on GPR
images. After this comparison, the observations are linked to
processes—driven largely by meteorological conditions—that
are known to have an effect on sand-nourished beach-foredune
environments.
RESULTS
Site 1. Nonnourished Beach (Heemskerk aan Zee)GPR Observations
A steep dune scarp, the result of a significant storm surge in
November 2007 that created a local water level of 3.13 m +MSL,
provided a (laterally discontinuous) exposure of older beach
and eolian sediments (Cunningham et al., 2011; Van Heteren
et al., 2008). Over a length of about 1 km, relatively coarse-
grained, shell-bearing paleostorm surge deposits were exposed
at various elevations, intercalated with wind-blown sand. At
beach pole 49.500 km (52u309570 N, 4u359400 E) near Heems-
kerk aan Zee, the foredune scarp was partly cut into a large
blowout in the frontal dune, facilitating access for GPR
surveying on top of the exposed sequence. This enabled direct
comparison between the GPR images and exposed strata. The
exposures were used to ground-truth the corresponding GPR
images, linking subsurface reflections and reflection configu-
rations (facies) with exposed boundaries and strata. This
information supported the interpretation of GPR transects
perpendicular to the shoreline. GPR profiles measured per-
pendicular to the escarpment start at the scarp and extend
across the steep foredune, to a maximum elevation of 18.5 m
+MSL, and landward down into the adjacent blowouts with
lowest points around 3 m +MSL. The seaward side of the
foredune is dominated by bare sand and was temporarily
oversteepened as a result of the scarp formation. The vegetated
lee side of the foredune is particularly steep, with angles up to
37u (Figure 2). The steep slope reflects strong fixation by
European marram grass (Ammophila arenaria).
Inclined and listric (spoon-shaped) reflections occur in the
higher parts of the foredune (Figure 4, right-hand part). Radar
facies at the lee sides are dominated by subparallel, inclined
reflection sets (facies FDL, Table 3, Figure 4 in yellow) dipping
landward. Locally, diffractions are visible. High-amplitude,
continuous and subparallel reflection sets (facies SB, Table 3,
Figure 4) are indicated in red. Below this unit a continuous
subhorizontal reflection at ,1.5 m +MSL (facies WT, Table 3,
Figure 4 in blue) is present.
GPR Interpretation
The inclined and listric reflections in the higher parts of the
profile are attributed to eolian bounding surfaces within the
foredune (facies FDC). Unit FDL is interpreted as an eolian
deposit that formed in the wind shadow of the migrating
foredune, deposited at the angle of repose. Local diffractions
can be caused by debris that washed up on the shore and was
transported farther inland by storm winds. The scarp exposure
revealed a link between unit SB and convoluted shell-bearing
beds deposited in storm surge conditions (cf. Cunningham
Table 1. Overview of sand nourishments at Bergen aan Zee (source: Rijkswaterstaat, Waterdienst). Volumes are given both per kilometer (as an indicator of
nourished sand in the kilometer bordering the study site) and per nourishment, as a typical nourishment extends along the coast for several kilometers. The
maximum elevations (top surface) of embankments are given; the elevations of the beach nourishments are unknown. No nourishments were carried out in
Bergen before 1990. Beach nourishment 3 (June 1994) was placed only along the southern part of Bergen aan Zee. Dates of Jarkus profiling refer to the onshore
part of the monitoring.
Number Type Volume (m3) Volume (m3/km) Elevation (m +MSL) Date of Placement
Date of Jarkus Profiling in
Year of Placement
1a Beach 386,000 257,000 May–Jun 1990 Apr 14
1b Embankment 60,000 40,000 6.00 May–Jun 1990 Apr 14
2 Beach + embankment 1,473,000 115,000 3.50 May–Nov 1992 Apr 25
3 Beach 101,000 168,000 Jun 1994 Apr 25
4 Beach 306,000 306,000 May 1995 Mar 30
5 Beach 352,000 144,000 Jun 1997 May 22
6 Beach 206,000 165,000 Apr–May 1999 Apr 17
7a Beach 225,000 450,000 Jun 2000 Nov 4
7b Shoreface 994,000 497,000 — Apr–Aug 2000 Nov 4
8a Beach + embankment 300,000 200,000 3.75 Apr 2005 Apr 24
8b Shoreface 1,500,000 320,000 — Aug–Sep 2005 Apr 24
Table 2. Overview of GPR settings applied.
Frequency Antennae Spacing Pulser Voltage Step Size Stacks Time Window
100 MHz 1.0 m 400 V 20 cm 16 300
200 MHz 0.5 m 400 V 10 cm 16 480
250 MHz 0.4 m 165 V 5 cm 16 350
Recent Coastal Dune Development 591
Journal of Coastal Research, Vol. 28, No. 3, 2012
et al., 2011). Hand augering at the landward dune foot confirmed
the lateral, landward continuation of this unit. Additional GPR
surveying showed that this unit extends more than 750 m
inland. Reflection WT is interpreted as the groundwater table.
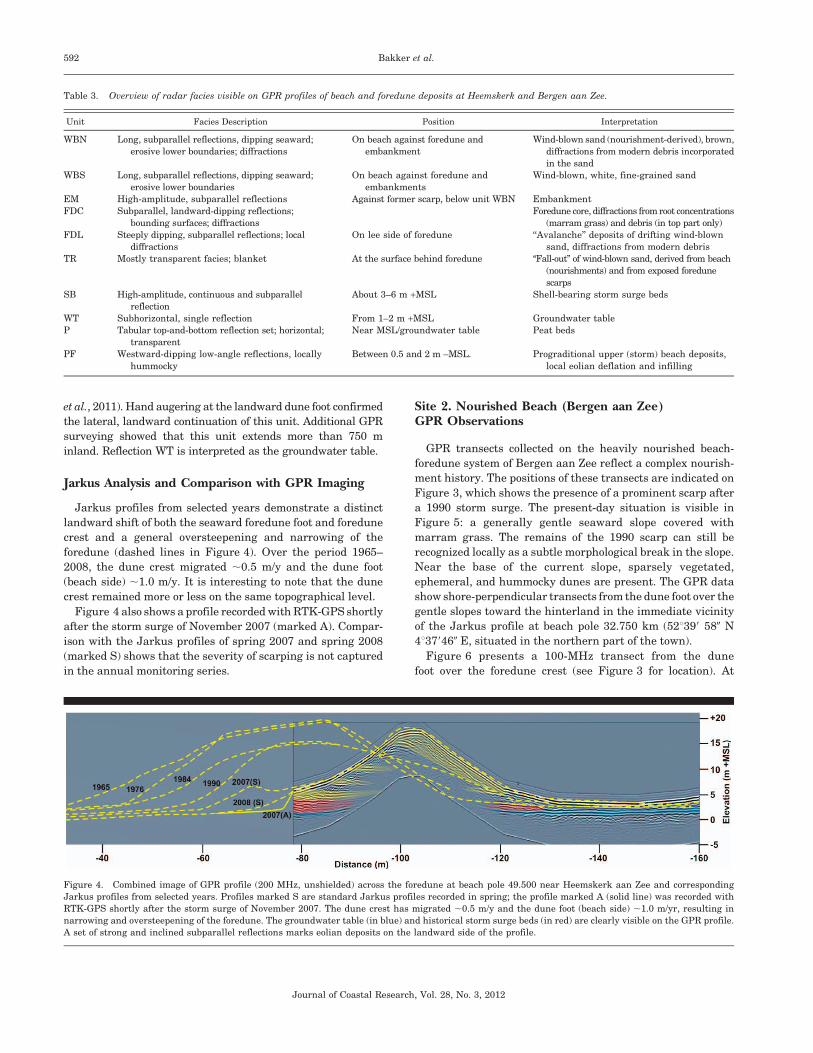
Jarkus Analysis and Comparison with GPR Imaging
Jarkus profiles from selected years demonstrate a distinct
landward shift of both the seaward foredune foot and foredune
crest and a general oversteepening and narrowing of the
foredune (dashed lines in Figure 4). Over the period 1965–
2008, the dune crest migrated ,0.5 m/y and the dune foot
(beach side) ,1.0 m/y. It is interesting to note that the dune
crest remained more or less on the same topographical level.
Figure 4 also shows a profile recorded with RTK-GPS shortly
after the storm surge of November 2007 (marked A). Compar-
ison with the Jarkus profiles of spring 2007 and spring 2008
(marked S) shows that the severity of scarping is not captured
in the annual monitoring series.
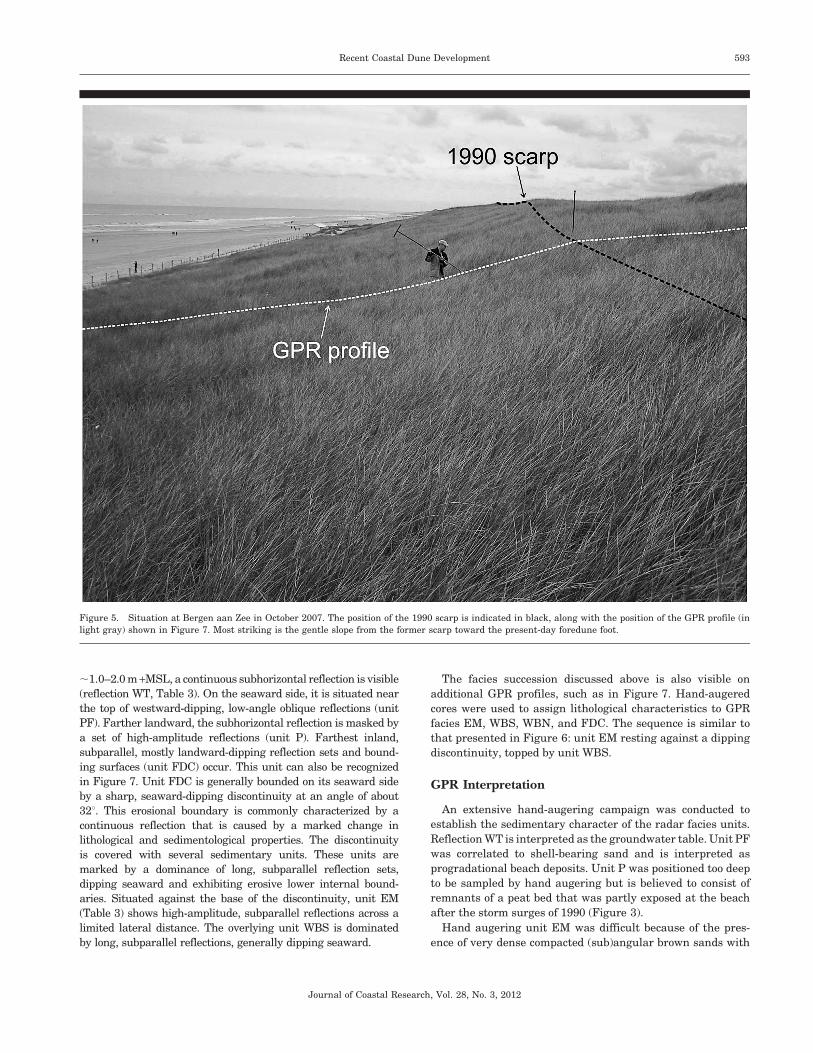
Site 2. Nourished Beach (Bergen aan Zee)GPR Observations
GPR transects collected on the heavily nourished beach-
foredune system of Bergen aan Zee reflect a complex nourish-
ment history. The positions of these transects are indicated on
Figure 3, which shows the presence of a prominent scarp after
a 1990 storm surge. The present-day situation is visible in
Figure 5: a generally gentle seaward slope covered with
marram grass. The remains of the 1990 scarp can still be
recognized locally as a subtle morphological break in the slope.
Near the base of the current slope, sparsely vegetated,
ephemeral, and hummocky dunes are present. The GPR data
show shore-perpendicular transects from the dune foot over the
gentle slopes toward the hinterland in the immediate vicinity
of the Jarkus profile at beach pole 32.750 km (52u399 580 N
4u379460 E, situated in the northern part of the town).
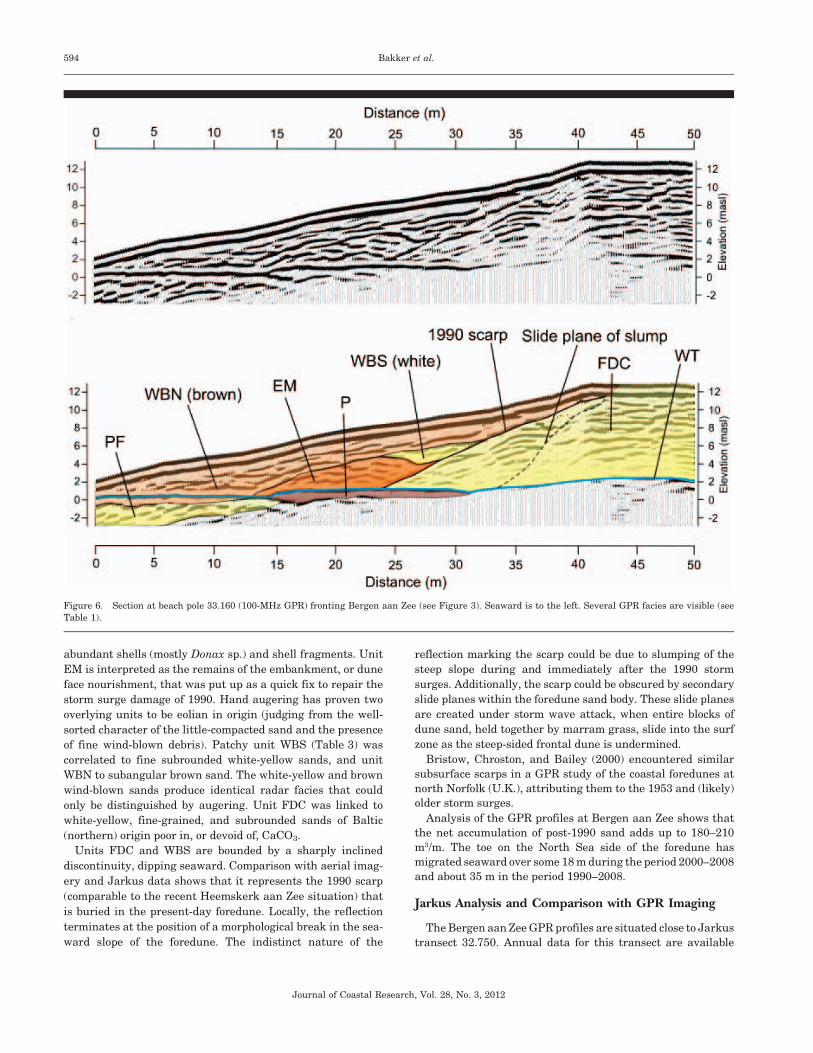
Figure 6 presents a 100-MHz transect from the dune
foot over the foredune crest (see Figure 3 for location). At
Table 3. Overview of radar facies visible on GPR profiles of beach and foredune deposits at Heemskerk and Bergen aan Zee.
Unit Facies Description Position Interpretation
WBN Long, subparallel reflections, dipping seaward;
erosive lower boundaries; diffractions
On beach against foredune and
embankment
Wind-blown sand (nourishment-derived), brown,
diffractions from modern debris incorporated
in the sand
WBS Long, subparallel reflections, dipping seaward;
erosive lower boundaries
On beach against foredune and
embankments
Wind-blown, white, fine-grained sand
EM High-amplitude, subparallel reflections Against former scarp, below unit WBN Embankment
FDC Subparallel, landward-dipping reflections;
bounding surfaces; diffractions
Foredune core, diffractions from root concentrations
(marram grass) and debris (in top part only)
FDL Steeply dipping, subparallel reflections; local
diffractions
On lee side of foredune ‘‘Avalanche’’ deposits of drifting wind-blown
sand, diffractions from modern debris
TR Mostly transparent facies; blanket At the surface behind foredune ‘‘Fall-out’’ of wind-blown sand, derived from beach
(nourishments) and from exposed foredune
scarps
SB High-amplitude, continuous and subparallel
reflection
About 3–6 m +MSL Shell-bearing storm surge beds
WT Subhorizontal, single reflection From 1–2 m +MSL Groundwater table
P Tabular top-and-bottom reflection set; horizontal;
transparent
Near MSL/groundwater table Peat beds
PF Westward-dipping low-angle reflections, locally
hummocky
Between 0.5 and 2 m –MSL. Prograditional upper (storm) beach deposits,
local eolian deflation and infilling
Figure 4. Combined image of GPR profile (200 MHz, unshielded) across the foredune at beach pole 49.500 near Heemskerk aan Zee and corresponding
Jarkus profiles from selected years. Profiles marked S are standard Jarkus profiles recorded in spring; the profile marked A (solid line) was recorded with
RTK-GPS shortly after the storm surge of November 2007. The dune crest has migrated ,0.5 m/y and the dune foot (beach side) ,1.0 m/yr, resulting in
narrowing and oversteepening of the foredune. The groundwater table (in blue) and historical storm surge beds (in red) are clearly visible on the GPR profile.
A set of strong and inclined subparallel reflections marks eolian deposits on the landward side of the profile.
592 Bakker et al.
Journal of Coastal Research, Vol. 28, No. 3, 2012
,1.0–2.0 m +MSL, a continuous subhorizontal reflection is visible
(reflection WT, Table 3). On the seaward side, it is situated near
the top of westward-dipping, low-angle oblique reflections (unit
PF). Farther landward, the subhorizontal reflection is masked by
a set of high-amplitude reflections (unit P). Farthest inland,
subparallel, mostly landward-dipping reflection sets and bound-
ing surfaces (unit FDC) occur. This unit can also be recognized
in Figure 7. Unit FDC is generally bounded on its seaward side
by a sharp, seaward-dipping discontinuity at an angle of about
32u. This erosional boundary is commonly characterized by a
continuous reflection that is caused by a marked change in
lithological and sedimentological properties. The discontinuity
is covered with several sedimentary units. These units are
marked by a dominance of long, subparallel reflection sets,
dipping seaward and exhibiting erosive lower internal bound-
aries. Situated against the base of the discontinuity, unit EM
(Table 3) shows high-amplitude, subparallel reflections across a
limited lateral distance. The overlying unit WBS is dominated
by long, subparallel reflections, generally dipping seaward.
The facies succession discussed above is also visible on
additional GPR profiles, such as in Figure 7. Hand-augered
cores were used to assign lithological characteristics to GPR
facies EM, WBS, WBN, and FDC. The sequence is similar to
that presented in Figure 6: unit EM resting against a dipping
discontinuity, topped by unit WBS.
GPR Interpretation
An extensive hand-augering campaign was conducted to
establish the sedimentary character of the radar facies units.
Reflection WT is interpreted as the groundwater table. Unit PF
was correlated to shell-bearing sand and is interpreted as
progradational beach deposits. Unit P was positioned too deep
to be sampled by hand augering but is believed to consist of
remnants of a peat bed that was partly exposed at the beach
after the storm surges of 1990 (Figure 3).
Hand augering unit EM was difficult because of the pres-
ence of very dense compacted (sub)angular brown sands with
Figure 5. Situation at Bergen aan Zee in October 2007. The position of the 1990 scarp is indicated in black, along with the position of the GPR profile (in
light gray) shown in Figure 7. Most striking is the gentle slope from the former scarp toward the present-day foredune foot.
Recent Coastal Dune Development 593
Journal of Coastal Research, Vol. 28, No. 3, 2012
abundant shells (mostly Donax sp.) and shell fragments. Unit
EM is interpreted as the remains of the embankment, or dune
face nourishment, that was put up as a quick fix to repair the
storm surge damage of 1990. Hand augering has proven two
overlying units to be eolian in origin (judging from the well-
sorted character of the little-compacted sand and the presence
of fine wind-blown debris). Patchy unit WBS (Table 3) was
correlated to fine subrounded white-yellow sands, and unit
WBN to subangular brown sand. The white-yellow and brown
wind-blown sands produce identical radar facies that could
only be distinguished by augering. Unit FDC was linked to
white-yellow, fine-grained, and subrounded sands of Baltic
(northern) origin poor in, or devoid of, CaCO3.
Units FDC and WBS are bounded by a sharply inclined
discontinuity, dipping seaward. Comparison with aerial imag-
ery and Jarkus data shows that it represents the 1990 scarp
(comparable to the recent Heemskerk aan Zee situation) that
is buried in the present-day foredune. Locally, the reflection
terminates at the position of a morphological break in the sea-
ward slope of the foredune. The indistinct nature of the
reflection marking the scarp could be due to slumping of the
steep slope during and immediately after the 1990 storm
surges. Additionally, the scarp could be obscured by secondary
slide planes within the foredune sand body. These slide planes
are created under storm wave attack, when entire blocks of
dune sand, held together by marram grass, slide into the surf
zone as the steep-sided frontal dune is undermined.
Bristow, Chroston, and Bailey (2000) encountered similar
subsurface scarps in a GPR study of the coastal foredunes at
north Norfolk (U.K.), attributing them to the 1953 and (likely)
older storm surges.
Analysis of the GPR profiles at Bergen aan Zee shows that
the net accumulation of post-1990 sand adds up to 180–210
m3/m. The toe on the North Sea side of the foredune has
migrated seaward over some 18 m during the period 2000–2008
and about 35 m in the period 1990–2008.
Jarkus Analysis and Comparison with GPR Imaging
The Bergen aan Zee GPR profiles are situated close to Jarkus
transect 32.750. Annual data for this transect are available
Figure 6. Section at beach pole 33.160 (100-MHz GPR) fronting Bergen aan Zee (see Figure 3). Seaward is to the left. Several GPR facies are visible (see
Table 1).
594 Bakker et al.
Journal of Coastal Research, Vol. 28, No. 3, 2012

over the period 1965–present. Most profiling of the dry part,
relevant in the present study, has been done in spring. Beach
nourishment will usually take place during the summer
months, shortly after the annual Jarkus profiling. In 2000,
however, measurements were taken on November 4 after
substantial shoreface and beach nourishment earlier in the
year (Table 2). For 2002, no Jarkus data are available; the
profile was established by interpolation between 2001 and
2003.
When all Jarkus profiles of a selected location are analyzed,
it is possible to visualize stacked sediment volumes (deposited
in different years) making up the sand wedge that has
accumulated in front of the 1990 scarp. Figure 8 shows that
this sand wedge is composed of sand volumes from only a
limited number of years. The 1990 profile represents the most
inland position of the dune front in the recorded period. All
subsequent profiles are positioned farther westward (i.e., at a
higher position), except the western part of the 1993 profile.
Even though the profiles in the period 1990–99 were positioned
seaward of the 1990 line, only sediment deposited in front of the
scarp in 1990–91 has survived one or more erosive events that
took place before the Jarkus profiling of 2000. The GPR
surveying has shown that it concerns unit EM, the 1990–91
embankments. In the period 2000–08, gradual accumulation
pushed the profile seaward. Sand nourishments were conduct-
ed in 2000 and 2005 only, but all other post-2000 years have
contributed to the sand wedge that fronts the 1990 scarp
(mostly GPR facies WBN).
Figure 9 shows the data of Figure 8 in numerical form
(between positions 290 and 2145 m). Sediments from 1992 and
the period 1994–99 have not been preserved at Jarkus transect
32.750. The largest volumes that make up the sand wedge
fronting the scarp originate from 1990–91 (the 1990 poststorm
embankment), 1992–93, and 2000 (the large nourishment). The
gradual accumulation after 2000 is a result of redistribution
by wind of nourishment sand located on the dry beach, as
evidenced by field observations, GPR reflection configurations,
and sedimentology of hand-augered material.
Analysis of year-to-year gross volumetric changes at Jarkus
transect 32.750 provides important additional information on
system morphodynamics (Figure 10). Indicated are net chang-
es for each year in the period 1990–2008, compared with the
previous year, of the higher part of the beach plus the foredune
front (between positions 290 and 2145 m in Figure 8). Erosion
occurred primarily in 1989–90, 1991–92, and 1998–99. Major
accumulation occurred not only in 1990 (the 1990 poststorm fix)
and 2000 (the largest nourishment to date), but also in 1996
(second-largest beach nourishment to date).
According to the Jarkus data at transect 32.750, there is an
overall net growth of 233 m3/m during the period 1990–2008.
The acquired GPR surveys complement this information,
showing accreted volumes varying from 180 to 210 m3/m over
a lateral distance of 530 m. From the GPR data, it can be con-
cluded that 21% of this volume originates from the 1990–91 em-
bankments, 11% from 1993, 36% from the 2000 nourishments,
and the remaining 32% from the period 2001–08. The addition
of sand has resulted in an average seaward shift of the foredune
toe of about 35 m.
Understanding Processes ReworkingBeach Nourishments
It is relatively easy to determine the geometry, composition
(origin), and age of nourishment-related sand deposits at the
upper parts of the beach and the adjacent, windward part of the
foredune at Bergen aan Zee. Linking these observations to
actual processes in the coastal environment is more difficult.
Along coasts marked by frontal dunes, wind is the most
important parameter affecting erosion, transport, and deposi-
tion. It has an indirect effect on subtidal and intertidal areas by
driving waves and currents, and a direct effect on intertidal
and supratidal areas through various eolian processes. In the
study area, shore-parallel sediment transport prevails during
periods of strong southerly to southwesterly winds. Vast
amounts of sand are set in motion under these conditions.
Inland sand transport occurs mostly when strong westerly
winds blow perpendicular to the coast. Numerous studies have
shown how these coastal processes act on beach sand (e.g., Van
der Wal [2004] for eolian sand transport and Pool [2009] and
Roelvink et al. [2009] for wave-induced erosion and associated
processes). Stuyfzand, Arens, and Oost (2010) additionally
demonstrated that the nourishment-derived sand has been
transported up to 300 m inland, affecting ecology. A complete
understanding of the effect of these processes on the coastal
profile requires analysis of meteorological and marine obser-
vations from the time period under consideration.
Water level data and marine observations are available for
two nearby sites (see Figure 1). The duration of water levels
above 2 m +MSL for each year in the period 1989–2008 at Petten
Zuid and IJmuiden Buitenhaven (Figure 11) is a relevant
parameter in understanding the direct impact of waves on the
coastal profiles of Heemskerk aan Zee and Bergen aan Zee.
Figure 7. Detail of a 250-MHz GPR section at beach pole 32.630 (see
Figure 3), with borehole data (A, B, and C) ground-truthing radar facies
SH, WBS, WBN, and FDC.
Recent Coastal Dune Development 595
Journal of Coastal Research, Vol. 28, No. 3, 2012

Although the exact water level at the dune foot is determined in
part by beach profile and breaker bar geometry, which affect
wave run-up, the 2 m +MSL water level, as measured at the two
monitoring stations, is a practical indicator for the threshold
that needs to be reached at both study sites before waves can
saturate and erode the dry beach and foredune.
Water levels above 2.0 m +MSL are reached only during
significant storm surges; the normal spring high-tide level is
around 1.05 +MSL (Petten) and 1.25 +MSL (IJmuiden). The
maximum levels reached during 1990–2008 at IJmuiden
Buitenhaven were 2.67 m +MSL in 1990 and 3.13 m +MSL
in 2007. The highest level recorded within the instrumental
monitoring time series is 3.85 m +MSL in 1953. Aside from the
surge-related water levels, wave run-up must be taken into
account. Under specific conditions, wave run-up can reach
elevations of more than 4–5 m +MSL (Pool, 2009).
Storm surge period 1 (Figure 11) occurred in 1990 and
caused the damage shown in Figure 3, creating the most
landward coastal profile to date. Storm surge 2, in 1993, eroded
the beach to even lower levels than in 1990, but the
embankments constructed in 1990 protected the dune foot
and stayed mostly intact. The 1999 storm surges eroded all
sediment accumulated between 1993 and 1999, including the
beach nourishments of 1994, 1995, and 1997. Storm surge 4, in
November 2007, resulted in the highest water levels since 1976
but had little effect on the profile at Bergen aan Zee.
The erosive effects of the storm surges, as indicated in the
volumetric balances of Figure 10, are more than offset by the
sand accumulation effects resulting from the nourishments. In
2000, the largest beach nourishment to date was carried out.
An even larger shoreface nourishment was put in place around
the same time. A 7-year period of marked meteorological
calmness followed; water levels above 2.0 m +MSL were very
rare and short-lived. Despite limited coastal erosion during this
time, additional beach (including embankment) and foreshore
nourishments were carried out in 2005. As a result of the period
devoid of significant storm surges, and reinforced by the 2005
nourishment that provided a new source of sediment, eolian
sand accumulation against the foredune has occurred ever
since the year 2000, without any significant intermittent
erosion.
Figure 12 shows wind frequencies for the period 1990–2008
at IJmuiden. Indicated are hours with wind speeds above 10
m/s, which are taken here as a measure of potential sand
transport by wind acting on a typical western Netherlands
beach. For natural and nourished sands with nonuniform grain
sizes, critical wind velocity is not a single value but a threshold
range (cf. Nickling, 1988). The threshold value of 10 m/s for
Bergen aan Zee gives an upper-end value of the critical range.
It is a function of grain size distribution of the local (nourished)
beach sediment (cf. Van der Wal, 1998). The frequencies in
Figure 12 are provided for winds from the 180u–270u quadrant
(shore-parallel sediment transport dominant), the 270u–360uquadrant (inland sediment transport dominant) and their sum
(180u–360u). Southeasterly to northeasterly winds are not
considered because these are rare and do not usually reach
10 m/s. Even when strong easterly winds occur, (seaward)
sediment transport is limited by vegetation on the landward
side of the foredune.
Figure 8. Analysis of Jarkus profiles for transect beach pole 32.750.
Preserved sand volumes originating from different years are shown in
different gray tones (situation 2008, derived from the Jarkus data). The
largest volumes originate from 1990 and 2000.
Figure 9. Post-1990 sand volumes present in 2008 and their year of origin at Jarkus transect 32.750. About 233 m3/m sand has accumulated since 1990.
596 Bakker et al.
Journal of Coastal Research, Vol. 28, No. 3, 2012

Figure 10. Sediment dynamics at Jarkus transect 32.750. Indicated are interannual volume changes. Profiles from successive years are compared with
calculated volumes of erosion or sedimentation.
Figure 11. Duration (in hours) of water levels above 2.00 m +MSL for each year in the period 1990–2008 in Petten Zuid (north of the study areas) and
IJmuiden Buitenhaven (south of the study areas). Average high-water level at these locations is 0.80 (1.05) and 0.95 (1.25) m +MSL, respectively (maximum
spring tide levels in brackets). Highest levels are usually reached at IJmuiden. Significant storm surges occurred in 1990, 1993, 1999, and 2007. The
maximum water levels observed during these extreme events are indicated above the bars in the graph (m +MSL).
Recent Coastal Dune Development 597
Journal of Coastal Research, Vol. 28, No. 3, 2012

Potential sand transport occurs during 2000 hours (i.e., more
than 80 full days) in an average year. Two exceptionally calm
years were 1996 and 2003. Years with high potential wind
transport do not necessarily coincide with storm surge years,
which might explain why no direct links with the observed
interannual profile changes could be established. It is clear,
however, that given sediment availability on the dry beach and
in nonvegetated foredune parts, redistribution of sand by wind
will be significant almost every year.
Storm Surge Field Observations
During the storm surge of November 2007, field observations
were conducted in both Heemskerk and Bergen aan Zee. Along
the Dutch coast, the northwesterly storm winds were not
extreme along the coast (8–9 Beaufort, average wind speed
18–24 m/s). Nevertheless, the highest water levels since 1976
were recorded. The height of the storm surge was determined
in the northern part of the North Sea, far offshore, where
hurricane-force winds associated with a slow-moving depres-
sion were active across an extremely long fetch. These con-
ditions generated large and high swells that moved into the
southern part of the North Sea before reaching the coastline
(maximum wave heights of 7–8 m near IJmuiden).
During high tide, the water easily reached the dune foot,
saturating the sand. Waves attacking the dune front resulted
in large-scale scarping. In most places, the dune foot was
eroded back between 2 and 3 m (typical value for Bergen aan
Zee) and 10 m (maximum value for Heemskerk). The amount of
erosion depended on the presence or absence of nourishment
sand, nearshore bathymetry, height and width of the beach,
and other local conditions (e.g., Brodie and McNinch, 2009;
Houser, Hapke, and Hamilton, 2008; Pool, 2009).
In Heemskerk, the scarped dune face formed fresh exposures
of foredune sand with intercalated shell-bearing, paleostorm
surge deposits. In Bergen aan Zee, water-lain nourishment sands
(including embankments) could be recognized in fresh exposures
as generally subhorizontally stratified, densely packed sedi-
ments. The water-lain nourishment sands are subangular and
poorly sorted. They are marked by silty admixtures, shell
concentrations, and local clay balls and also contain plastic, rope,
and other types of anthropogenic debris. The subangular nature
and dense packing of these sands make them more resistant
against erosion than the loosely packed, well-rounded eolian
sands. This increased resistance could explain part of the
observed difference in dune foot erosion between Heemskerk
and Bergen aan Zee. It reduces slumping, which takes place at
relatively steep angles. Eolian strata are more easily washed
away and slump at considerably gentler angles. Although an
additional explanation for the difference in dune foot erosion is
the high elevation of the prestorm beach at Bergen aan Zee
(Figure 8), it is likely that type and composition of nourished
sediment and the way it is introduced into the beach system are
important elements in the durability of beach nourishments.
Figure 12. Duration (in hours) of wind speeds .10 m/s for southwest and northwest circulations (and their sum) in the period 1990–2008 (wind directions
indicated). Data from IJmuiden. Most hours with potential sand transport occurred in 1990, 1998–2000, and 2008. Calm years were 1996 and 2003. Note that
windy years do not necessarily coincide with storm surge years (cf. Figure 11).
598 Bakker et al.
Journal of Coastal Research, Vol. 28, No. 3, 2012

DISCUSSION
Observations and analyses linking coastal profile changes to
natural processes and human interference on an annual to
decadal timescale are rare. Our study corroborates patterns
reported in the literature and supplements this knowledge by
providing quantified process-response relationships explaining
such patterns.
A regional study of foredune behavior in The Netherlands
was recently completed by Arens, Van Puijvelde, and Briere
(2010) using laser altimetric data and Jarkus profiling. To
quantify the effects of the nourishment policy on the dunes,
they analyzed total volumetric changes of the frontal dune
along the entire Dutch coast. They conclude that sand accretion
to the frontal dunes has shown an overall increase since the
establishment of the nourishment policy. Analysis of data from
the area just south of Bergen aan Zee (between beach poles
34.000 and 37.000, 1–4 km south of the GPR transects) shows a
trend break around 1997, from net erosion to net volumetric
growth. For beach pole 49.500 in the Heemskerk area, Arens,
Van Puijvelde, and Briere (2010) also observed a change
around 1997, from a net strong erosional state to a more or less
stable foredune volume. At this location, a landward shift of the
dune foot coincides with volumetric growth at the landward
side of the foredune, as confirmed and imaged by our data
(Figure 4). Arens, Van Puijvelde, and Briere (2010) see the
observed volumetric trend breaks as indirect proof of the
success of the nourishment policy. The overall pattern is
overprinted by local effects, such as sandbar migration,
blowout formation and—in general terms—a decrease of
storminess after 1990. Our study shows that the latter is true
for storm surges, but not for stronger winds in general
(Figure 12). As a result, sand loss through dune scarping has
been rare, whereas sand accumulation on the landward side of
the frontal dune has been significant.
The effects of dune scarps or bluffs, like the one at the
Heemskerk aan Zee, can be twofold. In a study on the influence
of coastal morphology on the transport of shoreface sediment in
the Canadian Beaufort Sea, Hequette et al. (2001) noted the
importance of downwelling, near-bottom currents. The numer-
ical model used in their study indicated that offshore sediment
transport is strongest where beaches are backed by bluffs.
Under these conditions, strong seaward-directed horizontal
pressure gradients drive powerful offshore bottom currents.
Low barriers that are easily breached experience lower set-up
and run-up during storm surges, and eroded sediment is
mainly transported obliquely offshore. Importantly, Hequette
et al. (2001) suggest that sediment eroded from bluff-backed
beaches might be transported offshore to depths that are
beyond the influence of fair-weather waves needed to return
the eroded material to the beach. Consequently, the presence of
coastal features that act as barriers to onshore-driven surface
water could result in a greater loss of sediment from the coastal
system than the absence of such features. In a study on the Gulf
coast of northwestern Florida, Houser, Hapke, and Hamilton
(2008) found the reverse to be true. They noted that in areas
with a relatively wide dune belt behind a foredune, most of the
sediment eroded from beach and dunes during storm surges is
deposited on the upper shoreface. This sediment is returned to
the beach during fair-weather conditions, when nearshore bars
weld to the coast. Areas with large foredunes and a wide dune
belt erode less rapidly than areas with smaller foredunes and
greater sediment fluxes through overwash. Houser, Hapke,
and Hamilton (2008) additionally suggested that the presence
or absence of transverse ridges in the nearshore zone affect the
storm surge level at the beach. In determining the response of a
stretch of coastline to the next extreme storm for coastal
management purposes, the differential influence of nearshore
bathymetry should be taken into account. In addition to beach
profiling and GPR imaging, field observations on sediment
transport on shoreface, nearshore zone, beach, and foredune
are needed, particularly during and after extreme events.
The overall trends at Bergen aan Zee (steady seaward
foredune migration) and Heemskerk (slow dune foot erosion),
as observed by Jarkus monitoring, are obscured by the effects of
major storm surges and by subsequent periods of relatively
rapid beach and foredune recovery. A limitation in separating
the erosive effects of storm surges from intervening recovery
periods and from the long-term trend is the low (annual)
temporal resolution of the Jarkus measurements. Pre- and
postsurge measurements will include not only storm surge
effects, but also the effects of all other coastal processes that
took place during the year between subsequent measurements,
including entrapment of sand by dune grass planted at the
dune foot. Earlier, Zhang, Douglas, and Leatherman (2002)
found a similar pattern as the ‘‘Heemskerk’’ scenario of slow,
long-term erosion in their analysis of shoreline data from the
U.S. East Coast. They noted that even after the most damaging
storms, such as the Ash Wednesday Storm of 1962, beaches
recover to positions matching their overall, century-scale
trend. Zhang, Douglas, and Leatherman (2002) concluded that
barrier beaches would not experience long-term erosion, even
when experiencing frequent major storms, if sediment supply
were sufficient to keep up with the effects of relative sea-level
rise. This conclusion is confirmed by our observations from
Bergen aan Zee, which show prenourishment erosion up to
1990 but slow nourishment-related foredune progradation
since then, interrupted, but not reversed, by brief erosive
events.
Although the two sites analyzed as part of this study
represent both a nourished and a nonnourished stretch of
coast, our results must be validated by observations from other
locations. Validation is possible where monitoring data of
nourished and natural foredunes within single coastal cells are
available. Where profile data are absent, GPR can be used
by itself to contrast the sedimentary record and behavior of
nourished and adjacent nonnourished beach-dune systems.
The resulting data need to be supplemented by meteorological
observations and by sediment transport measurements in the
entire coastal tract, particularly during extreme events.
Following this approach, morphological and ecological effects
of nourishment programs will become clearer, allowing fine-
tuning of nourishment strategy.
CONCLUSIONS
In revealing the internal architecture of foredunes, GPR
helps to establish the origin and preservation of stacked
Recent Coastal Dune Development 599
Journal of Coastal Research, Vol. 28, No. 3, 2012
sedimentary units that make up the foredunes. Thus, GPR
profiles are instrumental in explaining Jarkus profiling data in
terms of responsible coastal processes. The combination of GPR
and Jarkus can be used to optimize coastal management
policies.
At the Heemskerk aan Zee site, sand nourishment has never
been implemented. Jarkus profiling shows that during the period
1965–2008, the foredune foot migrated landward at an average
rate of 1.0 m/y. Scarp development has revealed bounding
surfaces in eolian strata resting on shell-bearing storm surge
beds. Both elements can be traced in a landward direction using
GPR surveying. Landward accretion of the foredune can also be
imaged. It is seen that the morphodynamics of the upper beach
and foredune are not captured by the lower temporal (i.e., yearly)
resolution of the standard profiling measurements.
At Bergen aan Zee, Jarkus and GPR data show a distinct,
nourishment-related net growth of the foredune volume over the
years, with high year-to-year variability. The dune foot has
migrated 35 m in a seaward direction over the period 1990–2008.
Integration of Jarkus and GPR data makes it possible to
establish the year of origin of sand volumes and to attribute
textural and compositional properties to these volumes. The data
show that 21% of the accreted volume originates from water-lain
embankments constructed in 1990, 11% from 1992–93 beach
sands, 36% from year 2000 nourishments (partly water-lain and
therefore in situ, mostly redistributed by wind), and the
remaining 32% from the period 2001–08 (entirely wind-redistrib-
uted nourishment sand). The net volume of accumulation ranges
between 180 and 233 m3/m over a shore-parallel distance of 530 m.
Almost all sand of the nourishments applied before 2000 has
been washed away. Analysis of meteorological and marine data
suggests that the 1999 storm surges are most likely responsible
for erosion of all post-1990 nourished material still present on
beach and foredune at that time. After 2000, structural
accumulation has taken place in the form of wind-blown
nourishment sand, not only in the nourishment years 2000 and
2005. This accumulation can be attributed to consistent, long-
term sediment supply from shoreface nourishments and to
favorable meteorological conditions.
Field observations during a significant storm surge in 2007
indicate that wind-blown nourishment sands are more prone to
wave erosion than water-lain nourishment sands. Type and
composition of the sand are very important and can be used not
only to predict the durability of nourished sediment volumes,
but also to assess ecological effects in the frontal dunes.
The analysis of process-response relationships governing the
behavior of the Dutch foredune system profits from the
combined power of Jarkus profiling and GPR surveying.
Whereas Jarkus profiling supplies volumetric data over long
time spans, GPR profiles visualize the net effects of profile
changes and reveal the contribution of natural processes and
specific nourishments to sand volume gained by nourished
coastal sections. Whereas the Jarkus profiling is restricted
to 250-m intervals and limited to measurements made each
spring, the GPR profiling can be carried out at any place and
time. Assessment of net variability along the coast at the
highest spatial and temporal resolution is essential when
understanding the behavior and preservation of nourished
sand volumes in light of meteorological conditions. Therefore,
combining a diversity of techniques and approaches, including
GIS based studies, Jarkus measurements, GPR, and meteoro-
logical reconstructions, in beach-nourishment evaluations
more often is recommended.
ACKNOWLEDGMENTS
Hoogheemraadschap Hollands Noorderkwartier and PWN
Water Supply Company North Holland gave us permission to
access the sites and provided logistical support; we especially
thank Menno van den Bos, Paul van der Linden, and Luc
Knijnsberg. Alastair Cunningham and Piet Kok provided
field assistance. Stijn van Puijvelde contributed to the
analysis of meteorological and marine data. Xavier Comas
and two anonymous reviewers are thanked for their critical
comments. This work was funded by Deltares projects Coastal
Maintenance (‘‘Kustlijnzorg’’) and Coastal Systems and is a
contribution to IGCP project 588 ‘‘Preparing for coastal
change: A detailed process-response framework for coastal
change at different timescales.’’
LITERATURE CITED
Arens, S.M., 2009. Effecten van suppleties op duinontwikkeling;geomorfologie. Rapportage fase 1 (Effects of Nourishments on DuneDevelopment, Geomorphology). Report Arens BSDO, RAP2009.2,68p. [in Dutch].
Arens, S.M.; Van Puijvelde, S.P., and Briere, C., 2010. Effecten vansuppleties op duinontwikkeling, geomorfologie. Rapportage fase 2(Effects of Nourishments on Dune Development, Geomorphology).Report Arens BSDO, RAP2010.3, 126p. [in Dutch].
Arens, S.M. and Wiersma, J., 1984. The Dutch foredunes: inventoryand classification. Journal of Coastal Research, 10(1), 189–202.
Bristow, C.S.; Chroston, P.N., and Bailey, S.D., 2000. The structureand development of foredunes on a locally prograding coast:insights from ground-penetrating radar surveys, Norfolk, UK.Sedimentology, 47, 923–944.
Brodie, K.L. and McNinch, J.E., 2009. Measuring surf-zone morpho-dynamics, beach volume change and runup during storms: newmethodology identifies beach cross-shore sediment flux metric. In:AGU Fall Meeting (San Francisco, California, American Geophys-ical Union), NH11A-1111.
Cunningham, A.C.; Bakker, M.A.J.; Wallinga, J.; Van Heteren, S.;Van der Valk, L.; Schaart, D.R., and Van der Spek, A.J.F., 2011.Extracting storm-surge data from coastal dunes for improvedassessment of flood risk. Geology, G32244, 1063–1066.
Hequette, A.; Desrosiers, M.; Hill, P.R., and Forbes, D.L., 2001. Theinfluence of coastal morphology on shoreface sediment transportunder storm-combined flows, Canadian Beaufort Sea. Journal ofCoastal Research, 17, 507–516.
Houser, C.; Hapke, C., and Hamilton, S., 2008. Controls on coastaldune morphology, shoreline erosion and barrier island response toextreme storms. Geomorphology, 100(3–4), 223–240.
Jol, H.M.; Smith, D.G., and Meyers, R.A., 1996. Digital groundpenetrating radar (GPR): a new geophysical tool for coastal barrierresearch (Examples from the Atlantic, Gulf and Pacific Coasts,U.S.A.). Journal of Coastal Research, 12, 960–968.
Nickling, W.G., 1988. The initiation of particle movement by wind.Sedimentology, 35, 499–511.
Nourtec, 1997. Innovative Nourishment Techniques Evaluation,Final Report. The Hague, The Netherlands,: Coord. Rijkswater-staat, National Institute for Coastal and Marine Management/RIKZ Report MAS2-CT93-0049. 105p.
Pool, A.D., 2009. Modelling the 1775 Storm Surge Deposits at theHeemskerk Dunes. Delft, The Netherlands: Technical UniversityDelft/Deltares, Master’s thesis, 92p.
Rijkswaterstaat, 1990. A new coastal defence policy for the Nether-lands. The Hague: Ministry of Transport en Public Works, 103p.
600 Bakker et al.
Journal of Coastal Research, Vol. 28, No. 3, 2012

Roelvink, D.; Reniers, A.; van Dongeren, A.; Van Thiel de Vries, J.; McCall,R., and Lescinski, J., 2009. Modelling storm impacts on beaches, dunesand barrier islands. Coastal Engineering, 56, 1133–1152.
Schoorl, H., 1990. Kust en Kaart (Coast and Map; in Dutch). Schoorl,the Netherlands: Pirola, 160p.
Stuyfzand, P.J.; Arens, S.M., and Oost, A.P., 2010. Geochemischeeffecten van zandsuppleties langs Hollands kust (GeochemicalEffects of Sand Nourishments Along the Coast of Holland).Water Research Institute, Report KWR 2010.048, 71p. [inDutch].
Van der Wal, D., 1998. The impact of the grain-size distribution ofnourishment sand on eolian sand transport. Journal of CoastalResearch, 14(2), 620–631.
Van der Wal, D., 2004. Beach-dune interactions in nourishmentareas along the Dutch coast. Journal of Coastal Research, 20, 317–325.
Van Heteren, S.; Bakker, M.A.J.; Oost, A.P.; Van der Spek, A.J.F.,and Van der Valk, L., 2008. Sedimentary signature of a storm surgeunit in the western Netherlands coastal dunes. GeophysicalResearch Abstracts, 10, EGU2008-A-10264.
Van Heteren, S.; FitzGerald, D.M.; McKinlay, P.A., and Buynevich,I.V., 1998. Radar facies of paraglacial barrier systems: coastal NewEngland, USA. Sedimentology, 45, 181–200.
Zhang, K.; Douglas, B., and Leatherman, S., 2002. Do storms causelong-term beach erosion along the U.S. East Barrier Coast? Journalof Geology, 110(4), 493–502.
Recent Coastal Dune Development 601
Journal of Coastal Research, Vol. 28, No. 3, 2012
Related Documents