Recent climate warming forces contrasting growth responses of white spruce at treeline in Alaska through temperature thresholds MARTIN WILMKING *, GLENN P. JUDAY * , VALERIE A. BARBER * and H A R O L D S . J . Z A L D w *Forest Science Department, University of Alaska Fairbanks, Fairbanks, AK 99775, USA, wPacific Northwest Research Station, USDA Forest Service, 3200 SW Jefferson Way Corvallis, OR 97333, USA Abstract Northern and high-latitude alpine treelines are generally thought to be limited by available warmth. Most studies of tree-growth–climate interaction at treeline as well as climate reconstructions using dendrochronology report positive growth response of treeline trees to warmer temperatures. However, population-wide responses of treeline trees to climate remain largely unexamined. We systematically sampled 1558 white spruce at 13 treeline sites in the Brooks Range and Alaska Range. Our findings of both positive and negative growth responses to climate warming at treeline challenge the widespread assumption that arctic treeline trees grow better with warming climate. High mean temperatures in July decreased the growth of 40% of white spruce at treeline areas in Alaska, whereas warm springs enhance growth of additional 36% of trees and 24% show no significant correlation with climate. Even though these opposing growth responses are present in all sampled sites, their relative proportion varies between sites and there is no overall clear relationship between growth response and landscape position within a site. Growth increases and decreases appear in our sample above specific temperature index values (temperature thresholds), which occurred more frequently in the late 20th century. Contrary to previous findings, temperature explained more variability in radial growth after 1950. Without accounting for these opposite responses and temperature thresholds, climate reconstructions based on ring width will miscalibrate past climate, and biogeochemical and dynamic vegetation models will overestimate carbon uptake and treeline advance under future warming scenarios. Keywords: Alaska, carbon uptake, climate change, cluster analysis, dendrochronology, threshold effects, treeline, white spruce Received 31 December 2003; revised version 7 April 2004 and accepted 27 April 2004 Introduction High-latitude forests provide important feedbacks to global climate: on the one hand, they contain 49% of the carbon stored in forested ecosystems (Dixon et al., 1994). Increases in growth, as well as forest expansion (treeline advance) due to warming could enhance CO 2 uptake (Koerner, 2000), therefore acting as a negative feedback to warming. On the other hand, however, replacement of tundra by evergreen conifers (treeline advance) decreases albedo, which acts as positive feedback and enhances warming (Bonan et al., 1992; Foley et al., 1994, 2000). Treelines as the edge of the boreal forest have been investigated for a long time, since trees at treeline are believed to be free from tree-to-tree competition and record a pure climatic signal (Schweingruber et al., 1992). Dendrochronological studies and climate recon- structions of the boreal forest focus on the positive growth response of treeline trees to warmth (Garfinkel & Brubaker, 1980; D’Arrigo & Jacoby, 1993; Briffa et al., 1998), from limited samples on sensitive sites (Pilcher et al., 1990). Their results confirms the intuitive under- standing that treeline trees in these cold environments are temperature limited, warming would lead to more growth, better survival of individuals and ultimately expansion of trees into tundra. Likewise, cooling of temperature would lead to recession of treelines (Kull- man, 1996). Using these parameters, vegetation models Correspondence: Martin Wilmking, tel. 1 1 907 458 0709, fax 1 1 907 474 6184, e-mail: [email protected] Global Change Biology (2004) 10, 1724–1736, doi: 10.1111/j.1365-2486.2004.00826.x 1724 r 2004 Blackwell Publishing Ltd

Welcome message from author
This document is posted to help you gain knowledge. Please leave a comment to let me know what you think about it! Share it to your friends and learn new things together.
Transcript
Recent climate warming forces contrasting growthresponses of white spruce at treeline in Alaska throughtemperature thresholds
MART I N W I LMK ING *, G L ENN P. J U DAY *, VA L E R I E A . BA R B E R * and HAROLD S . J . Z A LD w*Forest Science Department, University of Alaska Fairbanks, Fairbanks, AK 99775, USA, wPacific Northwest Research Station,
USDA Forest Service, 3200 SW Jefferson Way Corvallis, OR 97333, USA
Abstract
Northern and high-latitude alpine treelines are generally thought to be limited by
available warmth. Most studies of tree-growth–climate interaction at treeline as well as
climate reconstructions using dendrochronology report positive growth response of
treeline trees to warmer temperatures. However, population-wide responses of treeline
trees to climate remain largely unexamined. We systematically sampled 1558 white
spruce at 13 treeline sites in the Brooks Range and Alaska Range. Our findings of both
positive and negative growth responses to climate warming at treeline challenge the
widespread assumption that arctic treeline trees grow better with warming climate. High
mean temperatures in July decreased the growth of 40% of white spruce at treeline areas
in Alaska, whereas warm springs enhance growth of additional 36% of trees and 24%
show no significant correlation with climate. Even though these opposing growth
responses are present in all sampled sites, their relative proportion varies between sites
and there is no overall clear relationship between growth response and landscape
position within a site. Growth increases and decreases appear in our sample above
specific temperature index values (temperature thresholds), which occurred more
frequently in the late 20th century. Contrary to previous findings, temperature explained
more variability in radial growth after 1950. Without accounting for these opposite
responses and temperature thresholds, climate reconstructions based on ring width will
miscalibrate past climate, and biogeochemical and dynamic vegetation models will
overestimate carbon uptake and treeline advance under future warming scenarios.
Keywords: Alaska, carbon uptake, climate change, cluster analysis, dendrochronology, threshold
effects, treeline, white spruce
Received 31 December 2003; revised version 7 April 2004 and accepted 27 April 2004
Introduction
High-latitude forests provide important feedbacks to
global climate: on the one hand, they contain 49% of the
carbon stored in forested ecosystems (Dixon et al.,
1994). Increases in growth, as well as forest expansion
(treeline advance) due to warming could enhance CO2
uptake (Koerner, 2000), therefore acting as a negative
feedback to warming. On the other hand, however,
replacement of tundra by evergreen conifers (treeline
advance) decreases albedo, which acts as positive
feedback and enhances warming (Bonan et al., 1992;
Foley et al., 1994, 2000).
Treelines as the edge of the boreal forest have been
investigated for a long time, since trees at treeline are
believed to be free from tree-to-tree competition and
record a pure climatic signal (Schweingruber et al.,
1992). Dendrochronological studies and climate recon-
structions of the boreal forest focus on the positive
growth response of treeline trees to warmth (Garfinkel
& Brubaker, 1980; D’Arrigo & Jacoby, 1993; Briffa et al.,
1998), from limited samples on sensitive sites (Pilcher et
al., 1990). Their results confirms the intuitive under-
standing that treeline trees in these cold environments
are temperature limited, warming would lead to more
growth, better survival of individuals and ultimately
expansion of trees into tundra. Likewise, cooling of
temperature would lead to recession of treelines (Kull-
man, 1996). Using these parameters, vegetation modelsCorrespondence: Martin Wilmking, tel. 1 1 907 458 0709,
fax 1 1 907 474 6184, e-mail: [email protected]
Global Change Biology (2004) 10, 1724–1736, doi: 10.1111/j.1365-2486.2004.00826.x
1724 r 2004 Blackwell Publishing Ltd
produce upward and northward expansion of boreal
forest under warming climate (Chapin et al., 2000; Kittel
et al., 2000; Rupp et al., 2001), supported by some site
studies (Suarez et al., 1999; Luckman & Kavanagh, 2000;
Kullman, 2001).
However, positive sensitivity of northern high-lati-
tude trees to temperature has recently declined (Briffa
et al., 1998), and temperature-induced drought stress
can limit white spruce radial growth within the boreal
forest (Barber et al., 2000) and of some individual trees
at treeline (Lloyd & Fastie, 2002). In other words,
annual radial growth in individual trees is negatively
correlated to temperature. However, population-wide
responses of treeline trees to climate in Alaska remain
largely unexamined.
Our study identifies opposing population-wide
growth responses (enhanced and decreased growth
with warming climate) in two mountain ranges in
Alaska, quantifies the relative abundance of each
growth response at three scales (regional, by site and
by site type) and provides a plausible mechanism,
through which climate is forcing these opposing
growth responses.
Materials and methods
We collected tree ring samples from 1558 white spruce
(Picea glauca (Moench (Voss)) in the Brooks Range and
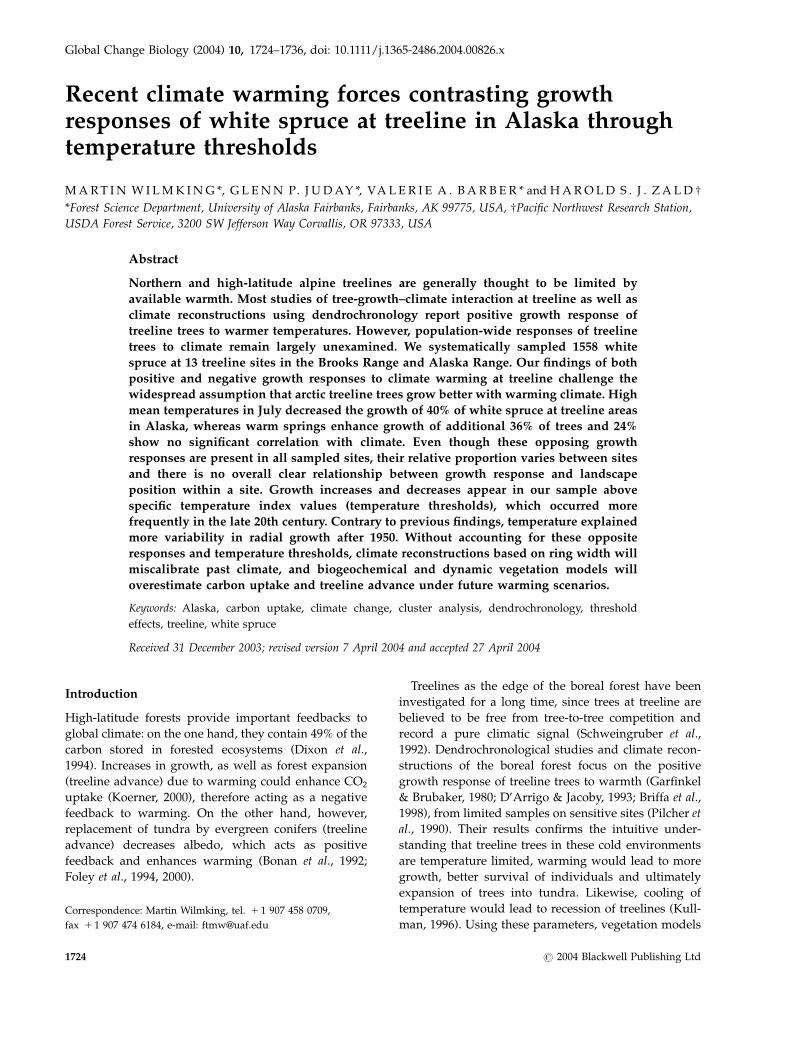
Alaska Range of Alaska (Fig. 1). Where possible (eight
out of 13 sites), we sampled three site types: floodplain,
high-density upland stands (north- and south-facing
forest) and low-density upland stands (north- and
south-facing tree limit). Low-density upland stands
are usually higher in absolute elevation on a given
slope than high-density upland stands; however, we
made an effort to sample high-density trees across their
elevational distribution (i.e. some stands were just 30–
50m lower in elevation than the low-density stands on
that slope). Low-density stand were assumed to be free
of tree-to-tree competition (except tree islands), high-
density stands could include tree-to-tree competition.
We collected nearly exclusively penetrating cores, so
that two radial measurements were available for each
year. Ring width was measured (Velmex sliding stage,
resolution: 0.001mm) and both annual ring width
measurements were then averaged. This analysis is
based on the 1155 trees older than 100 years. The 403
younger trees showed nearly identical results, but were
excluded to maintain stable sample size throughout the
common period of analysis. Tree growth was compared
with the Fairbanks record (1906–2000) of mean monthly
temperatures and total monthly precipitation. Fair-
banks is centrally located between the two mountain
ranges and is highly representative of temperature
trends in the boreal forest region of Alaska and has
therefore been frequently used to model treeline growth
in Brooks Range, Alaska Range and other mountain
ranges (Garfinkel & Brubaker, 1980; Jacoby & D’Arrigo,
1995; Barber et al., 2000; Lloyd & Fastie, 2002, 2003). In a
previous dendrochronological study (Barber et al.,
2000), the Fairbanks temperature record was found to
be strongly and consistently correlated with ring width
of 20 white spruce stands across central Alaska and
with d13C and maximum late-wood density at one and
three stands, respectively.
The Fairbanks record we used is a composite of
University Experiment Station (1906–1947) and Fair-
banks International Airport (1948–2000). During the
period of overlap between the two stations (1948–1996),
there was no significant difference in the summer mean
monthly temperatures. Fairbanks is the only climate
station in Interior Alaska with a record extending back
to the first decade of the 20th century. Other available
station records we evaluated included: Denali National
Park Headquarters (1923–2000), McGrath (1942–2000),
Fig. 1 Location of study sites in Brooks Range and Alaska Range
in Alaska. Shaded area is extent of boreal forest. All sites are at or
near treeline. Brooks Range sites: 1, BRKG (68.01N, 161.51W); 2,
BRHF (67.81N, 152.41W); 3, BRCL (67.71N, 150.51W); 4, BRNF
(67.91N, 150.51W); 5, BRNC (67.91N, 149.81W); 6, BRSJ (68.51N,
143.8vW); 7, BRFR (68.61N, 141.61W). Alaska Range sites:
8, ARCC (63.61N, 150.01W); 9, ARTL (63.41N, 149.21W); 10,
ARRC (63.71N, 149.01W); 11, ARSC (63.51N, 148.81W); 12,
ARBC (63.41N, 146.41W); 13, ARTK (63.31N, 143.31W). Loca-
tion of climate stations used in Fig. 2. BETT, Bettles; DNP,
Denali National Park; McG, McGrath and Fairbanks.
C ONTRA S T I NG GROWTH RE S PON S E S O F WH I T E S P RUC E 1725
r 2004 Blackwell Publishing Ltd, Global Change Biology, 10, 1724–1736
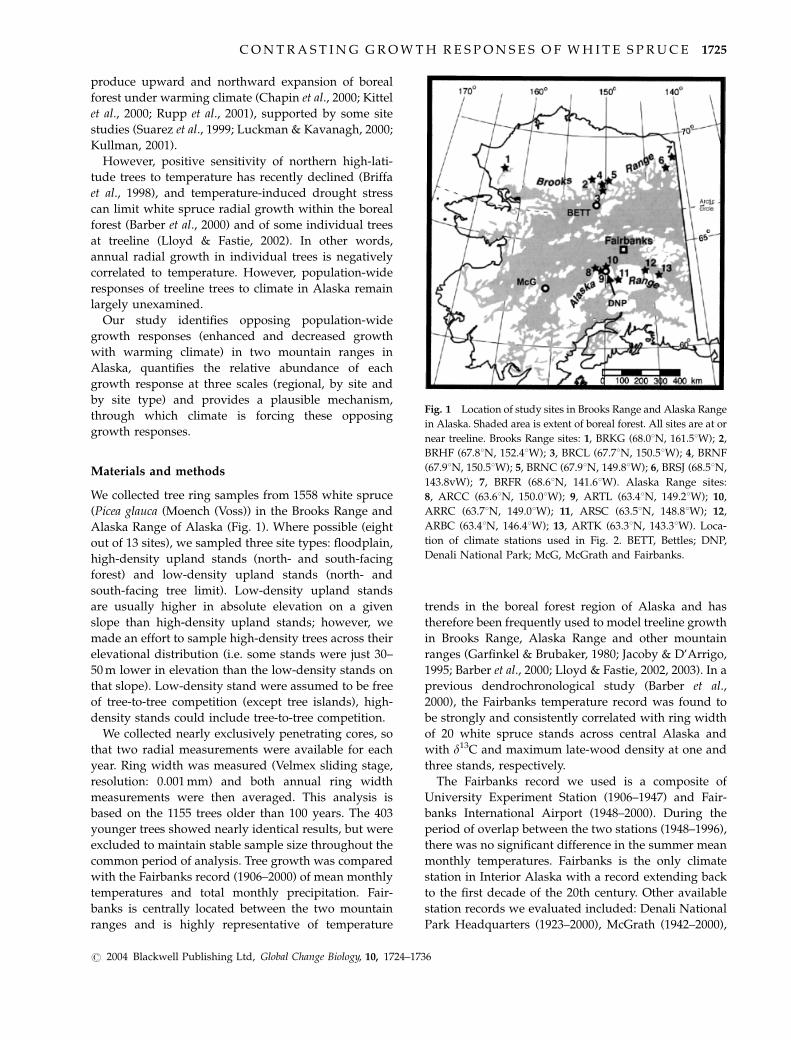
and Bettles (1949–2000). Most of these data sets were
affected by missing data, and relocation effects to a
greater degree than Fairbanks. The relationship of mean
March–August temperature at those four stations
revealed the same pattern of year-to-year variability
(Fig. 2).
Thus, both the station data themselves and the tree-
growth responses across Interior Alaska indicate that
Fairbanks climate data are indeed a valid indicator of
year-to-year variability in climate as it affects the
growth of white spruce.
Tree ring series were cross-dated on the basis of
prominent and well-known marker ring series. Accu-
racy of dating was checked using COFECHA runs for
each site. Dating errors were limited to 1 or 2 years and
corrected for subsequent analysis. Individual tree ring
series were detrended by ARSTAN (detrending re-
moves the age effect, Cook et al., 1992) using the first
detrending option (negative exponential or straight line
fit). We correlated each tree’s record of detrended
annual radial growth (1906–2000 overlapped with the
climatic record) with the 57 mean monthly tempera-
tures and precipitation preceding the end of ring
formation. Results from nondetrended tree ring series
exhibited similar results, suggesting that age did not
have a significant influence on the tree-growth–climate
relationship. The resulting matrix included about 8
million correlation scores for temperature alone.
To search for common pattern of correlation scores,
we used these matrices as input into a cluster analysis
(STATISTICA). Our objective was to simplify the task of
identifying significant correlation scores for each tree
(which is a usual procedure in dendroclimatology) as
well as search for overall population-wide response
types.
We used ‘joining’ (tree diagram, complete linkage) in
the cluster module and then refined the clusters using
the ‘k-means’ clustering procedure, where the program
calculates a user-specified number of clusters. We
increased the number of clusters in each step (starting
from two) to maximize the difference between clusters.
By visually inspecting the means of each clustering run,
we were able to stop the procedure as soon as the new
run did not produce new clustering pattern (signifi-
cantly different mean), but merely created a new cluster
emulating an existing pattern. We did not remove the
serial autocorrelation, because our goal was to establish
a relationship between growth and some combination
of months and not reconstruct or predict one parameter
(growth) with the other (mean temperature of the 1
month with highest correlation score).
Once we had identified the two dominant climate
signals (July and spring temperature indices, precipita-
tion was not significantly correlated), we calculated the
correlation score of each individual tree’s detrended
radial growth with these two climatic predictors. We
then grouped the trees according to the following
criteria: first, negative responders were defined by a
correlation score of ��0.25 (threshold of significance,
P5 0.01) of detrended growth with the July prior
temperatures after 1950. Positive responders were all
remaining trees with a correlation score �0.25 of
growth vs. the spring temperature index (after 1950).
To examine the consistency of the growth responses
throughout the last 200 years, we calculated the mean
raw ring width (decadal average) of trees belonging to
the two clusters that were significantly correlated with
temperature in both mountain ranges. Because the
number of trees contributing rings in each decade
varied (because of different dates of origin during the
19th century), we calculated the 95% confidence
interval in differences of the means of radial growth
by decade for the two clusters. To examine the
consistency of growth responses by site through time,
we identified the temperature factors that produced the
highest correlation scores for each site’s average of
radial growth index by responder type, both before and
after 1950. Selection of the highest correlation score was
based upon annual values. To provide additional
insights into the strength of the relationship, we used
a 5-year smoothing algorithm removing some of the
effects of short-term variability. We chose a 5-year
smoothing term, because there is a 8–9 and 16.7–18
years periodicity in both white spruce growth and
summer temperatures in Interior Alaska (Juday et al.,
2004), and therefore we decided to use a period that
would extend over at least half of the short cycle. A
smoothing term of approximately half of the cycle
length will enhance the expression of the medium-term
Fig. 2 Relationship of climate stations throughout Interior
Alaska. Year-to-year variability of averaged March–August
mean monthly temperatures (5 years smooth) is similar for four
stations in Interior Alaska. FAI, Fairbanks; BETT, Bettles; DNP,
Denali National Park; McG, McGrath. For location see Fig. 1.
1726 M . W I LMK ING et al.
r 2004 Blackwell Publishing Ltd, Global Change Biology, 10, 1724–1736
trends in the data, without dampening the cycles that
are present.
We then developed a regression of the two climatic
predictors vs. the mean of detrended radial growth of
the two significant groups of trees (negative and
positive responders). Piecewise linear regression in
STATISTICA was used to test, whether a single
regression was equally predictive across the entire
range of data. The program calculates two linear
regressions for a data array. The breakpoint or ‘thresh-
old’ of these regressions is chosen where the difference
in slope of the two models is maximized. We tested the
significance of these differences by comparing the slope
and P-values of the two resulting equations.
Results
Pattern of growth response to temperature
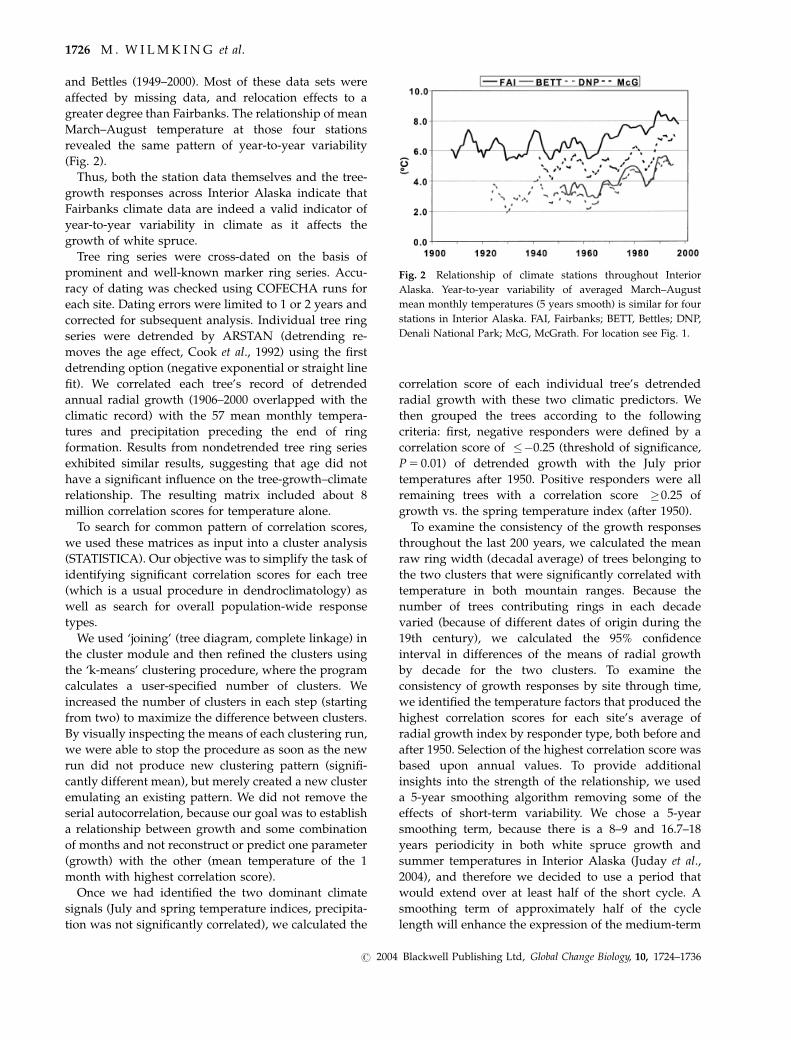
Based on the relationship between annual radial
growth and Fairbanks mean monthly temperature, the
initial clustering ‘tree’ diagram over the entire period
(1906–2000) of climate record revealed a major division
between trees with generally positive vs. negative
correlations with temperature. The ‘k-means’ clustering
procedure produced three distinctive clusters, revealing
three populations of (1) consistently negative, (2)
consistently positive and (3) nonsignificant correlation
of growth with temperatures (Fig. 3). It is particularly
noteworthy that this pattern repeated itself at each of
the 13 sites in both mountain ranges. More trees
belonged to the cluster defined by negative growth
responses to warm temperatures at these cold sites
(40.1%) than to the cluster with positive growth
responses (36.3%). While all 57 monthly correlations
define membership in a cluster, statistically significant
or near-significant scores are concentrated in only a few
specific months (Fig. 3). Serial autocorrelation leads to a
similar pattern of correlation each year for a period of
years prior to ring formation.
Recent findings identify a difference in tree-growth/
climate relationships at treeline between the periods
pre- and post-1950 (Briffa et al., 1998; Lloyd & Fastie,
2002). Even though this division is arbitrary, we
adopted it to (1) compare our results to other studies
and (2) obtain two time periods of about equal length in
Fig. 3 Cluster analysis of climate–tree correlation scores. Correlation scores of detrended annual radial growth with Fairbanks mean
monthly temperature over a 57-month period prior to the end of each yearly ring formation. The three lines depict the mean of the three
most distinctive clusters developed using ‘k-means’ clustering. Solid lines represent the mean correlation scores of all trees included in
the cluster with positive radial growth responses to monthly temperatures, dotted lines represent the cluster defined by negative
responses, and dashed line represents clusters defined by trees with no consistent growth response. Level of statistical significance
(P�0.01) indicated by horizontal dashed lines. Note intensification of growth response after 1950 and the maximization of correlation
scores in the July prior to ring formation for negative responders in both mountain ranges and in the spring (March and/or April) for the
positive-responding population. Because of a high degree of serial autocorrelation most explanatory power is concentrated in the
maximum correlation scores of the 2 years prior to ring formation.
C ONTRA S T I NG GROWTH RE S PON S E S O F WH I T E S P RUC E 1727
r 2004 Blackwell Publishing Ltd, Global Change Biology, 10, 1724–1736
our data set. Clustering runs from our sample restricted
to the pre- and post-1950 periods also show distinct
differences across this time boundary (Fig. 3). The
absolute value of the mean correlation scores of our
population-wide clusters in both mountain ranges
changed from almost uniformly nonsignificant pre-
1950 (P40.01, Fig. 3) to a pattern after 1950 in which
correlation scores of several months were statistically
significant (Fig. 3). All further references to statistical
significance are based on Po0.01.
At each of the 13 sites, as well as the combination of
data in each mountain range (Fig. 3), the three most
distinct clusters in the post-1950 data displayed
essentially the same pattern of correlation scores:
Cluster 1, a highly significant negative response to
previous July temperature; Cluster 2, a highly signifi-
cant positive response to spring temperatures (March 1
year and April temperatures 2 years prior in the Alaska
Range, and April 1 and 2 years prior in the Brooks
Range), and Cluster 3, no significant responses. This
pattern persisted even at one site where only 15 trees
met our age criterion. These July and spring tempera-
tures serve as our climatic predictor indices for
positively and negatively responding trees.
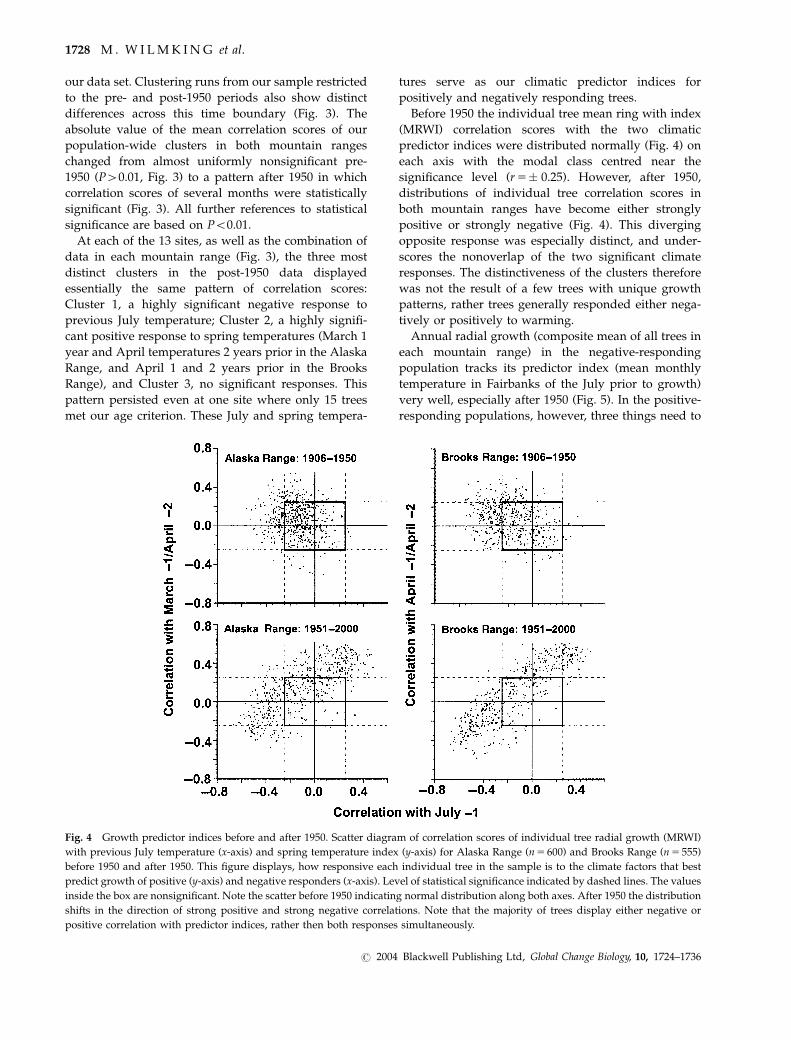
Before 1950 the individual tree mean ring with index
(MRWI) correlation scores with the two climatic
predictor indices were distributed normally (Fig. 4) on
each axis with the modal class centred near the
significance level (r5� 0.25). However, after 1950,
distributions of individual tree correlation scores in
both mountain ranges have become either strongly
positive or strongly negative (Fig. 4). This diverging
opposite response was especially distinct, and under-
scores the nonoverlap of the two significant climate
responses. The distinctiveness of the clusters therefore
was not the result of a few trees with unique growth
patterns, rather trees generally responded either nega-
tively or positively to warming.
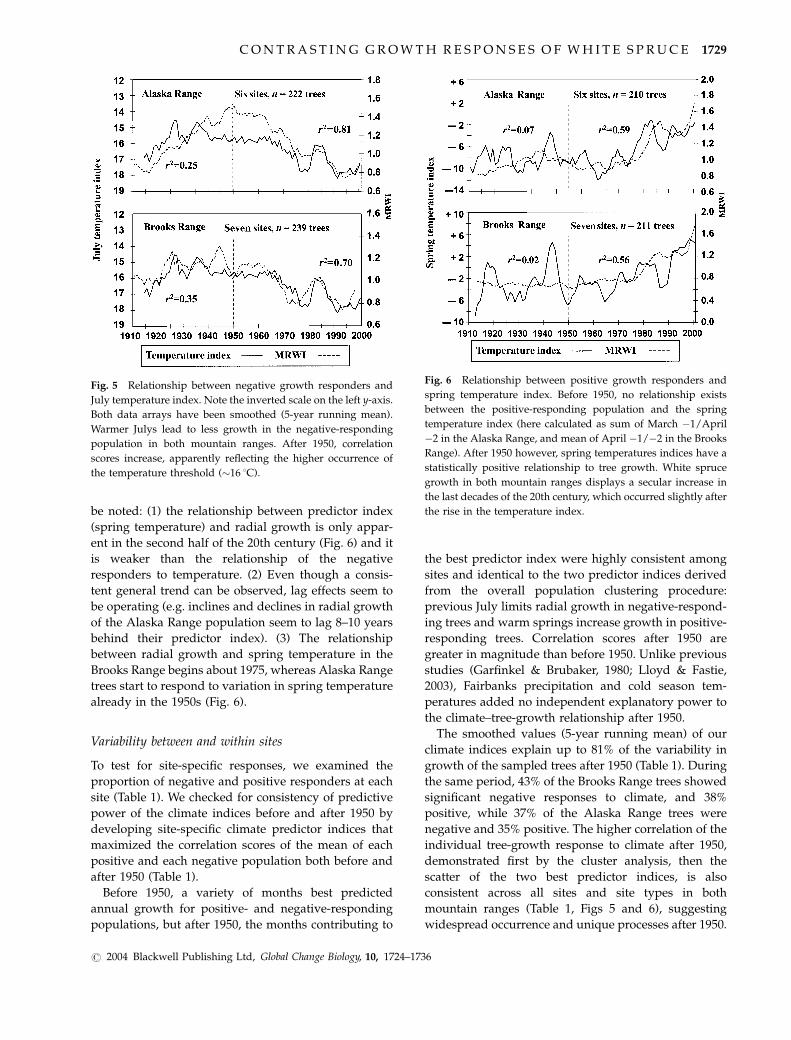
Annual radial growth (composite mean of all trees in
each mountain range) in the negative-responding
population tracks its predictor index (mean monthly
temperature in Fairbanks of the July prior to growth)
very well, especially after 1950 (Fig. 5). In the positive-
responding populations, however, three things need to
Fig. 4 Growth predictor indices before and after 1950. Scatter diagram of correlation scores of individual tree radial growth (MRWI)
with previous July temperature (x-axis) and spring temperature index (y-axis) for Alaska Range (n5 600) and Brooks Range (n5 555)
before 1950 and after 1950. This figure displays, how responsive each individual tree in the sample is to the climate factors that best
predict growth of positive (y-axis) and negative responders (x-axis). Level of statistical significance indicated by dashed lines. The values
inside the box are nonsignificant. Note the scatter before 1950 indicating normal distribution along both axes. After 1950 the distribution
shifts in the direction of strong positive and strong negative correlations. Note that the majority of trees display either negative or
positive correlation with predictor indices, rather then both responses simultaneously.
1728 M . W I LMK ING et al.
r 2004 Blackwell Publishing Ltd, Global Change Biology, 10, 1724–1736
be noted: (1) the relationship between predictor index
(spring temperature) and radial growth is only appar-
ent in the second half of the 20th century (Fig. 6) and it
is weaker than the relationship of the negative
responders to temperature. (2) Even though a consis-
tent general trend can be observed, lag effects seem to
be operating (e.g. inclines and declines in radial growth
of the Alaska Range population seem to lag 8–10 years
behind their predictor index). (3) The relationship
between radial growth and spring temperature in the
Brooks Range begins about 1975, whereas Alaska Range
trees start to respond to variation in spring temperature
already in the 1950s (Fig. 6).
Variability between and within sites
To test for site-specific responses, we examined the
proportion of negative and positive responders at each
site (Table 1). We checked for consistency of predictive
power of the climate indices before and after 1950 by
developing site-specific climate predictor indices that
maximized the correlation scores of the mean of each
positive and each negative population both before and
after 1950 (Table 1).
Before 1950, a variety of months best predicted
annual growth for positive- and negative-responding
populations, but after 1950, the months contributing to
the best predictor index were highly consistent among
sites and identical to the two predictor indices derived
from the overall population clustering procedure:
previous July limits radial growth in negative-respond-
ing trees and warm springs increase growth in positive-
responding trees. Correlation scores after 1950 are
greater in magnitude than before 1950. Unlike previous
studies (Garfinkel & Brubaker, 1980; Lloyd & Fastie,
2003), Fairbanks precipitation and cold season tem-
peratures added no independent explanatory power to
the climate–tree-growth relationship after 1950.
The smoothed values (5-year running mean) of our
climate indices explain up to 81% of the variability in
growth of the sampled trees after 1950 (Table 1). During
the same period, 43% of the Brooks Range trees showed
significant negative responses to climate, and 38%
positive, while 37% of the Alaska Range trees were
negative and 35% positive. The higher correlation of the
individual tree-growth response to climate after 1950,
demonstrated first by the cluster analysis, then the
scatter of the two best predictor indices, is also
consistent across all sites and site types in both
mountain ranges (Table 1, Figs 5 and 6), suggesting
widespread occurrence and unique processes after 1950.
Fig. 5 Relationship between negative growth responders and
July temperature index. Note the inverted scale on the left y-axis.
Both data arrays have been smoothed (5-year running mean).
Warmer Julys lead to less growth in the negative-responding
population in both mountain ranges. After 1950, correlation
scores increase, apparently reflecting the higher occurrence of
the temperature threshold (�16 1C).
Fig. 6 Relationship between positive growth responders and
spring temperature index. Before 1950, no relationship exists
between the positive-responding population and the spring
temperature index (here calculated as sum of March �1/April
�2 in the Alaska Range, and mean of April �1/�2 in the Brooks
Range). After 1950 however, spring temperatures indices have a
statistically positive relationship to tree growth. White spruce
growth in both mountain ranges displays a secular increase in
the last decades of the 20th century, which occurred slightly after
the rise in the temperature index.
C ONTRA S T I NG GROWTH RE S PON S E S O F WH I T E S P RUC E 1729
r 2004 Blackwell Publishing Ltd, Global Change Biology, 10, 1724–1736
To examine whether there was any obvious relation-
ship between the relative proportion of negative and
positive responders and site type, we calculated the
amount of each responder group according to land-
scape position within a site (floodplains vs. high-
density vs. low-density stands, Table 2). There seems
to be no consistent relationship of growth response
with landscape position or aspect at this scale. Even
though differences in relative abundance of positive vs.
negative responders between site types can be large (i.e.
in some sites most positive responders can be found in
low-density stands or floodplains), overall there seems
to be no single-site type favouring either growth
response.
Growth comparison over 200 years
In the first seven decades of the 19th century, mean
radial growth of negative and positive responders were
essentially equivalent in the Alaska Range, while in the
Brooks Range, negative responders grew at a greater
rate, although not significantly greater at the 95% level
(Fig. 7). Sample depth declined with increasing age and
this contributed to the overlapping confidence intervals
of the growth rates of positive and negative responders.
For the next 10 decades (1870s–1960s), negative
responders grew at a significantly greater rate in both
mountain ranges than positive responders. In the
decade of the 1970s, rates of growth were equivalent.
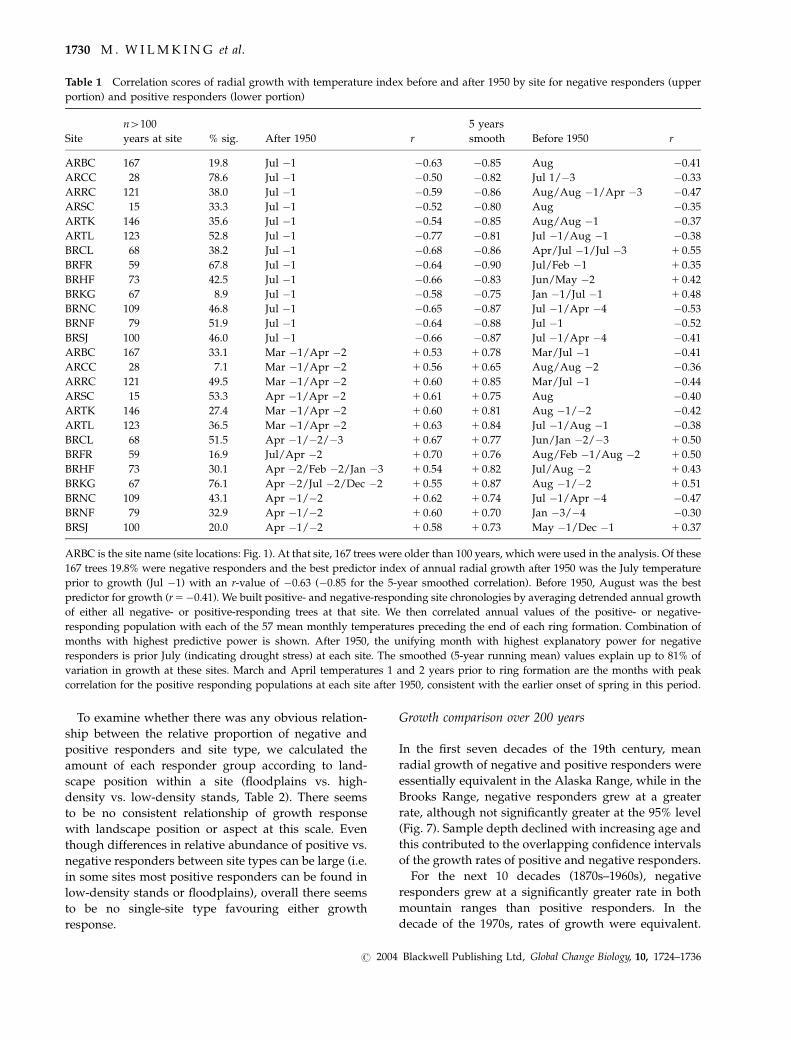
Table 1 Correlation scores of radial growth with temperature index before and after 1950 by site for negative responders (upper
portion) and positive responders (lower portion)
Site
n4100
years at site % sig. After 1950 r
5 years
smooth Before 1950 r
ARBC 167 19.8 Jul �1 �0.63 �0.85 Aug �0.41
ARCC 28 78.6 Jul �1 �0.50 �0.82 Jul 1/�3 �0.33
ARRC 121 38.0 Jul �1 �0.59 �0.86 Aug/Aug �1/Apr �3 �0.47
ARSC 15 33.3 Jul �1 �0.52 �0.80 Aug �0.35
ARTK 146 35.6 Jul �1 �0.54 �0.85 Aug/Aug �1 �0.37
ARTL 123 52.8 Jul �1 �0.77 �0.81 Jul �1/Aug �1 �0.38
BRCL 68 38.2 Jul �1 �0.68 �0.86 Apr/Jul �1/Jul �3 1 0.55
BRFR 59 67.8 Jul �1 �0.64 �0.90 Jul/Feb �1 1 0.35
BRHF 73 42.5 Jul �1 �0.66 �0.83 Jun/May �2 1 0.42
BRKG 67 8.9 Jul �1 �0.58 �0.75 Jan �1/Jul �1 1 0.48
BRNC 109 46.8 Jul �1 �0.65 �0.87 Jul �1/Apr �4 �0.53
BRNF 79 51.9 Jul �1 �0.64 �0.88 Jul �1 �0.52
BRSJ 100 46.0 Jul �1 �0.66 �0.87 Jul �1/Apr �4 �0.41
ARBC 167 33.1 Mar �1/Apr �2 1 0.53 1 0.78 Mar/Jul �1 �0.41
ARCC 28 7.1 Mar �1/Apr �2 1 0.56 1 0.65 Aug/Aug �2 �0.36
ARRC 121 49.5 Mar �1/Apr �2 1 0.60 1 0.85 Mar/Jul �1 �0.44
ARSC 15 53.3 Apr �1/Apr �2 1 0.61 1 0.75 Aug �0.40
ARTK 146 27.4 Mar �1/Apr �2 1 0.60 1 0.81 Aug �1/�2 �0.42
ARTL 123 36.5 Mar �1/Apr �2 1 0.63 1 0.84 Jul �1/Aug �1 �0.38
BRCL 68 51.5 Apr �1/�2/�3 1 0.67 1 0.77 Jun/Jan �2/�3 1 0.50
BRFR 59 16.9 Jul/Apr �2 1 0.70 1 0.76 Aug/Feb �1/Aug �2 1 0.50
BRHF 73 30.1 Apr �2/Feb �2/Jan �3 1 0.54 1 0.82 Jul/Aug �2 1 0.43
BRKG 67 76.1 Apr �2/Jul �2/Dec �2 1 0.55 1 0.87 Aug �1/�2 1 0.51
BRNC 109 43.1 Apr �1/�2 1 0.62 1 0.74 Jul �1/Apr �4 �0.47
BRNF 79 32.9 Apr �1/�2 1 0.60 1 0.70 Jan �3/�4 �0.30
BRSJ 100 20.0 Apr �1/�2 1 0.58 1 0.73 May �1/Dec �1 1 0.37
ARBC is the site name (site locations: Fig. 1). At that site, 167 trees were older than 100 years, which were used in the analysis. Of these
167 trees 19.8% were negative responders and the best predictor index of annual radial growth after 1950 was the July temperature
prior to growth (Jul �1) with an r-value of �0.63 (�0.85 for the 5-year smoothed correlation). Before 1950, August was the best
predictor for growth (r5�0.41). We built positive- and negative-responding site chronologies by averaging detrended annual growth
of either all negative- or positive-responding trees at that site. We then correlated annual values of the positive- or negative-
responding population with each of the 57 mean monthly temperatures preceding the end of each ring formation. Combination of
months with highest predictive power is shown. After 1950, the unifying month with highest explanatory power for negative
responders is prior July (indicating drought stress) at each site. The smoothed (5-year running mean) values explain up to 81% of
variation in growth at these sites. March and April temperatures 1 and 2 years prior to ring formation are the months with peak
correlation for the positive responding populations at each site after 1950, consistent with the earlier onset of spring in this period.
1730 M . W I LMK ING et al.
r 2004 Blackwell Publishing Ltd, Global Change Biology, 10, 1724–1736
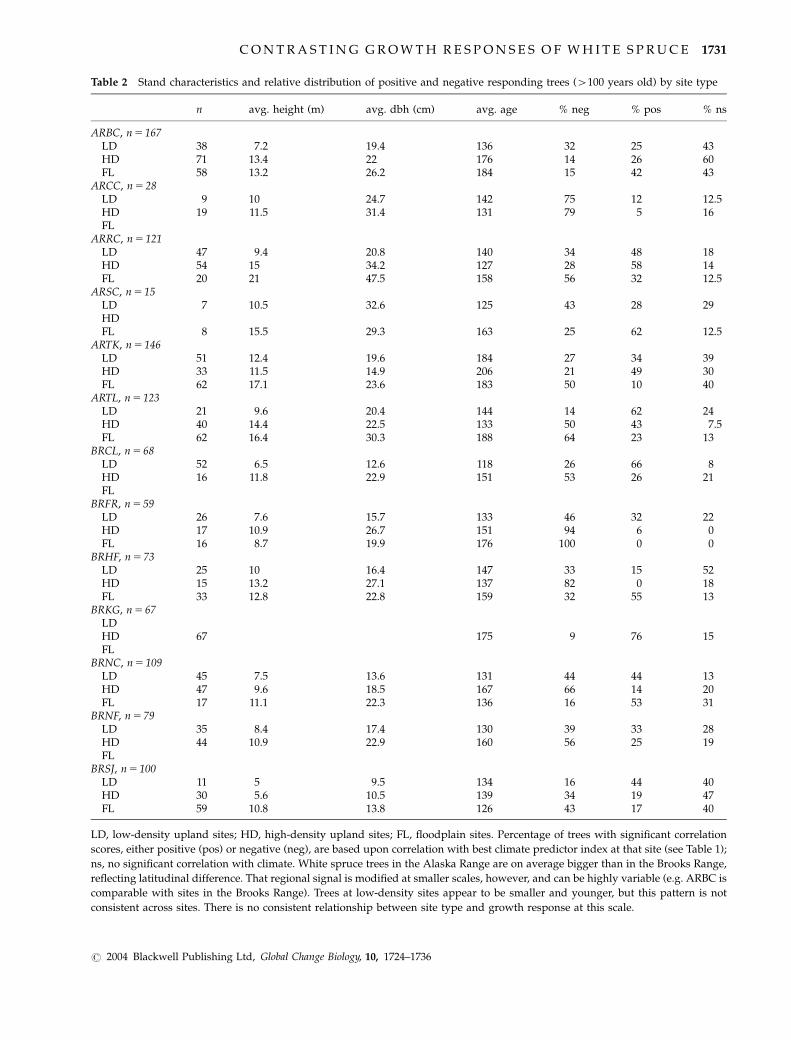
Table 2 Stand characteristics and relative distribution of positive and negative responding trees (4100 years old) by site type
n avg. height (m) avg. dbh (cm) avg. age % neg % pos % ns
ARBC, n5 167LD 38 7.2 19.4 136 32 25 43HD 71 13.4 22 176 14 26 60FL 58 13.2 26.2 184 15 42 43
ARCC, n5 28LD 9 10 24.7 142 75 12 12.5HD 19 11.5 31.4 131 79 5 16FL
ARRC, n5 121LD 47 9.4 20.8 140 34 48 18HD 54 15 34.2 127 28 58 14FL 20 21 47.5 158 56 32 12.5
ARSC, n5 15LD 7 10.5 32.6 125 43 28 29HDFL 8 15.5 29.3 163 25 62 12.5
ARTK, n5 146LD 51 12.4 19.6 184 27 34 39HD 33 11.5 14.9 206 21 49 30FL 62 17.1 23.6 183 50 10 40
ARTL, n5 123LD 21 9.6 20.4 144 14 62 24HD 40 14.4 22.5 133 50 43 7.5FL 62 16.4 30.3 188 64 23 13
BRCL, n5 68LD 52 6.5 12.6 118 26 66 8HD 16 11.8 22.9 151 53 26 21FL
BRFR, n5 59LD 26 7.6 15.7 133 46 32 22HD 17 10.9 26.7 151 94 6 0FL 16 8.7 19.9 176 100 0 0
BRHF, n5 73LD 25 10 16.4 147 33 15 52HD 15 13.2 27.1 137 82 0 18FL 33 12.8 22.8 159 32 55 13
BRKG, n5 67LDHD 67 175 9 76 15FL
BRNC, n5 109LD 45 7.5 13.6 131 44 44 13HD 47 9.6 18.5 167 66 14 20FL 17 11.1 22.3 136 16 53 31
BRNF, n5 79LD 35 8.4 17.4 130 39 33 28HD 44 10.9 22.9 160 56 25 19FL
BRSJ, n5 100LD 11 5 9.5 134 16 44 40HD 30 5.6 10.5 139 34 19 47FL 59 10.8 13.8 126 43 17 40
LD, low-density upland sites; HD, high-density upland sites; FL, floodplain sites. Percentage of trees with significant correlation
scores, either positive (pos) or negative (neg), are based upon correlation with best climate predictor index at that site (see Table 1);
ns, no significant correlation with climate. White spruce trees in the Alaska Range are on average bigger than in the Brooks Range,
reflecting latitudinal difference. That regional signal is modified at smaller scales, however, and can be highly variable (e.g. ARBC is
comparable with sites in the Brooks Range). Trees at low-density sites appear to be smaller and younger, but this pattern is not
consistent across sites. There is no consistent relationship between site type and growth response at this scale.
C ONTRA S T I NG GROWTH RE S PON S E S O F WH I T E S P RUC E 1731
r 2004 Blackwell Publishing Ltd, Global Change Biology, 10, 1724–1736
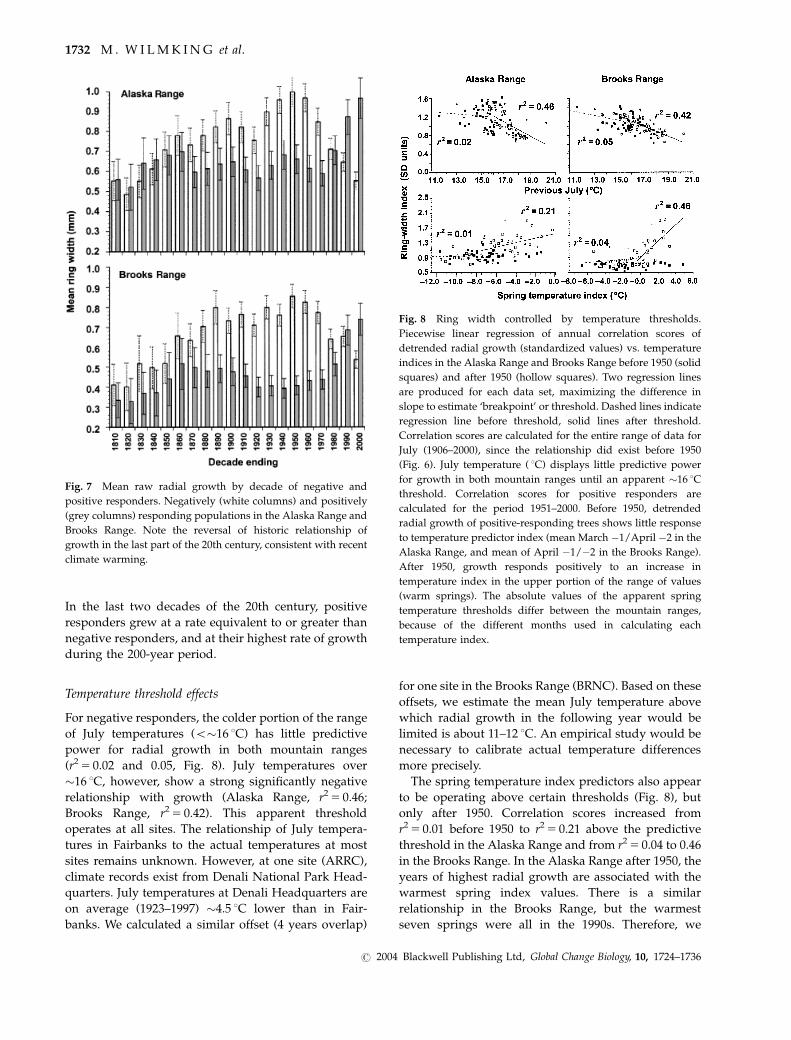
In the last two decades of the 20th century, positive
responders grew at a rate equivalent to or greater than
negative responders, and at their highest rate of growth
during the 200-year period.
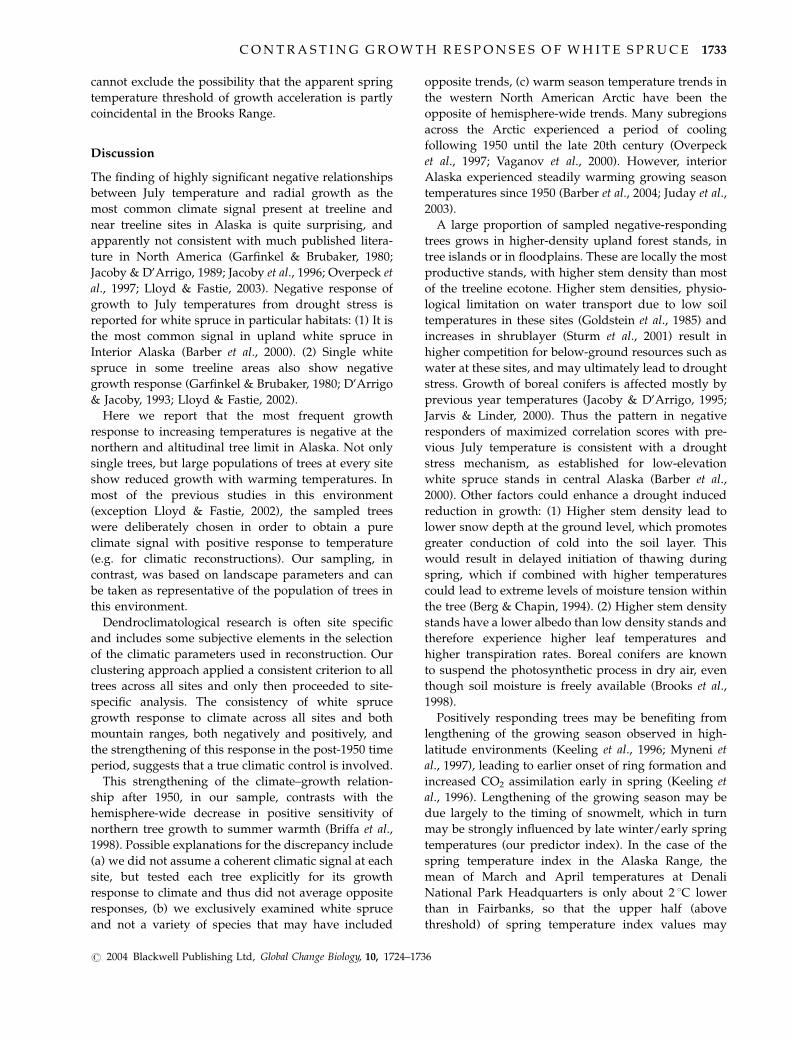
Temperature threshold effects
For negative responders, the colder portion of the range
of July temperatures (o�16 1C) has little predictive
power for radial growth in both mountain ranges
(r25 0.02 and 0.05, Fig. 8). July temperatures over
�16 1C, however, show a strong significantly negative
relationship with growth (Alaska Range, r25 0.46;
Brooks Range, r25 0.42). This apparent threshold
operates at all sites. The relationship of July tempera-
tures in Fairbanks to the actual temperatures at most
sites remains unknown. However, at one site (ARRC),
climate records exist from Denali National Park Head-
quarters. July temperatures at Denali Headquarters are
on average (1923–1997) �4.5 1C lower than in Fair-
banks. We calculated a similar offset (4 years overlap)
for one site in the Brooks Range (BRNC). Based on these
offsets, we estimate the mean July temperature above
which radial growth in the following year would be
limited is about 11–12 1C. An empirical study would be
necessary to calibrate actual temperature differences
more precisely.
The spring temperature index predictors also appear
to be operating above certain thresholds (Fig. 8), but
only after 1950. Correlation scores increased from
r25 0.01 before 1950 to r25 0.21 above the predictive
threshold in the Alaska Range and from r25 0.04 to 0.46
in the Brooks Range. In the Alaska Range after 1950, the
years of highest radial growth are associated with the
warmest spring index values. There is a similar
relationship in the Brooks Range, but the warmest
seven springs were all in the 1990s. Therefore, we
Fig. 7 Mean raw radial growth by decade of negative and
positive responders. Negatively (white columns) and positively
(grey columns) responding populations in the Alaska Range and
Brooks Range. Note the reversal of historic relationship of
growth in the last part of the 20th century, consistent with recent
climate warming.
Fig. 8 Ring width controlled by temperature thresholds.
Piecewise linear regression of annual correlation scores of
detrended radial growth (standardized values) vs. temperature
indices in the Alaska Range and Brooks Range before 1950 (solid
squares) and after 1950 (hollow squares). Two regression lines
are produced for each data set, maximizing the difference in
slope to estimate ‘breakpoint’ or threshold. Dashed lines indicate
regression line before threshold, solid lines after threshold.
Correlation scores are calculated for the entire range of data for
July (1906–2000), since the relationship did exist before 1950
(Fig. 6). July temperature ( 1C) displays little predictive power
for growth in both mountain ranges until an apparent �16 1C
threshold. Correlation scores for positive responders are
calculated for the period 1951–2000. Before 1950, detrended
radial growth of positive-responding trees shows little response
to temperature predictor index (mean March �1/April �2 in the
Alaska Range, and mean of April �1/�2 in the Brooks Range).
After 1950, growth responds positively to an increase in
temperature index in the upper portion of the range of values
(warm springs). The absolute values of the apparent spring
temperature thresholds differ between the mountain ranges,
because of the different months used in calculating each
temperature index.
1732 M . W I LMK ING et al.
r 2004 Blackwell Publishing Ltd, Global Change Biology, 10, 1724–1736
cannot exclude the possibility that the apparent spring
temperature threshold of growth acceleration is partly
coincidental in the Brooks Range.
Discussion
The finding of highly significant negative relationships
between July temperature and radial growth as the
most common climate signal present at treeline and
near treeline sites in Alaska is quite surprising, and
apparently not consistent with much published litera-
ture in North America (Garfinkel & Brubaker, 1980;
Jacoby & D’Arrigo, 1989; Jacoby et al., 1996; Overpeck et
al., 1997; Lloyd & Fastie, 2003). Negative response of
growth to July temperatures from drought stress is
reported for white spruce in particular habitats: (1) It is
the most common signal in upland white spruce in
Interior Alaska (Barber et al., 2000). (2) Single white
spruce in some treeline areas also show negative
growth response (Garfinkel & Brubaker, 1980; D’Arrigo
& Jacoby, 1993; Lloyd & Fastie, 2002).
Here we report that the most frequent growth
response to increasing temperatures is negative at the
northern and altitudinal tree limit in Alaska. Not only
single trees, but large populations of trees at every site
show reduced growth with warming temperatures. In
most of the previous studies in this environment
(exception Lloyd & Fastie, 2002), the sampled trees
were deliberately chosen in order to obtain a pure
climate signal with positive response to temperature
(e.g. for climatic reconstructions). Our sampling, in
contrast, was based on landscape parameters and can
be taken as representative of the population of trees in
this environment.
Dendroclimatological research is often site specific
and includes some subjective elements in the selection
of the climatic parameters used in reconstruction. Our
clustering approach applied a consistent criterion to all
trees across all sites and only then proceeded to site-
specific analysis. The consistency of white spruce
growth response to climate across all sites and both
mountain ranges, both negatively and positively, and
the strengthening of this response in the post-1950 time
period, suggests that a true climatic control is involved.
This strengthening of the climate–growth relation-
ship after 1950, in our sample, contrasts with the
hemisphere-wide decrease in positive sensitivity of
northern tree growth to summer warmth (Briffa et al.,
1998). Possible explanations for the discrepancy include
(a) we did not assume a coherent climatic signal at each
site, but tested each tree explicitly for its growth
response to climate and thus did not average opposite
responses, (b) we exclusively examined white spruce
and not a variety of species that may have included
opposite trends, (c) warm season temperature trends in
the western North American Arctic have been the
opposite of hemisphere-wide trends. Many subregions
across the Arctic experienced a period of cooling
following 1950 until the late 20th century (Overpeck
et al., 1997; Vaganov et al., 2000). However, interior
Alaska experienced steadily warming growing season
temperatures since 1950 (Barber et al., 2004; Juday et al.,
2003).
A large proportion of sampled negative-responding
trees grows in higher-density upland forest stands, in
tree islands or in floodplains. These are locally the most
productive stands, with higher stem density than most
of the treeline ecotone. Higher stem densities, physio-
logical limitation on water transport due to low soil
temperatures in these sites (Goldstein et al., 1985) and
increases in shrublayer (Sturm et al., 2001) result in
higher competition for below-ground resources such as
water at these sites, and may ultimately lead to drought
stress. Growth of boreal conifers is affected mostly by
previous year temperatures (Jacoby & D’Arrigo, 1995;
Jarvis & Linder, 2000). Thus the pattern in negative
responders of maximized correlation scores with pre-
vious July temperature is consistent with a drought
stress mechanism, as established for low-elevation
white spruce stands in central Alaska (Barber et al.,
2000). Other factors could enhance a drought induced
reduction in growth: (1) Higher stem density lead to
lower snow depth at the ground level, which promotes
greater conduction of cold into the soil layer. This
would result in delayed initiation of thawing during
spring, which if combined with higher temperatures
could lead to extreme levels of moisture tension within
the tree (Berg & Chapin, 1994). (2) Higher stem density
stands have a lower albedo than low density stands and
therefore experience higher leaf temperatures and
higher transpiration rates. Boreal conifers are known
to suspend the photosynthetic process in dry air, even
though soil moisture is freely available (Brooks et al.,
1998).
Positively responding trees may be benefiting from
lengthening of the growing season observed in high-
latitude environments (Keeling et al., 1996; Myneni et
al., 1997), leading to earlier onset of ring formation and
increased CO2 assimilation early in spring (Keeling et
al., 1996). Lengthening of the growing season may be
due largely to the timing of snowmelt, which in turn
may be strongly influenced by late winter/early spring
temperatures (our predictor index). In the case of the
spring temperature index in the Alaska Range, the
mean of March and April temperatures at Denali
National Park Headquarters is only about 2 1C lower
than in Fairbanks, so that the upper half (above
threshold) of spring temperature index values may
CONTRA S T I NG GROWTH RE S PON S E S O F WH I T E S P RUC E 1733
r 2004 Blackwell Publishing Ltd, Global Change Biology, 10, 1724–1736
actually reflect the onset of snowmelt at the sites.
Timing difference of these events between the Alaska
and Brooks Range caused by latitudinal difference also
support the hypothesis that threshold values for
positive responders reflect onset of snowmelt. In the
Alaska Range the positive correlation of growth with
temperature is maximized earlier than in the Brooks
Range (Fig. 3, Table 1), which is further north and
experiences later snowmelt.
Boreal coniferous trees need soil water to reinitiate
photosynthetic activity in spring (Jarvis & Linder, 2000).
Liquid water can be available at the soil surface as soon
as overlying snow starts to melt, even though mean air
temperatures are below freezing (Jarvis & Linder, 2000).
We infer that warmer spring temperatures produce
earlier onset of snowmelt leading to the positive growth
response of a subpopulation of white spruce. Although
this explanation is consistent with our data, further
work needs to be done to confirm this mechanism. On
the other hand, the consistency of this positive response
from individual trees to sites to entire mountain ranges
suggests that a true threshold mechanism is involved.
The apparent lag effects in the positive growth
response as a result of warmer spring temperatures
points to a complex mechanism of cause and effect. For
example, a long-term warming of spring temperatures
could not only lead to earlier snowmelt, therefore
longer snow-free season and warmer soils in the
summer, but also to more overall heat transfer into
the ground. Degradation of permafrost takes effect as
soon as soils are warmed sufficiently (to 0 1C), but to
warm a frozen soil up to that temperature would
require considerable energy over a long period of time,
thus possibly introducing lag effects.
Carbon sequestration in deciduous boreal ecosystems
is positively related to early thaw (Black et al., 2000;
Jarvis & Linder, 2000; Barr et al., 2002). We show that in
coniferous forests also wood production, and therefore
above-ground carbon uptake, can increase due to warm
springs, but only in our positive-responding popula-
tion. Some boreal systems switch from carbon sink to
carbon source over periods of years, and net ecosystem
productivity (NEP) in them is actually controlled by
respiration (Valentini et al., 2000). Carbon flux measure-
ments, needed to calculate respiration and ultimately
NEP, are not available for our sites.
The similarity of the percentages of positive and
negative responders in both mountain ranges after 1950
could lead to the conclusion that in the short term there
has been no net change in carbon uptake on a regional
scale by trees in these environments. However, it
appears that positive responders are more frequent in
environments with lower stem density than negative
responders. If low stem density is a necessary property
of a positive-responding population, than calculated
per unit area, the carbon uptake potential of positive
responders may be less than that of negative respon-
ders. Even more significantly, the majority of trees now
responding positively, historically grew less than
negative responders until the late 20th century (Fig. 7)
and as a result are smaller (avg. dbh 16.0 cm, height
8.4m) than negative responders (avg. dbh 23.0 cm,
height 10.4m). This earlier period generally experi-
enced cooler summers. Negative responders have
achieved significantly less growth than positive re-
sponders since the 1970s (Fig. 7), the timing of a major
summer temperature regime shift characterized by the
warmest and driest conditions of the last 200 years
(Barber et al., 2004).
Therefore, in these environments future climate
warming might not be associated with a significant
increase in carbon uptake and sequestration, but carbon
uptake overall may actually decline. Surprisingly, in
our results, age as an independent factor did not affect
the correlation of trees to temperature as reported
elsewhere (Szeicz & MacDonald, 1994; Lloyd & Fastie,
2002).
Conclusions
Recent climate warming has intensified the negative
growth response of a large proportion of trees at locally
productive sites near treeline in Alaska. Trees on less
favourable sites may be benefiting from earlier thaw
and are now outperforming productive sites, reversing
the historical growth relationship (Fig. 7). Any assump-
tion that white spruce growth at treeline will change
uniformly in relation to climate appears unjustified,
and this changing sensitivity to climate is an obvious
contributor to the error term in ring-width-based
reconstruction of past climate. Our results indicate that
climate–tree-growth relationships of treeline white
spruce in Alaska can be modelled successfully as two
distinct responses across entire mountain ranges. For
modelling applications at larger scales, the main
question becomes the relative proportion of positive
spring responders and negative summer drought
responders in the area of interest. The consistency of
the proportion of trees displaying these two responses
at a regional scale in the Brooks Range and Alaska
Range suggests that these ratios are applicable to
similar areas of the boreal forest. Landscape and local
scale influences on the distribution and abundance of
each growth response on the other hand, are not
consistent between and within sites.
Unprecedented levels of high temperatures in the last
decades (Barber et al., 2004) have led to nonlinear
patterns of white spruce growth responses to warming
1734 M . W I LMK ING et al.
r 2004 Blackwell Publishing Ltd, Global Change Biology, 10, 1724–1736
at Alaska’s treelines and temperature thresholds appear
to be operating. Drought stress may now also be
affecting treelines at the cold margin of the boreal
forest. In the longer term, intensification of warming
could lead to the elimination of these negative-
responding trees through stress-related mortality. Dy-
namic vegetation and biogeochemical models need to
incorporate these divergent responses and apparent
temperature thresholds to avoid overestimation of
treeline advance, high-latitude carbon uptake and
future above-ground carbon storage.
Acknowledgements
This study was supported by a Canon National Park ScienceScholarship, The German Academic Exchange Service (DAAD),the McIntire-Stennis Cooperative Forestry Research Program,the US-NSF Long-Term Ecological Research (LTER) Program, theCenter for Global Change and Arctic System Research, and agrant from the Explorers Club. We thank the US Fish andWildlife Service for data on one site (BRSJ) and David Valentine,Bob Stottlemyer, Chuck Rhoades, and Hlynur Oskarsson fordata on BRKG. We thank Joerg Sommer and Jens Ibendorf forfield assistance, as well as The Denali Foundation for kindsupport.
References
Barber VA, Juday GP, Finney BP (2000) Reduced growth of
Alaskan white spruce in the twentieth century from tempera-
ture-induced drought stress. Nature, 405, 668–673.
Barber VA, Juday GP, Finney BP et al. (2004) Reconstruction of
summer temperatures in interior Alaska from tree ring
proxies: evidence for changing synoptic climate regimes.
Climatic Change, 63, 91–120.
Barr AG, Griffis TJ, Black TA et al. (2002) Comparing the carbon
budgets of boreal and temperature deciduous forest stands.
Canadian Journal of Forest Research, 32, 813–822.
Berg EE, Chapin SF III (1994) Needle loss as a mechanism of
winter drought avoidance in boreal conifers. Canadian Journal
of Forest Research, 24, 1144–1148.
Black TA, Chen WJ, Barr AG et al. (2000) Increased carbon
sequestration by a boreal deciduous forest in years with a
warm spring. Geophysical Research Letters, 27, 1271–1274.
Bonan GB, Pollard D, Thompson SL (1992) Effects of boreal
forest vegetation on global climate. Nature, 359, 716–718.
Briffa KR, Schweingruber FH, Jones PD et al. (1998) Reduced
sensitivity of recent tree-growth to temperature at high
northern latitudes. Nature, 391, 678–682.
Brooks GR, Flannagan LB, Ehrlinger JR (1998) Responses of
Boreal conifers to climate fluctuations: indication from tree
ring width and carbon isotope analysis. Canadian Journal of
Forest Research, 28, 524–533.
Chapin FS III, McGuire AD, Randerson J et al. (2000) Arctic and
boreal ecosystems of western North America as components
of the climate system. Global Change Biology, 6 (Suppl. 1),
211–223.
Cook E, Briffa K, Shiyatov S et al. (1992) Tree ring standardization
and Growth-trend Estimation. In: Methods of Dendrochronology:
Applications in the Environmentral Sciences (eds Cook ER,
Kairiukstis LA), pp. 104–123. Kluwer Academics, Dordrecht.
D’Arrigo RD, Jacoby GC (1993) Secular trends in high northern
latitude temperature reconstructions based on tree rings.
Climatic Change, 25, 163–177.
Dixon RK, Brown S, Houghton RA et al. (1994) Carbon pools and
flux of global forest ecosystems. Science, 263, 185–190.
Foley JA, Kutzbach JE, Coe MT et al. (1994) Feedback between
climate and the boreal forest during the Holocene epoch.
Nature, 371, 52–54.
Foley JA, Levis S, Costa MH et al. (2000) Incorporating dynamic
vegetation cover within global climate models. Ecological
Applications, 10, 1620–1632.
Garfinkel HL, Brubaker LB (1980) Modern climate–tree-growth
relationships and climatic reconstructions in sub-Arctic
Alaska. Nature, 286, 872–874.
Goldstein GH, Brubaker LB, Hinckley TM (1985) Water relations
of white spruce (Picea glauca (Moench) Voss) at tree line in
north central Alaska. Canadian Journal of Forest Research, 15,
1080–1087.
Jacoby GC, D’Arrigo RD (1989) Reconstructed northern hemi-
sphere annual temperature since 1671 based on high latitude
tree-ring data from North America. Climatic Change, 14, 39–59.
Jacoby GC, D’Arrigo RD (1995) Tree-ring width and density
evidence of climatic and potential forest change in Alaska.
Global Biogeochemical Cycles, 9, 227–234.
Jacoby GC, Wils G, D’Arrigo RD (1996) Alaskan dendroclimatic
variations for the past 300 years along a north–south transect.
In: Tree Rings, Environment and Humanity. Proceedings of the
International Conference, 17/21 May 1994 Tucson, Arizona (eds
Dean JS, Maco DM, Swetnan TW. Radiocarbon 235–248.
Jarvis P, Linder S (2000) Constraints to growth of boreal forests.
Nature, 405, 904–905.
Juday GP, Barber VA, Rupp TS et al. (2003) A 200-year
perspective of climate variability and the response of white
spruce in Interior Alaska. In: Climate Variability and Ecosystem
Response at Long-Term Ecological Research (LTER) Sites (eds
Greenland D, Goodin DG, Smith RC), pp. 226–250. Oxford
University Press, New York.
Keeling CD, Chin JFS, Whorf TP (1996) Increased activity of
northern vegetation inferred from atmospheric CO2 measure-
ments. Nature, 382, 146–149.
Kittel TGF, Steffen WL, Chapin FS (2000) Global and regional
modeling of Arctic-boreal vegetation distribution and its sensi-
tivity to altered forcing. Global Change Biology, 6 (Suppl. 1), 1–18.
Koerner C (2000) Biosphere responses to CO2 enrichment.
Ecological Applications, 10, 1590–1619.
Kullman L (1996) Recent cooling and recession of Norway
spruce (Piea abies (L.) Karst.) in the forest-alpine tundra
ecotone of the Swedish Scandes. Journal of Biogeography, 23,
843–854.
Kullman L (2001) 20th century climate warming and tree-limit
rise in the southern Scandes of Sweden. Ambio, 30, 72–80.
Lloyd AH, Fastie CL (2002) Spatial and temporal variability in
the growth and climate response of treeline trees in Alaska.
Climatic Change, 52, 418–509.
C ONTRA S T I NG GROWTH RE S PON S E S O F WH I T E S P RUC E 1735
r 2004 Blackwell Publishing Ltd, Global Change Biology, 10, 1724–1736

Lloyd AH, Fastie CL (2003) Recent changes in treeline forest dis-
tribution and structure in interior Alaska. Ecoscience, 10, 176–185.
Luckman B, Kavanagh T (2000) Impact of climate fluctuations on
mountain environments in the Canadian Rockies. Ambio, 29,
371–380.
Myneni RB, Keeling CD, Tucker CJ et al. (1997) Increased plant
growth in the northern high latitudes from 1981–1991. Nature,
386, 698–702.
Overpeck JT, Hughen KA, Hardy D et al. (1997) Arctic environ-
mental change of the last four centuries. Science, 278, 1251–1256.
Pilcher JR, Schweingruber FH, Kairiukstis L et al. (1992) Primary
data. In: Methods of Dendrochronology: Applications in the
Environmental Sciences (eds Cook ER, Kairiukstis LA), Kluwer
Academics, Dordrecht.
Rupp TS, Chapin FS, Starfield AM (2001) Modeling the influence
of topographic barriers on treeline advance at the northern
forest-tundra ecotone in nortwestern Alaska. Climatic Change,
48, 399–416.
Schweingruber FH, Kariukstis L, Shiyatov SG (1992) Sample
selection. In: Methods of Dendrochronology: Applications in the
Environmental Sciences (eds Cook ER, Kairiukstis LA), Kluwer
Academics, Dordrecht.
Sturm M, Racine C, Tape K (2001) Increasing shrub abundance
in the Arctic. Nature, 411, 546–547.
Suarez F, Binkley D, Kaye MW (1999) Expansion of forest stands
into tundra in the Noatak National Preserve, northwest
Alaska. Ecoscience, 6, 456–470.
Szeicz JM, MacDonald GM (1994) Age-dependent tree-ring
growth responses of subarctic white spruce to climate.
Canadian Journal of Forest Research, 24, 120–132.
Vaganov EA, Briffa KR, Naurzbaev MM et al. (2000) Long-term
climatic changes in the arctic region of the Northern Hemi-
sphere. Doklady Earth Sciences, 375, 1314–1317.
Valentini R, Matteucchi G, Dolman H et al. (2000) Respiration as
the main determinant of carbon balance in European forests.
Nature, 404, 861–865.
1736 M . W I LMK ING et al.
r 2004 Blackwell Publishing Ltd, Global Change Biology, 10, 1724–1736
Related Documents