Sddhand, Vol. 10, Parts 1 & 2, April 1987, pp. 269-298. © Printed in India. Recent advances in the analysis and design of trickle-bed reactors P A RAMACHANDRAN, M P DUDUKOVI(~ and P L MILLS* Chemical Reaction Engineering Laboratory, Department of Chemical Engineering, Washington University at St. Louis, Missouri 63130, USA , Monsanto Company, 800N Lindbergh Boulevard, St. Louis, Missouri 63167, USA Abstract. This paper summarizes some progress in our understanding of trickle-bed reactors. The particular topics discussed in this review are the basic hydrodynamics, flow regime transition, pressure drol5 and holdup calculations, use of tracers, modelling of partial wetting effects, reactor design of and catalyst testing in trickle beds. The rapid advances made in these areas are critically examined and some problems which need further investigation are outlined. Keywords. Multiphase reactors: trickle beds. 1. Introduction Trickle-beds, which are packed-beds of catalyst with cocurrent flow of liquid and gas reactants, represent an important class of three-phase reactors. If reactor significance was judged by the tonnage of material processed, trickle-beds would be among the most important ones due to their widespread use in the petroleum industry in processes such as hydrodesulphurization, denitrogenation, demetalliza- tion and hydrocracking. They are also used in chemical processing mainly in hydrogenation and oxidation reactions. Typical applications include hydrogenation of nitrocompounds, aniline etc., synthesis of butynediol, production of sorbitol etc. Trickle-beds are also well-suited for the oxidation of dilute aqueous solutions of organic pollutants and hence have potential applications in waste water treatment. They cap also be used in operations with immobilized cells or enzymes which require liquid substrates and oxygen or where CO2 is formed as a product. When dealing with gas and liquid reactants that need to be processed on a solid catalyst, immobilized cells or enzymes, one can choose between slurry systems and packed bed operation. Catalyst slurries, i.e., finely powdered suspended catalyst particles in the 20/zm to 200 ~m range, are used in mechanically agitated A list of symbols is given at the end of the paper 269

Welcome message from author
This document is posted to help you gain knowledge. Please leave a comment to let me know what you think about it! Share it to your friends and learn new things together.
Transcript

Sddhand, Vol. 10, Parts 1 & 2, April 1987, pp. 269-298. © Printed in India.
Recent advances in the analysis and design of trickle-bed reactors
P A R A M A C H A N D R A N , M P DUDUKOVI(~ and P L MILLS*
Chemical Reaction Engineering Laboratory, Department of Chemical Engineering, Washington University at St. Louis, Missouri 63130, USA , Monsanto Company, 800N Lindbergh Boulevard, St. Louis, Missouri 63167, USA
Abstract. This paper summarizes some progress in our understanding of trickle-bed reactors. The particular topics discussed in this review are the basic hydrodynamics, flow regime transition, pressure drol5 and holdup calculations, use of tracers, modelling of partial wetting effects, reactor design of and catalyst testing in trickle beds. The rapid advances made in these areas are critically examined and some problems which need further investigation are outlined.
Keywords. Multiphase reactors: trickle beds.
1. Introduction
Trickle-beds, which are packed-beds of catalyst with cocurrent flow of liquid and gas reactants, represent an important class of three-phase reactors. If reactor significance was judged by the tonnage of material processed, trickle-beds would be among the most important ones due to their widespread use in the petroleum industry in processes such as hydrodesulphurization, denitrogenation, demetalliza- tion and hydrocracking. They are also used in chemical processing mainly in hydrogenation and oxidation reactions. Typical applications include hydrogenation of nitrocompounds, aniline etc., synthesis of butynediol, production of sorbitol etc. Trickle-beds are also well-suited for the oxidation of dilute aqueous solutions of organic pollutants and hence have potential applications in waste water treatment. They cap also be used in operations with immobilized cells or enzymes which require liquid substrates and oxygen or where CO2 is formed as a product.
When dealing with gas and liquid reactants that need to be processed on a solid catalyst, immobilized cells or enzymes, one can choose between slurry systems and packed bed operation. Catalyst slurries, i.e., finely powdered suspended catalyst particles in the 20/zm to 200 ~m range, are used in mechanically agitated
A list of symbols is given at the end of the paper 269

270 P A Ramachandran, M P Dudukovi ( and P L Mills
autoclaves, bubble columns and gas-lift reactors while somewhat larger particles are employed in three-phase fluidized beds. Catalyst pellets in the 0.08 to 0.32 cm range are used in packed-beds with cocurrent, downflow or upflow, and countercurrent gas-liq,~id flow. Germain et al (1979, p. 265) compare the relative merits of packed-beds and slurry reactors and conclude that, overall, the packed-beds are to be preferred due to their flow pattern that approaches plug flow, high catalyst loading per unit volume of the liquid, low energy dissipation rate (an order of magnitude lower than in slurry reactors) and much greater flexibility with respect to production rates and operating conditions used. The only marked disadvantages are their intolerance of highly exothermic reactions and their impracticality for systems with rapidl~r deactivating catalysts.
In spite of their advantages, the potential of trickle-bed reactors has never been fully utilized in chemical processing in partial hydrogenations, partial oxidations, desulphurizations, hydroformylations or in pollution abatement, fermentations and other biochemical reactions. The reason seems to lie in the difficulties associated with trickle-bed design which exceed those encountered with other reactor types. While scale-up of trickle-bed reactors in petroleum processing for certain types of known feeds is well established as an art, a priori prediction of trickle-bed performance or scale-up from small laboratory units for feeds and processes for which previous know-how does not exist is still considered very risky and is simply not done. This is due to the fact that phenomena in trickle-beds are incompletely understood and are not readily quantified.
In view of the complexities associated with trickLe-beds, it is not surprising that considerable research has been done in this area. A number of review articles on trickle-bed reactors are available which summarize the progress in this area (.Satterfield 1975; Goto et al 1977: Gianetto et al 1978; Shah 1979; Ramachandran & Chaudhari 1983; Herskowitz & Smith 1983; Dudukovic & Mills 1983, 1986; Gupta 1985, p. 515; Hanika & Stanek 1985, p. 1029). In view of the rapid advances that are being made in this area, it is appropriate to supplement these reviews with new developments and this is one of the objectives of this paper. In addition, the paper addresses the research needs in this area. Although the review is not exhaustive in its literature coverage, all the major new research trends are discussed.
The primary focus is on the developments in the subareas listed below in which significant work has been done in the recent years:
1. Flow regime transition; 2. pressure drop and holdup correlations: 3. use of tracers in trickle-beds; 4. influence of partial wetting; 5. reactor design equations; and 6. catalyst testing in trickle-beds.
2. Flow regine transition
Flow pattern in the trickle-bed can be classified into three regimes: (i) At low liquid rate, the flow pattern is trickling where the liquid trickles over the packing in essentially laminar flow. Here the presence of the gas does not significantly affect the flow of the liquid and this flow regime is therefore called a low interaction regime (LIR). The presence of the gas mainly alters the flow area available for the

Trickle-bed reactors 27l
liquid and this regime is alternatively also known as the 'geometric" interaction regime. (ii) At higher gas and/or liquid rates, we observe rippling or pulsing flow. Here, pulses of liquid with entrained gas bubbles periodically pass through the column at regular frequencies. In this region the interaction between the gas and liquid pulses is very high and the regime is also known as the high interaction regime (ttlR). As there is significant momentum exchange at the gas-liquid intelface the regime is also known as the 'hydrodynamic' interaction regime. (iii) At very high liquid rates and relatively low gas rates, the liquid becomes a continuous phase and the gas flows as a dispersed phase in the form of bubbles. This regime is referred to as the dispersed bubble flow regime.
Normal laboratory and commercial reactors are operated in the trickle or pulse flow regime. The transition between the two regimes is not very sharp and is usually characterized by an increase in the root mean square pressure fluctuations for a relatively small increase in the gas or liquid flow rates. Operation in the trickle flow regime ensures a large liquid residence time and provides a large single pass conversion of the liquid reactant. This is therefore useful for reactions which are kinetically controlled. Operation in the pulsing regime provides a dramatic increase in the mass transfer coefficients and is therefore suitable for relatively fast mass transfer limited reactions. Flexibility for changing the operating gas and liquid rates is also greater in the pulsing regime. Studies comparing the two regimes for reacting system are lacking and are needed to enable a rational choice of the operating gas and liquid velocities. Operation with very low liquid velocities in the trickle flow regime is common in commercial hydrodesulphurization reactors. Here in some cases the catalyst particle may not be completely wetted and the complexities associated with incomplete wetting are discussed in §7.
In order to properly interpret the experiments, it is necessary to know in which regime the reactor is operating for a given condition. It is also necessary to know whether the same flow regime will be maintained when one scales up from laboratory to pilot or commercial scale reactors. A number of studies have therefore been devoted to this subject. In one of the early studies, Charpentier & Favier (1975) used the Baker (1954) coordinate plot to demarcate the flow regime transition line. Separate flow maps were provided for foaming and non-foaming systems. Additional earlv work in this area has been provided by Specchia & Baldi (1977), Chou et al (1977), Fukushima & Kusaka (1977) and Talmor (1977).
The flow map of Charpentier & Favier (1975) is very usefOl for the practitioner when one views the transition as a zone rather than a sharp line. The flow map has been represented in analytical form by Dudukovid & Mills (1986) which leads to the following approximate criterion for maintaining trickle flow conditions.
p/UL --< (pLUL)~r and p~uG/eBA < 1, (1)
where (Pc at. )~.~ is the smaller of the two mass velocities evaluated in the folowing:
(PL Us. )~-~ = 1(1-~ pc; UU?,& (2a)
(PZ. UL),,- = 5"45 [*BA/p~Su(;] °:2 (eB/O), (2b)
where
A ---- [p¢;pr/p~,, rpw] 1'2, (.3)

272 P A Ramachandran, M P Dudukovi~ and P L Mills
@ = (~rw/o'L) [(~L/P~w) (Pw/pL)2] I/3. (4)
with SI units being used. When pLUL > (PLUL)cr and pcuc/eBA < 1, transition to pulsing flow occurs and at pGUc/eBA > 1, transition to spray flow occurs.
Recent studies have focussed more attention on the fundamental hydrodynamics and some of the trends in this area will now be reviewed.
The theoretical models for calculating the onset of pulsing is based on the analysis of flow in capillaries with restriction. Based on this approach, Sicardi & Hofmann (1982) proposed a model of a channel with constriction as shown.in figure 1. Pulsing is assumed to occur when the large liquid waves occlude the channel. The channel diameter, dco, is taken a s 4eB/ap and the parameter which takes into account the irregularity of the channel is the width of the protrusion, b, or an equivalent tortuosity factor 0 defined as 2b/dco. From dimensional analysis the following correlation was obtained for [A/h] at the onset of pulsing. (Here A is the maximum amplitude of the waves formed on the liquid surfaces and h is the mean film thickness. These parameters are shown in figure 1.)
[a/h]p = C['cieB/o-L ap] '~, (5)
where the subscript p denotes the onset of pulsing and ~'i is the interfacial drag at pulsing inception. The constant C is assumed to be a function of only the tortuosity factor 0. The value of [A/h]p c a n also be related to the liquid saturation, o~(= e#eB) by the following equation:
[Alh]p -- ~- [ ( i - ¢o)loo]p { I + [ I + [ ro l (1 - cO)]p]} I/2 , ( 6 )
The interfacial drag 7i can be related to the pressure drop in the system by the following equation:
(,ri) p = [ - Ap/AL]p eB(1 -- w)p/ap , (7)
The value of C was found to be independent of packing diameter and was a function of only the packing shape. From the analysis of data on various packings such as Raschig rings, ceramic cylinders, glass beads and glass cylinders it was found that C = 16.2 and a = 0.5. The model is empirical based on dimensional
WAVY - ~ LIQUID V///X~ FILM
4 CAPILLARY
PROTRUSION
Figure 1. Schematic of a channel with constrictions used in the model of Sicardi & Hofmann (1982).

T r i c k l e - b e d r e a c t o r s 273
analysis. It provides a relation between the pressure drop [(7)] and liquid saturation [(5) and (6)] at the onset of pulsing. Alternately, if a reasonable correlation is available for calculations of pressure drop and saturation, then the equations can be used to determine the liquid velocity required for the onset of pulsing. This can be done by equating (5) and (6) and leads to the following simplified equation:
2 0-2•/ ", 2-2 [-- AP/AL]Pulsing = 2.5 × 10 - 3 ap o L e B , [,eL) Pulsing" (8 )
A similar approach was used by Dimenstein & Ng (1986). The conceptual sketch of the How geometry used in their work is shown in figure 2. The model predicts the following equation for the gas velocity at the onset of pulsing:
u c = eB(,1 - or) {(2/pc) [ ( 4 c r L / d p ) - O'Lg ( d p / 2 ) ] } '/2 • (9)
Here, a is the fraction of the cross-sectional area of the void space occupied by liquid which was related to the external average liquid saturation in the bed.
c~ = 4[(1 - to) ~/2 - (1 - o,)1. (10)
In this method the effect of liquid velocity on the onset of pulsing comes only indirectly through the liquid holdup factor [parameter 1 - a]. The interstitial gas velocity necessary to cause pulsing is a constant which depends only on the packing diameter and physical properties. Also, for a certain range of packing size the RHS of (9) can become zero and the correlation is then no longer valid. For small particles and for air-water system the correlation agrees with the experimental data reasonably well.
Blok & Drinkenberg (1982) proposed that the liquid velocity required for pulsing to occur is a constant for a certain packing material. The correlation suggested was that the liquid phase Froude number at pulsing inception is a constant
2 2 2 U l / ( e C p c g d p ) = 0"08 to 0.09. (11)
Blok & Drinkenburg (1982) postulated two mechanisms for the pulse triggering process. First is liquid blocking of some of the passages among packing particles which occurs stochastically. The gas flow either breaks through or bypasses such blockages. At higher liquid flow rates this occurs more frequently and may
FLOW CHANNEL WITH THE MAXIMUM CROSS-SECTION
I
CATALYST PARTICLE
LIQUID / FILM
1 I
/•CATALYST PARTICLE
FLOW CHANNEL WITH THE MINIMUM CROSS-SECTION
Figure 2. Sketch 6f the flow geometry used to predict pulsing in the model of Dimenste in & Ng (.1986)

274 P A Ramachandran, M P Dudukovid and P L Mills
sometime lead to the blocking of a large part of the cross-section for flow. When the liquid holdup has reached a certain level, the total blockage starts moving. This corresponds to the onset of pulsing. The mechanism suggests that stochastic components need to be introduced in any model to calculate the conditions for flow transition.
The above discussion indicates the need for substantial work in this area. More data are clearly needed for large diameter columns and porous packings. Most of the studies have been done with nonporous packings. The reported capillary models (approach used by Hofmann and Sicardi, Ng etc.) need to be rigorously solved by finite element methods to explore their true behaviour and relationship to observed bed behaviour. Both steady state and transient hydrodynamics need to be simulated. The transient simulations provide useful information on the onset of flow instabilities. Single capillary models can then be incorporated using percolation concepts into a bed scale model to take into account the randomness of the bed. It may also be necessary to introduce stochastic components into the model. For practitioners, experimental information on the effect of operating variables such as column diameter, packing diameter, pressure, temperature etc., on the onset of pulsing would clearly be useful. For preliminary calculations the flow chart proposed by Talmor (1977) is useful as it covers a wide range of physical properties. For a quick calculation the flow map of Charpentier & I~avier (1975) or the approximate criterion of Blok & Drinkenburg (1982) would be used.
3. Pressure drop and holdup
For predicting the pressure drop and holdup in trickle-beds, it has been fo~md convenient to consider the low interaction and high interaction regimes separately.
3.1 Low interaction regime: Pressure drop
Specchia & Baldi (1977) proposed a model for the calculation of pressure drop on the basis that the gas flow in the bed is restricted by the presence of the liquid. The effective porosity then is e~ff = e8 - ets - eta. Now the Ergun equation is used with this modified porosity to correlate the frictional pressure drop.
C1 tZGU~;(1-- eeff) 2 C2 pGu~(1- eeff) a t a - 2 3 ~ - - - (12)
E eft d p e eft dp 2
It was suggested that C 1 and C2 be determined for single phase flow of gas in a prewetted bed, In this case eeff = eB-ets . A knowledge of static holdup is necessary when using the procedure. Values of C1 and Cz obtained for the air-water system on some packings are shown below:
Packing C1 C2 2-5 mm Raschig rings 316 4.0 4 mm Raschig rings 517 3.4 6 mm Raschig rings 384 3.4 3 mm spheres 227 1.52
Trickle-bed reactors 275
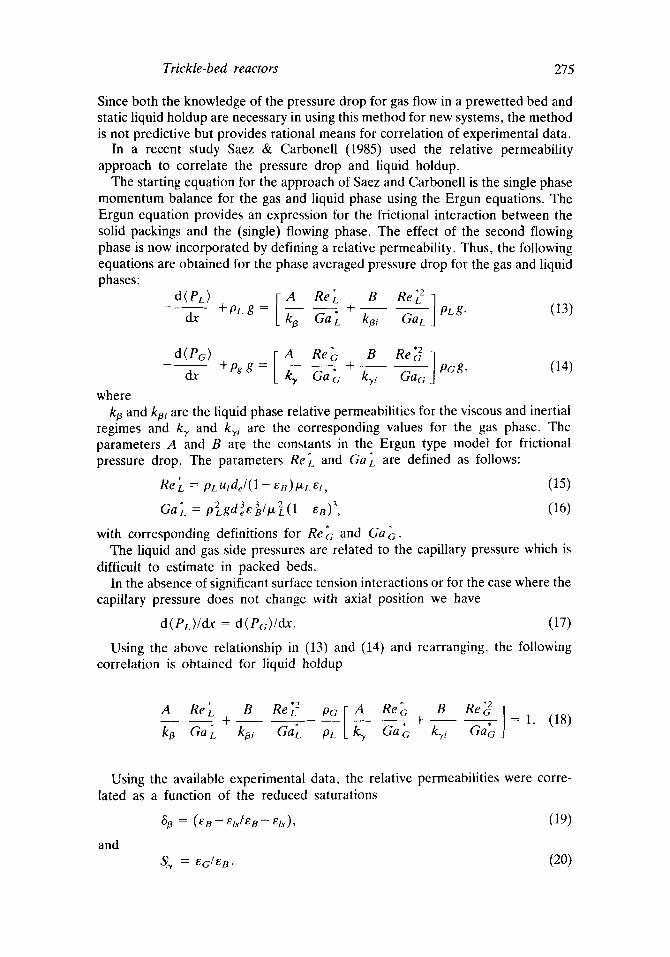
Since both the knowledge of the pressure drop for gas flow in a prewetted bed and static liquid holdup are necessary in using this method for new systems, the method is not predictive but provides rational means for correlation of experimental data.
In a recent study Saez & Carbonell (1985) used the relative permeability approach to correlate the pressure drop and liquid holdup.
The starting equation for the approach of Saez and Carbonell is the single phase momentum balance for the gas and liquid phase using the Ergun equations. The Ergun equation provides an expression for the frictional interaction between the solid packings and the (single) flowing phase. The effect of the second flowing phase is now incorporated by defining a relative permeability. Thus, the following equations are obtained for the phase averaged pressure drop for the gas and liquid phases:
[ * B Re~2j d(PL) A Re L + PLg, (13) dx + PL g = kt 3 Ga [ kt3 i GaL
* * 2 d(Pc,) [ A ReG B ReG 1
- = - - • + - Pc, g, (14) dx + pg g k. e Ga G k-yi Gac
where kt3 and kt3i are the liquid phase relative permeabilities for the viscous and inertial
regimes and kr and k~i are the corresponding values for the gas phase. The parameters A and B are the constants in the Ergun type model for frictional pressure drop. The parameters Re~ and Ga~. are defined as follows:
Re[ = pL Utde/( l -- gB ) tZL el , (15)
Ga*L = p2gd3 3 ee B/IZ eL (1 - en )-, (16)
with corresponding definitions for Re*G and Ga *c;. The liquid and gas side pressures are related to the capillary pressure which is
difficult to estimate in packed beds. In the absence of significant surface tension interactions or for the case where the
capillary pressure does not change with axial position we have
d(nL)/dx = d(Pc;)/dx. (17)
Using the above relationship in (13) and (14) and rearranging, the following correlation is obtained for liquid holdup
A ReL B Re[ 2 p c ; [ A Re*c, B R e ~ ]
* + - kyi GaG kt3 GaL k;ji Ga[ Pt. k v Ga*c;, + . = 1. (18)
Using the available experimental data, the relative permeabilities were corre- lated as a function of the reduced saturations
~ = ( e B - e ~ / 8 8 - 8 ~ ) , (19)
and 8~ = ~#eB. (20)
276 P A Ramachandran, M P Dudukovid and P L Mills
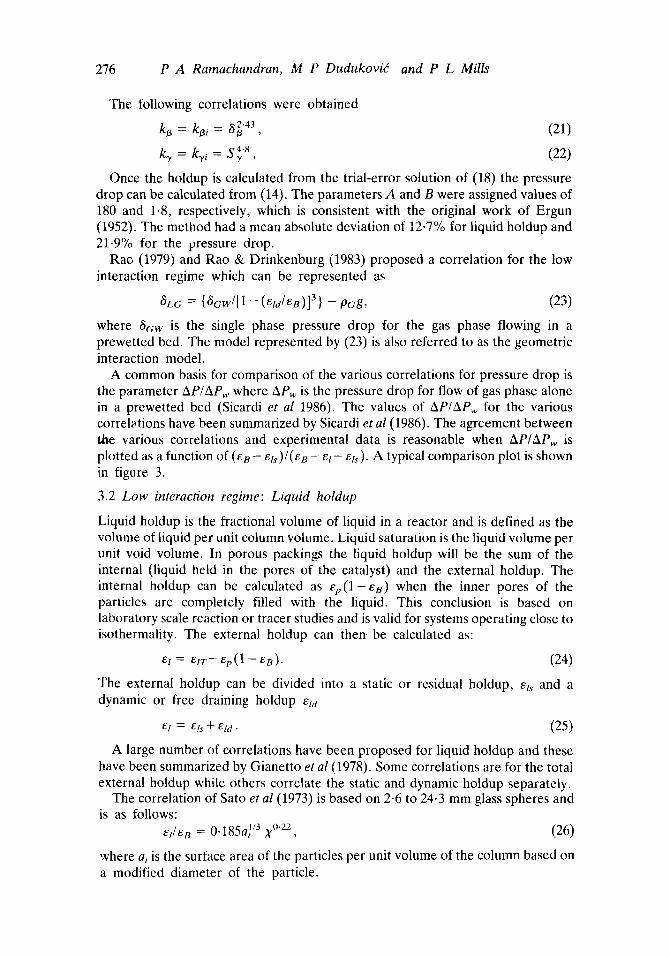
The following correlations were obtained
kt 3 = k 9 i _ ~g.43 (21)
k.~ = k./ i : S 4"8 , ( 2 2 )
Once the holdup is calculated from the trial-error solution of (18) the pressure drop can be calculated from (14). The parameters A and B were assigned values of 180 and 1.8, respectively, which is consistent with the original work of Ergun (1952). The method had a mean absolute deviation of t2-7% for liquid holdup and 21-9% for the pressure drop.
Rao (1979) and Rao & Drinkenburg (1983) proposed a correlation for the low interaction regime which can be represented as
6£c = {6cw/[1 - (e;d/eB)] 3} -- Pag, (23)
where 6cw is the single phase pressure drop for the gas phase flowing in a prewetted bed. The model represented by (23) is also referred to as the geometric interaction model.
A common basis for comparison of the various correlations for pressure drop is the parameter AP/APw where APw is the pressure drop for flow of gas phase alone in a prewetted bed (Sicardi et al 1986). The values of AP/APw for the various correlations have been summarized by Sicardi et al (1986). The agreement between tb, e various correlations and experimental data is reasonable when AP/APw is plotted as a function of (ee - g l s ) / ( e B -- e l - e l s ) . A typical comparison plot is shown in figure 3.
3.2 Low interaction regime: Liquid holdup
Liquid holdup is the fractional volume of liquid in a reactor and is defined as the volume of liquid per unit column volume. Liquid saturation is the liquid volume per unit void volume. In porous packings the liquid holdup will be the sum of the internal (liquid held in the pores of the catalyst) and the external holdup. The internal holdup can be calculated as ep(1-eB) when the inner pores of the particles are completely filled with the liquid. This conclusion is based on laboratory scale reaction or tracer studies and is valid for systems operating close to isothermality. The external holdup can then. be calculated as:
e l = e f T - - e p ( 1 - - e B ) . (24)
The external holdup can be divided into a static or residual holdup, ets and a dynamic or free draining holdup e;d
el = els + g l d . (25)
A large number of correlations have been proposed for liquid holdup and these have been summarized by Gianetto et al (1978). Some correlations are for the total external holdup while others correlate the static and dynamic holdup separately.
The correlation of Sato et al (1973) is based on 2.6 to 24.3 mm glass spheres and is as follows:
e//e/~ = O" 185a]/3 X °'22, (26)
where a, is the surface area of the particles per unit volume of the column based on a modified diameter of the particle.

Trickle-bed reactors 277
A p
A P w
10
8
6
4
2
t v G = O - ~ m / s
2 v G : O . S m / s
:3 v G = 1 . O m / s
0 v L = 2 . B ' S x l ( ~ 3 m / s ,
I I VL = 7 " O O x ~ O 3 m / $ ' exp .
0 0
0
t V ] t I I I J 1.0 1.1 1.2 1-3 1-4 1.5 1.6
£B- £~s
EB - £1 - £ 1 s
Figure 3. Comparison plot for various models for pressure drop prediction. Adapted from Sicardi et al (1986). Packings: 6 mm glass sphere; system: air-water,
a, = 6(1 - eu)/d*p, (27)
where d~ is the diameter of the particle modified to account for wall effects.
, d~ ( 2 8 )
dp = 1 + [ 4 d j 6 d r ( 1 - e~) "
Midoux et al (1976) proposed the following correlation for e/based on 3 mm glass and catalyst spheres and 1.8x 6 and 1.4× 5 mm catalyst cylinders:
el/eB = 0"66X°81/(l+O'66X°'Sl) , for 0.1 < X < 80. (29)
The parameter X in (26) and (29) is the square root of the ratio of pressure drop for gas and liquid flowing alone in the bed. This correlation is valid for nonfoaming systems for all hydrodynamic regimes, and for foaming systems for low interaction regimes. A separate correlation for foaming systems at high interaction regimes has been proposed by these authors.
Some correlations consider ets and eta separately, and these have a stronger theoretical basis, since ejj is affected by all the operating parameters, while et.~
278 P A Ramachandran, M P Dudukovi6 and P L Mills
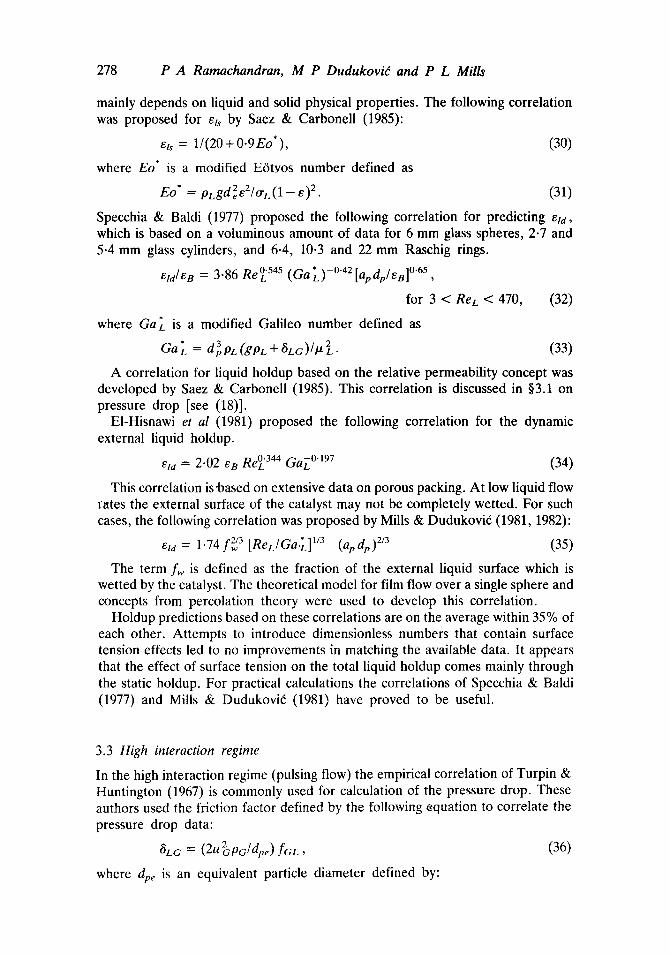
mainly depends on liquid and solid physical properties. The following correlation was proposed for ets by Saez & Carbonell (1985):
ets = 1/(20 + 0.9Eo*), (30)
where Eo" is a modified E6tvos number defined as
Eo* = pLgd2e2/o'L(1 -- e) 2. (31)
Specchia & Baldi (1977) proposed the following correlation for predicting etd, which is based on a voluminous amount of data for 6 mm glass spheres, 2.7 and 5.4 mm glass cylinders, and 6.4, 10.3 and 22 mm Raschig rings.
etd/eB = 3"86 Re~ 545 (Ga ~)-0.42 [apdp/eB]O.65,
for 3 < Ret. < 470, (32)
where Ga [ is a modified Galileo number defined as
Ga~ 3 = dpPL (gPL + t$LG)/IZ2L . (33)
A correlation for liquid holdup based on the relative permeability concept was developed by Saez & Carbonell (1985). This correlation is discussed in §3.1 on pressure drop [see (18)].
EI-Hisnawi et al (1981) proposed the following correlation for the dynamic external liquid holdup.
eta = 2"02 eB Re O'344 a a L 0"197 (34)
This correlation is "based on extensive data on porous packing. At low liquid flow pates the external surface of the catalyst may not be completely wetted. For such cases, the following correlation was proposed by Mills & Dudukovid (1981, 1982):
etd = 1"74f~ 3 [ReL/Ga.~] 1/3 (apdp) 2/3 (35)
The term fw is defined as the fraction of the external liquid surface which is wetted by the catalyst. The theoretical model for film flow over a single sphere and concepts from percolation theory were used to develop this correlation.
Holdup predictions based on these correlations are on the average within 35% of each other. Attempts to introduce dimensionless numbers that contain surface tension effects led to no improvements in matching the available data. It appears that the effect of surface tension on the total liquid holdup comes mainly through the static holdup. For practical calculations the correlations of Specchia & Baldi (1977) and Mills & Dudukovid (1981) have proved to be useful.
3.3 High interaction regime
In the high interaction regime (pulsing flow) the empirical correlation of Turpin & Huntington (1967) is commonly used for calculation of the pressure drop. These authors used the friction factor defined by the following equation to correlate the pressure drop data:
6LG = (2U2 pG/dpe) fGL, (36)
where dpe is an equivalent particle diameter defined by:
Trickle-bed reactors 279
dpl = ~ (dpen)/(1 - eB). (37)
The two-phase friction factor is then correlated by the following equation (Specchia & Baldi 1977):
In foc = 7.82 - 1.30 In + 0.573 In , (38)
where
and
Z r , 1 - 1 6 7 / n 0-767 = l ~ e G / l ~ e L , (39)
q, = (O-w/O-,_)[m (40)
The liquid holdup in the high interactive regime was also correlated by Specchia and Baldi using the parameter Z.
e/d = 0"123 eB(Z/@ TM )-0.312 [ap dp,,/eB] °'7"~ (41)
Experimental measurements of the holdup data and the corresponding actual liquid velocities indicate that a part of the liquid in the pulsing regime travels at a high velocity, which is comparable to the actual gas velocity. The fraction of the liquid travelling at high velocity probably corresponds to the liquid in excess of that required to cause pulsing. The analogy between this and a gas-solid fluidized bed is worth noting here. In a fluidized bed, the gas in excess of that required for minimum fluidization travels as a bubble phase. It appears that there is a hydrodynamic similarity between the fluidized bed and the pulsing trickle-bed and this analogy should be exploited in further basic studies.
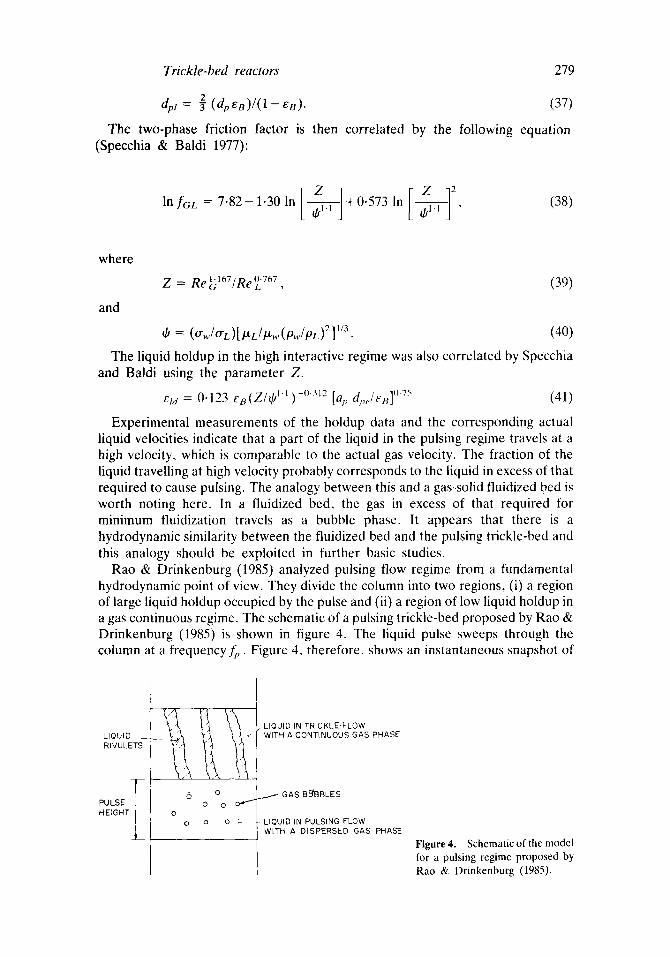
Rao & Drinkenburg (1985) analyzed pulsing flow regime from a fundamental hydrodynamic point of view. They divide the column into two regions, (i) a region of large liquid holdup occupied by the pulse and (ii) a region of low liquid holdup in a gas continuous regime. The schematic of a pulsing trickle-bed proposed by Rao & Drinkenburg (1985) is shown in figure 4. The liquid pulse sweeps through the column at a frequency fi,. Figure 4, therefore, shows an instantaneous snapshot of
LIQUID _ RIVULETS
PULSE j~- HEIGHT L
JL
6 o o o
o
o o o
LIQUID IN TRICKLE-FLOW WITH A CONTINUOUS GAS PHASE
GAS BfJBBLE S
LIQUID IN PULSING FLOW WITH A DISPERSED GAS PHASE
Figure 4. Schematic of the model for a pulsing regime proposed by Rao & Drinkenburg (1985).

280 P A Ramachandran, M P Dudukovid and P L Mills
the column. If the pulse velocity is vz, then the number of pulses per unit column height isfp/V r and therefore the fraction. HpT, of a unit column height occupied by the pulse is equal to NpHz, where Ht, is the pulse height.
The pressure drop is assumed to consist of three independent contributions: (i) pressure drop due to geometric interaction in the gas continuous region, (ii) pressure drop due to geometric interaction in the pulse, and (iii) additional contribution due to dynamic interaction in the pulse regime resulting from the gas bubble formation, liquid accclcr,ttion and liquid turbulence. The pressure drop per unit column height can therefl~re be expressed as
61,c; = (l-Ht,7)6c~:,c;c +HpTaL¢;.pWaLG, B+~LG, M+t~LG,A, (42)
where, 6Lc,,c,c is the pressure drop contribution from the gas continuous region (trickling flow part of the column), 6Lc,,p = pressure drop contribution from the pulsing part of the column,
6LC,,B = extra pressure drop due to gas dispersion into the pulse,
61~c.a4 = pressure drop due to mixing and turbulence in the liquid pulse,
6LC,A = pressure drop due to liquid acceleration as the liquid enters a pulse.
Equations have been developed for calculating each of the above pressure drop contributions by Rao & Drinkenburg (1985). For the sake of brevity, those equations are not reproduced here. A satisfactory fit of the experimental data (+ 30%) was obtained by using their model. The pressure drop due to bubble dispersion and pressure drop due to liquid acceleration were found to be comparable to each other at low liquid rates. At higher rates the bubble dispersion pressure drop dominates over the accleration pressure drop. The mixing pressure drop was not found to be important.
The above model results in a large number of basic parameters to characterize the flow in a trickle-bed. These are pulse frequency, pulse velocity, pulse height, liquid holdup in the trickling part of the pulse and liquid holdup in the pulsing part. These hydrodynamic parameters were measured in an earlier paper by Blok & Drinkenburg (1982). The total liquid holdup was determined by a tracer technique and the pulse properties were determined by conductivity measurements with two sets of conductivity cells (wire mesh nettings) placed 5 cm apart. The time difference between the minimum resistance values for the two signals, in combination with the distance between the two electrode sets, provides the value of pulse velocity. The conductivity cell was also calibrated separately by operating in the gas continuous flow regime using independent liquid holdup measurements by tracer techniques. Using these calibrations, the pulse holdup and base holdup (that in the trickling part of the column) could be measured. Pulse frequency would be measured by noting the time at which the minimum resistance value is attained at either of the two conductivity probes. In a recent study Christensen et al (1986) used a microwave probe to determine the flow parameters for the pulsing regime. A two-dimensional rectangular column was used in this work. It was observed that the pulse did not span the entire column cross-section unlike the case of small diameter columns.
A model to calculate the pressure drop in pulsing flow was also developed by
Trickle-bed reactors 281
Dimenstein & Ng (1985). The model is similar to the approach of Rao and Drinkenburg and the pressure drop is calculated as the sum of the two contributions from the pulsing and trickling part of the column. For each of these calculations a form of Ergun equation was used. Additional contribution to pressure drop resulting from the liquid acceleration as the liquid enters a pulse was introduced. The contributions of liquid deceleration and gas dispersion was not accounted for unlike in the work of Rao and Drinkenburg. Further, the Ergun coefficient for a dry bed was used. The model appears to be satisfactory at moderate gas flow rates. Further work is clearly needed along these directions especially using porous catalysts for experiments.
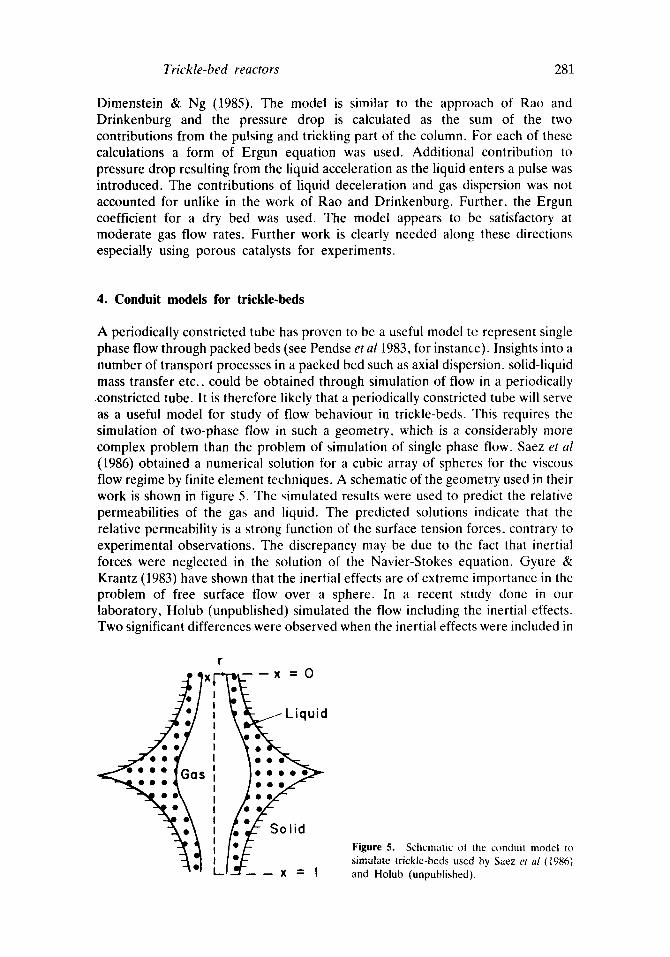
4. Conduit models for trickle-beds
A periodically constricted tube has proven to be a useful model te represent single phase flow through packed beds (see Pendse et al 1983, for instance). Insights into a number of transport processes in a packed bed such as axial dispersion, solid-liquid mass transfer etc., could be obtained through simulation of flow in a periodically constricted tube. It is therefore likely that a periodically constricted tube will serve as a useful model for study of flow behaviour in trickle-beds. This requires the simulation of two-phase flow in such a geometry, which is a considerably more complex problem than the problem of simulation of single phase flow. Saez et al
(1986) obtained a numerical solution for a cubic array of spheres for the viscous flow regime by finite element techniques. A schematic of the geometry used in their work is shown in figure 5. The simulated results were used to predict the relative permeabilities of the gas and liquid. The predicted solutions indicate that the relative permeability is a strong function of the surface tension forces, contrary to experimental observations. The discrepancy may be due to the fact that inertial forces were neglected in the solution of the Navier-Stokes equation. Gyure & Krantz (1983) have shown that the inertial effects are of extreme importance in the problem of free surface flow over a sphere. In a recent study done in our laboratory, Holub (unpublished) simulated the flow including the inertial effects. Two significant differences were observed when the inertial effects were included in
•
.JJ" i :o o o o I
Gas I l * u , 0~..~ • I / . , o ~
- ' ~ . ° ° \ t p o ~ -
- ~ o\ i A, - ' ~ o \ i I o S o l i d
L --X -- I
Figure 5. Schematic ol the conduit model to simulate trickle-beds used by Saez et al (1986) and Holub (unpublished).
282 P A Ramachandran, M P Dudukovi6 and P L Mills
the computations: (i) the gas-liquid interface shape becomes flatter indicating a reduced role of surface tension which is consistent with experimental trends, (ii) a recirculating flow developed near the solid surface. Work is currently in progress in correlating the basic trickle-bed design parameters using this approach.
The constricted tube model does not fully represent the liquid mixing that takes place at packing junctions. For this purpose, more complex pore space models used to study the transport phenomena in porous media are likely to prove useful. The single constricted capillary forms a basic unit cell here and these pore space models essentially consist of constricted capillaries connected in series and/or in parallel and have proved successful in predicting the various phenomena such as hysteresis etc. (Hysteresis behaviour has also been observed in trickle-beds with nonporous packings as shown by Kan & Greenfield 1978, and others.) Van Brakel (1975) has provided a useful summary of the various models. Alternatively, the constricted capillaries could be connected using the percolation concepts (Crine et al 1980) to develop a model for the flow in trickle-beds. The advantage of using the two-phase flow in constricted tubes to represent the various bonds in the percolation context is that considerable basic physics can be imbedded into the model. Significant progress in this direction can be expected in the near future.
5. Use of tracers
A number of basic design parameters in trickle-beds can be obtained using tracers. Due to the heterogeneous nature of the system, the interpretation of tracer data is more complicated as compared to single phase systems. This section of the paper summarizes the progress in this area.
Nonvolatile nonadsorbing tracers have been traditionally used to evaluate liquid ho!dup and backmixing. These studies have been summarized by Schwartz et al (1976), Dudukovi6 & Mills (1986) and Ramachandran & Chaudhari (1983).
Following the work of Schneider & Smith (1968) and of Colombo et al (1976), the first and second moment equations for a pulse input are
~, = (L/uL) [e t+(1-eB) (ep+ppK'a)], (41)
and
~ = [(2/Pe) - (2~Pc 2) (1 - e-Pe)] k~
+ [6(1 - eB)RZL/uL] (ep +ppK'a)2 [(1/45De) + (1/9ksR)]. (42)
Equation (42) is based on the assumption that the adsorption rate is very rapid and that axial dispersion can be used to describe the flow pattern of the external liquid. For a nonadsorbing tracer (i.e., K)~ = 0), (41) can be expressed as
~x = etrL/UL, (43)
where elf is the total (external as well as internal) liquid holdup and is defined by (24). Liquid holdup can therefore be obtained from the measured first moments. For an adsorbing tracer an additional contribution of the adsorption equilibrium constant to ~J~l results as indicated by (41). The adsorption acts as a time delay for the process.
Trickle-bed reactors 283
In the case of a partially wetted catalyst, Schwartz et al (1976) suggested a modified equation for the first moment:
I~1 = ( L / u L ) [e/T+f,-(]--eB)ppK'm], (44)
where fi is the wetted fraction of the total internal area of the catalyst. The basis for the derivation of (44) is that adsorption occurs only from the wetted portions of the catalyst, and hence the factor f, appears in the second term of (45).
The measurement of "the first moment using both an adsorbable and a nonadsorbable tracer under identical operating conditions can therefore be used to predict the fraction of the internal area wetted by the catalyst. This can be done by measuring/~1 for an adsorbing and nonadsorbing tracer in a trickle-bed as well as in a liquid filled bed at identical flow rate. Using these data, ~ can be directly calculated as
fi = [ ( ~/~1TB )adsorbing -- ( ~'l'l TB )nonadsorbing]/[ ( ~1 LF )adsorbing -- (/2'ILF )nonadsorbing ], (45)
where the subscripts TB and LF refer to trickle-bed and liquid full operations, respectively.
Equation (45) is model independent based on the sound theoretical background of the central volume principle (Buffham & Kropholler 1973). The experimental data show that the internal pore filling is complete for moderately isothermal conditions probably due to capillary action.
The second moment data may be useful in determining the axial dispersion coefficient (Schwartz et al 1976) but the results are accurate only for nonporous packings. This is because the spread in tracer response is a combined effect of axial dispersion and intraparticle diffusion for porous particles. (The second term on the RHS of (42) is often much larger than the first term which represents the contribution of axial dispersion.) Methods of decoupling the external nonidealities will be discussed in §6.
Tracer methods can also be used to evaluate the external contacting efficiency in trickle-bed. External contacting efficiency refers to the fraction of the external catalyst surface wetted by the liquid. The evaluation of this parameter by tracer methods is however not well defined and no theoretical basis is available. If one uses the equations derived by Suzuki & Smith (1970) and Sagara et al (1970), an effective intraparticle diffusivity can be calculated from the measured variance of the impulse response of a completely wetted pellet for a nonvolatile tracer. The intraparticle diffusivity calculated from the experimental impulse response in trickle-beds from this model is found to be less than the value obtained by independent means (for example from tracer experiments from a liquid full operation which ensures complete wetting). This apparent difference in intraparti- cle diffusivity was attributed due to the effects of incomplete external contacting by Colombo et al (1976) who proposed the formula
fw = [(De)Trickle bed / (De)L iqu id full l ' /2 ' (46)
The results o f f w computed by this method did not however agree well with other experimental evidence. To correct for that Baldi & Gianetto (1980) suggested the following equation:
fw = [ ( D e ) T r i c k l e bed/(De)ciqu,d fun] 1/2. (47)

284 P A Ramachandran, M P Dudukovi6 and P L Mills
This formula provides data that seem to be in agreement with reaction studies (Mills & Dudukovi6 1981, 1982) but lacks a firm theoretical basis. How tracer data should be properly interpreted and contacting efficiency extracted is an important question that needs to be answered.
In a recent study, Ramachandran et al (1986b) analysed theoretically the dynamic response of a catalyst particle whose external surface is only partially wetted. This leads to a new type of transient mixed boundary value problem which can be solved by a dual series technique. The solutions presented in the Laplace domain provides a method for determining the external contacting efficiency without the need for involving any heuristic arguments as done in earlier studies. Preliminary results indicate that a single exponent for the diffusivity ratio such as 0-5 or 1 may not be found for the entire range of contacting efficiencies and the exponent would be a function of the contacting efficiency.
6. Decoupling tracer response
As indicated in the last section, the measured tracer response is a combined effect of the global (axial dispersion, nonuniform distribution, bypassing etc.) and local or particle scale (incomplete contacting, intraparticle diffusion etc.) nonidealities and it is necessary to decouple the effects in order that the tracer data can be effectively used for scaleup and also for diagnostics of malfunctioning units. Recently, considerable progress has been made in this area (Kennedy & Jafee 1986; Ramachandran et al 1986a) and the key points will now be reviewed without going into detailed derivations.
The procedure is based on the assumption that the nonvolatile nonadsorbing tracer follows the path that a nonvolatile reactant would take. We also assume that the system can be divided into two regions (the bulk liquid and the catalyst) which communicate with each other through a transfer or exchange coefficient. Generalization to systems with more than two regions is straightforward and might be necessary to include effects such as bypassing or presence of static holdup, etc., but is not dealt with explicitly here.
The dynamic response of a nonadsorbing nonvolatile tracer can be represented as
, ~ ( C L ) ~- E 1 O C L / O t + k e x [ C L - Cp], (48)
where Ct. is the concentration of the tracer in the external liquid (whose holdup is et), Cp is the concentration of tracer corresponding to the particle phase, ~£ is a differential or algebraic operator characterizing the nonidealities of flow of the external fluid, kex is the exchange or mass transfer coefficient between the two regions and t is the time elapsed since tracer was introduced.
To illustrate this equation more clearly, if the axial dispersion model is used for the external liquid, then ~ takes the form:
02 0 ~£(CL) = DEL ,~x-'-- ~ (CL)--UL-z-- (CL).
dX (49)

Trick le -bed reactors 285
Taking the Laplace transform of (48) one obtains
= LsrL + (50) _Using a model for the dynamic response of the catalyst particle, the quantity
( C L - C p ) can be expressed as
C---L - -Cp = -C L H ( S ) , (51)
where H(s~[ now represents a particle scale transfer function. Using this relationship, (50) can be represented as
where
- [ kox/4(s) - (CL) = ] = ,Qp, (52)
et 3
p = s + k e x H ( s ) / e t . (53)
The dynamic response of a tracer which stays only in the external fluid can be expressed in Laplace domain as
"~ CL,e = elS ~'L,e, (54) where the subscript e is used to indicate that the measured response represents only the external nonidealities.
The analogy between (52) and (54) provides a method for isolating the residence time distributio'n of the external fluid alone. The procedure is as follows. From the actual experimentally obtained response in the time domain of the nonadsorbing nonvolatile tracer we obtain the response in the Laplace domain for various,yalues of s by integration as shown below:
CL, (S) = e - " Ct,1 ( t ) dt, (55) 0
where the subscript 1 indicates the outlet of the reactor. To start with we assume a model for particle scale contacting. This gives us a
specific form for H(s ) .For each valueof s, one can calculate p = s + kex ( H ( s ) / e t ) and group the data as CL1 vsp. Then CL1 (p) gives directly the nonidealities of the external fluid in the Laplace domain and the exit age density function for the external fluid_ can be obtained by inversion of CLI(p), i.e., Cm(t) = ~- l{Cm(p)} . The procedure is shown schematically in figure 6.
If the tracer were of the adsorbing type with a linear isotherm, the above procedure is still valid provided the necessary modification to H ( s ) is made to include the effects of adsorption. Use of adsorbing vs non-adsorbing tracer now offers the possibility of discriminating between the assumed particle scale models. Experiments with several tracers of different adsorptivity can be performed. The correct particle scale model should result in the identical model for sojourn times for the external fluid. This procedure (two independent experiments with nonadsorbing and adsorbing tracer) then determines both the particle scale and bed scale transfer functions uniquely,
The response of the external liquid in the Laplace domain can also be used to

286 P A Ramachandran, M P Dudukovi~ and P L Mills
t !
Eex t (t)
w
r~r t
J'o®6 st E(t)dt E ( s ) ~ b
II s
+ KexH(s)
£t
C' (~:(p)} E:(P) d (
rrr P
Figure 6. Procedure to decouple external liquid transfer function from the measured tracer response.
calculate the conversion of a first order liquid limiting reaction:
1 - X = CLt,ep = kexH(kp)/e l (56)
where kp represents the rate constant for a first order reaction per unit catalyst pore volume. Thus, if kp is known from independent measurement the conversion can be predicted in the trickle-bed reactor and matched with experiments. This will provide an additional check on the consistency of the data.
Kennedy & Jaffee (1986) used a similar procedure to determine the flow maldistribution in trickle-beds. The particle transfer function was assumed to be that for a completely wetted spherical catalyst. The form of H(s) for this case is given by Ramachandran & Smith (1979a).
H(s) = (De/ksR) { ( e p s / O e ) 1/2 R coth [(eps/Oe)l/2R] -- 1}/
[1 + (Oe/ksR){(eps/Oe) 1/2 R coth [(eps/Oe)l/2g] -- 1}. (57)
It may be noted here that the contribution of the solid-liquid mass transfer is often negligible in the above equation. This would simplify the transfer function even further.
The flow maldistribution in the external fluid could be isolated by this method. Using the transfer function of the external fluid, Kennedy and Jaffee modelled the reactor as two zones with unequal mass flux but otherwise in ideal plug flow (figure 7). The impact of the flow distribution on the reactor performance was estimated by coupling a kinetic model to the flow model.
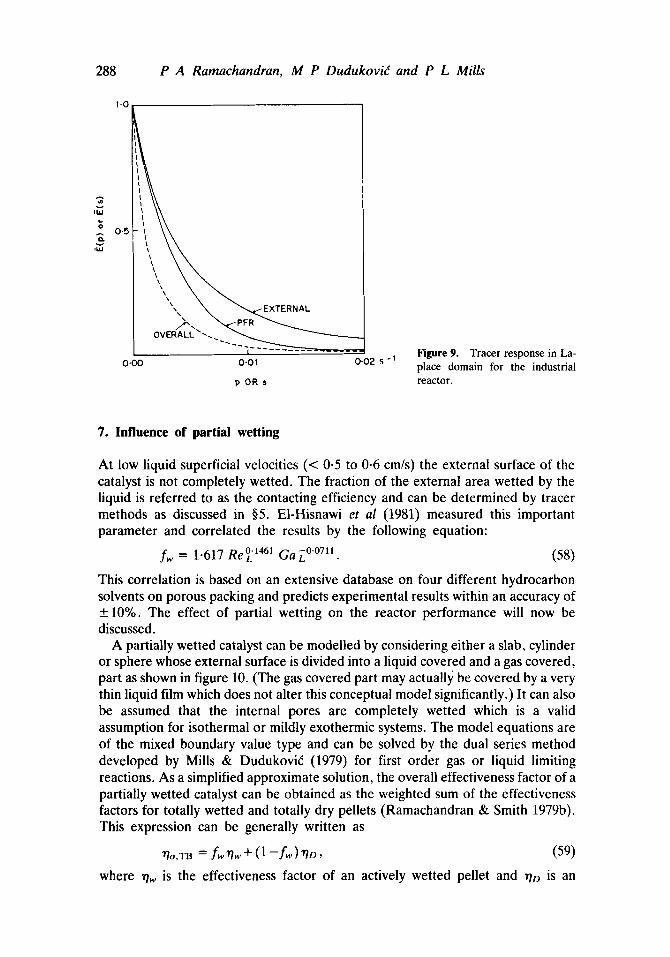
The above procedure for decoupling the transfer function was applied to an industrial reactor by Ramachandran et al (1986b). A tracer curve for an industrial reactor isshown in figure 8. The corresponding overall response in the Laplace domain CLI(S) and the response of the external fluid alone obtained by the decoupling procedure CLI,e(P) is shown in figure 9. If the external fluid were in plug flow the Laplace response would be given as 1 - exp ( - fs), where i is the mean

Trickle-bed reactors 287
GAS
1-W G
rain -1
LIQUID
W i 1-W L W G
F I
Figure 7. Reactor model for industrial scale trickle-beds proposed by Kennedy & Jaffee (1986).
residence time of the liquid in the reactor. This response is also shown in figure 9 for comparison. It is seen that the flow pattern of the external liquid in the industrial reactor deviates considerably from plug flow behaviour.
E(I)
0"05
0
0"10
0 20 I
4 0 rain
TIME
Figure 8. Tracer curves for a 2-1 m diameter industrial reactor.
288 P A Ramachandran, M P Dudukovi6 and P L Mills
"G
,W
1.0
0.5
0.00
\,
"\" TERNAL
OVER-ALL "-.._ ~ ~
0.01 0.02 s
p O R s
- 1 Figure 9. Tracer response in La- place domain for the industrial reactor.
7. Influence of partial wetting
At low liquid superficial velocities (< 0.5 to 0.6 cm/s) the external surface of the catalyst is not completely wetted. The fraction of the external area wetted by the liquid is referred to as the contacting efficiency and can be determined by tracer methods as discussed i n §5. EI-Hisnawi et al (1981) measured this important parameter and correlated the results by the following equation:
fw = 1.617 Re °'1461 GaL °'°711. (58)
This correlation is based on an extensive database on four different hydrocarbon solvents on porous packing and predicts experimental results within an accuracy of + 10%. The effect of partial wetting on the reactor performance will now be discussed.
A partially wetted catalyst can be modelled by considering either a slab, cylinder or sphere whose external surface is divided into a liquid covered and a gas covered, part as shown in figure 10. (The gas covered part may actually be covered by a very thin liquid film which does not alter this conceptual model significantly.) It can also be assumed that the internal pores are completely wetted which is a valid assumption for isothermal or mildly exothermic systems. The model equations are of the mixed boundary value type and can be solved by the dual series method developed by Mills & Dudukovi6 (1979) for first order gas or liquid limiting reactions. As a simplified approximate solution, the overall effectiveness factor of a partially wetted catalyst can be obtained as the weighted sum of the effectiveness factors for totally wetted and totally dry pellets (Ramachandran & Smith 1979b). This expression can be generally written as
r/o,TB = fwr/~ + (1 --f~) no, (59)
where ~Tw is the effectiveness factor of an actively wetted pellet and r/o is an

Trickle-bed reactors 289
0 o . A. SLAB ~ SPHERE
C. CYLINDER Figure 10. Representation of partial ex- ternal wetting for various catalyst shape adapted from Mills & Dudukovi6 (1979).
effectiveness factor of a dry or an inactively wetted pellet. The equations Bw and ~D for a slab geometry are as follows:
~w = 1/[(ck2/Biw) + (~b/tanh ~b)], (60)
71t) = 1/[(ck2/Bit) ) + (~b/tanh ~b)], (61)
where Biw and Bit) are the Biot numbers for the wet and dry portions defined as ks.,,R/De and ks.oR~De respectively. Here ~b is the Thiele modulus for a first-order reaction.
The corresponding equations for cylindrical and spherical geometry have been provided by Mills & Dudukovi~ (1980). The maximum error between the approximate solution and the exact solution is 12-8% for a gas limiting reaction and 38% for a liquid limiting reaction.
When the limiting reactant is in the liquid phase, the expression for the overall effectiveness factor of a partially wetted catalyst can be expressed as
' ~ t ) , T B = (fw/~ 2) tanh (~b/f~)/[1 + ('4a/Biw) tanh (~b/f~)]. (62)
This expression is useful for analysing performance data on commercial hydrodesulphurization. It is seen that the overall effectiveness factor depends on three independent parameters fw, ks(Biw) and D e in addition to the rate constants and a simple power law correlation of the type 7o oc u ~ is unlikely to be valid over the entire range. This also explains the fact that when the commercial hydrodesul- phurization data were plotted as ( 1 - X) vs (1/LHSV) on a log-log scale a unique slope was not obtained and the slope varied from 0-53 to 0.92 (Paraskos et a11975).
For power-law kinetics, analytical solutions based on the dual series method are not possible. The exact numerical solution can be approached using Galerkin finite element method as shown in a recent work by Mills et al (1986). In an earlier paper, Goto et al (1981) solved this problem by using a finite difference scheme with a fixed grid size. The solution accuracy can be improved by the finite element method since it is possible to use fine meshes in regions of steep concentration gradients. The diffusional characteristics of catalyst particles of irregular geometry such as trilobes, stars, macaroni or wagon wheels which are patented shapes used in

290 P A Ramachandran, M P Dudukovi6 and P L Mills
residuum hydrotreating (Dautzenberg 1984) can also be easily simulated using finite elements. Additional work in this direction may be necessary to find the optimum catalyst shape for hydrotreating processes.
8. Reactor design
Mills & Dudukovid (1983) proposed a generalized dispersion model for isothermal trickle-beds that include incomplete external contacting and compared various limiting cases of the model to experimental trickle-bed performance data using the hydrogenation of a-methylstyrene as a test reaction. It should be noted that at atmospheric pressure, at which the experiments were conducted, this reaction is gas reactant (hydrogen) limited. Some of the performance equations, that were included, are as follows:
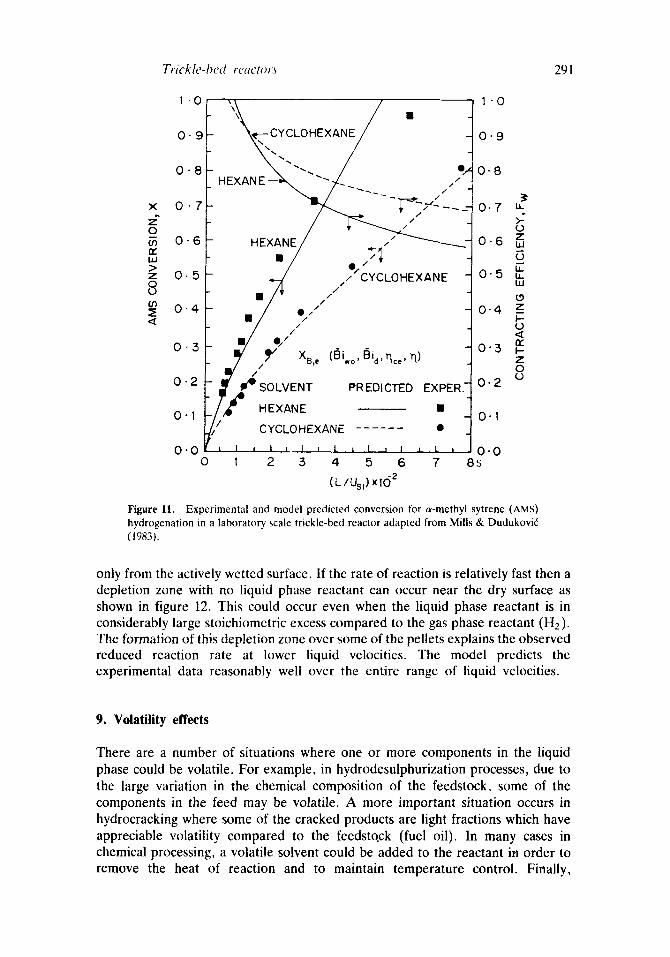
1. Completely wetted pellets with internal diffusion resistance controlling as typically encountered in basket reactors. 2. Completely wetted pellets with gas-to-liquid mass transfer resistance con- trolling. 3. Completely wetted pellets with liquid-to-solid mass transfer resistance con- trolling. 4. Partial externally wetted pellets with finite mass transfer resistance at the actively wetted catalyst surface with negligible mass transfer resistance at the inactively wetted catalyst surface. 5. Partial externally wetted pellets with unequal, finite mass transfer resistances at the actively and inactively wetted catalyst surfaces. The results can be summarized as follows: the model equation for case 1 always greatly overpredicted the measured trickle-bed conversion; while the model predictions for cases 2 and 3 were substantially less than the experimental values when the literature correla- tions for gas-liquid and solid-liquid mass transfer coefficients were used. The model predictions for case 4 underpredicted the experimental conversion for smaller values of space time but gave significant overprediction at larger values of liquid space time. Good agreement between the experimental and predicted values were obtained for case 5 except at very low liquid velocities. A comparison between the experimental and model predicted results is shown in figure 11 for two different reaction solvents (hexane and cyclohexane) along with the external contacting parameter (fw) values predicted by the correlation of EI-Hisnawi et al (1981).
The experimental results are significantly lower than the theoretical results at low liquid velocity, Beaudry et al (1986) developed a model to explain these discrepancies. The model views the trickle-beds as consisting of particles which are completely dry, half wetted and fully wetted. The overall effectiveness factor is obtained by combining the effectiveness factors for thege particles in the following manner
+ 2 no = ( 1 - f w ) 2 n o + 2 ( 1 - f ~ ) f w ~7o~ f~:n~, (64)
where the subscripts D, Dw and w represent dry, half wetted and fully wetted particles, respectively. For a nonvolatile reactant 7/o = 0. For a half wetted slab, the nonvolatile reactant (such as a-methyl styrene) can be supplied to the pellet
Trickle-bed react(,rs 291
1.0
0 . 9
0 . 8
X 0 " 7 z* 0
0 . 6 ne
z 0 . 5 8
0"4
0'3
02) O" 1 ,/
0 " 0 ' 0
HEXANE , , /
~ " %1 /
/ /
• o / /
Xa,e
~e SOLVENT P HEXANE
CYCLOHEXANE
I I I t I l I t I J I
1 2 3 4 5 6
( L/UsO x l() z
1 " 0
-XANE 0 • 9
_ ,, 0-8 /
~ 0 -7
/ /., ,. ~ 0 . 6
~/CYCLOHEXANE 0 " 5 f
/ /
/
0 " 4
0 " 3 ( ~ i o , f3ia,qo,, TI)
, 0 . 0 7 8s
b_
t..) Z UJ (..) la. b- b.I
Z
I - 0 < IX I- Z 0 0
Figure 11. Experimental and model predicted conversion for a-methyl sytrene (AMS) hydrogenation in a laboratory scale trickle-bed reactor adapted from Mills & Dudukovi6 (1983).
only from the actively wetted surface. If the rate of reaction is relatively fast then a depletion zone with no liquid phase reactant can occur near the dry surface as shown in figure 12. This could occur even when the liquid phase reactant is in considerably large stoichiometric excess compared to the gas phase reactant (H2). The formation of this depletion zone over some of the pellets explains the observed reduced reaction rate at lower liquid velocities. The model predicts the experimental data reasonably well over the entire range of liquid velocities.
9. Volat i l i ty effects
There are a number of situations where one or more components in the liquid phase could be volatile. For example, in hydrodesulphurization processes, due to the large variation in the chemical composition of the feedstock, some of the components in the feed may be volatile. A more important situation occurs in hydrocracking where some of the cracked products are light fractions which have appreciable volatility compared to the feedsto, ck (fuel oil). In many cases in chemical processing, a volatile solvent could be added to the reactant in order to remove the heat of reaction and to maintain temperature control. Finally,

292 P A Ramachandran, M P Dudukovi6 and P L Mills
V/////// r / / CATALYST PELLET " / / l ' D q
GAS A )...'~[IQ011J-FILLEI#.P.~.RE-.~\ ~} GAS A
)222;'2//2 4
I , / / / / / / / , / / / / / / , , ' / / [~'..q HALF-WETTED PELLET
I-0
0.5
DEPLETION ZONE WITH NO LIQUID -
REACTANT 0
GASEOUS REACTANT PROFILE
- . p/ LIQUID REACTANT I PROFILE/~l
' / / I
i / / i
, / / I
\ / /
Figure 12. Schematic of a slab which is wetted only on one side and the development of a deple- tion zone for the liquid phase reactant (Beaudry et al 1986).
interpretation of reaction data from a laboratory reactor could lead to errors if one of the liquid phase components is volatile and the effect of volatility is not accounted for (Smith & Satterfield 1986). In spite of the fact that there are a variety of situations where the volatility effects are important, there have been only few analyses of this problem. Collins et al (1985) developed a simple isothermal model for that case assuming that the vapour phase and the liquid phase are at equilibrium at all points in the reactor. Transport effects were not accounted for and the analysis was for a first order liquid reactant limiting case. A related study of Akgerman et al (1985) extended the analysis to various other kinetic schemes (second-order etc.). Complete catalyst wetting was assumed in these models, Ruecker et al (1986) incorporated the effect of partial wetting in a simplified model. The non-isothermal case was analyzed by Hook et al (1986) by imposing an empirically fitted temperature profile in the system. The heat effects due to reaction and solvent volatilization cannot be properly accounted for by the procedure (i.e., when temperature profile is empirically fitted). The latter solvent latent heat effects are particularly important for the situation where the heat of reaction is removed by adding a volatile solvent. Hence, it is necessary to perform additional analysis in trickle-bed reactors for partially volatile liquid phase systems.
Recent experimental studies of Smith & Satterfield (1986) also demonstrate the importance of liquid reactant volatility under certain conditions. It was shown by these authors that for a specified liquid hourly space velocity in a trickle-bed reactor, the degree of conversion of a reactant of appreciable volatility will usually decrease with increasing gas/liquid ratio. The magnitude of this effect will be larger, the higher the order of reaction. For systems with appreciable reactant/product volatility, the selectivity will also be affected by gas-liquid flow ratio ~vhen multiple reactions are taking place. No theoretical analysis or experimental confirmation of

Trickle-bed reactors 293
this has been published. Such a work will be useful in determining the optimum gas-liquid ratio to be used in chemical processing.
Fundamental studies on exothermic reactions in trickle-beds are lacking. Kim & Kim (1981) have developed some equations for predicting the pore dry out due to heat effects. Barkelew & Gambhir (1983) have provided some rules for prevention of hot spots in trickle-bed reactor. The use of these rules assures safe operation of adiabatic trickle-bed reactors. Multiple steady states have been experimentally observed by Hanika et al (1976). Although a comprehensive model is lacking, considerable progress in these directions could be expected in the next decade.
10. Catalyst testing
In industrial practice trickle-bed reactors are customarily used for catalyst testing in either one of the following two cases:
a) It is necessary to develop the scale-up parameters for design of a commercial trickle-bed reactor. Measurement of kinetics and studies of catalyst deactivation would be the major task here. b) It is necessary to compare new catalysts under simulated plant conditions for potential use in existing large scale trickle-beds. Catalyst screening, kinetics, reactor simulation and deactivation studies would be undertaken now.
When comparing different catalysts in trickle-bed reactors it is important to clearly establish what the basis for comparison is. Preferably the catalysts should have the same size and shape and should be tested in the same reactor. Normally, comparisons are made with respect to activity, selectivity, life, mechanical properties and costs. Unfortunately, there is no uniformly accepted definition of catalyst activity. The commonly used measures of activity are:
i) temperature required for a given conversion, ii) conversion achieved at given temperature, iii) space velocity required for a given conversion at given temperature, iv) overall reaction rate at given conditions, v) kinetic parameters from experimental studies.
Dudukovi6 & Mills (1987) recommend that criterion (iii) be used for catalyst comparison in trickle-bed reactors. The success of this procedure depends on three groups of assumptions: (a) the ratio of the catalyst activities is equal to the ratio of observed reaction rates per unit mass of catalyst, (b) that the reaction rate form is the same on various catalysts, and that (c) the trickle-bed behaves as an ideal plug flow reactor with no interphase and intraparticle gradients. Within a relatively narrow range of temperatures (30°C for some systems and over 60°C for others) it is likely that an nth order power law form can describe the apparent kinetics and assumption (a) will appear satisfied, Assumption (b) should hold for catalysts that have similar active sites and act on the same molecular functional groups. Assumption (c) demands a lot of trickle-bed reactor, i.e., absence of reactor scale radial gradients, negligible interphase and intraparticle gradients. Careful inter- pretation of experimental data would be needed if assumption (c) is not satisfied. Details are available in an unpublished report by Mills & Dudukovi~ (1987) which will appear soon and are not presented here.

294 P A Ramachandran, M P Dudukovi6 and P L Mills
11. Summary
This paper summarizes some progress in our understanding of trickle-bed reactors. The recent trend is to correlate the basic hydrodynamic parameters such as flow transition, pressure drop, holdup etc., on the basis of fundamental hydrodynamic models as opposed to purely empirical models used in the past. Separate hydrodynamic models may be necessary for trickle and pulse flow regimes due to additional complexities associated with pulse flow. Significant progress has also been made in our understanding of pulse flow. Analysis of flow in idealized complex geometries which would simulate a trickle-bed porous medium is an active field of research.
Use of tracers to estimate design parameters in trickle-beds such as holdups, contacting efficiency etc., is now a well-established procedure. Advances have been made in developing procedures to decouple bed scale and particle scale nonidealities in trickle-beds. Application to tracer data obtained in industrial size reactors is an active research pro}ee~ in both academia and industry.
Use of a partially wetted catalyst in the shape of a slab, cylinder or sphere, as a model to analyse trickle-bed reactor data has proven to be successful. Although such a simplified picture may be somewhat removed from reality, it provides a reasonable method for assessing the role of incomplete external wetting on reactor performance. Systems with nonlinear kinetics have also been recently simulated using this approach as well as cases where both the reactants could become limiting even though one reactant may be in large stoichiometric excess. Considerable work remains to be done in the area of reactor modelling and experimental verification of systems with volatile liquid phase components, non-isothermal and adiabatic reactions, reactor stability etc.
This paper is dedicated to Dr L K Doraiswamy on his sixtieth birthday. Dr Doraiswamy initiated a significant research programme in the area of multiphase reactors at NCL, Pune, resulting in a number of new technologies, several well-cited publications and a book in this area. One of the authors of this review (P A Ramachandran) had the privilege and pleasure of associating with this group and is grateful to the constant encouragement provided by Dr Doraiswamy.
This work could not have been possible without the industrial support to the Chemical Reaction Engineering Laboratory (CREL) at Washington University and Drs P A Ramachandran and M P Dudukovi6 would like to thank all the industrial sponsors of CREL.
List of symbols
ap at A,B BiD ,Biw
C
external area of particles per unit volume of reactor; surface area ap based on a modified diameter d~ in (27); Ergun constants in (13) and (14); Biot number for the dry and wet portions of the catalyst defined as (ks.t~R)/De and (k ..... R)/De, respectively; empirical constant in (5);

Trickle-bed reactor~" 295
CL CL1 C-'L , (~l. 1
G de
Be d r D~ DEL E(t) eo Y,
g GaL Ga~
.p npT H(s)
ky ~ k ~y i
kex
&,o
, w
ks K~
L ~g
P Pe P (PD
R
concentration of tracer in the external liquid; concentration of tracer in the outlet liquid: Laplace transform of the concentrations; representative concentration in the particle phase; packing equivalent diameter defined as 6 (volume of particle)/(external area); average diameter of catalyst particles; equivalent diameter of particle defined by (37); diameter of the reactor; intraparticle diffusivity of the tracer or reactant; axial dispersion coefficient of the liquid phase; exit age distribution of the liquid phase; modified Eotvos number defined by (31); fraction of the total area of the catalyst (internal and external) wetted by the liquid; pulse frequency; contacting efficiency or the fraction of the external area wetted by the liquid; acceleration due to gravity;
3 2' 2 . Galileo number dpgpL/l~L, modified Galileo number denned by (16) in Saez-Carbonell model or defined by (33) for Specchia-Baldi model; modified Galileo number for gas defined in a manner similar to (16); pulse height of individual pulses; fraction of the reactor height occupied by the pulses; particle scale transfer function; liquid phase relative permeability for the viscous and inertial regime, respectively; gas phase relative permeabilities in the viscous and inertial regimes respectively; exchange coefficient between the bulk phase and the particle phase; rate constant for a first-order liquid phase reaction based on particle pore volume; overall mass transfer coefficient from the gas phase to catalyst surface through the dry portions of the catalyst; mass transfer coefficient from the gas to catalyst through the wet portions; solid-liquid mass transfer coefficient; adsorption equilibrium constant for tracer for linear adsorption isotherm; total height of the reactor; operator describing the nonidealities in the flow of the external liquid; modified Laplace transform parameter defined by (53); liquid phase Peclet number uLL/DEL; pressure; phase-averaged pressure in liquid (or gas with the corresponding subscript); radius of the catalyst pellet;
296 P A Ramachandran, M P Dudukovi6 and P L Mills
ReL S
sy t
UG UL Vp X
X Z
8a
6L
~I.G o r
AP/AL
e~
modified Reynolds number for liquid phase defined by (15). A similar expression holds for Re*c,; Reynolds number for the liquid dpULPL/~L; Laplace transform variable; reduced saturation of the gas defined by (20); time elapsed since the introduction of tracer; superficial velocity of the gas; superficial velocity of the liquid; pulse velocity; axial distance; conversion of the liquid phase reactant; parameter defined by ~39); fraction of the throat area occupied by liquid; pressure drop per unit bed height for a packed bed with only gas flowing; pressure drop per unit bed height with only liquid flowing;
/pressure drop per unit bed height in two-phase flow;
reduced saturation of liquid defined by (19); bed voidage ;
et, eld, sts,external, dynamic, static, and total liquid holdup, respectively; EIT
et, Eeff
"0o, TB ~D, ~w
T~Dw
h
ill, L , JL/~ w
Pair, PG, PL, Pw
x q~
particle porosity; effective porosity for gas flow in a wetted bed = et3- ets; overall effectiveness factor in a trickle-bed; effectiveness factor for the dry portion, and the wet portion of the catalyst, respectively; effectiveness factor for a slab which is wetted only on one side; parameter defined by (3); first and second absolute moments of the response curve for a pulse tracer; viscosity of liquid, and water, respectively; density of air, gas, liquid, and water, respectively;
interfacial drag in the model of Sicardi & Hofmann (1980); Thiele modulus for a first-order catalytic reaction; liquid saturation et/et3; parameter defined as (6L/6a)°5; parameter defined by (4).
References
Akgerman A, Collins M, Hook B D 1985 Ind. Eng. Chem., Fundam. 24:398--401 Baker O 1954 Oil Gas J. 53:185-189 Baldi G, Gianetto A 1980 Paper presented at the NATO Advanced Study Institute on Multiphase
Reactors, Vimiero, Portugal Barkelew C H, Gambhir B S 1983 ACS Syrup. Ser. 237:61-72
Tr ick le -bed reactors 297
Beaudry E G, Mills P L, Dudukovi~ M P 1986 Paper presented at the World Congress in Chemical Engineering, Tokyo
Blok J R, Drinkenburg A A H 1982 Chem. Eng. J. 25:89-99 Buffham B A, Kropholler H W 1973 Chem. Eng. Sci. 28:1081-1089 Charpentier J C, Favier M 1975 AIChE J. 21:1213-1218 Chou T S, Worley F L, Luss D 1978 Ind. Eng. Chem. Fundam. 18:279-283 Collins G M, Hess R K, Akgerman A 1985 Chem. Eng. Commun. 35" 281-291 Colombo A, Baldi G, Sicardi S 1976 Chem. Eng. Sci. 31:1101-1108 Christensen G, McGovern S J, Sundaresan S 1986 AIChE J. 32:1677-1681 Crine M, Marchot P, L'Homme A 1980 Chem. Eng. Sci. 35:51-58 Dautzenberg F M 1984 Paper presented at the Cata|ytica Associates Seminar, Santa Clara, California Dimenstein D M, Ng K M 1985 Chem. Eng. Commun. 41:215-219 Dimenstein D M, Ng K M 1986 AIChE J. 1:115-122 Dudukovi~ M P, Mills P L 1986 Encyclopedia of fluid mechanics, [Houston: Gulf Publishing Company)
Chap. 32 Dudukovi~ M P, Mills P L 1987 Catalyst Testing in Trickle-Beds, Catalytic Report on Catalyst Testing,
Catalytic, Palo Alto, CA. Ergun S 1952 Chem. Eng. Prog. 48:89-94 EI-Hisnawi A A, Dudukovi6 M P, Mills P L 1981 ACS Syrup. Ser. 196:421430 Fukushima S, Kusaka K 1978 J. Chem. Eng. Japan. 11:241-249 Germain A, L'Homme A, Lefebvre 1979 in Chemical engineering of ga~-Iiquid reaction, (Liege,
Belgium: CEBEDOC) (~ian~tto A , Baldi G, Specchia V, Sicardi S 1978 AYt'hE J. 24:1087-1104 Goto S, Lakota A, Levec J 1981 Chem. Eng. Sci. 36:157-162 Goto S, Levee J, Smith J M 1977 Catal. Rev. Sci. Eng. 15:187-247 Gupta R 1985 in Handbook of fluids in motion. (eds) N P Cheremisinoff and R Gupta Gyure D C, Krantz W B 1983 Ind. Eng. Chem. Fundam. 22:405-410 Hanika J, Sporka K, Ruzicka V 1976 Chem. Eng. J. 12:193-197 Hanika H, Stanek S 1985 in Handbook of heat and mass transfer (ed) N P Cheremisinoff (Houston' Gult
Publishing Co.) vol. 25 Herskowitz M, Smith J M 1983 AIChE J. 29 :1 -18 Hook B D, Collins G M, Akgerman A 1986 Chem. Eng. Commun. 28:213--221 Kan K M, Greenfield P F 1978 Ind. Eng. Chem. Process Des. Dev. 17:482-485 Kennedy C R, Jaffee ~ -B t986 C-h~n. Eng. Set. 41:845-853 Kim D H, Kim Y G 198t J. Chem. Eng. Jpn. 14:311-317 Midoux N, Favier M, Charpentier J C 1976 J. Chetn. Eng. Jpn. 9:350-357 Mills P L, Dudukovi6 M P 1979 Ind. Eng. ('hem. 18:139-149 Mills P L, Dudukovi6 M P 1980 Chem. Eng. Sci. 35:1557-1570 Mills P L, Dudukovi6 M P 1981 A1ChE J. 27:893-91)4 Mills P L, Dudukovi6 M P 1982 AIChE J. 28:526-534 Mills P L, Dudukovi6 M P 1983 ACS Symp. Ser. 237:37-51 Mills P L, Lai S, Dudukovi6 M P, Ramachandran P A 1986 Finite element solution ofpartiall), wetted
catalyst (to be published) Paraskos J A~ Frayer J A, Shah Y T 1975 Ind. Eng. (.'hem. Process Des. Dev. 14:315-322 Pendse H, Chiang H W, Tien C 1983 Chem. Eng. Sci. 38:1137-1150 Ramachandran P A, Beaudry E, Dudukovi6 M P, Mayer F X 1986a. Paper presented AIChE Annual
Meeting, Miami Beach, paper 84f Ramaehandran P A, Chaudhari R V 1983 Three phase catalytic reactors [London: Gordon & Breach) Ramachandran P A, Dudukovi6 M P, Mills P L 1986b Chem. Eng. Sci. 41:855-862 Ramachandran P A, Smith J M t979a Chem. Eng. Sci. 34:75-91 Ramachandran P A, Smith J M 1979b AIChE J. 25:538-542 Rao V G 1979 Ph.D. thesis, I.I.T., Madras Rao V G, Drinkenburg A A H 1983 Can. J. Chem. Eng. 61:1,58-167 Rao V G, Drinkenburg A A H 1985 AIChE J. 31:1010-1018 Ruecker C M, Mensik M A, Akgcrman A 1986 Chem. Eng. Commun. 41:279-287 Saez A E, Carbonell R G 1985 AIChE J. 31:52-57 Saez A E, Carbonell R G, Levec J 1986 AIChE J. 32:353-357

298 P A Ramachandran , M P D u d u k o v i 6 and P L Mills
Sagara M, Schneider P, Smith J M 1970 Chem. Eng. J. 1:47-54 Sato Y, Hirose T, Takahaski, Toda M 1973 J. Chem. Eng. Jpn. 6:315-321 Satterfield C N 1975 AIChE J. 21:209-228 Schneider P, Smith J M 1968 AIChE J. 14:762-771 Schwartz T G, Weger E, Dudukovi~ M P 1976 AIChE J. 22:894-904 Shah Y T 1979 Gas-liquid-solid reactor design, (New York: McGraw-Hill) Sicardi S, Gerhard D, Hofmann H 1986 Chem. Eng. Commun. 42:1-9 Sicardi S, Hofmann H 1980 Chem. Eng. J. 20:251-253 Sicardi S, Hofmann H 1982 Chem. Eng. J. Smith C M, Satterfield C N 1986 Chem. Eng. Sci. 41:839-844 Specehia V, Baldi G 1977 Chem. Eng. Sci. 32:515-523 Suzuki M, Smith J M 1970 AIChE J. 16:882-884 Talmor E 1977 AIChE J. 23:868-874 Turpin J L, Huntington R L 1967 AIChE J. 13:1196-1202 Van Brakel J 1975 Powder Technol. 11:205-211
Related Documents


![A Numerical Model for Trickle Bed ReactorsThere have been a few numerical simulations of flow distribution in a trickle bed reactor. For example, Stanek et al. [24] used a radial](https://static.cupdf.com/doc/110x72/60a6e516623c3b03631f1576/a-numerical-model-for-trickle-bed-reactors-there-have-been-a-few-numerical-simulations.jpg)


