Journal of Chromatography A, 1067 (2005) 265–275 Recent advances in mass spectrometric measurement of dioxins Jean-Franc ¸ois Focant ∗ , Catherine Pirard, Gauthier Eppe, Edwin De Pauw Mass Spectrometry Laboratory, Dioxin Laboratory, University of Li` ege, All´ ee de la Chimie 3, B-6c Sart-Tilman, B-4000 Li` ege, Belgium Available online 2 December 2004 Abstract Past years, many efforts have been dedicated to the development of alternative analytical methods for the measurement of dioxins in various types of matrices. Polychlorinated dibenzo-p-dioxins (PCDDs), polychlorinated dibenzofurans (PCDFs), and polychlorinated biphenyls (PCBs) are compounds that are present in samples at part-per-billion (ppb) or part-per-trillion (ppt) level. Their measurement requires the use of very sensitive analytical methods. Gas chromatography (GC) coupled to quadrupole ion storage mass spectrometry (QISTMS), fast GC (FGC) coupled to time-of-flight mass spectrometry (TOFMS) and comprehensive two-dimensional gas chromatography (GC × GC) coupled to TOFMS are the more promising tools challenging the reference GC high resolution mass spectrometry (HRMS) based on sector instruments. We report herein some of the advances we achieved in the past years in our laboratory on the development of alternative measurement methods for those compounds. © 2004 Elsevier B.V. All rights reserved. Keywords: Quadrupole ion storage mass spectrometry; Tandem in time mass spectrometry; Time-of-flight mass spectrometry; Polychlorinated dibenzo-p- dioxins; Polychlorinated dibenzofurans; Polychlorinated biphenyls 1. Introduction Humans all over the world are exposed to chemicals dur- ing their lifetime. Among the thousands of existing anthro- pogenic compounds, some are persistent and remain in the environment for years once generated. The variation in mea- sured levels mainly depends on the fact that some are (were) synthesised as industrial products although others are re- leased accidentally or as by-products. Broad ranges of tox- icities can be observed. The duality level-toxicity usually indicates if measurements of particular chemical or fam- ily of chemicals should be implemented. Polychlorinated dibenzo-p-dioxins (PCDDs), polychlorinated dibenzofurans (PCDFs), polychlorinated biphenyls (PCBs) are the persis- tent organic chemicals that are the most often measured in various types of matrices during food safety programs, envi- ronmental monitoring, and epidemiological studies. All to- gether, they represent more than 400 individual molecules (congeners), which have to be separated from each other to ensure distinctive quantification of the target ones. Informa- ∗ Corresponding author. Tel.: +32 4 366 35 31; fax: +32 4 366 43 87. E-mail address: [email protected] (J.-F. Focant). tion on their toxicities and levels at which they can be mea- sured can be found elsewhere [1,2]. Accurate measurement of dioxins and related compounds requires high standard analytical strategies. Those com- plex multistep strategies include sample extraction, sam- ple cleanup and analyte measurements under strict qual- ity assurance/quality control (QA/QC) criteria. Several non- instrumental and instrumental automated approaches are available for both extraction and cleanup. Soxhlet extrac- tion and liquid–liquid extraction have long been the most used tools for non-instrumental extraction of solids and liq- uids, respectively. They have proven to be very efficient but some limitations encouraged the development of other ap- proaches based on instrumental techniques. Depending on the physico-chemical properties of the sample matrix, in- strumental techniques are based on solid phase extraction (SPE) [3], matrix solid phase dispersion (MSPD) [4], solid phase micro-extraction (SPME) [5], stir-bar sorptive extrac- tion (SBSE) [6], pressurised liquid extraction (PLE) [7], mi- crowave assisted extraction (MAE) [8], and supercritical fluid extraction (SFE) [9]. Preparative liquid chromatography (LC) using silica-based sorbents and size exclusion chromatogra- phy (SEC) are the most common techniques used for sample 0021-9673/$ – see front matter © 2004 Elsevier B.V. All rights reserved. doi:10.1016/j.chroma.2004.10.095

Welcome message from author
This document is posted to help you gain knowledge. Please leave a comment to let me know what you think about it! Share it to your friends and learn new things together.
Transcript

Journal of Chromatography A, 1067 (2005) 265–275
Recent advances in mass spectrometric measurement of dioxins
Jean-Franc¸ois Focant∗, Catherine Pirard, Gauthier Eppe, Edwin De PauwMass Spectrometry Laboratory, Dioxin Laboratory, University of Li`ege, Allee de la Chimie 3, B-6c Sart-Tilman, B-4000 Li`ege, Belgium
Available online 2 December 2004
Abstract
Past years, many efforts have been dedicated to the development of alternative analytical methods for the measurement of dioxins in varioustypes of matrices. Polychlorinated dibenzo-p-dioxins (PCDDs), polychlorinated dibenzofurans (PCDFs), and polychlorinated biphenyls(PCBs) are compounds that are present in samples at part-per-billion (ppb) or part-per-trillion (ppt) level. Their measurement requires the useof very sensitive analytical methods. Gas chromatography (GC) coupled to quadrupole ion storage mass spectrometry (QISTMS), fast GC(FGC) coupled to time-of-flight mass spectrometry (TOFMS) and comprehensive two-dimensional gas chromatography (GC× GC) coupledto TOFMS are the more promising tools challenging the reference GC high resolution mass spectrometry (HRMS) based on sector instruments.We report herein some of the advances we achieved in the past years in our laboratory on the development of alternative measurement methodsfor those compounds.©
K dibenzo-d
1
ipessliiid(tvrg(e
ea-
undscom-am-qual-on-s aretrac-ostliq-
t butr ap-ng on, in-ction
-
dC)
0d
2004 Elsevier B.V. All rights reserved.
eywords: Quadrupole ion storage mass spectrometry; Tandem in time mass spectrometry; Time-of-flight mass spectrometry; Polychlorinatedp-ioxins; Polychlorinated dibenzofurans; Polychlorinated biphenyls
. Introduction
Humans all over the world are exposed to chemicals dur-ng their lifetime. Among the thousands of existing anthro-ogenic compounds, some are persistent and remain in thenvironment for years once generated. The variation in mea-ured levels mainly depends on the fact that some are (were)ynthesised as industrial products although others are re-eased accidentally or as by-products. Broad ranges of tox-cities can be observed. The duality level-toxicity usuallyndicates if measurements of particular chemical or fam-ly of chemicals should be implemented. Polychlorinatedibenzo-p-dioxins (PCDDs), polychlorinated dibenzofuransPCDFs), polychlorinated biphenyls (PCBs) are the persis-ent organic chemicals that are the most often measured inarious types of matrices during food safety programs, envi-onmental monitoring, and epidemiological studies. All to-ether, they represent more than 400 individual moleculescongeners), which have to be separated from each other tonsure distinctive quantification of the target ones. Informa-
tion on their toxicities and levels at which they can be msured can be found elsewhere[1,2].
Accurate measurement of dioxins and related comporequires high standard analytical strategies. Thoseplex multistep strategies include sample extraction, sple cleanup and analyte measurements under strictity assurance/quality control (QA/QC) criteria. Several ninstrumental and instrumental automated approacheavailable for both extraction and cleanup. Soxhlet extion and liquid–liquid extraction have long been the mused tools for non-instrumental extraction of solids anduids, respectively. They have proven to be very efficiensome limitations encouraged the development of otheproaches based on instrumental techniques. Dependithe physico-chemical properties of the sample matrixstrumental techniques are based on solid phase extra(SPE)[3], matrix solid phase dispersion (MSPD)[4], solidphase micro-extraction (SPME)[5], stir-bar sorptive extraction (SBSE)[6], pressurised liquid extraction (PLE)[7], mi-crowave assisted extraction (MAE)[8], and supercritical fluiextraction (SFE)[9]. Preparative liquid chromatography (L
∗ Corresponding author. Tel.: +32 4 366 35 31; fax: +32 4 366 43 87.E-mail address:[email protected] (J.-F. Focant).
using silica-based sorbents and size exclusion chromatogra-phy (SEC) are the most common techniques used for sample
021-9673/$ – see front matter © 2004 Elsevier B.V. All rights reserved.oi:10.1016/j.chroma.2004.10.095
266 J.-F. Focant et al. / J. Chromatogr. A 1067 (2005) 265–275
clean-up and additional sorbents like Florisil, basic alumina,porous graphitic carbon (PGC) and 2-(1pyrenyl)ethyl (PYE)are commonly used to fractionate the extracts in subgroupsof compounds (PCDDs, PCDFs, PCBs), which can be ana-lyzed separately[10–13]. Furthermore, the coupling of theextraction and clean-up steps can result in high-throughputsample preparation methodologies, which allow the process-ing of a large number samples for many types of matrices[14,15]. Details on sample preparation for dioxin analysesare available in review articles[16,17].
Because of the semi-volatility of the analytes of interest,gas chromatography (GC) is the preferred approach for thefinal separation stage prior measurement of the individualspecies. The chromatographic separation relies on capillaryGC columns made of appropriate lengths of specialty phases(polar and apolar) and allows to differentiate between thedifferent congeners inside the fractionated sub-groups ofcompounds.
Although micro electron-capture detectors (�ECD) offerthe required sensitivity for the measurement of selectedPCBs, accurate peak identification can sometimes be difficultand mass spectrometric (MS) detectors are usually preferred.High resolution (HR) MS based on sector instruments haslong been, and still is, the reference measurement method forPCDD/Fs. It offers the required sensitivity and specificityiT el)i ichp atingt M,a ng tot times entlyi thee ents.T allya atep onsb sw peaka nsei om-p ands on.
t costa lysisp lgiand ivea se. Ina amsr ud-g entsa m the“i l ast the
most promising ones when coupled to suitable GC methodssuch as large volume programmable temperature vapourizerinjection (PTV-LV) GC, fast GC (FGC) or comprehensivetwo-dimensional gas chromatography (GC× GC). Someof the modern developments based on those techniquesfor environmental analysis are available in the literature[22,23]. The potential decrease in selectivity due to the lowmass resolution, relatively to HRMS sector instruments, canbe counterbalanced by operating the instrument in tandemmode or by improving the chromatographic separation. Thepresent paper reports some of the results we obtained lastyears in the development of alternative mass spectrometricmethods for the measurement of dioxin and selected PCBsat the ultra-trace level.
2. Experimental
2.1. Chemicals
All details on sample preparation procedures and con-sumables are available elsewhere[12–15]. Chromatographicpure grade helium gas, 99,9999% was purchased fromAir Products (Vilvoorde, Belgium). The internal standardsolution of the seventeen 2,3,7,8-chloro-subsituted13C12congeners labelled PCDD/Fs (EDF-4144), the calibrations dard( topeL 3,E andlT ion( ions(
2
arlier[ car-t mplec ower-P A,U l asr o en-s . QCm um,a m-p entala d toe
2
2s
anA ng-
n addition to valuable mass spectral information[18].he high sensitivity (down to the low femtogram lev
s achieved using electron impact (EI) ionisation, whroduces abundant molecular ions, but also by oper
he MS in selected ion monitoring (SIM) mode. In SIrestricted number of relevant masses correspondi
he analytes of interest are selected, this increases thepent on particular masses (dwell time) and consequmproves the sensitivity. The high selectivity results fromlevated mass resolution (ca. >10,000) of sector instrumhe use of isotope dilution (ID) based on commercivailable 13C12-labelled internal standard offers accureak identification by means of retention time comparisetween native (12C) and labelled (13C) compounds, aell as accurate peak quantification by comparison ofreas/heights[19]. The measurement of the two most inte
ons in the molecular cluster of native and labelled counds allows to measure the theoretical isotope ratioerves as a confirmatory procedure for peak identificati
Because HRMS instruments requires high investmennd highly skilled scientists, their use results in high anarices. Moreover, as one observed during the 1999 Beioxin crisis [20], rapid high-throughput and cost-effectnalytical methods are requested for emergency responddition, the completion of large scale monitoring progrequires affordable analytical methods to fit the limited bets. This can barely be attained using HRMS instrumnd alternative measurement methods are desirable. FroMS islands” presented by Brunee in 1987[21], quadrupoleon storage mass spectrometry (QISTMS) as welime-of-flight mass spectrometry (TOFMS) appear to be
tandard solution (EDF-4143) and the syringe stanEDF-4145) were purchased from Cambridge Isoaboratory (CIL, Andover, MS, USA). The EDF-414DF-4144 and EDF-4145 concentrations of the natives
abelled congeners are summarised in a previous report[13].he 13C12-labeled PCB internal standard spiking solutEC-5023), as well as the 10-points calibration solutEC-5022) were obtained from CIL.
.2. Sample preparation and quality control
Details on sample preparation have been reported e13–15]. Extractions were carried out either using SPEridges or using PLE, depending on samples. Further salean-up was achieved using an automated system (PrepTM, Fluid Management Systems Inc., Waltham, MSA) [17]. Various quality control (QC) samples as wel
ing-test samples were routinely used in the laboratory ture high quality standard performance of the methodsatrices were typically made of beef fat, yolk, bovine sernimal feeding stuffs and milk. Additionally, unknown sales were set in series in which QC samples and instrums well as procedural blanks (BCs) were always includensure full control of the method.
.3. Instrumentation
.3.1. Gas chromatography–high resolution masspectrometry (GC–HRMS)
The HRMS experiments were either performed onutospec Ultima (Micromass, Manchester, United Ki
J.-F. Focant et al. / J. Chromatogr. A 1067 (2005) 265–275 267
dom) or a MAT95XL (ThermofinniganMAT, Bremen, Ger-many). The HRMS was connected by a heated transferline (275◦C) to a Agilent 6890 Series (Palo Alto, CA,USA) gas chromatograph equipped with a A200SE autosam-pler (CTC Analytics AG, Zwingen, Zwitzerland). The col-umn was a 40 m RTX-5 MS (0.18 mm i.d.× 0.18�m df)(Restek, Interscience, Louvain-La-Neuve, Belgium). He-lium was used as the carrier gas at constant flow rate of1.2 ml/min. Two microlitres of the final extract in nonanewere injected into a split/splitless injector held at 275◦Cin splitless mode. The HRMS instrument was operated inSIM mode. Additional GC and HRMS parameters, includ-ing performing conditions, quantification and insurance qual-ity control for measurements were described previously[13].
2.3.2. Gas chromatography–quadrupole ion storagemass spectrometry in tandem mode (GC–QISTMS/MS)
Part of the MS/MS analyses were carried out with aSaturn 2000 GC/MS/MS coupled with a Star 3400CX gaschromatograph and a 8200CX autosampler (Varian, Wal-mut Creek, USA). The Saturn 5.1 software version of theworkstation was used. PCDD/Fs were separated on a DB-5 MS (30 m× 0.25 mm i.d.× 0.25�m df) capillary col-umn (J&W Scientific, Folsom, USA). The GC conditionsw ◦ttf enu set at2n rtede )ftt22 ere[
r in-j ona lda eM gasc pler( us-iu hec ec-t lassw ain-tr t23 ere[
2.3.3. Fast gas chromatography- and comprehensivetwo-dimensional gas chromatography–time-of-flightmass spectrometry (FGC and GC×GC–TOFMS)
The FGC–TOFMS instrument was the Pegasus III (LecoCorp., St Joseph, MI, USA) equipped with an Agilent 6890GC. The GC oven was programmed as follows: 140◦C for0.5 min, then to 330◦C at 25◦C/min. Helium was used at aconstant flow of 5 ml/min. The inlet temperature was 260◦Cfor splitless injections of 2�l using a Restek Uniliner. A DB-XLB (25 m× 0.20 mm i.d.× 0.33�m df) capillary column(J&W) was used. The transfer line temperature was 280◦C.The ion source temperature was 220◦C with an electron-impact filament bias voltage of−70 V. The data acquisitionrate was 10 scans/s for a mass range of 120–520 amu. Thedetector voltage was 1800 V. Data processing was performedusing the Leco ChromaTOFTM software. Peak apex findingwas performed automatically and further manually correctedwhen required. Additional details are available in a previousreport[26].
The GC× GC–TOFMS instrument was the Pegasus 4D(Leco Corp.). This system is based on a non-moving quad-jetmodulator made of two permanent cold nitrogen jets and twopulsed hot-air jets, which are responsible for trapping andrefocusing of compounds eluting from the first dimension1D column. This modulator was mounted in an Agilent 6890G jets.M turep ill bem haveb ayo in-t ref henr
3
3
e se-l ssr n thet -i placei t) ionsa so-c and( fromt y ane
ysisi ha ghteri pro-d the
ere: on-column injection of 1�l at 240 C, initial ovenemperature of 150◦C for 1 min, increased at 30◦C/mino 210◦C, then increased at 1◦C/min to 250◦C and heldor 7 min. Helium (N60, Air Liquide, France) has besed as carrier gas. The ion trap temperature was00◦C with the transfer line at 250◦C and a maximumumber of 5000 ions in the trap. All details are repolsewhere[24]. The PCB (mono-orthoand indicator PCBs
raction was injected splitless (1�l) at 140◦C, initial ovenemperature of 140◦C for 1 min, increased at 25◦C/mino 180◦C held for 1 min, then increased at 2◦C/min to10◦C held for 8 min, finally increased at 3◦C/min to80◦C and held for 2 min. Details are available elsewh
12].Large volume programmable temperature vapourise
ection GC–QISTMS/MS experiments were performedFinnigan PolarisQ ion trap (Austin, TX, USA) he
t 250◦C. The GC transfer line (300◦C) connected thS to a Thermoquest Trace GC 2000 (Milan, Italy)
hromatograph equipped with a Combi Pal autosamCTC Analytics AG). The analyses were carried outng a 40 m (0.18 mm i.d.× 0.18�m df) RTX-5 MS col-mn with Helium at constant flow rate of 1.2 ml/min. Tolumn was directly connected to a BEST PTV injor. The liner used was a Silco Sleeve liner with gool from Restek Corp. The oven temperature was m
ained at 100◦C for 6 min, ramped at 52◦C/min to 200◦C;amped at 2.9◦C/min to 250◦C for 6 min; ramped a.9◦C/min to 260◦C, and finally ramped at 10◦C/min to00◦C for 5 min. Further details are available elsewh
25].
C oven and liquid nitrogen was used to create the coldany types of column phase combination and temperarograms have been used and experimental condition wentioned when required. Details regarding the systemeen reported elsewhere[27,28]. Data processing and displf the GC× GC chromatograms were achieved using the
egrated Leco ChromaTOFTM software. Peak apexes weound automatically and further manually corrected wequired.
. Results and discussion
.1. GC–QISTMS/MS
QIST mass spectrometers have the capability to storected ions[29]. The lack of selectivity due to the unit maesolution is compensated by operating the instrument iandem mode (MS/MS or MS2). This is referred as tandemn-time mass spectrometry because the process takesn three successive steps: (1) selected precursor (parenre isolated in the ion trap after ionisation, (2) their disiation by collision-induced dissociation (CID) occurs,3) the product ions (daughters) are sequentially ejectedhe trap according to their mass and further detected blectron multiplier[21].
The use of ion trap MS/MS for PCDD and PCDF anals based on the specific loss of a COCl• fragment throug
unique fragmentation reaction that produces the dauons[30]. For each analyte, it is necessary to monitor theuction of at least two different daughter ions to check
268 J.-F. Focant et al. / J. Chromatogr. A 1067 (2005) 265–275
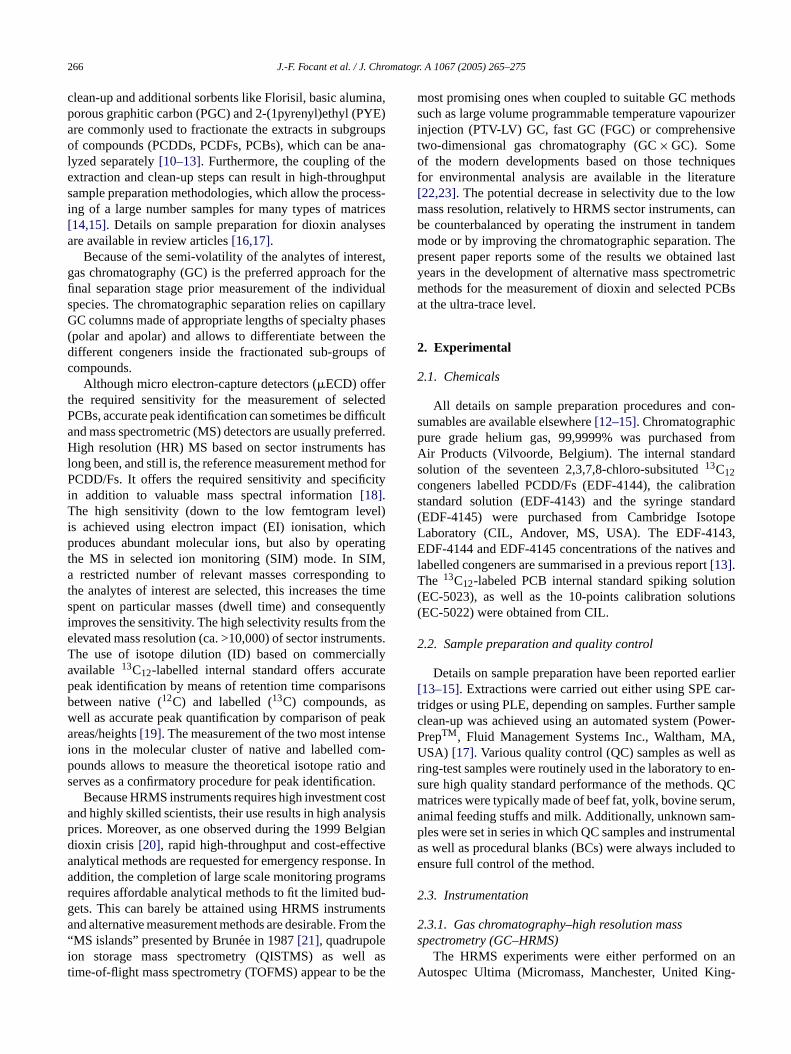
Fig. 1. Production of daughter ions from both native and13C-labelled TCDDspecies using QISTMS/MS.
isotope ratio. Precursor species containing at least one37Clatom ([M + 2]•+) must be isolated to ensure the productionof both [M−CO35Cl•] and [M−CO37Cl•] ions for both na-tive and labelled compounds (Fig. 1). The use of multiplereaction monitoring (MRM) allows to monitor the produc-tion of selected daughter ions for chromatographically co-eluting native and labelled compounds and perform ID[31].The instrument alternatively scans in the native and labelMS region and ion current can be reconstructed from thosechannels.
The ionisation (EI) can either occur in an internal sourceinside the ion trap, or in an external source with further ac-celeration of the produced ions through lenses and their in-troduction into the ion trap analyzer. In the case of PCDD/F
and PCBs, no significant ionisation differences are observedwhen using one or the other approach. The isolation of molec-ular ions from the produced ions has to be optimised for eachcongener. Depending on the elution order (the chlorinationlevel), segments are defined and specific isolation parame-ters are applied for each of them. The isolation of both native(12C) and13C-labelled precursors is optimised to satisfy toID requirements.
Although at least [M + 2]•+ species have to be consid-ered as precursor (Fig. 1), the choice of the parent ionsis not only related to the relative isotope abundances (themore parents you isolate, the more daughters you poten-tially produce), but also by the isotopic ratio of the pro-duced daughter ions. In fact, because the isotopic ratio checkis carried out on the daughter ions, it is desirable to getsimilar abundances for both daughters to ensure accuratemeasurement of both isotope species at low concentrations.Therefore, as illustrated inTable 1, [M + 2]•+ or [M + 4]•+
parent ions are often selected. The loss in abundance ofthe parent ion gets limited when moving up in the chlo-rination level and is counterbalanced by better daughterratios.
Optimum trapping efficiency of the precursor ions is en-sured by the presence of helium, which acts as a buffergas in the trap and slows down ion motion. As the in-s oft g of
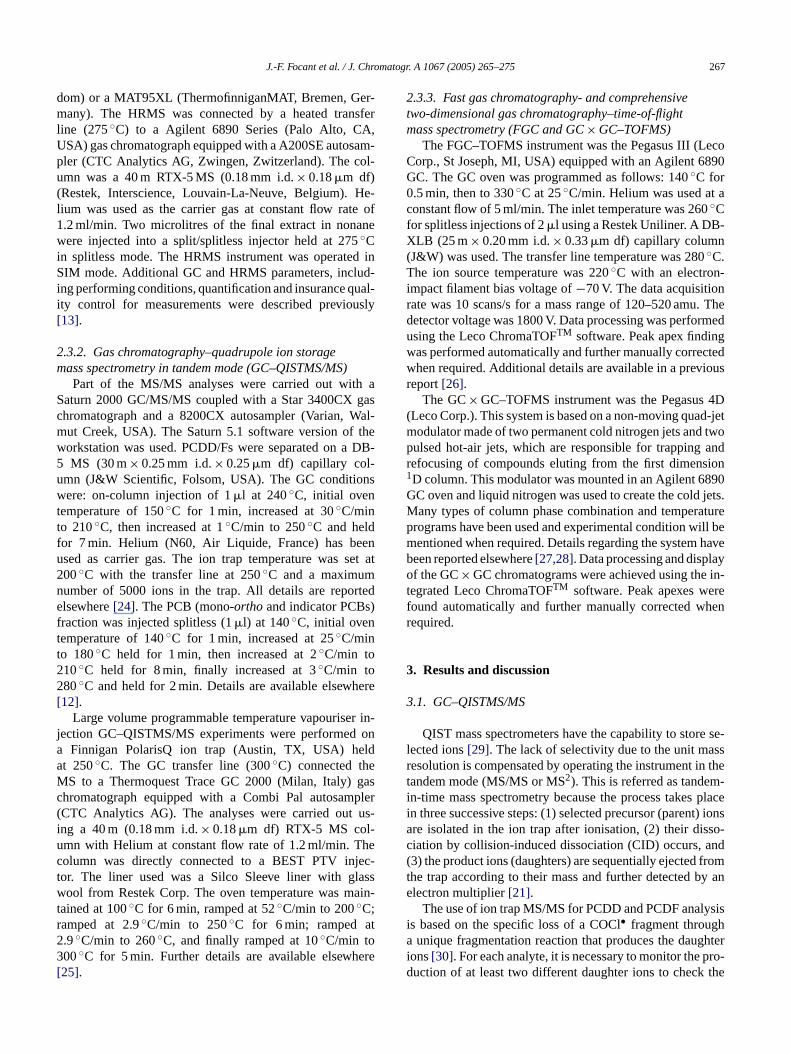
Table 1Principal parameters for the MS/MS measurement of PCDD/Fs using QISTM
Segment # Congeners Isolationa Dissociationb
Molecular ions (m/z) Excitation amplitud
1 TCDD 12C 322 (M + 2) 1.3 (5)c .4TCDD13C 334 (M + 2) 1.3 (5) .4TCDF12C 306 (M + 2) 1.6 (5.5) .4TCDF13C 318 (M + 2) 1.6 (5.5) .4
2 .8.8.8.8
3
4 8888
5 222
PeCDD12C 358 (M + 4) 1.3 (6)PeCDD13C 370 (M + 4) 1.3 (6)PeCDF12C 342 (M + 4) 1.6 (6)PeCDF13C 354 (M + 4) 1.6 (6)
HxCDD12C 392 (M + 4) 1.3 (6)HxCDD13C 404 (M + 4) 1.3 (6)HxCDF12C 376 (M + 4) 2 (6)HxCDF13C 388 (M + 4) 2 (6)
HpCDD12C 426 (M + 4) 1.5 (6)HpCDD13C 438 (M + 4) 1.5 (6)HpCDF12C 410 (M + 4) 2 (6)HpCDF13C 422 (M + 4) 2 (6)
OCDD12C 462 (M + 6) 1.5 (6)OCDD13C 474 (M + 6) 1.5 (6)OCDF12C 446 (M + 6) 2 (6)
13
OCDF C 458 (M + 6) 2 (6)a Theqz values were 0.3 and 0.45 when the damping gas flow was 0.3 andb The excitation time was 10 ms.c Values in parenthesis are voltages at damping gas flow of 1.7 ml/min andtrument sensitivity is limited by the trapping efficiencyhe precursor ion, recent instruments permit the tunin
S/MS
QA/QC
e (V) Isotope ratios Daughter ions (m/z) Validity (±20%)
0.33 257/259 0.26 < 0.33 < 00.33 268/270 0.26 < 0.33 < 00.33 241/243 0.26 < 0.33 < 00.33 252/254 0.26 < 0.33 < 0
0.66 293/295 0.53 < 0.66 < 00.66 304/306 0.53 < 0.66 < 00.66 277/279 0.53 < 0.66 < 00.66 288/290 0.53 < 0.66 < 0
0.5 327/329 0.4 < 0.5 < 0.60.5 338/340 0.4 < 0.5 < 0.60.5 311/313 0.4 < 0.5 < 0.60.5 322/324 0.4 < 0.5 < 0.6
0.4 361/363 0.32 < 0.4 < 0.40.4 372/374 0.32 < 0.4 < 0.40.4 345/347 0.32 < 0.4 < 0.40.4 356/358 0.32 < 0.4 < 0.4
0.6 397/399 0.48 < 0.6 < 0.70.6 408/410 0.48 < 0.6 < 0.70.6 381/383 0.48 < 0.6 < 0.7
0.6 392/394 0.48 < 0.6 < 0.721.7 ml/min, respectively.
using an external source QISTMS.
J.-F. Focant et al. / J. Chromatogr. A 1067 (2005) 265–275 269
the helium damping gas pressure inside the ion trap foreach separate segment. In practice, although default damp-ing gas flow values are 0.3 ml/min, higher flows (1.7 ml/min)have been optimized for PCDD/Fs[25,32]. The enhance-ment of the trapping efficiency, hence the later produc-tion of daughter ions, resulted in a three to five-fold sen-sitivity enhancement. Similar data were recently reportedby Kemmochi et al.[33]. By summing the two 2,3,7,8-TCDD daughter ion masses (m/z 257 and 259), the recon-structed ion current (RIC) permitted to reach instrumentallimit of detections (iLODs) of 200 fg, compared to the 1–5 pgrange classically attained when low damping flows are used[24,34].
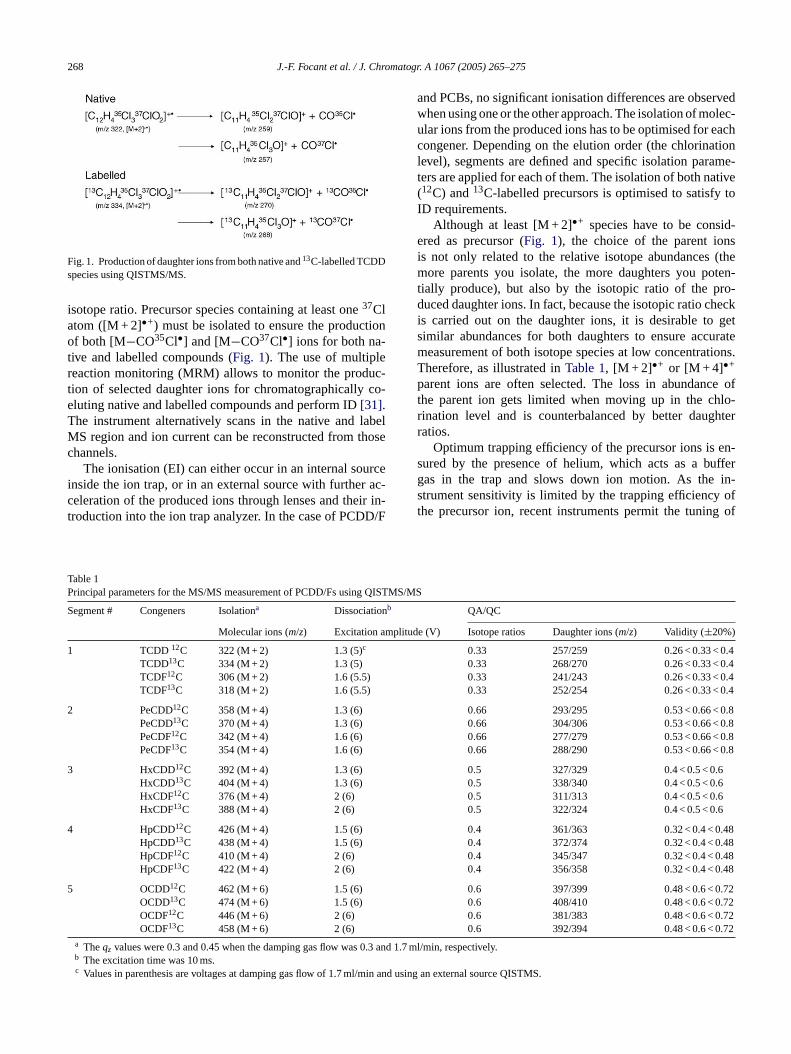
The CID process, responsible for the fragmentation of pre-cursor ions in product ions, mainly depends on the excitationmode, the CID time, the excitation voltage and the stabilityparameterqz, which is issued of the Mathieu second-orderdifferential equation that accounts for the ion motion in thetrap[35]. Two excitation modes (resonant and non-resonant)are available to increase the vibrational energy of the parentions and conduct to their fragmentation with sufficient yields.Most of the MS/MS experiments described in the literatureuse resonant excitation mode. Application of high frequencydipole field to the end-cap electrodes of the ion trap allows tomatch the secular frequency of the trapped ion and results ina ergyi theh te toa viatelth withCv xcita-t hichr
F n of1 teri
An example of dissociation curve is given for 1,2,3,4-TCDDin Fig. 2. Because helium also operates as a collision gasduring the CID process, the use of higher values of dampinggas flow during the isolation step influences the productionof the daughter ions. In practice, because precursor ion mo-tion is damped, more energy is required to excite the ionsfor CID fragmentation and, thus, higher CID amplitudes arerequired. CID voltages of 5–6 V have to be applied to theendcap electrodes to fragment tetra through octa-CDD/Fs. Inthat case, an optimumqzvalue of 0.45 has been reported[25].Table 1summarises the optimized MS/MS parameters for thePCDD/Fs segments. Finally, relatively short excitation timevalues tend to offer better signal to noise ratio than longerones, and a value of 5–10 ms is used with a typical scanningrate of 3 scans/s[23,34].
The MS/MS approach has been used to measure PCDDand PCDF levels in various types of matrices. Our early ef-forts, when the iLODs were not low enough to consider biotasamples, were dedicated to the screening of contaminatedfly ashes in conjunction with enzyme immunoassay (EIA)[24]. MS/MS data were highly correlated to HRMS data(R2 = 0.9987) in a four orders of magnitude dynamic range.MS/MS relative standard deviations (RSDs) ranged between10 and 15% (5 and 10% for HRMS). The combination of EIAfor the first sorting out of samples and the use of physico-c tions d theu pour-i t ofdv cinge ubse-q acko SQ)M an int ndT ctsd rmso eportf nfi ch-n ientc MSu
ttedl ytesw f thes na-t s toct MSa r theM catet rangeo herr for
n increase of the kinetic energy of the ion. The kinetic ens transformed into internal energy upon collisions withelium present in the trap. This internal energy is adequallow fragmentation reactions involving rearrangements
he breakage of multiple chemical bonds (loss of COCl•). Thexcitation voltage and the stability parameterqz are closely
inked and an optimum of the couple (CID voltage,qz) haso be found for each congener. An optimumqz value of 0.3as been reported earlier for PCDD/Fs in conjunctionID voltages ranging between 1.3 and 2 V[24]. Similar CIDalues were reported by other groups using resonant eion [36]. The higher voltages correspond to PCDFs, wequire higher activation energy for the loss of COCl• [37].
ig. 2. QISTMS/MS fragmentation curves for the resonant excitatio,2,3,4-TCDD with aqzvalue of 0.3. The maximum intensity for the daugh
ons is obtained for a CID value of 1.3 V.
hemical MS/MS method for positive sample confirmahowed to be a viable one. More recently, we evaluatese of a large volume programmable temperature va
zer injection GC–QISTMS/MS method for measuremenioxins in food and feed[25]. It appeared that a 10�l injectionolume of toluene extracts was the maximum to avoid faxcessive presence of toluene in the trap for hours and suent sensitivity drop. Such a limitation point out a drawbf QISTMS/MS compared to triple-stage quadrupoles (TS/MS where species are separated in space rather th
ime. If similar sensitivity is attained using QISTMS/MS aSQMS/MS[38], the later suffers less from matrix effeue to the intrinsic difference in the CID process. In tef sample preparation requirements, the 15-year-old r
rom Reiner et al.[40] stating that MS/MS and HRMS calter out different types of interferences but that neither teique can remove all interferences is still true and efficleanup has to be implemented independently of thesed.
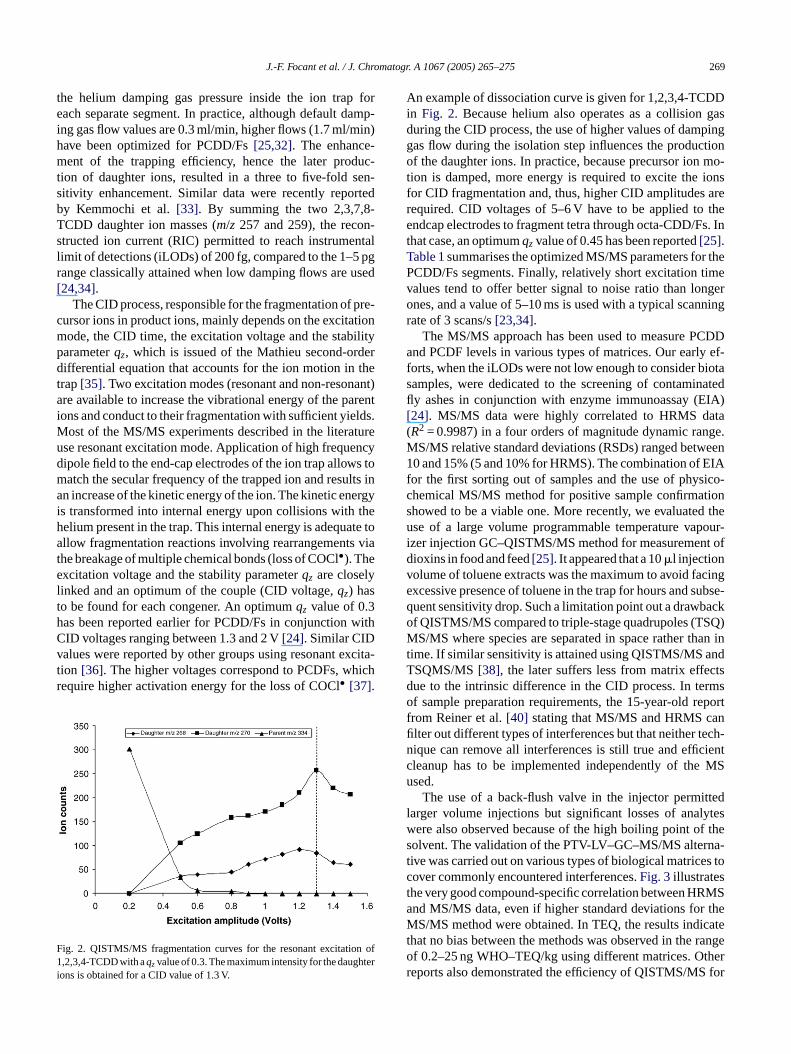
The use of a back-flush valve in the injector permiarger volume injections but significant losses of analere also observed because of the high boiling point oolvent. The validation of the PTV-LV–GC–MS/MS alterive was carried out on various types of biological matriceover commonly encountered interferences.Fig. 3illustrateshe very good compound-specific correlation between HRnd MS/MS data, even if higher standard deviations foS/MS method were obtained. In TEQ, the results indi
hat no bias between the methods was observed in thef 0.2–25 ng WHO–TEQ/kg using different matrices. Oteports also demonstrated the efficiency of QISTMS/MS

270 J.-F. Focant et al. / J. Chromatogr. A 1067 (2005) 265–275
Fig. 3. Comparison of PTV-LV–GC–QISTMS/MS and GC–HRMS for themeasurement of PCDD/Fs at the low pictogram level in biological matrices.
the measurements of PCDD/Fs in foodstuffs at low pictogramlevel [36,39].
QISTMS in tandem mode can also be used to measurePCB levels. Selectivity is ensured by monitoring the loss ofa Cl2 fragment through a unique fragmentation reaction thatproduces the daughter ions. Optimisation of the main param-eters (Table 2) conducted to a rugged method, which has beenapplied to the measurement of the mono-orthoPCBs as wellas the seven indicator PCBs (Aroclor 1260 mixture) in vari-ous types of biological matrices[12]. Malavia et al.[41] alsoreported the use of QISTMS/MS for the measurement of fournon-orthoPCBs in biota samples using a similar approach.
A QISTMS-based method has also been developed for themeasurement of PBDEs in biota samples[42]. EI was alsoused, instead of the more commonly used negative chemicalionisation (NCI), to ensure the monitoring of13C-labeledspecies for ID. Mass spectra are dominated by M•+ and[M − Br2]•+ species for low and high degrees of bromina-tion, respectively. The dissociation of the parent in daughterions by CID was also congener-dependent, with loss of Br2
(such as PCBs lose Cl2) or loss of COBr• (such as dioxinslose COCl•).
3.2. FGC–TOFMS
Reports on general principles and developments ofTOFMS are available in the literature[43,44]. In TOFMSinstruments, ions are accelerated to high velocity by an elec-tric field in a flight tube. Since all ions have the same kineticenergy, the time ions take to traverse the flight tube is propor-tional to their masses. Light mass ions travelling faster thanhigh mass ions. As a result of small kinetic energy distribu-tion, a corrective electrostatic field (reflectron) is also appliedat the end of the flight tube to ensure refocusing of similarmasses before detection. The time to acquire a complete massspectrum is limited by the flight time of the highest mass un-der analysis. A full mass spectrum can therefore be collectedin less than 100�s[45]. A unitm/zresolution TOFMS instru-ment is capable to acquire 5000 transients/s. Because severalspectra have to be averaged to improveS/N, it results in 500summed complete mass spectra/s for the mass range from10 to 1000m/z. Conversely to sector and quadrupole instru-ments, which offer limited scanning rates (ca. <20 scans/s)due to either the time required for electromagnets to changefield strength or the limited ring electrode voltage ramp toba ll ionsa
ermso peaksa f them vicep eaksw rvedw /MSm ato-g f re-
Table 2Principal parameters for the MS/MS measurement of PCBs using QISTMS/M
Segment # Congeners Isolationa
Molecular ions (m/z)
1 12
2
3
4
5
6
.3 ml/m
TriCB C 258 (M + 2)TriCB13C 270 (M + 2)
TeCB12C 292 (M + 2)TeCB13C 304 (M + 2)
PeCB12C 326 (M + 4)PeCB13C 338 (M + 4)
HxCB12C 360 (M + 2)HxCB13C 372 (M + 2)
HpCB12C 396 (M + 4)HpCB13C 408 (M + 4)
DeCB12C 500 (M + 6)DeCB13C 512 (M + 6)
a Theqz values were 0.3 and 0.45 when the damping gas flow was 0b The excitation time was 10 ms.
e applied to maintain QISTMS unitm/zresolution, TOFMSnalysers are a non-mass-scanning device because are virtually collected at the same time.
Fast GC (FGC) type separations are appealing in tf sample turnover but also because sharper and tallerre produced with potential subsequent improvement oethod sensitivity. The use of TOFMS as the detection deermits the accurate characterisation of those narrow pithout the drastic loss in peak resolution usually obsehen using low scan rate instruments and SIM or MSode[46]. TOFMS matches the speed of fast gas chromraphic separations and allows reliable reconstruction o
S
Dissociationb Daughter ions (m/z)Excitation amplitude (V)
1.8 186/1881.8 198/200
1.2 220/2221.2 232/234
1.6 254/2561.6 266/268
1.8 288/2901.8 300/302
1.9 324/3261.9 336/338
2.1 428/4302.1 440/442
in and 1.7 ml/min, respectively.
J.-F. Focant et al. / J. Chromatogr. A 1067 (2005) 265–275 271
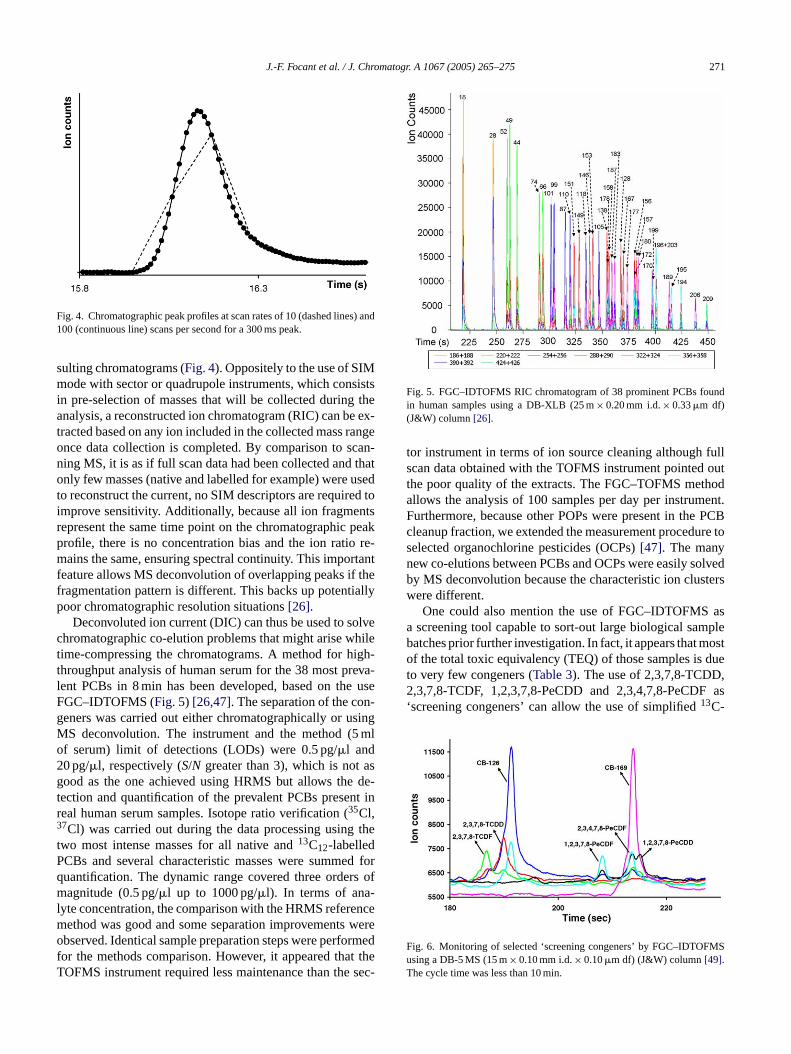
Fig. 4. Chromatographic peak profiles at scan rates of 10 (dashed lines) and100 (continuous line) scans per second for a 300 ms peak.
sulting chromatograms (Fig. 4). Oppositely to the use of SIMmode with sector or quadrupole instruments, which consistsin pre-selection of masses that will be collected during theanalysis, a reconstructed ion chromatogram (RIC) can be ex-tracted based on any ion included in the collected mass rangeonce data collection is completed. By comparison to scan-ning MS, it is as if full scan data had been collected and thatonly few masses (native and labelled for example) were usedto reconstruct the current, no SIM descriptors are required toimprove sensitivity. Additionally, because all ion fragmentsrepresent the same time point on the chromatographic peakprofile, there is no concentration bias and the ion ratio re-mains the same, ensuring spectral continuity. This importantfeature allows MS deconvolution of overlapping peaks if thefragmentation pattern is different. This backs up potentiallypoor chromatographic resolution situations[26].
Deconvoluted ion current (DIC) can thus be used to solvechromatographic co-elution problems that might arise whiletime-compressing the chromatograms. A method for high-throughput analysis of human serum for the 38 most preva-lent PCBs in 8 min has been developed, based on the useFGC–IDTOFMS (Fig. 5) [26,47]. The separation of the con-geners was carried out either chromatographically or usingMS deconvolution. The instrument and the method (5 mlof serum) limit of detections (LODs) were 0.5 pg/�l and2 asg de-t nt inr3 thetP ed forq rs ofm -l ncem wereo rmedf t theT sec-
Fig. 5. FGC–IDTOFMS RIC chromatogram of 38 prominent PCBs foundin human samples using a DB-XLB (25 m× 0.20 mm i.d.× 0.33�m df)(J&W) column[26].
tor instrument in terms of ion source cleaning although fullscan data obtained with the TOFMS instrument pointed outthe poor quality of the extracts. The FGC–TOFMS methodallows the analysis of 100 samples per day per instrument.Furthermore, because other POPs were present in the PCBcleanup fraction, we extended the measurement procedure toselected organochlorine pesticides (OCPs)[47]. The manynew co-elutions between PCBs and OCPs were easily solvedby MS deconvolution because the characteristic ion clusterswere different.
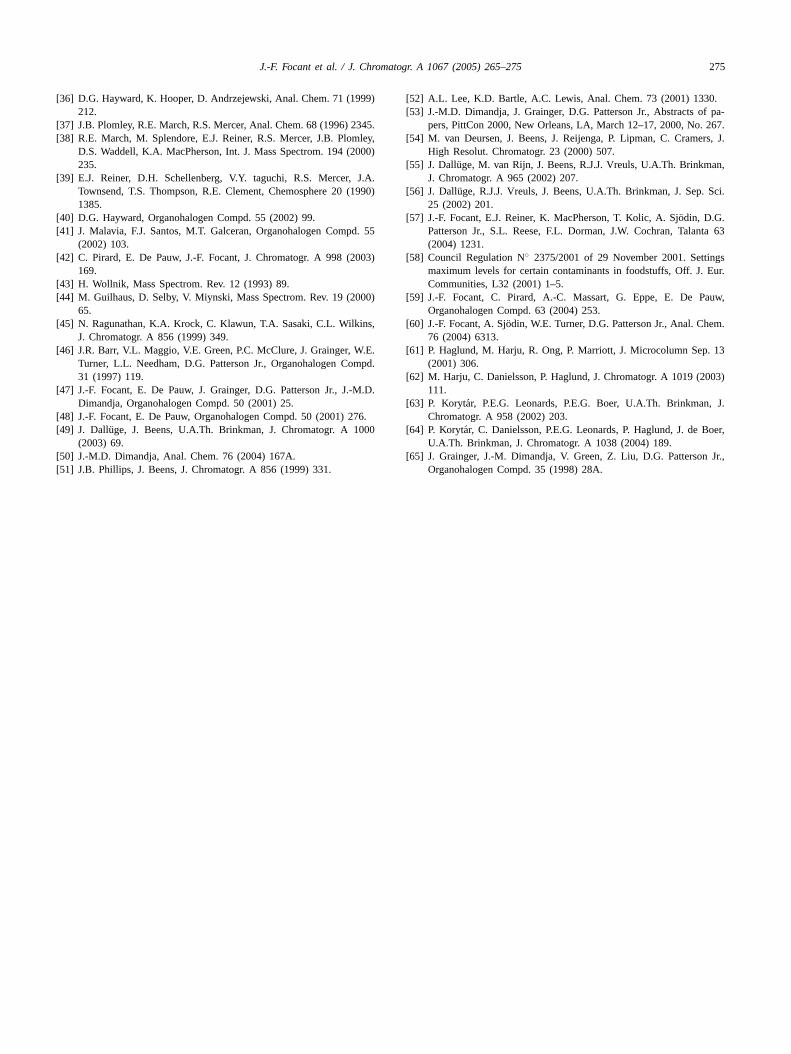
One could also mention the use of FGC–IDTOFMS asa screening tool capable to sort-out large biological samplebatches prior further investigation. In fact, it appears that mostof the total toxic equivalency (TEQ) of those samples is dueto very few congeners (Table 3). The use of 2,3,7,8-TCDD,2,3,7,8-TCDF, 1,2,3,7,8-PeCDD and 2,3,4,7,8-PeCDF as‘screening congeners’ can allow the use of simplified13C-
F MSuT
0 pg/�l, respectively (S/N greater than 3), which is notood as the one achieved using HRMS but allows the
ection and quantification of the prevalent PCBs preseeal human serum samples. Isotope ratio verification (35Cl,7Cl) was carried out during the data processing usingwo most intense masses for all native and13C12-labelledCBs and several characteristic masses were summuantification. The dynamic range covered three ordeagnitude (0.5 pg/�l up to 1000 pg/�l). In terms of ana
yte concentration, the comparison with the HRMS refereethod was good and some separation improvementsbserved. Identical sample preparation steps were perfo
or the methods comparison. However, it appeared thaOFMS instrument required less maintenance than the
ig. 6. Monitoring of selected ‘screening congeners’ by FGC–IDTOFsing a DB-5 MS (15 m× 0.10 mm i.d.× 0.10�m df) (J&W) column[49].he cycle time was less than 10 min.

272 J.-F. Focant et al. / J. Chromatogr. A 1067 (2005) 265–275
Table 3Relative contributions of selected congeners to the PCDD/F TEQ in selectedmatrices
Matrices Contributions to the TEQ (%)a
1,2,3,7,8-PeCDDand2,3,4,7,8-PeCDF
2,3,7,8-TCDDand2,3,7,8-TCDF
Sum
Terrestrial Horse 68 11 79Lamb 74 15 89Beef 79 6 85Pork 68 6 74Chicken 69 17 85Eggs 60 12 71Cream 86 0 86Butter 85 0 85Milk 75 8 83Powder milk 81 0 81Cheese 72 13 85
Aquatic Prawns 55 36 91Mackerel 41 58 99Trout 58 40 98
a See[48] for the source of the data.
label standard mixtures, the time compression of the GCrun and slight simplification of the samples preparationstep[48]. Fig. 6 shows the type of separation that can beachieved in few minutes using classical GC injector andoven.
3.3. GC×GC–TOFMS
As we saw, TOFMS is well suited for the analysis of toxi-cants like PCBs. However, this type of instrument has a ratherlimited sensitivity, which does not allow low picogram de-tection with sufficient reliability. Comprehensive GC× GCis a relatively new technique that rests on the use of two dif-ferent GC column phases to improve the chromatographicseparation efficiency. Its comprehensive aspect is due to thefact that all eluents from the first dimension column (1D) arere-injected into the second dimension column (2D) with con-servation of the resolution already achieved in1D. Extensivereview of the principles of the technique is available in theliterature[49,50]. GC× GC offers several advantages overclassical GC[51]. Among them, on the side of the significantpeak capacity enhancement, an increase in peak intensity isobtained after zone compression due to the modulation ofthe eluents of1D. Because narrow peaks are produced aftermodulation, mass conservation ensures higher peak intensi-t torn
e-s m inw sim-i an-aG ndp
TOFMS as a promising tool for the analysis of complexmixture of analytes at the pictogram level[54–56]. Clas-sically, 2D peak widths are 100–200 ms. The coupling be-tween GC× GC and TOFMS is thus symbiotic because theGC× GC component allows signal enhancement and im-provement of the TOFMS LODs, although TOFMS is thefast mass analyser of choice for the description of narrow2D peaks. Very recently, a robust GC× GC–TOFMS instru-ment has been launched on the market. This contributed tomove the technique from its childhood stage to a more ma-ture status, making it a tool to be evaluated in various areasof separation science.
The use of GC× GC–TOFMS for the isotope dilutionmeasurement of dioxins and related compounds in environ-mental matrices such as soils and ashes showed to be cor-related to GC–IDHRMS data[57]. The use of a1D RTX-Dioxin2 specialty phase combined with a more polar RTX-500 phase permitted the resolution of all PCDD/F congenersof interest in1D although remaining matrix interferenceswere kept away from analyte peaks in2D. The iLODs were aslow as 0.2–0.5 pg for 2,3,7,8-TCDD. The calibration curvesshowed good correlation coefficients for the 17 PCDD/Fs inthe concentration range of 0.5–200 pg (Table 4). Such sen-sitivity should allow to fulfil requirements such as the EUmaximum levels in foodstuffs[58], depending on congenerp e ef-fi assa ofo aph-t Hs),P nts ofP singGT d forG l frac-t rriedoP DFs.F BDEsi e-mc ratedi ess
TT thewl
Ec
2
ies [52]. This is of prime interest when LODs of a deteceed to be improved, as it is the case for TOFMS.
The coupling of GC× GC with TOFMS has been prented as a comprehensive three-dimensional systehich gas sample components go through three dis
lar separation mechanisms based, for example, onlyte volatility, polarity, and mass[53]. Early work onC× GC–TOFMS were limited by the data handling arocessing but more recent reports presented GC× GC–
rofile. Current developments are carried out to ensurciency at the EU target level. The comprehensive mnalysis of the TOFMS further permits the identificationther contaminants of concern such as polychlorinated n
halenes (PCNs), polycyclic aromatic hydrocarbons (PACBs and PBDEs present in the samples. MeasuremeCDD/Fs and PCBs in human and foodstuff matrices uC× GC–IDTOFMS have also been reported recently[59].he sample preparation-fractionation procedure designeC–IDHRMS analyses can be modified because severa
ions can be combined and a single injection can be caut for the measurement of non-ortho PCBs, mono-orthoCBs, and indicator PCBs, as well as PCDDs and PCor simultaneous measurement of PCBs, OCPs and P
n human serum samples[60], a 10-times sensitivity enhancent resulted from the compromise between GC× GC zone
ompression and the TOFMS scanning rate. This is illustn Fig. 7 for 2,3,7,8-TCDF. Because the modulation proc
able 4rueness of the GC× GC–IDTOFMS response for 2,3,7,8-TCDF inorking dynamic range based on12C native (m/z 304 and 306) and13C
abelled (m/z316 and 318) ions
xpectedoncentration
Average measuredconcentration
R.S.D. (n= 3)(%)
00 198.0 3.040 41.5 1.410 10.3 3.82 1.9 3.90.5 0.5 6.4

J.-F. Focant et al. / J. Chromatogr. A 1067 (2005) 265–275 273
Fig. 7. Signal enhancement for 200 pg of12C 2,3,7,8-TCDF. (A) The 3pulses correspond to the modulated GC× GC peaks and the small Gaussianpeak is the classical1D signal, (B) zoom on the base peak of the clustershowing both traces for12C native (m/z306, black) and13C label (m/z318,grey), (C) mass spectra of the base peak.
generates up to five peaks for each analyte, the peak integra-tion procedure is more complex than in the case of classicalGC and peak combination has to be carried out to performthe quantification. This resulted in a significant increase ofthe processing time and enlargement of file size, which canbe up to several hours and several Gb for a calibration curve,respectively.
Other column sets have been investigated in the area ofdioxin and PCB separation using GC× GC [61]. Very fine-tuning of the phase combination is possible to get the bestchromatographic separation for very complex mixtures suchas the 209 PCB congeners (Fig. 8) [28,62]. In such a case,if one cannot strictly talk about fast GC conditions (total runtime of 140 min), the number of analytes separated per unitof time (analytical speed) is at least as good as in classical GC(1.3 analyte per min). The use of�ECD instead of TOFMScan improve the system LODs[63,64]. Korytar et al. reportedLOD values of 90 fg for 2,3,7,8-TCDD. The choice betweenelectron capture or MS type detectors depends on the specificapplication area of the method. The relatively cheap�ECDbetter matches the needs for screening of well defined an-alytes although TOFMS offers mass spectral data that canbe used to confirm the presence of expected analytes and toidentify unexpected analytes when seeking for new toxicants.In addition, TOFMS produces less post-column band broad-e mite ned.I com-p volu-t ell.T y
Fig. 8. GC× GC–TOFMS contour plot of the 209 PCBs. The distributionof the peaks was highly structured in the chromatographic space and basedon the degree ofortho-substitution within each separated homologue series.A total of 192 congeners were resolved (chromatographically or by meanof deconvolution) in 146 min (1.3 analyte per min) using this column set.The 12 toxic dioxin-like congeners and the 7 European Union marker PCBswere separated from any interfering congeners. The column set was madeof a HT-8 (50 m× 0.22 mm i.d.× 0.25�m df) (SGE) as1D and a BPX-50(2.5 m× 0.10 mm i.d.× 0.10�m df) (SGE) as2D. See previous report forcomplete peak assignment[28].
simultaneously offer both type of detection to combine thesensitivity of the�ECD and the selectivity of the TOFMS.
Finally, because of the resulting zone compression aftermodulation, another field of application for GC× GC is itsuse as a signal enhancer, rather than to increase the peakcapacity of the chromatographic separation. A current area ofefforts is the coupling between GC× GC and sensitive sectorHRMS instruments. In the case of PCDD/Fs, where a goodseparation of the seventeen 2,3,7,8-substituted congeners canbe achieved in less than 40 min with classical GC, the use ofthe GC× GC modulator with a short piece of open tube as2D can improve instrument LODs. Early promising resultswere in the low femtograms-high attograms range for 2,3,7,8-TCDD [65]. Improvements of some aspects like sector MSscanning rate and data handling still need to be carried out tooffer the robustness required for routine use of this extremelysensitive tool for ultra-trace analysis.
s.
ning than�ECD and narrower peak widths might perasier peak identification when retention times are tighte
n cases where chromatographic resolution has to beromised in favour of speed, the mass spectral decon
ion capability of the TOFMS can be a valuable tool as whe next generation of GC× GC instruments will probabl
Fig. 9. Analytical triangle of the investigated measurement method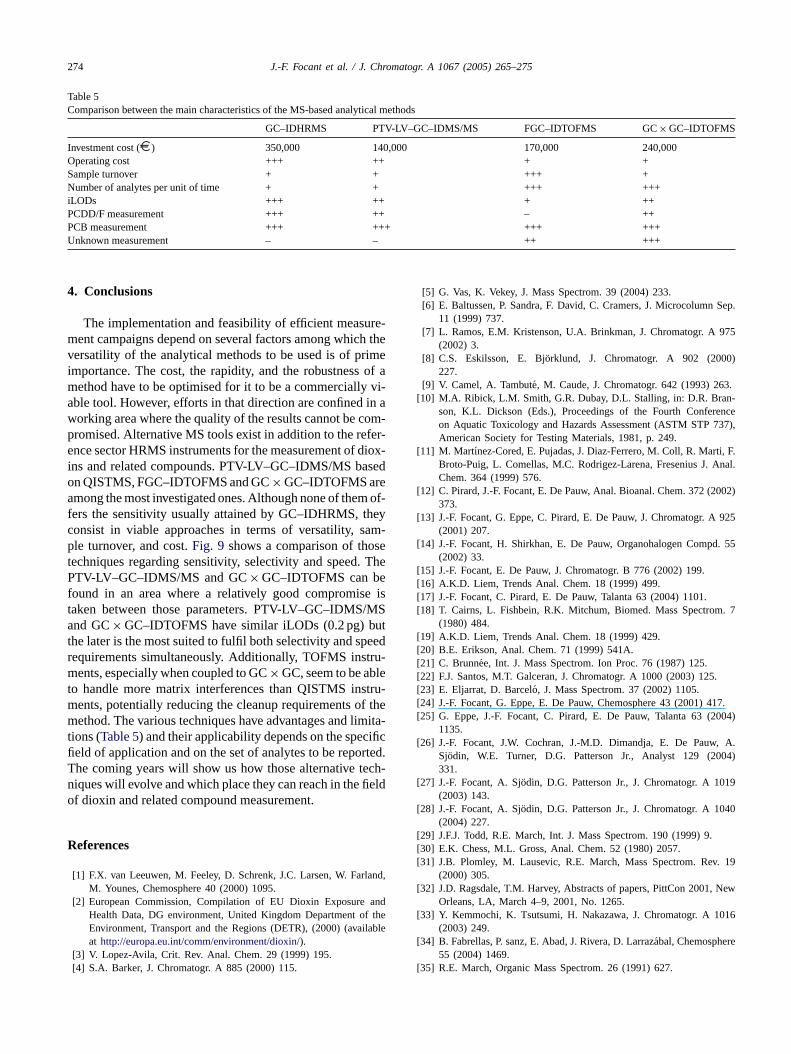
274 J.-F. Focant et al. / J. Chromatogr. A 1067 (2005) 265–275
Table 5Comparison between the main characteristics of the MS-based analytical methods
GC–IDHRMS PTV-LV–GC–IDMS/MS FGC–IDTOFMS GC× GC–IDTOFMS
Investment cost (D ) 350,000 140,000 170,000 240,000Operating cost +++ ++ + +Sample turnover + + +++ +Number of analytes per unit of time + + +++ +++iLODs +++ ++ + ++PCDD/F measurement +++ ++ – ++PCB measurement +++ +++ +++ +++Unknown measurement – – ++ +++
4. Conclusions
The implementation and feasibility of efficient measure-ment campaigns depend on several factors among which theversatility of the analytical methods to be used is of primeimportance. The cost, the rapidity, and the robustness of amethod have to be optimised for it to be a commercially vi-able tool. However, efforts in that direction are confined in aworking area where the quality of the results cannot be com-promised. Alternative MS tools exist in addition to the refer-ence sector HRMS instruments for the measurement of diox-ins and related compounds. PTV-LV–GC–IDMS/MS basedon QISTMS, FGC–IDTOFMS and GC× GC–IDTOFMS areamong the most investigated ones. Although none of them of-fers the sensitivity usually attained by GC–IDHRMS, theyconsist in viable approaches in terms of versatility, sam-ple turnover, and cost.Fig. 9 shows a comparison of thosetechniques regarding sensitivity, selectivity and speed. ThePTV-LV–GC–IDMS/MS and GC× GC–IDTOFMS can befound in an area where a relatively good compromise istaken between those parameters. PTV-LV–GC–IDMS/MSand GC× GC–IDTOFMS have similar iLODs (0.2 pg) butthe later is the most suited to fulfil both selectivity and speedrequirements simultaneously. Additionally, TOFMS instru-ments, especially when coupled to GC× GC, seem to be ablet tru-m f them imita-t ificfi rted.T ech-n fieldo
R
land,
andthe
lable
[5] G. Vas, K. Vekey, J. Mass Spectrom. 39 (2004) 233.[6] E. Baltussen, P. Sandra, F. David, C. Cramers, J. Microcolumn Sep.
11 (1999) 737.[7] L. Ramos, E.M. Kristenson, U.A. Brinkman, J. Chromatogr. A 975
(2002) 3.[8] C.S. Eskilsson, E. Bjorklund, J. Chromatogr. A 902 (2000)
227.[9] V. Camel, A. Tambute, M. Caude, J. Chromatogr. 642 (1993) 263.
[10] M.A. Ribick, L.M. Smith, G.R. Dubay, D.L. Stalling, in: D.R. Bran-son, K.L. Dickson (Eds.), Proceedings of the Fourth Conferenceon Aquatic Toxicology and Hazards Assessment (ASTM STP 737),American Society for Testing Materials, 1981, p. 249.
[11] M. Martınez-Cored, E. Pujadas, J. Diaz-Ferrero, M. Coll, R. Marti, F.Broto-Puig, L. Comellas, M.C. Rodrigez-Larena, Fresenius J. Anal.Chem. 364 (1999) 576.
[12] C. Pirard, J.-F. Focant, E. De Pauw, Anal. Bioanal. Chem. 372 (2002)373.
[13] J.-F. Focant, G. Eppe, C. Pirard, E. De Pauw, J. Chromatogr. A 925(2001) 207.
[14] J.-F. Focant, H. Shirkhan, E. De Pauw, Organohalogen Compd. 55(2002) 33.
[15] J.-F. Focant, E. De Pauw, J. Chromatogr. B 776 (2002) 199.[16] A.K.D. Liem, Trends Anal. Chem. 18 (1999) 499.[17] J.-F. Focant, C. Pirard, E. De Pauw, Talanta 63 (2004) 1101.[18] T. Cairns, L. Fishbein, R.K. Mitchum, Biomed. Mass Spectrom. 7
(1980) 484.[19] A.K.D. Liem, Trends Anal. Chem. 18 (1999) 429.[20] B.E. Erikson, Anal. Chem. 71 (1999) 541A.[21] C. Brunnee, Int. J. Mass Spectrom. Ion Proc. 76 (1987) 125.[22] F.J. Santos, M.T. Galceran, J. Chromatogr. A 1000 (2003) 125.[[ 17.[ 004)
[ , A.04)
[ 019
[ 040
[[[ . 19
[ New
[ 016
[ re
[
o handle more matrix interferences than QISTMS insents, potentially reducing the cleanup requirements oethod. The various techniques have advantages and l
ions (Table 5) and their applicability depends on the speceld of application and on the set of analytes to be repohe coming years will show us how those alternative tiques will evolve and which place they can reach in thef dioxin and related compound measurement.
eferences
[1] F.X. van Leeuwen, M. Feeley, D. Schrenk, J.C. Larsen, W. FarM. Younes, Chemosphere 40 (2000) 1095.
[2] European Commission, Compilation of EU Dioxin ExposureHealth Data, DG environment, United Kingdom Department ofEnvironment, Transport and the Regions (DETR), (2000) (avaiat http://europa.eu.int/comm/environment/dioxin/).
[3] V. Lopez-Avila, Crit. Rev. Anal. Chem. 29 (1999) 195.[4] S.A. Barker, J. Chromatogr. A 885 (2000) 115.
23] E. Eljarrat, D. Barcelo, J. Mass Spectrom. 37 (2002) 1105.24] J.-F. Focant, G. Eppe, E. De Pauw, Chemosphere 43 (2001) 425] G. Eppe, J.-F. Focant, C. Pirard, E. De Pauw, Talanta 63 (2
1135.26] J.-F. Focant, J.W. Cochran, J.-M.D. Dimandja, E. De Pauw
Sjodin, W.E. Turner, D.G. Patterson Jr., Analyst 129 (20331.
27] J.-F. Focant, A. Sjodin, D.G. Patterson Jr., J. Chromatogr. A 1(2003) 143.
28] J.-F. Focant, A. Sjodin, D.G. Patterson Jr., J. Chromatogr. A 1(2004) 227.
29] J.F.J. Todd, R.E. March, Int. J. Mass Spectrom. 190 (1999) 9.30] E.K. Chess, M.L. Gross, Anal. Chem. 52 (1980) 2057.31] J.B. Plomley, M. Lausevic, R.E. March, Mass Spectrom. Rev
(2000) 305.32] J.D. Ragsdale, T.M. Harvey, Abstracts of papers, PittCon 2001,
Orleans, LA, March 4–9, 2001, No. 1265.33] Y. Kemmochi, K. Tsutsumi, H. Nakazawa, J. Chromatogr. A 1
(2003) 249.34] B. Fabrellas, P. sanz, E. Abad, J. Rivera, D. Larrazabal, Chemosphe
55 (2004) 1469.35] R.E. March, Organic Mass Spectrom. 26 (1991) 627.
J.-F. Focant et al. / J. Chromatogr. A 1067 (2005) 265–275 275
[36] D.G. Hayward, K. Hooper, D. Andrzejewski, Anal. Chem. 71 (1999)212.
[37] J.B. Plomley, R.E. March, R.S. Mercer, Anal. Chem. 68 (1996) 2345.[38] R.E. March, M. Splendore, E.J. Reiner, R.S. Mercer, J.B. Plomley,
D.S. Waddell, K.A. MacPherson, Int. J. Mass Spectrom. 194 (2000)235.
[39] E.J. Reiner, D.H. Schellenberg, V.Y. taguchi, R.S. Mercer, J.A.Townsend, T.S. Thompson, R.E. Clement, Chemosphere 20 (1990)1385.
[40] D.G. Hayward, Organohalogen Compd. 55 (2002) 99.[41] J. Malavia, F.J. Santos, M.T. Galceran, Organohalogen Compd. 55
(2002) 103.[42] C. Pirard, E. De Pauw, J.-F. Focant, J. Chromatogr. A 998 (2003)
169.[43] H. Wollnik, Mass Spectrom. Rev. 12 (1993) 89.[44] M. Guilhaus, D. Selby, V. Miynski, Mass Spectrom. Rev. 19 (2000)
65.[45] N. Ragunathan, K.A. Krock, C. Klawun, T.A. Sasaki, C.L. Wilkins,
J. Chromatogr. A 856 (1999) 349.[46] J.R. Barr, V.L. Maggio, V.E. Green, P.C. McClure, J. Grainger, W.E.
Turner, L.L. Needham, D.G. Patterson Jr., Organohalogen Compd.31 (1997) 119.
[47] J.-F. Focant, E. De Pauw, J. Grainger, D.G. Patterson Jr., J.-M.D.Dimandja, Organohalogen Compd. 50 (2001) 25.
[48] J.-F. Focant, E. De Pauw, Organohalogen Compd. 50 (2001) 276.[49] J. Dalluge, J. Beens, U.A.Th. Brinkman, J. Chromatogr. A 1000
(2003) 69.[50] J.-M.D. Dimandja, Anal. Chem. 76 (2004) 167A.[51] J.B. Phillips, J. Beens, J. Chromatogr. A 856 (1999) 331.
[52] A.L. Lee, K.D. Bartle, A.C. Lewis, Anal. Chem. 73 (2001) 1330.[53] J.-M.D. Dimandja, J. Grainger, D.G. Patterson Jr., Abstracts of pa-
pers, PittCon 2000, New Orleans, LA, March 12–17, 2000, No. 267.[54] M. van Deursen, J. Beens, J. Reijenga, P. Lipman, C. Cramers, J.
High Resolut. Chromatogr. 23 (2000) 507.[55] J. Dalluge, M. van Rijn, J. Beens, R.J.J. Vreuls, U.A.Th. Brinkman,
J. Chromatogr. A 965 (2002) 207.[56] J. Dalluge, R.J.J. Vreuls, J. Beens, U.A.Th. Brinkman, J. Sep. Sci.
25 (2002) 201.[57] J.-F. Focant, E.J. Reiner, K. MacPherson, T. Kolic, A. Sjodin, D.G.
Patterson Jr., S.L. Reese, F.L. Dorman, J.W. Cochran, Talanta 63(2004) 1231.
[58] Council Regulation N◦ 2375/2001 of 29 November 2001. Settingsmaximum levels for certain contaminants in foodstuffs, Off. J. Eur.Communities, L32 (2001) 1–5.
[59] J.-F. Focant, C. Pirard, A.-C. Massart, G. Eppe, E. De Pauw,Organohalogen Compd. 63 (2004) 253.
[60] J.-F. Focant, A. Sjodin, W.E. Turner, D.G. Patterson Jr., Anal. Chem.76 (2004) 6313.
[61] P. Haglund, M. Harju, R. Ong, P. Marriott, J. Microcolumn Sep. 13(2001) 306.
[62] M. Harju, C. Danielsson, P. Haglund, J. Chromatogr. A 1019 (2003)111.
[63] P. Korytar, P.E.G. Leonards, P.E.G. Boer, U.A.Th. Brinkman, J.Chromatogr. A 958 (2002) 203.
[64] P. Korytar, C. Danielsson, P.E.G. Leonards, P. Haglund, J. de Boer,U.A.Th. Brinkman, J. Chromatogr. A 1038 (2004) 189.
[65] J. Grainger, J.-M. Dimandja, V. Green, Z. Liu, D.G. Patterson Jr.,Organohalogen Compd. 35 (1998) 28A.
Related Documents