1 /^ HUDSON RIVER PCBs REASSESSMENT RI/FS PHASE 3 REPORT: FEASIBILITY STUDY DECEMBER 2000 For U.S. Environmental Protection Agency Region 2 and U.S. Army Corps of Engineers Kansas City District Book 1 of 6 Report Text TAMS Consultants, Inc. 400207

Welcome message from author
This document is posted to help you gain knowledge. Please leave a comment to let me know what you think about it! Share it to your friends and learn new things together.
Transcript

1 /^HUDSON RIVER PCBs REASSESSMENT RI/FS
PHASE 3 REPORT: FEASIBILITY STUDY
DECEMBER 2000
For
U.S. Environmental Protection AgencyRegion 2
andU.S. Army Corps of Engineers
Kansas City District
Book 1 of 6Report Text
TAMS Consultants, Inc.
400207

HUDSON RIVER PCBs REASSESSMENT RI/FSPHASE 3 REPORT: FEASIBILITY STUDY
DECEMBER 2000
For
U.S. Environmental Protection AgencyRegion 2
andU.S. Army Corps of Engineers
Kansas City District
Book 1 of 6Report Text
TAMS Consultants, Inc.
400208

UNITED STATES ENVIRONMENTAL PROTECTION AGENCYREG ION 2
290 BROADWAYNEW YORK, NY 10007-1866
December 8, 2000
To All Interested Parties:
The U.S. Environmental Protection Agency (USEPA) is pleased to release the Feasibility Study,which is Phase 3 of the Reassessment Remedial Investigation/Feasibility Study (Reassessment RI/FS) forthe Hudson River PCBs Superfund Site. The Feasibility Study identifies and evaluates in detail the potentialremedial alternatives for addressing the PCB-contaminated sediments in the Upper Hudson River.
USEPA will accept public comments on the Agency' s Proposed Plan, which identifies the Agency' spreferred cleanup alternative, and on the Feasibility Study and other supporting analyses, through February16, 2001. USEPA will hold public meetings on December 12, 2000 in Saratoga Springs, New York and onDecember 14, 2000 in Poughkeepsie, New York to present the Proposed Plan and the results of theFeasibility Study and to accept public comment. In addition, USEPA is scheduling public meetings inJanuary 2001 to accept additional comment during the public comment period.
If you need additional information regarding the Feasibility Study or the Reassessment RI/FS, pleasecontact Ann Rychlenski at 212-637-3672.
Sincerely yours,
Richard L. Caspe, DirectorEmergency and Remedial Response Division
Internet Address (URL) • http://www,epa,gov 400209Recycled/Recyclable * Printed with Vegetable Oil Based (nfcs on Recycled Paper (Minimum 30% Postccmsumer)

Table Of Contents
oHrqoo
HUDSON RIVER PCBs REASSESSMENT RI/FSPHASE 3 REPORT: FEASIBILITY STUDY
TABLE OF CONTENTS
BOOK 1- TEXTEXECUTIVE SUMMARY . . . . . . . . . . . . . . . . . . . . . . . . . . . . . . . . . . . . . . . . . . . . . . . . . . . ES-1
1 INTRODUCTION TO THE FEASIBILITY STUDY (FS) . . . . . . . . . . . . . . . . . . . . . . 1-11.1 Purpose and Organization . . . . . . . . . . . . . . . . . . . . . . . . . . . . . . . . . . . . . . . . . 1-1
1.1.1 Purpose: Overview of the Feasibility Study Process under theComprehensive Environmental Response, Compensation, andLiability Act OF 1980, as Amended (CERCLA) . . . . . . . . . . . . . . . . . .1-1
1.1.2 Organization of the Feasibility Study Report..................... 1-31.2 Background Information . . . . . . . . . . . . . . . . . . . . . . . . . . . . . . . . . . . . . . . . . . 1-5
1.2.1 Site Description . . . . . . . . . . . . . . . . . . . . . . . . . . . . . . . . . . . . . . . . . . . 1-51.2.1.1 Hydrology . . . . . . . . . . . . . . . . . . . . . . . . . . . . . . . . . . . . . . . . . 1-61.2.1.2 River Bed Geology . . . . . . . . . . . . . . . . . . . . . . . . . . . . . . . . . . . 1-71.2.1.3 Wetlands and Floodplains . . . . . . . . . . . . . . . . . . . . . . . . . . . . . 1-81.2.1.4 Achaeological, Historic, and Cultural Resources . . . . . . . . . . . 1-91.2.1.5 Demographics and Land Use . . . . . . . . . . . . . . . . . . . . . . . . . . 1-111.2.1.6 Water U s e . . . . . . . . . . . . . . . . . . . . . . . . . . . . . . . . . . . . . . . . . 1-111.2.1.7 Ecological Resources . . . . . . . . . . . . . . . . . . . . . . . . . . . . . . . . 1-12
1.2.2 Site History . . . . . . . . . . . . . . . . . . . . . . . . . . . . . . . . . . . . . . . . . . . . . 1-131.3 Nature and Extent of Contamination . . . . . . . . . . . . . . . . . . . . . . . . . . . . . . . . 1-20
1.3.1 Nature of Contamination . . . . . . . . . . . . . . . . . . . . . . . . . . . . . . . . . . . 1-211.3.1.1 Analysis of PCBs . . . . . . . . . . . . . . . . . . . . . . . . . . . . . . . . . . . 1-211.3.1.2 Chemical and Physical Properties of PCBs . . . . . . . . . . . . . . . 1-241.3.1.3 Biological and Toxicological Properties of PCBs . . . . . . . . . . 1-25
1.3.2 Sources of PCBs in the Upper Hudson River . . . . . . . . . . . . . . . . . . . 1-261.3.2.1 Upstream Baseline - Niagara-Mohawk Power Corporation
Queensbury Site . . . . . . . . . . . . . . . . . . . . . . . . . . . . . . . . . . . . 1-271.3.2.2 GE Hudson Falls Facility . . . . . . . . . . . . . . . . . . . . . . . . . . . . . 1-271.3.2.3 GE Fort Edward Facility . . . . . . . . . . . . . . . . . . . . . . . . . . . . . 1-291.3.2.4 Remnant Deposit 1 . . . . . . . . . . . . . . . . . . . . . . . . . . . . . . . . . . 1-291.3.2.5 Remnant Deposits 2 through 5 . . . . . . . . . . . . . . . . . . . . . . . . . 1-301.3.2.6 Summary of PCB Sources between Rogers Island and
Hudson Falls . . . . . . . . . . . . . . . . . . . . . . . . . . . . . . . . . . . . . . . 1-301.3.3 PCBs in the Water Column . . . . . . . . . . . . . . . . . . . . ~ . . . . . . . . . . . . 1-311.3.4 PCBs in Sediment . . . . . . . . . . . . . . . . . . . . . . . . . . . . . . . . . . . . . . . . 1-33
1.3.4.1 Sediment PCB Inventory Estimates . . . . . . . . . . . . . . . . . . . . . 1-351.3.4.2 Additional Sediment Inventory Studies . . . . . . . . . . . . . . . . . . 1-37
1.3.5 PCBs in Fish . . . . . . . . . . . . . . . . . . . . . . . . . . . . . . . . . . . . . . . . . . . . 1-39: 1.4 Fate, Transport, and Bioaccumulation of PCB sin the Upper Hudson River .1-40
i TAMS
HUDSON RIVER PCBs REASSESSMENT RI/FSPHASE 3 REPORT: FEASIBILITY STUDY
TABLE OF CONTENTS (CONTINUED)
1.4.1 Geochemical Investigations . . . . . . . . . . . . . . . . . . . . . . . . . . . . . . . . . 1-411.4.2 Modeling Analysis . . . . . . . . . . . . . . . . . . . . . . . . . . . . . . . . . . . . . . . . 1-421.4.3 Transport of PCBs in Upper Hudson River Sediments . . . . . . . . . . . . 1-441.4.4 Long-Term Sequestration of PCBs . . . . . . . . . . . . . . . . . . . . . . . . . . . 1-451.4.5 PCB Transport from the Upper Hudson to the Lower Hudson . . . . . . 1-46
1.5 Baseline Human Health and Ecological Risk Assessments . . . . . . . . . . . . . . . 1-471.5.1 Risks to Human Health . . . . . . . . . . . . . . . . . . . . . . . . . . . . . . . . . . . . 1-471.5.2 Ecological Risks . . . . . . . . . . . . . . . . . . . . . . . . . . . . . . . . . . . . . . . . . . 1-51
1.6 Public Outreach and Peer Review . . . . . . . . . . . . . . . . . . . . . . . . . . . . . . . . . . 1-551.6.1 Public Outreach . . . . . . . . . . . . . . . . . . . . . . . . . . . . . . . . . . . . . . . . . . 1-551.6.2 Peer Review . . . . . . . . . . . . . . . . . . . . . . . . . . . . . . . . . . . . . . . . . . . . . 1-56
2 IDENTIFICATION OF POTENTIALLY APPLICABLE OR RELEVANT ANDAPPROPRIATE REQUIREMENTS (ARARs) AND TO-BE-CONSIDERED (TBC)CRITERIA . . . . . . . . . . . . . . . . . . . . . . . . . . . . . . . . . . . . . . . . . . . . . . . . . . . . . . . . . . . 2-12.1 Definition of ARARs . . . . . . . . . . . . . . . . . . . . . . . . . . . . . . . . . . . . . . . . . . . . . 2-1
2.1.1 Applicable Requirements . . . . . . . . . . . . . . . . . . . . . . . . . . . . . . . . . . . . 2-32.1.2 Relevant and Appropriate Requirements . . . . . . . . . . . . . . . . . . . . . . . . 2-32.1.3 Other Requirements To Be Considered . . . . . . . . . . . . . . . . . . . . . . . . 2-42.1.4 Waiver of ARARs . . . . . . . . . . . . . . . . . . . . . . . . . . . . . . . . . . . . . . . . . 2-4
2.2 Development of ARARs . . . . . . . . . . . . . . . . . . . . . . . . . . . . . . . . . . . . . . . . . . 2-52.3 Chemical-Specific ARARs . . . . . . . . . . . . . . . . . . . . . . . . . . . . . . . . . . . . . . . . 2-6
2.3.1 Federal Chemical-Specific ARARs . . . . . . . . . . . . . . . . . . . . . . . . . . . . 2-62.3.2 New York State Chemical-Specific ARARs . . . . . . . . . . . . . . . . . . . . . 2-72.3.3 Chemical-Specific Criteria, Advisories, and Guidance to
be Considered . . . . . . . . . . . . . . . . . . . . . . . . . . . . . . . . . . . . . . . . . . . . . 2-82.4 Location-Specific ARARs . . . . . . . . . . . . . . . . . . . . . . . . . . . . . . . . . . . . . . . . 2-10
2.4.1 Federal Location-Specific ARARs . . . . . . . . . . . . . . . . . . . . . . . . . . . 2-112.4.2 New York State Location-Specific ARARs . . . . . . . . . . . . . . . . . . . . . 2-142.4.3 Location-Specific Criteria, Advisories, and Guidance to
be Considered . . . . . . . . . . . . . . . . . . . . . . . . . . . . . . . . . . . . . . . . . . . . 2-162.5 Action-Specific A R A R s . . . . . . . . . . . . . . . . . . . . . . . . . . . . . . . . . . . . . . . . . . 2-16
2.5.1 Federal Action-Specific ARARs . . . . . . . . . . . . . . . . . . . . . . . . . . . . . 2-172.5.2 New York State Action-specific ARARs . . . . . . . . . . . . . . . . . . . . . . . 2-212.5.3 Action-Specific Criteria, Advisories, and Guidance to be Considered 2-24
3. IDENTIFICATION OF REMEDIAL ACTION OBJECTIVES (RAOs) ANDRESPONSE ACTIONS . . . . . . . . . . . . . . . . . . . . . . . . . . . . . . . . . . . . . . . . . . . . . . . . . 3-13.1 Basis and Development of Remedial Action Objectives . . . . . . . . . . . . . . . . . . 3-13.2 Calculation of Risk-Based Concentrations for Human and Ecological
ii TAMS400212
HUDSON RIVER PCBs REASSESSMENT RI/FSPHASE 3 REPORT: FEASIBILITY STUDY
TABLE OF CONTENTS (CONTINUED)Page
Receptors . . . . . . . . . . . . . . . . . . . . . . . . . . . . . . . . . . . . . . . . . . . . . . . . . . . . . . 3-23.2.1 Human Health Risk-Based Concentrations . . . . . . . . . . . . . . . . . . . . . . 3-33.2.2 Ecological Risk-Based Concentrations (RBCs) . . . . . . . . . . . . . . . . . . . 3-3
3.3 Preliminary Remedial Goals (PRGs) . . . . . . . . . . . . . . . . . . . . . . . . . . . . . . . . . 3-43.4 Limitations on Meeting PRGs . . . . . . . . . . . . . . . . . . . . . . . . . . . . . . . . . . . . . . 3-6
3.4.1 Surface Water PRGs . . . . . . . . . . . . . . . . . . . . . . . . . . . . . . . . . . . . . . . 3-63.4.1.1 Baseline Input at Glens Falls . . . . . . . . . . . . . . . . . . . . . . . . . . . 3-83.4.1.2 Current Inputs at Bakers Falls . . . . . . . . . . . . . . . . . . . . . . . . . . 3-8
3.4.2 Fish PRGs . . . . . . . . . . . . . . . . . . . . . . . . . . . . . . . . . . . . . . . . . . . . . . . 3-93.4.3 Limitations on Verifying Compliance with PRGs . . . . . . . . . . . . . . . . 3 - 1 0
3.5 Selection of Sediment Target Areas for Remediation . . . . . . . . . . . . . . . . . . . 3-103.5.1 Target Area Selection Considerations . . . . . . . . . . . . . . . . . . . . . . . . . 3-113.5.2 Application of the Available Data to Identification of Sediments for
Remediation . . . . . . . . . . . . . . . . . . . . . . . . . . . . . . . . . . . . . . . 3-223.5.2.1 Definition and Calculation of PCB Metrics . . . . . . . . . . . . . . . 3-223.5.2.2 Application of the Available Data . . . . . . . . . . . . . . . . . . . . . . 3-29
3.5.3 Criterial for Selection of Remedial Target Areas . . . . . . . . . . . . . . . . 3-383.5.3.1 Development of Mass per Unit Area (MPA) Criteria . . . . . . . 3-393.5.3.2 Remediation Threshold Criteria . . . . . . . . . . . . . . . . . . . . . . . . 3-42
3.5.4 Criteria Application . . . . . . . . . . . . . . . . . . . . . . . . . . . . . . . . . . . . . . . 3-443.5.4.1 Examples of the Areas Selected under the Expanded Hot Spot
Remediation . . . . . . . . . . . . . . . . . . . . . . . . . . . . . . . . . . . . . . . 3-453.5.4.2 Examples of the Areas Selected under the Hot Spot
Remediation . . . . . . . . . . . . . . . . . . . . . . . . . . . . . . . . . . . . . . . 3-503.5.4.3 Capture Efficiency . . . . . . . . . . . . . . . . . . . . . . . . . . . . . . . . . . 3-523.5.4.4 Other Considerations . . . . . . . . . . . . . . . . . . . . . . . . . . . . . . . . 3-54
3.6 Identification of General Response Actions . . . . . . . . . . . . . . . . . . . . . . . . . . 3-553.6.1 No Action . . . . . . . . . . . . . . . . . . . . . . . . . . . . . . . . . . . . . . . . . . . . . . . 3-563.6.2 Monitored Natural Attenuation . . . . . . . . . . . . . . . . . . . . . . . . . . . . . . 3-563.6.3 Institutional Controls . . . . . . . . . . . . . . . . . . . . . . . . . . . . . . . . . . . . . . 3-573.6.4 Containment . . . . . . . . . . . . . . . . . . . . . . . . . . . . . . . . . . . . . . . . . . . . . 3-573.6.5 In Situ Treatment . . . . . . . . . . . . . . . . . . . . . . . . . . . . . . . . . . . . . . . . . 3-573.6.6 Removal . . . . . . . . . . . . . . . . . . . . . . . . . . . . . . . . . . . . . . . . . . . . . . . . 3-583.6.7 Ex Situ T r e a t m e n t . . . . . . . . . . . . . . . . . . . . . . . . . . . . . . . . . . . . . . . . . 3-583.6.8 Beneficial Use . . . . . . . . . . . . . . . . . . . . . . . . . . . . . . . . . . . . . . . . . . . 3-583.6.9 Disposal . . . . . . . . . . . . . . . . . . . . . . . . . . . . . . . . . . . . . . . . . . . . . . . . 3-58
4.0 IDENTIFICATION AND SCREENING OF REMEDIAL TECHNOLOGIES . . . . . . 4-14.1 Sources and Methods for Identification of Potentially Applicable
Technologies . . . . . . . . . . . . . . . . . . . . . . . . . . . . . . . . . . . . . . . . . . . . . . . . . . . 4-1
iii TAMS400213
HUDSON RIVER PCBs REASSESSMENT RI/FSPHASE 3 REPORT: FEASIBILITY STUDY f
TABLE OF CONTENTS (CONTINUED) |Page !}
'!,
4.2 Technology Identification and Technical Implementability Screening . . . . . . . 4-3 j-4.2.1 No Action . . . . . . . . . . . . . . . . . . . . . . . . . . . . . . . . . . . . . . . . . . . . . . . . 4-4 |4.2.2 Monitored Natural Attenuation . . . . . . . . . . . . . . . . . . . . . . . . . . . . . . . 4-5 {4.2.3 Institutional Controls . . . . . . . . . . . . . . . . . . . . . . . . . . . . . . . . . . . . . . . 4-6 I4.2.4 C o n t a i n m e n t . . . . . . . . . . . . . . . . . . . . . . . . . . . . . . . . . . . . . . . . . . . . . . 4-7 I
4.2.4.1 Capping . . . . . . . . . . . . . . . . . . . . . . . . . . . . . . . . . . . . . . . . . . . 4-7 i;4.2.4.2 Retaining Dikes and Berms . . . . . . . . . . . . . . . . . . . . . . . . . . . 4-17 |
4.2.5 In Situ Treatment . . . . . . . . . . . . . . . . . . . . . . . . . . . . . . . . . . . . . . . . . 4-17 ^4.2.5.1 Bioremediation . . . . . . . . . . . . . . . . . . . . . . . . . . . . . . . . . . . . . 4-184.2.5.2 Solvent Extraction . . . . . . . . . . . . . . . . . . . . . . . . . . . . . . . . . . 4-214.2.5.3 Chemical Dechlorination . . . . . . . . . . . . . . . . . . . . . . . . . . . . . 4-214.2.5.4 Immobilization . . . . . . . . . . . . . . . . . . . . . . . . . . . . . . . . . . . . . 4-22
4.2.6 Removal Technologies . . . . . . . . . . . . . . . . . . . . . . . . . . . . . . . . . . . . . 4-244.2.6.1 Excavation . . . . . . . . . . . . . . . . . . . . . . . . . . . . . . . . . . . . . . . . 4-264.2.6.2 Dredg ing . . . . . . . . . . . . . . . . . . . . . . . . . . . . . . . . . . . . . . . . . . 4-264.2.6.3 Removal by Soil Freezing . . . . . . . . . . . . . . . . . . . . . . . . . . . . 4-31
4.2.7 Ex Situ T r e a t m e n t . . . . . . . . . . . . . . . . . . . . . . . . . . . . . . . . . . . . . . . . . 4-324.2.7.1 Sediment Pretreatment . . . . . ; . . . . . . . . . . . . . . . . . . . . . . . . . 4-334.2.7.2 Bioremediation . . . . . . . . . . . . . . . . . . . . . . . . . . . . . . . . . . . . . 4-364.2.7.3 Sediment Washing . . . . . . . . . . . . . . . . . . . . . . . . . . . . . . . . . . 4-404.2.7.4 Solvent Extraction . . . . . . . . . . . . . . . . . . . . . . . . . . . . . . . . . . 4-414.2.7.5 Chemical Dechlorination . . . . . . . . . . . . . . . . . . . . . . . . . . . . . 4-424.2.7.6 Thermal Desorption . . . . . . . . . . . . . . . . . . . . . . . . . . . . . . . . . 4-444.2.7.7 Thermal Destruction . . . . . . . . . . . . . . . . . . . . . . . . . . . . . . . . 4-454.2.7.8 Immobilization . . . . . . . . . . . . . . . . . . . . . . . . . . . . . . . . . . . . . 4-46
4.2.8 Beneficial Use . . . . . . . . . . . . . . . . . . . . . . . . . . . . . . . . . . . . . . . . . . . 4-474.2.8.1 Landfill Cover Material, Construction Fill, Mine Land
Reclamation . . . . . . . . . . . . . . . . . . . . . . . . . . . . . . . . . . . . . . . 4-474.2.8.2 Manufacture of Commercial Products . . . . . . . . . . . . . . . . . . . 4-51
4.2.9 Disposal Technologies . . . . . . . . . . . . . . . . . . . . . . . . . . . . . . . . . . . . . 4-514.2.9.1 Land Disposal . . . . . . . . . . . . . . . . . . . . . . . . . . . . . . . . . . . . . 4-524.2.9.2 Contained Aquatic Disposal . . . . . . . . . . . . . . . . . . . . . . . . . . 4-54
4.2.10 Summary of Initial Screening of Technologies . . . . . . . . . . . . . . . . . . 4-564.2.11 Supporting Technologies . . . . . . . . . . ; . . . . . . . . . . . . . . . . . . . . . . . . 4-58
4.3 Effectiveness, Implementability, and Cost Screening of Technology Process .Options . . . . . . . . . . . . . . . . . . . . . . . . . . . . . ; ' _ . . . . . . . . . . . . . . . . . . . . . . . . . 4-594.3.1 No Action . . . . . . . . . . . . . . . . . . . . . . . . . . . . . . . . . . . . . . . . . . . . . . . 4-60
4.3.1.1 Effectiveness . . . . . . . . . . . . . . . . . . . . . . . . . . . . . . . . . . . . . . 4-614.3.1.2 Implementability . . . . . . . . . . . . . . . . . . . . . . . . . . . . . . . . . . . 4-614.3.1.3 Costs . . . . . . . . . . . . . . . . . . . . . . . . . . . . . . . . . . . . . . . . . . . . . 4-61
iv TAMS400214
HUDSON RIVER PCBs REASSESSMENT RI/FSPHASE 3 REPORT: FEASIBILITY STUDY
TABLE OF CONTENTS (CONTINUED)
4.3.1.4 Conclusion . . . . . . . . . . . . . . . . . . . . . . . . . . . . . . . . . . . . . . . . 4-614.3.2 Monitored Natural Attenuation .............................. 4-61
4.3.2.1 Effectiveness . . . . . . . . . . . . . . . . . . . . . . . . . . . . . . . . . . . . . . 4-624.3.2.2 Implementability . . . . . . . . . . . . . . . . . . . . . . . . . . . . . . . . . . . 4-634.3.2.3 Costs . . . . . . . . . . . . . . . . . . . . . . . . . . . . . . . . . . . . . . . . . . . . . 4-634.3.2.4 Conclusion . . . . . . . . . . . . . . . . . . . . . . . . . . . . . . . . . . . . . . . . 4-63
4.3.3 Institutional Controls . . . . . . . . . . . . . . . . . . . . . . . . . . . . . . . . . . . . . . 4-634.3.3.1 Effectiveness . . . . . . . . . . . . . . . . . . . . . . . . . . . . . . . . . . . . . . 4-644.3.3.2 Implementability . . . . . . . . . . . . . . . . . . . . . . . . . . . . . . . . . . . 4-644.3.3.3 Costs . . . . . . . . . . . . . . . . . . . . . . . . . . . . . . . . . . . . . . . . . . . . . 4-644.3.3.4 Conclusion . . . . . . . . . . . . . . . . . . . . . . . . . . . . . . . . . . . . . . . . 4-64
4.3.4 C o n t a i n m e n t . . . . . . . . . . . . . . . . . . . . . . . . . . . . . . . . . . . . . . . . . . . . . 4-654.3.4.1 Subaqueous Capping . . . . . . . . . . . . . . . . . . . . . . . . . . . . . . . . 4-644.3.4.2 Retaining Dikes and Berms . . . . . . . . . . . . . . . . . . . . . . . . . . . 4-66
4.3.5 Removal . . . . . . . . . . . . . . . . . . . . . . . . . . . . . . . . . . . . . . . . . . . . . . . . 4-684.3.5.1 Excavation . . . . . . . . . . . . . . . . . . . . . . . . . . . . . . . . . . . . . . . . 4-684.3.5.2 D r e d g i n g . . . . . . . . . . . . . . . . . . . . . . . . . . . . . . . . . . . . . . . . . . 4-69
4.3.6 Ex Situ T r e a t m e n t . . . . . . . . . . . . . . . . . . . . . . . . . . . . . . . . . . . . . . . . . 4-734.3.6.1 Sediment Washing . . . . . . . . . . . . . . . . . . . . . . . . . . . . . . . . . . 4-734.3.6.2 Solvent Extraction . . . . . . . . . . . . . . . . . . . . . . . . . . . . . . . . . . 4-75 <4.3.6.3 Chemical Dechlorination . . . . . . . . . . . . . . . . . . . . . . . . . . . . . 4-76 ;4.3.6.4 Thermal Desorption . . . . . . . . . . . . . . . . . . . . . . . . . . . . . . . . . 4-77 i4.3.6.5 Thermal Destruction . . . . . . . . . . . . . . . . . . . . . . . . . . . . . . . . 4-78 :4.3.6.6 Immobilization . . . . . . . . . . . . . . . . . . . . . . . . . . . . . . . . . . . . . 4-80
4.3.7 Beneficial Use . . . . . . . . . . . . . . . . . . . . . . . . . . . . . . . . . . . . . . . . . . . 4-814.3.7.1 Landfill Cover Material, Construction Fill, Mine Land i
Reclamation . . . . . . . . . . . . . . . . . . . . . . . . . . . . . . . . . . . . . . . 4-81 ;.4.3.7.2 Manufacture of Commercial Products . . . . . . . . . . . . . . . . . . . 4-83 =?
4.3.8 Disposal Technologies . . . . . . . . . . . . . . . . . . . . . . . . . . . . . . . . . . . . . 4-84 )4.3.9 Summary of Effectiveness, Implementability, and Cost Screening of !•
Technologies . . . . . . . . . . . . . . . . . . . . . . . . . . . . . . . . . . . . . . . . . . . . 4-85 \4.4 Selection of Representative Process Options . . . . . . . . . . . . . . . . . . . . . . . . . 4-86 i
5.0 DEVELOPMENT OF REMEDIAL ACTION ALTERNATIVES . . . . . . . . . . . . . . . . 5-1 i5.1 _ Remedial Alternative Development . . . . . . . . . . . . . . . . . . . . . . . . . . . . . . . . . 5-4
5.1.1 Alternative Development Criteria . . . . . . . . . . . . . . . . . . . . . . . . . . . . . 5-45.1.2 Combination of Potentially Applicable Remedial Technologies into ^
Remedial Alternatives . . . . . . . . . . . . . . . . . . . . . . . . . . . . . . . . . . . . . . 5-6 °5.2 Concepts for Application of Technologies in Remedial Alternatives . . . . . . . 5-11 to-'&•'-
5.2.1 No Action, Institutional Controls, Monitored Natural Ul
TAMS
HUDSON RIVER PCBs REASSESSMENT RI/FSPHASE 3 REPORT: FEASIBILITY STUDY
TABLE OF CONTENTS (CONTINUED)
Attenuation (MNA) . . . . . . . . . . . . . . . . . . . . . . . . . . . . . . . . . . . . . . . 5-125.2.2 Removal of Targeted Sediments by Mechanical Dredging Methods .5-13
5.2.2.1 Mechanical Dredging Technology . . . . . . . . . . . . . . . . . . . . . 5-14 f5.2.2.2 Mechanical Dredging Equipment Capacity . . . . . . . . . . . . . . 5-17 |5.2.2.3 Productivity Analysis (Mechanical Dredges) . . . . . . . . . . . . . 5-20 ;•5.2.2.4 Transfer Facilities (Mechanical Dredging) . . . . . . . . . . . . . . . 5-21 1$5.2.2.5 Management of Dredged Material (Mechanical Dredging) . .. 5-23
5.2.3 Removal of Targeted Sediment by Hydraulic Dredging Methods . . . . 5-235.2.3.1 Equipment and Conceptual Approach (Hydraulic Dredging) . 5-245.2.3.2 Productivity (Hydraulic Dredging) . . . . . . . . . . . . . . . . . . . . . 5-255.2.3.3 Transfer Facilities (Hydraulic Dredging) . . . . . . . . . . . . . . . . . 5-265.2.3.4 Slurry Processing (Hydraulic Dredging) . . . . . . . . . . . . . . . . . 5-27
5.2.4 Capping of Targeted Sediments . . . . . . . . . . . . . . . . . . . . . . . . . . . . . . 5-285.2.4.1 Typical Cap Cross-Section . . . . . . . . . . . . . . . . . . . . . . . . . . . . 5-285.2.4.2 Capping Material Manufacture and Transport for Placement . 5-295.2.4.3 Cap Placement . . . . . . . . . . . . . . . . . . . . . . . . . . . . . . . . . . . . . 5-305.2.4.4 Dredging Requirements Related to Capping . . . . . . . . . . . . . . 5-30
5.2.5 Management of Dredged Material . . . . . . . . . . . . . . . . . . . . . . . . . . . . 5-315.2.5.1 Chemical/Thermal Processing of Dredged Material for
Disposal . . . . . . . . . . . . . . . . . . . . . . . . . . . . . . . . . . . . . . . . . . 5-325.2.5.2 Off-site Landfill Disposal . . . . . . . . . . . . . . . . . . . . . . . . . . . . 5-325.2.5.3 Beneficial Use . . . . . . . . . . . . . . . . . . . . . . . . . . . . . . . . . . . . . 5-34
5.2.6 Backfilling and Site Reconstruction . . . . . . . . . . . . . . . . . . . . . . . . . . 5-365.2.6.1 Backfilling Approach and Methods . . . . . . . . . . . . . . . . . . . . . 5-375.2.6.2 Shoreline Stabilization . . . . . . . . . . . . . . . . . . . . . . . . . . . . . . . 5-385.2.6.3 Habitat Replacement . . . . . . . . . . . . . . . . . . . . . . . . . . . . . . . . 5-39
5.2.7 Monitoring . . . . . . . . . . . . . . . . . . . . . . . . . . . . . . . . . . . . . . . . . . . . . . 5-425.2.7.1 Monitored Natural Attenuation Monitoring Program . . . . . . . 5-445.2.7.2 Design Support Investigation
(Pre-Construction Monitoring) . . . . . . . . . . . . . . . . . . . . . . . . 5-465.2.7.3 Construction Monitoring Program . . . . . . . . . . . . . . . . . . . . . . 5-485.2.7.4 Post-Construction Monitoring Program . . . . . . . . . . . . . . . . . . 5-515.2.7.5 Monitoring Program Summary . . . . . . . . . . . . . . . . . . . . . . . . 5-52
5.3 . Potential Remedial Action Alternatives . . . . . . . . . . . . . . . . . . . . . . . . . . . . . . 5-535.3.1 Modeling Evaluation of Alternative Scenarios . . . . . . . . . . . . . . . . . . 5-53
5.3.1.1 No Action and Monitored Natural Attenuation Modeling . . . . 5-545.3.1.2 Preliminary Modeling . . . . . . . . . . . . . . . . . . . . . . . . . . . . . . . 5-555.3.1.3 Engineering Modeling . . . . . . . . . . . . . . . . . . . . . . . . . . . . . . . 5-555.3.1.4 Refined Engineering Modeling . . . . . . . . . . . . . . . . . . . . . . . . 5-575.3.1.5 Scenario Nomenclature System . . . . . . . . . . . . . . . . . . . . . . . . 5-57
vi TAMS400216
HUDSON RIVER PCBs REASSESSMENT RI/FSPHASE 3 REPORT: FEASIBILITY STUDY
TABLE OF CONTENTS (CONTINUED)
5.3.1.6 List of Alternative Scenarios for Evaluation . . . . . . . . . . . . . . 5-595.3.2 Factors and Metrics for Evaluation of Model Scenarios . . . . . . . . . . . 5-635.3.3 Listing of Potential Remedial Action Alternatives . . . . . . . . . . . . . . . 5-65 I
SCREENING OF REMEDIAL ACTION ALTERNATIVES . . . . . . . . . . . . . . . . . . . 6-1 j6.1. Evaluation Criteria and Approach . . . . . . . . . . . . . . . . . . . . . . . . . . . . . . . . . . . 6-1 I-
6.1.1 Effectiveness . . . . . . . . . . . . . . . . . . . . . . . . . . . . . . . . . . . . . . . . . . . . . 6-1 [|6.1.2 Implernentability . . . . . . . . . . . . . . . . . . . . . . . . . . . . . . . . . . . . . . . . . . 6-2 !*:6.1.3 Cost . . . . . . . . . . . . . . . . . . . . . . . . . . . . . . . . . . . . . . . . . . . . . . . . . . . . 6-3 I
6.2 Description and Screening of Remedial Alternative Categories . . . . . . . . . . . . 6-3 [6.2.1 No Action . . . . . . . . . . . . . . . . . . . . . . . . . . . . . . . . . . . . . . . . . . . . . . . . 6-4 I
6.2.1.1 General Description of No Action . . . . . . . . . . . . . . . . . . . . . . . 6-4 \6.2.1.2 General Evaluation of No Action . . . . . . . . . . . . . . . . . . . . . . . . 6-4 |6.2.1.3 Conclusion . . . . . . . . . . . . . . . . . . . . . . . . . . . . . . . . . . . . . . . . . 6-6
6.2.2 Monitored Natural Attenuation (MNA) . . . . . . . . . . . . . . . . . . . . . . . . . 6-6 \6.2.2. 1 General Description of Monitored Natural Attenuation . . . . . . 6-6 }6.2.2.2 General Evaluation of Monitored Natural Attenuation . . . . . . . 6-8 j6.2.2.3 Conclusion . . . . . . . . . . . . . . . . . . . . . . . . . . . . . . . . . . . . . . . . 6-1 1 |
6.2.3 Capping with Dredging of Sediments in Target Areas and Monitored |Natural Attenuation (CAP) Alternatives . . . . . . . . . . . . . . . . . . . . . . . 6-12 |6.2.3. 1 General Description of Capping with Dredging (CAP) I
Alternatives . . . . . . . . . . . . . . . . . . . . . . . . . . . . . . . . . . . . . . . 6-13 I6.2.3.2 General Evaluation of Capping with Dredging (CAP)
Alternatives . . . . . . . . . . . . . . . . . . . . . . . . . . . . . . . . . . . . . . . 6-16 :6.2.4 Removal of Sediments in Target Areas and Monitored Natural j
Attenuation Alternatives . . . . . . . . . . . . . . . . . . . . . . . . . . . . . . . . . . . 6-19 ;6.2.4.1 General Description of Removal (REM) Alternatives . . . . . . . 6-21 :•;6.2.4.2 General Evaluation of Removal (REM) Alternatives . . . . . . . 6-23 K
6.3 Description and Screening of the Active Remediation Alternatives I(CAP and REM) . . . . . . . . . . . . . . . . . . . . . . . . . . . . . . . . . . . . . . . . . . . . . . . . 6-25 [ ;j
6.3.1 Description of REM Alternatives . . . . . . . . . . . . . . . . . . . . . . . . . . . . 6-266.3.1.1 Alternative REM- 1 0/MNA/MNA - Hot Spot Removal in River
Section 1 and MNA in River Sections 2 and 3 . . . . . . . . . . . . 6-26 \6.3.1.2 Alternative REM-0/MNA/MNA - Full-Section Removal in River | •
Section 1 and MNA in- River Sections 2 and 3 . . . . . . . . . . . . 6-27 '{:
6.3.1.3 Alternative REM-3/10/10 - Expanded Hot Spot Removal in RiverSection 1 and Hot Spot Removal in River Sections 2 and 3 . . 6-27 ^
6.3. 1 .4 Alternative REM-0/1 0/MNA - Full Section Removal in River oSection 1, Hot Spot Removal in River Section 2 and MNA 10in River Section 3 . . . . . . . . . . . . . . . . . . . . . . . . . . . . . . . . . . . 6-28 1
vii TAMS
HUDSON RIVER PCBs REASSESSMENT RI/FSPHASE 3 REPORT: FEASIBILITY STUDY
TABLE OF CONTENTS (CONTINUED)
6.3.1.5 Alternative REM-0/10/10 - Full-Section Removal in RiverSection 1, and Hot Spot Removal in River Sections 2 and 3 .. 6-29
6.3.1.6 Alternative REM-0/0/3 - Full-Section Removal in RiverSections 1 and 2, and Expanded Hot Spot Removal inRiver Section 3 . . . . . . . . . . . . . . . . . . . . . . . . . . . . . . . . . . . . . 6-30
6.3.2 Evaluation of REM Alternatives . . . . . . . . . . . . . . . . . . . . . . . . . . . . . 6-306.3.3 Conclusion for REM Alternatives . . . . . . . . . . . . . . . . . . . . . . . . . . . . 6-346.3.4 Conclusion for CAP Alternatives . . . . . . . . . . . . . . . . . . . . . . . . . . . . 6-35
6.4 Refinement of Active Remediation Alternatives Retained for DetailedAnalysis . . . . . . . . . . . . . . . . . . . . . . . . . . . . . . . . . . . . . . . . . . . . . . . . . . . . . . 6-366.4.1 Basis for Remedial Alternatives R e f i n e m e n t . . . . . . . . . . . . . . . . . . . . 6-36
6.4.1.1 Select Areas . . . . . . . . . . . . . . . . . . . . . . . . . . . . . . . . . . . . . . . 6-366.4.1.2 Dredging to Implement Remedial Alternatives . . . . . . . . . . . 6-37
6.4.2 Description of Refined Remedial Alternatives . . . . . . . . . . . . . . . . . . 6-386.4.2.1 Alternative CAP-3/10/Select . . . . . . . . . . . . . . . . . . . . . . . . . . 6-386.4.2.2 Alternative REM-3/10 /Se lec t . . . . . . . . . . . . . . . . . . . . . . . . . . 6-396.4.2.3 Alternative REM-0/0/3 . . . . . . . . . . . . . . . . . . . . . . . . . . . . . . 6-40
7. ALTERNATIVE-SPECIFIC RISK ASSESSMENTS . . . . . . . . . . . . . . . . . . . . . . . . . . 7-17.1 Use of Risk Assessments in Criteria Evaluation . . . . . . . . . . . . . . . . . . . . . . . . 7-2
7.1.1 Overall Protection of Human Health and the Environment . . . . . . . . . . 7-37.1.2 Long-Term Effectiveness . . . . . . . . . . . . . . . . . . . . . . . . . . . . . . . . . . . . 7-3
7.1.2.1 Long-Term Effectiveness: Protection of Human Health . . . . . . 7-47.1.2.2 Long-Term Effectiveness - Ecological Assessment . . . . . . . . . . 7-5
7.1.3 Short-Term Effectiveness . . . . . . . . . . . . . . . . . . . . . . . . . . . . . . . . . . . 7-57.1.3.1 Protection of the Community During Remedial Actions . . . . . 7-67.1.3.2 Protection of Workers During Remedial Actions . . . . . . . . . . 7-67.1.3.3 Potential Adverse Environmental Impacts Resulting from
Construction and Implementation . . . . . . . . . . . . . . . . . . . . . . . 7-77.1.3.4 Time until Remedial Response Objectives Are Achieved...... 7-7
7.2 Alternative-Specific Risk Assessment Methodology . . . . . . . . . . . . . . . . . . . . . . 7-77.2.1 Protection of Human Health . . . . . . . . . . . . . . . . . . . . . . . . . . . . . . . . . 7-7
7.2.1.1 Carcinogenic Risks - Quantitative IncrementalRisk . . . . . . . . . . . . . . . . . . . . . . . . . . . . . . . . . . . . . - / . . . . . . . . 7-9
7.2.1.2 Non-Cancer Health Effects - Hazard Indices (His) ....:..... 7-107.2.1.3 Relative Reductions in Cancer Risks and • . ' '.
Non-Cancer Health Hazards . . . . . . . . . . . . . . . . . . . . . . . . . . 7-117.2.1.4 Time to Achieve Human Health-Based PRGs . . . . . . . . . . . . . 7-13
7.2.2 Protection of the Environment: Ecological Risks-NOAEL/LOAEL-Based Toxicity Quotients . . . . . . . . . . . . . . . . . . . . 7-13
••- viii TAMS400218

HUDSON RIVER PCBs REASSESSMENT RI/FSPHASE 3 REPORT: FEASIBILITY STUDY
TABLE OF CONTENTS (CONTINUED)
7.2.2.1 River Otter . . . . . . . . . . . . . . . . . . . . . . . . . . . . . . . . . . . . . . . . 7-157.2.2.2 Mink . . . . . . . . . . . . . . . . . . . . . . . . . . . . . . . . . . . . . . . . . . . . . 7-157.2.2.3 Relative Reductions in Ecological Toxicity Quotients . . . . . . 7-157.2.2.4 Time to Achieve Ecological-Based PRGs . . . . . . . . . . . . . . . . 7-167.2.2.5 Ecological Probabilistic Dose-Response Analysis . . . . . . . . . . 7-16
7.3 Alternative-Specific Human Health Cancer Risks and Non-Cancer HealthHazards and Ecological Risks . . . . . . . . . . . . . . . . . . . . . . . . . . . . . . . . . . . . . 7-177.3.1 No Action Alternative . . . . . . . . . . . . . . . . . . . . . . . . . . . . . . . . . . . . . 7-18
7.3.1.1 Time to Reach Human Health-Based Fish Target Levels . . . . 7-187.3.1.2 Cancer Risks and Non-Cancer Health Hazards . . . . . . . . . . . . 7-187.3.1.3 Short-Term Human Health Cancer Risks and Non-Cancer
Health Hazards . . . . . . . . . . . . . . . . . . . . . . . . . . . . . . . . . . . . . 7-197.3.1.4 Time to Reach Ecological Fish Target Levels . . . . . . . . . . . . . 7-207.3.1.5 Ecological Toxicity Quotients . . . . . . . . . . . . . . . . . . . . . . . . . 7-207.3.1.6 Probabilistic Dose-Response Analysis . . . . . . . . . . . . . . . . . . . 7-20
7.3.2 Monitored Natural Attenuation . . . . . . . . . . . . . . . . . . . . . . . . . . . . . 7-217.3.2.1 Time to Reach Human Health-Based Fish Target Levels . . . . 7-217.3.2.2 Cancer Risks and Non-Cancer Hazards and Relative
Reductions ........................................ 7-227.3.2.3 Short-Term Human Health Cancer Risks and Non-Cancer
Health Hazards . . . . . . . . . . . . . . . . . . . . . . . . . . . . . . . . . . . . . 7-237.3.2.4 Time to Reach Ecological Fish Target Levels . . . . . . . . . . . . . 7-237.3.2.5 Ecological Toxicity Quotients and Relative Reductions . . . . . 7-247.3.2.6 Probabilistic Dose-Response Analysis . . . . . . . . . . . . . . . . . . . 7-24
7.3.3 CAP-3/10/Select . . . . . . . . . . . . . . . . . . . . . . . . . . . . . . . . . . . . . . . . . 7-257.3.3.1 Time to Reach Human Health-Based Fish Target Levels . . . . 7-267.3.3.2 Cancer Risks and Non-Cancer Health Hazards and j
Relative Reductions . . . . . . . . . . . . . . . . . . . . . . . . . . . . . . . . 7-26 i7.3.3.3 Short-Term Human Health Cancer Risks and Non-Cancer t
Health Hazards . . . . . . . . . . . . . . . . . . . . . . . . . . . . . . . . . . . . . 7-27 '7.3.3.4 Time to Reach Ecological Fish Target Levels . . . . . . . . . . . . . 7-28 •7.3.3.5 Ecological Toxicity Quotients and Relative Reductions . . . . . 7-287.3.3.6 Probabilistic Dose-Response Analysis . . . . . . . . . . . . . . . . . . . 7-29
7.3.4 REM-3/10/Select . . . . . . . . . . . . . . . . . . ' . . . . . . . . . . . . . . . . . . . . . . . 7-297.3.4.1 Time to Reach Human Health Fish Target Levels . . . . . . . . . . 7-307.3.4.2 Cancer Risks and Non-Cancer Health Hazards and Relative
Reductions . . . . . . . . . . . . . . . . . . . . . . . . . . . . . . . . . . . . . . . . 7-31 ^7.3.4.3 Short-Term Human Health Cancer Risks and Non-Cancer °
Health Hazards . . . . . . . . . . . . . . . . . . . . . . . . . . . . . . . . . . . . . 7-32 to7.3.4.4 Time to Reach Ecological Fish Target Levels . . . . . . . . . . . . 7- 32 £
ix : TAMS
\
I
HUDSON RIVER PCBs REASSESSMENT RI/FSPHASE 3 REPORT: FEASIBILITY STUDY
(TABLE OF CONTENTS (CONTINUED) j
7.3.4.5 Ecological Toxicity Quotients and Relative Reductions . . . . 7-337.3.4.6 Probabilistic Dose-Response Analysis . . . . . . . . . . . . . . . . . . . 7-34
7.3.5 REM-0/0/3 . . . . . . . . . . . . . . . . . . . . . . . . . . . . . . . . . . . . . . . . . . . . . 7-347.3.5.1 Time to Reach Human Health Fish Target Levels . . . . . . . . . . 7-357.3.5.2 Cancer Risks and Non-Cancer Health Hazards and
Relative Reductions . . . . . . . . . . . . . . . . . . . . . . . . . . . . . . . . 7-357.3.5.3 Short-Term Human Health Cancer Risks and Non-Cancer
Health Hazards . . . . . . . . . . . . . . . . . . . . . . . . . . . . . . . . . . . . . 7-367.3.5.4 Time to Reach Ecological Fish Target Levels . . . . . . . . . . . . . 7-367.3.5.5 Ecological Toxicity Quotients and Relative Reductions . . . . . 7-377.3.5.6 Probabilistic Dose-Response A n a l y s i s . . . . . . . . . . . . . . . . . . . 7-37
7.4 Uncertainties in Human Health and Ecological Risk Characterization . . . . . 7-387.4.1 Uncertainties in Exposure Pathway Assumptions . . . . . . . . . . . . . . . . 7-387.4.2 Uncertainties in Toxicological Data . . . . . . . . . . . . . . . . . . . . . . . . . . 7-397.4.3 Uncertainties in Exposure and Bioaccumulation Modeling . . . . . . . . 7-39
7.4.3.1 Uncertainties in the HUDTOX Fate and Transport Modeling . 7-397.4.3.2 Uncertainties in FISHRAND Bioaccumulation Modeling . . 7-40
7.4.4 Impacts of Uncertainty . . . . . . . . . . . . . . . . . . . . . . . . . . . . . . . . . . . . . 7-41
8 DETAILED ANALYSES OF REMEDIAL ALTERNATIVES8.1 Evaluation Process and Evaluation Criteria . . . . . . . . . . . . . . . . . . . . . . . . . . . . 8-1
8.1.1 Threshold Criterion 1: Overall Protection of Human Healthand the Environment . . . . . . . . . . . . . . . . . . . . . . . . . . . . . . . . . . . . . . . 8-38.1.1.1 Protection of Human Health . . . . . . . . . . . . . . . . . . . . . . . . . . . 8-48.1.1.2 Protection of the Environment: Ecological Risks . . . . . . . . . . . 8-4
8.1.2 Threshold Criterion 2: Compliance with ARARs . . . . . . . . . . . . . . . . . 8-48.1.3 Primary Balancing Criterion 1: Long-term Effectiveness and
Permanence . . . . . . . . . . . . . . . . . . . . . . . . . . . . . . . . . . . . . . . . . . . . . . 8-58.1.3.1 Magnitude of Residual Risks . . . . . . . . . . . . . . . . . . . . . . . . . . . 8-5 |||8.1.3.2 Adequacy and Reliability of Controls, if Any, Used to j
Manage Untreated Wastes or Treatment Residuals . . . . . . . . . . 8-7 >' 8.1.3.3 Adequacy Replacement and the Continuing Need for
Repairs/Maintenance . . . . . . . . . . . . . . . . . . . . . . . . . . . . . . . . . 8-88.1.4 Primary Balancing Criterion 2: Reduction of Toxicity, Mobility, or
Volume Through T r e a t m e n t . . . . . . . . . . . . . . . . . . . . . . . . . . . . . . . . . . 8-88.1.5 Primary Balancing Criterion 3: Short-term Effectiveness . . . . . . . . . . . 8-9
8.1.5.1 Protection of the Community During Remedial Actions . . . . . 8-108.1.5.2 Protection of Workers During Remedial Actions . . . . . . . . . . 8-108.1.5.3 Potential Adverse Environmental Impacts Resulting from
Construction and Implementation . . . . . . . . . . . . . . . . . . . . . . 8-10
x TAMS
400220

HUDSON RIVER PCBs REASSESSMENT RI/FSPHASE 3 REPORT: FEASIBILITY STUDY
TABLE OF CONTENTS (CONTINUED)Page
8.1.5.4 Time until Remedial Response Objectives are Achieved . . . . 8-118.1.6 Primary Balancing Criterion 4: Implementability . . . . . . . . . . . . . . . . 8-128.1.7 Primary Balancing Criterion 5: Cost . . . . . . . . . . . . . . . . . . . . . . . . . . 8-13
8.1.7.1 Present Worth Analysis . . . . . . . . . . . . . . . . . . . . . . . . . . . . . . 8-158.1.8 Modifying Criterion 1: State Acceptance . . . . . . . . . . . . . . . . . . . . . . 8-168.1.9 Modifying Criterion 2: Community Acceptance . . . . . . . . . . . . . . . . . 8-16
8.2 Alternative: No Action . . . . . . . . . . . . . . . . . . . . . . . . . . . . . . . . . . . . . . . . . . . 8-168.2.1 Description . . . . . . . . . . . . . . . . . . . . . . . . . . . . . . . . . . . . . . . . . . . . . . 8-168.2.2 Analysis . . . . . . . . . . . . . . . . . . . . . . . . . . . . . . . . . . . . . . . . . . . . . . . . 8-17
8.2.2.1 Overall Protection of Human Health and the Environment ... 8-178.2.2.2 Compliance with ARARs . . . . . . . . . . . . . . . . . . . . . . . . . . . . 8-19
8.3 Alternative: Monitored Natural Attenuation (MNA) . . . . . . . . . . . . . . . . . . . . 8-208.3.1 Description . . . . . . . . . . . . . . . . . . . . . . . . . . . . . . . . . . . . . . . . . . . . . . 8-208.3.2 Analysis . . . . . . . . . . . . . . . . . . . . . . . . . . . . . . . . . . . . . . . . . . . . . . . . 8-22
8.3.2.1 Overall Protection of Human Health and the Environment ... 8-228.3.2.2 Compliance with ARARs . . . . . . . . . . . . . . . . . . . . . . . . . . . . 8-268.3.2.3 Long-term Effectiveness and Permanence . . . . . . . . . . . . . . . . 8-278.3.2.4 Reduction of Toxicity, Mobility, or Volume through
Treatment . . . . . . . . . . . . . . . . . . . . . . . . . . . . . . . . . . . . . . . . . 8-288.3.2.5 Short-term Effectiveness . . . . . . . . . . . . . . . . . . . . . . . . . . . . . 8-298.3.2.6 Implementability . . . . . . . . . . . . . . . . . . . . . . . . . . . . . . . . . . . 8-318.3.2.7 Cost . . . . . . . . . . . . . . . . . . . . . . . . . . . . . . . . . . . . . . . . . . . . . 8-31
8.4 Alternative CAP-3/10/Select: Capping with Dredging of Expanded Hot Spotsin River Section 1; Capping with Dredging of Hot Spots in River Section 2;and Dredging of Select Areas in River Section 3 . . . . . . . . . . . . . . . . . . . . . . . 8-328.4.1 Description . . . . . . . . . . . . . . . . . . . . . . . . . . . . . . . . . . . . . . . . . . . . . . 8-32
8.4.1.1 Source Control in the Vicinity of the GE Hudson Falls Plant . 8-338.4.1.2 Implementation Schedule and Sequence of Operations . . . . . . 8-348.4.1.3 Engineered Capping, Select Removal, and In-river Transport
Operations . . . . . . . . . . . . . . . . . . . . . . . . . . . . . . . . . . . . . . . . 8-348.4.1.4 On-Site Material Management and Transfer Facilities . . . . . . 8-358.4.1.5 Water Treatment Subsequent to Removal . . . . . . . . . . . . . . . . 8-358.4.1.6 Backfilling and Site Reconstruction . . . . . . . . . . . . . . . . . . . . 8-368.4.1.7 OffrSite Transport and Dredged Material Management ..... 8-378.4.1.8 Performance Monitoring Program . . . . . . . . . . . . . . . . . . . . . . . 8-37
8.4.2 Analysis . . . . . . . . . . . . . . . . . . . . . . . . . . . . . . . . . . . . . . . . . . . . . . . . 8-388.4.2.1 Overall Protection of Human Health and the Environment ... 8-388.4.2.2 Compliance with ARARs . . . . . . . . . . . . . . . . . . . . . . . . . . . . 8-42 £8.4.2.3 Long-Term Effectiveness and Permanence . . . . . . . . . . . . . . . 8-43 o
|L K
8.4.2.4 Reduction of Toxicity, Mobility, or Volume through 10M
xi TAMS
HUDSON RIVER PCBs REASSESSMENT RI/FSPHASE 3 REPORT: FEASIBILITY STUDY
TABLE OF CONTENTS (CONTINUED)
Treatment . . . . . . . . . . . . . . . . . . . . . . . . . . . . . . . . . . . . . . . . . 8-46-8.4.2.5 Short-TermEffectiveness . . . . . . . . . . . . . . . . . . . . . . . . . . . . 8-478.4.2.6 Implementability . . . . . . . . . . . . . . . . . . . . . . . . . . . . . . . . . . . 8-538.4.2.7 Cost . . . . . . . . . . . . . . . . . . . . . . . . . . . . . . . . . . . . . . . . . . . . . 8-58
8.5 Alternative REM-3/10/Select: Expanded Hot Spot Removal in RiverSection 1; Hot Spot Removal in River Section 2; and Removal of SelectAreas in River Section 3 . . . . . . . . . . . . . . . . . . . . . . . . . . . . . . . . . . . . . . . . . 8-598.5.1 Description . . . . . . . . . . . . . . . . . . . . . . . . . . . . . . . . . . . . . . . . . . . . . . 8-59
8.5.1.1 Source Control in the Vicinity of the GE Hudson FallsFacility . . . . . . . . . . . . . . . . . . . . . . . . . . . . . . . . . . . . . . . . . . . 8-61
8.5.1.2 Implementation Schedule and Sequence of Operations . . . . . . 8-618.5.1.3 Removal and In-River Transport Operations . . . . . . . . . . . . . . 8-618.5.1.4 On-Site Material Management and Transfer Facilities . . . . . . 8-628.5.1.5 Water Treatment Subsequent to Removal . . . . . . . . . . . . . . . . 8-638.5.1.6 Backfilling and Site Reconstruction . . . . . . . . . . . . . . . . . . . . 8-638.5.1.7 Off-site Transport and Dredged Material Management.. . . . . 8-648.5.1.8 Performance Monitoring Program . . . . . . . . . . . . . . . . . . . . . . 8-64
8.5.2 Analysis . . . . . . . . . . . . . . . . . . . . . . . . . . . . . . . . . . . . . . . . . . . . . . . . 8-658.5.2.1 Overall Protection of Human Health and the Environment . .. 8-658.5.2.2 Compliance with ARARs . . . . . . . . . . . . . . . . . . . . . . . . . . . . 8-698.5.2.3 Long-Term Effectiveness and Permanence . . . . . . . . . . . . . . . 8-698.5.2.4 Reduction of Toxicity, Mobility, or Volume through
Treatment . . . . . . . . . . . . . . . . . . . . . . . . . . . . . . . . . . . . . . . . . . 8-718.5.2.5 Short-Term Effectiveness . . . . . . . . . . . . . . . . . . . . . . . . . . . . 8-728.5.2.6 Implementability . . . . . . . . . . . . . . . . . . . . . . . . . . . . . . . . . . . 8-798.5.2.7 Cost . . . . . . . . . . . . . . . . . . . . . . . . . . . . . . . . . . . . . . . . . . . . . 8-88
8.6 Alternative REM-0/0/3: Full-Section Removal in River Sections 1 and 2 andExpanded Hot Spot Removal in River Section 3 . . . . . . . . . . . . . . . . . . . . . . . 8-898.6.1 Description . . . . . . . . . . . . . . . . . . . . . . . . . . . . . . . . . . . . . . . . . . . . . . 8-89
8.6.1.1 Source Control at the GE Hudson Falls Plant . . . . . . . . . . . . . 8-908.6.1.2 Implementation Schedule and Sequence of Operations . . . . . . 8-918.6.1.3 Removal and In-River Transport Operations . . . . . . . . . . . . . . 8-918.6.1.4 On-Site Material Management and Transfer Facilities . . . . . . 8-928.6.1.5 Water Treatment Subsequent to Removal . . . . . . . . . . . . . . . . 8-938.6.1.6 Backfilling and Site Reconstruction . . . . . : . . . . . . . . . . . . . . 8-938.6.1.7 Off-Site Transport and Dredged Material Management . . . . . 8-948.6.1.8 Performance Monitoring Program . . . . . . . . . . . . . . . . . . . . . . 8-94
8.6.2 Analysis . . . . . . . . . . . . . . . . . . . . . . . . . . . . . . . . . . . . . . . . . . . . . . . . 8-958.6.2.1 Overall Protection of Human Health and the Environment ... 8-958.6.2.2 Compliance with ARARs . . . . . . . . . . . . . . . . . . . . . . . . . . . . 8-99
Xli TAMS [400222 Iv

HUDSON RIVER PCBs REASSESSMENT RI/FSPHASE 3 REPORT: FEASIBILITY STUDY
TABLE OF CONTENTS (CONTINUED)
8.6.2.3 Long-Term Effectiveness and Permanence . . . . . . . . . . . . . . 8-1008.6.2.4 Reduction of Toxicity, Mobility, or Volume through
Treatment . . . . . . . . . . . . . . . . . . . . . . . . . . . . . . . . . . . . . . . . 8-1018.6.2.5 Short-Term Effectiveness . . . . . . . . . . . . . . . . . . . . . . . . . . . 8-1028.6.2.6 Implementability . . . . . . . . . . . . . . . . . . . . . . . . . . . . . . . . . . 8-1088.6.2.7 Cost . . . . . . . . . . . . . . . . . . . . . . . . . . . . . . . . . . . . . . . . . . . . 8-118
9. COMPARATIVE ANALYSIS AND COST SENSITIVITY ANALYSES . . . . . . . . . 9-19.1 Overall Protection of Human Health and the Environment . . . . . . . . . . . . . . . . 9-1
9.1.1 Overall Protection of Human Health . . . . . . . . . . . . . . . . . . . . . . . . . . . 9-19.1.1.1 Time to Reach Fish Target Levels . . . . . . . . . . . . . . . . . . . . . . . 9-29.1.1.2 Relative Reductions in Cancer Risks and Non-Cancer Health
Hazards . . . . . . . . . . . . . . . . . . . . . . . . . . . . . . . . . . . . . . . . . . . 9-49.1.2 Overall Protection of the Environment . . . . . . . . . . . . . . . . . . . . . . . . . . . 9-7
9.1.2.1 River Otter . . . . . . . . . . . . . . . . . . . . . . . . . . . . . . . . . . . . . . . . . 9-79.1.2.2 Mink . . . . . . . . . . . . . . . . . . . . . . . . . . . . . . . . . . . . . . . . . . . . . 9-10
9.1.3 Downstream Transport of PCBs . . . . . . . . . . . . . . . . . . . . . . ; . . . . . .9-129.2 Compliance with ARARs . . . . . . . . . . . . . . . . . . . . . . . . . . . . . . . . . . . . . . . . 9-139.3 Long-Term Effectiveness and Permanence . . . . . . . . . . . . . . . . . . . . . . . . . . . 9-14
9.3.1 Reduction of Residual Risk . . . . . . . . . . . . . . . . . . . . . . . . . . . . . . . . . . 9-149.3.2 Adequacy of Controls . . . . . . . . . . . . . . . . . . . . . . . . . . . . . . . . . . . . . . . 9-179.3.3 Reliability of Controls . . . . . . . . . . . . . . . . . . . . . . . . . . . . . . . . . . . . . . . 9-18
9.4 Reduction of Toxicity, Mobility, or Volume through Treatment . . . . . . . . . . 9-199.5 Short-Term Effectiveness . . . . . . . . . . . . . . . . . . . . . . . . . . . . . . . . . . . . . . . . 9-20
9.5.1 Protection of the Community During Remedial Actions . . . . . . . . . . . . 9-219.5.2 Protection of Workers During Remedial Actions . . . . . . . . . . . . . . . . . . 9-229.5.3 Potential Adverse Environmental Impacts during Construction . . . . . . . 9-229.5.4 Time until Remedial Response Objectives Are Achieved . . . . . . . . . . . 9-26
9.6 Implementability . . . . . . . . . . . . . . . . . . . . . . . . . . . . . . . . . . . . . . . . . . . . . . . 9-279.6.1 Technical Feasibility . . . . . . . . . . . . . . . . . . . . . . . . . . . . . . . . . . . . . . . . 9-27
9.6.1.1 Dredging Feasibility . . . . . . . . . . . . . . . . . . . . . . . . . . . . . . . . . 9-279.6.1.2 Capping Feasibility . . . . . . . . . . . . . . . . . . . . . . . . . . . . . . . . . 9-299.6.1.3 Transfer Facilities Feasibility . . . . . . . . . . . . . . . . . . . . . . . . . . 9-309.6.1.4 Rail Transport and Disposal Feasibility . . . . . . . . . . . . . . . . . . 9-30
9.6.2 Administrative Feasibility . . . . . . . . . . . . . . . . . . . . . . . . . . . . . . . . . . . . 9-3 19.6.3 Availability of Services . . . . . . . . . . . . . . . . . . . . . . . . . . . . . . . . . . . . . . 9-32
9.7 Cost . . . . . . . . . . . . . . . . . . . . . . . . . . . . . . . . . . . . . . . . . . . . . . . . . . . . . . . . . 9-349.7.1 Net Present Worth. . . . . . . . . . . . . . . . . . . . . . . . . . . . . . . . . . . . . . . . . . 9-349.7.2 Capital Cost . . . . . . . . . . . . . . . . . . . . . . . . . . . . . . . . . . . . . . . . . . . . . . . 9-359.7.3 O & M Cost . . . . . . . . . . . . . . . . . . . . . . . .;.. . . . . . . . . . . . . . . . . . . . . . . 9-35
xiii . -'" TAMS

HUDSON RIVER PCBs REASSESSMENT RI/FSPHASE 3 REPORT: FEASIBILITY STUDY
TABLE OF CONTENTS (CONTINUED)
9.8 Cost Sensitivity A n a l y s e s . . . . . . . . . . . . . . . . . . . . . . . . . . . . . . . . . . . . . . . . . 9-369.8.1 Cost Sensitivity to an Increase in the Assumed Non-TSCA PCB "
Threshold Concentration . . . . . . . . . . . . . . . . . . . . . . . . . . . . . . . . . . . 9-379.8.2 Cost Sensitivity to Remediation Target Area Boundary Adjustment- 9-389.8.3 Cost Sensitivity to Reduction in Cap Thickness for Capping with Select
Removal Alternative . . . . . . . . . . . . . . . . . . . . . . . . . . . . . . . . . . . . . . 9-399.8.4 Cost Sensitivity to Depth of Removal Adjustment for the RemovalAlternatives . . . . . . . . . . . . . . . . . . . . . . . . . . . . . . . . . . . . . . . . . . . . . . . . . . . 9-409.8.5 Cost Sensitivity to Disposal Site Location . . . . . . . . . . . . . . . . . . . . . . 9-429.8.6 Summary of Cost Sensitivity Analyses . . . . . . . . . . . . . . . . . . . . . . . . 9-43
REFERENCES
xiv TAMS"
400224
HUDSON RIVER PCBs REASSESSMENT RI/FSPHASE 3 REPORT: FEASIBILITY STUDY
TABLE OF CONTENTS (CONTINUED)
BOOK 2 - TABLES AND FIGURESLIST OF TABLES
1-1 Phase 1 and Phase 2 Reassessment RI/FS Reports1 -2 N YSDEC Hot Spot Summary1-3 Aroclor Composition and Properties1-4 Properties of PCB Homologue Groups1-5 Congener Specific Aroclor Composition1-6 Hudson River Sampling Investigations Summary1-7 Average Total PCB Concentrations in Water from GE Monitoring, January 1999 - March
2000l-8a Average Fish Tissue Concentrations from 1998 N YSDEC Sampling in the Upper Hudson
River, Reported as mg/kg Wet Weight and Converted to a Consistent Estimator of Tri+PCBs
l-8b Average Fish Tissue Concentrations from 1998 NYSDEC Sampling in the Upper HudsonRiver, Reported as mg/kg-Lipid and Converted to a Consistent Estimator of Tri+ PCBs
1-9 Human Health Risk Assessment Summary - Upper Hudson River1-10 Human Health Risk Assessment Summary - Mid-Hudson River
2-1 a Chemical-Specific Potential Applicable or Relevant and Appropriate Requirements(ARARs)
2-lb Chemical-Specific Criteria, Advisories, and Guidance to be Considered (TBCs)2-2a Location-Specific Potential Applicable or Relevant and Appropriate Requirements
(ARARs)2-2b Location-Specific Criteria, Advisories, and Guidance to be Considered (TBCs)2-3a Action-Specific Potential Applicable or Relevant and Appropriate Requirements
(ARARs)2-3b Action-Specific Criteria, Advisories, and Guidance to be Considered (TBCs)
3-1 Data Source Used in the Selection of Areas for Remediation3-2 Upper Hudson Data Sets and Their Application3-3 Theoretical Limits of Impact of Various Remediation Criteria on PCB Mass and
Sediment Area in TI Pool3-4 Summary of Targeted Contamination
4-1 Initial Technology Evaluation and Screening4-2 List of Process Options for Capping4-3 List of Process Options for Bioremediation o4-4 List of Process Options for Solvent Extraction Technologies °4-5 List of Process Options for Chemical Dechlorination to4-6 List of Process Options for Solidification/Stabilization ^
XV TAMS
HUDSON RIVER PCBs REASSESSMENT RI/FSPHASE 3 REPORT: FEASIBILITY STUDY
TABLE OF CONTENTS (CONTINUED)
4-7 List of Dredging Technology Options 14-8 List of Suspended Sediment Containment Technology Options During Sediment f
Removal |4-9 List of Process Options for Sediment Washing |4-10 List of Process Options for Thermal Desorption j4-11 List of Process Options for Thermal Destruction i4-12 List of Process Options for Beneficial Use {,;4-13 List of Process Options for Thermal Destruction/Beneficial Use |4-14 List of Disposal Facilities, Non-TSCA-Permitted Landfills4-15 List of Disposal (Off-site) Facilities, TSCA-Permitted Landfills4-16 Effectiveness, Implementability, and Cost Evaluation - Screening of Technologies
6-1 Summary of Alternatives Screening Results6-2 Comparison of Remedial Alternatives by River Section6-3 Areas of Sediments, Volumes of Sediments, and Mass of PCBs Remediated by
Alternative
7-1 Time Frame Used to Calculate Risks and Hazards7-2 Values Used for Daily Intake Calculations - Upper Hudson River Fish - Adult Angler7-3 Modeled Post-Remediation PCB Concentrations in Fish - Upper Hudson River7-4 Species-Weighted Fish Fillet Average PCB Concentration7-5 Years to Achieve Human Health Based Target Levels - Comparison of Alternatives -
Upper Hudson River7-6a Long-Term Fish Ingestion Non-Cancer Health Hazards - Reasonable Maximum Exposure
and Central Tendency - Upper Hudson River Fish - Adult Angler7-6b Long-Term Fish Ingestion Non-Cancer Health Hazards - Reasonable Maximum Exposure
and Central Tendency - River Section 1 - Thompson Island Pool - Adult Angler7-6c Long-Term Fish Ingestion Non-Cancer Health Hazards - Reasonable Maximum Exposure
and Central Tendency - River Section 2 - Adult Angler7-6d Long-Term Fish Ingestion Non-Cancer Health Hazards - Reasonable Maximum Exposure
and Central Tendency - River Section 3 - Lock 5 to Troy Dam - Adult Angler7-7a Long-Term Fish Ingestion Cancer Risks - Reasonable Maximum Exposure and Central
Tendency - Upper Hudson River Fish - Adult Angler7-7b Long-Term Fish Ingestion Cancer Risks - Reasonable Maximum Exposure and Central
Tendency - River Section 1 - Thompson Island Pool - Adult Angler7-7c Long-Term Fish Ingestion Cancer Risks - Reasonable Maximum Exposure and Central •
Tendency - River Section 2 - Adult Angler7-7d Long-Term Fish Ingestion Non-Cancer Risks - Reasonable Maximum Exposure and
Central Tendency - River Section 3 - Lock 5 to Troy Dam - Adult Angler7-8 Time to Reach Ecological Target Concentrations7-9 Average of PCB Toxicity Quotients - Ecological Receptors (25-Year Time Frame)
XVi . TAMS400226
HUDSON RIVER PCBs REASSESSMENT RI/FSPHASE 3 REPORT: FEASIBILITY STUDY
TABLE OF CONTENTS (CONTINUED)
7-10 Probabilistic Dose-Response Analysis - Selected Output for Probability of Reduction ofFecundity of the Female River Otter - River Section 1
7-11 Probabilistic Dose-Response Analysis - Selected Output for Probability of Reduction ofFecundity of the Female River Otter - River Section 2
7-12 Reduction in Ecological Toxicity Quotients as Compared to the No Action and MNAAlternatives
8-1 Tri+ PCB Load Over Thompson Island Dam8-2 Tri+ PCB Load Over Northumberland Dam8-3 Tri+PCB Load Over Federal Dam8-4 Cost Analysis - No Action8-5 Cost Analysis - Monitored Natural Attenuation8-6 Areas of Sediments, Volumes of Sediments, and Mass of PCBs Remediated: CAP-
3/10/Select8-7 Engineering Parameters: CAP-3/10/Select8-8a Cost Analysis - Alternative CAP-3/ 10/Select8-8b Cost Analysis - Beneficial Use of Non-TSCA Material - Alternative CAP-3/10/Select8-9 Areas of Sediments, Volumes of Sediments, and Mass of PCBs Remediated: REM-
3/10/Select8-10a Engineering Parameters: REM-3/10/Select - Mechanical Removal8-10b Engineering Parameters: REM-3/10/Select - Hydraulic Removal8-11 a Cost Analysis - Alternative REM-3/10/Select8-1 Ib Cost Analysis - Beneficial Use of Non-TSCA Material - Alternative REM-3/10/Select8-1 Ic Cost Analysis - Hydraulic Dredging - Alternative REM-3/10/Select8-12 Areas of Sediments, Volumes of Sediments, and Mass of PCBs Remediated: REM-0/0/38-13a Engineering Parameters: REM-0/0/3 - Mechanical Removal8-13b Engineering Parameters: REM-0/0/3 - Hydraulic Removal8-14a Cost Analysis - Alternative REM-0/0/38-14b Cost Analysis - Beneficial Use of Non-TSCA Material - Alternative REM-0/0/38-14c Cost Analysis - Hydraulic Dredging - Alternative REM-0/0/3
9-1 Comparison of Costs9-2 Non-TSCA Safety Margin Sensitivity Analysis: Disposal Quantities9-3a Non-TSCA Safety Margin Sensitivity Analysis: Cost Analysis - Alternative CAP-
3/10/Select [
9-3b Non-TSCA Safety Margin Sensitivity Analysis: Cost Analysis - Alternative REM-3/10/Select
9-3c Non-TSCA Safety Margin Sensitivity Analysis: Cost Analysis - Alternative REM-0/0/3 o9-4 Remediation Boundary Adjustment Sensitivity Analysis: Quantities °9-5a Remediation Boundary Adjustment Sensitivity Analysis (MPA Target Area Plus 50 Feet): to
Cost Analysis - Alternative CAP-3/10/Select "^
xvii TAMS
HUDSON RIVER PCBs REASSESSMENT RI/FSPHASE 3 REPORT: FEASIBILITY STUDY
TABLE OF CONTENTS (CONTINUED)
9-5b Remediation Boundary Adjustment Sensitivity Analysis (MPA Target Area Minus 50Feet): Cost Analysis - Alternative CAP-3/10/Select
9-5c Remediation Boundary Adjustment Sensitivity Analysis (MPA Target Area Plus 50 Feet):Cost Analysis - Alternative REM-3/10/Select
9-5d Remediation Boundary Adjustment Sensitivity Analysis (MPA Target Area Minus 50Feet): Cost Analysis - Alternative REM-3/ 10/Select
9-5e Remediation Boundary Adjustment Sensitivity Analysis (MPA Target Area Plus 50 Feet):Cost Analysis - Alternative REM-0/0/3
9-5f Remediation Boundary Adjustment Sensitivity Analysis (MPA Target Area Minus 50Feet): Cost Analysis - Alternative REM-0/0/3
9-6 Cap Thickness Reduction Sensitivity Analysis: Quantities9-7 Cap Thickness Reduction Sensitivity Analysis: Cost Analysis - Alternative CAP-
3/10/Select9-8 Depth of Removal Adjustment Sensitivity Analysis: Quantities9-9a Depth of Removal Adjustment Sensitivity Analysis (Original Depth of Removal Plus 1
Foot): Cost Analysis - Alternative REM-3/10/Select9-9b Depth of Removal Adjustment Sensitivity Analysis (Original Depth of Removal Minus 1
Foot): Cost Analysis - Alternative REM-3/10/Select9-9c Depth of Removal Adjustment Sensitivity Analysis (Original Depth of Removal Plus 1
Foot): Cost Analysis - Alternative REM-0/0/39-9d Depth of Removal Adjustment Sensitivity Analysis (Original Depth of Removal Minus 1
Foot): Cost Analysis - Alternative REM-0/0/39-10 Summary of Cost Sensitivity Analyses
LIST OF FIGURES
1-1 Hudson River PCBs Superfund Site - Location Map1-2 Phased RI/FS Process1-3 Hudson River PCBs Site - River Sections for Alternatives Evaluation1-4 Total PCB Concentrations at Rogers Island, Observations and Moving Average1-5 Total PCB Concentrations at TID-West, Observations and Moving Average1-6 Total PCB Surface Sediment Concentrations from GE 1998-99 Samples
in the Upper Hudson1-7 NYSDEC PCB Results for Pumpkinseed from Stillwater to Coveville, Converted to Tri+
Basis-1-8 NYSDEC PCB Results for Largemouth Bass from Stillwater to Coveville, Converted to
Tri+ Basis
3-1 Features of Interest in the Upper Hudson Vicinity3-2 Location of 1996 and 1997 GE Float Survey Samples
xviii TAMS
400228
HUDSON RIVER PCBs REASSESSMENT RI/FSPHASE 3 REPORT: FEASIBILITY STUDY
TABLE OF CONTENTS (CONTINUED)
3-3 GE Float Survey Results for the TI Pool3-4 Principal Component 1 versus Principal Component 2 and MDPR versus Delta MW for
GE Float Survey Data3-5 Effective Rogers Island Concentration on Mixing Curve3-6 Cohesive Sediment Area and Central Channel Total PCBs as a Function of River Mile3-7 1999 Coring Results in Hot Spot 143-8 Erosion Area in TI Pool as Identified by Side Scan Sonar3-9 Length Weighted Average Concentration and Mass per Unit Area Calculations3-10 Correlations Among PCB Metrics for 1984 NYSDEC Sediment Survey3-11 Correlations Among PCB Metrics for USEPA Low Resolution Sediment Coring Survey3-12 Relationship among MPA, PCB Mass and Sediment Area in TI Pool (based on 1984
sediment survey)3-13 Relationship among MPA, PCB Mass and Sediment Area in the Cohesive Area in
the TI Pool (based on 1984 sediment survey)3-14 Relationship among MPA, PCB Mass and Sediment Area in the Non-cohesive Area in
the TI Pool (based on 1984 sediment survey)3-15 Selection of Remediation Areas for Expanded Hot Spot Removal: Hot Spot 83-16 Selection of Remediation Areas for Expanded Hot Spot Removal: Hot Spot 143-17 Selection of Remediation Areas for Expanded Hot Spot Removal: Hot Spot 283-18 Selection of Remediation Areas for Expanded Hot Spot Removal: RM 183.25 - 184.253-19 Selection of Remediation Areas for Expanded Hot Spot Removal: Hot Spot 363-20 Selection of Remediation Areas for Hot Spot Removal: Hot Spot 83-21 Selection of Remediation Areas for Hot Spot Removal: Hot Spot 143-22 Assessment of the Capture Efficiency for the Expanded Hot Spot Remediation Tri+ PCB
Concentration and MPA Histograms for 1984 NYSDEC Data Within and Outside ofRemedial Area
3-23 Assessment of the Capture Efficiency for the Hot Spot Remediation Tri+ PCBConcentration and MPA Histograms for 1984 NYSDEC Data Within and Outside ofRemedial Area
5-1 Conceptual Transfer Facility Plan (Mechanical Dredging Facility)5-2a Water Treatment and Solids Processing for Mechanical Dredging; Solids Handling5-2b Water Treatment and Solids Processing for Mechanical Dredging; Water Treatment5-3 Typical Cap Detail5-4 Typical River Cross-Section; Full-Section CAP Alternative5-5 River Cross Section at RM 193; REM 3/10/Select5-6 Monitoring Program Outline
6-1 Alternative REM - 10/MNA/MNA £6-2 Alternative REM - 0/MNA/MNA g6-3 Alternative REM - 3/10/10 10vo
Xix TAMS
HUDSON RIVER PCBs REASSESSMENT RI/FSPHASE 3 REPORT: FEASIBILITY STUDY
TABLE OF CONTENTS (CONTINUED)
6-4 Alternative REM - O/10/MNA6-5 Alternative REM - 0/10/106-6 Alternative REM - 0/0/36-7 Comparison between Forecasts for Thompson Island Pool Cohesive Surficial Sediments
for Alternatives for Screening6-8 Comparison between Forecasts for Thompson Island Pool Non-Cohesive Surficial
Sediments for Alternatives for Screening6-9 Comparison between Forecasts for Schuylerville Cohesive Surficial Sediments for
Alternatives for Screening6-10 Comparison between Forecasts for Schuylerville Non-Cohesive Surficial Sediments for
Alternatives for Screening6-11 Comparison between Forecasts for Stillwater Cohesive Surficial Sediments for
Alternatives for Screening6-12 Comparison between Forecasts for Stillwater Non-Cohesive Surficial Sediments for
Alternatives for Screening6-13 Comparison between Forecasts for Waterford Cohesive Surficial Sediments for
Alternatives for Screening6-14 Comparison between Forecasts for Waterford Non-Cohesive Surficial Sediments for
Alternatives for Screening6-15 Comparison between Forecasts for Federal Dam Non-Cohesive Surficial Sediments for
Alternatives for Screening6-16 Comparison between Water Column Total PCB Forecasts at Thompson Island Dam for
Alternatives for Screening6-17 Comparison between Water Column Total PCB Forecasts at Schuylerville for
Alternatives for Screening6-18 Comparison between Water Column Total PCB Forecasts at Stillwater for Alternatives
for Screening6-19 Comparison between Water Column Total PCB Forecasts at Waterford for Alternatives
for Screening6-20 Comparison between Water Column Total PCB Forecasts at Federal Dam for
Alternatives for Screening6-21 Comparison between Species Weighted Fish Fillet Average PCB Concentrations in River
Section 1 for Alternatives for Screening6-22 Comparison between Species Weighted Fish Fillet Average PCB Concentrations in River
Section 2 for Alternatives for Screening6-23 Comparison between Species Weighted Fish Fillet Average PCB Concentrations in River
Section 3 for Alternatives for Screening6-24 Comparison between Forecasts for Thompson Island Pool Cohesive Surficial Sediments
for Alternatives Retained for Detailed Analysis6-25 Comparison between Forecasts for Thompson Island Pool Non-Cohesive Surficial
Sediments for Alternatives Retained for Detailed Analysis
xx TAMS400230

HUDSON RIVER PCBs REASSESSMENT Rl/FSPHASE 3 REPORT: FEASIBILITY STUDY
TABLE OF CONTENTS (CONTINUED)
6-26 Comparison between Forecasts for Schuylerville Cohesive Surficial Sediments forAlternatives Retained for Detailed Analysis
6-27 Comparison between Forecasts for Schuylerville Non-Cohesive Surficial Sediments forAlternatives Retained for Detailed Analysis
6-28 Comparison between Forecasts for Stillwater Cohesive Surficial Sediments forAlternatives Retained for Detailed Analysis
6-29 Comparison between Forecasts for Stillwater Non-Cohesive Surficial Sediments forAlternatives Retained for Detailed Analysis
6-30 Comparison between Forecasts for Waterford Cohesive Surficial Sediments forAlternatives Retained for Detailed Analysis
6-31 Comparison between Forecasts for Waterford Non-Cohesive Surficial Sediments forAlternatives Retained for Detailed Analysis
6-32 Comparison between Forecasts for Federal Dam Non-Cohesive Surficial Sediments forAlternatives Retained for Detailed Analysis
6-33 Comparison between Water Column Total PCB Forecasts at Thompson Island Dam forAlternatives Retained for Detailed Analysis
6-34 Comparison between Water Column Total PCB Forecasts at Schuylerville forAlternatives Retained for Detailed Analysis
6-35 Comparison between Water Column Total PCB Forecasts at Stillwater for AlternativesRetained for Detailed Analysis
6-36 Comparison between Water Column Total PCB Forecasts at Waterford for AlternativesRetained for Detailed Analysis
6-37 Comparison between Water Column Total PCB Forecasts at Federal Dam forAlternatives Retained for Detailed Analysis
6-38 Comparison between Species Weighted Fish Fillet Average PCB Concentrations in RiverSection 1 for Alternatives Retained for Detailed Analysis
6-39 Comparison between Species Weighted Fish Fillet Average PCB Concentrations in RiverSection 2 for Alternatives Retained for Detailed Analysis
6-40 Comparison between Species Weighted Fish Fillet Average PCB Concentrations in RiverSection 3 for Alternatives Retained for Detailed Analysis
7-1 Reasonable Maximum Exposure Non-Cancer Health Hazards for Adult Angler by RiverSection
7-2 Central Tendency Exposure Non-Cancer Health Hazards for Adult Angler by RiverSection
7-3 Reasonable Maximum Exposure Cancer Risks for Adult Angler by River Section7-4 Central Tendency Exposure Cancer Risks for Adult Angler by River Section7-5 NOAEL Toxicity Quotient for River Otter by River Section7-6 LOAEL Toxicity Quotient for River Otter by River Section o7-7 NOAEL Toxicity Quotient for Mink by River Section g7-8 LOAEL Toxicity Quotient for Mink by River Section w
xxi / TAMS

HUDSON RIVER PCBs REASSESSMENT RI/FSPHASE 3 REPORT: FEASIBILITY STUDY
TABLE OF CONTENTS (CONTINUED)
7-9 Cumulative Risk Function for Female River Otter - No Action Alternative7-10 Cumulative Risk Function for Female River Otter - Monitored Natural Attenuation7-11 Cumulative Risk Function for Female River Otter - Active Remedial Alternatives
xxii TAMS400232
HUDSON RIVER PCBs REASSESSMENT RI/FSPHASE 3 REPORT: FEASIBILITY STUDY
TABLE OF CONTENTS (CONTINUED)
BOOK 3 -PLATESLIST OF PLATES
1 Overview of Hudson River, Glens Fall to Federal Dam2 Sediment Texture Classification3 River Bottom Geometry4-A Sediment PCB Inventories in 1984 - Total PCB MPA4-B Sediment PCB Inventories in 1984 - Tri+ PCB MPA5 Depth to 1 ppm PCB Concentration with Tri+ PCB MPA (g/m2)6 HUDTOX Model Segments and Areas Not Targeted for Remediation7 Hot Spot Remediation Target Boundaries (PCB MPA > 10 g/m2)8 Expanded Hot Spot Remediation Target Boundaries (PCB MPA > 3 g/m2)9 Full-Section Remediation Target Boundaries (PCB MPA > 0 g/m2)
10 CAP Alternatives: Hot Spot Capping Areas and Removal Depths(PCB MPA >10 g/m2)
11 CAP Alternatives: Expanded Hot Spot Capping Areas and Removal Depths(PCB MPA >3 g/m2)
12 CAP Alternatives: Full-Section Capping Areas and Removal Depths(PCB MPA >0g/m2)
13 REM Alternatives: Hot Spot Removal Areas and Depths (PCB MPA >10 g/m2)14 REM Alternatives: Expanded Hot Spot Removal Areas and Depths (PCB MPA >3 g/m2)15 REM Alternatives: Full-Section Removal Areas and Depths (PCB MPA >0 g/m2)16 Alternative CAP- 3/10/Select - Capping Areas and Removal Depths17 Alternative REM - 3/10/Select - Removal Areas and Depths18 Alternative REM - 0/0/3 - Removal Areas and Depths
ootoCOCO
xxin TAMS

HUDSON RIVER PCBs REASSESSMENT RI/FSPHASE 3 REPORT: FEASIBILITY STUDY
TABLE OF CONTENTS (CONTINUED)
BOOK 4 - APPENDICES A THROUGH C
Appendix A Background Material
A.I Supporting PlatesA.2 Upper Hudson River BaselineA.3 Upstream SourcesA.4 Survey of Environmental Dredging ProjectsA.5 Preliminary Human Health and Ecological Risk-Based Concentrations
Appendix B Volume Computations
Appendix C Vendor and Technology Contact Information
BOOK 5 - APPENDICES D THROUGH H
Appendix D Model Interpretation, Specifications and Results
D.I Model Interpretation: Risk Manager's ToolboxD.2 Model SpecificationsD.3 Model Results
Appendix E Engineering Analysis
E. 1 Technical Memorandum: Removal Productivity and Equipment Requirements(Mechanical Dredges)
E.2 Technical Memorandum: Areas Capped for the Capping Alternatives- ConceptDevelopment
E.3 Technical Memorandum: Volumes Removed for the Capping Altemtatives-Concept Development
E.4 Technical Memorandum: Capping with Dredging- Productivity and EquipmentRequirements (Mechanical Dredges)
E.5 Technical Memorandum: Applicability of Turbidity Barriers for RemediationE.6 Technical Memorandum: Semi-Quantitative Assessment of Water Quality
Impacts Associated with Dredging ActivitiesE.7 Technical Memorandum: Backfill Estimates Concept DevelopmentE.8 Technical Memorandum: Habitat Replacement/River Bank Restoration Concept
Development
xxiv TAMS400234

HUDSON RIVER PCBs REASSESSMENT RI/FSPHASE 3 REPORT: FEASIBILITY STUDY
TABLE OF CONTENTS (CONTINUED)
E.9 Technical Memorandum: Requirements for a Transfer Facility Adjacent to theThompson Island Pool
E.10 Technical Memorandum: Dredged Sediment Processing ConceptE. 11 Technical Memorandum: Evaluation of Off-Site Landfills for Final Disposal of
Dredged SedimentsE. 12 Technical Memorandum: Distribution of Sediment Volume by PCB
Concentration Range in the Thompson Island Pool and Below Thompson IslandDam
E. 13 Technical Memorandum: Estimation of Sediment PCB Inventories for Removal
Appendix F Habitat Replacement Program Description
Appendix G Monitoring Program Development
Appendix H Hydraulic Dredging Report and Debris Survey
H. 1 Hydraulic Dredging ReportH.2 Debris Survey
BOOK 6 - APPENDIX I
Appendix I Cost Estimates
1.1 Cost Estimate Summary1.2 Detailed Estimate Table of Contents1.3 Detailed Estimate - No Action Alternative1.4 Detailed Estimate - Monitored Natural Attenuation Alternative1.5 Detailed Estimate - Alternative CAP-3/10/Select1.6 Detailed Estimate - Alternative CAP-3/10/Select - Beneficial Use1.7 Detailed Estimate - Alternative REM-3/10/Select1.8 Detailed Estimate - Alternative REM-3/10/Select - Beneficial Use1.9 Detailed Estimate - Alternative REM-0/0/31.10 Detailed Estimate - Alternative REM-0/0/3- Beneficial UseI.I 1 - Detailed Estimate - Alternative REM-3/10/Select - Hydraulic Dredging1.12 Detailed Estimate - Alternative REM-0/0/3- Hydraulic Dredging
ootoWen
XXV TAMS
HUDSON RIVER PCBs REASSESSMENT RI/FSPHASE 3 REPORT: FEASIBILITY STUDY
TABLE OF CONTENTS (CONTINUED)
BOOK6-APPENDICES I
Cost Estimates1.1 Cost Estimate Summary1.2 Detailed Estimate Table of Contents1.3 Detailed Estimate - No Action Alternative1.4 Detailed Estimate - Monitored Natural Attenuation Alternative1.5 Detailed Estimate - Alternative CAP-3/10/Select1.6 Detailed Estimate - Alternative CAP-3/10/Select - Beneficial Use1.7 Detailed Estimate - Alternative REM-3/ 10/Select1.8 Detailed Estimate - Alternative REM-3/10/Select - Beneficial Use1.9 Detailed Estimate - Alternative REM-0/0/31.10 Detailed Estimate - Alternative REM-0/0/3 - Beneficial Use1.11 Detailed Estimate - Alternative REM-3/10/Select - Hydraulic Dredging1.12 Detailed Estimate - Alternative REM-0/0/3- Hydraulic Dredging
ooto00a\
XXV TAMS

ACRONYMS
ACGIH American Conference of Governmental Industrial HygienistsACHP Advisory Council on Historic PreservationAGC Annual Guideline ConcentrationAOC Administrative Order on ConsentAPEG Alkaline (Alkali Metal Hydroxide) Polyethylene GlycolARAR Applicable or Relevant and Appropriate RequirementARCS USEPA Assessment and Remediation of Contaminated Sediments ProgramATSDR Agency for Toxic Substance and Disease RegistryAWQC Ambient Water Quality CriterionBAT Best Achievable TechnologyBBL Blasland, Bouck, and LeeBCD Base-Catalyzed DecompositionBMR Baseline Modeling ReportCADD Computer-Aided Drafting and DesignCDF Confined Disposal FacilityGDI Chronic Daily IntakeCERCLA Comprehensive Environmental Response, Compensation, and Liability ActCFR Code of Federal Regulationscfs cubic feet per secondCLU-IN Hazardous Waste Clean-up Information (USEPA web site)COPC Chemicals of Potential ConcernCSF Cancer Slope FactorCT Central TendencyCWA Clean Water ActDEIR Data Evaluation and Interpretation ReportDMR Discharge Monitoring ReportDNAPL Dense Non-Aqueous Phase LiquidDOSM Depth of Scour ModelDOT Department of TransportationDRE Destruction and Removal EfficiencyBCD Electron Capture DetectorECL Environmental Conservation Law (New York)EEC Extreme Effect ConcentrationEE/CA Engineering Evaluation/Cost AnalysisEIS Environmental Impact StatementEO Executive OrderEPC Exposure Point ConcentrationERA Ecological Risk AssessmentESA Endangered Species ActETWG Engineering/Technology Work GroupFDA Food and Drug AdministrationFR Federal Register
400237 TAMS

ACRONYMS
Federal Remediation Technologies RoundtableFeasibility StudyFeasibility Study Scope of WorkFish & Wildlife Impact AnalysisGranular Activated CarbonGas ChromatographyGeosynthetic Clay LinerGeneral Electric CompanyGeographic Information SystemUSEPAs Great Lakes National Program OfficeGeneral Response ActionHigh Density PolyethyleneHuman Health Risk Assessment
FRTRFSFSSOWFWIAGACGCGCLGEGISGLNPOGRAHDPEHHRAHHRASOW Human Health Risk Assessment Scope of WorkHI Hazard IndexHMTA Hazardous Materials Transportation ActHP HorsepowerHQ Hazard QuotientHSI Habitat Suitability IndexHTTD High Temperature Thermal DesorptionIBI Index of Biotic IntegrityITT Innovative Treatment Technologies (database)KPEG Potassium polyethylene glycolLOAEL Lowest Observed Adverse Effect LevelLRC, LRCR Low Resolution Sediment Coring ReportLTI LimnoTech, Inc.LTTD Low Temperature Thermal DesorptionLWA Length-Weighted AverageMB I Macroinvertebrate Biotic IndexM&E Metcalf and EddyMCA Menzie-Cura and AssociatesMCACES Cost Estimating Software (USAGE)MCL Maximum Contaminant LevelMCLG Maximum Contaminant Level GoalMDEQ Michigan Department of Environmental QualityMEC Mid Range Effects ConcentrationMNA Monitored Natural Attenuation
_MPA Mass per Unit AreaMS Mass SpectroscopyNAAQS National Ambient Air Quality StandardsNCP National Oil Spill and Hazardous Substances Pollution Contingency PlanNEPA National Environmental Policy ActNHPA National Historic Preservation Act
oototo00
TAMS
ACRONYMS
NiMo Niagara Mohawk Power CompanyNOAA National Oceanic and Atmospheric AdministrationNOAEL No Observed Adverse Effect LevelNPL National Priorities ListNTCRA Non-Time Critical Removal ActionNYCRR New York Code of Rules and RegulationsNYSDEC New York State Department of Environmental ConservationNYSDOH New York State Department of HealthNYSDOT New York State Department of TransportationNYSPDES New York State Pollutant Discharge Elimination SystemO&M Operation and MaintenanceOPRHP Office of Parks, Recreation, and Historic PreservationOSHA Occupational Safety and Health AdministrationOSWER Office of Solid Waste and Emergency Response (USEPA)OU Operable UnitPCB Polychlorinated BiphenylPCRDMP Post-Construction Remnant Deposit Monitoring PlanPEL Probable Effects LevelPMCR Preliminary Modeling Calibration Reportppm part(s) per million (mg/kg or mg/L)PRG Preliminary Remediation GoalPSG Project Sponsor GroupPVC Polyvinyl ChlorideRAMP Remedial Action Master PlanRAO Remedial Action ObjectiveRBMR Revised Baseline Modeling ReportRBC Risk-Based ConcentrationREACH IT Remediation and Characterization Innovative Technologies (USEPA database)RfD Reference DoseRI Remedial InvestigationRI/FS Remedial Investigation/Feasibility StudyRIMS Remediation Information Management SystemRM River MileRME Reasonable Maximum ExposureROD Record of DecisionSARA Superfund Amendments and Reauthorization Act of 1986SEC Sediment Effect ConcentrationSHPO . State Historic Preservation OfficeSITE Superfund Innovative Technology Evaluation ProgramSPDES State Pollution Discharge Elimination SystemSQRT Screening Quick Reference TablesTAGM Technical Assistance Guidance Memorandum (NYSDEC)TBC To-be-considered
TAMS400239

ACRONYMS
TCDD 2,3,7,8-Tetrachlorodibenzo-p-dioxinTCP 2,4,6-TrichlorophenolT&E Threatened and EndangeredTEC Threshold Effect ConcentrationTEF Toxicity Equivalency FactorTEQ . ._ (Dioxin-Iike) Toxic EquivalentTI Thompson IslandTED Thompson Island DamTIN Triangulated Irregular NetworkTLV Threshold Limit ValueTOC Total Organic ContentTOGS Technical and Operational Guidance Series (NYSDEC)TOPS . Trace Organics Platform SamplerTQ Toxicity QuotientTR Target RiskTRV Toxicity Reference ValueTSCA Toxic Substances Control ActTWA Time-Weighted AverageUCL Upper Confidence LimitUET Upper Effects ThresholdUSAGE United States Army Corps of EngineersUSC United States CodeUSDOC United States Department of CommerceUSDOD United States Department of DefenseUSDOE United States Department of EnergyUSDOI United States Department of InteriorUSEPA United States Environmental Protection AgencyUSFWS United States Fish and Wildlife ServiceVISITT Vendor Information System for Innovative Treatment Technologies (USEPA
Program)VLDPE Very Low Density Polyethylene
ooto
TAMS

DISCLAIMER
Mention of trade names or commercial products in this Feasibility Study is for purposes ofevaluating remedial alternatives only, and does not constitute endorsement of any product ormanufacturer by the U.S. Environmental Protection Agency.
400241 TAMS |
Executive Summ
ary
CMoo
\ HUDSON RIVER PCBs REASSESSMENT FEASIBILITY STUDYEXECUTIVE SUMMARY
f DECEMBER 2000( •' •
SITE BACKGROUNDf:-\. Location and Description
I The Hudson River PCBs Superfund Site extends nearly 200 river miles (320 km) from the• Fenimore Bridge in Hudson Falls (River Mile [RM] 197.3) to the Battery in New York City (RMr 0) at the tip of Manhattan Island. This Feasibility Study (FS) is Phase 3 of the Reassessment||. Remedial Investigation/Feasibility Study (Reassessment RI/FS), which is being conducted by the
United States Environmental Protection Agency (USEPA) to reassess the Agency's 1984 interim Nof Action decision concerning polychlorinated biphenyls (PCBs) in the sediments of the Upper Hudson
River. This Reassessment FS identifies and evaluates in detail the remedial alternatives for PCB-contaminated sediments in the Upper Hudson River. The Upper Hudson River extends for 43 rivermiles (RM) from Fenimore Bridge in Hudson Falls (RM 197) to the Federal Dam at Green Islandin Troy (RM 153.9). The Lower Hudson River extends from the Federal Dam to the Battery (RM153.9 to 0).
^»^ The Reassessment FS is focused on the approximately 40 river miles from the northern endof Rogers Island to the Federal Dam at Troy. This portion of the river was divided into threesections for evaluating remedial alternatives in the FS. River Section 1, which is approximately 6miles long, extends from the northern end of Rogers Island (RM 194.6) to the TI Dam (RM 188.5)and is also referred to as the Thompson Island (TI) Pool. River Section 2 is approximately 5 mileslong and extends from the TI Dam (RM 188.5) to the Northumberland Dam near Schuylerville (RM183.4). River Section 3 is approximately 29 miles long and extends from below the NorthumberlandDam to the Federal Dam at Troy (RM 153.9).
History
PCB contamination in the Upper Hudson is due primarily to the release of PCBs from twoGeneral Electric Company (GE) capacitor plants in Fort Edward and Hudson Falls, New York (NY).During an approximate 30-year period ending in 1977, manufacturing processes at these two GEfacilities used PCBs in the manufacture of electrical capacitors. PCBs from both facilities weredischarged directly into the Hudson River. Estimates of the total quantity of PCBs discharged fromthe two plants into the river from the 1940s to 1977 range from 209,000 to 1,330,000 Ibs (95,000to 603,000 kg).
Many of the PCB s discharged to the river adhered to sediments and accumul ated downstreamwith the sediments as they settled in the impounded pool behind the former Fort Edward Dam (RM194.8), as well as in other impoundments farther downstream. Because of its deteriorating condition,
<<«WN the dam was removed by Niagara Mohawk Power Corporation in 1973. During subsequent spring ofloods, PCB-contarmnated sediments were scoured and transported downstream. A substantial °portion of these sediments was deposited in relatively quiescent areas of the river, i.e., lower energy *•areas where the finer-grained sediments with higher PCB concentrations were deposited. Theseareas were surveyed by New York State Department of Environmental Conservation (NYSDEC) in
ES-1 TAMS

1976 to 1978 and 1984, and are described as PCB hot spots. These NYSDEC-defmed hot spots,located between Rogers Island (RM 194) and Lock 2 (RM 163), are areas that typically had averagetotal PCB concentrations of 50 ppm or greater.
In 1975, the New York State Department of Health (NYSDOH) began to issue healthadvisories recommending that people limit consumption of fish from the Upper Hudson River. In1976, NYSDEC issued aban on fishing in the Upper Hudson River from Hudson Falls to the FederalDam at Troy, due to the potential risks from consumption of PCB-contaminated fish, and a ban oncommercial fishing of striped bass, which migrate upriver into the Lower Hudson. NYSDEC liftedthe ban against fishing in the Upper Hudson River and replaced it with a catch-and-release fishingprogram in 1995. NYSDOH continues to recommend that people eat none of the fish in the UpperHudson and that children under the age of 15 and women of child-bearing age eat none of the fishin the river for the entire length of the Superfund site. In addition, the commercial striped bassfishery in the Lower Hudson is still closed.
The site was proposed for inclusion on the National Priorities List in September 1983 andformally listed in September 1984. USEPA completed an FS and issued a Record of Decision(ROD) for the site in September 1984. The 1984 ROD included the following decisions:
• An interim No Action decision with regard to PCBs in the sediments of the Upper HudsonRiver;
• In-place capping, containment, and monitoring of exposed "remnant deposit" sediments (inthe area of RM 195 to RM 196), and stabilization of the associated riverbanks andrevegetation of the areas; and
• A detailed evaluation of the Waterford Water Works treatment facilities, including samplingand analysis of treatment to determine if an upgrade or alterations of the facilities wereneeded.
Sources of PCBs Upstream of Rogers Island
There are four major potential PCB sources adjacent to the Upper Hudson River betweenHudson Falls and Rogers Island, each at various stages of remediation. The four potentiallyimportant sources are the GE Hudson Falls plant, the GE Fort Edward plant, Remnant Deposit 1, andRemnant Deposits 2 through 5. The grouping of the remnant deposits is based on differences in thedegree of remediation completed. There are two minor potential sources of PCBs upstream of theFenimore Bridge: atmospheric deposition and the Niagara Mohawk Power Corporation site atQueensbury (located at about RM 209). These sources are considered anthropogenic baseline forpurposes of the FS. Based on current data, of the four major sources, only the GE Hudson Falls plantappears to contribute a substantial amount of the PCB loads measured at Rogers Island. The regiondownstream of Rogers Island contributes between four and five times as much PCB to the UpperHudson River as does the region upstream of Rogers Island, which includes leakage of PCB-contaminated oil through bedrock near the GE Hudson Falls plant.
In order to reduce the upstream source of PCBs, USEPA has authorized the performance ofan Engineering Evaluation/Cost Analysis (EE/C A) to evaluate potential Non-Time Critical RemovalActions (NTCRA) to address the PCBs entering the river in the vicinity of the GE Hudson Fallsplant. It is assumed that as a result of this source control removal action, the upstream load at Fort
ES-2 400244 TAMS

I Edward (Rogers Island) will be reduced from its average current value of 0.16 kg/day (equivalentto an average concentration of 13 ng/L) to 0.0256 kg/day (equivalent to an average concentration of
I 2 ng/L). Based on discussions with GE regarding a conceptual design, USEPA believes that a sourceI ' control NTCRA can be completed by January 1, 2005.
f REASSESSMENT REMEDIAL INVESTIGATION\
— In a December 19, 1989 letter to NYSDEC, USEPA announced that it would reassess the| 1984 interim no-action decision for PCB-contaminated sediments in the Upper Hudson River.1 USEPA's decision to conduct the Reassessment RI/FS was based on the 1986 Superfund
Amendments and Reauthorization Act's (SARA's) requirement that USEPA conduct five-yearfej reviews at sites where hazardous substances were left in-place, and USEPA's policy decision to; include such reviews at sites with pre-SARA RODs; recent advances in PCB treatment technologies;
f and NYSDEC's request to the Agency that it reassess its 1984 interim No Action decision.t."j
For its Reassessment RI/FS, USEPA used data collected during its own samplinginvestigations, as well as data collected by many other agencies (e.g., NYSDEC, U.S. Fish andWildlife Service [USFWS], National Oceanographic and Atmospheric Administration [NOAA]),institutions, and GE. The investigations include sediment surveys, river flow and water qualityinvestigations, fish/biota sampling, air monitoring, and plant/crop uptake studies.
<*——V,
Sixteen years after USEPA's 1984 interim No Action decision, PCB concentrations remainelevated in the Hudson River in the sediment, water, and fish. Concentrations generally decreasewith distance down river, away from the original source areas of the GE Hudson Falls and FortEdward plants. While some changes have occurred during this period, in general, conditions havenot improved substantially from about 1995 to the present.
Conceptual Site Model
: In the integrated conceptual model of the Hudson River PCBs site, PCB s are released fromthe two GE plants in Hudson Falls and Fort Edward into the Hudson River. Once in the river, thePCB s adhere to sediments or are carried in the water column. PCB s in the sediment are a continuingsource of contamination to the water column and biota, through aquatic and benthic food chains andthrough processes that have been empirically measured but are not easily modeled (e.g., boat scour,bioturbation). Because the river is a dynamic system, the PCB-contaminated sediments are notstable. Some PCB -contaminated sediment may be buried by deposition of cleaner sediments at sometimes, but in other places and: at other times they may be redistributed locally by scouring. Highflow events (e.g., spring floods) may increase the bioavailability of contaminants to organisms inthe water column. Organisms moving between the river and shore may also provide a pathway forPCB transfer to the terrestrial ecosystem.
Summary of Site Risks *•———————————— ox-v • o
USEPA examined risks to human health and the environment under baseline conditions in ,£the Revised Human Health Risk Assessment (Revised HHRA, USEPA, 2000q) and Ecological Risk w
Assessment (Revised ERA, USEPA, 2000p) for the Reassessment RI/FS, respectively. The baseline-v_; conditions are equivalent to the No Action remedial alternative and presume no remediation of the
ES-3 TAMS

PCB-contaminated sediments of the Upper Hudson River and no additional source control measuresat the GE Hudson Falls plant. The risk assessments conclude that current and future concentrationsof PCBs in fish are above levels of concern to human health and ecological receptors. For both,eating PCB-contaminated fish is the primary exposure pathway.
Peer Review
In accordance with USEPA guidance and the Peer Review Handbook, the scientific workconducted for the Reassessment underwent external peer review by independent scientific experts.The peer reviewers generally agreed with the findings and conclusions of the reports, although theyalso requested changes. USEPA issued Responses to Peer Review Comments for each of the peerreviews, as well as a Revised Human Health Risk Assessment and a Revised Ecological RiskAssessment. Revisions to all reports were incorporated into the FS, as appropriate.
ALTERNATIVE DEVELOPMENT
Remedial Action Objectives and Preliminary Remediatioti Goals
Consistent with the NCP and Agency RI/FS Guidance, USEPA developed remedial actionobjectives (RAOs) for the site. Preliminary remediation goals (PRGs) were established after reviewof both the preliminary chemical-specific applicable or relevant and appropriate requirements(ARARs) and risk-based concentrations. The following are the RAOs for the Reassessment FS:
• Reduce the cancer risks and non-cancer health hazards for people eating fish from the Riverby reducing the concentration of PCBs in fish. The risk-based PRO for protection of humanhealth is 0.05 mg/kg total PCBs in fish fillet based on the RME adult fish consumption rateof 1 meal per week. Other target concentrations are 0.2 mg/kg total PCBs in fish fillet,which is protective at a fish consumption rate of about 1 meal per month and 0.4 mg/kg totalPCBs in fish fillet, which is protective of the average angler (CT), who consumes about 1meal every 2 months. These targets of higher concentrations in fish represent points at whichfish consumption advisories might become less stringent (e.g., the "eat none" advisory forthe Upper Hudson could be relaxed as conditions improve).
• Reduce risks to ecological receptors by reducing the concentration of PCBs in fish. The risk-based PRO for the ecological exposure pathway is a range from 0.3 to 0.03 mg/kg total PCBsin fish (whole body), which correspond to PCB concentrations of 0.13 to 0.013 mg/kg in fishfillets. The ecological PRG is based on the lowest-observed adverse effects level (LOAEL)and the no-observed adverse effects level (NOAEL) for consumption of whole fish by theriver otter, an upper-trophic- level piscivorous mammal (TQ[LOAELorNOAEL).D[ET = 1). '
• Reduce concentrations of PCBs in river (surface) water that are above ARARs. The ARARsare: 1 x 10"6 |J,g/L (one part per quadrillion) total PCBs, NYS ambient water quality standardfor protection of human consumers offish; 1.2 x 10"4 [ig/L, NYS standard for protection ofwildlife; 1 x 10"3 Jlg/L, federal Ambient Water Quality Criterion; 0.09 |J.g/L, NYS standardfor protection of human health and drinking water sources; and 0.5 |ig/L, the federalmaximum contaminant level (MCL) for PCBs in drinking water.
ES-4 400246 TAMS

• Reduce the inventory (mass) of PCBs in sediment that are or may be bioavailable.
• Minimize the long-term downstream transport of PCBs in the river.
Development of Remediation Targets
Because consumption of fish is the major pathway of concern and fish concentrations arecontrolled by both sediment and water concentrations, a specific "cleanup value" for sediment wasnot selected as a goal. Instead, sediment cleanup is considered the means to achieve the RAOs.Areas of sediment for remediation were selected based on the potential for those areas to contributePCBs to the water column and fish through the food chain. The delineation of the target areasconsidered a number of factors, primarily the inventory of PCBs in the sediment, but also surfacesediment concentrations, sediment texture, bathymetry, and whether the PCB contamination isburied by greater than 12 inches of cleaner sediment. Target areas for remediation were not dividedsmaller than 50,000 square feet (a little over an acre) because of practical limitations on the numberof separate remediation zones that could be accommodated for a project of this size. In addition,areas considered to be rocky, as defined by side-scan sonar, were excluded.
PCB inventory in sediment is represented by samples with a Mass Per Unit Area (MPA)measurement (i.e., grams of PCBs per square meter). MPA represents the total mass of PCBs withina sediment core. MPA was plotted against area of non-cohesive sediment for River Section 1 (andagainst PCB mass remediated) to determine breakpoints where a small change in MPA would meana large increase in area or mass to be remediated. This is an engineering evaluation of the efficiencyof contamination to be addressed compared to the amount of the sediment surface that would requireremediation. Breakpoints were found at approximately 3 g/m2 and 10 g/m2. For a core with a depthof one foot, 3 g/m2 is equivalent to a concentration of approximately 10 mg/kg, and 10 g/m2 isequivalent to approximately 30 mg/kg.
The MPA target levels are defined as:
0 g/m2 Full-Section remediation3 g/m2 Expanded Hot Spot remediation10 g/m2 Hot Spot remediation
These criteria were applied to the three sections of the Upper Hudson to develop remedialtarget areas for River Sections 1, 2, and 3. In River Section 3, Full-Section remediation wasexcluded because it would have required remediation of an unreasonably large area (over 2,800acres) and there are limited data in areas other than the five hot spots. Similarly, a cleanup level suchas 1 mg/kg (as used for other sites) would have targeted unreasonably large areas in Section 3.
General Response Actions
Following the development of the RAOs and remediation target areas, USEPA updated the oGeneral Response Actions (GRAs) identified in the FS Scope of Work and its Responsiveness °Summary. The final GRAs are no action, monitored natural attenuation, institutional controls, *•containment (capping), removal (dredging), in situ treatment, ex situ treatment, beneficial use, anddisposal. J
ES-5 TAMS

A comprehensive review of technologies and process options was performed by USEPAbased on effectiveness, implementability, and cost. During the screening of technologies and processoptions, the General Response Action of in situ treatment was eliminated from further consideration,because no in situ treatment was identified that is capable of treating PCB-contaminated sedimentin place in the Upper Hudson River.
Development of Alternatives
In order to meet the RAOs, 59 alternative scenarios were developed for remediation of thePCB-contaminated sediments in the three sections of the Upper Hudson River. The alternatives weredeveloped by combining potentially applicable sediment remediation technologies from among thosethat remained after the technology screening (treatment and disposal options were consideredseparately, as discussed below). The initial list of alternatives that were evaluated can be groupedinto the following alternative categories:
Alternative Category 1: No Action. This alternative is equivalent to baseline conditions. It includesno source control at GE Hudson Falls, no institutional controls, and no action with respect to thePCBs in the sediments in the Upper Hudson River. Five year reviews would be required.
Alternative Category 2: Monitored Natural Attenuation (MNA) (with Source Control at GE HudsonFalls) and Institutional Controls. This alternative includes implementation of source controlmeasures at GE Hudson Falls pursuant to a separate NTCRA and monitoring, but no activeremediation, of the PCBs in the sediments. Five year reviews would be required.
Alternative Category 3: Containment (capping) of Target Areas. MNA (with Source Control at GEHudson Falls) and Institutional Controls. Alternative Category 3 includes placement of anengineered cap on target areas and protection of the cap from damage by boat propellers and anchors,bioturbation and other disturbances with backfill suitable for benthic and fish habitat. Five yearreviews would be required.
Alternative Category 4: Removal (dredging) of Target Areas and MNA (with Source Control at GEHudson Falls) and Institutional Controls Alternative Category includes removal of PCB-contaminated sediment, isolation of residual PCBs in sediments that may remain after dredgingthrough placement of backfill suitable for benthic and fish habitat in target areas from which thesediments are removed, and several post-removal option categories for handling the removedsediments. Five year reviews would be required.
Alternative Category 5: Containment and Removal (capping, after dredging in some areas) of TargetAreas and MNA (with Source Control at GE Hudson Falls) and Institutional Controls. AlternativeCategory 5 includes removal of PCB-contaminated sediment, placement of an engineered cap,protection of the cap from damage by boat propellers and anchors, bioturbation and otherdisturbances with backfill suitable for benthic and fish habitat, isolation of residual PCBs insediments that may remain after dredging through placement of backfill in target areas from whichthe sediments are removed, and several post-removal option categories for handling the removedsediments. Five year reviews would be required.
400248ES-6 TAMS
For alternative categories 3, 4, and 5, several alternatives were developed with a differentextent of remediation in River Sections 1, 2, and 3.
Institutional controls (fish consumption advisories) would be utilized with the MNA,Capping and Removal alternatives. Institutional controls are considered to be limited actionalternatives, and therefore are not included under the No Action alternative.
Capping alternatives (alternative categories 3 and 5) considered an engineered cap (includinga bentonite layer) of approximately 1-1/2 foot total thickness (including 1 foot of bentonitecomposite material overlain by 0.5 foot of backfill), which was based on the potential for disturbanceby boat propeller wash and ice chunks. However, because the addition of this material would greatlyalter the geometry of the river (shoreline) in shallow areas, areas with less than 6 feet average draftwould first require dredging. In addition, because the river is used for navigational purposes, it isimpractical to cap the channel (which later may require navigational dredging). Removal is the onlyactive remediation that would be performed in the channel.
For the removal alternatives, both mechanical and hydraulic dredging were considered topreserve flexibility during the remedial design. The following post-removal option categories wereevaluated:
A. Off-site Containment/Disposal of Removed Sediments.
B. Near River Ex Situ Treatment of Removed Sediments followed by Offsite Containment/Disposal of Treated Sediments.
C. Off-site Ex Situ Treatment of Removed Sediments followed by Off-site Containment/Disposal of Treated Sediments.
D. Abandoned Mine Reclamation/Landfill Cover/Construction Fill.
E. Near River Ex Situ Treatment of Removed Sediments followed by Abandoned MineReclamation/Landfill Cover/Construction Fill.
F. Off-site Ex Situ Treatment of Removed Sediments followed by Abandoned MineReclamation/Landfill Cover/Construction Fill.
G. Near River Ex Situ Treatment of Removed Sediments followed by Manufacture ofCommercial Products from Treated Removed Sediments.
H. Off-site Ex Situ Treatment of Removed Sediments followed by Manufacture of CommercialProducts from Treated Removed Sediments.
All of the above post-removal handling option categories require dewatering of thesediments. They also include appropriate treatment of the water (primarily filtration with polishingby granular activated carbon [GAC] adsorption) to meet NYS Pollution Discharge EliminationSystem (NYSPDES) requirements before being discharged into the river. Option Category Aincludes containment/disposal of the removed sediments in an industrial (RCRA Subtitle D) or
ES-7 TAMS
it*

TSCA-permitted landfill, depending on the concentration of total PCBs in the bulk dewateredsediments. Option Categories B and C are similar except for the location where the ex situ treatment(stabilization) is performed. Option Category D is a form of low-value beneficial use of the removedsediments without the need for any ex situ treatment (stabilization). This option category is likelysuitable for sediments with relatively low concentrations of total PCBs (typically < 4 or < 10 mg/kgdepending on the application and local site-specific requirements).
Option Categories E and F are applicable to sediments with similar concentrations of totalPCBs (typically < 4 or < 10 mg/kg) that require some ex situ treatment (stabilization) to improve thehandling and disposal characteristics of the dredged sediments prior to the low-value beneficial use.They are similar except for the location where the ex situ treatment is performed. Option CategoriesG and H are quite different from options A through F because the PCBs are removed by thermaldesorption, plasma arc vitrification, or surfactant washing and chemical treatment, and the sediments(clays, silts, and sands) are converted into higher value, useful commercial products such asarchitectural tiles, fiberglass, cement, light-weight aggregate, or manufactured soils. OptionCategories G and H are designed to allow unrestricted use of these products because they no longercontain PCBs; the categories are similar to each other except for the location where the ex situtreatment is performed.
Based on an evaluation of various factors including the method of dredging and the locationwhere ex situ treatment is performed, only Option Categories A, B, D, E, and H were retained forfurther consideration in the development and screening of alternatives.
Remedial Alternatives Screening
Application of Screening Criteria
The remedial alternatives were screened for effectiveness, implementability, and cost.Consistent with the RI/FS Guidance, effectiveness of a remedial alternative refers to its ability toprotect human health and the environment; the screening for this criterion is discussed in greaterdetail below. The screening for implementability involves both the technical and administrativefeasibility of constructing, operating, and maintaining a remedial alternative. The screening for costincludes both capital and O&M costs, where appropriate, as well as present worth analyses.
On the basis of the implementability screening, a new near-river landfill for disposal oftreated PCB-contaminated sediments was eliminated. USEPA has long known that much of thecommunity within the Upper Hudson River is opposed to the siting of a new landfill that wouldreceive PCB-contaminated sediment from the river. In recognition of this opposition, and theadministrative difficulties that would be encountered in attempting to site a near-river landfill,USEPA determined that a local landfill, though technically feasible, was not administrativelyfeasible.
For similar types of alternatives, the evaluation of the effectiveness screening criterion wasbased on the relative risks to human health and ecological receptors posed by exposure to PCBs inwater, sediment, and fish following implementation of the remedial alternatives. The exposureconcentrations were forecast using USEPA's coupled, quantitative models for PCB fate, transportand bioaccumulation in the Upper Hudson River, called HUDTOX and FISHRAND, which were
ES-8 400250 TAMS

developed for the Reassessment RI/FS. The models were calibrated to an extensive 21-yearhistorical data set.
Since the peer review, USEPA has performed validation runs of its Upper Hudson Rivermodels under baseline (No Action) conditions using data for the upstream boundary condition, thehydrograph, and tributary solids loading. With these inputs, USEPA demonstrated that the modelsare able to predict concentrations in fish that match the mean of the lipid-based fish body burden datawithin a factor of 2. Nonetheless, USEPA believes that the models, when used in the forecast mode,are best used to predict relative concentrations of PCBs in water, sediment, and fish, rather thanabsolute concentrations. There are a number of inherent uncertainties, both with respect to the data(or lack thereof) used to calibrate the models and the need to assume certain conditions in the future,such as the hydrograph and tributary solids loading. For these reasons, USEPA also developed keyadditional lines of evidence to evaluate protection of human health and the environment from (1)sensitivity analyses of the mathematical modeling, (2) estimation of upper bounds for the No Actionand MNA alternatives, and (3) analysis of observed trends in recent environmental data, which areindependent of the model.
Estimated Upper Bounds for No Action and Monitored Natural Attenuation Alternatives
The efficacy of the No Action and MNA alternatives depends primarily on the gradualdepletion and/or burial of sediment PCBs in the bioavailable zone. Given the possibility thatconcentrations of PCB s in sediment may decline more slowly than predicted by HUDTOX, whetherdue to the spatial scale of the model or inherent assumptions, such as sediment mixing zone ormixing rate, USEPA developed an approach for estimating upper bounds for the No Action andMonitored Natural Attenuation alternatives. (The rate of decline is much less important for theactive remedial alternatives, which rely primarily on sediment removal or capping to limit theexposure of biota to PCBs). The upper bounds were estimated assuming that PCB concentrationsin cohesive sediment will decline with a half-life of 50 years, consistent with the 1995-1999 data forPCBs in brown bullhead, a catfish that gets most of its PCB exposure from the sediment through thebenthic food chain. In the upper bound estimations, concentrations of PCBs in non-cohesivesediment and the water column are forecast by HUDTOX, which is reasonable given the high degreeof agreement between the model output and the water column data. The upper bounds for the NoAction and Monitored Natural Attenuation alternatives are considered in evaluating relative risksto human health and the environment posed by the different alternatives.
Modeling for Alternative Screening
Development of potential remedial alternatives was performed based on an evaluation of thedata used to delineate remediation target threshold boundaries and a four-step modeling evaluation.The evaluation also considered the potential uncertainties associated with model predictions andother lines of evidence, as identified above. Modeling of remedial alternative scenarios wasperformed in four stages: 1) modeling of No Action and Monitored Natural Attenuation, 2) lta>
preliminary modeling, 3) engineering modeling, and 4) refined engineering modeling. At each stage oof the modeling, the results were used to refine the scope of modeling in the next stage. J£
H
Modeling was conducted to evaluate the impact of remediation for combinations of the targetlevels for each river section. It was found that remediation in River Section 1, the Thompson Island "
ES-9 TAMS

Pool, had the greatest benefit with respect to PCB levels in fish and surface water. The model didnot show substantial benefits from remediation in River Section 3, most likely due to the relativelylarge scale of the model segments in this reach. However, data show increased water column jconcentrations in this reach resulting from tributary high flow events that caused scour in themainstem Hudson, thereby elevating the water-column PCB concentrations. For example, acomparison of 1977 and 1994 sediment data showed that over two thirds of the PCB inventory was |lost from Hot Spot 37. Therefore, certain areas in River Section 3, i.e., Hot Spots 36, 37, and thesouthern portion of 39, were selected for remediation based on PCB inventory and signs of PCBinventory loss. These target areas in River Section 3 are also referred to as Select areas. \
Based on analyses of the model output as compared to recent data trends, it appears that the f,rates of PCB decline with respect to the No Action (no source control) and Monitored Natural |Attenuation (with source control) alternatives in the model projections are faster than the rates ofdecline seen in the monitoring data. Under the modeled remedial alternatives, this over-optimism .[.-is eliminated wherever PCB inventory is removed or capped, because projected rates of decline are \replaced by specified concentrations in the remediated areas. Consequently, the benefits ofremediation based on comparisons of the remediation alternatives to the No Action and Monitored iNatural Attenuation alternatives are likely underestimated by the models. j
A specialized nomenclature system was used to designate the remedial scenarios (potential jremedial alternatives) for the engineering modeling and refined engineering modeling. The first part \of the scenario name uses three or more letters to describe the remedial alternative category, e.g.,removal (REM) or capping with dredging (CAP). The second part of the remedial scenario nameuses numbers or letters to denote the remediation target area for each of the three river sections and !'•the extent of remediation within each river section, sequentially from River Section 1 to RiverSection 3 (as explained earlier). Therefore, by this nomenclature system, the alternative that involves IFull-Section capping with dredging in River Section 1, Expanded Hot Spot capping with dredging <•of sediments (at or above nominal PCB MPA of 3 g/m2) in River Section 2, and no remediation ofsediments (MNA only) in River Section 3, would be designated as CAP-Q/3/MNA. <>
Screening Factors and Metrics
The alternatives were evaluated by comparing various factors including:f
• the mass of PCBs, areas and volumes of sediment targeted for remediation; I• the area capped;• the volume of sediment removed; ,• the surface water quality in each river section; |• the fish body burdens in each river section;• the PCB load over Federal Dam; ;• the propensity for scour in River Section 3 due to flows from the Hoosic River; f• the upstream boundary condition (best estimate of future conditions);• the need for long-term maintenance of capped areas; and f• the potential long-term risks from leaving contaminated sediments in the river's ecosystem.
400252ES-10 TAMS
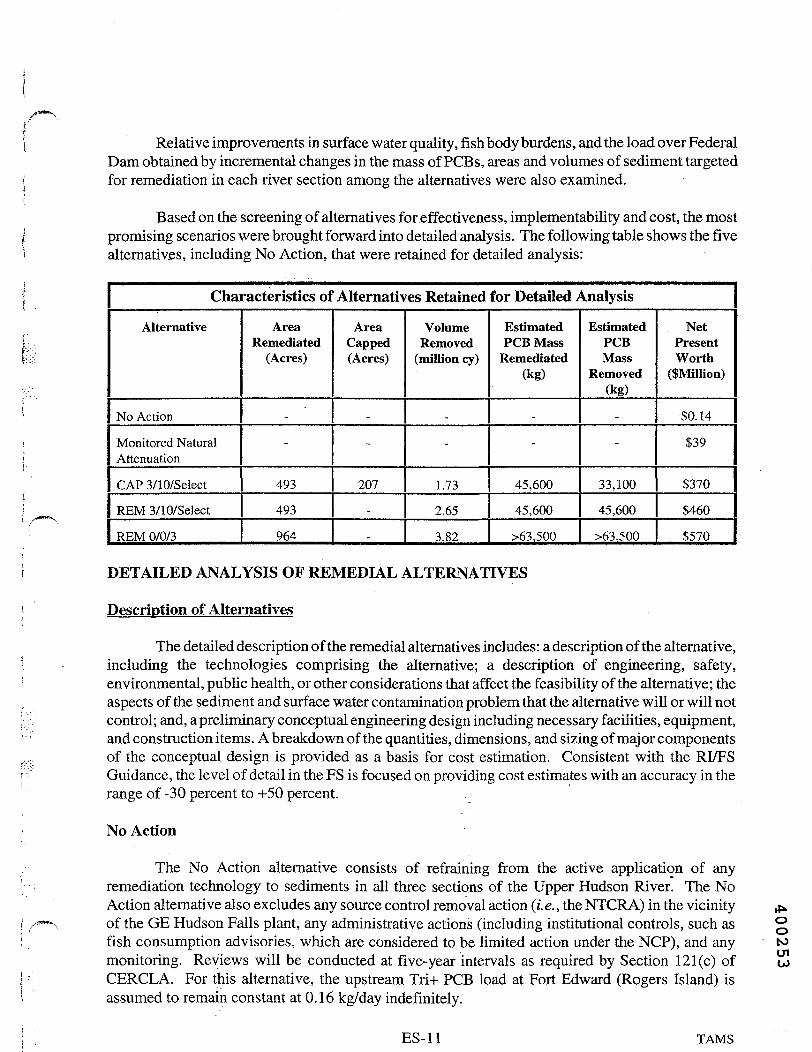
Relative improvements in surface water quality, fish body burdens, and the load over FederalDam obtained by incremental changes in the mass of PCBs, areas and volumes of sediment targetedfor remediation in each river section among the alternatives were also examined.
Based on the screening of alternatives for effectiveness, implementability and cost, the mostpromising scenarios were brought forward into detailed analysis. The following table shows the fivealternatives, including No Action, that were retained for detailed analysis:
Characteristics of Alternatives Retained for Detailed Analysis IAlternative
No Action
Monitored NaturalAttenuation
CAP 3/10/Select
REM 3/10/Select
REM 0/0/3
AreaRemediated
(Acres)
_
-
493
493
964
AreaCapped(Acres)
_
-
207
_
-
VolumeRemoved
(million cy)
„
-
1.73
2.65
3.82
EstimatedPCB Mass
Remediated(kg)
_
-
45,600
45,600
>63,500
EstimatedPCBMass
Removed(kg)
_
-
33,100
45,600
>63,500
NetPresentWorth
($MiIlion)
$0.14
$39
$370
$460
$570
DETAILED ANALYSIS OF REMEDIAL ALTERNATIVES
Description of Alternatives
The detailed description of the remedial alternatives includes: a description of the alternative,including the technologies comprising the alternative; a description of engineering, safety,environmental, public health, or other considerations that affect the feasibility of the alternative; theaspects of the sediment and surface water contamination problem that the alternative will or will notcontrol; and, a preliminary conceptual engineering design including necessary facilities, equipment,and construction items. A breakdown of the quantities, dimensions, and sizing of major componentsof the conceptual design is provided as a basis for cost estimation. Consistent with the RI/FSGuidance, the level of detail in the FS is focused on providing cost estimates with an accuracy in therange of -30 percent to +50 percent.
No Action
The No Action alternative consists of refraining from the active application of anyremediation technology to sediments in all three sections of the Upper Hudson River. The NoAction alternative also excludes any source control removal action (i.e., the NTCRA) in the vicinityof the GE Hudson Falls plant, any administrative actions (including institutional controls, such asfish consumption advisories, which are considered to be limited action under the NCP), and anymonitoring. Reviews will be conducted at five-year intervals as required by Section 121 (c) ofCERCLA. For this alternative, the upstream Tri+ PCB load at Fort Edward (Rogers Island) isassumed to remain constant at 0.16 kg/day indefinitely.
ootOin
ES-11 TAMS
Monitored Natural Attenuation (MNA)
The Monitored Natural Attenuation alternative includes natural attenuation of sediments, }institutional controls, long-term monitoring and modeling to track progress, and periodic reviews r
at five-year intervals. Unlike No Action, the MNA alternative assumes a separate source controlremoval action (NTCRA) at the GE Hudson Falls plant. It is assumed that as a result of this source jcontrol removal action, the average upstream PCB load at Fort Edward (Rogers Island) is reduced 'from 0.16 kg/day to 0.0256 kg/day on January 1, 2005. Natural attenuation refers to the reductionof toxicity, mobility and volume of contaminants in the sediments by naturally occurring biological, ychemical, and physical processes. Institutional controls (e.g., site use restrictions) are implementedas long-term control measures as part of this alternative. These restrictions include continuation or rextension of the existing fish consumption advisories, and catch and release restrictions. I?
Long-term monitoring of PCBs in sediments, the water column, and biota is conducted as ;part of the MNA alternative. The purpose of the monitoring and modeling is to demonstrate that ^contaminant reduction is occurring, and that the reduction is achieving regulatory requirements, suchas the NYS standard for PCBs in surface water (1 x 10"6 ug/L), for protection of the health of human fconsumers of fish. Monitoring includes measurements of sediment accumulation rates or \erosion/scour, PCB concentrations in the sediment by depth, bioaccumulation by benthic organisms,and the migration or harvesting of contaminated organisms. Monitoring data are used as input fparameters and recalibration points in the mathematical models to evaluate progress of the natural Iattenuation processes against the original predictions. Reviews are conducted at five-year intervalsto reassess the long-term appropriateness of continued MNA. f
CAP-3/10/SeIectV-1'
This alternative includes capping with dredging to perform Expanded Hot Spot remediation ;
(i.e., in which the nominal MPA targets are 3 g/m2 or greater) in River Section 1, Hot Spotremediation (i.e., in which the nominal MPA targets are 10 g/m2 or greater) in River Section 2, and [remediation of select areas (i.e., sediments with high-concentration PCB target areas and which arepotentially subject to scour) in River Section 3. This alternative also includes dredging in thenavigation channel as necessary to implement the remediation. Protection of the cap from damage iby boat propellers and anchors, bioturbation and other disturbances is implemented through addition 'Lof a layer of backfill material suitable for replacement of fish and benthic habitat. Areas from which ,.sediments are removed are backfilled with appropriate material to isolate residual PCBs in sediments fthat may remain after dredging is completed. No backfill is placed in the navigation channel. Afterconstruction is completed, MNA is implemented in each section of the river until the RAOs are ,achieved. }
The total area of sediments to be capped is approximately 207 acres. The estimated volume . >.of sediments to be removed is 1.73 million cubic yards. Remediation will commence in 2004 and fwill be completed in 2008. This alternative is performed in conjunction with a separate sourcecontrol removal action (i.e., NTCRA) in the vicinity of the GE Hudson Falls plant and also relies on finstitutional controls, such as the fish consumption advisories, and naturally occurring attenuationprocesses to reduce the toxicity, mobility and volume of the remaining PCBs in the Upper HudsonRiver sediments after the construction is completed. A review of site conditions will be conducted ?at five-year intervals, as required by Section 121© of CERCLA. '>
ES-12 400254 TAMS 1
REM-3/10/SeIect
i This alternative includes Expanded Hot Spot removal (/. e., in which the nominal MPA targetsI are 3 g/m2 PCBs or greater) in River Section 1, Hot Spot removal (i.e., in which the nominal MPA
targets are 10 g/m2 or greater) in River Section 2, and removal of select areas (i.e., sediments withI high-concentration PCB target areas and which are potentially subject to scour) in River Section 3.'• This alternative also includes sediment removal in the navigation channel as necessary to implement
the remediation. Isolation of residual PCBs in sediments that may remain after dredging is\ completed through addition of a layer of backfill material suitable for replacement of the fish and
benthic habitat. No backfill is placed in the navigation channel. After construction is completed,r MNA is implemented in each section of the river until the RAOs are achieved.
The total area of sediments targeted for removal is approximately 493 acres. The estimatedr volume of sediments to be removed is 2.65 million cubic yards. Remediation will commence inf 2004 and will be completed in 2008. This alternative is performed in conjunction with a separate
source control removal action (i.e., NTCRA) in the vicinity of the GE Hudson Falls plant and alsorelies on institutional controls, such as the fish consumption advisories, and naturally occurring
i attenuation processes to reduce the toxicity, mobility and volume of the remaining PCBs in theUpper Hudson River sediments after the construction is completed. A review of site conditions will
[ be conducted at five-year intervals, as required by Section 121 © of CERCLA.
REM-0/0/3
j This alternative includes Full-Section removal (i. e., removal of sediments in which the MPAtargets are 0 g/m2 or greater) in River Section 1 and 2, and Expanded Hot Spot removal (i.e., in
; which the nominal MPA targets are 3 g/m2 or greater) in River Section 3. This alternative alsoi includes sediment removal in the navigation channel as necessary to implement the remediation.
Isolation of residual PCBs in sediments that may remain after dredging is completed through(. - addition of a layer of backfill material suitable for replacement of the fish and benthic habitat. No
backfill is placed in the navigation channel.
} : The total area of sediments targeted for removal is approximately 964 acres. The volume ofi; sediments to be removed is estimated to be 3.82 million cubic yards. This alternative performs the
most extensive remediation that can be supported by current data, and has the longest duration.i Remediation will begin in 2004 and will be completed in 2010. This alternative is performed in
conjunction with a separate source control removal action (i.e., NTCRA) in the vicinity of the GEHudson Falls plant and also relies on institutional controls, such as the fish consumption advisories,
i and naturally occurring attenuation processes to reduce the toxicity, mobility and volume of theremaining PCBs in the Upper Hudson River sediments after the construction is completed. A reviewof site conditions will be conducted at five-year intervals, as required by Section 121 © of CERCLA.
|.v
Comparative Analysis of Alternatives **^^^ .————— ——————"~"~ ——————"•"———————————~~—— ^^f /""-N o
I Under CERCLA, nine key criteria are utilized in the detailed analysis of remedial {^alternatives. The first two criteria are threshold criteria that must be met by each alternative. The w
I two threshold criteria are: Overall Protection of Human Health and the Environment, andli / Compliance with ARARs. The next five criteria are the primary balancing criteria upon which the
(& ES-13 TA1UQ

analysis is based. The five primary balancing criteria are: Long-term Effectiveness and Permanence;Reduction of Toxicity, Mobility or Volume through Treatment; Short-term Effectiveness;Implementability; and Cost. The comparative analysis below encompasses the two threshold criteriaand the five balancing criteria, but not the two modifying criteria of state acceptance and communityacceptance, which will be evaluated following the public comment period.
Overall Protection of Human Health and the Environment
This evaluation criterion provides a final assessment as to whether each alternativeadequately protects human health and the environment. Relative reductions in risk for each remedialalternative as compared to the No Action and Monitored Natural Attenuation alternatives arediscussed below. Consideration of the impacts of the upstream boundary concentration is alsodiscussed.
Overall Protection of Human Health
Overall protection of human health was evaluated in two primary ways: the time that it wouldtake under each of the alternatives to reach the fish PRO and the other target concentrations, and therelative reduction in cancer risks and non-cancer health hazards under the five remedial alternatives.
Time to Reach Fish Target Levels
The fish PRO is 0.05 ppm PCBs (wet weight) in fillet. In addition, USEPA considered atarget concentration of 0.2 ppm PCBs (wet weight) in fillet based on one fish meal per month, anda target concentration of 0.4 ppm, based on the average consumption rate of one fish meal every twomonths. The target concentrations correspond to points at which the fish consumption advisoriesmight be relaxed from the current "eat none" recommendation in the Upper Hudson River. Thefollowing table shows the time required under each of the alternatives to reach the fish consumptionPRG and target concentrations.
Years to Reach PCB Target Concentration in FishAveraged Over Entire Upper Hudson River
Alternative
No Action
MNA
CAP-3/10/Select -
REM-3/10/Select
REM-0/0/3
0.05 ppm PRG
>67
>67
>67
>67
>67
0.2 ppm (1 meal/ month)target
>67
60 to >67
35
35
26
0.4 ppm (1 meal/ 2months) target
>67
34 to >67
21
20
11
The overall protection of human health achieved by the active alternatives is considerablymore than that achieved by the No Action and MNA alternatives. For the CAP-3/10/Select, REM-3/10/Select, and REM-0/0/3 alternatives, risk is reduced through removal or capping, with dredging
400256ES-14 TAMS

of contaminated sediments in River Sections 1 and 2, and removal of contaminated sediments inRiver Section 3, followed by Monitored Natural Attenuation.
In River Section 3, all of the active remediation alternatives meet the PRG targetconcentration of 0.05 ppm PCBs between the years 2050 and 2051 (which is 40 to 43 years afterconstruction is complete, depending on the alternative); the MNA alternative reaches it in the year2059; and the No Action alternative does not meet the PRG within the modeling time frame. As aresult, the PRG of 0.05 ppm also is expected to be attained in the majority of the Lower HudsonRiver, due to the lower initial concentration of PCBs in the Lower Hudson compared to the UpperHudson. Due to the continuing PCB load of 2 ng/L assumed after implementation of the sourcecontrol action in the vicinity of the GE Hudson Falls plant, the PCB concentration in fish averagedover the Upper Hudson is expected to be reduced to a range of 0.09 to 0.14 ppm, which is slightlyabove the PRG of 0.05 ppm.
The protectiveness of the active remedial alternatives is further enhanced throughimplementation of institutional controls, such as the fish consumption advisories. The modeledresults suggest that the advisories could be relaxed somewhat at various points in the future for thedifferent river sections. Specifically, the 0.2 ppm target concentration is met in River Section 2 in2044 for CAP-3/10/Select (about 36 years after remediation is complete), 2040 for REM-3/10/Select,and 2034 for REM-0/0/3. In comparison, it is met in 2061 for the base MNA alternative and is notmet within the modeled time frame for the estimated upper bound MNA alternative. The 0.2 ppmtarget concentration is not met within the modeled time frame for No Action or the estimated upperbound No Action alternative.
For the CAP-3/10/Select alternative, the modeling projects that the target concentration of0.4 ppm is attained in River Section 1 within 16 years of active remediation, within 15 years forREM-3/10/Select, and within 3 years for REM-0/0/3. The target of 0.2 ppm, protective of an adultwho consumes one fish meal per month, is attained in River Section 2 within 32 years of activeremediation. These time periods are significantly shorter than the time periods projected forattaining the 0.4 ppm target under either the No Action alternative or the MNA alternative..
Relative Reductions in Cancer Risks and Non-Cancer Health Hazards
The model output years included in the exposure calculations were identified on a riversection basis using different long-term period starting dates, depending on the construction schedulefor each remedial alternative. The long-term exposure period was considered to start immediatelyafter a one-year equilibration period beyond the completion of work in a given river section. Forexample, if the construction schedule for an alternative requires three years to complete in RiverSection 1, given a start date in 2004, the construction would be complete at the end of 2006,equilibration would occur over the year 2007, and the long-term period for calculation of cancer risksand non-cancer health hazards would start on January 1, 2008.
rt*o
Cancer risks and non-cancer health hazards for the entire Upper Hudson River (RMs 189 to o154) and for each section of the river under the active remedial alternatives were compared ^separately (using the appropriate time frame) to the cancer risks and non-cancer health hazards under ">J
the No Action and MNA alternatives, including their estimated upper bounds, to estimate thereduction in cancer risks and non-cancer health hazards achieved by each alternative.
ES-15 TAMS

The fish concentration predictions used are the species-weighted averages, based on relativespecies consumption reported in the 1991 state-wide New York angler survey. The fish consumptionrates and time periods assumed for exposure are the same as those utilized in the Revised HHRA.Because the PCB concentration in fish declines for the projected 70-year period covered by this FS,the average concentration (over time) actually declines as the exposure period increases. Thus, theaverage concentration and, by extension, the average PCB intake in terms of mg/kg-day, in a 7-yearexposure period is actually greater than the average concentration over, for example, 12 years. Asa result of the declining trend in PCB concentration in fish over time, the average daily dosedecreases as the exposure duration increases.
The RME cancer risks and non-cancer health hazards for adult anglers for each alternativeand for the entire Upper Hudson River are shown in the table below.
Non-Cancer Health Hazards and Cancer Risks from Fish IngestionAveraged over the Entire Upper Hudson River
Non-Cancer HealthHazard Index or
Cancer Risk
HI-RME (2009-2015)
HI-RME (201 1-2017)
HI-CT (2009-2020)
HI-CT(2011-2022)
Cancer risk - RME(2009-2048)
Cancer risk - RME(2011-2050)
Cancer risk - CT(2009-2020)
Cancer risk - CT(2011-2022)
No Action
53-80
48-75
5.0-7.7
4.5-7.3
7.8E-04 to1.4E-03
7.3E-04 to1.3E-03
1.7E-05 to2.6E-05
1.5E-05 to2.5E-05
MNA
40-71
34-66
3.4-6.7
2.9-6.3
4.0E-04 to1.2E-03
3.5E-04 to1. IE-03
1.2E-05to2.3E-05
l.OE-05 to2. IE-05
CAP-3/10/Select
15
1.3
1.8E-04
4.5E-06
REM-3/10/Select
13
1.2
1.7E-04
4.0E-06
REM-0/0/3
8
0.7
1.2E-04
2.4E-06
The table below shows a summary of predicted RME cancer risk and non-cancer healthhazard reductions for all active alternatives compared to the No Action and MNA alternatives, andfor MNA compared to No Action.
ES-16 400258TAMS
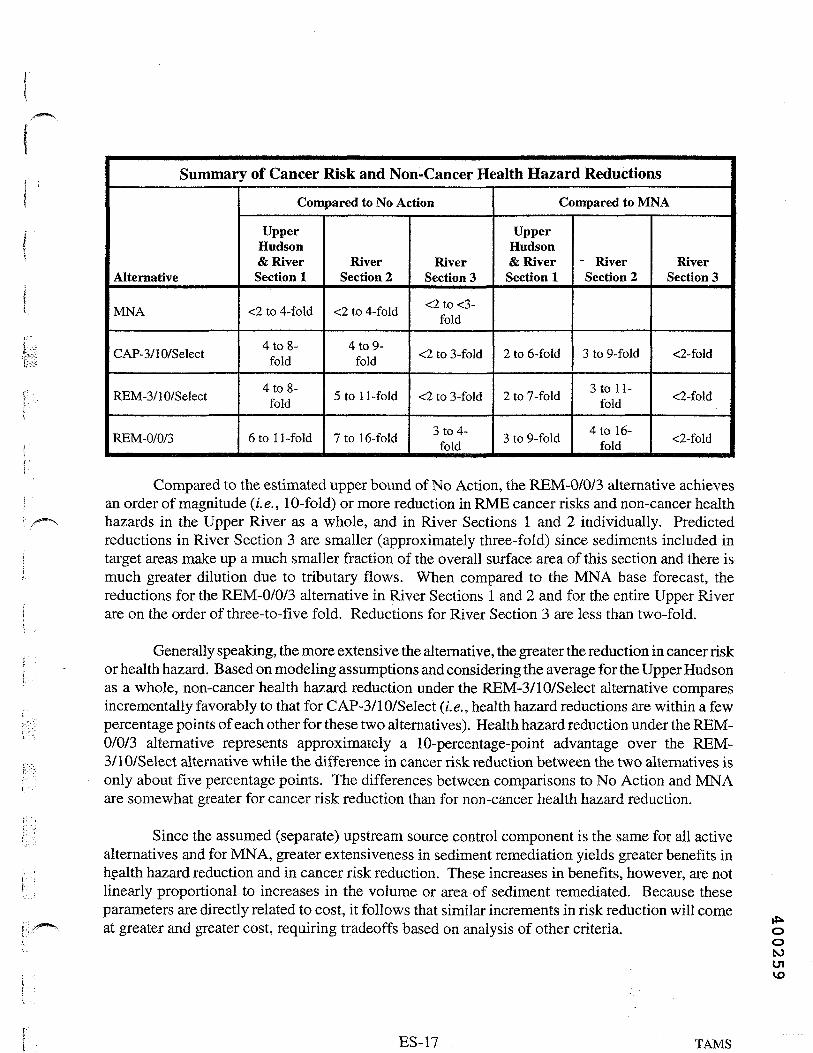
Summary of Cancer Risk and Non-Cancer Health Hazard Reductions
Alternative
MNA
CAP-3/1 0/Select
REM-3/10/SeIect
REM-0/0/3
Compared to No Action
UpperHudson& RiverSection 1
<2 to 4-fold
4108-fold
4 to 8-fold
6 to 11 -fold
RiverSection 2
<2 to 4-fold
4109-fold
5 to 1 1-fold
7 to 16-fold
RiverSection 3
<2 to <3-fold
<2 to 3-fold
<2 to 3-fold
3 to 4-fold
Compared to MNA
UpperHudson& RiverSection 1
2 to 6-fold
2 to 7-fold
3 to 9-fold
- RiverSection 2
3 to 9-fold
3 to 11-fold
4 to 16-fold
RiverSection 3
<2-fold
<2-fold
<2-fold
Compared to the estimated upper bound of No Action, the REM-0/0/3 alternative achievesan order of magnitude (i.e., 10-fold) or more reduction in RME cancer risks and non-cancer healthhazards in the Upper River as a whole, and in River Sections 1 and 2 individually. Predictedreductions in River Section 3 are smaller (approximately three-fold) since sediments included intarget areas make up a much smaller fraction of the overall surface area of this section and there ismuch greater dilution due to tributary flows. When compared to the MNA base forecast, thereductions for the REM-0/0/3 alternative in River Sections 1 and 2 and for the entire Upper Riverare on the order of three-to-five fold. Reductions for River Section 3 are less than two-fold.
Generally speaking, the more extensive the alternative, the greater the reduction in cancer riskor health hazard. Based on modeling assumptions and considering the average for the Upper Hudsonas a whole, non-cancer health hazard reduction under the REM-3/10/Select alternative comparesincrementally favorably to that for CAP-3/10/Select (i.e., health hazard reductions are within a fewpercentage points of each other for these two alternatives). Health hazard reduction under the REM-0/0/3 alternative represents approximately a 10-percentage-point advantage over the REM-3/10/Select alternative while the difference in cancer risk reduction between the two alternatives isonly about five percentage points. The differences between comparisons to No Action and MNAare somewhat greater for cancer risk reduction than for non-cancer health hazard reduction.
Since the assumed (separate) upstream source control component is the same for all activealternatives and for MNA, greater extensiveness in sediment remediation yields greater benefits inhealth hazard reduction and in cancer risk reduction. These increases in benefits, however, are notlinearly proportional to increases in the volume or area of sediment remediated. Because theseparameters are directly related to cost, it follows that similar increments in risk reduction will comeat greater and greater cost, requiring tradeoffs based on analysis of other criteria. O
OCOUl
ES-17 JAMS
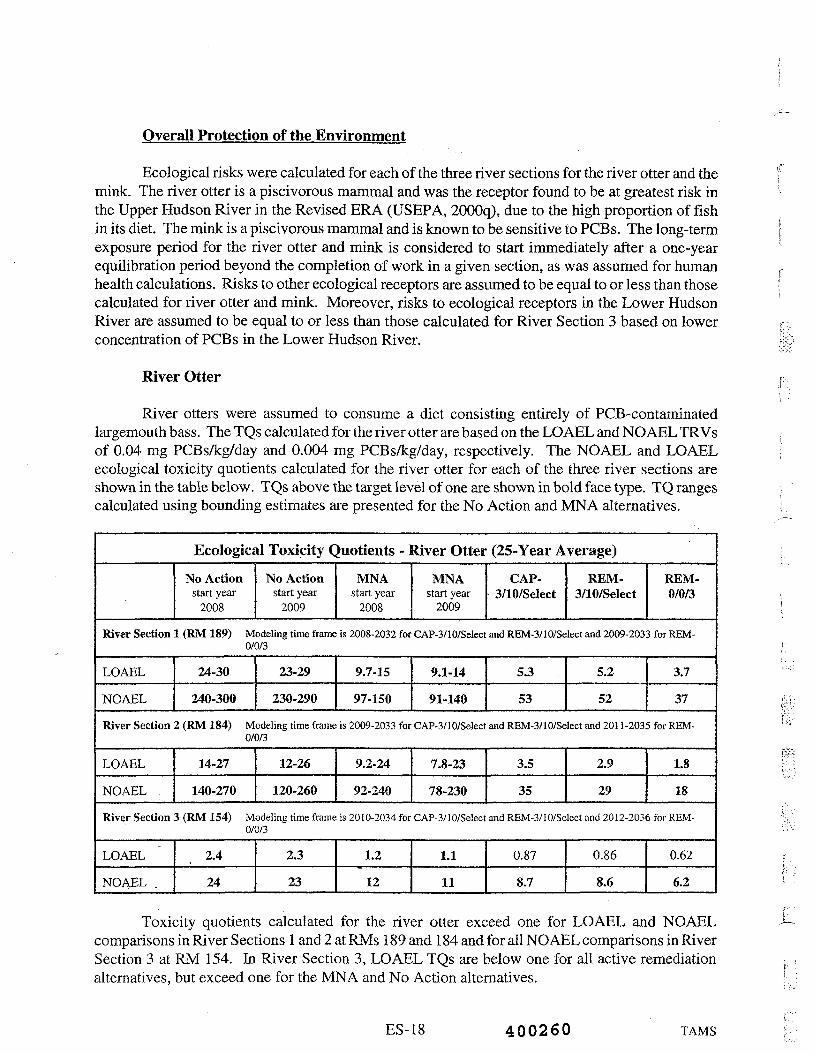
Overall Protection of the Environment
Ecological risks were calculated for each of the three river sections for the river otter and themink. The river otter is a piscivorous mammal and was the receptor found to be at greatest risk inthe Upper Hudson River in the Revised ERA (USEPA, 2000q), due to the high proportion of fishin its diet. The mink is a piscivorous mammal and is known to be sensitive to PCBs. The long-termexposure period for the river otter and mink is considered to start immediately after a one-yearequilibration period beyond the completion of work in a given section, as was assumed for humanhealth calculations. Risks to other ecological receptors are assumed to be equal to or less than thosecalculated for river otter and mink. Moreover, risks to ecological receptors in the Lower HudsonRiver are assumed to be equal to or less than those calculated for River Section 3 based on lowerconcentration of PCBs in the Lower Hudson River.
River Otter
River otters were assumed to consume a diet consisting entirely of PCB-contaminatedlargemouth bass. The TQs calculated for the river otter are based on the LOAEL and NOAEL TRVsof 0.04 mg PCBs/kg/day and 0.004 mg PCBs/kg/day, respectively. The NOAEL and LOAELecological toxicity quotients calculated for the river otter for each of the three river sections areshown in the table below. TQs above the target level of one are shown in bold face type. TQ rangescalculated using bounding estimates are presented for the No Action and MNA alternatives.
Ecological Toxicity Quotients - River Otter (25-Year Average)No Action
start year2008
No Actionstart year
2009
MNAstart year
2008
MNAstart year
2009
CAP-3/10/SeIect
REM-3/10/Select
REM-0/0/3
River Section 1 (RM 189) Modeling time frame is 2008-2032 for CAP-3/10/Select and REM-3/1 0/Select and 2009-2033 for REM-0/0/3
LOAEL
NOAEL
24-30
240-300
23-29
230-290
9.7-15
97-150
9.1-14
91-140
5.3
53
5.2
52
3.7
37
River Section 2 (RM 184) Modeling time frame is 2009-2033 for CAP-3/1 0/Select and REM-3/10/Select and 201 1-2035 for REM-0/0/3
LOAEL
NOAEL ..
14-27
140-270
12-26
120-260
9.2-24
92-240
7.8-23
78-230
3.5
35
2.9
29
1.8
18
River Section 3 (RM 154) Modeling time frame is 20 1 0-2034 for CAP-3/ 1 0/Select and REM-3/ I 0/Select and 20 1 2-2036 for REM-0/0/3
LOAEL
NOAEL \
2.4
24
2.3
23
1.2
12
1.1
11
0.87
8.7
0.86
8.6
0.62
6.2
Toxicity quotients calculated for the river otter exceed one for LOAEL and NOAELcomparisons in River Sections 1 and 2 at RMs 189 and 184 and for all NOAEL comparisons in RiverSection 3 at RM 154. In River Section 3, LOAEL TQs are below one for all active remediationalternatives, but exceed one for the MNA and No Action alternatives.
ES-18 400260 TAMS
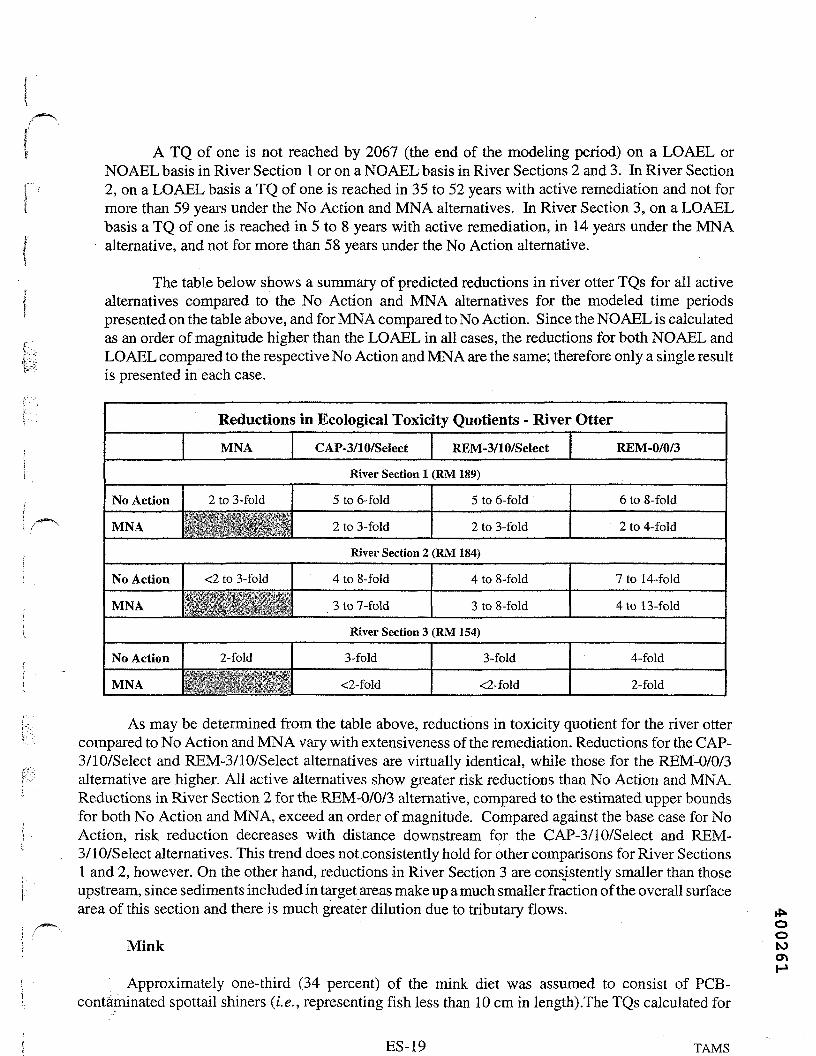
/•""""N
A TQ of one is not reached by 2067 (the end of the modeling period) on a LOAEL orNOAEL basis in River Section 1 or on a NOAEL basis in River Sections 2 and 3. In River Section2, on a LOAEL basis a TQ of one is reached in 35 to 52 years with active remediation and not formore than 59 years under the No Action and MNA alternatives. In River Section 3, on a LOAELbasis a TQ of one is reached in 5 to 8 years with active remediation, in 14 years under the MNAalternative, and not for more than 58 years under the No Action alternative.
The table below shows a summary of predicted reductions in river otter TQs for all activealternatives compared to the No Action and MNA alternatives for the modeled time periodspresented on the table above, and for MNA compared to No Action. Since the NOAEL is calculatedas an order of magnitude higher than the LOAEL in all cases, the reductions for both NOAEL andLOAEL compared to the respective No Action and MNA are the same; therefore only a single resultis presented in each case.
Reductions in Ecological Toxicity Quotients - River OtterMNA CAP-3/10/Select REM-3/10/SeIect REM-0/0/3
River Section 1 (RM 189)
No Action
MNA
2 to 3-fold 5 to 6-fold
2 to 3-fold
5 to 6-fold
2 to 3-fold
6 to 8-fold
2 to 4-fold
River Section 2 (RM 184)
No Action
MNA
<2 to 3-fold 4 to 8-fold
3 to 7-fold
4 to 8-fold
3 to 8-fold
7 to 14-fold
4 to 13-fold
River Section 3 (RM 154)
No Action
MNA
2-fold 3-fold
<2-fold
3-fold
<2-fold
4-fold
2-fold
As may be determined from the table above, reductions in toxicity quotient for the river ottercompared to No Action and MNA vary with extensiveness of the remediation. Reductions for the CAP-3/10/Select and REM-3/10/Select alternatives are virtually identical, while those for the REM-0/0/3alternative are higher. All active alternatives show greater risk reductions than No Action and MNA.Reductions in River Section 2 for the REM-0/0/3 alternative, compared to the estimated upper boundsfor both No Action and MNA, exceed an order of magnitude. Compared against the base case for NoAction, risk reduction decreases with distance downstream for the CAP-3/10/Select and REM-3/10/Select alternatives. This trend does not .consistently hold for other comparisons for River Sections1 and 2, however. On the other hand, reductions in River Section 3 are consistently smaller than thoseupstream, since sediments included in target areas make up a much smaller fraction of the overall surfacearea of this section and there is much greater dilution due to tributary flows.
Mink
Approximately one-third (34 percent) of the mink diet was assumed to consist of PCB-contaminated spottail shiners (i.e., representing fish less than 10 cm in length).The TQs calculated for
ooto
ES-19 TAMS

the mink are based on the LOAEL and NOAEL TRVs of 0.04 mg PCBs/kg/day and 0.004 mgPCBs/kg/day, respectively. The NOAEL and LOAEL ecological toxicity quotients calculated for themink for each of the three river sections are shown in the table below. TQs above the target level of oneare shown in bold face type. TQ ranges calculated using bounding estimates are presented for the NoAction and MNA alternatives.
Ecological Toxicity Quotients - Mink (25-Year Average)
No Actionstart year
2008
No Actionstart year
2009
MNAstart year
2008
MNAstart year
2009
CAP-3/10/Select
REM-3/10/Select
REM-0/0/3
River Section 1 (RM 189) Modeling time frame is 2008-2032 for CAP-3/ 10/Select and REM-3/10/Select and 2009-2033 for REM-0/0/3
LOAEL
NOAEL
4.6-5.3
46-53
4.5-5.2
45-52
1.7-2.6
17-26
1.6-2.5
16-25
0.94
9.4
0.95
9.5
0.70
7.0
River Section 2 (RM 184) Modeling time frame is 2009-2033 for CAP-3/1 0/Select and REM-3/10/Select and 201 1-2035 for REM-0/0/3
LOAEL
NOAEL
1.5-2.7
15-27
1.3-2.6
13-26
0.94-2.5
9.4-25
0.79-2.4
7.9-24
0.36
3.6
0.31
3.1
0.19
1.9
River Section 3 (RM 154) Modeling time frame is 2010-2034 for CAP-3/ 10/Select and REM-3/ 10/Select and 2012-2036 for REM-0/0/3
LOAEL
NOAEL
0.21
2.1
0.20
2.0
0.11
1.1
0.09
0.9
0.07
0.75
0.08
0.75
0.06
0.55
Toxicity quotients calculated for the mink are below or equal to one for LOAEL comparisonsfor active alternatives in all river sections. In River Section 3, NOAEL comparisons for activeremediation alternatives are also below one. Under the No Action and MNA alternatives, all NOAELand LOAEL TQs in River Sections 1 and 2 exceed one, except for the LOAEL base case for the MNAalternative. LOAEL TQs in River Section 2 exceed one for the No Action alternative and estimatedupper bound of the MNA alternative. NOAEL TQs in River Section 3 exceed one for the No Actionalternative, whether starting in the Year 2008 or 2009, and for the MNA alternative starting in the Year2008.
A TQ of one on a LOAEL basis is reached in two to five years with active remediation in RiverSection 1. Under the MNA alternative, a TQ of one is reached in a time frame of 22 years to more than60 years, and under the No Action alternative it is not reached for more than 60 years (the extent of themodeling period). In River Section 2, a TQ of one on a LOAEL basis is reached.before the long-termmodeling period for all active alternatives. Under the base MNA and No Action alternatives, a TQ ofone is reached in 10 and 21 years, respectively, while under the estimated upper bounds for thesealternatives, it is not reached for more than 59 years. Under active remediation in River Section 3, a TQof one on a NOAEL basis is reached in four to five years, in 12 years under the MNA alternative, andin more than 58 years under the No Action alternative.
The table below shows a summary of predicted reductions in Mink TQs for all active alternativescompared to the No Action and MNA alternatives, and for MNA compared to No Action. Since theNOAEL is calculated as an order of magnitude higher than the LOAEL in all cases, the reductions for
ES-20 400262 TAMS

both NOAEL and LOAEL compared to the associated No Action and MNA are the same; therefore onlya single result is presented in each case.
Reductions in Ecological Toxicity Quotients - Mink
MNA CAP-3/10/Select REM-3/10/Select REM-0/0/3
River Section 1 (RM 189)
No Action
MNA
2 to 3-fold 5 to 6-fold
2 to 3-fold
5 to 6-fold
2 to 3-fold
6 to 7-fold
2 to 4-fold
River Section 2 (RM 184)
No Action
MNA
<2 to 3-fold 4 to 8-fold
3 to 7-fold
5 to 9-fold
3 to 8-fold
7 to 14-fold
4 to 13-fold
River Section 3 (RM 154)
No Action
MNA
2-fold 3-fold
<2-fold
3-fold
<2-foId
3-fold
<2-fold
As may be determined from the table above, reductions in toxicity quotient for the minkcompared to No Action and MNA vary with extensiveness of the remediation. Reductions for the CAP-3/10/Select and REM-3/10/Select alternatives are virtually identical (slightly favoring REM-3/10/Selectin River Section 2), while those for the REM-0/0/3 alternative are higher. All active alternatives showgreater risk reductions than MNA. Reductions in River Section 2 for the REM-0/0/3 alternative,compared to the upper bounds for both No Action and MNA, exceed an order of magnitude. Comparedagainst the base case for No Action, risk reduction decreases with distance downstream for the CAP-3/10/Select and REM-3/10/Select alternatives. This trend does not consistently hold for othercomparisons for River Sections 1 and 2, however. On the other hand, reductions in River Section 3 areconsistently smaller than those upstream, since sediments included in target areas make up a muchsmaller fraction of the overall surface area of this section and there is much greater dilution due totributary flows.
Downstream Transport of PCBs
Remedial action objectives for the site call for minimizing long-term downstream transport ofPCBs over the Federal Dam. The table below provides a summary of the annual Tri+ PCB loads passingthe dams at the downstream ends of all three river sections for three points in time (years 2003,2011 and2035). The year 2003 represents the period immediately preceeding the start of remedial constructionunder any of the active remedial alternatives, while 2011 represents a period shortly after completionof construction (i.e., 2008 for CAP-3-10-Select and REM-3/10/Select, and 2010 for REM-0/0/3). Theyear 2035 represents the approximate mid-point of the ends of the ecological modeling time frames forthe various alternatives. This is also approximately the end of the period for which cost estimates areprepared (i.e., about 30 years from the start of construction).
400263ES-21 TAMS
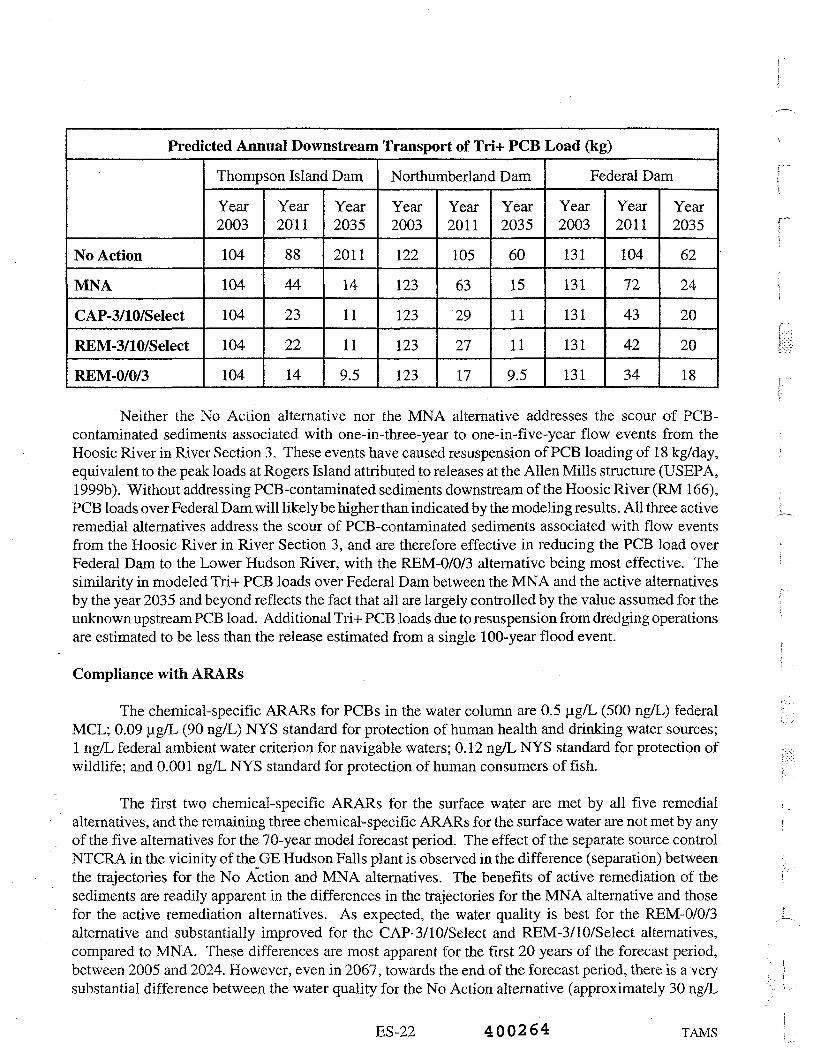
Predicted Annual Downstream Transport of Tri+ PCB Load (kg)
No Action
MNA
CAP-3/10/SeIect
REM-3/10/Select
REM-0/0/3
Thompson Island Dam
Year2003
104
104
104
104
104
Year2011
88
44
23
22
14
Year2035
2011
14
11
11
9.5
Northumberland Dam
Year2003
122
123
123
123
123
Year2011
105
63
29
27
17
Year2035
60
15
11
11
9.5
Federal Dam
Year2003
131
131
131
131
131
Year2011
104
72
43
42
34
Year2035
62
24
20
20
18
Neither the No Action alternative nor the MNA alternative addresses the scour of PCB-contaminated sediments associated with one-in-three-year to one-in-five-year flow events from theHoosic River in River Section 3. These events have caused resuspension of PCB loading of 18 kg/day,equivalent to the peak loads at Rogers Island attributed to releases at the Alien Mills structure (USEPA,1999b). Without addressing PCB-contaminated sediments downstream of the Hoosic River (RM 166),PCB loads over Federal Dam will likely be higher than indicated by the modeling results. All three activeremedial alternatives address the scour of PCB-contaminated sediments associated with flow eventsfrom the Hoosic River in River Section 3, and are therefore effective in reducing the PCB load overFederal Dam to the Lower Hudson River, with the REM-0/0/3 alternative being most effective. Thesimilarity in modeled Tri+ PCB loads over Federal Dam between the MNA and the active alternativesby the year 2035 and beyond reflects the fact that all are largely controlled by the value assumed for theunknown upstream PCB load. Additional Tri+ PCB loads due to resuspension from dredging operationsare estimated to be less than the release estimated from a single 100-year flood event.
Compliance with ARARs
The chemical-specific ARARs for PCBs in the water column are 0.5 ug/L (500 ng/L) federalMCL; 0.09 ug/L (90 ng/L) NYS standard for protection of human health and drinking water sources;1 ng/L federal ambient water criterion for navigable waters; 0.12 ng/L NYS standard for protection ofwildlife; and 0.001 ng/L NYS standard for protection of human consumers offish.
The first two chemical-specific ARARs for the surface water are met by all five remedialalternatives, and the remaining three chemical-specific ARARs for the surface water are not met by anyof the five alternatives for the 70-year model forecast period. The effect of the separate source controlNTCRA in the vicinity of the GE Hudson Falls plant is observed in the difference (separation) betweenthe trajectories for the No A~ction and MNA alternatives. The benefits of active remediation of thesediments are readily apparent in the differences in the trajectories for the MNA alternative and thosefor the active remediation alternatives. As expected, the water quality is best for the REM-0/0/3alternative and substantially improved for the CAP-3/10/Select and REM-3/10/Select alternatives,compared to MNA. These differences are most apparent for the first 20 years of the forecast period,between 2005 and 2024. However, even in 2067, towards the end of the forecast period, there is a verysubstantial difference between the water quality for the No Action alternative (approximately 30 ng/L
ES-22 400264 TAMS
at TDD and Schuylerville and 10 ng/L at Federal Dam) and the other four alternatives (approximately 5ng/L at TED and Schuylerville and 1.7 ng/L at Federal Dam).
Because there is no active remedial action associated with the sediments for the No Action andMNA alternatives, action-specific and location-specific ARARs do not apply. The three active remedialalternatives will comply with action-specific ARARs (e.g., CWA Sections 401 and 404; TSCA; Section3004 of RCRA; Section 10 of the Rivers and Harbors Act; New York State ECL Article 3, Title 3, andArticle 27, Titles 7 and 9), and location-specific ARARs (e.g., Endangered Species Act; Fish andWildlife Coordination Act; Farmland Protection Policy Act; National Historic Preservation Act; andNew York State Freshwater Wetlands Law).
Long-Term Effectiveness and Permanence
The long-term effectiveness of an alternative is assessed through the following criteria: reductionin residual risk, adequacy of controls, and reliability of controls.
Reduction of Residual Risk
The No Action and MNA alternatives result in continuation of the degraded condition of surficialsediments and surface water quality of the Upper Hudson River for several decades (albeit graduallyreduced), especially in River Section 1, regardless of any reduction in the upstream water columnloadings. The long-term transport of PCBs over the Federal Dam and to the Lower Hudson River willcontinue indefinitely, although a substantial portion of this transport is due to the assumed upstreamboundary condition; i.e., the PCB load entering the Upper Hudson at Rogers Island. The Tri+ PCB loadover the Federal Dam for the No Action alternative is approximately 131 kg (288 Ibs) in 2003,104 kg(229 Ibs) in 2011, and 63 kg (138 Ibs) in 2035. Similarly, for the MNA alternative, the Tri+ PCB loadover the Federal Dam is approximately 131 kg (288 Ibs) in 2003,72 kg (158 Ibs) in 2011, and 24 kg(52 Ibs) in 2035 In 2035, as a result of the separate source control NTCRA in the vicinity of the GEHudson Falls plant, the PCB load over Federal Dam is reduced by approximately 62 percent.
For the CAP-3/10/Select alternative, residual risk is reduced through capping 207 acres of PCB-contaminated sediments and removal of 1.73 million cubic yards of sediments containing approximately33,100 kg (73,000 Ibs) PCBs. For this alternative, the PCB load over the Federal Dam is approximately131 kg (288 Ibs) in 2003, 45 kg (98 Ibs) in 2011, and 20 kg (44 Ibs) in 2035. Soon after constructionin 2011, the CAP-3/10/Select alternative results in a 58 percent reduction in the Tri+ PCB load overFederal Dam compared to the No Action alternative and a 40 percent reduction in the PCB load overFederal Dam compared to the MNA alternative. After a longer period of time, in 2035, the CAP-3/10/Select alternative results in a 68 percent reduction in the Tri+ PCB load over Federal Damcompared to the No Action alternative and a 16 percent reduction in the load over Federal Damcompared to the MNA alternative..
The CAP-3/10/Select alternative does not completely eliminate long-term risks for target areasthat are capped. Sediments are removed in areas only to the degree necessary for cap installation and,in some areas, highly contaminated sediments may be left in place below the cap and backfill.Anthropogenic or natural processes (e.g., navigation accidents, severe storms, or longer-term changesin the depositional/erosional regime in a given location) may damage or erode and scour the capmaterials and redistribute PCB-contaminated capped sediments over wider areas of the Upper Hudson
ES-23 TAMS

River. Non-routine repair or replacement of large sections of the cap may have to be undertaken if abreach occurs in a highly contaminated area (e.g., Hot Spot 14 in River Section 1 or Hot Spot 28 in RiverSection 2) due to catastrophic events such as a major flood. Depositional buildup of sediments adjacentto the cap could shift currents over the cap creating the potential for erosion in an unexpected area.
The influence of regional aquifer systems on the hydrologic regime of Upper Hudson River hasnot been evaluated. Groundwater level fluctuations can result from a wide variety of hydrologicphenomena (e.g., groundwater recharge due to seasonal heavy rainfall, or bank-storage effect near theriver) and the subsequent inflow of groundwater may breach the cap in multiple areas and transportPCBs into the river. During periods of extremely low flow, sections of the cap could be exposed to theair and a different range of temperatures and other conditions unlike the submerged environment,resulting in freeze-thaw damage or desiccation cracking.
For the two removal alternatives, a total volume of contaminated sediment from 2.65 millioncubic yards (REM-3/10/Select) to 3.82 million cubic yards (REM-0/0/3), containing a mass of PCBsfrom 45,600 kg (100,550 Ibs) (REM-3/10/Select) to an estimated mass of more than 63,500 kg(154,700 Ibs) (REM-0/0/3) located in areas from 493 to 964 acres (REM-3/10/Select and REM-0/0/3,respectively) of the Upper Hudson River will be remediated. For the REM-3/10/Select alternative, theTri+ PCB load over the Federal Dam is 131 kg (288 Ibs) in 2003,42 kg (92 Ibs) in 2011, and 20 kg (44Ibs) in 2035. Soon after construction in 2011, the REM-3/10/Select alternative results in a 60 percentreduction in the Tri+ PCB load over Federal Dam compared to the No Action alternative and a 42percent reduction in the load over Federal Dam compared to the MNA alternative. After a longer periodof time, in 2035, the REM-3/10/Select alternative results in a 69 percent reduction in the Tri+ load overFederal Dam compared to the No Action alternative and a 17 percent reduction in the load over FederalDam compared to the MNA alternative.
For the REM-0/0/3 alternative, the Tri+ PCB load over the Federal Dam is approximately 131kg (288 Ibs) in 2003, 34 kg (75 Ibs) in 2011, and 18 kg (39 Ibs) in 2035. Soon after construction in2011, the REM-0/0/3 alternative results in a 67 percent reduction in the PCB load over Federal Damcompared to the No Action alternative and a 53 percent reduction in the Tri+ PCB load over FederalDam compared to the MNA alternative. After a longer period of time, in 2035, the REM-0/0/3alternative results in a 72 percent reduction in the Tri+ PCB load over Federal Dam compared to the NoAction alternative and a 25 percent reduction in the load over Federal Dam compared to the MNAalternative.
The three active remedial alternatives (CAP-3/10/Select, REM-3/10/Select, and REM-0/0/3) alsorely on natural attenuation processes such as burial by cleaner sediments, bioturbation, biodegradation,dispersion, dilution through advection and recharge, adsorption, and volatilization to further reduce theconcentration of any contaminants that remain after construction is completed. However, modelingresults predict that these three alternatives will not completely achieve, the PRGs for the site within themodeled period, although RAOs are met in part or in full, as described above. The limitation in meetingPRGs largely stems from the assumption of the upstream Tri+ PCB load at Fort Edward (Rogers Island)of 0.0256 kg/day in 2005. Greater achievement of the PRGs is estimated based on a 0 kg/dayassumption. Thus, remediating PCB-contaminated sediment in combination with control of theupstream load can be expected to achieve more PRGs, and to approach the PRGs faster, than eitherapproach alone.
400266ES-24 TAMS

Adequacy of Controls
The No Action and MNA alternatives do not provide for engineering controls on the riversediments. The MNA alternative assumes a separate source control NTCRA in the vicinity of the GEHudson Falls plant. The existing institutional controls, which rely on voluntary compliance, are not fullyadequate in reducing exposure to PCBs due to consumption of contaminated fish. In addition,institutional controls are inadequate for protection:of the environment (e.g., ecological receptors).
The CAP-3/10/Select alternative provides for dredging of some contaminated sediments in targetareas and placement of an engineered cap over the remaining target areas. Like the MNA alternative,this alternative also provides for institutional controls, such as the fish consumption advisories. TheREM-3/10/Select and REM-0/0/3 alternatives provide for removal of contaminated sediments in targetareas. These two alternatives also provide for institutional controls, such as the fish consumptionadvisories.
The planned post-construction fish, water column, and sediment monitoring program allows fortracking the natural recovery of the river after remediation is completed. It also provides data to confirmthe need to continue the existing fish consumption advisories and to evaluate the possibility of relaxingthe advisories.
Reliability of Controls
Sediment capping, dredging, backfilling and habitat replacement, and off-site disposal/ treatmentof removed sediments are, individually, all reliable and proven technologies. However, for the CAP-3/1 0/Select alternative, proper design, placement, and maintenance of the cap in perpetuity are requiredfor its effectiveness, continued performance, and reliability. This presents a challenge for the UpperHudson River since the capping concept requires maintenance of nearly 12 miles of long, narrow stripsof cap with a high perimeter-to-surface area ratio. A cap placed in a relatively sheltered embayment orcove would be easier to maintain, since it would not be subject to the significant variations in riverconditions typical of a river channel. The cap integrity monitoring and maintenance program plannedfor the CAP-3/10/Select alternative provides for as reasonably reliable maintenance as could beexpected, if consistently and thoroughly followed. The challenge lies in overcoming the natural humantendency to relax vigilance as time goes on, especially as the essential rationale for installation of thecap fades from public consciousness. The fish consumption advisories will continue to provide somemeasure of protection of human health until PCB concentrations in fish are reduced and the PRO forprotection of human health is attained. However, even the attainment of acceptable levels in the. fishmay serve to undermine vigilance in maintaining the cap in the future.
In general, the REM-3/10/Select and REM-0/0/3 alternatives are the most reliable, as there islittle or no longer-term maintenance or residual risk associated with the remedial work. Of the removal •alternatives, REM-0/0/3 is the most reliable, as it permanently removes the greatest amount of sediment £*(leaving the least amount of PCBs in the river). The CAP-3/10/Select alternative does not achieve the Qsame degree of reliability due to the potential for defects or damage to the cap, thereby reducing its *°effectiveness. This alternative would still require all of the sediment handling, processing, and disposal -4activities needed for the removal alternatives. The No Action alternative is the least reliable. Althoughthe MNA alternative is more reliable than the No Action alternative, it relies more heavily oninstitutional controls than do the active remedial alternatives to limit exposure to PCBs. Also, the fish
consumption advisories may be relaxed sooner under the active alternatives. Institutional controls donot address ecological receptors, and human health risk reduction relies on knowledge of and voluntarycompliance with the fish consumption advisories.
Reduction of Toxicity, Mobility, or Volume through Treatment
The No Action and MNA alternatives do not involve any containment or removal ofcontaminants from the Upper Hudson River sediments. Because the MNA alternative assumes theseparate source control NTCRA in the vicinity of the GE Hudson Falls plant, the upstream Tri+ PCBload to the water column is expected to be reduced from 0.16 kg/day to 0.0256 kg/day by January 1,2005. The No Action and MNA alternatives rely on natural attenuation processes such as burial bycleaner sediments, biodegradation, bioturbation, and dilution to reduce PCB concentrations in sedimentsand surface water. Biodegradation processes may convert some of the more highly chlorinated PCBcongeners (e.g., tetrachlorbiphenyls) to less chlorinated congeners (monochloro- and dichloro-biphenyls)and biphenyl. The degree to which dechlorination affects PCB toxicity remains uncertain and debatedwithin the scientific community. In any case, dechlorination is not expected to continue to extensivelymodify the PCB inventory over time since it appears to occur only within the first few years ofdeposition. Natural dilution of the contaminated sediments will also reduce the toxicity, but the overallvolume of contaminated sediments would increase as PCBs are contributed to the Upper Hudson fromupstream. Concentrations of PCBs in fish will respond slowly over time to decreases in concentrationsin sediments and surface water.
For the CAP-3/10/Select alternative, the mobility of the PCBs in capped areas (approximately207 acres) is reduced because these PCBs are sequestered under the bentonite cap. However, cappingdoes not satisfy the CERCLA statutory preference for treatment. In addition, there is no reduction in thetoxicity or volume of the PCBs under the cap. Under this alternative, the mass of PCBs and the volumeof contaminated sediments within the Upper Hudson River are permanently reduced becauseapproximately 1.73 million cubic yards of sediment, containing an estimated 33,100 kg (72,973 lbs)ofPCBs, are removed from the ecosystem. Because the CAP-3/10/Select alternative also assumes theseparate source control NTCRA in the vicinity of the GE Hudson Falls plant, the upstream Tri+ PCBload to the water column is expected to be reduced from 0.16 kg/day to 0.0256 kg/day by January 1,2005. Additional reduction of the water column loads will result from sediment remediation. Afterconstruction of the alternative is completed, natural attenuation processes will provide further, butslower, reductions in the toxicity of PCBs in the remaining sediments and surface water.
For the REM-3/ 10/Select and REM-0/0/3 alternatives, the mass of PCBs and volume ofcontaminated sediments in the Upper Hudson River are permanently reduced because sediment volumesfrom 2.65 to 3.82 million cubic yards (REM-3/10/Select and REM-0/0/3, respectively) containing amassof PCBs from 45,600 kg (100,550 Ibs) (REM-3/10/Select) to an estimated mass of greater than 63,500kg (139,993 Ibs) (REM-0/0/3) are removed from the ecosystem. Because these removal alternatives alsoassume the separate source control NTCRA in the vicinity of the GE Hudson Falls plant, the upstreamTri + PCB load to the water column is expected to be reduced from 0.16 kg/day to 0.0256 kg/day byJanuary 1,2005. Additional reduction of the water column loads will result from sediment remediation.Also, as for the CAP-3/10/Select alternative, natural attenuation processes will provide further, butslower, reductions in the toxicity of PCBs in the remaining sediments and surface water afterconstruction of the alternative is completed. .
ES-26 400268 TAMS

I In all three active remediation alternatives, for the mechanical dredging option, the sedimentsthat are removed undergo limited treatment (stabilization with Portland cement) prior to landfill disposal.
I For the hydraulic dredging option, the sediments that are removed are processed through hydrocyclones,I coagulation, sedimentation, and belt filter presses to separate them from the water. However, these
sediments do not undergo stabilization prior to landfill disposal. A different treatment process may be; employed for the beneficial use option. However, due to the large volume of sediments that would be
removed from the river under each of the active alternatives, none of the alternatives satisfies the -statutory preference for treatment as a principal element of the remedy (CERCLA Section 121(b)).
' Short-Term Effectiveness
|p The short-term effectiveness of each alternative is addressed through evaluation of the followingl>:" criteria: protection of the community during remedial actions, protection of workers during remedial
actions, potential adverse environmental impacts during construction, and time until remedial response) objectives are achieved.
Protection of the Community During Remedial Actionsj
No construction activities are associated with the remediation of sediments for the No Action and, MNA alternatives, so neither alternative increases the potential for direct contact with or ingestion and
/—-^ inhalation of PCBs from the surface water and sediments. The cancer risks and non-cancer healthhazards to humans and the adverse effects to ecological receptors due to the PCB-contaminated
[• sediments will persist throughout the short term. Due to the separate source control NTCRA in theI vicinity of the GE Hudson Falls plant, the PCB load to the water column is expected to be reduced from
0.16 kg/day to 0.0256 kg/day by January 1,2005. As a result, cancer risks and non-cancer health hazardsI to humans and adverse effects to ecological receptors for the MNA alternative are slightly lower thanI those under the No Action alternative in the short term. For the MNA alternative, the fish consumption
advisories will continue to be the only means for protecting human health. There are no such advisoriesI - in the No Action alternative.
Risks to ecological receptors and cancer risks and non-cancer health hazards to humans posedi by consumption of PCB-contaminated fish will be reduced more rapidly under the active alternatives
than under the No Action and MNA alternatives. The fish consumption advisories and restricted accessto portions of the river undergoing remediation provides protection from risks to human health for the
! local community in the short term.
Transfer facilities and treatment areas present potential short-term risks to the community.i Therefore, access to these areas will be restricted to authorized personnel. In addition, monitoring and
engineering controls will be employed to minimize short-term effects due to material processingr activities. Increased traffic will also present an incremental risk to the community. The potential for{. ; traffic accidents may increase marginally as additional vehicles are on the road. These effects are likely' : . . . . • J ifcl
to be minimal because most transportation of sediments for disposal will be accomplished by rail. In oj /""" addition to vehicular traffic, there will be increased river traffic. Work areas in the river will be isolated °I (access-restricted), with an adequate buffer zone so that pleasure craft and commercial shipping can °^
safely avoid such areas. Finally, the increased in-river barge traffic will be monitored and controlled to{ minimize, to the extent possible, adverse effects on the commercial or recreational use of the Upper[ Hudson River.
! ; ES-27 TAMS'
Protection of Workers During Remedial Actions
For the No Action alternative, occupational risks to persons performing the sampling activities(for the five-year reviews) will be unchanged from current levels. A slight increase in occupational riskmay be associated with the MNA alternative due to the greater degree of sampling involved in the river(and the separate source control NTCRA in the vicinity of the GE Hudson Falls plant). For the threeactive remediation alternatives (CAP-3/10/Select, REM-3/10/Select, and REM-0/0/3), potentialoccupational risks to site workers from direct contact, ingestion, and inhalation of PCBs from the surfacewater and sediments and routine physical hazards associated with construction work and working onwater are significantly higher than for the No Action and MNA alternatives. For these alternatives, aswell as the No Action and MNA alternatives, personnel will follow a site-specific health and safety planand OSHA health and safety procedures, and will wear the necessary personal protective equipment.
Potential Adverse Environmental Impacts during Construction
No construction activities associated with the river sediments are conducted for the No Actionand MNA alternatives. Neither continuation of the existing limited sampling activities for the No Actionalternative nor the increased monitoring program for the MNA alternative is anticipated to have anyadverse effect on the environment, beyond that already caused by the PCB contamination of thesediments in the Upper Hudson River.
For the three active remediation alternatives (CAP-3/10/Select, REM-3/10/Select, and REM-0/0/3), the release of PCBs from the contaminated sediments into the surface water during construction(dredging and cap placement), as well as the transport of PCBs over Federal Dam, will be controlled byoperational practices (e.g., control of sediment removal rates; use of enclosed dredge buckets; and useof sediment barriers). Although precautions to minimize resuspension will be taken, it is likely that therewill be a temporary increase of suspended PCB concentrations, and possibly in fish PCB body burdens.Studies have shown that such effects are controllable, small, and transient, and that longer termimprovement is seen (e.g., Fox River Demonstration Project, 2000; MDEQ, 1999).
Remedial activities may also result in temporary impacts to aquatic and wildlife habitat of theUpper Hudson. Backfilling and habitat replacement measures will be implemented to mitigate theseimpacts. A monitoring program will be established to verify the attainment of the habitat replacementobjectives. Although the degree of impact will be directly related to the area remediated and volumedredged, these differences among the alternatives are not considered to be substantial due to theirtransient nature and the mitigation measures that will be utilized.
As part of this evaluation, a semi-quantitative analysis of the possible increase in PCB loads andconcentrations due to sediment resuspension was performed for the regions downstream and outside ofthe target areas. These areas in fact represent the largest portion of the Upper Hudson within the siteboundaries. This calculation is intended to describe the mean increase in water column PCBconcentration over each dredging season in these areas.
Resuspension losses for the CAP-3/10/Select alternative apply only to the areas undergoingdredging. Areas undergoing capping only are assumed to yield minor additional resuspension. Sincethis alternative involves the least sediment removal of the three engineered alternatives, additional PCBloads are smallest. Only mechanical dredging, as represented by an enclosed bucket dredge, is
ES-28 400270 TAMS
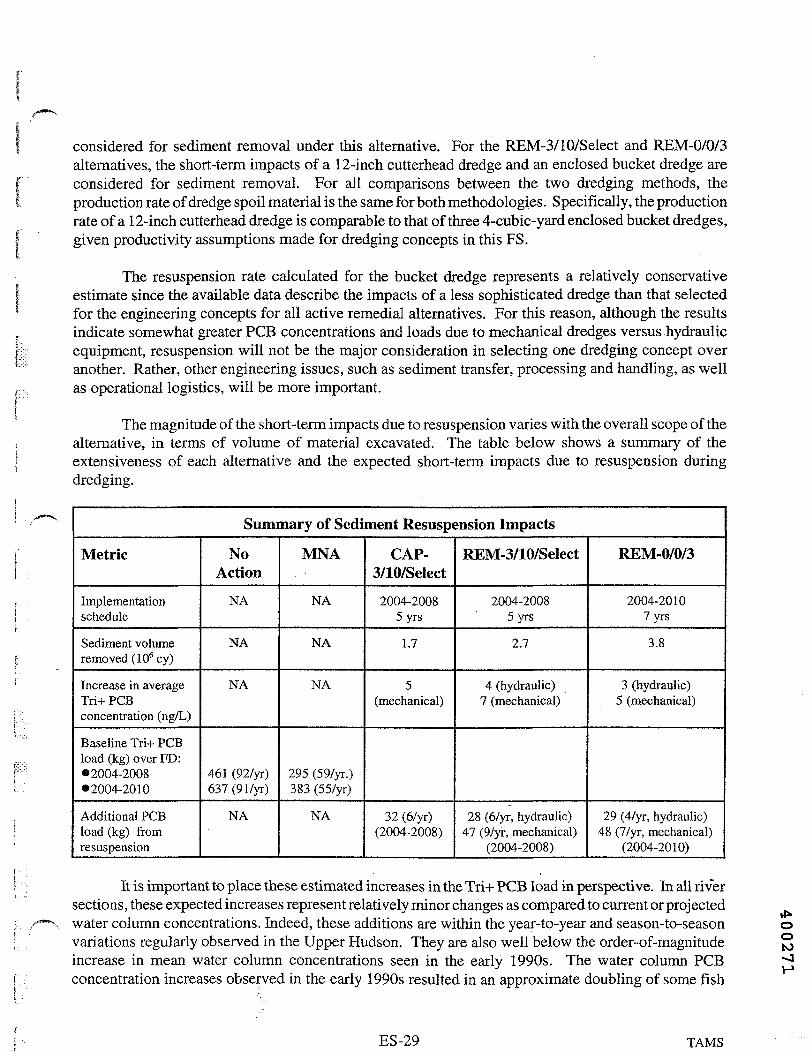
considered for sediment removal under this alternative. For the REM-3/10/Select and REM-0/0/3alternatives, the short-term impacts of a 12-inch cutterhead dredge and an enclosed bucket dredge areconsidered for sediment removal. For all comparisons between the two dredging methods, theproduction rate of dredge spoil material is the same for both methodologies. Specifically, the productionrate of a 12-inch cutterhead dredge is comparable to that of three 4-cubic-yard enclosed bucket dredges,given productivity assumptions made for dredging concepts in this FS.
The resuspension rate calculated for the bucket dredge represents a relatively conservativeestimate since the available data describe the impacts of a less sophisticated dredge than that selectedfor the engineering concepts for all active remedial alternatives. For this reason, although the resultsindicate somewhat greater PCB concentrations and loads due to mechanical dredges versus hydraulicequipment, resuspension will not be the major consideration in selecting one dredging concept overanother. Rather, other engineering issues, such as sediment transfer, processing and handling, as wellas operational logistics, will be more important.
The magnitude of the short-term impacts due to resuspension varies with the overall scope of thealternative, in terms of volume of material excavated. The table below shows a summary of theextensiveness of each alternative and the expected short-term impacts due to resuspension duringdredging.
Summary of Sediment Resuspension Impacts
Metric
Implementationschedule
Sediment volumeremoved (106cy)
Increase in averageTri+ PCBconcentration (ng/L)
Baseline Tri+ PCBload (kg) over FD:•2004-2008•2004-2010
Additional PCBload (kg) fromresuspension
NoAction
NA
NA
NA
461 (92/yr)637(91/yr)
NA
MNA
NA
NA
NA
295 (59/yr.)383 (55/yr)
NA
CAP-3/10/Select
2004-20085 yrs
1.7
5(mechanical)
32 (6/yr)(2004-2008)
REM-3/10/SeIect
2004-20085 yrs
2.7
4 (hydraulic)7 (mechanical)
28 (6/yr, hydraulic)47 (9/yr, mechanical)
(2004-2008)
REM-0/0/3
2004-20107 yrs
3.8
3 (hydraulic)5 (mechanical)
29 (4/yr, hydraulic)48 (7/yr, mechanical)
(2004-2010)
It is important to place these estimated increases in the Tri+ PCB load in perspective. In all riversections, these expected increases represent relatively minor changes as compared to current or projectedwater column concentrations. Indeed, these additions are within the year-to-year and season-to-seasonvariations regularly observed in the Upper Hudson. They are also well below the order-of-magnitudeincrease in mean water column concentrations seen in the early 1990s. The water column PCBconcentration increases observed in the early 1990s resulted in an approximate doubling of some fish
ooto-J
ES-29 TAMS

levels. Thus, by analogy, the PCB releases associated with dredging for any of the three activealternatives should have only a minor impact on fish body burdens in the Upper Hudson.
In addition to the examination of the increase in PCB concentration, the analysis also includedan estimate of the Tri+ PCB mass released by dredging operations. The additional release from any ofthe three active alternatives is less than the PCB release estimated from a single 100-year flood event(i.e., about 60 kg). As discussed in the RBMR, the 100-year flood was not expected to have a majorimpact on fish or river PCB levels, with associated increases not lasting more than one to two years.With the remedial releases spread out over five or seven years, the impact should be much smaller witha residual impact (after completion of construction) of even shorter duration than the 100-year flood.
Based on these analyses, it appears unlikely that the removal of sediments associated with anyof the three alternatives will yield substantially higher levels of PCB in the water or fish of the UpperHudson during dredging. For the REM-3/10/Select and REM-0/0/3 alternatives, water columnconcentrations may reach from 25 to 60 percent over those forecast using HUDTOX in River Sections2 and 3 but the higher levels are short-lived. Based on the similarity to the release associated with the100-year flood event, it is unlikely that the residual effects will last more than a few years after theconstruction is completed.
For the CAP-3/10/Select alternative there is a potential transient impact from the temporaryexposure of deeper, contaminated sediments during the time interval between excavation and capplacement. It may be possible to reduce impacts associated with exposure of deeper sediments bydetailed planning of all phases of the dredging and capping operations. However, the level ofcoordination between the different elements of this alternative will render the overall remedial programunder CAP-3/10/Select particularly complex. In addition, it will not be possible to fully avoid waterquality and related ecological impacts resulting from the temporary exposure of contaminated sedimentsthat are targeted for capping. Due to the transient and variable nature of this exposure, the impact cannotbe quantified. Nonetheless, barring a major flood event, it is unlikely to be greater than that originatingfrom sediment resuspension.
Time until Remedial Response Objectives Are Achieved
For all five alternatives, the risk-based PRO for protection of human health of 0.05 ppm PCBs(wet weight) in fish fillets is not met in any of the river sections in the short term. The targetconcentration of 0.2 ppm PCBs (one meal per month) in fish fillets is also not met in any river sectionin the short term for all five alternatives. The alternate target concentration of 0.4 ppm PCBs (one mealevery two months) in fish fillets is not met in River Sections 1 and 2 in the short term by any of the fivealternatives, but is met in River Section 3 in the year 2010 for the three active remediation alternativesand in the year 2011 for the MNA alternative. The 0.4 ppm PCBs target fish concentration is not metin the short term in River Section 3 by the No Action alternative.
The risk-based PRO for protection of the environment is a range from 0.3 to 0.03 mg/kg inwhole fish (this corresponds to a range from 0.13 to 0.013 mg/kg total PCBs in fish fillets), based on theLOAEL and NOAEL fish concentrations consumed by the river otter. The corresponding LOAEL andNOAEL whole fish target concentrations for the mink are 0.7 and 0.07 mg/kg PCBs. For the river otter,the PRGs are not met in River Sections 1, 2, and 3 in the short term for all five remedial alternatives.For the mink, the LOAEL target concentration is not met in River Section 1 in the short term, but is met
ES-30 400272 TAMS
in River Sections 2 and 3 prior to 20 1 0 for the three active remediation alternatives. For the mink, underthe MNA alternative, the LOAEL target concentration is not met in River Sections 1 and 2 in the shortterm, but is met in River Section 3 prior to 2010. For the mink, the NOAEL target concentration is notmet in River Sections 1, 2, and 3 in the short term for any of the five remedial alternatives.
Implementability
The implementability of the alternatives are compared through evaluation of the followingcriteria: technical feasibility, administrative feasibility and availability of services.
Technical Feasibility
Both the No Action and MNA alternatives are technically feasible.
Technical feasibility for the active remediation alternatives is discussed below in terms of themain components of the alternatives: dredging (mechanical and hydraulic), capping, transfer facilities,and rail transport and disposal.
Dredging Feasibility
Mechanical Dredging
Removal of targeted sediments solely by mechanical means has been evaluated for the CAP-3/10/Select, REM-3/10/Select, and REM-0/0/3 alternatives. Removal of targeted sediments by hydraulicdredging has also been evaluated for the REM-3/10/Select and REM-0/0/3 alternatives. With regard tomechanical dredging, the following are the principal distinctions between the capping and removalalternatives:
• Capping requires the least total dredging (about 35 percent less than REM-3/10/Select) and leastannual output (about 35 percent less than REM-3/10/Select);
• REM-0/0/3 requires the most removal work (about 43 percent more than REM-3/10/Select);• Annual removal rates for REM-3/10/S elect and REM-0/0/3 are approximately equal; and• REM-0/0/3 entails significantly more removal of sediments in shallow cuts (less than 2.0 feet)
than does REM-3/10/Select.
Technical feasibility includes evaluation of the capability of mechanical equipment toproductively remove as little as one or two feet of sediment. As a result of recent advances inmechanical systems, buckets are now available that can efficiently remove sediments in wide, shallowcuts. Therefore, it has been concluded that efficient removal of sediments, as proposed under each ofthe three active, alternatives, is technically feasible.
Feasibility was also evaluated in terms of the ability of mechanical dredging systems to maintain *•acceptably low rates of sediment resuspension. Based on an analysis of sediment resuspension during odredging operations, it is concluded that substantial water quality impacts are not expected to occur as ^a result of mechanical dredging operations. Thus, from the perspective of sediment resuspension, each w
alternative that involves mechanical dredging is considered feasible. ;.
ES-31 TAMS

Hydraulic Dredging
Hydraulic dredging has been evaluated for the REM-3/10/Select and REM-0/0/3 alternatives.Under these alternatives, most removal will be accomplished with a suction cutterhead dredge; dredgingin River Section 3 will be accomplished by means of mechanical equipment. The principal differencesbetween the use of hydraulic and mechanical systems, insofar as those systems have been evaluated inthis FS, are as follows:
• Only one hydraulic dredge is needed to remove targeted sediments in River Sections 1 and 2, asopposed to several mechanical dredges;
• Hydraulically dredged sediments are conveyed to the transfer facility by means of a slurrypipeline and not in barges;
• Hydraulically dredged sediments are dewatered and not stabilized; and• Hydraulic dredging entails operation of a substantial water treatment facility.
Hydraulic dredging is considered technically feasible for either active alternative to which it isbeing applied. One distinction between REM-0/0/3 and REM-3/10/Select is that REM-0/0/3 entailssubstantially more removal of sediments where contamination is limited to the upper 1.0 or 1.5 feet.Since it is not considered practical to dredge less than two feet of sediment with the selected hydraulictechnology, it will be necessary to dredge 90,000 cubic yards of non-targeted sediments should hydraulicdredging be selected under the REM-0/0/3 alternative.
As for the mechanical equipment discussed above, sediment resuspension rates and water qualityimpacts have also been estimated for hydraulic dredging. Based on available data, it has been calculatedthat hydraulic dredging operations will resuspend 40 percent less sediment than will mechanical removaloperations for the same production rate. This analysis, however, does not reflect a number of recentimprovements made to mechanical systems which were specifically formulated to reduce resuspensionand for which published data is not yet available. Therefore, the difference in performance between thetwo technologies (mechanical and hydraulic dredging) estimated, is not expected to be a determiningfactor in equipment selection and the two technologies are considered equally feasible from theperspective of sediment resuspension.
Capping Feasibility
Capping involves considerably less dredging than does the corresponding removal alternativesince principal reliance is being placed on an impervious cap to effectuate the remediation. Evaluationof the AquaBlok™ system is currently in progress at several sites and final feasibility of this technologymust await results of those studies. However, the materials of which AquaBlok™ is composed haveserved reliably in other, similar applications, and, therefore, there is reasonable expectation thatAquaBlok™ will ultimately prove to be technically feasible. The scheduling of in-river work (dredgingand capping) and overall program logistics will be somewhat more complex under the CAP-3/10/Selectalternative than under REM-3/10/Select or REM-0/0/3.
Transfer Facilities Feasibility
Each active alternative, as evaluated in this FS, requires that transfer facilities be established attwo locations: one facility would be located adjacent to River Section 1, and another would be in the Port
ES-32 400274 TAMS
of Albany area. Utilization of these sites is somewhat different under the capping and mechanicaldredging alternatives. About 35 percent less dredged material would be processed annually at thetransfer facilities if the capping alternative were selected. This suggests a substantially lower level ofactivity at the transfer facilities (and potentially smaller sites). However, capping also requires that largequantities of AquaBlok™ be manufactured and distributed throughout the river. Doing so maysubstantially increase the use of the transfer facility sites (or result in separate sites being set up fordistribution of AquaBlok™). Consequently, establishing transfer facilities at two locations for eitherthe capping or mechanical removal remedies is considered equally feasible.
Should hydraulic dredging be selected as the removal technology, establishing a transfer facilityadjacent to River Section 1 will be somewhat complicated by the need to operate relatively large slurryprocessing and water treatment systems. Several acres may be needed to house these systems and anyassociated equipment. Nonetheless, it is expected that a transfer/processing site can be assembled shouldhydraulic dredging be the selected dredging technology.
Rail Transport and Disposal Feasibility
The capping alternative would result in least stabilized dredged material being shipped to off-sitedisposal facilities. The two removal alternatives generate approximately the same quantity of stabilizeddredged material on an annual basis. Thus, the scale of rail operations for the REM-3/10/Select andREM-0/0/3 is approximately the same. However, REM-0/0/3 has a duration of seven years and REM-3/10/Select has a duration of five years. It is expected that railroads that serve the Upper Hudson areacan handle the additional traffic that would be generated by any of the alternatives.
Administrative Feasibility
In general, the principal administrative task under the MNA alternative is the institutionalcontrols, such as the fish consumption advisories. Fish consumption advisories and a "catch and releaseonly" fishing restriction are currently in place, so institutional controls are considered administrativelyfeasible.
For the active remediation alternatives (CAP-3/10/Select, REM-3/10/Select, and REM-0/0/3),it is expected that the two transfer facilities, constructed on land adjacent to the Upper Hudson River,will be considered "on-site" for the purposes of the permit exemption under CERCLA Section 121 (e),although any such facilities will comply with the substantive requirements of any otherwise necessarypermits. Since the requirements for these facilities are equivalent for all three alternatives, assumingmechanical dredging, there is little difference in the administrative feasibility among the three. Thehydraulic dredging option for the REM-3/10/Select and REM-0/0/3 alternatives will require somewhatgreater land area, but properties meeting the requirements appear to exist. Although procurement ofappropriate properties with reasonably close rail access presents certain marketplace and administrativechallenges, research conducted for this FS suggests that sufficient options exist to provide workablesolutions under a variety of possible scenarios.
£*O
It is assumed that review and concurrence on siting and design of these facilities by the State of °New York will be obtained in a reasonably expeditious manner. While it is possible that local -Jopposition to permanent dredged sediment disposal in the vicinity of the Upper Hudson River may m
translate to concerns regarding (and possible local administrative opposition to) a temporary northern
ES-33 T.AMS

transfer facility, it is likely that the tangible concerns can be addressed by proper design and engineeringcontrols. It is also expected that, for any of the active remedial alternatives, there will be substantialrestrictions on construction activity, including controls on the types of dredging and capping equipmentto be used, restrictions on the speed of operations, constraints on barge filling practices, and controls ontemporary storage of contaminated dredge spoils. Construction activities will also have to becoordinated with the Canal Corporation, which operates the Locks on the Upper Hudson River from Maythrough November.
The major difference among the three alternatives in regard to local administrative feasibilityrelates to the lengths of the respective construction programs. The CAP-3/10/Select and REM-3/10/Select alternatives are projected to require five years of construction each, while the REM-0/0/3alternative is estimated at seven years. Compensating economic benefits (expected to be roughlyproportionate to the overall cost of each alternative) to the labor force for both skilled and unskilledworkers, as well as local businesses such as lodging and food services and equipment and raw materialssuppliers, may mitigate potential local administrative opposition.
Since the concepts for these alternatives call for shipment of sediments to disposal by rail, localhighways will not be required to carry substantially increased heavy truck traffic, although some increasewill be experienced during mobilization activities and possibly for delivery of certain materials andcommodities. If beneficial use of dredged sediments proves a reality during design and implementation,some options may entail additional truck traffic, but the possibility exists for moving the material to thesouthern transfer facility by barge for loading onto trucks so as to minimize impacts on the secondary,local highway systems.
Availability of Services
For the No Action and MNA alternatives, the necessary services are available. For the activeremedies, the services and materials listed below appear to present the principal limitations.
Barges and Towboats
Since most commercial activity on the Upper Hudson has ceased, it is not likely that a sufficientnumber of barges and tow boats suitable for river work can be readily found in the project vicinity.Obtaining barges and towboats will necessitate early planning for procurement and may require thatsome equipment be fabricated for this program. The number of barges and towboats required formechanical dredging related to the REM-3/10/Select and REM-0/0/3 alternatives is approximately thesame since the volume of material being removed on an annual basis is approximately the same. With \regard to the CAP-3/10/Select alternative, the quantity of material being removed is approximately 35 | ; ; :percent less than that under the REM-3/10/Select alternative. Even though the capping operation willalso require barges and towboats, the amount of work required for capping and backfill under CAP- Q3/10/Select is about the same as the amount of work required for backfill alone under REM-3/10/Select. MConsequently, the difference in the number of barges and towboats required is not strictly proportionalto the difference in dredging volume between the two alternatives. It is estimated that the number of Kbarges and towboats will be about 20 to 25 percent less for CAP-3/10/Select.
Hydraulic dredging utilizes only three to four larger-capacity hopper barges (loaded to 1000tons) to transport dewatered sediments from the northern to the southern transfer facility, while
ES-34 400276 TAMS
mechanical dredging utilizes about four hopper barges and seven or eight lower-capacity deck barges(loaded to 200 tons) for transport of sediments directly to the northern and southern transfer facilities.Because hydraulic dredging will require fewer barges and towboats than a comparable mechanicaldredging program, there will be a substantially reduced requirement for procurement or fabrication ofbarges associated with hydraulic dredging.
Rail Cars
Availability of rail cars fluctuates with economic conditions. The number of cars required tosupport operations for any active alternative is directly proportional to the volume of material processedon an annual basis. Therefore, on an annual basis, CAP-3/10/Select will require approximately one-thirdfewer cars than either of the removal alternatives. Since the active remedial alternatives are relativelylong-term projects, and will require considerable pre-planning, it is expected that the needed rollingstock can be obtained for any of the active alternatives.
Cement
The amount of Portland cement required varies with the volume of sediment processed for analternative. Specifically, hydraulic dredging for either of the removal alternatives is projected to requireno stabilizing agent due to the use of mechanical dewatering. The CAP-3/10/Select alternative requiresabout one-third less stabilizing agent than either REM-3/10/Select or REM-0/0/3 on an annual basis.Availability of this commodity also fluctuates with economic conditions. However, since there areseveral potential, less costly substitutes for Portland cement, it is not likely that adverse conditions inthe Portland cement market would make project implementation infeasible, although, depending on theamount required, use of substitutes could conceivably be more costly due to the potentially highervolume to be disposed.
Cost
Capital. O&M and Present Worth Cost Estimates
The present worth costs for all five alternatives have been estimated for the year 2000 using a7 percent discount rate. The net present worth, capital costs, and the O&M costs for all five alternatives,including the beneficial use option, are presented in the table below.
ooto
ES-35 TAMS
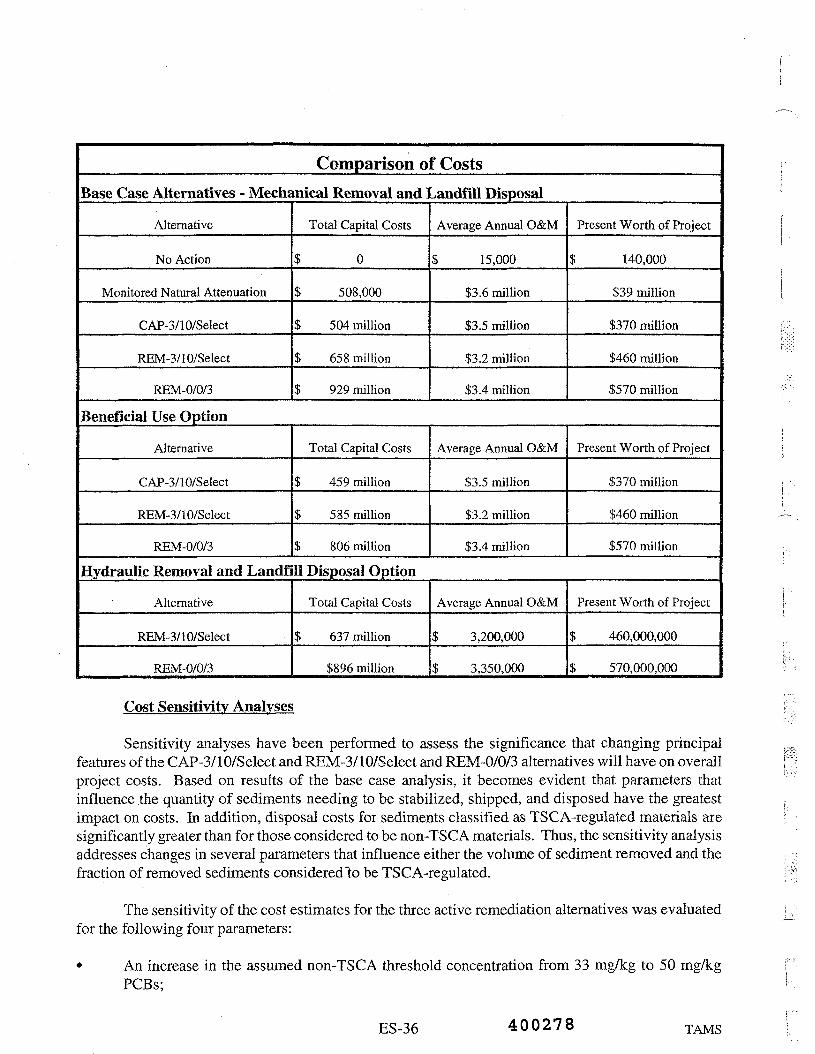
Comparison of CostsBase Case Alternatives - Mechanical Removal and Landfill Disposal
Alternative
No Action
Monitored Natural Attenuation
CAP-3/1 0/Select
REM-3/10/Select
REM-0/0/3
Total Capital Costs
$ 0
S 508,000
$ 504 million
$ 658 million
$ 929 million
Average Annual O&M
$ 15,000
$3.6 million
$3.5 million
$3.2 million
$3.4 million
Present Worth of Project
$ 140,000
$39 million
$370 million
$460 million
$570 million
Beneficial Use Option
Alternative
CAP-3/10/Select
REM-3/10/Select
REM-0/0/3
Total Capital Costs
$ 459 million
$ 585 million
$ 806 million
Average Annual O&M
$3.5 million
$3.2 million
$3.4 million
Present Worth of Project
$370 million
$460 million
$570 million
Hydraulic Removal and Landfill Disposal Option
Alternative
REM-3/10/Select
REM-0/0/3
Total Capital Costs
$ 637 million
$896 million
Average Annual O&M
$ 3,200,000
$ 3,350,000
Present Worth of Project
$ 460,000,000
$ 570,000,000
Cost Sensitivity Analyses
Sensitivity analyses have been performed to assess the significance that changing principalfeatures of the CAP-3/ 10/Select and REM-3/10/Select and REM-0/0/3 alternatives will have on overallproject costs. Based on results of the base case analysis, it becomes evident that parameters thatinfluence the quantity of sediments needing to be stabilized, shipped, and disposed have the greatestimpact on costs. In addition, disposal costs for sediments classified as TSCA-regulated materials aresignificantly greater than for those considered to be non-TSCA materials. Thus, the sensitivity analysisaddresses changes in several parameters that influence either the volume of sediment removed and thefraction of removed sediments considered "to be TSCA-regulated.
The sensitivity of the cost estimates for the three active remediation alternatives was evaluatedfor the following four parameters:
• An increase in the assumed non-TSCA threshold concentration from 33 mg/kg to 50 mg/kgPCBs;
ES-36 400278 TAMS
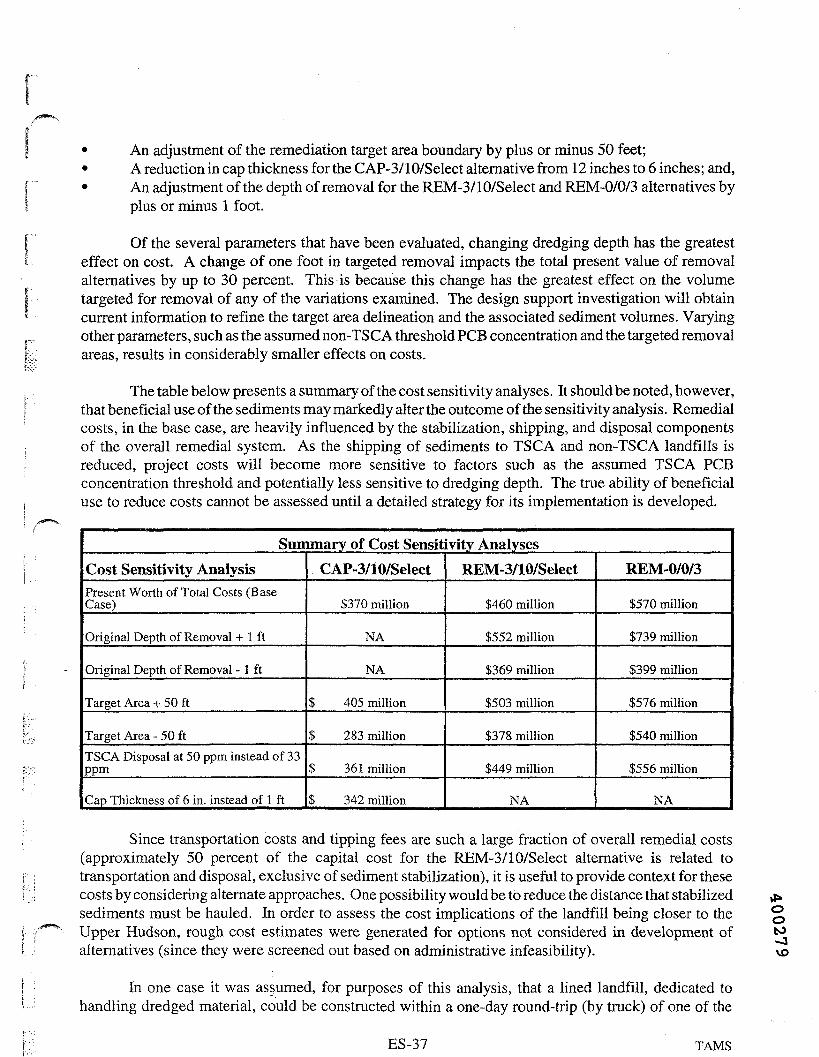
• An adjustment of the remediation target area boundary by plus or minus 50 feet;• A reduction in cap thickness for the CAP-3/10/Select alternative from 12 inches to 6 inches; and,• An adjustment of the depth of removal for the REM-3/10/Select and REM-0/0/3 alternatives by
plus or minus 1 foot.
Of the several parameters that have been evaluated, changing dredging depth has the greatesteffect on cost. A change of one foot in targeted removal impacts the total present value of removalalternatives by up to 30 percent. This is because this change has the greatest effect on the volumetargeted for removal of any of the variations examined. The design support investigation will obtaincurrent information to refine the target area delineation and the associated sediment volumes. Varyingother parameters, such as the assumed non-TSC A threshold PCB concentration and the targeted removalareas, results in considerably smaller effects on costs.
The table below presents a summary of the cost sensitivity analyses. It should be noted, however,that beneficial use of the sediments may markedly alter the outcome of the sensitivity analysis. Remedialcosts, in the base case, are heavily influenced by the stabilization, shipping, and disposal componentsof the overall remedial system. As the shipping of sediments to TSCA and non-TSCA landfills isreduced, project costs will become more sensitive to factors such as the assumed TSCA PCBconcentration threshold and potentially less sensitive to dredging depth. The true ability of beneficialuse to reduce costs cannot be assessed until a detailed strategy for its implementation is developed.
Summary of Cost Sensitivity AnalysesCost Sensitivity AnalysisPresent Worth of Total Costs (BaseCase)
Original Depth of Removal + 1 ft
Original Depth of Removal - 1 ft
Target Area + 50 ft
Target Area - 50 ftTSCA Disposal at 50 ppm instead of 33Ppm
Cap Thickness of 6 in. instead of 1 ft
CAP-3/10/Select
$370 million
NA
NA
$ 405 million
$ 283 million
$ 361 million
$ 342 million
REM-3/10/Select
$460 million
$552 million
$369 million
$503 million
$378 million
$449 million
NA
REM-0/0/3
$570 million
$739 million
$399 million
$576 million
$540 million
$556 million
NA
Since transportation costs and tipping fees are such a large fraction of overall remedial costs(approximately 50 percent of the capital cost for the REM-3/10/Select alternative is related totransportation and disposal, exclusive of sediment stabilization), it is useful to provide context for thesecosts by considering alternate approaches. One possibility would be to reduce the distance that stabilizedsediments must be hauled. In order to assess the cost implications of the landfill being closer to theUpper Hudson, rough cost estimates were generated for options not considered in development ofalternatives (since they were screened out based on administrative infeasibility).
In one case it was assumed, for purposes of this analysis, that a lined landfill, dedicated tohandling dredged material, could be constructed within a one-day round-trip (by truck) of one of the
OOto-J
ES-37 TAMS
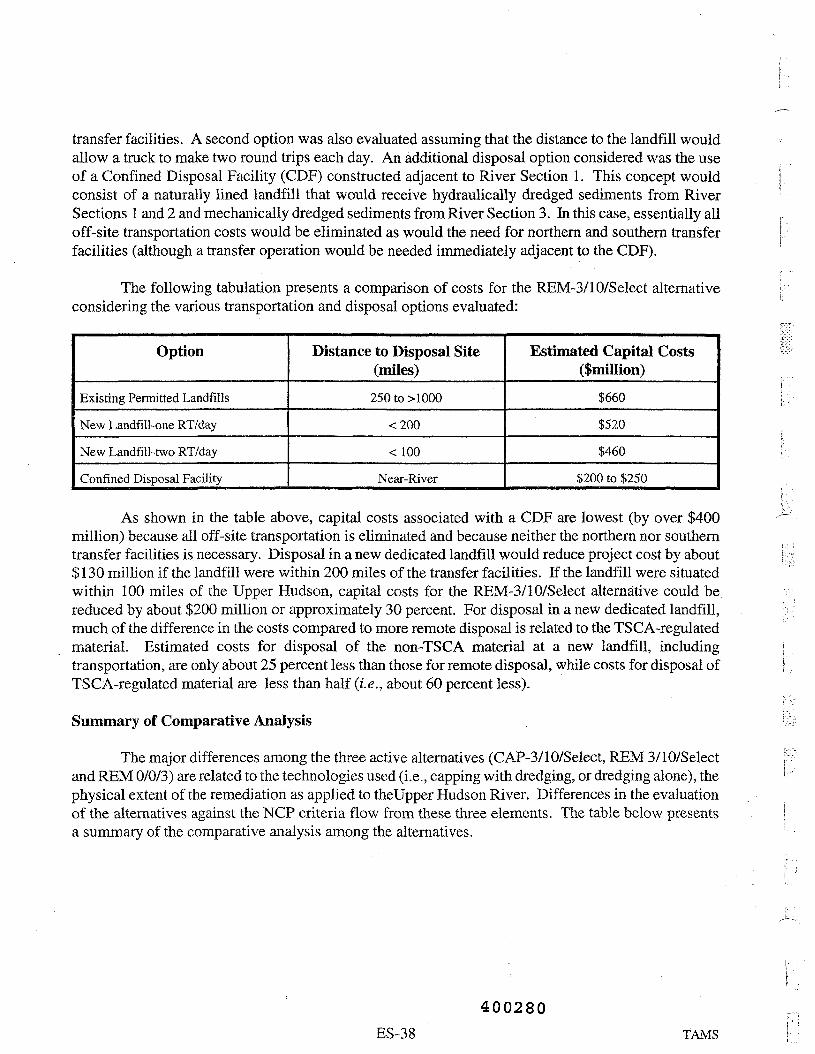
transfer facilities. A second option was also evaluated assuming that the distance to the landfill wouldallow a truck to make two round trips each day. An additional disposal option considered was the useof a Confined Disposal Facility (CDF) constructed adjacent to River Section 1. This concept wouldconsist of a naturally lined landfill that would receive hydraulically dredged sediments from RiverSections 1 and 2 and mechanically dredged sediments from River Section 3. In this case, essentially alloff-site transportation costs would be eliminated as would the need for northern and southern transferfacilities (although a transfer operation would be needed immediately adjacent to the CDF).
The following tabulation presents a comparison of costs for the REM-3/10/Select alternativeconsidering the various transportation and disposal options evaluated:
Option
Existing Permitted Landfills
New Landfill-one RT/day
New Landfill-two RT/day
Confined Disposal Facility
Distance to Disposal Site(miles)250 to > 1000
<200
<100
Near-River
Estimated Capital Costs($million)
$660
$520
$460
$200 to $250
As shown in the table above, capital costs associated with a CDF are lowest (by over $400million) because all off-site transportation is eliminated and because neither the northern nor southerntransfer facilities is necessary. Disposal in a new dedicated landfill would reduce project cost by about$ 130 million if the landfill were within 200 miles of the transfer facilities. If the landfill were situatedwithin 100 miles of the Upper Hudson, capital costs for the REM-3/10/Select alternative could be.reduced by about $200 million or approximately 30 percent. For disposal in a new dedicated landfill,much of the difference in the costs compared to more remote disposal is related to the TSCA-regulatedmaterial. Estimated costs for disposal of the non-TSCA material at a new landfill, includingtransportation, are only about 25 percent less than those for remote disposal, while costs for disposal ofTSCA-regulated material are less than half (i.e., about 60 percent less).
Summary of Comparative Analysis
The major differences among the three active alternatives (CAP-3/10/Select, REM 3/10/Selectand REM 0/0/3) are related to the technologies used (i.e., capping with dredging, or dredging alone), thephysical extent of the remediation as applied to theUpper Hudson River. Differences in the evaluationof the alternatives against the NCP criteria flow from these three elements. The table below presentsa summary of the comparative analysis among the alternatives.
400280ES-38 TAMS
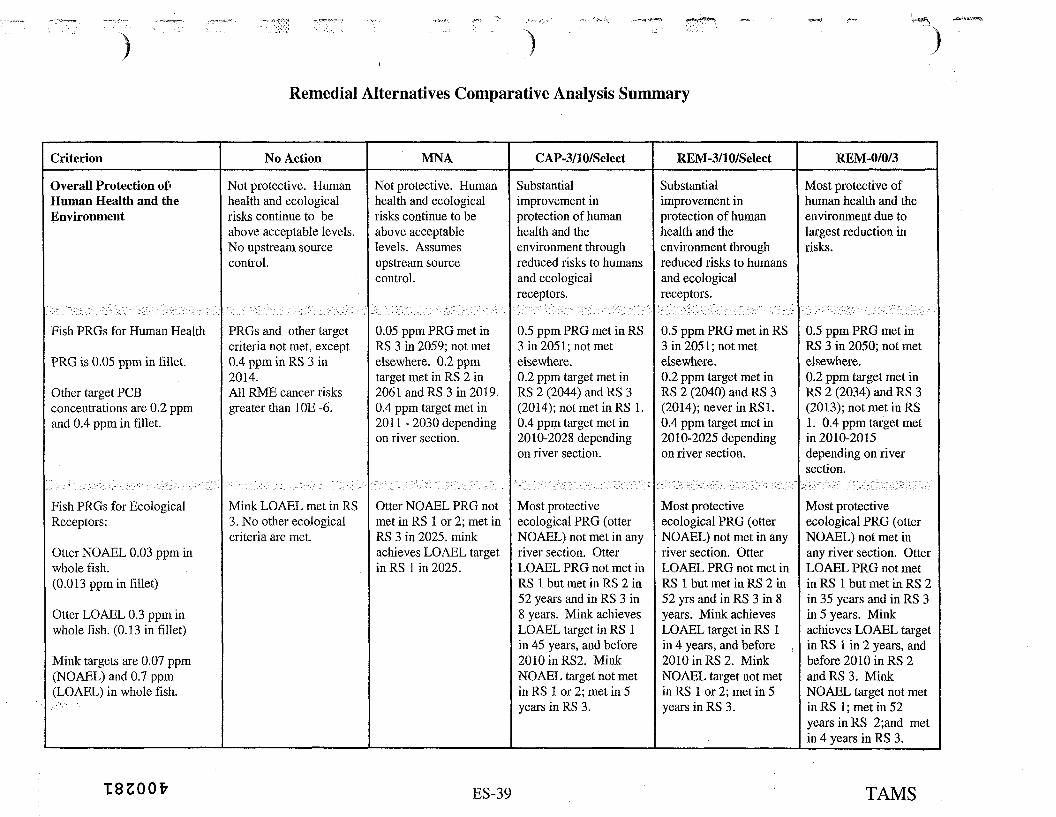
%
Remedial Alternatives Comparative Analysis Summary
Criterion
Overall Protection ofHuman Health and theEnvironment
Fish PRGs for Human Health
PRO is 0.05 ppm in fillet.
Other target PCSconcentrations are 0.2 ppmand 0.4 ppm in fillet.
^^:\r:-^;:::?:v^;^r:;;;^::--^:;-:::-.'-'it^
Fish PRGs for EcologicalReceptors:
Otter NOAEL 0.03 ppm inwhole fish.(0.0 13 ppm in fillet)
Otter LOAEL 0.3 ppm inwhole fish. (0.1 3 in fillet)
Mink targets are 0.07 ppm(NOAEL) and 0.7 ppm(LOAEL) in whole fish.
No Action
Not protective. Humanhealth and ecologicalrisks continue to beabove acceptable levels.No upstream sourcecontrol.
PRGs and other targetcriteria not met, except0.4 ppm in RS 3 in2014.All RME cancer risksgreater than 10E -6.
Mink LOAEL met in RS3. No other ecologicalcriteria are met.
MNA
Not protective. Humanhealth and ecologicalrisks continue to beabove acceptablelevels. Assumesupstream sourcecontrol.
.-'••.•:-.-\K-f ::::-•••'•-. • : -f. •-...•••:.•: -''•':. • .:~ *:•.''
0.05 ppm PRO met inRS 3 in 2059; not metelsewhere. 0.2 ppmtarget met in RS 2 in2061 and RS 3 in 2019.0.4 ppm target met in201 1-2030 dependingon river section.
Otter NOAEL PRO notmet in RS 1 or 2; met inRS 3 in 2025. minkachieves LOAEL targetin RS 1 in 2025.
CAP-3/10/Select
Substantialimprovement inprotection of humanhealth and theenvironment throughreduced risks to humansand ecologicalreceptors.-.' '•v^:':/>::V-:::':;;:r:':'>:; : :. '":':X- ' ^.; :": :
0.5 ppm PRO met in RS3 in 2051; not metelsewhere.0.2 ppm target met inRS 2 (2044) and RS 3(2014); not met in RS 1.0.4 ppm target met in2010-2028 dependingon river section.
••f^^::->-.:^^--^:\^ff;^:^:f-~:Most protectiveecological PRG (otterNOAEL) not met in anyriver section. OtterLOAEL PRG not met inRS 1 but met in RS 2 in52 years and in RS 3 in8 years. Mink achievesLOAEL target in RS 1in 45 years, and before2010inRS2. MinkNOAEL target not metin RS 1 or 2; met in 5years in RS 3.
REM-3/10/Select
Substantialimprovement inprotection of humanhealth and theenvironment throughreduced risks to humansand ecologicalreceptors.
0.5 ppm PRG met in RS3 in 2051; not metelsewhere.0.2 ppm target met inRS 2 (2040) and RS 3(2014); never in RS1.0.4 ppm target met in2010-2025 dependingon river section.
Most protectiveecological PRG (otterNOAEL) not met in anyriver section. OtterLOAEL PRG not met inRS 1 but met in RS 2 in52 yrs and in RS 3 in 8years. Mink achievesLOAEL target in RS 1in 4 years, and before2010 in RS 2. MinkNOAEL target not metin RS 1 or 2; met in 5years in RS 3.
REM-0/0/3
Most protective ofhuman health and theenvironment due tolargest reduction inrisks.
0.5 ppm PRG met inRS 3 in 2050; not metelsewhere.0.2 ppm target met inRS 2 (2034) and RS 3(2013); not met in RS1. 0.4 ppm target metin 2010-2015depending on riversection.
Most protectiveecological PRG (otterNOAEL) not met inany river section. OtterLOAEL PRG not metin RS 1 but met in RS 2in 35 years and in RS 3in 5 years. Minkachieves LOAEL targetin RS 1 in 2 years, andbefore 2010 in RS 2andRS3. MinkNOAEL target not metinRS 1; met in 52years in RS 2;and metin 4 years in RS 3.
T S Z O O f r ES-39 TAMS

Remedial Alternatives Comparative Analysis Summary
Criterion
Overall Protection ofHuman Health and theEnvironment (continued)
PCB transport at Federal Dam
Comph'ance with ARARs
(MCL - 0.5 mg/L;0.09 NYS std for drinkingwater(DW);
1 ng/L federal navigable std;
0.12 ng/L NY std for wildlife;
0.001 ng/L NY std for fishconsumption.
Long Term Effectivenessand Permanence
Based on:Reduction in residual risk,Adequacy of controls, andReliability of controls. '
No Action
PCB transport overFederal Dam projectedto be:13 1kg in 2003104 kg in 201163 kg in 2035
MCL and NYS std forDW protection are met.Other stds not met.Assumes constant 13ng/L upstream input;concentration at FederalDam is 10 ng/L in 2067.
Not effective.
MNA
PCB transport overFederal Dam projectedto be:13 1kg in 200372 kg in 201124 kg in 2035
MCL and NYS std forDW protection are met.Others are not met.
Cone at Federal Dam is1.7ng/lin2067.
Limited effectiveness.Risk reduction throughburial is not permanent.Surveys show fishconsumption advisoriesnot fully effective (14percent non-compliance).
CAP-3/10/Select
Projected PCB transportat Fed. Dam:13 1kg in 200343 kg in 201120 kg in 2035
MCL and NYS std forDW protection are met.Others are not met.
Cone at Federal Dam is1.7 ng/L in 2067.
Select removal iseffective/permanent.Capping requiresongoing monitoring andmaintenance.Effectiveness limited toareas and volumesactually remediated.
Volume removed: 1.7million cubic yards
REM-3/10/Select
Projected PCB transportat Fed.Dam131 kg in 200342 kg in 201120 kg in 2035
MCL and NYS std forDW protection are met.Others are not met.
Cone at Federal Dam is1.7 ng/L in 2067.
Removal is permanentand effective. Noongoing maintenancerequired. Monitoringconducted (as for allalternatives):
Volume removed: 2.7million cubic yards.
REM-0/0/3
Projected PCBtransport at Fed. Dam:13 1kg in 200331 kg in 201118 kg in 2035
MCL and NYS std forDW protection are met.Others are not met.
Cone at Federal Dam is1.7 ng/L in 2067.
Removal is permanentand effective andexceeds that underREM-3/lO/Select. Noongoing maintenancerequired. Monitoringconducted (as for allalternatives):
Volume removed: 3.8million cubic yards.
ZQZQQTrES-40 TAMS

Remedial Alternatives Comparative Analysis Summary
Criterion
Reduction of Toxicity,Mobility, or Volumethrough Treatment
Short-Term Effectiveness
Short-term impacts fromconstruction includetemporary loss of benthichabitat (habitat replacementwill mitigate); temporary lossof recreational and aestheticvalues. Degree of impactrelated to area capped andvolume removed. Current Tri+PCB load is 109 kg/yr.
No Action
No reduction throughtreatment.
Existing risks continue.No construction-relatedimpacts. Tri+PCB loadat Federal Dam is 461kg for 2004-2008 (92kg/yr); 637 kg for 2004-2010 (91 kg/yr).
MNA
No reduction throughtreatment. Somereduction throughnatural attenuation.Hudson Falls sourceassumed to be reducedfrom 0.16 to 0.0256kg/day.
NTCRA assumed toreduce upstream Tri+PCB load to 0.0256kg/day in 2005, thusreducing short-termrisks compared to NoAction. Noconstruction-relatedimpacts. Tri+PCB loadat Federal Dam is295 kg for 2004-2008(59 kg/yr); 383 kg for2004-2010 (55 kg/yr).
CAP-3/10/Select
Mobility of PCBs under207 acres of cap isreduced; 33, 100 kg ofPCBs are removedpermanently. GEHudson Falls sourceassumed to be reducedfrom 0.16 to 0.0256kg/day.
Assumes NTCRA.33% less dredging thanREM-3/10/Select &55% less than REM-0/0/3. Resuspensiongenerates 32 kg Tri+PCB load at FD for2004-2008 (6 kg/yr);-10% increase overMNA; within yr-to-yrfluctuation of NoAction.
REM-3/10/Select
46,500 kg of PCBs (in2.7 million cubic yardsof contaminatedsediment) removedpermanently. GEHudson Falls sourceassumed to be reducedfrom 0.16 to 0.0256kg/day.
Assumes NTCRA.-50% more dredgingthan CAP-3/10/Select &-30% less than REM-0/0/3. Resuspensiongenerates 28 kg (6kg/yr) (hydraulic) to 47kg (9 kg/yr)(mechanical) Tri+PCB load at FD in2004-2008; -10-16%increase over MNA;impact to river waterless than release from100-yr flood.
REM-0/0/3
63,500 kg of PCBs (in3.8 million cubic yardsof contaminatedsediment) are removedpermanently. GEHudson Falls sourceassumed to be reducedfrom 0.16 to 0.0256kg/day.
Assumes NTCRA.-45% more dredgingthan REM-3/10/Select& more than doubleCAP-3/10/Select.Resuspension generates29 kg (4 kg/yr)(hydraulic) to 48 kg (7kg/yr) (mechanical)Tri+ PCB load at FD in2004-2010; -10-13%increase over MNA;impact to river waterless than release from100-yr flood.
ooto00w
ES-41 TAMS
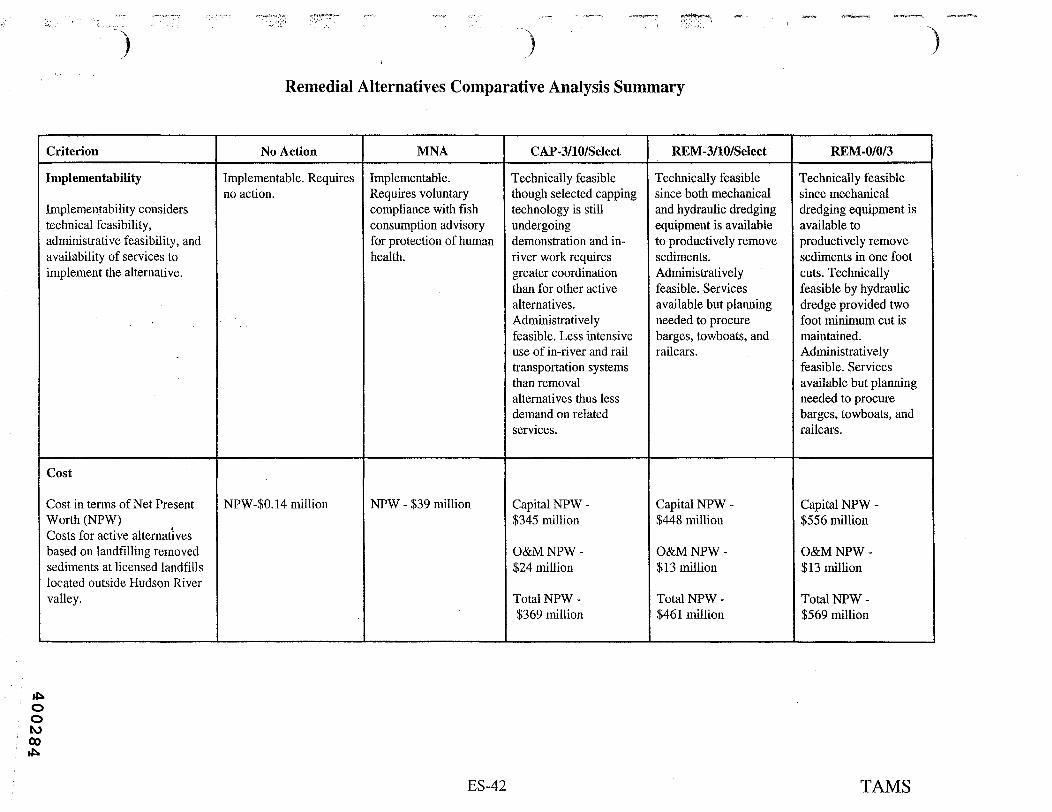
Remedial Alternatives Comparative Analysis Summary
Criterion
Implementability
Implementability considerstechnical feasibility,administrative feasibility, andavailability of services toimplement the alternative.
Cost
Cost in terms of Net PresentWorth (NPW)Costs for active alternativesbased on landfilling removedsediments at licensed landfillslocated outside Hudson Rivervalley.
No Action
Implementable. Requiresno action.
NPW-$0. 14 million
MNA
Implementable.Requires voluntarycompliance with fishconsumption advisoryfor protection of humanhealth.
NPW - $39 million
CAP-3/10/SeIect
Technically feasiblethough selected cappingtechnology is stillundergoingdemonstration and in-river work requiresgreater coordinationthan for other activealternatives.Administrativelyfeasible. Less intensiveuse of in-river and railtransportation systemsthan removalalternatives thus lessdemand on relatedservices.
Capital NPW -$345 million
O&M NPW -$24 million
Total NPW -$369 million
REM-3/10/Select
Technically feasiblesince both mechanicaland hydraulic dredgingequipment is availableto productively removesediments.Administrativelyfeasible. Servicesavailable but planningneeded to procurebarges, towboats, andrailcars.
Capital NPW -$448 million
O&M NPW -$13 million
Total NPW -$461 million
REM-0/0/3
Technically feasiblesince mechanicaldredging equipment isavailable toproductively removesediments in one footcuts. Technicallyfeasible by hydraulicdredge provided twofoot minimum cut ismaintained.Administrativelyfeasible. Servicesavailable but planningneeded to procurebarges, towboats, andrailcars.
Capital NPW -$556 million
O&M NPW -$13 million
Total NPW -$569 million
ooM00
ES-42 TAMS

09•O
400285
1. INTRODUCTION TO THE FEASIBILITY STUDY (FS)
The Hudson River PCBs Superfund Site extends nearly 200 river miles (320 km) from the
Fenimore Bridge in Hudson Falls (River Mile [RM] 197.3) to the Battery in New York City (RM0) at the tip of Manhattan Island (see Figure 1-1). This Feasibility Study (FS) is Phase 3 of the
Reassessment Remedial Investigation/Feasibility Study (Reassessment RI/FS) that is beingconducted for the site by the United States Environmental Protection Agency (USEPA) to reassessthe Agency's 1984 interim No Action decision concerning polychlorinated biphenyls (PCBs) in the
sediments of the Upper Hudson River. The FS, prepared in accordance with USEPA's Guidance
for Conducting Remedial Investigations and Feasibility Studies Under CERCLA, Interim Final,
October 1988 (OSWER Directive Number 9355.3-01) (hereafter as the RI/FS Guidance), the
Feasibility Study Scope of Work (FSSOW) (USEPA, 1998d), and the FSSOW Responsiveness
Summary (USEPA, June 1999k), contains remedial alternatives that have been evaluated by USEPA
as a basis for determining an appropriate course of action for those sediments in order to protect
human health and the environment. The area of the Upper Hudson River evaluated for active
remediation addressed in this Reassessment RI/FS is the river bed between the Fenimore Bridge at
Hudson Falls (just south of Glens Falls) and the Federal Dam at Troy. Plate 1 presents a general site
location map of the Upper Hudson River.
1.1 Purpose and Organization
1.1.1 Purpose: Overview of the Feasibility Study Process under the ComprehensiveEnvironmental Response, Compensation, and Liability Act of 1980, as Amended (CERCLA)
The purpose of an FS is to evaluate an appropriate range of remedial alternatives, including
No Action, that will reduce risks to human health and the environment at a Superfund site, based on
data, analyses, and other information generated during the RI/FS process. The terms "remedy" and
"remedial action" are defined in CERCLA, 42 US-C § 9601(24), as "those actions consistent with
permanent remedy taken instead of or in addition to removal actions in the event of a release or oto
threatened release of a hazardous substance into the environment, to prevent or minimize the release °
1-1 TAMS

of hazardous substances so that they do not migrate to cause substantial danger to present or future
public health or welfare or the environment."
Remedies selected by USEPA must be protective of human health and the environment, cost-
effective, and utilize permanent solutions and alternative treatment technologies or resource recovery
technologies to the maximum extent practicable. Furthermore, CERCLA requires that remedial
actions selected by USEPA comply with applicable or relevant and appropriate requirements
(ARARs), unless USEPA justifies a waiver from an ARAR that will not be met. In accordance with
CERCLA, USEPA will favor remedies that permanently and significantly reduce the volume,
toxicity, or mobility of hazardous substances through treatment over remedial actions not involving
such treatment (42 USC § 9621(b)(l)).
The National Oil and Hazardous Substances Pollution Contingency Plan (commonly referred
to as the National Contingency Plan, or NCP), 40 CFR Part 300, contains USEPA's regulations for
implementing CERCLA. Section 300.430 of the NCP, in conjunction with the RI/FS Guidance, sets
forth the development and evaluation process for remedial alternatives. This process is represented
in a flow chart in Figure 1-2 and consists of the following steps:
• Perform a remedial investigation to collect data necessary to characterize the site, including
risks to human health and the environment presented by hazardous substances at the site, for
the purpose of developing and evaluating effective remedial alternatives (40 CFR §
300.430(d));
• Establish remedial action objectives specifying contaminants and media of concern, potential
exposure pathways, and remedial goals. Remediation goals establish acceptable exposure
levels that are protective of human health and the environment (40 CFR § 300.430(e)(2));
• Identify and evaluate potentially suitable remedial technologies (40 CFR § 300.430(e)(2)(ii));
• Assemble suitable technologies into alternative remedial actions (40 CFR §
300.430(e)(2)(iii));
• Develop and screen potential remedial alternatives based on long-term and short-term
effectiveness, implementability, and cost (40 CFR § 300.430(e)(7)); and
1-2 400287 TAMS

• Conduct a detailed analysis of a limited number of alternatives that represent viableapproaches to remedial action after evaluation in the screening stage. The detailed analysisin the FS consists of an assessment of individual remedial alternatives against the first seven
of the nine evaluation criteria established in the NCP, and a comparative analysis that focuseson the relative performance of each alternative against those criteria. Detailed analysis with
respect to the final two criteria, state acceptance and community acceptance, is conductedby USEPA after release of the FS Report and issuance of the Proposed Plan (40 CFR §300.430(e)(9)).
1.1.2 Organization of the Feasibility Study Report
The components of this FS Report are identified in CERCLA regulations (40 CFR § 300.430)
and the RI/FS Guidance; however, the organization and format of this FS have been modified*—~N
somewhat as appropriate, both for clarity and to reflect the nature of the work performed.
This FS report, which is Phase 3 of the Reassessment RI/FS, is submitted in six books. Book
1 (this document) contains the text, the organization of which is described below. Book 2 contains
the tables and figures. Book 3 contains the plates. Books 4 through 6 contain the appendices, which
provide detailed information that supports the text.
The text (Book 1) is organized into nine chapters.
• Chapter 1 (this chapter) provides introductory and background material, and summarizes
what has been learned about the nature and extent of PCB contamination in the river, as well
as the current knowledge of PCB fate, transport, and bioaccumulation and risks to human
health and the environment posed by PCBs in the Hudson River. This is based on Phase 2
investigations and other available data. ^o>•—^ o
I «i J: * Chapter 2 presents the potential ARARs, which are the federal and state environmental laws oo
,.,,, and regulations that remedies must meet and may form the basis of. the preliminary
1-3 TAMS

remediation goals. Included in this chapter are other to-be-considered (TBC) criteria, which
are non-promulgated criteria, advisories, guidance, and proposed standards issued by federalor state governments. TBCs are not legally enforceable but may be considered in thedevelopment and evaluation of alternatives.
Chapter 3 presents the remedial action objectives (RAOs) for the site, general responseactions (GRAs) for achieving the RAOs, and the criteria for identifying areas of the river for
potential remediation.
Chapter 4 presents a review of technologies that may be utilized for the general response
actions identified in Chapter 3. The technologies are screened for applicability for use in
developing remedial alternatives specifically for the Hudson River PCBs site.
Chapter 5 presents the development and conceptual description of remedial alternatives.
Chapter 6 presents the screening of remedial alternatives for effectiveness, implementability,
and cost, resulting in a limited number of alternatives being retained for detailed evaluation.
Chapter 7 presents the alternative-specific human health and ecological risk assessments.
Chapter 8 presents detailed descriptions and analyses of features unique to each alternative
according to each of the seven criteria required to be evaluated in the FS Report.
Chapter 9 provides the comparative analysis of the remedial alternatives, along with a
discussion of the cost sensitivity analyses performed.
4002891-4 TAMS

1.2 Background Information
In December 1990, USEPA issued a Scope of Work (SOW) for reassessing the No Action
decision for the Hudson River PCBs site. The SOW indicated that the Reassessment RI/FS wouldbe conducted in three phases:
• Phase 1 - Interim Characterization and Evaluation;
• Phase 2 - Further Site Characterization and Analysis; and
• Phase 3 - Feasibility Study.
In August 1991, USEPA issued a Phase 1 Report that described the results of Phase 1 studies
(USEPA, 199 la). The Phase 1 Report contains a compilation of background material, a discussion
of findings, and a preliminary assessment of risks, and identifies data gaps and data needs. This
report served as the basis for the development of the Phase 2 investigations. The Phase 2 work
began in December 1991 and is now complete. A series of reports and responsiveness summaries
has been released as a result of the Phase 2 work. These reports are listed in Table 1-1. In
accordance with CERCLA 40 CFR § 300.430, this FS builds upon the previous investigations and
reports completed for the site.
1.2.1 Site Description
The Hudson River flows in a generally southerly direction approximately 315 miles from its
source at Lake Tear-of-the-Clouds on Mount Marcy in the Adirondack mountains to the Battery in
New York City. The Hudson River PCBs Superfund Site extends nearly 200 river miles (320 km)
from the Fenimore Bridge in Hudson Falls (RM 197.3) to the Battery in New York City (RM 0) at
the tip of Manhattan Island. The Superfund site traditionally has been divided into the Upper
Hudson River and Lower Hudson River, based on physical and chemical characteristics. The Upper
Hudson River extends from Fenimore Bridge in Hudson Falls to the Federal Dam at Green Islandfain Troy (RM 153.9), a distance of about 43 river miles. The Lower Hudson River extends from the
Federal Dam to the Battery (RM 153.9 to 0).
1-5 TAMS

Within the Upper Hudson River, the first 2.7 miles are not a major focus of the Reassessment
RI/FS because the PCB contamination in this area largely has been addressed. The area between the
Fenimore Bridge and the former Fort Edward Dam (RM 194.8), a distance of about 2.5 miles,consists primarily of rocky outcrops and little sediment, or areas of sediment that have already beenremediated (i.e., the remnant deposits, which are discussed in greater detail in Section 1.3.2 and
Appendix A). The area between the former Fort Edward Dam and the northern end of Rogers Island,
a distance of about 0.2 mile, contains shallow, fast-moving water and primarily coarse-grained
sediments that are believed to have minimal PCB inventory.
The portion of the Upper Hudson River being considered for sediment remediation extends
from the former Fort Edward Dam to Federal Dam. This portion of the river was divided into three
sections for evaluating remedial alternatives in the FS. These three river sections are shown on
Figure 1-2. River Section 1 consists of the Thompson Island (TI) Pool. This river section extends
about 6.3 miles from the former Fort Edward Dam (RM 194.8) to the TI Dam at RM 188.5. For
practical purposes, this section is considered to start at the northern end of Rogers Island at RM
194.6. River Section 2 extends from the TI Dam (RM 188.5) to the Northumberland Dam (for
convenience, sometimes referred to as Lock 5) near Schuylerville (RM 183.4), an extent of about
five river miles. River Section 3 extends from below the Northumberland Dam to the Federal Dam
at Troy (RM 153.9), an extent of nearly 29 river miles.
1.2.1.1 Hydrology
The Upper Hudson River is entirely freshwater and non-tidal. The mean annual flow of the
Hudson River at Fort Edward is approximately 4,800 cubic feet per second (cfs) (USGS, 2000).
Downstream of Fort Edward, the river is joined by several tributaries, the most significant of which
are the Batten Kill, the Fish Creek, and the Hoosic River. The combined total of the tributaries
significantly increases the flow of the Upper Hudson by the time it reaches Waterford, where the
mean annual flow of the river is approximately 8,400 cfs. At its confluence with the Mohawk River
(RM 156), the river flow reaches an annual average of 12,300 cfs (USGS, 2000).
1_6 400291 TAMS
There are eight dams with locks in the portion of the Upper Hudson River that is considered
j in this Reassessment RI/FS. The locks and dams form a series of pools in the river. The flow in the
Upper Hudson is controlled by these dams, and to a lesser degree, by wetlands and backwaters in the
I: vicinity of the river, which act as a buffer for high and low flow conditions. The flow in the Upper
Hudson is also controlled by several reservoirs above Glens Falls, the most significant of which is
I Great Sacandaga Lake (USEPA, 1984b). It is expected that minimum average daily flow at Fort
Edward will be maintained in the range of 1,500 cfs to 4,000 cfs, depending on conditions at the!•'••.[!£ Great Sacandaga Lake (Erie Boulevard Hydropower, 2000).
The mean gradient of the river between Fort Edward and the Federal Dam at Troy is about
three feet per mile. The gradient within each pool is much smaller than the mean gradient, with
major elevation drops between the pools at the dams. The width of the Upper Hudson above Lock
4 in Stillwater is approximately 400 feet. The Upper Hudson has an average depth of less than 8 feet
in the shoal areas, and approximately 18 feet in the channel, with a maximum depth of more than
45 feet in a section below TI Dam. The total surface area of the Upper Hudson is approximately
3,900 acres.
The Champlain Canal is coincident with portions of the Hudson River, extending from
Waterford (RM 158) on the Hudson to Whitehall at the southern end of Lake Champlain. The
Champlain Canal is 60 miles long, including 37 miles of canalized Hudson River from Waterford
to Fort Edward, and 23 miles of land-cut sections. The canal diverges from the river at Fort Edward
just below Lock 7 and proceeds in a northeasterly direction to Lake Champlain. Additional land cut
areas exist at Stillwater, Northumberland, and Fort Miller. The portion of the river from Waterford
to the Federal Dam is considered part of the Erie Canal.
1.2.1.2 River Bed Geology
Sediments of the Upper Hudson have been extensively investigated during Phase 2 of the °
Reassessment RI/FS, including a geophysical investigation consisting of side-scan sonar, bathymetric \oto
soundings, and subbottom profiling. Evaluation of sonar images and other data suggests that
1-7 TAMS

sediment distribution patterns are locally complex (USEPA, 1997a and 19985, and Appendix H).
Bedrock, cut away to form the Champlain Canal, is exposed in some areas, while lacustrine silts and
clays of glacial age are exposed in other areas. Coarser-grained sediments are often observed in thechannel while finer sediments are more common in shallow water. Wood chips are present in
surface sediments in many locations, as well as sediment mounds likely created by historic disposalof dredged spoils in the river. PCB hot spots previously defined by the New York State Departmentof Environmental Conservation (NYSDEC), as identified on Table 1-2, are generally coincident
with areas of fine-grained sediments, including silts and clays, where suspended matter with a high
affinity for PCBs is most likely to settle. (Channel maintenance dredging subsequent to NYSDEC's
delineation based on 1977/78 sampling has likely eliminated Hot Spots I through 4, located in the
channels around Rogers Island.)
Sediment texture classifications were also reported in the 1984 NYSDEC sediment survey
of the Thompson Island Pool (TI Pool) (Brown et al, 1988). These classifications, based on an
average of grab and core samples, indicated a composition of about 37 percent gravel, 26 percent
fine sands, 11 percent fine sand with wood chips, 9.4 percent clay, 5.4 percent coarse sand, and about
9 percent other types (including hybrids comprised of the listed types, such as "gravel with wood
chips" and "fine sand and gravel").
1.2.1.3 Wetlands and Floodplains
Both federal and state freshwater wetlands exist adjacent to the Upper Hudson River. The
100-year floodplains of the Upper Hudson and tributaries are available from Flood Insurance Rate
Maps prepared by the Federal Emergency Management Agency (FEMA). The width of the 100-year
floodplain ranges from approximately 400 to over 5,000 feet in the vicinity of the Upper Hudson
River. Areas adjacent to the Upper Hudson River include forested shoreline wetlands, transitional
uplands, and vegetated backwaters (emergent marsh and scrub-shrub wetlands).
L _ g 400293 TAMS
1.2.1.4 Archaeological, Historic, and Cultural Resources
The approximately 40-mile stretch of the Upper Hudson River that is the focus of this FS has
been an important a source of energy, natural resources, and transportation to the region from itspopulation by prehistoric peoples to the present time. During the thousands of years following thefinal northerly retreat of the Wisconsin Glacier approximately 14,000 years ago, the river and itsdrainages gradually transformed the landscape, providing a rich habitat and supporting a substantialprehistoric population.
The Hudson Valley has figured prominently in the historical and cultural development of the
United States. The valley was home to a league of five Native American nations from the mid- 1400s
to approximately 1600. Following Henry Hudson's exploration up the Hudson River in 1609,
looking for a quick passage to China for the Dutch East India Company, the area was first heavily
settled by the Dutch. From the 17th through 19th centuries, this region was gradually settled by
European immigrants who cleared more of the land, established towns, and built a variety of
industries along the river. Efforts to maximize the industrial use of the river led to the construction
of locks, dams, gates, channels, and related structures.
During the French and Indian War and the American Revolution, the Hudson River often
proved to be of vital logistical importance and was the site of numerous military engagements. The
Revolutionary War Battle of Saratoga fought along the Hudson River in 1777 was won by the
Americans and led to the French alliance and eventual victory and independence. The foundry at
West Point supplied munitions to the Union forces during the Civil War.
The 60-mile (96.5-km) Champlain Canal was completed in 1825. This canal linked the
Upper Hudson River at Troy, New York with the southern end of Lake Champlain at Whitehall, New
York. During the heyday of the Champlain Canal, between 1823 and the early 20th century,i^
thousands of canal boats passed between Lake Champlain and the Hudson River, transporting raw °to
materials and finished products. vo
1-9 TAMS
Recently, the Hudson River has been designated an American Heritage River because of its
important role in American history and culture. Through this program, which is an initiative to more
effectively use the federal government's many resources, environmental, economic, and social
concerns will be addressed in a plan that is designed by local communities. The American Heritage
Rivers initiative is intended to help communities revitalize their rivers and the banks along them•the streets, the historic buildings, the natural habitats, the parks—to help celebrate their history and
their heritage.
A site file search of the records of the New York Office of Parks, Recreation, and Historic
Preservation (OPRHP), the New York State Museum, and the National Register of Historic Places
was conducted in 1990 for a small portion of the area along the Hudson River PCBs site, in the
towns of Moreau and Fort Edward (Collamer & Associates, Inc., 1990). That search resulted in the
documentation of 20 previously identified cultural resources, including the following:
• Three prehistoric sites (one of which was a stratified, multi-component seasonal campsite);
• One site dating to the French and Indian War;
• One multi-component prehistoric site also containing French and Indian War and
Revolutionary War encampments;
• The Fort Edward Blockade site;
• One cultural resource without any available description;
• The Satterlee Lane Historic Deposits;
• Eight historic houses or former house sites;
• A site described as Ferry Landing;
• A mid-to late-19lh century mill site;
• The site of a ferry house and blockhouse; and
• The site of the Royal Blockhouse.
1_10. 400295 TAMS
1.2.1.5 Demographics and Land Use
Four counties (Albany, Washington, Rensselaer, and Saratoga) lie adjacent to the UpperHudson River between Troy (Federal Dam) and Hudson Falls. Saratoga and Washington Countieshave experienced growth between 1990 and 1999, 10.2 percent and 1.4 percent respectively, whileRensselaer and Albany Counties have experienced population declines of 1.9 percent and 0.3percent, respectively; total population of those counties, according to July 1999 estimates by the US
Department of Commerce, Bureau of the Census, is just under 700,000. Warren County, in which
Glens Falls is located, is just to the northwest of the Hudson River PCBs site.
In the area adjacent to the Upper Hudson River, forests and farmlands surround urban centersand historic villages. There are apple orchards and dairy farms, parks, nature preserves, and gardens.Portions of the agricultural land lie within New York State Agricultural Districts and include parcelsconsidered to be prime farmland. In addition to apples, other crops include corn and hay used forforage, and small quantities of cash crops such as oats and wheat. Industrial use is typically locatednear urban centers such as Albany and Troy and includes hydroelectric plants, manufacturing (brakelinings, paper products, clothing, garden equipment) and paper mills. In addition to agriculture andindustry, recreation and tourism are popular throughout the Hudson River Valley.
Boating is available on the river and on the Erie and Champlain Canals; marinas and dockscan be found along the waterway. Schaghticoke Canal Park sits at Lock 4 of the Champlain Canal,
Schuylerville has a large waterside town park, and other town parks lie along the river, including two
in Fort Edward. A marina and hotel complex has been proposed for the southern end of Rogers
Island. Area festivals include various county fairs such as those in Washington and Rensselaer
Counties.
1.2.1.6 Water Use
The cities of Waterford, Poughkeepsie, and Rhinebeck, as well as the Highland and PortEwen Water Districts, obtain their water supplies directly from the Hudson River. In addition, a °oto
voo\1-11 TAMS

water intake near Chelsea, which is north of Beacon, may be used to supplement New York City'swater supply during periods of drought. Waterfbrd is the only municipal water intake in the Upper
Hudson River. The treatability study at Waterfbrd Water Works, which was completed in 1990pursuant to USEPA's 1984 ROD, indicated that the treated water met standards applicable to thepublic water supplies at that time. It should be noted that the town of Halfmoon has proposed to usethe Upper Hudson River as a source of public water supply.
Industrial and commercial purposes such as cooling, manufacturing process, and fireprotection, and generation of hydroelectric and thermal power, are more common uses of HudsonRiver water, which is also used for domestic (watering lawns and gardens) and agricultural purposes
(irrigation). There are no records of water withdrawal for agricultural uses, as permits are notrequired for irrigation withdrawals.
1.2.1.7 Ecological Resources
The Hudson River provides diverse habitats for all trophic levels of the river's ecosystem.
Plants, plankton, aquatic invertebrates, fish, amphibians, reptiles, birds, and mammals use theHudson River for feeding, reproduction, and shelter. In addition to the aquatic communities
associated with the river, animals living in wetland, floodplain, and upland communities are also
dependent on the river.
During the field sampling effort for the Ecological Risk Assessment, a baseline vegetative
survey was performed at nine stations in the Upper Hudson River. A plant ecologist conducted thesurvey by identifying dominant submergent and emergent vegetation observed in intertidal, bank,
and upland areas, when possible. A list of species identified during the field investigation is
provided in Table B-6 of the Baseline Ecological Risk Assessment (ERA) (USEPA, 1999c).
Similar plants were present at the nine Upper Hudson River stations, including nearly all the-same dominant submergent plants (e.g., wild celery, water chestnut). The most prevalent aquaticplant noted was water chestnut (Trapa natans), which was abundant along nearly the entire river.
1-12 TAMS
400297
Water chestnut is an introduced species, whose rosettes of floating leaves crowd together in mats,choking freshwater shallows, limiting boat access, and shading out other submergent vegetation(Stanne et al., 1996). Some locations in the Upper Hudson (e.g., the western channel at GriffinIsland) were inaccessible due to the thick mats of water chestnut encountered during the ecological
sampling. However, these water chestnut beds may harbor large populations of invertebrates andyoung fish.
Emergent species (e.g., arrow arum, pickerel weed) were located at about half the stations
sampled. Generally, areas of the river with reduced flow velocity allow fine-grained sediments to
settle out, providing favorable conditions for plant growth. Vegetation observed on the river bank
varied, but a majority of locations included silver maple (Acer saccharinum) and white ash (Fraxinus
americana).
The dominant macroinvertebrates found in the 1992 ecological sampling were isopods,midges, worms, amphipods, and clams (USEPA, 2000q, Table 2-2). Vertebrates potentially foundin or along the Upper Hudson River, including fish, amphibians, reptiles, birds, and mammals, are
discussed in the Revised ERA (USEPA, 2000q).
1.2.2 Site History
During an approximate 30-year period ending in 1977, manufacturing processes at two GE
facilities, one in Fort Edward, New York and the other in Hudson Falls, New York, used PCBs in
the manufacture of electrical capacitors. PCBs from both facilities were discharged directly into the
Hudson River; estimates of the total quantity of PCBs discharged from the two plants into the river
from the 1940s to 1977 range from 209,000 to 1,330,000 pounds (95,000 to 603,000 kg) (USEPA,
199 la).
Many of the PCBs discharged to the river adhered to sediments and accumulated downstream
with the sediments as they settled in the impounded pool behind the former Fort Edward Dam (RM
194.8), as well as in other impoundments farther downstream. Because of its deteriorating condition, °to00
1-13 TAMS

the dam was removed by Niagara Mohawk Power Corporation in 1973. During subsequent springfloods, PCB-contaminated sediments were scoured and transported downstream. A substantialportion of these sediments was deposited in relatively quiescent areas of the river, i.e., lower energyareas where the finer-grained sediments with higher PCB concentrations were deposited. Theseareas were surveyed by NYSDEC in 1976 to 1978 and 1984, and are described as PCB hot spots.These NYSDEC-defmed hot spots, located between RM 194 at Rogers Island to Lock 2 at RM 163,are areas that typically had average total PCB concentrations of 50 parts per million (ppm) or greater.
Not all the PCB-contaminated sediments behind the former dam were transporteddownstream, however; five areas of contaminated sediments were exposed due to lowering of theriver water level when the Fort Edward Dam was removed. These five areas remained upstream of
the former dam and are known as the remnant deposits.
In 1974, the New York State Department of Transportation (NYSDOT) dredgedapproximately 250,000 cubic yards of sediment from the channels adjacent to Rogers Island fornavigational purposes. The dredged materials were disposed of in Special Area 13, which is located
along the west bank of the river just south of Rogers Island. Another 384,000 cubic yards of
sediment were removed from the east and west channels in 1974 and 1975 and disposed of in theMoreau Landfill, located on the west shore of the river opposite the southern end of Rogers Island
(just north of Special Area 13).
A 1975 legal action brought by NYSDEC against GE resulted in a $7 million program for
the investigation of PCBs and the development of methods to reduce of remove the threat of PCBcontamination. In 1975, the New York State Department of Health (NYSDOH) began to issuehealth advisories recommending that people limit consumption of fish from the Upper Hudson River.
In 1976, NYSDEC issued a ban on fishing in the Upper Hudson River from Hudson Falls to theFederal Dam at Troy, due to the potential risks from consumption of PCB-contaminated fish, anda ban on commercial fishing of striped bass, which migrate upriver into the Lower Hudson.NYSDEC lifted the ban against fishing in the Upper Hudson River and replaced it with a catch-and-
release fishing program in 1995. Since 1976, NYSDOH has recommended that people eat none of
1-14 TAMS
400299
• J .the fish in the Upper Hudson and that children under the age of 15 and women of child-bearing age
eat none of the fish in the river for the entire length of the Superfund site. In addition, the
commercial striped bass fishery in the Lower Hudson is still closed.
Although commercial uses of PCBs~generally ceased in 1977, PCBs from GE's Fort Edward
I and Hudson Falls plants continued to contaminate the Hudson River after that date, due primarilyto erosion of the contaminated remnant deposits, discharges of PCBs via bedrock fractures and other
|g releases from the GE Hudson Falls plant, as well as erosion from contaminated deposits above the
? water line near the GE Fort Edward plant outfall and discharges of contaminated water from the
I former Fort Edward plant outfall pipe (Tofflemire, 1984; NYSDEC, 1999f). The PCB-contaminated
F former outfall pipe and pipe bedding were removed from the riverbank near the Fort Edward plantI
' in 1996 (NYSDEC, 1999f).
\ •'!"^-~N. NYSDEC removed about 14,000 cubic yards of contaminated sediments from Remnant
| ; Deposit 3A in 1978. Those sediments were placed in a secure encapsulation site in Moreau, along! with some 215,000 cubic yards of sediment that had been dredged by NYSDOT to clear the
I : navigation channel east of Rogers Island. Unstable river banks of two sites were reinforced at that
time. Three sites were revegetated to prevent public contact with the sediments and to minimize
1 erosion and release of PCBs into the environment.
Iri: In September 1980, Congress passed an amendment to the Clean Water Act (CWA) under
Title 1, Section 116 (a) and (b), entitled "The Hudson River PCB Reclamation Demonstration
f$ Project." Under this legislation, funds up to $20 million could be authorized by the USEPA
Administrator for, among other things, the demonstration of technologies for removal of PCBs from
I , Hudson River sediments, provided that the Administrator determined that funds were not first
available under Section 116 or 311 of the CWA or from the then-proposed Comprehensive
I Environmental Response, Compensation, and Liability Act of 1980. The intended demonstration
was to clean up about 20 hot spots involving approximately 360,000 cubic yards of sediment.fy '
I', Congress authorized the USEPA to make grants to the NYSDEC in order to carry out the intent of
,.;, the amendment. :
{ ' • - . : < . - " '
t • .' '-.;i":v'
$""* 1-15 TAMS

In accordance with the National Environmental Policy Act (NEPA) and requirements in the
CWA, Section 116, USEPA issued a Draft and Supplemental Environmental Impact Statement (EIS)
in 1981, and a Final EIS in 1982. In December 1982, a NEPA ROD was signed in which the
USEPA Administrator determined that funds for addressing this problem were available under
CERCLA, and that the problem rated sufficiently high to be considered for inclusion on the National
Priorities List (NPL). The site was proposed for the NPL in 1983.
Under Superfund, a Remedial Action Master Plan (RAMP) was initiated to evaluate all
available information and assess feasible remedial options. In 1984, before the RAMP was
completed, the Hudson River PCBs site was listed on the NPL, and, as a result, became eligible for
CERCLA funding. The RAMP was subsequently changed to an FS, since the RAMP contained all
the necessary information to meet the statutory requirements of an FS. The FS was issued in April
of 1984.
USEPA issued a ROD for the site in September 1984 (USEPA, 1984a). The 1984 ROD does
not address PCB DNAPL seeps near the GE Hudson Falls plant, the existence of which was
unknown at the time. USEPA recognized that PCB contamination in the Upper Hudson River
sediments needed to be addressed, but selected an interim No Action remedy for the sediments
because, in the Agency's view, the reliability and effectiveness of available remedial technologies
at that time was uncertain. The ROD contained the following decisions:
• An interim No Action decision with regard to PCBs in the sediments of the Upper Hudson
River;
• In-place capping, containment, and monitoring of exposed "remnant deposit" sediments (in
the area of RM 195 to RM 196), and stabilization of the associated riverbanks and
re vegetation of the areas; and
• A detailed evaluation of the Waterford Water Works treatment facilities, including sampling
and analysis of treatment to see if an upgrade or alteration of the facilities was needed.
M6 400301 TAMS

USEPA notified GE of the remedy selected in the 1984 ROD and offered the company theopportunity to implement the selected remedy for the remnant deposits and Waterford drinking watersupply evaluation. GE declined USEPA' s offer. NYSDEC, with funding provided by USEPA,
conducted the evaluation at the Waterford Water Works. The study was released in 1990 and found
that PCB concentrations were below analytical detection limits after treatment and met standardsapplicable to public water supplies. In addition, NYSDEC prepared a design for the in-place
containment of the remnant deposits.
In March 1989, GE offered to assume responsibility for the implementation of the in-place
containment remedy for the remnant deposits. USEPA issued a September 27, 1989 Administrative
Order on Consent to GE requiring the company to prepare a remedial design report for the
construction of access roads to the remnant deposits, and to submit a design for the in-place
containment of the remnant deposits incorporating the NYSDEC-prepared design, plus any USEPA-
approved refinements to that design. USEPA also issued a September 27, 1989 Administrative
Order to GE requiring the company to construct and maintain the access roads to the remnant
deposits.
GE performed the in-place containment of the remnant deposits under a 1990 consent decree
with USEPA. The in-place capping of these remnant deposits included installation of a geosynthetic
clay cap and a two-foot layer of soil over the affected areas, followed by grading and revegetating
to minimize erosion. The river banks were stabilized with rock to prevent scouring. Cap
construction and the erection of gates to limit site access were completed in 1991.
• In May 1983, following USEPA's decision to address the contaminated sediments under
CERCLA and to discontinue funding the Demonstration Project under CWA § 1 16, New York State,
the Hudson River Sloop Clearwater, and other environmental groups, filed suit to compel the
USEPA to award the balance of the $20 million stipulated under Section 1 16 of the CWA so the
demonstration project could proceed. In May 1984, USEPA signed a settlement agreement wherebyo
the Agency would make a grant to New York State of approximately $18 million for dredging and oto
1-17 TAMS
disposal of PCBs if the state obtained an acceptable disposal site with all the necessary state and
federal permits within three years. This deadline was later extended.
NYSDEC had obtained a conditional approval for a disposal site ("Site 10") in Fort Edward
in 1982, although the approval was revoked by the New York State Supreme Court following a
lawsuit by Washington County Citizen Environmentalists Against Sludge Encapsulation ("CEASE")that challenged the Site 10 approval because, among other things, the proposed Site 10 violated local
zoning laws.
NYSDEC submitted a new application for an alternate disposal site (Site G) after the New
York Court of Appeals upheld the Supreme Court's decision regarding Site 10. In 1987, however,
coincident with hearings associated with the Site G application, the New York State legislature
amended the NYS Environmental Conservation Law to eliminate local zoning and land-use
regulations from consideration in the siting of a hazardous waste disposal facility. By this time,
other issues in CEASE's legal challenge were resolved, thus eliminating the rationale for revoking
Site 10.
The New York State Hazardous Waste Facility Siting Board rejected the use of Site G in part
because of its smaller size relative to Site 10. Also, Site 10 ranked more favorably than Site G in
NYSDEC's evaluation of proposed disposal sites against the criteria in 6 NYCRR Part 361. After
the Siting Board voted in favor of NYSDEC's proposed dredging project and use of Site 10, the
NYSDEC Commissioner directed the Project Sponsor Group (i.e., NYSDEC staff responsible for
the Demonstration Project) to conduct additional designs and reapply for the use of Site 10 for
containment of contaminated river sediments, as well as material to be excavated from the remnant
deposits and dredge spoil sites. NYSDEC now- favored a project that was of a larger scale than the
Demonstration Project, and which would remediate as much of the PCBs in the Upper Hudson River
as possible. NYSDEC prepared the necessary design documents for Site 10 and, on December 15,
1989, NYSDEC issued its Hudson River PCB Project Action Plan which, among other things, laid
out the potential scope of a comprehensive cleanup of PCB contamination in the Hudson River
system. Under the Project Action Plan, a total of approximately 3 million cubic yards containing
1-18 400303 TAMS

250,000 pounds of PCBs would be removed from the Upper Hudson River. The estimated cost forremoval and encapsulation only was $280 million. The plan indicated that costs associated with
decontamination technologies were uncertain but "could more than triple the total costs of theProject."
In a December 19, 1989 letter to NYSDEC, USEPA announced that it would reassess the1984 interim no-action decision for PCB-contaminated sediments in the Upper Hudson River.
USEPA's decision to conduct the Reassessment was based on the 1986 Superfund Amendments and
Reauthorization Act's (SARA's) requirement that USEPA conduct five-year reviews at sites where
hazardous substances were left in-place under a prior remedy, and USEPA's policy decision to
include such reviews at sites with pre-SARA RODs; recent advances in PCB treatment technologies;
and a request to conduct the Reassessment from NYSDEC. In its letter, USEPA informed NYSDEC
that, because NYSDEC had not met a December 15, 1988 deadline for obtaining the necessary State
permits, certificates and approvals for the project, and since NYSDEC's Demonstration Project had
been superseded by the larger remediation project outlined in the Project Action Plan, the
Demonstration Project under CWA § 116 should be closed out, after which USEPA would make the
remaining CWA § 116 funds available to the State for the construction of wastewater treatment
facilities. NYSDEC did not pursue the Project Action Plan following USEPA's decision to conduct
the Reassessment.
In September 1991, elevated PCB concentrations (nearly 100 times greater than those of the
previous month, and higher than any reported since the early 1980s) were again detected in Hudson
River water. GE later attributed the higher levels to the collapse of a wooden gate structure within
the abandoned Alien Mill located adjacent to the GE Hudson Falls capacitor plant (RM -197)
(O'Brien and Gere, 1993b). As reported by GE, the gate had kept water from flowing through a
tunnel cut into bedrock below the mill, which contained oil-phase PCBs that migrated there via
subsurface bedrock fractures.rf*ooU>
From 1993 to 1995, extensive PCB contamination was detected in water conduits within the oifc.mill, and approximately 45 tons of PCB-bearing oils and sediments were eventually removed
1-19 TAMS
(O'Brien and Gere, 1995). In 1994, GE documented the presence of PCB dense non-aqueous phase
liquid (DNAPL) seeps in a dewatered portion of the river bottom at Bakers Falls adjacent to theHudson Falls plant site. GE instituted a number of mitigation efforts that have resulted in a decline,
but not total cessation, of these seeps (O'Brien and Gere, 1995). GE is conducting remedial
activities at the GE Hudson Falls plant site under an Order on Consent between the NYSDEC and"
GE. A more in-depth discussion of external PCB sources, including the GE facilities, the remnant
deposits, and other sources in both the Upper and Lower Hudson River, is contained in the Data
Evaluation and Interpretation Report (USEPA, 1997a).
In order to reduce the upstream source of PCBs, USEPA has authorized the performance of
an Engineering Evaluation/Cost Analysis (EE/CA) to evaluate potential Non-Time Critical Removal
Actions (NTCRA) to address the discharge of PCBs into the river in the vicinity of GE's Hudson
Falls plant. It is assumed that as a result of this source control removal action, the upstream Tri+
PCB load at Fort Edward (Rogers Island) will be reduced from its average current value of 0.16
kg/day (equivalent to an average concentration of 13 ng/L) to 0.0256 kg/day (equivalent to an
average concentration of 2ng/L). GE has discussed with USEPA and NYSDEC a conceptual
approach to contain the release of PCB oil from the vicinity of the Hudson Falls facility. Assuming
that the conceptual approach proposed by GE, or a similarly effective system, is available to address
the Hudson Falls source, USEPA believes that a source control NTCRA can reasonably be
completed by January 1, 2005.
1.3 Nature and Extent of Contamination
The study of PCBs in the Upper Hudson River has occurred over a period of many years, and
continues to this day. As a result, the ending date of the data available has changed with each of the
reports issued as part of the Reassessment RI/FS, and it is possible that conditions in the river have
changed since some of the earlier reports were written (i.e., between 1991 and 1995). This section
summarizes information on the nature of the contamination (PCBs) and also presents available
evidence on the extent of PCB contamination in the Upper Hudson River, including sources of
PCBs, and the extent of PCB contamination in the three principal affected media: river water,
1-20 400305 TAMS

sediments, and fish. This information provides the starting point for the FS evaluation of future
conditions with and without remedial intervention. Data collection focused on the Upper Hudson
River, as this part of the river was the part under consideration for possible remediation. Data forthe FS are contained in Release 5.0 of the database for the Hudson River PCBs Reassessment RI/FS(October, 2000).
1.3.1 Nature of Contamination
The contaminants studied in the Reassessment RI/FS for the Hudson River PCBs site are,by definition, polychlorinated biphenyls (PCBs). PCBs consist of a group of 209 distinct chemical
compounds, known as congeners, that contain one to ten chlorine atoms attached to a biphenyl
molecule, with the generic formula of C12H(10_X)C1X, where x is an integer from one to ten.
Homologue groups are identified based on the number of chlorine atoms present, for example,
monochlorobiphenyls contain one chlorine atom, dichlorobiphenyls contain two chlorine atoms, and
trichlorobiphenyls contain three chlorine atoms.
Commercially manufactured PCBs consisted of complex mixtures of congeners, known
under various trade names. The PCBs utilized by GE were manufactured by Monsanto Corporation,
the company that manufactured 95 percent of the PCBs sold in the US, and marketed under the
general trade name "Aroclors." About 140 to 150 different congeners have been identified in the
various commercial Aroclors, with about 60 to 90 different congeners present in each individual
Aroclor.
1.3.1.1 Analysis of PCBs
Interpretation of historical trends in PCB concentrations may be enhanced by consideration
of the changes in analytical methods that have occurred over time. This provides greater consistency
in the data. For instance, the recent methods using capillary-column gas chromatography that yields £J
OPCB congener results, whereas older methods use chromatographic analyses based on packed- u>o
column quantitation that yielded Aroclor equivalents. Because an Aroclor is a complex mixture of °^
1-21 TAMS

many individual congeners, interpretation of the older packed-column data raises technical issues.
In addition, packed-column Aroclor quantitation methods have changed over time, and these changes
have implications for the interpretation of historical trends in the data and the development of
statistical relationships.
A commercial PCB mixture consists of many individual congeners, each with its own set of
chemical properties. Introduction of PCBs into the environment quickly changes the original
mixture and the relative proportions of the congeners. Processes such as weathering, dechlorination,and biological accumulation affect the individual congeners to varying degrees. Thus, analytical
Aroclor quantitations on environmental samples are not directly comparable to actual concentrations
of PCB congeners. Results of capillary column analyses do not have a direct interpretation as
"Aroclors;" however, total PCB concentration is readily estimated as the sum of individual congener
concentrations. Translation methods were developed to make the older data sets consistent with
congener-based quantitations; the development and implementation of the translation process are
discussed in the Revised Baseline Modeling Report (RBMR) (USEPA, 2000a) and the Low
Resolution Sediment Coring Report (LRC) (USEPA, 1998b). Tri+ PCBs, the sum of trichloro-
through decachlorobiphenyl concentrations, provides a common basis for use of the various data
sets.
PCBs have been used in a variety of substances, including dielectric fluids in capacitors and
transformers, printing inks, plasticizer in paints, carbonless paper, coolants, lubricants, adhesives,
dusting agents, and several other applications (Safe, 1990). Their chemical and physical stability and
electrical insulating properties account for this widespread usage, but make them more persistent in
the environment. As noted, Monsanto Coiporation produced more than 95 percent of the PCBs used
in the United States from 1930 to 1977, when PCB sales were generally prohibited under provisions
of the Toxic Substances Control Act (TSCA). The most widely marketed mixtures include Aroclors
1016, 1221, 1242, 1248, 1254, and 1260. Aroclor 1232, one of the suite of seven Aroclors
commonly quantified in USEPA methods, is a roughly 50:50 mixture of Aroclors 1221 and 1242.
At least two higher molecular weight Aroclors were also produced, Aroclor 1262 and Aroclor 1268,
but these were less common.
1-22 400307 TAMS

The first two digits in the Aroclor number represent the atomic mass of carbon (or the
presence of 12 carbon atoms) and the second half is the weight percent of chlorine in the mixture
(e.g., Aroclor 1242 is 42 percent chlorine by weight). The exception to this nomenclature is Aroclor
1016, which is 41 percent chlorine by weight, not 16 percent. The difference between Aroclor 1242
and Aroclor 1016 is in homologue composition rather than percent chlorine; 1016 contains a smaller
percentage of homologues with five or more chlorines (less than 0.5 percent, as compared with
approximately 6.5 percent in Aroclor 1242).
PCB Measurements
Estimates of the total PCB mass present in the sediments in 1984 are sensitive to the methods
and assumptions used to convert concentration data to mass units, as well as to any inaccuracies in
the methods used to estimate concentration and density.
The estimates of total PCB mass depend directly on the total PCB concentrations reported
by NYSDEC. This total is based on the sum of Aroclor quantitations (specifically Aroclors 1242,
1254, and 1260), which may not accurately reflect the actual sum of PCB congeners present,
particularly when environmental degradation has altered the congener composition of the original
Aroclors. This issue was addressed in the LRC (USEPA, 1998b). This discussion describes how
the 1984 measurements closely approximate the Tri+ sum of congeners and do not represent the
monochloro- and dichlorobiphenyl fractions.
The analytical protocol used by NYSDEC (Brown and Werner, 1984) called for most, but
not all, samples to be screened by gas chromatography/mass spectrometry (GC/MS) prior to deciding
whether to undertake a more expensive gas chromatography analysis with an electron capture
detector (GC/ECD). GC/ECD results were regarded as strictly preferable when both were available;
GC/MS estimates were substituted only when GC/ECD data were not available. -OOU)O00
1-23 . TAMS

Estimation of the Sediment PCB Inventory Based on 1984 Data
The 1984 NYSDEC PCB data are reported on a concentration basis as ppm (milligram per
kilogram [mg/kg] or microgram per gram [jag/g]) in sediment on a dry-weight basis. For mass
estimation, these concentrations must be converted by multiplying by the density. Summing mass
in the vertical dimension yields mass per unit area (MPA). Mass units are additive (unlikeconcentration) and appropriate for spatial analyses, such as kriging or polygonal declustering.
1.3.1.2 Chemical and Physical Properties of PCBs
PCBs are colorless or straw-colored and vary in consistency from liquid (for lower molecular
weight Aroclors such as 1221) to viscous liquids (e.g., Aroclor 1254) or waxy solids (Aroclor 1260).
PCBs typically have very low water solubility; the solubility generally decreases as chlorination
increases (Table 1-3). Differences in solubility of Aroclors are in turn a function of the congener and
homologue composition of each Aroclor, with lower molecular weight Aroclors (e.g., Aroclor 1221)
being dominated by less-chlorinated congeners (e.g., trichlorobiphenyls) than higher molecular
weight Aroclors (e.g., Aroclor 1260).
Tables 1-3 through 1-5 provide some details on PCB Aroclors. Table 1-3 provides
approximate Aroclor composition and properties on a homologue (level of chlorination) basis. Table
1-4 provides some physical constants for PCB homologue groups. Table 1-5 provides congener-
specific composition of seven of the common commercial Aroclors. The values in Table 1-5 were
derived from congener-specific analysis of Aroclor standards performed as part of the Reassessment
RI/FS. The data reported on the table are generally in good agreement with literature values on
congener composition of Aroclors; however, there is no literature consensus on the exact
composition of commercial Aroclors due to variability in manufacturing (Erickson, 1997).
1-24 400309 TAMS
1.3.1.3 Biological and Toxicological Properties of PCBs
PCBs are lipophilic, that is, they tend to accumulate in fatty tissue. The higher the numberof chlorine atoms, the lower the water solubility and the greater the tendency to accumulate in lipids,with the exception of the most highly chlorinated PCBs. The mechanism of action by which PCBs
may cause adverse effects once they enter a living organism is discussed below.
PCBs are classified as a B2 (probable human carcinogen) by USEPA (1996c). Earlier studies
found high, statistically significant incidences of liver tumors in rats ingesting Aroclor 1260.
Mechanistic studies are beginning to identify several congeners that have dioxin-like activity and
may promote tumors by different modes of action. PCBs are absorbed through ingestion, inhalation,
and dermal exposure, after which they are transported similarly through the circulation. This
provides a reasonable basis for expecting similar internal effects from different routes of
environmental exposure. Information on relative absorption rates suggests that differences in
toxicity across exposure routes are small. The human studies are being updated; currently available
evidence is "inadequate, but suggestive" (USEPA, 1996c).
PCBs have been shown to induce a variety of adverse effects in mammals including:
• Mortality, as seen by a decrease in survival;
• Cancer, such as liver hepatomas;
• Reproductive effects including estrus cycle effects, decreased conception, decreased litter
size, and decreased sperm motility;
• Developmental effects including decreased fetal weight and survival; decreased motor
function, learning and memory effects, and hyperactivity;
• Neurological effects including decreases in dopamine levels; and behavior changes such as
lethargy;
• Systemic damage including gastrointestinal, hematological, liver, and thyroid effects,
decrease in body weight gain; and
1-25 TAMS

• Immunological effects such as increased infections, decreased antibody concentrations and
response, and thymus effects.
The Revised ERA and Revised HHRA (USEPA, 2000q and USEPA, 2000p, respectively)
contain discussions of the toxicological effects of PCBs.
1.3.2 Sources of PCBs in the Upper Hudson River
Rogers Island (RM 194.6) forms the northern boundary to the TI Pool and defines the
upstream end of the HUDTOX modeling grid. Monitoring at Rogers Island is used to assess PCB
loads originating above the TI Pool and entering the model as an upstream forcing function. The
region above Rogers Island can be divided into two domains. The first of these domains represents
sources of PCBs entering the upstream boundary of the Hudson River PCBs site from above the
Fenimore Bridge in Hudson Falls (RM 197.3). The second domain represents sources adjacent to
the Upper Hudson River at the northern end of the site between Hudson Falls and Rogers Island.
There are two potential sources of PCBs upstream of the Fenimore Bridge: atmospheric
deposition and the Niagara-Mohawk Power Corporation (NiMo) site at Queensbury (located at about
RM 209). These sources are considered anthropogenic baseline for purposes of the FS. Since
specific information on PCB load resulting from atmospheric deposition is not available, the
remaining discussion in subsection 1.3.2.1 below on the upstream baseline focuses on the NiMo
Queensbury site. Additional information is provided in Appendix A. As discussed in the DEIR
(USEPA, 1997a) and the LRC Responsiveness Summary (USEPA, 1999b), the region above the GE
plant at Hudson Falls is a minor contributor to the total PCB load entering the TI Pool.
There are four major potential PCB sources adjacent to the Upper Hudson River between
Hudson Falls and Rogers Island, each at various stages of remediation." The four potentially
important sources are the GE Hudson Falls plant, the GE Fort Edward plant, Remnant Deposit 1,
and Remnant Deposits 2 through 5. The grouping of the remnant deposits is based on differences
in the degree of remediation completed. A brief summary of the history and the current conditions
1-26 400311 TAMS
is provided in subsections 1.3.2.2 through 1.3.2.5 below; these sources are discussed in greater detail
in Appendix A of this FS.
The discussion in this subsection and in those immediately following (1.3.3 through 1.3.5)is based on significant data collection efforts conducted between 1976 and 2000 by USEPA,NYSDEC, USGS, NOAA, and GE, as culled from the Hudson River PCBs Reassessment RFFS
project database. The latest version of the database is Release 5.0 (October, 2000). A summary of
the samples collected and analyses performed is provided in Table 1-6.
1.3.2.1 Upstream Baseline - Niagara-Mohawk Power Corporation Queensbury Site
Remedial activities were conducted at the NiMo Queensbury site, including the river, under
the direction of NYSDEC. Subsequently, contamination in fish in the vicinity of the site was
reduced. Some PCB contamination remains in the river near the site and is found in fish collected
near the site. Even though the current contribution of this site to the load at Hudson Falls is
unknown, its effect is small in comparison to the source conditions between Hudson Falls and
Rogers Island. Currently, the total baseline concentration for Tri+ PCBs from all sources above
Hudson Falls is in the range of 1 to 2 ng/L. However, NYSDEC is evaluating possible further
remediation at the site that may affect (i.e., reduce) the baseline PCB input into the Upper Hudson
River.
1.3.2.2 GE Hudson Falls Facility
This site represents one of the two original discharge locations for PCB contamination from
GE. The facility is no longer in operation, and the only activity on site is related to the remediation.
Since the cessation of manufacturing discharges, extensive evidence has been found, beginning in
1983, to show that this facility still continues to leak PCBs into the Hudson River. The largest
documented leakage event occurred during 1991 to 1993, apparently initiated by a partial failure *•
within the abandoned Alien Mill structure near Bakers Falls in 1991. PCB loads originating from u»H1
this structure were quite large during this period (e.g., 250 kg/month in September 1991) but have M
1-27 TAMS

since been greatly reduced. A significant amount of GE remedial work planned and conducted under
NYSDEC jurisdiction reduced loads significantly by 1996 (to about 10 ng/L on average) relative to (•
earlier years (about 100 ng/1 in 1991), although the load appears to have increased somewhat in the[
1998-99 time frame (to about 13 ng/L on average). f
Based on a review of the most recent data (GE, 1998-99), it is estimated that leakage from ',
this site contributes the vast majority of the roughly four to eight kg of PCBs per month that travel
past Rogers Island under current conditions. Congener patterns in PCB loads at Rogers Islandindicate the presence of freshly released Aroclors 1242, consistent with the observed leakage of
non-aqueous phase PCB-bearing oils from the bedrock beneath the GE facilities. Further efforts by
GE to reduce this leakage are ongoing.
In addition, USEPA has authorized the performance of an Engineering Evaluation/Cost
Analysis (EE/CA) to evaluate potential Non-Time Critical Removal Actions (NTCRAs) to address
the discharge of PCBs into the river in the vicinity of GE's Hudson Falls facility. It is assumed that
as a result of this separate source control removal action, the upstream Tri+ PCB load at Fort Edward
(Rogers Island) will be reduced from its average current value of 0.16 kg/day (equivalent to an
average concentration of 13 ng/L) to an average of 0.0256 kg/day (equivalent to an average
concentration of 2ng/L). GE has discussed with USEPA and NYSDEC a conceptual approach to
contain the release of PCB oil from the vicinity of the Hudson Falls facility. Assuming that the
conceptual approach proposed by GE, or a similarly effective system, is available to address the
Hudson Falls source, USEPA believes that a source control NTCRA can reasonably be completed
by January 1, 2005. If achievable, these added reductions of the input at Bakers Falls are likely to
have a significant impact on the overall attainable PCB concentrations in all media (water, sediment,
and fish) in the Upper Hudson after possible sediment remediation, much more so than the effect of
any reductions north of Hudson Falls; however, the actual extent to which the leakage at Bakers Falls
can be reduced and the time in which any such reductions can be achieved have yet to be established.
i'28 400313 TAMS
1.3.2.3 GE Fort Edward Facility
This facility is located slightly farther from the Hudson River than the Hudson Falls facility| and is underlain by a layer of silt and clay, as opposed to the bedrock at the Hudson Falls facility.
Thus, while historical discharges from the Fort Edward facility were undoubtedly large, since the| cessation of operation, discharges and leakages have been minor in comparison to those emanating
from the Hudson Falls facility. It is believed that the majority of post- 1977 contamination
f$ originating from this site was probably associated with bank erosion of contaminated soils and
sediments around the former discharge pipe. These materials are being addressed under a January! 2000 NYSDEC Record of Decision. It is presumed that this action will reduce the PCB loads into
<> the river at this location.\
I 1.3.2.4 Remnant Deposit 1l -
f Remnant Deposit 1 is the only one of the five remnant deposits not addressed by the remedial
' efforts conducted by GE in 1987 to 1991. As such, the sediments of this deposit have been available
(: : for subsequent resuspension and transport downstream. It is most likely that this occurs during largeIflow events when river velocities are sufficient to resuspend large quantities of sediment. Diffusive
exchange can also occur during lower flow conditions. While these processes undoubtedly occur
on some level, the congener pattern evidence suggests that these processes cannot be major
contributors to the annual load at Rogers Island. This is based on the assumption that this source
would yield a somewhat weathered congener pattern, which is not in evidence in the weekly
monitoring data at Rogers Island. Thus, like the source area associated with the GE Fort Edward
facility, this area may have been important historically but it is unlikely to contribute a significant
portion of the Rogers Island PCB load under the normal range of flow conditions. However, given
the fact that this area remains uncontrolled, the possibility remains that a large flow such as ai ' -t 100-year flood may release a substantial mass of PCBs from this area.
oow
1-29 TAMS

1.3.2.5 Remnant Deposits 2 through 5
Evidence for the remobilization of sediments from behind the former Fort Edward Dam,collectively referred to as the remnant deposits, is extensive. Data on water column loads as well
as the obstruction of the canal itself all point to the transport of these materials downstream.
However, since the completion of the engineered caps at Remnant Deposits 2 through 5 in 1991,movement of these materials has been greatly limited. Any contamination that originates from these
deposits would have to reach the river via groundwater. In other settings this may be important but
in this instance there is little evidence that this is occurring. Again relying on the congener patterns
of the Rogers Island sample, and incorporating the partition coefficient data collected by USEPA in
1993, there is little evidence to suggest a significant water-borne transport source of PCBs to the
river from these remnant deposits. The Rogers Island signal clearly matches that of the measured
leakages from the Hudson Falls facility, as shown in Appendix A, both of which are consistent with
a freshly released PCB mixture. Remedial efforts at this location have reduced a formerly important
source to a negligible one.
1.3.2.6 Summary of PCB Sources between Rogers Island and Hudson Falls
Of the four potential sources in the portion of the Hudson River between Hudson Falls and
Rogers Island, only the source at Bakers Falls appears to contribute significant amounts of the PCB
loads measured at Rogers Island. The monitoring data at Rogers Island clearly define the source as
one originating from "fresh" Aroclors, thus eliminating the other potential sources discussed. PCB
loads originating above Hudson Falls have also been recently reduced and are unlikely to contribute
more than a few percent of the annual load at Rogers Island. For perspective, the regions
downstream of Rogers Island contribute between four and five times as much PCB as does the region
upstream of Rogers Island.
1-30 400315 TAMS

1.3.3 PCBs in the Water Column
The dominant sources of PCB load to the water column of the Upper Hudson River can be
separated into two groups: (1) bedrock seeps and other discharges upstream of the former FortEdward Dam above Rogers Island; and (2) PCB mobilization from the extensive deposits ofcontaminated sediments stored in the TI Pool and, to a lesser extent, other downstream dam pools.
USGS monitoring of PCBs in the water of the Upper Hudson River began in 1977. Evaluation ofthese data (USEPA, 1997a) indicates that annual PCB loads at Stillwater (reflecting all upstream
sources) were approximately 3,000 kg/yr in 1977-79, and 1000 kg/yr in 1980-84, then declined to
about 200 kg/yr by 1991. From 1980 to 1991, the upstream loads at Rogers Island appear to have
declined from about 500 kg/yr to less than 200 kg/yr. The declining trend in loads at Stillwater
primarily reflects the washout of readily erodible PCB-contaminated sediments left by the dam
removal and shows a gradual increase in the relative importance of sources upstream of Rogers
Island.
More intensive monitoring of PCBs in water by GE began in April 1991 and has continued
to present. Data from the Rogers Island station (RM 194.2) clearly show the effect of the Alien Mill
gate structure failure, with elevated concentrations from late 1991 until 1995 (Figure 1-4). From
1996 on, concentrations at this station have been much lower, averaging 13 ng/L.
PCB concentrations at the TI Dam west (TID-West) station also show a response to the 1991
event, but less pronounced than at Rogers Island (Figure 1-5). Specifically, as the upstream source
was controlled, the TI Dam concentrations did not fall off as fast, reflecting the presence of a
significant PCB source in the contaminated sediments of River Section I. Concentrations at this
station from January 1996 through March 2000 average 90 ng/L and exhibit a strong seasonal
component that typically peaks in early summer. During the summer of 1998 (June-September) the
average concentration was 134 ng/L. In addition, five observations in excess of 300 ng/L were noted ^
during the winter of 1999-2000. owH1
01:
1-31 TAMS

The concentration data indicate significant gains in PCB load across the TI Pool. The
concentrations may be converted to load estimates by integration with the flow series, using a ratio
estimator (as described in the DEIR). In 1999,Tri+ PCB load is estimated to be approximately .93kg/day from the TED-West sampling station above TI Dam. Estimating load gain across the TI Pool
as the difference in loads at Rogers Island and TED-West yields an estimate for this time period ofa gain of 0.78 kg/day. During this same period, approximately 0.04 kg/day total Tri+ PCB loadderived from upstream of Bakers Falls, and about 0.10 kg/day from the Bakers Falls area. The recent
rate of apparent load gain across the TI Pool is consistent with the estimated load gain over the entire
period of record from 1991 to 1999 of 0.72 kg/day, indicating that PCB load continues to be
generated from the TI Pool at an approximately constant rate; the fact is that despite orders-of-
magnitude reduction of input at Bakers Falls, the load across the TI Pool has remained fairly
constant.
Samples collected at the TID-West station at the TI Dam are believed to be biased high
relative to PCB concentrations actually transported across the dam under some flow conditions. This
results from the incomplete mixing of near-shore and center channel water during the warmer
months of the year when the river flow is low. Near-shore waters generally have higher PCB
concentrations relative to the center channel, which is attributed to the release of PCBs from fine-
grained sediments. Center channel concentrations appear to be on the order of 50 to 80 percent of
the TID-West concentrations under these conditions. Even after adjusting for this potential bias, the
Tri+ load generated from the TI Pool was still on the order of 0.6 kg/day on an annual basis in 1999
(0.58 kg/day for 1991 to 1999), and represents the main source of PCB load present at the TI Dam.
In recent years, GE has also resumed monitoring at the Route 29 bridge in Schuylerville.
Average total PCB concentrations in water from the GE monitoring stations for the most recent data
(January 1999-March 2000) are summarized in Table 1-7. As noted in the DEIR and RBMR
(USEPA, 1997a and 2000a), concentrations below Schuylerville tend to reflect the same loads
present at Schuylerville, with a reduction in concentration associated with tributary dilution.
!_32. 400317 TAMS

The spatial trends in water column PCB concentrations can be determined from the Phase
2 transect sampling effort and the GE weekly monitoring results. The analysis of these data is
presented in the DEIR (USEPA, 1997a), the LRC Responsiveness Summary (USEPA, 1999b), and
the DEIR/LRC Response to Peer Review Comments (USEPA, 2000J). The sediments of River
Section 1 (the TI Pool) are the major source of PCBs to the water column throughout the year, with
the majority of the release occurring from May to October. Based on the level of source control at
the GE Hudson Falls facility documented in the GE/QEA Modeling Report (QEA, 1999) and in
subsequent monitoring data, the sediments of River Section 1 have clearly become the dominant
PCB source year-round in the post- 1996 period.
In addition, there is evidence of a sediment-based PCB source in River Section 2 between
the TI Dam and Schuylerville (i.e., below the TI Dam). Both the USEPA and GE data show an
additional but smaller PCB load gain between the dam and Schuylerville. This load is similar in
PCB composition to that produced by the sediments of River Section 1 . Below Schuylerville, there
is little evidence for additional significant PCB contributions, based on the lack of additional PCB
load from Schuylerville to Waterford.
In fact, the data suggest near-conservative transport behavior of the Tri+ PCB load from TI
Dam to Waterford (that is, the load at the TI Dam is equal to the load at Waterford), as discussed in
the DEIR/LRC Response to Peer Review Comments (USEPA, 2000J). During late spring and
summer conditions, the total PCB load is not conservative and declines downstream of the TI Dam.
However, the decline is largely confined to the less-chlorinated homologues, suggesting the
occurrence of another process that selectively affects these homologues. Gas exchange or aerobic
degradation are likely candidates for this loss.
1.3.4 PCBs in Sediment
Historically, the highest PCB sediment concentrations have been observed in cohesive ou>
sediments of River Section 1. Concentrations generally decrease with distance down river, away
1-33 . TAMS
from the source area, although areas of elevated sediment concentrations, initially identified by
NYSDEC as hot spots, are found in depositional areas throughout the Upper Hudson. I
River Section 1 (the TI Pool) has been the subject of several large sediment surveys, each of j
which attempted to map sediment PCS inventories and areas of concentrated contamination.
NYSDEC completed the first major survey of the TI Pool and the Upper Hudson between 1976 and \
1978. This survey was used to identify 40 areas of highly contaminated sediments (hot spots), 20 ,ijj
of which were located in the TI Pool. In 1984, NYSDEC completed a second, more intensive survey I
of the TI Pool. On the basis of this survey, NYSDEC (M. Brown et al., 1988 and NYSDEC, 1992) ^
identified areas or polygons of elevated sediment contamination. P;
Because of the scale and coverage of the 1984 NYSDEC survey, it has been considered a :
benchmark in attempting to assess and understand sediment PCB inventories in the Upper Hudson /
River. The 1984 sediment survey revealed a high degree of heterogeneity in the distribution of PCBs ,_
in the sediments of River Section 1 . Indeed, it was not unusual for samples taken only a few meters
apart horizontally to exhibit order-of-magnitude differences in PCB concentrations, and results along
some transects across the river ranged from nondetectable to greater than 1,000 mg/kg. On the other f
hand, it was also clear that there was spatial correlation in PCB concentrations, reflected in the
delineation of a number of PCB hot spots. \,
As a part of the Reassessment Phase 2 investigation, the low resolution sediment coring f:
program was intended to assess the applicability of the 1984 survey to recent PCB inventories. This
was accomplished by reoccupying selected 1984 sampling locations and collecting new cores to form f
a basis for comparison. The low resolution "sediment coring program provided an alternate means
of assessing these fluxes by using the PCB inventories found in the sediments to explain removal
and deposition processes. In River Section 1, 63 sites originally sampled in 1984 were selected and« I'.'
reoccupied in 1994, providing a ten-year period of integration. The premise for analysis was: "Has [.'
the sediment inventory of PCBs increased or decreased during the intervening ten years?" While the
premise itself was simple, there was concern that sediment heterogeneity, differing sedimentation :
rates, analytical technique differences, and other issues would confound the ability to discern true ,
1-34 TAMS

changes in the sediment inventory. Despite these concerns, the data showed that a significant lossof sediment inventory from selected hot spots had occurred between 1984 and 1994. Subsequent
resampling of a subset of these locations in 1998 by GE confirmed the sediment inventory losses.While the 1984 data are the primary basis for estimation of PCB inventory in River Section 1 dueto their unmatched sample density, changes in inventory since 1984 must also be taken into account.
1.3.4.1 Sediment PCB Inventory Estimates
An estimate of the 1984 sediment total PCB inventory in River Section 1 using geostatistical
analysis is presented in Chapter 4 of the DEIR (USEPA, 1997a). This estimate used data from the
1984 NYSDEC sediment samples but did not consider sediment texture. Sediment texture is
relevant because PCB concentrations are strongly correlated with the texture of shallow sediments;
higher concentrations of PCBs are found in areas of finer-grained, shallow sediments. A similar
degree of correlation was noted between total PCB concentration and the side-scan sonar signal
itself. The side-scan sonar results form the basis for the assignment of sediment texture, discussed
in more detail in the following paragraphs. LRC Figures 3-19 and 3-30 illustrate the strength of the
relationships among total PCBs, sediment texture, and side-scan sonar signal. The mean PCB
concentration varies nearly an order of magnitude in correlation with these properties.
The current estimate of the PCB inventory in River Section 1 based on the 1984 data is
presented in Appendix B of the Responsiveness Summary for the LRC (USEPA, 1999b). This
estimate takes into account the relationship between PCB mass and sediment texture. The purpose
of the analysis was to provide an estimate of the sediment PCB inventory while also providing
separate estimates for areas of fine-grained and coarse-grained sediments.
Sediment texture information is available in two forms: visual texture classification for the
sample points collected in 1984 and side-scan sonar sediment classification-for the bottom of RiverjJS^
Section 1, obtained in 1992. Subsection 4.1.1 of the DEIR contains a complete discussion of the oo
side-scan sonar analysis. In this analysis, the NYSDEC core and grab samples are separated into *£ocohesive and non-cohesive groups based on the 1984 visual texture classification. Non-cohesive
1-35 TAMS
sediments typically are coarse-grained, such as medium to coarse sand or gravel. Fine-grainedsediments, such as fine sands, silts, and clays, are generally considered cohesive sediments, and in
general, samples classified as predominantly clay, silt, or fine sand were classified as cohesivesediment. The remaining samples that are predominantly sand, coarse sand, or gravel are assigned
to the non-cohesive group. There are 503 cohesive sample locations (221 grabs, 282 cores) and 591non-cohesive sample locations (470 grabs, 121 cores).
In the Phase 2 analysis, Thiessen polygons were formed around all 1984 cohesive sample
points. This procedure was repeated for the non-cohesive sample points. Using the side-scan sonarsediment classifications, the Thiessen polygons are clipped so that the mass per unit area for the
cohesive sample points (based on visual texture classification) is applied only to cohesive areas of
the river (defined by side-scan sonar) and, similarly, the mass per unit area for the non-cohesive
sample points is applied only to the non-cohesive areas. For the side-scan sonar sediment
classification, cohesive areas are defined as fine- or finer-grained and non-cohesive areas are coarse-
or coarser-grained based on the original interpretation of the side-scan sonar images (Flood, 1993).
The means of calculating the mass per unit area is described in Section 3.5. The following quote is
a brief description of the Theissen polygon technique used in this analysis, as presented in the DEIR
(USEPA, 1997a).
A simple method for addressing the problem of irregular sample spacing (or
coverage) and clustering of data is a graphical technique known as polygonal
declustering (Isaaks and Srivastava, 1989). As with other approaches to estimating
total mass from spatial data, this relies on a weighted linear combination of the
sample values. Weighting is formed graphically, however, without any assumptions
regarding the statistical distribution of the data, and spatial correlation is not
explicitly modeled. In this method, the total area of interest is simply tiled into
polygons, one for each sample, with the area of the polygon representing the relative
weighting of that sample. The polygons, called Thiessen polygons or polygons of
influence, are drawn such that a polygon contains all the area that is closer to a given
sample point than to any other sample point. Polygonal declustering often
1-36 400321 TAMS

successfully corrects for irregular sample coverage. Because no complicated
numerical methods need be applied, polygonal declustering provides a useful rough
estimate of total mass to which the estimates obtained by other methods can be
compared.
The revised sediment total PCB mass estimate for River Section 1 based on this approach
is 15.4 metric tons, a minor revision to the estimate of 14.9 metric tons provided in the LRC
Responsiveness Summary Appendix B (USEPA, 1999b). The revision resulted from a quality
control review of the original analysis. Both values agreed closely with the kriging analysis result
presented in the DEER of 14.5 metric tons. The estimated trichloro- and higher homologue inventory
present in 1984 can be calculated by multiplying the mass of total PCBs by 0.944, as discussed in
Chapter 4 and Appendix E of the LRC. As discussed in the LRC, it is likely that the 1984
measurements most accurately represent the sum of the trichlorinated to decachlorinated biphenyls
(Tri+ PCBs). The estimate for the Tri+ inventory of River Section 1 is 14.5 metric tons (15.4 tons
x 0.944). As discussed in Appendix E of the LRC, the inventory of Tri+ PCBs is considered
relatively well known for 1984, while the total PCB inventory is less well known and, in fact, may
be underestimated by a large percentage.
1.3.4.2 Additional Sediment Inventory Studies
The subsequent low resolution sediment coring program conducted by USEPA (USEPA,
1998b) reexamined sediment inventories in several areas of River Section 1, specifically, a subset
of fine-grained sediment zones exhibiting elevated PCB concentrations. This study demonstrated
that the PCB inventories in these locations had been subject to a statistically significant degree of
loss. The results of this study indicated that sediment inventories within the fine-grained sediments
of River Section 1 and downstream areas were not inherently stable and were, in fact, subject to
remobilization. Although the mechanisms responsible for the remobilization are not well known, the
evidence from both Phase 2 of the Reassessment RI/FS and subsequent GE studies strongly indicatesw
declines in these inventories over time. toto
1-37 TAMS
A thorough summary of sediment conditions is difficult to obtain from direct monitoring
because the concentrations in sediments show a high degree of local variability, and intensive
sampling is difficult and expensive. Information on surface sediment concentrations in the early
1990s derived from the USEPA Phase 2 sampling program and the GE 1991 sampling effort is
provided in the DEIR, LRC, and RBMR. The samples were obtained between RM 186 and RM 194and were largely focused toward the fine-grained sediments. A limited amount of additional data wascollected by GE in 1998 and 1999, primarily upstream of RM 186, and focused on hot spot areas.
Surface sediment concentrations (0 to 1-, 2-, or 5-cm samples) are shown in Figure 1-6. The average
concentration of all GE surficial sediment samples (0-5 cm) collected during this period was 41
mg/kg, with a maximum of 640 mg/kg. A number of GE's 1998-99 samples were co-located with
USEPA 1994 samples and NYSDEC 1984 samples. A comparison of the co-located samples is
provided in Appendix D. Both the 1994 and 1998 samples indicate a substantive decrease in
sediment PCB inventory relative to 1984; however, no consistent decrease in surface concentrations
between 1994 and 1998-99 is evident in this comparison. In fact, 14 out of 25 co-located samples
showed an increase in concentration, suggesting that PCBs that had been buried are being uncovered
through scour/erosion or other processes in those areas. These results confirm that significant
concentrations of PCBs remain near surface in the Upper Hudson, at depths where they may be
available to biota.
A more integrated picture of recent sediment concentrations is provided by the HUDTOX
model output. As reported in the RBMR (USEPA, 2000a), HUDTOX uses the more
spatially-intensive sediment sampling from past decades as a foundation to project a best-estimate
of current conditions on a segment-averaged basis. Data generated for various matrices in the Upper
Hudson River have been: analyzed and reported both on an Aroclor basis and on a
congener/homologue basis. "As discussed in the RBMR, there are potential significant differences
in analytical methodologies, and these data are best combined through conversion to a common
quantitation basis. The quantitation basis chosen in the RBMR is the sum of trichloro- through
decachlorobiphenyls, or Tri+ PCBs. Reported Aroclor data are therefore converted to Tri+, using
the translation equations presented in the RBMR, and combined with homologue data for Tri+.
4003231-38 TAMS
These are separated into estimates for cohesive and non-cohesive sediments, as the two sedimenttypes show different concentrations as well as different spatial patterns in concentration.
1.3.5 PCBsinFish
PCB concentrations observed in fish are the result of exposure to the concentrations of PCBsin both water and surface sediment. Because biota integrate exposures over time, they provide a
time-averaged indicator of trends in exposure concentrations.
NYSDEC continues to collect and analyze fish tissue data from many locations in the Upper
Hudson River, and has provided results through 1999. Recent data include PCB analyses both
against Aroclor standards and on a congener/homologue basis; however, as discussed in subsection
1.3.1, the Aroclor data have been converted to a Tri+ PCBs. For example, 1998 Tri+PCB
concentrations of PCBs in the TIP averaged about 28.6 mg/kg in carp, and about 16.1 mg/kg for
largemouth bass. Average wet weight concentrations of Tri+ PCBs in fish for 1998 are presented
in Table 1-8 A.
Because PCBs tend to accumulate in fatty tissues, it is also useful to examine concentrations
on a lipid basis, as shown in Table 1-8B. These lipid-based Tri+ concentrations are generally similar
to those observed earlier in the 1990s and reported in Table 4-5 of the RBMR. Some data also exist
for 1999 for largemouth bass and are consistent, as shown in Figure 1-8.
Time trends of lipid-based Tri+ concentrations for two key species between Stillwater and
Coleville (RM 168.1 - 176) are shown in Figures 1-7 and 1-8. The Stillwater-Coleville portion of
the river was used for this analysis due to the extent and continuity of the sampling record there.
Concentrations in yearling pumpkinseed (Figure 1-4) are known to respond strongly to water column
exposure concentrations (RBMR), and the observed trend in pumpkinseed body burdens resembles
that seen in the water column, with a strong decline in the late 1970s and early 1980s, followed by
a more gradual decline and flattening out of the trend. Pumpkinseed results for 1992 appear to show
the impact of the Alien Mill event. In contrast, body burdens in largemouth bass are believed to be
1-39 TAMS
more closely tied to sediment pathways, and may also integrate over several years of exposure. The
largemouth bass results (Figure 1-8) do not show a clear response to the Alien Mill event, and appear
to have been nearly stable throughout the 1990s despite reduction in the upstream sources of PCBs.
Fish body burdens have shown to decline with river mile to about the same degree as the
changes in the sediment PCB concentration. This analysis is presented in Appendix K of the ERA
(USEPA, 1999c). Similarly, the average molecular weight of the PCB body burden in fish samples
increased with distance from the Upper Hudson River source areas. Differences in total PCB
concentration among species was shown to be significant based on their food source. However, on
a lipid basis, the interspecies differences disappeared and the largest changes in PCB concentration
coincided with river mile. Similarly, the molecular weight of the PCB body burdens in fish was
found to vary by river mile and not by feeding guild. These results indicate that PCB uptake and
biomagnification of individual congeners in fish is largely related to distance downstream of the GE
Hudson Falls and Fort Edward facilities and not to trophic level.
In addition, the reason for the increase in molecular weight with distance downstream is not
known but may be attributed to one or more several possible causes, including decreasing importance
of water column exposure for fish due to declining water column concentrations, particularly for
lighter congeners. Alternatively, water column concentrations may simply become higher in
molecular weight due to replenishment from less-dechlorinated Lower Hudson sediments, yielding
a higher molecular weight for water-based exposure. Lastly, metropolitan New York discharges
present higher molecular weight mixtures for fish exposure in the saline portion of the lower
Hudson.
1.4 Fate, Transport, and Bioaccumulation of PCBs in the Upper Hudson River
The factors controlling PCB loading, fate, transport, cycling between environmental
compartments, and bioaccumulation in the Upper Hudson River are presented primarily in the DEIR
(USEPA, 1997a), the accompanying LRC (USEPA, 1998b), the RBMR (USEPA, 2000a), and the
cited responsiveness summaries addressing public comment on the documents (USEPA, 1998a;
1-40 400325 JAMS
USEPA 1999b; USEPA, 2000b). This section summarizes some of the key findings regarding PCBdynamics that are of relevance to the FS.
1.4.1 Geochemical Investigations
The current understanding of PCB fate, transport, and bioaccumulation in the Upper HudsonRiver is compiled in several of USEPA's Phase 2 reports, specifically the DEIR (USEPA, 1997a),the LRC (USEPA, 1998b), and the RBMR (USEPA, 2000a). The geochemical investigations andinterpretations are contained in the DEIR and accompanying documents. Key conclusions of this
report are:
1. The area of the site upstream of the TI Dam represents the primary source of PCBs to the
freshwater Hudson. This includes the GE Hudson Falls and Fort Edward facilities, the remnant
deposit area and the sediments of River Section 1 (the TI Pool).
2. The PCB load originates from the sediments in River Section 1 and has a readily identifiable
homologue pattern that dominates the water column load from the TI Dam to Troy from May
through October.
3. Sediment inventories will not be naturally "remediated" via dechlorination. The extent of
dechlorination is limited, resulting in probably less than ten percent loss from the original mass.
4. There is little evidence of widespread burial of PCB-contaminated sediment by clean
sediment in River Section 1. Burial is seen at some locations, but more core sites showed loss of
PCB inventory than showed PCB gain or burial.
5. As of 1994, there has been a statistically significant loss of from 4 to 59 percent (best
estimate 45 percent) of the PCB inventory from highly contaminated sediments in the TI Pool and oU)
a net loss of inventory from hot spot sediments between the TI Dam and the Federal Dam at Troy. ^
1-41 TAMS
6. The comprehensive 1984 sediment survey provides the best basis for estimating the spatial
distribution of PCBs and the total PCB inventory in River Section i, and an analysis of the side-scan
sonar 500 kHz signal and the 1984 NYSDEC sediment PCB survey indicated that the acoustic signalcould be used to predict the level of sediment PCB contamination.
In sum, the sediments of River Section 1 strongly impact the water column, generating a
significant water column load and exposure concentration whose congener pattern can often be seen
throughout the Upper Hudson. The decrease in PCB inventories in the more highly contaminated
sediments of River Section 1 and from several of the studied hot spots below River Section 1, along
with the indication of an inventory gain in the coarse sediments of River Section 1, indicate that
PCBs are being redistributed within the Hudson River system. These results show that the stability
of the sediment deposits cannot be assured.
Burial of contaminated sediment by cleaner material is not occurring universally. Burial of
more PCB-contaminated sediment by less contaminated sediment has occurred at limited locations,
while significant portions of the PCB inventories at other hot spots have been re-released to the
environment. It is likely that PCBs will continue to be released from Upper Hudson River
sediments.
Patterns of contamination found throughout the Hudson all contain the "fingerprint" of GE-
related contamination. In the freshwater Hudson, GE-related contamination represents 80 to 100
percent of the in-place and water-borne contamination. In the Upper Hudson, this percentage is quite
close to 100 percent. In the saline Hudson, GE-related contamination represents perhaps 50 percent
of the in-place and recently deposited PCB inventory.
1.4.2 Modeling Analysis
The modeling effort for the Reassessment RI/FS was designed to replicate existing data on
PCB distribution and to predict future levels of PCBs in Upper Hudson River sediment, water, and
fish. The models are used in concert with geophysical data interpretations in this FS to help evaluate
and compare the effectiveness of various remedial scenarios. Results of the modeling analysis,
1-42 400327 TAMS
including calibration and baseline prediction of No Action, are presented in the RBMR (USEPA,
2000a). The overall goal of the modeling effort was to develop scientifically credible models capableof answering the following principal questions:
1. When will PCB levels in fish populations recover to levels meeting human health andecological risk criteria under continued No Action?
2. Can remedies other than No Action significantly shorten the time required to achieve
acceptable risk levels?
3. Are there contaminated sediments now buried that are likely to become "reactivated"
following a major flood, possibly resulting in an increase in contamination of the fish
population?
Key findings from the modeling analyses, under conditions of no remedial action being
performed in the Upper Hudson River, are summarized below.
1. Sediment deposition is occurring, on average, in most of the Upper Hudson, but not at rates
sufficient for sequestration of PCBs stored in sediment.
2. PCB concentrations in water are driven by PCBs stored in sediments under current
conditions.
3. Over the long term, the upstream boundary concentration of PCBs will limit the amount of
natural attenuation that can take place.L
'
4. Occurrence of a 100-year peak flow does not appear likely to cause a catastrophic resettingi&>of the system, with massive mobilization of PCB stores now buried at depth. oOU)
' 1000
1-43 TAMS
5. Both sediment and water column concentrations represent important sources of exposure to
biota.
6. Over the long term, PCB concentrations in fish will become increasingly controlled by the
upstream boundary condition.
1.4.3 Transport of PCBs in Upper Hudson River Sediments
The original sources of the vast majority of PCB contamination in the Upper Hudson River
were the discharges from the GE plants in Fort Edward and Hudson Falls, New York. Over the past
50 years, these PCBs have adhered to the sediments (sands, silts and clays) and these sediments now
serve as a continuing source of contamination for the water column and biota.
These sediments migrate downstream by both suspended load and bed-load transport. Bed-
load transport represents particles that roll or saltate along the river bottom without being brought
into resuspension. Since these particles are not transported into the water column, they have no
effect on the suspended sediment concentration. However, the effects of bed-load transport are
significant in the changes in the thickness of the sediment bed, and increase the rate of PCB
desorption from the transported sediments into the water column.
The processes that determine the fate of PCBs in the Upper Hudson River may be divided
into two categories, i.e. transport, and transfer and reaction. Transport is the physical movement of
PCBs caused by the net advective movement of water, mixing, and resuspension/deposition of solids
to which PCBs are adsorbed. It is dependent on the flow and dispersion characteristics in the water
column and the settling velocity and resuspension rate of the solid particles. Transfer and reaction
include movement of PCBs among air, water, and solid phases of the system, and biological (or
biochemical) transformation or degradation of the PCBs. The processes involved in transfer and
reaction include volatilization, adsorption, dechlorination, bioturbation, and biodegradation. PCBs
are present in the Upper Hudson River in three phases that interact with each other: freely dissolved;
sorbed to particulate matter or solids; and complexed with dissolved (or colloidal) organic matter.
1-44 400329 TAMS

These complex sediment and water exchange processes govern the mechanisms that in turncontribute to bioaccumulation of PCBs in the fish via both benthic and pelagic food webs. Thesehighly variable and complex processes include sediment resuspension and settling, biological mixing
(bioturbation), sediment bedload transport, anthropogenic disturbances such as boat and barge traffic,flood events, ice-rafting, and other such related processes. The net result of these processes is that,in general, the distribution of PCBs in the sediments of the Upper Hudson River is very
heterogeneous. This heterogeneity is apparent from examination of the 1977 and 1984 NYSDECdata (including the hot spot delineation), the 1994 USEPA data, and the 1991, 1998, and 1999 GE
data.
PCB loss or gain from the sediment can take many forms. Scour, diffusion, groundwater
advection, and biological activity can all potentially remove PCBs from a given location. Biological
activity in the form of anaerobic microbial dechlorination can also serve to decrease PCBconcentration in the sediments. PCB inventories can be increased chiefly by deposition, either with
sediment contaminated by newly released PCBs or with redeposited sediments from other
contaminated locations. Until 1996-1997 when GE reduced PCB discharge from the Hudson Falls
plant, it is likely that sediment deposition involved significant amounts of both fresh and redeposited
material (GE, 1991-1997). Tracing and estimating all of the various fluxes represents a daunting
task made all the more difficult by inherent spatial and temporal variations.
1.4.4 Long-Term Sequestration of PCBs
Long-term sediment sequestration of PCBs is clearly not assured, as demonstrated by several
observations made during the Phase 2 investigation. These include:
1. The statistically significant loss of the sediment PCB inventory from highly contaminated
sediments in the TI Pool between 1984 and 1994. Samples collected by GE in 1998 (see
Appendix D [Modeling Uncertainty]) also show inventory loss in comparison to 1984 data.
1-45 TAMS
2. The continued loading of PCBs from the sediments of the Upper Hudson to the water column
despite the controls placed on releases from the GE Hudson Falls plant.
3. The scouring of PCB -contaminated sediments from the Upper Hudson resulting from the
Hoosic River spring flow in 1993.
4. The apparent upward movement (i.e., loss) of the sediment inventory in Hot Spot 28 based
on a comparison of GE and USEPA data.
5. The occurrence of high PCB concentrations in the surface sediments (0-5 cm) of Hot Spot
14 as documented by GE in 1999.
1.4.5 PCB Transport from the Upper Hudson to the Lower Hudson
PCBs are transported from the Upper Hudson River to the Lower Hudson (i.e., south of the
Federal Dam at Troy). The mass of total PCBs transported over the Federal Dam to the Lower
Hudson declined from about 3,000 to 4,000 kg/year in the late 1970s to about 150 to 500 kg/year by
the late 1980s or early 1990s (USEPA, 1991a). The most recent estimate of Tri+ PCBs, based on
1998 GE data from a monitoring station at Schuylerville, is 214 kg/yr; the estimated (modeled)
average for the 1990s is about 290 kg/yr over Federal Dam, with a modeled daily average Tri+ PCB
concentration of 30.25 ng/L.
An evaluation of PCB concentrations in sediments below Federal Dam is limited by the lack
of a synoptic study of this region. An assessment of the Lower Hudson region performed in the
1980s (Bopp and Sinipson, 1989) indicated that the New York Harbor total PCB concentration was
0.8 mg/kg in the 1970 and 0.5 to 0.7 mg/kg in the 1980s. Sample data from the 1993 ecological
investigation showed, a sharp drop in sediment PCB concentrations between RM 140 and RM 150,
with PCB concentrations ranging from less than 0.1 mg/kg to about 1.5 mg/kg (with a fairly high
degree of scatter) at nine stations between RM 144 and RM 24. The modeled average PCB
concentration in sediments at Federal Dam was 0.4 mg/kg in the 1990s.
1-46 400331

1.5 Baseline Human Health and Ecological Risk Assessments
USEPA uses human health risk assessment as a tool to evaluate the likelihood and degree
of chemical exposure and the possible adverse health effects occurring or which may occur as a
result of exposure to one or more chemical or physical stressors, and ecological risk assessments to
evaluate the likelihood of adverse ecological effects associated with such exposure. The reports use
current USEPA policy and guidance as well as additional site data and analyses to supplement andrefine the preliminary human health and ecological risk assessments presented in the Phase I Report
(USEPA, 199 la). The reports referenced previously (in Section 1.2 of this FS) and associated
documents pertaining to assessment of human health and ecological risk are, unless otherwise
specified, referred to collectively in this FS as the Revised Human Health Risk Assessment (Revised
HHRA) and the Revised Ecological Risk Assessment (Revised ERA), respectively.
*"^ 1.5.1 Risks to Human Health
The Revised HHRA quantitatively evaluated both cancer risks and non-cancer health hazards
from exposure to PCBs in the Upper Hudson River and Mid-Hudson River. The Revised HHRA
evaluates both current and future risks to young children, adolescents, and adults in the absence of
{ - any remedial action and institutional controls, such as fish consumption advisories. The basic steps
of the Superfund human health risk assessment process are the following: 1) data collection and
( analysis to determine the nature and extent of chemical contamination in environmental media, such/-•;-..;
as sediment, water, and fish; 2) exposure assessment, which includes identification of possible
f;S exposed populations and an estimation of human chemical intake through exposure routes such as( ' .•
ingestion, inhalation, or skin contact; 3) toxicity assessment, which is an evaluation of chemical
{ toxicity including cancer and non-cancer health effects from exposure to chemicals; and 4) risk
characterization, which describes the likelihood and degree of chemical exposure at a site and theI . ;
[ i possible adverse health effects associated with such exposure.
X"-*N
; Adults, adolescents, and young children were identified as receptors possibly exposed to
PCBs in the Upper Hudson River due to fishing and recreational activities (swimming, wading), asI ;V.".'
if, 1-47 TAMS
oCO
well as from living adjacent to the Upper Hudson River and inhaling volatilized PCBs in the air.
Cancer risks and non-cancer health hazards were calculated for each of these receptors, as shown on
Table 1-9. To protect human health and provide a full characterization of the PCS cancer risks and
non-cancer health hazards, both an average (central tendency) exposure estimate and a reasonable
maximum exposure (RME) estimate were calculated. The RME is the maximum exposure that is
reasonably expected to occur in the Upper Hudson River under baseline conditions, and is not a
worst-case scenario.
The exposure pathways identified in the Revised HHRA are ingestion of fish, incidental
ingestion of sediments, dermal contact with sediments and river water, and inhalation of volatilized
PCBs in air. For these exposure pathways, central tendency and RME estimates were calculated
using point estimate analyses, whereby an individual point estimate was selected for each exposure
factor used in the calculation of cancer risks and non-cancer health hazards. Incidental ingestion of
river water while swimming was not evaluated for the Upper Hudson River because the river water
meets drinking water standards for PCBs (i.e., the Federal Maximum Contaminant Level for PCBs
of 0.0005 mg/L [40 CFR § 141.32(e)(45)]). Tri+ PCB concentrations in fish, water, and sediment
are based on modeled forecasts as presented in the RBMR (USEPA, 2000a), which assumed an
upstream boundary condition (i.e., PCB concentration entering the study area north of RM 195) of
lOng/L.
The Revised HHRA shows that cancer risks and non-cancer health hazards exceed acceptable
levels for an individual ingesting PCB-contaminated fish from the Upper Hudson River under the
reasonable maximum exposure (RME) scenario. Consistent with USEPA policy, the risk managers
in the Superfund program evaluate the cancer risk and non-cancer health hazards to individuals under
RME conditions in the decision-making process. The Revised HHRA indicates that fish ingestion
represents the primary pathway for PCB exposure and for potential adverse health effects, and that
cancer risks and non-cancer health hazards from other exposure pathways are generally below levels
of concern. The results of the Revised HHRA are used in the FS to establish acceptable exposure
levels in the development of remedial alternatives for PCB-contaminated sediments in the Upper
Hudson River.
1-48 4°°333 TAMS
USEPA has classified PCBs as probable human carcinogens and known animal carcinogens.Other long-term adverse health effects of PCBs observed in laboratory animals include a reduced
ability to fight infections, low birth weights, and learning problems.
The major findings of the HHRA are:
• Eating fish is the primary pathway for hurnans to be exposed to PCBs from the Hudson.
• Under the RME scenario for eating fish, the calculated cancer risk is one in 1,000. This
excess cancer risk is 1,000 times higher than USEPA' s goal of protection and ten times
higher than the highest cancer risk level generally allowed under federal Superfund law.
• For non-cancer health effects, the RME scenario for eating fish from the Upper Hudson
results in a level of exposure to PCBs that is more than 100 times higher than USEPA's
reference level (hazard index [HI]) of one for young children. For adolescent it is 74 times
higher and for the adult it is 65 times higher than the reference level of one.
• Under the baseline conditions, the point estimate RME cancer risks and non-cancer health
hazards would exceed USEPA's generally acceptable levels (cancer risk range of 10"4 tolO"6
and non-cancer hazard index of one) for a 40-year exposure period beginning in 1999.
• Risks from being exposed to PCBs in the river through skin contact with contaminated
sediments and river water, incidental ingestion of sediments, and inhalation of PCBs in air
are generally within or below USEPA's levels of concern.
The HHRA for the Upper Hudson was externally peer-reviewed and a response to peer
comments developed (USEPA, 2000m). The Rev
reponse to the peer review comments (USEPA, 2000p).
_/— -s review comments developed (USEPA, 2000m). The Revised HHRA incorporates changes made in o
1-49 TAMS
The Revised HHRA also evaluated cancer risks and non-cancer health hazards posed byPCBs in the Mid-Hudson River (Federal Dam at Troy to Poughkeepsie) (USEPA, 2000p); these are
presented in Table 1-10. PCB concentrations in fish, water, and sediment are based on modeled
forecasts as presented in the ERA (USEPA, 1999c). The major findings of the report were:
• Eating fish is the primary pathway for humans to be exposed to PCBs from the Mid-Hudson
River.
• Under the RME scenario for eating fish, the calculated risk is approximately seven in 10,000.
This excess cancer risk is more than 700 times higher than USEPA's goal of protection
(1 x 10"6, or 1 in 1,000,000) and above highest cancer risk level generally allowed under
federal Superfund law.
• For non-cancer health effects, the RME scenario for eating fish from the Mid-Hudson results
in a level of exposure to PCBs that is 34 times higher for adults, 37 times higher for
adolescents, and 53 times higher for young children than USEPA's reference level (HI) of
one.
• Under baseline conditions, the RME cancer risks and non-cancer health hazards for eating
fish would be above USEPA's generally acceptable levels (i.e., cancer risks exceed 1 x 10"4,
or 1 in 10,000, and non-cancer health hazards exceed 1.0) for a 40-year exposure period
beginning in 1999.
• For the fish consumption pathway, average cancer risks lie within the risk range of 10"6 to
10"4, and non-cancer health hazards under central tendency or average assumptions fall
slightly above the USEPA's reference level (HI) of one.
• Risks from exposure to PCBs in the Mid-Hudson River through skin contact with
contaminated sediments and river water, residential ingestion of river water as a source of
1-50 4°°335 TAMS
drinking water, incidental ingestion of sediments, and inhalation of PCBs in air are below
I USEPA's levels of concern for cancer and non-cancer health effects.i
I 1.5.2 Ecological Risks
| The Revised ERA quantitatively evaluated the current and future risks to the environmentin the Upper Hudson River (Hudson Falls, New York to Federal Dam at Troy, New York) and the
|| Lower Hudson River (Federal Dam to the Battery in New York City) posed by PCBs, in the absence
of remediation.
F' -The Superfund ecological risk assessment process includes the following: 1) identification
of contaminants of concern; 2) development of a conceptual model, which identifies complete
exposure pathways for the ecosystem; 3) identification of assessment endpoints, which are ecological
***N values to be protected; 4) development of measurement endpoints, which are the actual
measurements used to assess risk to the assessment endpoints; 5) exposure assessment, which
describes concentrations or dietary doses of contaminants of concern to which the selected receptors
are or may be exposed; 6) effects assessment, which describes lexicological effects due to chemical
exposure and the methods used to characterize those effects to the receptors of concern; and 7) risk
characterization, which compares the results of the exposure assessment with the effects assessment
to evaluate the likelihood of adverse ecological effects associated with exposure to chemicals at a
site.
The contaminants of concern identified for the site are PCBs. Assessment endpoints are
explicit expressions of actual environmental values (i.e., ecological resources) that are- to be
r\ protected. The assessment endpoints that were selected for the Hudson River are sustainability of
benthic community, which serves as a food source for local fish and wildlife, and sustainability
|!"'; (survival, growth, and reproduction) of local fish (forage, omnivorous, and piscivorous) populations,
^.^ insectivorous bird and mammal populations, waterfowl populations, omnivorous mammal o'populations, and piscivorous and semi-piscivorous bird populations.
1-51 . TAMS
The measurement endpoints identified for the Revised ERA are:
• Benthic community indices, such as richness, abundance, diversity, and biomass;
• Concentrations of PCBs in fish and invertebrates to evaluate food-chain exposure;
• Measured and modeled total PCB body burdens in receptors (including avian receptor eggs)to determine exceedance of effect-level thresholds based on toxicity reference values
(TRVs);
• Measured and modeled toxicity equivalent quotient (TEQ)-based PCB body burdens in
receptors (including avian receptor eggs) to determine exceedance of effect-level thresholds
based on TRVs;
• Exceedance of criteria for concentrations of PCBs in river water that are protective of fish
and wildlife;
• Exceedance of guidelines for concentrations of PCBs in sediments that are protective of
aquatic health; and
• Field observations.
Representative receptors selected as models for the Revised ERA were the benthic
macroinvertebrate community; fish species including pumpkinseed (Lepomis gibbosus), spottail
shiner (Notropis hudsonius), brown bullhead (Ictalurus [now Ameiurus] nebulosus), white perch
(Morone americana), yellow perch (Percaflavescens), largemouth bass (Micropterus salmoides),
and striped bass (Morone saxatilis); birds, including tree swallow (Tachycineta bicolor), mallard
(Anas platyrhychos), belted kingfisher (Ceryle alcyori), great blue heron (Ardea herodias), and bald
eagle (Haliaeetus leucocephalus); and mammals, including little brown bat (Myotis lucifugus),
raccoon (Procyon lotor), mink (Mustela vison), and river otter (Lutra canadensis).
The exposure assessment describes complete exposure pathways and exposure parameters
(e.g., body weight, prey ingestion rate, home range) used to calculate the concentrations or dietary
doses to which the receptors of concern may be exposed due to chemical exposure. Previously
issued Reassessment RI/FS documents i.e., the DEIR (USEPA, 1997a) and the RBMR (USEPA,
2000a) provide current and future (i.e.,measured and modeled) concentrations of PCBs in fish,
1-52 4°°337

sediments, and river water, and the data collected for the Reassessment form the basis of the site data
collection and analyses that were used in conducting the Revised ERA. Exposure parameters were
obtained from USEPA references, scientific literature, and directly from researchers.
The effects assessment describes the methods used to characterize particular toxicological
effects of PCBs on aquatic and terrestrial organisms due to chemical exposure. These measures of
toxicological effects, called TRVs, provide a basis for estimating whether the chemical exposure ata site is likely to result in adverse ecological effects. TRVs were selected based on lowest-observed-
adverse-effects-levels (LOAELs) or no-observed-adverse-effects-levels (NOAELs) from laboratory
or field-based studies reported in the scientific literature. These TRVs examine the effects of PCBs
and dioxin-like PCB congeners on the survival, growth, and reproduction offish and wildlife species
in the Hudson River. Reproductive effects (e.g., egg maturation, egg hatchability, and survival of
juveniles) were generally the most sensitive endpoints for animals exposed to PCBs.
Risk characterization examines the likelihood of adverse ecological effects occurring as a
result of exposure to chemicals, and discusses the qualitative and quantitative assessment of risks
to ecological receptors with regard to toxic effects. Risks are estimated by comparing the results of
the exposure assessment (measured or modeled concentrations of chemicals in receptors of concern)
to the TRVs developed in the effects assessment. The ratio of these two numbers is called a toxicity
quotient, or TQ. TQs equal to or greater than one (TQ > 1) are typically considered to indicate
potential risk to ecological receptors; for example, reduced or impaired reproduction, or recruitment
of new individuals. A probabilistic dose-response analysis was also performed to determine the
percentage of selected piscivorous bird and mammal populations that are predicted to experience
decreased fecundity (fertility) due to PCB exposure.
To integrate the various components of the Revised ERA, the results of the risk
characterization and associated uncertainties were evaluated to assess the risk of adverse effects in*«
the receptors of concern as a result of exposure to PCBs originating in the Hudson River. This o
approach considers both the results of the TQ analysis and field observations for each assessment woo
endpoint. However, as field observations are not available for many species and can be subjective,
1-53 TAMS
they were given less weight than the TQ analysis. For the mammals and most birds, TQs for the
dioxin-like PCBs were greater than the TQs for total PCBs.
The results of the Revised ERA indicate that receptors in close contact with the Hudson
River are at an increased ecological risk primarily as a result of exposure to PCBs in prey. This
conclusion is based on a TQ approach, in which measured or modeled body burdens, dietary doses,
and egg concentrations of PCBs were compared to appropriate TRVs, and on field observations. On
the basis of these comparisons, receptors are at risk. In summary, the major findings of the report
were:
• Piscivorous fish (e.g., largemouth bass and striped bass) and omnivorous fish (e.g., brown
bullhead) in the Hudson River may be adversely affected (i.e., reduced survival, growth,
and/or reproduction) from exposure to PCBs. Forage fish are unlikely to be affected outside
of River Section 1 (the TI Pool).
• Birds and mammals that feed on insects with an aquatic stage spent in the Hudson River,
such as the tree swallow and little brown bat, may be adversely affected (i.e., reduced
survival, growth, and/or reproduction), particularly insectivorous mammals living in the TI
Pool area.
• Waterfowl feeding on animals and plants in the Hudson River are unlikely to be adversely
affected (i.e., reduced survival, growth, and/or reproduction) from exposure to PCBs.
• Omnivorous animals such as the raccoon that-derive a large portion of their food from the
Hudson River may be adversely affected (i.e., reduced survival, growth, and/or reproduction)
from exposure to PCBs.
• Birds and mammals that eat PCB-contaminated fish from the Hudson River, such as the bald
eagle, belted kingfisher, great blue heron, mink, and river otter, are at risk at the population
1-54.

level. PCBs may adversely affect the survival, growth, and reproduction of these species.Piscivorous mammals are at the greatest risk due to their feeding patterns.
• Fragile populations of threatened and endangered species, represented by the bald eagle, are
particularly susceptible to adverse effects from PCB exposure.
• PCB concentrations in water and sediments in the Upper and Lower Hudson River generally
exceed standards and criteria and guidelines established to be protective of the environment.
• The risks to fish and wildlife are greatest in the Upper Hudson River (in particular the TI
Pool) and decrease as PCB concentrations decrease down river. Based on modeled future
PCB concentrations, piscivorous species are expected to be at considerable risk through 2018
(the entire forecast period; risks were not modeled beyond this period).
1.6. Public Outreach and Peer Review
The Reassessment RI/FS process also includes public outreach and peer review of technical
documents. The implementation of these activities for the Hudson River PCBs Reassessment RI/FS
is summarized below.
1.6.1 Public Outreach
At the outset of Phase 1, USEPA designed a Community Interaction Program (CIP) that
addressed the complexities of communication and public participation associated with a project
whose geographic area includes communities and political jurisdictions along a 200-mile stretch of
the Hudson River, and involves interested parties in as many as 14 counties. This program, entirely
unique to USEPA, is based on a community relations plan (CRP) prepared according to CERCLA
community relations guidance, and consists of a three-tiered committee structure starting with four
community-level liaison groups, providing maximum opportunity for all interested parties to
participate in the project.
1-55 JAMS

The chairperson and two cochairpeople of the four liaison groups make up a steering
committee chaired by the USEPA's Community Relations Coordinator. The function of the steering
committee is to bring individual liaison group issues to the table to share with the other groups andto raise those issues and questions to the USEPA project team and management.
The top tier in the structure is the Hudson River PCBs Site Reassessment RI/FS Oversight
Committee (HROC), chaired by the Deputy Director of USEPA Region 2's Emergency Remedial
Response Division (ERRD). Each liaison group chairperson sits on that committee, along with
representatives of state and federal agencies who have jurisdiction or an interest in the Hudson River
and the project. GE also has a seat on this committee.
An adjunct group called the Scientific and Technical Committee (STC) comprised of
scientists and researchers - all volunteers - was established to be available to USEPA throughout the
project to provide advice and input on specific technical issues when requested. Members came from
all over the country to participate.
More than 65 regular meetings of various types - joint liaison group meetings, steering
committee meetings, HROC meetings, STC meeting, and public and press availability sessions -
have been held at locations up and down the river on both sides of the Hudson between Glens Falls
and Poughkeepsie, New York, during the eleven years of the project. Sixteen information
repositories have been maintained, where copies of the reports and other documents prepared for the
Reassessment RI/FS can be reviewed by the public, and USEPA has hosted a number of special
events such as a coring demonstration, presentations by subject matter specialists, and a call-in
public availability session.
1.6.2 Peer Review
In accordance with USEPA guidance and the Peer Review Handbook, the scientific work
conducted for the Reassessment that is the basis for this proposed action has undergone external peer
review. USEPA's six major Phase 2 Reports have undergone external peer review by five panels
1-56 400341 TAMS

of independent experts. These reports were the PMCR (USEPA, 1996a), the geochemistry reports
I (DEIR [USEPA, 1997a], and the LRC [USEPA, 1998b]), the HHRA (USEPA, 1999d), ERA
(USEPA, 1999c), and RBMR (USEPA, 2000a). Each peer review panel was asked to address
| specific questions, together called the "charge," regarding the methods USEPA used, the findings
and conclusions of the report being reviewed, and controversial issues that were identified by the
I public prior to the peer review meeting. In addition, the panels were invited to address any otherissues that were not specifically identified in the charge.
,, The peer reviewers generally agreed with the findings and conclusions of the reports,
I although they also requested revisions. USEPA issued Responses to Peer Review Comments for
i each of the Peer Reviews as well as the Revised HHRA and the Revised ERA, which include all!''•. changes made to address the peer review comments on those reports. Revisions were incorporated,
I as appropriate, into the FS.£ ^
! In addition, the Scientific and Technical Committee described previously, has provided peer
input into the various documents USEPA prepared as part of the Reassessment.
OO
to
1-57 TAMS

as•o
400343

2. IDENTIFICATION OF POTENTIALLY APPLICABLE OR RELEVANT ANDAPPROPRIATE REQUIREMENTS (ARARs) AND TO-BE-CONSIDERED (TBC)CRITERIA
This FS was developed following the basic methodology outlined in 40 CFR § 300.430 and
further discussed in the RI/FS Guidance. Section 121(d) of CERCLA requires that remedial actions
comply with state and federal applicable or relevant and appropriate requirements (ARARs), as
defined below, unless a waiver is justified. ARARs are used to assist in determining the appropriate
extent of site cleanup, to scope and formulate remedial action alternatives, and to govern the
implementation of a selected response action.
The potential ARARs for the Hudson River PCBs site in each of the three categories
(chemical-specific, location-specific, and action-specific), along with other to-be-considered (TBC)
criteria, are summarized in Table 2-1 through 2-3 and discussed below. It should be noted that
ARARs are potential in this FS and in the Proposed Plan, and become final upon issuance of the
ROD.
In the absence of federal- or state-promulgated ARARs, or in the case where ARARs are
judged to be inadequately protective, certain criteria, advisories, guidance values, and proposed
standards may be used for developing remedial action alternatives or for determining what is
protective to human health and the environment (i.e., to set preliminary remediation goals). These
criteria, advisories, guidance values, and proposed standards are identified by USEPA as "to-be-
considered" (TBC) criteria. TBCs are not legally binding and do not have the status of ARARs.
2.1 Definition of ARARs
ARARs, as defined in CERCLA Section 121(d), are: :
• Any standard, requirement, criterion, or limitation promulgated under federal environmental
law; and
ooU)
2-1 TAMS

• Any promulgated standard, requirement, criterion, or limitation under a state environmental
or facility siting law that is more stringent than the associated federal standard, requirement,
criterion, or limitation.
If a state is authorized to implement a program in lieu of a federal agency, state laws arising
out of that program constitute the ARARs instead of the federal authorizing legislation. A stringency
comparison is unnecessary because state regulations under federally authorized programs areconsidered to be federal requirements.
"On-site" with regard to CERCLA remedial response actions means the areal extent of
contamination and all suitable areas in very close proximity to the contamination necessary for
implementation of the response action. On-site actions must comply with ARARs, but must only
comply with the substantive requirements of a regulation and not the administrative requirements
(CERCLA Section 121(e)(l)). Substantive requirements are those requirements that pertain directly
to actions or conditions in the environment. Examples include health-based or risk-based standardsfor hazardous substances (e.g., maximum contaminant levels [MCLs] in drinking water) and
technology-based standards (e.g., RCRA standards for landfills). Administrative requirements
include permit applications, reporting, record keeping, and consultation with administrative bodies,
and are not necessary for on-site CERCLA cleanup (Section 121(e)(l)). Although consultation with
the state and federal offices responsible for issuing the permits is not required, it is recommended
for compliance with the substantive requirements.
Off-site actions must comply only with requirements that are legally applicable. Off-site
actions must comply with both the substantive and administrative parts of those requirements.
Compliance with employee protection requirements of the Occupational Safety and Health
Act (OSHA) is specifically required by 40 CFR §300.150. OSHA standards are not considered
ARARs because they directly apply to all CERCLA response actions. In addition, OSHA
requirements are more properly viewed as employee protection, rather than environmental,
requirements, and thus the process outlined in CERCLA Section 121(d) for the attainment or waiver
of ARARs does not apply to OSHA standards.
400345 TAMS
2.1.1 Applicable Requirements
Applicable requirements are those cleanup standards, control standards, and other substantiveenvironmental protection requirements, criteria, or limitations promulgated under federal or state lawthat specifically address a hazardous substance, pollutant, contaminant, remedial action, location,or other circumstance at an NPL site. "Applicability" implies that the remedial action or thecircumstances at the site satisfy all of the jurisdictional prerequisites of a requirement, including theparty subject to the law, the circumstances or activities that fall under the authority of the law, thetime period during which the law is in effect, and the types of activities the statute or regulationsrequire, limit, or prohibit.
2.1.2 Relevant and Appropriate Requirements
Relevant and appropriate requirements are those cleanup standards, control standards, and
other substantive environmental protection requirements, criteria, or limitations promulgated under
federal or state law that, while not "applicable" to a hazardous substance, pollutant, contaminant,remedial action, location, or other circumstance at an NPL site, address problems or situationssufficiently similar (relevant) to those encountered, and are well-suited (appropriate) tocircumstances at the particular site. Requirements must be both relevant and appropriate to beARARs. During the FS process, relevant and appropriate requirements have the same weight and
consideration as applicable requirements.
The term "relevant" was included so that a requirement initially screened as nonapplicablebecause of jurisdictional restrictions could be reconsidered and, if appropriate, included as an ARARfor a given site. For example, MCLs would be not applicable, but relevant and appropriate, for a site
with groundwater contamination in a potential (as opposed to an actual) drinking water source.
The relevance and appropriateness of a requirement can be judged by comparing a numberof factors, including the characteristics of the remedial action, the hazardous substances in question,or the physical circumstances of the site, with those addressed in the requirement. The objective andorigin of the requirement are also considered. A requirement that is judged to be relevant andappropriate must be complied with to the same degree as if it were applicable. However, it is
2-3 TAMS
possible for only part of a requirement to be considered relevant and appropriate, the rest being
dismissed if not judged to be both relevant and appropriate in a given case.
2.1.3 Other Requirements To Be Considered
To-be-considered requirements, or TBCs, are non-promulgated criteria, advisories, guidance,
and proposed standards issued by federal or state governments. TBCs are not potential ARARsbecause they are neither promulgated nor enforceable, although it may be necessary to consult TBCs
to interpret ARARs, or to determine preliminary remediation goals when ARARs do not exist forparticular contaminants, or are not sufficiently protective. Compliance with TBCs is not mandatory,as it is for ARARs. [.;/
f
2.1.4 Waiver of ARARs j
According to CERCLA Section 121(d)(4), an ARAR may be waived by USEPA, provided }
protection of human health and the environment is still achieved, under the following six specific -~
conditions: r
• The selected remedial action is only part of a total remedial action that will attain ARARs ;;.•
when completed;
• Compliance with such requirements will result in greater risk to human health and the[''•
environment than alternative options; £:
I1
• Compliance with such requirements is technically impracticable from an engineering L
perspective; • •,..i.'
• The selected remedial action will provide a standard of performance equivalent to other • I,
approaches required under applicable regulations;
__J
• The requirement is a state requirement that has been inconsistently applied in similar
circumstances at other remedial actions within the state; or (
2-4 ' TAMS400347 j
• Attainment of the ARAR would entail extremely high costs relative to the added degree of
reduction of risk afforded by the standard such that remedial action at other sites would bejeopardized (i.e., fund balancing).
2.2 Development of ARARs
Under the description of ARARs set forth in the NCP and CERCLA, many federal and state
environmental requirements must be considered. ARARs and TBCs fall into three broad categories,based on the manner in which they are applied at a site:
• Chemical-specific. These are health- or risk-based numerical values or methodologies that
establish concentration or discharge limits, or a basis for calculating such limits, forparticular contaminants. Examples of chemical-specific ARARs are drinking water MCLs,
ambient air quality standards, or ambient water quality criteria for PCBs. If more than one
such requirement applies to a contaminant, compliance with the more stringent applicable
ARAR is required.
• Location-specific. These are restrictions based on the concentration of hazardous substances
or the conduct of activities in specific locations. Examples of natural site features include
wetlands, scenic rivers, and floodplains. Examples of man-made features include historic
districts and archaeological sites. Remedial action alternatives may be restricted or
precluded depending on the location or characteristics of the site and the requirements thatto it.
• Action-specific. Action-specific requirements set controls or restrictions on particular kinds
of activities related to the management of hazardous substances, pollutants, or contaminants,and are primarily used to assess the feasibility of remedial technologies and alternatives.Examples of action-specific ARARs include Resource Conservation and Recovery Act(RCRA) monitoring requirements and TSCA disposal requirements.
- ' £o
Chemical-specific, location-specific, and action-specific ARARs and TBCs are all considered |£ooin the development and evaluation of remedial alternatives. Chemical- and location-specific ARARs
2-5 TAMS

typically are identified during scoping of the RI/FS and during the site characterization phase of the
RI. Action-specific ARARs are identified during the development of the remedial alternatives in the
FS.
When an alternative is selected, it must be able to fulfill the requirements of all ARARs (or
a waiver must be justified). ARARs pertaining both to contaminant levels and to performance ordesign standards should be attained at all points of potential exposure, or at the point specified bythe ARAR itself. Where the ARAR does not specify the point of compliance, there is discretion todetermine where the requirement shall be attained to be protective.
2.3 Chemical-Specific ARARs
Chemical-specific ARARs provide either actual cleanup levels or a basis for calculating such
levels. For example, surface water criteria and standards, as well as air standards, provide necessary
cleanup goals for the Hudson River PCBs contamination.
Chemical-specific ARARs are also used to indicate acceptable levels of discharge to
determine treatment and disposal requirements and to assess the effectiveness of remedial
alternatives. Table 2-la lists and summarizes potential federal and state chemical-specific ARARs.
Chemical-specific ARARs will apply to every alternative developed in later phases of the FS.Chemical-specific TBCs are listed in Table 2-lb.
2.3.1 Federal Chemical-Specific ARARs J
Safe Drinking Water Act - 42 USC § 300f et seq. ; 40 CFR Part 141
Regulations promulgated under the Safe Drinking Water Act establish enforceable MCLs for
PCBs (40 CFR Part 141) and non-enforceable maximum contaminant level goals (MCLGs) for
The Federal Food, Drug, and Cosmetic Act is neither a federal or state environmental lawnor a facility siting law. Therefore, the Food and Drug Administration (PDA) tolerance level forPCBs in commercially caught fish (2 mg/kg; Federal Food, Drug, and Cosmetic Act, 21 USC § 301et seq.; 21 CFR § 109.30(a)(7)) is not an ARAR for this site.
2-6 TAMS400349
finished water provided to consumers. MCLs for known and probable human carcinogens areestablished using an acceptable risk range of 104 to 10'6 (56 FR 3526 [January 30,1991]). The MCL
for total PCBs is 0.0005 ppm (0.5 ug/L). The drinking water MCL for PCBs is an ARAR because
a number of communities use the Hudson River water as a drinking water source. Non-zero MCLGsmust be attained for groundwater or surface waters that are potential sources of drinking water (40
CFR § 300.430(e)(2)(I)(5)(B)); in other words, when the MCLG is greater than zero, the MCLG isconsidered an ARAR. The MCLG for all carcinogens, including PCBs, is zero. Where the MCLG
is established at a zero value, only the MCL must be attained (40 CFR 300.430(e)(2)(I)(5)(C)).Therefore, because the MCLG for PCBs is zero, only the MCL for PCBs (and not the MCLG) is anARAR.
Federal Water Pollution Control Act, as amended by the Clean Water Act (CWA) - 33 USC§ 1251 etseq.i 40 CFR Part 129
The Federal Water Pollution Control Act provides the authority for USEPA to establish waterquality criteria. The toxic pollutant effluent standards are promulgated at 40 CFR 129. The ambientwater criterion for PCBs in navigable waters is established at 0.001 jag/L (40 CFR § 129.105(a)(4)).
2.3.2 New York State Chemical-Specific ARARs
New York Environmental Conservation Law (ECL), Article 15, Title 3 and Article 17, Titles3 and 8; 6 NYCRR Parts 700-706
Water quality standards are established under various sections of the New York ECL,including Article 15 (ECL § 15-0313) and Article 17 (ECL §§ 17-0301, 17-0303, and 17-0809).The water quality standards for PCBs established at 6 NYCRR § 703.5 (and also published inNYSDEC's Technical and Operational Guidance Series [TOGS] Memo 1.1.1, June 1998) are 0.09
ug/L for potable water sources; 0.001 ng/L for protection of human health based on fishconsumption; and 0.12 ng/L (1.2 x 10"4 ug/L) for the protection of wildlife.
OOU)OlO
2-7 TAMS
2.3.3 Chemical-Specific Criteria, Advisories, and Guidance to be Considered
The chemical-specific TBC criteria discussed below are from federal and state criteria and
guidance documents, and are summarized on Table 2-lb.
Biota
International Joint Commission - United States and Canada - Great Lakes Water QualityAgreement of 1978, as amended
The concentration of total PCBs in fish tissue (whole fish, calculated on a wet weight basis)
should not exceed 0.1 jag/g (0.1 mg/kg) for the protection of birds and animals that consume fish.
National Oceanic and Atmospheric Administration (NOAA) - Damage Assessment Center:Reproductive, Developmental, and Immunotoxic Effects of PCBs in Fish - A Summary ofLaboratory and Field Studies
This report (NOAA, 1999a) indicates that the effective concentrations for reproductive and
developmental toxicity fall within the ranges of PCB concentrations found in some of the more
contaminated Hudson River fish. However, there are an insufficient number of studies to assess
the immunotoxicity of PCBs in fish.
Fish larvae survival can be reduced by concentrations of 1.3 to 4 ppm (mg/kg) wet weight
PCBs in the bodies of the fish larvae. Improper functioning of the reproductive system and adverse
effects on development may result from adult fish liver concentrations of 25 to 70 ppm of Aroclor
1254.
PCB Congener BZ#77 has been shown to cause reproductive and developmental effects in
field and laboratory studies at concentrations of 0.3 ppm to 5 ppm (wet weight) in the livers of adult
fish, eggs, or embryos. Egg deposition was reduced at 0.3 ppm, pituitary gonadotropin decreased
and adult mortality increased at 0.6 ppm, reduced larval survival was observed at 1.3 to 4 ppm,
retinoids decreased at 1.5 ppm, and the percent of females and gonad growth decreased at 4 to 5
ppmBZ#77. :
2-8 400351 TAMS

NYSDEC Division of Fish and Wildlife - Niagara River Biota Contamination Project: FishFlesh Criteria for Piscivorous Wildlife
This report (NYSDEC, 1987) provides a method for calculating PCB concentration criteria
in fish flesh for the protection of piscivorous wildlife, and establishes a final fish-flesh criterion of
0.11 mg/kgPCBs.
Sediment
USEPA Office of Emergency and Remedial Response - Guidance on Remedial Actions forSuperfund Sites with PCB Contamination
This guidance document (USEPA, 1990a) provides guidance on the investigation and remedy
selection for PCB-contaminated Superfund sites. It also provides preliminary remediation goals
for various contaminated media and identifies other considerations important to protect humanhealth and the environment.
The document presents cleanup levels for freshwater sediment based on an equilibrium
partitioning approach and the freshwater ambient water quality criterion (AWQC) of 0.01 f-ig/L.
For example, the cleanup level is 1.9 ug/g (1.9 mg/kg) at 10 percent organic carbon, and 0.19 jag/g
at 1 percent organic carbon. Sediment PCB concentrations of 1 to 2 mg/kg are protective of
migratory birds.
USEPA Great Lakes National Program Office, Assessment and Remediation of ContaminatedSediments (ARCS) Program - Calculation and Evaluation of Sediment Effect Concentrationsfor the Amphipod Hyalella azteca and the Midge Chironomus riparius
This document (USEPA, 1996b) provides sediment effects concentrations (SECs), which aredefined as the concentrations of a contaminant in sediment below which toxicity is rarely observed
and above which toxicity is frequently observed. For freshwater, the threshold effects level (TEL)
is 32 ng/g (32 ug/kg) total PCBs; the probable effects level (PEL) is 240 ng/g total PCBs; and theno effects concentration (NEC) is 190 ng/g total PCBs.
u>m10
2-9 TAMS

NOAA - Damage Assessment Office: Development and Evaluation of Consensus-BasedSediment Effects Concentrations for PCBs in the Hudson River
This report (NOAA, 1999b) provides estuarine, freshwater, and marine sediment effects
concentrations for total PCBs. The threshold effect concentration (TEC) is 0.04 mg/kg; the mid-range effect concentration (MEC) is 0.4 mg/kg; and the extreme effect concentration (EEC) is 1.7
mg/kg total PCBs.
NOAA - Screening Quick Reference Tables (SQRTs) for Organics
The SQRTs provide PCB concentrations in freshwater sediment (dry weight basis). Thelowest ARCS H. azteca TEL is 31.6 ppb (31.6 ug/kg); the TEL is 34.1 ppb; the PEL is 277 ppb;
and the upper effects threshold (UET) is 26 ppb (Microtox bioassay).
NYSDEC Division of Fish, Wildlife and Marine Resources - Technical Guidance forScreening Contaminated Sediment
This document (NYSDEC, 1999a) provides sediment screening values for metals and non-polar organic contaminants, such as PCBs, in units of micrograms of contaminant per gram organic
carbon in sediment (ug/go). Table 1 of this guidance document lists sediment criteria for totalPCBs of 0.0008 ug/go for freshwater, based on human health bioaccumulation, 2760.8 ug/go for
freshwater based on benthic aquatic life acute toxicity, 19.3 ug/go for freshwater based on benthicaquatic life chronic toxicity, and 1.4 ug/go in freshwater based on wildlife bioaccumulation.
2.4 Location-Specific ARARs
Potential location-specific ARARs are presented in Table 2-2a and location-specific TBCs
are in Table 2-2b.
2-10 400353 TAMS

2.4.1 Federal Location-Specific ARARs
f Section 404 of the CWA (Federal Water Pollution Control Act, as amended), 33 USC § 1344;f 33 CFR Parts 320 - 329
I Section 404 of the CWA establishes requirements for issuing permits for the discharge ofdredged or fill material into navigable waters of the United States, and includes special policies,
f practices, and procedures to be followed by the US Army Corps of Engineers (USAGE) inconnection with the review of applications for such permits. These regulations apply to all existing,
|;;: proposed, or potential disposal sites for discharges of dredged or fill materials into US waters,including wetlands. USEPA may prohibit fill if there is an unacceptable adverse impact on the
f receiving water body. In accordance with CERCLA section 121(e)(l), no federal, state, or local
permits are required for remedial action conducted entirely on site, although the remedial actioni
I, must comply with the substantive requirements of CWA Sections 404 and 33 CFR Parts 320-329.
^ CWA Section 404 (33 USC § 1344), 40 CFR Part 230
!-.-.".• No activity that adversely affects an aquatic ecosystem (including wetlands) shall be
r', permitted if there is a practical alternative available that has less adverse impact. If there is no1 ' practicable alternative, then the adverse impacts of the activity must be minimized.
1 TSCA, Title 1,15 USC§ 2601; TSCA Facility Requirements (40 CFR 761.65 - 761.75)
t : TSCA and TSCA facility requirements provide siting guidance and criteria for storage
m (761.65), incinerators (761.70), and chemical waste landfills (761.75). TSCA and associatedI regulations are described in subsection 2.5.1 of this FS.
Statement of Procedures on Floodplain Management and Wetlands Protection; 40 CFR Part6, Appendix A
These procedures set forth USEPA policy and guidance for carrying out Executive Orders *•(EO) 11990 and 11988. S
en
2-11 TAMS
EO 11988 - Floodplain Management - requires federal agencies to evaluate the potential
effects of actions that may be taken in a floodplain and to avoid, to the extent possible, long-term
and short-term adverse affects associated with the occupancy and modification of floodplains, andto avoid direct or indirect support of floodplain development wherever there is a practicable
alternative.
EO 11990 - Protection of Wetlands - requires that activities conducted by federal agencies
avoid, to the extent possible, long-term and short-term adverse affects associated with the
modification or destruction of wetlands. Federal agencies are also required to avoid direct orindirect support of new construction in wetlands when there are practical alternatives; harm towetlands must be minimized when there is no practical alternative available. These requirementsare applicable to alternatives involving remedial actions (including construction) in wetlands.
Federal wetlands, based on National Wetlands Inventory maps (USFWS, 2000), and New York
State regulated wetlands, based on NYSDEC maps (Cornell University, 2000), are present
throughout the entire Upper and Lower Hudson River (see Plate 1 of the Revised ERA [USEPA,
2000q]).
Endangered Species Act (ESA), 16 USC§ 1531 etseq.; 50 CFR Parts 17, Subpart I, and 50CFR Part 402
The ESA of 1973 and subsequent amendments provide for the conservation of threatened and
endangered species of animals and plants, and the habitats in which they are found. The act requires
federal agencies, in consultation with the Secretary of the Interior, to verify that any agency-
supported action is not likely to jeopardize the continued existence of any endangered or threatened
species or its critical habitat, or result in the destruction or adverse modification of a critical habitat
of such species. Exemptions may be granted by the Endangered Species Committee.
The bald eagle (Haliaeetus leucocephalus), a federal-listed threatened species and a NYS-
listed endangered species, winters along the Upper Hudson River. NYSDEC has radio-tracked bald
eagles in the Upper Hudson River area over the past two winters, and has identified some important
perching/feeding/and roosting areas (Nye, 2000). The short-eared owl (Asioflammeus), a NYS-
listed endangered species, also: may occur along the upper river (NYSDEC, 2000). A raptor
400355 TAMS

•
concentration area has been identified in Washington County by the NY Natural Heritage Program
(NYSDEC, 2000).
Many federal or NYS-listed threatened and endangered species are found in the Lower
Hudson River (see subsection 2.1.3 and Table 2-7 of Revised ERA). These include fiveinvertebrates, two fish, six amphibians and reptiles, seven birds, two mammals, and many plants.
Federal-listed endangered species found in or along the river include -the Karner blue butterfly
(Lycaeides melissa samuelis), shortnose sturgeon (Acipenser brevirostrum), peregrine falcon (Falco
peregrinus), and Indiana bat (Myotis sodalis).
Within the tidal (lower) portion of the Hudson River, 34 sites have been designated asSignificant Coastal Fish and Wildlife Habitats under the NYS Coastal Management Program(NYSDOS, 1987). Five additional sites have been identified as containing important plant and
animal communities to bring the total number of sites to 39 (see Table 2-8 of Revised ERA;
USEPA 2000q; derived from NYSDOS and the Nature Conservancy, 1990). These areas are
unique, unusual, or necessary for continued propagation of key species. Habitats (and their
associated communities) present in significant habitats include freshwater and brackish watershallows, mudflats, marshes, swamp forest, deepwater, and creeks. Many areas provide spawning
areas for fish and are used as resting and feeding areas for migratory birds.
Fish and Wildlife Coordination Act, 16 USC § 662
The Fish and Wildlife Coordination Act requires consideration of the effects of a proposed
action on wetlands and areas affecting streams (including floodplains), as well as other protectedhabitats. Federal agencies must consult with the United States Fish and Wildlife Service (USFWS)
and the appropriate state agency with jurisdiction over wildlife resources prior to issuing permits 'or undertaking actions involving the modification of any body of water (including impoundment,diversion, deepening, or otherwise controlled or modified for any purpose). The requirements ofthis act are applicable for alternatives involving remediation activities in wetlands or floodplains. "
• - otoCJI
2-13 TAMS
Farmland Protection Policy Act of 1981,7 USC § 4201 et seq.-, 7 CFR Part 658
This act regulates the extent to which federal programs contribute to the unnecessary andirreversible conversion of farmland to non-agricultural uses. Federal agencies must use the criteria(40 CFR § 658.5) to identify and take into account the adverse effects of their programs on the
preservation of farmland; to consider alternative actions that could lessen adverse effects; and toascertain that their programs are, to the extent practicable, compatible with state and localgovernment and private programs and policies to protect farmland.
National Historic Preservation Act of 1966 (NHPA); 16 USC § 470 etseq.\ 36 CFR Part 800
Under Section 106 of the NHPA, federal agencies must take into account the effects of their
actions on any district, site, building, structure, or object included in, or eligible for inclusion in,
. the National Register of Historic Places. Implementing regulations for Section 106 established by
the Advisory Council on Historic Preservation (ACHP), established under 36 CFR Part 800, provide
specific criteria for identifying adverse effects of federal undertakings on historic properties.
Effects to cultural resources listed on, or eligible for listing on, the National Register of Historic
Places are evaluated with regard to the Criteria of Adverse Effect. If the undertaking results in
adverse effects, then the agency must consult with the State Historic Preservation Office (SHPO)
and other consulting parties to develop ways to avoid, reduce, minimize, or mitigate the impact of
the undertaking on historic properties. An initial review of sites potentially subject to the regulation
is presented in subsection 1.2.1 of this FS.
2.4.2 New York State Location-Specific ARARs
New York ECL Article 24 Title 7, Freshwater Wetlands; 6 NYCRR Parts 662 - 665
Freshwater wetlands of New York State are protected under Article 24 of the ECL,
commonly known as the Freshwater Wetlands Act (FWA). Wetlands protected under Article 24
are known as New York State regulated wetlands. The regulated area includes the wetlandsthemselves and a protective buffer or adjacent area that extends 100 feet landward of the wetland
boundary. All freshwater wetlands with an area of 12.4 acres or greater are depicted on a set of
2-14 TAMS400357
maps published by NYSDEC. Wetlands less than 12.4 acres may also be mapped if they have
| unusual local importance. Four classes of wetlands (Class I, the most valuable, through Class IV,
.., the least valuable) have been established and are ranked according to their ability to perform
I wetland functions and provide wetland benefits. Vegetative cover, ecological associations, special
I features, hydrological and pollution control features, distribution, and location are factors
' considered in the determination of wetland benefit.
* Regulated activities include, among others, dredging, draining, excavation, and removal of
I' sand, soil, mud, shells, gravel, and other aggregate from any freshwater wetland (ECL § 24-
0701(2)). Regulations on activities are provided in 6 NYCRR Part 665; procedural requirements
I*-* are specified in 6 NYCRR Part 663.f •
New York ECL Article 3, Title 3; Article 27, Titles 7 and 9; 6 NYCRR § 373-2 - GeneralFacility Standards
^^ Location standards, which establish construction requirements for a hazardous waste facility
in a 100-year floodplain, are provided in 6 NYCRR § 373-2.2(j)(l).
; New York State ECL Article 11, Title 5 - Endangered and Threatened Species of Fish and•: Wildlife - Species of Special Concern; 6 NYCRR Part 182
The New York State endangered species legislation enacted in 1970 was designed to
complement the federal ES A by authorizing NYSDEC to adopt the federal endangered species list
so that prohibitions of possession or sale of federally listed species and products could be enforced
by state enforcement agents. The state list can therefore include species that, while plentiful
" elsewhere, are endangered in New York. The law was amended in 1981 to authorize the adoption
of a list of threatened species that would receive protection similar to endangered species. In: addition to the threatened species list, NYSDEC also adopted a list of species of special concern,
species for which a risk of endangerment has been documented by NYSDEC. The law and
regulations restrict activities in areas inhabited by endangered species. The list of state-regulated, - species in the Upper and Lower Hudson River is presented in the Revised ERA (USEPA, 2000q). ^
oThe taking of any endangered or threatened species is prohibited, except under a permit or license otoi/i00
2-15 TAMS
issued by NYSDEC. The destroying or degrading the habitat of a protected animal likely
constitutes a "taking" of that animal under NY ECL § 11-0535.
2.4.3 Location-Specific Criteria, Advisories, and Guidance to Be Considered
The location-specific TBC criterion identified for this FS is listed in Table 2-2b.
USEPA Office of Solid Waste and Emergency Response - Policy on Floodplains and WetlandAssessments for CERCLA Actions, August 1985
Superfund actions must meet the substantive requirements of the Floodplain Management
Executive Order (EO 11988) and the Protection of Wetlands Executive Order (EO 11990) (see
Table 2-2a: Location-Specific ARARs). This memorandum discusses situations that require
preparation of a floodplains or wetlands assessment, and the factors that should be considered in
preparing an assessment, for response actions taken pursuant to Section 104 or 106 of CERCLA.
For remedial actions, a floodplain/wetlands assessment must be incorporated into the analysis
conducted during the planning of the remedial action.
2.5 Action-Specific ARARs
Action-specific ARARs are usually technology- or activity-based limitations that control
actions at CERCLA sites. After remedial alternatives are developed, action-specific ARARspertaining to proposed site remedies provide a basis for assessing the feasibility and effectiveness
of the remedies. For example, action-specific ARARs may include hazardous waste transportation
and handling requirements, air and water emissions standards, and landfilling and treatmentrequirements of TSCA and RCRA. Potential action-specific ARARs are presented in Table 2-3a.
Action-specific TBCs appear in Table 2-3b.
2-16 TAMS400359

,:.;
2.5.1 Federal Action-Specific ARARs
TSCA, Title 1,15 USC Section 2605; 40 CFR §761.50 - 761.79
TSCA provides USEPA with authority to require testing of both new and existing chemical
substances entering the environment, and to regulate them where necessary. TSCA requirements
do not apply to PCBs at concentrations less than 50 ppm. USEPA guidance provides that the form
and concentration of the PCB contamination be determined on an "as found" basis, rather than on
the original form and concentration of PCB materials prior to their release. PCBs can not be
diluted, however, to escape TSCA requirements.
TSCA establishes prohibitions and requirements for the manufacturing, processing,
distribution in commerce, use, disposal, storage, and marking of PCBs. 40 CFR Part 761 includes
provisions for incineration, disposal, storage for disposal, chemical waste landfills,
decontamination, clean-up policy, record keeping, and reporting for PCBs.
SubpartD of 40 CFR 761, as revised June 29, 1998, with technical corrections in June 1999,
contains the following applicable provisions regarding PCBs:
• 40 CFR § 761.50 identifies disposal requirements for various PCB waste types.
• 40 CFR § 761.61 addresses cleanup and disposal options for PCB remediation waste, which
includes PCB-contaminated sediments and dredged materials. Disposal options for PCBremediation waste include disposal in a high-temperature incinerator, an approved chemical
waste landfill, or a facility with a coordinated approval under 40 CFR § 761.77. PCB
remediation waste containing PCBs at concentrations less than 50 ppm may be disposed of
off site in an approved disposal facility for the management of municipal solid waste, or ina disposal facility approved under 40 CFR part 761. 40 CFR §761.61(c) allows a USEPA
Regional Administrator to approve a risk-based disposal method that will not pose an
unreasonable risk of injury to human health or the environment.
2-17 TAMS
40 CFR 761.65 states that PCB waste must be removed from storage within one year fromthe time it was removed from service for disposal, and identifies storage facility and
container requirements. An exemption from this regulation exists for containerized non-
liquid PCBs (soil, rags, debris), which may be stored for up to 30 days from the date they
were removed from service for disposal at a facility not meeting the technical requirements.A request for an extension of up to one additional year may be made to the USEPARegional Administrator. PCBs may be stored at facilities in compliance with RCRAprovisions (RCRA section 3004 or 3006). Storage in floodplains is prohibited. This section
may be applicable should dredged materials be stored before incineration or land disposal.
40 CFR § 761.70 covers the incineration of PCBs. Incinerators for the burning of PCBs
must be approved by the USEPA Regional Administrator for incinerators operating only inRegion n or the Director, Exposure Evaluation Division for multi-region facilities, pursuant
to 40 CFR § 761.70(d), which lists application requirements. Specific technical
requirements for incineration of non-liquid PCBs (40 CFR § 761.70(b)) include:
• Air emissions no more than 0.001 g PCBs/kg PCBs in feed,
• Combustion efficiency (CO2/CO ratio) minimum of 99.9 percent,
• Monitor feed at 15-minute intervals,
• Continuous temperature monitoring,
• Stack gas monitoring at startup and any change of conditions (O2, CO, CO2, NOX,HC1, total chlorinated organics, PCBs, and particulate matter),
• Combustion and operation monitoring (continuous for O2 and CO, and periodic forfeed when either the combustion or feed monitoring systems fail), and
• Water scrubbers to control HC1 emissions.
40 CFR § 761.75 applies to facilities used for land disposal of PCBs. In general, a chemical
waste landfill for PCBs must be approved by the USEPA Regional Administrator. The
landfill must meet technical requirements that include, but are not limited to, the following:
soil consistency surrounding the landfill (e.g., either permeability < 10"7 cm/sec or a
synthetic liner); siting requirements (not in flood zones; not hydraulically connected to
2-18 400361 TAMS
surface water); flood protection; topography; and appropriate record maintenance (40 CFR761.75 (b)).
• 40 CFR § 761.79 provides decontamination standards and procedures for removing PCBs
that are regulated for disposal from water, organic liquids, and other materials.
RCRA Section 3004,42 USC § 6924; 40 CFR Part 264
40 CFR Part 264 lists standards applicable for an owner or operator of hazardous waste
treatment, storage, and disposal facilities. This part includes general facility standards, releasesfrom the facility, contingency plan, and emergency procedures for the generator of hazardous waste,landfills and incinerators. Much of the RCRA program has been authorized in New York State.
In accordance with USEPA policy, the authorized portions of the New York State RCRA program,
rather than the federal regulations, constitute ARARs. Therefore, only those federal RCRA
regulations that have not been fully authorized in New York State are cited below as potentialfederal ARARs. Specific sections of 40 CFR Part 264 that may constitute ARARs are listed below.
40 CFR § 264.13(b)(8) requires the owner or operator of a facility that treats, stores, ordisposes of hazardous wastes to develop and follow a written waste analysis plan.
40 CFR § 264.232 addresses surface impoundments, and details the design, construction,
operation, monitoring, inspection, and contingency plans required for a RCRA surface
impoundment. Wastes must be managed in accordance with 40 CFR 264 Subparts BB (Air
Emission Standards for Equipment Leaks) and CC (Air Emission Standards for Tanks,Surface Impoundments, and Containers).
Section 404(b)(l) Guidelines for Specification for Disposal Sites for Discharge of Dredged orFill Material; 40 CFR Part 230
it»Establishes guidelines for specification of disposal sites for dredged or fill material. Except oo
as otherwise provided in the CWA Section 404(b)(2), no discharge of dredged or fill material is *£to
permitted if there is a practicable alternative to the proposed alternative which would have less
2-19 TAMS
adverse impact on the aquatic ecosystem, so long as the alternative does not have other significantadverse environmental consequences. The guidelines include criteria for evaluating whether a
particular discharge site may be specified.
Section 404(c) of the CWA, 33 USC § 1344(c); 40 CFR Part 231; 33 CFR Parts 320,323, and325
These regulations apply to all existing, proposed, or potential disposal sites for discharges
of dredged or fill materials into US waters, which include wetlands. The regulations include specialpolicies, practices, and procedures to be followed by the USAGE in connection with the review ofapplications for permits to authorize such discharge of dredged or fill material.
Section 10, Rivers and Harbors Act, 33 USC § 403; 33 CFR Part 322
USAGE approval is generally required to excavate or fill, or in any manner to alter or
modify the course, location, condition, or capacity of the channel of any navigable water of the
United States. In accordance with CERCLA Section 121(e)(l), no federal, state, or local permits
are required for remedial action that is conducted entirely on site, although the remedial action must
comply with the substantive requirements of Section 10 of the Rivers and Harbors Act and 33 CFR
Part 322.
Hazardous Materials Transportation Act (HMTA), as amended, 49 USC §§ 5101 - 5127; 49CFR Part 171: Department of Transportation Rules for Transportation of HazardousMaterials
This regulation outlines procedures for packaging, labeling, manifesting, and transporting
of hazardous materials to a licensed off-site disposal facility.
2-20 400363 TAMS
2.5.2 New York State Action-Specific ARARs
New York State ECL Article 27, Title 7; 6 NYCRR Part 360 - Solid Waste ManagementFacilities
These regulations identify the requirements for design, construction, operation and closure,and other solid waste management activities for solid waste management facilities.
New York State ECL Article 27, Title 11; 6 NYCRR Part 361 - Siting of Industrial HazardousWaste Facilities
This regulation establishes criteria for siting industrial hazardous waste treatment, storage,
and disposal facilities, regulates the siting of new industrial hazardous waste facilities locatedwholly or partially within New York State, and identifies criteria by which the facilities siting board
will determine whether to approve a proposed industrial hazardous waste facility.
New York State ECL Article 27, Title 3; 6 NYCRR Part 364 - Standards for WasteTransportation
These regulations identify the requirements for the collection, transport, and delivery of
regulated wastes, including hazardous wastes.
New York State ECL Article 27, Title 9; 6 NYCRR Parts 370 and 371 - Standards forHazardous Waste Management
6 NYCRR Parts 370 and 371 provide specific New York State regulations for activities
associated with hazardous waste management. Part 371 identifies and lists wastes consideredhazardous under New York State law. The Part 371 regulations generally follow the federal RCRAregulations and definitions. However, §371.4(e)(l) specifically adds PCBs at concentrations of 50
.ppm or greater (on a dry weight basis; with the exception of liquid wastes), including dredged
materials, to the state's list of hazardous wastes. (PCBs are regulated under the federal TSCAprogram, not under RCRA.)
0°CJ
cr>
2-21 TAMS

New York State ECL Article 3, Title 3; Article 27, Titles 7 and 9; 6 NYCRR Part 372 -Hazardous Waste Manifest System and Related Standards — -\
These regulations outline standards for generators and transporters of hazardous waste, and j
standards for generators, transporters, and treatment, storage, or disposal facilities relating to theuse of hazardous waste manifest system. I
New York State ECL Article 3, Title 3; Article 27, Titles 7 and 9; 6 NYCRR Part 373 - jHazardous Waste Management Facilities
These regulations establish requirements for treatment, storage, and disposal of hazardous Iwaste; permit requirements; and construction and operation standards for hazardous waste -management facilities. '•-.
New York State ECL Article 27, Title 13; 6 NYCRR Part 375 - Inactive Hazardous WasteDisposal Sites
These regulations establish requirements for the development and implementation of
inactive hazardous waste disposal site remedial programs.
New York State ECL Article 27, Titles 9; 6 NYCRR Part 376 - Land Disposal Restrictions
These regulations require that PCB wastes including dredge spoils with PCB concentrationsgreater than 50 mg/kg be disposed of in accordance with federal PCB regulations at 40 CFR 761.
New York State ECL, Article 19, Title 3 - Air Pollution Control Law; 6 NYCRR Parts 200-257 - Air Pollution Control Regulations
The NYSDEC regulations that pertain to emissions are 6 NYCRR Parts 200, 202, 211,212,
219, and 257. The emission of air contaminants that jeopardize human, plant, or animal life, are
ruinous to property, or cause a level of discomfort is strictly prohibited (6^ NYCRR 211). Adoptedpursuant to New York State's Air Pollution Control Law, and submitted to and approved by
USEPA pursuant to Section 110 of federal Clean Air Act, 42 USC § 7401. The USEPA-approved
New York State regulations are listed at 40 CFR § 52.1679.
400365 TAMS

New York State ECL Article 15, Title 5, and Article 17, Title 3; 6 NYCRR Part 608 - Use andProtection of Waters
These regulations cover excavation and fill of the navigable waters of the state. No person,
local public corporation or interstate authority may excavate from or place fill, either directly orindirectly, in any of the navigable waters of the state or in marshes, estuaries, tidal marshes and
wetlands that are adjacent to and contiguous at any point to any of the navigable waters of the state,and that are inundated at mean high water level or tide, without a permit (6 NYCRR 608.5). Inaccordance with CERCLA Section 121(e)(l), no federal, state, or local permits are required for
remedial action that is conducted entirely on site, although the remedial action must comply withthe substantive requirements of this statute and associated regulations.
New York ECL Article 17, Title 8; 6 NYCRR Part 750-758 - Water Resources Law
These regulations provide standards for storm water runoff, surface water, and groundwater
discharges. In general, they prohibit discharge of any pollutant to the waters of New York without
a SPDES permit. In accordance with CERCLA Section 121(e)(l), no federal, state, or local permitsare required for remedial action that is conducted entirely on site, although the remedial action must
comply with the substantive requirements of the Water Resources Law.
New York ECL Article 17, Title 5
It shall be unlawful for any person, directly or indirectly, to throw, drain, run or otherwise
discharge into such waters organic or inorganic matter that shall cause or contribute to a conditionin contravention of applicable standards (identified at 6 NYCRR § 701.1).
New York ECL Article 11, Title 5
The Fish and Wildlife Law against water pollution provides that no" deleterious or poisonous -'substances shall be thrown or allowed to run into any public or private waters in quantities injurious
' *
to fish life, protected wildlife or waterfowl inhabiting those waters, or injurious to the propagation 0. u>
of fish, protected wildlife or waterfowl therein. °*G\
2-23 TAMS
2.5.3 Action-Specific Criteria, Advisories, and Guidance to be Considered
After review of federal and state sources, the following action-specific TBC criteria andguidance were identified (see Table 2-3b).
USEPA - Covers for Uncontrolled Hazardous Waste Sites
This guidance document (EPA/540/2-85-002; USEPA, 1985) provides criteria for coversfor uncontrolled hazardous sites which include a vegetated top cover, middle drainage layer, and
low permeability layer.
USEPA Rules of Thumb for Superfund Remedy Selection
This document (EPA 540/R-97/013; USEPA, 1997d) describes key principles and
expectations, as well as "best practices" based on program experience, for the remedy selection
process under Superfund. Major policy areas covered are risk assessment and risk management,
developing remedial alternatives, and ground-water response actions.
USEPA Land Use in the CERCLA Remedy Selection Process
This document (OSWER Directive No. 9355.7-04; USEPA 1995) Presents information forconsidering land use in making remedy selection decisions at NPL sites.
USEPA Contaminated Sediment Strategy
This document (EPA/823/R-98/001; USEPA 1998e) establishes an Agency-wide strategy
for contaminated sediments, with the following four goals: 1) prevent the volume of contaminatedsediments from increasing; 2) reduce the volume of existing contaminated sediment; 3) ensure thatsediment dredging and dredged material disposal are managed in an environmentally sound manner;and 4) develop scientifically sound sediment management tools for use in pollution prevention,
source control, remediation, and dredged material management. The strategy includes the Hudson
River in its case studies of human health risks. ;
2-24 400367 TAMS
USEPA Structure and Components of Five-Year Reviews; Supplemental Five-Year ReviewGuidance Second Supplemental Five-Year Review Guidance
These documents (OSWER Directive 9355.7-02, USEPA 1991; OSWER Directive 9355.7-
02A, USEPA 1994; and OSWER Directive 9355.7-03A, USEPA 1995) provide guidance onconducting Five-Year Reviews for sites at which hazardous substances, pollutants, or contaminantsremain on-site above levels that allow for unrestricted use and unlimited exposure. The purpose
of the Five-Year Review is to evaluate whether the selected response action continues to beprotective of public health and the environment and is functioning as designed.
NYSDEC Division of Air Resources: Air Guide 1 - Guidelines for the Control of ToxicAmbient Air Contaminants
This document provides guidance for the control of toxic ambient air contaminants in New
York State. Current annual guideline concentrations (AGCs) for PCBs are 0.01 ug/m3 for
inhalation of evaporative congeners (Aroclors 1242 and below) and 0.002 ug/m3 for inhalation of
persistent highly chlorinated congeners (Aroclors 1248 and above) in the form of dust or aerosols.
NYSDEC Technical and Operational Guidance Series (TOGS) 1.1.1 Ambient Water QualityStandards and Guidance Values
TOGS 1.1.1 provides guidance for developing discharge limitations and monitoringconditions for discharges to surface waters (NYSDEC, 1998).
NYSDEC TOGS 1.2.1 - Industrial SPDES Permit Drafting Strategy for Surface Waters
TOGS 1.2.1 provides guidance for writing permits for discharges of wastewater fromindustrial facilities and for writing requirements equivalent to SPDES permits for discharges from
remediation sites.
ooU)a\CO
2-25 TAMS
NYSDEC TOGS 1.3.1 - Waste Assimilative Capacity Analysis & Allocation for Setting WaterQuality Based Effluent Limits
TOGS 1.3.1 provides guidance to water quality control engineers in determining whether
discharges to waterbodies have a reasonable potential to violate water quality standards and
guidance values.
NYSDEC TOGS 1.3.2 - Toxicity Testing in the SPDES Permit Program
TOGS 1.3.2 describes the criteria for deciding when toxicity testing will be required in a
permit and the procedures which should be followed when including toxicity testing requirements
in a permit.
NYSDEC TOGS 1.3.7 - Analytical Detectability & Quantitation Guidelines for SelectedEnvironmental Parameters
TOGS 1.3.7 provides method detection limits and practical quantitation limits for pollutants
in distilled water.
NYSDEC Technical and Administrative Guidance Memorandum (TAGM) 4031 - FugitiveDust Suppression and Particulate Monitoring Program at Inactive Hazardous Waste Sites
TAGM 4031 provides guidance on fugitive dust suppression and particulate monitoring for
inactive hazardous waste sites.
NYSDEC Interim Guidance on Freshwater Navigational Dredging, October 1994
This document (NYSDEC, 1994a) provides guidance for navigational dredging activities
in freshwater areas.
2-26 TAMS

NYSDEC Division of Fish, Wildlife and Marine Resources - Fish and Wildlife ImpactAnalysis (FWIA) for Inactive Hazardous Waste Sites, October 1994
This document (NYSDEC, 1994b) provides the rationale and methods for sampling and
evaluating impacts of a site on fish and wildlife during the remedial investigation and other stages
of the remedial process.
oW<IO
2-27 TAMS

nBS
400371

^ 3. IDENTIFICATION OF REMEDIAL ACTION OBJECTIVES (RAOs) ANDRESPONSE ACTIONS
Remedial action objectives (RAOs) serve as guidelines in the development of alternativesfor site remediation. RAOs specify the contaminants and media of concern, exposure routes andpotential receptors, and an acceptable concentration limit or range for each contaminant for each ofthe various media, exposure routes, and receptors. The basis and development of the RAOs arepresented in Section 3.1. The RAOs, listed in Section 3.2, are then used to establish specificremedial goals for contaminated media; these preliminary remedial goals (PRGs) presented inSection 3.3 serve to focus the development of alternatives or remedial technologies that can achievethe remedial goals. Section 3.4 discusses the limitations of remediation in meeting some of thePRGs.
Section 3.5 presents the development of the selection criteria to identify sediments for
remediation. The resulting estimates for areas and volumes to be remediated are also provided.
^^ General response actions (GRAs) for achieving the RAOs and PRGs are identified in Section 3.6.
3.1 Basis and Development of Remedial Action Objectives
The results of the revised human health risk assessment (Revised HHRA), as identified in
Chapter 1, were used to calculate risk-based concentrations (RBCs) of PCBs corresponding tovarious cancer risks and non-carcinogenic human heath hazards. The results of the revised
[;.., ecological risk assessment (Revised ERA), based on no-observed-adverse-effects-levels (NOAELs)and lowest-observed-adverse effect levels (LOAELs), were used to calculate toxicity quotients (TQs)
K;ii for ecological receptors. These risk assessments were summarized in Section 1.5 of this FS.
I RAOs are developed in order to set targets for achieving PRGs (ARARs and RBCs that areprotective of human health and the environment) early in the remedial alternative development
( • : • • ' <j process. The RAOs should be as specific as possible, without unduly limiting the range of
alternatives that can be developed. o/: j y***"**- f~i
I »Jto
3-1 TAMS
In the original 1984 FS (USEPA, 1984b), the contaminants of concern were total PCBs,
which remain the contaminants of concern for this Reassessment RI/FS. The principal site-relatedrisks to both human and ecological receptors are associated with the consumption of PCB-
contaminated fish. A range of RBCs for PCBs in fish has been calculated (Section 3.2) based on
these completed risk assessments. The concentrations of PCBs in fish are in turn a function of boththe sediment and water concentrations of PCBs, and are, to some extent, species-dependent.
Using the linear FISHPATH component of the FISHRAND model, fish PCB concentrationswere calculated using various assumptions of inputs to the system (i.e., upstream water column Tri+PCB loadings) and theoretical possible final (post-remediation) Tri+ PCB surface sedimentconcentrations in the Upper Hudson River. The calculated fish concentrations indicated that it would
be extremely difficult to meet some of the PRGs, especially ecological PRGs based on NOAELs,
with the current upstream Tri+ PCB concentration on the order of about 13 ng/L (based on data fromthe last three years).
In consideration of the factors discussed above, USEPA has established the following RAOs
for the Hudson River Reassessment FS, where applicable:
• Reduce the cancer risks and non-cancer health hazards for people eating fish from the
Hudson River by reducing the concentration of PCBs in fish.
• Reduce risks to ecological receptors by reducing the concentration of PCBs in fish.
• Reduce PCB concentrations in river (surface) water that are above ARARs.
• Reduce the inventory (mass) of PCBs in sediment that are or may be bioavailable.
• Minimize the long-term downstream transport of PCBs in the river.
400373 TAMS
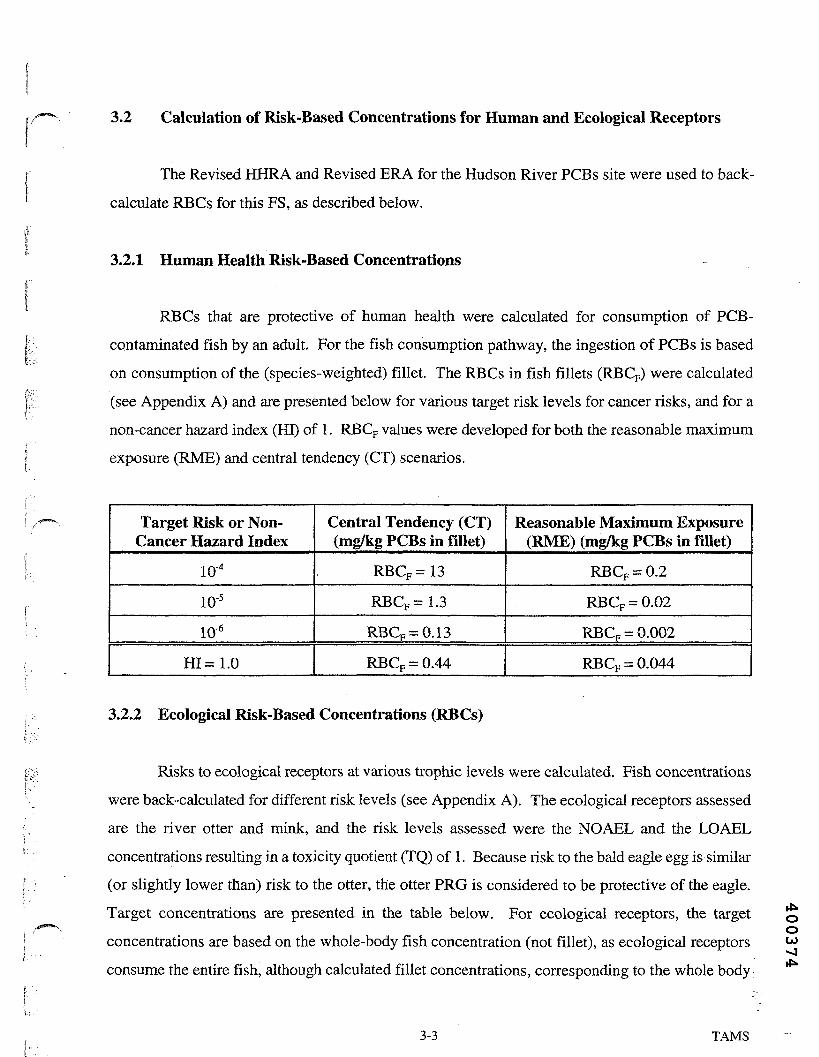
3.2 Calculation of Risk-Based Concentrations for Human and Ecological Receptors
The Revised HHRA and Revised ERA for the Hudson River PCBs site were used to back-calculate RBCs for this FS, as described below.
3.2.1 Human Health Risk-Based Concentrations
RBCs that are protective of human health were calculated for consumption of PCB-
contaminated fish by an adult. For the fish consumption pathway, the ingestion of PCBs is basedon consumption of the (species-weighted) fillet. The RBCs in fish fillets (RBCF) were calculated(see Appendix A) and are presented below for various target risk levels for cancer risks, and for anon-cancer hazard index (HI) of 1. RBCF values were developed for both the reasonable maximum
exposure (RME) and central tendency (CT) scenarios.
Target Risk or Non-Cancer Hazard Index
lo-4
io-5
io-6
HI =1.0
Central Tendency (CT)(mg/kg PCBs in fillet)
RBCF=13
RBCp =1.3
RBCF = 0.13
RBCp = 0.44
Reasonable Maximum Exposure(RME) (mg/kg PCBs in fillet)
RBCF = 0.2
RBCp = 0.02
RBCp = 0.002
RBCp = 0.044
3.2.2 Ecological Risk-Based Concentrations (RBCs)
Risks to ecological receptors at various trophic levels were calculated. Fish concentrationswere back-calculated for different risk levels (see Appendix A). The ecological receptors assessed
are the river otter and mink, and the risk levels assessed were the NOAEL and the LOAELconcentrations resulting in a toxicity quotient (TQ) of 1. Because risk to the bald eagle egg is similar
(or slightly lower than) risk to the otter, the otter PRO is considered to be protective of the eagle.
Target concentrations are presented in the table below. For ecological receptors, the target
concentrations are based on the whole-body fish concentration (not fillet), as ecological receptors
consume the entire fish, although calculated fillet concentrations, corresponding to the whole body
oou>
3-3 TAMS
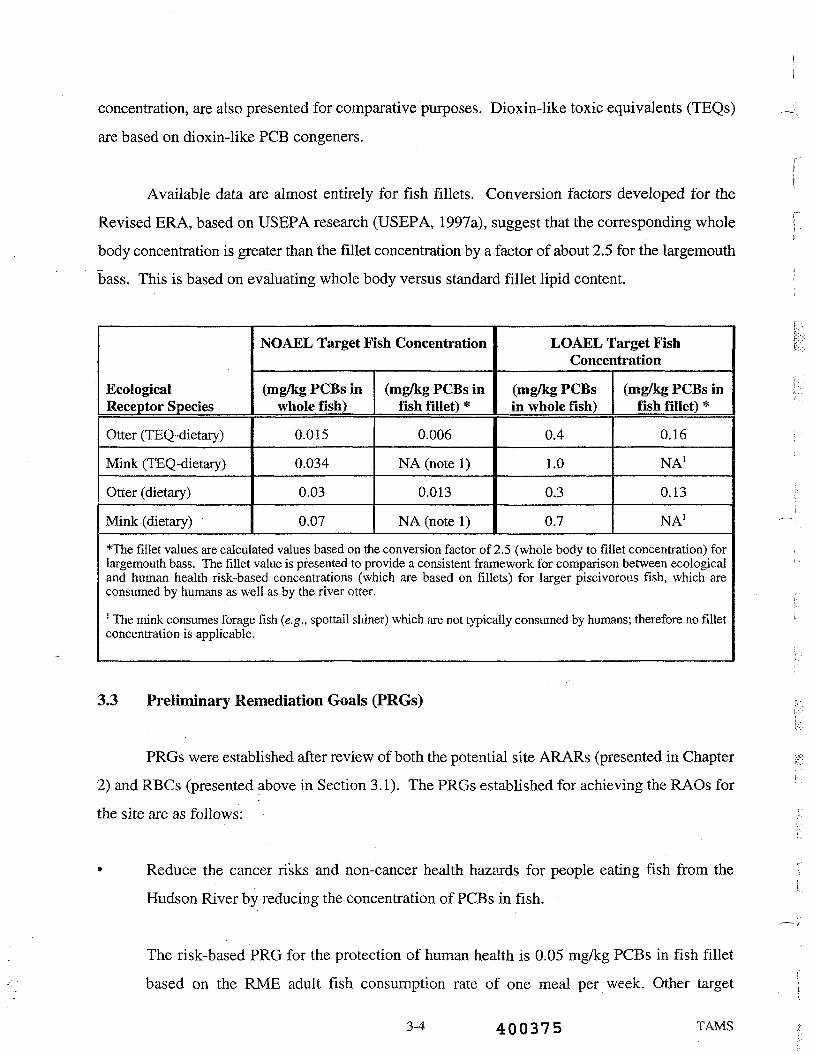
concentration, are also presented for comparative purposes. Dioxin-like toxic equivalents (TEQs)
are based on dioxin-like PCB congeners.
Available data are almost entirely for fish fillets. Conversion factors developed for the
Revised ERA, based on USEPA research (USEPA, 1997a), suggest that the corresponding whole
body concentration is greater than the fillet concentration by a factor of about 2.5 for the largemouth
bass. This is based on evaluating whole body versus standard fillet lipid content.
EcologicalReceptor Species
Otter (TEQ-dietary)
Mink (TEQ-dietary)
Otter (dietary)
Mink (dietary)
NOAEL Target Fish Concentration
(mg/kg PCBs inwhole fish)
0.015
0.034
0.03
0.07
(mg/kg PCBs infish fillet) *
0.006
NA (note 1)
0.013
NA (note 1)
LOAEL Target FishConcentration
(mg/kg PCBsin whole fish)
0.4
1.0
0.3
0.7
(mg/kg PCBs infish fillet) *
0.16
NA1
0.13
NA1
*The fillet values are calculated values based on the conversion factor of 2.5 (whole body to fillet concentration) forlargemouth bass. The fillet value is presented to provide a consistent framework for comparison between ecologicaland human health risk-based concentrations (which are based on fillets) for larger piscivorous fish, which areconsumed by humans as well as by the river otter.1 The mink consumes forage fish (e.g., spottail shiner) which are not typically consumed by humans; therefore no filletconcentration is applicable.
3.3 Preliminary Remediation Goals (PRGs)
PRGs were established after review of both the potential site ARARs (presented in Chapter
2) and RBCs (presented above in Section 3.1). The PRGs established for achieving the RAOs for
the site are as follows:
• Reduce the cancer risks and non-cancer health hazards for people eating fish from the
Hudson River by reducing the concentration of PCBs in fish.
The risk-based PRO for the protection of human health is 0.05 mg/kg PCBs in fish fillet
based on the RME adult fish consumption rate of one meal per week. Other target
3-4 400375 TAMS

j/*"'*N concentrations are 0.2 mg/kg total PCBs in fish fillet, which is protective at a fish
' consumption rate of about one meal per month, and 0.4 mg/kg PCBs in fish fillet, which is
I protective of the average angler who consumes about one meal every two months. TheseI
targets of higher concentrations in fish represent points at which fish consumption advisories
f might become less stringent (e.g., the "eat none" advisory for the Upper Hudson could berelaxed as conditions improve).
• Reduce risks to ecological receptors by reducing the concentration of PCBs in fish.pi
The risk-based PRO for the ecological exposure pathway is a range from 0.3 to 0.03 mg/kg1 total PCBs in fish (whole body), which corresponds to PCB concentrations of 0.12 to 0.012I
mg/kg in fish fillets. The ecological PRO is based on the LOAEL and NOAEL for
consumption of whole fish by the river otter, an upper trophic level piscivorous mammal
(TQfLOAEL or NOAELJ-DIET = !)• Consideration was also given to use of TEQ-based NOAEL of—^ 0.015 mg/kg (whole body) for dioxin-like PCBs; however, use of this criterion requires
congener-specific data that are not routinely available, and would not necessarily achievegreater protection of wildlife. Furthermore, there is more uncertainty associated with the
TEQ-based NOAEL than the PCB-based NOAEL.
• Reduce PCBs in sediments in order to reduce PCB concentrations in river (surface) waterthat are above surface water ARARs.
The ARARs for surface water are:
1 x 10'6 Aig/L (one part per quadrillion) total PCBs, the New York State (NYS)
ambient water quality standard for the protection of health of human consumers offish;
• 1.2 x 10"4 jugiL, the NYS standard for protection of wildlife;
• 1 x 10"3 //g/L, the federal ambient water quality criterion for navigable waters;it*
• 0.09 /ug/L, the NYS standard for protection of human health and drinking water °if W^ ^_J
, wsources; and oen
• 0.0005 mg/L (0.5 yUg/L), the federal maximum contaminant level (M.C.L.) for PCBs
in drinking water.
3-5 TAMS

No specific numerical PRGs were developed for the final two RAOs:
• Reduce the inventory (mass) of PCBs in sediment that are or may be bioavailable.
• Minimize the long-term downstream transport of PCBs in the river.
Use of PRGs does not preclude the development and consideration or selection of alternativesthat attain other risk levels. Final selection of the appropriate level of risk is made based on thebalancing of criteria in the remedy selection step of the process. Site-specific considerations that
may affect the achievement of these PRGs are discussed immediately below (Section 3.4).
3.4 Limitations on Meeting PRGs
Current and future concentrations of PCBs in the water at the upstream end of the Upper
Hudson River (i.e., upstream of Rogers Island [RM 194.6]) are expected to limit the ability of
remedial actions to achieve the stringent PRGs for fish and water established for the site. These fall
into two categories: limitation of analytical (measurement) systems that may impact verification of
stringent PCB PRGs (subsection 3.4.3), and uncertainty associated with the effect of ongoing or
planned remediation upstream of Rogers Island conducted by GE and others (subsections 3.4.1 and
3.4.2).
3.4.1 Surface Water PRGs
Achievable and verifiable remediation targets for water are constrained by continued releases
of PCBs into the river system, as well as by the aforementioned limitations of current analytical
methodologies discussed in subsection 3.4.4. These continued releases are defined as the PCB load
entering the site from upstream of Rogers Island (RM 194.6). These upstream loads are not subject
to remedial actions within this FS, but these are largely being addressed separately. Existing data
show the presence of low-concentration inputs (detectable concentrations of less than 2 ng/L) north
of known GE inputs (i.e., from Glens Falls and north) as well as PCB leakage from bedrock at the
GE Hudson Falls plant. Each of these issues is discussed below.
4003773-6 TAMS
The upstream baseline for the Reassessment RI/FS is defined as the PCB conditions observed
in the river above the GE Hudson Falls plant, i.e., just above Bakers Falls Dam at RM 196.1. It is
not equivalent to an uncontaminated background condition, as a number of sources of PCB loads are
present upstream of Bakers Falls (see Appendix A). Concentrations of PCBs in the water and fish
upstream of Baker Falls are, however, much lower than those below Bakers Falls.
I A potential PCB source above Bakers Falls between RM 196.1 and RM 210 is the NiMo
Queensbury Site, as shown on Figure 3-1. NYSDEC is currently evaluating the feasibility of furtherI remediation at this site.
Water column data are less extensive than fish data in the region extending upstream of GlensFalls, both temporally and spatially. USEPA data (1997a) suggest mean total PCB concentrations
in water that are less than 2 ng/L and probably less than 1 ng/L are typical in this part of the river.PCBs are not detected in most samples (at a reporting limit of 11 ng/L) in the more frequent but less
sensitive GE data at Fenimore Bridge, just upstream of Bakers Falls Dam, although the results doshow occasional spike concentrations that are quite high (387 ng/L maximum). It is most likely,
however, that these values are the result of remedial activities by GE at its Hudson Falls plant and
at Bakers Falls Dam. This is based on the observation that the homologue patterns of the spikes are
very different from the normal patterns seen at the station. The pattern of the spike concentrations
closely resembles the Aroclor mixtures released by GE.
Additionally, the spike concentrations are principally found in the period 1995-1996, during
which time the Baker Falls Dam was undergoing replacement. These concentrations were reduced
following the completion of the remedial and repair activities at the Bakers Falls Dam completed in1996. The otherwise irregular and low concentrations seen at Bakers Falls suggest that the reported
PCB levels can be attributed to other non-PCB compounds in solution that interfere with the PCB
measurements. A true local source generating 1 to 2 ng/L to the water column would have a moreconsistent homologue signal, as can be seen in the fish data from this region.
OOU>»J00
3-7 JAMS

3.4.1.1 Baseline Input at Glens Falls j
PCBs are typically present at low concentrations in watersheds affected by human activity, f'I
and the Hudson River is no exception. Limited data (see USEPA, 1997a) suggest that the upstreamconcentration of PCBs in water, as measured north of any of the former GE facilities (i.e., at Glens |:
iFalls and Fenimore Bridge), is in the range of about 1 ng/L total PCBs, although this value issomewhat uncertain due to the limited number of measurements and the fact that the reported values [
i;
are on the extreme low end of the analytical detection range. It is likely that the input at Glens Fallsr
is lower now than in 1993, due to the remediation conducted since then at the NiMo Queensbury site. jHowever, due to the relatively high quantitation limits of the GE data at Glens Falls and Fenimore
•i.
Bridge (11 ng/L PCBs in water), this cannot be confirmed analytically from the available data. I
3.4.1.2 Current Inputs at Bakers Falls i
Data from both USEPA and GE indicate that there is continued leakage of PCBs into the -
river through the bedrock at Bakers Falls, despite efforts by GE to control the source. Data from
GE's 1997-99 sampling at Rogers Island suggested that this input results in an average total PCB '
concentration in water of about 13 ng/L, although there are wide fluctuations, and the concentration
is also based on measurements at or below the low end of the analytical detection level. The 13 ng/L
estimate is calculated by averaging the 1997-1999 Rogers Island water column sampling data; avalue of one-half the detection limit, or 5.5 ng/L, is assigned to samples in which PCBs werereported as not detected.
Remedial activities currently being planned and implemented in the vicinity of the GE
Hudson Falls plant are intended to reduce this input. However, neither the timing nor the achievable
degree of reduction is known. Over the period 1997 to 1999, in-place controls have reduced the PCBload to an equivalent annual concentration of 13 ng/L. For modeling purposes, it has been assumed
that this level is representative of loading" conditions over the next several years. Thus, this value
has been used to represent upstream boundary conditions in the near term (1999-2004) for the
majority of the modeling of active remedial scenarios, described in greater detail in Chapter 5, as
well as for modeling of the No Action scenario.
400379 TAMS
r /""*""• Some modeling scenarios were run utilizing an upstream boundary Tri+ PCB concentrationof 30 ng/L. Based on review of the monitoring data, this value was considered to represent a
reasonable worst-case scenario, taking into account the variability of the data. Some scenarios werealso run using a concentration of 0 ng/L; in other words, it was assumed that there was no PCB inputfrom upstream of Rogers Island. The zero-input assumption provides the theoretical limit on the
maximum benefit of remediation or attenuation of upstream sources.
3.4.2 FishPRGs
PCB concentrations in biota are driven by concentrations in water and sediment. Theexistence of upstream boundary loads will result in non-zero PCB concentrations in both water andsediment. As a result, concentrations in fish will also remain above zero in the presence of the
upstream load.
--x, Even if the PCB input from the Bakers Falls source was substantially reduced, PCB
concentrations in fish would not return to zero due to the input of baseline loads from above Bakers
Falls. Data collected both for the reassessment RI/FS, as well as extensive annual monitoring data
collected by NYSDEC (as presented in the ERA; USEPA, 1999c), show that there are detectable
concentrations of PCBs even in fish caught north of any of the former GE plants at Hudson Falls and
Fort Edward, confirming the presence of an upstream baseline load. One of those sources is the
NiMo Queensbury site and another is atmospheric fallout. While there is some yearly and inter-species variability, the available data for four species (largemouth bass, brown bullhead, yellowperch, and white perch) suggest that the upstream concentration of total PCBs in fish fillets aboveBakers Falls in recent years is approximately 0.2 mg/kg (Note that the Tri+ PCB and total PCB
concentrations are essentially the equal in Huson River fish tissue). Recent remedial activities in the
region above Bakers Falls can be expected to continue to result in lower PCB levels in fish.
Monitoring data on fish body burdens obtained by NYSDEC represents the most extensiverecord both temporally and spatially. The PCB data for the most recently available samples
^*s( 1 998- 1 999) show that fish body burdens were one to three orders of magnitude lower in this regionrelative to River Section 1 and other locations downstream.
3-9 TAMS
0O
3.4.3 Limitations on Verifying Compliance with PRGs
The analytical method utilized by USEPA for the Reassessment RI/FS has a practicallimitation of accurate quantitation of approximately 1 ng/L for monochlorobiphenyls, 0.05 ng/L fordichlorobiphenyls through hexachlorobiphenyls, and 0.05 to 0.1 ng/L for heptachlorobiphenylsthrough decachlorobiphenyls on 17-liter water samples (USEPA, 1997a). Although data are reportedbelow these concentrations, the reliability and accuracy of the data at lower concentrations are lesscertain. This analytical method was developed specifically for the Reassessment RI/FS andrepresented the state-of-the-art at the time the analysis was conducted; it is unlikely that this
detection limit can be improved upon significantly in the near future. Therefore, the true value of
the PCB input from Glens Falls is only estimated..
The analytical method utilized by GE has a quantitation limit about ten times higher (11
ng/L) than that utilized by USEPA for the Reassessment RI/FS. While the GE method is a congener-
specific method and is capable of detecting significant inputs into the river, it is less useful in
determining low-level PCB concentrations (below 10 ng/L).
The most stringent river water PRO (based on the New York surface water standard) is 0.001
ng/L. It is evident from the available analytical methodologies that compliance with this PRG cannoteasily be verified, since current commercially available methodologies can achieve reliablequantitation only at concentrations two to four orders of magnitude higher than this value. One
potentially applicable method is the NYSDEC Trace Organics Platform Sampler (TOPS), a high
volume sampler providing lower detection limits for PCBs than methods generally available
commercially, reportedly capable of reporting down to the 1 x 10"6 /ug/L (0.001 ng/L) NY water
quality standard.
3.5 Selection of Sediment Target Areas for Remediation
In order to develop remedial alternatives, it was necessary to identify the sediments that
might appropriately be targeted for remediation. Criteria for making this identification are presented
in subsection 3.5.1, followed by the available data and their use in various measurements (metrics)
for assessing these criteria, discussed in subsection 3.5.2. In subsection 3.5.3, the criteria are
3-10. 400381 TAMS

[ """ described for the three levels of sediment remediation that were used to construct the remedialscenarios. Subsection 3.5.4 describes the application of the criteria to the river, with the resulting
f • estimates of sediment volumes, areas, and PCB mass.
I In previous sections of the FS, italics have been used to designate areas of high PCBconcentrations delineated by NYSDEC, as in "Hot Spot 28" or, more generally "hot spots." This
I convention is retained through the FS when specifically referring to these NYSDEC-delineated areaswith their originally-defined boundaries. Where the term "hot spot" is used to mean target areas
II delineated according to the criteria for the FS, using all available data sets, italics are not used.
! 3.5.1 Target Area Selection Considerations
j Having identified the sediments of the Upper Hudson as the primary source of PCBs to the
freshwater Hudson (USEPA, 1997a, 1998a, 1998b, and 1999b), it was then necessary to identifyUy—-s those sediments whose remediation would have the greatest impact in achieving the RAOs and PRGs
(e.g., reducing fish body burdens and PCB transport). Additionally, it was important to identify' t i V ;.{ those sediments with the greatest potential for subsequent PCB release, considering PCB
r concentration and inventory as well as susceptibility to remobilization.|;v-I. ;.:
In identifying the sediment target areas, several approaches were used. The selection of
\ sediment areas for remediation was based largely on geochemical and statistical interpretations ofi the data, including observations concerning PCB transport, changes in sediment inventory, sediment
*; PCB distribution, and impacts on the biota. The observations and analyses that weighed most
f>/; heavily in the selection of remedial areas are described below. Taken together, these observationsand analyses provide a sound basis for the selection of remedial target areas presented later in this
f chapter. The observation and its implications for remediation are described in each of the followingitems.
1' '• . rf*Based on the lines of evidence described below, PCB inventory, PCB surface concentration, g
c-,/*-s OJI • sediment texture, and proximity to shore must all be considered in the selection of sediment remedial oo{•> ' w
areas. PCB inventory provides an approximate measure of the potential for long-term release andp! recontamination of the immediate area as well as those areas downstream. Surface concentrationi:f
:•••• 3-11 TAMS
provides a measure of the immediate exposure conditions associated with the sediment.
Incorporating the noted correlation among sediment (fine-grained) texture, near-shore proximity,
PCB inventory, and biological activity, it is possible to identify areas of the Upper Hudson that are
likely to represent potential long-term sources. It is only by considering the criteria together, rather
than alone, that achievement of the RAOs and PRGs can be maximized.
The lines of evidence in support of these criteria include the following:
1. PCB loads and concentrations in the Upper Hudson have a strong seasonal dependence, with
maximum sediment release rates occurring from late May to mid-June. These release rates
gradually decline throughout the summer and largely cease by late fall. The dependence is
clearly not flow-related (see next bullet) and strongly suggests a biologically mediated
process (see Appendix D). This observation suggests that the majority of this load is derived
from sediments in biologically active zones, that is, in near-shore environments that support
a high density of plants and animals.
2. May through September water column PCB concentrations at the TID-West station have
little flow dependence and show little decline over the period 1996 to 1999 (see Appendix
D). The concentrations do, however, vary substantively throughout the year. Peak
concentrations occur from late May to mid-June and gradually decline throughout the
summer. This is in contrast to water temperature (a possible indicator of diffusive sediment-
water exchange), which does not peak until August. Similar monthly peak concentrations
have been observed for June through September for the period 1996 to 1999, despite flow
rates varying by a factor of four. That is, water column PCB concentrations at TJD-West
have been the same each June, July, August, and September for these years in spite of a large
variation in summer time flow during this period. However, within each year, June is quite
different from September.
The consistency in near-shore conditions from year to year, independent of flow, suggests
the existence of quasi-steady-state exchange processes that regulate the water column
concentrations in the near-shore environment. Additionally, these results suggest that near-
shore water-column conditions are controlled by processes that are able to tap a relatively
3-12 400383 TAMS

large PCB inventory, hence the lack of decline in water-column concentrations in the lastfour years. These results indicate that near-shore PCB concentrations and related biologicalexposures are the result of processes that occur in the near-shore environment.
3. The TED-West station is considered a good representation of near-shore water columnconditions because it is located at the western wing wall of the TI Dam and to the west of themain channel of the river. The PCB concentrations at this station are frequently but notalways higher than those of the center channel of the river. Typically, the PCB concentrationat this station matches that of the center channel under greater than average flow conditions(greater than 5,000 cfs) and during the cooler months of the year when biological activity islow. The fact that this station differs from the main channel largely during warm, low flow
conditions shows the continued importance of near-shore releases. This station also
documents the net increase of PCB load and concentration originating in the near-shore
environment over the period 1991 to the present.
4. The near-shore areas contain the majority of the cohesive (fine-grained) sediments. These
areas would also be expected to be the most active in terms of biological activity in the
sediment since they are relatively rich in organic matter and are frequently vegetated. These
areas are also expected to be the predominant areas for biological exposure to PCBs via both
sediment and water column exposure since plants and animals are concentrated in theseareas. The strong indication of a biologically mediated PCB release process and the likelycoincidence of extensive sediment PCB contamination and areas of greater biological activity
suggest that the majority of the annual PCB release from the sediments originates from thenear-shore cohesive sediments.
5. Since the release process is probably biologically mediated, there is no inherent dependence
of the release rate upon sediment concentrations, unlike processes such as diffusion. Rather,it is the coincidence of PCB contamination, cohesive sediment texture, and biologicalactivity in the near-shore environment that creates the most likely source of PCBs for both ^
owater column transport and biological exposure. woo
3-13 . TAMS

6. Further evidence of the importance of near-shore, cohesive sediments can be seen in the
summer and fall float survey results obtained by GE in 1996 and 1997 (O'Brien and Gere,
1998; QEA, 1999). Figure 3-2 presents a map of the TI Pool locations occupied during these
surveys. In these results, near-shore water column concentrations (east and west shore) were
substantially higher than those of the main channel; Figure 3-3 illustrates that these
concentrations were sometimes as much as five times "higher. Near-shore water column
results showed localized areas of high PCB concentrations, suggesting that these are areas
of increased sediment release. These results indicate that the near-shore environment isresponsible for the majority of the PCB load carried by the river in the warmer months of the
year.
7. In a similar fashion, the congener patterns of the main channel and near-shore water column
concentrations suggest a simple pattern of mixing between the upstream source and that
originating in the near-shore sediments. An examination of the molar dechlorination product
ratio (MDPR) as a function of the concentration reveals a tight relationship between the two
that can be expressed by a simple linear combination of two end-members. This expression
describes the relationship between the MDPR and the water concentration in River Section
1 as a concentration-weighted average of the ratios, assuming an upstream condition defined
by the Rogers Island concentration and a near-shore sediment source with a single or
narrowly varying ratio that gradually adds additional PCBs to the water column. This yields
the following relationship:
MDPR. =TPCBKMMDPRK,-MDPR )* — - — - MDPRi JKl ^ Kl nss' nm/rn1 .r C/>;.
TPCBD!*MDPR,f,+ (TPCB.- TPCB^MDPRMDPR. = ————-————2—————-———*£—————5
TPCB.
3-14 400385 TAMS
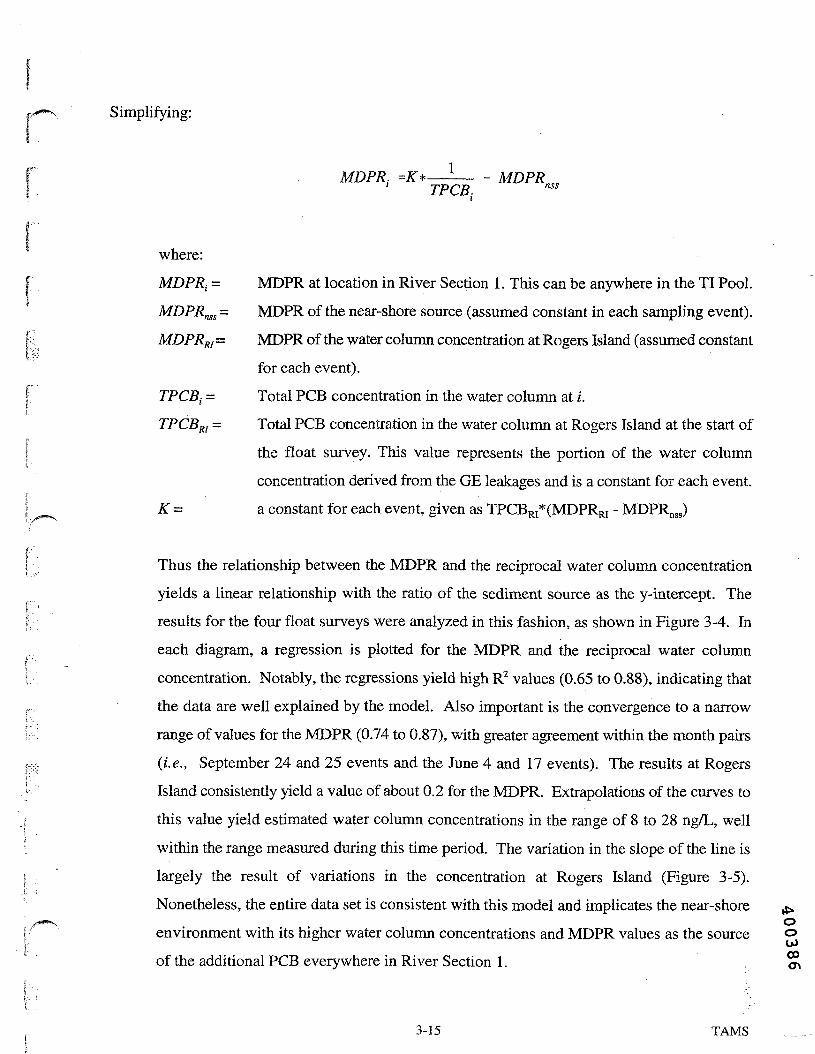
Simplifying:
MDPR. = —-— - MDPRTPCB. nss
where:
MDPRt =MDPR>!SS =
MDPRRl=
TPCB, =
TPCBK =
iv- _
MDPR at location in River Section 1. This can be anywhere in the TI Pool.MDPR of the near-shore source (assumed constant in each sampling event).
MDPR of the water column concentration at Rogers Island (assumed constantfor each event).
Total PCB concentration in the water column at i.
Total PCB concentration in the water column at Rogers Island at the start of
the float survey. This value represents the portion of the water column
concentration derived from the GE leakages and is a constant for each event.
a constant for each event, given as TPCBRI*(MDPRRI - MDPRnss)
Thus the relationship between the MDPR and the reciprocal water column concentration
yields a linear relationship with the ratio of the sediment source as the y-intercept. The
results for the four float surveys were analyzed in this fashion, as shown in Figure 3-4. In
each diagram, a regression is plotted for the MDPR and the reciprocal water column
concentration. Notably, the regressions yield high R2 values (0.65 to 0.88), indicating thatthe data are well explained by the model. Also important is the convergence to a narrow
range of values for the MDPR (0.74 to 0.87), with greater agreement within the month pairs
(i.e., September 24 and 25 events and the June 4 and 17 events). The results at Rogers
Island consistently yield a value of about 0.2 for the MDPR. Extrapolations of the curves to
this value yield estimated water column concentrations in the range of 8 to 28 ng/L, wellwithin the range measured during this time period. The variation in the slope of the line islargely the result of variations in the concentration at Rogers Island (Figure 3-5).Nonetheless, the entire data set is consistent with this model and implicates the near-shoreenvironment with its higher water column concentrations and MDPR values as the source
of the additional PCB everywhere in River Section 1.
ooi*>00a\
3-15 TAMS
8. The float survey results also indicated the absence of substantial sediment-derived watercolumn PCB loads upstream of the areas that contained large amounts of fine-grainedsediments. That is, water column loads measured at Rogers Island (RM 194.6) remained
largely unchanged for the first 1.5 miles downstream (i.e., to RM 193). Between RM 194.6
and 193, areas of fine-grained sediments are very limited. The first major areas of fine-grained sediments are found below RM 193, specifically Hot Spots 6,7, and 8. The facts that(1) little load gain is seen in the first 1.5 miles of River Section 1 where the river is primarilylined with coarse-grained sediments, and (2) the appearance of a sediment-derived load iscoincident with the presence of fine-grained sediments are additional evidence suggesting
a causal relationship between fine-grained sediments and the increased water-column PCB
loads observed in River Section 1. The data supporting these observations are illustrated in
Figure 3-6, which presents the observed load gain and the cumulative area of fine-grained
sediments as a function of river mile in River Section 1 for each of the four float survey
events. These results implicate the near-shore environment as the major source of the
sediment-derived PCB loads from River Section 1.
9. The evaluation of the 1994 USEPA and 1984 NYSDEC sediment surveys presented in the
LRC and the associated responsiveness summary (USEPA, 1998b; 1999b) indicates that
fine-grained areas of River Section 1 underwent significant PCB mass loss during the period
1984 to 1994. Similar scale inventory losses were seen in several major fine-grained
sediment deposits downstream of the TI Dam as well. While some of the examined areasappeared unchanged, others appeared to have lost substantial portions of their PCB
inventory, as much as 50 percent or more. The extent of loss was found to correlate with the
original PCB inventory measured in 1984 (i.e., the greater the 1984 inventory, the greater the
proportion of mass that was lost). These observations suggest that the stability of PCBinventories contained within the sediments cannot be assured indefinitely. Additionally,
these results indicate that PCBs in many areas were not being isolated or sequestered by
sediment deposition, as has been asserted. Rather, the results suggest that historical depositsof PCBs continue to be available for recontamination of surface sediments and the biota. A
similar analysis performed using coring data obtained by GE in 1998 yields a similar result.
Specifically, the 1998 sites were designed to match a subset of the paired 1994 USEPA and
1984 NYSDEC sites. The matched pairs of GE and NYSDEC values show levels of loss
3-16 400387 TAMS

/"""" from the sediment similar to those calculated for the USEPA-NYSDEC pairs (see Appendix* D). These results indicate that long-term "storage" of PCBs in the sediments of the Upper
r Hudson is not assured. More importantly, the PCBs re-released from the sediments are then^ again available to contaminate surface sediments and biota downstream. It is likely that theI re-release process serves to sustain surface PCB concentrations, thereby limiting the recovery
of the river surface sediments and the biota body burdens derived from the surface sediments,f although the process mechanisms have not been identified.
|| 10. An additional important observation from the low resolution sediment coring effort was thepresence of peak PCB concentrations in the top-most segment of the majority (60 percent)
j of the low resolution cores. In most cases this placed the maximum concentrations within
9 inches of the sediment surface and near or within the biologically available zone. Thus,
the majority of the PCB inventory of the sediments does not appear to be isolated from the
biologically active zone in the fine-grained areas examined.
11. Similar evidence was obtained by GE in coring sites associated with Hot Spot 14 in 1998.
Ten cores were obtained from this hot spot, several of which showed surface (0 to 5 cm)
concentrations 30 mg/kg and higher (Figure 3-7). Two of the sites had concentrations over
200 mg/kg (270 and 630 mg/kg) in this layer, indicating the presence of historical PCBcontamination at the sediment surface. Most cores collected had PCB concentrations greaterthan 100 mg/kg in the 5- to 10-cm layer. Based on the high resolution coring results obtained
by both USEPA and GE, mean concentrations on suspended matter have not exceeded thislevel since the early 1980s. Mean suspended solids PCB concentrations over 200 mg/kg
were last observed in the 1970s. Thus, these materials must be relatively old (at least pre-
1985) despite their proximity to the surface. While the mechanism to maintain such
historical concentrations at or near the surface is not known, it is clear from these data thathistorical materials and their associated PCB concentrations continue to be available to the
surface sediments, the water column, and the biota.
i^"*-"\ o
12. Side-scan sonar results obtained in 1991 and 1992 indicated multiple areas undergoing scour g
based on surface morphology (Flood, 1993). These features were sufficiently large enough ooto be discemable at the resolution of approximately one square foot. Figure 3-8 shows where
3-17 TAMS

such areas were identified between Rogers Island and the Northumberland Dam. The
identification of such features in some areas does not preclude the occurrence ofresuspension elsewhere but rather simply identifies those areas undergoing sufficient levelsof resuspension to form discernable, scour-related surface features. In River Section 1, themajority of these areas are found in cohesive sediments. The clear presence of such scour-
related features is further evidence for the-lack of long-term stability in the sediments.
13. An important consideration in selecting potential remedial target areas is the hydrology ofthe Upper Hudson River. The Upper Hudson River is a partially regulated river with several
run-of-the-river dams. As such it is still subject to large flows that can modify the river bed
and transport large quantities of sediment from the river bed. These processes have been
examined as discussed in the RBMR (USEPA, 2000a). However, the Upper Hudson does
not accumulate sediment everywhere in its bed, although some portions of it, particularly
those areas behind dams, may in fact collect sediment. The long-term stability of deposition
in such environments cannot be assured given the dynamic nature of the river and the high
energies available for sediment transport. This is in sharp contrast to a lake or reservoir, in
which mean linear velocities are frequently zero and remain that way for hundreds or
thousands of years. However, even in lakes, deposition is far from homogeneous, with near-
shore environments frequently exhibiting no net deposition simply due to wind-driven
resuspension that serves to "focus" lake sediments into the deeper portions of the lake. The
point here is not to suggest that near-shore Hudson sediments behave like those in lakes, but
rather to demonstrate that sediment environments are not inherently stable.
14. Since the sediments of the river cannot be considered inherently stable, the PCB inventory
contained within those sediments cannot be assured to be permanently sequestered.
Processes which move the sediments serve to transport PCBs to other locations downstream
as well as to uncover PCBs below the surface of the sediment. Thus the PCB inventory
represents an important criterion for the selection of remedial areas.
15. While PCB inventories in fine-grained sediments appear correlated with areas of expected
biological activity and areas of increased water column PCB concentrations, it is also
observed that surface concentrations are well-correlated with fish body burdens (see the
3-18 400389 TAMS

bivariate analysis of sediment, water, and fish body burdens in the RBMR (USEPA, 2000a).Thus, while PCB inventories and their lack of consistent long-term stability must be
considered in selecting remedial action areas, so must surface PCB concentrations. Surface
sediment PCB concentration represents an important alternative criterion for selection ofremedial areas, separate from the criterion of sediment PCB inventory. Although inventoryand concentration are correlated, the relationship is not exact, as will be discussed later in
this section.
16. Another line of evidence supporting the selection of remedial areas was obtained from thehigh resolution sediment cores collected by the USEPA in 1992 and by GE in 1998. The
results from these cores indicate that PCB concentrations in recent deposition have notappreciably increased or declined over the last ten years, despite the major changes in the
upstream loads to the river. This observation suggests that historical PCBs from the
sediments represent a major continuing source to the Upper Hudson, since recent deposition
has not responded to the changes upstream and instead has remained elevated, close to the
levels seen in the sediments prior to the Alien Mills event. The high resolution cores
represent unique environments where deposition occurs regularly and resuspension is largely
absent. Core samples collected both by USEPA and GE show little variability in sediments
deposited from the late 1980s to the time of core collection, despite an increase, and then
decrease, of more than an order-of-magnitude in the PCB load at Rogers Island during this
period.
The absence of any substantive variation in these levels suggests three possibilities: first, that
little deposition was occurring over the period, thus yielding little new highly contaminated
sediment; second, that the PCB levels in the cores were primarily governed by other sourcessuch as the sediments; or third, that vertical mixing via bioturbation served to completely
homogenize the sediment concentrations. While vertical mixing is a possibility for the GE
coring efforts conducted four years after the major release period, it is not a plausibleexplanation for the 1992 cores since they were collected in the middle of the Alien Mill o
Oevent. Given that the third explanation (mixing by bioturbation) could not apply to the 1992 £J
cores, it is not a very likely explanation for the lack of variation in the 1998 cores since they
were obtained from similar environments.
3-19 TAMS

Further evidence for the lack of substantive vertical mixing was developed by Olsen et al.
(1980), based on the cesium-137 profiles observed in Hudson River cores. Olsen concludedthat extensive vertical mixing would serve to smooth the cesium-137 peak observed in eachcore, reducing the cesium distributions to uninterpretable profiles. Due to the uniqueness ofthese cores (i.e., the fact that they are datable) and their locations in a very shelteredenvironment, the assumption of a lack of bioturbation in these high resolution cores cannotbe extended to the rest of the river. Indeed, bioturbation is a likely mechanism for PCBrelease from the sediments, as discussed above.
Based on these considerations only the first two possible explanations remain viable. Withregard to the first explanation concerning lower deposition rates, suspended solids loads were
somewhat reduced after 1990 (USEPA, 2000a), possibly due to the capping of the remnant
deposits. Alternatively, it is also possible that unstable sediments in the main channel above
Fort Edward resulting from the removal of the Fort Edward Dam are no longer prevalent.
Thus, the possibility of slower deposition is real. This would also mean that little of these
greatly increased loads associate with the Alien Mills Event was captured within the
sediments of the Upper Hudson River. Alternatively, or perhaps in addition to this
explanation, the occurrence of significant PCB releases from the historical sediments
elsewhere in the river could serve to maintain the steady, high levels seen in the recently
deposited materials recorded by the cores. Either by lack of burial or by re-release, both
scenarios support the importance of historical sediments .to PCB levels in the Hudson.
The USEPA models do not of themselves permit a direct identification of these sediments,
since the spatial resolution of the models (about ten acres in River Section 1, and larger than tenacres in River Sections 2 and 3) is much greater than the minimum size of an area that would be
selected for dredging (about one acre). Moreover, the model application requires the synthesis of
mean PCB contamination levels and inventories for large areas of the Hudson, integrating much of
the detail available within the various sediment data sets. Nonetheless, the model can be applied in
estimating the net effect of remediation on scales comparable to the model segment lengths. In the
identification of the specific target areas for remediation and the preferential selection of cohesive
or non-cohesive sediments for remediation, the model is most appropriately used to provide a general
guide and estimate an overall impact.
4003913-20 TAMS

In particular, it was important to recognize the limitations of the modeling analysis.
Specifically, despite the large amount of data assembled, there was little data to constrain the relativecontributions by cohesive and non-cohesive sediments to the water column transport or biologicaluptake. While contributions from the sediment by resuspension can be approximated using sediment
physical properties and the GE resuspension model SEDZL, the main means of PCB transport fromthe sediment to the water column is not flow-driven and was empirically represented in the model.This process was responsible for more than 50 percent of the PCB mass transfer to the water column.While the data collected were sufficient to describe the net contribution by this process, little datawere available that could be applied to the model to estimate the relative release rates and exchangeprocesses among the various sediment zones. Nearly all data collected serve to integrate thesecontributions but cannot discern them individually. Thus, on both a spatial scale and on the basisof the transfer mechanisms, the models cannot provide complete information to direct the selection
of the remedial target areas.
The parameters used in the modeling efforts to characterize the relative contributions ofcohesive and non-cohesive sediments were assigned using best professional judgment, generating
an internally consistent modeling result that matches the calibration data set. However, the assumed
values do not represent a unique solution to the modeling analysis; other sets of assumptions
concerning the relative importance of cohesive and non-cohesive sediments may also yield
acceptable calibrations. This indicates that the model forecast results are more uncertain than the
hindcast results, as discussed in Appendix D. Importantly, the model results are most uncertain with
regard to remedial actions involving various combinations of cohesive and non-cohesive sedimentremediation, since only their combined contribution, and not their relative contributions, is well
known. This results, in part, from the difference in the spatial scales for the model vs. the minimum
size of an area that would be remediated.
The model response to the various remedial scenarios was considered in estimating the
overall effectiveness of each scenario, thus indirectly verifying the selection'of areas for remediation.oou>voNJ
3-21 TAMS

3.5.2 Application of the Available Data to Identification of Sediments for Remediation
The Upper Hudson has been the subject of a large number of sediment sampling events. Innearly every case, however, data collection goals were somewhat different, with some studiesfocusing on PCB inventory and some on concentration. Additionally, the definition of "surface"sediment has varied considerably among studies. Lastly, analytical techniques have varied over time.As a result, comparing conditions among the various data sets is enhanced by correcting for thesedifferences. The actual application of the various data sets will be discussed by example later in this
text.
Comparisons among the various data sets first required resolution among the different
analytical schemes used by the different investigations. These issues have been dealt with
extensively in the Phase 2 reports, i.e., the DEIR (USEPA 1997a), LRC (USEPA 1998b), and RBMR
(USEPA, 2000a), and are not repeated here. To summarize the approach, the reconciliation of the
historical, packed-column, Aroclor-based techniques with the more recent, capillary column,
congener-based analysis was accomplished by aligning the individual packed-column and congener
chromatographic "peaks," and summing the results into a single consistent basis. Because of known
limitations in the historical techniques, this reconciliation of PCB measures could only be done for
the heavier portions of the PCB spectrum, that is, the trichloro and higher homologues. The sum of
this fraction of the PCB spectrum has been defined as the Tri+ sum. Few reliable measures of the
lighter (lower molecular weight) congeners, that is, the monochloro- and dichlorobiphenyls , existin the historical data prior to 1991. This represents an important exclusion because the majority of
the spatially representative sediment data was collected prior to 1991.
3.5.2.1 Definition and Calculation of the PCB Metrics
In the selection of remedial areas, the evaluation of the extent of contamination employed
several different metrics (measurement bases), including four PCB-based parameters: "surface"concentration; mass per unit area (MPA); length-weighted average (LWA); and maximum
concentration. Data from the various data sets were transformed into these metrics as was
appropriate, depending upon the type and quality of information available and the desired description
of contamination. Other data sets were used as Well, including sediment texture (as defined by side-
3-22 400393 TAMS

scan sonar) and river bathymetry. The various PCB metrics mentioned above have been usedextensively in the Phase 2 reports. The definitions and derivations of these metrics are given below.
Each of these metrics provides a different perspective on the extent of contamination and thusall are useful in the identification or remedial target areas. However, the various historical data setsdid not always lend themselves to the calculation of all of these values, as discussed in the nextsection.
"Surface" Concentration
This parameter is meant to represent the PCB concentration in the surficial sediments, thatis, the sediments in contact with the overlying water column, fish, and benthic invertebrates.
Depending upon the mechanisms of exchange and contact, the effective depth of "surficial"
sediments for each of these three entities may be quite different. Knowing the effective depth ineach instance implies knowing the mechanisms of exchange. As discussed above, this is clearly not
the case for sediment-water exchange.
The depth of surficial sediments has been operationally defined in a different manner for each
of the various sampling programs, beginning in 1976. Notably, a value for "surface" concentration
can be obtained from cores and grab samples. However, while the depth of the coring interval iswell defined, that from a grab sample is not. Typically these grab samples are assumed to representbetween 5 and 15 cm of depth as measured from the surface. For core samples, the depth of surficialsediments among the larger sediment collection programs was defined as approximately 10 cm in
1976-1978 (NYSDEC), 30 cm in 1984 (NYSDEC), 5 cm in 1991 (GE), 23 cm in 1994 (USEPA),
and finally 2 cm in 1998 (GE). (Note that GE also collected samples from 2 to 5 cm in 1998 to
permit a comparison to its 1991 data.) To add to the uncertainty in estimating the historical
"surface" concentrations, both the 1976-1978 and 1984 sampling efforts incorporated a large number
of grab samples. Depths for these samples are essentially unknown but are believed to be less than15 cm (6 in). Thus these events have wide depth ranges internal to their data sets.
As a result of the wide disparity in the definition of surficial sediments, direct comparison
among the studies using this parameter is greatly limited. Differences in surface concentrations from
3-23 TAMS
oocovo
one study to another may result from actual changes in sediment conditions or may simply representthe effect of different sampling depths. Nonetheless, surface concentrations within each study wereused in the selection of remedial areas since these values are expected to most closely represent the
nearer-term exposure conditions to the biota as well as the properties of the sediments in continuouscontact with the water column.
Length-Weighted Average Concentration
Length-weighted average concentration (LWA) is defined as the mean concentration at agiven coring location based on the number of core segments, their individual lengths, and PCB
concentrations. Essentially, the LWA is mathematically equivalent to the value that would be
obtained if the entire core was processed as a single sample. The formula for LWA is as follows:
no. core segments£ Cancel.
LWA = ———————————no. core segments
X it1=1
where:
ConCf = PCB concentration in core segment ili = length of core segment i
This parameter was used extensively in the low resolution sediment coring analysis (USEPA,
1998b) and is described further there. Figure 3-9 illustrates the calculation of this parameter. It
should be noted that this parameter is sensitive to. the depth cored at a location. That is, if several
layers are obtained below the interval of sediment contamination, these serve to "dilute" the LWA
value. For this reason, the LWA calculation did not include layers with PCB concentrations lower
than 1 mg/kg.
Calculation of a true LWA is contingent on collection of a core. Clearly this calculation
cannot be performed for a grab. Thus, this limits the usefulness of this parameter in data sets where
many grabs;have been collected. In their analysis of the 1976-1978 and 1984 data sets, NYSDEC
3'24 400395 TAMS

developed relationships between grabs and cores for the purpose of this calculation. However, this
calculation is highly uncertain and is essentially just a means of incorporating and integrating the
core and grab data on a large scale.
Maximum Concentration
This parameter is simply defined as the maximum concentration obtained at a location. For
grab samples, it is simply the reported value. For cores, it is the maximum value found among thecore segments obtained at the location. This parameter is used along with its location in the core toassess the depth of contamination as well as the availability of the PCB inventory to the surficial
sediments. Thus, cores whose maximum values are found in the top-most segment indicate that
much or most of the PCB inventory is relatively near the surface. Conversely, cores whose maxima
are found in deeper segments have a relatively smaller fraction of their inventory available to the
surficial sediments. This approach is generally utilized for sediment cores with thick segments(nominally greater than 9 inches or 23 cm) and relatively long lengths (greater than 15 cm), where
sufficient sediment depth was represented to document the displacement of the PCB maximum
below the biologically available portion of the sediment. Additionally, the results from analysis of
these data must be contrasted with the documented sediment inventory losses described in the LRC
(USEPA, 1998b). That is, inventory losses were seen even when the concentration maxima had
moved below the top-most core segment. In these cases, however, the maximum value wassubstantially lower than that measured previously.
PCB Mass per Unit Area
The last of the main PCB metrics used in the selection of remedial areas is PCB mass per unit
area (MPA). Unlike the previous three metrics, each of which represents concentration, MPA is
expressed in units of contaminant mass per area of river bottom (i.e., g/m2), not mass of contaminant
per unit mass of sediment (e.g., mg/kg). The MPA represents the total amount of PCB mass foundin the sediments below each square meter of sediment surface. MPA is most easily determined from
core results because these can be readily integrated into this form. Figure 3-9 presents a typical
calculation of the MPA for a core. :
3-25 TAMS
In calculating the MPA for a core, core segment length, core segment concentration, and core
segment solids density must all be measured or estimated. The solids density (i.e., solids-specificweight) is a necessary component to account for differences in sediment density. Solids-specific
weight can vary from roughly 0.5 to 1.3 g/cc and thus strongly affects the calculation. For example,if two sediment samples have the same PCB concentration but one has half the solids-specific weight(e.g., 0.6 g/cc vs 1.2 g/cc), the more dense sample has twice the PCB mass in the same volume. Theformula for the calculation of the MPA is as follows:
no. core segmentsMPA = £ Cone.* p.*/.
1=1
where: Conct = PCB concentration in core segment i
Pi = solids-specific weight of core segment /
/,. = length of core segment i
Thus, the MPA represents the integration of the PCB content of the core over its length by summing
the mass of PCB found in each segment.
The main underlying assumption in the use of the MPA is that the entire sequence of PCB
contamination at the sampling site is represented in the core. To the extent this is true, integration
of the core provides an unbiased estimate of the sediment inventory, regardless of the rate of
deposition. This is different from the "surface" sediment concentration, which may or may not be
closely correlated with underlying sediments, depending upon the sampling conditions, core segment
intervals, and the current rate of PCB loss or gain by the sediments, among other factors. In
calculation of the MPA for short cores or grab samples, assumptions concerning the unrepresented
sediment contamination are necessary. In both the 1976-1978 and 1984 NYSDEC surveys,
correlations between sediment inventories and surface sediment concentrations were developed and
applied to estimate the sediment inventories. This approach yields relatively high uncertainty when
predicting the inventory at discrete locations, but should yield reasonably accurate estimates when
applied over large areas, incorporating multiple coring and grab sample sites. The reduction in
uncertainty at larger scales results from the averaging of the individual estimates. That is, while
3-26 400397 JAMS
I/--N individual inventory estimates may be far from the true value, the average of the individual estimates* will approach the true mean if a sufficient number of samples is collected.
* MPA provides a simple basis to estimate total PCB mass over a large area, given as ther product of the mean MPA and the area under consideration. Additionally, more recent and more
accurate surveys have not characterized the Upper Hudson River as extensively as the earlier -I surveys. As a result, the data used to select various areas for remediation have been derived from
several surveys, utilizing the more current data whenever possible but relying on the historical datay to fill data gaps. MPA provides the best means for integrating the results of the major data sets (i.e.,
1976-1978 NYSDEC, 1984 NYSDEC, and 1994 USEPA), since estimation of MPA was a goal of
| each of them. Notably, the GE sediment survey data are not considered in this fashion because ofi
the use of sample composites, designed to represent mean conditions but providing little detailjj:
f appropriate for the identification of remedial areas. (GE data were mainly considered in assessing
"surface" sediment concentrations.)
i ^~N
Calculation of the MPA is readily accomplished for the 1984 NYSDEC and 1994 USEPA
I sediment inventory investigations, in part because the studies were specifically designed for this
purpose. The 1994 survey consisted exclusively of cores that are readily converted to MPA. Thei
i '.i 1984 survey collected the greatest number of cores of any survey of the TI Pool, and thus much of
the results could readily be converted to MPA. In fact, MPA was the main metric for this study, with
i much of the data presented in this form. As previously discussed, NYSDEC performed an extensiveanalysis, correlating sediment MPA with texture, "surface" concentration, and depth of
F;I : contamination so as to permit the estimation of MPA for all sampling points, both cores and grabs.
p Applying these data, the 1984 NYSDEC survey provided a benchmark estimate of the inventory of
< River Section 1 based on the MPA metric. USEPA further refined this estimate using geostatistical
techniques and the side-scan sonar results (USEPA, 1997a; USEPA, 1999b).
The MPA was also estimated as a part of the 1976-1978 NYSDEC sediment survey.Tofflemire and Quinn (1979) and NYSDEC (1992) both developed a basis to relate the 1976-1978 g
x™""x ' Oshallow cores (0-4 in) and surface grab samples to an estimate of the MPA at each location. These w
\oapproaches are outlined in the LRC (USEPA, 1998b), with details provided in the original reports. °°
As mentioned above, this approach will yield individual location estimates with relatively high levels
3-27 TAMS

of uncertainty, but when considered over large areas should yield accurate estimates of sedimentinventory. These calculations were the basis for the comparisons of 1976-1978 and 1994 inventoriesmade in the LRC (USEPA, 1998b).
MPA was found to correlate strongly with "surface" concentrations for both the 1984 and1994 data sets. This correlation results from the observation that the majority of the cores in bothdata sets have their maximum concentration in the uppermost core segment. Hence the MPA islargely determined by the same core segment as describes the "surface" concentration. This
correlation would not occur if the majority of PCB mass was buried at each location (i.e., if the
majority of the PCB mass was found in deeper core segments). The correlations within each of the
data sets will be discussed individually later in this section.
MPA correlates even more strongly with LWA, as might be expected from the calculation
shown in Figure 3-9. Both MPA and LWA incorporate the core segment lengths and PCB masses.
The most important difference between them is the use of a density term (solids-specific weight) in
the MPA. Because of the inverse correlation of PCB concentration and solids-specific weight (i.e.,
higher PCB concentrations occur in sediments with a lower mass of solids per unit volume of
sediment), the most contaminated core segments tend to weigh less heavily in the MPA calculation
than in the LWA calculation.
Many factors affect the PCB inventory over time and hence the measures of that inventory
(i.e., MPA and other concentration metrics). For example, losses via porewater migration or
resuspension will decrease the MPA but not necessarily the surficial PCB concentration, depending
upon the exchange mechanisms and the extent of PCB inventory below the "surface." However,
burial, if it occurs, will serve to increase the MPA slightly, as additional PCB mass is added by the
newly deposited sediments while causing a decline in the surface concentration as the less
contaminated sediments cover the existing sediment inventory of PCBs. The same change in surface
concentration can occur if PCBs are released from the sediment while causing a decrease in the
MPA.
The LWA has similar concerns. Deposition by less contaminated sediments serves todecrease the LWA as the PCB inventory increases. This is a result of averaging the recently
3-28 400399 TAMS

deposited, less contaminated sediment with the higher concentrations in the existing PCB inventory.
The additional contaminated sediment inventory is spread out over a greater depth of sediments.Losses from the sediment serve to decrease both the inventory and the LWA. Hence, only the MPAcan be used to track PCB release or storage in the sediment, and thus is the reason MPA is used as
a basis for comparison among studies. Its use in the selection of remedial areas is in recognition ofthe more variable nature of "surface" concentration as well as the need to consider the fate of PCBsthat do not currently reside at the "surface" but rather in regions of the sediment where biologicalmixing, resuspension, porewater migration, and other processes may return these materials to thesurface.
As discussed above, there is much evidence for the occurrence of sediment resuspension in
the Upper Hudson (Flood, 1993) as well as the absence of long-term burial in many locations
(USEPA, 1998b). Additionally, the main PCB flux from the sediments appears to be biologicallymediated, originating from the near-shore environment. By their nature, these processes are not
inherently limited to surficial sediments. Resuspension serves to remove the surface layer and expose
underlying sediments, while biological activity can extend down 10 and perhaps as much as 15 cm
into the sediment; therefore, neither the deeper historical PCB "surface" (0-30 cm) concentration
data nor the more recent shallower PCB "surface" (0-5 cm) concentration data is necessarily a goodindicator of the potential for PCB release in the future. To this end, the MPA, which reflects the
entire PCB inventory measured at a location, represents the better measure of the long-term releasepotential.
3.5.2.2 Application of the Available Data
In identifying potential sediment target areas for remediation, several data sets were used,representing PCB as well as non-PCB data. The number of data sets to apply to the selection ofremedial zones varied by river section, with the River Section 1 having the greatest number. The
amount of available data decreased moving downstream from River Section 1. The available dataits.
sets and their application are described below in chronological order based on date of collection. °jfa.
Table 3-1 provides a list of the data utilized in the selection of potential remediation target areas in oo
River Sections 1, 2, and 3.
3-29 TAMS

NYSDEC 1976-1978 Sediment Survey
This survey produced an extensive set of grab and core samples covering most of the UpperHudson between Fort Edward and Waterford. Many of the samples were obtained as part of river
cross-sections (i.e., a set of samples collected in a line extending from the east shore to the westshore of the river). Additional cores and grabs were taken in areas of fine-grained sediment. Thesesamples were used by NYSDEC to define the original hot spots.
Two separate analyses were completed on these data, the first by Tofflemire and Quinn
(1979) of the NYSDEC and a second by Malcolm Pirnie for NYSDEC (NYSDEC, 1992). Because
of the greater number of grab samples obtained relative to cores, both reports attempted to use the
coring data as a basis to estimate conditions below the sediments represented by the grab samples.
PCB concentrations to a depth of 12 inches (30 cm) were estimated for each grab location based on
the relationship between surficial (0-10 cm) and deeper (10-30 cm) sediments as documented by the
core samples obtained during the surveys. This relationship was developed by Malcolm Pirnie to
estimate the LWA for each location. The USEPA applied the Malcolm Pirnie relationship to the
1976-1978 data set (NYSDEC, 1990). The results of this calculation were used in the remedial
target area selection process.
"Surface" concentrations were represented by grab samples and the top core segments. These
sample were considered representative of the top ten cm of sediment.
The MPA values for these data are limited in two aspects. First, the coring data and the grab
estimates are limited to the 0- to 30-cm interval. Thus, the estimate of the MPA may be biased lowdue to the lack of representation of sediment below 30 cm. The potential importance of this
underestimation was documented in the LRC (USEPA, 1998b), which described the extensive
inventory associated with Hot Spot 28 that had not been documented by the 1976-1978 survey.
Secondly, additional uncertainty is associated with the lack of density measurements for many of the
1976-1978 sampling locations. Density values for these samples were estimated from sediment
texture considerations.
3.30 400401 TAMS

The Aroclor-based PCB analytical data from this survey were used to estimate total PCB andTri+ concentrations. The conversion algorithms are described in the RBMR (USEPA, 2000a).
Recognizing the limitations of this survey as well as its age, more recent surveys were used
to estimate PCB parameters whenever possible. In particular, the subsequent 1984 NYSDEC surveywas used in River Section 1. Nonetheless, the 1976-78 survey remains the most spatially extensiveand was used to evaluate many areas in River Sections 2 and 3. In using these data, all of theavailable PCB metrics were used (i.e., "surface" concentration, LWA, and MPA), with greateremphasis placed on "surface" concentration and LWA.
NYSDEC 1984 Sediment Survey
Like the previous survey, the 1984 investigation produced a large set of grab and core
samples. However, there were several important differences between the 1984 and the 1976-1978surveys. The 1984 survey was limited to River Section 1. Cores collected in this survey were
typically advanced to two feet, twice the core depth of the 1976-1978 survey. Density was
determined for most samples. Grab samples were only obtained when coring was unsuccessful, thuscoring was preferentially performed in fine-grained sediment areas where sediments are more easily
obtained by this method. This survey represents the most detailed investigation of any section ofthe Upper Hudson River and forms the primary data set for the selection of remedial target areas in
River Section 1.
Data from the 1 984 investigation was originally analyzed by NYSDEC as reported in Brown,
et al. (1988). This analysis, like the prior NYSDEC work, sought to apply the coring data results to
the grab samples to estimate the mass of PCBs beneath the depth examined by the grab samples.While focusing largely on the MPA, the technique used by the NYSDEC could be used to estimateboth MPA and LWA. In their report, NYSDEC placed greater emphasis on estimating and
employing the MPA in their analysis of River Section 1 . This emphasis by NYSDEC, as well as thereasons previously described, confirm the importance of this metric as an aid in assessing the long-
term PCB release potential from the sediment.oto
3-31 TAMS

The 1984 sediment data have been extensively analyzed as part of the Phase 2 investigation.
The results of the analyses are reported in the DEER (USEPA, 1997a), the LRC (USEPA, 1998b) andthe LRC Responsiveness Summary (USEPA, 1999b). As a part of these analyses, the data wereconverted to Tri+ estimates to make them directly comparable to other investigations.
The 1984 samples were originally analyzed using one or two methods. Nearly all sampleswere analyzed using a screening technique. A large subset of these samples was then analyzed usinga more rigorous Aroclor-based chromatographic method. The original screening results wereclassified into three groups: "cold"; "warm"; and "hot." Based on the subsequent chromatographic
analysis, these classifications were assigned nominal values, based on the median of the subset of
samples analyzed more rigorously. This procedure is described in the DEIR (USEPA, 1997a). Thus
the 1984 data fall into two categories from an analytical perspective: screened, and quantitated. Both
data sets are used in the selection of remedial areas. As it happened, the majority of the screened
samples represents low levels of contamination (i.e., "cold, <10 ppm," or "10«50" [greater than
10 and less than 50 ppm]), so that samples used to select target areas for remediation were nearly all
quantitative data.
In the 1984 study, the data set contains two different "surface" sediment definitions: sediment
obtained from the cores (0-30 cm); and sediment obtained from grab samples (depth unknown but
assumed to be 0-10 cm or less). Thus the concentration results for "surface" sediments from cores
and grab samples are not readily used together since they represent clearly different sediment depths.
However, these data remain useful for estimating "surface" concentrations in general since the data
set is so extensive.
While all PCB metrics developed from the 1984 data were employed (i.e., "surface"
concentration, maximum concentration [cores only], LWA, and MPA), it is useful to note the
correlation of surface concentration and MPA. This is illustrated in Figure 3-10. The two graphs
in the figure represent the correlations of the "surface" concentration with MPA for the core and the
grab data, using only the quantitative results. From these diagrams it can be seen that the results arestrongly correlated. This is to be expected for the core results, since the "surface" concentration is
represented by the 0-30 cm segment and the majority of the PCB inventory was found to reside in
this layer for most cores. The result for the grabs is expected as well since the relationship between
3-32 400403 TAMS
concentration and MPA used for the grab samples was developed from the core data. Nonetheless,these diagrams illustrate the effective relationship between MPA and concentration as measured.
For both data sets, the "surface"concentration corresponding to an MPA of 3 g/m2 is approximately10 mg/kg, and the "surface" concentration corresponding to an MPA of 10 g/m2 is approximately
30 mg/kg. Since these parameters are so closely related for the 1984 data set, selection of remedial
areas based on an MPA or "surface" concentration criterion will tend to identify the same areas. Thediscussion and derivation of the 3 g/m2 and 10 g/m2 criteria are provided immediately after thissubsection.
The 1984 sediment data represented the main data set for the selection of remedial areas inRiver Section 1 based on PCB criteria. All four PCB metrics were determined from the data (notethat no PCB maxima were determined from the grab samples) and examined in the selection process.
General Electric 1991 Sediment Composite Survey
GE conducted a survey of the Upper Hudson in 1991 by collection of cores from
approximately 1,000 sites. The sediments from these sites were composited based on collection
depth and field classification into 309 samples representing three separate depths (0-5, 5-10, and 10-
25 cm), or 92 composite samples for each depth. An additional 35 composites consisted of grab
sample locations. Only one depth is represented by these composites. These samples represented
various areas in the Upper Hudson from Rogers Island to Lock 3.
The stations included in individual composite samples were separated by relatively long
distances, up to 1.5 miles below the TI Dam and closer to 0.5 mile in River Section 1. Samplecomposites were constructed with the intention of matching sediment types (i.e., silts with silts,
sands with sands, etc.). However, composites frequently crossed the river, potentially combining
sediments from different environments despite the similarity of texture. Additionally, main channel
composites were constructed from grab samples, not cores; thus, the true depth of sampling is notwell constrained, although it is believed to be on the scale of 2 to 5 cm. ^
oi£>OThese samples (GE, 1991) were analyzed by capillary column chromatography, and the data rf*
were reported as PCB congeners, which were readily converted to a Tri+ basis for this evaluation.
3-33 TAMS

The 1991 GE data were used strictly on a concentration basis, since MPA and LWA were
not considered to be well defined in this context. In particular, the limited sample depth (25 cm or
10 in) would potentially yield underestimates for these parameters if substantial PCB inventories
were present below this level. Additionally, given the great spatial extent of the samples and the
tendency for composites to blur significant areas of high concentration, these data were only used
from a review or confirmation perspective. No specific criteria were developed for these data.
USEPA 1992 Side-Scan Sonar Survey
As a part of the extensive geophysical survey conducted during the Reassessment RI, River
Sections 1 and 2 were surveyed using side-scan sonar. These acoustic data were used to assess the
physical properties of the river bottom, including sediment texture and morphology (Flood, 1993;
USEPA, 1997a). The interpretation of these data included the delineation of areas of fine-grained
(cohesive) sediment, coarse-grained (non-cohesive) sediment, and rocky areas. The 1984 NYSDEC
sediment survey showed the cohesive areas to have significantly higher PCB concentrations relative
to non-cohesive areas. This finding was confirmed by the USEPA's low resolution sediment coring
program conducted in 1994.
The sediment texture delineations were used in a subsequent reanalysis of the 1984 sediment
data (USEPA, 1999b) that was used in turn to prepare the mapping of the river MPA and "surface"
concentrations used in selection of remedial areas in River Section 1. Additionally, the noted
coincidence of higher PCB levels and fine-grained sediment added fine-grained sediment texture to
the list of criteria used in the selection of remedial areas. This criterion was considered secondary
to that of the PCB metrics, in part due to the occurrence of glacial clays at the sediment surface.
Nonetheless, this criterion was an important consideration in selecting the remedial target areas.
USEPA 1992 Bathymetric Survey
For the Reassessment RI, USEPA also obtained bathymetric data throughout the surveyed
areas of River Sections 1 and 2 during the geophysical investigation. These data, which were used
to generate bathymetric maps to identify regions of shallow water as well as the main channel of the
river, were utilized to support selection of remedial areas based on the supposition that the shallow
3-34 400405 TAMS

regions of the river contain relatively higher sediment PCB levels. To this end, bathymetry aidedin defining remedial area boundaries for areas already defined as contaminated based on PCB data.
In River Section 3, bathymetric data obtained from NO A A navigational charts (NOAA, 2000) were
used only in engineering design, not in identification of remedial areas.
USEPA 1994 Low Resolution Sediment Coring Program
Another part of the Reassessment RI involved collection of low resolution sediment coresfrom the Upper Hudson. These cores were intended to provide current estimates of the PCBsediment inventory for the purposes of comparison with the previous NYSDEC studies discussed
above. The cores averaged about 57 cm (22 in) in length, consisting of nominally 23-cm (9-in)segments. The last 5- to 10-cm interval (i.e., the bottom) of the core were analyzed for cesium-137
to establish whether the core included all post-1954 deposition, thereby representing the entire PCB
inventory at each location. Seventy cores were collected at 13 clusters in River Section 1. However,
the tightly grouped nature of the samples was not appropriate for estimating large area inventories,
so these samples were merely considered as an additional set of data for examination. They could
not be used to estimate the absolute PCB concentrations or MPA for sediments on a broad scale.
In River Sections 2 and 3, the low resolution sediment coring program examined a total of
seven of the historically defined hot spots, as originally identified by NYSDEC. NYSDEC's original
analysis indicated that these hot spots contained about 75 percent of the hot spot PCB inventory
below the TI Dam. Thus, although only 7 of the 20 hot spots below the TI Dam were sampled in the
LRC, the majority of the known PCB mass in these regions was surveyed. In these hot spots,
sampling was done with the express purpose of estimating sediment inventory on a hot spot scale.On this basis, these samples were used to estimate the PCB metrics for each of the seven hot spots
studied.
Quantitation of PCB s in these samples was reported on a congener basis and therefore could,£,
be easily converted to a Tri+ basis for analysis and comparison with the other data sets. Like the oo1984 data set, the estimation of "surface" concentrations from these samples was based on relatively Q
a\thick segments (23 cm). MPA and LWA, however, were readily calculated from the data. Also,again like the 1984 data, the "surface" concentration and the MPA were correlated as shown in the
3-35 . TAMS
upper diagram of Figure 3-11. The MPA criteria of 3 g/m2 and 10 g/m2 corresponded to Tri+ PCB
concentrations of 9 and 25 mg/kg, respectively. These values were quite similar to those determined
from the 1984 data set (10 and 30 mg/kg respectively).
In the lower diagram of Figure 3-11, the correlation between MAP and LWA is shown forthe low resolution cores. This correlation is higher than that shown in the upper diagram. This isto be expected, since both MPA and LWA use the majority of core segments at each location. The
MPA criteria of 3 g/m2 and 10 g/m2 corresponded to LWA values (8 and 24 mg/kg, respectively) verysimilar to the corresponding "surface" concentration values. This is expected as well, since the top-most segment generally contained the majority of the PCB inventory. Thus MPA, LWA, and
"surface" concentration were largely determined by the same core segment, that is, the top one, in
each core.
Overall, these data proved most useful in River Sections 2 and 3 where their spatial coverage
was designed to aid in estimating hot spot scale conditions. These data were supplemented by the
1976-78 data to examine other hot spots as well as the areas outside the hot spots.
General Electric 1998 Sediment Composite Survey
In 1998, GE undertook a second round of sediment composite sampling. This effort was not
as extensive as the first and was largely limited to River Section 1. The survey attempted to replicate
many of the 1991 composites, although overall distances represented by individual composites were
generally shorter and no cross-channel compositing was performed. Sampling occurred at a total of
165 sampling locations, with two depths obtained per location (0-2 and 2-5 cm). These locations
were composited at the two depths to yield 19 samples per depth interval. Three composite grab
samples were generated as well, with an undefined depth of collection presumed to be the top few
centimeters. Sample composites were examined as part of the remedial target area selection process
as measures of "surface" sediment only, due the limited sampling depth. Again, due to their great
spatial extent and limited depth, these data could only be used from a review or confirmation
perspective. No specific criteria were developed from these data.
4004073-36 TAMS

r;:
General Electric 1998-1999 Sediment Coring Program
In 1998 and 1999, GE collected a number of cores from the Upper Hudson. This coring
program really represented a series of small coring studies, each with its own goals. Core slicing
intervals, maximum core depth, and distance to other GE coring locations varied among the cores.
As a result, the cores obtained are not representative of large areas of the river. To utilize these data,
the core results were assembled so as to provide estimates of the 0- to 5-cm concentrations whenever
possible. Estimating "surface" concentrations in this fashion was the main application of this dataset.
Some subsets of the data focused on Hot Spots 14, 16, and 28. These cores could provide
data on "surface" (0-5 cm) and shallow (5-15 cm) sediment concentrations, but in most instances the
cores were too shallow to be used for an MPA or LWA calculation.
Analytically, these data were similar to the 1991 sediment data and therefore were easilyconverted to the Tri+ PCB basis.
Like the other GE data, these data were not sufficient to provide a basis to classify large areas
of Upper Hudson sediments. These data were used on a review or confirmational basis to support
the choices made based on the more extensive data sets.
Summary of Data Sets Available
As a result of the variable data coverage documenting Upper Hudson sediments, no single
data set provides a sufficient basis to select areas for remediation in every section of the river.
Therefore, coverage of the three sections had to be pieced together to assess PCB contamination,
weighing both extent of data coverage as well as the age of the data. Table 3-2 outlines the
application of the data sets available in each river section. It should be noted that where one datai£»set presents the main basis of information, the other data sets were used to supplement those data oo
whenever possible. These data sets are noted on Table 3-2 as well. £oo
3-37 . TAMS
3.5.3 Criteria for Selection of the Remedial Target Areas
This subsection contains a description of the criteria that were used to develop the three
levels (thresholds) of sediment remediation, which in turn were used to construct the remedialscenarios. These criteria were derived based on the information presented in the foregoing
discussions, taking into consideration the available data for each river section. While these criteriaprovide a set of selection parameters, it is important to note that they are applied more as guidelinesrather than as absolute rules, for two primary reasons: engineering limitations must also be
considered, and much of the existing data is relatively old. Current conditions are unlikely to
precisely match historical ones, although it can be anticipated that areas of historically higher PCB
concentrations will continue to be contaminated relative to current mean or median conditions.
However, considering the age of some of the data as well as the documented variability of the
sediment contamination, it is not appropriate to apply the criteria on a strict basis. Rather, the
criteria are used to identify remedial areas where elevated levels of PCB contamination arecharacteristic of the area.
The anticipated remedial operations are not "surgical" in nature and thus it is not appropriate
or productive to attempt to remove all sediments exceeding a specified threshold value. It is
important to recognize that the purpose of remediation is not to remove all PCB-contaminated
sediments exceeding some specified threshold. Given the importance of the near-shore environment
to both ecological exposures and PCB release from the sediment, the focus of the application of each
remediation threshold will be sufficient reduction of PCB mass and concentration to achieve the
RAOs, not to target every isolated contaminated area.
The analyses performed as part of the Reassessment RI have documented the tendency for
higher levels of PCB contamination to coincide with fine-grained sediments in the near-shore
environment. Additionally, statistical analysis of PCB contamination shows it to occur in patterns
aligned with the direction of flow, similar to that seen in the sediment texture itself. Nonetheless,
PCB contamination can vary significantly over short distances. Conditions wherein a highconcentration is surrounded by a number of low values or vice versa are fairly common. These
considerations played an important role in selecting the remedial areas for the Hot Spot and
Expanded Hot Spot remediation criteria, since these were intended to reduce PCB levels and
3-38 400409 TAMS
l/"""^ exposure without addressing all occurrences of PCB contamination, as noted above. In particular,1 engineering considerations determined that the minimum unit of area selected for remediation ber 50,000 square feet (sq ft).
| Since the modeling analysis does not provide a strict numerical value for PCB removal orcapping, criteria for identifying sediments targeted for remediation are derived both from the
I considerations described in this subsection and from general considerations from the modelinganalysis. Having identified and selected criteria on this basis, the model was used to compare and
I :|V contrast the proposed remedial scenarios derived from these criteria. Ultimately, this analysis will
be used to calculate the estimated reduction in risk resulting from the remedial scenarios, and therebyr-'I indirectly support the selection criteria.
\
3.5.3.1 Development of Mass per Unit Area (MPA) Criteria
y—N Based on its evaluation of the existing database for the PCB-contaminated sediments,
USEPA decided to use MPA as one of the primary criterion for the selection of remedial areas.
. Three different thresholds were developed to represent a range of remedial activity. The most
extensive in each section was the selection of all sediments greater than 0 g/m2PCBs (in other words,I1 all sediments within an area; referred to as Full-Section remediation). The other two thresholds were
sediments with a nominal MPA greater than 3 g/m2 (Expanded Hot Spot Remediation) and
sediments with a nominal MPA greater than 10 g/m2 (Hot Spot Remediation). The latter two
thresholds were developed from an analysis of the 1984 data set as discussed below.
As discussed previously (subsection 3.4.2.2), the 1984 data set represents the most
comprehensive coverage of any major area in the Upper Hudson in any given year. As such, it is
considered to be characteristic of the sediment contamination in the Upper Hudson River in general,and so can be used to assess the relationships among river sediment area, MPA, and PCBconcentration. That is, what areas are identified by a given MPA threshold? Similarly, how much
of the estimated sediment PCB inventory is contained within the sediments whose MPA is greater ^-N Q
than the same given threshold? oi(*MO
3-39 TAMS

To answer these questions and derive an MPA target criterion, the relationship among MPA,sediment area, and PCB mass were plotted for River Section 1 using the 1984 data. The sedimentdata are presented first as a pool-wide basis, then by cohesive and non-cohesive sediment areas.
Figure 3-12 presents three diagrams, representing the relationship among MPA, PCB mass, andsediment area for River Section 1. The two upper diagrams of this figure represent area and mass
plotted against MPA. In both diagrams, an initial gradual increase in area or mass with decreasingMPA gives way to a sharp rise in these parameters as relatively low values of MPA are approached.Also notable are two distinct rises in the relationships of remediation area and mass with MPA, onebetween 7 and 8 g/m2 and one between 1 and 2 g/m ? These features were not expected andprompted further analysis of the data.
The results for the cohesive and non-cohesive sediments were examined separately to see if
these rises in area and mass were present in both sediment distributions. Figures 3-13 and 3-14
present the MPA, PCB mass, and sediment area relationships for the two sediment types,respectively. The cohesive sediments show no break in slope at 1 and 8 g/m2. The non-cohesive
sediments show a more pronounced break in slope at these MPA values. Further investigation into
the non-cohesive sediment data showed these breaks resulted from the inclusion of the screened
samples. As described above, the 1984 data set included both analyzed and screened samples. Two
of the screening classifications comprised the majority of the screened results, "cold, <10 ppm," and
"10«50" (greater than 10 and less than 50 ppm). As it happened, the vast majority of the screened
data fell in the non-cohesive areas. Each of these categories was assigned a discrete value: "10«50"
was assigned a value of 18.2 mg/kg and "cold, <10 ppm" was assigned a value of 3.3 mg/kg. These
assignments were based on the median value of the samples in each of the groups that were both
screened and analyzed. The details of this analysis are provided in Chapter 4 of the DEIR (USEPA,
1997a). After considerations of density and sampling depth, these values translate to 7 and 1 g/m2.
It became apparent that these categories represented a large number of sampling locations, 101 at
7 g/m2 and 326 at 1 g/m2. In 1984, there were 1,138 locations in all, thus the relatively high number
of occurrences at these discrete values produces the breaks in the MPA curves.
Recognizing that these samples would represent a range of MPAs centered on these discrete
values, a secondary set of curves has been generated by a weighted average calculation. These are••. .
shown on the diagrams as dashed curves. These curves are expected to more closely represent the
3-40 400411 TAMS

true relationships between MPA and the other variables, by partially redistributing the valuesassociated with the screened samples.
In the bottom-most diagrams in Figures 3-12,3-13, and 3-14, the relationships between PCB
mass in the sediments and area remediated are represented for the whole pool, cohesive sediments
only, and non-cohesive-sediments, respectively. These relationships are defined from their
relationships with MPA. Two points are noted on each curve, 3 g/m2 and 10 g/m2. These valueswere selected based on the relationship between mass removed and area affected.
The 3 g/m2 value was selected as a criterion that represents a theoretical removal of about 90percent of the PCB inventory in River Section 1 (Table 3-3). That is, if all sediment areas with MPA
greater than 3 g/m2 were removed, 90 percent of the estimated PCB inventory would also be
removed. This is accomplished by the remediation of only 47 percent, or 235 acres, of the total river
bottom area within River Section 1, a total of approximately 520 acres. This value was chosen to
remediate large fractions of both the cohesive and non-cohesive PCB inventories, 98 percent and 84
percent, respectively. A larger fraction of the cohesive area (60 percent) is selected relative to the
non-cohesive area (40 percent), as might be expected given the tendency for higher PCB inventories
in the cohesive sediment (USEPA, 1997a).
The 10 g/m2 criterion was selected to represent a theoretical removal of about 65 percent ofthe sediment PCB inventory. Note that this criterion only selects about 17 percent (85 acres) of the
river bottom area within River Section 1. In fact, this criterion focuses the remediation on the
cohesive sediments, removing nearly 90 percent of the PCB inventory associated with these
sediments. This criterion results in the selection of only 37 percent of the non-cohesive PCB
inventory. Thus, the cohesive sediment PCB mass removed represents 70 percent of the total mass
removed. The distribution of river bottom area selected yields a similar proportion between cohesive
and non-cohesive sediment. The areas included under the 10 g/m2 criterion include 36 percent of
the cohesive sediment area, but only 9 percent of the non-cohesive sediment area. Thus, 80 percentof the total area meeting the 10 g/m2 criterion consists of cohesive sediment.
Both thresholds (3 g/m2 and 10 g/m2) have the potential to remediate the vast majority of the
PCB mass while affecting less than half of the TI Pool sediment area. These thresholds also capture
oo
to.2 n~A 1A r*l™1\
3-41 . TAMS

the majority of elevated "surface" concentrations as well, discussed later in this section. As shown
previously, based on the 1984 NYSDEC and 1994 USEPA data, an MPA of 3 g/m2 represents anaverage "surface" (0- to 12-inch) Tri+ PCB concentration of approximately 10 mg/kg, and an MPA
of 10 g/m2 represents an average "surface" concentration of approximately 30 mg/kg. Lastly, it isimportant to note that the MPA criteria developed here and summarized in Table 3-3 form only oneof several considerations in selecting areas for remediation. In particular, engineering considerationsas well as data uncertainty will act to reduce the estimates of mass to be remediated under the HotSpot and Expanded Hot Spot remediation scenarios relative to the theoretical limits set by the strict
data interpretation described above. The complete set of criteria for each of the three remedial
threshold is presented below.
3.5.3.2 Remediation Threshold Criteria
The criteria for each of the three remediation thresholds - Full-Section remediation,
Expanded Hot Spot remediation, and Hot Spot remediation - are described below.
Full-Section Remediation
This threshold involves the remediation of all sediment in the entire river section, with the
exception that areas are excluded based solely on engineering issues and sediment texture. That is,
accessibility by the remedial equipment is the major limitation in deciding whether an area receives
remediation. The engineering issues themselves are described later in this report. The only other
concern in this regard is the identification of rocky areas of the river bottom. In general, these areas
have not been demonstrated to harbor significant PCB inventories or concentrations, nor are they
readily treated using standard dredging equipment. As a result, areas defined as rocky are excluded
under this remediation scenario. It should be noted that this threshold (Full-Section remediation)
is only developed for River Sections 1 and 2.
3-42 400413 TAMS
Expanded Hot Spot Remediation
The criteria for the selection of remedial areas under this threshold were designed to identify
and treat the majority of fine-grained PCB contamination as well as similarly contaminated areas of
coarse-grained sediments in the river section. Effectively, this sediment target threshold includes
nearly all significant near-shore contamination and reduces PCB contamination near or in the river
channel. To accomplish this, the following criteria were established:
1 . Remediate sediment with a MPA greater than 3 g/m2;
2. Remediate "surface"sediment concentrations greater than 10 mg/kg;
3. Select contaminated locations in proximity to other locations of comparable level of
contamination (i.e., meeting criteria 1 or 2 immediately above), so as to generate a
target area of sufficient size (see criterion 4, below) for remediation;
4. Select a minimum area to be remediated of no less than 50,000 sq ft; and
5. Select remediation area boundaries based on sediment texture bounds and
bathymetry, where appropriate.
These criteria were applied to the Upper Hudson River to identify areas for Expanded Hot
Spot remediation for each of the three river sections.
Hot Spot Remediation
The criteria for the selection of remedial areas under this threshold were designed to identify
and treat a smaller area of the river as compared to the Full-Section and Expanded Hot Spot
remediation thresholds while still capturing the worst conditions measured. Effectively, this scenario
is limited to the fine-grained areas in the near-shore environment. Given the likelihood that the near-
shore environment is both the main PCB release area and the main area of biological exposure, this
remediation was designed to provide a substantive reduction in release and exposure. To accomplish
this, the following criteria were established for the Hot Spot remediation threshold:
1. Remediate sediment with a MPA greater than 10 g/m2;
2. Remediate "surf ace" sediment concentrations greater than 30 mg/kg;
3-43 . TAMS
o
3. Select contaminated locations in proximity to other locations of comparable level of
contamination (i.e., meeting criteria 1 or 2 immediately above), so as to generate atarget area of sufficient size (see criterion 4, below) for remediation
4. Select a minimum area for remediation of no less than 50,000 sq ft; and5. Remediate area boundaries based on sediment texture bounds and bathymetry, where
appropriate.
These criteria were applied to the Upper Hudson River to identify areas for Hot Spot
remediation in each of the three river sections.
3.5.4 Criteria Application
The application of the criteria described above yields a substantial volume of sediment,
regardless of the remediation target threshold. The range in volume is approximately two-fold from
the smallest scale (Hot Spot remediation) to the largest scale (Full-Section remediation) effort. Table
3-4 presents a summary of the remediation volumes on a section basis. To construct the sediment
volumes for the remedial scenarios described later in the FS, one need only match the river section
with its assigned level of remediation and sum the values to obtain the volume for the entire Upper
Hudson. Results for areas affected and mass of PCBs removed, based on the 1984 data, are also
presented in Table 3-4.
The discussions above describe the criteria used for the selection of sediment areas for
remediation. The selection criteria for the Full-Section remediation are based solely on engineering
considerations that are discussed later in this report. A more detailed description of the areasincluded within the Full-Section threshold, including figures illustrating the areas involved, is
presented later in this FS. For the other two remedial thresholds, however, the criteria given above
could not be applied in an absolute way due to conflicting considerations (e.g., area size vs. degree
of contamination). In light of this, it is useful to see several examples as to how these criteria were
applied.
3-44 4°°415 TAMS
3.5.4.1 Examples of the Areas Selected Under the Expanded Hot Spot Remediation
The Expanded Hot Spot remediation threshold considered MPA and "surface" concentration.
Typically, these criteria lead to the same or similar area selections. Five examples of the criteriaapplication are provided for the Expanded Hot Spot remediation: two from River Section 1; twofrom River Section 2; and one from River Section 3.
River Section 1 (I)
The first example covers the river in the vicinity of Hot Spot 8, RM 191 to 192.5. This area
of the river has seen a fairly extensive amount of study, with data available from all eight datasources listed previously. Figure 3-15 illustrates each of the data sets examined in this area, with
MPA and "surface" concentrations calculated for the 1976-78, 1984, and 1994 investigations. As
a result, there are a total of 19 data representations (i.e., 19 diagrams) on the figure, including
""" diagrams of the original NYSDEC hot spot boundaries, the Expanded Hot Spot remediation scenario
f boundaries, and the Hot Spot Remediation scenario boundaries. Each diagram in the figure
I represents the same area of the river, with a different data representation superimposed on the map.
, Sample locations have been color-coded by concentration or MPA on a log-scale, with half-log steps
I (factor of 3. 16 or 10I/2), in recognition of the log-normal distribution that is characteristic of PCB
I contamination in the Upper Hudson (USEPA, 1997a). The same color coding is used in all point
i representations of the data. That is, the range of values 3.2 to 10 is always bright blue for allI sampling point representations, both MPA and concentration. The only exception is the polygonal
* ;- declustering results for 1984, which uses a different color scheme.
""•"" Also shown on each map are the boundaries relating to rock or rocky areas of the river
f bottom, dredge spoil mounds, and islands, each of which are unlikely to be included in the remedial' ; areas selected. Two bathymetric contours are shown on each diagram, at 6.5 and 12.5 feet, as an aid
y in locating the shoals and channel. Finally, the remediation boundaries are shown in each diagram
^^ to illustrate how the boundaries compare with the data used to derive them. o
Three remedial target areas have been identified in Figure 3-15. The largest and mostimportant of these areas is found along the eastern shore, coincident with the original NYSDEC Hot
3-45 TAMS
o•*I"4

Spot 8. The other two are found along the western shore, one at RM 192 and the other at RM 191.5,
corresponding to Hot Spot 9. In the first two diagrams of Figure 3-15, the 1976-1978 NYSDECsediment survey results are plotted as MPA and "surface" concentrations, respectively. These data
show a general coincidence of higher values within the selected areas. However, these data were not
strictly considered in determination of the target area since they were superseded by the more
extensive and definitive 1984 survey, which is represented in the next four diagrams of the figure.
In the first two of the 1984 diagrams, the data have been represented as individual points. For the1984 MPA diagram, locations marked by bright blue or lighter colors are nearly all contained in theselected areas. The river channel near RM 191.8 has several blue points scattered among the darker
markers that would, strictly speaking, meet the MPA criteria. However, these locations represent
grab samples with low surface concentrations (less than 10 mg/kg; see the next diagram) foundoutside the cohesive areas (see the sixteenth diagram), and are therefore not included. The 1984
diagrams show how the more contaminated locations in both concentration and MPA are not only
coincident but also are captured within the remediation boundaries.
Diagrams 5 and 6 show the 1984 data in a Thiessen polygon representation. This approach
has been previously presented in the LRC Responsiveness Summary (USEPA, 1999b) and
summarized in Chapter 1, and is therefore not repeated here. Essentially, the polygons have been
assigned values based on their locations within the side-scan sonar boundaries and their proximity
to 1984 samples of similar sediment texture. Thus, cohesive sediment samples were used to define
polygon properties in cohesive sediment areas and non-cohesive sediments were applied to polygons
in non-cohesive areas. As can be seen on these diagrams, the vast majority of the polygons with
elevated MPA or "surface" concentration lie within the target remediation areas included within the
Expanded Hot Spot criterion. Note that the threshold color for MPA is yellow while the threshold
color for "surface" concentration is the faded green. An occasional polygon with MPA or
concentration above the threshold lies outside or partly outside the boundaries, but these areas are
scattered and therefore do not meet the third criterion, proximity to other contaminated areas. In
some instances, the remediation boundary crosses through a polygon. In most cases, the sampling
point has been included but the polygon has been clipped based on bathymetry, sediment boundaries,or simply the assessment that the remainder of the area (polygon) is relatively far from the sampling
location and therefore poorly known.
4004173-46 TAMS
I/*"""> The next three diagrams represent the composite samples from the 1991 GE investigation.' Application of these data for selection purposes is problematic due to the manner in which the
I samples were obtained. The compositing process creates a mechanical average of the samples andlimits the high and low values. Additionally, the GE composite samples spanned long distances and
I frequently crossed sediment boundaries as defined by the side-scan sonar results. As a result, thesedata are only useful to confirm areas of high PCB concentrations, but are not used to eliminate
i marginal areas. The three diagrams represent the GE composites from 0 to 5 cm, 5 to 10, cm andi
1 to 25 cm. In general, the eastern remedial area is confirmed by the GE samples as exceeding thep: criterion of 10 mg/kg in the "surface" layer. The western remedial areas are not completely
coincident with the GE composites; therefore, the samples are of limited usefulness. Note that/"' •I several composites cross the river in the vicinity of the western remedial areas.
iI Diagrams 10 and 11 represent the 1994 USEPA low resolution coring data in the region.
While these data are not sufficient to redefine the remedial boundaries, they serve to confirm the
i ^-^ general level of contamination. Sediment inventories and "surface" concentrations appear lower in
most matched locations but are still above the threshold criteria for both parameters.Ii .
Diagrams 12 and 13 represent the 1998 GE composite samples at 0 to 2 and 2 to 5 cm depth!f intervals, respectively. These data have the same limitations as the 1991 results but still confirm the
elevated concentrations along the eastern shore. Diagrams 14 and 15 represent the 1998-1999 GEi • • 't coring data from the area. These data, like the 1994 USEPA results, confirm the existence of higher
r PCB levels in the remedial areas, with conditions similar to those seen in 1994.('.•.-.'-
IK? Diagram 16 represents the 1992 side-scan sonar interpretation. The basic approach for! establishing the remedial boundaries becomes evident through an examination of this diagram in
i conjunction with the 1984 MPA diagrams. Essentially, areas of higher contamination were
identified with the 1984 data and then bounded using the side-scan sonar interpretation. Subsequent
data served to substantiate this approach and confirm the continued existence of contaminatedsediments in terms of both PCB inventory and "surface" concentration. Diagrams 17 and 18 are o
,,../*—% °| provided simply for reference to permit a comparison of the Expanded Hot Spot remediation areas £
to the original NYSDEC hot spots and the less extensive Hot Spot remediation.
3-47 . TAMS
River Section 1 (II)
Figure 3-16 represents the area near Hot Spot 14, between RM 189.6 to 190.6. The figure
is structured in the same manner as Figure 3-15. Here again, the 1984 data set is the basis foridentifying areas of contamination. The side-scan sonar boundaries are used as guides for theremedial area boundaries. Data collected subsequent to the 1984 study confirm these areas as
contaminated. The exceptional area in this figure is the remedial area to the west of Griffin Island.This region is not characterized by high MPA (greater than 3 g/m2) values based on the 1984 data,although some marginal MPA values (3 to 10 g/m2) were obtained in 1994. However, high surfaceconcentrations were obtained in 1984 and 1994, and these data are further supported by the 1991 GEcomposites for the area. On this basis, the area was selected for remediation. It should be noted that
this area also contains the location used by NYSDEC for its spring fish monitoring station. Elevated
concentrations of PCBs in fish were also found in this area (e.g., PCB concentrations in largemouth
bass averaged over 23 ppm in 1997, based on NYSDEC data for Griffin Island [USEPA, 2000t]),
further supporting the selection of this area for remediation.
River Section 2 (I) '
Figure 3-17 represents the area around Hot Spot 28, RM 185.2 to 186.2 from Section 2 of the
river. There are six fewer diagrams on this figure than on Figures 3-15 and 3-16 because no 1984
NYSDEC samples and no 1998 GE cores were obtained in this area. The 1976-1978 NYSDEC data
showed this area to be contaminated, as is evident in the first two diagrams. The 1994 results
showed the NYSDEC data to have seriously underestimated the sediment inventory in this area
(USEPA, 1998b), as can be seen by comparing diagrams 1 and 6. Diagram 6 shows a larger
proportion of locations greater than 100 g/m2. The 1991 GE composite results for the area (diagrams
3, 4, and 5) do not suggest elevated "surface" concentrations. However, the GE composites extend
over such long horizontal distances that they are of little value in delineating remedial areas. As
shown in diagrams 8 and 9, the 1998 GE cores were few in number but nearly all the GE composites
confirmed the presence of PCB contamination exceeding the criteria.
Definition of the remediation boundaries was based on the side-scan sonar results for the area
and the 1994 sediment data. This can be observed by comparing the remediation boundaries with
3-48 400419 TAMS

the 1994 data and the side-scan sonar map in diagram 11. The only difference between theExpanded Hot Spot remediation and the Hot Spot remediation for this area is the exclusion of theshore area below RM 185.6. This exclusion is based on the relatively low levels of concentrationobserved in this area in the 1976-1978 survey. No subsequent data were obtained in this area.
River Section 2 (II)
Figure 3-18 is a representation of the area around Hot Spots 34 and 35, RM 183.25 to 184.25,
in River Section 2. Like the previous area, no 1984 data and no 1998 composite data are available.
Additionally, no 1998-1999 coring data are available either. This reduces the figure to 10 diagrams.
The 1976-1978 data show this region to contain many contaminated locations with "surface"
concentrations frequently greater than 100 mg/kg. The 1991 GE composite data are again very
limited in their usefulness due to the length of river from which composites were generated. The
1994 data set produces values that are still above the thresholds for MPA and concentration, but are
relatively lower than those observed in 1976-1978. This is consistent with the conclusions of the
LRC (USEPA, 1998b). The fact that both inventory and concentration decline suggests loss to the
water column and hence to locations downstream. The 1994 data, while not as extensive as the
1976-1978 data, are still considered sufficiently representative of the area to indicate the continued
contamination of cohesive sediments in the region. Thus the 1994 data along with the side-scan
sonar are used to define the remedial areas. The remedial areas for the Hot Spot remediation are alsoshown on the figure. These areas are also largely defined from the side-scan sonar data, with atruncation of the northern extent of remediation based on the lack of substantive levels in the 1976-1978 data set and the lack of any subsequent sampling.
River Section 3
Hot Spot 36 in River Section 3 is the last example area to be examined for the Expanded HotSpot remediation, as shown in Figure 3-19. The available data for this area is more limited than any
previously described. Only 1976-1978 NYSDEC samples and 1991 GE composites are available
for the area. While the 1976-1978 data document an extensive inventory and elevated "surface"concentrations, particularly around the 6.5-ft contour, the 1991 GE sample data do not appear to
include this area. Some of the discrepancies may be due to differences in the USEPA and GE maps
3-49 TAMS

of the region. Nonetheless, the GE samples are composited over such a long area that they lack theability to discern local PCB contamination. Side-scan sonar data were not available for RiverSection 3, but some data on sediment texture was obtained by GE during a sediment probing study,surveying the river bottom with a long, thin pole. These results are considered only approximate butsuggest the continued presence of fine-grained sediments in this area. Consideration of the 1976-1978 sediment data and the GE sediment probe study was the basis of the boundaries shown inFigure 3-19. It should be noted that none of the area around Hot Spot 36 was selected for the HotSpot remediation because of its generally lower level of concentration.
3.5.4.2 Examples of the Areas Selected under the Hot Spot Remediation
In Figures 3-15 to 3-19, one diagram representing the Hot Spot remediation is included for
comparison with the Expanded Hot Spot Remediation. In Figures 3-17, 3-18, and 3-19, theboundaries are similar enough that further discussion is not needed. However, in River Section 1,the differences between the two remediation approaches are less straightforward, largely due to thegreater abundance of data. To demonstrate this, two examples are shown, corresponding to the first
two examples given above.
Figure 3-20 presents the area around Hot Spot 8. The diagrams in Figure 3-20 correspondexactly to those in Figure 3-15, the difference being a less extensive remediation area. The datapresented in Figure 3-20 are identical to those shown in Figure 3-15. The best place to begin thecomparison is with diagrams 18 and 19 in the figures. These permit a direct comparison of the areasselected. In general, the areas included under Hot Spot remediation are narrower as well as lessextensive than those included under Expanded Hot Spot remediation. The large eastern shoreremediation area is narrower off the islands and no longer extends across the width of the river atthe northern end of the example area. The southernmost end is also trimmed. These adjustmentsare developed from the Thiessen polygons shown in diagrams 5 and 6. Note the lesser extent ofareas greater than 10 g/m2 as compared to areas greater than 3 g/m ? Some of the adjustment isdesigned to follow the cohesive/non-cohesive boundary more closely, such as at the southern endof the eastern remediation area.
3-50 TAMS
400421

The areas defined for the Hot Spot remediation are also supported by the 1994 MPA and
1998 MPA results, although these data are not sufficient to redefine the boundaries (see diagrams10 and 14, respectively). These areas are less well-supported by the later PCB concentration data.The 1991 and 1998 GE composites only show elevated concentrations in the deeper segments on the
eastern shore but again, these samples cover long distances and areas outside the selected areas andso serve to minimize local maximums. The 1994 "surface" concentrations showed a goodcorrespondence with the MPA for two of the three areas. The area on the southwest shore had lowsurface concentrations relative to the 30 mg/kg threshold, but was still selected since the MPA
exceeds the Hot Spot remediation threshold (10 g/m2). The 1998 GE core data were generallysupportive as well, with exceedances in the selected areas for both MPA and "surface" concentration.Overall, the areas selected for the Hot Spot remediation tended to be closer to shore as well as more
concentrated within the cohesive sediments, noted previously in Figures 3-12 through 3-14.
Figure 3-21 represents the Hot Spot remediation areas in the vicinity of Hot Spot 14,
corresponding to Figure 3-16. Again the diagrams in Figure 3-21 correspond exactly to those in
Figure 3-16, simply with the Hot Spot remediation areas indicated. A comparison of diagrams 18
and 19 shows that the areas selected for Hot Spot remediation are narrower and less extensive thanthose for the Expanded Hot Spot remediation, as anticipated. In particular, the large areas of non-
cohesive sediments along the eastern shore of Griffin Island (the western side of the main river
channel) have been excluded by the application of higher MPA and concentration thresholds. Theseareas fall just below the Hot Spot remediation criteria and just within the Expanded Hot Spotremediation criteria. The Hot Spot Remediation criteria tend to leave a few scattered areas inexceedance of the thresholds. The reduced areas are consistent with the 1991 to 1998 USEPA andGE sediment data. Diagrams 8 through 14 document the elevated MPA and concentrations foundin these areas. A large area (polygon) exceeding the MPA threshold can be seen in the main riverchannel at RM 189.8. This polygon was not selected under either remediation threshold because it
is based on a single point located in among the rocky areas to the east of the channel. The point canbe seen in diagram 4 at roughly RM 189.8.
These examples highlight the main difference between the two remediation approaches. Theo
MPA and concentration thresholds of the Hot Spot remediation tend to leave out the less »*tocontaminated non-cohesive sediments that border the cohesive sediments or the shorelines. Both M
3-51 TAMS

Hot Spot and Expanded Hot Spot remediation criteria include the majority of contaminated cohesivesediments.
3.5.4.3 Capture Efficiency
To assess the net effect of the various criteria used to develop the Ful-Section, Expanded HotSpot, and Hot Spot remediation thresholds, USEPA calculated the "capture efficiency" of eachapproach to assess the degree to which the areas targeted for remediation include the areas meetinga strict application of the threshold criteria. The capture efficiency is the percentage of area withina river section containing PCB-contaminated sediment at or exceeding the threshold MPA that is
targeted for remediation (i.e., captured). Capture efficiency is best determined using the 1984
NYSDEC data set for River Section 1 (^1 Pool), because only this data set is sufficiently detailed
to estimate the removal and residual percentages. However, similar capture efficiencies would be
expected for River Sections 2 and 3 if the data for these sections allowed similar calculations to beperformed.
For Full-Section remediation, all sediment is remediated, so the PCB-based criteria are
effectively an MPA of 0 g/m2 or greater and a "surface" concentration of 0 mg/kg or greater. Full-
Section remediation addresses 97 percent of the 15,400 kg of PCBs in River Section 1, based on the
1984 data. (The percentage is less than 100 since areas within River Section 1 which are unavailable
[inaccessible] for treatment due to various engineering or access limitations are excluded from Full-
Section remediation.) Table 3-4 presents estimates for mass of PCBs remediated in each of the riversections. For River Section 1, the percentage of the total PCB inventory addressed by eachremediation scenario is listed. For River Sections 2 and 3, however, it is not possible to calculate •a percentage of PCB mass remediated, because the data are insufficient to estimate the total PCB jinventory within these sections.
The Expanded Hot Spot remediation captures ;86 percent of all locations with an MPA of 3g/m2 or greater, 77 percent of all locations with MPAs of 1 g/m2 or greater, 87 percent of all locationswith a "surface" concentration of 10 mg/kg or greater, and 85 percent of all locations with "surface"
concentration of 3.2 mg/kg or greater. Put another way, the Expanded Hot Spot remediation, whichis based primarily on an MPA of 3 g/m2, leaves behind only 23 percent of all areas with an MPA of
3-52 TAMS
400423

1 g/m2 or more and only 15 percent of all areas with a "surface" concentration of 3 mg/kg or more.
Simply stated, even though Expanded Hot Spot remediation is defined in part by the use of 3 g/m2,the Expanded Hot Spot remediation would address a substantial portion of the sediment contained
within an MPA of 1 g/m2 or more. This is illustrated in Figure 3-22. In each diagram contained in
the figure, the selection criterion is noted on a histogram of the 1984 sample data. The 1984 data
are tallied in the diagram as individual measurement locations. In each diagram, it is clear that the
selection process has captured the majority of the 1984 locations exceeding the Expanded Hot Spotremediation criteria. Notably, the Hot Spot remediation addresses 75 percent of the total PCB
inventory in River Section 1 (see Table 3-4). Within River Section 1, 92 percent of the total PCB
inventory is contained in sediments with MPA of 3 g/m2 or higher. Therefore, the capture efficiency
of Hot Spot remediation is calculated as the 75 percent addressed divided by the 92 percent includedin the applicable criterion (3 g/m2), for a capture efficiency of 82 percent (75/92). This mass of
PCBs captured under Hot Spot remediation (82 percent) compares well with the sediment areasaddressed under this threshold (86 percent of the area with MPA of 3 g/m2 or greater).
The Hot Spot remediation captures 73 percent of all locations with an MPA of 10 g/m2 or
greater and 76 percent of all locations with a "surface" concentration of 32 mg/kg or higher. This
is illustrated in Figure 3-23. The approach captures the majority of the 1984 locations exceeding the
MPA and "surface" concentration criteria. The lower capture efficiency compared to the Expanded
Hot Spot remediation results from a number of relatively small isolated areas with MPA valuesgreater than 10 g/m2 that are not selected due to their isolation and size (<50,000 sq ft; these areasare small, disconnected segments). The areas created using the Expanded Hot Spot remediationcriteria are generally more contiguous with fewer isolated areas than the Hot Spot remediation, ascan be seen in the examples previously presented. Notably, the Hot Spot remediation addresses 56
percent of the total PCB inventory in River Section 1 (see Table 3-4), out of a possible 66 percent
of the PCB inventory which is contained in sediments with MPA of 10 g/m2 or higher. This
represents about 85 percent (56 percent divided by 66 percent) of the theoretical limit. This capture
of 85 percent of the PCB mass included under Hot Spot remediation is relatively high compared tothe capture of about 73 percent of the areas meeting the 10 g/m2 criterion. This difference (85
percent capture on a mass basis, as compared to 73 percent capture on an area basis) is attributed tothe observation regarding the distribution of 10 g/m2 areas noted above (i.e., the occurrence of small
§
to3-53 TAMS *

isolated areas with MPA values greater than 10 g/m2 that are not selected due to their isolation and
size).
3.5.4.4 Other Considerations
Application of the PCB contamination and engineering criteria described above served tocreate three thresholds focused on reducing both sediment PCB inventory as well as sediment"surface" concentrations. These criteria were best applied in River Section 1 where data were
relatively plentiful, as compared to locations downstream. River Section 2 also had a fairly robustdata set against which to apply the selection criteria. The River Section 3 data set was the most
limited of the three sections and as a result, USEPA also considered other observations besides directsediment measurements in selecting possible remediation areas. In particular, the 1993 USEPA
water column study observed a substantial resuspension event associated with a one-in-three to one-in-five-year flow event on the Hoosic River. During this event, resuspension from the Hudson Riversediments significantly raised water column PCB concentrations and loads. This is discussed in theDEIR (USEPA, 1997a) and LRC Responsiveness Summary (USEPA, 1999b). Water column loads
were equivalent to the peak GE-related discharges from Hudson Falls seen that year (18 kg/day total
PCB).t
Given the frequency with which such flow events can occur (once every three to five years),
these events will serve to resuspend and transport contaminated Hudson River sediments from thevicinity of the Hoosic River on a regular basis, contaminating downstream areas. While the exactsource area of the resuspended sediments is unknown, Hot Spot 37, immediately downstream of theHoosic River confluence, is a likely candidate. This area hot spot has lost a substantial portion ofits 1976-1978 sediment inventory (USEPA, 1998b), although it still retains a significant PCBinventory. For this reason, this hot spot is likely to be selected regardless of remediation approach.
Similarly, Hot Spot 36 lies in a relatively unsheltered region of the river and is also likely to besubject to regular scour events (although not from the Hoosic River, whose confluence is further
downstream). Concern over its contributions to PCB resuspension would dictate its selection forremediation as well.
3-54 TAMS
400425

An additional consideration in the identification of target areas is centered on Hot Spot 39,
located in River Section 3. This hot spot represents a unique condition in the Upper Hudson River.Specifically, several of the core profiles obtained from this hot spot as part of the 1994 USEPAinvestigation indicated very high rates of sediment deposition. As noted in the LRC (USEPA,
1998b), many of the cores from this hot spot were incomplete, in that the typical 3-foot core lengthdid not extend through the entire thickness of contaminated sediments. Based on these results, it wasconcluded that the historical PCB inventory was undergoing burial in part of the hot spot. The areas
within Hot Spot 39 undergoing significant burial were identified by those cores whose PCB
maximum occurred below 24 inches. This criterion identified the central portion of the hot spot asundergoing significant burial. For this reason, this portion of Hot Spot 39 was excluded from
consideration under the Select remediation delineations. (Note that the Select remediationdelineations for this reach are developed in Chapter 6 of the FS.) In this portion of the hot spot it
is believed that the bulk of sediment contamination lies sufficiently below the surface and would notbe expected to pose a future problem. Additionally, the high rate of deposition in this area shouldfurther isolate the contaminated sediments. It should be noted that the portion of Hot Spot 39
excluded from Select remediation was included in the target areas identified under Hot Spot and
Expanded Hot Spot remediation.
Other areas within, or in the vicinity of, the NYSDEC delineation of Hot Spot 39 had coreprofiles more typical of Upper Hudson sediment contamination, with PCB maximum concentrationsoccurring in the uppermost layers of complete cores. As a result, these areas were considered in theselection of remedial target areas. These areas are all within the southern portion of Hot Spot 39,or just south of the NYSDEC delineation, and are referred to in the Select remediation as "thesouthern portion of Hot Spot 39".
3.6 Identification of General Response Actions
General response actions (GRAs) are categories of actions that may be implemented toachieve the project-specific RAOs. GRAs may include (but are not limited to) such categories astreatment, containment, disposal, or combinations of these categories. General response actions ^
oidentified for remediation of the Hudson River PCBs Site include the following: °
toa\
3-55 TAMS
• No Action;
• Monitored Natural Attenuation;• Institutional Controls;
• Containment;• In situ treatment;• Removal;• Ex situ treatment;• Beneficial Use; and
• Disposal.
The GRAs listed above represent only actions that would b? applied directly to thecontaminated sediments. Implementation of additional remedial activities, such as habitat
replacement, water treatment, backfill, and the like are considered part of the general actions listedabove. These additional remedial activities are considered in the technology screening, alternativedevelopment, and detailed analysis chapters that follow.
A brief description of each of the general response actions is provided below.
3.6.1 No Action
No Action will be considered throughout each phase of the FS, as required by the NCP.Under the No Action alternative, contaminated river sediments will be left in place without treatmentor containment. The effectiveness of this alternative is assessed as though there are no controls inplace, and existing upstream PCB loads (averaging 13 ng/LTri+ PCBs, as previously discussed) areassumed to continue indefinitely. No additional institutional controls or monitoring would be
implemented as part of the No Action alternative. No Action is appropriate if the site poses nocurrent or potential threat to human health or the environment.
3.6.2 Monitored Natural Attenuation (MNA)
Monitored Natural Attenuation includes monitoring and may include modeling to assess the
status and future of contamination at the site, but does not include active remedial measures. This
3-56 TAMS400427
response action may be appropriate if in situ processes would achieve site-specific RAOs in a time
frame that is reasonable compared to active remedial measures. For the Hudson River ReassessmentRI/FS, MNA includes the assumption that upstream remedial actions currently planned or underway
(e.g., such as the separate Non-Time Critical Removal Action [NTCRA] in the vicinity of the GEHudson Falls plant, conducted outside the scope of this FS) will reduce the upstream Tri+ PCB loadto about 0.0256 kg/day, corresponding to a concentration of about 2 ng/L, by January 1, 2005. MNAmay be used as one component of a total remedy, either in conjunction with active remediation, or
as a follow-up measure.
3.6.3 Institutional Controls
Institutional controls are administrative or legal controls intended to prevent or reduce humanexposure to on-site hazardous substances, processes established to reduce exposure to contaminants
of concern (i.e., PCBs) on a community and regional basis. For example, institutional controls for
the Hudson River PCBs site may include fish consumption advisories or fishing restrictions.
Institutional controls are typically utilized in conjunction with other remedy components, and not
as a stand-alone remedy.
3.6.4 Containment
Containment involves the physical isolation or immobilization of contaminated sediment
without treatment, for example, by an engineered cap. Containment technologies can be used toisolate contaminated sediment, thereby limiting the potential exposure to, and mobility andbioavailability of, contaminants in the sediments.
3.6.5 In situ Treatment
In situ treatment technologies may be used to reduce contaminant concentrations withoutremoval or containment of the contaminated sediments. Also, some in situ processes such asstabilization or solidification may reduce contaminant mobility or bioavailability. o
oifeto00
3-57 JAMS
3.6.6 Removal
Removal of sediments from the river consists of dredging or excavating contaminatedsediments for subsequent treatment or disposal. Contaminants (PCBs) are removed from the riverbed by this response action.
3.6.7 Ex situ Treatment
Ex situ treatment is treatment of PCB-contaminated sediments prior to removal (subsection
3.6.6) of the contaminated sediments. Numerous ex situ treatment options are available. Sediments
may be disposed of on land after treatment to meet disposal criteria; or offered for beneficial use
after treatment (including reuse as backfill for excavated sediments in the river) to meet beneficialuse criteria.
3.6.8 Beneficial Use
Beneficial use means that sediments removed from the river and meeting relevant criteria
(either with or without treatment) are used or placed in a manner that provides some benefit to thepublic.
3.6.9 Disposal
Disposal is the placement of material (after removal) into a site, structure, or facility on atemporary or permanent basis. Depending on the type of disposal, the excavated material mayundergo limited or extensive treatment prior to disposal. The disposal options vary depending upon
the characteristics of the excavated material (e.g., PCB concentration) and the degree and type oftreatment of the material prior to disposal. Disposal, as a GRA, is differentiated from beneficial usein that the contaminated material is assumed to require isolation from human and ecological
receptors to prevent adverse health or environmental effects.
3-58 TAMS
400429
Chapter 4
on^oo

4. IDENTIFICATION AND SCREENING OF REMEDIAL TECHNOLOGIES
Previous studies of the Hudson River have been reviewed as part of the process of identifyingtechnologies for consideration in this FS, including the NUS Feasibility Study (USEPA, 1984b) and
the Hudson River PCB Reclamation/Demonstration Program report by Malcolm Pirnie, Inc.
(NYSDEC, 1985), prepared as part of the Hudson River PCB- Reclamation/Demonstration Project.The majority of the treatment technologies reviewed at the time of publication of the NUS and MPI
reports were in the early stages of development, and little was known about their environmental
effects and costs. In addition, in some cases technologies had undergone preliminary testing but
were not developed further, or the process developers had since left the market. The Phase I Report
for this Reassessment RI/FS (USEPA, 199 la) provides a preliminary technology screening.
Various databases, technical reports, and publications, discussed in Section 4.1 below, were
used in conducting an updated search to identify and evaluate remedial technologies for use at the
Hudson River PCBs site. These and other resources were used to identify a number of potentially
applicable remedial technologies or process options for dealing with Upper Hudson River sediments
contaminated with PCBs. As an initial screening, each of the potentially applicable remedial
technologies was evaluated in terms of effectiveness and technical implementability at the site. A
brief description of the remedial technologies considered and the initial screening process is
presented in Section 4.2, and a summary of the screening process is presented in Table 4-1.
Technologies that were retained after the initial screening were submitted to a second screening
process and evaluated in terms of effectiveness, implementability, and costs. The second screening
process is presented in Section 4.3 and summarized on Table 4-16. Technologies that were retained
after the second screening were then used to develop remedial alternatives for the site as discussed
in Chapter 5.
4.1 Sources and Methods for Identification of Potentially Applicable Technologies
Among the databases, technical reports, and publications used in the search, of particular note ^oare the USEPA sources as follows: rfa.u>H
4-1 - TAMS

Superfund Innovative Technology Evaluation (SITE) Program (USEPA, 1999g);• Selecting Remediation Techniques for Contaminated Sediment (USEPA, 1993b);
• Assessment and Remediation of Contaminated Sediments (ARCS) Program Remediation
Guidance Document (USEPA, 1994);
• USEPA Hazardous Waste Clean-up Information (CLU-IN) web site (USEPA, 2000e);
• USEPA Remediation and Characterization Innovative Technologies (USEPA REACH IT)
database (USEPA, 2000f);
• Federal Remediation Technologies Roundtable (FRTR, 1999) web site; and
• Remediation Technologies Network (RTN) Remediation Information Management System
(RIMS, 2000) Database.
The SITE Program was created by USEPA to encourage the development and use of
innovative treatment and monitoring technologies. Under the program, USEPA works with and
supports technology developers who research, refine, and demonstrate innovative technologies at
hazardous waste sites. SITE demonstration project information is compiled and can be used as a
reference guide on innovative treatment technologies.
The ARCS Program was initiated in 1987 by USEPA's Great Lakes National Program Office
(GLNPO) to address sediment contamination in the Great Lakes. The ARCS program consisted of
a five-year study and demonstration projects relating to the treatment of contaminated sediments.
The ARCS remediation guidance document is a product of the ARCS Program, and was prepared
by the Engineering/Technology Work Group (ETWG), a working committee under the ARCS
Program. The guidance document provides information on the selection, design, and implementation
of sediment remediation technologies, including feasibility evaluation, testing technologies, and
effectiveness at past site projects.
The USEPA CLU-EN web site provides information about innovative treatment technologies
and includes descriptions of and contact information for relevant programs and organizations. It also
provides access to publications (e.g., Tech Trends) and other tools useful in technology review and
evaluation.
4-2 TAMS400432 i'--.

The USEPA REACH IT database combines information from three established USEPA
databases, the Vendor Information System for Innovative Treatment Technologies (VISITT)database, the Vendor Field Analytical and Characterization Technologies System (Vendor FACTS)
database, and the Innovative Treatment Technologies (ITT) database. This database combinesvendor-supplied information with information from the USEPA, the US Department of Defense(DOD), the US Department of Energy (DOE), and state project managers regarding sites at whichinnovative technologies have been implemented, and provides information on over 1,400remediation technologies and 750 vendors.
The FRTR describes itself as an interagency group seeking to improve the collaborative
atmosphere among federal agencies involved in hazardous waste site remediation. Member agencies
include the DOD, DOE, US Department of the Interior (DOI), US Department of Commerce (DOC),
US Department of Agriculture (DOA), and the USEPA. Its web site contains such information as
cost and performance of remedial technologies, results of technology development and
demonstration, and technology optimization and evaluation.
The RIMS 2000 database, owned and operated by the Research Technologies Network,
L.L.C., contains remedial technology information on nearly 900 technologies. It includes technical
paper abstracts, summaries, and components of remediation efforts undertaken since the inception
of CERCLA in 1980. This information is verified and updated by RTN on a monthly basis to
provide current and objective information on the status of innovative technologies.
4.2 Technology Identification and Technical Implementability Screening
Technologies are presented here grouped by general response action type in the same order
as presented in Section 3.6:
• No Action
• Monitored Natural Attenuation (MNA) ^" O
• Institutional Controls otfc"
• Containment oj
4-3 TAMS
• In situ treatment technologies
• Removal methods• Ex situ treatment techniques
• Beneficial use
• Disposal.
Additional remedial activities (e.g., sediment dispersion controls and sediment pretreatment
methods) are not discussed or evaluated in detail in this chapter. Some feasibility evaluation of a
number of these technologies will be conducted in Chapter 5 so that remedial alternatives can be
conceptualized sufficiently for detailed analysis. No Action is presented to provide a baseline for
comparison in accordance with the NCP. MNA is included as an option that provides extensive
continued monitoring of the river in accordance with USEPA guidance (USEPA, 1999J).
Technology identification and technical implementability screening comments are provided in Table
4-1.
4.2.1 No Action
Under No Action, no remedial action, including removal or containment of contaminated
sediment, treatment, engineering controls, or institutional controls, is implemented. According to
USEPA's 1988 RI/FS Guidance, No Action may include monitoring of conditions in the river in
order to verify that no unacceptable exposures to hazardous substances occur in the future. However,
for this FS, No Action does not include any monitoring; only the five-year reviews will be
performed. The No Action alternative is generally appropriate in situations where contamination at
a site presents no current or potential threat to human health or the environment, when CERCLA
does not provide the authority to take remedial action (for example, if the site contamination consists
only of a pure petroleum product), or when a previous response action has eliminated the need for
additional remedial action at a site. The NCP requires the No Action alternative to be developed as
one of the potential remedial actions to be considered in the Feasibility Study. The complete deferral
of remedial action is easily implemented technically and administratively. No Action will be
retained for further evaluation.
4-4 TAMS400434

4.2.2 Monitored Natural Attenuation
Monitored natural attenuation refers to the reliance on natural attenuation processes, within
the context of a carefully controlled and monitored site cleanup approach, to achieve site-specific
remediation objectives (e.g., reduction of volume and toxicity of contaminants) within a time frame
that is reasonable as compared to that offered by other more active methods. Natural attenuation- ! „.
processes may include biodegradation, biotransformation, bioturbation, diffusion, dilution,adsorption, volatilization, chemical reaction or destruction, resuspension, downstream transport, and
burial by clean material. Some or all of the processes may be occurring at any given time and
location within the river. In some cases, these processes transfer some or all of the mass of
contaminants (or derivative end-products) to and from the sediment and overlying water. The net
result of such processes is attenuation of the concentration of the contaminant within the sediment.
MNA can be implemented alone, along with an active remedial action, or after an active remediation
is completed. In addition, institutional controls (i.e., site use restrictions) may be implemented as
long-term control measures as part of an MNA alternative.
Extensive site monitoring and modeling are performed as part of monitored natural
attenuation to demonstrate that contaminant reduction is occurring, and that the reduction is
achieving cleanup goals (RAOs or PRGs). Long-term monitoring will be conducted in sediments,
in the water column, and in biota. Monitoring may include measurements of sediment accumulation
rates, contaminant levels in the sediment by depth, bioaccumulation by benthic organisms, and the
migration or harvesting of contaminated organisms. Loss of contaminants can be documented by
historical trends or contaminant concentration distribution showing a reduction in the total mass of
contaminants in sediments, water, and/or biota, or by the presence of degradation products in
sediments. The monitoring data can also be used as input parameters in mathematical models to
evaluate progress of the natural attenuation processes against the original predictions.
A significant limitation of natural attenuation, particularly where burial by cleaner sediments. - - *.is the primary attenuation process, is that burial occurs only in depositional areas. In addition, °
because natural attenuation depends upon maintenance of the uncontaminated sediment layer w' uianthropogenic processes, or long-term or cyclical changes in weather or severe storms, may result
"'•4-5 - TAMS

in erosion and scouring of the sediments and redistribution of the contaminants over wide areas, even
when burial is achieved.
Monitored natural attenuation is most appropriate as a remedy for sites where natural
processes have been observed or are strongly expected, and where there are no adverse impacts on
potential human or ecological receptors. Where there is a source present, USEPA guidance
(USEPA, 1999J) recommends that natural attenuation should be considered only when sourceremoval or control is also implemented. Natural attenuation that depends primarily on sediment
burial may not be appropriate in navigation channels where dredging is required for maintenance of
the channels. MNA will be retained for further evaluation.
4.2.3 Institutional Controls
Institutional controls are defined as non-engineering, administrative, and/or legal controls
at a site, intended to prevent or reduce human exposure to hazardous substances. Site use restrictions
may be applied to control use or disturbance of sediments or resources impacted by the sediments
(e.g., surface water and fish) that would otherwise pose danger to human health or the environment
if not addressed by remediation. Restrictions may include continuation or extension of existing fish
consumption advisories, limitations on recreational use, restrictions on private sediment disturbance
activities such as waterfront improvement or small craft access, and controls on sediment removal
(i.e., dredging). These restrictions are enforceable by NYSDEC or the USAGE. While there may
be gaps in compliance, implementation of such restrictions is not problematic from a technical
standpoint; therefore, institutional controls are retained for further evaluation. Institutional controls
may also be implemented at the site by USEPA.
Monitoring is not an institutional control (USEPA, 2000r); however, it is necessary in order
to implement and evaluate certain institutional controls, e.g., fish consumption advisories.
Monitoring of various media will allow ongoing evaluation of the concentrations" and effects of
PCBs in the vicinity of the river. Monitoring may include sediment sampling, water column
sampling, fish/biota sampling, and/or air monitoring in the vicinity of the river. All of these are
4-6 TAMS400436

potentially applicable and technically implementable; therefore all are retained for further evaluation.Air monitoring may not be necessary with a well-designed water column monitoring program.
It should be noted that both monitoring and site use restrictions are required to prevent orreduce human exposures to hazardous substances.
4.2.4 Containment
In situ control and containment measures are intended to reduce dispersion and leaching of
contaminated sediments to other areas of a water body, and to reduce direct human and ecological
exposure to contaminants. Sediment containment measures evaluated here are long-term remedial
options. They are different from the temporary sediment control options implemented during
dredging or excavation that are discussed in subsection 4.2.6 and evaluated in Table 4-8. Long-term
sediment control and containment methods evaluated include capping and use of retaining dikes and
berms.
4.2.4.1 Capping
Caps may be engineered for placement in subaqueous (i.e., fully inundated) locations and in
the flood zone where alternate cycles of wetting and drying may occur, as is the case at the remnant
deposit sites. Caps may be used in situ or to cover excavated or dredged materials consolidated for
disposal in subaqueous or near-shore areas. Capping would also be necessary for closure of upland
disposal sites. For purposes of this evaluation, the discussion is focused on in situ containment of
sediments. This typically involves the placement of a low permeability material on top of the
contaminated sediment. A low permeability material prevents or slows down the movement of
contaminated pore water into the water column. Caps can also provide for sorption and attenuation
of contaminants. In addition, placement of a cap on top of the contaminated sediments prevents
direct human contact and exposure of behthic organisms and demersal (bottom dwelling) fish to .ocontaminated material. o*.U)
4-7 - TAMS

There are practical limits to the application of engineered capping to the Upper Hudson River —r
due to its geometry (water depths) and navigational needs. Large tracts of the river are occupied by
fairly shallow shoal areas, in many places bordered by permanent or seasonal homes with waterfront ;!
access. In these areas, installation of a cap of any significant thickness could move the shoreline as >much as 20 to 50 feet toward the channel, changing both the character of the waterfront and |hydraulic features of the shoals. Thus, in-river capping in shallow shoal areas (water depth less than
t
6 feet) may be impractical unless removal of an equivalent thickness of sediment has been {
accomplished first. Capping is also inappropriate in the channel of the Champlain Canal, for which
a navigational draft of 12 feet must be maintained. if;
For purposes of this FS, water depths in River Sections 1 and 2 are defined by bathymetric \
data gathered in 1992. The flow rate at the time of this survey was approximately 3,090 cfs. The f
6- and 12-foot contours were mapped using a Triangulated Integrated Network (TIN) accessible to '
both CADD and GIS software. In River Section 3, i.e., downstream of the Northumberland Dam,
contours displayed on the NOAA navigation chart for the Hudson River were digitized into the
project mapping. Use of the term "water depth" in subsequent descriptions of technologies, remedial
alternatives, and engineering analyses is referenced to these mapped contours, particularly as they '
describe areas and action boundaries on the river bottom. (
It is recognized that the bathymetry may have changed somewhat since 1992, particularly as
demonstrated by the annual "canal sweeps" conducted by the Canal Corporation for estimating the
extent of dredging necessary to maintain the navigation channel. New York State Thruway
Authority data for 1999 is an example of such data. While the methods used to obtain the data are
not as sophisticated as those used to perform the bathymetric survey for the Reassessment RI/FS, the
results do indicate those areas where the channel has become shallower than the required 12 feet.
Because of the need to maintain at least 12 feet of draft in the Champlain Canal, the 12-foot
contour was used as a surrogate for the navigation channel. The 12-foot contour usually results in
a wider section than the defined channel (for which no digital mapping coordinates are available to
the project), thus likely providing a somewhat conservative estimate of its influence on removal
schemes. That is, calculations of volumes for removal will likely be larger than the actual volumes.
4-8 TAMS -"'400438

Conversely, the areas amenable to capping may be calculated as somewhat smaller than the actualareas. The net effect may be to marginally increase the costs of all active remediation alternatives,
since the cost of removal (and subsequent disposal) is greater than the cost of capping. This should
not have an effect on relative comparisons among active alternatives.
A wide variety of materials can theoretically be used to cap contaminated sediments in orderto minimize or reduce leaching (soluble diffusion), bioturbation, and erosive (convective) transport.
Capping materials may be divided into three basic categories: inert materials; active materials; and
sealing agents. Capping options evaluated for use in the Upper Hudson River are presented in Table4-2. Options that are highlighted on the table have been tested for or applied to freshwater sediments
or PCB-contaminated sediments.
The USAGE has performed extensive research on the placement of capping systems over
river sediments. The primary considerations for the design of any capping system are:
• Cap thickness required to isolate sediment from the effects of bioturbation;
• Extent of consolidation of the sediment and/or capping material during and after cap
placement;
• Geometry of the sediment surface;
• Potential for cap erosion after installation;
• Operational concerns; and
• Cap thickness required to control chemical flux from sediments to the water column.
The basic criterion for a successful capping project is simply that the cap required to perform
some or all of the intended functions identified above be successfully designed, placed, and
maintained (Palermo et al, 1998).
Bioturbation is defined as the movement and mixing of sediment as a result of the activities
of burrowing benthic organisms. Evaluation of bioturbation is important, as benthic activity may *•
result in mixing capping materials with underlying contaminated sediment, thereby reexposing the it*w
contaminants to the water column. Bioturbation also provides mechanisms for contaminant uptake *°
4-9 TAMS

by burrowing organisms with subsequent transfer up the food chain. The extent of benthic activity
needs to be defined in order to select a cap thickness that minimizes or prevents mixing of the cap
materials with the underlying sediment. Fish nesting behavior is another example that may also
result in mixing of capping materials with underlying contaminated sediments.
Contaminated sediments are usually fine-grained and they are often susceptible to large
amounts of consolidation. Consolidation of the cap and underlying sediment may result in expulsion
of sediment pore water containing chemical constituents into the cap. Additionally, consolidation
can be mistaken for erosion during post-cap placement monitoring.
Geometry of the sediment surface is important. Placement of capping material on sloped
surfaces may result in uneven distribution because capping materials could migrate over steep slopes
soon after placement.
Erosion of the cap may occur due to the action of normal currents or eddies, or due to the
effects of storm events. The cap design should include measures to stabilize the contaminated
sediments and prevent resuspension and transport to other portions of the river bed. The design
should also include measures to mitigate erosion, if deemed necessary.
Operational concerns include factors that may impact the ability to accurately place the cap
at the desired thickness under site-specific conditions (including current, flow patterns, and climate),
and physical disturbance of the cap (e.g., ice-rafting or boat anchors or running aground).
Chemical flux from sediment through the cap may occur due to diffusion or groundwater
advection.
In Situ Capping Using Inert Materials
Inert materials include clay, silt, sand, geosynthetic clay liners (GCLs), geomembranes, and
AquaBlok™. Cleaner, less contaminated dredged sediments are often used for subaqueous capping
in estuarine and ocean dredging projects. However, the use of less contaminated sediments for this
400440
project was eliminated as an option, as the placement of additional contaminants in the river would
hinder achievement of RAOs/PRGs. Although, in actual practice, inert material caps would not be
all clay, all silt, or ail sand as described below, the smaller proportions of other particle size fractionswould not materially alter the properties of the primary capping material (clay, silt, or sand). A moredetailed discussion of these inert capping materials is outlined below:
Clay. A clay cap consists of a layer of clay placed on top of the existing sediments. Clay,
when placed in lifts, at or near the optimum moisture content and subsequently compacted to a
predetermined density, such as a Modified Proctor density of 90 to 95 percent, will form a low
permeability (1 x 10 "7 cm/sec or less) cap. However, bulky clay is very difficult to place and
compact in a river environment. Clay caps are usually used to contain waste in landfills, not in
rivers. In addition, a clay cap may also be subject to erosion in the river. Thus, a clay cap is
eliminated from further evaluation.
Silt. A silt cap is a layer of silt placed on top of the existing sediments. Silt consists of fine-
grained sediments that have a relatively low permeability (on the order of 1 x 10"5 cm/sec). The
placement of a silt cap is also difficult, as the silt may disperse and float downstream with the
current. Further, a silt cap may also be subject to erosion in the river. Thus, a silt cap is eliminated
from further evaluation.
Sand. A sand cap is a layer of sand placed on top of the existing sediments. The placement
of clean material on top of the existing contaminated sediments means that the benthic organisms
repopulate clean sediments. However, the placement of a sand cap does not prevent recontamination
of the new sand material by movement of potentially contaminated pore water. In addition, a sand
cap is subject to erosive forces that may eventually expose the contaminated sediments. Thus, a sand
cap is also eliminated from further evaluation.
Geomembrane. A geomembrane is a polyethylene sheet usually manufactured using either ^o
high-density polyethylene (HDPE), very low density polyethylene (VLDPE), or polyvinyl chloride o
(PVC). Geomembranes have been extensively used in landfills as a low permeability material to |_»
prevent the migration of leachate from the landfill into the groundwater. They have also been used
4-11 TAMS

to waterproof tunnels and as caps on hazardous waste sites. However, then are some technical
difficulties associated with the membrane placement process in a riverine environment. During
placement, the river current can carry the membrane or the barge performing the installation, thus
making accurate placement of the membrane difficult, if not impossible. The membrane could tear,
or the roll could spin quickly, causing a pile of clay that would then have to be removed. In addition,sheets of geomembrane must be hot-welded together to provide a continuous impermeable layer.
Further, the fact that this process must occur "in the dry" adds to the difficulty of installation. The
use of a geomembrane as a capping material was therefore eliminated from further consideration.
The use of bentonite as a material that is relatively impermeable and that serves as physical,
hydraulic, and chemical barrier or liner is proven and well established (Daniel, 1993). In a riverine
environment, the technical difficulty lies in finding a suitable method for the placement of this
proven material over the contaminated sediments to isolate them from the overlying sensitive
ecosystem.
Geosynthetic Clay Liner (GCL). A GCL consists of a layer of bentonite clay sandwiched
between two needle-punched geotextiles. The engineering function of GCLs is as a hydraulic barrier
to water, leachate, or other liquids. Bentonite is manufactured in a dry powder form. When exposed
to water, it hydrates and forms a low-permeability clay with a permeability value of less than 1 x 10~7
cm/sec. GCLs have been used in the cover of landfills as an alternative to the three feet of clay
typically required. There has been very limited experience with the placement of GCLs in a riverine
environment. If it were possible to place a GCL in the river successfully, the GCL would act as a
low-permeability barrier and would prevent the migration of the potentially contaminated pore water
into the water column. Many of the problems associated with the installation of the geomembranes
are also applicable to the installation of a GCL in a river. Further, adjacent sheets must be
overlapped at least 12 inches in order to prevent seepage between sheets. Due to such installation
difficulties, the use of a GCL was eliminated from further consideration.
AquaBIok™. AquaBlok™ is a capping system consisting of gravel particles to which
bentonite clay is bonded. The composite particle (gravel and bentonite) is created by a special
manufacturing process. Gravel or crushed stone is obtained from a local quarry and is initially
4-12 -" TAMS400442

,'••• :( • ; <L::.
coated with a polymer. The bentonite is then added, forming a dry, hard aggregate. The composite
particles, herein referred to as AquaBlok™, are spread from the surface of the water and sink quickly
to the bottom of the river on top of the sediment. As the bentonite hydrates, a uniform, continuous,
cohesive low permeability cap (1 x 10'8 cm/sec) is formed over the contaminated sediments.
Standard construction equipment such as front-end loaders, conveyors, and barges is used to place
AquaBlok™. The hydrated particles are cohesive and are more resistant to erosion than sand. In
laboratory flume tests there was little loss of AquaBlok™ particles at a current velocity of 3 ft/sec
when compared with the amount of sand lost at the same velocity. The potential success and
innovative aspect of the AquaBlok™ composite particle system is as follows:
• It overcomes the technical difficulty of sub-aqueous placement by using the innovativedelivery system and
• It utilizes readily available materials such as bentonite and gravel or aggregate.
The use of AquaBlok™ is retained for further consideration.
Other Considerations. Gravel, stone, and riprap may be used as armoring to protect the cap
from erosion and to minimize scouring of the underlying cap. The cap thickness must also accountfor the activity of burrowing animals and benthic organisms.
Engineered caps using other inert materials similar to those employed for landfill or land-
based hazardous waste site closure may also be used in near-shore and subaqueous situations. For
example, the remnant deposit sites were capped using a combination of natural soils, GCLs, and
riprap for scour and erosion protection. However, the cap placed on top of the remnant deposit sites
.was placed in a dry environment, above the normal level of the water in the river.
Conclusion. Capping using inert materials is retained for further evaluation, with
AquaBlok™ as the selected process option.oo
4-13 TAMS

In Situ Capping Using Active Materials
Active materials such as activated carbon can be applied to the surface of subaqueous
sediment or mixed with the sediment in an attempt to limit contaminant mobility. Active materials
need to be combined or covered with inert materials to provide stability, erosion resistance, and, in
some cases, protection for benthic organisms (Cullinane et al., 1986). For some contaminated
sediments, chemically active materials may be added that neutralize or reduce toxicity of the
contaminants. However, the literature reviewed provides no indication that chemicals used in ex situ
treatment systems (see subsection 4.2.7) to dechlorinate or otherwise detoxify PCBs in saturated
sediments have been successfully applied in situ as part of capping systems. Capping using activated
carbon or other active materials can be effective, but has the disadvantage of potential future release
of capped (adsorbed) contaminants due to breakthrough in the active materials. The use of active
materials in the application of capping is not retained for further evaluation.
In Situ Capping Using Sealing Agents
Sealing agents such as cement, quicklime, or grout may be applied to the surface of
subaqueous sediments or mixed with the uppermost layer to form a crust upon curing. This
technique stabilizes the surface, preventing erosion and resuspension of the contaminated material,
and reduces or eliminates leaching of contaminants into the water column. Mobile (barge-mounted)
concrete pumps may be used to apply the material in order to minimize sediment disturbance
(Sirrine, 1990). Diversion of stream flow may be required for effective application of a cap
composed of sealing agents, but is not considered generally feasible in the Upper Hudson River.
Also, the crusty surface is not a desirable habitat for biota. Therefore, capping with sealing agents
is not retained for further evaluation.
Thin-Layer Capping
Thin-layer capping, or "particle broadcasting," is a remedial technology that consists of
placing a thin cap over contaminated sediments. For purposes of this FS, thin-layer capping refers
4-14 TAMS400444

I /*** to cap thicknesses of six inches or less. A cap placed over contaminated sediments can serve three
primary functions:
• Physical isolation of the contaminated sediments from the benthic environment;
1 • Stabilization of contaminated material, preventing resuspension and transport to other sites;and
1 • Reduction of the flux of dissolved contaminants into the cap and the overlying water column.
rp Laboratory studies at Louisiana State University (LSU) found that caps as thin as five to
seven millimeters (0.2 to 0.3 inches) drastically reduce the flux of 2,4,6-trichlorophenol (TCP) from
j sediment to water. The LSU study demonstrated that "the most significant factor in determining the
« time it takes for the contaminant to emerge is the chemical sorptive capacity of the capping sediment.I:
\ The caps with the lowest organic carbon content were the least effective in slowing down the rate
, of breakthrough" (Hazardous Substance Research Center, 1995). However, for real-world situations,(" — especially riverine environments like the Upper Hudson River, the LSU laboratory studies are of
;-.-. little value; it would be difficult even to measure sediment thickness variations of 0.2 to 0.3 inchesI1 in the river, let alone address the difficulty of uniform placement of caps with such thin layers.
f- ' •
!.' At Pier 64 in Seattle, Washington, a 4-acre area was capped with a design thickness of one
fi foot in waters ranging from 20 to 60 feet deep. This thin-layer cap was intended to "enhance the!•'•?. . :
natural recovery, immediately isolate biota from contaminants (including lead, mercury, zinc, PAHs,
[, benzoic acid, bis (2-ethylhexyl)phthalate, dibenzofurans, and PCBs), reduce resuspension during pile
driving, and not unduly reduce navigation depths" (Sumeri, 1996). The cap was designed to
p withstand the 0.02- to 0. 1 6-ft/sec current measured in the area and attributed to tidal cycles. Physical
monitoring of the cap showed that while most of the cap had maintained its design thickness, the
western portion of the cap showed a reduction in cap thickness from 0.7 feet during placement to 0.4
feet six months later. It has not been determined whether this reduction is attributed to erosion or
to localized consolidation/settling. Post-capping chemical monitoring of the water column has
shown that concentrations of metals and organic compounds are below pre-capping non-zero••"""""N
concentrations.
4-15 TAMS
At Eagle Harbor West in Seattle Sound, Washington, 6 acres of surface sediments exceeding
the minimum cleanup level of 0.59 ppm mercury were thinly capped (6 inches) using 22,600 tons
of quarry sand to enhance natural recovery. Water depths in the capping area ranged from zero to
45 feet. Post-implementation surveys identified 16 discrete cap areas lacking in minimum thickness.
To correct this deficiency, an additional 1,000 cubic yards of material was placed. Post-
implementation monitoring was still ongoing (GE, AEM, and-BBL, 1999).
The results from these larger scale projects over relatively short time periods demonstrate that
thin-layer capping does not appear to be very effective or reliable. Other particle broadcasting
laboratory studies conducted by ALCOA for the Grasse River sediments have yielded questionable
results (ALCOA, 1999). The ALCOA report expressed doubts about the test results obtained during
its cap application and cap stability tests. ALCOA questioned the elevated turbidity and TSS
concentrations recorded in the water column studies and stated that such observations are not
considered to be representative of the solids response expected in the Lower Grasse River. ALCOA
also stated that TSS concentrations measured during evaluation of the resuspension potential of fine
sand during shaker tests may not have accurately represented the resuspended sediment, and that the
shaker tests have limited applicability for evaluating non-cohesive sediments.
It is believed that the conditions in the Upper Hudson River, including the known site-
specific hydrodynamic forces, hydrologic conditions, PCB concentrations, and bioturbation caused
by native biota (approximately top four inches of the surface sediments) make the site inappropriate
for the use of thin-layer capping as a containment technology. A thin-layer cap typically has a
thickness of six inches or less. After considering the potential for scouring of sediments due to
major storm events, ice-rafting, boat anchors, and the mixing of the upper four inches of the cap
material due to bioturbation, it appears that there would be insufficient thickness for such a cap to
contain the potential migration of PCBs from the contaminated sediments to the water column.
Therefore, thin-layer capping will not be considered further in this FS.
4-16 TAMS400446

4.2.4.2 Retaining Dikes and Berms
These types of structures include subaqueous or full-depth compacted earth (or sediment)embankments, bulkheads, sheet piling, earth-filled sheet-pile cells, and armored spur dikes used to
minimize downstream transport of suspended contaminated sediments. These structures areimplemented as long-term sediment containment options, and are different from sediment barriers
set up temporarily to control resuspended sediments during sediment removal activities. Dikes andberms may be constructed as components of in-river, near-shore, or upland confined disposalfacilities. These are addressed in subsection 4.2.9. Dikes and berms may also be constructed in the
river perpendicular to stream flow to impede downstream sediment movement, or parallel to the
shore to isolate contaminated sediments from the river channel flow.
When constructed perpendicular to the river bank, retaining dikes and berms may be effective
in trapping and increasing deposition of sediments suspended in the water column, thereby
interrupting downstream transport and scour. To some degree, existing dams serve this function.
However, this role could be enhanced by excavating sediment sinks behind the dams to allow greater
capture of waterborne sediments. Such an approach could also serve a secondary purpose in
alleviating the buildup of sediment deposits behind the dams, hence maintaining habitat conditions
and reducing the necessity of navigational dredging in some areas. Dikes and berms constructed
parallel to the shoreline may be used to isolate contaminated sediments left in place in depositional
areas from the convective forces of the stream. This technique could be used to prevent or reduce
the erosion of materials from depositional areas during periods of high flow and flooding. Retaining
dikes and berms are technically implementable and are retained for further evaluation.
4.2.5 In Situ Treatment
In situ technologies involve the treatment of contaminated sediments without removal from
rivers, lakes, or harbors. The primary advantages of in situ treatment over alternatives involvingo
removal of contaminated sediments are the potentially lower release of sediment-borne contaminants
to the surrounding environment and the minimal sediment handling requirements. The main
limitation of in situ treatment is the lack of process control during treatment, which can lead to
4-17 TAMS
o
incomplete or ineffective treatment and release of treatment by-products to the water column. In situ
treatment technologies are most effective in low-flow streams or embayments where flow can be
diverted during treatment (USEPA, 1993b).
In situ treatment technologies include biological and physical/chemical methods. Potential
in situ bioremediation approaches for-treating PCBs in the Hudson River sediments are discussed
first, followed by a discussion of physical/chemical treatment technologies including solvent
extraction, chemical dechlorination, and solidification/stabilization. In situ thermal techniques such
as vitrification are not known to have applicability to subaqueous riverine sediments and are thus not
discussed.
4.2.5.1 Bioremediation
Bioremediation is a technique in which the physical, chemical, and biological conditions of
a contaminated medium are manipulated to accelerate the natural biodegradation and mineralization
processes. Biodegradation is the process whereby microorganisms alter the structure of a chemical
(which may include other organic and inorganic compounds as intermediate or final byproducts),
while mineralization is the complete biodegradation of a chemical to carbon dioxide, water, and
simple inorganic compounds (e.g., salts). In nature, both partial biodegradation and complete
mineralization take place; the processes, however, are frequently slow.
Bioremediation has been used in the treatment of municipal wastewater for a number of
years. It has been used fairly successfully under some conditions to treat petroleum products,
creosote, and pesticide contamination. PCBs, however, pose greater challenges to bioremediation
than many other types of contamination. Additional research is necessary before effective full-scale
biological treatment is available for these compounds.
Paramount to successful PCB bioremediation is the identification of a microbial population
capable of degrading a large number of different PCB congeners. Various microbial strains have
been identified that have the ability to degrade many PCB congeners (Abramowicz, 1990). Aerobic
biodegradation is generally limited to the less-chlorinated PCB congeners (Garvey et al., 1999). On
4-18 TAMS
the other hand, anaerobic organisms have shown the ability to reductively dechlorinate the heavily
chlorinated PCB congeners. Anaerobic dechlorination generates less-chlorinated biphenyls as
degradation products, but does not change the total molar concentration of PCBs. Anaerobic
dechlorination does, however, yield products that can be degraded by aerobes. Thus, sequential
anaerobic/aerobic treatment may enable treatment of more-chlorinated PCB mixtures.
In addition to the identification of PCB-degrading microbes, successful bioremediationrequires identification of the environmental factors controlling biodegradation. Results from
research sponsored by General Electric to define the environmental conditions most conducive to
PCB biodegradation indicate that optimum aerobic microbial activity requires:
• Microbial growth on biphenyl or chlorobiphenyl (Bedard, 1990; Unterman et al, 1988);
• Temperatures elevated above those that would be characteristic of Hudson River sediments
(McDermott etal., 1989);
• Aeration (McDermott etal., 1989); and
• Sufficient PCB bioavailability.
Optimum anaerobic activity for Hudson River strains or consortia appears to require:
• The absence of inhibitors, such as sulfate (Tiedje et al, 1989);
• Elevated PCB concentrations, i.e. greater than 50 ppm (Tiedje et al., 1987);
• The presence of certain inorganic nutrients (Abramowicz et al., 1989);
• A supplemental carbon source (Tiedje et al., 1989; Nies et al., 1990; Alder et al., 1990); and
• Temperatures elevated above those that would be characteristic of river sediments (Tiedje
etal., 1989).
Once an acceptable microbial consortium and proper environmental variables have been
identified, one of two different engineering approaches to bioremediation can be taken, an in situjfS.
approach or an ex. situ (land-based or bioreactor) approach. In situ bioremediation is discussed here oo
and the remaining approaches are discussed in subsection 4.2.7, Ex Situ Treatment. Table 4-3 £VDpresents those bioremediation process options (both in situ and ex situ) evaluated for use at the
_:• •
4-19 " TAMS
Hudson River PCBs site. Options that are highlighted on the table have been tested for or applied
to freshwater sediments or PCB-contammated sediments.
For in situ treatment, the contaminated sediments are left in place. This approach obviously
limits the amount of control that can be exercised over environmental variables during
bioremediation, and can pose significant engineering difficulties in the uniform introduction and
mixing of any microbes or nutrients that may be required. Additionally, mixing requires a
containment system to prevent suspension and transport of contaminated sediments. Regular
monitoring of sediment conditions and PCB concentration is necessary to assess remedial progress.
An in situ PCB bioremediation experiment was conducted by GE on sediments in the Upper
Hudson River between August 9 and October 21, 1991 (Harkness et al., 1993). Six self-contained
steel caisson reactors were driven into the river bottom in the vicinity of Fort Edward, New York.
The sediments within the caissons were mixed and used as experimental units subjected to varying
addition of oxygen, inorganic nutrients, a co-metabolite, and known PCB-degrading bacteria. Test
results showed increases in the numbers of indigenous biphenyl-metabolizing microorganisms in all
experimental caissons. In addition, PCB concentrations, normalized to total organic carbon (TOC)
content, decreased by about 50 percent in all experimental caissons. However, biodegradation of
the remaining PCBs was not observed. Harkness et al. (1993) attribute this result to desorption
kinetics, with the resistant fraction likely to become available only over long periods of time. Garvey
and Thomchuk (1997) used the molar dechlorination product ratio (MDPR; see definition in
subsection 3.5 of this FS) to demonstrate the infeasibility of complete PCB biodegradation.
Based on results of the field study and in the absence of other evidence of the effectiveness
of this option, there is insufficient information to indicate that in situ bioremediation is technically
feasible for sediments in the Upper Hudson River, or that it would achieve RAOs/PRGs within a
reasonable time frame. Thus, this technology will not be evaluated further.
4-20 400450

/"^ 4.2.5.2 Solvent ExtractionI
I Solvent extraction involves the dissolution of contaminants from the sediment matrixfollowed by recovery and treatment of the solvent. This technology first reduces the volume of
I contaminants in the sediment, PCBs in this case, and then reduces the toxicity by treatment ordestruction of the contaminant-bearing solvent. For in situ extraction, necessary system components
I include an injection system for delivery of the solvent, a recovery system for the contaminant-bearingspent solvent, and containment structures to prevent uncontrolled migration of the solvent.
|;5 Treatment or destruction of the spent solvent would be accomplished ex situ.
I. Types of solvent potentially applicable to PCB removal are discussed under ex situ solvent
t extraction options in subsection 4.2.7. Table 4-4 presents solvent extraction technologies evaluated8 for treating the Hudson River sediments; however, none of the technologies has been implemented
f in situ in sediments. In situ solvent extraction is not considered applicable to the Hudson River1 ,-—s sediments for several reasons. Specifically, non-homogeneous materials may result in uneven
( solvent application and potential short-circuiting, and monitoring of extraction effectiveness would
be difficult. Also, the potential for incomplete recovery of solvents is substantial. Failure of the
I' containment system would have potentially deleterious results on surrounding sediments and water
quality. In situ solvent extraction will not be evaluated further.
4.2.5.3 Chemical Dechlorination
This technology is somewhat similar to solvent extraction. Reagents are injected into the
sediment, and PCBs are solubilized into the reagent/liquid phase where dechlorination occurs,
resulting in a reduction in toxicity. Like solvent extraction, the process requires an injection system
for delivery of reagents and a containment system or diversion of stream flow to control the process.
USEPA (I993b) indicates conceptual applicability of the APEG (alkali metal hydroxide-based
polyethylene glycol) reagent dechlorination process (discussed further in subsection 4.2.7) to
sediments in situ. Table 4-5 presents chemical dechlorination technologies evaluated for treating•WW^ '
the Hudson River sediments. None of the technologies, however, have been implemented in situ.
4-21 TAMS
In the dechlorination process, an alkali metal hydroxide base and polyethylene glycol _j
reagents react with PCBs to produce glycol ether and a chloride salt, which are water soluble and of
low toxicity. However, drawbacks similar to those for solvent extraction render this technology j
unsuitable for Hudson River sediments in situ. Specifically, non-homogeneous sediments may resultj
in uneven application of reagents and short-circuiting and, again, monitoring of process effectiveness |
in situ would be difficult. USEPA (1993b) reports that the degradation process is temperature-f
dependent and may proceed slowly at ambient temperatures, especially in the winter. Also, the
amount of water tolerated by the process has not been established; this is of critical importance in
a subaqueous setting. Constructing a completely reliable containment system is problematic, and |
diversion of stream flow for long inter-seasonal time periods is impractical on this large scale. In
situ chemical dechlorination will not be evaluated further.
Dechlorination in combination with solidification (discussed below) is a process that
combines the addition of setting agents to immobilize contaminants, and appropriate reagents to
dechlorinate contaminants. This process has not been demonstrated for PCB-contaminated
sediments. Furthermore, this process has been inactive since 1994, with no new advances or tests
(Funderburk, 1999; dePercin, 1999). Combined dechlorination/solidification is not retained for '
further evaluation. (,
4.2.5.4 Immobilization j
Immobilization refers to a broad class of treatment processes that physically or chemically f
reduce the mobility of hazardous constituents in a contaminated material. Immobilization includes!-"
solidification, stabilization, and encapsulation processes, described below. In solidification, the g
contaminants are physically rather than chemically bound within a solidified matrix. Stabilization
is a process by which a contaminated material is converted to a more chemically stable form. The j
process entails the use of a chemical reaction to transform the contaminant to a new non-toxic
compound or substance. In many applications, both solidification and stabilization occur " (
simultaneously to varying extents. Encapsulation involves complete coating or enclosure of a
contaminant particle with an additive or binder. "~"(
4-22 TAMS400452
.toxicity.
In situ immobilization methods involve mixing solidification/stabilization agents such as
cement, quicklime, grout, and pozzolanic materials, as well as reagents, with sediments in place tosolidify/stabilize contaminants in the matrix. The solidification/stabilization agents are mixed
throughout the zone of contamination using conventional excavation equipment or speciallydesigned injection apparatus such as mixing blades attached to vertical-drive augers.
Solidification/stabilization technologies evaluated for use at the Hudson River PCBs site are
presented in Table 4-6. The processes in Table 4-6 include both in situ and ex situ applications;
however, in situ immobilization is considered in this section and ex situ immobilization is evaluated
in subsection 4.2.7.8.
The effectiveness of stabilization/solidification technologies is variable depending on the
characteristics of the contaminated soil and the particular additives used. In general, this technique
is more effective for inorganic constituents (metals) than for organic constituents. Although
stabilization/solidification can potentially be effective in reducing the mobility of PCBs because
PCBs have characteristics of strong adsorption to sediments, the technology would not reduce their
As typically performed, in situ solidification/stabilization has several limitations: reagent
mixtures may be difficult to adjust and place accurately in a subaqueous setting; the use of augers
or circular caissons requires substantial overlap for continuous coverage; some volume increase of
the river bed is to be expected; and release of free solidification agents to the water column during
mixing may be difficult to control. Long-term monitoring of the cured mass could be problematic,
but a properly designed water column monitoring program may be sufficient. The technique is not
feasible in areas where the solidified mass wil l interfere with future dredgiag activities (i.e., the
navigational channel). Further, solidification/stabilization may not be appropriate for shallow areas
of the river, where volume expansion of the treated sediments may interfere with small craft
navigation in these areas. Finally, a solidified mass may present problems as habitat for biota in the
river.
Ulw
4-23 - TAMS

Even though solidification/stabilization may be effective in reducing PCB mobility in
sediments, in situ immobilization is not retained for further evaluation because of potential
implementability and future use issues.
Solidification in combination with dechlorination was discussed and evaluated previously
in subsection 4.2.5.3, Chemical Dechlorination. Combined dechlorination/solidification is'not
retained for further evaluation because of lack of demonstrated effectiveness for PCB-contaminated
sediments.
4.2.6 Removal Technologies
Removal technologies are employed in those cases where contaminated sediments are to be
withdrawn for ex situ treatment, confinement, or disposal. Sediment removal can be conducted "in
the dry," i.e., by excavation methods, or by dredging techniques. Numerous excavation and dredging
technologies are available to address site-specific conditions and constraints likely to be encountered
at the Hudson River PCBs site. Factors that influence equipment selection for projects involving
riverine sites include river bed characteristics, water depth, sediment characteristics, volume of
material being removed, the hydrodynamic environment, accessibility, availability of upland areas
for sediment processing and storage, and ultimate disposal options. Sediment removal technologies
evaluated are presented in Table 4-7. Technologies that are shaded on the table are potentially
applicable for use at the Hudson River PCBs site and are described in the following discussion; thus,
the "shading" on Table 4-7 has a different meaning than on other tables.
Debris removal may be required prior to dredging to remove over-sized material from target
areas. Over-sized material, e.g., boulders, timbers, and man-made debris, can interfere with proper
operation of dredges, thereby causing increased sediment resuspension during dredging. Debris
removal can be achieved by mechanical means using construction equipment or a mechanical dredge.
A recent debris survey conducted in the Upper Hudson River (November, 1999; Appendix
H) indicated that both woody materials and rock may be encountered during removal work. The
wood materials appear to consist of both tree fragments and cut shapes such as boards and pilings.
4-24 400454 TAMS

•«-<•-- -1^
Rock was found in piles at various locations throughout the river system. It is expected that the rock
piles will either be avoided or removed prior to dredging work. Most wood debris would not be
expected to impact removal operations; however, larger tree fragments can also be removed priorto the start of work in a particular area.
Sediment removal activities will likely result in an increase in suspended matter in the watercolumn. It should be noted that control of the dredging operation itself is the primary means ofcontrol of sediment resuspension. Other suspended sediment control measures, listed in Table 4-8,
may be implemented as needed to control the amount of sediment resuspension and transport
expected from a particular remedial alternative. Some of these potential suspended sediment control
options are intended to block suspended sediment movement, while others are intended to limit or
redirect water currents at the work site during sediment removal activities. To be effective, barriers
are deployed around the dredging operation and must remain in place until the operation is
completed at that area, while at the same time minimizing, to the extent practicable, interference with
""" navigational traffic.
The most common method of containing suspended sediments involves the use of silt screens
and curtains. These barriers generally consist of vertically hung geotextile fabrics that may either
be impermeable (curtain) or porous (screen). The barriers are installed around the work area and
secured by anchoring to the river bed or by fastening to existing bulkheads or piers. Effectiveness
rests on a number of site conditions that may disrupt the securing process, including local currents
(barriers will have diminished effectiveness at currents exceeding 1.5 ft/sec as described in Appendix
E), water depth, wind, tides, boat wakes, waves, presence of extremely hard bed surfaces such as
bedrock in critical points, and the presence of debris.
Another suspended sediment control method, applicable to shallow or near-shore locations,
involves physical isolation of the work area from the rest of the river. Isolation can be accomplished
I using various physical barriers (Table 4-8), although steel sheet piling and cofferdams have been the
most commonly used methods to date. Use of sheet piling is not known to be feasible due to
presence of shallow bedrock in many areas. "Porta-dams," which are braced steel walls in sections,
can be used where sheet piling is impractical. Once installed, barge-mounted dredging can be
4-25 TAMS

performed inside the isolated area, or the area can be dewatered and its sediments excavated "in the
dry."
4.2.6.1 Excavation
Excavation methods would apply to sediment removal from shallow, near-shore areas wherethe work zone can be isolated from the adjacent water body and dewatered to the point where the
contaminated sediments are exposed for removal. Excavation technologies can also be employed
in shoal areas of the river that may be exposed during low-flow periods. Table 4-7 identifies
equipment commonly employed during excavation operations. Excavation methods can also be
effective for removal of contaminated sediments that have been deposited within shallow side
channels where access by dredging equipment may be difficult. In such cases, the excavation
equipment would be coupled with one of the containment technologies identified on Table 4-8 so
that the work can be accomplished in relatively dry conditions. Excavation is technically
implementable and is retained for further evaluation.
4.2.6.2 Dredging
As the Upper Hudson's sediment contamination problems have become better understood,
dredging alternatives, including bank-to-bank dredging of the river, full-scale dredging of the 40
NYSDEC-defined PCB hot spots in the river, and reduced-scale dredging of the most contaminated
hot spots have been considered. Due to limited funding under the CWA, a reduced-scale dredging
program had been considered by USEPA and NYSDEC in earlier studies. The NYSDEC at one time
proposed dredging and encapsulation of river sediments at a near-river site (NYSDEC, 1985).
Dredging technologies have been evaluated extensively by the USAGE and by USEPA for
their applicability to specific Superfund projects. With the growing demand for equipment tailored
to the specific needs of remedial projects, a wide variety of specialty dredging equipment has been
developed. Classifying this equipment is complicated by the fact that hybrid machines are now being
fabricated with the characteristics of both mechanical and hydraulic dredges. Table 4-7 provides an
4-26 400456 TAMS

approach to classifying dredging equipment that is based, in part, on the particular requirements and
constraints of the Hudson River. A description of the principal systems follows.
Dredging Using Conventional Dredges
Both conventional hydraulic and mechanical dredges have applicability to remove Hudson
River sediments. These machines come in a range of capacities and are currently being fabricatedat a scale that is consistent with the access limitations of the Upper Hudson. Historically,
maintenance of the Champlain Canal navigation channel has been accomplished by bothconventional mechanical and hydraulic equipment.
Mechanical systems can conveniently be categorized into two types: those that use various
types of buckets suspended from barge-mounted derricks ("bucket-on-rope" systems), and those
systems that are hydraulically actuated (e.g., backhoes). An advantage of a hydraulically actuated
machine is the positive action that allows for greater removal precision and permits handling of a
wide range of sediment types and debris. On the other hand, "bucket-on-rope" systems may be
preferable when dredging softer contaminated sediments overlying a harder or impermeable non-
contaminated layer. Both "bucket-on-rope" and hydraulically actuated machines have been fitted
with various types of covers, enclosures, and seals to minimize the release of sediments during
removal operations. Should mechanical dredges be used for removal of river sediments, use of
buckets with such "environmental" modifications may be necessary.
Hydraulic dredges use pump suction to withdraw sediments. When a hydraulic dredge is
fitted with a rotating cutting head, it acquires the ability to remove a wide range of sediment types
including, in some cases, consolidated materials. Hydraulic cutterheads come in numerous
configurations, depending on the manufacturer, and can be sized to conform to the spatial constraints
of the river. One disadvantage of these machines is that they tend to entrain substantial quantities
of water, thereby requiring dewatering of sediments before further processing is possible. In
addition, relatively cumbersome and costly slurry lines and pumping stations may be needed to ^oconvey sediments to shore-side processing facilities. This disadvantage of hydraulic methods may ^(ji
be outweighed by cost savings if sufficient bank area is available for near-shore passive dewatering ^
4-27 TAMS

of the dredged slurry and disposal of dewatered sediments with overland transportation. Theresuspension potential of mechanical and hydraulic dredges is discussed in Appendix E.
Both mechanical dredges and hydraulic units are retained for further evaluation in this
feasibility study. The equipment in this category that will be given further consideration includes
"bucket-on-rope" and hydraulically actuated mechanical dredges and suction and cutterheadhydraulic machines.
Dredging Using Large-Scale Dredges
Table 4-7 also lists a number of dredges that receive some attention when dredging
equipment is evaluated, but usually are found to be unsuitable upon final analysis. These relatively
large machines (often mounted on ocean-going vessels) are most often used to obtain borrow
materials or for maintenance and new work navigational dredging. While it is theoretically possible
to scale such equipment to river conditions, various alternative conventional and specialty dredges
(discussed below) are both available and better suited to conduct removal operations within the
Hudson River. For these reasons, these large-scale dredges are not retained for further evaluation.
Dredging Using Specialty Dredges
Numerous specialty dredges have been configured to address project-specific needs. Most
of these have had their origins in non-Superfund activity and have been adapted to removal of
contaminated sediments. However, as the scale and complexity of remedial programs increased,
manufacturers began to assemble equipment to address the specific constraints of Superfund work,
including precision removal of sediments and the need for low sediment resuspension rates. Several
of the specialty dredges that appear to have applicability to conditions represented by the Upper
Hudson River are listed in Table 4-7 and are described below.
Amphibious Excavators. Amphibious excavators are readily transportable units that have
the potential to specifically remove contaminated sediments along the river shorelines and within
shallow secondary channels. One of the unique characteristics of these machines is that they have
4-28 400458 TAMS

hydraulically actuated arms that can be fitted with any of several heads, including a bucket, a rake,
or a cutterhead pump bucket. While the production rate of such equipment is expected to be
relatively low, its versatility, particularly in shallow areas, warrants continued consideration of theexcavators. Amphibious excavators will be retained for further evaluation.
Ham Visor Dredge. A Dutch contractor has modified a backhoe with a unique bucket
geometry that fully encloses captured sediments by means of hydraulically operated flap gates. The
gates are closed before the bucket is raised. Potentially, the Ham Visor Dredge reduces sediment
resuspension in comparison to non-enclosed buckets. Although it has some of the same applicability
as the conventional backhoe, its capability to limit resuspension may be impeded when debris is
present in the work area. The Ham Visor Dredge is retained for further evaluation.
Horizontal Auger Dredge. A number of manufacturers fabricate these compact units, which
have seen wide application on non-Superfund projects. Auger dredges tend to function best in
quiescent waters where relatively fine-grained materials have accumulated. Several manufacturers
have enhanced their auger equipment by adding cutters to the auger flights to give the equipment
greater applicability. Augers use pump suction to withdraw sediments (in this sense they function
as hydraulic dredges) that are then conveyed as a slurry for further processing. Due to the relatively
low production rates expected from auger systems, and their propensity to become fouled when
debris is present, these systems are not retained for further evaluation.
Clean-up Dredge. The clean-up dredge is an auger-type system developed in Japan for
removal of highly contaminated sediments (Palermo and Pankow, 1988). The auger is shielded with
pivoting wings covering the sediment during collection and with shrouds for collecting gas for
venting in order to minimize resuspension. An underwater television camera is used to monitor
resuspension, while sonar devices are used to monitor the depth of the cut. It is expected that this
unit has some of the same limitations as the conventional horizontal auger dredge. In addition, there
is little US experience with the dredge and, therefore, it is not retained for further evaluation.
Refresher System. This is another Japanese design wherein a helical cutterhead is shrouded
to minimize sediment resuspension, reportedly generating only a fraction of the suspended solids
4-29 TAMS
o*.en

produced by a conventional cutterhead. Like the clean-up dredge, this system also includes
underwater video monitoring and gas collection capability. Given that there is no US experience
with this equipment, it is not retained for further evaluation.
Submersible Pumps. Submersible pumps have been variously configured for the removal
of sediments. The sediments are conveyed in slurry form to either barge-mounted or shore-side
processing facilities. Some manufacturers have begun to fit their pump systems with a form of
cutting head to expand the range of applicability. In addition, one manufacturer has configured the
submersible pump inlet so as to create an eddy effect that enhances movement of sediments into the
pump suction. In addition to being mounted on a floating platform, submersible pumps can also be
hung from a land-based boom or crane, thereby permitting landside access to the work area. These
units are most applicable to removal of fine-grained sediments that may have been deposited within
secondary channels and along the river's shoreline. Submersible pumps are retained for further
evaluation in this FS.
Matchbox Suction Dredge. The Matchbox Suction Dredge was developed in Holland as
an alternative to the conventional cutterhead, specifically for use with contaminated sediments
(Palermo and Pankow,-1988). A large plate covers the top of the plain suction dredge head to avoid
excessive water movement and escape of gas bubbles. A flap on the side of the dredge head is
opened in the direction of swing, while the opposite flap is closed, with the intent of maximizing
capture of sediment at near in situ density while minimizing resuspension. Also, the angle of the
dredge head is adjustable to maintain the optimum position relative to the bottom. This type of
dredge was evaluated in the New Bedford Harbor Superfund Pilot Study along with the conventional
cutterhead and horizontal auger dredges. Operational problems encountered with the Matchbox were
considered more severe than for the cutterhead dredge (USAGE, 1990). The Matchbox suction
dredge is not retained for further evaluation.
Diver-Assisted Dredging. In this technology, divers hold small-diameter suction hoses or
guide submersible pumps to manually remove sediments. In some cases, sediments have been
manually removed by vacuum lines connected to awaiting trucks. This labor-intensive, low-
production dredging method, which is typically used only for small, inaccessible areas, was used to
4-3° 400460 TAMS
remove sediments from a water intake flume in Indiana Harbor and for a limited part of the
Manistique Harbor project. Diver-assisted dredging could be used in limited areas of the Upper
Hudson River where the primary dredging technology has been applied, but does not achieveRAOs/PRGs due to inaccessibility of the sediments. Diver-assisted dredging is retained for furtherevaluation.
Pneumatic Dredges. Unlike hydraulic dredges, these systems use compressed air and
hydrostatic pressure differential to dislodge sediments that are then pumped as a slurry. Generally,
?- the pneumatic cover or chamber is lowered into the sediment using a crane and suspension cable;
-,; once in place, the chamber's pressurized air is released, bringing the chamber back to atmospheric
pressure. The difference in surrounding hydrostatic pressure forces sediment into the chamber
through an entrance valve. The valve is closed and compressed air is forced into the chamber,
displacing sediment slurry out the discharge valve and to the surface through a discharge hose or pipe
(Palermo and Pankow, 1988). Pneumatic dredges have largely been applied outside the US to
projects involving fine-grained sediments, but because they typically have minimum water depth
requirements for effective operation, they are not appropriate for use in shallow shoal areas of the
Upper Hudson. In the channel, where sufficient depth may exist, their use is unsuitable due to the
sediment characteristics. Therefore, pneumatic dredges will not be given further consideration.
4.2.6.3 Removal by Soil Freezing
S A derivative of soil freezing technology has been given some consideration for possible
applicability to contaminated sediments. According to initial reports from a project in Canada
'"•'• (OCETA, 1999), a sediment freezing demonstration was undertaken to remove contaminated
sediment, under water, in two-square-meter blocks. The.sediment blocks were frozen by injecting
a refrigerant into a series of cells that had been lowered into the target material. Final evaluation of
the demonstration effort is not yet available. However, it is expected that the process would be
costly, provide relatively low removal rates, and apply only to fine-grained sediments where
y—*\ hydrodynamic conditions would permit freezing to occur. In addition, due to the factors such as high
; energy consumption and potential leakage of refrigerant (OCETA, 1999), sediment freezing
technology will not be retained for further evaluation.
4-31 TAMS
4.2.7 Ex Situ Treatment
To date, incineration and disposal in landfills are the most widely practiced and permitted
methods for management of PCB-contaminated soils and sediment. However, other technologies
have now emerged and are considered technically and economically feasible alternatives toincineration and landfilling in certain circumstances. In this section, a range of ex situ treatment
technologies is presented, with a discussion of their general applicability to the Hudson River site
and their level of development.
Treatment can be performed at a facility located near the river using mobile units or more
permanent treatment plants contained within buildings, or located off site at a treatment facility.
Although the same remedial technologies are applicable for both near-river and off-site treatment
of contaminated sediments, near-river treatment is considered first because it would minimize
transportation and handling costs. For the purpose of this FS, near-river is defined as a corridor that
includes the river and extends two miles landward from either bank. A two-mile width of corridor
is used because it encompasses a wide variety of locations that could be considered for a local
processing, treatment, or disposal facility within a reasonable hauling distance from the river. The
applicability of complete or partial near-river treatment depends primarily on the availability of land
for such a facility.
Biological, physical, chemical, thermal, and solidification/stabilization processes are
considered for treatment of PCB-contaminated sediment in the Upper Hudson River. In this
instance, treatment is defined as those processes that destroy, detoxify, isolate, immobilize, or
otherwise render the contaminant environmentally unavailable. Processes considered for treatment
of PCB-contaminated sediments include bioremediation, sediment washing, solvent extraction,
dechlorination, thermal desorption, thermal destruction, thermal destruction/beneficial use, and
solidification/stabilization. The processes considered are at different stages of development. Each,
however, has potential value in treatment of the PCB-contaminated sediment. To be retained for
further evaluation, a technology must have undergone preliminary testing for its environmental
compatibility and technical implementability.
4-32 400462 TAMS

Sediment pretreatment technologies, which refers to processes that modify or conditiondredged or excavated sediments prior to final treatment or disposal, are described first, followed bya discussion of ex situ treatment technology.
4.2.7.1 Sediment Pretreatment
Sediment pretreatment, including such technologies as dewatering and solids classification,is typically utilized to facilitate the efficacy of subsequent sediment treatment processes. These
pretreatment technologies are not, in themselves, generally effective in removing or reducing
contamination levels in the sediment. However, by improving the sediment characteristics or
reducing the volume of the material to be treated, such technologies may reduce the overall cost of
ex situ treatment alternatives. While they are not screened in this chapter, these supporting
technologies are briefly discussed below. More detailed descriptions and evaluations are provided
by Cullinane et al (1986) and USEPA (1991b, c, 1993b, and 1994).
Dewatering
Dewatering is used to reduce the moisture content of a sediment, thereby improving its
handling characteristics. The extent to which dewatering is necessary is dependent on the method(s)
used in dredging the sediment, as well as the subsequent treatment/disposal of the sediment.
Mechanically dredged sediment will have a moisture content comparable to its in situ moisture
content, which for Hudson River sediments is approximately 50 to 60 percent by weight (i.e., a
geotechnical water content of 100 to 150 percent). This statement generally applies to "virgin" or
relatively consolidated sediments. Sediments previously disturbed by dredging or other activities
may have a much higher moisture content (70 to 80 percent by weight). This can become important
if a second pass is necessary to remove additional material at a later time or if the dredging operation
is not well controlled. In contrast, hydraulically dredged sediment could potentially have a moisture
content on the order of 85 percent by weight or more (i.e., a geotechnical water content of 500j*
percent or more). Such material is a slurry or suspension, and retains no structural soil properties. <=>£>a\u>
4-33 " TAMS

Dewatering reduces the costs of transportation and ultimate disposal by reducing the weight
and volume of the sediments. In addition, many treatment processes have an optimum moisture
content range outside of which the process is either not effective or not economical, or perhaps both.
A variety of dewatering processes is available, the selection of which is dependent on the volume
of the sediment, the amount of available land space, the moisture content of the influent, and thedesired moisture content of the effluent. The ARCS Remediation Guidance Document (USEPA,
1994) has classified dewatering technologies into three general types: passive dewatering
technologies; mechanical dewatering technologies; and active evaporative technologies.
Passive dewatering of sediments is typically accomplished in tanks, lagoons, or other surface
impoundments and relies primarily on processes such as settling, surface drainage, consolidation,
and evaporation to remove water from sediments. Disadvantages of passive dewatering technologies
are potentially significant land and time requirements for effective dewatering compared to
mechanical and active evaporative technologies, particularly if conditioners to aid in dewatering are
not used. The process can achieve high solids in surface crust, but has the disadvantage of potential
PCB emissions into the air.
Mechanical dewatering processes are based on the input of energy to squeeze, press, or draw
water from sediments. Most mechanical dewatering processes can increase the solids content of a
feed material to a level comparable to that of in situ sediment deposits (about 50 percent solids).
Common mechanical dewatering processes include belt filter presses, plate filter presses, vacuum
filters, centrifuges, and gravity thickeners. Mechanical dewatering is most suitable where land is not
available for a passive dewatering facility. Disadvantages of mechanical dewatering processes are
the potentially high operation and maintenance costs.
Active evaporative processes rely on artificial energy sources to heat sediments and remove
moisture. Active evaporative dewatering can achieve the highest solids, approximately 90 percent,
of the three types of dewatering discussed here. Common active evaporative technologies include
flash dryers, rotary dryers, and modified multiple hearth furnaces. Active evaporative technologies
would only be employed where subsequent processes (e.g., incineration) require extremely dry
4004644-34 TAMS

materials. Disadvantages of active evaporative processes are high operating costs due to high energy
requirements, and capture and treatment of potential air emissions.
Solids Classification
Solids classification is used to separate the sediment solids based on such characteristics as
size, density, and mass, and can be important in managing contaminated sediments because PCBstend to preferentially adsorb to the fine-grained sediments. Therefore, separation of the relatively
non-contaminated coarse-grained fraction can significantly reduce the volume of material that
requires additional treatment. The effectiveness of solids classification is dependent on such factors
as the volume of contaminated sediments, the particle size distribution of the material, and the
characteristics of the contaminants. Typical solids classification processes include stationary screens
and sieves, vibratory screens, hydraulic classifiers, spiral classifiers, and cyclones/hydrocyclones.
/* N Selection of a solids classification technology depends on the objective of the pretreatment.
Besides minimizing the volume of material for subsequent treatment, solids classification can be
used to remove oversized material that may interfere with subsequent treatment processes.
Grizzlies and trommels are used to remove the coarsest material from dredged sediments.
Grizzlies typically remove rocks and debris five cm or larger in diameter. Trommels are used to
remove gravel, rocks, or trash one to ten cm in diameter. Either is usually the first step in any
. treatment train. The purpose of this equipment is to remove over-sized material that may damage
other processing equipment. Vibratory screens and hydrocyclones are typically used to cull out
particles larger than about 2 cm and 100 um, respectively, in diameter. Vibratory screens are more
effective than hydrocyclones for sediments with solids content greater than 25 to 30 percent and for
variable feed rates. Mechanical classifiers can also be used for separation in the same size range as
hydrocyclones. However, classifiers are even more sensitive than hydrocyclones to variations in
solids content and feed rate (USE-PA, 1994).t£>O
—N Orf*A hydrocyclone was used in a pilot scale demonstration of sediment particle size separation ar\en
technologies conducted at the Saginaw River. Results of the demonstration project showed that
4-35 TAMS

approximately 80 percent of the PCB mass in the sediment samples was associaied with the finest-
grained sediments, which composed 20 percent of the original sediment mass. Preliminary toxicity
testing of the separated coarser-grained fraction indicated that this material may be suitable for
unrestricted disposal.
4.2.7.2 Bioremediation
As discussed in subsection 4.2.5.1, bioremediation is a technique in which the physical,
chemical, and biological conditions of a contaminated medium are manipulated to accelerate the
natural biodegradation and mineralization processes. Bioremediation can occur in situ or ex situ.
The advantage of in situ bioremediation is that it avoids materials handling by enhancing biological
activity of the contaminated sediment in place. However, ex situ bioremediation allows for stricter
control of environmental conditions that impact biological activity. Two approaches to ex situ
bioremediation are evaluated below: a bioreactor approach and a land-based approach. In the
bioreactor approach, slurry phase bioremediation is considered, while in the land-based approach,
land farming and composting are considered. Table 4-3 presents bioremediation process options
evaluated for use at the Hudson River PCBs site. Options that are highlighted on the table have been
tested for or applied to freshwater sediments or PCB-contaminated sediments.
Slurry Phase Bioremediation
In an ex situ bioreactor approach, the sediments are completely contained, so a bioreactor
approach offers greater control over environmental variables than either an in situ or land-based
system. Furthermore, this approach is conducive to the sequential anaerobic/aerobic treatment that
may be required to treat more heavily chlorinated PCBs. Remediation in a bioreactor, however, may
provide little advantage over alternative remedial techniques in terms of sediment handling
requirements and destruction efficiency.
In slurry phase bioremediation, the excavated contaminated sediment is combined with water
to create a slurry and is then aerobically biodegraded using either a self-contained reactor or a lined
lagoon; if already in a slurry form, the excavated sediment would possibly be dewatered to achieve
' 4-36 TAMS400466
an optimum water content. Aeration is provided by floating or submerged aerators, or by
compressed air and spargers. Aeration tends also to mix the sediment slurry; however, this mixing
action is often supplemented by mechanical mixers to enhance contact between the microorganisms
and the contaminants. Nutrients and neutralizing agents are added as appropriate, as are surfactants,
dispersants, or other agents, to improve bioavailability of the contaminants. The reaction time isdependent on such factors as the physical/chemical nature of the contaminant as well as itsbiodegradability. Once biodegradation is complete, the slurry is dewatered and the solids arerecovered for disposal or additional treatment as necessary. Process water is typically recovered and
reused.
Reactor-based slurry biodegradation of PCB-contaminated sediment has not been
demonstrated in full-scale capacity. In addition, the lengthy time necessary to achieve significant
PCB degradation in pilot-scale tests indicate that this method is not yet appropriate for treating the
potentially large volume of Hudson River sediment in a realistic time frame. Slurry-phase
bioremediation is not retained for further evaluation.
Bioremediation by Composting and Landfarming
Two types of land-based biological treatment approaches, composting and land farming, can
be used for bioremediation of sediments. Implementation of either treatment for the Hudson River
site may require dewatering of the dredged sediments. Since anaerobic conditions would be difficult
to maintain in both composting and landfarming approaches, these systems are appropriate only for
aerobic bioremediation application.
In composting, sediments are placed in large piles. A typical compost pile may be six to
eight feet in height and contain from 4,000 to 10,000 cubic yards of sediment. Sediments are placed
on top of a prepared clay or plastic liner with a leachate collection system in compliance with RCRA
minimum technology requirements. Oxygen is supplied to the material through a piping system.
Alternatively, the compost piles can be tilled to facilitate the transport of oxygen through the system.o\
4-37 TAMS

Installation of a watering system to maintain appropriate moisture levels and to deliver
nutrients and microbes to the piles may be necessary. In cool weather, steam or heated water may
be delivered to the piles to maintain elevated temperatures. Collected leachate can be recirculated.In some cases, the compost piles are covered to provide insulation as well as to minimize particulate
emissions and surface runoff. Depending upon the permeability of the sediments, they may require
mixing with a bulking agent prior to piling to develop a permeability that will allow penetration ofnutrients, water, air, and microbes. In a typical static pile system, the bulking agent consists of wood
chips that are mixed with the sediments (NYSDEC, 1991). Regular monitoring of both pile
conditions and changes in PCB concentration is necessary to assess remedial progress.
In land farming, sediments are spread over liners and leachate collection systems in 9- to 18-
inch layers, or lifts, for treatment. Although land farms require more space for treatment than
compost piles, a number of lifts can be land-farmed sequentially over the same surface area. A
sprinkler system is used to deliver microbes, nutrients, and moisture to the land farm. Oxygen can
be supplied through periodic tilling. As land farms are generally not covered, there is the potential
for loss to the air of more volatile congeners, especially during initial spreading and tilling.
Compost piles and land farms have been used to treat soil contaminated with solvents,
petroleum products, or creosote at a number of sites, with varying degrees of success. These
contaminants, however, are generally more readily biodegraded than PCBs. No full-scale PCB
bioremediation projects using these techniques have been completed to date, and few vendors have
experience treating any compounds in soil or sediment volumes greater than 10,000 cubic yards.
Land-based bioremediation options will not be retained for further evaluation.
Phytoreclamation of Dredged Sediments
Sediments are essentially displaced topsoils from the watershed that enter and are eventually
deposited in the Upper Hudson River. Dredged sediments are therefore topsoils that have been
removed from the river. One possible beneficial use of contaminated dredged sediments is to make
them suitable for reuse off site as a soil material by reducing contaminant concentrations to within
4-38 400468 TAMS

regulatory compliance limits. Phytoreclamation is the use of plants to reduce contaminantconcentrations in dredged material.
The application of phytoreclamation to dredged sediments presents some challenges that are
unique to sediments. Since these sediments come from an aquatic environment, they are initially wetand anaerobic after placement in a confined disposal facility (CDF). Subsequent drying andoxidation depend on dewatering and management techniques, which vary from site to site. Drying
and oxidation of surface layers may result in physicochemical changes that may affect plant
establishment and contaminant mobility. Although the surface layer of dredged sediments in a CDF
may be dry and aerobic, deeper layers may remain anaerobic due to the physical design of CDFs and
limited air penetration of surface layers. The depth of dredged sediments in a CDF may vary from
only a few feet to as much as 90 feet. Management of dredged sediment is further complicated by
the potential of elevated concentrations of multiple contaminants. The selection of plant species and
methods of plant establishment is determined by these factors.
A number of factors must be considered prior to initiating a phytoreclamation process in the
field. The age and condition of dredged sediments in existing CDFs may determine the process
selection. Freshly deposited sediments and sediments in some older CDFs will require dewatering
prior to plant establishment. The selection of plant species is contaminant- and site-specific, as
plants that are noted as effective in reducing certain contaminants may not grow sufficiently in
certain climates or soil types. Other difficulties may include the patent and/or licensing requirements
to use some phytoreclamation processes and the ability to obtain certain germplasms. The
phytoreclamation framework described in Price and Lee (1999) provides guidance in determining
the most effective phytoreclamation approach, if one is available.
Reclamation goals or acceptable concentrations in the final soil product are typically
determined by the local authority in which the site is located, or where the soil material will be used
if transported off the site. For phytoreclamation of freshly dredged sediment or in a ponded CDF, ^o
removal of water to support establishment of upland plants and other bioreclamation processes may o
be required. Lee et al. (1976) determined that certain plants can facilitate dewatering and vo
consolidation of fine-grained dredged material. Transpiration by plants can remove significantly
4-39 TAMS

larger quantities of water than simple evaporation of unvegetated dredged material. Plants that can
be easily established on loosely consolidated dredged material and have large root systems that will
reach anaerobic zones to facilitate water removal are necessary. Examples of such suitable plants
include Eastern gamma grass (Tripsacum dactyloides) and hybrid poplar trees (Populus spp.). Under
certain conditions, anaerobic dredged material may be blended with cellulose and biosolids toproduce a manufactured soil product. The resulting soil product will have less free water and willbe ready for immediate establishment of plants for the phytoreclamation process.
The cleanup goals for each contaminant may be based on a soil concentration threshold or
a bioavailability threshold. In situations where two or more contaminants require some form of
reduction, phytoreclamation may have to occur sequentially or concurrently with other
phytoreclamation, bioreclamation, or chemoreclamation processes.
Phytoreclamation of PCBs is not an effective technology at present. Some studies are being
conducted using mulberry (Morus spp.) and hackberry (Celtis occidentalis) trees (for Aroclors and
PCB congeners, respectively), utilizing sequential wet/dry soil conditions and inoculation with
specific microbes. The degradation of PCBs by phenol-like root excretions has been identified as
a likely process (Fletcher et al., 1995). Phytoreclamation may be more effective on PCBs in
conjunction with a bioreclamation process such as biomounds. Data concerning phytoreclamation
of PCBs, dioxins, and other such compounds are inconclusive at present; further research and testing
is required (Price and Lee, 1999). Therefore, phytoreclamation of PCB-contaminated sediments will
not be retained for further consideration in this FS.
4.2.7.3 Sediment Washing
Sediment washing is a water-based volume minimization process in which the sediment is
mechanically scrubbed to remove such contaminants as halogenated solvents, aromatics, fuel oils,
PCBs, and chlorinated phenols (USEPA, 1993b). Sediment washing is based on the same principle
as solids classification; that is, organic and inorganic contaminants tend to preferentially bind, either
chemically or physically, to smaller-sized particles such as clay and silt. Sediment washing separates
the fine fraction of sediments from the coarser particles, thereby concentrating the contaminants and
4-40 400470 TAMS
I reducing the volume of material requiring additional treatment or disposal. Consequently, sediment
washing has limited effectiveness in treating sediments with large fractions of fine-grained particles.
I Typical soil washing solutions are water or water in combination with organic solvents, chelating
compounds, surfactants, acids, or bases. Extraction technologies using organic solvents will be! • "
I discussed in subsection 4.2.7.4, Solvent Extraction. Modification of the soil washing solution adapts
the process to most effectively remove and concentrate the contaminant(s) of concern.
Sediment washing technologies evaluated for use at the Hudson River site are presented in
i; Table 4-9. Options that are highlighted on the table have been tested for or applied to freshwater
..,, sediments or PCB-contaminated sediments. Sediment washing is technically implementable and can
be potentially effective in treating the PCB-contaminated sediment at the site. Sediment washing
will be retained for further evaluation.
4.2.7.4 Solvent Extraction
Solvent extraction, discussed in subsection 4.2.5.2, involves the dissolution of contaminants
from the sediment matrix and recovery and treatment of the contaminant-bearing solvent. Multiple
p extraction cycles are often required to achieve high removal efficiencies. The most common solvents
used for PCB extraction are kerosene, propane, methanol, ethanol, dimethylformamide,
; - ethylenediamine, triethylamine, and freon mixtures. Solvent extraction processes evaluated for use
at the Hudson River PCBs site are presented in Table 4-4. Options that are highlighted on the table
: have been tested for or applied to freshwater sediments or PCB-contaminated sediments.
;v' As shown in Table 4-4, ex situ solvent extraction has been demonstrated to be effective in
treating sediments contaminated with PCBs at pilot scale and full scale. Furthermore, solvent
extraction would be technically implementable for the Upper Hudson River. It should be noted that
the liquid waste stream would require further treatment, e.g., other chemical or physical separation
I; processes, to separate the contaminants and recover the solvent. The concentrated PCB residuals °
-w^ would require ultimate disposal either by incineration or another suitable method. The treated ~J
sediments may also require further processing prior to ultimate disposal. Solvent extraction will be
retained for further evaluation.
4-41 TAMS
4.2.7.5 Chemical Dechlorination
Dechlorination processes remove chlorine atoms from chlorinated contaminants such as
PCBs through the addition of a chemical reagent under alkaline conditions at increased temperatures.
Dechlorination processes evaluated for treating Hudson River sediments, including the APEG
process, the base-catalyzed decomposition (BCD) process, dechlorinatlon in combination with
thermal desorption, and dechlorination in combination with solidification, are described briefly in
the following section and evaluated further in Table 4-5. Options that are highlighted on the table
have been tested for or applied to freshwater sediments or PCB-contaminated sediments. Processes
combining dechlorination and thermal desorption are included both in this section and in subsection
4.2.7.6, Thermal Desorption. Processes combining dechlorination and solidification are also
included in subsection 4.2.7.8, Immobilization.
Chemical Dechlorination Utilizing Alkali Metal Hydroxide-based Polyethylene Glycol Reagent(APEG)
This process detoxifies PCBs by heating and mixing the contaminated sediment with the
APEG reagent. Potassium hydroxide is the most commonly used alkali metal hydroxide in this
process; the resulting product is potassium polyethylene glycol (KPEG). Sodium hydroxide is
another commonly used alkali metal hydroxide. During the process, the PCBs are decomposed into
glycol ether and chloride salt, which are water-soluble, low-toxicity compounds.
The dechlorination process requires from 0.5 to 5 hours per batch, depending on such factors
as the contaminant concentration, water content, humic and clay content, and the level of treatment
required. Once dechlorination is complete, the treated sediment is washed to remove excess reagent
and treatment by-products. Spent reagent and washwater may require additional treatment.
Toxicity of the technique's reaction products and their long-term effect on environmental
conditions remain to be confirmed. The APEG process often results in partial dechlorination, with
residual compounds that are water-soluble and slightly toxic. Furthermore, the APEG process can
sometimes form dioxins and furans (USEPA, 1993c). Due to the potential for the latter, this process
is not retained for further evaluation.
4-42 400472 TAMS
Chemical Dechlorination by the Base-catalyzed Decomposition (BCD) Process
The BCD process combines chemical addition with thermal input to dechlorinate organiccompounds without the use of polyethylene glycol. The process, which was developed by USEPA,is partly a thermal desorption process (discussed below) and partly a dechlorination process. The
first step of the process involves the addition of sodium bicarbonate to PCB-contaminated sedimentsto lower the temperature at which thermal desorption occurs and to partially destroy the PCBs. Thesediment-sodium bicarbonate mixture is heated to temperatures ranging from 600° to 950° F, which
results in PCB dechlorination and volatilization. The vapor condensate is then passed into another
reactor, where sodium hydroxide, a high-boiling hydrocarbon oil, and a catalyst are added. The
mixture is heated to 600° to 950° F for three to six hours, during which further PCB dechlorination
occurs. The BCD process produces residual compounds that are not water-soluble and not toxic.
Laboratory tests have demonstrated that BCD treatment of PCBs does not produce dioxins and
furans.
In 1996 and 1997, a thermal desorption/BCD unit was used in a full-scale project at Naval
Station Guam to treat PCB-contaminated soil. The system averaged 1.3 tons per hour and treated
the soil to an average total PCB concentration of below 2 ppm.
The BCD process can be effective in the treatment of PCB-contaminated sediments. It does
not have the same limitation as the APEG process in terms of producing dioxins and furans. The
BCD process is technically implementable at the site. Base-catalyzed decomposition is retained for
further evaluation.
Combined Thermal Desorption/Dechlorination Processes
As discussed above, dechlorination processes, particularly BCD, rely on thermal desorption
to extract PCBs from sediments before dechlorination can occur. Combined thermal oo
desorption/dechlorination processes have an advantage over simple thermal desorption processes in *
that the organic contaminants are chemically destroyed rather than just concentrated after being
desorbed from the sediment solids. Combined thermal desorption/dechlorination processes are
4-43 TAMS
10

evaluated in Table 4-5. Options that are highlighted on the table have been tested for or applied to
freshwater sediments or PCB-contaminated sediments.
Combined thermal desorption/dechlorination processes have been demonstrated to be
effective in treating PCB-contaminated sediments in pilot and full-scale projects. This technology
is technically implementable and is retained for further evaluation.
Combined Dechlorination/Solidification
Dechlorination in combination with solidification (discussed below) is a process that
combines the addition of setting agents to immobilize contaminants, and reagents to dechlorinate
contaminants. This process has not been demonstrated for PCB-contaminated sediments.
Furthermore, this process has been inactive since 1994, with no new advances or tests (Funderburk,
1999; dePercin, 1999). Combined dechlorination/solidification is not retained for further evaluation.
4.2.7.6 Thermal Desorption
Thermal desorption involves the application of heat to below-combustion temperatures,
typically 200° to 1,000° F, to volatilize water and organic contaminants. Dewatering prior to
treatment is often appropriate to avoid excess costs associated with thermally driving off moisture.
Thermal desorption processes take place under anoxic conditions to prevent combustion. The
vaporized organics are then recovered by condensation or carbon adsorption for additional treatment,
e.g., dechlorination. Alternatively, the vaporized organics can be incinerated in a high-temperature,
secondary-combustion chamber (USEPA, I993c). By desorbing the contaminants from the sediment
matrix, the volume of material subject to additional treatment is greatly reduced.
Thermal desorption processes can be categorized into two groups based on the operating
temperature of the desorber: high-temperature thermal desorption (HTTD) or low-temperature
thermal desorption (LTTD). These relative terms should not be confused with terms used when
thermal desorption is being compared with incineration processes. In such comparison, thermal
desorption is referred to as a low-temperature thermal process, while incineration is considered a
4-44 400474 TAMS
high-temperature process, in which temperatures are generally 2,000° F or higher. HTTD processes
operate at 600 to 1,000° F and are frequently used in combination with incineration or dechlorination.
LTTD processes operate at 200 to 600° F and have been most successful for remediating petroleumhydrocarbon contamination in soil (FRTR, 1999).
A temperature below 800° F is generally not sufficient to release PCBs from soils orsediments unless air flow is severely restricted. However, in a restricted-oxygen atmosphere, PCBsmay react (by pyrolysis) to form other compounds such as dibenzofurans, some of which are
considered more toxic than PCBs. This problem must be addressed in order for a particular thermal
desorption technology to be appropriate for PCB-contaminated sediments.
There are many commercially available thermal desorption processes. Those evaluated for
use at the Hudson River site are presented in Table 4-10. Options that are highlighted on the table
have been tested for or applied to freshwater sediments or PCB-contaminated sediments.
Thermal desorption has been demonstrated to be effective in removing PCBs from sediments,
and is technically implementable at the site. The desorbed PCBs would require further treatment or
disposal. As discussed previously, thermal desorption is often combined with dechlorination
processes so that organic contaminants are chemically destroyed rather than just concentrated after
being desorbed from the sediment solids. Combined thermal desorption/dechlorination processes
are also evaluated in Table 4-10. Thermal desorption is retained for further evaluation.
4.2.7.7 Thermal Destruction
Thermal destruction is a controlled process that uses high temperatures to destroy hazardous
contaminants. The specific products of thermal destruction vary depending on the types of wastes
that are burned and the operating parameters. Most thermal destruction units consist of a waste feed
system, an air or oxygen-fed burner system, a combustion chamber, a combustion monitoring system, *>o
and equipment for air pollution treatment and control and ash removal. ^-jen
4-45 TAMS
Thermal destruction systems can be fixed, mobile, or transportable. Fixed systems are off-
site TSCA-permitted incineration facilities. The use of these facilities requires that sediments be
dewatered prior to transportation to the facilities. Mobile thermal destruction systems are broughtto a site and then removed at the conclusion of the remediation. They normally include all of the
equipment and supporting systems necessary for operation of the facility, such as electric-power
generation equipment, a fuel supply, and equipment to collect and dispose of wastewater.Transportable equipment differs from mobile equipment in that it requires a significant installation
effort. This equipment is provided in modular components and must be assembled before use.
Transportable systems are designed so that they can be dismantled, removed, and re-installed at
another site. The potentially large load for this project would probably necessitate installation of one
or more near-river thermal destruction systems if mobile or transportable systems are selected.
The thermal destruction processes/options evaluated for Hudson River sediments are
presented in Table 4-11. Options that are highlighted on the table have been tested for or applied
to freshwater sediments or PCB-contaminated sediments. Thermal destruction has been
demonstrated to be very effective in destroying PCBs in soils and sediments and is technically
implementable; thermal destruction is therefore retained for further evaluation.
4.2.7.8 Immobilization
Immobilization refers to a broad class of treatment processes that physically or chemically
reduces the mobility of hazardous constituents in a contaminated material. Immobilization treatment
of contaminated sediments improves material handling characteristics, decreases the area through
which contaminant transport can occur, and limits the contaminant solubility and toxicity.
Immobilization includes solidification, stabilization, and encapsulation processes (subsection
4.2.5.4).
Ex situ immobilization methods involve mixing setting agents such as cement, quicklime,
grout, pozzolanic materials, and reagents with sediments in a treatment unit. A treatment unit
typically consists of a materials feed system, a reaction vessel equipped with mixing equipment, and
4-46 400476 TAMS

an area for curing. Sediments may require some pre-processing, such as screening of oversized
material, prior to solidification/stabilization treatment.
Solidification/stabilization processes evaluated for use at the Hudson River PCBs site are
presented in Table 4-6. Options that are highlighted on the table have been tested for or applied to
freshwater sediments or PCB-contaminated sediments.
The effectiveness of solidification/stabilization technologies is variable depending on the
characteristics of the contaminated soil and the particular additives used (subsection 4.2.5.4). This
technology is technically implementable at the site because PCBs have characteristics of strong
adsorption to sediments. Ex situ immobilization technologies are retained for further evaluation.
Solidification in combination with dechlorination was discussed and evaluated previously
(subsection 4.2.7.5, Chemical Dechlorination). Combined dechlorination/solidification is not
retained for further evaluation because of lack of demonstrated effectiveness for PCB-contaminated
sediments.
4.2.8 Beneficial Use
Beneficial use of dredged contaminated sediments includes two main options, using the
dredged sediment in their original form, or treating the sediments to destroy the PCB contaminants
and processing the treated material to create a useable product.
4.2.8.1 Landfill Cover Material, Construction Fill, Mine Land Reclamation
Beneficial use options discussed in this subsection involve using dredged sediment in its
original form, i.e., the sediment may be treated to remove contaminants prior to being put to use, but
its essential form will still be that of a sediment material. These beneficial use options are presented ^oin Table 4-12, and differ from those discussed in subsection 4.2.8.2, Manufacture of Commercial o£>
Products, where thermal treatment processes actually form a useable product that is no longer ^
sediment.
4-47 TAMS

Beneficial Uses of Dredged Material, Engineer Manual 1 1 10-2-5026 (USAGE, 1987a),
provides evaluation of and conceptual design criteria for several potential beneficial use options.
The physical location of the site and character of the surrounding region, as well as the nature of the
contaminant problem, limit the beneficial options that can be considered. It is unlikely that options
that bring exposed sediments - even if treated - into close physical proximity to humans, domesticanimals, or wildlife would be acceptable for consideration due to the perception of risk. For thesereasons, beneficial use options such as habitat (e.g., wetlands) development, park and recreational
uses, and agricultural uses are not evaluated for this project. The creation of made land, with proper
isolation and engineering controls, is a possible exception; this is discussed below in subsection
4.2.9. Beneficial use options discussed in this subsection include using dredged sediments for solid
waste landfill cover, construction fill, and abandoned strip mine reclamation.
As a practical matter, it is unlikely that private parties would accept treated sediment for
construction purposes due to the nature of the contamination. Moreover, the sheer volume of
material potentially involved makes the logistics of beneficial use schemes a challenge. Potential
beneficial use, other than made land, is therefore likely to be limited to solid waste landfill cover
material, fill material for large government construction projects, such as highways and airports, and
strip mine reclamation fill material.
Beneficial use may be applicable to raw sediments, to coarser-grained sediments separated
from fine-grained sediments through solids classification pretreatment or soil washing treatment, or
to treated sediments. It is likely that beneficial use options will require meeting certain appropriate
criteria for the specific use.
Solid Waste Landfill Cover
Soils are used in the operation of solid waste landfills to provide daily cover, interim cover,
and final cover. This material must be amenable to handling by typical earth moving equipment such
as front end loaders and dump trucks; must be spreadable; and must be able to be compacted under
the wheels or tracks of trucks and bulldozers. The sediments of the Upper Hudson River are largely
silty sands and sandy silts which, if dry enough, would serve as satisfactory cover material.
400478 TAMS

Hydraulically dredged sediments would require settling with subsequent drying prior to use at a
landfill.
There are several solid waste landfills within 100 miles of the site. However, because of the
potentially large volume of dredged material that could be generated, and because some landfills maynot accept dredged material as landfill cover even if treated, the total combined capacity of theselandfills may not be sufficient. However, if smaller components of the total sediments are
considered (e.g., separated coarse-grained material), or if this option were to be combined with
another beneficial use option, use of the material as landfill cover may be feasible. This beneficial
use option may be suitable for sediments with low concentrations of total PCBs (typically four to ten
mg/kg), especially if these sediments have already undergone a relatively low-cost treatment such
as solidification/stabilization with pozzolanic materials. Beneficial use of sediments as solid waste
landfill cover, therefore, is retained for further evaluation.
Construction Fill
Utilization of barge canal sediments as fill for construction projects is a sediment reuse
historically practiced in the Mohawk Region (Malcolm Pirnie, Inc., 1984). As noted above, current
knowledge of the PCB contamination of Hudson River sediments, or even association with the
remediation project, would likely restrict potential demand for these materials to state or federal
government projects. However, treated solidified/stabilized sediments from Newark Bay were used
as construction fill at the Jersey Gardens Mall project, which is privately owned. Treated or
minimally contaminated sediments can also be used in major highway or airport construction where
they would be encapsulated safely within pavements or beneath structures.
Dredged sediments from the Hudson River likely do not have sufficient coarse materials
(gravel) to be utilized as highway or runway subbase without amendment. In addition, as discussed
previously with regard to landfill cover, there likely would not be sufficient capacity at potential ^o
construction projects in the vicinity of the site to accept the total volume of dredged material, given ®*j
that it is potentially so large. Again, however, if smaller components of the total sediments are vo
considered (e.g., separated coarse-grained material), or if this option were to be combined with
4-49 TAMS
another beneficial use option, the construction project option may be feasible. This beneficial use
option may be suitable for sediments with low concentrations of total PCBs (typically four to ten
mg/kg), especially if these sediments have already undergone a relatively low-cost treatment such
as solidification/stabilization with pozzolanic materials. Beneficial use as construction fill is
retained for further evaluation.
Abandoned Mine Reclamation
This beneficial use option involves using dredged sediments to reclaim abandoned mine
lands. The focus of abandoned mine reclamation is to reduce health and safety issues related to the
unreclaimed mines. Pennsylvania, for example, which in the past was a leading coal producer, has
many abandoned mines statewide that could potentially use dredged sediments for reclamation.
Reclamation can involve filling open mine pits, open shafts, and undermined areas with subsidence
problems, and grading surface mine areas to minimize erosion. Prior to use as mine reclamation
material, the dredged sediments may be blended with other materials such as biosolids, paper waste,
and coal ash to provide products that inhibit acid mine drainage production and facilitate enhanced
reclamation and revegetation of abandoned mine lands.
Abandoned mine reclamation has many benefits, including elimination of physical hazards
to people living and working near these sites. The environmental benefits of abandoned mine
reclamation include restoration of land for future use and improvement of water quality. Restoration
of the land can result in increased pasture land and recreational areas, and enhanced wildlife habitat.
Currently, the use of dredged sediments as mine reclamation material is being evaluated at
an abandoned surface mine in the central part of Pennsylvania in a pilot project sponsored by the
Office of New Jersey Maritime Resources (USEPA, 1999m). Pending evaluation of groundwater
monitoring results from this project, which may require several years, the Pennsylvania Bureau of
Abandoned Mine Reclamation is not authorizing other reclamation projects using dredged material.
In addition, dredged sediments with PCB concentrations greater than 4 ppm will not be accepted as
abandoned mine reclamation material (Linanne, 1999). However, because this beneficial use option
can potentially accept large quantities of sediments (in the TI Pool, for example, it is estimated that
400480 TAMS
more than 11 percent of the sediments potentially targeted for remediation under a full section effort
have PCS concentrations below 4 ppm), it will be retained for further evaluation.
4.2.8.2 Manufacture of Commercial Products
The technologies discussed in this subsection combine treatment processes to destroyorganics in the sediments with some further physical/chemical processing to convert the
decontaminated sediment into a useable commercial product. The treatment processes are thermal
destruction processes that may involve oxidation and destruction of organic contaminants in an
oxygen-rich environment, or pyrolysis and destruction of organic contaminants in an oxygen-poor
environment. Along with contaminant destruction, the three technologies evaluated in this group
all include further processing such as heating the sediment matrix to the melting point to fuse the
matrix into a homogenous glassy liquid, then quenching the melt to make a glass tile product or glass
fibers for use in the manufacturing of construction grade cement. These processes are presented in
Table 4-13. Options that are highlighted on the table have been tested for or applied to freshwater
sediments or PCB-contaminated sediments.
Thermal destruction has been demonstrated to be very effective in destroying PCBs in soils
and sediments. Thermal destruction, combined with further processing to manufacture a useable
product, has an advantage over simple thermal destruction processes in that there is no final product
for disposal. Furthermore, processing costs may be recovered when the useable product can be sold
commercially. Combined thermal destruction/beneficial use processes are technically implementable
and will be retained for further evaluation.
4.2.9 Disposal Technologies
Some means must be employed to provide final disposal of any sediments that are physically
removed from the river through environmental dredging. Some disposal technologies may require ^o
dewatering prior to implementation and, depending on the particular technology and contaminant °
concentrations, some form of ex. situ treatment as discussed in subsection 4.2.7 may also be required. j_i
Disposal technologies considered include land disposal and aquatic disposal.
4-51 TAMS
4.2.9.1 Land Disposal
Land disposal of PCB-contaminated sediments may be accomplished in CDFs or in landfills.
Confined disposal facilities can accommodate hydraulically dredged sediments and are designed and
operated to accomplish both dewatering and encapsulation. Confined disposal facilities include both
upland facilities and near-shore facilities. Near-shore facilities are those located within the influence
of the water body, whether within the floodplain or within the water course proper; the lower zones
of the facility are below the groundwater table. USEPA (1993b) notes that CDFs are cost-effective,
and with proper location, design, and construction can perform well in isolating contaminants from
the environment.
The use of landfills requires that sediments be dewatered prior to placement. Since the most
economical means of dewatering bulk dredge spoils utilizes diked impoundments, near-river landfills
with separate dewatering facilities will not be considered; the confined disposal facility is an
equivalent and more cost-effective method. The use of off-site landfills is also considered.
However, the additional handling and transportation of the material to an off-site landfill may add
significantly to the cost.
Off-Site Landfill
Dredged material with PCB concentrations less than 50 ppm can legally be disposed of in
a municipal or solid waste landfill. Dredged material with PCB concentrations greater than 50 ppm
requires disposal at a TSCA-permitted landfill. Because commercial solid waste facilities may
impose a more stringent limit of 30 to 35 mg/kg PCBs as an acceptance criterion, however, for
management and final disposition of dredged sediments for purposes of this assessment, a trigger
level of 33 ppm, not 50 ppm, will be used as the PCB concentration in sediment that would
differentiate between TSCA-permitted and non-TSCA-permitted disposal. A list of solid waste
landfills evaluated and screened for Hudson River PCB sediment disposal is presented in Table 4-14.
A list of TSCA-permitted landfills is presented and screened in Table 4-15. In both cases, these
landfills are screened on the basis of potential capacity to accept PCB-contaminated sediments.
4-52 400482 TAMS

I Depending on the degree of unavoidable mixing expected during the removal, treatment, or
dewatering process, use of both non-TSCA-permitted and TSCA-permitted disposal facilities mayI : be necessary. Further, off-site landfill disposal would require transportation, potentially to great
distances. Some disposal facilities may be accessible by rail. Using unit trains, the cost ofI transportation for large quantities of material, if planned in advance, may be significantly lower than
use of trucks. This option is technically implementable and is retained for further evaluation.?
Upland Confined Disposal Facility
The fundamental characteristic of a CDF is a diked area into which dredged materials are
j. ' placed hydraulically. The facility must be large enough to provide adequate capacity to meet
dredging requirements and must efficiently retain solids while allowing supernatant to be released.
Coarse material such as gravel, sand, and perhaps clay balls, falls out of suspension rapidly near the
inlet pipe. The fine-grained material such as silt and clay particles gradually settles out as the
"""""*•• suspension water moves toward the overflow weir.
In this case, the CDF is also intended to provide long-term disposal of the contaminated
dredged material, essentially as a secure lined landfill. This necessitates siting, design, construction,
operation, closure, post-closure monitoring, and maintenance. The facility must meet regulatory
requirements, including effluent discharge limits and groundwater standards, for landfills in which
PCB-contaminated materials will be stored. A secure, lined CDF provides a high degree of isolation
of the contaminated material with a low probability of subsequent discharge.
Siting a location for a CDF in the vicinity of the Upper Hudson River will be the primary
consideration in evaluation of this technology (USEPA, 1997b). Although local and political issues
have historically made the siting of land disposal facilities problematic (see subsection 1.2.2), this
technology is technically feasible and will be retained for further evaluation.
oo£t00U>
4-53 TAMS

Near-shore Confined Disposal Facility
This term is normally used for a diked disposal area within the tidal zone employed for
harbor and waterfront dredging projects. For the purposes of this project, it refers to a CDF located
within the 100-year floodplain or in shallow, non-navigation areas of the river. A potentialfloodplain location large enough to accommodate the volume of dredge spoils anticipated is theremnant deposit area north of Fort Edward. Use of this area would probably require initial removal
and stockpiling of the remnant material to allow installation of a liner below significant
contamination. The remnant material could then be disposed of in the newly created cells along with
dredged material. Location of CDFs in shallow river areas would result in made land, creating or
extending islands, or connecting islands to the river bank. While there is no single location that
could accommodate the volume of dredged material anticipated, there are several potentially suitable
areas between Fort Edward and Schuylerville which, taken together, could provide sufficient
capacity.
The layout and operation of a near-shore CDF are, in many respects, similar to those for an
upland facility. However, whether in the floodplain or in shallow river areas, construction must take
place in wet conditions and the design and operation must account for high-flow periods and floods.
Since in both cases the areas to be filled are not necessarily contiguous, the dredging sequence may
be matched to filling and closure of individual cells in a single season, thereby avoiding washout
during floods. With proper capping and isolation, such areas could be developed for habitat,
parkland, commercial uses, or waterfront access. Advantages of near-shore CDFs are that in some
cases no purchase of land is necessary (except possibly for construction access), and the permit
exemption of CERCLA Section 121(e)(l) would apply to any CDFs that are located within the
Hudson River PCBs Site. The construction of near-shore CDFs for disposal is technically feasible
and this option will be retained for further evaluation.
4.2.9.2 Contained Aquatic Disposal
Contained aquatic disposal of dredged material in open waters has been practiced for many
years. Restricted disposal involves controls beyond those applied in conventional projects in order
400484

to address the risks or uncertainties associated with contaminated sediments (Cullinane et al, 1986).Unrestricted disposal is not appropriate in the Upper Hudson River because of the nature of the
contamination and the need to avoid interfering with navigation. For the purposes of this FS, theprincipal restriction to be considered is containment of the sediments to avoid subaqueous materialtransport or release of contaminants.
Contained aquatic disposal involves subaqueous covering or capping of dredged sediments,
whether they are simply placed on the bottom or deposited in depressions or excavated pits.
Subsection 4.2.4 contains a discussion of capping sediments in place. Over the last two decades,
millions of cubic yards of sediments have been disposed of in this manner, mostly in harbor and
estuarine locations.
Contained aquatic disposal has not been used previously in the Upper Hudson River.
However, numerous uncapped "wet dump grounds" have historically been used for temporary
storage or disposal of sediments during navigational maintenance dredging. At least seven such
areas between Fort Edward and Schuylerville have been documented (Malcolm Pirnie, Inc., 1984).
Typically, these areas resulted from storage of material dredged by the slower but more available
clamshell dredges. When available, faster cutterhead dredges were used to redredge the wet dump
grounds to retrieve the material for upland disposal. Some of the wet dump grounds are coincident
with hot spots.
Cullinane et al. (1986) suggest that the most important physical goal in selecting a site for
aquatic disposal is long-term stability, which is influenced by at least six factors, including currents,
water depth, salinity/temperature stratifications, bathymetry, dispersion and mixing, and navigation
and positioning. There are locations in the Upper Hudson River where currents may cause difficulties
for the disposal operation, particularly during periods of high flow. However, the major reaches of
the river in which the largest amounts of the contaminated sediments exist are relatively calm. In
the short term, the major concern with currents is simply accurate positioning of the disposal device £o
(USEPA, L993b). The bulk of the material will settle out close to the point of deposition with only •*oosmall amounts of the sediment remaining suspended. In order to address long-term stability issues *"
4-55 TAMS

with regard to currents, sufficient armoring would be required to avoid transport of the cover
material.
The water depth for typical aquatic (open water) disposal projects in marine environments
is about 70 feet (USEPA, 1993b). Except for a single deep hole immediately south of TI Dam on
the west side of Thompson Island, no other part within the area under consideration approach this
depth. The navigation channel is maintained at a minimum depth of 12 feet, while non-channel areas
may be considerably shallower. Unless large subaqueous pits are excavated specifically for disposal,
there is insufficient area in which to place the anticipated quantities of material without significantly
changing the nature and hydraulics of the watercourse in disposal locations.
Due to the extremely limited potential areas for disposal, this technology is not appropriate
for the Upper Hudson and will not be evaluated further.
4.2.10 Summary of Initial Screening of Technologies
Aside from No Action, MNA, and institutional controls, there are six categories of general
response actions appropriate to remediation of PCB-contaminated sediments of the Upper Hudson
River. These are containment, in situ treatment, removal, ex situ treatment, beneficial use, and
disposal. In connection with these six general response actions, 20 technologies with various process
options have been evaluated as described above for effectiveness and technical implementability;
four of these technologies were evaluated for both in situ and ex situ application. The results of this
screening evaluation are summarized in Table 4-1.
Of the 20 technologies considered, seven were not retained for further evaluation. These
include bioremediation (both in situ and ex situ), in situ solvent extraction, in situ chemical
dechlorination, in situ immobilization, soil freezing, and aquatic disposal. There are various
supporting technologies that may be required in order to implement certain of the primary
technologies. A discussion of these supporting technologies can be found in subsection 4.2.11.
4-56 TAMS400486

Containment of the sediments in place is the remedial response least invasive to the sediment
environment. Containment systems such as capping and retaining structures are methods for
controlling sediment resuspension under the range of expected river hydraulic conditions. While
retaining dikes and berms may be used as part of a containment scheme, it is most likely that capping
with inert materials or sealing agents would provide more long-term effectiveness and stability than
dikes or berms alone.
Technologies applicable to treating the Hudson River sediments in situ have also been
considered. In situ treatment technologies would be somewhat more invasive than containment but
less so than removal. The main limitation of in situ treatment is the lack of process control during
treatment, which can lead to incomplete or ineffective treatment and contaminant release to the water
column. All in situ treatment technologies were eliminated in this first stage of screening for these
reasons.
Bottom sediments may be removed if other less invasive technologies are not cost-effective
or protective. Excavation and environmental dredging using conventional or specialty dredges has
been retained for further evaluation. Equipment modifications and operational controls to reduce
sediment dispersion during dredging, such as using cutterhead dredge shrouds, adjusting cutterhead
rotational speed, employing scow-filling controls, and setting limitations on cutterhead swing speed,
are important considerations. Excavation may generate less sediment resuspension than dredging
because the work zone can be isolated from the adjacent water body or dewatered prior to removal
of contaminated sediments.
Should a decision be made to remediate the Hudson River PCBs site by removing some or
all of the contaminated bottom materials, it would be necessary to dispose of the removed materials
directly or to treat those materials and dispose of the treated residuals. Physical, chemical, biological,
and thermal processes or technologies, or combinations thereof, have been proposed for treatment
of PCB-contaminated solids. Of the treatment technologies evaluated, all were retained for further J^oconsideration except for bioremediation because, based on results from other sites, complete •£»00
biodegradation of PCBs may be difficult to achieve within a reasonable time frame for the potentially ^
large volume of dredged sediments for the Upper Hudson.
4-57 TAMS

Beneficial use options of either using the dredged sediment in its original form, or treating
the sediments to destroy the PCBs and processing the treated material to create a useable commercial
product, were evaluated and retained.
The final category of remedial technologies considered here involves disposal of either
untreated contaminated sediments or the residuals from treatment of contaminated sediments. Land
disposal options have been retained for further assessment. While there are no nearby landfills
permitted to receive PCB-containing sediments, transportation and disposal at landfills more distant
from the river but permitted to receive PCB sediments is technically feasible and is an option.
Upland disposal, which would involve obtaining approval to construct a proximate CDF specifically
for contaminated sediments removed from the Upper Hudson River, and near-shore disposal in a
facility located within the 100-year floodplain or in shallow, non-navigation areas of the river, are
two other land disposal options. Aquatic disposal has been ruled out based on the lack of suitable
area to accommodate the quantity of material expected.
4.2.11 Supporting Technologies
Supporting technologies are mentioned in this chapter in relation to their potential
applicability in concert with some of the primary technologies that were evaluated. None of these
supporting technologies has been evaluated or screened to this point. Such technologies include:
• Sediment dispersion controls to maintain water quality, described briefly in subsection 4.2.6,
Removal Technologies;
• Passive, mechanical, and active evaporative dewatering technologies and solids classification
processes (stationary screens and sieves, vibratory screens, hydraulic classifiers, spiral
classifiers, and cyclones/hydrocyclones), described in subsection 4.2.7, Ex Situ Treatment;
• Wastewater treatment subsequent to application of some ex situ treatment technologies; and
• Transportation, whether by truck, rail, or barge.
Evaluation and selection of supporting technologies is appropriate in the detailed evaluation
and conceptual design phase.
4-58 400488 TAMS
Some consideration of habitat replacement is also appropriate here. Sediment removal and
sediment containment involve primary technologies that result in potential impacts to or disturbanceof aquatic and wildlife habitat, potentially resulting in the need for restoration measures that involve
application of supporting technologies. Details pertaining to the habitat replacement concepts appearin Chapter 5 and Appendix F. The major objectives of habitat replacement are:
• Restoration of fish habitat;• Restoration of benthic habitat;
• Replacement of vegetation communities;
• Restoration of wetlands; and
• Stabilization of shorelines.
The following potentially applicable supporting technologies would address these objectives:
• Placement of suitable substrate and limited deployment of boulder clusters in deep river
areas;
• Planting of rooted submerged and floating aquatic vegetation in shallow river areas,
excluding emergent wetlands and riverbanks;
• In emergent marsh areas, establishment of vegetative species that are valuable to fish and
wildlife; deep pools vegetated with rooted and floating vascular plants; and shrub-scrub
wetlands along the shoreline fringes; and
• Stabilization of riverbanks utilizing both vegetative and structural-vegetative methods.
4.3 Effectiveness, Implementability, and Cost Screening of Technology Process Options
Technologies and process options that pass the initial technical feasibility screening are
subjected to a further screening based en the three criteria of effectiveness, implementability, and
cost. Results of this screening are discussed below and are summarized on Table 4-16. It should •**•obe noted that the numbering of subsections for this screening does not directly match the numbering °
ooof the initial technology screening discussion (subsections 4.2.1 through 4.2.10), since one general ^
4-59 JAMS
response action category (in situ treatment, subsection 4.2.5) was not retained for further evaluation
in this section.
Effectiveness focuses on the degree to which a process option reduces the toxicity, mobility,
or volume of hazardous substances through treatment and achieves long-term protection. The
effectiveness criterion also considers the degree to which the process options complies with theARARs and minimizes short-term impacts, and also how quickly it achieves protection.
Implementability includes both the technical and administrative feasibility of implementing
a technology process. Technologies that were clearly ineffective or unworkable for this site were
previously screened in Section 4.2. Therefore, consideration of implementability with respect to
process options focuses on the administrative implementability of technology processes, including
necessary permits for off-site actions; the availability of treatment, storage, and disposal facilities;
and the availability of necessary equipment and skilled workers to implement a technology process.
Cost plays a limited role in this screening stage; only order-of-magnitude costs (i.e., low,
moderate, or high cost) are developed. For the purposes of this discussion, processing costs of less
than $100/ton of sediments were considered low; $100 to $500/ton were considered moderate; over
500 to $l,000/ton were considered high, and processing costs over $ 1,000/ton were considered very
high. For treatment technologies, processing costs were assumed to include all the costs associated
with the treatment other than capital and mobilization costs. Technologies or process options that
may be significantly more costly without any offsetting benefit over comparable options may be
screened out at this point.
4.3.1 No Action
Under No Action, no active remediation of any kind is implemented. In this FS, the No
Action alternative excludes implementation of ongoing monitoring programs and any institutional
controls/administrative actions; only five-year reviews will be performed.
4-60 TAMS400490
4.3.1.1 Effectiveness
Under the No Action scenario, ecological and human health risks at the site exceedacceptable levels ( USEPA 2000q, and USEPA 2000p) and are likely to remain at unacceptable
levels for several decades. The No Action alternative is not effective in reducing these risks becauseit does not include any remedial activities to reduce human or ecological exposure to hazardoussubstances at the site.
4.3.1.2 Implementability
No Action is easily implemented from a technical and administrative perspective.
4.3.1.3 Costs
There are no short-term costs for No Action. Long-term costs are limited to periodicreassessment at five-year intervals.
4.3.1.4 Conclusion
The No Action option is retained as a baseline for comparison to other alternatives.
4.3.2 Monitored Natural Attenuation
As discussed in subsection 4.2.2, monitored natural attenuation refers to the reliance on
natural attenuation processes to achieve remedial action objectives within a time frame that is
reasonable compared to other more active methods. It is not considered to be a No Action remedy.
Natural attenuation includes the reduction of volume and toxicity of contaminants in sediments by
natural biological, chemical, and physical processes. Extensive site monitoring and modeling would ^
be performed as part of monitored natural attenuation for the Hudson River PCBs site. Institutional o^
controls also may be a component of the MNA alternative. JfJ
4-61 TAMS
4.3.2.1 Effectiveness ~
The effectiveness of MNA depends on how well naturally occurring processes such as [
biodegradation and burial reduce PCB levels in the river. Biodegradation of PCBs in the Upper
Hudson River sediments has resulted in partial reduction of highly chlorinated congeners, but little j
or no reduction of less chlorinated congeners (USEPA, 1997aj. More importantly, the degree ofj
dechlorination varies directly with the level of contamination but only becomes important at higher !
concentrations (greater than 100 mg/kg and higher). Additionally, dechlorination does not appear
to continue indefinitely with time. Finally, full dechlorination can only reduce the total mass of PCBs II
by 26 percent and this has been only rarely observed. Thus much of the sediment PCB inventory ,
remains largely intact with regard to dechlorination, having only been subject to minor '
dechlorination losses, estimated at less than 10 percent of mass (USEPA, 1997a, and USEPA, ;
1998b). '
Notably, dechlorination, when it is able to proceed to its fullest extent, is expected to reduce _
the carcinogenicity of PCBs although this has not been directly verified. However, less than full
dechlorination, more typical of Hudson conditions, is expected to increase PCB mobility, potentially
increasing migration from the sediments and bioavailability. Additionally, lower chlorinated ?
congeners have been ascribed higher neurological and developmental impacts in humans so that the
ultimate impact of the dechlorination levels typically seen in Hudson River PCBs is unclear. Thus, t
dechlorination is not expected to improve the effectiveness of MNA through reduction of mobility
or toxicity. I
Burial of contaminated sediment by deposition of less-contaminated sediment does occur in ;"!
the Upper Hudson, but varies significantly along the river and is difficult to quantify at a specific
location. Additionally, the USEPA found evidence for statistically significant PCB mass loss from f:i
the sediments, indicating that re-release of the PCBs in the river sediments is occurring over time.
Indeed, the water column monitoring records obtained by GE suggest that sediment release of PCBs j
from the TI Pool has diminished little over the ten-year period of record. Monitoring of PCB levels
in fish indicates that some reduction has occurred historically, but the current rate is such that will
not reach RAOs or PRGs for several decades (USEPA, 2000a). Extensive monitoring and analysis
4-62 400492 TAMS

required as part of MNA/recovery are effective in tracking trends in PCB dynamics, but will not, in
themselves, meet RAOs. Indeed, the gradual downward declines of PCB levels in fish and insediments are consistent with much slower rates of recovery than those estimated by the modeling
analysis. These issues raise significant concerns about the effectiveness of MNA.
4.3.2.2 Implementability
Monitored natural attenuation is considered to be readily implementable technically and
administratively.
4.3.2.3 Costs
Short- and long-term costs for site monitoring and data analysis and modeling are relatively
low compared to active remedial actions.
4.3.2.4 Conclusion
Monitored natural attenuation can be implemented alone, along with an active remedial
action, or after an active remediation is completed. MNA timing and efficiency can vary by river
section depending on whether active remediation is planned for that section. This option is retained
for further evaluation.
4.3.3 Institutional Controls
Institutional controls are non-engineering, administrative, and/or legal controls intended to
prevent or reduce human exposure to on-site hazardous substances. For example, institutional
controls for the Hudson River PCBs site may include fishing bans or advisories, site access/deed
restrictions, water "use restrictions, or restrictions on sediment disturbance.
OO£>VO10
4-63 TAMS
4.3.3.1 Effectiveness
The effectiveness of institutional controls if implemented with no remedial action is low,
because RAOs are not met. Site use restrictions may prevent exposure to PCBs from a human healthstandpoint, but will not reduce or alleviate ecological impacts. Also, since some people may not
comply with fish consumption advisories, it is possible that some exposure to PCB contaminationmay occur.
4.3.3.2 Implementability
Site use restrictions are easily implemented. Effective enforcement of site use restrictions,
including fish consumption advisories, may be difficult to maintain in the long term.
4.3.3.3 Costs
Costs for institutional controls including any associated monitoring are relatively low
compared to active remedial actions.
4.3.3.4 Conclusion
Institutional controls are retained for further evaluation in this FS.
4.3.4 Containment
Both containment technologies evaluated, subaqueous capping and retaining berms and dikes,
were retained in the initial screening.
4.3.4.1 Subaqueous CappingA wide variety of materials can theoretically be used to cap contaminated sediments in order
to minimize or reduce leaching, bioturbation, and erosive transport of contaminants. Capping using
inert materials or sealing agents was retained after the initial screening.
4-64 400494 TAMS

Effectiveness
Capping is expected to be effective in containing PCBs in the sediments and meeting RAOsif the cap is properly designed, constructed, and maintained. Given sufficient thickness andarmoring, capping using inert materials or sealing agents can minimize leaching of PCBs to the water
column, prevent bioturbation, and withstand hydraulic conditions such as scour events associatedwith extreme floods. However, a large groundwater flux component may significantly impair theeffectiveness of a subaqueous cap. Other factors that may affect the effectiveness of a subaqueouscap include scour due to movement of ice chunks during spring thaw (ice rafting), possible damagedue to watercraft navigation, and drying/cracking of or result of freeze/thaw cycles on cap areasexposed during low-flow periods.
Implementability
While technically feasible, implementation of this technology would require consideration
of several factors. Due to the thickness of material layers needed, the cap would penetrate the water
surface in many locations and make other locations so shallow that the parameters for recreational
craft navigation would change. Unless sediments are removed prior to placement of the cap, these
changes may result in extensive modifications to the shoreline and bathymetry. In addition,
implementation of a cap in shallow areas may be limited due to reasons stated above (i.e.,
drying/cracking, freeze/thaw cycles, scour due to ice chunks, etc.). A subaqueous cap will likely not
be implemented in the canal navigation channel, which is subject to maintenance dredging. Finally,
this approach will substantially eliminate the benthic population in the extensive areas capped.
Costs
Construction costs are expected to be low to moderate depending on the type of capping
material, the thickness of the cap, and the method of construction. For a typical cap design and most- ' ^
capping materials, cap construction costs are expected to be less than $10 per square foot. Long- °fj^
term costs include periodic monitoring of the cap and cap maintenance, as required. vo
4-65 TAMS
Conclusion
Capping has been effectively implemented at other sites with contaminated sediments.Capping presents a viable in situ remedial alternative compared to sediment removal. Capping may
be considered where sediment removal is implemented but contamination is left in place. It can be
used to cover areas where sediment removal has been implemented, although it is not practicable for
the navigation channel. Capping using inert materials or sealing agents is retained for further
evaluation.
4.3.4.2 Retaining Dikes and Berms
This evaluation considers dikes and berms only in the context of long-term stand-alone
structures within the river to minimize downstream transport of suspended contaminated sediments.
When used as components of CDFs or subaqueous capping system, evaluation of retaining dikes and
berms is inferred in the discussion of the primary technology. These structures are intended for
implementation as long-term sediment containment options, and are different from sediment barriers
set up temporarily to control resuspended sediments during sediment removal activities.
Effectiveness
Retaining dikes and berms may be engineered to be effective in minimizing downstream
transport. This can be accomplished by trapping or increasing deposition of suspended sediments
or by isolating already deposited sediments from scouring forces. With proper understanding of each
local hydrodynamic situation, dikes or berms may be engineered to withstand and provide
effectiveness during extreme scour events or under routine water levels and current velocities-
Regardless of their effectiveness against erosional transport, however, these structures by themselves
will have no effectiveness in reducing diffusion of PCBs to the water column from the contaminated
sediments, except insofar as they allow or enhance deposition of clean suspended material over
contaminated sediments. This process, though, would be slow and unreliable. This technology will,
therefore, not be effective in achieving RAOs.
4-66 400496 TAMS

Implementability
Implementation of this technology requires less backfill or armoring material thansubaqueous capping. The necessary resources, regardless of the particular design, are readilyavailable. The presence of rocky soils may impede construction of some containment options. Lessdisruption of shorefront property and small-craft navigation would occur than for shallow areasubaqueous capping. However, depending on location of the retaining dikes and berms, someinterference with navigation activities may occur. Due to the smaller amounts of resources needed
and less construction activity required, this technology is expected to require less time to implementthan subaqueous capping.
Costs
Construction costs are expected to be low and to depend on the type of construction materialand the method of construction. Long-term costs include periodic monitoring and maintenance of
the retaining structures, as required.
Conclusion
Retaining dikes and berms are eliminated from further consideration due to their
ineffectiveness in achieving RAOs compared to other technologies.
4.3.5 Removal
Two sediment removal technologies, i. e., excavation and dredging, were retained in the initial
screening.
4.3.5.1 Excavation
Excavation technologies are sediment removal technologies that would be used after a
particular work area has been isolated from the river and then dewatered to expose the target
4-67 TAMS
oo

material. Contaminated sediment in shoal areas of the river that may be exposed during low-flowperiods can also be excavated.
Effectiveness
Excavation technologies are effective and most applicable to removal of those sediments thathave been deposited along the river's shallow shoreline areas and within secondary channels.Excavation is most effective when used in combination with any one of several containment or
isolation systems (see Section 4.2). Excavation is effective in removing the targeted contaminated
sediments from shallow areas.
Implementability
Excavation technologies are conventional systems and are readily available in configurations
and sizes that conform to the access limitations and other constraints of the Upper Hudson. While
excavation technologies are not likely to be suitable for removing all the river's contaminated
sediments, they can be used to manage a portion of the removal requirements. It appears that
landside access to contaminated sediments in the Upper Hudson River would require significant
disruption of some private properties. Therefore, it is likely that excavation activities would usually
be conducted from the water side.
Costs
Costs associated with implementation of typical excavation methods are expected to be in
the low to moderate range. As the volume of material being removed increases, the unit cost for
excavation work will decrease.
Conclusion
Excavation technologies are applicable for removal of contaminated sediments in shallow
areas of the river and therefore are retained for further evaluation.
4-68 TAMS400498

4.3.5.2 Dredging
The dredging technologies that have been retained to this point in the analysis includeconventional dredges and specialty dredges. Actual dredging technologies selected for removal ofUpper Hudson contaminated sediments would need to function effectively in light of the wide rangeof physical conditions that would be" encountered, including access limitations, varying riverconditions, sediments ranging from fine- to coarse-grained, the presence of debris, cobbles, orboulders in some locations, and navigational conflicts, among others. In light of the many
constraints, it can be expected that several different dredging technologies may need to be appliedto complete removal of the targeted sediments.
For this FS, dredging technologies were placed into three categories: conventional dredges;
large-scale dredges; and specialty dredges (subsection 4.2.6.2). Both large-scale dredges and certainspecialty machines were eliminated from further evaluation. The type of equipment that have been
retained are evaluated below for potential effectiveness, implementability, and cost.
Mechanical Dredges
Mechanical dredges can be placed into two principal categories, "bucket-on-rope" systemsand hydraulically-actuated buckets.
Effectiveness. The "bucket-on-rope" units are now being designed with covers and
enclosures that significantly reduce the quantity of material resuspended during removal operations.
In addition to enclosures, in some cases the actual digging action of the bucket has been modified
to achieve greater sediment removal precision. This technology can be effective for the removal of
fine- and coarse-grained sediments, provided excessive debris is not present to prevent complete
bucket closure.
rfko
The hydraulically actuated bucket dredge is essentially an excavator that has been adapted °to dredging operations. These machines, particularly in a backhoe configuration, have been used in vo
European dredging projects for some time. Recently, backhoes have seen utilization in US dredging
4-69 TAMS

projects, including deepening of the Kill Van Kull in New York Harbor. Advantages of thehydraulically actuated bucket include its removal precision and production efficiency. Both clamshell
and backhoe buckets are now being fitted with covers to reduce resuspension and can remove fine-and coarse-grained sediments at nearly in situ water content. These machines can remove most
bulky debris encountered during dredging operations with less impairment to productivity thanhydraulic dredges operating under comparable conditions.
Implementability. "Bucket-on-rope" systems that are compatible with the Upper Hudson's
physical constraints are readily available. Hydraulically actuated machines are also readily availablein configurations that are compatible with the physical limitations of working on the river. Since
mechanical dredges can be expected to remove sediments at nearly in situ conditions, these systems
have the advantage of minimizing the volume of water removed from the sediments.
Costs. Costs associated with "bucket-on-rope" systems and hydraulically actuated bucket
dredges are expected to be in the low to moderate range, even when consideration is given to the use
of turbidity curtains or other suspended sediment control systems. Since mechanical dredges would
remove sediments at nearly in situ densities, dewatering costs would be minimized with these types
of equipment.
Conclusion. Mechanical dredges, in particular "bucket-on-rope" systems and hydraulically
actuated bucket dredges, are potentially effective and implementable for removal of Upper Hudson
sediments. Thus, these types of equipment are being retained for further evaluation in this feasibility
study.
Hydraulic Dredges
This is a broad category of dredges that ranges in size from high-volume productionmachines to dredges designed to address specific remedial action situations. The units being
considered here are those that are mounted on floating platforms and require at least several feet of
water for maneuvering. When a hydraulic dredge is fitted with a cutting head it is often referred to
as a cutterhead dredge. Given the wide range of bottom conditions that would be encountered in the
4-70 400500
river, it is expected that the hydraulic cutterhead machine would have greater applicability thanwould a conventional suction dredge.
Effectiveness. The cutterhead unit can be expected to efficiently remove either coarse or fine
grained sediments. Also, it has been the historic view that hydraulic dredges are less prone toresuspend sediments than mechanical systems; however, it should be noted that much of the
comparative evaluation of these systems comes from navigational projects where conventional openbuckets were employed for removal work. It is not expected that the historic comparisons will beapplicable to the equipment and operating philosophy that would be utilized for dredging of theUpper Hudson River. Finally, it is expected that productivity of hydraulic equipment is somewhat
more apt to be impacted by the presence of debris than that of a mechanical system.
Implementability. Hydraulic cutterhead dredges are readily available in configurations and
capacities that are compatible with working conditions on the Upper Hudson River. However,implementation of a complete hydraulic dredging system will entail addressing several important
constraints imposed by the river. In order to carry out hydraulic dredging operations, a lengthy slurry
line will need to be installed to convey dredged solids to a shoreside processing facility. That line
and the associated pumping system have the potential to impede river navigation. In addition, asslurry line length increases, reliability of the overall dredging system can be reduced. It is expected
that considerations such as these will be addressed, in detail, during the project's design phase.
Costs. Costs for dredging with a cutterhead are expected to be in the low to moderate range.
However, since these machines pump the removed sediments in a relatively low-density slurry form,there could be substantial cost associated with dewatering the dredged material prior to its final
disposition.
Conclusion. Given their versatility to handle a wide range of sediment types, hydraulicrfs.
cutterhead systems are retained for further evaluation in this study. ouio
4-71 TAMS

Specialty Dredges
The types of equipment that have been retained in this category include submersible pumps
and various amphibious excavators that can be fitted with several different types of removal heads.
Effectiveness. Specialty dredges may offer an advantage where the target material is difficult
to access because water depth is not sufficient to enable use of any of the conventional dredges. Asubstantial fraction of the contaminated sediments in the Upper Hudson River is found in shallow
shoreline areas or within secondary channels. Amphibious excavators, and possibly submersible
pumps, may provide an alternative to excavation for removal of these sediments.
Implementability. Specialty dredges are available in a wide array of configurations and are
supplied by numerous manufacturers. In general, these machines function best when fine-grained
materials are targeted for removal. However, some of the units are being fitted with cutting-action
attachments to extend their range of applicability. The specialty units can be expected to attain
relatively low production rates and there may be a need to employ suspended sediment control
barriers when removal operations are being conducted. Furthermore, depending on the type of
removal head selected, use of the specialty machines may entail dewatering of sediments, as would
be the case when conventional hydraulic dredges are used.
Costs. Because of their low production rate, it is expected that costs associated with the use
of these specialty dredge systems will be moderate.
Conclusion. Amphibious excavators and submersible pumps are specifically designed to
access sediments in shallow areas and are therefore applicable to removal of Upper Hudson River
sediments. Speciality dredges will be retained for further evaluation.
4.3.6 Ex Situ Treatment
For the following evaluation of ex situ treatment technologies, it will be assumed that a
location for the treatment facility in the site vicinity is equally available for all technologies and
4-72 400502 TAMS

options. However, a near-river treatment facility would likely be limited by land area availability,and therefore, technologies and process options with large land area requirements would be at adisadvantage in terms of implementability. Ex situ treatment at an off-site facility is potentially an
option; however, this involves transportation of large volumes of untreated sediments, withassociated costs. The economics of off-site transportation would have to be balanced with thepotential effectiveness of the treatment process during evaluation of the treatment technology.Federal and state permits, including TSCA permits, may be required for most, if not all, of thetreatment options evaluated in this section. For purposes of this analysis, it is assumed thatpermitting will be administratively feasible for all technologies, with the possible exception of
incineration, for which permitting may prove difficult.
4.3.6.1 Sediment Washing
Sediment washing is a water-based volume minimization process in which the sediment is
mechanically scrubbed to remove contaminants.
Effectiveness
The effectiveness of this technology for treating PCB-contaminated sediments has been
demonstrated at pilot scale, where PCB removal efficiency up to 95 percent has been reported.
When the appropriate equipment and washing solution are used, sediment washing can effectively
concentrate contaminants into a fine-particle fraction for secondary treatment. Sediment washing
may have limited effectiveness in treating sediments with large fractions of fine-grained particles
such as clay and silt. For example, a representative soil washing process has been demonstrated tobe most effective for soil/sediment with less than 40 percent silt, and clay material smaller than 45
|J,m (see Table 4-9, page 2). The contaminated sediments of the Upper Hudson River that wouldpotentially be removed in dredging are largely silty sands and sandy silts. Based on Phase 2
confirmatory sampling, fine-grained material averaged about 30 percent of the sediment by weight. " ,&,o
However, the median value was about 20.5 percent, and since the samples were not collected °
randomly within contaminated areas, this is perhaps a more representative value. Therefore, w
sediment washing is potentially effective for treating the Hudson River sediments.
4-73 TAMS

Implementability
Sediment washing is technically and administratively implementable, and the appropriate
equipment and services are available from various vendors. Existing full-scale commercial systems
can operate at rates up to 300 tons per hour. Sediment washing produces a liquid waste stream along
with the contaminated fines fraction that will require further treatment. The final disposal of different
phases of contaminated materials could present implementability and space problems in terms ofmaterials handling and temporary storage.
Costs
Separation of the contaminated fine-grained fraction from coarse-grained material can result
in reduced disposal cost and volumes requiring handling as hazardous waste. The relative costs of
this technology are variable and depend on the type of washing reagents, level of contaminant in the
sediments, and the fraction of fine-grained material in the sediments. In general, the costs can be
classified as low to moderate compared to other technologies.
Conclusion
Because of its potential effectiveness in separating the more contaminated fine-grained
fraction from coarse-grained material, sediment washing is retained for further evaluation.
4.3.6.2 Solvent Extraction
Solvent extraction involves the dissolution of contaminants from the sediment matrix; the
contaminant-bearing solvent is then recovered and treated.
Effectiveness
When the appropriate solvent is used, solvent extraction can effectively concentrate
contaminants into a residual byproduct waste stream for secondary treatment. However, multiple
4'74 400504 TAMS

extraction cycles are often required to achieve high removal efficiencies. The effectiveness of this
technology for treating PCB-contaminated sediments has been demonstrated at pilot scale, where
PCB removal efficiency up to 99.9 percent has been reported, and at full scale, where removal
efficiencies of greater than 98 percent have been reported.
Implementability
Solvent extraction is technically and administratively implementable, and appropriate
equipment and services are available from various vendors. However, the capacity of existing
equipment may not be sufficient to handle the potential volume of dredged sediments from the river
within a reasonable time frame. Existing full-scale continuous treatment systems can operate at rates
up to 10 tons per hour. One batch treatment system evaluated can be configured to treat varying soil
volumes (1 to 1,000 cubic yards per batch); however, the treatment time for each batch is not known.
Final disposal of different phases of contaminated materials such as sediments, solvent, and watercould present implementability and space problems in terms of handling and temporary storage.
Costs
The relative costs of this technology are variable and depend on the type of solvent and level
of contaminant in the sediments. In general, the costs can be classified as moderate to high compared
to other technologies. Costs for further treatment and/or ultimate disposal of the solvent containingPCBs may be incurred in addition to the solvent extraction costs noted above.
Conclusion
Because of its relatively widespread use and treatment effectiveness, solvent extraction is
retained for further evaluation. Reliable vendors of this technology are available, and the technology
has successfully treated materials containing PCBs at full scale on a limited basis.
ooUloUl
4-75 TAMS

4.3.6.3 Chemical Dechlorination
The BCD process was retained out of the two dechlorination options evaluated. It is partly
a thermal desorption process and partly a dechlorination process. Dechlorination reagents can besprayed on contaminated soil/sediment before it enters a thermal desorption unit to allow fordechlorination in the desorber, or the condensed liquids from the desorption process can bedechlorinated in a separate reactor.
Effectiveness
The BCD process is potentially effective in treating PCB-contaminated sediments. BCD, in
combination with thermal desorption, has been demonstrated at full scale to treat PCB-contaminated
soil to an average total PCB concentration of below 2 ppm from a high of near 3,000 ppm.
Implementability
Chemical dechlorination, with and without thermal desorption, is technically and
administratively implementable. However, the number of vendors offering this technology may be
limited. Furthermore, the capacity of existing equipment may not be sufficient to handle the
potential volume of dredged sediments from the Upper Hudson River within a reasonable time
frame. One existing BCD/thermal desorption system has a reported treatment rate of only about 20
tons per day. Additional treatment capacity may be available in the future if the need arises.
Costs
The relative costs of this technology depend on the sediment properties and volume to be
treated. In general, they can be classified as moderate to high compared to other technologies.
Conclusion
400506 TAMS
Dechlorination is effective and retained for further evaluation, most likely implemented incombination with thermal desorption; the combined process, also effective, is retained for evaluation.
4.3.6.4 Thermal Desorption
Thermal desorption involves application of heat at below-combustion temperatures, typically200 to 1,000° F, to volatilize water and organic contaminants. The vaporized organics are thenrecovered via condensation or carbon adsorption for additional treatment, i.e., dechlorination or
incineration in a high-temperature secondary combustion chamber.
Effectiveness
Thermal desorption can effectively separate PCBs from sediments for subsequent removal
of the contaminant. Thermal desorption has been demonstrated at pilot and full scale for treating
PCB-contaminated sediments, where PCB removal efficiency of more than 99 percent has been
reported.
Implementability
Thermal desorption is technically and administratively implementable, and the appropriate
equipment and services are available from various vendors. Existing commercially available, full-
scale systems can operate at rates up to 90 tons per hour. Depending on the water content of the
dredged material, sediment dewatering may be required prior to thermal desorption treatment. The
final treatment or disposal of desorbed PCBs would be required as part of this process. Thermaldesorption can be combined with dechlorination as described in the previous section.
Costs
The relative costs of this technology can be classified as moderate to high compared to other °\j\
technologies. Costs for further treatment and/or ultimate disposal of the desorbed PCBs would be o^incurred in addition to the thermal desorption costs.
4-77 - TAMS
Conclusion
Because of its relatively widespread use and treatment effectiveness, thermal desorption isretained for further evaluation. Reliable vendors of this technology are available.
4.3.6.5 Thermal Destruction
Thermal destruction is a controlled destruction process that uses high temperatures to destroy
hazardous contaminants in sediments.
Effectiveness
Thermal destruction can be very effective for treating PCB-contaminated sediments. Proper
operation, however, is essential to achieve the complete breakdown of PCBs and to avoid the
formation of incomplete combustion products. For incineration of TSCA-regulated PCB wastes, a
minimum destruction and removal efficiency (DRE) of 99.9999 percent is required.
Implementability
Implementability issues are similar to those of other technologies. Unit throughput, timeliness
of completing the treatment, and availability of sufficient capacity are important concerns. Various
mobile and transportable thermal destruction systems of different capacities, manufactured by a
number of firms, are widely available. The primary implementability issue for a near-river
incineration system as opposed to using existing incineration systems that are farther away is the
ability to obtain the necessary federal and state (TSCA) permits. Permitting is theoretically feasible
but numerous on-site incineration projects have experienced long delays, and local opposition to an
incinerator can significantly delay and possibly prevent issuance of a permit. Off-site contract
incineration would avoid permitting concerns but would require transporting the material. Four
TSCA incinerators are currently capable of treating PCB-contaminated sediments and are located
at various distances from the Hudson River PCBs site. Dewatering is required before any thermal
destruction treatment can be conducted. For near-river incineration, flue gases must be treated prior
4-78 TAMS400508

to discharge, and treatment of residual ash may be required prior to disposal. In accordance with
CERCLA Section 121(e)(l), federal, state, and local permits are not required for remedial actionsundertaken entirely on-site, including incineration, although an on-site incinerator would still need
to comply with substantive requirements of federal and state permitting laws.
Costs
Thermal destruction costs are moderate to very high compared to other technologies. The
high energy requirements and necessary emission controls inherent to thermal destruction processes,particularly incineration, are the primary contributors to the elevated costs. For disposal at an off-siteincinerator, significant transportation costs may be incurred in addition to treatment costs.
Conclusion
Near-river thermal destruction processes will be eliminated from further considerationbecause of potential permitting and public acceptance difficulties. Off-site incineration is eliminated
from further consideration because of prohibitively high costs compared to other off-site treatment
and disposal options.
4.3.6.6 Immobilization
Immobilization refers to a broad class of treatment processes that physically or chemicallyreduce the mobility of hazardous constituents in a contaminated material through the addition ofbinding agents.
Effectiveness
Immobilization, in particular solidification and stabilization, can potentially be effective for
treating PCB-contaminated sediments depending on the characteristics of the sediments and the typeH™
of binding agent used. Solidification/stabilization can also be implemented for water absorption in oui
dredged sediments for transport and landfill disposal. This technology is generally more effective °
4-79 TAMS

for immobilizing metal contamination but can also be effective for PCBs because of strong
adsorption characteristics of PCBs to soil and sediments. This technology does not destroy or remove
PCBs; consequently, determination of the effectiveness of solidification/stabilization requiresmeasurement by an appropriate extraction or leaching procedure. However, because of the tendencyof PCBs to adsorb to soil and sediment, typical leach test results may not show significantdifferences between the leachability of PCBs in the untreated and treated matrix.
Solidification/stabilization was used to treat PCB-contaminated soil at the Pepper Steel AlloySuperfund site. Soil containing PCBs at concentrations ranging from 1.4 to 760 ppm was treated
with cement and fly ash. Analysis of leachate from the solidified mass showed no PCBs at a
detection limit of 1 ppb.
Implementabiiity
Solidification/stabilization is technically and administratively implementable, and the
appropriate equipment and services are available from various vendors. Most binding agents and
additives are also widely available. However, treatability studies to determine the appropriate
amount and type of binding agent for effective PCB immobilization must be performed prior to full-
scale implementation. The volume and weight of treated material can increase significantly after
solidification/stabilization depending on the amount of binding agent used. Because PCBs are not
removed or destroyed, the solidified/stabilized material may still require disposal at a landfill.
Costs
The relative costs of this technology are variable and depend on sediment characteristics, the
type of binders and additives used, and the level of contaminant in the sediments. In general, the
costs can be classified as low to moderate compared to other treatment technologies.
Conclusion
4-80 400510 TAMS
Because solidification/stabilization using pozzolanic materials can effectively immobilize
PCBs in sediments, and because such treated sediments have a potential beneficial use as landfill
cover materials or as construction fill, this treatment technology will be retained for further
consideration in the development of remedial alternatives.
4.3.7 Beneficial Use
Beneficial use of dredged contaminated sediments includes two main options: using thedredged sediment in its original form, or treating the sediments to destroy the PCB contaminants andprocessing the treated material to create a useable commercial product. Both were retained after theinitial evaluation and screening.
4.3.7.1 Landfill Cover Material, Construction Fill, Mine Land Reclamation
Beneficial use options discussed in this section include using dredged sediments for solid
waste landfill cover, construction fill, and abandoned strip mine reclamation.
Effectiveness
Beneficial use options that involve the use of dredged sediment in its original form are
potentially effective methods for final disposal of dredged material. These beneficial use options
may be implemented with or without preprocessing or treatment to remove PCBs, although any
beneficial use must take into account the potential exposure of human health and environment to
PCBs in the dredged material.
Implementability
The beneficial use options evaluated are technically and administratively implementable.
The capacity available to accommodate these options may not be sufficient to handle the potential *•ovolume of dredged material unless smaller components of the total sediments are considered (e.g., ^
H»separated coarse-grained material) or the options are used in combination. Currently, the use of *-*
4-81 TAMS

dredged sediments as mine reclamation material is being evaluated in Pennsylvania. Pending
completion of ongoing groundwater monitoring, the Pennsylvania Bureau of Abandoned MineReclamation is not authorizing similar reclamation projects using dredged material. In addition,
dredged sediments with PCB concentrations greater than 4 ppm would not be accepted as abandonedmine reclamation material (Linanne, 1999).
Costs
For the beneficial use options evaluated, costs are variable and depend on degree ofpreprocessing or treatment required, transportation costs to the disposal destination, and potential
fee for disposal. These costs are estimated to be low compared to other disposal options.
Conclusion
Because of the potential beneficial use of dredged sediments as compared to disposal options
such as landfilling, these options are retained for further evaluation.
4.3.7.2 Manufacture of Commercial Products
The technologies evaluated in this section combine treatment processes to destroy organics
in the sediments with some further physical/chemical process to convert the decontaminated
sediment into a useable commercial product.
Effectiveness
Beneficial use options are potentially effective methods for final disposal of dredged material.
Beneficial use options that involve the manufacture of useable commercial products are particularly
effective because th'e treatment processes used are thermal processes that destroy organic
contaminants. All three options evaluated (i.e., production of cement, light weight aggregate, andglass tile) have been demonstrated at pilot scale and are in the process of being, or will be,
400512 TAMS

demonstrated at full scale in the immediate future as part of the New York/New Jersey Harbor
Decontamination Demonstration Project (see Table 4-13).
Implementability
These beneficial use options are technically and administratively implementable. Thetechnologies evaluated are process-specific and are only offered by certain vendors. Large-scaleequipment with high throughput rates are either being constructed or planned for all three beneficial
use options evaluated. As the products are manufactured, it is assumed that there will be potentialdemand and market for the products.
Costs
Costs of thermal treatment and manufacture of useable products varies widely and range from
low to very high depending primarily on the thermal process option used. A primary benefit of these
beneficial use options is that some of the processing costs may be recovered when the useable
products are sold commercially.
Conclusion
Because of the beneficial use options and the effectiveness in PCB removal and potential
recovery of processing costs from these useable product manufacturing options, they will be retainedfor further evaluation.
4.3.8 Disposal Technologies
Disposal technologies evaluated in Section 4.2 include land disposal and aquatic disposal.
Only land disposal, either at off-site landfills or "in upland or near-shore confined disposal facilities,
was retained after the initial screening.
Effectiveness
4-83 TAMS
enMUI

Land disposal options are potentially effective methods for final disposal of dredged material.
Off-site landfill facilities would be permitted to handle PCBs. Upland or near-shore CDFs must be
designed and constructed to meet regulatory requirements, including effluent discharge limits andgroundwater standards, for landfills in which PCB-contaminated materials will be disposed.
Implementability
Off-site landfill disposal is technically and administratively implementable. Several landfillshave been identified that can accept PCB sediments (both TSCA- and non-TSCA regulated material)
from the river and that have sufficient capacity for the potentially large volume of dredged material.
Sediments to be disposed of at an off-site landfill would likely require dewatering and/or
stabilization prior to being transported from the site.
Disposal in upland or near-shore CDFs is also technically implementable. However, siting
a location for a CDF in the vicinity of the Upper Hudson may not be administratively feasible given
local opposition to a dredged material disposal facility in this area and the need to obtain New York
State Hazardous Waste Facility Siting Board approval for a new facility in New York State that is
not within the Hudson River PCBs site. At the very least, administrative issues to obtain approval
and to construct a near-river CDF could significantly delay implementation of any remedial action
that includes this disposal option. In addition, given the volume of dredged material anticipated,
more than one disposal area could be required to provide sufficient capacity.
Costs
Costs for off-site landfill disposal are expected to be low for dredged sediments with PCB
concentrations less than 50 ppm and moderate for sediments with PCB concentrations greater than
50 ppm. Although TSCA regulates PCBs at concentrations greater than 50 ppm, most commercial
solid waste facilities impose a more stringent limit in order to provide them with a margin of safety,as discussed in subsection 4.2.9.1. Dewatering and transportation costs are additional costs that
would be incurred for off-site landfill disposal options. Costs for construction and disposal at upland
or near-shore CDFs are expected to be low.
4-84 400514 TAMS

Conclusion
Because of their effectiveness, off-site land disposal options will be retained for furtherevaluation. However, disposal in upland or near-shore CDFs will not be retained for further
evaluation because of the potential administrative infeasibility of such options.
4.3.9 Summary of Effectiveness, Implementability, and Cost Screening of Technologies
Based on the effectiveness, implementability, and cost screening performed as describedabove, the following remedial options have been retained for further evaluation:
• No Action
• Institutional Controls (monitoring and site use restrictions)
• Monitored Natural Attenuation
• Containment by capping
• Removal by excavation and dredging
• Ex situ treatment by sediment washing
• Ex situ treatment by solvent extraction
• Ex situ treatment by chemical dechlorination
• Ex situ treatment by thermal desorption
• Ex situ treatment by immobilization (Solidification/stabilization)
• Beneficial use (re-use and manufactured products)
• Off-site disposal (excluding CDFs and upland facilities)
Based on the effectiveness, implementability, and cost screening performed as describedabove, the following did not pass the screening and have not been retained for further evaluation:
• Containment by retaining dikes and berms ^o
• Ex situ treatment by thermal destruction (incineration) *j>i_i
• Off-site disposal in CDFs or upland facilities 01
• In situ treatment
4-85 TAMS

4.4 Selection of Representative Process Options
For various technologies screened in this chapter, there may be more than one process option
approach that may be applicable to the Hudson River remedial alternatives. Those process optionswill be identified and discussed as necessary for the development and screening of the alternativespresented in Chapter 5 and Chapter 6.
4'86 400516

Chapter 5
H10oo

5. DEVELOPMENT OF REMEDIAL ACTION ALTERNATIVES
In this chapter, categories of potential remedial alternatives for the contaminated sedimentsin the Upper Hudson River are developed by grouping the potential remedial technologies identified
in Chapter 4. These alternative categories are described in detail and specific remedial alternativeswithin each of these categories are developed for screening in Chapter 6. This development wasperformed based on an evaluation of alternative scenarios to narrow the field of potential alternatives
while preserving an appropriate range of options.
As stated in Section 3.2, the RAOs and PRGs determined for this FS are:
* Reduce the cancer risks and non-cancer health hazards for people eating fish from the River
by reducing the concentration of PCBs in fish. The risk-based PRO for protection of humanhealth is 0.05 mg/kg total PCBs in fish fillet based on the RME adult fish consumption rate
of one meal per week. Other target concentrations are 0.2 mg/kg total PCBs in fish fillet,which is protective at a fish consumption rate of about one meal per month, and 0.4 mg/kgtotal PCBs in fish fillet, which is protective of the average (CT) angler, who consumes about
one fish meal every two months. These targets of higher concentrations in fish representpoints at which fish consumption advisories might become less stringent (e.g., the "eat none"
advisory for the Upper Hudson could be relaxed) as conditions improve.
• Reduce risks to ecological receptors by reducing the concentration of PCBs in fish. The risk-
based PRO for the ecological exposure pathway is a range from 0.3 to 0.03 mg/kg total PCBs
in fish (whole fish), and is based on the LOAEL and NOAEL for consumption of whole fishby the river otter, an upper trophic level piscivorous mammal that was found to be at greatest
risk (TQ[LOAELorNOAEL]-DiET = !)• Consideration was also given-to use of TEQ-based NOAEL0.015 mg/kg dioxin-like PCBs as the PRO; however, use of this criterion requires congener-specific data that are not routinely available, and would not necessarily achieve greater
protection of wildlife. Furthermore, there is more uncertainty associated with the TEQ-based ^
NOAEL than with the PCB-based NOAEL. oH00
5-1 TAMS

• Reduce concentrations of PCBs in river (surface) water that are above ARARs. The surfacei
water ARARs are 1 x 1 Cr |ig/L (one part per quadrillion) total PCBs, the NYS ambient water —J-quality standard for protection of human consumers of fish; 1.2 x 10"4 1-lg/lU the NYSstandard for protection of wildlife; 1 x 10"3 }ig/L, the federal Ambient Water Quality iCriterion; 0.09 (J-g/L, the NYS standard for protection of human health and drinking watersources; and 0.5 [ig/L, the federal MCL. (
• Reduce the inventory (mass) of PCBs in sediment that are or may be bioavailable. !:
f.
• Minimize the long-term downstream transport of PCBs in the river. fc:
K-
In order to meet these objectives, this FS considers various containment, removal, treatment,and disposal options for remediation of contaminated sediments in three sections of the Upper I-Hudson River. The three river sections, as defined in subsection 1.2.1, are:
• Section 1: the TI Pool; _
• Section 2: the TI Dam to the Northumberland Dam; and
• Section 3: below the Northumberland Dam to the Federal Dam.
The contaminants of concern in both sediments and surface water are PCBs.
The primary sources of the PCB contamination in the Upper Hudson River are the historicaldischarges from the GE facilities in Fort Edward and Hudson Falls, New York. Chapter 1 contains ;;r.a summary of site history and contains a review of historical sources of PCBs. During the past 50years, these PCBs have adhered to the sediments, and these sediments now serve as the dominant !"source of PCB contamination for the water column and biota. Benthic organisms are directly
exposed to the PCB-contaminated sediments of the Hudson River, thus introducing PCBs into the
food chain. PCBs in the sediments also contribute to PCB concentrations in the water columnthrough exchange and movement of sediments, leading to bioaccumulation through water columnfood chain pathways.
400519

The processes that determine the fate of PCBs in the Upper Hudson River may be divided
into two categories: (1) transport; and (2) transfer and reaction. Transport is the physical movement
of PCBs caused by the net advective movement of water, mixing, resuspension, deposition, and bed-
load transport of solids to which PCBs are adsorbed. Transport is dependent on the flow anddispersion characteristics in the water column and the settling velocity and resuspension rate of thesolid particles. Downstream transport for the Hudson River PCBs site refers to the migration of
PCBs beyond the Federal Dam at Troy to the Lower Hudson River. Transfer and reaction includemovement of PCBs between the water and solid phases of the system, and biological (orbiochemical) transformation or degradation of the PCBs. The processes involved in transfer andreaction include adsorption, dechlorination, bioturbation, and biodegradation. The extent to whicheach of these processes occur varies in different portions of the River at different points in time.PCBs are present in the Upper Hudson River in three phases that interact with each other: freelydissolved; sorbed to particulate matter or solids; and complexed with dissolved (or colloidal) organic
matter.
-«vIn addition to exchanging PCBs with the water column, contaminated sediments within the
Hudson River may move as a result of scour and deposition processes. Sediments and sediment-associated PCBs migrate downstream via both suspended load and bed-load transport. Bed-loadtransport represents particles that roll or bounce along the river bottom without being brought intoresuspension. Since these particles are not transported into the water column, they have no effecton the suspended sediment concentration. However, the effects of bed-load transport are significant
in that this transport may change the thickness of the sediment bed and the spatial distribution ofPCBs in the river. Bed-load movement of PCB-contaminated sediments may also increase the rate
of desorption of PCBs from the transported sediments into the water column.
This FS considers alternatives that can be typically categorized as both source control and
E ? management of migration alternatives. Source control alternatives generally consist of remediali actions that prevent or minimize risks by controlling the source of the contamination at_or near the
area where the hazardous substances were originally located. Management of migration alternativesrf*
I/*""*"'" generally prevent or minimize risks due to the migration of the hazardous substances away from the °I . uisource. The categories of remedial alternatives developed for sediments are presented in Section 5.1. tooI Alternative development criteria and applicable guidelines are also presented in Section 5.1. Thet..- ' ".
5-3 TAMS

detailed description of these categories of remedial alternatives is presented in Section 5.2, and a listof candidate alternatives for screening (within these alternative categories) is provided in Section 5.3.
The alternatives developed and screened in this FS are conceptual. Any characteristics of
these alternatives, e.g., remediation target area boundaries, staging and pretreatment locations, andremoval depths and rates, should be considered to be approximate. Specific details would befinalized during remedial design, as appropriate, based on the Record of Decision (ROD).
5.1 Remedial Alternative Development
The criteria for developing alternatives and the subsequent identification of potentialremedial alternatives for the Hudson River PCBs site are presented below.
5.1.1 Alternative Development Criteria
Alternative development must conform to the requirements of CERCLA and, to the
maximum extent practicable, the NCP. CERCLA Section 121(d) requires that Superfund remedial
actions comply with federal and state ARARs, or justify a waiver. Superfund remedial actions mustalso attain state requirements that are more stringent than federal requirements to the extent that they
are also applicable or relevant and appropriate and are identified to USEPA in a timely manner.
CERCLA Section 121 (b) identifies the following statutory preferences that must beconsidered in the development and evaluation of remedial alternatives:
* Remedial actions that involve treatment that permanently and significantly reduces the
volume, toxicity, or mobility of the hazardous substances through treatment are preferredover remedial actions not involving such treatment.
• Off-site transport and disposal of hazardous substances or contaminated materials withouttreatment is considered the least favorable remedial alternative when practicable treatmenttechnologies are available.
5-4 400521

• Remedial actions using permanent solutions, alternative treatment technologies, or resource
recovery technologies that, in whole or in part, will result in a permanent and significant
decrease in toxicity, mobility, or volume of a hazardous substance are preferred.
Based on these statutory preferences and the RAOs developed in Chapter 3, remedial
alternatives were developed to meet the following criteria:
• The remedial alternative is protective of human health and the environment.
• The remedial alternative attains chemical-specific ARARs (unless a waiver is justified) andcan be implemented in a manner consistent with location-specific and action-specific
ARARs.
• The remedial alternative uses permanent solutions and alternative treatment technologies to
the maximum extent practicable.
• The alternatives developed are capable of achieving the remedial action objectives (RAOs)in a cost-effective manner.
USEPA's RI/FS Guidance (USEPA, 1988) and the NCP state that the treatment alternativesshould range from an alternative that, to the degree possible, would eliminate the need for long-term
management (including monitoring) at the site to other alternatives that treat the principal threatsposed by hazardous substances at a site but that vary in the degree of treatment employed and thequantities and characteristics of the treatment residuals and untreated waste that must be managed.This guidance and the NCP require that a containment option involving little or no treatment, as wellas a no action alternative, should be developed.
- Source control alternatives primarily address situations in which hazardous substancesremain at or near the areas where they were originally located and are not adequately contained to gprevent migration into the environment. The purpose of source control remedies is to prevent or to
tominimize the migration of hazardous substances from the source material. These remedies seek to
remove, stabilize, or contain the hazardous substances, and are primarily applied in .-cases where
5-5 JAMS

contaminants are present at significant concentrations in the surface sediments. Hence, sourcecontrol alternatives have been developed for the Upper Hudson River surface sediments in the threeriver sections.
For the Upper Hudson River, these remedial alternatives can also be categorized asmanagement of migration actions in that they will eliminate or reduce the migration of PCBs fromthe- Upper Hudson River sediments to other areas of the Upper Hudson River or downstream.
These remedial alternatives have been conceptually designed to prevent or minimize potential
short-term and long-term disruptions of recreational and commercial navigation, as well as riverfrontaccess to private and public properties, as they currently exist in the Upper Hudson River. Thesepotential remedial alternatives have also been designed to restore and monitor benthic and fishhabitat in areas where short-term impacts to such habitat due to containment or removal actions are
unavoidable in order to meet the RAOs.
5.1.2 Combination of Potentially Applicable Remedial Technologies into RemedialAlternatives
The potentially applicable technologies remaining after the initial screening in subsection
4.3.9 have been combined into a number of remedial alternative (general response action) categories,as follows:
Alternative Category 1: No Action
Alternative Category 2: Monitored Natural AttenuationAlternative Category 3: Containment (Capping) of Target Areas and Monitored
Natural AttenuationAlternative Category 4: Removal (Dredging) of Target Areas and Monitored Natural
AttenuationAlternative Category 5: Combined Capping and Dredging of Target Areas and
Monitored Natural Attenuation
5-6 400523 TAMS
Alternative Categories 1 and 2 do not include any containment, removal, disposal, ortreatment of contaminated sediments. Alternative Category 1 does not assume any source controlin the vicinity of the GE Hudson Falls facility (implemented under a separate NTCRA), nor does it
include continuation of the current institutional controls such as fish consumption advisories;
Alternative Category 1 involves only the five-year reviews required by CERCLA Section 121(c).
Alternative Category 2 assumes the separate source control NTCRA in the vicinity of the GE HudsonFalls facility, and includes the continuation of the current institutional controls such as the New YorkState fish consumption advisories. It also involves monitoring and the five-year reviews requiredby CERCLA Section 121(c). Alternative Category 2 may also include new (additional) institutionalcontrols. Alternative Categories 3, 4 and 5 all assume the separate source control NTCRA in thevicinity of the GE Hudson Falls facility.
The containment alternatives (containment only, Alternative Category 3, and capping
combined with dredging, Alternative Category 5) include placement of an engineered cap and fill
suitable for benthic and fish habitat. The removal alternatives (Alternative Categories 4 and 5)include several post-removal option categories for handling of the removed sediments. The removalalternatives also include placement of backfill in target areas from which the sediments are removed.The functions of the backfill material are to isolate any residual PCS contamination in surfacesediments and to provide a substrate suitable for benthic and fish habitat.
For the combined capping with dredging alternatives (Alternative Category 5), sedimentswould be removed from some target areas and an engineered cap would be placed over areas fromwhich sediments are removed, as well as over other target areas. The exceptions with regard toplacement of an engineered cap are the channel and very shallow areas, which would not be capped.Definition of "shallow areas" is found in Section 5.2 as part of the discussion concerning detailed
development of alternatives. For the combined capping with dredging alternatives, sediments wouldonly be removed from target areas to be capped to the extent necessary to maintain existing waterdepths in the river suitable for recreational and commercial navigation. In addition, backfill wouldbe placed in target areas from which the sediments are removed or contained. The functions of the rf*obackfill material placed over the cap are to provide a buffer layer for erosion protection, to prevent ^
tobioturbation of the cap material, and to provide substrate suitable for benthic and fish habitat. *•
5-7 TAMS

Alternative Categories 3, 4, and 5 also include continuation of the current institutionalcontrols such as the New York State fish consumption advisories and expected improvement in the
upstream water quality (and measured PCB fish concentrations) due to ongoing remedial work inHudson Falls and Fort Edward.
The post-removal option categories for the removed sediment (Alternative Categories 4 and5) are as follows:
A. Off-site Containment/Disposal of Removed Sediments;
B. Near-river Ex Situ Treatment of Removed Sediments followed by Off-site Containment/Disposal of Treated Sediments;
C. Off-site Ex Situ Treatment of Removed Sediments followed by Off-site Containment/
Disposal of Treated Sediments;
D. Abandoned Mine Reclamation/Landfill Cover/Construction Fill;
E. Near-river Ex Situ Treatment of Removed Sediments followed by Abandoned Mine
Reclamation/Landfill Cover/Construction Fill;
F. Off-site Ex Situ Treatment of Removed Sediments followed by Abandoned MineReclamation/Landfill Cover/Construction Fill;
G. Near-river Ex Situ Treatment of Removed Sediments followed by Manufacture ofCommercial Products from Treated Removed Sediments; and
H. Off-site Ex Situ Treatment of Removed Sediments followed by Manufacture of CommercialProducts from Treated Removed Sediments.
All of the above post-removal handling option categories require dewatering of the
sediments. They also include suitable treatment of the water (primarily filtration with polishing by
5-8 400525 TAMS

granular activated carbon [GAC] adsorption) to meet NYS Pollution Discharge Elimination System
(NYSPDES) discharge requirements before being discharged into the river. Option Category A
includes containment/disposal of the removed sediments in an industrial (RCRA Subtitle D) orTSCA-permitted landfill, depending on the concentration of total PCBs in the bulk dewatered
sediments. Option Categories B and C are similar except for the location where the ex situ treatment
(stabilization) is performed. Option Category D is a form of low-value beneficial use of the removedsediments without the need for any ex situ treatment (stabilization). This option category is likely
suitable for sediments with relatively low concentrations of total PCBs (typically < 4 or < lOmg/kgdepending on the application and local site-specific requirements).
Option Categories E and F are applicable to sediments with similar concentrations of totalPCBs (typically < 4 or < 10 mg/kg) that require some ex situ treatment (stabilization) to improve thehandling and disposal characteristics of the dredged sediments prior to the low-value beneficial use.
They are similar except for the location where the ex situ treatment is performed. Option Categories
G and H are quite different from options A through F because the PCBs are removed by thermaldesorption, plasma arc vitrification, or surfactant washing and chemical treatment, and the sediments(clays, silts, and sands) are converted into higher value, useful commercial products such as
architectural tiles, fiberglass, cement, light-weight aggregate, or manufactured soils. OptionCategories G and H are designed to allow unrestricted use of these products because they no longer
contain PCBs; the categories are similar to each other except for the location where the ex situtreatment is performed.
Near-river ex situ treatment is preferable (if feasible) because it is likely to be more cost-effective due to lower transportation costs. Therefore, Option Categories B and E are preferable to
Option Categories C and F. Stabilization typically results in a product with an increased weight andvolume. Although other treatment processes such as sediment washing with surfactants and other
additives, thermal desorption, vitrification, solvent extraction, and chemical dechlorination are moreeffective than stabilization, they are also relatively more expensive. Also, stabilization may help toimprove the handling and disposal characteristics of the removed sediments. In addition to °
Cnpermanently reducing the toxicity and volume of PCBs in sediments, the choice of thermal too\
desorption, plasma arc vitrification, or surfactant washing treatment may be justifiable when the
5-9 TAMS
sediments are used for the manufacture of higher value commercial products instead of being sent
to a landfill.
Abandoned mine reclamation in Pennsylvania coal mines using sediments from the NewYork/New Jersey harbor containing less than 4 mg/kg of total PCBs is currently being evaluated ina large-scale pilot study, and future use of this option is pending. Sediments with 4 to 10 mg/kg oftotal PCBs (depending oh the application and local site-specific requirements) are considered to besuitable for use as landfill cover or construction fill material.
Based on the discussion above, stabilization is the only form of near-river ex situ treatmentthat may be required (to improve handling and disposal characteristics) prior to off-site containment/disposal in a landfill or low-value beneficial use. As explained later in subsection 5.2.5.1, the costof transportation and disposal at a non-TSCA landfill is approximately $50 per ton, and the cost oftransportation and disposal at a TSCA landfill is approximately $100 per ton. The cost ofstabilization is approximately $19 per ton, whereas the costs of the other treatment processes -thermal desorption, plasma arc vitrification, or surfactant washing and chemical treatment - are $ 100per ton or higher. Therefore, the use of other ex situ treatment processes described above is not cost-effective or justifiable if the treated sediments are eventually sent to a landfill or used as construction
fill material. Thus, near-river ex situ treatment for Option Categories B, C, E, and F refers to
stabilization. On the other hand, for the manufacture of higher value commercial products, treatmentprocesses like thermal desorption, plasma are vitrification, or surfactant washing and chemicaltreatment are necessary to remove the PCBs from the sediments. Therefore, Option Categories G
and H refer to these ex situ treatment processes and not to stabilization.
Due to additional materials handling and transportation steps, Option Categories C, F, andH, which involve off-site treatment, are likely to be relatively more expensive to implement thanOption Categories B, E, and G, which involve treatment near the river. However, Option CategoryH may be preferable to Option Category G in many instances because of the ease of performing allthe processing steps necessary to manufacture the commercial product at the same location, thusminimizing requirements for additional loading and unloading of the removed sediments. Similarly,
Option Categories B and E, which include treatment (i.e., stabilization), will be relatively moreexpensive to implement than Option Categories A and D, which do not include treatment; however,
5-'° 400527

Option Categories B and E may be preferable in many instances in spite of the.slightly higher
transportation costs because of the improvement in the handling and disposal characteristics of the
removed sediments.
If mechanical dredging is performed, Option Categories C and F are not selected because
near-river ex situ stabilization is required before the sediments are transported. Option Category Gis not selected because it requires additional loading and unloading of large quantities of sediments
prior to the manufacture of commercial products. Therefore, Option Categories B and E are selectedif mechanical dredging is performed, due to the need to stabilize the sediments for transportation todisposal. On the other hand, Option Categories A and D are selected if hydraulic dredging isperformed, since stabilization is assumed to be unnecessary following hydraulic dredging. Basedon the foregoing comparisons, therefore, only Option Categories A, B, D, E, and H will be retained
for further consideration in the development and screening of alternatives in this FS.
As described in subsection 4.2.4.1, there are practical limits to the application of engineered
capping to the Upper Hudson River due to its geometry (water depths) and navigational needs.Large tracts of the river contain fairly shallow shoal areas, in many places bordered by permanent
or seasonal homes with waterfront access. In these areas, installation of an engineered cap of anysignificant thickness could move the shoreline as much as 20 to 50 feet toward the channel, changing
both the character of the waterfront and the hydraulic features of the shoals. Thus, in-river cappingin shallow shoal areas (water depth less than 6 feet) may be impractical unless removal of anequivalent thickness of sediment has been accomplished first. Capping is also inappropriate in the
channel of the Champlain Canal, for which a navigational draft of 12 feet must be maintained, as thismay require navigational dredging. Further, based on the preliminary modeling for the containment-only scenario described in Appendix D, Alternative Category 3 (Containment of Targeted Areas and
Monitored Natural Attenuation) is not effective in meeting the RAOs and PRGs. Therefore,Alternative Category 3 is eliminated from further consideration in the development of remedialalternatives in this FS. •
ooentooo
5-11 TAMS

5.2 Concepts for Application of Technologies in Remedial Alternatives
This section of the FS develops concepts for application of technologies in remedialalternatives. A wide range of technologies have been evaluated in Chapter 4 for their applicability
to remediating Upper Hudson contaminated sediments. For reasons detailed in Chapter 4, many ofthose technologies were screened out, while several have been retained for further evaluation. Based
on-the previous screening, the remaining technologies will be presented here as components ofremedial categories that will, in turn, form the basis of specific remedies for the Upper Hudson. Thetechnologies that will be addressed in this section are as follows:
• No Action;• Institutional Controls;
• Monitored Natural Attenuation (MNA);
• Removal of targeted sediments by mechanical dredging methods;
• Removal of targeted sediments by hydraulic dredging methods;
• Capping of targeted sediments with dredging;• Site restoration; and
• Monitoring.
5.2.1 No Action, Institutional Controls, Monitored Natural Attenuation (MNA)
As detailed in Chapter 4, No Action, Institutional Controls, and MNA do not involve activeremediation of contaminated sediments. No Action consists of refraining from active application
of any remedial technology to the Hudson River PCBs site. Under No Action there is no sourcecontrol of contaminants entering the river at Hudson Falls, no monitoring of environmental media,
and no institutional controls.
Institutional controls are non-engineering, administrative, or legal controls intended toprevent or reduce human exposure to hazardous substances. This includes monitoring ofenvironmental media as well as site use restrictions such as fish consumption advisories and bans.Institutional controls do not comprise an independent technology category but, rather, will becomea component of all other alternative categories except No Action.
5-12 . TAMS400529

MNA refers to a reduction in sediment contaminant mass and toxicity by naturally occurring
biological, chemical, and physical processes as described in subsection 4.2.2 In addition,
incorporated within MNA are extensive site monitoring and modeling to demonstrate thatcontaminant reduction is, in fact, occurring. Finally, both institutional controls and the assumption
of a separate source control NTCRA in the vicinity of the GE Hudson Falls plant are elements ofMNA. MNA will be a component of all active remedies described below.
5.2.2 Removal of Targeted Sediments by Mechanical Dredging Methods
For purposes of describing a remedy that includes mechanical dredging, it is assumed thatthe remedial work will be implemented over a five- to seven-year construction period. This durationreflects the magnitude of the program that would need to be accomplished given the volume oftargeted sediments (Chapter 3). Knowing the quantity of targeted sediment and the construction
duration, it becomes possible to identify the type and scale of systems and facilities that will beincorporated into a mechanical dredging scenario.
This subsection describes, in general terms, the equipment and physical plant that would beneeded to mechanically remove, process, and dispose of targeted Hudson River sediments. Actual
implementation of an active remedy, however, would not be limited by the equipment and systems
described below. Project designs or construction plans may identify alternative means and methodsto conduct any particular program. For purposes of this evaluation, mechanical removal of
contaminated sediments is considered to involve the following principal steps:
• Dredging targeted sediments;
• Transporting or conveying sediments to a transfer facility;• Processing dredged sediments; and• Transporting processed sediments off-site.
OOIftU)O
5-13 JAMS

5.2.2.1 Mechanical Dredging Technology
As a result of the evaluation presented in Chapter 4, several types of mechanical dredges
were retained for further evaluation. These include bucket-on-rope systems and hydraulicallyactuated excavators. Of these, a dredging system based on the hydraulic excavator, fitted withappropriate auxiliary equipment, appears to be most applicable to Upper Hudson conditions:
• Excavators generate sufficient digging force to remove both cohesive and non-cohesive river
sediments;• These units are less prone to debris-induced equipment breakdowns;• Auxiliary equipment, in a wide range of capacities and reaches, can be fitted to the machines;• Excavators can be installed on floating platforms with drafts that are compatible with
available water depths at target sediment locations;
• Productivity of these machines is relatively high under conditions likely to be encountered
during remedial work; and• Relatively precise excavator positioning is possible using electronic sensors and digital
positioning systems. ,
Auxiliary equipment that can be fitted to excavators include hydraulically actuated
mechanical arms (boom and stick) with sufficient reach to access targeted sediments. In addition,the auxiliary equipment includes hydraulically actuated buckets with capacities compatible withproject productivity requirements and in-river working constraints. As described further below, itis expected that the mechanical dredges used on the Upper Hudson will be equipped with state-of-
the-art components to limit sediment resuspension and to enable real-time assessment of equipmentposition and removal status.
Each excavator will be positioned on a floating platform (for example, deck barge or flexi-float) so that it can be towed to the actual work area and then maneuvered, as necessary, during
removal operations. The platform-mounted excavator must maintain a draft that is compatible withwater depth limitations imposed by the in-river location of targeted sediments. As removal
operations proceed, sediments will be placed either into hopper barges (where water depths areadequate) or onto deck barges (in shallow areas) that have been configured for sediment handling.
5'14 400531 TAMS

Barges will be filled to planned limits and towed to one of several waterfront transfer facilities where
the sediments will be off-loaded.
Recent innovations to mechanical dredging systems are expected to reduce sedimentresuspension and allow more precise removal of targeted material. Several of these developments
are listed below:
• Enclosures have been added to both clamshell and backhoe buckets to limit spillage duringsediment removal;
• Relief valves or vents have been added to clamshell buckets to limit the hydraulic force
exerted by the downward descending bucket and, as well, to improve sediment removalefficiency;
• The cutting profile of clamshells has been substantially modified to enable efficient removal
operations when taking shallow sediment cuts;• Modified cutting profiles also reduce suction forces on sediments as the bucket is lifted;
• Addition of on-board computers tied to various digital positioning systems allow preciseremoval of targeted sediments and automated, real-time documentation of removal results;and
• Instrumenting the excavator unit and its auxiliary equipment provides operators with status
information including completion of bucket closure.
This FS Report is not intended to specify the precise equipment and systems to be used forremediation of the Upper Hudson, which would be determined during remedial design. Rather, the
goal here is to present concepts at a sufficient level of detail so that alternative-specificimplementability can be evaluated and costs can be estimated. In order to accomplish this objective
it is necessary to make assumptions as to equipment and systems. With regard to mechanicaldredging equipment, excavators outfitted with auxiliaries such as the profiling grab developed byBoskalis Dolman (Netherlands) appear to'incorporate most of the relevant technical innovations that
have occurred in recent years. The profiling grab was developed for removal of contaminated oen
sediments in shallow cuts and has recently been demonstrated at the New Bedford Harbor Superfund ^j
site. Also, the system of which the profiling grab is a component has been planned with a complete
instrumentation package for positioning and operational control. Thus, the analysis that follows
5-15 TAMS
assumes that mechanical dredging equipment similar to that demonstrated at New Bedford Harbor
will be used.
Several American and international equipment manufacturers were contacted to gather
information on their approaches to riverine dredging operations. At least one domestic manufacturer
indicated interest in developing an environmental bucket for remedial work. In fact, it is anticipated
that both American and international suppliers will continue to make improvements to their
equipment in reaction to changing conditions at both remedial and navigational dredging sites.Given the continuing development of new systems and equipment, and the scale of effort represented
by sediment projects such as the Hudson River PCBs site, it is anticipated that further equipment
innovation will occur over the next several years.
In addition to equipment-specific features, several other aspects of removal operations are
worth noting, particularly in regard to sediment resuspension. Hydraulic actuated excavators, when
unconstrained by concerns over sediment resuspension, can operate at cycle times of one minute orless (recently a large backhoe dredging within the Kill Van Kull in New York Harbor was observed
operating on a 70 second cycle in 30 to 40 feet of water). It is expected that, as cycle time is
extended, sediment resuspension will be reduced. Therefore, to some extent, the release rate of
sediments is under control of the equipment operator; this is particularly the case where the
equipment has, at the outset, been designed to be low-impacting. Thus, sediment resuspension may
be limited, in part, by specifying equipment speed or cycle time; the downside of this approach is
that productivity suffers as cycle times are lengthened. Appendix E contains a technicalmemorandum on the subject of resuspension during dredging operations.
Finally, it is expected that removal work will be conducted, to the maximum extent
practicable, within an enclosure consisting of a combination of various types of turbidity barriers.
The enclosure system will reduce river current speeds within work areas and will limit downstream
migration of those sediments that become waterborne. The enclosure system will be deployed eachtime dredging activity is initiated at a new work area and then re-deployed as work proceeds along
the contractor's pre-established dredging pattern. It is not expected, however, that turbidity barrierscan be deployed within the navigation channel of the Upper Hudson. Appendix E contains a
technical memorandum addressing .turbidity barriers.
5'16 400533 TAMS

5.2.2.2 Mechanical Dredging Equipment Capacity
An array of mechanical dredging equipment, configured to meet limitations imposed by site
conditions, will be required to remove Upper Hudson River contaminated sediments. Of particular
importance in this regard is the water depth available for the dredging equipment to access targeted
work areas. Hydraulically actuated excavators and the associated auxiliary equipment (boom, stick,
bucket, etc.) are fabricated in a range of sizes, capacities, weights, and working reaches. Equipment
combinations selected for any particular project reflect all the particulars of the job; however, there
are important constraints on the possible equipment combinations that can be fashioned due tovarious physical limitations.
In order to provide an overview of sediment removal equipment and operations, it is
necessary to establish some general parameters so that one potential set of equipment and facilities
can be analyzed. Since available draft (water depth) is such a significant constraint on sediment
removal operations, water depth at target material locations is used here as the basis for identifying
equipment capacities, which in turn drive removal productivity. In particular, the selection of
equipment will be based on the following general work area characteristics:
• Work areas with sufficient water depth to enable use of somewhat larger, higher productivity,equipment;
• Work areas with water depths that require use of relatively shallow draft, lower productivity,equipment; and
• Near shore and extremely shallow areas where specialty systems are required.
One general objective in delineating work areas for deeper draft and shallower draft
equipment is to avoid selection of equipment packages that have only limited applicability to Upper
Hudson conditions. For instance, while there may be some logic in selecting the largest capacity unitto maximize productivity, in-river access limitations inherent to such equipment can marginalize its
overall value. Thus, based on a review of available bathymetric maps and maps of target material •*' f>
locations, as well as an analysis of the range of potentially available excavator equipment packages, mW
a relatively larger, higher productivity equipment package has been selected that is capable of *"performing in areas with as little as five feet of water. -•;
5-17 TAMS

For areas that provide less than five feet of water, it is necessary to select an alternative
equipment package that can remove a significant fraction, if not all, of the remaining target material.Therefore, based on a review of available river data and an analysis of potential equipment, a
package has been selected that can conduct removal operations in three feet of water. The principaldifference between the two equipment packages is that the lighter package incorporates a smallerhydraulic excavator and a lower capacity bucket.
Deeper Draft Equipment
This equipment package will utilize an excavator fitted with a 4-cubic-yard environmentalbucket. The selected machine will be configured to have a 30-foot effective working reach and isexpected to maintain an operating cycle of 120 seconds. The alternative-specific productivityanalysis presented in Appendix E is based on this system's being used to remove targeted sediments
that are within its effective working reach and where there is at least 5 feet of water under post-
dredging conditions. The excavator will discharge sediments into a hopper barge that is expectedto draw 5 feet of water when loaded with 400 tons of sediment and 8 feet when loaded at 1,000 tons.
While it is expected that the higher productivity machine will draw approximately 5 feet of
water when mounted on a floating platform, it is not expected that the hopper barge into whichdredged material is discharged can be fully loaded in 5 feet of water (hopper barges loaded withabout 1,500 to 1,800 tons of cargo have historically transited the Champlain Canal). Thus it will be
necessary to plan the work so that full loading of hopper barges can be achieved as often as possible.The alternative-specific productivity analysis assumes that, on average, hopper barges will be loaded
with 1,000 tons of cargo. Appendix E contains alternative-specific productivity calculations.
Once a hopper barge has been loaded, it will be towed from the work area to the transfer andprocessing facilities established at the northern or southern limits of the site. Transit through the
Champlain Canal places a number of constraints (e.g., draft, length, width, overhead clearance) onthe scale of equipment that can be used for remediating Upper Hudson sediments. While nominallythe canal system can pass vessels drawing 12 feet of water, less draft is actually available sincenavigational dredging over the last 20 years has been limited to uncontaminated sediments at the
5-18 400535 TAMS
confluence of the Hoosic River. Dredging the Champlain Canal's navigation channel to enable
passage of loaded barges (1,000 tons of sediment) is a component of each active remedial alternative.
r1 Shallow Draft Equipment
A lower productivity equipment package has been identified that can perform the bulk of
remaining removal work, i.e., that which cannot be handled by the selected higher productivity,deeper draft equipment. An excavator with a 30-foot effective working reach and a 2-cubic-yard
environmental bucket has been selected for this purpose. This dredge would operate in three feetof water. In addition, it is assumed that the machine will discharge sediments into either a hopperbarge or a suitably configured deck barge. Each storage barge would be loaded with up to 200 tonsof cargo and would draw about 4 feet of water. The working cycle for this equipment package isexpected to be 120 seconds, on average, which is comparable to that of the equipment working in
deeper waters.
The alternative-specific productivity analysis presented in Appendix E assumes that the lower
productivity package will remove most of the targeted sediments in areas shoreward of the defined
working limits for the higher productivity system. It is assumed for conceptual purposes that all
loaded barges will be towed to a transfer and processing facility established adj acent to River Section1. (The southern transfer facility is assumed to be used only for the larger loads generated by the
deeper draft dredging.) It has been assumed that no additional material beyond the initial 2,000 tonswould be loaded into these barges in order to generate a more economic load. Given the draft of
these lightly loaded barges, there will not be substantial limitations on their accessing a transfer andprocessing facility.
Specialty Equipment
In limited areas, where application of the equipment previously described would not be
optimal, it may be necessary to consider use of any one of a number of specialty dredges such as the ^o
amphibious excavator or the long reach Ham Visor Grab. These specialty devices are able to ofunction at locations that have little or no available water and are, consequently, out of reach of £Jconventional dredging systems. As described in subsection 4.2.6.2, amphibious excavators employ
5-19 TAMS

pontoons and other means to move through mucky soils/sediments and are able to remove
contaminants either in a mechanical mode or hydraulically. The Visor Grab employs a low-capacity,enclosing backhoe bucket (less than two cubic yards) that is mounted on a long-reach excavatorsystem to remove near-shore sediments. Productivity achieved by these machines is expected to belower than that attained by more conventional dredging equipment.
For purposes of the cost evaluation presented in this FS, it is assumed that the work thatwould optimally be performed by a specialty dredge is instead conducted by the shallow draftmechanical dredge previously described. Since that equipment package is not optimum for work inareas where the specialty equipment would best be deployed, a penalty has been assigned to accountfor the loss of efficiency that is likely to result. The penalty consists of extending the operating cycletime for the shallow draft equipment to three minutes from the expected two minutes. For purposesof the analysis presented here, the three-minute operating cycle will apply to all work conducted bythe shallow draft equipment.
5.2.2.3 Productivity Analysis (Mechanical Dredges)
In general, the overall rate at which contaminated sediments must be removed to maintaina particular schedule depends on a number of project-specific considerations including the following:
• Volume and depth of targeted material;• Targeted construction time frame of five to seven years; and
• Seasonal working limits (May through November) due to operation of locks in the canalsystem. . .
In the case of mechanical dredging systems, the following were the principal factors used tocompute short-term productivity and equipment requirements for implementing removal alternatives:
• Removal work will occur 30 weeks each year and 6 days per week with about 75 hours ofproductive dredging each week;
• Remaining time is available for equipment relocation, set-up, and maintenance;• Equipment .working in deeper areas will maintain a 2-minute working cycle;
5-20 TAMS400537

• Equipment working in shallow areas will maintain a 3-minute working cycle;
• Each bucket load will consist of 80 percent target material and 20 percent additional water;
and• A 15 percent efficiency penalty is imposed to account for an overlap between adjacent
sediment removal cuts.
Since it has been assumed that two different equipment packages will be employed to carryout removal operations, it is necessary to establish the fraction of target materials that will behandled by each system. This has been accomplished on an alternative-specific basis and themethodology is further detailed in Appendix E. Once the volume that will be handled by eachequipment package is known, it becomes possible to determine daily and hourly production rates(e.g., cubic yards removal per day or per hour) as well as the number of dredges, tow boats, andbarges that would be needed to implement an alternative.
Daily and hourly production rates are of particular importance to the analysis presented here
since these two parameters have a significant influence on the scale of processing equipment thatmust be provided at each waterfront transfer facility. In addition, daily production will also impact
the transportation system that must be configured to haul stabilized sediments to final disposal
locations (landfills, beneficial use facilities, etc.).
5.2.2.4 Transfer Facilities (Mechanical Dredging)
Mechanically dredged sediments will be transported via hopper or deck barges to a waterfronttransfer facility where they will be off-loaded, processed, and placed into rail cars, for off-sitedisposal. A preferred location for the transfer facility is one that is already being used for suchoperations and, therefore, has existing wharf facilities at which barges can be secured and unloaded.
In addition, a transfer facility needs to have good rail access. It is expected that such locations canbe found in the greater Albany area where a number of riverside materials handling terminals, with
existing wharf facilities and good rail access, already exist. Therefore, the analysis presented herein ^o
is predicated on the use of the Albany area waterfront for sediment transfer and processing ooperations. oo
5-21 ' TAMS
In addition to establishing waterfront operations in the Albany area, it would be desirable tolocate a transfer and processing facility at the northern limits of the work area so as to reduce in-rivertransportation requirements. Since there are essentially no waterfront materials handling operationswithin River Section 1 or 2, it will be necessary to assume that a location can be found where a
temporary facility can be constructed. Characteristics of a suitable location include adequate riverfrontage for supporting barge operations, sufficient land for materials processing and storage, and
access to rail facilities. For purposes of the analysis presented here, it is also assumed that a suitabletransfer and processing location can be found adjacent to River Section 1. Figure 5-1 is a conceptualsketch of a transfer facility identifying the principal facilities that would need to be erected to support
mechanical dredging operations.
Barges delivering dredged sediments to the processing/transfer facilities will be secured atan existing or newly constructed wharf or dock. Material in the barges will be off-loaded by
conventional methods such as a crane or excavator. Prior to unloading barges, excess water that has
accumulated above the incoming sediments will be pumped off, treated, and discharged back to the
river. Figure 5-2 shows a concept for the treatment of water withdrawn from incoming barges. It
is expected that most excess water (i.e., water entrained during dredging operations) will be
recovered by this means.
Once the dredged material has been off-loaded, it will be processed to improve its handling
and shipping characteristics and to facilitate landfill stacking. The precise nature and degree ofprocessing will primarily depend on sediment characteristics, dredging methods, and particulars of
the landfill at which the sediments will be disposed; beneficial use of sediments will also influencethe processing concept. As described in Appendix E, processes such as gravity draining, mechanicaldewatering, and chemical stabilization are applicable to sediments removed from the Upper Hudson.
Of these, chemical stabilization has been selected as the processing technology for purposes ofderiving alternative-specific cost estimates. Thus, post-removal Option Categories B, E, and H are
applicable to the mechanical dredging concept. Chemical stabilization has been applied to dredgedmaterials generated by other Superfund projects and, as well, by several recent navigational dredgingprojects. A wide range of stabilizing agents have been used in these cases including cement, fly ash,
and cement kiln and lime kiln dust. Specifically, the analysis presented in following sections is
5-22 400539 TAMS
based on blending eight percent Portland Cement into the dredged sediments to improve the
materials handling properties (Appendix E).
Based on the foregoing, off-loaded sediments will be discharged into a collection hopper
through a series of racks and screens that remove larger debris. The dredged material will then be
blended with cement in a pug mill, after which the stabilized sediments will be placed into temporary
storage prior to being loaded into rail cars by either conveyors or front-end loaders. It is possible that
some in-storage residence time will be required before the sediment's handling properties improvesufficiently to allow rail load-out.
Stabilized sediments will be hauled off site in covered rail gondolas that can accept up to 100
tons of bulk material per car. Sufficient rail capacity appears to exist in the Port of Albany area to
accommodate the transportation needs of an Upper Hudson River remedial project. However, it isexpected that at a northern transfer facility, it will be necessary to develop a small rail yard adjacent
to an active rail corridor so that a manageable, project-specific logistics system can,be developed for
exporting dredged material. Given that opportunities to develop a facility adjacent to River Section
1 are constrained, the alternative-specific productivity analysis places an upper bound on the mass
of stabilized sediment that can be processed and shipped from the northern transfer facility. The
limit is set at 1,600 tons per day, which equates to 16 rail car loads. All remaining material is
assumed to be processed and shipped from a transfer facility situated in the Port of Albany area.
5.2.2.5 Management of Dredged Material (Mechanical Dredging)
As described in Chapter 4, several options for management of sediments removed from the
Upper Hudson River have been retained for further analysis. An evaluation of these technologies,
as applicable to a mechanical dredging option, is presented in subsection 5.2.5
5.2.3 Removal of Targeted Sediment by Hydraulic Dredging-Methods
Hydraulic dredging methods are also applicable to removal of contaminated sediments. Of °en
the several hydraulic systems initially screened in Chapter 4, the conventional cutterhead suction •*>odredge was retained for further consideration. The two principal operating components of a
5-23 TAMS
cutterhead suction dredge are a leading suction pipe with attached cutting head and an onboard slurry
pump. The pump hydraulically entrains river sediments that have been loosened by action of the
cutterhead and discharges the resultant slurry (water and sediment) into a length of trailing pipe.
Using a boom or ladder, the inlet or suction pipe and cutterhead can be extended sufficientlybeyond the leading edge of the dredge to reach targeted materials. The slurry pump is sized to meetproject productivity requirements and to convey slurried sediments to a processing facility. Theentire assembly of suction piping and slurry pump is mounted on a hull that allows the dredgingsystem to be towed to and maneuvered within a particular work area. An illustration of a hydraulicdredge along with a more detailed presentation of an overall concept for an hydraulic dredgingsystem is provided in Appendix H of this report.
5.2.3.1 Equipment and Conceptual Approach (Hydraulic Dredging)
As discussed in Appendix H, the hydraulic dredge selected for evaluation here is outfitted
with a 12-inch suction line and 600 HP main pump. It is mounted on a 60 x 28 x 4 foot hull that is
expected to maintain a 2.5- to 3-foot draft. The cutterhead for the 12-inch dredge has an
approximate diameter of 40 inches and is about 42 inches long. The dredging unit advances by
raising and lowering spuds located at the rear of the hull and swings by pulling on anchors positionedoff to either side of the hull.
During operation, the hydraulic dredge discharges slurry into a 16-inch, high-densitypolyethylene (HDPE) pipeline that may approach a maximum length of about 50,000 feet. The
length of the pipeline depends on the distance from the dredge to the location where the sedimentslurry will be processed. The slurry pipeline is configured in three principal sections. The first
pipeline section is about 2,000 feet long, floating immediately behind the dredge on a system ofpontoons to enable repositioning of the dredge. The second pipeline section (up to 50,000 feet in
length) is submerged to avoid interference with river traffic. Lastly, where the slurry line mustbypass several dams, it is anticipated that the line would emerge from the river and run along theshoreline for short distances.
5-24 TAMS
It is expected that all material removed by the hydraulic dredging system will be conveyedby slurry line to the northern transfer facility. The configuration of that transfer facility differssubstantially from that described for the mechanical dredging option (subsection 5.2.2.4). In order
to convey the sediment/water slurry up to 50,000 feet, a series of booster pump stations are needed.Since booster pumps can be effective over distances of up to 10,000 feet, it is expected that up to 5
stations will be needed when the slurry line is at its maximum working length. The booster pumpsare mounted on a series of shallow draft barges outfitted with 1600 to 2000 HP diesel-operatedpumps. The practical limit for slurry line length is considered to be about 50,000 feet due to thedecreasing reliability inherent in a system composed of multiple booster stations operating in series.
As is the case with mechanical systems, it is expected that the hydraulic dredging system willbe fitted with state-of-the-art electronic positioning equipment so that the work is performed asefficiently and precisely as possible. In addition, it is expected that a number of innovations may bedeveloped for this program to further control resuspension of river sediments and to improve theoverall productivity of dredging operations. These innovations will most likely be modifications tothe geometry of the cutterhead and suction pipe, addition of shrouds, and improved operation of theladder mechanism from which the suction pipe is suspended. It is also expected that a skimmer boatwill be employed to collect floating materials that may be generated during dredging operations.
5.2.3.2 Productivity (Hydraulic Dredging)
Once the overall capacity (size) of the hydraulic dredge has been established, estimatingproduction rates for that unit depends on several principal factors (quantities shown are those usedin the alternative-specific productivity analysis):
• Hours of productive dredging per day (14 to 17 hours per day);
• Days of operation per week (6) and weeks per season (30);• Slurry pumping rate (7,000 to 9,000 gpm);• Type of cut (production); and• Slurry solids content (15 to 20 percent by cut volume).
oo01KJ
5-25 TAMS
IAdditional information on production rates (cubic yards of sediment removed per day) for
the hydraulic dredging system is provided in Appendix H. In general, it is estimated that the Jhydraulic system will remove targeted sediments at rates ranging from 266 to 275 cubic yards per "~hour. I
5.2.3.3 Transfer Facilities (Hydraulic Dredging) I
The transfer facility configuration applicable to hydraulic dredging operations differs from *that needed to support mechanical dredging operations (see Appendix H for a concept sketch). jUnder the mechanical removal scenario, sediments would be transported to processing facilities by *means of hopper and deck barges that will be unloaded by conventional mechanical means. In Icontrast, for the hydraulic dredging option, sediments will be conveyed in slurry form to the transferfacility via pipeline, and therefore require substantial processing prior to off-site shipment. I
Given the location of the bulk of the targeted sediments, as well as slurry pipeline constraints, Iit has been assumed that all hydraulically removed sediments will be conveyed to a northerntransfer/processing site established located adjacent to River Section 1. The incoming slurry will _Ilikely undergo three principal stages of processing: coarse solids separation, fine solidssedimentation and dewatering, and water treatment. In addition, depending on overall system Iefficiency, it may not be necessary to stabilize either the separated coarse solids or the dewatered finematerial prior to shipping these materials to off-site disposal or beneficial use facilities. Therefore, Ifor the alternative-specific analysis presented in Chapter 8, it has been assumed that stabilization willnot be needed. Thus, post-removal Option Categories A, D, and H are applicable to hydraulic |dredging.
m
Processed sediments will be hauled to ultimate disposal facilities either by direct rail -shipment from the northern transfer facility or, as necessary, by barge to a secondary rail trans- Pshipment location. The need for a secondary trans-shipment location arises because the northern Mtransfer facility is not expected to have adequate rail capacity to handle all sediments removed on "a daily basis during the course of remediation. The secondary location is assumed to be in the Port flof Albany area and is intended to handle those materials that cannot be shipped from the northerntransfer facility due to rail and other capacity constraints.
a
5-26 TAMS400543 I
Since the practical length of a reliable slurry line has been estimated to be 50,000 feet, it isnot expected that a processing facility located adjacent to River Section 1 can be utilized forprocessing slurry generated by dredging operations south of the Northumberland Dam.Consequently, for any remedial alternative that involves removal of sediments in River Section 3,it is assumed that dredging will be accomplished by the mechanical equipment previously described.Mechanically dredged material, in this case, would be transported in hopper barges to a processingfacility established in the Port of Albany area, where unloading and stabilization of sediments wouldbe accomplished in accordance with the mechanical dredging concept.
5.2.3.4 Slurry Processing (Hydraulic Dredging)
The initial stage of slurry processing, i.e., solids separation, is intended to take advantage ofthe fact that a substantial portion of the targeted sediments, particularly those characterized as non-cohesive, are relatively coarse material (60 to 70 percent sands or fine sands). It is expected that thecoarse fraction can be effectively separated from the rest of the incoming slurry by physical means.
To do this, the slurry will be discharged over several stationary and vibrating screens that removegravel-sized and larger materials. The slurry will then flow down a series of hydrocyclones in whichfine and coarse sands will be separated from the solids stream. Coarse materials separated by thesetwo physical processes will be stockpiled, allowed to drain, and disposed.
The remaining slurry stream will be discharged to a series of circular tanks whereinflocculants or polymers will be added to enhance coagulation and settlement. Settled solids will thenbe dewatered (using belt presses) and loaded onto rail cars for off-site disposal. The flocculationtank supernatant will be pumped to a water treatment plant that includes a series of settling andfiltration steps as illustrated in Appendix H. The treatment plant will be sized to handle the entireflow of incoming slurry as well as any additional waste water incidental to site operation.
Solids generated by the solids separation and water treatment systems will be hauled to eitheroff-site disposal facilities or to off-site beneficial uses (see subsection 512.5). Since Hudson RiverPCB contamination has been associated with fine-grained sediments (predominantly silts), thecoarser fraction of the slurry materials separated by physical methods as described above is expected
5-27 TAMS
otn
to be relatively free of contamination and may be suitable for beneficial use without furtherprocessing.
5.2.4 Capping of Targeted Sediments
As a result of the screening presented in Chapter 4, capping using the AquaBlok™ systemhas been retained as the representative process option. Capping involves the placement of a lowpermeability material over contaminated sediment that acts to prevent or slow the movement ofcontaminated pore water. In addition, exposure of aquatic organisms to contaminated sediments isprevented by an engineered cap, since it isolates the original contaminated substrate and, once inposition, allows repopulation to occur in clean materials. AquaBlok™ is a manufactured productconsisting of beruonite applied to a gravel substrate, which when placed in water hydrates andexpands to form a continuous impermeable mat.
5.2.4.1 Typical Cap Cross-Section
An engineered cap using the AquaBlok™ system is expected to consist of a 12-inch layer ofhydrated AquaBlok™ overlain by a 6-inch layer of backfill/benthic substrate. A typical cap cross-section is shown in Figure 5-3. Of the different types of AquaBlok™ materials that can bemanufactured, three have been considered for application to the Upper Hudson:
• Type A AquaBlok™ is a mixture consisting of 80 percent stone and 20 percent bentonite,applied at a rate of 55 pounds per square foot (Ib/sf). Since Type A is more resistant tomechanical impacts than other formulations, it will be used in the upper cap layer, wherewater depths are less than three feet.
• Type B AquaBlok™ is a mixture consisting of 70 percent stone and 30 percent bentonite,applied at a rate of 45 Ib/sf. This formulation will also be used as an upper capping layerwhere water depths are greater than 3 feet, since it offers greater resistance to river-inducederosion than do more impervious AquaBlok™ formulations.
5-28 TAMS
400545

• Type C AquaBlok™ is a mixture consisting of 60 percent stone and 40 percent bentonite,applied at a rate of 25 Ib/sf. Type C material will be the first lift placed at all locations, asit is less permeable than the other types due to its high bentonite content.
While the manufacturer suggests application of a six-inch layer of AquaBlok™, a moresubstantial concept is being presented here for several reasons. The thickness has been increased toaddress the possibility that the cap will be subject to damage from ice scour and boat traffic. Also,cap erosion may result from both normal river flows and less frequent, but high energy, storm events.Finally, as described further below, since substantial dredging is necessary to install an engineeredcap system in shallow areas, that dredging work may expose more contaminated sediments than arecurrently found at the sediment surface; thus additional protection is warranted in the form of a one-foot-thick cap overlain by six inches of new benthic substrate.
A six-inch benthic substrate layer will be placed over the AquaBlok™ to protect it fromburrowing animals and also to provide a clean substrate for repopulation by benthic organisms. Thebackfill will also serve as a sacrificial layer in the event of significant erosion or surficial damage.This will reduce the potential for catastrophic breaches of cap integrity and avoid maintenanceemergencies, thus facilitating reliance on a routine maintenance program.
Placement of 18 inches of capping material over the river bottom, particularly in shallowareas, could result in moving the shoreline toward the river channel by as much as 25 to 50 feet, andpossibly have some effect on river hydraulics. Therefore, to prevent changing the configuration ofthe river, 1.5 feet of sediment will be removed prior to the placement of the cap in targeted shallowareas; i.e., areas with less than six feet of water. In the navigation channel, i.e., where water depthsexceed 12 feet, targeted sediments will be removed and no cap will be installed. It is expected thatthe mechanical dredging equipment previously described will also be applicable to these removalrequirements.
5.2.4.2 Capping Material Manufacture and Transport for Placement
£>O
As stated previously, AquaBlok™ is manufactured by coating a gravel-sized substrate with ^it
polymer to which bentonite then adheres. The AquaBlok™ product may be manufactured at any <s\
5-29 TAMS
suitable location and then transported to a riverfront location either by truck or rail. Once at theriver, the capping material is loaded onto barges for placement over targeted areas. Alternatively,
AquaBlok™ maybe manufactured at a dockside location and loaded into barges there for subsequenttransport and placement in the river.
For purposes of this FS, it is assumed that the AquaBlok™ material will be manufacturedlocally. The manufacturing facility will be located near a source of raw materials (i.e., crushed stoneor gravel). According to the manufacturer, the facility could easily be located within an existing sandand gravel operation, several of which can be found in the Fort Edward-Hudson Falls area. On thisbasis, the principal raw materials to be imported will be bentonite and polymer, which can betransported to the manufacturing site by either truck or rail or a combination of both. Once theAquaBlok™ has been manufactured, it v^ill be loaded into hopper barges for in-river distribution andplacement.
5.2.4.3 Cap Placement
AquaBlok™ material will be placed on the river bed from the end of a deck barge by meansof a telescoping conveyor. The telescoping conveyor will be configured to distribute AquaBlok™material within a 100-foot radius of the deck barge. Because of its gravel substrate, the material willrapidly settle over the areas where it is being released. Loads of AquaBlok™ of approximately 1,000tons will be transported by hopper barge to targeted cap areas where a small front-end loader willload the conveyor that transfers the AquaBlok™ to a distribution barge, from which the telescopingconveyor is operated.
5.2.4.4 Dredging Requirements Related to Capping
As previously mentioned, capping alternatives also involve dredging of contaminatedsediments within targeted shoreline areas and within the navigational channel. The complete set ofcriteria used to identify where dredging is needed follow:
• At locations where the water depth is less than 6 feet, 1.5 feet of sediments are removed andthe cap placed as described above, except as noted below;
5-30 TAMS
400547
• At locations where the water depth is between 6 feet and 12 feet, no dredging occurs and thecap is placed as described above, except as noted below;
• At locations where the water depth is greater than 12 feet, contaminated sediments areremoved to the depth of contamination, since placement of a cap is incompatible with themaintenance of the navigation channel;
• No cap is placed in areas where the depth of contamination is 2 feet or less; at theselocations, sediments are removed to the depth of contamination;
• In the non-navigational section between the TI Dam and Lock 6, there are few areas withcontamination below 2 feet in depth; therefore, it is not likely to be cost-effective to mobilizecapping equipment for this portion of the river. As a result, the targeted sediments in thispart of the river are removed rather than capped.
The type of dredging equipment and equipment productivity factors described for themechanical removal concept are considered applicable to dredging operations under the cappingcategory. Furthermore, as was the case for the removal concept, transfer facilities will be needed toprocess and load out the dredged sediments. Depending on the quantity of sediments being dredgedand the overall sediment management strategy selected, it is possible that transfer operations willneed to be established both adjacent to River Section 1 and in the Port of Albany area (i.e., thenorthern and southern transfer facilities). Transportation modes and management options fordredged sediments would be similar to those under the removal category.
5.2.5 Management of Dredged Material
As a result of the screening analysis conducted in Chapter 4, a number of treatmenttechnologies associated with ultimate management of dredged sediments have been retained forfurther evaluation:
i• Sediment washing; o
en• Solvent extraction; j£
5-31 TAMS

• Chemical dechlorination;• Thermal desorption, and• Solidification/stabilization.
There are two possible applications of these technologies: to render the dredged sedimentssuitable for off-site landfill disposal, and to enable beneficial use of the dredged material.Application of the first four technologies to landfill disposal is presented in subsection 5.2.5.1.Application of stabilization methods to off-site landfill disposal is discussed in subsection 5.2.5.2.Beneficial use of dredged material is detailed in subsection 5.2.5.3.
5.2.5.1 Chemical/Thermal Processing of Dredged Material for Disposal
Unit costs associated with the chemical and thermal processes that have been retained to thispoint are presented in a series of Chapter 4 tables. In general, unit costs for those chemical andthermal processing technologies with which there is some operating experience range between $ 100and $250 per ton of processed sediment. This cost range does not include any consideration fortransporting sediments either after on-site treatment or ,o off-site chemical/thermal treatmentfacilities.
As presented in the alternative-specific analysis in Chapter 8, it is expected thattransportation of stabilized sediments to aTSCA-permitted landfill will cost approximately $100 perton based on the selected disposal location. Transportation and disposal of stabilized sediments toa non-TSCA landfill will cost approximately $50 per ton based on the identified disposal facilities.Thus, disposal with prior chemical/thermal treatment is likely to substantially exceed the cost ofdisposal of stabilized dredged material. Consequently, the chemical/thermal processes retained in
#
Chapter 4 will not be evaluated further in the FS.
5.2.5.2 Off-site Landfill Disposal
On-site and near-river landfill disposal were screened out in Chapter 4 based onadministrative infeasibility due to public opposition. Options for off-site disposal of sediments
removed from the Upper Hudson River will depend, in part, on their PCB concentrations. Dredged
5-32 TAMS400549

material with PCB concentrations of 50 mg/kg or more is subject to regulation under TSCA (40 CFR
761.61, et seq.}. However, commercial solid waste management facilities may impose a more
stringent limit of 30 to 35 rng/kg PCBs as an acceptance criterion. This provides them with a marginof safety in accepting wastes classified in bulk, using analysis of composite samples. Therefore, a
trigger level of 33 ppm, not 50 ppm, will be used for the purposes of this FS to determine which
removed sediments are to be disposed of in TSCA-permitted landfills and which may be managedin Subtitle D facilities or diverted for beneficial reuse. The method for estimating the quantities of
non-TSCA-regulated and TSCA-regulated materials is described in Appendix E.
As part of this FS, a survey was performed to identify landfills permitted to handle materialswith PCB concentrations greater than 50 mg/kg. Appendix E contains a technical memorandum onthis subject. Based on that survey, it has been determined that the alternative-specific analysispresented here will be based on rail transport of the TSCA-regulated sediments to a permitted facilityin Andrews, Texas. This facility has direct rail access, the capacity to handle the potential volumeof material, and competitive disposal costs. However, a different landfill could be selected whenimplementation of a specific remedy is initiated.
Numerous alternatives are theoretically available for disposal of non-TSCA-regulatedsediments. One site identified is situated in the Niagara Falls, New York area. Additional sites have
been identified in Ohio, Maine, South Carolina, and Canada. The key considerations for selectinglandfills for this fraction of the dredged material are landfill capacity and rail access. For purposesof the analysis presented here, it is assumed that the non-TSCA-regulated sediments will be hauled
by rail to landfills within 750 miles of the Upper Hudson including the landfill at Niagara Falls, NewYork.
As previously noted in subsection 5.2.3, it will be necessary to dewater and stabilize dredged
sediments before shipping them to a landfill. Stabilization will be accomplished at each of thetransfer facilities where barges will be received and unloaded. Space requirements needed to supporta stabilization operation (silos, hoppers, conveyors, pug mill, and temporary storage) are considered Q
oto be relatively modest based on recent experience at a Jersey City, New Jersey project. Thus, the in
Ul
option to landfill sediments that have been stabilized on site has been retained for further evaluation. °This option is applicable to mechanical dredging..
5-33 TAMS

Hydraulically dredged sediments will be conveyed to the northern transfer and processingfacility in slurry form as described in subsection 5.2.3. Coarse solids will be separated from theslurry by means of hydrocyclones; fine solids will be removed by flocculation and then mechanically
dewatered (e.g., using filter presses). Dredged material processed in this manner is expected to besuitable for direct placement into rail cars without further stabilization. Thus, landfill disposal of
hydraulically dredged sediments that have been separated into coarse and fine fractions will beretained for further evaluation in this FS.
5.2.5.3 Beneficial Use
Beneficial use of dredged material offers an opportunity to manage those materials more
efficiently and, consequently, at lower cost than would apply to landfill disposal. In addition, sincesome forms of beneficial use generate commodities having considerable value in the market place,
depending on particulars, treatment or processing of sediments to generate a useful commodity may
be cost-effective. A possible beneficial use strategy for managing contaminated sediments dredged
from the Upper Hudson River is presented here and will serve as the basis for the alternative-specific
detailed analysis in Chapter 8.
For convenience, use of dredged sediments for beneficial purposes can be placed into twocategories, a low-value category and a higher-value category. Forms of low-value beneficial usesof stabilized sediments include abandoned mine reclamation, use as landfill cover material, and use
as construction fill material. All of these uses are likely to be off site and are suitable for sediments
with relatively low concentrations of total PCBs (typically 4 to 10 mg/kg, depending on theapplication and local requirements). Abandoned mine reclamation in Pennsylvania coal mines usingsediments with less than 4 mg/kg of total PCBs from the New York/New Jersey Harbor is currently
being evaluated in a large-scale pilot study. Future availability of this option depends on pilot
program results.
Different options are applicable to sediments with higher concentrations of total PCBs(greater than 10 mg/kg but less than 33 mg/kg PCBs). These options are quite different from the
low-value category of uses because the PCBs are removed by thermal desorption, plasma arc
vitrification, or surfactant washing and chemical treatment, and the treated sediments (clays, silts,
5-34 ' TAMS400551

and sands) are converted into higher-value, useful commercial products such as architectural tiles,
fiberglass, cement, light-weight aggregate, or manufactured soils. Unrestricted use of these end
products is permissible because they are considered to be free of PCBs.
For purposes of the detailed analysis presented in Chapter 8, the following assumptions were
made as to application of beneficial use:
• Use of removed sediments as construction fill was chosen as the low-value post removal-option selected for analysis.
• Use as manufactured cement was chosen as the higher-value option selected for analysis.
• Non-TSCA material will be segregated into two fractions for the beneficial use purposes,the fraction with less than 10 mg/kg PCBs and the 10 to 33 mg/kg PCBs fraction.,
• The sediment fraction with less than 10 mg/kg PCBs will be stabilized with eight percentPortland Cement at the northern and southern transfer facilities. This material will then beloaded onto trucks to be transported to off-site facilities where it will be stored for use as
construction fill material. It is assumed that there is no disposal cost associated with thisbeneficial use option. Only the cost to transport the material to the appropriate off-sitefacilities is included. For the cost estimate, these facilities are assumed to be within a 200-mile radius of the transfer facilities and transportation is by truck.
• The sediment fraction with 10 to 33 mg/kg PCBs will be transported by barge to theappropriate processing facility, assumed to be located in the vicinity of New York/New
Jersey Harbor. For this option, it is assumed that barges will be loaded at the dredging siteand will proceed directly to the processing facility. No stabilization or further processing isassumed to be required for these sediments prior to_off-loading at the vendor's location. Forthe detailed analysis in Chapter 8, the processing facility is assumed to be within 200 miles £
oof Albany. 01ento
5-35 TAMS

5.2.6 Backfilling and Site Reconstruction
Upon completion of removal or capping work, there is likely to be some residual
contamination along the river bottom due to resettlement and incomplete removal of sediments.While the mass of PCB contamination from these sources is expected to be a minor fraction of the
contamination removed, these residual surficial materials will represent a potential contaminationsource to the water column. .
In addition to residual contamination, it is also expected that the process of removing and
capping contaminated river sediments may result in some impacts to river bottom topography, riverhydraulics, and the stability of the shoreline. Finally, there are potential ecosystem implications tothe extensive dredging and capping operations that will be part of the active remedial alternatives.These implications include the following:
• Removal of substrate used as habitat by fish and benthic invertebrates;
• Displacement of benthic organisms;
• Loss of vegetation including wetland communities; and
• Disturbance of shoreline stability.
In order to mitigate various impacts of dredging and capping operations, each capping and
removal alternative contains:
• Placement of a blanket of clean fill over those areas that will have experienced capping or
removal work;• Stabilization of disturbed shoreline areas; and
• An aquatic and wetland vegetation planting program.
Each of these activities is summarized below and described in greater detail in Appendix F.
5'36 400553 TAMS
5.2.6.1 Backfilling Approach and Methods
Placement of clean backfill material fulfills a number of important purposes in remediation
of the river bed, including isolation of dredging residuals, mitigation of potential bathymetricchanges in shallow areas, protection of impermeable capping materials, and habitat replacement.Of the principal purposes for placement of a clean backfill blanket within the river, habitatreplacement will most likely have the greatest influence on characteristics of selected materials. Asdescribed in Appendix F, fish and benthic organisms require a diversity of bottom conditions tospawn and thrive, including stream bottoms composed of gravels, sands, and finer materials. Thus,the backfill used needs to be composed of materials of varying textures to simulate, to a reasonabledegree, bottom conditions in a healthy river system. /
A concept for placement of clean fill materials has been developed that provides a reasonableapproach for estimating the amount of work to be accomplished and generally conforms to thehabitat replacement goals described below and in Appendix F. While locations requiring habitatreplacement have not been specifically delineated, development of this concept facilitates estimationof costs for the backfill component of each capping with dredging alternative. Placement of backfillmaterial to protect the engineered cap has already been described. The backfill concept outlinedbelow applies particularly to those areas of the river within which sediment removal alone willoccur.
Elements of the concept are as follows:
• Clean fill will not be placed in the navigation channel or in other areas where deeper waterenvironment is preferred based on ecological considerations;
• In areas of the river between the 6-foot contour and the navigation channel, 6 inches of gravelwill be placed over 6 inches of sand;
• Between the shoreline and the 6-foot contour, 12 inches of sand will be placed; and
• In shallow wetland areas, pre-removal water depths will be re-established using acombination of sand and fine sand blended with silty material.
ooUl
5-37 TAMS

Placement of the clean backfill blanket will generally proceed from upstream to downstreamfollowing the progress of remediation; one exception to this is River Section 3, where removal andbackfilling may occur prior to completion of work in other sections. Sand and gravel backfillmaterials will be obtained from nearby sand and gravel mining operations and will be loaded ontobarges and hauled to the placement location. Where finer-textured materials are needed to achievehabitat replacement goals in disturbed wetland areas, these will be purchased from suppliers in theHudson Valley and transported by barge to the relevant work areas.
5.2.6.2 Shoreline Stabilization
Since both the removal and capping categories involve considerable sediment removal inproximity to the banks of the river, there will be a need to renew or stabilize shoreline areas so asto limit or control the potential for erosion. Locations requiring stabilization have not beenspecifically delineated for purposes of this FS; however, a concept has been developed that providesa reasonable approach for estimating the quantity and cost of shoreline stabilization required on analternative- specific basis. The approach taken for purposes of this analysis is to assume that thestabilization program will be a function of depth of sediment removal within the river immediatelyadjacent to each shoreline segment. In particular, the following strategy has been followed to definestabilization requirements, including the length of shoreline that will be affected and the stabilizationsystem that will be employed:
• Where less than 2 feet of sediment removal is proposed, stabilization will consist of hydro-seeding the adjacent shoreline area;
• Where 2 or 2.5 feet of removal is proposed, dormant mattresses of plant materials will beemployed to stabilize river banks; and
• Where the proposed dredge cut is 3 feet or greater, timber or log revetments (retaining walls)in combination with plant material mattresses will be employed.
It should be noted that, for all sections of the river where near-shore removal operations areplanned, the backfill concept previously described requires that either sand or gravel materials beplaced on the river bottom to isolate residual contamination and to re-establish ecological functions.It is expected that about one foot of material will be placed on the river bottom for these purposes,
5-38 TAMS
400555

and that this layer will also serve as an additional mechanism to control bank erosion. The actuallength of shoreline that would require stabilization is specific to each alternative (Chapter 8).
5.2.6.3 Habitat Replacement
As previously mentioned, sediment removal or capping may result in impacts to aquatic andwildlife habitat. Examples of potential impacts follow:
• Removal or capping of substrate used as spawning and foraging habitat by fish and benthicinvertebrate species;
• Displacement of benthic organisms;• Loss of plant communities;• Loss of freshwater wetlands acreage and wetland functional values; and• Disturbance of shoreline stability.
A description of existing habitats within the Upper Hudson River that may potentially beaffected by removal or capping operations is presented in Appendix F. For purpose of describingpotential habitat replacement measures, the physical habitats of the river have been defined as havingthe following four zones typical of the Upper Hudson River:
• Deep river - areas of the river that are deeper than the photic zone (i.e., depth to lightpenetration), defined here as depths exceeding six feet. The substrate of the deep open riverzone is largely characterized as non-cohesive and is not vegetated.
• Shallow river - open waters of the river that are within the photic zone (i. e., depths less thansix feet). In these locations there is a mixture of substrate types (cohesive and non-cohesive).
• Emergent wetlands - emergent wetlands that occur in areas of the river with reduced flowvelocity (vegetated backwaters) that allow fine-grained sediments to settle out. Substrate inthese areas is generally cohesive.
ooUl
• River bank - the shoreline of the river (vegetated and non-vegetated). ^
5-39 TAMS

As detailed below, several habitat replacement concepts are available for these four zones.However, these techniques are not considered applicable to the navigation channel in the UpperHudson, which is expected to be subject to maintenance dredging. For this reason, as well as the
absence of rooted aquatic vegetation in such areas, replacement of habitat substrate in the channelwould accrue only marginal ecological benefits.
Deep River Habitat Replacement
Deep river areas are characterized by bottom depths below the photic zone, the illuminatedwater column and river bottom to which photosynthesis is restricted. The depth of light penetrationin the Upper Hudson River varies on both temporal and spatial scales. However, for the purpose offormulating habitat replacement concepts, the typical depth of the photic zone is assumed to beapproximately six feet. Therefore, deep river habitat replacement concepts pertain to river areas withpost-backfilling depths ranging between six and 12 feet. Concepts developed for the deep river zonewould replace fish and benthic habitat and encourage recolonization.
Methods applicable to the deep river zone are limited. Due to the absence of sufficient lightlevels for photosynthesis, establishment of rooted aquatic vegetation is not an option. The need tomaintain the navigability of the river and to avoid creation of obstructions and hazards to boat trafficprecludes the extensive deployment of hard structures. For these reasons, appropriate methods arerestricted to the placement of suitable substrate and the possible limited deployment of boulderclusters.
Most of the remediated area within the deep river zone would likely be backfilled with a one-half-foot-thick layer of gravel over a one-half-foot-thick layer of sand. The intent is to reconstructa stable substrate on the river bottom, often a critical requirement for fish spawning and secondary
production by aquatic insects. Although a gravel substrate would be suitable for most fish speciesin this zone, the ideal spawning habitat for many species is a complex mixture of sediment sizes.Therefore, a one-foot deep layer of sand may be placed in some locations to create a mosaic ofsubstrates. Backfill comprised of fine sediments would not be placed in the deep river zone.
However, over time, silt and fine sands would be transported into the backfilled areas by currents,gradually increasing the heterogeneity of the substrates.
5-40 TAMS400557

Shallow River Habitat Replacement
The shallow river zone comprises river areas within the photic zone, generally extendingbetween the shoreline and river depths of six feet, but excluding emergent wetlands and river banks.
This zone encompasses shallow water areas within the main and secondary river channels, andshoals, bars, and partially enclosed sheltered coves adjacent to the channels. It includes bothpredominantly non-vegetated areas and areas containing rooted submerged or rooted floating aquaticvegetation. Objectives for the shallow river zone are to replace fish habitat and benthic habitat andencourage recolonization, and replace disturbed plant communities.
Although river currents in the shallow river zone preclude the establishment of non-rootedvegetation, availability of sufficient light for photosynthesis enables use of rooted aquatic vegetation.This vegetation is planted in patches within the remediation area. Species selected are limited tonon-invasive rooted submerged and rooted floating aquatic vegetation, currently occurring in or
native to the Upper Hudson River. Candidate species that are valuable to fish and wildlife arediscussed in Appendix F.
Only locations backfilled with the sand substrate are planted with rooted aquatic vegetation;gravel surface substrates are not planted. Planting on sand surface substrates will be implementedto establish a mosaic of vegetation cover, both in terms of species composition and plant coverdensity. Plant cover densities may range between 0 and 100 percent. Plant materials (species,planting stock, and availability), planting locations, and planting densities will be determined during
remedial design.
Emergent Wetland Habitat Replacement
Emergent wetlands are characterized by erect, rooted, herbaceous hydrophytic plants,excluding mosses and lichens. This vegetation, is present for most of the growing season in most
- • - - *•years. Emergent wetlands occur in areas of the river with reduced flow velocity that allow fine- °
01grained sediments to settle out. While there are forested riparian wetlands adjacent to the river, ui°°
remediation activities will not occur there; therefore, this habitat replacement concept does notaddress forested wetlands.
5-41 TAMS
Objectives for emergent wetlands are to replace fish and benthic habitat and to encourage
recolonization. Additional objectives are to replace disturbed plant communities and replacewetlands. Wetland replacement will be focused on the following end points:
• Re-establish wetland function and values (habitat, flood control, water quality), and
• Re-establish habitat diversity through provision of emergent marsh with interspersed deep-water pools and scrub-shrub wetland habitat.
Candidate species useful for wetland replacement are described in Appendix F.
River Bank/Shoreline Stabilization
River banks immediately adjacent to sediment removal locations may require stabilization
to control bank erosion, slumping, and sloughing. Ecological objectives for the shoreline, or river
bank zone, are to replace vegetation communities and stabilize shorelines. Potential bank
stabilization methods will be a function of the depth of sediment removal in the river adjacent to
each shoreline segment. The basic stabilization strategy has already been described; however, the
actual river bank stabilization method to be employed along each shoreline segment will be specifiedduring the remedial design phase. Both vegetative methods and structural-vegetative methods willlikely be employed, the choice being dependent on the extent of bottom sediment removal in theadjacent river and the magnitude of erosive forces.
5.2.7 Monitoring
An important component of any remedial alternative for the Hudson River is the monitoring
of river conditions before, during, and after the remedial effort. The purpose of the monitoring is
primarily to document the improvement in river conditions as a result of the remedial effort as well
as to verify that the remedy succeeds in achieving RAOs. Additionally, monitoring will be utilizedto assess the effectiveness of measures taken to mitigate potential short-term impacts resulting fromthe remedial activities.
5-42 TAMS400559
Various aspects of the proposed monitoring address the long-term changes in the PCBconcentrations in sediment, water, and fish. Additionally, PCB concentrations in sediment
immediately prior to and subsequent to any remedial activity are also to be monitored. Finally,
impacts of the remedial activities on water column and fish conditions are addressed. Each of these
aspects is covered to a differing degree, depending on the remedial activity selected. The followingtext provides an overview of the proposed monitoring programs. A detailed discussion of theproposed programs is found in Appendix G.
The monitoring programs fall into four separate categories as follows:
• Monitored Natural Attenuation Monitoring Program• Design Support Investigation
• Construction Monitoring Program• Post-Construction Monitoring Program
Monitoring is not a part of the No Action alternative. Also, the monitoring programassociated with MNA is treated separately from that of the programs for the active remedialalternatives. The last three programs are components of any active remedial alternative involvingremoval or capping. The discussion that follows presents the basic premise of each of themonitoring programs and an outline of the monitoring tasks. In several instances, the monitoringprograms have several tasks in common. Additionally, the second, third, and fourth monitoring
programs listed above have alternative-specific features.
The length and spatial coverage varies widely among the monitoring programs, covering arange of 1 to 30 years, and from as few as 30 to as many as 200 river miles. Figure 5-6 provides anoutline of the entire suite of monitoring programs.
Each of these monitoring programs involves tasks in addition to the sampling effort itself,' »^including, among others, tallying, reporting, and interpretation of the data. For the purposes of cost o
oestimating, data reporting and interpretation have been estimated on a per-sample basis. MNA ^
. orequires the additional effort of incorporating the data collection results into further modeling
analysis to determine whether the actual data trajectory matches the model forecast. To the extent;
5-43 TAMS
that there are differences, the models will require adjustment and possibly recalibration to reflect the
actual data and make more accurate forecasts. A smaller but similar modeling program is planned
for the post-construction monitoring period.
5.2.7.1 Monitored Natural Attenuation Monitoring Program
Under this alternative, an extensive monitoring program will be conducted to document theexpected rate of decline in PCB concentrations in water, fish, and sediment. Additionally, thisprogram is intended to develop data sets that can be used to validate and further refine various
USEPA models. These models will require revision to enhance their accuracy over the long termand to correct any differences between the model forecast and the actual measured trends. It isexpected that model review and recalibration will occur on a three-to-five year cycle to reflect thenewest data in the model forecasts. This cycle time also corresponds to the frequency of the major
sediment monitoring events. A five-year recalibration has been assumed for cost estimation
purposes.
Surface water monitoring under the MNA alternative consists of five components. Two ofthese are weekly sampling of the Upper Hudson and monthly sampling of the Lower Hudson under
a time-of-travel monitoring plan. Sampling events will occur at seven Upper Hudson stations and
four Lower Hudson stations. Because of the important differences in congener patterns among the
various potential PCB sources in the region, congener-specific data are required. Ancillary
measurements include suspended solids and the fraction of organic carbon on the suspended solids.
The remaining three elements under this program are designed to collect data to furtherenhance the understanding of PCB loads in the Upper Hudson. These include monitoring of
suspended solids and float surveys. Suspended solids monitoring is needed to further refine and
improve the existing modeling analysis of solids transport in the Upper Hudson. Flow data will berequired as well. The remaining water-related elements are two float survey programs, similar indesign to the studies done by GE in 1996 and 1997 (O'Brien & Gere, 1998). These surveys coverRiver Sections 1 and 2 and are focused on the warmer months of the year. The surveys are intendedto study the processes and the areas responsible for the PCB release from the sediments documentedin the USEPA and GE data. ,
5-44 400561 TAMS

The fish monitoring program under MNA is based on the sampling program assembled byNYSDEC in 1997 (included in Appendix G). For this FS, the main goals of fish monitoring are as
follows:
• To assess temporal trends in PCB concentrations in selected resident species;
• To evaluate spatial relationships in Hudson River PCB contamination as reflected by PCB
concentrations in the fish; and• To ascertain PCB concentrations in striped bass for purposes of providing or modifying
health advisories and for regulating commercial fisheries.
Essentially, the program is intended to further the understanding of PCB uptake in fish whilealso monitoring to determine when fish levels reach acceptable concentrations for recreational andcommercial use. To accomplish this, fish monitoring will continue as it has for the last several years,
with the collection of resident and migratory species from both the Upper and Lower Hudson.
To assess sediment contamination, sediment cores will be collected for radionuclide datingand PCB analysis from throughout the Upper and Lower Hudson River. These cores documentmajor releases to the river along the river's length. Eleven locations in the main stem of the Hudsonplus one location in the Mohawk near its confluence with the Hudson will be occupied for thisprogram. The sampling frequency for this program is at five-year intervals for most of the 30-yearmonitoring period, although cores are collected in years 1 and 4 (three years apart) to examine the
initial conditions. PCB analysis is done on a congener-specific basis for this program to provide
information on the transformations over time of the PCB mixtures contained within the sediment
(i.e., dechlorination). In this manner, these cores document the long-term response of PCBcontamination in the Hudson.
In addition, the sediments of several hot spots will be examined every five years to assess thein-place inventory and compare it with prior inventory estimates. Additionally, composite samplessimilar to those collected by GE and used in the modeling analysis will be generated every five yearsto track changes in the surface sediment conditions. These results can be directly incorporated into °
the HUDTOX model as a part of future model refinements anticipated under the MNA alternative. a\
5-45 TAMS

By sampling at this frequency, the results will permitthe documentation of changes in sediment PCB
inventory and concentration over time.
The final component of the MNA monitoring program is acoustic mapping of sediment
properties and river bathymetry. The geophysical surveying by acoustic techniques is similar to thePhase 2 efforts completed in 1992. Several different acoustical packages will be used to collectsurface sediment characteristics (side-scan sonar), sediment thickness (sub-bottom profiling), andbathymetric data (multi-beam sonar). Additional coverage of the river bottom for bathymetry,specifically to assess sediment burial or resuspension over time, will be conducted using a multi-
beam system. The timing for this task is intended to provide a large quantity of data on the
sediments and their variability at the beginning of the program followed by regular, less frequentmonitoring later in the program. Specifically, the bathymetric survey will be conducted quarterlyin the first year, followed by annual surveys in years 2 to 5, with surveying on five-year intervals
thereafter. For purposes of cost estimating, surveys at five-year intervals are assumed to occur during
years 6 through 30.
5.2.7.2 Design Support Investigation (Pre-Construction Monitoring)
Unlike the MNA monitoring program, the design support program does not represent a
remedial alternative by itself. Rather, this program will be implemented as part of a remedial
alternative involving sediment removal or capping. The purpose of the design support program is
to provide current data on sediment conditions prior to initiation of sediment remediation. Thesedata will form the basis for the final identification of sediments to be remediated, whether byremoval or by capping. Because the information to be gathered on the sediments is needed for bothactive remediation categories, the number of samples and the sampling density are the same for both
options, given the same remediation target criteria. For example, target areas incorporated in an.alternative designated by 3/10/10 require the same number of samples for both removal (REM-
3/10/10) and capping (CAP-3/10/10). This is because both alternatives require knowledge of thehorizontal and vertical extent of contamination, since both involve sediment removal.
The design support program involves sediment, fish, and geophysical sampling during a one-
year; period. Included in this sampling are the MNA alternative monitoring programs involving
400563 TAMS

water, fish, and dated sediment core sampling. In addition to the seven basic components from
MNA (i.e., the five water column elements, fish monitoring, and dated sediment), a caged fish study
will also be implemented during the design support program. This will establish a baseline of
conditions for comparison to caged fish studies planned for the post-construction period.
Remedial alternatives developed for the Upper Hudson River involve varying degrees of
sediment removal or capping. Estimates of remediation areas and volumes for these alternatives are
based on currently available data that describe the horizontal and vertical extent of contamination.
However, these data would need to be updated before the sediment removal or capping operations
begin. Additionally, given the anticipated magnitude of sediment removal, data will be collected at
a sufficient spatial resolution to minimize, to the extent possible, the removal of clean sediments,
as well as to minimize the potential for not remediating PCB-contaminated sediments meeting the
specific target thresholds. On this basis, then, the design support program will refine the sediment
PCB inventory of the Upper Hudson.
Estimation of the number of cores required is not straightforward, in part because of the need
to select a minimum area unit for remediation and, more importantly, because of the inherent
variability in the data. The design support sampling program will require the incorporation of
several data sets in order to properly estimate the sampling density. Sampling density will vary with
each alternative, as well as by river section, since the alternatives have different goals in each
section. For the areas most likely to be removed under the Hot Spot (10 g/m2) and Expanded Hot
Spot (3 g/m2) remediation thresholds, 40 cores per 5-acre unit are required to accurately assess
sediment depth. For areas with a high probability of sediment contamination at or near those
thresholds, sampling density is estimated at 36 cores per 5-acre unit. Finally, low probability areas
will be sampled at a low density of one core per acre or less. Derivations of the various estimates
are included in Appendix G. Ultimately, the remedial alternatives selected for detailed analysis yield
between 4,800 and 7,600 coring locations for the design support sampling program. Because of the
extensive removal component in a capping alternative, the sampling program is estimated to be the
same for both capping and removal. Cores are nominally estimated at three feet in length, consisting
of three separate core segments for PCB analyses plus additional radionuclide analyses.
5-47 " TAMS

The last data collection effort under the design support is geophysical surveying. The
geophysical survey has two major goals: first, to establish river bathymetry and sediment type priorto the onset of remediation; and second, to re-examine the river bottom in conjunction with the
sediment sampling program discussed above as an aid to the delineation of remediation areas. Thecollection of accurate bathymetric data is paramount for measurement of the actual volume of
sediment removed, the depth of cap installed, and achievement of the desired removal depths. Thedesign support bathymetric survey provides the reference surface for the interpretation of subsequent
surveys for the dredged volumes, dredged depths, and cap thicknesses. To this end, the bathymetriccross-sections are to be obtained in a fairly dense coverage in the areas slated for remediation.
A side-scan sonar survey will provide current data on the nature of the river bottomsediments, updating the USEPA side-scan sonar survey of 1992, which would be approximately tenyears old at the initiation of a design effort, and the more limited side-scan sonar data obtained
during the 1999 debris survey. The side-scan sonar survey will also refine understanding of the
occurrence of debris that may interfere with sediment remediation. Finally and most importantly,
the side-scan sonar survey will be used in conjunction with the design support coring program tomap removal/capping boundaries and sediment thicknesses, and to finalize the remedial design.
5.2.7.3 Construction Monitoring Program
This program is intended to document PCB levels in the Hudson River during the
remediation of the river sediments. It contains several tasks that specifically address PCB and
suspended solids levels in the vicinity of removal operations and the downstream impacts of the realoperations. This program also represents the confirmatory sampling effort wherein sediment sampleswill be collected after removal, backfilling, and capping to ascertain the degree of cleanlinessachieved. This program begins the year before the start of construction and continues until
construction is completed. Depending on the alternative, construction is assumed to require either
five or seven years. Thus, the construction monitoring program will have a duration of either six or
eight years.
This program will continue the water column and fish monitoring begun under the design
support program. It is important that these efforts begin prior to initiation of remedial operations
400565
to establish a baseline for subsequent comparisons during and after construction. Caged fish will
not be monitored during the actual construction period.
During the construction period, monitoring of two important water column elements has been
included. The first is the monitoring of suspended solids in the vicinity of the dredging operations.Twice-daily measurements of suspended solids via turbidity meter will be made upstream anddownstream of each dredge. Approximately five percent of the turbidity measurements will be
confirmed by a direct suspended solids measurement. These measurements will serve to monitorthe escape of suspended solids from the dredging operations and to trigger the subsequent programelement when turbidity exceeds a specific threshold. In this instance, a water column time-of-travelevent will be initiated. These events represent water column sampling in addition to the weeklymonitoring events described for MNA. In these events, the water column monitoring will be
conducted to track the plume of increased turbidity as it travels downstream and assess its potentialimpacts. It may also be possible to correlate turbidity and PCB measurements in order to establish
a turbidity threshold which, if exceeded, may trigger modifications to dredging operations.
The sediment monitoring task under construction monitoring is designed to document the
degree of cleanup achieved by the remediation activities. Specifically, it consists of sediment core
collection in the remediation zones after removal, backfilling, and capping. Where removal of PCB-
contaminated sediments has been conducted, core collection will serve to document the removal ofthe PCB inventory and the attainment of acceptable PCB concentrations. The task has beenestimated assuming that the dredged areas will exhibit the same level of variability as seen in the
historical data. Thus the requirement of 36 cores per 5-acre unit as described previously is used in
the estimate. Confirmatory sampling for the backfill program will be implemented to document an
acceptable PCB level in the backfill as well as a sufficient thickness of material. Since only cleanbackfill (non-PCB contaminated material) will be used, a less intense sampling program (15 coresper 5-acre unit) will be implemented.
The capping alternative also requires confirmatory sampling. In those areas slated for •*"oremoval without subsequent capping, the sampling density will be the same as that for the all ^
o\removal programs. For areas to be capped, confirmatory coring is only required once the cap is in °*place. Areas to be partially dredged do not require post-dredge sampling since the sediment removal
5-49 TAMS
in these areas is only designed to permit emplacement of the cap. Sampling density for the capped
areas is estimated to be the same as for the backfill component.
In all three programs, the ultimate rate of sampling will need to be adjusted once the successrate and degree of homogeneity of the remaining sediment have been tested during the remediation
itself. Core lengths will be limited to about four inches with deeper sediments obtained in about tenpercent of the coring locations. Core depths for the capped areas will be limited to four inches intothe impermeable cap material, so as not to fully penetrate the cap. Hydration of the cap material ismore complete on the exterior surfaces than in the interior of the layer. Additional hydration of freshcapping material, surrounding the core site, will generally result in self-healing of the impermeable
layer.
The last program element under construction monitoring is geophysical surveying, designed
to document the physical volume of sediment removed and the backfill or capping material installed
on the river bottom. This will be done by simple bathymetry as well as acoustic imaging of the
sediment type (side-scan sonar).
Acoustical surveys will be conducted to obtain bathymetric data and surface sediment
characteristics for all areas of sediment removal. These surveys will be conducted after sediment
removal to determine the volume and depth of sediment removed. These surveys will be completedprior to any confirmatory sediment core collection. Multi-beam surveys will also be performed to
confirm the volume and thicknesses of backfill and capping material. For dredged areas, thisrepresents a single additional survey after the backfill material has been installed. For the capped
areas, two surveys will be required. The first follows the placement of the cap to assess the successof the installation and the thickness installed. A second survey will be required after the backfill has
been installed to confirm that the specified thickness has been placed.
In addition to the program elements identified above, it is likely that an air monitoring
program will be implemented in the vicinity of the transfer facilities to verify the performance ofmeasures designed to prevent or minimize impacts to workers and the community during
remediation.
5-50 400567 TAMS
5.2.7.4 Post-Construction Monitoring Program
The post-construction monitoring program is essentially similar to the MNA program, but
is initiated after remediation. Initially, the frequency of data collection is similar to that of the MNA
program. Unlike monitored natural attenuation alone, however, it is anticipated that the need forfrequent monitoring will decline several years after active remediation is completed, at least for the
sediment removal alternatives. Thus, monitoring is limited to ten years for these alternatives.Monitoring is planned for 25 years for the capping alternative, since the performance of the cap mustbe routinely verified.
The purpose of the post-construction monitoring program is to document the success of theremedial measures in reducing PCB levels in the water, sediments, and fish of the Hudson River.Thus, this program involves the sampling of all three media. For the removal alternatives, after theinitial, intense monitoring period, monitoring decreases to quarterly time-of-travel monitoring, and
the float surveys are discontinued. Water column monitoring of suspended solids also decreasesfrom daily measurements to monthly. The periods specified above are best estimates needed for cost
estimation.
The fish monitoring program for the post-construction period is identical to that of MNA,with the one exception discussed below. The purpose is to closely monitor fish body burdensthroughout the Hudson River as they respond to the remedial efforts. These results will serve todocument the expected decline in fish body burdens and provide the data needed by NYSDEC to
regulate and eventually reopen the Hudson fishery when appropriate. Because fish body burdens
are not predicted to meet PRGs over the model forecast period, even under the most extensiveremedial programs, the fish monitoring program is projected to be required indefinitely. Costs are
estimated for the entire 25-year post-construction period.
In addition to the regular fish monitoring described above, caged fish will also be deployed
and collected in the post-construction period to monitor the impacts of water-column exposures to *
fish after construction. These data provide a basis for establishing the impact of the upstream eno^
dredging efforts on downstream fish exposure. This program will be implemented for ten years. °°
5-51 TAMS
The sediment monitoring program consists of two tasks, the first designed to document the
long-term response of the river to the remediation, and the second to monitor changes in the
remediation areas themselves. The first task is the collection of dated sediment cores that has been
previously discussed. The fact that cores integrate the annual deposition of sediment enablesdocumentation of the long-term recovery of the Hudson, because within this annual deposition is
clear evidence of the PCB load carried by the river. The duration of this task for the three removalalternatives extends 9 years, with coring events in years 1,4, and 9. For the capping alternative, thesampling program duration is 25 years, with coring events in years 1,4, 9, 14,19, and 24.
The second sediment monitoring task involves monitoring the remediation areas to documentthe changes, if any, in the thicknesses of the backfill material and its level of contamination. It willalso document any recontamination of surface sediments. Specific to the capping category, thissampling will also verify the integrity of the cap by showing that the capping material has not been
exposed due to loss of backfill material. Thus the sediment sampling program is substantially longer
for the cap alternative than for the removal alternatives. Specifically, for the removal category, 250
locations will be occupied on three separate occasions, that is, years 1, 4, and 9 of the
post-construction period. For the capping category, the cap will be sampled in years 1,4, 9,14, 19,
and 24. While the exact number of locations that would be applicable has not been determined, thecost estimate is based on sampling at approximately 500 locations.
Geophysical surveys will be conducted on a routine basis during the post-construction period.
These surveys will monitor changes in the installed backfill and capping material and identify areas
undergoing scour or deposition. These data will be important to the capping option since they canbe used to assess the long-term integrity of the cap. The program is similar to the geophysical surveyplanned for the construction monitoring program and will use the geophysical survey data from that
program as a baseline for comparison. The geophysical surveys will also be used as an aid in placingthe 250 to 500 sediment core locations under the sediment monitoring program.
5.2.7.5 Monitoring Program Summary
The proposed monitoring programs cover an extensive range of alternative possibilities.
Monitoring of water, sediment, and fish is involved in each of the programs discussed, and in each
5-52 400569 TAMS
case, the importance of building on the current monitoring program while obtaining additional data
has been emphasized. This aspect is important since a large historical record exists for the Hudson
River that will aid in the interpretation of future results. In the same vein, the monitoring programs
are quite extensive in order to sufficiently document changes in the conditions of the river. By
extensively monitoring, deviations from the anticipated behavior under each remedial alternative canbe identified as early as possible, allowing for further actions if required. As the river achieves the
expected response and meets or exceeds the anticipated PCB concentrations or loads, it may be
appropriate to reduce the frequency of monitoring in one or more media. This possibility has beenconservatively addressed in some programs, depending upon the permanence of the remedialalternative and the anticipated recovery of the river. Ultimately, the decision to reduce monitoringcan only be made during the monitoring period itself.
5.3 Potential Remedial Action Alternatives
Development of potential remedial alternatives was performed based on an evaluation of thedata used to delineate remediation target threshold boundaries and the four-step modeling evaluationfor alternative scenarios summarized in subsection 5.3.1 below and presented in detail in Appendix
D. The evaluation also considered the potential uncertainties associated with model predictions and
other lines of evidence, as described in Appendix D.
Subsection 5.3.2 describes the screening factors and metrics used to evaluate modelscenarios. This evaluation was performed to narrow the field of potential alternatives while
preserving an appropriate range of options. A list of potential alternatives assembled for screening
in Chapter 6 (within the four alternative categories described above in Section 5.2) is provided insubsection 5.3.3.
5.3.1 Modeling Evaluation of Alternative Scenarios
Modeling of remedial alternative scenarios is described in detail in Appendix D andi£>
summarized briefly in this section. Modeling of remedial alternative scenarios was performed in °four stages: 1) modeling of No Action and Monitored Natural Attenuation, 2) preliminary modeling, <i
o3) engineering modeling, and 4) refined engineering modeling. Preliminary modeling scenarios
5-53 TAMS
involve initial model experiments that did not consider engineering constraints in detail.
Engineering modeling scenarios involve a series of experiments that incorporated engineering
constraints, to further explore the effects of various approaches to remediation, upstream boundaryconditions, and target thresholds. Refined engineering modeling scenarios involve modeling ofpotential remedial alternatives. At each stage of the modeling, the results were used to refine thescope of modeling in the next stage.
5.3.1.1 No Action and Monitored Natural Attenuation Modeling
The No Action and MNA alternatives provide the baseline against which active remedialalternatives are evaluated. These scenarios are obtained by running the model over a 70-yearforecast period (through 2067) without application of active remediation for the sediments. Modelforecasts of the impacts of No Action provide a best estimate of long-term trends at the reach-
averaged scale, based on currently available data. These forecasts are, however, subject to
considerable uncertainty relative to projections of specific years in which RAOs or other targets are
achieved. Similarly, the forecasts are also subject to considerable uncertainty relative to active
remedial alternatives that remove sediments with high concentrations of PCBs from the river or
provide an engineered barrier to contact between these sediment PCBs and the water column and
biota. In addition, the reach-averaged model predictions are not necessarily representative of trendsat the more localized scales at which resident fish feed. This is suggested by the comparison ofmodel predictions and recent observed trends in fish and surface sediment concentration in and near
the NYSDEC fish sampling location near Griffin Island in the southern end of River Section 1, as
described in Appendix D. Based on the trend analysis results, an alternative bounding calculation
for No Action and MNA was performed using a slowly-declining cohesive sediment exposureconcentration representing localized conditions in the region of sediment PCB hot spots not
experiencing burial by cleaner sediment.
Sediment and water PGB concentrations for No Action and MNA alternatives, including boththe baseline model predictions and the alternative bounding calculation, were then fed forwardthrough the FISHRAND model to produce forecasts of fish tissue concentration.
5-54 400571 TAMS

5.3.1.2 Preliminary Modeling
Preliminary modeling runs constitute simplified experiments to evaluate the general efficacy
of the different remedial alternative categories. The primary objective of the preliminary level FSmodeling was to evaluate the general effectiveness of the three remedial alternative categories,Alternative Categories 3, 4, and 5, described above in subsection 5.1.2, relative to No Action andMNA. Thirteen preliminary level remediation scenarios were simulated using the coupled
mathematical models described previously to determine the effects of remediation (capping,dredging, and capping with dredging) on the resulting concentrations of PCBs in fish and surfacewater quality in River Sections 1 , 2, and 3 of the Upper Hudson River (see Appendix D for details).
As stated earlier, based on results from the preliminary level modeling, Alternative Category 3(Capping of Target Areas and MNA) was eliminated from further consideration.
5.3.1.3 Engineering Modeling
The primary objective of the engineering level modeling was to evaluate the general
effectiveness of the 2 active remedial alternative categories, Alternative Categories 4 and 5,
described above, against No Action and MNA. Twenty-one engineering level remedial alternative
scenarios were simulated to determine the effects of remediation (capping with dredging, and
dredging) on the resulting concentrations of PCBs in fish and surface water quality in River Sections1, 2, and 3 (see Appendix D for details). These include 1 1 removal (dredging) alternative scenariosand 10 containment (capping with dredging) alternative scenarios. These 21 alternative scenarios
include three that test the effects of changes to the assumed upstream Tri+ PCB load at Rogers
Island. In addition to these 21 scenarios, three additional removal alternative scenarios weresimulated to test model sensitivity to residual sediment concentrations, and three additionalcontainment (capping with dredging) alternative scenarios were simulated to test model sensitivity
to partial failure of the containment or improper placement of the cap.
For most of the engineering model simulations, the upstream boundary condition at FortEdward (Rogers Island) was set at a constant concentration of 10 ng/L Tri+ PCBs. The maindifferences between the model input for these engineering level modeling alternative scenarios andthe preliminary level modeling alternative scenarios are the basic assumptions for delineating areas
5-55 TAMS
oo
for sediment removal (dredging) or containment (capping with dredging). The preliminary level
modeling alternatives were based on theoretical removal to a target MPA calculated from the PCB
concentrations for the sediment sampling points in the database, whereas the engineering levelalternatives take into consideration actual physical limitations due to the size and capacity ofconstruction equipment (dredges and barges) and access issues (presence of rocky areas, dams, andavailable water depths), as well as the heterogeneity of the PCB distribution in the sediment. For
practical reasons, small but isolated areas of high PCB concentration were excluded from beingtargeted, whereas small areas of low concentration within larger target areas were included. Adetailed discussion of the development of target threshold boundaries is provided in Section 3.5.
The general conclusions from the engineering modeling results are as follows:
• At the scale of the model segments, long-term predictions of Tri+ PCB concentrations in
River Sections 1,2, and 3 are controlled by assumptions of boundary conditions for upstream
Tri+ PCB loads.
• The model predicts large differences in Tri+ PCB concentrations in water, sediment, and fish
immediately following remediation, with later results converging to the No Action trajectory,
controlled by the upstream boundary. The rate of convergence of these predictions (and thusthe apparent value of remediation) is controlled by model calibration assumptions of the rateof natural decline of Tri+ PCB surface sediment concentrations, which are subject to
uncertainty. Rapid convergence is not predicted using the estimated upper bound of the NoAction and MNA alternatives (Appendix D). This suggests that fish tissue concentrationsin localized areas, including important habitat and fishing areas such as the historical fishsampling location near Griffin Island in the southern end of River Section 1, may decline at
rates that are much slower than those predicted by the model at the reach-averaged scale.
• Predictions of non-cohesive sediment Tri+ PCB concentrations are strongly dependent onthe target threshold boundaries (degree of remediation), and extensive remediation of diffusecontamination is required in River Section 1 to achieve a substantial decline in Tri+ PCB
concentrations in water, sediment, and fish. Concentrations of Tri-i- PCBs in the water
column at the TI Dam are most strongly related to the non-cohesive sediment concentrations.
5-56 TAMS

Downstream of the TI Dam, the concentration of Tri+ PCBs in the water column at the TIj ,I Dam is the most important factor controlling water column exposure.
jj 5.3.1.4 Refined Engineering Modeling
(i In this fourth and final stage of the modeling of alternative scenarios, the upstream boundaryI condition was changed from a constant Tri+ PCB concentration boundary to a constant Tri+ PCB
i load boundary condition. The upstream PCB loads are associated with bedrock seeps and are notr , strongly flow-dependent. Therefore, a constant Tri+ PCB load boundary is more appropriate than-^ a constant Tri+ PCB concentration boundary. The revised current constant Tri+ PCB load boundaryI: ; condition of 0. 1 6 kg/day rate represents the average daily load based on 1 997- 1999 GE monitoring1 data, and is equivalent to a Tri+ PCB concentration of approximately 1 3 ng/L under average annual
I flow conditions.
For all refined engineering alternative scenarios except No Action, further source control«*»*,
measures are assumed in the vicinity of the GE Hudson Falls plant due to a separate NTCRA that
are expected to substantially reduce the PCBs in the upstream water column. Specifically, for theseruns, the upstream load was assumed to step down from 0.16 kg/day (approximately 13 ng/L) to
0.0256 kg/day Tri+ PCB (approximately 2 ng/L) on January 1, 2005. The 2 ng/L level wasdetermined to be reasonable for further source control at Hudson Falls, coupled with the smallongoing load from upstream of the GE plants.
Several capping with dredging and several removal alternative scenarios were evaluated thatrepresent a full range of remediation in each of the three river sections. These alternative scenarioswere then evaluated based on several criteria including the reductions in the predicted fish bodyburdens and water quality in each of the three river sections as compared to No Action and the
predicted cumulative Tri+ PCB flux over the Federal Dam.
5.3.1.5 Scenario Nomenclature System *•
A specialized nomenclature system was used to designate the remedial scenarios (potentialremedial alternatives) for the engineering modeling and refined engineering modeling; this
5-57 TAMS

nomenclature system differs from that used in the preliminary modeling. The first part of the— iscenario name uses three or more letters to describe the remedial alternative category, e.g., removal
(REM) or capping with dredging (CAP). The second part of the remedial scenario name usesi
numbers or letters to denote the remediation target area for each of the three river sections defined |in Chapter 3 and the extent of remediation within each river section, sequentially from River Section f
1 to River Section 3. The remediation designations are: !
f• 0: refers to Full-Section remediation (in other words, the remediation of all sediments '
within the river section) and designates the target areas with PCB MPA of 0 g/m2 or f;
greater; f":-
i''• 3: refers to Expanded Hot Spot remediation and designates target areas based primarily
on a PCB MPA of 3 g/m2 or greater; \
• 10: refers to Hot Spot remediation and designates target areas based primarily on a PCB '•MPA of 10 g/m2 or greater; —
• Select: refers to remediation of selected areas in River Section 3, designated based on
additional criteria such as depth of burial by cleaner sediments and potential for scour !not represented by the model, as explained in subsection 6.4.1.1;
• MNA: refers to monitored natural attenuation of the sediments only (i.e., no target areas are
designated). '••'_
Therefore, by this nomenclature system, the alternative that involves Full-Section capping
with dredging in River Section 1, Expanded Hot Spot capping with dredging of sediments (at or
above nominal PCB MPA of 3 g/m2) in River Section 2, and no remediation of sediments (MNA i
only) in River Section 3, would be designated as CAP-0/3/MNA. Full-Section remediation wasexcluded in River Section 3 because it would require remediation of an unreasonably large area(more than 2,800 acres) and there are limited data in areas other than the five hot spots in thissection.
5-58 400575 TAMS

5.3.1.6 List of Alternative Scenarios for Evaluation
The various engineering and refined engineering model runs are listed below. Included inthe list are the model run number, the designation of the alternative to which the model runcorresponds, and a summary of the upstream boundary conditions assumed for the run. The varioussensitivity analysis runs are also included in the list below.
ooen^3a\
5-59 TAMS

Engineering Modeling
Run No.
El
E2
E3
E4
E5
E6
E7
E8
E9
E10
Ell
E12
E13
E14
E15
E16
E17
E18
Alternative Designation
REM-0/0/3
REM-0/3/3
REM-3/3/3
REM-10/10/10
REM-3/10/10
REM-0/O/MNA
REM-0/3/MNA
CAP-3/3/3
CAP-10/10/10
CAP-3/10/10
CAP-0/3/MNA
CAP-0/MNA/MNA
CAP-3/MNA/MNA
CAP-0/O/MNA
CAP-3/3/MNA
REM-0/10/MNA
REM-0/10/10
CAP-0/10/10
Tri+ PCB Upstream Boundary Condition
Constant at 10 ng/L
Constant at 10 ng/L
Constant at 10 ng/L
Constant at 10 ng/L
Constant at 10 ng/L
Constant at 10 ng/L
Constant at 10 ng/L
Constant at 10 ng/L
Constant at 10 ng/L
Constant at 10 ng/L
Constant at 10 ng/L
Constant at 10 ng/L
Constant at 10 ng/L
Constant at 10 ng/L
Constant at 10 ng/L
Constant at 10 ng/L
Constant at 10 ng/L
Constant at 10 ng/L
Sensitivity to change in upstream boundary condition
Run No.
E3B
E3C
E8B
Alternative Designation
REM-3/3/3
REM-3/3/3
CAP-3/3/3
Tri+ PCB Upstream Boundary Condition
Constant at 0 ng/L
Constant at 30 ng/L
Constant at 0 ng/L
5-60 400577 TAMS
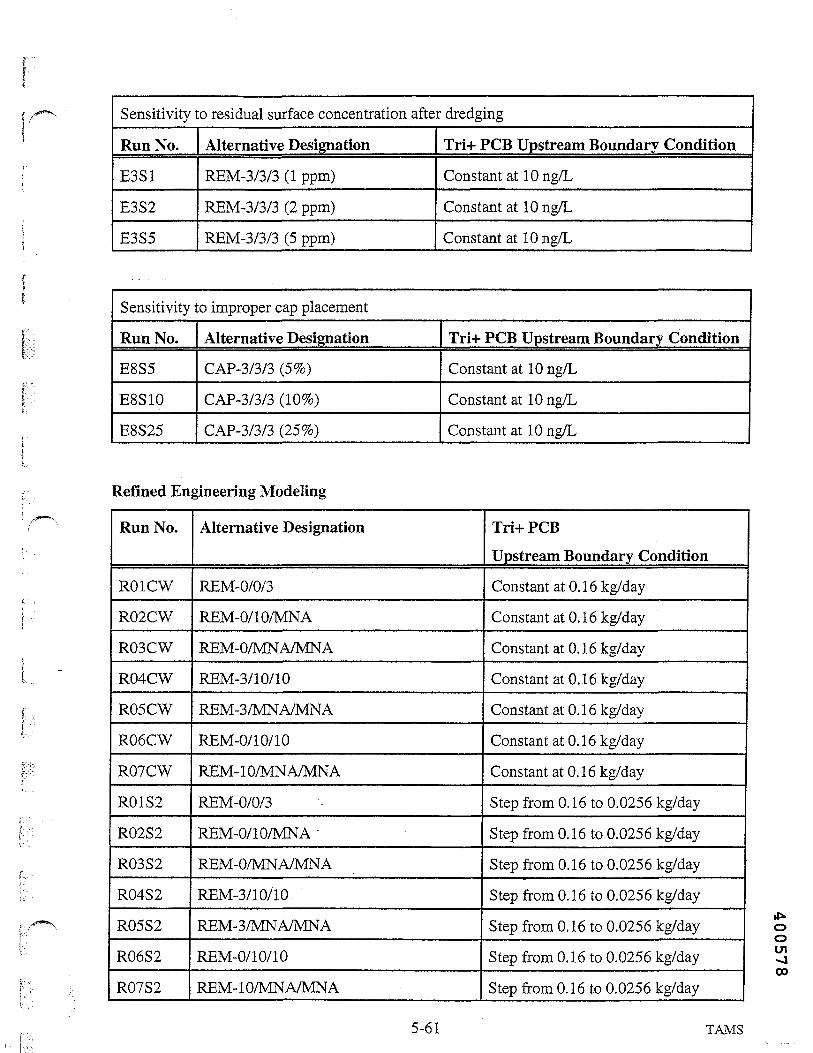
Sensitivity to residual surface concentration after dredging
Run No.
E3S1
E3S2
E3S5
Alternative Designation
REM-3/3/3 (1 ppm)
REM-3/3/3 (2 ppm)
REM-3/3/3 (5 ppm)
Tri+ PCB Upstream Boundary Condition
Constant at lOng/L
Constant at 10 ng/L
Constant at 10 ng/L
Sensitivity to improper cap placement
Run No.
E8S5
E8S10
E8S25
Alternative Designation
CAP-3/3/3 (5%)
CAP-3/3/3 (10%)
CAP-3/3/3 (25%)
Tri+ PCB Upstream Boundary Condition
Constant at 10 ng/L
Constant at 10 ng/L
Constant at 10 ng/L
Refined Engineering Modeling
Run No.
R01CW
R02CW
R03CW
R04CW
R05CW
R06CW
R07CW
R01S2
R02S2
R03S2
R04S2
R05S2
R06S2
R07S2
Alternative Designation
REM-0/0/3
REM-0/10/MNA
REM-0/MNA/MNA
REM-3/10/10
REM-3/MNA/MNA
REM-0/10/10
REM-10/MNA/MNA
REM-0/0/3 :
REM-0/10/MNA -
REM-0/MNA/MNA
REM-3/10/10
REM-3/MNA/MNA
REM-0/10/10
REM-10/MNA/MNA
Tri+ PCB
Upstream Boundary Condition
Constant at 0.16 kg/day
Constant at 0. 1 6 kg/day
Constant at 0.16 kg/day
Constant at 0. 1 6 kg/day
Constant at 0.16 kg/day
Constant at 0.16 kg/day
Constant at 0. 1 6 kg/day
Step from 0. 16 to 0.0256 kg/day
Step from 0.16 to 0.0256 kg/day
Step from 0.16 to 0.0256 kg/day
Step from 0.16 to 0.0256 kg/day
Step from 0.16 to 0.0256 kg/day
Step from 0.16 to 0.0256 kg/day
Step from 0.16 to 0.0256 kg/day
OOcn<ioo
5-61 TAMS

R01SO
R08S2
R09S2
R10S2
R11S2
R12S2
R13S2
R14S2
R15S2
R16S2
R17S2
R18S2
R19S2
REM-0/0/3
REM-0/0/3 with polygonal weighting(pw)
REM-3/10/10 (with pw)
REM-10/MNA/MNA (with pw)
REM-3+Channel/10/36-37
REM-0/10/36-37
REM-3/10/36-37
REM-3/10/Select + channel to implement
CAP-3/10/Select + channel to implement
REM-0/0/3 + channel to implement
CAP-0/10/36-37
CAP-0/10/MNA
CAP-0/MNA/MNA
Step from 0.16 to 0.0 kg/day
Step from 0.16 to 0.0256 kg/day
Step from 0.16 to 0.0256 kg/day
Step from 0.1 6 to 0.0256 kg/day
Step from 0.16 to 0.0256 kg/day
Step from 0.16 to 0.0256 kg/day
Step from 0.16 to 0.0256 kg/day
Step from 0.16 to 0.0256 kg/day
Step from 0.16 to 0.0256 kg/day
Step from 0. 16 to 0.0256 kg/day
Step from 0.16 to 0.0256 kg/day
Step from 0.16 to 0.0256 kg/day
Step from 0.16 to 0.0256 kg/day
Sensitivity to residual surface concentration after dredging
Run No.
R14S2-0
R14S2-2
R14S2-5
Alternative Designation
REM-3/10/Select (0 ppm)
REM-3/10/Select (2 ppm)
REM-3/10/Select (5 ppm)
Tri+ PCB Upstream Boundary Condition
Step from 0.16 to 0.0256 kg/day
Step from 0.16 to 0.0256 kg/day
Step from 0. 16 to 0.0256 kg/day
Sensitivity to improper cap placement
Run No.
R15S2-15
R15S2-25
Alternative Designation
CAP-3/1 0/Select (15%)
CAP-3/10/Select (25%)
Tri+ PCB Upstream Boundary Condition
Step from 0.16 to 0.0256 kg/day
Step from 0.16 to 0.0256 kg/day
5-62 400579 TAMS

5.3.2 Factors and Metrics for Evaluation of Model Scenarios
As can be seen from the list above, a wide range of possible scenarios was explored. Thealternative scenarios were evaluated by comparing various factors including the:
• Mass of PCBs, areas and volumes of sediment targeted for remediation;• • Area capped;• Volume of sediment removed;• Surface water quality in each river section;• Fish body burdens in each river section; and the• PCB load over Federal Dam.
Relative improvements in surface water quality, fish body burdens, and the load over FederalDam obtained by incremental changes in the mass of PCBs, areas, and volumes of sediment targeted
for remediation in each river section among the alternative scenarios were also examined.
After comparing the results for the scenarios, based on these factors, the following ten activeremediation alternatives were developed for alternative screening in addition to the No Action andthe MNA alternatives:
Alternative REM-10/MNA/MN A;
Alternative REM-0/MNA/MNA;
Alternative REM-3/1 0/10;
Alternative REM-0/ 1 0/MN A;
Alternative REM-0/10/10;Alternative REM-0/0/3;Alternative CAP-0/MNA/MNA;
Alternative CAP-3/10/10;Alternative CAP-0/10/MNA; andAlternative CAP-0/10/10.
ui00o
5-63 TAMS

For all of these alternatives, it is assumed that a separate source control NTCRA is performed
in the vicinity of the GE Hudson Falls facility and that naturally occurring attenuation processesfurther reduce the toxicity, mobility, and volume of the remaining PCBs in the Upper Hudson Riversediments after construction is completed.
This evaluation was performed to narrow the field of potential alternatives while preservingan • adequate range of options (degree of remediation). For example, alternative REM-10/MNA/MN A is the least extensive alternative, consisting of Hot Spot remediation in River Section
1 (the TIP) and MNA alone in River Sections 2 and 3. Alternative REM-0/MNA/MNA involves
Full-Section remediation in River Section 1 and MNA in River Sections 2 and 3. Alternative CAP-
0/MNA/MNA is a similar alternative that uses a combination of capping and dredging to performFull-Section remediation in River Section 1 and depends on MNA in River Sections 2 and 3.Alternative REM-3/10/10 involves Expanded Hot Spot removal from River Section 1, andHotSpot
removal from River Sections 2 and 3. Alternative CAP-3/10/10 is a similar alternative that uses a
combination of capping and dredging to perform Expanded Hot Spot remediation in River Section
1, and Hot Spot remediation in River Sections 2 and 3. No capping is performed in River Section
3 for this alternative because the remediation target areas in this section are relatively small.
Alternative REM-0/10/MNA is a more extensive alternative that involves Full-Section
removal in River Section 1, Hot Spot removal in River Section 2 and depends on MNA in River
Section 3. Alternative CAP-0/10/MNA is a similarly extensive alternative that uses a combination
of capping and dredging to perform Full-Section remediation in River Section 1 and Hot Spot
remediation in River Section 2, and depends on MNA in River Section 3. In order to address
potential scouring of hot spots by flows from the Hoosic River in River Section 3, Alternative REM-O/10/10 is a more extensive alternative that involves Full-Section removal in River Section 1 and Hot
Spot removal in River Sections 2 and 3. Alternative CAP-0/10/10 is a similarly extensive alternative
that uses a combination of capping and dredging to perform Full-Section remediation in RiverSection 1 and Hot Spot removal in River Sections 2 and 3. No capping is performed in RiverSection 3 for this alternative because the remediation target areas in this section are relatively small.Finally, Alternative REM-0/0/3 is the most extensive alternative evaluated and includes Full-Section
removal in River Sections 1 and 2 and Expanded Hot Spot removal in River Section 3.
5-64 400581 TAMS

5.3.3 Listing of Potential Remedial Action Alternatives
Based on the evaluation process summarized above and described in detail in Appendix D,
the following twelve alternatives (in four alternative categories, and listed below in order of
increasing remediation target areas) were retained for screening based on effectiveness,I implementability, and cost, described in Chapter 6:
I No Action (without separate source control)
i!:•;••
K3 Monitored Natural Attenuation (with separate source control)
f?K.I • :[•'1 Capping with Dredging Alternatives (assumes separate source control)
CAP-0/MNA/MNA (R03S2)
i CAP-3/10/10 (R09S2)!'/""^ CAP-0/10/MNA (R02S2)
; CAP-0/10/10 (R06S2)
[ ; Removal Alternatives (assumes separate source control)
REM-10/MNA/MNA (R10S2)
REM-0/MNA/MNA (R03S2)
REM-3/10/10 (R09S2)
REM-0/10/MNA (R02S2)
REM-0/10/10 (R06S2)REM-0/0/3 (R08S2)
0o010010
5-65 TAMS

n05
400583
6. SCREENING OF REMEDIAL ACTION ALTERNATIVES
In this chapter, the alternatives listed in subsection 5.3.3 are screened based on the criteriaof effectiveness, implementability, and cost. This screening step was performed as required by
CERCLA and the NCP to narrow the field of remedial alternatives that are subject to the detailedanalysis presented in Chapter 8.
6.1 Evaluation Criteria and Approach
The screening criteria discussed herein conform to the remedy selection requirements setforth in Section 121 of CERCLA, the NCP [40 CFR 300.430(e)(7)], and the RI/FS Guidance. Thethree criteria used for the initial screening of alternatives are effectiveness, implementability, and
cost.
6.1.1 Effectiveness
Effectiveness criteria are based on the outline presented in CERCLA, Section 121(b) andSection 300.430(e)(7)(I) of the NCP. The primary criterion in screening the effectiveness of aremedial alternative is its ability to protect human health and the environment. Other factors
considered are:
• The ability of a remedial alternative to reduce the toxicity, mobility, or volume ofcontamination through treatment;
• The capability of an alternative to attain the potential ARARs presented in Chapter 2;
• The impact of the long-term uncertainties associated with land disposal;
• The persistence, toxicity, and mobility of the hazardous substances, and their propensity tobioaccumulate;
• Short-term and long-term potential for adverse human health effects due to exposure tocontaminants;
i£*• How quickly an alternative achieves protection; o
m00
6-1 TAMS
• The potential for future remedial action costs if the remedial alternative in question were to ^
fail; and• The potential threat to human health and the environment associated with excavation,
transportation, and redisposal or containment.
For this FS, the effectiveness criterion is evaluated by comparing, among other factors, thespecies-weighted average PCS concentrations in fish fillet as modeled for each alternative to therisk-based PRGs for human health; comparing the predicted surface water quality for each alternativewith the chemical-specific ARARs for water quality; and comparing the predicted Tri+ PCB loadover the Federal Dam for each alternative in the years 2003 (before remediation), 2011 (soon aftercompletion of the most aggressive remediation), and 2035 (25 years after completion of the most
aggressive remediation). This evaluation is performed by noting the relative magnitude of the areas
and volumes of contaminated sediments targeted for remediation by a particular alternative in
comparison with other similar alternatives.
6.1.2 Implementability
Implementability is considered in the screening process as a measure of the technical andadministrative feasibility of constructing, operating, and maintaining a remedial action. Factors
considered in this evaluation include:
• The ability to construct and operate alternative technologies within site-specific andtechnology-specific regulations and constraints. Technical aspects to be considered include
operation, maintenance, monitoring, and post-implementation support.
• The ability to obtain necessary approvals from other offices and agencies. For off-siteactions, this includes the ability to comply with permitting requirements that are legallyapplicable to the'response action; and
• The availability of key alternative components, including equipment and technicalspecialists; treatment, storage, and disposal services; and capacity and the time required forinstallation (and startup, if necessary) of a remedial system.
6-2 400585 TAMS
6.1.3 Cost
The intent of the cost screening is to make order-of-magnitude comparisons to screen outalternatives that have much higher costs than other alternatives, without providing a comparative
increase in protection. Costs are identified as advantageous (low) or disadvantageous (high) to aidin choosing among alternatives of the same type. Both capital and operation and maintenance(O&M) costs are considered. Alternatives that have excessive costs (at least an order of magnitudehigher than a comparable alternative) and do not provide an increase in protection are eliminatedfrom further consideration. Costs are used to compare on-site and off-site treatment technologiesfor screening. Costs are not used to screen between treatment and non-treatment alternatives. Costdetails are presented in the detailed analysis of alternatives, Chapter 8.
6.2 Description and Screening of Remedial Alternative Categories
In this section of the FS, each alternative developed is described and screened based on the
criteria of effectiveness, implementability, and cost. The alternatives are discussed under the broaderheadings of the four alternative types identified previously in subsection 5.1.3. Where appropriate,
elements of alternative components common to alternatives of a similar type (e.g., capping) arediscussed once, to minimize redundancy within this section. As stated in subsection 5.3.3, the
following twelve alternatives (in four alternative categories) were retained for screening. Thealphanumeric codes in the parentheses represent the model runs associated with these alternatives,as presented in subsection 5.3.1.6.
• No Action (without source control)• Monitored Natural Attenuation (with source control)
• Capping with Dredging Alternatives (with source control and monitored natural attenuation
after construction is completed)CAP-0/MNA/MNA (R03S2)
CAP-3/10/10 (R09S2) £o
CAP-0/10/MNA (R02S2) g
CAP-0/10/10 (R06S2) .'. °"
6-3 TAMS
• Removal Alternatives (with source control and monitored natural attenuation after
construction is completed)
REM-10/MNA/MNA (R10S2)REM-0/MNA/MNA (R03S2)
REM-3/10/10 (R09S2)REM-0/10/MNA (R02S2)
REM-0/10/10 (R06S2)
REM-0/0/3 (R08S2)
This list provides a range of alternatives and has been arranged in order of increasingremediation target areas.
6.2.1 No Action
6.2.1.1 General Description of No Action
For this FS, the No Action alternative consists of refraining from the active application of
any remediation technology to sediments in all three sections of the Upper Hudson River. The NoAction alternative also excludes any source control removal action (i.e., the NTCRA) near the GE
Hudson Falls plant, any administrative actions (including institutional controls, such as fishconsumption advisories, which are considered to be limited action under the NCP), and anymonitoring. As required by Section 121 (c) of CERCLA, periodic reviews will be conducted at five-
year intervals to reassess the long-term appropriateness of continued No Action.
6.2.1.2 General Evaluation of No Action
The initial evaluation of the No Action alternative based on the criteria of effectiveness,
implementability, and cost is presented below.
400587 TAMS
Effectiveness
No Action is not effective in meeting the RAOs and PRGs over the 70-year model forecastperiod. The dominant carcinogenic and non-carcinogenic risks to human health and ecological
receptors (piscivorous birds and mammals) posed by the PCB-contaminated sediments will continuefor several decades. Analyses presented in Appendix D suggest there is a reasonable probability thatthe decline in exposure concentrations and associated risks may be much slower than predicted by
the model. This is particularly true at the localized (rather than reach-averaged) scales at which fishfeed, and the bounding analysis described in Appendix D suggests that risks may potentially continueat even higher levels for substantially longer periods. The risk-based PRG for protection of humanhealth of 0.05 ppm PCBs (wet weight) in fish fillet is not met in any of the three river sections over
the 70-year model forecast period. The target concentration of 0.2 ppm PCBs (one meal per month)in fish fillets is also not met in any of the three river sections. The alternate target concentration of0.4 ppm PCBs (one meal every two months) in fish fillets is not met in River Sections 1 and 2, but
is met in River Section 3 in the year 2014, according to model estimates.
The chemical-specific ARARs for PCBs in water are 0.5 pg/L (500 ng/L) federal MCL; 0.09Mg/L (90 ng/L) NYS standard for protection of human health and drinking water sources; 1 ng/Lfederal Ambient Water Quality Criterion; 0.12 ng/L NYS standard for protection of wildlife; and
0.001 ng/L NYS standard for protection of human consumers of fish. The first two chemical-specific ARARs for the surface water are met by the No Action alternative, whereas the remainingthree chemical-specific ARARs for the surface water are not met for the entire 70-year forecastperiod. The bounding analysis described in Appendix D suggests that degradation of surface waterquality may potentially continue at even higher levels for substantially longer periods.
The annual Tri+ PCB load over the Federal Dam predicted by the model for the No Actionalternative is approximately 131 kg in 2003, 104 kg in 2011, and 63 kg in 2035. This alternativedoes not include remediation in River Section 3, and therefore does not address the seour of PCB- it>contaminated sediments associated with one-in-three-year to one-in-five-year flow events from the o
mHoosic River. These events have caused resuspension of PCB loading of 18 kg/day, equivalent to °°
the peak loads at Rogers Island attributed to releases at the Alien Mills structure at Bakers Falls
(USEPA, 1999b). Without addressing PCB-contaminated sediments downstream of the Hoosic
6-5 TAMS

River (RM 166), PCB loads over Federal Dam will likely be higher than indicated by the modelingresults.
Implementability
The complete deferral of remedial action is easily implemented from both technical andadministrative standpoints, as it requires only continued periodic re-evaluation (every five years) ofrisks to human health and the environment.
Cost
There is no capital cost associated with this alternative. All costs are associated with the five-
year reviews required by CERCLA, and these are considered to be O&M costs.
6.2.1.3 Conclusion
The No Action alternative does not actively reduce the toxicity, mobility, or volume of the
contamination through treatment. The cancer risks and non-cancer human health hazards and risks
to ecological receptors posed by fish consumption will continue to remain above acceptable levels
(PRGs) and the surface water quality will continue to be degraded for at least the next 70 years,
assuming a continued upstream load of approximately 0.16 kg/day Tri+ PCBs. No Action has beenretained for detailed analysis, in accordance with CERCLA and the NCP, to serve as a basis for
comparison with other remedial alternatives.
6.2.2 Monitored Natural Attenuation (MNA)
6.2.2.1 General Description of Monitored Natural Attenuation
The Monitored Natural Attenuation alternative includes natural attenuation of sediments,
institutional controls, long-term monitoring and modeling to track progress, and periodic reviews
at five-year intervals. This alternative would be implemented in conjunction with separate sourcecontrol (i.e., the NTCRA) in the vicinity of the GE Hudson Falls plant.
6~6 400589 TAMS
t . -v, Natural attenuation refers to the reduction of volume and toxicity of contaminants in the' sediments by naturally occurring biological, chemical, and physical processes. Attenuation processesf in sediments include biodegradation, biotransformation, bioturbation, diffusion, dilution, adsorption,! volatilization, chemical reaction or destruction, resuspension, and burial by cleaner material,f " 'i
. Unlike No Action, the MNA alternative assumes a separate source control removal actionI in the vicinity of the GE Hudson Falls facility. In order to address the upstream source of PCBs,
USEPA has issued an approval memorandum for an engineering evaluation and cost analysisL (EE/CA) for a non-time critical removal action (NTCRA) to address the discharge of PCBs into the
river in the vicinity of the GE Hudson Falls plant. Assuming that a viable response action is! available to address the Hudson Falls source, USEPA believes that a source control NTCRA can
>'\
reasonably be completed by January 1, 2005, if not earlier. Therefore, it is assumed that as a resultof this source control removal action, the average upstream Tri+ PCS load at Fort Edward (RogersIsland) is reduced from 0.16 kg/day to 0.0256 kg/day on January 1, 2005.
•••Institutional controls (e.g., site use restrictions) are implemented as long-term control
measures as part of this alternative. These restrictions include continuation or extension of theexisting fish consumption advisories, and catch and release restrictions.
Continued presence of large quantities of PCB-contaminated sediments in the Upper HudsonRiver may necessitate operational restrictions on future non-remedial sediment removal activities .
(such as navigational dredging), including controls on the types of dredging equipment, constraintson barge filling practices, and restrictions on handling and disposal of the contaminated dredgespoils. However, such restrictions are incorporated into the existing permitting process and do not
require separate institutional controls under a remedy. Since direct contact with sediments has not
been determined to pose unacceptable risks to human health, no restrictions on sediment disturbancefor changes to waterfront access or structures are contemplated as part of this alternative.
*>Long-term monitoring of PCBs in sediments, the water column, and biota is conducted as o
o""""" part of the MNA alternative. The purpose of the monitoring and modeling is to demonstrate that ^
ocontaminant reduction is occurring, and that the reduction is achieving regulatory requirements, suchas the NYS standard for PCBs in surface water (1 x lO'^g/l), for protection of the health of human
6-7 TAMS

consumers offish. Monitoring of various media will allow ongoing evaluation of the concentrationsand effects of PCBs in the vicinity of the river. Monitoring includes measurements of sedimentaccumulation rates or erosion/scour, PCB concentrations in the sediment by depth, bioaccumulationby benthic organisms, and the migration or harvesting of contaminated organisms. Loss ofcontaminants can be documented by historical trends or contaminant concentration distributionsshowing a reduction in the total mass of contaminants in sediments, water, and biota, or by thepresence of degradation products in sediments. The series of mathematical models for the fate,transport, and bioaccumulation of PCBs described in the RBMR (USEPA, 2000a) will be refined
and recalibrated on a regular basis as new data become available. Monitoring data are used as inputparameters and recalibration points in the mathematical models to evaluate progress of the naturalattenuation processes against the original predictions. Reviews are conducted at five-year intervals
to reassess the long-term appropriateness of continued MNA.
6.2.2.2 General Evaluation of Monitored Natural Attenuation
The initial evaluation of the MNA alternative, based on the three criteria of effectiveness,
implementability, and cost, is presented below.
Effectiveness
A substantial limitation of monitored natural attenuation, particularly where burial by cleanersediments is the primary attenuation process, is that burial occurs only in depositional areas. As
discussed in Appendix D, rates of attenuation of sediment exposure concentrations and associated
fish body burdens are likely to be much slower in localized areas than are predicted by the model at
the reach-average scale. In addition, because natural attenuation depends upon maintenance of theuncontaminated sediment layer, anthropogenic processes or severe storms may erode and scour thesediments locally and redistribute the contaminants over wide areas, even when burial is achieved.
Natural attenuation is most appropriate for those portions of the Upper Hudson River where, based
on existing data, natural sedimentation and other processes have been observed or are strongly
expected to reduce exposure concentrations, and where there are no predicted adverse impacts on
potential human or ecological receptors. Natural attenuation that depends primarily on sediment
6-8 400591 TAMS

burial is not appropriate in the navigation channel of the Champlain Canal where dredging is
required for maintenance.
MNA is not very effective in meeting the RAOs and PRGs over the 70-year model forecastperiod. Risks to human health and ecological receptors (piscivorous birds and mammals) posed bythe PCB-contaminated sediments will continue for several decades. ^The bounding analysisdescribed in Appendix D suggests that risks may potentially continue at even higher levels for
substantially longer periods. The risk-based PRO for protection of human health of 0.05 ppm PCBs(wet weight) in fish fillet is not met in River Sections 1 and 2 over the 70-year model forecast period,but is met in River Section 3 in the year 2059. The target concentration of 0.2 ppm PCBs (one mealper month) in fish fiEets is also not met in River Section 1, but is met in River Section 2 in the year2061, and is met in River Section 3 in the year 2019. The target concentration of 0.4 ppm PCBs (onemeal every two months) in fish fillets is met in River Sections 1, 2, and 3, in the years 2039, 2038,
and 2011, respectively.
The failure to achieve PCB levels below 0.2 ppm in fish tissue in River Section 1 and thenear- asymptotic approach to this value in River Section 2 reflect the importance of the assumptionof the upstream loading late in the forecast period. Even in River Section 3, an asymptotic valuearound 0.05 ppm is clearly evident. Essentially, each river section approaches a condition underwhich the assumed load at Fort Edward produces a steady-state condition between the contaminationwithin the active sediments and that in the water column. No further reduction in fish body burdenis possible without a change in the assumed upstream load.
Under this condition, differences between asymptotic values in different river sections simplyreflect the effects of dilution. River Sections 1 and 2 have similarly valued asymptotes since there
are no major tributaries to these sections and little dilution occurs. In River Section 3, three majortributaries, including the Batten Kill, Fish Creek and the Hoosic River serve to dilute the PCB loadand concentration and thus yield a much lower asymptote for the fish body burden. Only by
it*assuming a lower upstream load can lower fish body burdens be achieved in any of these sections. °
mThe uncertainty associated with the estimation of the asymptotic value is relatively large since it is vofar out on the forecast. Additionally, the actual trend of the upstream load, while it is expected todecline due to source controls, is yet to be established, adding further uncertainty to the forecast.
6-9 TAMS
The chemical-specific ARARs for PCBs in water are 0.5 jagfL (500 ng/L) federal MCL; 0.09/ug/L (90 ng/L) NYS standard for protection of human health and drinking water sources; 1 ng/Lfederal Ambient Water Quality Criterion; 0.12 ng/L NYS standard for protection of wildlife; and0.001 ng/L NYS standard for protection of human consumers of fish. The first two chemical-specific ARARs for the surface water are met by the MNA alternative, whereas the remaining threechemical-specific ARARs for the surface water are not met for the entire 70-year forecast period.The bounding analysis described in Appendix D suggests that degradation of surface water qualitymay potentially continue at even higher levels for substantially longer periods.
The annual Tri+ PCB load over the Federal Dam predicted by the model for the MNAalternative is about 131 kg in 2003, 72 kg in 2011, and 24 kg in 2035. This alternative does not
include remediation in River Section 3, and therefore does not address the scour of PCB-
contaminated sediments associated with one-in-three-year to one-in-five-year flow events from the
Hoosic River, as discussed in subsection 6.2.1.2. Without addressing PCB-contaminated sediments
downstream of the Hoosic River (RM 166), PCB loads over Federal Dam will likely be higher than
indicated by the modeling results.
Based on the modeling, it was found to be important to the long-term recovery of the river
to alleviate the upstream source of PCBs to the extent possible. Absent source control, the upstream
source is expected to become the dominant source of PCBs in fish over the long term. Source
control alone will not, however, reduce PCB concentrations in fish to acceptable levels within areasonable time frame, nor reduce the downstream transport of PCBs to acceptable levels (see
Refined Engineering Modeling results in Appendix D).
Implementability
The MNA alternative can be easily implemented because activities like monitoring,
modeling, and site use restrictions can easily be performed, and have in fact been performed to
varying extent for the past twenty years; thus the resources necessary are readily available.
Continuation of the currently existing fish consumption advisories and the catch and releaserestrictions can be readily performed. While there are documented gaps in compliance (Hudson
6-10 400593 TAMS
River angler surveys conducted in 1991/92 and 1996 indicated that about 14 percent of Upper
Hudson River anglers reported having eaten fish from the Hudson River [NYSDOH» 1999]),
implementation of such restrictions is not problematic from a technical standpoint. The
administrative challenge lies in motivating the general public into a greater degree of voluntarycompliance.
Cost
There is no construction cost associated with the MNA alternative. The estimated majorcosts associated with this alternative are monitoring, modeling, and reporting costs. Costs of
implementing institutional controls are expected to be relatively minor and are therefore notincluded. Also, there are costs associated with the five-year reviews required by Section 121(c) of
CERCLA, and all of these costs are considered to be O&M costs. Due to the additional data costs
associated with the data management requirements associated with the modeling process, includingthe cost of running and recalibrating the model, the MNA alternative will be more expensive than
No Action, but less expensive than alternatives involving active sediment remediation (capping with
dredging and removal categories, discussed later in this section). Only the costs pertaining to theriver (sediments, water column, and biota) are included; land-based remediation costs for the
NTCRA in the vicinity of the GE Hudson Falls plant are excluded for the purposes of comparisonamong alternatives.
6.2.2.3 Conclusion
The MNA alternative does not reduce the toxicity, mobility, or volume of the contamination
through treatment. Some reduction in mobility of PCB-contaminated sediments may occur in places
through burial, and some reduction in volume (in the Upper Hudson) may occur through transport
of PCBs over the Federal Dam at Troy. However, these processes are not projected to besufficiently effective to meet RAOs. Risks .to human health and the environment posed by fish
i£»consumption will continue to remain above target concentrations for at least the next 40 to 45 years, ooand longer for the PRO (0.05 ppm PCB in fish fillet). Based on the modeling, it was found to be Q
&important to the long-term recovery of the river to alleviate the upstream source of PCBs to the
extent possible.
6-11 TAMS
Fish consumption advisories and catch and release restrictions are the only means to protecthuman health until protective levels in fish are achieved. The continuous long-term monitoringprogram allows for providing additional warnings to local residents and the general public if anunexpected situation develops in the future. However, as described in subsection 6.2.2.2, there isevidence that the fish consumption advisories are not fully protective of human health due to gapsin compliance. Moreover, these advisories and the monitoring program have no effect in reducingthe ecological risks to piscivorous birds and mammals. Like No Action, the MNA alternative hasbeen retained for detailed analysis to serve as a basis for comparison with other remedial alternatives.
6.2.3 Capping with Dredging of Sediments in Target Areas and Monitored NaturalAttenuation (CAP) Alternatives
The four alternatives within this category are listed below:
Alternative CAP-0/MNA/MNA - The CAP-0/MNA/MNA alternative uses capping with
dredging to perform Full-Section remediation in the TI Pool (River Section 1) and MNA in
River Sections 2 and 3. This alternative also includes MNA after completion of activeremediation, and is performed in conjunction with a separate source control NTCRA in the
vicinity of the GE Hudson Falls plant.
Alternative CAP-3/10/10 - The CAP-3/10/10 alternative uses capping with dredging to
perform Expanded Hot Spot remediation in River Section 1 and Hot Spot remediation in
River Section 2. No capping is performed in River Section 3 for this alternative because the
remediation target areas in this section are relatively small and isolated from one another.
This alternative addresses potential scouring of hot spots by flows from the Hoosic River inRiver Section 3 by Hot Spot removal. This alternative also includes MNA after completion
of active remediation, and is performed in conjunction with a separate source control
NTCRA in the vicinity of the GE Hudson Falls plant.
Alternative CAP-0/10/MNA - The CAP-0/10/MNA alternative uses a combination of
capping and dredging to perform Full-Section remediation in River Section 1 and Hot Spot
remediation in River Section 2, and MNA in River Section 3. This alternative also includes
6-12 400595 TAMS
MNA after completion of active remediation, and is performed in conjunction with a separatesource control NTCRA in the vicinity of the GE Hudson Falls plant.
• Alternative CAP-0/10/10 - The CAP-0/10/10 alternative uses capping with dredging to
perform Full-Section remediation in River Section 1, and Hot Spot remediation in River
Section 2. No capping is performed in River Section 3 for this alternative because theremediation target areas in this section are relatively small and isolated from one another.
The alternative addresses potential scouring of hot spots, by flows from the Hoosic River inRiver Section 3 by Hot Spot removal. This alternative also includes MNA after completionof active remediation, and is performed in conjunction with a separate source controlNTCRA in the vicinity of the GE Hudson Falls plant.
For all above capping with dredging alternatives, after construction is completed, post-remediation monitoring of natural attenuation is conducted in river sections in which there is
Expanded Hot Spot remediation (i.e., in which the nominal MPA target concentrations are 3 g/m2
PCBs or greater) and Hot Spot remediation (i.e., in which the nominal MPA target concentrations
are 10 g/m2 PCBs or greater). Post-remediation monitoring of natural attenuation will also beconducted where Full-Section remediation is performed (i.e., where the MPA target concentrationsare 0 g/m2 PCBs or greater) but the duration of the monitoring program will be shorter.
6.2.3.1 General Description of Capping with Dredging (CAP) Alternatives
CAP alternatives involve in-river (sub-aqueous) capping of contaminated sediments within
target areas. As discussed in subsection 4.2.4.1, water depths in River Sections 1 and 2 are defined
by bathymetric data gathered in 1992. In general, relative to this category of alternatives, sediments
are capped after sediment removal to a depth of 1.5 feet (the thickness necessary to accommodate
cap installation without a change in water depth in target areas with less than 6 feet of water). Anexception is made in areas where PCB contamination is at depths of less than 1.5 to 2 feet, whereonly sediment removal is conducted. Sediments in target areas with water depths greater than 6 feet •&•
are capped without prior sediment removal, except in the navigation channel, typically defined as mvo
areas with water depth greater than 12 feet, based on existing bathymetric data. Sediments in target °*
6-13 TAMS

areas in the navigation channel are removed, but not capped. The cap is only installed in areas wherecontaminants remain after dredging.
The CAP alternatives are all performed in conjunction with a source control NTCRA in thevicinity of the GE Hudson Falls facility. It is assumed that as a result of this source control removalaction, the upstream Tri+ PCS load at Fort Edward (Rogers Island) will be reduced from 0.16 kg/dayto 0.0256 kg/day on January 1, 2005. Reviews are conducted at five-year intervals to evaluate theattainment of RAOs and PRGs.
The capping concept relies primarily on a product called AquaBlok™, which is applied tothe area to be capped using a telescoping conveyor operating from a deck barge. AquaBlok™ is a
proprietary formulation consisting of gravel particles encapsulated in a layer of bentonite to form
pellets that hydrate when applied under water and expand to form a continuous layer, typically
expanding to twice the initial product thickness. A layer of backfill material is placed on top of the
AquaBlok™ layer to protect the impermeable layer from damage and to provide suitable habitat forbenthic biota and fish. Different types of backfill material are used in different areas, based on water
depth in the area and ecological conditions prior to capping and dredging.
Sediment removal is conducted using mechanical or hydraulic dredging equipment. In the
case where mechanical dredging is utilized, the dredged/excavated sediments are transported byhopper barge or deck barge to the transfer facility, where water separated from the sediment during
transport is removed and the dredged/excavated sediment is stabilized by mixing with cement or
other appropriate pozzolanic material to absorb the remaining standing water. In the case where
hydraulic dredging is utilized, the dredged material is transported via the slurry pipeline and the
booster pumping stations to the transfer facility, where the water is separated from the sediments in
a treatment train that includes hydrocyclones, coagulation, sedimentation, and belt filters. Nostabilization is anticipated for hydraulically dredged sediments. For both dredging methods, the
water will be treated to meet the discharge criteria (e.g., NYSPDES limits) and returned to the river.
Areas from which sediments are removed are backfilled with appropriate material to isolate residualsediments that may remain after dredging is completed and to re-establish benthic habitats. Nobackfill is placed in the navigation channel.
6-14 400597 TAMS

I -^ There are five options for dealing with the sediments after removal from the river:r( • Landfill disposal (for hydraulic dredging);
• Stabilization and landfill disposal (for mechanical dredging);[ • Beneficial use as landfill cover or construction fill material (for hydraulic dredging);
• Stabilization and beneficial use as landfill cover or construction fill material (for mechanical
| dredging); and• Thermal treatment and beneficial use as manufactured commercial products such as cement,
|x; ' light weight aggregate, fiberglass, or architectural tiles (for both mechanical and hydraulicdredging).
P(•.
For the first two options, the dredged material (with or without stabilization) will berf transported off site and disposed of at a landfill. Dredged sediments with PCB concentration greater
than 50 mg/kg require disposal at a TSCA-permitted landfill. However, commercial solid wastefacilities may impose a more stringent limit of 30 to 35 mg/kg PCBs as an acceptance criterion. This^~^provides them with a factor of safety in accepting wastes. For management and final disposition ofdredged sediments for purposes of this FS, a trigger level of 33 mg/kg, not 50 mg/kg, will be usedas the PCB concentration in sediment that will differentiate between TSCA-permitted and non-
TSCA-permitted disposal. Thus, for landfill disposal associated with this category of alternatives,
material with PCB concentrations of less than 33 mg/kg will be disposed of at a solid waste landfill.Estimation of the quantities of TSCA and non-TSCA sediments is addressed in Chapter 8 (detailedanalysis).
For the third and fourth options, the dredged material (with less than 10 mg/kg PCBs) will
be transported off site (with or without stabilization) for subsequent beneficial use as landfill coveror construction fill material (depending on the application and local site-specific requirements). The
fifth option involves thermal treatment of the sediments, followed by processing the treated materialto cement or another commercial product.
j*oo
^^ (JlFor the capping with dredging alternatives, the post-remediation monitoring program consists vooo
of two components: a cap integrity verification program, and a program to monitor the PCB; concentrations in sediments, surface water, and biota. These were described in detail in Section 5.2.
6-15 TAMS
Post-remediation monitoring of natural attenuation is an implicit component of all CAP alternativesin all river sections.
6.2.3.2 General Evaluation of Capping with Dredging (CAP) Alternatives
The initial evaluation of the Capping with Dredging (CAP) alternatives, based on the threecriteria of effectiveness, implementability, and cost, is presented below.
Effectiveness
Capping is a proven technology for isolating contaminated sediments from the water columnand biota if proper design, placement, and maintenance of the cap are performed to provide capeffectiveness, continued performance, and reliability. Capping will reduce the mobility of
contaminants in the river but will not affect toxicity or volume of contaminants. Because PCB
contamination remains in the sediment, capping alternatives may be inherently less protective of
human health and the environment in the long term than removal alternatives. Even though thecapping concept is designed to. avoid failure, cap damage caused, for example, by dragging of largetrees that fall into the river during catastrophic natural events like major floods cannot be avoided.
AquaBlok™ is a manufactured product consisting of a composite of gravel particles encapsulated
with bentonite. Although AquaBlok™ is a relatively new product and has not been used at many
sites over relatively long periods of time, the effectiveness of the cap depends on bentonite, whichhas been proven as an impermeable liner material in preventing the migration of contaminants. Once
deployed through the water column, the heavy nucleus of the composite material carries thebentonite-bearing particles to the bottom where the bentonite hydrates and expands to form a
continuous impermeable mat. This was discussed in greater detail in Chapter 4.
Sediment capping may cause short-term adverse impacts to the river. These impacts include
burial of the benthic community and temporary loss of benthos and habitat for the ecologicalcommunity during capping. Replacement of the benthic habitat will be implemented through
addition of appropriate backfill material on top of the cap after cap placement. Natural benthicrecolonization following a disturbance is rapid, and in many instances the process begins within days
6-16 400599 TAMS
after perturbation. In many cases, full recovery to pre-disturbance species composition andabundance occurs within one year (Oliver and Hulberg, 1977).
Select sediment removal may also result in short-term adverse impacts to the river. Theseimpacts include exposure of contaminated sediments to the water column, fish, and biota due toresuspension of sediments during removal, and temporary loss of benthos and habitat for theecological community in dredged areas. Risks due to resuspension can be minimized throughcontrol of the sediment removal mechanics and rate, and use of an appropriate sediment barrier (seeAppendix E). Replacement of the benthic habitat will be implemented through addition of a layerof backfill material in dredged areas after sediment removal, which provides a protective layer forthe cap, reducing damage from boat anchors, bioturbation, and the like, and also serves as substratefor fish habitat.
Sediment processing at the transfer facility may pose some short-term risks (e.g., spills,accidents). Risks due to stabilization using cement or other pozzolanic material are expected to benegligible with proper handling. Transportation of contaminated sediments to off-site disposal ortreatment facilities may also pose some short-term risks to the environment (e.g., spills, accidents).If ex situ treatment of contaminated sediments is selected (higher value beneficial use option),treatment at a manufacturing facility may pose some short-term risks to the surrounding communityand environment, depending on the type of treatment conducted. Short-term risks posed byemissions from thermal treatment processes are likely to be higher than those associated with othertreatment processes such as soil washing. However, emissions can be reduced by the use of properpollution controls.
Removal and off-site disposal/treatment of contaminated sediments are permanent remediesfor the river. Sediment dredging and excavation are reliable technologies (see Section 5.2).Removal of sediments will reduce toxicity, volume, and mobility of contaminants in the river.Stabilization and disposal of sediments at properly managed land disposal facilities will reducemobility of contaminants. Thermal destruction (as included in a beneficial use option) will reduceor eliminate the toxicity and volume of contaminants.
oo
6-17 TAMS

Properly managed landfills provide reliable controls for long-term management of PCB-contaminated sediments. Stabilization and thermal destruction have been demonstrated to beeffective in treatment of PCB-contaminated sediments at other sites. Treatability studies may berequired to demonstrate the effectiveness of specific technologies in treating sediments from theUpper Hudson River.
Implementability
As described in Section 5.2, equipment and services for sediment capping are availablecommercially, as are equipment and services for sediment removal, material handling, and off-sitetransportation. In shallow areas, special equipment packages may have to be utilized. Dependingupon the locations that are eventually selected, transfer facilities with good rail access and suitablewharf facilities are expected to be available or can be developed. The potentially large volume ofmaterial required for cap construction and the large volume of sediments to be removed will requiresignificant coordination of the sediment removal activities, cap placement, and material handling andtransportation activities. A plant to manufacture the AquaBlok™ product may be set up near the siteto reduce transportation costs. However, the feasibility of establishing a plant near the site willdepend on the local availability of raw materials (i.e., gravel and clay).
Existing permitted landfills were contacted regarding capacity and it was determined thatthere is sufficient, currently available, off-site land disposal capacity for both the TSCA-regulatedand non-TSC A-regulated fractions of removed sediment (see Chapter 4).
No administrative difficulties are anticipated in getting the necessary approvals from USEPA,USAGE, and NYSDEC for capping. However, the potentially extensive sediment removal andcapping activities will result in temporary disruption of recreational uses and boating access duringremediation. Shoreline disruption has been estimated (in miles) for the specific alternativesdiscussed below in Section 6.3. The difficulty associated with this disruption is a function both ofthe total length of shoreline disruption and the value of the disturbed area. However, for thisscreening level assessment, the implementability issues associated with shoreline disruption areassumed to be a function of the length of the disturbed shoreline. Although measures to mitigate orprevent impacts and disruptions will be employed, local communities may experience some measure
6-18 TAMS400601

of inconvenience during remedial activities. Measures that will be implemented in conjunction withthis alternative category to minimize both short- and long-term disruption include:
• Accommodation of existing boat traffic during construction;• Sediment removal prior to capping in shallow areas to maintain small craft navigation depth;• Limited duration of the remediation period (a matter of months at any given location);• Shoreline stabilization and waterfront restoration;• Control of sediment removal mechanics and rates; and• Use of sediment barriers during sediment removal.
Cost
Costs for CAP alternatives vary primarily with the total volume of sediments removed andthe total area capped. In general, capital costs for a capping with dredging alternative will be lowerthan those for an alternative that involves sediment removal alone of the same target areas. This isbecause capping costs are lower than costs for dredging, off-site transport of the sediment, and finallandfill disposal or treatment followed by beneficial use. However, O&M costs for a cappingalternative will be higher than for a sediment removal alternative involving the same areas becauseof cap maintenance costs and, to a lesser extent, more extensive monitoring costs required in the longterm. Based on the total area capped for each alternative and the volume of sediments to be dredged,the most expensive CAP alternative, CAP-0/10/10 would be expected to cost about half again asmuch as CAP-3/10/10, the least extensive CAP alternative. Total O&M costs are expected to be onthe order of 15 to 20 percent of total capital costs for an alternative.
6.2.4 Removal of Sediments in Target Areas and Monitored Natural AttenuationAlternatives
There are six alternatives within this category, as follows:
Alternative REM-10/MNA/MNA - The REM-10/MNA/MNA alternative represents the
least extensive remedial option. It involves Hot Spot remediation in River Section 1 and>£>
MNA in River Sections 2 and 3. This alternative also includes MNA after completion of oa\oto
6-19 TAMS

active remediation and will be performed in conjunction with a separate source controlNTCRA in the vicinity of the GE Hudson Falls plant.
Alternative REM-0/MNA/MNA - The REM-0/MNA/MNA alternative involves Full-Section remediation in River Section 1 and MNA in River Sections 2 and 3. This alternativealso includes MNA after completion of active remediation and will be performed in Jconjunction with a separate source control NTCRA in the vicinity of the GE Hudson Falls •plant. |
IAlternative REM-3/10/10 - The REM-3/10/10 alternative involves Expanded Hot Spot |removal from River Section 1 and Hot Spot removal from River Sections 2 and 3. It |J
addresses potential scouring of hot spots by flows from the Hoosic River in River Section 1
3. This alternative also includes monitored natural attenuation after completion of active mremediation and will be performed in conjunction with a separate source control NTCRA inthe vicinity of the GE Hudson Falls plant.
Alternative REM-0/10/MNA - The REM-0/10/MNA alternative is a more extensivealternative that involves Full-Section removal in River Section 1 and Hot Spot removal inRiver Section 2, and MNA in River Section 3. This alternative also includes MNA aftercompletion of active remediation and will be performed in conjunction with a separate sourcecontrol NTCRA in the vicinity of the GE Hudson Falls plant.
Alternative REM-0/10/10 - The REM-0/10/10 alternative is a more extensive alternative
that involves Full-Section removal in River Section 1, and Hot Spot removal in RiverSections 2 and 3. It addresses potential scouring of hot spots by flows from the Hoosic Riverin River Section 3. This alternative also includes MNA after completion of activeremediation and will be performed in conjunction with a separate source control NTCRA inthe vicinity of the GE Hudson Falls plant.
• Alternative REM-0/0/3 - The REM-0/0/3 alternative is the most extensive scenario
developed. It includes Full-Section removal in River Sections 1 and 2 and Expanded HotSpot removal in River Section 3. This alternative also includes MNA after completion of
6-20 TAMS400603

active remediation and will be performed in conjunction with a separate source controlNTCRA in the vicinity of the GE Hudson Falls plant.
After construction is completed, post-remediation monitoring of natural attenuation isconducted in river sections in which there is Expanded Hot Spot remediation (i.e., in which thenominal MPA target concentrations are 3 g/m2PCBs or greater) and Hot Spot remediation (i.e., inwhich the nominal MPA target concentrations are 10 g/m2 PCBs or greater). Post-remediationmonitoring of natural attenuation will also be conducted where Full-Section remediation isperformed (i.e., where the MPA target concentrations are 0 g/m2 PCBs or greater) but the durationof the monitoring program will be shorter.
As with the CAP alternatives, the major common components of this category of alternativesare described and evaluated below. The main components of sediment removal are described briefly,and the processing, transport, treatment, and disposal of the sediments after removal from the riverare also discussed, as they are support technologies of the sediment removal option.
6.2.4.1 General Description of Removal (REM) Alternatives
Sediment removal will be conducted using mechanical or hydraulic dredging equipment. In
the case where mechanical dredging is utilized, the dredged/excavated sediments are transported byhopper barge or deck barge to the transfer facility, where water separated from the sediments duringtransport is removed and the dredged/excavated sediments are stabilized by mixing with cement orother appropriate pozzolanic material to absorb the remaining standing water. In the case wherehydraulic dredging is utilized, the dredged material is transported via the slurry pipeline and thebooster pumping stations to the transfer facility, where the water is separated from the sediments ina treatment train that includes hydrocyclones, coagulation, sedimentation, and belt filters. For bothdredging methods, the water is treated to meet the discharge criteria (e.g., NYSPDES limits) andreturned to the river. Areas from which sediments are removed are backfilled with appropriatematerial to isolate residual sediments that may remain after dredging is completed and to restorebenthic habitats. No backfill is placed in the navigation channel.
oo
6-21 TAMS

The REM alternatives are all performed in conjunction with a separate source controlNTCRA in the vicinity of the GE Hudson Falls plant. It is assumed that as a result of this sourcecontrol NTCRA, the upstream Tri+ PCB load at Fort Edward (Rogers Island) will be reduced from0.16 kg/day to 0.0256 kg/day on January 1,2005. A review will be conducted at five-year intervalsto evaluate the attainment of RAOs and PRGs.
There are five options for dealing with the sediments after removal from the river:
• Landfill disposal (for hydraulic dredging);• Stabilization and landfill disposal (for mechanical dredging);• Beneficial use as laadfill cover or construction fill material (for hydraulic dredging);• Stabilization and beneficial use as landfill cover or construction fill material (for mechanical
dredging); and• Thermal treatment and beneficial use as manufactured commercial products like cement,
light weight aggregate, fiberglass, or architectural tiles (for both mechanical and hydraulicdredging).
For the first two options, the dredged material (with or without stabilization) will be
transported off site and disposed of at a landfill. Dredged sediments with PCB concentration greaterthan 50 mg/kg require disposal at a TSCA-permitted landfill. However, commercial solid wastefacilities may impose a more stringent limit of 30 to 35 mg/kg PCBs as an acceptance criterion,providing the facility with a margin of safety in accepting wastes classified as non-PCB material.Therefore, for management and final disposition of dredged sediments for purposes of this FS atrigger level of 33 mg/kg, not 50 mg/kg, will be used as the PCB concentration in sediment todifferentiate between TSCA-permitted and non-TSCA-permitted disposal. Thus, for landfill disposalassociated with this category of alternatives, material with PCB concentrations of less than 33 mg/kgwill be disposed of at a solid waste landfill. Estimation of the quantities of TSCA and non-TSCAsediments is addressed in Chapter 8.
For the third and fourth options, the dredged material (with less than 10 mg/kg PCBs) will
be transported off site (with or without stabilization) for subsequent beneficial use as landfill coveror construction fill material (depending on the application and local site-specific requirements). The
6-22 TAMS400605

fifth option involves thermal treatment of the sediments, followed by processing the treated material(rf«g^*fc\
to cement or another commercial product.
For the removal alternatives, the post-remediation monitoring program consists of a programto monitor the PCB concentrations in sediments, surface water, and biota. This is described in detail
'•' in Section 5.2. Post-remediation monitoring of natural attenuation is an implicit component of allREM alternatives in all river sections.
6.2.4.2 General Evaluation of Removal (REM) Alternatives
' The initial evaluation of the Removal (REM) alternatives, based on the three criteria ofeffectiveness, implementability, and cost, is presented below.
Effectiveness
/""""" Removal and off-site disposal/treatment of contaminated sediments are permanent remediesfor the river. Sediment dredging and excavation are reliable technologies (see Section 5.2). Removal
of sediments will reduce toxicity, volume, and mobility of contaminants in the river. Stabilization
; and disposal of sediments at properly managed land disposal facilities will reduce mobility of
contaminants. Thermal destruction (as included in a beneficial use option) will reduce or eliminate
the toxicity and volume of contaminants.
Properly managed landfills provide reliable controls for long-term management of PCB-contaminated sediments. Stabilization and thermal destruction have been demonstrated to beeffective in treatment of PCB-contaminated sediments at other sites. Treatability studies may be
required to demonstrate the effectiveness of specific technologies in treating sediments from theUpper Hudson River.
if*Sediment removal may result in short-term adverse impacts to'the river. These impacts oo/«—^ include exposure of contaminated sediments to the water column, fish, and biota due to resuspension Q
a\of sediments during removal, and temporary loss of benthos and habitat for the ecological
•' community in dredged areas. Risks due to resuspension can be minimized through control of
6-23 TAMS
sediment removal rate and use of an appropriate sediment barrier (see Appendix E). Replacementof the benthic habitat will be implemented through addition of a layer of backfill material in dredgedareas after sediment removal, which provides isolation of residual sediments that may remain afterdredging is completed (see Appendix F). Natural benthic recolonization following a disturbance israpid, and in many instances, the process begins within days after perturbation. In many cases, fullrecovery to pre-disturbance species composition and abundance occurs within one year (Oliver andHulberg, 1977).
Sediment processing at the transfer facility may pose some short-term risks (e.g., spills,accidents). Risks due to stabilization using cement or other pozzolanic material are expected to benegligible with proper handling. Transportation of contaminated sediments to off-site disposal ortreatment facilities may also pose some short-term risks to the environment (e.g., spills, accidents).
If ex situ treatment of contaminated sediments is selected (higher value beneficial use option),
treatment at a manufacturing facility may pose some short-term risks to the surrounding community
and environment, depending on the type of treatment conducted. Short-term risks posed by
emissions from thermal treatment processes are likely to be higher than those for other treatment
processes like soil washing. However, these can be minimized by the use of proper pollution
controls.
Implementability
As described in Section 5.2, equipment and services for sediment removal are available
commercially, as are equipment and services for material handling and off-site transportation. In
shallow draft areas, special equipment packages may have to be utilized. Depending upon the
locations that are eventually selected, transfer facilities with good rail access and suitable wharffacilities are expected to be available or can be developed. The potentially large volume ofsediments to be removed will require significant coordination of the dredging/excavation efforts,
material handling activities, and off-site transportation logistics. Based on a survey of landfills
conducted for this FS, there is sufficient, currently available, off-site land disposal capacity for both
the TSCA-regulated and non-TSCA-regulated fractions of removed sediment (see Chapter 4).
6-24 400607 TAMS
No administrative difficulties are anticipated in getting the necessary approvals from USEPA,USAGE, and NYSDEC for sediment removal. However, the sediment removal activities will result
in temporary disruption of recreational uses and boating access during remediation. Shorelinedisruption has been estimated (in miles) for the specific alternatives discussed below in Section 6.3.
The difficulty associated with this disruption is a function both of the total length of shorelinedisruption and the value of the disturbed area. However, for this screening level assessment theimplementability issues associated with shoreline disruption are assumed to be a function of itslength. Although measures to mitigate or prevent impacts and disruptions will be employed, localcommunities will experience some measure of inconvenience during remedial activities. Measuresthat will be implemented in conjunction with this alternative category to minimize both short- andlong-term disruption include:
• Accommodation of existing boat traffic during construction;
• Limited duration of the remediation period (a matter of months at any given location);
• Shoreline stabilization and waterfront restoration;
• Control of sediment removal mechanics and rates; and
• Use of sediment barriers during sediment removal.
Cost
Capital costs for sediment removal, off-site transportation, and disposal or treatment arehigher compared to costs involving capping of equivalent target areas, although some of the moreextensive CAP alternatives involve more sediment removal than a few of the less extensive REMalternatives. O&M costs for a sediment removal alternative will be lower than for implementation
of a CAP alternative for an equivalent area, as removal-only alternatives do not require long-termmaintenance.
6.3 Description and Screening of Active Remediation Alternatives (CAP and REM)rf*oo
In this section, the ten active remediation alternatives in two alternative categories (capping <y>with dredging and removal) are described and screened based on effectiveness, implementability,
and cost. The major differences between these two categories (CAP and REM) have been addressed
6-25 TAMS
o°°
in Section 6.2. As can be seen from list of alternatives in subsections 6.2.3 and 6.2.4, the most
obvious difference among the specific alternatives within a particular alternative category (CAP orREM) is the target area addressed by the alternative, i.e., the degree of remediation. Further, the
range of target areas covered by the four CAP alternatives listed in subsection 6.2.3 is a subset of therange of target areas included in the six REM alternatives. Therefore, this section presents adescription and screening of the six REM alternatives. Screening of alternatives primarily focuseson differences between varying thresholds of remediation (i.e., Full-Section, Expanded Hot Spot,or Hot Spot) within the remedial alternative categories (i.e., REM or CAP). At this level of analysis,
comparisons are not made between alternatives in different categories for purposes of elimination.Although this evaluation is based on the REM alternatives, it is also representative of the CAPalternatives because the conclusions reached from a similar evaluation of corresponding CAPalternatives would be the same.
6.3.1 Description of REM Alternatives
The six alternatives in the REM (Removal) category are described below.
63.1.1 Alternative REM-10/MNA7MNA - Hot Spot Removal in River Section 1 and MNA inRiver Sections 2 and 3
This alternative includes removal of all sediments with nominal MPA greater than 10 g/m2
PCBs (Hot Spot remediation) in River Section 1 and MNA in River Sections 2 and 3, as shown on
Figure 6-1. There is no active sediment remediation in River Sections 2 and 3. The areas to be-
remediated are shown on Plate 13. The total area of sediments targeted for remediation by this
alternative is approximately 150 acres. The estimated volume of sediments to be removed is about965,000 cubic yards. This alternative involves complete or partial removal of sediments from mosthot spots from Rogers Island to the TI Dam (i.e., general locations of Hot Spots 5 through 20, except
for Hot Spots 11, 12, 13,18, and 19). (Channel maintenance dredging subsequent to NYSDEC's
delineation based on 1977/78 sampling has likely eliminated Hot Spots 1 through 4, located in the
channels around Rogers Island.) Assuming approximately 100 to 130 acres of sediment area can bedredged per year, remediation will commence in 2004 and will be completed in 2005. Sediment
. removal, handling, transport, treatment, and disposal will be conducted as described in subsection
6-26 400609 TAMS

6.2.4.1. This alternative is performed in conjunction with a separate source control NTCRA in thevicinity of the GE Hudson Falls facility and also relies on naturally occurring attenuation processes
to reduce the toxicity, mobility, and volume of the remaining PCBs in the Upper Hudson Riversediments after the construction is completed. A review of site conditions will be conducted at five-year intervals to evaluate the attainment of RAOs and PRGs.
6.3.1.2 Alternative REM-0/MNA/MNA - Full-Section Removal in River Section 1 and MNAin River Sections 2 and 3
This alternative includes removal of all sediments with MPA greater than 0 g/m2 PCBs (Full-Section remediation) in River Section 1 and MNA in River Sections 2 and 3, as shown on Figure 6-2. There is no active sediment remediation in River Sections 2 and 3. The areas to be remediatedare shown on Plate 15. The total area of sediments targeted for remediation by this alternative is
approximately 470 acres. The estimated volume of sediments to be removed is 2,030,000 cubic
yards. This alternative involves complete removal of contaminated sediments from Rogers Island
to the TI Dam, except for inaccessible areas such as rock-bound Hot Spot 12.Assumingapproximately 100 to 130 acres of sediment area can be dredged per year, remediation willcommence in 2004 and will be completed in 2007. Sediment removal, handling, transport,
treatment, and disposal will be conducted as described in subsection 6.2.4.1. This alternative is
performed in conjunction with a separate source control NTCRA in the vicinity of the GE Hudson
Falls plant and also relies on naturally occurring attenuation processes to reduce the toxicity,mobility, and volume of the remaining PCBs in the Upper Hudson River sediments after theconstruction is completed. A review of site conditions will be conducted at five-year intervals to
evaluate the attainment of RAOs and PRGs. Alternative CAP-0/MNA/MNA is a comparable
alternative that targets the same sediment areas as Alternative REM-0/MNA/MNA, but utilizes
capping with dredging to perform the active remediation. Details on areas capped and volumesremoved are shown on Table 6-1.
6.3.1.3 Alternative REM-3/10/10 - Expanded Hot Spot Removal in River Section'1 and HotSpot Removal in River Sections 2 and 3
oo
This alternative includes removal of all sediments with nominal MPA greater than 3 g/m2 £Jo
PCBs (Expanded Hot Spot remediation) in River Section 1, and removal of all sediments with
6-27 TAMS
nominal MPA greater than 10 g/m2 PCBs (Hot Spot remediation) in River Sections 2 and 3, asshown on Figure 6-3. The areas to be remediated are shown on Plates 13 and 14. The total area of
sediments targeted for remediation by this alternative is approximately 441 acres. The estimatedvolume of sediments to be removed is about 2.5 million cubic yards. This alternative involvescomplete or partial removal of sediments from hot spots from Rogers Island to Federal Dam (i.e.,general locations of Hot Spots 5 through 40, except for Hot Spots 12, 21, 23, 24, 27,29, 30, 32, 38,and 40). Rock-bound, inaccessible areas are excluded. Assuming approximately 100 to 130 acresof sediment area can be dredged per year, remediation will commence in 2004 and will be completed
in 2007. Sediment removal, handling, transport, treatment, and disposal will be conducted asdescribed in subsection 6.2.4.1. This alternative is performed in conjunction with a separate sourcecontrol NTCRA in the vicinity of the GE Hudson Falls plant and also relies on naturally occurringattenuation processes to reduce the toxicity, mobility, and volume of the remaining PCBs in the
Upper Hudson River sediments after the construction is completed. A review of site conditions will
be conducted at five-year intervals to evaluate the attainment of RAOs and PRGs. The CAP-3/10/10
alternative is comparable to the REM-3/10/10 alternative in that both alternatives target the samesediment areas, but CAP-3/10/10 utilizes capping with dredging to perform the active remediation.
6.3.1.4 Alternative REM-0/10/MNA - Full-Section Removal in River Section 1, Hot SpotRemoval in River Section 2 and MNA in River Section 3
This alternative includes removal of all sediments with MPA greater than 0 g/m2 PCBs (Full-Section remediation) in River Section 1, removal of all sediments with nominal MPA greater than
10 g/m2 PCBs (Hot Spot remediation) in River Section 2, and MNA in River Section 3, as shown
on Figure 6-4. There is no active sediment remediation in River Section 3. The areas to be
remediated are shown on Plates 13 and 15. The total area of sediments targeted for remediation bythis alternative is approximately 544 acres. The estimated volume of sediments to be removed isabout 2.6 million cubic yards. This alternative involves complete removal of contaminated
sediments from Rogers Island to the TI Dam, except for rock-bound, inaccessible areas such as Hot
Spot 12, and removal of hot spots from the TI Dam to the Northumberland Dam (i.e., general
locations of Hot Spots 20 through 35, except for Hot Spots 21, 23, 24, 27, 29,30 and 32). Assuming
approximately 100 to 130 acres of sediment area can be dredged per year, remediation willcommence in 2004 and will be completed in 2008. Sediment removal, handling, transport,
6-28 ^ubli TAMS
treatment, and disposal will be conducted as described in subsection 6.2.4.1. This alternative isperformed in conjunction with a separate source control NTCRA in the vicinity of the GE Hudson
Falls plant and also relies on naturally occurring attenuation processes to reduce the toxicity,mobility and volume of the remaining PCBs in the Upper Hudson River sediments after the
construction is completed. A review of site conditions will be conducted at five-year intervals toevaluate the attainment of RAOs and PRGs. The CAP-O/IO/MNA and REM-0/10/MNA alternativesare comparable in that both target the same sediment areas, but the CAP-0/10/MNA alternativeutilizes capping with dredging to perform the active remediation.
6.3,1.5 Alternative REM-0/10/10 - Full-Section Removal in River Section 1, and Hot SpotRemoval in River Sections 2 and 3
This alternative includes removal of all sediments with MPA greater than 0 g/m2 PCBs (Full-Section remediation) in River Section 1 and removal of all sediments with nominal MPA greaterthan 10 g/m2 PCBs (Hot Spot remediation) in River Sections 2 and 3, as shown on Figure 6-5. Theareas to be remediated are shown on Plates 13 and 15. The total area of sediments targeted forremediation by this alternative is approximately 641 acres. The estimated volume of sediments to
be removed is about 3.0 million cubic yards. This alternative involves complete removal of
sediments from Rogers Island to TI Dam, except for rock-bound, inaccessible areas such as Hot Spot12, and removal of hot spots from the TI Dam to Federal Dam (i.e., general locations of Hot Spots5 through 40, except for Hot Spots 21, 23, 24, 27,. 29, 30, 32, 38, and 40). Assuming approximately
100 to 130 acres of sediment area can be dredged per year, remediation will commence in 2004 andwill be completed in 2008. Sediment removal, handling, transport, treatment, and disposal will be
conducted as described in subsection 6.2.4.1. This alternative is performed in conjunction with a
source control NTCRA in the vicinity of the GE Hudson Falls plant and also relies on naturallyoccurring attenuation processes to reduce the toxicity, mobility and volume of the remaining PCBs
in the Upper Hudson River sediments after the construction is completed. A review of site .conditions will be conducted at five-year intervals to evaluate the attainment of RAOs and PRGs.
Alternative CAP-0/10/10 is a comparable alternative that targets the same sediment areas ast£>
Alternative REM-0/10/10, but utilizes capping with dredging to perform the active remediation. ocr»Mto
6-29 TAMS

6.3.1.6 Alternative REM-0/0/3 - Full-Section Removal in River Sections 1 and 2, and ExpandedHot Spot Removal in River Section 3
This alternative includes removal of all sediments with MPA greater than 0 g/m2 PCBs (fullsection remediation) in River Sections 1 and 2 and removal of all sediments with MPA greater than10 g/m2 PCBs (Expanded Hot Spot remediation) in River Section 3, as shown on Figure 6-6. Theareas to be remediated are shown on Plates 14 and 15. The total area of sediments targeted forremediation by this alternative is approximately 920 acres. The estimated volume of sediments tobe removed is about 3.7 million cubic yards. This alternative involves complete removal ofcontaminated sediments from Rogers Island to the Northumberland Dam, except for rock-bound,
inaccessible areas such as Hot Spot 12, and complete or partial removal of hot spots from theNorthumberland Dam to the Federal Dam (i.e., general locations of Hot Spots 36 through 40, except
for Hot Spot 38). Assuming approximately 100 to 130 acres of sediment area can be dredged peryear, remediation will commence in 2004 and will be completed in 2010. Sediment removal,
handling, transport, treatment, and disposal will be conducted as described in subsection 6.2.4.1.
This alternative is performed in conjunction with a source control NTCRA in the vicinity of the GE
Hudson Falls plant and also relies on naturally occurring attenuation processes to reduce the toxicity,
mobility and volume of the remaining PCBs in the Upper Hudson River sediments after the
construction is completed. A review of site conditions will be conducted at five-year intervals toevaluate the attainment of RAOs and PRGs.
6.3.2 Evaluation of REM Alternatives
The initial evaluation of the six REM (removal) alternatives for the criteria of effectiveness,
implementability, and cost is presented below.
Effectiveness
The general effectiveness of the category of REM alternatives was described in subsection
6.2.4.2. In this subsection, the percent of sediment area and sediment volume remediated, the
percent of PCB mass removed, and the percent reductions in species-weighted fish fillet PCB
concentration, water column PCB concentration, and PCB load over Federal Dam are used to
400613 TAMS
evaluate the effectiveness of the six REM alternatives detailed in subsection 6.3.1. Figures 6-7through 6-23 present the predicted PCB concentrations in sediment, surface water and species-weighted average fish fillet for the six REM alternatives as compared to the No Action and MNAalternatives. These figures also present the bounding calculations for the No Action and MNAalternatives (described in Appendix D).
'
The REM- 10/MNA/MNA alternative is not very effective in meeting the RAOs and PRGsover the 70-year model forecast period, especially in River Sections 2 and 3. Risks to human healthand ecological receptors (piscivorous birds and mammals) posed by the PCB -contaminatedsediments will continue for several decades. Alternative REM-0/MNA/MNA is very effective inmeeting the RAOs and PRGs over the 70-year model forecast period in River Section 1, but not veryeffective in River Sections 2 and 3. In River Section 1, the REM-3/10/10 alternative is moreeffective in meeting the RAOs and PRGs over the 70-year model forecast period than the REM-
10/MNA/MNA alternative, but less effective than the REM-0/MNA/MNA alternative. In River
Sections 2 and 3, the REM-3/10/10 alternative is more effective in meeting the RAOs and PRGs
over the 70-year model forecast period than either the REM- 10/MNA/MNA or REM-0/MNA/MNA
alternatives.
As expected, the REM-0/0/3 alternative is the most effective remedial alternative in meetingthe RAOs and PRGs over the 70-year model forecast period for the Upper Hudson River. In River
Section 1, the REM-0/0/3 alternative is as effective as the REM-0/MNA/MNA, REM-0/10/MNA,and REM-0/10/10 alternatives, but more effective than the REM- 10/MNA/MNA and REM-3/10/10alternatives. In River Section 2, the REM-0/0/3 alternative is approximately ten percent more
effective than the REM-3/10/10, REM-0/10/MNA, and REM-0/10/10 alternatives, and nearly four
times as effective as the REM-0/MNA/MNA and REM- 10/MNA/MNA alternatives. In River
Section 3, model results suggest that the REM-0/0/3 alternative is equally as effective as the REM-
0/10/10, REM-0/10/MNA, REM-3/10/10, and REM-0/MNA/MNA alternatives in meeting the RAOs- and PRGs over the 70-year model forecast period, and nearly 25 percent more effective than theREM- 10/MNA/MNA alternative. As discussed in subsection 6.4.1.1. below, the model appears to ^
obe relatively insensitive to changes in the selected target threshold for River Section 3. o
6-31 TAMS

The risk-based PRO for protection of human health of 0.05 ppm PCBs (wet weight) in fishfillet is not met in River Sections 1 and 2 over the 70-year model forecast period by any of the sixalternatives. However, in River Section 3, this PRO is met by the REM-10/MNA/MNA and REM-3/10/10 alternatives in the year 2051. For the REM-0/MNA/MNA, REM-0/10/MNA, REM-0/10/10, and REM-0/0/3, alternatives, the risk-based PRO for protection of human health of 0.05ppm PCBs (wet weight) in fish fillet is met in River Section 3 in the year 2050.
In River Section 1, the target concentration of 0.2 ppm PCBs (one meal per month) in fishfillets is not met by any of the six alternatives over the 70-year model forecast period. In RiverSection 2, this target concentration is met by the REM-10/MNA/MNA alternative in the year 2060,by the REM-0/MNA/MNA alternative in 2051, by the REM-3/10/10 alternative in 2043, by theREM-O/IO/MNA and REM-0/10/10 alternatives in 2037, and by the REM-0/0/3 alternative in 2034.
In River Section 3, this target concentration is met by the REM-10/MNA/MNA alternative in the
year 2017, by the REM-0/MNA/MNA and REM-3/10/10 alternatives in 2014, and by the REM-
0/10/MNA, REM-0/10/10, and REM-0/0/3 alternatives in 2013.
In River Section 1, the target concentration of 0.4 ppm PCBs (one meal every 2 months) in-
fish fillets is met by the REM-10/MNA/MNA alternative in the year 2030, by the REM-3/10/10
alternative in 2026, and by the REM-0/MNA/MNA, REM-O/IO/MNA, REM-0/10/10, and REM-
0/0/3 alternatives in 2011. In River Section 2, this target concentration is met by the REM-
10/MNA/MNA alternative in the year 2037, by the REM-0/MNA/MNA alternative in 2035, by the
REM-3/10/10 alternative in 2025, by the REM-O/IO/MNA and REM-0/10/10 alternatives in 2021,
and by the REM-0/0/3 alternative in 2014. In River Section 3, this target concentration is met by the
REM-10/MNA/MNA alternative in the year 2011, and by the REM-0/MNA/MNA, REM-3/10/10,
REM-O/IO/MNA, REM-0/10/10, and REM-0/0/3 alternatives in 2010.
The chemical-specific ARARs for PCBs in water are 0.5 //g/L (500 ng/L) federal MCL; 0.09ytig/L (90 ng/L) NYS standard for protection of human health and drinking water sources; 1 ng/L
federal Ambient Water Quality Criterion; 0.12 ng/L NYS standard for protection of wildlife; and
0.001 ng/L NYS standard for protection of human consumers of fish. The first two chemical-
specific ARARs for the surface water are met by all of the six REM alternatives, whereas the
6-32 400S15 TAMS

remaining three chemical-specific ARARs for the surface water are not met for the entire 70-year
forecast period by any of these alternatives.
Just prior to remediation, in the year 2003, the Tri+ PCB load over the Federal Dam predictedby the model is approximately 131 kg annually for all six alternatives. Soon after remediation, in
the year 2011, this annual Tri+ PCB load is about 63 kg for the REM-10/MNA/MNA alternative,48 kg for the REM-0/MNA/MNA alternative, 42 kg for the REM-3/10/10 alternative, 36 kg for theREM-0/10/MNA and REM-0/10/10 alternatives, and 34 kg for Alternative REM-0/0/3. Severaldecades after active remediation is completed, in the year 2035, this Tri+ PCB load is approximately22 kg for the REM-10/MNA/MNA, 20 kg for the REM-0/MNA/MNA and REM-3/10/10
alternatives, and 18 kg for the REM-0/10/MNA, REM-0/10/10, and Alternative REM-0/0/3
alternatives.
The REM-10/MNA/MNA, REM-0/MNA/MNA, and REM-0/10/MNA alternatives do notinclude remediation in River Section 3, and therefore do not address the scour of PCB-contaminated
sediments associated with one-in-three to one-in-five-year flow events from the Hoosic River,
discussed as a limitation in subsection 6.2.1.2. Without addressing PCB-contaminated sediments
downstream of the Hoosic River (RM 166), the Tri+ PCB loads over Federal Dam for these threealternatives will likely be higher than indicated by the modeling results.
The table below provides a comparison of volumes of contaminated sediment and PCBinventory removed by each of the six REM alternatives, arranged from least to most extensive.
Alternative
REM-10/MNA/MNA
REM-0/MNA/MNA
REM-3/10/10
REM-0/10/MNA
REM-0/10/10
REM-0/0/3
Volume Removed (cubic yards)
965,0002,030,000
2,485,0002,568,0002,999,0003,706,000
PCB Mass Removed (kg)
8,60015,000
41,90038,600
45,300
60,700
£*00a\h-»
6-33 TAMS

Implementability
The general implernentability of the category of REM alternatives was described insubsection 6.2.4.2. Implementability of specific alternatives within this category is primarily afunction of scale; i.e., the total area remediated, volume of sediment removed, and the length ofshoreline disturbed. Although all six REM alternatives are readily implementable, the REM-10/MNA/MNA and REM-0/MNA/MNA alternatives are easier to implement because all of thesediment removal work is done in River Section 1. Next, the REM-0/10/MNA alternative is alsoeasier to implement because it does not involve sediment removal in River Section 3. However, asexplained, this would not address the scouring of sediments by flows from the Hoosic River. Asshown in Tables 6-1, the length of shoreline disturbed by the sediment removal activities for theREM-10/MNA/MNA alternative is estimated to be 6.6 miles and the area targeted for remediation
by this alternative is approximately 4 percent of the total Upper Hudson River area. The length of
shoreline disturbed by the sediment removal activities for the REM-0/0/3 alternative is estimated to
be 33 miles and the area targeted for remediation by this alternative is approximately 24 percent of
the total Upper Hudson River area.
Cost
The costs for the six REM alternatives primarily depend on the volume of sediments to be
removed from the Upper Hudson River. Of the six alternatives, the REM-10/MNA/MNA alternative
has the lowest costs, whereas the REM-0/0/3 alternative has the highest costs by a factor of about
four over REM-10/MNA/MNA. Based on the volume of sediment to be removed, costs for the other
four REM alternatives are expected to range between two and three times the cost for REM-
10/MNA/MNA. Total O&M costs for an alternative are expected to be a small fraction (say, 2 to
5 percent) of the total capital costs.
6.3.3 Conclusion for REM Alternatives
The model analyses presented above show that remediation less than Expanded Hot Spot
remediation in River Section 1 and Hot Spot remediation in River Sections 2 and 3 will notsubstantially reduce PCB concentrations in fish. The evaluation shows that while Full-Section
"4 400617 TAMS
i remediation provides greater benefits, much larger sediment areas and volumes must be removed' at considerably greater costs.
I' The REM-3/10/10 and REM-0/0/3 alternatives were retained for detailed analysis, based on[ the effectiveness, implementability, and cost screening presented above and summarized below.
The REM-3/10/10 alternative appears to provide a good balance in achieving the RAOs andPRGs at costs that are moderate as compared to the other REM alternatives that were evaluated. Asdescribed in Table 6-1, the REM-3/10/10 alternative significantly reduces the risks to human healthand the environment from PCBs at the site. This conclusion is based on a combination of factorsthat includes the area remediated, the volume of sediments removed, the length of shoreline affected,the transport of Tri+ PCBs over the Federal Dam, the species-weighted average PCB fish filletconcentration, and the water quality in all three river sections. The REM-3/10/10 alternative also
addresses PCB-contaminated sediments in all three river sections.
The REM-0/0/3 alternative is the most extensive remedial alternative, and as such providesthe greatest benefits at the highest costs. It serves as the upper bound of the benefits of activeremediation of the Upper Hudson River sediments. Therefore, the REM-3/10/10 and REM-0/0/3alternatives are retained for detailed analysis.
6.3.4 Conclusion for CAP Alternatives
As stated in Section 6.3 above, the range of target areas covered by the four CAP alternatives
listed in subsection 6.2.3 is a subset of the range of target areas included in the six REM alternatives.Although the evaluation provided in subsection 6.3.2 above is based on the REM alternatives, it isalso representative of the CAP alternatives because the conclusions reached from a similar
evaluation of corresponding CAP alternatives would be the same. Therefore, the CAP-3/10/10alternative is also retained for detailed analysis.
6-35 TAMS
6.4 Refinement of Active Remediation Alternatives Retained for Detailed Analysis
To perform the detailed analysis of the three active remediation alternatives identified above,it is necessary to further examine the hot spots and remediation target areas shown in Plates 13, 14,and 15 from an implementation and engineering perspective. In addition, it is important to carefullyconsider the information about the scour of sediments from hot spots by the Hoosic River flows inRiver Section 3, as described in Chapter 3- Other factors that need to be considered include the
information about the existing water depths in the navigation channel in all three river sections
provided by the Canal Corporation. In Section 5.2, the drafts required by various types of dredgingequipment were discussed and evaluated.
6.4.1 Basis for Remedial Alternatives Refinement
The sections below explain the basis for refinement of the REM-3/10/10, CAP-3/10/10, and
REM-0/0/3 alternatives.
6.4.1.1 Select Areas
As described in Appendix D, calibration data for the HUDTOX model are very limited in
some key areas, especially in River Section 3. Based on these limited data, the spatial scale of the
model segments for the sediments is relatively much larger (approximately 1,283,000 m2) than the
spatial scale of the model segments in River Section 1 (approximately 138,000 m2). These relatively
broad spatial scales do not necessarily reflect what happens at local spatial scales smaller than modelsegments. As shown in the predicted results presented in Figures 6-7 through 6-23, the model
appears to be relatively insensitive to changes in the selected target threshold (i.e., PCB MPA of 3
g/m2 versus 10 g/m2) in River Section 3.
The importance of the increased exposure to PCB contamination due to scouring ofsediments by the Hoosic River flows has been discussed previously. Hot Spot 37 is immediately
downstream of the confluence of the Hoosic River with the Upper Hudson River and has historically
been subject to scour. Hot Spots 36 and 39 both include a sizeable inventory of PCBs and may besubject to scour under certain conditions. Therefore, other factors were examined in addition to the
M6 400619

PCB inventory and model predictions when identifying areas to be remediated for River Section 3.
These factors include the flow rates, sedimentation rates, bioturbation, historical erosion patterns,
and depth of PCB contamination within the hot spot areas, among others.
Hot Spot 39 represents a unique condition in the Upper Hudson River. Specifically, several
of the core profiles obtained from this hot spot as part of the 1994 USEPA investigation indicatedvery high rates of sediment deposition. The areas within Hot Spot 39 undergoing significant burial
were identified by sediment cores whose PCB maximum occurred below 24 inches. This criterionidentified the central portion of the hot spot as undergoing significant burial, and this portion of Hot
Spot 39 was excluded from the areas to be dredged. Li this portion of the hot spot, it is believed thatthe bulk of sediment contamination lies sufficiently below the surface to not pose a future problem.
Additionally, the high rate of deposition in this area should further isolate the contaminated
sediments. The northern and southern areas of Hot Spot 39 had core profiles more typical of Upper
Hudson sediment contamination, with PCB maximum concentrations occurring in the uppermost
layers of complete cores. As a result, these areas were included in the areas to be dredged.
In order to reflect the refinements discussed in this section, the nomenclature used to describethe three active alternatives was modified as described below:
Alternative CAP-3/10/Select;
Alternative REM-3/10/Select; and,
Alternative REM-0/0/3.
6.4.1.2 Dredging to Implement Remedial Alternatives
Based on evaluation of the engineering productivity calculations described in Appendix E,
the drafts required by various types of dredges, towboats and barges were compared with informationon channel depths provided by the Canal Corporation-. This evaluation showed that portions of thenavigation channel would have to be dredged in all three river sections to allow the unrestricted omovement of barges loaded with dredged sediments as well as to accommodate normal boat traffic °
toon the river. Therefore, in order to properly implement the three active remediation alternatives °
selected for detailed analysis in subsections 6.3.3 and 6.3.4, additional areas and volumes need to
6-37 TAMS

be added in all three river sections to the CAP-3/10/Select, REM-3/10/Select, and REM-0/0/3
alternatives.
The areas and volumes for these three refined alternatives are presented in Table 6-3. Figures6-24 through 6-40 present the predicted PCB concentrations in sediment, surface water and species-weighted average fish fillet for these three refined alternatives as compared to the No Action andMNA alternatives.
6.4.2 Description of Refined Remedial Alternatives
The three refined remedial alternatives (CAP-3/10/Select; REM-3/10/Select; and REM-0/0/3)
are described below.
6.4.2.1 Alternative CAP-3/10/Select
This alternative includes capping with dredging to perform Expanded Hot Spot remediation
(i.e., in which the nominal MPA targets are 3 g/m2 or greater) in River Section 1, Hot Spot
remediation (i.e., in which the nominal MPA targets are 10 g/m2 or greater) in River Section 2, and
remediation of select areas (i.e., sediments with high-concentration PCB target areas and which are
potentially subject to scour) in River Section 3. This alternative also includes dredging in the
navigation channel as necessary to implement the remediation and to accommodate normal boattraffic on the river. Protection of the cap from damage by boat propellers and anchors, bioturbation
and other disturbances is implemented through addition of a layer of backfill material suitable for
replacement of fish and benthic habitat. Areas from which sediments are removed are backfilled
with appropriate material to isolate residual PCBs in sediments that may remain after dredging is
completed. No backfill is placed in the navigation channel. After construction is completed, MNAis implemented in each section of the river until the RAOs are.achieved.
The areas to be remediated for this alternative are shown in Plate 16. The total area ofsediments to be capped is approximately 207 acres. The estimated volume of sediments to be
removed is 1.73 million cubic yards. Remediation will commence in 2004 and will be completed
in 2008. This alternative is performed in conjunction with a separate source control removal action
6'38 400621 TAMS

,-~^ (i.e., NTCRA) in the vicinity of the GE Hudson Falls plant and also relies on institutional controls,1 such as the fish consumption advisories, and naturally occurring attenuation processes to reduce the
toxicity, mobility and volume of the remaining PCBs in the Upper Hudson River sediments after theI
construction is completed. A review of site conditions will be conducted at five-year intervals, asrequired by Section 121 (c) of CERCLA.
f 6.4.2.2 Alternative REM-3/10/S elect
| s This alternative includes Expanded Hot Spot removal (i.e., in which the nominal MPA targets|-£
are 3 g/m2 PCBs or greater) in River Section 1, Hot Spot removal (i.e., in which the nominal MPA| targets are 10 g/m2 or greater) in River Section 2, and removal of select areas (i.e., sediments with
high-concentration PCS target areas and which are potentially subject to scour) in River Section 3.This alternative also includes sediment removal in the navigation channel as necessary to implement
the remediation and to accommodate normal boat traffic on the river. Isolation of residual PCBs in
sediments that may remain after dredging is completed through addition of a layer of backfill•"Nmaterial suitable for replacement of the fish and benthic habitat. No backfill is placed in thenavigation channel. After construction is completed, MNA is implemented in each section of theriver until the RAOs are achieved.
The areas to be remediated for this alternative are shown in Plate 17. The total area of
sediments targeted for removal is approximately 493 acres. The estimated volume of sediments tobe removed is 2.65 million cubic yards. Remediation will commence in 2004 and will be completedin 2008. This alternative is performed in conjunction with a separate source control removal action
(i.e., NTCRA) in the vicinity of the GE Hudson Falls plant and also relies on institutional controls,such as the fish consumption advisories, and naturally occurring attenuation processes to reduce the
toxicity, mobility and volume of the remaining PCBs in the Upper Hudson River sediments after theconstruction is completed. A review of site conditions will be conducted at five-year intervals, asrequired by Section 121 (c) of CERCLA.
Oo
to
6-39 TAMS
6.4.2.3 Alternative REM-0/0/3
This alternative includes Full-Section removal (i.e., removal of sediments in which the MPAtargets are 0 g/m2 or greater) in River Section 1 and 2, and Expanded Hot Spot removal (i.e., inwhich the nominal MPA targets are 3 g/m2 or greater) in River Section 3. This alternative alsoincludes sediment removal in the navigation channel as necessary to implement the-remediation andaccommodate normal boat traffic on the river. Isolation of residual PCBs in sediments that mayremain after dredging is completed through addition of a layer of backfill material suitable forreplacement of the fish and benthic habitat. No backfill is placed in the navigation channel.
The areas to be remediated for this alternative are shown in Plate 18. The total area ofsediments targeted for removal is approximately 964 acres. The volume of sediments to be removed
is estimated to be 3.82 million cubic yards. This alternative performs the most extensive remediation
that can be supported by current data, and has the longest duration. Remediation will commence in2004 and will be completed in 2010. This alternative is performed in conjunction with a separatesource control removal action (i.e., NTCRA) in the vicinity of the GE Hudson Falls plant and also
relies on institutional controls, such as the fish consumption advisories, and naturally occurring
attenuation processes to reduce the toxicity, mobility and volume of the remaining PCBs in the
Upper Hudson River sediments after the construction is completed. A review of site conditions will
be conducted at five-year intervals, as required by Section 121(c) of CERCLA.
6-40 400623 TAMS

n
-a
400624
r 7. ALTERNATIVE-SPECIFIC RISK ASSESSMENTS
I The alternative-specific risk assessments presented in this FS calculate risks for the Upperi<• Hudson River (i.e., the approximately 40 river miles from the northern end of Rogers Island to ther • Federal Dam at Troy). Although the Hudson River PCBs Superfund Site extends nearly 200 river1 miles (320 km) from the Fenimore Bridge at Hudson Falls (RM 197.3) to the Battery in New YorkI City (River RM 0), alternative-specific risks are presented only for the Upper Hudson River (Federal
Dam at RM 153.9 to the former Fort Edward Dam at RM 194.8), which is the focus of this FS report.I This portion of the river was divided into three sections for convenience in evaluating conditions and
remedial alternatives in the FS (Plate 1). These three sections were individually evaluated for human
I health (including both cancer risks and non-cancer health hazards) and ecological risks, and the
upper river as a whole was also evaluated for human health risks.
rIRiver Section 1 consists of the TI Pool, for practical purposes considered to start at the
\ northern end of Rogers Island at RM 194.6 and extending to the TI Dam at RM 188.5. River SectionI.—^ 2 extends from the TI Dam (RM 188.5) to the Northumberland Dam (Lock 5) near Schuylerville
j (RM 183.4), a distance of about five river miles. River Section 3 extends from below the
Northumberland Dam (Lock 5) to the Federal Dam at Troy (RM 153.9), a distance of nearly 29 river
miles. Angler use and ecological parameters were assumed to be the same throughout the three
sections of the Upper Hudson River. Cancer risks and non-cancer hazard indices (His) were
I -. averaged from the three sections to provide an overall (average) estimate of human health cancerrisks and non-cancer health hazards associated with the Upper Hudson River.f '
f ^ ........ The alternative-specific risk assessments use the same methodology and assumptions that£? were used in the Hudson River PCBs Site Revised HHRA (USEPA, 2000p) and Revised ERA
(USEPA, 2000q). Exposure parameters, toxicity values, and time frames used herein (i.e., for thej
i- baseline No Action alternative) are consistent with those used to model future PCB concentrations
r in both revised HHRA and ERA reports. However, the starting time for alternative-specificassessments presented in this FS differs from the starting time used for the assessments presented
: in the revised HHRA and ERA. The Revised HHRA used an assessment period beginning in 1999 Qi'y^——X Q
and extending up to 40 years (i.e., 1999 through 2038, inclusive) for the reasonable maximum <r>to[V exposure (RME) cancer assessment and seven years (i.e., 1999 through 2005) for the non-cancer *"
7-1 TAMS

health assessment. The ERA used a 25-year time frame beginning in 1993 (i.e., 1993-2017).Modeling for the ERA was begun in 1993 because the ecological sampling program was conductedthen, which provided much of the data used in the ERA.
Calculated cancer risks and non-cancer hazards for exposure after the completion ofremediation (i.e., from 2008 on) are presented in this chapter of the FS. Because modeled sediment
PCB concentrations decrease over time (USEPA, 2000a), the baseline risks calculated for the HHRAand ERA using the 1999 and 1993 start dates are higher than those calculated in this report using thelater (2008 on) start date.
This FS focuses on risks from fish ingestion for both human and ecological receptors. Thealternative-specific risk assessments presented herein are not intended to be full or complete risk
assessments. Rather, they focus on the major source of risk to human and ecological receptors (i.e.,fish ingestion) both as a means to assess the absolute degree of risk reduction and to enable
evaluation and comparison among alternatives with respect to risk-based criteria.
7.1 Use of Risk Assessments in Criteria Evaluation
Risk assessments integrate exposure to contaminants and lexicological effects to provide a
risk characterization. Quantitative risk assessment is a tool for evaluating reductions in risk using
mathematical models, and as such is subject to uncertainties and limitations that are described laterin this chapter. In this FS, two of the RAOs (reduce the cancer risks and non-cancer health hazards
for people eating fish from the Hudson River by reducing the concentration of PCBs in fish, andreduce risks to ecological receptors by reducing the concentration of PCBs in fish) and the associated
preliminary remediation goals (PRGs) are directly linked to risk calculations. This section describes
the methodology used to calculate risks to human health and the environment, and their integration
into the alternative evaluation criteria.
Of the seven alternative-specific detailed evaluation criteria addressed in this FS, three have
a risk-based component:
• Overall protection of human health and the environment
7-2 - TAMS
400626

• Long-term effectiveness and permanence
• Short-term effectiveness
The use of alternative-specific risk assessments for each of these criteria is discussed below.
7.1.1 Overall Protection of Human Health and the Environment
Overall protection of human health and the environment is one of the two threshold criteriathat must be met by each alternative. This evaluation criterion provides a final assessment of theextent to which a given alternative is protective of human health and the environment. The overall
protectiveness criterion includes an assessment of other risk-based evaluation criteria, such as long-
term effectiveness and permanence and short-term effectiveness. As part of determination of
protectiveness, the evaluation describes how risks through each pathway would be eliminated,reduced, or controlled through treatment, engineering, or institutional controls. Overall protectionalso addresses, for example, potential volatilization of PCBs during sediment processing.
7.1.2 Long-Term Effectiveness
Long-term effectiveness is evaluated by using modeling results to project the human health
and ecological impacts through the years over the exposure period of a human or ecological receptor.As described in the Revised HHRA (USEPA, 2000p),the maximum time frame used to calculate
non-cancer hazards and cancer risks for human health modeling is 40 years, and ecological toxicity
quotient modeling results are based on a 25-year exposure period, with starting dates ranging
between 2008 and 2012 depending on the alternative and river section. The HUDTOX andFISHRAND models were run for a 70-year period (1998-2067) for this FS and the full modeling
time frame is examined when determining the number of years required to reach human health and
ecological target levels. The start date for the long-term effectiveness period was considered to startimmediately after the equilibration period following remediation. For example, if the construction
schedule for a remedy requires three years to complete, given a start date in 2004, the construction
would be complete at the end of 2006, equilibration would occur over the year 2007, and theo
long-term period for risk calculation starts on January 1, 2008. <^to
7-3 TAMS

Risks for each section of the river for each remedy are compared separately to the No Action
and MNA alternatives. Therefore, two sets of baseline alternatives for both No Action and MNAare calculated, one to coincide with the schedule for CAP-3/10/S and REM-3/10/S, and one to matchthe schedule of REM-0/0/3. For the entire 40 miles of the Upper Hudson River, the years 2009 (the
midpoint of start years for CAP-3/10/S and REM-3/10/S) and 2011 (approximately the midpoint ofstart years for REM-0/0/3) are used.
7.1.2.1 Long-Term Effectiveness: Protection of Human Health
Long-term human health effects are modeled for the same exposure duration used for the
baseline Revised HHRA (USEPA, 2000p), as summarized below. However, the specific years
modeled vary, depending on the assumed progress of remediation within a given river segment for
each alternative. Table 7-1 summarizes the time frames utilized in the calculation of the alternative-
specific human health cancer risks and non-cancer hazards and ecological risks. No Action and
MNA alternatives are modeled with different time periods corresponding to the three (active)
remedial alternatives so that meaningful comparisons among alternatives can be made.
For carcinogenic effects:
• Reasonable maximum exposure (RME): 40 years for the adult (2011 through 2050)
• Central tendency (CT) exposure ("average" or "typical"): 12 years for the adult (2011
through 2022)
For non-cancer health effects:
RME: seven years for the adult (2011 through 2017)
CT exposure: 12 years for the adult (2011 through 2022)
As was done in the Revised HHRA, the modeled fish concentrations for each of the three
river sections are averaged, with each year and each river section weighted equally. In addition,cancer risk and non-cancer health hazard calculations are also presented for each individual riversection. The fish concentrations used are the species-weighted averages, based on Connelly et al.
(1992), and are those considered to represent a reasonable ingestion scenario among the three fish
7-4 TAMS400628

species consumed to any significant extent by human receptors (anglers): largemouth bass (47
percent); brown bullhead (44 percent); and yellow perch (9 percent).
7.1.2.2 Long-Term Effectiveness: Ecological Assessment
The ecological assessment is based on modeled effects for two receptors, the river otter and
mink. TQs are calculated for both the NOAEL and the LOAEL to provide a range of exposure risks.The bald eagle, a piscivorous bird, was also considered as a potential receptor to model for the FS.However, adult eagle risks are much lower than otter risks, and eagle egg risks are similar butslightly lower than otter risks. Therefore, only river otter (the most sensitive receptor) and mink
results are presented here.
As in the evaluation of human health risks, the start date for the long-term effectivenessperiod was considered to be immediately after the equilibration period following remediation. Risks
for each section of the river for each remedy are compared separately to the No Action alternative.
The 25-year forecast period used in the Revised ERA was also selected as the mink and river otter
exposure period in this FS. This exposure period is considered appropriate because it extends
throughout the average lifespan of both the mammalian receptors. Mink live up to 10 years (Walker,
1997; Kurta, 1995) and river otter live on the average 15 to 20 years in the wild and up to 25 years
in captivity (Ohio Division of Wildlife, 2000).
7.1.3 Short-Term Effectiveness
As defined in the RI/FS Guidance and the NCP, assessment of short-term effectiveness
addresses a number of factors:
• Protection of the community during remedial actions• Protection of workers during remedial actions• Potential adverse environmental impacts resulting from construction and implementation• Time until remedial response objectives are achieved
N)VO
7-5 TAMS

The role of alternative-specific risk assessments in addressing each of these components ofshort-term effectiveness is described below.
For the purposes of this FS, the short-term period is considered to include the time from
initiation of remedial activities, assumed to be in the year 2004, through the alternative-specific and
river section-specific period for implementation, and a subsequent one- to two-year period for
attenuation of residual impacts. Therefore, the short-term period is of variable duration, and extends
from 2004 through the year immediately prior to the beginning of the long-term period, as shown
in Table 7-1. Modeling results for active remedial alternatives are compared to No Action and MNA
alternatives for the same time period, so that comparisons among alternatives are on a consistent
basis.
7.1.3.1 Protection of the Community During Remedial Actions
The protection of the community during remedial actions is assessed on a quantitative basis.
Community risks that are considered include both physical hazards (e.g., noise, navigational hazards)
and potential exposure to hazardous materials (e.g., PCBs).
7.1.3.2 Protection of Workers During Remedial Actions
Potential risks to workers implementing the various remedial alternatives as well as measures
to prevent, minimize, or mitigate such risks are addressed as part of this criterion. The risks toworkers that are considered include both physical hazards (e.g., falling off the deck of a barge or
being injured in other job-related accidents) and potential exposure to hazardous materials (e.g.,
PCBs).
The protection of workers during remedial actions is addressed quantitatively (in Section 8
of the FS); no specific quantitative risks are calculated.
400630

7.1.3.3 Potential Adverse Environmental Impacts Resulting from Construction andImplementation
Potential adverse environmental impacts are addressed qualitatively, as there is no reliablemeans of quantifying potential short-term impacts from actions such as sediment resuspension,temporary habitat loss, or other transient effects. These impacts are discussed qualitatively in
Chapters oftheFS.
7.1.3.4 Time until Remedial Response Objectives Are Achieved
As discussed earlier, modeling results do not consider the potential short-term adverse
impacts of remedial actions. The time to achieve short-term remedial response objectives is
evaluated using the year after the completion of the remedial action. For example, considering the
Upper Hudson River as a whole, the short-term period would extend from 2004 through 2008 (for
2010 Alternative REM-0/0/3), lasting for five to seven years. The short-term period extends for the
longest amount of time at River Section 3, where it ends at the beginning of 2010 or 2012. If
objectives (PRGs) are achieved prior to the end of the short-term period, the modeling data are
examined further to determine if the model predicts attainment of the objectives prior to or during
the short-term period. The numerical human health and ecological PRGs as presented in Chapter
3 are used to evaluate this criterion.
7.2 Alternative-Specific Risk Assessment Methodology
The methodology used for the alternative-specific assessment of human health and ecological
risks is presented below.
7.2.1 Protection of Human Health
Two principle criteria were used to assess overall protection of human health: the relativereduction in cancer risks and non-cancer health hazards for each of the five remedial alternatives; jn
oand the time that it would take under each of the alternatives to reach the fish PRO and the other °
U)target concentrations. h*
7-7 TAMS

The protection of human health is assessed quantitatively through calculation of both non-
cancer health hazards and cancer risks to anglers living in the towns, cities, and rural areas
surrounding the Upper Hudson River. The angler population is defined as those individuals (maleand female) who consume self-caught fish from the Hudson, in the absence of remediation of
sediments and Hudson-specific fish consumption advisories. The assessment of fish consumptionby the angler population includes childhood through adulthood. All sport fish consumed wereassumed to come from the Hudson River. The RME scenario assumed a one-half pound meal (227grams) 51 times per year (i.e., 31.9 g/day) and the CT scenario assumed the same serving size 6.4
times per year (i.e., 4.0 g/day) for the adult (see Table 7-2).
Cancer risks and non-cancer hazard indices were calculated for River Sections 1, 2, 3, and
the Upper Hudson River as a whole using the following equation:
C,h x IR. x (1 - Loss) xFSxEFxEDxCFAverageDailylntake (mg/kg - day) = —————J—————————————————————
BWxAT
where:
Cfish = concentration of PCBs in fish (mg/kg wet weight)
IRflsh = ingestion rate of fish (g/day)
Loss = cooking loss (g/g)
FS = fraction from source (unitless)
EF = exposure frequency (days/year)
ED = exposure duration (years)
CF = conversion factor (kg/g)BW = body weight (kg)
AT = averaging time (days)
Values used for daily intake calculations (i.e., for the variables in the Average Daily Intake equation
above) are provided in Table 7-2. Annual mean concentrations in fish used to calculate average PCB
concentrations in fish over the various multi-year time frames (7, 12, or 40 years) are listed in Table
7-8 TAMS400632

7-3. Mean fish PCB concentrations for the 70-year period from 1998 to 2067 were predicted usingthe FISHRAND model (USEPA, 2000a). Largemouth bass, brown bullhead, and yellow perch areexpressed on a standard fillet wet weight basis for Tri+ PCBs at the three modeling locations and
averaged over the three river sections to provide an average Upper Hudson River value.
To obtain an expected value (mean) and standard deviation from the FISHRANDprobabilistic model, the following procedure was used:
1. Log-transform the model output for the 25th, 50th and 95th percentiles2. Plot the results against the inverse of the normal cumulative distribution, yielding a straight
line;3. Obtain the parameters of the regression to estimate a geometric standard deviation (GSD,
or a, calculated as I/slope) and u (calculated as the intercept times a); and
4. Obtain the mean (expected value, or E[x], of the distribution) as £$X\=C
The mean was then used as the annual exposure point concentration (EPC), from which cancer risks
and non-cancer hazards are calculated. For human health risks, annual EPCs were averaged overthe appropriate exposure period (Table 7-1) and used to calculate average daily intake. Individual
annual toxicity quotients weje calculated for ecological receptors, which were then averaged overa 25-year exposure period (Table 7-1) to estimate risk.
7.2.1.1 Carcinogenic Risks - Quantitative Incremental Risk
Cancer risks are characterized as the incremental increase in the probability (i.e., one in a
million, or 10~6) that an individual will develop cancer during his or her lifetime, above background
risk, as a result of site-specific exposure. The phrase "incremental increase" is defined as the riskdue to environmental chemical exposure above the background cancer risk experienced by all
individuals in the course of daily life.*•oo
The quantitative assessment of cancer risks involves evaluation of lifetime average daily dose a\to
and application of toxicity factors reflecting the carcinogenic potency of the chemical. Specifically, w
7-9 TAMS

excess (incremental) cancer risks are calculated by multiplying intake estimates (lifetime average
daily doses) and cancer slope factors (CSFs) (USEPA, 1999i) as follows (USEPA, 1989b):/ \ /
Cancer Risk = Intake —^— x CSF mg
\ kg - day) ( kg-day
Exposure levels are expressed as the chronic daily intake averaged over a lifetime ofexposure, in units of mg/kg-day (mg of PCB intake per kilogram of human body weight per day).A CSF is an estimate of the upper-bound probability of an individual developing cancer as a result
of a lifetime of exposure to a particular level or dose of a possible, probable, or known carcinogen.
Cancer slope factors are expressed in units that are the reciprocal of those for exposure, that is,(mg/kg-day)"1. Multiplication of the exposure level by the CSF yields a unitless estimate of cancerrisk. The acceptable risk range identified in the NCP (USEPA, 1990b) is 10"4 to 10"6 (or an increased
probability of developing cancer of 1 in 10,000 to 1 in 1,000,000) and refers to plausible upper
bound risks (in other words, the RME risk). Alternative-specific RME and CT cancer risk estimates
calculated for the fish ingestion exposure pathway are presented in Section 7.3.
As noted in subsection 1.5.1, calculations for adolescents and young children eating fish were
added to the Revised HHRA (USEPA, 2000p) based on comments by the peer review panel, but
were not evaluated separately in the FS because the differences between the cancer risks and non-
cancer hazards for the young child vs. the adult are no greater than three-fold. For example, young
child, adolescent, and adult cancer risks were summed in the Revised HHRA, but adult risks
accounted for approximately half of the total cancer risk, in part based on the exposure duration. For
carcinogenic effects, the RME is 40 years and the CT is 12 years.
7.2.1.2 Non-Cancer Health Effects - Hazard Indices (His)
The evaluation of non-cancer health effects involves a comparison of average daily exposure
levels with established reference doses (RfDs) to determine whether estimated exposures exceed
recommended limits to protect against chronic adverse health hazards. An RfD is defined as an
estimate (with uncertainty spanning perhaps an order of magnitude or greater) of a daily exposure
level for the human population, including sensitive subpopulations, that is likely to be without an
appreciable risk of deleterious effects during a lifetime. Chronic RfDs are specifically developed
7-10 TAMS400634
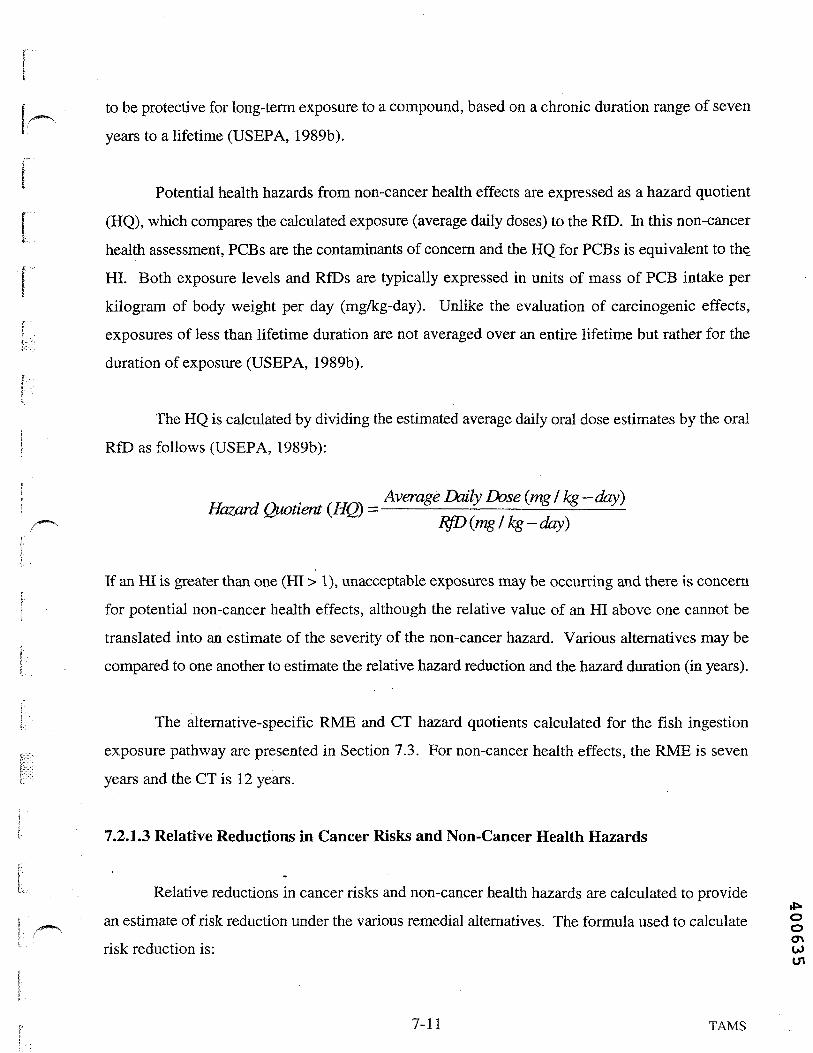
to be protective for long-term exposure to a compound, based on a chronic duration range of seven
years to a lifetime (USEPA, 1989b).
Potential health hazards from non-cancer health effects are expressed as a hazard quotient
(HQ), which compares the calculated exposure (average daily doses) to the RfD. In this non-cancer
health assessment, PCBs are the contaminants of concern and the HQ for PCBs is equivalent to the
HI. Both exposure levels and RfDs are typically expressed in units of mass of PCB intake perkilogram of body weight per day (mg/kg-day). Unlike the evaluation of carcinogenic effects,exposures of less than lifetime duration are not averaged over an entire lifetime but rather for the
duration of exposure (USEPA, 1989b).
The HQ is calculated by dividing the estimated average daily oral dose estimates by the oral
RfD as follows (USEPA, 1989b):
rr .~ „. + fTTr>\ Average Daily Dose (mg I kg -day)Hawrd Quotient (HQ) = ———— — — —— - —— —— ————tfD (mg/kg-day)
If an HI is greater than one (HI > 1), unacceptable exposures may be occurring and there is concern
for potential non-cancer health effects, although the relative value of an HI above one cannot be
translated into an estimate of the severity of the non-cancer hazard. Various alternatives may be
compared to one another to estimate the relative hazard reduction and the hazard duration (in years).
The alternative-specific RME and CT hazard quotients calculated for the fish ingestion
exposure pathway are presented in Section 7.3. For non-cancer health effects, the RME is seven
years and the CT is 12 years.
7.2.1.3 Relative Reductions in Cancer Risks and Non-Cancer Health Hazards
Relative reductions in cancer risks and non-cancer health hazards are calculated to provide
an estimate of risk reduction under the various remedial alternatives. The formula used to calculate• , • ,risk reduction is:
7-11 TAMS
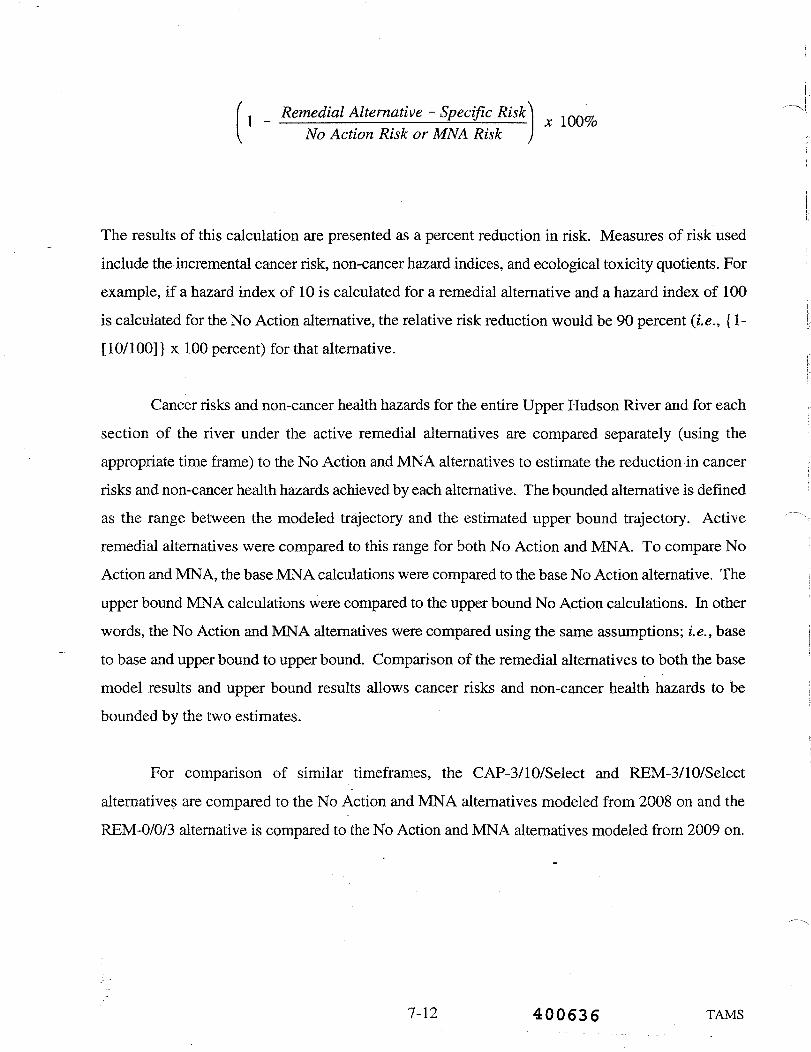
Remedial Alternative - Specific Risk \ in/v^———————————————————————————————————————— X i(j(j7O
No Action Risk or MNA Risk >
The results of this calculation are presented as a percent reduction in risk. Measures of risk usedinclude the incremental cancer risk, non-cancer hazard indices, and ecological toxicity quotients. Forexample, if a hazard index of 10 is calculated for a remedial alternative and a hazard index of 100is calculated for the No Action alternative, the relative risk reduction would be 90 percent (i.e., {1-
[10/100]} x 100 percent) for that alternative.
Cancer risks and non-cancer health hazards for the entire Upper Hudson River and for each
section of the river under the active remedial alternatives are compared separately (using the
appropriate time frame) to the No Action and MNA alternatives to estimate the reduction in cancer
risks and non-cancer health hazards achieved by each alternative. The bounded alternative is definedas the range between the modeled trajectory and the estimated upper bound trajectory. Active
remedial alternatives were compared to this range for both No Action and MNA. To compare No
Action and MNA, the base MNA calculations were compared to the base No Action alternative. The
upper bound MNA calculations were compared to the upper bound No Action calculations. In other
words, the No Action and MNA alternatives were compared using the same assumptions; i.e., base
to base and upper bound to upper bound. Comparison of the remedial alternatives to both the base
model results and upper bound results allows cancer risks and non-cancer health hazards to bebounded by the two estimates.
For comparison of similar timeframes, the CAP-3/10/Select and REM-3/10/Select
alternatives are compared to the No Action and MNA alternatives modeled from 2008 on and theREM-0/0/3 alternative is compared to the No Action and MNA alternatives modeled from 2009 on.
7-12 400636 TAMS
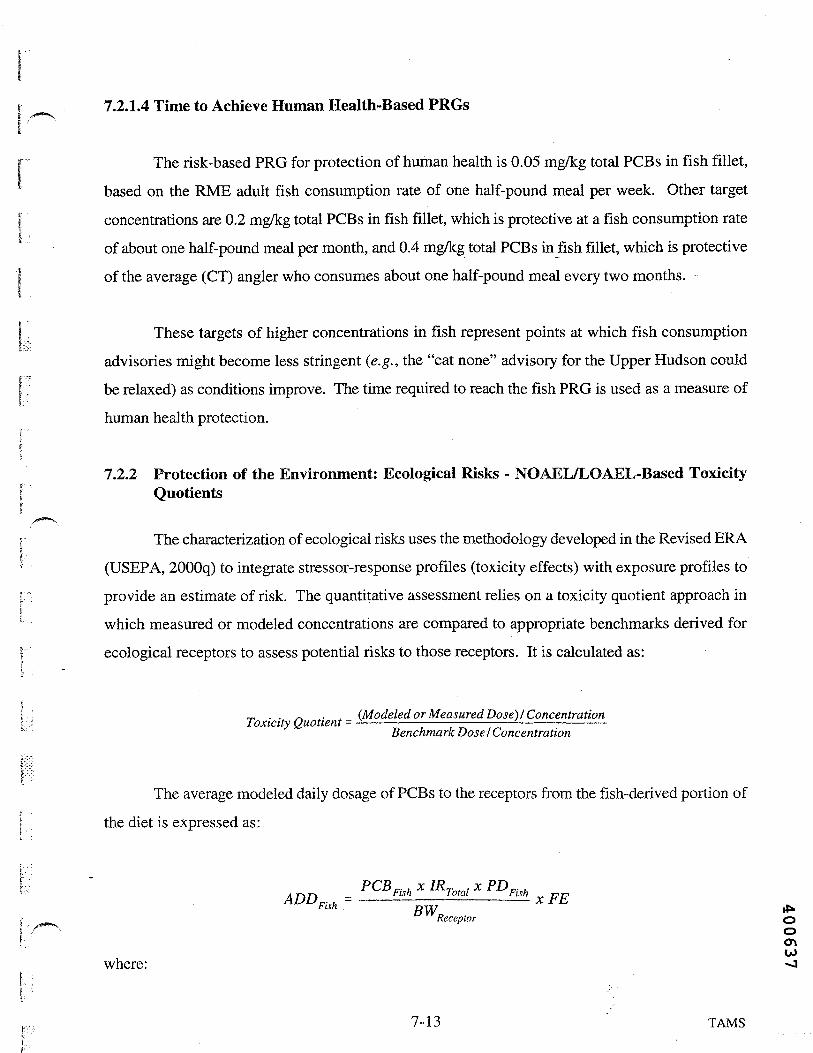
7.2.1.4 Time to Achieve Human Health-Based PRGs
The risk-based PRO for protection of human health is 0.05 mg/kg total PCBs in fish fillet,
based on the RME adult fish consumption rate of one half-pound meal per week. Other target
concentrations are 0.2 mg/kg total PCBs in fish fillet, which is protective at a fish consumption rateof about one half-pound meal per month, and 0.4 mg/kg total PCBs in fish fillet, which is protectiveof the average (CT) angler who consumes about one half-pound meal every two months.
These targets of higher concentrations in fish represent points at which fish consumptionadvisories might become less stringent (e.g., the "eat none" advisory for the Upper Hudson could
be relaxed) as conditions improve. The time required to reach the fish PRO is used as a measure of
human health protection.
7.2.2 Protection of the Environment: Ecological Risks - NOAEL/LOAEL-Based ToxicityQuotients
The characterization of ecological risks uses the methodology developed in the Revised ERA
(USEPA, 2000q) to integrate stressor-response profiles (toxicity effects) with exposure profiles to
provide an estimate of risk. The quantitative assessment relies on a toxicity quotient approach in
which measured or modeled concentrations are compared to appropriate benchmarks derived for
ecological receptors to assess potential risks to those receptors. It is calculated as:
„, . . -. . (Modeled or Measured Dose)/ConcentrationToxicity Quotient = -————————————'-————————Benchmark Dose I Concentration
The average modeled daily dosage of PCBs to the receptors from the fish-derived portion of
the diet is expressed as:
F.hFish
Receptor O0
O»towhere: -J
7-13 " TAMS
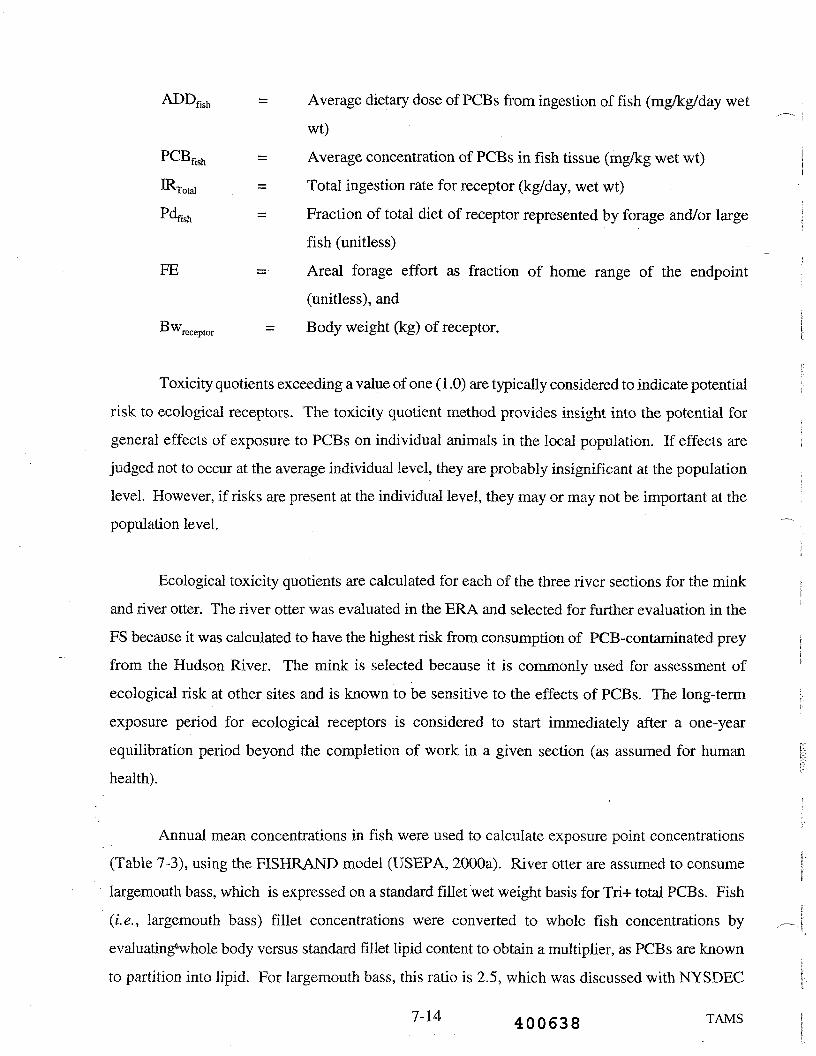
ADDfish = Average dietary dose of PCBs from ingestion of fish (mg/kg/day wet
wt)
PCBfish = Average concentration of PCBs in fish tissue (mg/kg wet wt)IRTotal = Total ingestion rate for receptor (kg/day, wet wt)
Pdfj^ = Fraction of total diet of receptor represented by forage and/or largefish (unitless)
FE =• Areal forage effort as fraction of home range of the endpoint(unitless), and
BwrecePtor = B ody weight (kg) of receptor.
Toxicity quotients exceeding a value of one (1 .0) are typically considered to indicate potential
risk to ecological receptors. The toxicity quotient method provides insight into the potential for
general effects of exposure to PCBs on individual animals in the local population. If effects are
judged not to occur at the average individual level, they are probably insignificant at the population
level. However, if risks are present at the individual level, they may or may not be important at the
population level.
Ecological toxicity quotients are calculated for each of the three river sections for the mink
and river otter. The river otter was evaluated in the ERA and selected for further evaluation in the
FS because it was calculated to have the highest risk from consumption of PCB-contaminated prey
from the Hudson River. The mink is selected because it is commonly used for assessment of
ecological risk at other sites and is known to be sensitive to the effects of PCBs. The long-term
exposure period for ecological receptors is considered to start immediately after a one-year
equilibration period beyond the completion of work in a given section (as assumed for human
health).
Annual mean concentrations in fish were used to calculate exposure point concentrations
(Table 7-3), using the FISHRAND model (USEPA, 2000a). River otter are assumed to consume
largemouth bass, which is expressed on a standard fillet wet weight basis for Tri+ total PCBs. Fish
(i.e., largemouth bass) fillet concentrations were converted to whole fish concentrations by
evaluating*whole body versus standard fillet lipid content to obtain a multiplier, as PCBs are known
to partition into lipid. For largemouth bass, this ratio is 2.5, which was discussed with NYSDEC
400638 TAMS

and thought to be comparable to values for Hudson River fish. PRGs for the river otter are providedon both a fillet and whole body basis. Mink are assumed to consume spottail shiner. As forage fish
were modeled on a whole body basis, no multiplier was applied. Individual annual TQs werecalculated for ecological receptors, which were then averaged over a 25-year period (Table 7-1) to
estimate risk.
7.2.2.1 River Otter
River otter are assumed to consume a diet consisting entirely (100 percent) of PCB-contaminated largemouth bass (representing large [greater than 25 cm] fish). All fish consumed areassumed to come from the Hudson River. Because river otters are closely related to mink, theLOAEL and NOAEL selected from field studies of dietary exposure of mink to PCBs are used to
develop toxicity reference values (TRVs) for the river otter. On the basis of a two-generation field
study conducted by Restum et al. (1998) showing reduced reproduction and/or growth and survival
of offspring in mink fed PCB-contaminated carp, the LOAEL and NOAEL TRVs (i.e., benchmark
concentrations) for the river otter are 0.04 mg PCBs/kg/day and 0.004 mg PCBs/kg/day, respectively.
7.2.2.2 Mink
Approximately one-third (34 percent) of the mink diet was assumed to consist of PCB-
contaminated spottail shiners (representing small [less than 10 cm] fish). All fish consumed are
assumed to come from the Hudson River. Although mink may consume other PCB-contaminated
prey, (e.g., crayfish and other aquatic invertebrates), these prey were not considered in the FS
calculations. On the basis of Restum et al. (1998), the LOAEL and NOAEL TRVs for the mink are0.04 mg PCBs/kg/day and 0.004 mg PCBs/kg/day, respectively.
7.2.2.3 Relative Reductions in Ecological Toxicity Quotients
Toxicity quotients for the entire Upper Hudson River and for each section of the river under
the active remedial alternatives are compared separately (using the appropriate time frame) to the oo\
bounded No Action and MNA alternatives to estimate the reduction in TQs achieved by each J£
7-15 TAMS
alternative. Comparison of the alternatives to both the HUDTOX and trend analysis results allowsTQs to be bounded by the two estimates.
7.2.2.4 Time to Achieve Ecological-Based PRGs
The risk-based PRO for protection of the environment is a range from 0.13 to 0.013 mg/kgtotal PCBs in fish fillets (0.3 to 0.03 mg/kg in whole fish), and is based on the LOAEL and NOAEL
fish concentrations for river otter consumption. Mink LOAEL and NOAEL whole fish targetconcentrations are 0.7 and 0.07 mg/kg PCBs. Since the mink consumes small forage fish (less than10 cm), fillet concentrations are not practical for calculations for this species. Toxicity equivalencyquotient (TEQ)-based fish target concentrations are provided in subsection 3.2.2. The time required
to reach the ecological target levels is used as a measure of the protection of the environment.
7.2.2.5 Ecological Probabilistic Dose-Response Analysis
The potential for population-level effects on the river otter is evaluated by comparing dose-
response curves from the literature (Moore et at., 1999) and cumulative distributions of exposure
developed in the Revised ERA (USEPA, 2000q). The potential for population-level effects is
expressed as the probability that a certain percentage of the otter population will experience a
decrease in fecundity (i.e., fertility). This analysis was run for River Sections 1 and 2 for 2011,2021,
and 2036, representing a range of exposures (2011 represents the exposure after completion of
remedial action, 2021 represents ten years after the completion of remediation, and 2036 represents
exposures representative towards the end of the modeling period). The risks in River Section 3 are
lower based on calculated toxicity quotients, and therefore a probabilistic dose-response analysis was
not performed for this section.
To compare the cumulative distributions with the dose-response curves from the literature,
the following procedure was used. First, the Monte Carlo exposure models were used to generatethe cumulative frequency of predicted dietary doses for each receptor. Output concentrations were
log-transformed, and the associated cumulative frequencies, expressed as fractions, were transformed
by the inverse of the normal cumulative distribution. The log-transformed Monte Carlo
concentrations and the transformed cumulative frequencies yield straight lines when plotted against
?-16 400640 TAMS

each other. The parameters of those regressions (one for each river mile-year combination) were
used to obtain the cumulative frequency for the specified doses in the dose-response curves from the
literature. The resulting curves can then be compared directly by plotting the probability of
exceedance on the y-axis and the percent reduction in fecundity on the x-axis.
7.3 Alternative-Specific Human Health Cancer Risks and Non-Cancer Health Hazards andEcological Risks
The quantitative assessment of the human health cancer risks and non-cancer health hazards
for each alternative for the entire 40 miles of the Upper Hudson River and for each of the three river
sections is discussed below. Ecological risks were calculated for each of the three river sections for
the river otter and mink. The alternatives for which alternative-specific risks were calculated and
presented are:
• No Action
• Monitored Natural Attenuation
CAP 3/10/Select
REM 3/10/Select
REM 0/0/3
/
For each of these alternatives, alternative-specific risk assessments were performed that
addressed the following criteria:
• Time to reach human health-based fish target levels;
• Cancer risks and non-cancer hazards;
• Short-term risks and hazards to human health;
• Time to reach ecological-based fish target levels; and
• Ecological risks (toxicity quotients) by receptor (river otter and mink).
ooo\
7-17 TAMS

7.3.1 No Action Alternative
The No Action Alternative consists of refraining from the application of any active
remediation technology to sediments in all three sections of the Upper Hudson River. The No
Action alternative also excludes any separate source control removal action (i.e., the NTCRA) in the
vicinity of the GE Hudson Falls plant, administrative actions (including institutional controls such
as fish consumption advisories), and any monitoring. Therefore, the No Action Alternative assumes
continuation of existing upstream boundary conditions; i.e., a constant PCB load equivalent to an
average water column PCB concentration of about 13 ng/L. The HUDTOX and FISHRAND
models, together with the bounding calculation described in Appendix D, were run to provide cancer
risk and non-cancer health hazard estimates.
7.3.1.1 Time to Reach Human Health-Based Fish Target Levels
As stated previously, the fish concentration PRG is 0.05 ppm PCBs (wet weight) in fillet
with additional target concentrations of 0.2 ppm and 0.4 ppm PCBs (wet weight). In River Sections
1, 2, and 3, the No Action alternative does not meet the human health PRG of 0.05 ppm or the target
concentration of 0.2 ppm PCBs within the modeling time frame, which extends to 2067 (Table 7-5).
Neither is the additional target concentration of 0.4 ppm reached in River Sections 1 and 2, but it is
reached in River Section 3 in 2014 (Table 7-5). These comparisons show that target levels would
not be achieved in the long term under the No Action alternative.
7.3.1.2 Cancer Risks and Non-Cancer Health Hazards
Cancer risks and non-cancer health hazards were calculated for two time frames for the No
Action alternative to cover the implementation time frames of all alternatives.
Non-Cancer Health Hazards
Non-cancer RME health hazards (i.e., His) for the No Action alternative in the Upper Hudson
River range from 53 to 80 using a start date of 2009 and from 48 to 75 using a start date of 2011
(Table 7-6a\ RME hazard indices (calculated for the 2009 and 2011 start dates) range from about
7-18 TAMS400642

70 to 100 in River Section 1 (Table 7-6b), from about 80 to 130 in River Section 2 (Table 7-6c), and
are about 10 in River Section 3 (Table 7-6d). There is no bounding range in River Section 3 because
there are no cohesive sediments in this river section, which accounts for the difference in predicted
exposure concentrations in the bounding calculation. The differences seen in this section are entirely
due to the start year. CT hazard indices are about an order of magnitude lower than RME hazard
indices, but are still above one at all locations except River Section 3 (Tables 7-6a to 7-6d). Non-
cancer hazard indices by river section are shown on Figures 7-1 and 7-2 for the RME and CT
exposure, respectively. All hazard indices except the CT estimate in River Section 3 are well above
the target level of one, indicating that the No Action alternative will not meet the non-cancer hazard
index target level in the long-term.
Cancer Risks
Incremental RME cancer risks for the No Action alternative in the Upper Hudson River range
from 7.8 x 10^ to 1.4 x 10'3 using a start date of 2009, and from 7.3 x 10"4 to 1.3 x 10'3 using a start
date of 2011 (Table 7-7a). RME cancer risks, calculated for the 2009 and 2011 start dates, range
from about 1.2 x 10'3 to 1.8 x 10'3 in River Section 1 (Table 7-7b), from 9.1 x lO"4 to 2.2 x 10"3 in
River Section 2 (Table 7-7c), and are about 1.6 x 10⁴ in River Section 3 (Table 7-7d). Cancer risks
by river section are shown on Figures 7-3 and 7-4 for the RME and CT exposure, respectively. The
Upper Hudson River as a whole, and River Sections 1 and 2 specifically, have RME cancer risks that
exceed the target risk range of 10"4 to 10"6, indicating that the No Action alternative will not meet the
cancer risk target level in the long term.
7.3.1.3 Short-Term Human Health Cancer Risks and Non-Cancer Health Hazards
Based on the modeling done to estimate long-term effects, a qualitative evaluation of short-
term cancer risks and non-cancer health hazards can be made. Fish concentrations for the seven/nine
year short-term period beginning in 2004 are above all target levels (Table 7-4). As PCB
concentrations are highest in the initial modeling years, it is apparent that target non-cancer health ^o
hazard and cancer risk levels will not be achieved in the short-term under the No Action alternative. °rf*
Short-term PCB concentrations do not differ between the base and upper bound No Action scenarios. u»
7-19 TAMS

7.3.1.4 Time to Reach Ecological Fish Target Levels
USEPA considered NOAEL/LOAEL target concentrations of 0.03/0.3 ppm and 0.07/0.7 ppm
PCBs (wet weight) in whole fish for the river otter and mink, respectively. The river otter
concentrations correspond to 0.13/0.013 ppm in fish fillets. The mink target concentrations are only
available on a whole fish basis and are not directly comparable to fillet-based PRGs.
The No Action alternative does not meet any of the river otter PRGs in River Sections 1, 2,
and 3 for the duration of the model under the base and upper bound calculations (Table 7-8). For
the base No Action alternative, the mink LOAEL target concentration is reached in River Section
2 in 2031, but it is not reached within the modeling period under the upper bound No Action
alternative. In River Section 3, the mink LOAEL TQ is reached prior to 2010.
7.3.1.5 Ecological Toxicity Quotients
Toxicity quotients for the river otter are above one for all comparisons in all three sections
of the river (Table 7-9). The river otter TQ is up to two orders of magnitude above the target level
(Figure 7-5) as compared to the NOAEL, and is an order of magnitude greater than the LOAEL
(Figure 7-6). The average mink TQ exceeds one for all comparisons except the LOAEL comparison
in River Section 3 (Figures 7-7 and 7-8).
7.3.1.6 Probabilistic Dose-Response Analysis
The probabilistic dose-response analysis for the No Action (including estimated upper bound)
alternative in River Section 1 (RM 189) shows about 100 percent probability of a 75 percent
reduction in female river otter fecundity in the year 2011, remaining within one percent of that level
through 2021 and 2036 (Table 7-10 and Figure 7-9). At the upper end of the dose response function,
the No Action alternative shows between 72 to 83 percent probability of a 98 percent reduction in
fecundity, falling to 56 to 70 percent in 2021, and to 54 to 68 percent in 2036. The range of
probabilities represents the curves from the base and estimated bound runs. At the 50 percent effect
level, there is a 100 percent probability of a 50 percent reduction in fecundity throughout the entire
modeling period (through 2036).
7-20 400644 TAMS

In River Section 2 (RM 184), the No Action (including estimated upper bound) alternative
shows a 100 percent probability of a 75 percent reduction in fecundity in the year 2011 (Table 7-11
and Figure 7-9). In 2021 there is a 89 to 100 percent probability of a 75 percent reduction in
fecundity, with the lower end falling to 61 to 99 percent in 2036. At the upper end of the dose-
response function, the No Action alternative shows between a 57 to 85 percent probability of a 98
percent reduction in fecundity in 2011, falling to 18 to 71 percent in 2021, and to 3 to 55 percent in
2036. At the 50 percent effect level, there is a 100 percent probability of a 50 percent reduction in
fecundity in 2011, a 99 to 100 percent probability in 2021, and 96 to 100 percent probability in 2036.
7.3.2 Monitored Natural Attenuation
Unlike No Action, the MNA alternative assumes a separate source control removal action
(NTCRA) in the vicinity of the GE Hudson Falls facility. It is assumed that as a result of the
NTCRA, the upstream Tri+ PCB load at Fort Edward (Rogers Island) will be reduced from 0.16
kg/day to 0.0256 kg/day (about 2 ng/L) on January 1,2005. The HUDTOX and FISHRAND models,
together with the bounding calculation described in Appendix D, were run to provide cancer risk and
non-cancer health hazard estimates. These models provide output in Tri+ PCBs, which are known
to bioaccumulate in fish.
7.3.2.1 Time to Reach Human Health-Based Fish Target Levels
The MNA alternative does not meet the human health PRG fish concentration of 0.05 ppm
PCBs in River Sections 1 and 2 within the modeling time frame, extending to 2067 (Tables 7-4 and
7-5). In River Section 3 it is reached in 50 years. The target concentration of 0.2 ppm is not reached
in River Section 1. In River Section 2 it is reached in a time period of 54 to more than 59 years and
in River Section 3 it is reached in 11 years. The 0.4 ppm target is achieved in a period from 32 to
more than 60 years in River Section 1, from 31 to more than 59 years in River Section 2, and in 2
years in River Section 3. The longer time to achieve PRGs is based on the upper bound MNA
alternative.oo
ui
7-21 TAMS

7.3.2.2 Cancer Risks and Non-Cancer Health Hazards and Relative Reductions
Cancer risks and non-cancer health hazards were calculated for the MNA alternative and
were then compared to the No Action alternative to determine the relative risk reduction.
Comparisons are made between cancer risks and non-cancer health hazards calculated for the same
time frames.
Non-Cancer Health Hazards
Non-cancer RME health hazards for the MNA alternative in the Upper Hudson River range
from 40 to 71 using a start date of 2009 and from 34 to 66 using a start date of 2011 (Table 7-6a).
Non-cancer RME hazard indices range from about 44 to 80 in River Section 1 (Table 7-6b), from
about 57 to 130 in River Section 2 (Table 7-6c), and from 6 to 7 in River Section 3 (Table 7-6d).
There is no bounding range in River Section 3 because there are no cohesive sediments in this river
section, which accounts for the difference in predicted exposure concentrations in the bounding
calculation. The differences seen in this section are entirely due to the start year. CT non-cancer
health hazards are roughly an order of magnitude lower than RME non-cancer health hazards, but
are still above one at all locations except River Section 3 (Tables 7-6a to 7-6d). Non-cancer hazard
indices by river section are shown on Figures 7-1 and 7-2 for the RME and CT exposure,
respectively. All hazard indices except the CT estimate in River Section 3 are well above the target
level of one, indicating that the MNA alternative will not meet the non-cancer hazard index target
level in the long term.
Based on RME and CT comparisons, the base MNA alternative achieves a 25 to 35 percent
reduction in non-cancer health hazard compared to the baseline No Action alternative in the upper
river, but only an 11 to 14 percent reduction when upper bound MNA concentrations are compared
to upper bound No Action concentrations (Table 7-6a). Similar results are seen in individual river
sections (Tables 7-6b to 7-6d), with the smallest reductions (as low as 2 percent) seen in River
Section 2.
7-22 400646 TAMS

Cancer Risks
Incremental RME cancer risks for the MNA alternative in the Upper Hudson River range
from 4.0 x 10"4 to 1.2 x 10~3 using a start date of 2009 and from 3.5 x 10"4 to 1.1 x 10'3 using a start
date of 201 l(Table 7-7a). RME cancer risks range from about 5.0 x 10"4 to 1.2 x 10'3 in River
Section 1 (Table 7-7b), from 5.2 x 1(T* to 2.2 x 10"3 in River Section 2 (Table 7-7c), and from about
6.8 x 10"5 to 7.7 x 10"5 in River Section 3 (Table 7-7d). Cancer risks by river section are shown on
Figures 7-3 and 7-4 for the RME and CT exposure, respectively. RME cancer risks exceed the target
risk range of lO'4 to 10"6 in River Sections 1 and 2, indicating that the MNA alternative will not meet
the cancer risk target level in the long term.
Based on RME and CT cancer risk comparisons, the base MNA alternative achieves a 3 1 to
52 percent reduction in cancer risk compared to the baseline No Action alternative in the upper river,
but only a 13 to 18 percent reduction in cancer risk when the upper bound MNA concentrations are
compared to the upper bound No Action concentrations (Table 7-7a). Results are similar when
examined on a section-specific basis (Tables 7-7b to 7-7d), with the smallest reductions (as low as
2 percent) seen in River Section 2.
7.3.2.3 Short-Term Human Health Cancer Risks and Non-Cancer Health Hazards
Based on the modeling done to estimate long-term effects, a qualitative evaluation of short-
term cancer risks and non-cancer health hazards can be made. Fish concentrations for the seven-to-
nine-year short-term period beginning in 2004 exceed all target levels (Table 7-4), with the exception
that the 0.4 ppm target is achieved in River Section 3 in 201 1 . Since PCB concentrations are highest
in the initial modeling years, target non-cancer health hazard and cancer risk levels will not be
achieved in the short term under the MNA alternative. Short-term PCB concentrations do not differ
between the base and upper bound No Action scenarios.
7.3.2.4 Time to Reach Ecological Fish Target Levels ^ooo\&The MNA alternative does not meet any of the river otter PRGs in River Sections 1 and 2 for *j
the duration of the model (Table 7-8). In River Section 3, the river otter LOAEL is reached in 14
7-23 TAMS
years. There is no difference between the estimated upper bound and base MNA alternatives in
River Section 3 because there are no cohesive sediments in this section of the river. Using the upper
bound MNA concentrations, the mink NOAEL and LOAEL target concentrations are not reached
in River Sections 1 and 2. Under the base MNA concentrations, the LOAEL target concentration
for the mink is reached in River Section 1 in 22 years and in River Section 2 in 10 years, and the
NOAEL target concentration is not reached in these sections at all.
7.3.2.5 Ecological Toxicity Quotients and Relative Reductions
Average toxicity quotients for the river otter are above one for all comparisons (Table 7-9).
The average mink TQ exceeded one for all comparisons except the base MNA LOAEL comparison
in River Section 2 and the LOAEL comparison in River Section 3.
The MNA alternative achieves between a 51 to 63 percent reduction in risk as compared to
the No Action alternative in River Section 1, a 7 to 36 percent reduction in River Section 2, and a
49 to 51 percent reduction in River Section 3 (Table 7-12). Greater reductions in risk are seen when
the base MNA scenario is compared to the base No Action scenario than are seen in the comparison
of the upper bound scenarios for MNA and No Action.
7.3.2.6 Probabilistic Dose-Response Analysis
The probabilistic dose-response analysis for the MNA alternative (including estimated upper
bound) in River Section 1 (RM 189), shows about a 92 to 99 percent probability of a 75 percent
reduction in female river otter fecundity in the year 2011, falling to 59 to 90 percent in 2021, and 20
to 73 percent in 2036 (Table 7-10 and Figure 7-10). At the upper end of the dose response function,
the MNA alternative shows between 23 to 50 percent probability of a 98 percent reduction in
fecundity, falling to 3 to 21 percent in 2021, and to 0.2 to 7 percent in 2036. At the 50 percent effect
level, there is a 100 percent probability of a 50 percent reduction in fecundity in 2011, a 95 to 100
percent probability in 2021, and a 71 to 98 percent probability in 2036.
In River Section 2 (RM 184), the MNA (including estimated upper bound) alternative shows
a 97 to 100 percent probability of a 75 percent reduction in fecundity in the year 2011 (Table 7-11
7-24 TAMS

and Figure 7-9). In 2021, there is a 58 to 100 percent probability of a 75 percent reduction in
I ^^ fecundity, falling to 3 - 98 percent in 2036. At the upper end of the dose response function, the
MNA alternative shows between a 43 to 83 percent probability of a 98 percent reduction in fecundity1 in 2011, falling to 3 - 67 percent in 2021, and to 0 - 47 percent in 2036. At the 50 percent effect
f level, there is a 100 percent probability of a 50 percent reduction in fecundity in 2011, a 95 to 100i! percent probability in 2021, and 31 to 100 percent probability in 2036.
I1 7.3.3 CAP-3/10/Select?t
This alternative includes capping with dredging to perform Expanded Hot Spot remediation
[ (i.e., in which the nominal MPA target concentrations are 3 g/m2 or greater) in River Section 1, Hot
Spot remediation (i.e., in which the nominal MPA target concentrations are 10 g/m2 or greater) in
River Section 2, and remediation of select areas (i.e., sediments with high concentration PCB target
areas) in River Section 3. This alternative also includes dredging in the navigation channel as
necessary to implement the remediation and to accommodate normal boat traffic in the river.
Remediation will commence in 2004 and will be completed in 2008. This alternative is performed
in conjunction with a separate source control (i.e., NTCRA) in the vicinity of the GE Hudson Falls
plant and also relies on naturally occurring attenuation processes to reduce the toxicity, mobility, and
volume of the remaining PCBs in the Upper Hudson River sediments after the construction is
completed. A review of site conditions will be conducted at five-year intervals.
This alternative assumes that 10 percent of the area targeted for capping is not capped due
to improper cap placement. Two simulations for sensitivity analyses were conducted for CAP-
3710/Select, modified by the assumption that a greater percentage of the area in the area targeted for
: containment (capping) is assumed not to have a cap due to improper placement during construction
of the cap or to subsequent damage to the cap after placement. The two simulations that were
modeled were that 15 percent and 25 percent of the areas targeted for capping were not capped.
These risk and hazard results from these simulations are similar to those from the base run (Table
7-6a to 7-7d) and are therefore not discussed in detail.ooo\&•vo
7-25 TAMS
7.3.3.1 Time to Reach Human Health-Based Fish Target Levels
In each of River Sections 1, 2, and 3, the CAP-3/ 10/Select alternative meets at least one of
the target fish concentrations. In River Section 1, the 0.4 ppm target is achieved in 19 years (2026),
in River Section 2 in 20 years, and in River Section 3 in one year (Table 7-5). The 0.2 ppm target
concentration is achieved in 36 years (2044) in River Section 2 and in five years in River Section 3.
The lowest target concentration of 0.05 ppm is reached in 42 years (2051) in River Section 3. The
remaining target levels are not achieved within the modeling time frame (which ends in 2067).
Results of the sensitivity runs were within two years of the base run (Table 7-5). These comparisons
show that at least one of the target levels would be reached in each section of the river under the
CAP-3/10/Select alternative.
7.3.3.2 Cancer Risks and Non-Cancer Health Hazards and Relative Reductions
Cancer risks and non-cancer hazards were calculated for the CAP-3/10/Select alternative.
These numbers are then compared to the No Action and MNA alternatives to determine the relative
risk reductions achieved by this alternative.
Non-Cancer Health Hazards
Non-cancer health hazards for the CAP-3/10/Select alternative in the Upper Hudson River
are 1.3 and 15 for the CT and RME scenarios, respectively (Table 7-6a). Hazard indices for the CT
and RME scenarios were 1.6 and 17 in River Section 1 (Table 7-6b), 1.9 and 22 in River Section
2 (Table 7-6c), and 0.44 and 5.4 in River Section 3 (Table 7-6d). The results for the sensitivity runs
show only small differences from the base scenario; however, as would be expected, the 25 percent
loss sensitivity shows the highest hazard indices of the group.
The CAP-3/10/Select alternative achieves a 72 to 81 percent RME non-cancer health hazard
reduction compared to No Action and a 63 to 79 percent RME non-cancer health hazard reduction
compared to MNA in the upper river (Table 7-6a). Comparisons to the CT scenario and comparisons
by river section show similar reductions in risk in River Sections 1 and 2. Reductions are lower in
River Section 3, where the RME and CT scenarios show a 46 and 53 percent reduction, respectively,
7'26 400650 TAMS
compared to No Action, and a 23 and 26 percent risk reduction compared to MNA. Non-cancer
hazard indices by river section are shown on Figures 7-1 and 7-2 for the RME and CT exposure,
respectively.
Cancer Risks
Incremental cancer risks for the CAP-3/10/Select alternative in the Upper Hudson River are
4.5 x 1CT6 and 1.8 x KX4 for the CT and RME scenarios, respectively (Table 7-7a). Cancer risks for
CT and RME exposure are 5.4 x 10'6 and 2.4 x 10⁴ in River Section 1 (Table 7-7b), 6.6 x 10'6 and
2.4 x 10"4 in River Section 2 (Table 7-7c), and 1.5 x ICT6 and 5.8 x 10⁵ in River Section 3 (Table 7-
7d). The results for the sensitivity runs show only small differences from the base scenario;
however, the highest incremental cancer risk is associated with the 25 percent loss sensitivity run,
as would be expected.
The CAP-3/10/Select alternative achieves a 77 to 87 percent RME cancer risk reduction
compared to No Action and a 55 to 84 percent reduction compared to MNA in the upper river (Table
7-7a). Comparisons to the CT scenario and comparisons by river section show similar reductions
in cancer risk in River Sections 1 and 2. In River Section 3 reductions are 65 and 53 percent
compared to the No Action alternative and 25 and 26 percent compared to the MNA for RME and
CT exposure, respectively. Incremental cancer risks by river section are shown on Figures 7-3 and
7-4 for the RME and CT exposure, respectively.
All of the calculated cancer risks are within the range of 10"4 to 10*, indicating that the CAP-
3/10/Select alternative will meet the cancer risk target level in the long-term.
7.3.3.3 Short-Term Human Health Cancer Risks and Non-Cancer Health Hazards
Based on the modeling done to estimate long-term effects, a qualitative evaluation of short-
term cancer risks and non-cancer health hazards can be made. Fish concentrations for the seven-yearoshort-term period beginning in 2004 indicate that only the 0.4 ppm fish concentration target level oo\
in River Section 3 would be met in the short term, in 2010 (Table 7-4); none of the other non-cancer ^]
health hazard and cancer risk target levels will be achieved in the short term under this alternative.
7-27 TAMS

7.3.3.4 Time to Reach Ecological Fish Target Levels
The CAP-3/10/Select alternative achieves the LOAEL target concentration for mink in River
Sections 2 and 3 by the completion of the remedial action in 2010, and the mink LOAEL in River
Section 1 is reached in five years (2014). The CAP-3/10/Select alternative does not meet any of the
NOAEL target levels for the river otter in any of the river sections within the modeling time frame,
but reaches the otter LOAEL target concentration in River Sections 2 and 3 in 52 years and 8 years,
respectively (Table 7-8).
The 15 and 25 percent loss sensitivity analyses showed similar times to reach target
concentrations, requiring at most two years longer than the base capping scenario to achieve some
of the target levels (Table 7-8).
7.3.3.5 Ecological Toxicity Quotients and Relative Reductions
Toxicity quotients for the river otter are above one for comparisons at River Sections 1 and
2 (Table 7-9). In River Section 3, only the otter NOAEL comparison has a TQ above one, while all
other comparisons are below one. The mink LOAEL TQ is below one at River Section 2.
Reductions in TQs in comparisons between the CAP-3/10/Select and the No Action
alternative range from 78 to 82 percent in the River Section 1, from 75 to 87 percent reduction in
River Section 2, and from 64 to 65 percent in River Section 3 (Table 7-12). Reductions compared
to the MNA alternative are between 45 and 64 percent in the River Section 1 and 62 and 86 percent
in River Section 2, and are 29 percent in River Section 3 (Table 7-12).
The TQs for the sensitivity analyses are similar to those of the base CAP-3/10/Select
alternative (Table 7-9). TQs for the 25 percent cap failure are slightly greater than the other
scenarios (Table 7-9). Reductions in risk range for 25 percent cap failure as compared to the No
Action alternative range between 76 to 81 percent in the River Section 1 and 70 to 84 percent in
River Section 2, and are 62 percent in River Section 3 (Table 7-12). These are slightly lower than
the reductions seen in the base scenario. Reductions as compared to the MNA alternative for the 25
7-28 Ann^r.~ TAMS
percent cap failure scenario are between 38 and 61 percent in the River Section 1, 54 and 83 percent
in River Section 2, and 23 and 25 percent in River Section 3 (Table 7-12).
7.3.3.6 Probabilistic Dose-Response Analysis
The probabilistic dose-response analysis for the CAP-3/ 10/Select alternative in River Section
1 (RM 189), shows about a 47 percent probability of a 75 percent reduction in female river otter
fecundity in the year 2011, falling to 19 percent in 2021, and 10 percent in 2036 (Table 7-10 and
Figure 7-11). At the upper end of the dose-response function, the CAP-3/10/Select alternative shows
about a 1 percent probability of a 98 percent reduction in fecundity, falling to 0.1 percent in 2021,
and to 0 percent in 2036. At the 50 percent effect level, there is a 91 percent probability of a 50
percent reduction in fecundity in 2011, a 71 percent probability in 2021, and a 55 percent probability
in 2036.
In River Section 2 (RM 184), the CAP-3/10/Select alternative shows a 40 percent probability
of a 75 percent reduction in fecundity in the year 2011 (Table 7-11 and Figure 7-11). In 2021 there
is a 5 percent probability of a 75 percent reduction in fecundity in 2011, falling to 0.1 percent in
2036. At the upper end of the dose-response function, the CAP-3/10/Select alternative shows a 0.9
percent probability of a 98 percent reduction in fecundity, falling to 0 percent in 2021 and in 2036.
At the 50 percent effect level, there is a 88 percent probability of a 50 percent reduction in fecundity
in 2011, a 42 percent probability in 2021, and a 6 percent probability in 2036.
7.3.4 REM-3/10/Select
This alternative includes Expanded Hot Spot remediation (i.e., in which the nominal MPA
target concentrations are 3 g/m2 PCBs or greater) in River Section 1, Hot Spot remediation (i.e., in
which the nominal MPA target concentrations are 10 g/m2 or greater) in River Section 2, and
dredging of select areas (i.e., sediments with high concentration PCB target areas) in River Section
3. This alternative also includes dredging in the navigation channel as necessary to implement the *•
remediation and to accommodate normal boat traffic on the river. Remediation will commence in cr»ui
2004 and will be completed in 2008. This alternative is performed in conjunction with a separate w
source control (i.e., NTCRA) in the vicinity of the GE Hudson Falls plant. After construction is
7-29 TAMS

completed, this alternative relies on institutional controls such as the fish consumption advisories
and on MNA in areas not remediated until the RAOs are achieved. A review of site conditions will
be conducted at five-year intervals.
In addition to the base case, three simulations for sensitivity analyses were conducted based
on the input for REM-3/10/Select, with assumptions of three different residual Tri+ PCB
concentrations in sediment:
• 0 mg/kg in the entire depth of sediment modeled in dredged areas;
• 2 mg/kg in the top 10 cm of sediment in dredged areas; and
• 5 mg/kg in the top 10 cm of sediment in dredged areas.
The sensitivity runs utilized these assumptions of residual PCB concentrations in place of
the original (base case) assumption of a residual concentration of 0.25 mg/kg PCBs for cohesive
sediments and 0.5 mg/kg for non-cohesive sediments in the entire depth of sediments in dredged
areas. The quantitative risks associated with the three sensitivity analysis runs are similar to the base
run and are therefore not discussed in detail below.
7.3.4.1 Time to Reach Human Health Fish Target Levels
In each of River Sections 1, 2, and 3, the REM-3/10/SeIect alternative meets at least one of
the target fish concentrations. In River Section 1, the 0.4 ppm target is achieved in 18 years (2025),
in River Section 2 in 16 years, and River Section 3 in one year (Table 7-5). The 0.2 ppm target
concentration is achieved in 32 years (2040) in River Section 2 and in five years in River Section 3.
The most stringent target concentration of 0.05 ppm is reached in 42 years (2051) in River Section
3. The remaining target levels are not achieved during the modeling time frame. The sensitivity run
results were within ten years of the base run (Table 7-5), with the 5 ppm residual run exhibiting the
greatest difference. These comparisons show that at least one of the target levels would be reached
in each section of the river under the REM-3/10/Select alternative.
7-30 TAMS400654

7.3.4.2 Cancer Risks and Non-Cancer Health Hazards and Relative Reductions
Cancer risks and non-cancer health hazards are calculated for the REM-3/10/Select
alternative. These numbers are then compared to the No Action and MCA alternatives to determine
the relative risk reduction achieved by this alternative.
Non-Cancer Health Hazards
Non-cancer health hazards for the REM-3/10/Select alternative in the Upper Hudson River
are 1.2 and 13 for the CT and RME scenarios, respectively (Table 7-6a). Hazard indices for the CT
and RME scenarios were 1.5 and 16 in River Section 1 (Table 7-6b), 1.5 and 18 in River Section 2
(Table 7-6c), and 0.44 and 5.3 in River Section 3 (Table 7-6d). The results of the sensitivity runs
do not differ much from the base scenario, with the exception of the 5 ppm residual run, which
shows the highest non-cancer hazard indices of the group (as expected).
The REM-3/10/Select alternative achieves a 75 to 84 percent RME hazard index reduction
compared to No Action and a 67 to 82 percent RME hazard index reduction compared to MNA in
the upper river (Table 7-6a). Comparisons to the CT scenario and comparisons by river section show
similar reductions in hazard indices in River Sections 1 and 2. Reductions are lower in River Section
3; reductions for the RME and CT scenarios show a 47 and 54 percent reduction compared to No
Action and a 24 and 27 percent reduction in hazard index compared to MNA. Non-cancer hazard
indices by river section are shown on Figures 7-1 and 7-2 for the RME and CT exposure,
respectively.
Cancer Risks
Incremental cancer risks for the REM-3/10/Select alternative in the Upper Hudson River are
4.0 x 10"6 and 1.7 x 10;4 for the CT and RME scenarios, respectively (Table 7-7a). Cancer risks for
CT and RME exposure are 5.2 x 10'6 and 2.3 x 10"4 in River Section 1 (Table 7-7b), 5.3 x 10'6 and
2.0 x 10^ in River Section 2 (Table 7-7c), and 1.5 x 10"6 and 5.7 x 10'5 in River Section 3 (Table 7-
7d). The sensitivity runs show that a 5 ppm residual can substantially increase cancer risks in the
7-31 TAMS
tn

upper river and River Sections 1 and 2. The 2 ppm residual scenario shows a smaller, but noticeable,
increase in cancer risks.
The REM-3/10/Select alternative achieves a 79 to 88 percent RME cancer risk reduction
compared to No Action and a 58 to 86 percent RME cancer risk reduction compared to MNA in the
upper river (Table 7-7a). Comparisons to the CT scenario and comparisons by river section show
similar reductions in cancer risk in River Sections 1 and 2. In River Section 3, reductions are 66 and
54 percent compared to the No Action alternative and 26 and 27 percent compared to the MNA for
the RME and CT exposures, respectively. Cancer risk reduction decreases with increasing residual
concentrations. Incremental cancer risks by river section are shown on Figures 7-3 and 7-4 for the
RME and CT exposure, respectively.
All of the calculated cancer risks are within the target risk range of 10^ to 10"6, indicating that
the REM-3/10/Select alternative will meet the cancer risk target level in the long-term.
7.3.4.3 Short-Term Human Health Cancer Risks and Non-Cancer Health Hazards
Based on the modeling done to estimate long-term effects, a qualitative evaluation of short-
term cancer risks and non-cancer health hazards can be made. For the seven-year short-term period
beginning in 2004, only the 0.4 ppm fish concentration target level in River Section 3 would be met
(Table 7-4); none of the other non-cancer health hazard and cancer risk target levels will be achieved
in the short term under this alternative.
7.3.4.4 Time to Reach Ecological Fish Target Levels
The REM-3/10/Select alternative achieves the LOAEL target concentration for mink in River
Sections 2 and 3 by the completion of the remedial action by 2009 and 2010, respectively (Table 7-
8). The REM-3/10/Select alternative does not meet any of the NOAEL target levels for the river
otter in any of the river sections within the modeling time frame (see Table 7-8), but the otter
LOAEL in River Section 3 is reached in 2018.
7-32 400656 TAMS
The sensitivity runs showed similar times to reach target concentrations, with the exception
of the 5 ppm residual, which takes more than 16 years longer than the base removal scenario to
achieve some of the target levels (Table 7-8).
7.3.4.5 Ecological Toxicity Quotients and Relative Reductions
Toxicity quotients for the river otter are above one for comparisons at River Sections 1 and
2 (Table 7-9). The mink LOAEL TQs are below one at all river sections. In River Section 3, only
the river otter NOAEL TQ is greater than one.
Reductions in toxicity quotients between REM-3/10/Select and the No Action alternative
range from 78 to 83 percent in the River Section 1 and 79 to 89 percent in River Section 2, and are
65 percent in River Section 3 (Table 7-12). Reductions as compared to the MNA alternative range
from 44 to 65 percent in the River Section 1, 67 to 88 percent in River Section 2, and 28 to 30
percent in River Section 3 (Table 7-12).
The TQs for the sensitivity runs are similar to those of the base CAP-3/ 10/Select alternative
(Table 7-9), although TQs for mink LOAEL TQ at River Section 1 are greater than one for the 2 ppm
and 5 ppm residual scenarios. The river otter LOAEL TQ at River Section 3 is above one for the 5
ppm residual scenario.
Reductions in risk for the sensitivity analysis runs as compared to the No Action alternative
range from 65 to 84 percent in the River Section 1, 56 to 90 percent in River Section 2, and 54 to 66
percent in River Section 3 (Table 7-12). Reductions in risk for the sensitivity analysis runs as
compared to the MNA alternative range froml4 to 67 percent in the River Section 1,34 to 89 percent
in River Section 2, and 9 to 33 percent in River Section 3 (Table 7-12). The greatest reductions in
TQs as compared to the No Action alternative are seen in the runs with the lowest residual sediment
PCB concentrations.
oo<r\
7-33 TAMS
7.3.4.6 Probabilistic Dose-Response Analysis
The probabilistic dose-response analysis for the REM-3/10/Select alternative in River Section
1 (RM 189), shows about a 41 percent probability of a 75 percent reduction in female river otter
fecundity in the year 2011, falling to 17 percent in 2021, and 10 percent in 2036 (Table 7-10 and
Figure 7-11). At the upper end of the dose-response function, the REM-3/10/Select alternative
shows about a 1 percent probability of a 98 percent reduction in fecundity, falling to 0.1 percent in
2021, and to 0 percent in 2036. At the 50 percent effect level, there is a 89 percent probability of a
50 percent reduction in fecundity in 2011, a 68 percent probability in 2021, and a 54 percent
probability in 2036.
In River Section 2 (RM 184), the REM-3/10/Select alternative shows a 23 percent probability
of a 75 percent reduction in fecundity in the year 2011 (Table 7-11 and Figure 7-11). In 2021 there
is a 3 percent probability of a 75 percent reduction in fecundity, falling to 0.1 percent in 2036. At
the upper end of the dose-response function, the REM-3/10/Select alternative shows a 0.2 percent
probability of a 98 percent reduction in fecundity in 2011, falling to 0 percent in 2021 and in 2036.
At the 50 percent effect level, there is a 75 percent probability of a 50 percent reduction in fecundity
in 2011, a 30 percent probability in 2021, and a 4 percent probability in 2036.
7.3.5 REM-0/0/3
This alternative includes Full-Section remediation (i.e., in which the MPA target
concentrations are 0 g/m2 or greater) in River Sections 1 and 2, and Expanded Hot Spot remediation
(i.e., in which the nominal MPA target concentrations are 3 g/m2 or greater) in River Section 3. This
alternative also includes dredging in the navigation channel as necessary to implement the
remediation and to accommodate normal boat traffic on the river. Remediation will commence in
2004 and will be completed in 2010. This alternative is performed in conjunction with a separate
source control (i.e., NTCRA) in the vicinity of the GE Hudson Falls plant. After construction is
completed, this alternative relies on institutional controls such as fish consumption advisories and
MNA in areas not remediated until the RAOs are achieved. A review of site conditions will be
conducted at five-year intervals.
7-34 TAMS400658
7.3.5.1 Time to Reach Human Health Fish Target Levels
REM-0/0/3 meets at least one of the target concentrations in all three sections of the river
within the modeling time frame (Tables 7-4 and 7-5). The 0.4 ppm target concentration is achieved
in 2013, in 2015, and in 2010 in River Section 1, River Section 2, and in River Section 3,
respectively (Table 7-4). The 0.2 ppm target concentration is achieved in 2034 in River Section 2
and in 2013 in River Section 3. The most stringent target concentration of 0.05 mg/kg PCBs in fish
fillets is reached in 2050 in River Section 3. Table 7-5 shows the number of years to achieve these
target levels for each river section under the REM-0/0/3 alternative. Note that all alternatives share
the same start years in this table (although REM-0/0/3 is completed later than the other alternatives)
to allow a direct comparison between alternatives.
7.3.5.2 Cancer Risks and Non-Cancer Health Hazards and Relative Reductions
Cancer risks and non-cancer health hazards calculated for the REM-0/0/3 alternative are
compared to target levels to determine cancer risks and non-cancer health hazards. These results are
then compared to the No Action and MNA alternatives to determine the relative cancer risk and non-
cancer health hazard reduction achieved by this alternative.
Non-Cancer Health Hazards
Non-cancer health hazards for the REM-0/0/3 alternative in the Upper Hudson River are 0.7
and 7.6 for the CT and RME scenarios, respectively (Table 7-6a). CT and RME hazard indices are
1.0 and 10 in River Section 1 (Table 7-6b), 0.87 and 9.7 in River Section 2 (Table 7-6c), and 0.3 and
3.6 in River Section 3 (Table 7-6d). All CT hazard indices are below one, with the exception of the
CT at River Section 1, which equals one.
The REM-0/0/3 alternative achieves an 84 to 90 percent RME non-cancer health hazard
reduction compared to No Action and a 77 to 88 percent RME non-cancer health hazard reductionocompared to MNA in the Upper Hudson River as a whole (Table 7-6a). Comparisons to the CT oa\
scenario and comparisons by river section show similar reductions in non-cancer health hazards in J£
River Sections 1 and 2. In River Section 3, reductions range from 60 to 65 percent compared to the
7-35 TAMS

No Action alternative and from 37 to 40 percent compared to MNA. Non-cancer hazard indices by
river section are shown on Figures 7-1 and 7-2 for the RME and CT exposure, respectively.
Cancer Risks
Incremental cancer risks for the REM-0/0/3 alternative in the Upper Hudson River are 2.4
x 10"6 and 1.2 x 10"4 for the CT and RME scenarios, respectively (Table 7-7a). CT and RME cancer
risks are 3.3 x 10* and 1.7 x 10⁴ in River Section 1 (Table 7-7b), 3.0 x 10'6 and 1.3 x 10"4 in River
Section 2 (Table 7-7c), and 1.0 x 10'6 and 4.3 x 10'5 in River Section 3 (Table 7-7d).
The REM-0/0/3 alternative achieves an 84 to 91 percent RME risk reduction compared to
No Action and a 66 to 89 percent RME risk reduction compared to MNA (Table 7-7a). Comparisons
to the CT scenario and comparisons by river section show similar reductions in risk in River Sections
1 and 2. In River Section 3, reductions are 65 to 73 percent compared to the No Action alternative
and 36 to 40 percent compared to the MNA. Cancer risks by river section are shown on Figures 7-3
and 7-4 for the RME and CT exposure, respectively.
All of the calculated cancer risks are within the target risk range, indicating that the REM-
3/10/Select alternative will meet the cancer risk target level in the long term.
7.3.5.3 Short-Term Human Health Cancer Risks and Non-Cancer Health Hazards
Based on the modeling done to estimate long-term effects, a qualitative evaluation of short-
term cancer risks and non-cancer health hazards can be made. Fish concentrations for the nine-year
short-term period beginning in 2004 indicate that only the 0.4 ppm fish concentration target level
in River Section 3 would be met in the short-term, in 2010 (Table 7-4); none of the other non-cancer
health hazard and cancer risk target levels will be achieved in the short term under this alternative.
7.3.5.4 Time to Reach Ecological Fish Target Levels
The REM-0/0/3 alternative achieves the LOAEL target concentration for mink in River
Sections 2 and 3 by the completion of the remedial action in 2010 (Table 7-8). The REM-0/0/3
"6 400660

alternative does not meet any of the NOAEL target levels for the river otter in any of the river
sections within the modeling time frame (see Table 7-8), but the otter LOAEL in River Sections 2
and 3 is reached in 2044 and 2015, respectively.
7.3.5.5 Ecological Toxicity Quotients and Relative Reductions
Average toxicity quotients for the river otter are above one at River Sections 1 and 2 (Table
7-9). In River Section 3, only the otter NOAEL has a TQ above one, with all other comparisons
below one. The mink LOAEL TQs are also below one at River Sections 1 and 2. This alternative
has the lowest calculated ecological toxicity quotients.
Reductions in TQs compared to the No Action alternative are between 84 and 87 percent in
the River Section 1, 86 and 93 percent in River Section 2, and 47 and 49 percent in River Section
3 (Table 7-12). Reductions compared to the MNA alternative are between 59 and 75 percent in the
River Section 1, 79 and 93 percent in River Section 2, and 47 and 49 percent in River Section 3
(Table 7-12).
7.3.5.6 Probabilistic Dose-Response Analysis
The probabilistic dose-response analysis for the REM-0/0/3 alternative in River Section 1
(RM 189) shows about a 12 percent probability of a 75 percent reduction in female river otter
fecundity in the year 2011, falling to 7 percent in 2021, and 6 percent in 2036 (Table 7-10 and Figure
7-11). At the upper end of the dose-response function, the REM-0/0/3 alternative shows about a 0.1
percent probability of a 98 percent reduction in fecundity, falling to 0 percent in 2021 and 2036. At
the 50 percent effect level, there is a 60 percent probability of a 50 percent reduction in fecundity in
2011, a 47 percent probability in 2021, and a 46 percent probability in 2036.
In River Section 2 (RM 184), the REM-0/0/3 alternative shows a 5 percent probability of a
75 percent reduction in fecundity in the year 2011 (Table 7-11 and Figure 7-11). In 2021 there is a
0.3 percent probability of a 75 percent reduction in fecundity, falling to 0 percent in 2036. At the oa\
upper end of the dose-response function, the REM-0/0/3 alternative shows a 0 percent probability £)
of a 98 percent reduction in fecundity in 2011, 2021, and 2036. At the 50 percent effect level, there
7-37 TAMS

is a 40 percent probability of a 50 percent reduction in fecundity in 2011, a 9 percent probability in
2021, and a 2 percent probability in 2036.
7.4 Uncertainties in Human Health and Ecological Risk Characterization
The uncertainties associated with the human health and ecological risk assessment procedures
are discussed in detail in the Revised HHRA (USEPA, 2000p) and Revised ERA (USEPA, 2000q),
respectively. Uncertainties associated with the HUDTOX fate and transport modeling and the
FISHRAND bioaccumulation modeling are discussed in the RBMR (USEPA, 2000a) and in
Appendix D of this FS. This section provides a brief summary of these findings.
The uncertainties associated with characterization of risks under a given set of exposure
concentrations are consistent among alternatives and should not influence estimates of relative
reductions in risk. In contrast, uncertainty in forecasts of exposure concentrations can alter estimates
of relative reductions in risk. This is because the level of uncertainty in predicting exposure
concentrations is believed to be greater for No Action and MNA than for active remediation, as
discussed in Appendix D. Future trends in surface sediment concentrations in particular are subject
to high levels of uncertainty for No Action and MNA, for which the model predicts reductions over
time by a combination of burial and exchange with the water column. Active remediation, in which
PCBs are permanently removed from the river, has a much higher level of certainty. Uncertainties
associated with the exposure and bioaccumulation modeling are common to both the human health
and ecological risk assessments and are discussed in the following text.
7.4.1 Uncertainties in Exposure Pathway Assumptions
The assumptions used for the selection of human health exposure pathways, defining the
angler population, PCB concentrations in fish, fish ingestion rate, fraction from source, angler
exposure duration, and PCB cooking losses are considered to be reasonable, and the associated
uncertainty is not expected to influence the overall conclusions of the Revised HHRA (USEPA,
2000p). Likewise, the assumptions used for the ecological exposure pathways are considered to be
reasonable and the associated uncertainty is not expected to influence the overall conclusions of the
Revised ERA (USEPA, 2000q).
7-38 400662 TAMS

7.4.2 Uncertainties in Toxicological Data
The toxicity values used in the human health risk assessment have been peer reviewed and
are the most current values recommended by USEPA in its Integrated Risk Information System
(IRIS) (USEPA, 1999i). A number of epidemiological studies in human populations and animal
toxicity studies have been conducted since the IRIS files for Aroclors 1016 and 1254 were last
updated. USEPA is currently evaluating these toxicity data as part of the non-cancer re-assessment
and will determine if modifications to the RfD are warranted. The fact that any previous exposures
(either background or past consumption of PCB-contaminated fish) may still be reflected in an
individual's current body burden is an additional source of uncertainty, and may result in an
underestimate of non-cancer health hazards. The uncertainties in the cancer slope factor (CSF)
suggest that estimated cancer risks may be either over- or under-estimated (USEPA, 1996c; USEPA,
1999d).
To minimize uncertainty associated with the difference among species in sensitivity to PCBs
in ecological receptors, the TRVs utilized for the Hudson River ecological risk assessments and
utilized for this FS are based on studies conducted on species the same as or closely related to (i.e.,
within the same taxonomic family) the ecological receptors evaluated in this FS (river otter and
mink). Both laboratory and field studies were used to develop TRVs.
7.4.3 Uncertainties in Exposure and Bioaccumulation Modeling
Two models - HUDTOX and FISHRAND - were used to predict fish concentrations used in
this FS. Uncertainties associated with these models are summarized below and discussed in greater
detail in Appendix D.
7.4.3.1 Uncertainties in the HUDTOX Fate and Transport Modeling
The HUDTOX mass balance fate and transport model is the quantitative foundation for the4i.
alternative-specific risk assessments presented in this FS. HUDTOX provides a best-estimate oo
interpretation of the 1977-99 history of observed PCB fate and transport in the Upper Hudson River, £Ju>
at a model segment-averaged spatial scale. While this model is calibrated to provide a best-estimate
7-39 TAMS

interpretation of data, the interpretations are not necessarily exact. First, the calibrated model is
limited by the quality of available calibration data. In some key areas, the calibration data are limited
(e.g., there are only very limited data available on surface-layer sediment PCB concentrations over
time). Further, deficiencies in the calibration data could result in a model that is biased in the sense
that causal relationships are not perfectly captured, which may result in inaccuracies when the model
is used in a forecast mode. Bias might also be introduced if there has been a qualitative change in
the nature of PCB fate and transport in the river relative to the model calibration period. Finally, the
model cannot capture all the details of PCB fate and transport at the local scale at which transport
from the environment into biota, and thus potentially to humans, actually occurs.
Uncertainties associated with HUDTOX model calibration and spatial segmentation, as well
as an empirical analysis of recent data-based trends in fish and sediment (Appendix D), raise the
distinct possibility of a slower rate of natural attenuation of sediment exposure concentrations than
that predicted by the HUDTOX model, particularly at the localized spatial scales associated with the
foraging range of resident fish. This would result in overestimation of the benefits of natural
attenuation.
The trend analyses suggest the possibility that the model-predicted rate of decline of surface
sediment Tri+ PCB concentrations in locations associated with NYSDEC fish sample collection,
and, as a result, the rate of decline of fish concentrations driven by sediment exposures, may be too
fast. The discrepancy is most likely due to cohesive sediments, as these sediments provide the main
route of exposure to fish. This, in turn, suggests that the use of a bounding forecast for No
Action/MNA constructed using a slower rate of decline in cohesive sediment concentrations is an
appropriate method to address uncertainty. A full discussion of the development of the bounding
forecast is contained in Appendix D.
7.4.3.2 Uncertainties in FISHRAND Bioaccumulation Modeling
Like HUDTOX, the FISHRAND bioaccumulation model similarly provides a best-estimate
interpretation of the history of observed PCB concentrations in fish, conditional on the HUDTOX
interpretation of PCB fate and transport. FISHRAND bioaccumulation modeling is also subject to
uncertainties and potential errors.
7-40 400664 TAMS
The literature review and experimental data collected for the Hudson River has shown that:
(1) river ecosystem characteristics vary significantly from one location to another depending on flow
rate, depth, sediment structure, etc.; and (2) certain parameters in the model (such as feeding
preferences) are only imprecisely known. Moreover, most of the observed data are not easily related
to FISHRAND input parameters because observations are taken at specific points in space and time,
while the FISHRAND model parameters are values corresponding to averages over time, space, and
species. It is also important to remember that calibration of the FISHRAND model was conducted
using environmental concentration estimates from HUDTOX as the forcing function. Thus, any
uncertainties in the HUDTOX model calibration will also propagate into the FISHRAND calibration.
The RBMR shows that the relative percent difference between FISHRAND predictions and
observed data is typically within 25 to 40 percent, and significantly less than that for many individual
years, species, and locations. This suggests roughly a factor of two, or less, uncertainty in the mean
estimate of fish concentration. Fortunately, most of the identified sources of uncertainty in the
bioaccumulation modeling are likely to apply equally to the evaluation of No Action, MNA, and
active remediation scenarios. This means that estimates of the relative risk reduction among
remedial alternatives, and between remedial alternatives and No Action or MNA, are subject to less
uncertainty.
7.4.4 Impacts of Uncertainty
As evident from the foregoing discussion, there are a number of potential sources of
uncertainty in the fate and transport, bioaccumulation, and risk estimation tools used to develop and
compare the alternative-specific human health and ecological risk assessments. Accordingly, the
characterizations of risk associated with each alternative are also uncertain. Although these
estimates are uncertain, the uncertainty that applies to the evaluation of all alternatives (including
No Action) has no impact on the relative risk reduction ranking of remedial alternatives.
Analysis of relative risk reduction is potentially impacted more seriously by sources of
uncertainty that apply unequally to active remediation versus No Action and MNA, or by any opotential biases in the component models. As discussed, the major issue for the evaluation of °
<T»relative risk reduction is the potential for biases in the HUDTOX modeling, especially in the forecast in
7-41 JAMS
of exposure concentrations at localized spatial scales under the No Action or MNA alternatives.
These issues are set out in full detail in Appendix D. In Appendix D, an evaluation of potential
sources of error in the HUDTOX calibration coupled with analysis of other lines of evidence,
including evaluation of recently observed trends in fish tissue and surface sediment concentrations,
is used to develop a bounding calculation on cohesive sediment exposure concentrations and
resulting fish tissue concentrations. Use of this bounding calculation, supported by the data, is
appropriate to provide reasonable assurances on the degree of risk and hazard reduction attainable
under the No Action and MNA alternatives.
400666 TAMS

Ioc
400667
8. DETAILED ANALYSES OF REMEDIAL ALTERNATIVES
Chapter 8 presents a detailed description and analysis of each remedial alternative that passed
the effectiveness, implementability, and cost screening evaluation in Chapter 6. Five remedialalternatives in four different categories were retained for detailed analysis. Section 8.1 provides a
summary of the detailed analysis process, the nine criteria used to analyze each remedial alternative,and the manner in which these criteria are applied in this FS. Sections 8.2 through 8.6 present the
detailed description and analyses of these five alternatives. To minimize redundancy, the descriptionof the alternatives makes use of the general description of common elements (such as capping,
removal, and monitoring) presented previously in Section 5.2. However, any differences or
alternative-specific issues related to the implementation of these technologies are addressed in the
alternative-specific descriptions and evaluations presented below. As described further in
subsections 8.1.8 and 8.1.9 below, the two modifying criteria (State Acceptance and Community
Acceptance) are not addressed in this FS report. The extent to which alternatives are analyzed during
the detailed evaluation is determined, to a large degree, by the available data and the use of best
engineering judgment.
8.1 Evaluation Process and Evaluation Criteria
The detailed description of the remedial alternatives includes the following:
• A description of the alternative, including the technologies comprising the alternative;
• A description of engineering, safety, environmental, public health, or other considerations
that affect the feasibility of the alternative;
• The aspects of the sediment and surface water contamination problem that the alternative will
or will not control; and
o• A preliminary conceptual engineering design including necessary facilities, equipment, and o
construction items. A breakdown of the quantities, dimensions, and sizing of major £}
components of the conceptual design is provided as a basis for cost estimation. Consistent
8-1 TAMS
with the RI/FS Guidance, the level of detail in the preliminary design is focused on providing
cost estimates with an accuracy in the range of -30 percent to +50 percent.
The NCP provides nine key criteria to address the CERCLA requirements for analysis of
remedial alternatives. The first two criteria are threshold criteria that must be met by each
alternative. The next five criteria are the primary balancing criteria upon which the analysis is based.
The final two criteria are referred to as modifying criteria and are applied, following the public
comment period, to evaluate state and community acceptance.
The two threshold criteria are:
• Overall Protection of Human Health and the Environment: and
• Compliance with ARARs.
The five primary balancing criteria upon which the analysis is based are:
• Long-Term Effectiveness and Permanence;
• Reduction of Toxicity, Mobility or Volume through Treatment;
• Short-Term Effectiveness;
• Implementability; and
Cost.
The two modifying criteria wi l l be evaluated following comments on the Proposed Plan
and w i l l be described in the ROD for the site. The modifying criteria are not addressed in this FS.
These cri teria are:
• State Acceptance; and
• Community Acceptance.
Each of these nine criteria is described below and seven of them are employed in the detailed
analysis of alternatives for remediation of Upper Hudson River sediments. The two modifying
criteria (State Acceptance and Community Acceptance) will be addressed in USEPA's ROD.
400669 -AV1S

1•• It must be stressed that the alternatives described in the following analyses are conceptual.
i Any characteristics of these alternatives (such as remediation locations, depths, and removal/capping
[I rates), while based on the available data and information, should be considered to be preliminary.In addition, some of the alternatives may impact wetlands adjacent to the banks of the river. If
[1 necessary, estimates of the wetland impacts will be refined, and replacement and mitigation methodswill be developed during remedial design.
Brief discussions on each of the nine criteria are presented in the sections below.
8.1.1 Threshold Criterion 1: Overall Protection of Human Health and the Environment
This evaluation criterion provides a final assessment as to whether each alternative
adequately protects human health and the environment, and draws on the assessments conducted
under other evaluation criteria, especially long-term effectiveness and permanence, short-term
effectiveness, and compliance with ARARs. As part of determination of protectiveness, the
evaluation describes how risks through each pathway would be eliminated, reduced, or controlled
through treatment, engineering, or institutional controls. This criterion considers unacceptable short-
term or synergistic (e.g., cross-media) effects posed by an alternative. For example, overall
protection considers potential volatilization of PCBs during sediment processing at the transfer
facilities.
Long-term effectiveness is evaluated by using modeling results to project the human health
and ecological impacts through the years over the exposure period of a human or ecological receptor.
As described in Section 7.1, the maximum time frame used to calculate non-cancer health hazards
and cancer risks for human health modeling is 40 years, and ecological toxicity quotient (TQ)
modeling results are based on a 25-year exposure period, with starting dates ranging between 2008
and 2012 depending on the alternative and river section. The FISHRAND model wasVun for a 70-
year period (1998 to 2067) for this FS, and the full modeling time frame is examined when
determining the number of years required to reach human health and ecological target levels. As
explained in Section 7.1, these time frames are consistent with the time periods for the RevisedHHRA (USEPA 2000p) and Revised ERA (USEPA, 2000q). Short-term effectiveness is evaluated
primarily by a qualitative evaluation of effects associated with each alternative and secondarily by
8-3 TAMS
examining whether preliminary remedial goals (PRGs) would be met in the short term using
modeling results (not considering the effects of remedial action). Compliance with ARARs is
evaluated using a straightforward comparison of modeled results with criteria.
8.1.1.1 Protection of Human Health
The protection of human health is assessed quantitatively through calculation of both non-
cancer health hazards and carcinogenic health risks as described previously in subsection 7.2.1.
8.1.1.2 Protection of the Environment - Ecological Risks and Downstream Transport
The protection of the environment is assess*, d through the evaluation of risks to ecological
receptors, and the downstream transport of PCBs. The risl'S to ecological receptors (specifically, the
river otter and mink) are addressed quantitatively through calculation of NOAEL/LOAEL-based TQs
as described previously in subsection 7.2.2. Downstream transport is evaluated through modeled
projections of Tri+ PCB loads transported from one nver section to the next, and from the Upper
Hudson River to the Lower Hudson River.
8.1.2 Threshold Criterion 2: Compliance with ARARs
Alternatives are assessed as to whether they attain federal and state legally applicable or
relevant and appropriate requirements (ARARs), including:
• Chemical-specific ARARs (e.g., maximum contaminant levels [MCLs], Ambient Water
Quality Criteria [AVVQC]);
• Location-specific ARARs (e.g., requirements for constructing a hazardous waste facility in
a floodplain);
• Action-specific ARARs (e.g., Toxic Substances Control Act requirements for PCB
remediation waste); and
• Other criteria, advisories, and guidelines, as appropriate.
8-4 TAMS400671
USEPA may select a remedial action that does not attain a particular ARAR under certain
conditions outlined in CERCLA Section 121(d) and the NCP. These waivers are discussed in
subsection 2.1.4.
8.1.3 Primary Balancing Criterion 1: Long-Term Effectiveness and Permanence
Alternatives are also assessed for the long-term effectiveness and permanence they afford,and the degree of certainty that the alternative will prove successful. Factors that can be considered,
according to the NCP and RI/FS Guidance, are as follows:
• Long-term reliability and adequacy of the engineering and institutional controls, including
uncertainties associated with land disposal of untreated wastes and residuals.
• Magnitude of residual risks in terms of amounts and concentrations of wastes remaining
following implementation of a remedial action, considering the persistence, toxicity,
mobility, and propensity to bioaccumulate of such hazardous substances and their
constituents.
The time period for the evaluation of the long-term effectiveness and permanence is
considered to extend from the end of the short-term period, i.e., beginning in 2010 for all alternatives
(except in 2012 for The REM-0/0/3 alternative, as discussed in subsection 8.1.5). Depending on the
particular aspect of the criterion being analyzed, the end dates vary, as discussed below.
8.1.3.1 Magnitude of Residual Risks
The magnitude of residual risks for each alternative is based on both human health and
ecological effects. These were evaluated as follows.
ooa\to
8-5 JAMS

Long-Term Effectiveness - Human Health Evaluation
Long-term human health effects are modeled for the same time period as was used for the
Revised HHRA (USEPA, 2000p) as summarized previously in subsection 7.1.2.1 and reiterated
below:
For cancer risks:
• Reasonable maximum exposure (RME): 40 years (2011 through 2050)
Central tendency (CT) exposure ("average"): 12 years (2011 through 2022)
For non-cancer health hazards:
RME: seven years (2011 through 2017)
CT exposure: 12 years (2011 through 2022)
However, as noted on Table 7-1, the specific ycars modeled vary, depending on the assumed
progress of remediation within a given river segment for each alternative; No Action and MNA
alternatives are modeled with time periods that correspond to the three active remedial alternatives
so that meaningful comparisons among alternatives can be made. Table 7-1 summarizes the time
frames utilized in the calculation of the alternative-specific human health and ecological risks and
hazards.
As was done in the Revised HHRA, the modeled fish concentrations for each of the three
river sections are averaged, with each year and each river section weighted equally. In addition, risk
calculations are also presented for each individual section of the Upper Hudson River. The fish
concentrations used are the species-weighted averages, based on Connelly etal. (1992), and are those
considered to represent a reasonable ingestion scenario among the three fish species modeled that
are consumed to any significant extent by human receptors (anglers): largemouth bass (47 percent);
brown bullhead (44 percent); and yellow perch (9 percent).
The alternative-specific long-term human health risk calculations for fish ingestion for each
alternative are presented in Chapter 7. More detail on the process for this calculation is provided
above in subsection 7.2.1.
8-6 400673 TAMS

Long-Term Effectiveness - Ecological Assessment
The ecological assessment in Chapter 7 is based on modeled effects for two receptors, the
river otter and mink. TQs are calculated for both the NOAEL and the LOAEL to provide a range
of exposure risks. The bald eagle, a piscivorous bird, was also considered as a potential receptor to
model for the FS. However, adult eagle risks are much lower than otter risks, and eagle egg risks
are similar (but slightly lower) than otter risks. Therefore, only river otter (the most sensitive
receptor) and mink results are presented here.
As in the evaluation of human health risks, the start date for the long-term effectiveness
period was considered to be immediately after the equilibration period following remediation.
Ecological risks for each section of the river for each active alternative are compared separately to
the No Action and MNA alternatives. The 25-year forecast period used in the Revised ERA was also
selected as the mink and river otter exposure period in this FS. This exposure period is considered
appropriate because it extends throughout the average lifespan of both mammalian receptors. Mink
live up to 10 years (Walker, 1997; Kurta, 1995) and river otter live on the average 15 to 20 years in
the wild and up to 25 years in captivity (Ohio Division of Wildlife, 2000).
The alternative-specific long-term ecological risk calculations for each receptor and each
alternative are tabulated and summarized in Chapter 7. More detail on the process for this
calculation is provided above in subsection 7.2.2.
8.1.3.2 Adequacy and Reliability of Controls, if Any, Used to Manage Untreated Wastes orTreatment Residuals
In general, this criterion is qualitative and is based on review of documentation regarding the
various technologies, and professional judgment as to how the specific conditions in the Upper
Hudson River (and in individual river sections, as applicable) affect the use of information available
in the literature.
oo
8-7 TAMS
For capping, a semi-quantitative assessment was made of the effectiveness of the controls,
assuming that partial cap failure or other defects occurred. This assessment is discussed in greaterdetail in the alternative-specific analysis of this criterion.
8.1.3.3 Remedy Replacement and the Continuing Need for Repairs/Maintenance
For this FS, only two elements may possibly require ongoing maintenance or activity. Theseare the engineered cap (a component of one of the alternatives subject to detailed analysis) and
monitoring of sediments, water quality, and PCB concentrations in fish (a long-term component of
all alternatives). Both elements are addressed in the conceptual design of the alternatives and in the
cost estimates. A more detailed assessment for each alternative is discussed in the alternative-specific analysis for this criterion. As noted above, assumptions are made regarding the magnitude
of potential cap defects, as well as their frequency. Possible consequences of the failure to detector repair defects in the cap are discussed.
8.1.4 Primary Balancing Criterion 2: Reduction of Toxicity, Mobility, or Volume ThroughTreatment
CERCLA expresses a preference for remedial alternatives that employ treatment that reducesthe toxicity, mobility, or volume of hazardous substances. Relevant factors include:
• The treatment processes that the remedies employ and the materials they will treat;
• The amount of hazardous materials that will be destroyed or treated;
• The degree of expected reduction in toxicity, mobility, or volume;
• The degree to which the treatment is irreversible;
• The type and quantity of residuals that will remain following treatment, considering the
persistence, toxicity, mobility, and propensity to bioaccumulate of such hazardous substances
and their constituents; and
• Whether the alternative would satisfy the statutory preference for treatment as a principal
element.
8-8 400675 TAMS

For this FS, this criterion is evaluated both by assessment of the extent to which the mass of
PCBs is reduced and the degree to which the toxicity, mobility, or volume of PCB-contaminated
sediments is reduced in each of the five alternatives. Removal alternatives are considered to achieve
a reduction in the volume of contaminated sediments at the site; however, the extent to which
destruction of toxic contaminants (i.e., PCBs) would occur varies depending on the final treatment
or disposition of the removed sediments.
One alternative is analyzed that involves capping as a component (along with dredging). The
extent to which the capping achieves irreversible reduction in contaminant mobility is also discussed
under this criterion.
8.1.5 Primary Balancing Criterion 3: Short-Term Effectiveness
The short-term effectiveness of alternatives is assessed considering such appropriate factors
as:
• Protection of the community during remedial actions;
• Protection of the workers during remedial actions;
• Potential adverse environmental impacts resulting from construction and implementation;
and
• Time unti l remedial response objectives (i.e., RAOs and PRGs) are achieved.
For the purposes of this FS, the short-term period is ^onsidered to include the time from
init iat ion of remedial activit ies, assumed to be in the year 2004, through the alternative-specific and
river section-specific period for implementation, and a subsequent one- to two-year period for
attenuation of residual impacts. Therefore, the short-term period is of variable durat ion, and extends
from 2004 through the year immediately prior to the beginning of the long-term period, as shown
on Table 7-1. Modeling results for active remedial alternatives are compared to No Action and
MNA alternatives for the same time period, so that comparisons among alternatives are on a *>oconsistent basis. °
8-9 JAMS

8.1.5.1 Protection of the Community During Remedial Actions
Community risks that are considered include both physical hazards (e.g., noise, navigation
hazards) and potential exposure to hazardous materials (e.g., PCBs).
The protection of the community during remedial actions is assessed on a qualitative basis
because the HUDTOX model does not account for potential resuspension of sediments during
remediation, and therefore the full benefits of the remedial action shown by the model may not be
achieved by the year indicated by the model. However, an estimate of the additional PCB load to
the water column resulting from dredging activities is made; and this is presented in the discussion
of potential adverse impacts environmental impacts resulting from construction and implementation
(as described in general in subsection 8.1.5.3, below).
8.1.5.2 Protection of Workers During Remedial Actions
Potential risks to workers implementing the various remedial alternatives as well as measures
to prevent, minimize, or mitigate such risks are addressed as pan of this criterion. The risks to
workers that are considered include both physical hazards (e.g., fa l l ing off the deck of a barge or
being injured in other job-related accidents) and potential exposure to hazardous materials (e.g.,
PCBs).
8.1.5.3 Potential Adverse Environmental Impacts Resulting from Construction andImplementation
Potential adverse environmental impacts are addressed both quali tat ively and seini-
quant i ta t ively. As a result of a removal action, environmental condit ions may be adversely affected
both at the site of remedial operations as well as at locations downstream. Both concerns were
considered in the development of the remedial alternatives as well as in the selection of engineering
techniques to implement the alternatives. Appendix E.6 contains a detailed discussion of a semi-
quantitative model used to assess short-term resuspension impacts as a result of sediment removal.
These calculations are focused on the potential increase in downstream PCB loads and water column
concentrations, which represent the primary route for environmental impacts in areas not directly
8-10 400677

affected by the remedial construction. Estimates of short-term loads and concentrations are
compared with HUDTOX forecasts in the absence of sediment remediation to place the short-term
impacts in perspective. Potential short-term impacts from actions such as temporary habitat loss are
discussed qualitatively since there is no reliable means of quantifying them.
8.1.5.4 Time until Remedial Response Objectives are Achieved
As discussed earlier, modeling results do not consider the potential short-term adverse
impacts of remedial actions. The time to achieve short-term remedial response objectives is
evaluated using the year after the completion of the remedial action. For example, considering the
Upper Hudson River as a whole, the short-term period would extend from 2004 through 2008 (or
through 2010 for The REM-0/0/3 alternative), lasting for five to seven years. The short-term period
is the longest for River Section 3, ending in 2010 (or 2012 for The REM-0/0/3 alternative).
As discussed earlier, HUDTOX/FISHRAND modeling results do not consider the potential
short-term adverse impacts of remedial actions. The time to achieve short-term remedial response
objectives is evaluated by examining conditions in the year after the completion of the remedial
action. These conditions are based on the forecasts produced by HUDTOX/FISHRAND. For
example, considering the Upper Hudson River as a whole, the short-term period for capping or
removal alternatives extends from 2004 through 2008 (or through 2010 for The REM-0/0/3
alternative), lasting for five to seven years. The short-term period is greatest in duration for River
Section 3, ending in 2010 (or 2012 for The REM-0/0/3 alternative). This arises from the fact that
this section is downstream of the remedial efforts that begin upstream and that this section wi l l be
remediated last (to the extent practicable) under any remedial alternative.
The numerical human health and ecological PRGs presented in Chapter 3 are used to
evaluate th is cri terion. The model forecast is compared to the PRGs to estimate the year in which
each PRO is attained. It is important to remember that forecasts are subject to considerable
uncertainty. Therefore, the estimated year of target attainment should be considered a general guide. *•o
The estimates serve best as a basis for comparison among alternatives where large differences (5 to ^
10 years or more) among alternatives in attaining a PRG can be identified. °°
8 - I I TAMS
8.1.6 Primary Balancing Criterion 4: Implementability
The ease or difficulty of implementing the alternatives are assessed by considering the
following factors:
• Technical Feasibility
Degree of difficulty associated with constructing and operating the technology;
Expected operational reliability of the technologies;
Ease of undertaking additional remedial actions, if necessary; and
Ability to monitor the effectiveness of the alternative.
• Administrative Feasibility
Need to coordinate with and obtain necessary approvals and permits (e.g., obtaining
permits for off-site activities, rights-of-way for construction, etc.) from other
agencies and offices.
• Availabil i ty of Services and Materials
Availability of necessary equipment and specialists;
Availabil i ty of adequate capacity and location of needed treatment, storage, and
disposal services;
Avai l ab i l i ty of prospective technologies; and
Ava i l ab i l i ty of services and materials , plus the potential for obtaining competitive
bids.
g.12 400679 TAMS
8.1.7 Primary Balancing Criterion 5: Cost
Costs for CERCLA evaluation are divided into two principal categories, i.e., capital costs and
annual operation and maintenance (O&M) costs. A number of principal elements of a remedial
alternative may fall into the category of direct and indirect capital costs:
• Construction costs;
• Equipment costs;
• Site development costs;
• Building and services costs;
• Transport and disposal costs;
• Engineering expenses;
• Startup and shakedown costs; and
• Contingency allowances.
Those items not placed into the capital cost category are considered to be O&M costs, among
which are the following:
• Operating labor costs;
• Materials and energy costs;
• Purchased services;
• Administrative and insurance costs; and
• Costs of periodic site reviews.
Where expenditures wi l l occur over differing time frames, the RI/FS Guidance (USEPA,
1988) specifies that a present worth analysis be conducted to enable comparison of different remedial
alternatives on the basis of a single cost figure. A discount rate of seven percent before taxes and
after inflation is used for the present worth analysis.rf>oo
Consistent with the RI/FS Guidance, cost estimates performed during the feasibility study <r\CO
stage are expected to provide an accuracy of -30 percent to +50 percent; further, after the present °
worth of each alternative is calculated, individual costs may be evaluated through a sensitivity
8-13 TAMS

analysis if there is sufficient uncertainty concerning specific assumptions (see Section 9.2).
Sensitivity analysis is to be considered for those factors that can substantially change overall costs
of an alternative with only small changes in their values, especially if such factors have a high degree
of uncertainty associated with them. Several factors are identified as potential candidates for
consideration in a sensitivity analysis, including delineation of target area boundaries and volume
of contaminated material. These are discussed further in Section 9.2.
The capital and O&M cost estimates incorporated in this FS were generated using the
USAGE MCACES cost estimating system. MCACES is a computer-based estimating system that
uses a series of databases to build an estimate. The basic databases incorporated into the MCACES
system are the Labor Rates Database and the Equipment Rates Database. Inputs from these two
databases are employed to generate work crew requirements (laborers and associated equipment) and
then unit prices (uni t costs for accomplishing a specific task by a specific crew). An example of the
procedure followed by the MCACES system that has relevance to this FS is as follows:
• Establish crew size/configuration and then the hourly cost for a dredge crew (S/hour);
• Establish dredge equipment operating costs ($/hour);
• Determine productivity applicable to work in the Hudson River (cubic yards/hour);
• Estimate the uni t cost of dredging from labor and crew databases (S/cubic yard); and
• Estimate total dredging costs ($/alternative).
The estimates provided were based on the Washington County, New York prevailing wage
rates. Major i tems such as transportation and disposal costs (S/ton) were obtained through
communication wi th transportation companies and waste management enti t ies . Costs of major
equipment items were based on quotes or derived from historical data. Costs for certain specific
items (e.g., roads, rail spurs, buildings, clearing) were bui l t up from the MCACES u n i t price
database (BSD Costlink, 1998).
Work considered to be performed by subcontractors is loaded with either 10 or 15 percent
overhead (depending on size of contract) and 10 percent profit. The prime contractor's home office
overhead is included at 15 percent, profit at 8 percent, and bond at 0.60 percent. Railroad costs and
landfi l l fees have prime contractor loadings of 2 percent for overhead, and 3 percent profit.
8-14 400681 TAMS
A 10 percent contingency on labor, a 5 percent contingency on materials, and a 10 percent
design contingency have been added to the estimate to account for the level of detail available at the
feasibility stage. Historic costs have been escalated at the highest price level adjustment, and an 8.25percent state sales tax has been added to material purchases.
Further information on and detailed results from the MC ACES cost estimating effort can be
found in Appendix I. Output from the estimating effort is summarized in this chapter for eachremedial alternative that is subject to detailed evaluation.
8.1.7.1 Present Worth Analysis
In order to compare costs for alternatives that have different implementation time frames, a
present worth analysis was conducted for each remedial alternative. The present worth costs were
calculated assuming an inflation rate of three percent and an annual interest rate of ten percent, for
an effective discount rate of seven percent. For all alternatives that involve active remediation, the
timeline used to calculate the present worth is as follows: design support testing was assumed to beconducted in 2002, remedial design was assumed to be conducted in 2003, and remediation was
assumed to be conducted from 2004 through 2008 (except for The REM-0/0/3 alternative, which is
assumed to have a construction period of seven years, i.e., 2004 through 2010). The No Action and
MNA alternatives were costed for a period of 30 years, with the 30-year period starting in 2004. Post
remediation monitoring and O&M are assumed to extend 25 years after remediation is complete for
the capping with select removal alternative, and for ten years after remediation is complete for the
removal alternatives.
None of the cost estimates presented in the detailed analysis includes the costs of the
Engineering Evaluation/Cost Analysis (EE/CA) or expected NTCRA for source control in the
vicinity of the GE Hudson Falls plant, which will be conducted as a separate removal action.
^8.1.8 Modifying Criterion 1: State Acceptance g
<TiThis criterion provides the state - in this case, the State of New York - with the opportunity ooto
to assess any technical or administrative issues and concerns regarding each of the alternatives. State
acceptance is not addressed in this FS, but will be addressed in the ROD.
8-15 TAMS
8.1.9 Modifying Criterion 2: Community Acceptance
Issues and concerns the public may have regarding each of the alternatives falls into this
category of evaluation. Community acceptance is not addressed in this FS document, but will be
addressed in the ROD.
8.2 Alternative: No Action
8.2.1 Description
The No Action alternative consists of refraining from the active application of any
remediation technology to sediments in all three sections of the Upper Hudson River. The No
Action alternative also excludes any source control removal action (i.e., the NTCRA) in the vicinity
of the GE Hudson Falls plant, any administrative actions (including institutional controls, such as
fish consumption advisories, which are considered to be limited action under the NCP), and any
monitoring. As required by Section 121© of CERCLA, reviews will be conducted at five-year
intervals to reassess the long-term appropriateness of continued No Action.
For this alternative, the upstream Tri+ PCB load at Fort Edward (Rogers Island) is assumed
to remain constant at 0.16 kg/day indefinitely. The Tri+ PCB loads over the TI Dam, the
Northumberland Dam, and the Federal Dam predicted by the model for the No Action alternative
are presented in Tables 8-1, 8-2, and 8-3, respectively.
A summary of the details of the cost estimate for the No Action alternative is given in Table
8-4. The estimated net present worth cost of this alternative, calculated at a 7 percent discount rate,
is approximately $140,000. There is no capital cost associated with this alternative. The estimated
annual average O&M cost is about $ 15,400 and represents the periodic cost of the five-year reviews
over a 30-year period. The estimated present worth of the O&M cost for No Action is about
$140,000.
4006838-16 TAMS
8.2.2 Analysis
8.2.2.1 Overall Protection of Human Health and the Environment
Under No Action, the release of PCBs from contaminated sediments into the surface waterand subsequently to the air, as well as the transport of PCBs from the Upper Hudson River over theFederal Dam to the Lower Hudson River, will continue indefinitely and thereby degrade the
environment.
No Action is not effective in meeting the RAOs and PRGs over the 70-year model forecast
period. The dominant carcinogenic and non-carcinogenic risks to human health and ecological
receptors (piscivorous birds and mammals) posed by the PCB-contaminated sediments will continue
for several decades. Analyses presented in Appendix D suggest that there is a reasonable probability
that the decline in exposure concentrations and associated risks may be much slower than predicted
by the model. This is particularly true at the localized (rather than reach-averaged) scales at which
fish feed, and the bounding analysis described in Appendix D suggests that risks may potentially
continue at even higher levels for substantially longer periods. The No Action alternative does not
include institutional controls such as fish consumption advisories to protect humans from exposure
to PCBs through consumption of contaminated fish.
Overall Protection of Human Health
The risk-based PRO for protection of human health of 0.05 ppm PCBs (wet weight) in fish
fillet is not met in any of the three river sections over the 70-year model forecast period. The target
concentration of 0.2 ppm PCBs (one meal per month) in fish fillets is also not met in any of the three
river sections. The target concentration of 0.4 ppm PCBs (one meal every two months) in fish fillets
is not met in River Sections 1 and 2, but is met in River Section 3 in the year 2014, according to
model estimates. »t*ooa\
For the No Action alternative, cancer risks and non-cancer health hazards are calculated for jj°
two time frames using start dates of 2009 and 2011 to cover the implementation time frames for all
alternatives. The RME and CT non-cancer hazard indices are discussed in detail in subsection
8-17 TAMS
7.3.1.2 and are presented in Tables 7-6a through 7-6d for the Upper Hudson River and separately
for River Sections 1,2, and 3, respectively. RME and CT non-cancer hazard indices by river section
are shown on Figures 7-1 and 7-2, respectively. The CT hazard indices are approximately an order
of magnitude lower than the RME hazard indices, and are all well above the target level of oneexcept for the CT hazard index in River Section 3. Similarly, the RME and CT incremental cancer
risks are discussed in detail in subsection 7.3.1.2 and are presented in Tables 7-7a through 7-7d forthe Upper Hudson River and separately for River Sections 1, 2, and 3, respectively. RME and CT
incremental cancer risks by river section are also shown on Figures 7-3 and 1A, respectively. The
RME incremental cancer risks all exceed the target risk range of 10"4 to \Q* and the CT incremental
cancer risks lie within this range.
Overall Protection of the Environment - Ecological Receptors
The risk-based PRO for protection of the environment is a range from 0.3 to 0.03 mg/kg in
whole fish (this corresponds to a range from 0.13 to 0.013 mg/kg total PCBs in fish fillets), based
on the LOAEL and NOAEL fish concentrations consumed by the river otter. The corresponding
LOAEL and NOAEL target concentrations for the mink are 0.7 and 0.07 mg/kg PCBs in whole fish,
respectively. For the river otter, none of the PRGs is met in any of the three river sections over the
70-year model forecast period. For the mink, the LOAEL target concentration is not met in River
Section 1 over the 70-year model forecast period, but is met in River Section 2 in 21 years and is met
in River Section 3 prior to 2010.
For the No Action alternative, the ecological toxicity quotients for the river otter and the
mink are discussed in subsection 7.3.1.5 and presented in Table 7-9. For the river otter, the NOAEL
and LOAEL TQs by river section are shown in Figures 7-5 and 7-6, respectively. The river otter TQs
are two orders of magnitude above the NOAEL target level and one order of magnitude above the
LOAEL target level. For the mink, the NOAEL and LOAEL TQs by river section are shown in
Figures 7-7 and 7-8, respectively. All of the mink TQ comparisons exceed one, except for the
comparison with the LOAEL target level in River Section 3.
4006858-18 TAMS

Overall Protection of the Environment - Downstream Transport of PCBs
The Tri+ PCB load over the TI Dam predicted by the model for the No Action alternative is
approximately 104 kg in 2003, 88 kg in 201 1, and 60 kg in 2035. The Tri+ PCB load over the
Northumberland Dam is about 122 kg in 2003, 105 kg in 201 1, and 60 kg in 2035. The Tri+ PCBload over the Federal Dam is 131 kg in 2003, 104 kg in 201 1, and 62 kg in 2035. This alternative
does not address the scour of PCB-contaminated sediments associated with one-in-three-year to one-
in-five-year flow events from the Hoosic River in River Section 3. These events have caused
resuspension of PCB loading of 1 8 kg/day, equivalent to the peak loads at Rogers Island attributed
to releases at the Alien Mills structure (USEPA, 1999b). Without addressing PCB-contaminated
sediments downstream of the Hoosic River (RM 166), PCB loads over Federal Dam will likely be
higher than indicated by the modeling results.
8.2.2.2 Compliance with ARARs
The chemical-specific ARARs for PCBs in the water-column are 0.5 ug/L (500 ng/L) federal
MCL; 0.09 ug/L (90 ng/L) NYS standard for protection of human health and drinking water sources;
1 ng/L federal Ambient Water Quality Criterion; 0. 1 2 ng/L NYS standard for protection of wildlife;
and 0.001 ng/L NYS standard for protection of human consumers of fish. The first two chemical-
specific ARARs for the surface water are met by the No Action alternative, whereas the remaining
three chemical-specific ARARs for the surface water are not met for the entire 70-year forecast
period. The bounding analysis described in Appendix D suggests that degradation of surface water
quality may potentially continue at even higher levels for substantially longer periods. Since there
is no active remedial action associated with this alternative, action-specific ARARs do not apply.
No location-specific ARARs are applicable to this alternative.
The evaluation of the two threshold criteria shows that the No Action alternative is not
protective of human health and the environment. Therefore, the five primary balancing criteria are
not evaluated for this alternative. oo\00
8-19 TAMS
8.3 Alternative: Monitored Natural Attenuation (MNA)
8.3.1 Description
The principal components of the Monitored Natural Attenuation alternative include, asdescribed below:
• Source control by a separate removal action in the vicinity of the GE Hudson Falls plant;
• Natural attenuation of sediments;
• Institutional controls;
• A long-term sediment, surface water, and fish monitoring program;
• A series of mathematical models for the fate, transport, and bioaccumulation of PCBs; and
• Reviews at five-year intervals under Section 121© of CERCLA.
Unlike No Action, the MNA alternative assumes a separate non-time critical removal action
(NTCRA) for source control in the vicinity of the GE Hudson Falls plant. It is assumed that, as a
result of this source control NTCRA, the upstream Tri+ PCB load at Fort Edward (Rogers Island)
is reduced from 0.16 kg/day to 0.0256 kg/day on January 1, 2005. USEPA has authorized the
performance of an Engineering Evaluation/Cost Analysis (EE/CA) to evaluate potential NTCRAs
to address the discharge of PCBs into the river in the vicinity of GE's Hudson Falls plant. GE has
discussed with USEPA and NYSDEC a conceptual approach to contain the release of PCB oil from
the vicinity of the Hudson Falls facility. Assuming that the conceptual approach proposed by GE,
or a similarly effective system, is available to address the Hudson Falls source, USEPA believes that
a source control NTCRA can reasonably be completed by January 1, 2005, if not earlier.
Natural attenuation refers to the reduction of volume and toxicity of contaminants in the
sediments by naturally occurring biological, chemical, and physical processes. Attenuation processes
in sediments include biodegradation, biotransformation, bioturbation, diffusion, dilution, adsorption,
volatilization, chemical reaction or destruction, resuspension, and burial by cleaner material.
8-20 400687 TAMS
Institutional controls (e.g., site use restrictions) are implemented as long-term controlmeasures as part of this alternative. These restrictions include continuation or modification of theexisting fish consumption advisories, and catch and release restrictions.
Continued presence of large quantities of PCB-contaminated sediments in the Upper HudsonRiver may necessitate operational restrictions on future non-remedial sediment removal activitiessuch as navigational dredging, including controls on the types of dredging equipment, constraintson barge filling practices, and restrictions on handling and disposal of the contaminated dredge
spoils. However, such restrictions are incorporated into the existing permitting process and do not
require separate institutional controls under a remedy. Since direct contact with sediments has been
determined not to pose unacceptable risks to human health, no restrictions on sediment disturbance
for changes to waterfront access or structures are contemplated as part of this alternative.
Long-term monitoring (assumed to extend over a 30-year period for cost estimating purposes)
is conducted in sediments, in the water column, and in fish as part of the MNA alternative. The
purpose of the monitoring and modeling is to demonstrate that contaminant reduction is occurring,
and that the reduction is achieving regulatory requirements, such as the NYS standard for PCBs in
surface water (1 x 10"6 ug/L) for protection of the health of human consumers of fish.
The number and distribution of sediment, water, and fish samples that are collected as part
of this alternative are described in subsection 5.2.7.1 and in Appendix G, and are outlined on Figure
5-6. Monitoring includes measurements of water column contamination, dated sediment cores,
sediment PCB inventory, sediment physical properties (geophysics), and bioaccumulation by resident
fish. Reductions in PCB concentrations and the PCB inventory are documented by historical trends
or concentration distributions showing a reduction in the total mass of PCBs in sediments, water, or
biota, or by the presence of degradation products in sediments. The series of mathematical models
for the fate, transport, and bioaccumulation of PCBs (described in the RBMR, USEPA, 2000a) will
be refined and recalibrated on a regular basis as new data become available. This refinement
includes resegmentation of the existing model grid, especially for River Sections 2 and 3. The £o
monitoring data are also used as input parameters and recalibration points in the mathematical o\oomodels to evaluate progress of the natural attenuation processes against the original predictions. °°
8-21 TAMS

The sediment samples (dated cores) are analyzed for radionuclides, congener-specific PCBs,
and total organic carbon (TOC). Acoustic mapping of sediment properties, flow measurements, and
bathymetric surveys are also performed. Water column samples are analyzed for congener-specific
PCBs, total suspended solids (TSS), and fraction of organic carbon on the suspended solids.Samples of the resident fish species including largemouth bass, brown bullhead, and yellow perch
are analyzed for total PCBs (Aroclors), congener-specific PCBs, and lipid content. As required bySection 121 © of CERCLA, five-year reviews are conducted (assumed to extend for a 30-year period
for cost estimating purposes).
To complete the analysis of the monitoring data, the USEPA's Hudson River models
(HUDTOX and FISHRAND) will be updated and recalibrated as necessary to reflect the information
gathered in the monitoring program. The results of this analysis will be used in the evaluation of the
effectiveness of MNA.
8.3.2 Analysis
8.3.2.1 Overall Protection of Human Health and the Environment
The overall protection of human health and the environment achieved by the MNA
alternative is considerably more than that achieved by the No Action alternative because this
alternative assumes the separate source control NTCRA in the vicinity of the GE Hudson Falls plant
and also relies on the fish consumption advisories and catch and release restrictions to protect people
from exposure to PCBs through consumption of contaminated fish. There are some health risks to
site workers for the short and long term because direct exposure pathways do exist; these risks,
though assumed to be small, may increase over existing levels due to the expansion of the sampling
and monitoring program involved in this alternative.
This alternative relies on the naturally-occurring processes such as sediment deposition,
bioturbation, dispersion, advection, and biotransformation to sequester, destroy, or dilute the
sediment PCB inventories of the Upper Hudson, resulting in a decline in surface sediment and water
column PCB concentrations. As discussed in several of the Reassessment RI reports (USEPA,
1997a, 1998a, 1998b, and 1999b), these processes do not perform reliably. Biodegradation
8-22 400689 TAMS
processes, specifically anaerobic dechlorination, may decrease the level of chlorination of some of
the PCBs. Much of the PCB inventory of the sediments appears largely unaffected by this process,
with minimal mass loss (less than 10 percent on average) (USEPA, 1997a). The degree to which
chlorination affects PCB toxicity remains uncertain and debated within the scientific community.Yet, animal studies supported by GE and reviewed in the 1996 PCB cancer reassessment (USEPA,1996) found tumors in lab animals for all Aroclor mixtures tested (Aroclor 1016, 1242, 1254 and
1260), spanning a wide range of chlorination (USEPA, 1996c). Thus, it is not clear the degree to
which the transformation from more highly chlorinated PCBs to lesser chlorinated congeners would
alter the PCB toxicity, if at all.
Sediment deposition has failed to sequester the PCBs of the Upper Hudson, given the clear
evidence of ongoing PCB release from the sediments (see Section 3.5). Additionally, PCB inventory
comparisons over time have shown extensive PCB losses from the sediments, suggesting
bioturbation or sediment resuspension as major factors in replenishing and maintaining surface PCB
concentrations. The release of PCBs from contaminated sediments into the water column has
continued largely unchanged over the past 10 years, based on annual loads of total PCBs originating
from the River Section 1. Model forecasts suggest only a gradual decline in surface sediment and
water column concentrations and have large uncertainties associated with these estimates. Thus the
transport of PCBs from the sediments of the Upper Hudson River over the Federal Dam to the Lower
Hudson River will persist for many decades and thereby continue to degrade environments
throughout the Hudson.
A substantial limitation of the MNA alternative, particularly where burial by less
contaminated sediments is the primary attenuation process, is that burial occurs only in truly
depositional areas. Long-term deposition of sediment is not a general characteristic of the river bed
although portions of the river may be depositional. As discussed in Appendix D, rates of attenuation
of surface sediment PCB concentrations and associated fish body burdens may be much slower in
local regions than those predicted by the model at the reach-average scale. In addition, because
natural attenuation in this instance depends upon maintenance of the overlying less-contaminated o<^
sediment layer, anthropogenic processes or severe storms may erode and scour the sediments and jo
redistribute the PCBs over wide areas, even when burial is (temporarily) achieved. Natural
attenuation is most appropriate for those portions of the Upper Hudson River where, based on
8-23 JAMS

existing data, natural sedimentation and other processes have been observed, or are strongly
expected, to reduce surface sediment concentrations. These areas appear to be quite limited, based
on the sediment evidence, which shows the majority of the PCB inventory to lie within the top 9
inches of sediment (see Section 3.5, and USEPA, 1998b). Additionally, natural attenuation that
depends primarily on sediment burial is not appropriate in the navigation channel of the ChamplainCanal where dredging is required for maintenance.
MNA is not very effective in meeting the RAOs and PRGs over the 70-year model forecast
period. Risks to human health and ecological receptors (piscivorous birds and mammals) posed by
the PCB-contaminated sediments will continue for several decades. The bounding analysis
described in Appendix D suggests that risks may potentially continue at even higher levels for
substantially longer periods.
Protection of Human Health
The risk-based PRO for protection of human health of 0.05 ppm PCBs (wet weight) in fish
fillet is not met in River Sections 1 and 2 over the 70-year model forecast period, but is met in River
Section 3 in the year 2059. The target concentration of 0.2 ppm PCBs (one meal per month) in fish
fillets is also not met in River Section 1, but is met in River Section 2 in the year 2061 and is met
in River Section 3 in the year 2019. The target concentration of 0.4 ppm PCBs (one meal every two
months) in fish fillets is met in River Sections 1, 2, and 3 in the years 2039, 2038, and 2011,
respectively.
Cancer risks and non-cancer health hazards for the MNA alternative are calculated for two
time frames using start dates of 2009 and 2011 to cover the implementation time frames for all
alternatives. The RME and CT non-cancer health hazard indices are discussed in detail in subsection
7.3.2.2 and are presented in Tables 7-6a through 7-6d for the Upper Hudson River and separately
for River Sections 1,2, and 3, respectively. RME and CT non-cancer hazard indices by river section
are shown on Figures 7-1 and 7-2, respectively. The CT hazard indices are approximately an order
of magnitude lower than the RME hazard indices, and are all well above the target level of one
except for the CT hazard index in River Section 3. Similarly, the RME and CT incremental cancer
risks are discussed in detail in subsection 7.3.2.2 and are presented in Tables 7-7a through 7-7d for
8-24 400691 TAMS

the Upper Hudson River and separately for River Sections 1, 2, and 3, respectively. RME and CT
incremental cancer risks by river section are also shown on Figures 7-3 and 7-4, respectively. The
RME incremental cancer risks for the Upper Hudson River and River Sections 1 and 2 all exceed
the target risk range of 10"4 to 10"6, whereas the RME incremental cancer risk for River Section 3 lieswithin this range. All of the CT incremental cancer risks lie within this range.
Protection of the Environment - Ecological Receptors
The risk-based PRO for protection of the environment is a range from 0.3 to 0.03 mg/kg in
whole fish (this corresponds to a range from 0.13 to 0.013 mg/kg total PCBs in fish fillets), based
on the LOAEL and NOAEL fish concentrations consumed by the river otter. The corresponding
LOAEL and NOAEL target concentrations for the mink are 0.7 and 0.07 mg/kg PCBs in whole fish.
For the river otter, the PRGs are not met in River Sections 1 and 2 over the 70-year model forecast
period, but the LOAEL target concentration is met in River Section 3 in 14 years. For the mink, the
LOAEL target concentration is met in River Section 1 in 22 years, in River Section 2 in 10 years,
and in River Section 3 prior to 2010. For the mink, the NOAEL target concentration is not met in
River Sections 1 and 2, but is met in River Section 3 in 12 years.
The ecological TQs for the river otter and the mink are discussed in subsection 7.3.2.5 and
presented in Table 7-9. For the river otter, the NOAEL and LOAEL TQs by river section are shown
in Figures 7-5 and 7-6, respectively. The river otter TQs are two orders of magnitude above the
NOAEL target level and one order of magnitude above the LOAEL target level. For the mink, the
NOAEL and LOAEL TQs by river section are shown in Figures 7-7 and 7-8, respectively. All of
the mink TQ comparisons exceed one, except for the comparison with the LOAEL target level in
River Sections 2 and 3.
Since MNA is not an active remediation, there are no impacts specific to the short-term.
Monitoring under MNA is not expected to have an impact on ecological receptors.oocr>voto
8-25 JAMS

Protection of the Environment - Downstream Transport of PCBs
The Tri+ PCS load over the Tl Dam predicted by the model for the MNA alternative is about
104 kg in 2003,44 kg in 2011, and 14 kg in 2035. The Tri+ PCB load over the Northumberland
Dam is 123 kg in 2003,63 kg in 2011, and 15 kg in 2035. The Tri+ PCB load over the Federal Damis approximately 131 kg in 2003,72 kg in 2011, and 24 kg in 2035. This alternative does not addressthe scour of PCB-contaminated sediments associated withone-in-three-year to one-in-five-year flow
events from the Hoosic River in River Section 3. One such event was observed in 1993 (USEPA,
1997b), which caused a PCB loading of 18 kg/day by resuspension of Hudson River sediment. This
loading was equivalent to the peak loads at Rogers Island that same year, attributed to releases at the
Alien Mills structure (USEPA, 1999b). Without addressing PCB-contaminated sediments
downstream of the Hoosic River (RM 166), PCB loads over Federal Dam will likely be higher than
indicated by the modeling results.
8.3.2.2 Compliance with ARARs
The chemical-specific ARARs for PCBs in the water-column are 0.5 ug/L (500 ng/L) federal
MCL; 0.09 ug/L (90 ng/L) NYS standard for protection of human health and drinking water sources;
1 ng/L federal Ambient Water Quality Criterion; 0.12 ng/L NYS standard for protection of wildlife;
and 0.001 ng/L NYS standard for protection of human consumers of fish. The first two chemical-
specific ARARs for the surface water are met by the MNA alternative, whereas the remaining three
chemical-specific ARARs for the surface water are not met for the entire 70-year forecast period.
The bounding analysis described in Appendix D suggests that degraded surface water quality
conditions may potentially continue at even higher levels for substantially longer periods. Since
there is no active remedial action for the sediments associated with this alternative, action-specific
ARARs do not apply. No location-specific ARARs are applicable to this alternative.
4006938-26 JAMS

8.3.2.3 Long-Term Effectiveness and Permanence
Magnitude of Residual Risks
This alternative will result in continuation of the degraded condition of surficial sedimentsand surface water quality (albeit gradually reduced) of the Upper Hudson River, especially in RiverSection 1, for several decades, regardless of any reduction in the upstream water column loadings.
The long-term transport of PCBs over the Federal Dam and to the Lower Hudson River will continue
indefinitely. The Tri+ PCB load over the Federal Dam predicted by the model for the MNA
alternative is approximately 131 kg in 2003, 72 kg in 201 1, and 24 kg in 2035. As a result of the
separate source control NTCRA in the vicinity of the GE Hudson Falls plant, the Tri+ PCB load over
Federal Dam is reduced by approximately 62 percent in 2035 compared to the No Action alternative.
Risks to human health and ecological receptors (piscivorous birds and mammals) posed by the PCB-
contaminated sediments would continue unabated for several decades. This alternative does not
address the scour of PCB -contaminated sediments associated with one-in-three-year to one-in-fi ve-
year flow events from the Hoosic River in River Section 3.
Adequacy of Controls
This alternative does not provide for engineering controls on the river sediments. The MNA
alternative assumes source control in the vicinity of the GE Hudson Falls plant. As discussed in
Revised HHRA (USEPA, 2000p), the existing fish consumption advisories and fishing bans are not
completely effective. Therefore, the existing institutional controls, which rely on voluntary
compliance, are not fully adequate in reducing exposure to PCBs due to consumption of
contaminated fish. In addition, institutional controls are ineffective for protection of the environment
(e.g., ecological receptors).
Reliability of Controls
Only institutional controls such as the existing fish consumption advisory and catch and
release restrictions would continue to provide some measure of protection for human health from
the consumption of PCB contaminated fish. Although the MNA alternative is more protective of
8-27 TAMS
oo

human health than the No Action alternative, it is not very reliable, as the institutional controls
associated with this alternative do not address ecological receptors, and human risk reduction relies
on knowledge of and voluntary compliance with the fish consumption advisories. The planned
annual monitoring program provides a basis to adjust the advisories in response to changing PCB
levels in fish and to add new advisories for the protection of the public if the expected declines do
not occur. However, the monitoring program has no effect on reducing the ecological risks to fish,piscivorous birds, and mammals.
8.3.2.4 Reduction of Toxicity, Mobility, or Volume through Treatment
This alternative does not involve any containment or removal of contaminants from the
Upper Hudson River sediments and does not include any treatment. The separate source control
NTCRA in the vicinity of the GE Hudson Falls plant which is assumed for the MNA alternative is
expected to reduce the upstream water column Tri+ PCB load to the site (i.e., at Rogers Island) from
0.16 kg/day to 0.0256 kg/day by January 1, 2005. Sediment contributions of Tri+ PCBs in 2005 are
expected to be about 0.1 kg/day, or about four times greater than the reduced input from Hudson
Falls. The MNA alternative relies on naturally-occurring processes such as sediment deposition,
dispersion, advection, and biotransformation processes to sequester, destroy, or dilute the PCB
inventories of the Upper Hudson River, resulting in a decline in surface sediment and water column
PCB concentrations. Biodegradation processes may convert some of the more highly chlorinated
PCB congeners (e.g., tetrachlorobiphenyls) to less chlorinated congeners (monochloro- and dichloro-
biphenyls) and biphenyl, although dechlorination is not expected to continue to extensively modify
the PCB inventory over time since it appears to occur only within the first few years of deposition
(USEPA, 1997a). The degree to which chlorination affects PCB toxici ty remains uncertain and
debated within the scientific community. Yet, animal studies supported by GE and reviewed in the
1996 PCB cancer reassessment (USEPA, 1996c) found tumors in lab animals for all Aroclor
mixtures tested (Aroclor 1016, 1242, 1254 and 1260), spanning a wide range of chlorination
(USEPA, 1996c). Thus, it is not clear the degree to which the transformation from more highly
chlorinated PCBs to lesser chlorinated congeners would alter the PCB toxicity, if at all.
Natural dilution of the contaminated sediments will also reduce the toxicity, but the overall
volume of contaminated sediments will increase as PCBs are contributed to the Upper Hudson from
8-28 400695 TAMS
upstream. Concentrations of PCBs in fish, and thus the toxicity and volume, will respond slowly
over time to decreases in the concentrations in sediments and surface water. Reductions sufficientj to meet PRGs will require several decades.i
| 8.3.2.5 Short-Term Effectiveness
\ Short-term effectiveness is assessed through review of the four components previouslydescribed (subsection 8.1.5), which are protection of the community during remedial actions,
j protection of workers during remedial actions, potential adverse environmental impacts resulting
from construction and implementation, and time until remedial response objectives are achieved.
Protection of the Community During Remedial Actions
No construction activities are associated with the remediation of sediments for the MNA
alternative, so it does not increase the potential for direct contact and ingestion and inhalation of
^ PCBs from the surface water and the sediments. The risks to human health and to ecological
receptors due to the PCB-contaminated sediments will persist throughout the short term. Due to the
separate source control NTCRA in the vicinity of the GE Hudson Falls plant, the upstream water
column Tri+ PCB load to the site (i.e., at Rogers Island) expected to be reduced from 0.16 kg/day
to 0.0256 kg/day by January 1, 2005. As a result, risks to human health and to ecological receptors
for the MNA alternative are slightly lower than those under the No Action alternative in the short
term. For the MNA alternative, the institutional controls (fish consumption advisories and catch-
and-release restrictions) will continue to be the only means for protecting human health. There are
• no such controls in the No Action alternative. The monitoring program associated with this
alternative is unlikely to pose any risk to the community.
Protection of Workers During Remedial Actions
The persons performing the sampling activities will follow OSHA health and safety £o
^_ procedures and wear the necessary personal protective equipment. A slight increase in occupational cr»10
risk may be associated with the MNA alternative due to the greater degree of sampling involved in °^
the river. There are potential short-term risks to site workers from contact with or accidental
8-29 TAMS

ingestion of PCB-contaminated surface water and sediments; however, these risks are small.
Limited risks also may arise from physical hazards associated with the work (e.g., boating accidents).
Potential Adverse Environmental Impacts Resulting from Construction and Implementation
No construction activities associated with the river sediments are conducted for the MNAalternative. The monitoring program for the MNA alternative is not anticipated to have any adverse
effect on the environment, beyond that already caused by the PCB contamination of the sediments
in the Upper Hudson River.
Time until Remedial Response Objectives Are Achieved
Before discussing the time to achieve various PRGs, it is important to note that forecasts are
subject to considerable uncertainty. Therefore, the estimated year of target attainment should be
considered a general guide. In particular, the time estimates given below are based on the model
forecast and do not represent the upper-bound estimate for MNA, which yields substantially longer
periods to achieve PRGs. The risk-based PRO for protection of human health of 0.05 ppm PCBs
(wet weight) in fish fillets is not met in River Sections 1, 2, and 3 in the short term. The target
concentration of 0.2 ppm PCBs (one meal per month) in fish fillets is also not met in River Sections
1, 2, and 3 in the short term. The alternate target concentration of 0.4 ppm PCBs (one meal every
two months) in fish fillets is not met in River Sections 1 and 2 in the short term, but is met in River
Section 3 in the year 2011 for the MNA alternative.
The risk-based PRO for protection of the environment is a range from 0.13 to 0.013 mg/kg
total PCBs in fish fillets (this corresponds to a range from 0.3 to 0.03 mg/kg in whole fish), and is
based on the LOAEL and NOAEL fish concentrations consumed by the river otter. The
corresponding LOAEL and NOAEL whole fish target concentrations for the mink are 0.7 and 0.07
mg/kg PCBs. For the river otter, the PRGs are not met in River Sections 1, 2, and 3 in the short
term. For the mink, the LOAEL target concentration is not met in River Sections 1 and 2 in the short
term, but is met in River Section 3 prior to 2010. For the mink, the NOAEL target concentration is
not met in River Sections 1, 2, and 3 in the short term.
8-30 400697 TAMS

The release of PCBs from the contaminated sediments into the surface water, andsubsequently to the air, as well as the transport of PCBs from the Upper Hudson River over the
Federal Dam, will continue indefinitely.
83.2.6 Implementability
Technical Feasibility
This alternative only requires using computer modeling and standard sampling and analytical
methods to implement; therefore, it is technically feasible and readily implementable.
Administrative Feasibility
In general, the principal administrative task under the MNA alternative is the continuation
of institutional controls, such as the fish consumption advisories and the performance of the five-year
reviews. Those tasks are currently being performed and are relatively straightforward to implement.
Availability of Services and Materials
All the services and materials needed to implement this alternative are readily available.
8.3.2.7 Cost
A summary of the details of the cost estimate for Alternative MNA is given in Table 8-5.
The estimated net present worth cost of this alternative, calculated at a 7 percent discount rate, is
approximately $39 million.
Capital Cost
The capital cost associated with this alternative is about $508,000; this cost is entirely for
refi
$417,000.
oo£)oo
model refinement and calibration. The present worth of the capital cost for the MNA alternative is
8-3 1 TAMS

O&M Costs
Due to the varying frequency of different elements of the monitoring program, and the five-
year period for reviews, O&M costs will vary on an annual basis. The annual average O&M costs
for this alternative are estimated to be about 3.6 million dollars and represents the monitoring costs,
the periodic cost of the modeling, and the five-year reviews. This cost has been estimated for a 30-
year period. The estimated present worth of the O&M cost for this alternative is about $38.2 million.
8.4 Alternative CAP-3/10/Select: Capping with Dredging of Expanded Hot Spots in RiverSection 1; Capping with Dredging of Hot Spots in River Section 2; and Dredging ofSelect Areas in River Section 3
8.4.1 Description
The principal components of this alternative include, as described below:
• Source control via separate removal action in the vicinity of the GE Hudson Falls plant;
• An implementation schedule and sequence of operations for the remediation;
• Engineered capping of sediments in selected target areas following dredging as necessary;
• Dredging of sediments in remaining target areas;
• In-river transport of capping materials, backfill materials, and dredged sediments;
• Processing of sediments at the northern and southern material management and transfer
facilities;
• Treatment of the water entrained in removed (dredged) sediments to NYSPDES discharge
criteria;
• Backfilling and habitat replacement,
• Transportation of dewatered and stabilized materials to off-site dredged material
management locations; and
• A performance monitoring program.
This alternative includes capping with dredging to perform Expanded Hot Spot remediation
(i.e., in which the nominal MPA targets are 3 g/m2 or greater) in River Section 1, Hot Spot
remediation (i.e., in which the nominal MPA targets concentrations are 10 g/m2 or greater) in River
8-32 400699 TAMS
i Section 2, and remediation of select areas (i.e., sediments with high-concentration PCB target areas)
in River Section 3. This alternative also includes sediment removal in the navigation channel as
I necessary to implement the alternative (i.e., to accommodate dredges and barges). The areas to be
remediated for this alternative are shown on Plate 16. The total area of sediments to be capped is
i approximately 207 acres. The estimated volume of sediments to be removed is 1.73 million cubici
yards. This alternative also relies on naturally occurring attenuation processes to reduce the toxicity,mobility, and volume of the remaining PCBs in the Upper Hudson River sediments after the
construction is completed. Institutional controls (e.g., site use restrictions) are implemented as long-ij term control measures as part of this alternative. These restrictions include continuation or\
modification of the existing fish consumption advisories and catch and release restrictions. A review
of site conditions will be conducted at five-year intervals, as required by Section 12 1© of CERCLA.
In this alternative, in River Section about 1 , 1 60 acres of PCB-contaminated sediments are
capped and 849,000 cubic yards of sediments containing 7,100 kg of PCBs are removed. An
additional 66,100 cubic yards of sediments containing 200 kg of PCBs are removed from the
navigation channel in River Section 1 . In River Section 2, 52 acres of PCB-contaminated sediments
are capped and 292,000 cubic yards of sediments containing 15,600 kg of PCBs are removed. An
additional 15,400 cubic yards of sediments containing 700 kg of PCBs are removed from the
navigation channel in River Section 2. In River Section 3, there is no capping and 392,900 cubic
yards of sediments containing 6,700 kg of PCBs are removed. No capping is performed in River
Section 3 for this alternative because the portions of the remediation target areas meeting the criteria
for capping in this section are relatively small and isolated from one another. An additional 1 17,000
cubic yards of sediments containing 2,800 kg of PCBs are remo\ed from the navigation channel in
River Section 3. Estimates of the areas, volumes, and mass of PCBs remediated, and the areas
capped, volumes removed, and the mass of PCBs removed from the sediment target areas and the
navigation channel for each river section, are presented in Table 8-6.
8.4.1.1 Source Control in the Vicinity of the GE Hudson Falls Plant
•-— The CAP-3/ 10/Select alternative assumes a separate non-time critical removal actionoo
o(NTCRA) for source control in the vicinity of the GE Hudson Falls plant. It is assumed that, as a
result of this source control NTCRA, the upstream Tri+ PCB load at Fort Edward (Rogers Island)
8-33 JAMS

entering the Hudson River PCBs site is reduced from 0.16 kg/day to 0.0256 kg/day on January 1,
2005. USEPA has authorized the performance of an Engineering Evaluation/Cost Analysis (EE/CA)
to evaluate potential NTCRAs to address the discharge of PCBs into the river in the vicinity of the
GE Hudson Falls plant. GE has discussed with USEPA and NYSDEC a conceptual approach to
contain the release of PCB oil from the vicinity of the Hudson Falls facility. Assuming that the
conceptual approach proposed by GE, or a similarly effective system, is available to address the
Hudson Falls source, USEPA believes that a source control NTCRA can reasonably be completedby January 1, 2005, if not earlier.
8.4.1.2 Implementation Schedule and Sequence of Operations
Remediation will commence in 2004 and will be completed in 2008. To the extent
practicable, sediments near Rogers Island will be remediated first, and the work will progress
downstream towards the Federal Dam at Troy in River Section 3. Dredging of River Section 3 may
occur simultaneously with removal operations elsewhere as a result of the need to gain access to the
site or because doing so will improve overall efficiency. For this alternative, dredging of
contaminated sediments will be initiated before capping begins, and removal operations will
continue for approximately five years. It is expected that dredging work will precede capping in each
work area. Capping material (12 inches of hydrated AquaBlok™) and backfill (6 inches of fill
consisting of sand, silt, and gravel) will be placed in the targeted areas as described in subsection
5.2.6, and other site reconstruction activities will be conducted as described below.
8.4.1.3 Engineered Capping, Select Removal, and In-river Transport Operations
As described in subsection 5.2.4, the AquaBlok™ material w i l l be manufactured locally and
transported by truck to a bulkhead located along the Champlain Canal. The material will be placed
in a large hopper barge (capacity of 2,000 tons) and towed to the area of cap placement. Using a
conveyor, the material will be transferred to a shallow draft barge equipped with a mounted
telescoping conveyor. The barge-mounted telescoping conveyor will be used to spread the
AquaBlok™ material over the area to be capped. The cap material will be placed in the target areas
at an estimated rate of approximately one acre per day per lift per crew. Two lifts will be required
to place 'he cap, as described earlier in subsection 5.2.4. Capping operations will not be conducted
8-34 400701 JAMS

continuously because the area to be capped must be completely dredged first, and the cap can be
installed at a rate faster than the rate at which the dredge can remove contaminated sediments. For
this alternative, the quantities of AquaBlok™ material that will be placed are presented in Table 8-7.
In order to accomplish the sediment removal planned for this alternative within the five-yearconstruction period, a number of dredges and other marine equipment will be needed for the in-river
operations. The number and type of dredges needed to accomplish the work depend on the volume
of material to be removed, the time frame for the work, the productivity of the equipment, and the
limitations on the in-river and out-of-river transportation systems. Based on the target areas for this
alternative, Table 8-7 provides a list of the number and types of dredges that will be operated, the
number of barge loads of sediment that will be received at the northern and southern transfer
facilities, and quantity estimates for other engineering productivity parameters.
8.4.1.4 On-Site Material Management and Transfer Facilities
At the northern and southern dredged material management and transfer facilities, the
sediments will be dewatered and stabilized by blending with eight percent Portland cement as
described in subsection 5.2.2 and Appendix E. This blending serves to improve both the material
handling and disposal properties of the dredged material. The rates at which this material is
processed in the northern and southern facilities are presented in Table 8-7. This stabilized material
will then be loaded into rail cars or barges as described in subsections 5.2.2 and 5.2.5 for transfer to
disposal or beneficial use facilities. The estimated number of rail cars loaded at each material
management and transfer facility for this alternative is also presented in Table 8-7.
8.4.1.5 Water Treatment Subsequent to Removal
The water associated with the dredged material will be treated at the northern and southern
water treatment plants to NYSPDES discharge criteria as described previously in subsection 5.2.2.oojoto
8-35 JAMS

8.4.1.6 Backfilling and Site Reconstruction
As described in subsection 5.2.6, site reconstruction measures will be undertaken to mitigate
disturbances to the hydraulics of the river channel, the shoreline, and the aquatic habitat caused by
removal and capping operations. Areas that are dredged but not capped will be backfilled with one
foot of imported clean fill. This backfill will consist of gravel, silt and sand in order to re-establisha range of habitat types for a variety of aquatic biota, especially the resident fish. The navigation
channel will not be backfilled. Areas capped with AquaBlok™ will be backfilled with six inches
of a sand, silt and gravel mixture.
Disturbed portions of the shoreline will have to be either stabilized or reconstructed. The
stabilization measures envisioned in this FS report consist of hydro-seeding the shoreline where
disturbance is expected to be minimal, and then expanding the scale of the effort where the
disturbances increase. Thus, in near-shore areas where between two and three feet of sediment will
be removed, the stabilization concept consists of placement of an approximately 20-foot-wide
vegetative mattress. Where shoreline disturbance will equal or exceed three feet of sediment
removal, the stabilization concept includes either a log or wood crib revetment in addition to the
vegetative mattress. Table 8-7 shows the extent of shoreline disturbance and stabilization anticipated
for this alternative. Where shoreline wetlands (critical areas) will be removed by the dredging work,
it is expected that the original bottom elevation will be re-established and that the new upper layer
of substrate would be a silty material. The quantities of gravel, sand, and silt required for backfill
and reconstruction of areas of the river bottom are also presented on Table 8-7.
Beyond physical replacement of the river bottom substrate, it is also anticipated that a
spectrum of in-river plantings wil l be undertaken to further reduce the time for the river to return to
a productive ecological condition. The plantings will consist of various types of wetland and aquatic
species. The species being considered for this component of the program are detailed in Appendix
F. The general type and quantity of planting envisioned for the CAP 3/10/Select alternative are
shown on Table 8-7.
4007038-36 TAMS

8.4.1.7 Off-Site Transport and Dredged Material Management
Of the total estimated volume of about 1.73 million cubic yards of sediments removed from
the Upper Hudson River under the CAP-3/ 10/Select alternative, about 722,000 cubic yards (withPCB concentrations greater than 33 mg/kg) will be managed as TSCA-regulated material, and just
over 1.0 million cubic yards (containing less than 33 mg/kg PCBs) will be handled as non-TSCAmaterial. The TSCA material will be sent to a TSCA-permitted landfill and the non-TSCA material
will be sent to a non-TSCA landfill as described in subsection 5.2.5. If facilities and adequate
capacity for beneficial use are available based on market conditions at the time when this alternative
is implemented, some or all of the non-TSCA material will be utilized for such purposes as described
in subsection 5.2.5.3. This includes both low-value beneficial uses as material for construction fill,
landfill cover, or abandoned mine reclamation, and higher-value beneficial uses as manufactured
commercial products.
8.4.1.8 Performance Monitoring Program
The performance monitoring program consists of two components: monitoring during
construction of the alternative and post-construction monitoring.
Construction Monitoring
During construction of this alternative, the monitoring program described in subsection
5.2.7.3 will be implemented. The purpose of this monitoring is to confirm that removal, capping,
and backfilling of areas targeted for remediation has been performed as designed. The construction
monitoring program will begin the year after design support testing is completed and will last for six
years. This program includes collection of samples from the sediment, water column, and biota.
oo
8-37 TAMS
Post-Construction Monitoring
The post-construction performance of this alternative will be monitored through the
implementation of the sampling program described in subsection 5.2.7.4 and in Appendix G, and
as outlined in Figure 5-6. Long-term monitoring for a 25-year period after remediation is completed
in 2008 and will be conducted in sediments, in the water column, and in biota as part of thisalternative. Monitoring will include measurements of water column contamination, dated sediment
cores, sediment PCB inventory, sediment physical properties (geophysics), and bioaccumulation by
resident fish. Loss of contaminants can be documented by historical trends or contaminant
concentration distributions showing a reduction in the total mass of contaminants in sediments,
water, or biota, or by the presence of degradation products in sediments. The monitoring data will
also be used as input parameters in the mathematical models to evaluate progress of the natural
attenuation processes against the original predictions.
The number and distribution of sediment, water, and fish samples that will be collected are
presented in the alternative-specific tables in Appendix G. The sediment samples (cores and surface
grab samples) will be analyzed for total PCBs (Aroclors) and total organic carbon. Bathymetric
surveys will also be performed. Water column samples will be analyzed for congener-specific PCBs,
TSS, and fraction of organic carbon on TSS. Samples of the resident fish species including
largemouth bass, brown bullhead, and yellow perch will be analyzed for total PCBs, congener-
specific PCBs, and lipid content. A review of site conditions will be conducted at five-year intervals
assumed to extend for a 25-year period beyond completion of construction for cost estimating
purposes (i.e., 30 years after initiation of the alternative).
8.4.2 Analysis
8.4.2.1 Overall Protection of Human Health and the Environment
The overall protection of human health and the environment achieved by the CAP-
3/10/Select alternative is considerably more than that achieved by the No Action and MNA
alternatives because this alternative is a permanent alternative that involves both containment and
removal of contaminated sediments in River Sections 1 and 2, and removal of contaminated
8-38 400705 TAMS
sediments in River Section 3. It also provides for some limited on-site treatment of the PCBs in the
sediments by the stabilization process (addition of eight percent Portland cement) discussed above.
In addition, the CAP-3/ 10/Select alternative assumes the separate source control NTCRA in the
vicinity of the GE Hudson Falls plant, and also relies on the fish consumption advisories and catch
and release restrictions to protect human health.
The existing fish consumption advisories and restricted access to portions of the river
undergoing remediation reduce risks to the local community. The CAP-3/10/Select alternative also
relies on such natural attenuation processes as burial by cleaner sediments, bioturbation,
biodegradation, dispersion, dilution through advection and recharge, adsorption, and volatilization
to further reduce the concentration of PCB-contaminant sediments remaining in the river after
construction to address is completed.
There are five options for dealing with the sediments after removal from the river: landfill
disposal (for hydraulic dredging); stabilization and landfill disposal (for mechanical dredging);
beneficial use as landfill cover or construction fill material (for hydraulic dredging); stabilization and
beneficial use as landfill cover or construction fill material (for mechanical dredging); and thermal
treatment and beneficial use as manufactured commercial products like cement, light weight
aggregate, fiberglass, or architectural tiles (for both mechanical and hydraulic dredging). For the
landfill disposal option, the PCB-contaminated sediments would be permanently removed and
contained at a permitted and regulated facility. For the beneficial use option, the removed and
stabilized sediments will be further treated at the off-site facility, and the PCBs will be permanently
sequestered (for the construction fill/landfill cover option) or destroyed (for the manufacture of
commercial products option).
For the CAP-3/10/Select alternative, risks to human health and ecological receptors
(piscivorous birds and mammals) will be reduced through capping of an estimated 207 acres of
PCB-contaminated sediments and dredging of approximately 33,100 kg of PCBs contained in anrf*
estimated 1.73 million cubic yards of sediments. Capping reduces the mobility of contaminants in oothe river but does not affect their toxicity or volume. Dredging the sediments reduces the toxicity, Q
o\mobility, and volume of the contaminants in the river. After construction is completed, natural
8-39 TAMS

attenuation processes may further reduce the toxicity and volume of contaminants in sediments (e.g.,
through biodegradation) or reduce their mobility (e.g., though burial by cleaner sediments).
Capping is a proven technology for isolating contaminated sediments from the water columnand biota. AquaBlok™ is a manufactured product consisting of a composite of gravel particlesencapsulated with bentonite. Although AquaBlok™ is a relatively new product and has not beenused at many sites over relatively long periods of time, the effectiveness of the cap depends on
bentonite, which has been proven as an impermeable liner material in preventing the migration of
contaminants. However, proper design, placement, and maintenance of the cap are required for cap
effectiveness, continued performance, and reliability. Because PCBs remain in the sediment, the
CAP-3/10/Select alternative may be inherently less protective of human health and the environment
in the long term than a comparable dredging alternative. Even though the capping concept is
designed to avoid failure, cap damage caused by, for example, large trees that fall into the river
during natural events like major floods cannot be avoided.
Overall Protection of Human Health
For the CAP-3/10/Select alternative, the risk-based PRO for protection of human health of
0.05 ppm PCBs (wet weight) in fish fillet is not met in River Sections 1 and 2 over the 70-year
model forecast period, but is met in River Section 3 in the year 2051. The target concentration of
0.2 ppm PCBs (one meal per month) in fish fillets is also not met in River Section 1, but is met in
River Section 2 in the year 2044 and is met in River Section 3 in the year 2014. The target
concentration of 0.4 ppm PCBs (one meal every two months) in fish fillets is met in River Sections
1, 2, and 3 in the years 2026, 2028, and 2010, respectively.
The failure to achieve PCB levels below 0.2 ppm in fish tissue in River Section 1 and the
near- asymptotic approach to this value in River Section 2 reflect the importance of the assumption
of the upstream loading late in the forecast period. Even in River Section 3, an asymptotic value of
approximately 0.05 ppm is clearly evident. Significant reductions in fish tissue concentrations are
accomplished as a result of the sediment remediation and the source control NTCRA .However, each
river section approaches a condition under which the assumed load at Fort Edward produces a
steady-state condition between the contamination within the active sediments and that in the water
8-40 400707 TAMS
column. No further reduction in fish body burden is possible without a change in the assumed
upstream load.
For the CAP-3/ 10/Select alternative, cancer risks and non-cancer health hazards are
calculated using a start date of 2009. The RME and CT non-cancer hazard indices are discussed indetail in subsection 7.3.3.2, and are presented in Tables 7-6a through 7-6d for the Upper Hudson
River and separately for River Sections 1, 2, and 3, respectively. RME and CT non-cancer hazard
indices by river section are shown on Figures 7-1 and 7-2, respectively. The CT hazard indices are
approximately an order of magnitude lower than the RME hazard indices, and are all above the target
level of one except for the CT hazard index in River Section 3. Similarly, the RME and CT
incremental cancer risks are discussed in detail in subsection 7.3.3.2, and are presented in Tables 7-
7a through 7-7d for the Upper Hudson River and separately for River Sections 1, 2, and 3,
respectively. RME and CT incremental cancer risks by river section are also shown on Figures 7-3
and 7-4, respectively. The RME incremental cancer risks for the Upper Hudson River and River
Sections 1 and 2 all slightly exceed the acceptable risk range of 10^ to 10"6, whereas the RME
incremental cancer risk for River Section 3 lies within this range, as do all of the CT incremental
cancer risks.
Overall Protection of the Environment - Ecological Receptors
The risk-based PRO for protection of the environment is a range from 0.13 to 0.013 mg/kg
total PCBs in fish fillets (this corresponds to a range from 0.3 to 0.03 mg/kg in whole fish), and is
based on the LOAEL and NOAEL fish concentrations consumed by the river otter. The
corresponding LOAEL and NOAEL whole fish target concentrations for the mink are 0.7 and 0.07
mg/kg PCBs. For the river otter, the NOAEL target concentration is not met in any of the three river
sections over the 70-year model forecast period. For the river otter, the LOAEL target concentration
is not met in River Section 1, but is met in River Section 2 in 52 years and is met in River Section
3 in 8 years. For the mink, the LOAEL target concentration is met in River Section 1 in 45 years and
is met in River Sections 2 and 3 prior to 2010. For the mink, the NOAEL target concentration is not ^omet in River Sections 1 and 2, but is met in River Section 3 in 5 years. -jo00
8-41 . TAMS

For the CAP-3/ 10/Select alternative, the ecological TQs for the river otter and the mink are
discussed in subsection 7.3.3.5 and presented in Table 7-9. For the river otter, the NOAEL and
LOAEL TQs by river section are shown in Figures 7-5 and 7-6, respectively. The river otter TQsare two orders of magnitude above the NOAEL target level in River Sections 1 and 2 and one order
of magnitude above the NOAEL target level in River Section 3. The river otter TQs are one orderof magnitude above the LOAEL target level in River Sections 1 and 2. In River Section 3, the river
otter toxicity quotient is below one for the LOAEL comparison. For the mink, the NOAEL and
LOAEL TQs by river section are shown in Figures 7-7 and 7-8, respectively. All of the mink TQ
comparisons are below one, except for the comparison with the NOAEL target level in River
Sections 1 and 2.
Overall Protection of the Environment - Downstream Transport of PCBs
The Tri+ PCB load over the TI Dam predicted by the model for the CAP-3/10/Select
alternative is about 104 kg in 2003, 23 kg in 2011, and 11 kg in 2035. The Tri+ PCB load over the
Northumberland Dam is approximately 123 kg in 2003,29 kg in 2011, and 11 kg in 2035. The Tri+
PCB load over the Federal Dam is about 131 kg in 2003, 43 kg in 2011, and 20 kg in 2035. This
alternative does address the scour of PCB-contaminated sediments associated with one-in-three-year
to one-in-five-year flow events from the Hoosic River in River Section 3, and is therefore effective
in reducing the PCB load over Federal Dam to the Lower Hudson River. PCB loads due to
resuspension from dredging operations are estimated to be 32 kg (about 6 kg/yr) over the entire
Upper Hudson River for the five-year period.
8.4.2.2 Compliance with ARARs
The chemical-specific ARARs for PCBs in the water-column are 0.5 ug/L (500 ng/L) federal
MCL; 0.09 ug/L (90 ng/L) N YS standard for protection of human health and drinking water sources;
1 ng/L federal Ambient Water Quality Criterion; 0.12 ng/L NYS standard for protection of wildlife;
and 0.001 ng/L NYS standard for protection of human consumers of fish. As shown in Figures 6-33
through 6-37, the first two chemical-specific ARARs for the surface water are met by the CAP-
3/10/Select alternative and the remaining three chemical-specific ARARs for the surface water are
not met by this alternative for the 70-year forecast period. These figures also show that the water
4007098-42 TAMS
quality is substantially improved for the CAP-3/10/Select alternative, compared to the No Action
and MNA alternatives. These differences are most apparent for the first 20 years (between 2005 and
2024) of the forecast period. However, even towards the end of the forecast period (in 2067), thereis a very substantial difference between the water quality for the No Action alternative(approximately 30 ng/L at TID and Schuylerville and 10 ng/L at Federal Dam) and Alternative CAP-
3/10/Select (approximately 5 ng/L at TID and Schuylerville and 1.7 ng/L at Federal Dam).
The CAP-3/10/Select alternative will comply with action-specific ARARs (e.g., CWA
Sections 401 and 404; TSCA; Section 3004 of RCRA; Section 10 of the Rivers and Harbors Act;
New York State ECL Article 3, Title 3, and Article 27, Titles 7 and 9) and location-specific ARARs
(e.g., Endangered Species Act; Fish and Wildlife Coordination Act; Farmland Protection Policy Act;
National Historic Preservation Act; and the New York State Freshwater Wetlands Law).
8.4.2.3 Long-Term Effectiveness and Permanence
Magnitude of Residual Risks
For the CAP-3/10/Select alternative, residual risk is reduced through capping 207 acres of
PCB-contaminated sediments and removal of 1.73 million cubic yards of sediments containing
33,100 kg PCBs. For this alternative, the Tri+ PCB load over the Federal Dam are predicted to
decrease from about 131 kg in 2003 to less than 20 kg in 2035. Soon after construction in 2011, the
CAP-3/10/Select alternative achieves a 58 percent reduction in the Tri+ PCB load over Federal Dam
compared to the No Action alternative and a 40 percent reduction in the Tri+ PCB load over Federal
Dam compared to the MNA alternative. After a longer period of time, in 2035, the CAP-3/ 10/Select
alternative results in a 68 percent reduction in the Tri-f PCB load over Federal Dam compared to the
No Action alternative and a 16 percent reduction in the Tri+ PCB load over Federal Dam compared
to the MNA alternative. The similarity in modeled PCB loads over Federal Dam between the MNA
and the CAP-3/10/Select alternatives by this time (e.g., 2035 and beyond) reflects the fact that both
are largely controlled by the value assumed for the unknown upstream PCB load. °-jMo
The CAP-3/10/Select alternative does not completely eliminate long-term risks for target
areas that are capped. Sediments are removed in areas only to the degree necessary for cap
JAMS
installation and, in some areas, highly contaminated sediments may be left in place below the cap
and backfill. Anthropogenic or natural processes (e.g., navigation accidents, severe storms, or
longer-term changes in the depositional/erosional regime in a given location) may damage or erode
and scour the cap materials and redistribute PCB-contaminated capped sediments over wider areasof the Upper Hudson River. Non-routine repair or replacement of large sections of the cap may haveto be undertaken if a breach occurs in a highly contaminated area (e.g., Hot Spot 14 in River Section
1 or Hot Spot 28 in River Section 2) due to catastrophic events such as a major flood. Depositional
buildup of sediments adjacent to the cap could shift currents over the cap creating the potential for
erosion in an unexpected area.
The influence of regional aquifer systems on the hydrologic regime of Upper Hudson River
has not been evaluated. Groundwater level fluctuations can result from a wide variety of hydrologic
phenomena (e.g., groundwater recharge due to seasonal heavy rainfall, or bank-storage effect near
the river) and the subsequent inflow of groundwater may breach the cap in multiple areas and
transport PCBs into the river. During periods of extremely low flow, sections of the cap could be
exposed to the air and a different range of temperatures and other conditions unlike the submerged
environment, resulting in freeze-thaw damage or desiccation cracking.
The CAP-3/ 10/Select alternative also relies on natural attenuation processes such as burial
by cleaner sediments, bioturbation, biodegradation, dispersion, dilution through advection and
recharge, adsorption, and volatilization to further reduce the concentration of any contaminants that
remain after construction is completed. However, as discussed in subsection 8.4.2.1, modeling
results predict that this alternative will not completely achieve the PRGs for the site wi thin the
modeled period, although RAOs are met in part or in full. The limitation in meeting PRGs largely
stems from the assumption of the upstream Tri+ PCB load at Fort Edward (Rogers Island) of 0.0256
kg/day beginning in 2005. Greater achievement of the PRGs is estimated based on a 0 kg/day
assumption. Thus, remediating PCB-contaminated sediment in combination with control of the
upstream load can be expected to achieve PRGs to a greater extent than either approach alone.
4007118-44 JAMS
Adequacy of Controls
The CAP-3/ 10/Select alternative provides for dredging of some contaminated sediments in
target areas and placement of an engineered cap over the remaining target areas. This alternative
also assumes a separate source control NTCRA in the vicinity of the GE Hudson Falls plant. Likethe MNA alternative, this alternative also provides for institutional controls such as the fishconsumption advisories and catch and release restrictions. As discussed for the MNA alternative,the existing institutional controls are not fully adequate in reducing exposure to PCBs from
consumption of contaminated fish. In addition, institutional controls are inadequate for protection
of the environment.
The planned post-construction fish, water column, and sediment monitoring program allows
for tracking the natural recovery of the river after remediation is completed and determining the need
to continue the existing fish consumption advisory. It also provides data to strengthen or extend the
fishing advisories in the event that fish levels do not decline as expected. However, these advisories
and the monitoring program have no effect on reducing the ecological risks to fish, piscivorous birds,
and mammals.
Reliability of Controls
Sediment capping, sediment removal (dredging and excavation), backfilling and habitat
replacement, and off-site disposal/treatment of removed sediments are all reliable and proven
technologies. However, for the CAP-3/10/Select alternative, proper design, placement, and
maintenance of the cap in perpetuity are required for its effectiveness, continued performance, and
reliability. This presents a challenge for the Upper Hudson River. The cap concept for the Upper
Hudson River requires maintenance of nearly 12 miles of long, narrow strips of cap with high length-
to-width and of perimeter-to-surface area ratios. A cap placed in a relatively sheltered embayment
or cove would be easier to maintain, since it would not be subject to the significant variations in riverrf»
conditions typical of a river channel. The cap integrity monitoring and maintenance program °>j
planned for the CAP-3/10/Select alternative provides for as reasonably reliable maintenance as could H1
be expected, if consistently and thoroughly followed. The challenge lies in overcoming the natural
human cendency to relax vigilance as time goes on, especially as the rationale for the cap's placement
8-45 TAMS

in the first place fades from public consciousness. The fish consumption advisories will continue
to provide some measure of protection of human health until PCB concentrations in fish are reduced
and the PRO for protection of human health is attained. However, even the attainment of acceptablelevels in the fish may serve to undermine vigilance in maintaining the cap in the future.
8.4.2.4 Reduction of Toxicity, Mobility, or Volume through Treatment
For the CAP-3/10/Select alternative, the mobility of the PCBs in capped areas (approximately
207 acres) is reduced because these PCBs are sequestered under the bentonite cap. However,
capping does not satisfy the CERCLA statutory preference for treatment. In addition, there is no
reduction in the toxicity or volume of the PCBs under the cap. Under this alternative, the mass of
PCBs and the volume of contaminated sediments within the Upper Hudson River are permanently
reduced because approximately 1.73 million cubic yards of sediment, containing an estimated 33,100
kg of PCBs, are removed. The CAP-3/10/Select alternative also assumes a separate source control
NTCRA in the vicinity of the GE Hudson Falls plant which is expected to reduce the upstream water
column Tri+ PCB load to the Hudson River PCBs site (i.e., at Rogers Island) from 0.16 kg/day to
0.0256 kg/day by January 1, 2005. The sediment remediation will serve to greatly reduce sediment-
to-water transfer of PCBs by removal or isolation of the contaminated sediments. In addition, after
construction of the alternative is completed, natural attenuation processes will provide further (but
slower) reductions in the toxicity of PCBs in the remaining sediments and surface water.
For the mechanical dredging option, the sediments that are removed undergo limited
treatment (stabilization with Portland cement) prior to landfill disposal. Based on the large volume
of sediments that are removed from the river under the CAP-3/10/Select alternative, but not
subjected to treatment other than stabilization, it does not satisfy the statutory preference for
treatment as a principal element of the remedy (CERCLA Section 121(b)). A different treatment
process may be employed for the high-value beneficial use option, thus satisfying the statutory
preference for treatment in such a case.
4007138-46 TAMS

8.4.2.5 Short-Term Effectiveness
Short-term effectiveness is assessed through review of the four components described
previously in subsection 8.1.5: protection of the community during remedial actions; protection of
the workers during remedial actions; potential adverse environmental impacts resulting fromconstruction and implementation; and time until remedial response objectives are achieved.
Protection of the Community During Remedial Actions
Risks to humans posed by consumption of PCB-contaminated fish will be reduced more
rapidly under the CAP-3/ 10/Select alternative than under the No Action and MNA alternatives. As
discussed in below, exposure levels for fish are not expected to increase substantively during this
remedial action so that risks from consuming fish will remain largely the same during the
construction period. The fish consumption advisories and restricted access to portions of the river
undergoing remediation provide protection from risks to human health for the local community and
the general public in the short term.
Transfer facilities and treatment areas present potential short-term risks to the community.
Therefore, access to these areas will be restricted to authorized personnel. In addition, monitoring
and engineering controls will be employed to minimize short-term effects due to material processing
activities. Increased traffic will also present on incremental risk to the community. The potential
for traffic accidents may increase marginally as additional vehicles are on the road. These effects
are likely to be minimal because most transportation of sediments for disposal will be accomplished
by rail. In addition to vehicular traffic, there will be increased river traffic. Work areas in the river
will be isolated (access-restricted), with an adequate buffer zone so that pleasure craft and
commercial shipping can safely avoid such areas. Finally, the increased in-river barge traffic will
be monitored and controlled to minimize, to the extent possible, adverse effects on the commercial
or recreational use of the Upper Hudson River.OO
8-47 JAMS

Protection of Workers During Remedial Actions
For the CAP-3/10/Select alternative, potential occupational risks to site workers from direct
contact, ingestion, and inhalation of PCBs from the surface water and sediments, and routine
physical hazards associated with construction work and working on water, are significantly higher
than for the No Action and MNA alternatives. For this alternative, site personnel will follow a site-
specific health and safety plan, OSHA health and safety procedures, and wear the necessary personal
protective equipment.
Potential Adverse Environmental Impacts Resulting from Construction and Implementation
For the CAP-3/10/Select alternative, the release of PCBs from the contaminated sediments
into the water column during construction (dredging and cap placement), as well as the transport of
PCBs over Federal Dam, will be controlled by operational practices (e.g., control of sediment
removal rates; use of enclosed dredge buckets; and use of sediment barriers). Although precautions
to minimize resuspension will be taken, it is likely that there will be a transient increase of suspended
PCB concentrations in the water column, and possibly in PCB concentrations in fish. Studies have
shown that such effects are controllable, small, and transient, and that longer-term improvement is
seen (e.g., WRI, 2000; MDEQ, 1999).
Remedial activities may also result in the temporary impacts to aquatic and wildlife habitat
of the Upper Hudson. Backfilling and habitat replacement measures wil l be implemented to mitigate
these impacts. A monitoring program will be established to verify the attainment of the habitat
replacement objectives. The degree of impact is directly related to the area remediated and volume
dredged. From this perspective, the impacts of the CAP-3/10/Select and the REM-3/10/Select
alternatives will be similar, since each alternative will modify the same total area of the river.
However, the impacts of these modifications are not considered to be significant due to their
transient nature and the mitigation measures which will be utilized.
As part of this evaluation, a semi-quantitative analysis of the possible increase in PCB loads
and concentrations from dredging operations was performed for the regions downstream and outside
of the target areas. These areas, in fact, represent the largest portion of the Upper Hudson within the
„ ,fi 4007155-4o TAMS
site boundaries (i.e., areas not subject to remediation). This calculation is intended to describe the
mean increase in water column PCB concentration over each dredging season in these areas. The
detailed description of the model and analysis used to estimate resuspension losses is provided in
Appendix E.6. The results of the analysis are summarized here. The resuspension losses for thisalternative apply only to the areas undergoing dredging. Areas undergoing capping only are assumedto yield little additional resuspension. Since this alternative involves the least sediment removal of
the three active alternatives, additional PCB loads are smallest. Only mechanical dredging, as
represented by an enclosed bucket dredge, is considered for sediment removal under this alternative.
The resuspension rate assumed for the bucket dredge is a relatively conservative estimate since the
available data describe the impacts of a less sophisticated dredge than that selected for the
engineering concept for this alternative.
Resuspension modeling results indicate that dredging associated with this alternative would
increase water column Tri+ PCB concentrations during remediation by an estimated average of 2.3
ng/L in River Section 1,12 ng/L in River Section 2, and 5 ng/L in River Section 3. The estimated
overall average increase in Tri+ PCBs is 5 ng/L. Note that the increases in PCB concentration would
occur only during the remediation construction period. That is, water column concentrations would
increase by 2.3 ng/L in River Section 1 during the three years of operation there. The increase in
water column concentrations in River Sections 2 and 3 would be less during this period due to
further settling and dilution of the material released from River Section 1. Similarly, water column
concentrations in River Section 2 would increase by an average of 12 ng/L during the one year of
operation in this river section. There would be no impact to River Section 1, which is upstream, and
a lesser impact to River Section 3, since dilution and settling would serve to reduce the increase.
The 5 ng/L increase in River Section 3 applies only during the last year of construction. The
estimates for the increased PCB concentrations in River Sections 2 and 3 are based on the
assumption that construction can be sequenced so that dredging occurs from upstream to
downstream. To the extent that dredging of the various river sections occurs in parallel rather than
in sequence, water column concentrations at the downstream dredging areas would be higher than
those estimated by the model. The incremental concentration increases would not be strictly *•
additive, however, since settling between the dredging areas will serve to reduce the increase ^jH
produced by the upstream location. °*
8-49 TAMS
It is important to place these estimated increases in the Tri+ PCB load in perspective. In
particular, concentrations of Tri+ PCBs in the water column at the TI Dam were in the range of 14.4to 532 (mean of 66 ng/L) in May through November 1999, the period of the year corresponding to
the proposed remedial operations. At the expected time of implementation, the mean concentrationat the TI Dam during this period is expected to be 29 ng/L based on the HUDTOX forecast.
Concentrations in River Section 2 are generally similar to those in River Section 1 while those in
River Section 3 are reduced by about 25 to 50 percent, depending on distance downstream due to
dilution from tributary flow. Thus in all river sections, these expected increases represent relatively
minor changes as compared to current or projected water column concentrations. Indeed, these
additions are within the year-to-year and season-to-season variations regularly observed in the Upper
Hudson. They are also well below the order-of-magnitude increase in mean water column
concentrations seen in the early 1990s. The water column PCB concentrations increases observed
in the early 1990s resulted in an approximate doubling of some fish levels. Thus, by analogy, the
PCB releases associated with the CAP-3/10/Select alternative should have only a minor impact on
fish body burdens in the Upper Hudson. It should be noted that Total PCB concentration increases
may be greater, perhaps two to three times higher than those for Tri+ PCBs. However, current and
projected water column total PCB concentrations at the TI Dam are also two to three times higher
than those for Tri-i- PCBs. Thus the expected increase in total PCB represents the same percentage
increase relative to projected conditions as anticipated for the Tri+ increase.
While the previous paragraph has placed the dredging-related increase in water column
concentrations of Tri+PCB in perspective, it should be noted that where particularly high sediment
concentrations are likely to be encountered, additional measures to limit and control sediment
resuspension could be employed. One location where additional measures may be warranted is the
vicinity of Hot Spot 28 in River Section 2 where elevated PCB levels are known to exist. At this
location it may be possible to perform some of the work in dry conditions by erecting a port-o-dam
or other structural barrier system (see Appendix E for a discussion of turbidity barriers) and then
draining the work area to reduce water levels. Once the area has been isolated and dewatered, work
could proceed by means of excavation equipment with much less concern over the release of
sediments into the water column. This and other approaches to further control and limit sediment
resuspension, in specific circumstances, will be evaluated during the design phase.
4007178-50

In addition to the examination of the increase in PCB concentration, the model analysis also
included an estimate of the total amount of Tri+ PCB mass released by dredging operations.
Overall, the remediation would yield an additional 32 kg of Tri+ PCBs over the five-year operation,
or about 6 kg/yr. This value should be compared to the estimated release of Tri+ PCBs during theremediation period in the absence of remediation (461 kg or about 92 kg/yr for No Action, and 295
kg or about 59 kg/yr for MNA). The resuspension-related increase is only about 10 percent of the
expected annual release under MNA and even less relative to No Action. In fact, the modeled PCB
load increase is well within the range of year-to-year variability. The current annual rate of release
of Tri+ PCBs, approximately 109 kg/year (a rate which is largely unchanged over the last 10 years),
would generate 545 kg over a period equivalent to the CAP-3/10/Select remedial operations.
The additional release from the CAP-3/10/Select alternative is less than the PCB release
estimated from a single 100-year flood event (i.e., about 60 kg), as noted in the RBMR (USEPA,
2000a). As discussed in the RBMR, the 100-year flood was not expected to have a major impact on
fish or river PCB levels, with associated increases not lasting more than one to two years. With the
remedial releases spread out over five years, the impact should be much smaller with a residual
impact (after completion of construction) of even shorter duration than the 100-year flood.
Based on these analyses, it appears unlikely that the dredging of sediments associated with
the CAP-3/10/Select alternative will yield substantively higher levels of PCB in the water or fish of
the Upper Hudson during remedial construction. Based on the similarity to the release associated
with the 100-year flood event, it is unlikely that the residual effects after the construction will last
more than a few years.
However, for the CAP-3/10/Select alternative there is a potential transient impact from the
temporary exposure of deeper, contaminated sediments during the time interval between excavation
and cap placement. It may be possible to reduce impacts associated with exposure of deeper
sediments by detailed planning of all phases of the dredging and capping operations. However, therf*
level of coordination between the different elements of this alternative will render the overall °•j
remedial program under CAP-3/10/Select particularly complex. In addition, it will not be possible Hoo
to fully avoid water quality and related ecological impacts resulting from the temporary exposure of
contaminated sediments that are targeted for capping. Due to the transient nature of this exposure,
8-51 TAMS

the impact cannot be quantified. Nonetheless, it is unlikely to be greater than that originating from
sediment resuspension.
Time until Remedial Response Objectives Are Achieved
As noted previously, forecasts are subject to considerable uncertainty. Therefore, the
estimated years of target attainment discussed below should be considered a general guide. The risk-
based PRO for protection of human health of 0.05 ppm PCBs (wet weight) in fish fillets is not met
in River Sections 1,2, and 3 in the short term. The target concentration of 0.2 ppm PCBs (one meal
per month) in fish fillets is also not met in River Sections 1,2, and 3 in the short term. The alternate
target concentration of 0.4 ppm PCBs (one meal every two months) in fish fillets is not met in River
Sections 1 and 2 in the short term, but is met in River Section 3 in the year 2010 for the CAP-
3/10/Select alternative. Due to the potential effects of sediment resuspension discussed above, there
may be a delay of a few years in achieving the reductions forecast by the model.
The risk-based PRO for protection of the environment is a range from 0.3 to 0.03 mg/kg in
whole fish (this corresponds to a range from 0.13 to 0.013 mg/kg total PCBs in fish fillets), based
on the LOAEL and NOAEL fish concentrations consumed by the river otter. The corresponding
LOAEL and NOAEL target concentrations for the mink are 0.7 and 0.07 mg/kg PCBs in whole fish.
For the river otter, the PRGs are not met in River Sections 1, 2, and 3 in the short term. For the
mink, the LOAEL target concentration is not met in River Section 1 in the short term, but is met in
River Sections 2 and 3 prior to 2010. For the mink, the NOAEL target concentration is not met in
River Sections 1, 2, and 3 in the short term.
Therefore, in the short term, many RAOs and PRGs are not met for the CAP-3/10/Select
alternative, and this alternative is not protective of human health or the environment during the
construction period. However, the conditions associated with the implementation of this alternative
are not expected to be much more detrimental than those associated with MNA. Subsequent to the
implementation, conditions will improve substantively relative to MNA as discussed under long-
term effectiveness.
4007198-52 TAMS
8.4.2.6 Implementability
Technical Feasibility
Technical feasibility for the CAP-3/10/Select alternative is discussed below in terms of themain components of the alternative. Principal elements of the overall system that must be
constructed, operated, and otherwise be available in order to cap and selectively remove targeted
sediments, are as follows:
• Mechanical dredging equipment,
• Transfer facilities,
• AquaBlok™ system and facilities,
• Barges and towboats, and
• Transportation and disposal systems.
Dredging Equipment
Removal work under this alternative would be accomplished by means of mechanical
dredges. In general, the mechanical dredging systems (excavators outfitted with the appropriate
auxiliary equipment) needed to implement this alternative are either available, or can be fabricated.
Central to establishing the technical feasibility of the dredging program that would need to
be conducted under this alternative is the ability of the selected equipment to productively remove
as little as one or two feet of contaminated sediment. Buckets, such as those developed by Cable
Arm and certain European equipment suppliers, have been designed specifically for removal of
sediments in large area, shallow, flat cuts. These buckets also incorporate features to minimize
sediment resuspension and to monitor the precision of removal operations. The Cable Arm concept
has been used on several remedial projects in the US and Canada, and the European Horizontal ^o
Profiler has now undergone its initial US demonstration at New Bedford Harbor (see Chapter 5 and o*jAppendix A). Based on these experiences it is concluded that the shallow removal work called for Q
under this alternative can be efficiently accomplished as a result of recent innovations in the auxiliary
systems that are fitted to conventional hydraulic excavators.
8-53 TAMS

Buckets such as the Cable Arm and the Horizontal Profiler have been specifically designed
to minimize sediment resuspension. In addition, operational controls (e.g., cycle time) can be
implemented during removal operations to further reduce sediment resuspension. An analysis of the
short-term water quality implications of using a modern environmental bucket are presented in
Appendix E. The analysis indicates that rates of resuspension expected from use of the newest
generation of mechanical equipment (and the resulting water quality impacts) are well below thosereported in the technical literature regarding mechanical dredging operations as recently as a few
years ago. Based on the design of the new generation of mechanical dredging equipment and the
potential to further limit resuspension by operational controls, minimal downstream impact is
expected during removal work. Semi-quantitative estimates of the impacts on water column loads
and PCB loads are discussed in subsection 8.4.2.5 (see also Appendix E).
Transfer Facilities
Under the CAP-3/10/Select alternative, transfer facilities will be established at two locations
to process sediments generated by removal operations. These transfer facilities will require wharf
facilities as well as access to an operating rail line. In addition, adequate land area must be available
to process incoming sediments and to load the processed sediments into rail cars. Development of
the two transfer operations, one at a location adjacent to River Section 1 and one at a southern
location near Albany, is considered technically feasible. While the availability of suitable locations
adjacent to River Section 1 is limited, locations do exist where such operations can be established.
In the Port of Albany area, there are a number of materials handling operations that can be
configured to serve as sediment handling and processing facilities.
AquaBlok™ System and Facilities
Evaluation of the AquaBlok™ system is currently in progress at several remedial sites (e.g.,
Ottawa River, Ohio and Fort Richardson, Alaska). Therefore, while some experience already exists
with this technology, its long-term performance has not yet been established. However, the principal
component of the system is bentonite, which is a stable, low-permeability barrier material. Bentonite
has been used in capping systems for years and has demonstrated effectiveness for long-term
encapsulation of contaminants.
8-54 400721 JAMS

As can be noted from the conceptual plan that has been developed for this alternative (see
Plate 16), the pattern of work under CAP-3/10/Select is particularly complex. Capping would occur
in extended linear patterns with a high perimeter-to-surface area ratio. The capping concept isconstrained by areas where capping is impractical or infeasible (e.g., the navigation channel and
areas where depth of contamination is two feet or less). Because the dredging and cappingoperations will occur in an irregular, patchwork pattern dictated by these linear features, there willbe a need to coordinate the in-river work with some precision so that contaminated sediment
exposure will be minimized as much as possible. Furthermore, since manufacturing of cappingmaterials may occur at a different location than that at which dredged material is being processed,
the complexity of this alternative extends beyond dredging and capping to encompass activities at
two transfer facilities and possibly a cap manufacturing site. The degree of coordination required
at in-river work areas, and at material handling locations makes technical feasibility somewhat more
of a challenge than for dredging alone.
Barge and Tow boat Operations
Considerable use of barges and towboats will be necessary to implement this alternative.
Barges will be needed to haul dredged sediments to the northern and southern transfer facilities and
to haul capping materials to the various in-river capping locations. Based on preliminary
information received from the New York State Canal Corporation (Dergosits, 2000) it appears that
movement of loaded barges through the Champlain Canal will be feasible, provided that some
navigational dredging is accomplished in the early stages of remedial work. An estimate of the
quantity of material that must be removed to enable barges loaded with approximately 1,000 tons
to move through the canal system has been made. Costs for this additional removal work have been
included in overall cost of the alternative. Thus, from the standpoint of available draft, movement
of barges and towboats from the work site to the transfer facilities is considered technically feasible.
Other clearance and operating restrictions imposed by the canal system are not expected to preclude
implementation of the CAP-3/10/Select alternative.
OO^]toto
8-55 TAMS

Transportation and Disposal
Rail is the principal transportation mode considered for shipping dredged sediments out of
the Hudson Valley. Although barges could be a link in the transportation scheme, barge transportbeyond transfer facilities has been considered in this FS only in association with beneficial use of
dredged sediments. Under this alternative, approximately 16 carloads of sediment would beprocessed at the northern transfer facility each day, and approximately 14 carloads at the Albany
transfer facility. It is expected that this level of rail activity can be readily accommodated in the
Upper Hudson River area, given the resources of the two Class I railroads that serve the region.
As explained in Appendix E, adequate landfill capacity with rail access exists to manage
Hudson River sediments. This includes capacity at TSCA and non-TSCA landfills. Though
transportation distance to these facilities is considerable, landfilling stabilized Hudson River
sediments is considered feasible.
Administrative Feasibility
For the CAP-3/10/Select alternative, it is expected that the two transfer facilities, both
constructed on land adjacent to the river, will be considered "on-site" for the purposes of the permit
exemption under CERCLA Section 121(e), although any such facilities will comply with the
substantive requirements of any otherwise necessary permits. Operations under this alternative will
have to be performed in conformance with substantive requirements of regulatory programs
implemented by US ACE under Section 10 of the Rivers and Harbors Act and Sections 401 and 404
of the CWA. In addition, discharges during remediation will conform to NYS regulations related
to maintenance of Hudson River water quality. Backfilling and habitat replacement wi l l be
implemented in accordance with federal and state ARARs.
It is expected that contract documents for this alternative will contain substantial restrictions
on construction activity, including controls on the types of dredging and capping equipment to be
used, restrictions on the speed of operations, constraints on barge filling practices, and controls on
temporary storage of contaminated dredge spoils. Construction activities will also have to be
coordinated with the Canal Corporation, which operates the locks on the Upper Hudson River from
8_56 400723 TAMS

May through November. Finally, requirements of other regulatory programs will be incorporated
as necessary on the basis of information developed during remedial design.
Availability of Services and Materials
This section details the availability of services and materials that will be needed to implementthe CAP-3/ 10/Select alternative.
Dredges
It is expected that mechanical dredging equipment can be obtained as needed for the CAP-
3/10/Select alternative.
Barges and Towboats
Commercial activity on the Champlain Canal has all but ceased. Therefore, it is unlikely that
the full complement of towboats and barges is available in the immediate project vicinity to conduct
capping and dredging operations. Procurement of towboats and barges will require advance planning
and may entail fabricating some equipment
Processing and Stabilization Equipment
This equipment includes silos, hoppers, conveyors, and pug mills and is considered to be
commercially available on relatively short notice.
Cement or Substitute
The demand for and, therefore the availability of, cement varies with market conditions.
During mid-2000 demand was high and obtaining adequate supplies in the Hudson Valley could o
have been a problem. Substitutes for cement (cement kiln dust or fly ash) are generally available, io
usually at substantially reduced costs in comparison to Portland cement. The utility and cost-
effectiveness of these substitutes will need to be demonstrated via bench scale tests. Since there is
8-57 TAMS
likely to be a number of options available for processing dredged sediments (see Appendix E), it is
concluded here that the availability of Portland cement (or lack thereof) will not prevent processingand off-site disposal of dredged sediments.
TMAquaBlok
AquaBlok™ cap material will be manufactured either near the work site or at a location inthe Hudson Valley at a quarry where there is a supply of sand and gravel. The other constituents of
this composite aggregate material, clay and polymer, are also considered readily available.
Rail Cars
The availability of rail cars fluctuates with the state of the economy. Since the CAP-
3/10/Select alternative will be implemented over five years, and substantial planning will take place
prior to construction, it is expected that rail cars can be obtained within the cost parameters used in
this FS.
Landfill Capacity
Based on a survey of existing permitted TSCA and non-TSCA landfills (Appendix E), it is
concluded that adequate landfill capacity with rail access exists for disposal of Hudson River
sediments.
8.4.2.7 Cost
A summary of the details of the cost estimate for the CAP-3/10/Select alternative is given
in Tables 8-8a and 8-8b. Table 8-8a presents the summary for the disposal of stabilized dredged
materials at both TSCA and non-TSCA landfills. Table 8-8b presents the summary for the option
where the non-TSCA material is utilized for beneficial purposes. The estimated net present worth
costs of this alternative, calculated at a 7 percent discount rate, are approximately $370 million
assuming landfill disposal and $338 million assuming beneficial use.
4007258-58 1AMS

Capital Cost
Since the construction will be performed over a five-year period, capital costs will vary on
an annual basis. The total capital costs for this alternative are estimated to be about $504 millionassuming landfill disposal and about $459 million assuming beneficial use. The estimated presentworth of the capital costs for this alternative is $344 million assuming landfill disposal and $314
million for beneficial use.
O&M Costs
Due to the varying frequency of different elements of the monitoring program and the five-
year reviews, O&M costs will vary on an annual basis. The estimated annual average O&M costs
for this alternative are about $3.45 million for both landfill disposal and beneficial use options, and
represents the monitoring costs and the periodic cost of the modeling and the five-year reviews.
These costs have been estimated for a 25-year period. The estimated present worth of the O&M
costs for this alternative is $24 million for both landfill disposal and beneficial use options.
8.5 Alternative REM-3/10/Select: Expanded Hot Spot Removal in River Section 1; HotSpot Removal in River Section 2; and Removal of Select Areas in River Section 3
8.5.1 Description
The principal components of the REM-3/10/SeIect alternative include, as described below:
• Source control via separate removal action in the vicinity of the GE Hudson Falls plant;
• An implementation schedule and sequence of operations for the remediation;
• Removal (dredging) of sediments in selected target areas;
• In-river transport of backfill materials and dredged sediments;
• Processing at the northern and southern material management and transfer facilities;o• Treatment of the water entrained in removed (dredged) sediments to NYSPDES discharge o•~j
criteria; ^
• Backfilling and habitat replacement;
8-59 TAMS

• Transportation of dewatered and stabilized materials to off-site dredged material
management locations; and
• A performance monitoring program.
This alternative includes remediation by Expanded Hot Spot removal (i.e., in which thenominal MPA targets are 3 g/m2 PCBs or greater) in River Section 1, Hot Spot removal (i.e., in
which the nominal MPA targets 10 g/m2 or greater) in River Section 2, and removal of select areas
(i.e., sediments with high-concentration PCB target areas) in River Section 3. This alternative also
includes dredging in the navigation channel as necessary to implement the remediation (e.g., barges
and towboats). The areas to be remediated for this alternative are shown in Plate 17. The total area
of sediments targeted for removal is approximately 493 acres. The estimated volume of sediments
to be removed is 2.65 million cubic yards. This alternative also relies on naturally occurring
attenuation processes to reduce the toxicity, mobility, and volume of the remaining PCBs in the
Upper Hudson River sediments after the construction is completed. Institutional controls (e.g., site
use restrictions) are implemented as long-term control measures as part of this alternative. These
restrictions include continuation or modification of the existing fish consumption advisories and
catch and release restrictions. A review of site conditions will be conducted at five-year intervals,
as required by Section 121(c) of CERCLA.
Under the REM-3/10/Select alternative, in River Section 1, 266 acres of PCB-contaminated
sediments are remediated and nearly 1.5 million cubic yards of sediments containing 11,600 kg of
PCBs are removed. An additional 66,100 cubic yards of sediments containing 200 kg of PCBs are
removed from the navigat ion channel in River Section 1. In River Section 2, 74 acres of PCB-
contaminated sediments are remediated and 565,000 cubic yards of sediments containing 23,600 kg
of PCBs are removed. An additional 15,400 cubic yards of sediments containing 700 kg of PCBs
are removed from the navigation channel in River Section 2. In River Section 3, 92 acres of PCB-
contaminated sediments are remediated and 393,000 cubic yards of sediments containing 6,700 kg
of PCBs are removed. An additional 117,000 cubic yards of sediments con'aining 2,800 kg of PCBs
are removed from the navigation channel in River Section 3. Estimates of the areas remediated, as
well as the volumes and the mass of PCBs removed from the sediment target areas and the
navigation channel for each river section, are presented in Table 8-9.
8-60 4°°727 TAMS
8.5.1.1 Source Control in the Vicinity of the GE Hudson Falls Facility
The REM-3/10/Select alternative assumes a separate non-time critical removal action
(NTCRA) for source control in the vicinity of the GE Hudson Falls plant. The assumed separatesource control NTCRA, is expected to reduce the upstream water column Tri+ PCB load to theHudson River PCBs site at Fort Edward (Rogers Island) from 0.16 kg/day to 0.0256 kg/day on
January 1, 2005. USEPA has authorized the performance of an Engineering Evaluation/Cost
Analysis (EE/CA) to evaluate potential NTCRAs to address the discharge of PCBs into the river in
the vicinity of the GE Hudson Falls plant. GE has discussed with USEPA and NYSDEC a
conceptual approach to contain the release of PCB oil from the vicinity of the Hudson Falls facility.
Assuming that the conceptual approach proposed by GE, or a similarly effective system, is available
to address the Hudson Falls source, USEPA believes that a source control NTCRA can reasonably
be completed by January 1, 2005, if not earlier.
8.5.1.2 Implementation Schedule and Sequence of Operations
Remediation will commence in 2004 and will be completed in 2008. To the extent
practicable, sediments near Rogers Island in River Section 1 will be remediated first, and the work
will progress downstream towards the Federal Dam at Troy in River Section 3. Dredging of River
Section 3 may occur simultaneously with removal operations elsewhere as a result of the need to
gain access to the site or because doing so will improve overall efficiency. For this alternative,
removal operations are estimated to continue for approximately five years. Areas that correspond
to the navigation channel will be dredged first, followed by the areas in the intermediate depth zone
and shallow zone, in that order. Subsequently, backfill (12 inches of sand, silt, and gravel) will be
placed in the targeted areas as described in subsection 5.2.6, and other site restoration activities will
be performed as described below.
8.5.1.3 Removal and In-River Transport Operations
*.o
In order to accomplish the sediment removal planned for this alternative within the five-year o
construction period, a number of dredges and other marine equipment will be needed for the in-river m
operations. The number and type of dredges needed to accomplish the work depend on the volume
8-61 TAMS

of material to be removed, the time frame for the work, the productivity of the equipment, and the
limitations on the in-river and out-of-river transportation systems. Sediment removal can be
performed using either mechanical or hydraulic dredging equipment. Where mechanical dredging
is utilized, the dredged/excavated sediments are transported by hopper barge or deck barge to the
transfer facility. Where hydraulic dredging is utilized, the dredged material is transported via the
slurry pipeline and the booster pumping stations to the transfer facility. Based on the remediationtargets for this alternative, Table 8- lOa provides a list of the number and types of mechanical dredges
that will be operated, the number of barge loads of sediment that will be received at the northern and
southern transfer facilities, and quantity estimates for other engineering productivity parameters.
Table 8-10b provides a similar list of the number and types of hydraulic dredges, the number of
barge loads of sediment, and quantity estimates for other engineering productivity parameters.
8.5.1.4 On-Site Material Management and Transfer Facilities
Where mechanical dredging is utilized, the water separated from the sediments during
transport is removed at the transfer facility and the dredged sediments are stabilized by mixing with
cement or other appropriate pozzolanic material to absorb the remaining standing water. At the
northern and southern dredged material management and transfer facilities, the sediments will be
dewatered and blended with eight percent Portland cement as described in subsection 5.2.2 and
Appendix E. This blending serves to improve both the handling and disposal properties of the
dredged material. The rates at which this material is processed in the northern and southern facilities
are presented in Table 8-10a. This stabilized material will then be loaded into rail cars or barges as
described in subsections 5.2.2 and 5.2.5 for transfer to beneficial use and/or disposal facilities. The
estimated number of rail cars loaded at each material management and transfer facil i ty for this
alternative is also presented in Table 8-10a.
Where hydraulic dredging is utilized, the dredged material is transported via the slurry
pipeline and the booster pumping stations to the transfer facility, where the water is separated from
the sediments in a treatment train that includes hydrocyclones, coagulation, sedimentation, and belt
filters. The rates at which the separated solids are processed in the northern and southern facilities
are presented in Table 8-10b. These separated solids will then be loaded into rail cars or barges as
described in subsections 5.2.3 and 5.2.5 for transfer to beneficial use and/or disposal facilities. The
8-62 400729 TAMS
estimated number of rail cars loaded at each material management and transfer facility for this
alternative is also presented in this Table 8-1 Ob.
8.5.1.5 Water Treatment Subsequent to Removal
The water associated with the dredged material will be treated at the northern and southern
water treatment plants to NYSPDES discharge criteria as described previously in subsections 5.2.2and 5.2.3.
8.5.1.6 Backfilling and Site Reconstruction
As described in subsection 5.2.6, measures will be undertaken to mitigate disturbances to the
hydraulics of the river channel, the shoreline, and the aquatic habitat caused by removal operations.
The areas that are dredged will be backfilled with one foot of imported clean fill. This backfill willconsist of gravel, silt, and sand in order to re-establish a range of habitat types for a variety of aquatic
biota, especially the resident fish. The navigation channel will not be backfilled.
The disturbed portions of the river shoreline will have to be either stabilized or reconstructed.
The stabilization measures envisioned in this FS consist of hydro-seeding the shoreline where
disturbance is expected to be minimal and then expanding the scale of the effort where the
disturbances increase. Thus, in near-shore areas where between two and three feet of sediment
would be removed, the stabilization concept consists of placement of an approximately 20-foot-wide
vegetative mattress; where shoreline disturbance would equal or exceed 3 feet of sediment removal,
the stabilization concept includes either a log or wood crib revetment in addition to the vegetative
mattress. Tables 8-10a and 8-10b show the extent of shoreline disturbance and stabilization
anticipated for the REM-3/10/Select alternative. Where shoreline wetlands (critical areas) will be
removed by the dredging work, it is expected that the original bottom elevation will be re-established
and that the new upper layer of substrate would be a silty material. The quantities of gravel, sand,
and silt required for backfill and reconstruction of areas of the river bottom are also presented on oo
Tables 8-lOa and 8-10b. -a10o
8-63 TAMS

Beyond physical replacement of the river bottom substrate, it is also anticipated that a
spectrum of in-river plantings will be undertaken to further reduce the time for the river to return to
a productive ecological condition. The plantings will consist of various types of wetland and aquatic
species. The species being considered for this component of the program are detailed in Appendix
F. The general type and quantity of planting envisioned for the REM-3/10/Select alternative areshown on Tables 8-lOa and 8-lOb.
8.5.1.7 Off-Site Transport and Dredged Material Management
Of the total volume of about 2.65 million cubic yards of sediments removed from the Upper
Hudson River under the REM-3/10/Select alternative, it is estimated that more than 1.1 million cubic
yards (containing greater than 33 mg/kg PCBs) will need to be managed as TSCA-regulated material,
and 1.54 million cubic yards (containing less than 33 mg/kg PCBs) will be handled as non-TSCA
material. The TSCA material will be sent to a TSCA-permitted landfill and the non-TSCA material
will be sent to a non-TSCA landfill, as described in subsection 5.2.5. If facilities and adequate
capacity for beneficial use are available based on market conditions at the time when this alternative
is implemented, some or all of the non-TSCA material will be utilized for such purposes as described
in subsection 5.2.5.3. This includes both low-value beneficial uses as material for construction fill,
landfill cover, or abandoned mine reclamation and higher-value beneficial uses as manufactured
commercial products.
8.5.1.8 Performance Monitoring Program
The performance monitoring program consists of two components, monitoring during
construction of the alternative and post-construction monitoring.
Construction Monitoring
During construction of the REM-3/10/Select alternative, the construction monitoring program
described in subsection 5.2.7.3 will be implemented. The purpose of this monitoring is to confirm
that removal and backfilling of areas targeted for remediation has been performed as designed for
this alternative. The construction monitoring program will begin the year after design support testing
8-64 400731 JAMS

is completed and will last for six years. This program includes collection of samples from thesediment, water column, and biota.
Post-Construction Monitoring
The post-construction performance of this alternative will be monitored through theimplementation of the sampling program described in subsection 5.2.7.4 and in Appendix G. Figure
5-6 presents the outline of this monitoring program. Long-term monitoring for a ten-year period
after remediation is completed in 2008 will be conducted in sediments, in the water column, and in
biota as part of this alternative. Monitoring will include measurements of water column
contamination, dated sediment cores, sediment PCB inventory, sediment physical properties
(geophysics), and bioaccumulation by resident fish. Loss of contaminants can be documented by
historical trends or contaminant concentration distributions showing a reduction in the total mass of
contaminants in sediments, water, or biota, or by the presence of degradation products in sediments.
The monitoring data will also be used as input parameters in the mathematical models to evaluate
progress of the natural attenuation processes against original predictions.
The number and distribution of sediment, water column, and fish samples that will be
collected are presented in the alternative-specific tables in Appendix G. The sediment samples
(cores and surface grab samples) will be analyzed for total PCBs and total organic carbon.
Bathymetric surveys will also be performed. Water column samples will be analyzed for congener-
specific PCBs, TSS, and fraction of organic carbon on TSS. Samples of the resident fish species
including largemouth bass, brown bullhead, and yellow peich will be analyzed for total PCBs
(Aroclors), congener-specific PCBs, and lipid content. A review of site conditions will occur at the
end of every five years for a 10-year period.
8.5.2 Analysis
8.5.2.1 Overall Protection of Human Health and the Environment
The overall protection of human health and the environment achieved by the REM-
3/10/Select alternative is considerably more than that achieved by the No Action and MNA
8-65 TAMS
oo
alternatives because this alternative is a permanent alternative that involves removal of contaminated
sediments in River Sections 1, 2, and 3. It also provides for some limited on-site treatment of the
PCBs in the sediments by the stabilization process (addition of eight percent Portland cement)
discussed above. In addition, the REM-3/10/Select alternative assumes a separate source control
NTCRA in the vicinity of the GE Hudson Falls plant, and also relies on the fish consumptionadvisories and catch and release restrictions to protect human health.
The existing fish consumption advisories and restricted access to portions of the river
undergoing remediation reduce risks to the local community. This alternative also relies on such
natural attenuation processes as burial by cleaner sediments, bioturbation, biodegradation, dispersion,
dilution through advection and recharge, adsorption, and volatilization to further reduce the
concentration of PCB-contarninant sediments remaining in the river after construction is completed.
There are five options for dealing with the sediments after removal from the river: landfill
disposal (for hydraulic dredging); stabilization and landfill disposal (for mechanical dredging);
beneficial use as landfill cover or construction fill material (for hydraulic dredging); stabilization and
beneficial use as landfill cover or construction fill material (for mechanical dredging); and thermal
treatment and beneficial use as manufactured commercial products like cement, light weight
aggregate, fiberglass, or architectural tiles (for both mechanical and hydraulic dredging). For the
landfill disposal option, the PCB-contaminated sediments would be permanently removed and
contained at a permitted and regulated facility. For the beneficial use option, the removed and
stabilized sediments will be further treated at the off-site facility and the PCBs will be permanently
sequestered (for the construction fill/landfill cover option) or destroyed (for the manufacture of
commercial products option).
For the REM-3/10/Select alternative, risks to human health and ecological receptors
(piscivorous birds and mammals) will be reduced through remediation of an estimated 493 acres
of PCB-contaminated sediments and rerrioval of approximately 45,600 kg of PCBs contained in an
estimated 2.65 million cubic yards of sediments. Removal of the sediments reduces the toxicity,
mobility, and volume of the contaminants in the river. After construction is completed, natural
attenuation processes may further reduce the toxicity and volume of PCBs in sediments (e.g., through
biodegradation) or reduce their mobility (e.g., though burial by cleaner sediments).
8-66 400733 ;AMS
Overall Protection of Human Health
For Alternative REM-3/10/Select, the risk-based PRO for protection of human health of 0.05
ppm PCBs (wet weight) in fish fillet is not met in River Sections 1 and 2 over the 70-year model
forecast period, but is met in River Section 3 in the year 2051. The target concentration of 0.2 ppmPCBs (one meal per month) in fish fillets is also not met in River Section 1, but is met in River
Section 2 in the year 2040 and is met in River Section 3 in the year 2014. The target concentration
of 0.4 ppm PCBs (one meal every two months) in fish fillets is met in River Sections 1, 2, and 3, in
the years 2025, 2024, and 2010, respectively. As discussed previously, further recovery as forecast
by the model (i.e., reduction in fish PCB concentrations) is limited due to the assumption made for
the upstream PCB load.
As for the CAP-3/10/Select alternative, the failure to achieve further reduction in PCB levels
in each river section reflects the importance of the assumption of the upstream loading late in the
forecast period. Significant reductions are accomplished as a result of the sediment remediation and
the source control NTCRA but no further reduction in fish body burden is possible without a change
in the assumed upstream load.
For the REM-3/10/Select alternative, cancer risks and non-cancer health hazards are
calculated using a start date of 2009. The RME and CT non-cancer hazard indices are discussed in
detail in subsection 7.3.4.2 and are presented in Tables 7-6a through 7-6d for the Upper Hudson
River and separately for River Sections 1, 2, and 3, respectively. RME and CT non-cancer hazard
indices by river section are shown on Figures 7-1 and 7-2, respectively. The CT hazard indices are
approximately an order of magnitude lower than the RME hazard indices, and are all above the target
level of one except for the CT hazard index in River Section 3. Similarly, the RME and CT
incremental cancer risks are discussed in detail in subsection 7.3.4.2 and are presented in Tables 7-7a
through 7-7d for the Upper Hudson River and separately for River Sections 1,2, and 3, respectively.
RME and CT incremental cancer risks by river section are also shown on Figures 7-3 and 7-4,rf*>respectively. The RME incremental cancer risks for the Upper Hudson River and for River Sections oo
1 and 2 all slightly exceed the acceptable risk range of 10^ to 10"6, whereas the RME incremental £ji^
cancer risk for River Section 3 lies within this range. All of the CT incremental cancer risks lie
within this range.
8-67 TAMS

Overall Protection of the Environment - Ecological Receptors
The risk-based PRO for protection of the environment is a range from 0.13 to 0.013 mg/kg
total PCBs in fish fillets (this corresponds to a range from 0.3 to 0.03 mg/kg in whole fish), based
on the LOAEL and NOAEL fish concentrations consumed by the river otter. The corresponding
LOAEL and NOAEL whole fish target concentrations for the mink are 0.7 and 0.07 mg/kg PCBs.
For the river otter, the NOAEL target concentration is not met in any of the three river sections over
the 70-year model forecast period. For the river otter, the LOAEL target concentration is not met
in River Section 1, but is met in River Section 2 in 52 years and in River Section 3 in 8 years. For
the mink, the LOAEL target concentration is met in River Section 1 in 4 years, and is met in River
Sections 2 and 3 prior to 2010. For the mink, the NOAEL target concentration is not met in River
Sections 1 and 2, but is met in River Section 3 in 5 years.
For the REM-3/10/Select alternative, the ecological TQs for the river otter and the mink are
discussed in subsection 7.3.4.5 and presented in Table 7-9. For the river otter, the NOAEL and
LOAEL TQs by river section are shown in Figures 7-5 and 7-6, respectively. The river otter TQs
are two orders of magnitude above the NOAEL target level in River Sections 1 and 2 and one order
of magnitude above the NOAEL target level in River Section 3. The river otter TQs are one order
of magnitude above the LOAEL target level in River Sections 1 and 2. In River Section 3, the river
otter TQ is below one for the LOAEL comparison. For the mink, the NOAEL and LOAEL TQs by
river section are shown in Figures 7-7 and 7-8, respectively. All of the mink TQ comparisons are
below one, except for the comparison with the NOAEL target level in River Sections 1 and 2.
Overall Protection of the Environment - Downstream Transport of PCBs
The Tri+ PCB load over the TI Dam predicted by the model for the REM-3/10/Select
alternative is approximately 104 kg in 2003, 22 kg in 2011, and 11 kg in 2035. The Tri-f PCB load
over the Northumberland Dam is about 123 kg in 2003, 27 kg in 2011, and 11 kg in 2035. The Tri+
PCB load over the Federal Dam is 131 kg in 2003, 42 kg in 2011, and 20 kg in 2035. This
alternative addresses the scour of PCB-contaminated sediments associated with one-in-three-year
to one-in-five-year flow events from the Hoosic River in River Section 3, and is therefore effective
in reducing the PCB load over Federal Dam to the Lower Hudson River.
8-68 400735 TAMS

8.5.2.2 Compliance with ARARs
The chemical-specific ARARs for PCBs in the water-column are 0.5 ug/L (500 ng/L) federal
MCL; 0.09 ug/L (90 ng/L) NYS standard for protection of human health and drinking water sources;
1 ng/L federal Ambient Water Quality Criterion; 0.12 ng/L NYS standard for protection of wildlife;and 0.001 ng/L NYS standard for protection of human consumers offish. As shown in Figures 6-33
through 6-37, the first two chemical-specific ARARs for the surface water are met by the REM-
3/10/Select alternative and the remaining three chemical-specific ARARs for the surface water are
not met by this alternative for the 70-year forecast period. These figures also show that the water
quality is substantially improved for the REM-3/10/Select alternative, compared to the No Action
and MNA alternatives. These differences are most apparent for the first 20 years (between 2005 and
2024) of the forecast period. However, even towards the end of the forecast period (in 2067), there
is a very substantial difference between the water quality for the No Action alternative
(approximately 30 ng/L at TID and Schuylerville and 10 ng/L at Federal Dam) and the REM-
3/10/Select alternative (approximately 5 ng/L at TED and Schuylerville and 1.7 ng/L at Federal Dam).
The REM-3/10/Select alternative will comply with action-specific ARARs (e.g., CWA
Sections 401 and 404; TSCA; Section 3004 of RCRA; Section 10 of the Rivers and Harbors Act;
New York State ECL Article 3, Title 3, and Article 27, Titles 7 and 9) and location-specific ARARs
(e.g.. Endangered Species Act; Fish and Wildlife Coordination Act; Farmland Protection Policy Act;
National Historic Preservation Act; and New York State Freshwater Wetlands Law).
8.5.2.3 Long-Term Effectiveness and Permanence
Magnitude of Residual Risks
For the REM-3/10/Select alternative, residual risk is reduced through remediation of 493
acres of PCB-contaminated sediments and removal of 2.65 million cubic yards of sediments»tt
containing 45,600 kg PCBs. For this alternative, the Tri+ PCB load over the Federal Dam is o
approximately 131 kg in 2003, 42 kg in 2011, and slightly less than 20 kg in 2035. Soon after wo\
construction in 2011, the REM-3/10/Select alternative results in a 60 percent reduction in the Tri+
PCB load over Federal Dam compared to the No Action alternative and a 42 percent reduction in the
8-69 TAMS

Tri+ PCB load over Federal Dam compared to the MNA alternative. After a longer period of time,
in 2035, the REM-3/10/Select alternative results in a 69 percent reduction in the Tri+ PCB load over
Federal Dam compared to the No Action alternative and a 17 percent reduction in the Tri+ PCB loadover Federal Dam compared to the MNA alternative. The similarity in PCB loads over Federal Dam
between the MNA and the REM-3/10/Select alternatives by this time (e.g., 2035 and beyond) is
reflects the fact that both are largely controlled by the assumed, but unknown, upstream PCB load.
The REM-3/10/Select alternative also relies on natural attenuation processes such as burial
by cleaner sediments, bioturbation, biodegradation, dispersion, dilution through advection and
recharge, adsorption, and volatilization to further reduce the concentration of any contaminants that
remain after construction is completed. However, modeling results predict that this alternative will
not completely achieve 0.05 ppm PRO in fish fillet for River Sections 2 and 3 within the modeled
period. However, it is predicted to be nearly achieved for the Upper Hudson River as a whole within
the modeled time frame. The limitation in meeting this PRG largely stems from the assumption of
the upstream Tri+ PCB load to the Hudson River PCBs site at Fort Edward (Rogers Island). It was
assumed that this load will be reduced 0.0256 kg/day beginning in 2005, but will remain at this (non-
zero) load for the duration of the modeled period. Greater achievement of the PRGs is achieved if
the upstream PCB input to the site were assumed to be 0 kg/day. Thus, remediating PCB-
contaminated sediment in combination with further control of the upstream load can be expected to
achieve far more PRGs and target concentrations than either approach alone.
Adequacy of Controls
The REM-3/10/Select alternative provides for removal of contaminated sediments in target
areas. This alternative also assumes a separate source control NTCRA in the v ic in i ty of the GE
Hudson Falls plant. Like the MNA alternative, this alternative also provides for institutional controls
such as the fish consumption advisories and catch and release restrictions. As discussed for the
MNA alternative, the existing institutional controls, which rely on voluntary compliance, are not
fully adequate in reducing exposure to PCBs due to consumption of fish. In addition, institutional
controls are inadequate for protection of the environment (e.g., ecological receptors).
8-70 400737 TAMS
The planned post-construction fish, water column, and sediment monitoring program allows
for tracking the natural recovery of the river after remediation is completed and collection of data
necessary for possible relaxing of the fish consumption advisories.
Reliability of Controls
Sediment removal (dredging and excavation), backfilling and habitat replacement, and off-
site disposal/treatment of removed sediments are all reliable and proven technologies. The REM-
3/10/Select alternative is more reliable than the CAP-3/ 10/Select alternative because there is little
or no long-term maintenance or residual risk associated with the remedial work. Also, the fish
consumption advisories will continue to provide some measure of protection of human health until
PCB concentrations in fish are reduced to 0.05 ppm and the PRO for protection of human health is
attained.
8.5.2.4 Reduction of Toxicity, Mobility, or Volume through Treatment
For the REM-3/10/Select alternative, the toxiciry, mobility, and volume of the PCBs in
approximately 493 acres of river sediments are permanently reduced (although not through
treatment) because approximately 2.65 million cubic yards of sediment, containing an estimated
45,600 kg of PCBs are removed from the ecosystem of the Upper Hudson River. Because the REM-
3/10/Select alternative also assumes a separate source control NTCRA in the vicinity of the GE
Hudson Falls plant, the Tri+ PCB load to the water column is expected to be reduced from 0.16
kg/day to 0.0256 kg/day by January 1, 2005. In addition, after construction of the alternative is
completed, natural attenuation processes will provide further (but slower) reductions in the toxicity
of PCBs in the remaining sediments and surface water.
For the mechanical dredging option, the sediments that are removed undergo limited
treatment (stabilization with Portland cement) prior to landfill disposal. For the hydraulic dredging'
option, the sediments that are removed are processed through hydrocyclones, coagulation, ^o
sedimentation, and belt filters to separate them from the water. However, these sediments do not o-•jundergo stabilization with Portland cement prior to landfill disposal. Based on the large volume of ^
sediments that are removed from the river but not subjected to treatment other than stabilization, the
8-71 TAMS

REM-3/10/Select alternative does not satisfy the statutory preference for treatment as a principal
element of the remedy (CERCLA Section 121(b)). A different treatment process may be employed
for the high-value beneficial use option, thus satisfying the statutory preference for treatment in such
a case.
8.5.2.5 Short-Term Effectiveness
Short-term effectiveness is assessed through review of the four components described above
(subsection 8.1.5): protection of the community during remedial actions, protection of workers
during remedial actions, potential adverse environmental impacts resulting from construction and
implementation, and time until remedial response objectives are achieved.
Protection of the Community During Remedial Actions
Risks to humans posed by consumption of PCB-contaminated fish will be reduced more
rapidly under the REM-3/10/Select alternative than under the No Action and MNA alternatives. As
discussed later in this subsection, exposure levels for fish are not expected to increase substantively
during this remedial action so that risks from consuming fish will remain largely the same during
the construction period. The fish consumption advisories and restricted access to portions of the
river undergoing remediation provides protection from risks to human health for the local
community in the short term.
Transfer facilities and treatment areas present potential short-term risks to the community.
Therefore, access to these areas will be restricted to authorized personnel. In addition, monitoring
and engineering controls wil l be employed to minimize short-term effects due to material processing
activities. Increased traffic wil l also present an incremental risk to the community. The potential
for traffic accidents may increase marginally as additional vehicles are on the road. These effects
are likely to be minimal because most transportation of sediments for disposal will be accomplished
by rail. In addition to vehicular traffic, there will be increased river traffic. Work areas in the river
will be isolated (access-restricted), with an adequate buffer zone so that pleasure craft and
commercial shipping can safely avoid such areas. Finally, the increased in-river barge traffic will
8-72 400739
be monitored and controlled to minimize, to the extent possible, adverse effects on the commercialor recreational use of the Upper Hudson River.
Protection of Workers During Remedial Actions
For the REM-3/10/Select alternative, potential occupational risks to site workers from directcontact, ingestion, and inhalation of PCBs from the surface water and sediments and routine physical
hazards associated with construction work and working on water are substantially higher than for
the No Action and MNA alternatives. For this alternative, site personnel will follow a site-specific
health and safety plan, OSHA health and safety procedures, and wear the necessary personal
protective equipment.
Potential Adverse Environmental Impacts Resulting from Construction and Implementation
For the REM-3/10/Select alternative, the release of PCBs from the contaminated sediments
into the surface water during construction (dredging), as well as the transport of PCBs over the
Federal Dam, will be controlled by operational practices (e.g., control of sediment removal rates; use
of enclosed dredge buckets; and use of sediment barriers). Although precautions to minimize
resuspension will be taken, it is likely that there will be a temporary increase of suspended PCB
concentrations, and possibly an increase in fish PCB body burdens. Studies have shown that such
effects are controllable, small, and transient, and that longer-term improvement is seen (e.g., WRI,
2000; MDEQ, 1999).
Remedial activities may also result in temporary impacts to aquatic and wildl i fe habitat of
the Upper Hudson. Backfilling and habitat replacement measures wi l l be implemented to mitigate
these impacts. A monitoring program will be established to verify the attainment of the habitat
replacement objectives. The degree of impact is directly related to the area remediated and volume
dredged. From this perspective, the impacts of the REM-3/10/Select and the CAP-3/10/Select
alternatives will be similar, since each alternative will modify the same total area of the river. ^o
However, these impacts are not considered to be significant due to their transient nature and the oi^
mitigation measures which will be utilized. o
8-73 TAMS

As part of this evaluation, a semi-quantitative analysis of the possible increase in PCB loads
and concentrations was performed for the regions downstream and outside of the target areas. These
areas, in fact, represent the largest portion of the Upper Hudson within the site boundaries. This
calculation is intended to describe the mean increase in water column PCB concentration over eachdredging season in these areas. The detailed description of the model and analysis to estimateresuspension losses is provided in Appendix E.6. The results of the analysis are summarized here.This alternative involves a greater volume of sediment removal than CAP-3/ 10/Select and less thanREM-0/0/3. Correspondingly, the mass of sediment resuspended for REM-3/ 10/Select lies between
the other two alternatives. As part of this analysis, the short-term impacts of a 12-inch cutterhead
dredge and an enclosed bucket dredge are considered for sediment removal. For all comparisons
between the two dredging methods, the production rate of dredge spoil material is the same for both
methodologies. Specifically, the production rate of a 12-inch cutterhead dredge is comparable to that
of three 4-cubic-yard enclosed bucket dredges. The 12-inch cutterhead dredge and three 4-cubic-
yard enclosed bucket dredges form the basis for comparisons below.
The resuspension rate for the bucket dredge represents a relatively conservative estimate.
Specifically, the available data for the bucket dredge describe the impacts of a less sophisticated
dredge than that selected for the engineering concept for this alternative. Although the results of the
resuspension modeling indicate somewhat greater PCB concentrations and loads due to mechanical
dredges versus hydraulic equipment, resuspension considerations will not be the main consideration
in selecting one concept over another, since the mechanical dredge estimate is considered
conservative. Rather, other engineering issues, such as sediment transfer, processing and handling
as well as operational logistics, will be more important considerations.
The model results indicate that dredging operations associated with this alternative would
serve to raise water column Tri+ PCB concentrations during the remediation an average of 2.4 ng/L
in River Section 1 utilizing the cutter-head dredge and an average of 4 ng/L using the enclosed
bucket dredges. For the expected one year of operation in River Section 2, the cutterhead dredge
would raise water column Tri+ PCB concentrations by 9 ng/L, whereas the bucket dredges would
raise concentrations by 15 ng/L. The last year of operation, set for River Section 3, is projected to
raise water column Tri+ PCB concentrations by 5 ng/L via the cutterhead dredge and 8 ng/L via the
bucket dredges. The overall average increase in Tri+ PCBs is estimated to be 4 ng/L for the cutter-
8-74 400741 JAMS

head dredge and 7 ng/L for the bucket dredges. Estimated water column PCB concentrationincreases from the cutterhead dredge are consistently about 40 percent lower than the three bucketdredges. This is based on a somewhat lower rate of resuspension for the cutterhead and a moreconservative estimate of resuspension for the bucket dredges. See Appendix E.6 for furtherdiscussion of the comparison.
The increases in PCB concentration would occur only during the remedial construction
period. For example, using the three enclosed bucket dredges, water column concentrations would
increase by an average of 4 ng/L in River Section 1 during the three years of operation there. The
increase in water column concentrations in River Sections 2 and 3 would be less during this period
due to further settling and dilution of the material released from River Section 1. Similarly, water
column concentrations in River Section 2 would increase by an average of 15 ng/L during the one
year of operation in this river section. There would be no impact to River Section 1, which is
upstream, and a lesser impact to River Section 3, since dilution and settling would serve to reduce
the increase. The 8 ng/L increase in River Section 3 applies only during the last year of construction.
The estimates for the increased PCB concentrations in River Sections 2 and 3 are based on
the assumption that construction can be sequenced so that dredging occurs from upstream to
downstream. To the extent that dredging of the various river sections occurs in parallel rather than
in sequence, water column concentrations at the downstream dredging areas would be higher than
those estimated by the model. The incremental concentration increases would not be strictlyadditive, however, since settling between the dredging areas will serve to reduce the increase
produced by the upstream location.
It is important to place these estimated increases in the Tri+ PCB load in perspective. In
particular, concentrations of Tri+ PCBs in the water column at the TI Dam were in the range of 14
to 532 ng/L (mean of 66 ng/L) in May through November (1999), the period (time of year)
corresponding to the remedial operations. During the anticipated period of implementation, the
mean concentration at the TI Dam is expected to be 29 ng/L, based on the HUDTOX forecast. Thus
implementation of the REM-3/10/Select alternative is only expected to increase mean water column4k
concentrations in River Section 1 by 14 percent. Forecast concentrations in River Section 2 are °generally similar to those in River Section 1. Under REM-3/10/Select, water column concentrations ^
to
8-75 TAMS

would increase by about 30 percent with the cutterhead dredge in River Section 2 (29 ng/L, plus anincrease of 9 ng/L) or by about 50 percent with the bucket dredges (29 ng/L, plus an increase of 15
ng/L), but only for the one year of operation in this river section. Average concentrations would beexpected to increase by about 50 percent in River Section 3 during the one year of operation in thisriver section.
While the previous paragraph has placed the dredging related increase in water columnconcentrations of Tri+PCB in perspective, it should be noted that where particularly high sedimentconcentration are likely to be encountered additional measures to limit and control sedimentresuspension could be employed. One location where additional measures may be warranted is thevicinity of Hot Spot 28 in River Section 2 where elevated PCB levels are known to exist. At thislocation it may be possible to perform some of the work in dry conditions by erecting a port-o-damor other structural barrier system (see Appendix E for a discussion of turbidity barriers) and thenpumping the work area to reduce water levels. Once the area has been isolated and dewatered, workcould proceed by means of excavation equipment with much less concern over the release ofsediments into the water column. This and other approaches to further control and limit sedimentresuspension, in specific circumstances, will be evaluated during the design phase.
Thus, in River Section 1, the projected increases in Tri+ PCB load from sedimentresuspension represent relatively minor changes as compared to current or projected water columnPCB concentrations, regardless of dredge type. Indeed, these increases in load are well below the
year-to-year and season-to-season variations regularly observed in the Upper Hudson. Changes inRiver Sections 2 and 3 are more substantial but relatively short in duration (the 30 weeks of a singledredging season). In all cases however, the projected increases for all three river sections are wellbelow the order-of-magnitude increase in mean water column concentrations seen in the early 1990s.
These water column increases resulted in an approximate doubling of some fish PCB concentrationsin some river sections. Thus, by analogy, PCB releases associated with the REM-3/10/Selectalternative should have only a minor impact on fish body burdens in the Upper Hudson. It shouldbe noted that total PCB concentration increases may be greater, perhaps two to three times higher,
than those estimated for Tri-t- PCBs. However, current and projected water column total PCBconcentrations at the TI Dam are also two to three times higher than those for Tri+ PCBs. Thus the
8-76 „ „ « „ . _ TAMS
expected increase in total PCB represents the same percentage increase relative to projectedconditions as anticipated for the Tri+ PCB concentration increase.
In addition to the examination of the increase in PCB concentration, the model analysis alsoincluded an estimate of the total amount of Tri+ PCB mass released by dredging operations. Overall,the remediation would yield an additional 28 kg of Tri+ PCBs over the five-year operation utilizingthe cutterhead dredge, or about 6 kg/yr. The bucket dredges would yield about 47 kg, or 9 kg/yr.These values should be compared to the estimated release of Tri+ PCBs from the sediments duringthe remediation period in the absence of remediation (46 1 kg or about 92 kg/yr for No Action and295 kg or about 59 kg/yr for MNA from River Section 1 alone). The increase due to the use of thecutterhead dredge is only about 1 0 percent of the expected annual release under MNA and even lessunder No Action. In fact the load difference is well within the range of year-to-year variability. The
bucket dredge release is a little higher but still less than 16 percent of the expected annual releaseunder MNA and even less under No Action. Notably, the current annual release of Tri+ PCBs is 109kg/year. This rate of release, which is largely unchanged over the last 10 years, would yield 545 kgover a period equivalent to the remedial operations for the REM-3/10/Select alternative.
The additional release from the REM-3/10/Select alternative (28 to 47 kg) is less than thePCB release estimated from a single 100-year flood event (i.e., 60 kg) as noted in the RBMR
(USEPA, 2000a). As discussed in the RBMR, the 100-year flood was not expected to have a major
impact on fish or river PCB levels, with associated increases not lasting more than one to two years.With the remedial releases spread out over five years, the impact should be much smaller with aresidual impact (after completion of construction) of even shorter duration than the 100-year flood.
Based on these analyses, it appears unlikely that the removal of sediments associated with
the REM-3/10/Select alternative will yield substantively higher PCB concentrations in UpperHudson fish during remedial construction. Water column increases may be as high as 30 to 50percent in River Sections 2 and 3 but the higher levels are short-lived. Based on the similarity to therelease associated with the 100-year flood event, it is unlikely that the residual effects will last more
than a few years after the construction is completed.oo
8-77 TAMS
Due to the greater extent of sediment removal, river conditions may be slightly worse thanthose anticipated during the implementation of the CAP-3/10/Select alternative. However, the impact
of additional resuspension losses under the REM-3/10/Select alternative may be partially or entirelyoffset by the increased exposure of contaminated sediments under CAP-3/10/Select. However, theimpact of the latter could not be estimated.
Time until Remedial Response Objectives Are Achieved
As noted previously, forecasts are subject to considerable uncertainty. Therefore, theestimated years of target attainment discussed below should be considered a general guide. The risk-based PRO for protection of human health of 0.05 ppm PCBs (wet weight) in fish fillets is not metin River Sections 1,2, and 3 in the short term. The target concentration of 0.2 ppm PCBs (one mealper month) in fish fillets is also not met in River Sections 1,2, and 3 in the short term. The targetconcentration of 0.4 ppm PCBs (one meal every two months) in fish fillets is not met in RiverSections 1 and 2 in the short term, but is met in River Section 3 in the year 2010 for the REM-3/10/Select alternative. Due to potential effects of sediment resuspension discussed above, theremay be a delay of a few years in achieving the reductions forecast by the model.
The risk-based PRO for protection of the environment is a range from 0.13 to 0.013 mg/kgtotal PCBs in fish fillets (this corresponds to a range from 0.3 to 0.03 mg/kg in whole fish), basedon the LOAEL and NOAEL fish concentrations consumed by the river otter. The corresponding
LOAEL and NOAEL whole fish target concentrations for the mink are 0.7 and 0.07 mg/kg PCBs.For the river otter, the PRGs are not met in River Sections 1, 2, and 3 in the short term. For themink, the LOAEL target concentration is not met in River Section 1 in the short term, but is met inRiver Sections 2 and 3 prior to 2010. For the mink, the NOAEL target concentration is not met in
River Sections 1, 2, and 3 in the short term.
Therefore, in the short term, many RAOs and PRGs are not met for the REM-3/10/Selectalternative, and this alternative is not protective of human health or the environment during the
construction period. However, the conditions associated with the implementation of this alternativeare not expected to be much more detrimental than those associated with MNA. Subsequent to the
8-78 TAMS400745

implementation, conditions will improve substantively relative to MNA as discussed under long-term effectiveness.
8.5.2.6 Implementability
Technical Feasibility
Technical feasibility is evaluated for the principal equipment and systems that are expected
to be required for the REM-3/10/Select alternative:
• Mechanical or hydraulic dredging equipment;
• Transfer facilities;
• Barges and towboats; and
• Transportation and disposal systems.
Dredging Equipment
Mechanical Dredging Equipment
Removal work under this alternative (REM-3/10/Select) would be accomplished by means
of several mechanical dredges operating simultaneously for five construction seasons. The dredging
equipment needed to implement this alternative (estimated to be four excavators outfitted with the
appropriate auxiliary equipment) is either available or can be fabricated.
Central to establishing the technical feasibility of the dredging program under this alternative
is the ability of the selected equipment to productively (i.e., cost-effectively) remove as little as one
or two feet of contaminated sediment. Buckets, such as those developed by Cable Arm and
European equipment suppliers, have been designed specifically for removal of sediments in largearea, shallow, flat cuts. These buckets also incorporate features to minimize sediment resuspension
£>•and to monitor the precision of removal operations. The Cable Arm concept has been used on o
oseveral remedial projects in the US and Canada, and the European Horizontal Profiler has now ^
o\undergone its initial US demonstration at New Bedford Harbor (see Chapter 5 and Appendix A).
8-79 TAMS

Based on these experiences it is concluded that the shallow removal work called for under this
alternative can be efficiently accomplished as a result of ongoing innovations in the design ofexcavators and the associated auxiliary equipment.
Buckets such as the Cable Arm and the Horizontal Profiler have been specifically designedto minimize sediment resuspension. Furthermore, beyond the design features that have beenincorporated into the equipment, it is also possible to impose controls on actual removal operations(e.g., cycle time) so that further reductions in sediment resuspension can be attained. An analysisof the short term water quality implications of using a modern environmental bucket are presentedin Appendix E. The analysis indicates that rates of resuspension expected from the newestgeneration of mechanical equipment are well below those reported in the technical literal, .eregarding mechanical dredging operations, as recently as a few years ago. Bcsed on the design of
the new generation of mechanical dredging equipment and the potential to further limit resuspensio.<by operational controls, minimal downstream impact is expected during removal work (seeAppendix E). The estimated Tri+ PCB loads due to resuspension from mechanical dredgingoperations is 47 kg (about 9 kg/yr) over the entire Upper Hudson River for the five-year period. Thisvalue should be compared to the estimated release of Tri+ PCBs from the sediments during theremediation period in the absence of remediation (461 kg or about 92 kg/yr for No Action and 295kg or about 59 kg/yr for MNA from River Section 1 alone). Therefore, an alternative based onmechanical removal of targeted sediments is environmentally feasible.
Hydraulic Dredging Equipment
Details on the hydraulic dredging concept are presented in Appendix G. This concept
indicates that one suction dredge outfitted with a cutterhead can remove the targeted sediments inRiver Sections 1 and 2 in about four years. Given the limitations on slurry line length described inAppendix H, it will also be necessary to employ several mechanical dredges for removal operationsin River Section 3. It is expected that the required hydraulic dredge and mechanical dredges are
either commercially available or can be fabricated for this project.
Hydraulic dredge designs have undergone substantial modifications in reaction to the need
to reduce sediment resuspension and to conduct removal operations as precisely as possible. It is
8-80 TAMS400747

expected that continuing improvements will be made to cutterhead and inlet pipe geometry, controlof the cutterhead swing, and the geometry of shrouds added for resuspension control. An analysisof sediment resuspension rates expected during operation of a modern suction dredge is presentedin Appendix E. The estimated Tri+ PCB loads due to resuspension from hydraulic dredgingoperations is 28 kg (about 6 kg/yr) over the entire Upper Hudson River for the five-year period. Thisvalue should be compared to the estimated release of Tri+ PCBs from the sediments during theremediation period in the absence of remediation (461 kg or about 92 kg/yr for No Action and 295kg or about 59 kg/yr for MNA from River Section 1 alone). Therefore, an alternative based onhydraulic removal of targeted sediments is environmentally feasible.
Transfer Facilities-"Sf
Mechanical Dredging*"["
Transfer facilities will be established at two locations to process sediments generated bymechanical removal operations under this alternative. These transfer facilities require wharffacilities as well as access to an operating rail line. In addition, adequate land area must be availableto process incoming sediments and to load the processed sediments into rail cars. Development ofthe two transfer operations, one at a location adjacent to River Section 1 and one at a southernlocation near Albany, is considered technically feasible. While the availability of suitable locationsadjacent to River Section 1 is limited, locations do exist where such operations can potentially beestablished. In the Port of Albany area there are a number of materials handling operations that canbe configured to serve as sediment handling and processing facilities.
Hydraulic Dredging
Transfer facilities will be established at two locations to process sediments generated byhydraulic removal operations under this alternative. These transfer facilities require wharf facilitiesas well as access to an operating rail line. In addition, adequate land area must be available to
process incoming sediments and to load the processed sediments into rail cars. Development of thetwo transfer operations, one at a location adjacent to River Section 1 and one at a southern site near oAlbany, is considered technically feasible. 5
ifeoo
8-81 TAMS

While the availability of suitable locations adjacent to River Section 1 is limited, locationsdo exist where transfer operations can potentially be established. Under the hydraulic dredgingscenario, land area requirements at the northern transfer facility are somewhat more extensive thannecessary for removal operations conducted by only mechanical dredges. This is a consequence ofthe need to process (dewater) incoming sediment slurry at the rate of approximately 8,000 gpm.While the additional land area required for slurry processing (perhaps several acres) somewhatcomplicates establishing a transfer facility adjacent to River Section 1, it is expected that a locationcan be identified for this purpose. With regard to a transfer facility in the Albany vicinity, it isexpected that a location with existing wharf facilities and rail access can be found along theindustrial waterfront zone.
Barge and Towboat Operations
Mechanical Dredging
Considerable use of barges and towboats will be necessary to implement the mechanicaldredging option for this alternative. Barges will be needed to haul dredged sediments to the northernand southern transfer facilities and to place backfill in the river at the completion of removaloperations. Based on preliminary information received from the New York State Canal Corporation(Dergosits, 2000) it appears that movement of loaded barges through the Champlain Canal will befeasible, provided that some navigational dredging is accomplished in the early stages of remedialwork. An estimate of the quantity of material that must be removed to enable barges loaded withapproximately 1,000 tons to move through the canal system has been made. Costs for this additional
removal work have been included in overall cost of the alternative. Thus, from the standpoint ofavailable draft, movement of barges and towboats from the work site to the transfer facilities isconsidered technically feasible. Other clearance and operating restrictions imposed by the canalsystem are not expected to preclude implementation of the REM-3/10/Select alternative .
5 '
! 'Hydraulic Dredging
Considerable use of barges and towboats will be necessary to implement the hydraulic
dredging option of this alternative. Barges will be needed to haul dewatered sediments from the
8-82 .nn TAMS400749

northern to the southern transfer facilities and to haul mechanically dredged sediments directly to
the southern transfer facility. Based on preliminary information received from the New York State
Canal Corporation, it appears that movement of loaded barges through the Champlain Canal will be
feasible provided that some navigational dredging is accomplished in the early stages of remedialwork. An estimate of the quantity of material that must be removed to enable barges loaded with
approximately 1,000 tons to move through the canal system has been made. Costs for this additionalremoval work have been included in the overall cost of the alternative. Thus, from the standpoint
of available draft, movement of barges and towboats between transfer facilities is considered
technically feasible. Other clearance and operating restrictions imposed by the canal system are not
expected to preclude accomplishing the program.
Transportation and Disposal
Mechanical Dredging
Rail is the principal transportation mode considered for shipping dredged sediments out of
the Hudson Valley. Although barges could be a link in the transportation scheme, barge transport
has been considered in this FS only in association with beneficial use of dredged sediments. Under
this alternative, approximately 16 carloads of sediment would be processed at the northern transfer
facility each day and approximately 29 carloads at the Albany transfer facility. It is expected that
this level of rail activity can be accommodated in the Hudson Valley, given the resources of the two
Class I railroads that serve the region.
As explained in Appendix E, adequate landfill capacity with rail access exists to manage
Hudson River sediments. This includes TSCA-permitted landfill capacity and capacity for non-
TSCA materials. The considerable transportation distance to these facilities impacts overall
alternative costs but not the technical feasibility of landfill disposal.
i**Hydraulic Dredging ooj
UloAs with mechanical dredging, rail is the principal transportation mode considered for
shipping hydraulically dredged sediments out of the Hudson Valley. Although barging may be a link
8-83 TAMS
in the transportation scheme, barge transport has been considered in this FS only in association with
beneficial use of dredged sediments. Under this alternative, when hydraulic dredging operations arein progress, approximately 16 carloads of sediment would be processed at the northern transfer
facility each day and approximately 26 carloads at the southern transfer facility. It is expected that
this level of rail activity (which is slightly less than that estimated for the mechanical dredging
option) can be accommodated in the Upper Hudson River area, given the resources of the two ClassI railroads that serve the region.
As explained in Appendix E, adequate landfill capacity with rail access exists to manage
Hudson River sediments. This includes TSCA-permitted landfill capacity and capacity for non-
TSCA materials. The considerable transportation distance to these facilities affects overall costs but
not the feasibility of landfill disposal.
Administrative Feasibility
For the REM-3/10/Select alternative, it is expected that the two transfer facilities, both
constructed on land adjacent to the river, will be considered "on-site" for the purposes of the permit
exemption under CERCLA Section 121(e), although any such facilities will comply with the
substantive requirements of any otherwise necessary permits. Operations under this alternative will
have to be performed in conformance with substantive requirements of regulatory programs
implemented by USAGE under Section 10 of the Rivers and Harbors Act and Sections 401 and 404
of the CWA. In addition, discharges during remediation will conform to NYS regulations related
to maintenance of Hudson River water quality. Backfill and habitat replacement wi l l be
implemented in accordance with federal and state ARARs.
It is expected that contract documents for this alternative wi l l contain substantial restrictions
on construction activity including controls on the types of dredging and capping equipment to be
used, restrictions on the speed of operations, constraints on barge filling practices, and controls on
temporary storage of contaminated dredge spoils. Construction activities will also have to be
coordinated with the Canal Corporation, which operates the locks on the Upper Hudson River from
May through November. Finally, requirements of other regulatory programs will be incorporated
as necessary on the basis of information developed during remedial design.
8-84 400751 TAMS

Availability of Services and Materials
Mechanical Dredging
i This section details the availability of services and materials needed to implement the REM-3/10/Select alternative using mechanical dredges.
jj
Mechanical Dredgesi
It is expected that mechanical dredging equipment needed for the REM-3/10/Select
alternative is either commercially available or can be readily fabricated.
Barges and Towboats
Commercial activity on the Champlain Canal has all but ceased. Therefore, it is unlikely that
-—- the full complement of towboats and barges is available in the immediate project vicinity to conduct
the removal operations. Procurement of towboats and barges will require advance planning and
may entail fabricating some equipment.
Processing and Stabilization Equipment
The principal components of the sediment stabilization system are silos, hoppers, conveyors,
and pug mills. A processing system will be erected at both the southern and northern transfer
facilities to process mechanically dredged sediments. Stabilization equipment can be purchased
from a number of manufacturers and suppliers and is considered to be available for purposes of this
FS.
Cement or Substituterfko
The demand for and, therefore, the availability of, Portland cement varies with market ^j" 01
conditions. During mid-2000 demand was high and obtaining adequate supplies in the Hudson *°
Valley could have been a problem. Substitutes for cement (cement kiln dust or fly ash) are generally
8-85 TAMS
available, usually at substantially reduced costs in comparison to Portland cement. The utility and
cost-effectiveness of these substitutes will need to be demonstrated via bench scale tests. Since there
is likely to be a number of options available for processing dredged sediments (see Appendix E), itis concluded that the availability of Portland cement (or lack thereof) will not prevent processing and
off-site disposal of dredged sediments.
Rail Cars
The availability of rail cars fluctuates with the state of the economy. Since the REM-
3/10/Select alternative will be implemented over five years, and substantial planning will take place
prior to construction, it is expected that rail cars can be obtained within the cost parameters used in
this FS.
Landfill Capacity
Based on a survey of existing permitted TSCA and non-TSCA landfills (see Appendix E),
it is concluded that adequate landfill capacity with rail access exists for disposal of dredged material
generated by the REM-3/10/Select alternative.
Hydraulic Dredging
This section details the availability of services and materials needed to implement the REM-
3/10/Select alternative using a hydraulic dredging system in River Sections 1 and 2 and mechanical
dredges in River Section 3.
Dredges
It is expected that the hydraulic and mechanical dredging equipment required to implement
the REM-3/10/Select alternative is either commercially available or can be fabricated as needed.
8-86 400753 TAMS
Barges and Towboats
Commercial activity on the Champlain Canal has all but ceased. Therefore, it is unlikely thatthe full complement of towboats and barges is available in the immediate project vicinity to conduct
removal operations. Procurement of towboats and barges will require advance planning and mayentail fabricating some equipment.
Dewatering Equipment
Incoming slurry generated by the hydraulic dredging operations (about 8,000 gpm average
pumped to the northern transfer facility) will be processed via a series of hydrocyclones, flocculation
and settling tanks, and belt presses for purposes of dewatering the dredged sediments prior to off-site
shipment (see Appendix E). This equipment can be purchased from a number of manufacturers and
suppliers and is considered to be available for purposes of this FS.
Processing and Stabilization Equipment
The principal components of the sediment stabilization system are silos, hoppers, conveyors,
and pug mills. This system will be erected at the southern transfer facility to process mechanically
dredged sediments coming from River Section 3. This equipment can be purchased from a number
of manufacturers and suppliers and is considered to be available for purposes of this FS.
Cement or Substitute
The demand for and, therefore, the availabil i ty of, Portland cement varies with market
conditions. During mid-2000 demand was high and obtaining adequate supplies in the Hudson
Valley could have been a problem. Substitutes for cement (cement kiln dust or fly ash) are generally
available, usually at substantially reduced costs in comparison to Portland cement. The utility and "
cost-effectiveness of these substitutes will need to be demonstrated through bench scale tests. Since ^
there is likely to be a number of options available for processing dredged sediments (see Appendix <iui
E), it is concluded here that the availability of Portland cement (or lack thereof) will not prevent **
processing and off-site disposal of dredged sediments.
8-87 TAMS

Rail Cars
The availability of rail cars fluctuates with the state of the economy. Since the REM-
3/10/Select alternative will be implemented over five years, and substantial planning will take place
prior to initiating construction, it is expected that rail cars can be obtained within the cost parametersused in this FS.
Landfill Capacity
Based on a survey of existing permitted TSCA and non-TSCA landfills (see Appendix E),
it is concluded that adequate landfill capacity with rail access exists for disposal of Hudson River
sediments.
8.5.2.7 Cost
A summary of the details of the cost estimate for the REM-3/10/Select alternative is given
in Tables 8-1 la, 8-1 Ib, and 8-1 Ic. Table 8-11 a presents the summary for mechanical dredging with
the disposal of all stabilized dredged materials at both TSCA and non-TSCA landfills. Table 8-1 Ib
presents the summary for the option where the non-TSCA material is utilized for beneficial purposes.
Table 8-1 Ic presents the summary for optional use of hydraulic dredging with the disposal of all
dredged materials at both TSCA and non-TSCA landfills. The estimated net present worth costs of
this alternative, calculated at a 7 percent discount rate, are approximately $460 million for
mechanical dredging and landfill disposal, $413 million for mechanical dredging and beneficial use,
and $448 million for hydraulic dredging and landf i l l disposal.
Capital Cost
Since the construction will be performed over a five-year period, capital costs will vary on
an annual basis. The total capital costs estimated for this alternative are $658 million for mechanical
dredging and landfill disposal, $585 million for mechanical dredging and beneficial use, and $637
million for hydraulic dredging and landfill disposal. The present worth of the capital costs for this
alternative is estimated to be $448 million for mechanical dredging and landfill disposal, $399
8-88 400755 TAMS
million for mechanical dredging and beneficial use, and $434 million for hydraulic dredging and
landfill disposal.
O&M Costs
Due to the varying frequency of different elements of the monitoring program, and the five-
year reviews, O&M costs will vary on an annual basis. The estimated annual average O&M costs
for this alternative are about $3.2 million for all three options and represents the monitoring costs,
the periodic cost of the modeling, and the five-year reviews. O&M costs have been estimated for
a ten-year period. The estimated present worth of the O&M costs for this alternative is about $ 13.5
million for mechanical dredging and either landfill disposal or beneficial use, and $ 13.75 million for
hydraulic dredging and landfill disposal.
8.6 Alternative REM-0/0/3: Full-Section Removal in River Sections 1 and 2 and ExpandedHot Spot Removal in River Section 3
8.6.1 Description
The principal components of this alternative, as described below, include:
• Source control via separate removal action in the vicinity of the GE Hudson Falls plant;
• An implementation schedule and sequence of operations for the remediation;
• Removal (dredging) of sediments in selected target areas;
• In-river transport of backfill materials and dredged sediments;
• Processing of sediments at the northern and southern material management and transfer
facilities;
• Treatment of the water entrained in removed (dredged) sediments to NYSPDES discharge
criteria;
• Backfilling and habitat replacement;
• Transportation of dewatered and stabilized materials to off-site dredged material £o
management locations; and -Jen
• A performance monitoring program. **
8-89 TAMS

This alternative includes remediation by Full-Section removal (i.e., in which the nominal
MPA targets are 0 g/m2 or greater) in River Section 1 and 2 and Expanded Hot Spot removal (i.e.,
in which the nominal MPA targets are 3 g/m2 or greater) in River Section 3. This alternative also
includes sediment removal in the navigation channel as necessary to implement the remediation.
The areas to be remediated for this alternative are shown in Plate 18. The total area of sedimentstargeted for removal is approximately 964 acres. The volume of sediments to be removed is
estimated to be 3.83 million cubic yards. This alternative also relies on naturally occurring
attenuation processes to reduce the toxicity, mobility, and volume of the remaining PCBs in the
Upper Hudson River sediments after the construction is completed. Institutional controls (e.g., site
use restrictions) are implemented as long-term control measures as part of this alternative. These
restrictions include continuation or modification of the existing fish consumption advisories and
catch and release restrictions. A review of site conditions will be conducted at five-year intervals,
as required by Section 121© of CERCLA.
In River Section 1,470 acres of PCB-contaminated sediments are remediated and nearly 2.0
million cubic yards of sediments containing 15,000 kg of PCBs are removed. In River Section 2,
316 acres of PCB-contaminated sediments are remediated and approximately 1.1 million cubic yards
of sediments containing more than 35,000 kg of PCBs (see explanation lor estimated mass in
Appendix E) are removed. In River Section 3, 134 acres of PCB-contaminated sediments are
remediated and 571,000 cubic yards of sediments containing 10,700 kg of PCBs are removed. An
additional 117,000 cubic yards of sediments containing 2,800 kg of PCBs are removed from the
navigation channel in River Section 3. Estimates of the areas remediated, as well as the volumes and
the mass of PCBs removed from the sediment target areas and the navigation channel for each river
section, are presented in Table 8-12.
8.6.1.1 Source Control in the Vicinity of the GE Hudson Falls Plant
The REM-0/0/3 alternative assumes a separate norf-time critical removal action (NTCRA)
for source control in the vicinity of the GE Hudson Falls plant. It is assumed that as a result of this
source control (NTCRA), the upstream Tri+ PCB load at Fort Edward (Rogers Island) is reduced
fromO. 16 kg/day to 0.0256 kg/day on January 1, 2005. USEPA has authorized the performance of
an Engineering Evaluation/Cost Analysis (EE/CA) to evaluate potential NTCRAs to address the
8-90 400757 TAMS

discharge of PCBs into the river in the vicinity of the GE Hudson Falls plant. GE has discussed with
USEPA and NYSDEC a conceptual approach to contain the release of PCB oil from the vicinity of
the Hudson Falls facility. Assuming that the conceptual approach proposed by GE, or a similarly
effective system, is available to address the Hudson Falls source, USEPA believes that a source
control NTCRA can reasonably be completed by January 1, 2005, if not earlier.
8.6.1.2 Implementation Schedule and Sequence of Operations
Remediation will commence in 2004 and be completed in 2010. To the extent practicable,
sediments near Rogers Island in River Section 1 will be remediated first, and the work will progress
downstream towards the Federal Dam at Troy in River Section 3. Dredging in River Section 3 may
occur simultaneously with removal operations elsewhere as a result of the need to ensure
navigational access to the site or because doing so will improve overall efficiency. For this
alternative, removal operations are estimated to continue for approximately seven years. Areas that
correspond to the intermediate depth zone will be dredged first, followed by the areas in the shallow
zone and the navigation channel, in that order. Subsequently, backfill (12 inches of sand, silt, and
gravel) will be placed in the targeted areas as described in subsection 5.2.6, and other site
reconstruction activities will be performed as described below.
8.6.1.3 Removal and In-River Transport Operations
In order to accomplish the sediment removal planned for the REM-0/0/3 alternative within
the seven-year construction period, a number of dredges and other marine equipment will be needed
for the in-ri ver operations. The number and type of dredges needed to accomplish the work depend
on the volume of material to be removed, the time frame for the work, the productivity of the
equipment, and the limitations on the in-river and out-of-river transportation systems. Sediment
removal can be performed using either mechanical or hydraulic dredging equipment. Where
mechanical dredging is utilized, the dredged/excavated sediments are transported by hopper barge
or deck barge to the transfer facility. Where hydraulic dredging is utilized, the dredged material is ^o
transported via the slurry pipeline and the booster pumping stations to the transfer facility. Based o-jon the remediation targets for this alternative, Table 8- 13a provides a list of the number and types ^
of mechanical dredges that will be operated, the number of barge loads of sediment that will be
8-91 TAMS
received at the northern and southern transfer facilities, and quantity estimates for other engineering
productivity parameters. Table 8-13b provides a similar list of the number and types of hydraulic
dredges, the number of barge loads of sediment, and quantity estimates for other engineering
productivity parameters.
8.6.1.4 On-Site Material Management and Transfer Facilities
Where mechanical dredging is utilized, the water separated from the sediments during
transport is removed at the transfer facility and the dredged/excavated sediments are stabilized by
mixing with cement or other appropriate pozzolanic material to absorb the remaining standing water.
At the northern and southern dredged material management and transfer facilities, the sediments will
be dewatered and blended with eight percent Portland cement as described previously in subsection
5.2.2 and Appendix E. This blending serves to improve both the handling and disposal properties
of the dredged material. The rates at which this material is processed in the northern and southern
facilities are presented on Table 8-13a. This stabilized material will then be loaded into rail cars or
barges as described in subsections 5.2.2 and 5.2.5 for transfer to beneficial use or disposal facilities.
The estimated number of rail cars loaded at each material management and transfer facility for this
alternative are also presented on Table 8-13a.
Where hydraulic dredging is utilized, the dredged material is transported via the slurry
pipeline and the booster pumping stations to the transfer facility, where the water is separated from
the sediments in a treatment train that includes hydrocyclones, coagulation, sedimentation, and belt
filters. The rates at which the separated solids are processed in the northern and southern facilities
are presented on Table 8-13b. These separated solids wil l then be loaded into rail cars or barges as
described in subsections 5.2.3 and 5.2.5 for transfer to beneficial use and/or disposal facil i t ies. The
estimated number of rail cars loaded at each material management and transfer fac i l i ty for this
alternative are also presented on Table 8-13b.
400759 TAMS

8.6.1.5 Water Treatment Subsequent to Removal
The water associated with the dredged material will be treated at the northern and southern
water treatment plants to NYSPDES discharge criteria as described previously in subsections 5.2.2and 5.2.3.
8.6.1.6 Backfilling and Site Reconstruction
As described in subsection 5.2.6, site reconstruction measures will be undertaken to mitigate
disturbances to the hydraulics of the river channel, the shoreline, and the aquatic habitat caused by
removal operations. The areas that are dredged will be backfilled with one foot of imported clean
fill. This backfill will consist of gravel, silt and sand in order to re-establish a range of habitat types
for a variety of aquatic biota, especially the resident fish. The navigation channel will not be
backfilled.
The disturbed portions of the river shoreline will have to be either stabilized or reconstructed.
The stabilization measures envisioned in this FS consist of hydro-seeding the shoreline where
disturbance is expected to be minimal and then expanding the scale of the effort where the
disturbances increase. Thus, in near-shore areas where between two and three feet of sediment
would be removed, the stabilization concept consists of placement of an approximately 20-foot-wide
vegetative mattress; where shoreline disturbance would equal or exceed 3 feet of sediment removal,
the stabilization concept includes either a log or wood crib revetment in addition to the vegetative
mattress. Tables 8-13a and 8-13b show the extent of shoreline disturbance and stabilization
anticipated for the REM-0/0/3 alternative. Where shoreline wetlands (critical areas) wil l be removed
by the dredging work, it is expected that the original bottom elevation w i l l be re-established and that
the new upper layer of substrate would be a silty material. The quantities of gravel, sand, and silt
required for backfill and reconstruction of areas of the river bottom are also presented on Tables 8-
13aand8-13b.
tfc.o
Beyond physical replacement of the river bottom substrate, it is also anticipated that a 5cr>
spectrum of in-river plantings will be undertaken to further reduce the time for the river to return to °
a productive ecological condition. The plantings will consist of various types of wetland and aquatic
8-93 1AMS

species. The species considered for this component of the program are detailed in Appendix F. The
general type and quantity of planting envisioned for the REM-0/0/3 alternative are shown on Tables
8-13aand8-13b.
8.6.1.7 Off-Site Transport and Dredged Material Management
Of the total estimated volume of about 3.82 million cubic yards of sediments removed from
the Upper Hudson River under the REM-0/0/3 alternative, 1.42 million cubic yards (containing
greater than 33 mg/kg PCBs) will be handled as material subject to regulation under TSCA, and 2.4
million cubic yards (containing less than 33 mg/kg PCBs) will be handled as non-TSCA material.
The TSCA material will be sent to a landfill permitted and regulated under TSCA, and the non-
TSCA material will be sent to a non-TSCA landfill, as described in subsection 5.2.5. If facilities and
adequate capacity for beneficial use are available based on market conditions at the time when this
alternative is implemented, some or all of the non-TSCA material will be utilized for such purposes
as described in subsection 5.2.5.3. This includes both low-value beneficial uses as material for
construction fill, landfill cover, or abandoned mine reclamation and higher-value beneficial uses as
manufactured commercial products.
8.6.1.8 Performance Monitoring Program
The performance monitoring program consists of two components, monitoring during
construction of the alternative and post-construction monitoring.
Construction Monitoring
During the construction of the REM-0/0/3 alternative, the construction monitoring program
described in subsection 5.2.7.3 will be implemented. The purpose of this monitoring is to confirm
that removal and backfilling of areas targeted for remediation has been performed as designed for
this alternative. The construction monitoring program will begin the year after design support testing
is completed and will last for eight years. This program includes collection of samples from the
sediment, water column, and biota.
8"94 400761 TAMS

Post-Construction Monitoring
The post-construction performance of this alternative will be monitored through the
implementation of the sampling program described in subsection 5.2.7 A and in Appendix G. Figure
5-6 presents the outline of this monitoring program. Long-term monitoring for a ten-year period
after remediation is completed in 2010 will be conducted in sediments, the water column, and biota
as part of this alternative. Monitoring will include measurements of water column contamination,
dated sediment cores, sediment PCB inventory, sediment physical properties (geophysics), and
bioaccumulation by resident fish. Loss of contaminants can be documented by historical trends or
contaminant concentration distributions showing a reduction in the total mass of contaminants in
sediments, water, or biota, or by the presence of degradation products in sediments. The monitoring
data will also be used as input parameters in the mathematical models to evaluate progress of the
natural attenuation processes against the original predictions.
The number and distribution of sediment, water column, and fish samples that will be
collected are presented in the alternative-specific tables in Appendix G. The sediment samples
(cores and surface grab samples) will be analyzed for total PCBs (Aroclors) and total organic carbon.
Bathymetric surveys will also be performed. Water column samples will be analyzed for congener-
specific PCBs, TSS, and fraction of organic carbon on TSS. Samples of the resident fish species,
including largemouth bass, brown bullhead, and yellow perch, will be analyzed for total PCBs ,
congener-specific PCBs, and lipid content. A review of site conditions would occur at the end of
every five years (for a 10-year period).
8.6.2 Analysis
8.6.2.1 Overall Protection of Human Health and the Environment
The REM-0/0/3 alternative provides the greatest overall protection of human health and the
environment achieved by any of the remedial alternatives for the Upper Hudson River evaluated in ^o
the detailed analysis. This alternative is a permanent remedy that involves removal of the largest o-jamount of contaminated sediments in River Sections 1, 2, and 3. It also provides for some limited ^
on-site treatment of the PCBs in the sediments by the stabilization process (addition of eight percent
8-95 TAMS
Portland cement) discussed above. In addition, the REM-0/0/3 alternative assumes the separate
source control NTCRA in the vicinity of the GE Hudson Falls plant, and also relies on the fish
consumption advisories and catch and release restrictions to protect human health.
The existing fish consumption advisory and restricted access to portions of the river
undergoing remediation reduce risks to the local community. The REM-0/0/3 alternative also relies
on such natural attenuation processes as burial by cleaner sediments, bioturbation, biodegradation,dispersion, dilution through advection and recharge, adsorption, and volatilization to further reduce
the concentration of PCB-contaminated sediments remaining in the river after construction is
completed in 2010.
There are five options for dealing with the sediments after removal from the river: landfill
disposal (for hydraulic dredging); stabilization and landfill disposal (for mechanical dredging);
beneficial use as landfill cover or construction fill material (for hydraulic dredging); stabilization and
beneficial use as landfill cover or construction fill material (for mechanical dredging); and thermal
treatment and beneficial use as manufactured commercial products like cement, light weight
aggregate, fiberglass, or architectural tiles (for both mechanical and hydraulic dredging). For the
landfill disposal option, the PCB-contaminated sediments would be permanently removed and
contained at an off-site permitted and regulated facility. For the beneficial use option, the removed
and stabilized sediments will be further treated at the off-site facility and the PCBs wi l l be
permanently sequestered (for the construction fill/landfill cover option) or destroyed (for the
manufacture of commercial products option).
For the REM-0/0/3 alternative, risks to human health and ecological receptors (piscivorous
birds and mammals) wi l l be reduced through remediation of an estimated 964 acres of PCB-
contaminated sediments and removal of more than approximately 63,500 kg of PCBs (see
explanation for estimated mass in Appendix E) contained in an estimated 3.82 million cubic yards
of sediments. Removal of the sediments reduces the toxicity, mobility, and volume of the
contaminants in the river. After construction is completed, natural attenuation processes may further
reduce the toxicity and volume of PCBs in sediments (e.g., through biodegradation) or reduce their
mobility (e.g., though burial by cleaner sediments).
8-96 400763 TAMS

Overall Protection of Human Health
For the REM-0/0/3 alternative, the risk-based PRO for protection of human health of 0.05
ppm PCBs (wet weight) in fish fillet is not met in River Sections 1 and 2 over the 70-year model
forecast period, but is met in River Section 3 in the year 2050. The target concentration of 0.2 ppm
PCBs (one meal per month) in fish fillets is also not met in River Section 1, but is met in River
Section 2 in the year 2034 and is met in River Section 3 in the year 2013. The target concentration
of 0.4 ppm PCBs (one meal every two months) in fish fillets is met in River Sections 1, 2, and 3 in
the years 2013, 2015, and 2010, respectively. Due to potential effects of sediment resuspension as
discussed below (subsection 8.6.2.5), there may delay of a few years in achieving the reductions
forecast by the model.
As for the CAP-3/10/Select and the REM-3/10/Select alternative, the failure to achieve
further reduction in PCB levels in each river section reflects the importance of the assumption of the
upstream loading late in the forecast period. Significant reductions are accomplished as a result of
the sediment remediation and the source control NTCRA but no further reduction in fish body
burden is possible without a change in the assumed upstream load
For the REM-0/0/3 alternative, cancer risks and non-cancer health hazards are calculated
using a start date of 2011. The RME and CT non-cancer hazard indices are discussed in detail in
subsection 7.3.5.2 and are presented in Tables 7-6a through 7-6d for the Upper Hudson River and
separately for River Sections 1, 2, and 3, respectively. RME and CT non-cancer hazard indices by
river section are shown on Figures 7-1 and 7-2, respectively. The CT hazard indices are
approximately an order of magnitude lower than the RME hazard indices. The RME hazard indices
are all above the target level of one. The CT hazard indices are all below the target level of one,
except for the CT hazard index in River Section 1, which is equal to one. Similarly, the RME and
CT incremental cancer risks are discussed in detail in subsection 7.3.5.2 and are presented in Tables
7-7a through 7:7d for the Upper Hudson River and separately for River Sections 1, 2, and 3,
respectively. RME and CT incremental cancer risks by river section are also shown on Figures 7-3 oo
and 7-4, respectively. The RME incremental cancer risks for the Upper Hudson River and River ^
Sections 1 and 2 all slightly exceed the acceptable risk range of 10^ to 10"6, whereas the RME
8-97 TAMS
incremental cancer risk for River Section 3 lies within this range. All of the CT incremental cancer
risks lie within this range.
Overall Protection of the Environment - Ecological Receptors
The risk-based PRO for protection of the environment is a range from 0.13 to 0.013 mg/kgtotal PCBs in fish fillets (this corresponds to a range from 0.3 to 0.03 mg/kg in whole fish), based
on the LOAEL and NOAEL fish concentrations consumed by the river otter. The corresponding
LOAEL and NOAEL whole fish target concentrations for the mink are 0.7 and 0.07 mg/kg PCBs.
For the river otter, the NOAEL target concentration is not met in any of the three river sections over
the 70-year model forecast period. For the river otter, the LOAEL target concentration is not met
in River Section 1, but is met in River Section 2 in 35 years and in River Section 3 in five years. For
the mink, the LOAEL target concentration is met in River Section 1 in 2 years and is met in River
Sections 2 and 3 prior to 2010. For the mink, the NOAEL target concentration is not met in River
Section 1, but is met in River Section 2 in 52 years and in River Section 3 in four years.
For the REM-0/0/3 alternative, the ecological TQs for the river otter and the mink are
discussed in subsection 7.3.5.5 and presented in Table 7-9. For the river otter, the NOAEL and
LOAEL TQs by river section are shown in Figures 7-5 and 7-6, respectively. The river otter TQs
are two orders of magnitude above the NOAEL target level in River Sections 1 and 2 and one order
of magnitude above the NOAEL target level in River Section 3. The river otter TQs are one order
of magnitude above the LOAEL target level in River Sections 1 and 2. In River Section 3, the river
otter toxicity quotient is below one for the LOAEL comparison. For the mink, the NOAEL and
LOAEL TQs by river section are shown in Figures 7-7 and 7-8, respectively. All of the mink TQ
comparisons are below one, except for the comparison wi th the NOAEL target level in River
Sections 1 and 2.
Overall Protection of the Environment - Downstream Transport of PCBs
The Tri+ PCB load over the TI Dam predicted by the model for the REM-0/0/3 alternative
is about 104 kg in 2003, 14 kg in 2011, and 9.5 kg in 2035. The Tri+ PCB load over the
Northumberland Dam is 123 kg in 2003, 17 kg in 2011, and 9.5 kg in 2035. The Tri+ PCB load over
8'98 400765

the Federal Dam is 131 kg in 2003, 34 kg in 2011, and less than 18 kg in 2035. This alternative
addresses the scour of PCB-contaminated sediments associated with one-in-three-year to one-in-five-
year flow events from the Hoosic River in River Section 3 and is the most effective in reducing the
PCB load over Federal Dam to the Lower Hudson River.
8.6.2.2 Compliance with ARARs
The chemical-specific ARARs for PCBs in the water-column are 0.5 ug/L (500 ng/L) federal
MCL; 0.09 ug/L (90 ng/L) NYS standard for protection of human health and drinking water sources;
1 ng/L federal Ambient Water Quality Criterion; 0.12 ng/L NYS standard for protection of wildlife;
and 0.001 ng/L NYS standard for protection of human consumers offish. As shown in Figures 6-33
through 6-37, the first two chemical-specific ARARs for the surface water are met by the REM-0/0/3
alternative and the remaining three chemical-specific ARARs for the surface water are not met by
this alternative for the 70-year forecast period. These figures also show that the water quality is best
for the REM-0/0/3 alternative, compared to the No Action and MNA alternatives. These differences
are most apparent for the first 20 years (between 2005 and 2024) of the forecast period. However,
even towards the end of the forecast period (in 2067), there is a very substantial difference between
the water quality for the No Action alternative (approximately 30 ng/L at TID and Schuylerville and
10 ng/L at Federal Dam) and the REM-0/0/3 alternative (approximately 5 ng/L at TDD and
Schuylerville and 1.7 ng/L at Federal Dam).
The REM-0/0/3 alternative will comply with action-specific ARARs (e.g., CWA Sections
401 and 404; Toxic Substances Control Act; Section 3004 of RCRA; Section 10 of the Rivers and
Harbors Act; New York State ECL Article 3, Title 3, and Article 27, Titles 7 and 9) and location-
specific ARARs (e.g.. Endangered Species Act: Fish and Wildlife Coordination Act; Farmland
Protection Policy Act; National Historic Preservation Act; and New York State Freshwater Wetlands
Law).
OO
<t\
8-99 TAMS

8.6.2.3 Long-Term Effectiveness and Permanence
Magnitude of Residual Risks
For the REM-0/0/3 alternative, residual risk is reduced through remediation of 964 acres of
PCB-contaminated sediments and removal of 3.82 million cubic yards of sediments containing more
than 63,500 kg PCBs. Appendix E contains an explanation for estimated mass. For this alternative,
the Tri+ PCB load over the Federal Dam is approximately 131 kg in 2003, 34 kg in 2011, and less
than 18 kg in 2035. Soon after construction in 2011, the REM-0/0/3 alternative results in a 67
percent reduction in the Tri+ PCB load over Federal Dam compared to the No Action alternative and
a 53 percent reduction in the Tri+ PCB load over Federal Dam compared to the MNA alternative.
After a longer period of time, in 2035, the REM-0/0/3 alternative results in a 72 percent reduction
in the Tri+ PCB load over Federal Dam compared to the No Action alternative and a 25 percent
reduction in the Tri+ PCB load over Federal Dam compared to the MNA alternative. The similarity
in modeled PCB loads over Federal Dam between the MNA and the REM-0/0/3 alternatives by this
time (e.g., 2035 and beyond) reflects the fact that both are largely controlled by the value assumed
for the unknown upstream PCB load.
The REM-0/0/3 alternative also relies on natural attenuation processes such as burial by
cleaner sediments, bioturbation, biodegradation, dispersion, dilution through advection and recharge,
adsorption, and volatilization to further reduce the concentration of any contaminants that remain
after construction is completed. Due to the extensive removal performed for this alternative, there
is less reliance on natural process for further remediation than in. other alternatives. This alternative
achieves the greatest reduction in fish tissue concentrations and ensuing impacts among all of the
alternatives. However, modeling results predict that this alternative w i l l not completely achieve the
0.05 ppm PRO in fish fil let for River Sections 1 and 2 for the site w i t h i n the modeled period. The
limitation in meeting this PRO largely stems from the assumption of the upstream Tri-f PCB load
at Fort Edward (Rogers Island) of 0.0256 kg/day beginning in 2005. Greater achievement of the
PRGs is estimated employing a 0 kg/day assumption at Fort Edward.
8-100 400767 TAMS
Adequacy of Controls
The REM-0/0/3 alternative provides for removal of contaminated sediments in target areas.
The REM-0/0/3 alternative also assumes source control in the vicinity of the GE Hudson Falls plant.
Like the MNA alternative, this alternative also provides for institutional controls such as the fish
consumption advisories and catch and release restrictions. As discussed for the MNA alternative,the existing institutional controls, which rely on voluntary compliance, are not fully adequate in
reducing exposure to PCBs due to consumption of contaminated fish. In addition, institutional
controls are inadequate for protection of the environment (e.g., ecological receptors).
The planned post-construction fish, water column, and sediment monitoring program allows
for tracking the natural recovery of the river after remediation is completed and collection of data
necessary for possible relaxing of the fish consumption advisories.
Reliability of Controls
Sediment removal (dredging), backfilling and habitat replacement, and off-site disposal/
treatment of removed sediments are all reliable and proven technologies. The REM-0/0/3 alternative
is the most reliable alternative because there is little or no long-term maintenance or residual risk
associated with the remedial work. Also, the fish consumption advisories will continue to provide
some measure of protection of human health until PCB concentrations in fish are reduced to meet
PRGs for protection of human health.
8.6.2.4 Reduction of Toxicity, Mobility, or Volume through Treatment
For the REM-0/0/3 alternative, the toxicity, mobility, and volume of the PCBs in
approximately 964 acres of river sediments are permanently reduced (although not through
treatment) because approximately 3.82 million cubic yards of sediment containing more than an ^o
estimated 63,500 kg of PCBs (Appendix E) are removed from the ecosystem of the Upper Hudson o
River. Because the REM-0/0/3 alternative also assumes a separate source control NTCRA in the ^
vicinity of the GE Hudson Falls plant, the Tri+ PCB load to the water column is expected to be
reduced from 0.16 kg/day to 0.0256 kg/day by January 1,2005. In addition, after construction of the
8-101 .AMS

aJternative is completed, natural attenuation processes will provide further (but slower) reductions
in the toxicity of PCBs in the remaining sediments and surface water.
For the mechanical dredging option, the sediments that are removed undergo limited
treatment (stabilization with Portland cement) prior to landfill disposal. For the hydraulic dredging
option, the sediments that are removed are processed through hydrocyclones, coagulation,sedimentation, and belt filters to separate them from the water. However, these sediments do not
undergo stabilization with Portland cement prior to landfill disposal. Based on the large volume of
sediments that are removed from the river under this alternative but not subject to treatment other
than stabilization, the REM-0/0/3 alternative does not satisfy the statutory preference for treatment
as a principal element of the remedy (CERCLA Section 121 (b)0. A different treatment process may
be employed for the high-value beneficial use option, thus satisfying the statutory preference for
treatment in such a case.
8.6.2£ Short-Term Effectiveness
Short-term effectiveness is assessed through review of the four components described above
(subsection 8.1.5): protection of the community during remedial actions; protection of workers
during remedial actions; potential adverse environmental impacts resulting from construction and
implementation; and time until remedial response objectives are achieved.
Protection of the Community During Remedial Actions
Risks to humans posed by consumption of PCB-contaminuted fish will be reduced most
rapidly under the REM-0/0/3 alternative, more than under any other remedial alternative for the
Upper Hudson River. As discussed in later in this subsection, exposure levels for fish are not
expected to increase substantively during this remedial action so that risks from consuming fish will
remain largely the same during the construction period. The fish consumption advisories and
restricted access to portions of the river undergoing remediation provides protection from risks to
human health for the local community in the short term.
4007698-102 TAMS
Transfer facilities and treatment areas present potential short-term risks to the community.
Therefore, access to these areas will be restricted to authorized personnel. In addition, monitoring
and engineering controls will be employed to minimize short-term effects due to material processing
activities. Increased traffic will also present an incremental risk to the community. The potential
for traffic accidents may increase marginally as additional vehicles are on the road. These effects
are likely to be minimal because most transportation of sediments for disposal will be accomplished
by rail. In addition to vehicular traffic, there will be increased river traffic. Work areas in the river
will be isolated (access-restricted), with an adequate buffer zone so that pleasure craft and
commercial shipping can safely avoid such areas. Finally, the increased in-river barge traffic will
be monitored and controlled to minimize, to the extent possible, adverse effects on the commercial
or recreational use of the Upper Hudson River.
Protection of Workers During Remedial Actions
For the REM-0/0/3 alternative, potential occupational risks to site workers from direct
contact, ingestion, and inhalation of PCBs from the surface water and sediments, and routine
physical hazards associated with construction work and working on water, are substantially higher
than for any of the other remedial alternatives. For this alternative, site personnel will follow a site-
specific health and safety plan, OSHA health and safety procedures, and wear the necessary personal
protective equipment.
Potential Adverse Environmental Impacts Resulting from Construction and Implementation
For the REM-0/0/3 alternative, the release of PCBs from the contaminated sediments into
the surface water during construction (dredging), as well as the transport of PCBs over Federal Dam,
will be controlled by operational practices (e.g., control of sediment removal rates; use of enclosed
dredge buckets; and use of sediment barriers). Although precautions to minimize resuspension will
be taken, it is likely that there will be a temporary increase of suspended PCB concentrations, andit*
possibly an increase in PCB concentrations in fish. Studies have shown that such effects are ^-j
controllable, small, and transient, and that longer-term improvement is seen (e.g., WRI, 2000; -JoMDEQ, 1999).
8-103 TAMS
Remedial activities may also result in temporary impacts to aquatic and wildlife habitat of
the Upper Hudson. Backfilling and habitat replacement measures will be implemented to mitigate
these impacts. A monitoring program will be established to verify the attainment of the habitat
replacement objectives. The degree of impact is directly related to the area remediated and volumedredged. From this perspective, the impacts of the REM-0/0/3 alternative will be the greatest of any
alternative since this alternative involves the remediation of nearly all areas of River Sections 1 and2. (The impact in River Section 3 is nearly the same in this regard as CAP-3/10/Select and REM-
3/10/Select since there only minor differences between the Select and the Expanded Hot Spot
boundaries in this river section.) However, these impacts are considered to be temporary due to the
short duration of the remedial construction and the mitigation measures which will be utilized.
As part of this evaluation, a semi-quantitative analysis of the possible increase in PCB loads
and concentrations was performed for the regions downstream and outside of the target areas. These
areas, in fact, represent the largest portion of the Upper Hudson within the site boundaries. This
calculation is intended to describe the mean increase in water column PCB concentration over each
dredging season in these areas. The detailed description of the model and analysis to estimate
resuspension losses is provided in Appendix E.6. The results of the analysis are summarized here.
This alternative involves the greatest volume of sediment of any alternative. Correspondingly, the
mass of sediment resuspended for REM-0/0/3 is greater than for the other alternatives. As part of
this analysis, the short-term impacts of a 12-inch cutterhead dredge and an enclosed bucket dredge
are considered for sediment removal. For all comparisons between the two dredging methods, the
production rate of dredge spoil material is the same for both methods. Specifically, the production
rate of a 12-inch cutterhead dredge is comparable to that of three 4-cubic-yard enclosed bucket
dredges. The 12-inch cutterhead dredge and three 4-cubic-yard enclosed bucket dredges form the
basis for comparisons below.
The resuspension rate for the bucket dredge represents a relatively conservative estimate.
Specifically, the available data for the bucket dredge describe the impacts of a less sophisticated
dredge than that selected for the engineering concept for this alternative. Although the results of the
resuspension modeling indicate somewhat greater PCB concentrations and loads due to mechanical
dredges versus hydraulic equipment, resuspension considerations will not be the main consideration
in selecting one concept over another, since the mechanical dredge estimate is considered
8-104 400771 TAMS

conservative. Rather, other engineering issues, such as sediment transfer, processing and handling
as well as operational logistics, will be more important considerations..
The model results indicate that dredging operations associated with the REM-0/0/3alternative would increase water column Tri+ PCB concentrations during remediation an estimated
average of 2 ng/L in River Section 1 utilizing the cutterhead dredge and an average of 3.5 ng/L using
the enclosed bucket dredges. These values are lower than those for the other two active remedial
alternatives because a much greater volume of less-contaminated sediments will be removed under
REM-0/0/3. The period of removal is also one year longer. For the expected two years of operation
in River Section 2, the cutterhead dredge would raise water column Tri+ PCB concentrations by 4
ng/L whereas the bucket dredges would raise concentrations by 7 ng/L. The last year of operation,
assumed to be in River Section 3, is projected to increase water column Tri+ PCB concentrations
by 5 ng/L using the cutter-head dredge and 10 ng/L using the bucket dredges. The overall average
increase in Tri+ PCBs for the seven-year operation is estimated to be 3 ng/L for the cutterhead
dredge and 5 ng/L for the bucket dredges. The water column Tri+ PCB concentration increases
associated with use of the cutterhead dredge are consistently about 40 percent lower than those from
the three bucket dredges, based on a somewhat lower rate of resuspension for the cutterhead and a
more conservative estimate of resuspension for the bucket dredges. See Appendix E.6 for further
discussion of the comparison.
The increases in PCB concentration would occur only during the remedial construction
period. For example, using the three enclosed bucket dredges, water column PCB concentrations
would increase by an average of 3.5 ng/L in River Section 1 during the four years of operation there.
The increase in water column concentrations in River Sections 2 and 3 would be less during this
period due to further settling and dilution of the material released from River Section 1. Similarly,
water column concentrations in River Section 2 would increase by an average of 7 ng/L during the
two years of operation in this river section, but there would be no impact to River Section 1
(upstream of River Section 2), and a lesser impact to River Section 3, since dilution and settling
would reduce the increase. The 9 ng/L increase in River Section 3 applies only during the last year ^o
of construction; i.e., during implementation of remedial activities within River Section 3, and would o
have no impact (i.e., no water column PCB concentration increase) on River Sections 1 or 2. to
8-105 TAMS
It is important to place these estimated increases in the Tri+ PCB load in perspective. In
particular, concentrations of Tri+ PCBs in the water column at the TI Dam were in the range of 14.4
to 532 ng/L (mean of 66 ng/L) in May through November (1999), the part of the year during which
remedial operations are assumed to occur. During the anticipated period of implementation, the
mean concentration at the TI Dam is expected to be 29 ng/L, based on the HUDTOX forecast. Thus,the implementation of the REM-0/0/3 alternative is only expected to increase mean water column
concentrations in River Section 1 by 12 percent (29 ng/L + 3.5 ng/L). Forecast concentrations in
River Section 2 are generally similar to those in River Section 1. Under the REM-0/0/3 alternative,
water column concentrations would increase by about 14 percent using the cutterhead dredge in
River Section 2 (29 ng/L, plus 4 ng/L increase), or about 24 percent with the bucket dredges (29
ng/L, plus 7 ng/L increase), but only for the two years of operation in this river section. Average
water column PCB concentrations would be expected to increase by about 60 percent in River
Section 3 during the one year of operation in this river section.
Thus, in River Section 1, these expected increases represent relatively minor changes as
compared to current or projected water column concentrations, regardless of dredge type. Indeed,
these increases are well below the year-to-year and season-to-season variations regularly observed
in the Upper Hudson. Change in River Sections 2 and 3 are more substantial but relatively short in
duration (one to two dredging seasons). In all cases however, the projected increases for all three
river sections are well below the order-of-magnitude increase in mean water column concentrations
seen in the early 1990s. These water column increases resulted in an approximate doubling of some
PCB concentrations in fish in some river sections. Thus, by analogy, PCB releases associated with
the REM-0/0/3 alternative should have only a minor impact on fish body burdens in the Upper
Hudson. It should be noted that total PCB concentration increases may be greater, perhaps two to
three times higher than those for Tri-f PCBs. However, current and projected water column tot-nl
PCB concentrations at the TI Dam are also two to three times higher than those forTri-f PCBs. Thus
the expected increase in total PCB concentrations represents the same percentage increase relative
to projected conditions as anticipated for the Tri-i- PCB increase.
In addition to the examination of the increase in PCB concentration, the model analysis also
included an estimate of the total amount of Tri+ PCB mass released by dredging operations. Overall
the remediation would yield an additional 29 kg of Tri+ PCBs over the seven-year operation utilizing
8-106 400773 TAMS

the cutterhead dredge, or about 4 kg/yr. The bucket dredges would yield about 48 kg, or 7 kg/yr.
These values should be compared to the estimated release of Tri+ PCBs from the sediments during
the remediation period in the absence of remediation (637 kg or about 91 kg/yr for No Action, and
383 kg or about 55 kg/yr for MNA from River Section 1 alone). The increase due to the use of thecutterhead dredge is only about 10 percent of the expected annual release under MNA and even less
under No Action. In fact, the load increase is well within the range of year-to-year variability. The
bucket dredge release is a slightly higher but still less than 13 percent of the expected annual release
under MNA and even less under No Action. The current annual release of Tri+ is 109 kg/year; this
rate of release, which is largely unchanged over the last 10 years, would generate 763 kg over a
period equivalent to the remedial operations for the REM-0/0/3 alternative.
The additional release from the REM-0/0/3 alternative (29 to 48 kg) is less than the PCB
release estimated from a single 100-year flood event (i.e., 60 kg) as noted in the RBMR (USEPA,
2000a). As discussed in the RBMR, the 100-year flood was not expected to have a major impact on
fish or river PCB levels, with associated increases not lasting more than one to two years. With the
remedial releases spread out over five years, the impact should be much smaller with a residual
impact (after completion of construction) of even shorter duration than the 100-year flood.
Based on these analyses, it appears unlikely that the removal of sediments associated with
the REM-0/0/3 alternative will generate substantively higher PCB concentrations in fish of the Upper
Hudson during remedial construction. Water column increases may reach 25 to 60 in River Sections
2 and 3 but the higher concentrations are short-lived. Based on the similarity in magnitude to the
release associated with the 100-year flood event, it is unlikely that the residual effects wil l last more
than a few years after the construction is completed .
Time until Remedial Response Objectives Are Achieved
The risk-based PRO for protection of human health of 0.05 ppm PCBs (wet weight) in fish
fillets is not met in River Sections 1, 2, and 3 in the short term. The target concentration of 0.2 ppm *•
PCBs (one meal per month) in fish fillets is also not met in River Sections 1, 2, and 3 in the short 3•j
term. The target concentration of 0.4 ppm PCBs (one meal every two months) in fish fillets is not *•
met in River Sections 1 and 2 in the short term, but is met in River Section 3 in the year 2010 for the
8-107 TAMS

REM-0/0/3 alternative. Due to potential effects of sediment resuspension discussed above, there
may delay of a few years in achieving the reductions forecast by the model.
The risk-based PRO for protection of the environment is a range from 0.3 to 0.03 mg/kg in
whole fish (corresponding to a range from 0.13 to 0.013 mg/kg total PCBs in fish fillets), based on
the LOAEL and NOAEL fish concentrations consumed by the river otter. The correspondingLOAEL and NOAEL target concentrations for the mink are 0.7 and 0.07 mg/kg PCBs in whole fish.
For the river otter, the PRGs are not met in River Sections 1, 2, and 3 in the short term. For the
mink, the LOAEL target concentration is not met in River Section 1 in the short term, but is met n
River Sections 2 and 3 prior to 2010. For the mink, the NOAEL target concentration is not met in
River Sections 1, 2, and 3 in the short term.
Therefore, in the short term, many RAOs and PRGs are not met for the REM-0/0/3
alternative, and this alternative is not protective of human health or the environment during the
construction period. However, water column and fish tissue PCB concentrations associated with the
implementation of this alternative are not expected to be much more detrimental than the typical
conditions associated with MNA. Subsequent to the implementation, conditions will improve
substantively relative to MNA in terms of these measures as discussed under long-term effectiveness.
This alternative does involve the modification of nearly all habitat in River Sections 1 and 2. While
the impact from the habitat modification will be mitigated to the extent possible, some longer term,
although not permanent, impacts to ecological habitat are anticipated.
8.6.2.6 Implementability
Technical Feasibility
Technical feasibility is evaluated for the principal equipment and systems that are expected
to be required for the REM-0/0/3 alternative:
• Mechanical or hydraulic dredging equipment;
• Transfer facilities;
8-108 __ TAMS

• Barges and towboats; and
• Transportation and disposal systems.
Dredging Equipment
Mechanical Dredging Equipment
It is estimated that removal work under the REM-0/0/3 alternative will be accomplished by
five mechanical dredges operating simultaneously for seven construction seasons. Dredging
equipment needed to implement this alternative is either commercially available or can be fabricated.
On an annual basis, approximately three percent more material is removed under the REM-0/0/3
alternative as compared to REM-3/10/Select (546,000 cubic yards per year versus 530,000 cubic
yards per year). Thus, there is little to distinguish the two alternatives from the perspective of the
scale of equipment and operations. One difference between the two alternatives is the depth of
targeted sediments. The REM-0/0/3 alternative targets substantial areas where the depth of
contamination is one foot or less, whereas the REM-3/10/Select alternative targets minimum cuts
of two feet. As a result, the selection of equipment for REM-0/0/3 will be heavily influenced by the
need to remove sediment in one foot of water.
Central to establishing the technical feasibility of the dredging program under the REM-0/0/3
alternative is the ability of the selected equipment to productively (i.e., cost-effectively) remove as
little as one or two feet of contaminated sediments. Buckets, such as those developed by Cable Arm
and certain European equipment suppliers, have been designed specifically for removal of sediments
in large-area, shallow, flat cuts. These buckets also incorporate features to minimize sediment
resuspension and to monitor the precision of removal operations. The Cable Arm concept has been
used on several remedial projects in the US and Canada, and the European Horizontal Profiler has
now undergone its initial US demonstration at New Bedford Harbor (see Chapter 5 and Appendix
A). Based on these experiences, it is concluded that the shallow removal work called for under this
alternative can be efficiently accomplished as a result of ongoing innovations in the design of
excavators and associated auxiliary equipment.
8-109 TAMS

Buckets such as the Cable Arm and the Horizontal Profiler have been specifically designed
to minimize sediment resuspension. Furthermore, beyond the design features that have been
incorporated into the equipment, it is also possible to impose controls on removal operations (e.g.,
increased cycle time) so that further reductions in sediment resuspension can be attained. An
analysis of the short-term water quality implications of using a modern environmental bucket are
presented in Appendix E. The analysis indicates that rates of resuspension expected from the newestgeneration of mechanical equipment are well below those reported in the technical literature as
recently as a few years ago regarding mechanical dredging operations. It is concluded, given the
design features of the new generation of mechanical dredging equipment and the potential to further
limit resuspension by operational controls, that minimal downstream impact will be observed during
removal work (see Appendix E). The estimated Tri-f- PCB loads due to resuspension from
mechanical dredging operations is 48 kg (about 7 kg/yr) over the entire Upper Hudson River for the
seven-year period. This value should be compared to the estimated release of Tri+ PCBs from the
sediments during the remediation period in the absence of remediation (637 kg or about 91 kg/yr for
No Action, and 383 kg or about 55 kg/yr for MNA from River Section 1 alone). Therefore, an
alternative based on mechanical removal of targeted sediments is environmentally feasible.
Hydraulic Dredging Equipment
Details on the hydraulic dredging concept are presented in Appendix H. This concept
indicates that one suction dredge outfitted with a cutterhead can remove the targeted sediments in
River Sections 1 and 2 in about five years. Given the limitations on slurry line length described in
Appendix H, it wil l also be necessary to employ several mechanical dredges for removal operations
in River Section 3. The hydraulic and mechanical dredges required for this alternative are either
commercially available or can be fabricated for this project.
Hydraulic dredging efficiency (and resuspension rates) may be negatively affected when
shallow removal cuts are attempted. Since the REM-0/0/3 alternative targets sediments where the
depth of contamination is one foot, it has been assumed in this analysis (see Appendix H) that two
feet of removal wi l l occur in these areas to avoid the impracticality of a one foot cut. Thus, an
additional 90,000 cubic yards of uncontaminated sediment will be dredged under the REM-0/0/3
alternative to accommodate limitations of the hydraulic equipment. While this results in a higher
8-110 TAMS
estimated cost, the trade-off is warranted for engineering practicality. From the perspective of
removing targeted sediments, use of the selected hydraulic technology is considered feasible.
Hydraulic dredge designs have undergone substantial modifications in response to the need
to reduce sediment resuspension and the need to conduct removal operations as precisely as possible.
It is expected that continuing improvements will be made to cutterhead and inlet pipe geometry,
control of the cutterhead swing, and the geometry of shrouds added for resuspension control. An
analysis of sediment resuspension rates expected during operation of a modern suction dredge is
presented in Appendix E. The estimated Tri+ PCB loads due to resuspension from hydraulic
dredging operations is 29 kg (about 4 kg/yr) over the entire Upper Hudson River for the seven-year
period. This value should be compared to the estimated release of Tri+ PCBs from the sediments
during the remediation period in the absence of remediation (461 kg or about 92 kg/yr for No Action
and 295 kg or about 59 kg/yr for MN A from River Section 1 alone). Therefore, an alternative based
on hydraulic removal of targeted sediments is environmentally feasible.
Transfer Facilities
Mechanical Dredging
Transfer facilities will be established at two locations to process sediments generated bymechanical removal operations under the REM-0/0/3 alternative. These transfer facilities require
wharf facilities as well as access to an operating rail line. In addition, adequate land area must be
available to process incoming sediments and to load the processed sediments into rail cars.
Development of the two transfer operations, one at a location adjacent to River Section 1 and one
at a southern location near Albany, is considered technically feasible. While the availabil i ty of
suitable locations adjacent to River Section 1 is limited, locations do exist where such operations can
potentially be established. In the Port of Albany area there are a number of materials handling
operations that can be configured to serve as sediment handling and processing facilities.
oo~4•J00
8 - 1 1 1 TAMS
Hydraulic Dredging
Transfer facilities will be established at two locations to process sediments generated byhydraulic removal operations under this alternative. These transfer facilities require wharf facilities
as well as access to an operating rail line. In addition, adequate land area must be available to
process incoming sediments and to load the processed sediments into rail cars. Development of the
two transfer operations, one at a location adjacent to River Section 1 and one at a southern location
near Albany, is considered technically feasible.
While the availability of suitable locations adjacent to River Section 1 is limited, locations
do exist where transfer operations can potentially be established. Under the hydraulic dredging
option, land area requirements at the northern transfer facility are somewhat more extensive than is
the case when mechanical dredges are used. This is a consequence of the need to process (dewater)
incoming sediment slurry at the rate of approximately 8,000 gpm. While the additional land area
required for slurry processing (perhaps several acres) somewhat complicates establishing a transfer
facility adjacent to River Section 1, it is expected that a location can be identified for this purpose.
With regard to a transfer facility in the Port of Albany vicinity, it is expected that a location with
existing wharf facilities and rail access can be found along the industrial waterfront zone.
Barge and Towboat Operations
Mechanical Dredging
Considerable use of barges and towboats wil l be necessary to implement this alternative.
Barges wi l l be needed to haul dredged sediments to the northern and southern transfer faci l i t ies and
to place backfill in the river at the completion of removal operations. Based on preliminary
information received from the New York State Canal Corporation, it appears that movement of
loaded barges through the Champlain Canal will be feasible, provided that some navigational
dredging is accomplished in the early stages of remedial work. An estimate of the quantity of
material that must be removed to enable barges loaded with approximately 1,000 tons to move
through the canal system has been made. Costs for this additional removal work have been included
in the overall cost of the alternative. Thus, from the standpoint of available draft, movement of
8-112 400779 TAMS

barges and towboats from the work site to the transfer facilities is considered technically feasible.
Other clearance and operating restrictions imposed by the canal system are not expected to preclude
accomplishing the program.
Hydraulic Dredging
Considerable use of barges and towboats will be necessary to implement this alternative.
Barges will be needed to haul dewatered sediments from the northern to the southern transfer
facilities and to haul mechanically dredged sediments directly to the southern transfer facility. Based
on preliminary information received from the New York State Canal Corporation, it appears that
movement of loaded barges through the Champlain Canal will be feasible provided that some
navigational dredging is accomplished in the early stages of remedial work. An estimate of the
quantity of material that must be removed to enable barges loaded with approximately 1,000 tons)
to move through the canal system has been made. Costs for this additional removal work have been
included in the overall cost of the alternative. Thus, from the standpoint of available draft,
movement of barges and towboats between transfer facilities is considered technically feasible.
Other clearance and operating restrictions imposed by the canal system are not expected to preclude
accomplishing the program.
Transportation and Disposal
Mechanical Dredging
Rail is the principal transportation mode considered in the FS for shipping dredged sediments
out of the Hudson Valley. Although barging may be a link in the transportation scheme, barge
transport has been considered in this FS only in association with beneficial use of dredged sediments.
Under the REM-0/0/3 alternative, approximately 16 carloads of sediment would be processed at the
northern transfer facility each day and approximately 30 carloads at the southern transfer facility.£*
It is expected that this level of rail activity can be accommodated in the Upper Hudson River area, oogiven the resources of the two Class I railroads that serve the region. ^
8-113 TAMS
As explained in Appendix E, adequate landfill capacity with rail access exists to manage
Hudson River sediments. This includes TSCA-permitted landfill capacity and capacity for non-
TSCA materials. The considerable transportation distance to these facilities affects overall
alternative costs but not the technical feasibility of landfill disposal.
Hydraulic Dredging
Rail is the principal transportation mode considered for shipping hydraulically dredged
sediments out of the Hudson Valley. Although barging may be a link in the transportation scheme,
barge transport has been considered in this FS only in association with beneficial use of dredged
sediments. Under the REM-0/0/3 alternative, when hydraulic dredging operations are in progress,
approximately 16 carloads of sediment would be processed at the northern transfer facility each day
and approximately 34 carloads at the southern transfer facility, a slightly higher total (50 carloads
per day, as opposed to 46) than the estimate for the mechanical dredging option. It is expected that
this level of rail activity can be accommodated in the Hudson Valley, given the resources of the two
Class I railroads that serve the region.
As explained in Appendix E, adequate landfill capacity with rail access exists to manage
Hudson River sediments. This includes TSCA-permitted landfill capacity and capacity for non-
TSCA materials. The considerable transportation distance to these facilities affects overall
alternative costs but not the technical feasibility of landfill disposal.
Administrative Feasibility
For the REM-0/0/3 alternative, it is expected that the two transfer facilities, both constructed
on land adjacent to the river, wi l l be considered "on-site" for the purposes of the permit exemption
under CERCLA Section 121(e), although any such facilities wil l comply with the substantive
requirements of any otherwise necessary permits. Operations under this alternative will have to be
performed in conformance with substantive requirements of regulatory programs implemented by
USAGE under Section 10 of the Rivers and Harbors Act and Sections 401 and 404 of the CWA. In
addition, discharges during remediation wi l l conform to NYS regulations related to maintenance of
8-H4 400781 TAMS

Hudson River water quality. Backfilling and habitat replacement will be implemented in accordance
with federal and state ARARs.
It is expected that contract documents for this alternative will contain substantial restrictions
on construction activity including controls on the types of dredging and capping equipment to be
used, restrictions on the speed of operations, constraints on barge filling practices, and controls on
temporary storage of contaminated dredge spoils. Construction activities will also have to be
coordinated with the Canal Corporation, which operates the locks on the Upper Hudson River from
May through November. Finally, requirements of other regulatory programs will be incorporated
as necessary on the basis of information developed during remedial design.
Availability of Services and Materials
Mechanical Dredging
This section details the availability of services and materials needed to implement the REM-
0/0/3 alternative using mechanical dredges.
Dredges
It is expected that mechanical dredging equipment can be obtained as needed for the REM-
0/0/3 alternative.
Barges and Towboats
Commercial activity on the Champlain Canal has all but ceased. Therefore, it is unl ikely that
the full complement of towboats and barges is available in the immediate project vicinity to conduct
the required removal operations. Procurement of towboats and barges will require advance planningi^
and may entail fabricating some equipment. oo^o00to
8-115 TAMS

Processing and Stabilization Equipment
The principal components of the sediment stabilization system are silos, hoppers, conveyors,
and pug mills. A system will be erected at both the southern and northern transfer facilities to
process mechanically dredged sediments. The stabilization equipment can be purchased from a
number of manufacturers and suppliers and is considered to be available for purposes of the REM-0/0/3 alternative.
Cement or Substitute
The demand for and, therefore, the availability of Portland cement varies with market
conditions. During mid-2000 demand was high and obtaining adequate supplies in the Hudson
Valley could have been a problem. Substitutes for cement (cement kiln dust or fly ash) are generally
available, usually at substantially reduced costs in comparison to Portland cement. The utility and
cost-effectiveness of these substitutes will need to be demonstrated via bench scale tests. Since there
is likely to be a number of options available for processing dredged sediments (see Appendix E), it
is concluded here that the availability of Portland cement (or lack thereof) will not prevent
processing and off-site disposal of dredged sediments.
Rail Cars
The availability of rail cars fluctuates with the state of the economy. Since the REM-0/0/3
alternative is a relatively long-term project of about five years, and substantial planning wi l l take
place prior to construction, it is expected that rail cars can be obtained w i t h i n the cost parameters
used in this FS.
Landfill Capacity
The REM-0/0/3 alternative generates about 45 percent more material requiring disposal than
REM-3/ 10/Select. However, based on a survey of existing permitted TSCA and non-TSCA landfills
(see Appendix E), it is concluded that adequate landfill capacity with rail access exists for disposal
of the contaminated sediments.
8-116 400*783 JAMS
Hydraulic Dredging
This section details the availability of services and materials needed to implement the REM-
0/0/3 alternative using a hydraulic dredging system in River Sections 1 and 2 and mechanical
dredges in River Section 3.
Dredges
It is expected that the hydraulic and mechanical dredging equipment required to implement
the REM-0/0/3 alternative is either commercially available or can be fabricated as necessary.
Barges and Towboats
Commercial activity on the Champlain Canal has all but ceased. Therefore, it is unlikely that
the full complement of towboats and barges is available in the immediate project vicinity to conduct
removal operations. Procurement of towboats and barges will require advance planning and may
entail fabricating some equipment.
Dewatering Equipment
Incoming slurry generated by the hydraulic dredging operations (about 8,000 gpm on average
pumped to the northern transfer facility) will be processed by a series of hydrocyclones, flocculation
and settling tanks, and belt presses to dewater the dredged sediments prior to off-site shipment (see
Appendix E). This equipment can be purchased from a number of manufacturers and suppliers and
is considered to be available for this FS.
Processing and Stabilization Equipment
The principal components of the sediment stabilization system are silos, hoppers, conveyors, £o
and pug mills. This system will be erected at the southern transfer facility to process mechanically »Joo
dredged sediments coming from River Section 3. The equipment can be purchased from a number *
of manufacturers and suppliers and is considered to be available for this FS.
8-117 TAMS

Cement or Substitute
The demand for and, therefore, the availability of, Portland cement varies with market
conditions (mechanically dredged sediments would be stabilized under this alternative). During mid-2000 demand was high and obtaining adequate supplies in the Hudson Valley could have been a
problem. Substitutes for cement (cement kiln dust or fly ash) are generally available, usually at
substantially reduced costs in comparison to Portland cement. The utility and cost-effectiveness of
these substitutes will need to be demonstrated through bench scale tests. Since there is likely to be
a number of options available for processing dredged sediments (see Appendix E), it is concluded
here that the availability of Portland cement (or lack thereof) will not prevent processing and off-site
disposal of dredged sediments.
Rail Cars
The availability of rail cars fluctuates with the state of the economy. Since the REM-0/0/3
alternative is a relatively long-term project of about seven years duration, and substantial planning
will take place prior to initiating construction, it is expected that rail cars can be obtained within the
cost parameters used in this FS.
Landfill Capacity
This alternative generates about 45 percent more material requiring disposal than does the
REM-3/10/Select alternative. However, based on a survey of existing permitted TSCA and non-
TSCA landfills (see Appendix E), it is concluded that adequate landf i l l capacity with rail access
exists for disposal of the contaminated sediments.
8.6.2.7 Cost
A summary of the details of the cost estimate for the REM-0/0/3 alternative is given in
Tables 8-14a, 8-14b, and 8-14c. Table 8-14a presents the summary for mechanical dredging with
the disposal of stabilized dredged materials at both TSCA and non-TSCA landfills. Table 8-14b
presents the summary for the option where non-TSCA material is utilized for beneficial purposes.
8-118 400785 TAMS

Table 8-14c presents the summary for optional use of hydraulic dredging with the disposal of
dredged materials at both TSCA and non-TSCA landfills. The estimated net present worth costs of
this alternative, calculated at a 7 percent discount rate, are approximately $570 million for
mechanical dredging and landfill disposal, $496 million for mechanical dredging and beneficial use,
and $550 million for hydraulic dredging and landfill disposal.
Capital Cost
Since the construction will be performed over a seven-year period, capital costs will vary on
an annual basis. The estimated total capital costs for this alternative are about $929 million for
mechanical dredging and landfill disposal, $806 million for mechanical dredging and beneficial use,
and $896 million for hydraulic dredging and landfill disposal. The estimated present worth of the
capital costs for this alternative is approximately $556 million for mechanical dredging and landfill
disposal, $483 million for mechanical dredging and beneficial use, and $536 million for hydraulic
dredging and landfill disposal. I
O&M Costs
Due to the varying frequency of different elements of the monitoring program and the five-
year reviews, O&M costs will vary on an annual basis. The estimated annual average O&M costs
for this alternative, which consist of the monitoring costs, the periodic cost of the modeling, and the
five-year reviews, are about $3.35 million for all three options. These costs have been estimated for
a ten-year period. The estimated present worth of the O&M costs for this alternative is about $ 12.5
million for mechanical dredging and landfill disposal or beneficial use, and S I3 .1 mil l ion for
hydraulic dredging and landfi l l disposal. (The last figure is higher because, based on productivity
estimates for the selected dredge, construction for the hydraulic dredging option may be able to be
completed sooner.)
oo^j00
8-119 TAMS

n65•anso
400787

9. COMPARATIVE ANALYSIS AND COST SENSITIVITY ANALYSES
This chapter provides an overall comparison of the five remedial alternatives analyzed in
detail in Chapter 8, using the seven NCP criteria (Sections 9.1 through 9.7). The comparative
analysis encompasses the two threshold criteria and the five balancing criteria. The two modifying
criteria of state acceptance and community acceptance will be evaluated in USEPA's ROD. For the
three active remedial alternatives, a comparison of the impacts of managing the non-TSC A-regulated
dredged materials (beneficial use versus landfill disposal) is also presented where this distinction
is relevant. In addition, this chapter also compares the impact on relevant criteria of mechanical
dredging versus hydraulic dredging options for the two removal alternatives.
A discussion of the sensitivity of the cost estimates for the three active remedial alternatives
to various factors (e.g., the areas targeted for remediation and the assumed threshold PCB
concentration for characterizing the removed sediments into TSCA-regulated and non-TSCA-
regulated categories) is presented in Section 9.8. The sensitivity of the cost estimates for the capping
with dredging alternative to a reduction in the cap thickness is examined and evaluated in this
section. The sensitivity of the cost estimates for the two removal alternatives to the depth of
sediments targeted for removal is also included in this section.
9.1 Overall Protection of Human Health and the Environment
This evaluation criterion provides a final assessment as to whether each alternative
adequately protects human health and the environment. Relative reductions in risk for each remedial
alternative as compared to the No Action and Monitored Natural Attenuation alternatives are
discussed below. Consideration of the impacts of the upstream boundary concentration is also
discussed.
9.1.1 .Overall Protection of Human Health
Overall protection of human health was evaluated in two primary ways:o-j0000
9-1 TAMS

• The time that it would take under each of the alternatives to reach the fish PRO and the other
target concentrations, and
• The relative reduction in cancer risks and non-cancer health hazards under the five remedial
alternatives.
9.1.1.1 Time to Reach Fish Target Levels
The fish PRO is 0.05 ppm PCBs (wet weight) in fillet. In addition, USEPA considered a
target concentration of 0.2 ppm PCBs (wet weight) in fillet based on one fish meal per month, and
a target concentration of 0.4 ppm, based on the average (CT) consumption rate of one fish meal
every two months. The target concentrations correspond to points at which the fish consumption
advisories might be relaxed from the current "eat none" recommendation in the Upper Hudson River.
The following table shows the time required under each of the alternatives to reach the fishconsumption PRO and target concentrations.
Years to Reach PCB Target Concentration in FishAveraged Over Entire Upper Hudson River
Alternative
No Action *
MNA*
CAP-3/ 10/Select
REM-3/10/Select
REM-0/0/3
0.05 ppm PRO
>67
>67
>67
>67
>67
0.2 ppm (1 meal/ month)target
>67
60 to >67
35
35
26
0.4 ppm (1 meal/ 2months) target
>67
34 to >67
21
20
11
*Both No Action and MNA results are calculated as a range, with the first value representing the base case, and thesecond value representing the upper bound. For No Action, none of the fish target concentrations are achieved withinthe modeled period for either the base case or upper bound; the same limitation applies to MNA for the 0.05 ppm PRO.Therefore, only a single value is shown for these entries on the table.
The overall protection of human health achieved by the active alternatives is considerably
more than that achieved by the No Action and MNA alternatives. For the CAP-3/10/Select, REM-
3/10/Select, and REM-0/0/3 alternatives, risk is reduced through removal or capping with dredging
9-2 400789 TAMS
of contaminated sediments in River Sections 1 and 2, and removal of contaminated sediments in
River Section 3, followed by Monitored Natural Attenuation.
In River Section 3, all of the active remediation alternatives meet the PRG target
concentration of 0.05 ppm PCBs between the years 2050 and 2051 (which is 40 to 43 years after
construction is complete, depending on the alternative); the MNA alternative reaches it in the year
2059; and the No Action alternative does not meet the PRG within the modeling time frame. As a
result, the PRG of 0.05 ppm also is expected to be attained in the majority of the Lower Hudson
River, due to the lower initial concentration of PCBs in the Lower Hudson compared to the Upper
Hudson. Due to the continuing Tri+ PCB load of 2 ng/L assumed after implementation of the source
control action in the vicinity of the GE Hudson Falls plant, the PCB concentration in fish averaged
over the Upper Hudson is expected to be reduced to a range of 0.09 to 0.14 ppm, which is slightly
above the PRG of 0.05 ppm.
The protectiveness of the active remedial alternatives is further enhanced through
implementation of institutional controls, such as the fish consumption advisories. The modeled
results suggest that the advisories could be relaxed somewhat at various points in the future for the
different river sections. Specifically, the 0.2 ppm target concentration is met in River Section 2 in
2044 for CAP-3/10/Select (about 36 years after remediation is complete), 2040 for REM-3/10/Select,
and 2034 for REM-0/0/3. In comparison, it is met in 2061 for the base MNA alternative and is not
met withing the modeled time frame for the estimated upper bound. The 0.2 ppm target
concentration is not met within the modeled time frame for No Action.
For the CAP-3/10/Select alternative, the modeling projects that the target concentration of
0.4 ppm is attained in River Section 1 within 16 years of active remediation, within 15 years for
REM-3/10/Select, and within 3 years for REM-0/0/3. The target of 0.2 ppm, protective of an adult
who consumes one fish meal per month, is attained in River Section 2 within 32 years of active
remediation. These time periods are significantly shorter than the time periods projected for
attaining the 0.4 ppm target under either the No Action alternative or the MNA alternative.
oojvoo
9-3 TAMS

9.1.1.2 Relative Reductions in Cancer Risks and Non-Cancer Health Hazards
The model output years included in the exposure calculations were identified on a river
section basis using different long-term period starting dates, depending on the construction schedule
for each remedial alternative. The long-term exposure period was considered to start immediately
after a one-year equilibration period beyond the completion of work in a given river section. For
example, if the construction schedule for an alternative requires three years to complete in River
Section 1, given a start date in 2004, the construction would be complete at the end of 2006,
equilibration would occur over the year 2007, and the long-term period for calculation of cancer risks
and non-cancer health hazards would start on January 1, 2008.
Cancer risks and non-cancer health hazards for the entire Upper Hudson River (RMs 189 to
154) and for each section of the river under the active remedial alternatives were compared
separately (using the appropriate time frame) to the cancer risks and non-cancer health hazards under
the No Action and MNA alternatives, including their estimated upper bounds, to estimate the
reduction in cancer risks and non-cancer health hazards achieved by each alternative. Non-cancer
health hazard and cancer risk reductions predicted for the adult angler (both RME and CT) are
presented on Tables 7-6a through 7-6d (for non-cancer health hazards averaged over the entire Upper
Hudson River and calculated for each river section individually) and on Tables 7-7a through 7-7d
(for cancer risk). The underlying non-cancer health hazard index and cancer risk data are presented
graphically in Figures 7-1 through 7-4.
The fish concentration predictions used are the species-weighted averages, based on relative
species consumption reported in the 1991 state-wide New York angler survey (Connelly et al.,
1992). The fish consumption rates and time periods assumed for exposure are the same as those
utilized in the Revised HHRA (USEPA 2000p) and summarized in Chapter 7. Because the PCB
concentration in fish declines for the projected 70-year period covered by this FS, the average
concentration (over time) actually declines as the exposure period increases. Thus, the average
concentration and, by extension, the average PCB intake in terms of mg/kg-day, in a 7-year exposure
period is actually greater than the average concentration over, for example, 12 years. As a result of
the declining trend in PCB concentration in fish over time, the average daily dose decreases as the
exposure duration increases.
9'4 400791 TAMS
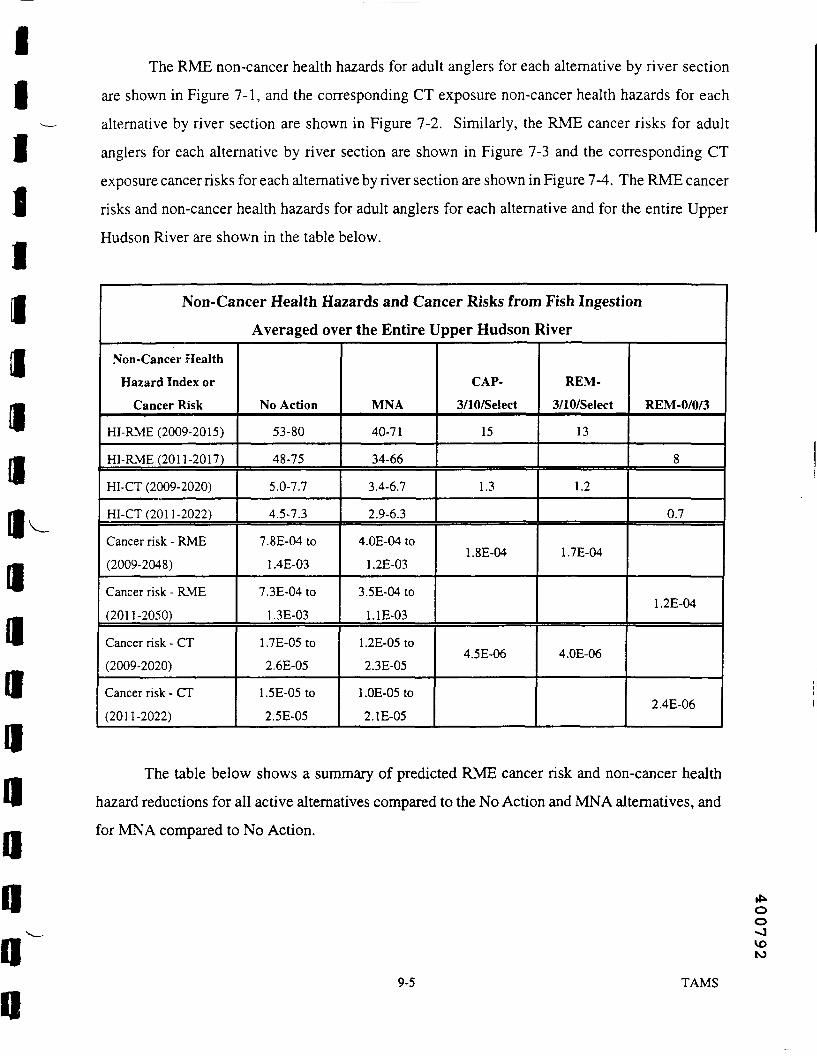
The RME non-cancer health hazards for adult anglers for each alternative by river section
are shown in Figure 7-1, and the corresponding CT exposure non-cancer health hazards for each
alternative by river section are shown in Figure 7-2. Similarly, the RME cancer risks for adult
anglers for each alternative by river section are shown in Figure 7-3 and the corresponding CT
exposure cancer risks for each alternative by river section are shown in Figure 7-4. The RME cancer
risks and non-cancer health hazards for adult anglers for each alternative and for the entire Upper
Hudson River are shown in the table below.
Non-Cancer Health Hazards and Cancer Risks from Fish IngestionAveraged over the Entire Upper Hudson River
Non-Cancer Health
Hazard Index or
Cancer Risk
HI-RME (2009-2015)
HI-RME(2011-2017)
HI-CT (2009-2020)
HI-CT(2011-2022)
Cancer risk - RME
(2009-2048)
Cancer risk - RME
(2011-2050)
Cancer risk - CT
(2009-2020)
Cancer risk - CT
(2011-2022)
No Action
53-80
48-75
5.0-7.7
4.5-7.3
7.8E-04 to
1.4E-03
7.3E-04 to
1.3E-03
1.7E-05to
2.6E-05
1.5E-05to2.5E-05
MNA
40-71
34-66
3.4-6.7
2.9-6.3
4.0E-04 to
1.2E-03
3.5E-04 to1. IE-03
1.2E-05 to
2.3E-05
1.0E-05to2. IE-05
CAP-3/10/Select
15
1.3
1.8E-04
4.5E-06
REM-3/10/Select
13
1.2
1.7E-04
4.0E-06
REM-0/0/3
8
0.7
1.2E-04
2.4E-06
The table below shows a summary of predicted RME cancer risk and non-cancer health
hazard reductions for all active alternatives compared to the No Action and MNA alternatives, and
for MNA compared to No Action.
oo
to
9-5 TAMS

Summary of Cancer Risk and Non-Cancer Health Hazard Reductions
Alternative
MNA
CAP-3/ 10/Select
REM-3/10/Select
P EM-0/0/3
Compared to No Action
UpperHudson& RiverSection 1
<2 to 4-fold
4108-fold
4108-fold
a t o l l -fold
RiverSection 2
<2 to 4-fold
4109-fold
5 to 11-fold
7 to 16-fold
RiverSection 3
<2 to <3-fold
<2 103-fold
<2 to 3-fold
3 to 4-fold
Compared to MNA
UpperHudson& RiverSection 1
2106-fold
2107-fold
StoP-fold
RiverSection 2
StoP-fold
3 to 11-fold
4 to 16-fold
RiverSection 3
<2-fold
<2-fold
<2-fold
Compared to the estimated upper bound of No Action, the REM-0/0/3 alternative achieves
an order of magnitude (i.e., 10-fold) or more reduction in RME cancer risks and non-cancer health
hazards in the Upper River as a whole, and in River Sections 1 and 2 individually. Predicted
reductions in River Section 3 are smaller (approximately three-fold) since sediments included in
target areas make up a much smaller fraction of the overall surface area of this section and there is
much greater dilution due to tributary flows. When compared to the MNA base forecast, thereductions for the REM-0/0/3 alternative in River Sections 1 and 2 and for the entire Upper River
are on the order of three-to-five fold. Reductions for River Section 3 are less than two-fold.
Generally speaking, the more extensive the alternative, the greater the reduction in risk orhealth hazard. Based on modeling assumptions and considering the average for the Upper Hudson
as a whole, non-cancer health hazard reduction under the REM-3/10/Select alternative comparesincrementally favorably to that for CAP-3/10/Select (i.e., health hazard reductions are within a few
percentage points of each other for these two alternatives). As shown on Tables 7-6a through 7-6d,
health hazard reduction under the REM-0/0/3 alternative represents approximately a 10-percentage-point advantage over the REM-3/10/Select alternative. Cancer risk reductions presented on Tables7-7a through 7-7d show a similar, though generally more tightly bounded, trend for the equivalentcomparisons. For example, the difference in cancer risk reduction between the REM-0/0/3
9-6 TAMS
400793
alternative and REM-3/10/Select is only about five percentage points. On the other hand, the
differences between comparisons to No Action and MNA are somewhat greater for cancer risk
reduction than for non-cancer health hazard reduction.
Since the assumed (separate) upstream source control component is the same for all activealternatives and for MNA, greater extensiveness in sediment remediation yields greater benefits in
health hazard reduction and in cancer risk reduction. These increases in benefits, however, are notlinearly proportional to increases in the volume or area of sediment remediated. Since these
parameters are directly related to cost, it follows that similar increments in risk reduction will come
at greater and greater cost, requiring tradeoffs based on analysis of other criteria.
9.1.2 Overall Protection of the Environment
Ecological risks were calculated for each of the three river sections for the river otter and the
mink. The river otter is a piscivorous mammal and was the receptor found to be at greatest risk inthe Upper Hudson River in the Revised ERA (USEPA, 2000q), due to the high proportion of fish
in its diet. The mink is a piscivorous mammal and is known to be sensitive to PCBs. The long-term
exposure period for the river otter and mink is considered to start immediately after a one-year
equilibration period beyond the completion of work in a given section, as was assumed for human
health calculations. Risks to other ecological receptors are assumed to be equal to or less than thosecalculated for river otter and mink. Moreover, risks to ecological receptors in the Lower Hudson
River are assumed to be equal to or less than those calculated for River Section 3 based on lower
concentration of PCBs in the Lower Hudson River.
9.1.2.1 River Otter
River otters were assumed to consume a diet consisting entirely of PCB-contaminatedlargemouth bass. The TQs calculated for the river otter are based on the LOAEL and NOAEL TRVsof 0.04 mg PCBs/kg/day and 0.004 mg PCBs/kg/day, respectively. The NOAEL and LOAEL riverotter toxicity quotients are shown for each alternative in Figures 7-5 and 7-6, respectively. The ^
oNOAEL and LOAEL ecological toxicity quotients calculated for the river otter for each of the three °
river sections are shown in the table below. ^
9-7 TAMS

Ecological Toxicity Quotients - River Otter(Average of 25 -Year Time Frame)
No Actionstart year
2008
No Actionstart year
2009
MNAstart year
2008
MNAstart year
2009
CAP-3/10/Select
REM-3/10/Select
REM-0/0/3
River Section 1 (RM 189) Modeling time frame is 2008-2032 for CAP-3/1 0/Select and REM-3/10/Select and 2009-2033 for REM-0/0/3
LOAEL
NOAEL
24-30
240-300
23-29
230-290
9.7-15
97-150
9.1-14
91-140
5.3
53
5.2
52
3.7
37
River Section 2 (RM 184) Modeling time frame is 2009-2033 for CAP-3/ 10/Select and REM-3/10/Select and 2011-2035 for REM-0/0/3
LOAEL
NOAEL
14-27
140-270
13-26
12C 260
9.2-24
92-240
7.8-23
78-230
3.5
35
2.9
29
1.8
18
River Section 3 (RM 154) Modeling time frame is 2010-2034 for CAP-3/10/Select and REM-3/ 10/Select and 2012-2036 for REM-0/0/3 ;
LOAEL
NOAEL
2.4
24
2.3
23
1.2
12
1.1
11
0.87
8.7
0.86
8.6
0.62
6.2
Notes:TQs above the target level of 1 .0 are shown in boldface type.
Range of years calculated using bounding estimates are presented for the No Action and MNA alternatives.
Toxicity quotients calculated for the river otter exceed one for LOAEL and NOAELcomparisons in River Sections 1 and 2 at RMs 189 and 184 and for all NOAEL comparisons in RiverSection 3 at RM 154. In River Section 3, LOAEL TQs are below one for all active remediationalternatives, but exceed one for the MNA and No Action alternatives.
A TQ of one is not reached by 2067 (the end of the modeling period) on a LOAEL orNOAEL basis in River Section 1 or on a NOAEL basis in River Sections 2 and 3. In River Section
2, as shown on Table 7-8, on a LOAEL basis a TQ of one is reached in 35 to 52 years with activeremediation and not for more than 59 years under the No Action and MNA alternatives. In RiverSection 3, on a LOAEL basis a TQ of one is reached in 5 to 8 years with active remediation, in 14years under the MNA alternative, and not for more than 58 years under the No Action alternative.
9-8 TAMS400795

The table below shows a summary of predicted reductions in river otter TQs for all active
alternatives compared to the No Action and MNA alternatives for the modeled time periods
presented on the table above, and for MNA compared to No Action. Since the NOAEL is calculated
as an order of magnitude higher than the LOAEL in all cases, the reductions for both NOAEL and
LOAEL compared to the respective No Action and MNA are the same; therefore only a single result
is presented in each case.
Reductions in Ecological Toxicity Quotients - River OtterMNA CAP-3/10/Select REM-3/10/Select REM -0/0/3
River Section 1 (RM 189)
No Action
MNA
No Action
MNA
2 to 3-fold
l!ft€if?fiit?5 to 6-fold
2 to 3-fold
5 to 6-fold
2 to 3-fold
6 to 8 -fold
2 to 4-fold
River Section 2 (RM 184)
<2 to 3-fold
'•?---;t~."m-f ;\ ;£=¥:*.•' -•-»
4 to 8-fold
3 to 7-fold
4 to~8-fold
3 to 8-fold
7 to 14-fold
4 to 13-fold
River Section 3 (RM 154)
No Action
MNA
2-fold
vistsiMsi3-fold
<2-fold
3-fold
<2-fold
4-fold
2-fold
As may be determined from the table above, reductions in toxicity quotient for the river otter
compared to No Action and MNA vary with extensiveness of the remediation. Reductions for the CAP-
3/10/Select and REM-3/10/Select alternatives are virtually identical, while those for the REM-0/0/3
alternative are higher. All active alternatives show greater risk reductions than. Reductions in RiverSection 2 for the REM-0/0/3 alternative, compared to the estimated upper bounds for both No Actionand MNA, exceed an order of magnitude. Compared against the base case for No Action, risk reduction
decreases with distance downstream for the CAP-3/10/Select and REM-3/10/Select alternatives. This
trend does not consistently hold for other comparisons for River Sections 1 and 2, however. On the other
hand, reductions in River Section 3 are consistently smaller than those upstream, since sedimentsincluded in target areas make up a much smaller fraction of the overall surface area of this section andthere is much greater dilution due to tributary flows.
oo-0
9-9 TAMS
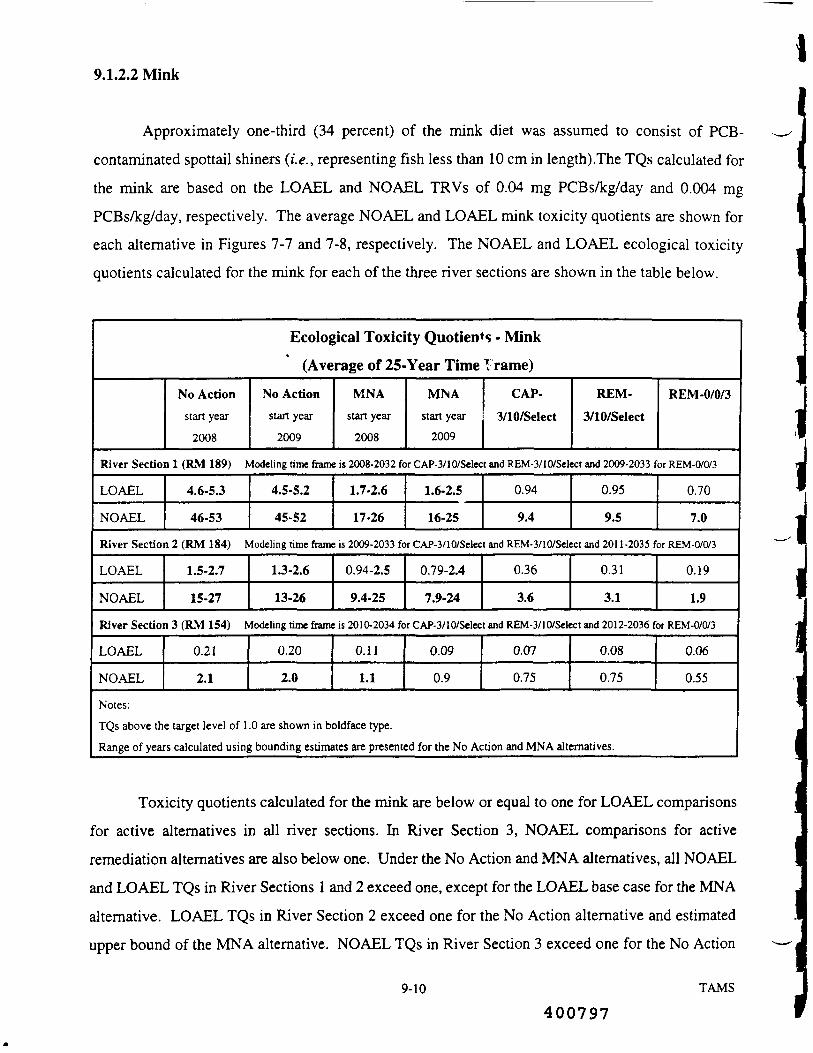
9.1.2.2 Mink
Approximately one-third (34 percent) of the mink diet was assumed to consist of PCB-
contaminated spottail shiners (i.e., representing fish less than 10 cm in length).The TQs calculated for
the mink are based on the LOAEL and NOAEL TRVs of 0.04 mg PCBs/kg/day and 0.004 mgPCBs/kg/day, respectively. The average NOAEL and LOAEL mink toxicity quotients are shown for
each alternative in Figures 7-7 and 7-8, respectively. The NOAEL and LOAEL ecological toxicity
quotients calculated for the mink for each of the three river sections are shown in the table below.
Ecological Toxicity Quotients • Mink«
(Average of 25-Year Time 1 rame)No Action
start year
2008
No Actionstart year
2009
MNAstart year
2008
MNAstart year
2009
CAP-
3/10/SelectREM-
3/10/SelectREM-0/0/3
River Section 1 (RM 189) Modeling time frame is 2008-2032 for CAP-3/1 0/Select and REM-3/10/Select and 2009-2033 for REM-0/0/3
LOAEL
NOAEL
4.6-5.3
46-53
4.5-5.2
45-52
1.7-2.6
17-26
1.6-2.5
16-25
0.94
9.4
0.95
9.5
0.70
7.0
River Section 2 (RM 184) Modeling time frame is 2009-2033 for CAP-3/1 0/Select and REM-3/10/Select and 2011-2035 for REM-0/0/3
LOAEL
NOAEL
1.5-2.7
15-27
1.3-2.6
13-26
0.94-2.5
9.4-25
0.79-2.4
7.9-24
0.36
3.6
0.31
3.1
0.19
1.9
River Section 3 (RM 154) Modeling time frame is 2010-2034 for CAP-3/1 0/Select and REM-3/1 0/Select and 2012-2036 for REM-0/0/3
LOAEL
NOAEL
0.21
2.1
0.20
2.0
0.11
1.1
0.09
0.9
0.07
0.75
0.08
0.75
0.06
0.55
Notes:TQs above the target level of 1 .0 are shown in boldface type.
Range of years calculated using bounding estimates are presented for the No Action and MNA alternatives.
Toxicity quotients calculated for the mink are below or equal to one for LOAEL comparisons
for active alternatives in all river sections. In River Section 3, NOAEL comparisons for activeremediation alternatives are also below one. Under the No Action and MNA alternatives, all NOAELand LOAEL TQs in River Sections 1 and 2 exceed one, except for the LOAEL base case for the MNA
alternative. LOAEL TQs in River Section 2 exceed one for the No Action alternative and estimatedupper bound of the MNA alternative. NOAEL TQs in River Section 3 exceed one for the No Action
9-10 TAMS
400797

alternative, whether starting in the Year 2008 or 2009, and for the MNA alternative starting in the Year
2008.
A TQ of one on a LOAEL basis is reached in two to five years with active remediation in River
Section 1. Under the MNA alternative, a TQ of one is reached in a time frame of 22 years to more than60 years, and under the No Action alternative it is not reached for more than 60 years (the extent of the
modeling period). In River Section 2, a TQ of one on a LOAEL basis is reached before the long-termmodeling period for all active alternatives. Under the base MNA and No Action alternatives, a TQ of
one is reached in 10 and 21 years, respectively, while under the estimated upper bounds for these
alternatives, it is not reached for more than 59 years. Under active remediation in River Section 3, a TQ
of one on a NOAEL basis is reached in four to five years, in 12 years under the MNA alternative, and
in more than 58 years under the No Action alternative.
The table below shows a summary of predicted reductions in Mink TQs for all active alternatives
compared to the No Action and MNA alternatives, and for MNA compared to No Action. Since the
NOAEL is calculated as an order of magnitude higher than the LOAEL in all cases, the reductions for
both NOAEL and LOAEL compared to the associated No Action and MNA are thesame; therefore only
a single result is presented in each case.
Reductions in Ecological Toxicity Quotients - MinkMNA CAP-3/10/Select REM-3/lO/Select REM-0/0/3
River Section 1 (RM 189)
No Action
MNA
2 to 3-fold 5 to 6-fold
2 to 3-fold
5 to 6-fold
2 to 3-fold
6 to 7-fold
2 to 4-fold
River Section 2 (RM 184)
No Action
MNA
<2 to 3-fold 4 to 8-fold
3 to 7-fold
5 to 9-fold
3 to 8-fold
7 to 14-fold
4 to 13-fold
River Section 3 (RM 154)
No Action
MNA
2-fold
tlSI®*BISI?3-fold
<2-fold
3-fold
<2-fold
3-fold
<2-fold oo^Jvo00
9-11 TAMS
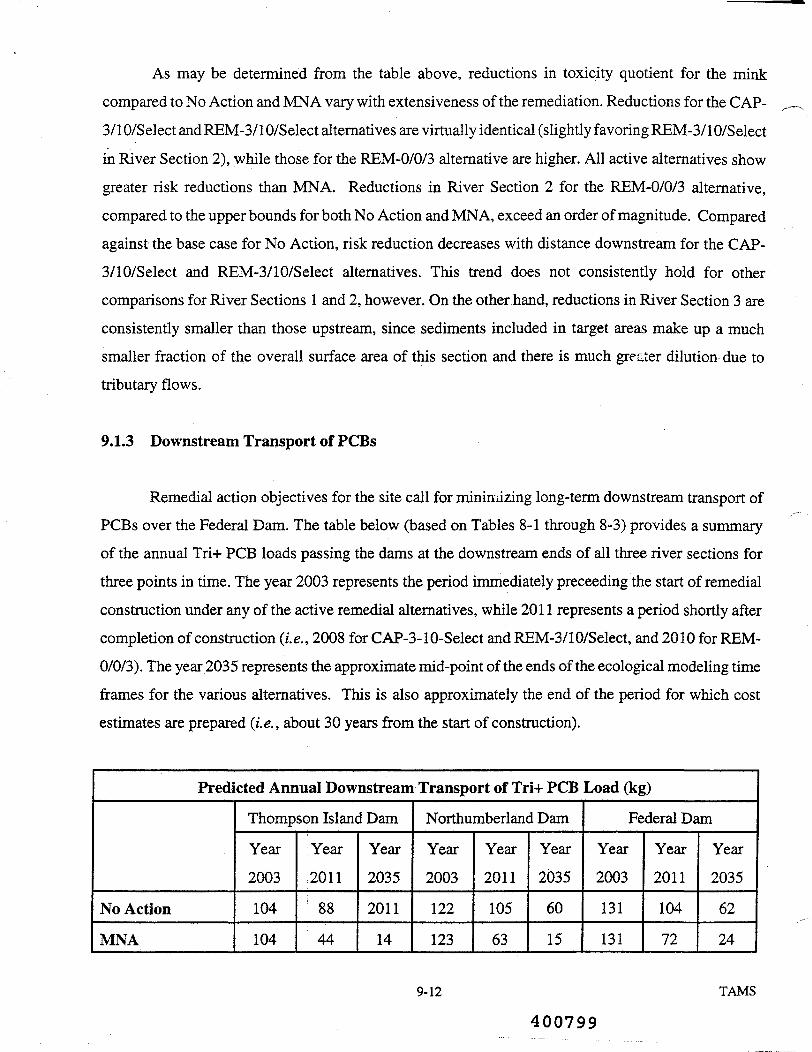
As may be determined from the table above, reductions in toxicity quotient for the minkcompared to No Action and MNA vary with extensiveness of the remediation. Reductions for the CAP-
3/10/Select and REM-3/10/Select alternatives are virtually identical (slightly favoring REM-3/10/Select
in River Section 2), while those for the REM-0/0/3 alternative are higher. All active alternatives showgreater risk reductions than MNA. Reductions in River Section 2 for the REM-0/0/3 alternative,compared to the upper bounds for both No Action and MNA, exceed an order of magnitude. Comparedagainst the base case for No Action, risk reduction decreases with distance downstream for the CAP-3/10/Select and REM-3/10/Select alternatives. This trend does not consistently hold for othercomparisons for River Sections 1 and 2, however. On the other hand, reductions in River Section 3 areconsistently smaller than those upstream, since sediments included in target areas make up a muchsmaller fraction of the overall surface area of this section and there is much greater dilution due totributary flows.
9.1.3 Downstream Transport of PCBs
Remedial action objectives for the site call for minimizing long-term downstream transport ofPCBs over the Federal Dam. The table below (based on Tables 8-1 through 8-3) provides a summaryof the annual Tri+ PCB loads passing the dams at the downstream ends of all three river sections forthree points in time. The year 2003 represents the period immediately preceeding the start of remedialconstruction under any of the active remedial alternatives, while 2011 represents a period shortly aftercompletion of construction (i.e., 2008 for CAP-3-10-Select and REM-3/10/Select, and 2010 for REM-0/0/3). The year 2035 represents the approximate mid-point of the ends of the ecological modeling timeframes for the various alternatives. This is also approximately the end of the period for which costestimates are prepared (i.e., about 30 years from the start of construction).
Predicted Annual Downstream Transport of Tri+ PCB Load (kg)
No Action
MNA
Thompson Island Dam
Year
2003
104
104
Year2011
88
44
Year
2035
2011
14
Northumberland Dam
Year2003
122
123
Year
2011
105
63
Year2035
60
15
Federal Dam
Year
2003
131
131
Year2011
104
72
Year
2035
62
24
9-12 TAMS
400799

Predicted Annual Downstream Transport of Tri+ PCB Load (kg)
CAP-3/10/Select
REM-3/10/SeIect
REM-0/0/3
Thompson Island Dam
104
104
104
23
22
14
11
11
9.5
Northumberland Dam
123
123
123
29
27
17
11
11
9.5
Federal Dam
131
131
131
43
42
34
20
20
18
Neither the No Action alternative nor the MNA alternative addresses the scour of PCB-
contaminated sediments associated with one-in-three-year to one-in-five-year flow events from the
Hoosic River in River Section 3. These events have caused resuspension of PCB loading of 18 kg/day,
equivalent to the peak loads at Rogers Island attributed to releases at the Alien Mills structure (USEPA,
1999b). Without addressing PCB-contaminated sediments downstream of the Hoosic River (RM 166),
PCB loads over Federal Dam will likely be higher than indicated by the modeling results. All three active
remedial alternatives address the scour of PCB-contaminated sediments associated with flow events
from the Hoosic River in River Section 3, and are therefore effective in reducing the PCB load over
Federal Dam to the Lower Hudson River, with the REM-0/0/3 alternative being most effective. The
similarity in modeled Tri-i- PCB loads over Federal Dam between the MNA and the active alternatives
by the year 2035 and beyond reflects the fact that all are largely controlled by the value assumed for the
unknown upstream PCB load. Additional Tri+ PCB loads due to resuspension from dredging operations
are estimated to be less than the release estimated from a single 100-year flood event, as discussed insubsection 9.5.3.
9.2 Compliance with ARARs
The chemical-specific ARARs for PCBs in the water column are 0.5 pg/L (500 ng/L) federalMCL; 0.09 |ag/L (90 ng/L) NYS standard for protection of human health and drinking water sources;
1 ng/L federal ambient water criterion for navigable waters; 0.12 ng/L NYS standard for protection of
wildlife; and 0.001 ng/L NYS standard for protection of human consumers of fish.
As shown in Figures 6-33 through 6-37, the first two chemical-specific ARARs for the surface
water are met by all five remedial alternatives, and the remaining three chemical-specific ARARs forthe surface water are not met by any of the five alternatives for the 70-year model forecast period. The
9-13 TAMS
oo00oo
effect of the separate source control NTCRA in the vicinity of the GE Hudson Falls plant is observed
in the difference (separation) between the trajectories for the No Action and MNA alternatives. The
benefits of active remediation of the sediments are readily apparent in the differences in the trajectoriesfor the MNA alternative and those for the active remediation alternatives. As expected, the water qualityis best for the REM-0/0/3 alternative and substantially improved for the CAP-3/10/Select and REM-3/10/Select alternatives, compared to MNA. These differences are most apparent for the first 20 yearsof the forecast period, between 2005 and 2024. However, even in 2067, towards the end of the forecastperiod, there is a very substantial difference between the water quality for the No Action alternative(approximately 30 ng/L at TID and Schuylerville and 10 ng/L at Federal Dam) and the other fouralternatives (approximately 5 ng/L at TID and Schuylerville and 1.7 ng/L at Federal Dam).
Because there is no active remedial action associated with the sediments for the No Action andMNA alternatives, action-specific and location-specific ARARs do not apply. The three active remedialalternatives will comply with action-specific ARARs identified in table 2-2A (e.g., CWA Sections 401and 404; TSCA; Section 3004 of RCRA; Section 10 of the Rivers and Harbors Act; New York StateECL Article 3, Title 3, and Article 27, Titles 7 and 9, and location-specific ARARs listed in table 2-2B(e.g., Endangered Species Act; Fish and Wildlife Coordination Act; Farmland Protection Policy Act;
National Historic Preservation Act; and New York State Freshwater Wetlands Law).
9.3 Long-Term Effectiveness and Permanence
The long-term effectiveness of an alternative is assessed through the following criteria, asevaluated individually in this section:
• Reduction in residual risk;
• Adequacy of controls; and• Reliability of controls.
9.3.1 Reduction of Residual Risk
The No Action andMNA alternatives result in continuation of the degraded condition of surficial
sediments and surface water quality of the Upper Hudson River for several decades (albeit graduallyreduced), especially in River Section 1, regardless of any reduction in the upstream water column
9-14 TAMS
400801
loadings. The long-term transport of PCBs over the Federal Dam and to the Lower Hudson River will
continue indefinitely, although a substantial portion of this transport is due to the assumed upstream
boundary condition; i.e., the PCB load entering the Upper Hudson at Rogers Island. Table 8-3 presents
the Tri+ PCB load over the Federal Dam in 2003 (approximately 130 kg), in 201 1(104 kg), and in 2035
(63 kg) for the No Action alternative. Similarly, this table also presents the Tri+ PCB load over the
Federal Dam in 2003 (approximately 130 kg), in 2011 (72 kg), and in 2035 (24 kg) for the MNA
alternative. In 2035, as a result of the separate source control NTCRA in the vicinity of the GE Hudson
Falls plant, the Tri+ PCB load over Federal Dam is reduced by approximately 62 percent.
For the CAP-3/1 0/Select alternative, residual risk is reduced through capping 207 acres of PCB-
contaminated sediments and removal of 1.73 million cubic yards of sediments containing 33,100 kg
PCBs. For this alternative, Table 8-3 presents the Tri+ PCB load over the Federal Dam in 2003
(approximately 130 kg), in 201 1(45 kg), and in 2035 (20 kg). In 201 1, soon after construction ends, the
CAP-3/ 10/Select alternative results in a 58 percent reduction in the Tri+ PCB load over Federal Dam
compared to the No Action alternative and a 40 percent reduction in the load over Federal Dam
compared to the MNA alternative. After a longer period of time, in 2035, the CAP-3/ 10/Select
alternative results in a 68 percent reduction in the Tri+ PCB load over Federal Dam compared to the No
Action alternative and a 16 percent reduction in the load over Federal Dam compared to the MNA
alternative.
The CAP-3/1 0/Select alternative does not completely eliminate long-term risks for target areas
that are capped. Sediments are removed in areas only to the degree necessary for cap installation and,
in some areas, highly contaminated sediments may be left in place below the cap and backfill.
Anthropogenic or natural processes (e.g., navigation accidents, severe storms, or longer-term changes
in the depositional/erosional regime in a given location) may damage or erode and scour the cap
materials and redistribute PCB-contaminated capped sediments over wider areas of the Upper Hudson
River. Non-routine repair or replacement of large sections of the cap may have to be undertaken if a
breach occurs in a highly contaminated area (e.g., Hot Spot 14 in River Section 1 orHotSpot28 in River
Section 2) due to catastrophic events such as a major flood. Depositional buildup of sediments adjacent
to the cap could shift currents over the cap creating the potential for erosion in an unexpected area.oto
9-15 TAMS
The influence of regional aquifer systems on the hydrologic regime of Upper Hudson River has
not been evaluated. Groundwater level fluctuations can result from a wide variety of hydrologic
phenomena (e.g., groundwater recharge due to seasonal heavy rainfall, or bank-storage effect near the
river) and the subsequent inflow of groundwater may breach the cap in multiple areas and transport
PCBs into the river. During periods of extremely low flow, sections of the cap could be exposed to the
air and a different range of temperatures and other conditions unlike the submerged environment,
resulting in freeze-thaw damage or desiccation cracking.
For the two removal alternatives, a total volume of contaminated sediment from 2.65 million
cubic yards (REM-3/10/Select) to 3.82 million cubic yards (REM-0/0/3), containing a mass of PCBs
from 45,600 kg (REM-3/10/Select) to an estimated mass of more than 63,500 kg (REM-0/0/3) located
in areas from 493 to 964 acres (REM-3/10/Select and REM-0/0/3, respectively) of the Upper Hudson
River will be remediated. Appendix E contains the basis for estimation of mass. For the REM-
3/10/Select alternative, Table 8-3 presents the Tri-i- PCB load over the Federal Dam in 2003
(approximately 130kg), in 2011(42 kg), and in 2035 (20kg). In 2011, soon after construction ends, the
REM-3/10/Select alternative results in a 60 percent reduction in the Tri+ PCB load over Federal Dam
compared to the No Action alternative and a 42 percent reduction in the load over Federal Dam
compared to the MNA alternative. After a longer period of time, in 2035, the REM-3/10/Select
alternative results in a 69 percent reduction in the Tri+ PCB load over Federal Dam compared to the No
Action alternative and a 17 percent reduction in the load over Federal Dam compared to the MNA
alternative.
For the REM-0/0/3 alternative, Table 8-3 presents the Tri+ PCB load over the Federal Dam in
2003 (approximately 130 kg), in 2011(34 kg), and in 2035 (18 kg). In 2011, soon after construction
ends, the REM-0/0/3 alternative results in a 67 percent reduction in the Tri-t- PCB load over Federal Dam
compared to the No Action alternative and a 53 percent reduction in the load over Federal Dam
compared to the MNA alternative. After a longer period of time, in 2035, the REM-0/0/3 alternative
results in a 72 percent reduction in the Tri+ PCB load over Federal Dam compared to the No Action
alternative and a 25 percent reduction in the load over Federal Dam compared to the MNA alternative.
The three active remedial alternatives (CAP-3/10/Select, REM-3/10/Select, and REM-0/0/3) also
rely on natural attenuation processes such as burial by cleaner sediments, bioturbation, biodegradation,
9-16 w_, TAMS400803

dispersion, dilution through advection and recharge, adsorption, and volatilization to further reduce the
concentration of any contaminants that remain after construction is completed. However, modeling
results predict that these three alternatives will not completely achieve the PRGs for the site within the
modeled period, although RAOs are met in part or in full, as discussed in subsections 9.1.1 and 9.1.2.
The limitation in meeting PRGs largely stems from the assumption of the upstream Tri+ PCB load at
Fort Edward (Rogers Island) of 0.0256 kg/day in 2005. Greater achievement of the PRGs is estimated
based on a 0 kg/day assumption. Thus, remediating PCB-contaminated sediment in combination with
control of the upstream load can be expected to achieve more PRGs, and to approach the PRGs faster,
than either approach alone.
9.3.2 Adequacy of Controls
The No Action and MNA alternatives do not provide for engineering controls on the river
sediments. The MNA alternative assumes a separate source control NTCRA in the vicinity of the GE
Hudson Falls plant. As noted previously in Chapter 8, the existing institutional controls, which rely on
voluntary compliance, are not fully adequate in reducing exposure to PCBs due to consumption of
contaminated fish. In addition, institutional controls are inadequate for protection of the environment
(e.g., ecological receptors).
The CAP-3/10/Select alternative provides for dredging of some contaminated sediments in target
areas and placement of an engineered cap over the remaining target areas. Like the MNA alternative,
this alternative also provides for institutional controls, such as the fish consumption advisories. The
REM-3/10/Select and REM-0/0/3 alternatives provide for removal of contaminated sediments in target
areas. These two alternatives also provide for institutional controls, such as the fish consumption
advisories.
The planned post-construction fish, water column, and sediment monitoring program allows for
tracking the natural recovery of the river after remediation is completed. It also provides data to confirm
the need to continue the existing fish consumption advisories and to evaluate the possibility of relaxing *•
the advisories. ooo
9-17 TAMS

9.3.3 Reliability of Controls
Sediment capping, dredging, backfilling and habitat replacement, and off-site disposal/ treatment
of removed sediments are, individually, all reliable and proven technologies. However, for the CAP-
3710/Select alternative, proper design, placement, and maintenance of the cap in perpetuity are required
for its effectiveness, continued performance, and reliability. This presents a challenge for the Upper
Hudson River since the capping concept requires maintenance of nearly 12 miles of long, narrow strips
of cap with a high perimeter-to-surface area ratio. A cap placed in a relatively sheltered embayment or
cove would be easier to maintain, since it would not be subject to the significant variations in river
conditions typical of a river channel. The cap integrity monitoring and maintenance program planned
for the CAP-3/10/Select alternative provides for as reasonably reliable maintenance as could be
expected, if consistently and thoroughly followed. The challenge lies in overcoming the natural human
tendency to relax vigilance as time goes on, especially as the essential rationale for installation of the
cap fades from public consciousness. The fish consumption advisories will continue to provide some
measure of protection of human health until PCB concentrations in fish are reduced and the PRO for
protection of human health is attained. However, even the attainment of acceptable levels in the fish
may serve to undermine vigilance in maintaining the cap in the future.
In general, the REM-3/10/Select and REM-0/0/3 alternatives are the most reliable, as there is
little or no longer-term maintenance or residual risk associated with the remedial work. Of the removal
alternatives, REM-0/0/3 is the most reliable, as it permanently removes the greatest amount of sediment
(leaving the least amount of PCBs in the river). The CAP-3/10/Select alternative does not achieve the
same degree of reliability due to the potential for defects or damage to the cap, thereby reducing its
effectiveness. This alternative would still require all of the sediment handling, processing, and disposal
activities needed for the removal alternatives. The No Action alternative is the least reliable. Although
the MNA alternative is more reliable than the No Action alternative, it relies more heavily on
institutional controls than do the active remedial alternatives to limit exposure to PCBs. Also, the fish
consumption advisories may be relaxed sooner under the active alternatives. Institutional controls do
not address ecological receptors, and human health risk reduction relies on knowledge of and voluntary
compliance with the fish consumption advisories.
9-18 . TAMS400805
9.4 Reduction of Toxicity, Mobility, or Volume through Treatment
The No Action and MNA alternatives do not involve any containment or removal of
contaminants from the Upper Hudson River sediments. Because the MNA alternative assumes the
separate source control NTCRA in the vicinity of the GE Hudson Falls plant, the upstream Tri+ PCB
load to the water column is expected to be reduced from 0.16 kg/day to 0.0256 kg/day by January 1,
2005. The No Action and MNA alternatives rely on natural attenuation processes such as burial by
cleaner sediments, biodegradation, bioturbation, and dilution to reduce PCB concentrations in sediments
and surface water. Biodegradation processes may convert some of the more highly chlorinated PCB
congeners (e.g., tetrachlorbiphenyls) to less chlorinated congeners (monochloro- and dichloro-biphenyls)
and biphenyl. The degree to which chlorination affects PCB toxicity remains uncertain and debated
within the scientific community. Yet, animal studies supported by GE and reviewed in the 1996 PCB
cancer reassessment (USEPA, 1996c) found tumors in lab animals for all Aroclor mixtures tested
(Aroclor 1016, 1242, 1254 and 1260), spanning a wide range of chlorination. Thus, it is not clear the
degree to which the transformation from more highly chlorinated PCBs to lesser chlorinated congeners
would alter the PCB toxicity, if at all. In any case, dechlorination is not expected to continue to
extensively modify the PCB inventory over time since it appears to occur only within the first few years
of depositon (USEPA, 1997a). Natural dilution of the contaminated sediments will also reduce the
toxicity, but the overall volume of contaminated sediments would increase as PCBs are contributed to
the Upper Hudson from upstream. Concentrations of PCBs in fish will respond slowly over time todecreases in concentrations in sediments and surface water.
For the CAP-3/10/Select alternative, the mobility of the PCBs in capped areas (approximately
207 acres) is reduced because these PCBs are sequestered under the bentonite cap. However, capping
does not satisfy the CERCLA statutory preference for treatment. In addition, there is no reduction in the
toxicity or volume of the PCBs under the cap. Under this alternative, the mass of PCBs and the volume
of contaminated sediments within the Upper Hudson River are permanently reduced because
approximately 1.73 million cubic yards of sediment, containing an estimated 33,100 kg of PCBs, are
removed from the ecosystem. Because the CAP-3/10/Select alternative also assumes the separate source it*o
control NTCRA in the vicinity of the GE Hudson Falls plant, the upstream Tri+ PCB load to the water ^o
column is expected to be reduced from 0.16 kg/day to 0.0256 kg/day by January 1, 2005. Additional <n
reduction of the water column loads will result from sediment remediation. After construction of the
9-19 TAMS

alternative is completed, natural attenuation processes will provide further, but slower, reductions in the
toxicity of PCBs in the remaining sediments and surface water.
For the REM-3/10/Select and REM-0/0/3 alternatives, the mass of PCBs and volume of
contaminated sediments in the Upper Hudson River are permanently reduced because sediment volumes
from 2.65 to 3.82 million cubic yards (REM-3/10/Select and REM-0/0/3, respectively) containing a mass
of PCBs from 45,600 kg (REM-3/10/Select) to an estimated mass of greater than 63,500kg (REM-0/0/3)
are removed from the ecosystem (Appendix E). Because these removal alternatives also assume the
separate source control NTCRA in the vicinity of the GE Hudson Falls plant, the upstream Tri + PCB
load to the water column is expected to be reduced from 0.16 kg/day to 0.0256 kg/day by January 1,
2005. Additional reduction of the water column loads will result from sediment remediation. Also, as
for the CAP-3/10/Select alternative, natural attenuation processes will provide further, but slower,
reductions in the toxicity of PCBs in the remaining sediments and surface water after construction of the
alternative is completed.
In all three active remediation alternatives, for the mechanical dredging option, the sediments
that are removed undergo limited treatment (stabilization with Portland cement) prior to landfill disposal.
For the hydraulic dredging option, the sediments that are removed are processed through hydrocyclones,
coagulation, sedimentation, and belt filter presses to separate them from the water. However, these
sediments do not undergo stabilization prior to landfill disposal. A different treatment process may be
employed for the beneficial use option. However, due to the large volume of sediments that would be
removed from the river under each of the active alternatives, none of the alternatives satisfies the
statutory preference for treatment as a principal element of the remedy (CERCLA Section 121(b)).
9.5 Short-Term Effectiveness
The short-term effectiveness of each alternative is addressed through evaluation of the following
criteria:
• Protection of the community during remedial actions;
• Protection of workers during remedial actions;
• Potential adverse environmental impacts during construction; and
• Time until remedial response objectives are achieved.
9-20 400807 TAMS
9.5.1 Protection of the Community During Remedial Actions
No construction activities are associated with the remediation of sediments for the No Action and
MNA alternatives, so neither alternative increases the potential for direct contact with or ingestion and
inhalation of PCBs from the surface water and sediments. The cancer risks and non-cancer health
hazards to humans and the adverse effects to ecological receptors due to the PCB-contaminated
sediments will persist throughout the short term. Due to the separate source control NTCRA in the
vicinity of the GE Hudson Falls plant, the Tri+ PCB load to the water column is expected to be reduced
from 0.16 kg/day to 0.0256 kg/day by January 1, 2005. As a result, cancer risks and non-cancer health
hazards to humans and adverse effects to ecological receptors for the MNA alternative are slightly lower
than those under the No Action alternative in the short term. For the MNA alternative, the fish
consumption advisories will continue to be the only means for protecting human health. There are no
such advisories in the No Action alternative.
Risks to ecological receptors and cancer risks and non-cancer health hazards to humans posed
by consumption of PCB-contaminated fish will be reduced more rapidly under the active alternatives
than under the No Action and MNA alternatives. The fish consumption advisories and restricted access
to portions of the river undergoing remediation provides protection from risks to human health for the
local community in the short term.
Transfer facilities and treatment areas present potential short-term risks to the community.
Therefore, access to these areas will be restricted to authorized personnel. In addition, monitoring and
engineering controls will be employed to minimize short-term effects due to material processing
activities. Increased traffic will also present an incremental risk to the community. The potential for
traffic accidents may increase marginally as additional vehicles are on the road. These effects are likely
to be minimal because most transportation of sediments for disposal will be accomplished by rail. In
addition to vehicular traffic, there will be increased river traffic. Work areas in the river will be isolated
(access-restricted), with an adequate buffer zone so that pleasure craft and commercial shipping can^
safely avoid such areas. Finally, the increased in-river barge traffic will be monitored and controlled to oo
minimize, to the extent possible, adverse effects on the commercial or recreational use of the Upper ®oo
Hudson River.
9-21 TAMS

9.5.2 Protection of Workers During Remedial Actions
For the No Action alternative, occupational risks to persons performing the sampling activities
(for the five-year reviews) will be unchanged from current levels. A slight increase in occupational risk
may be associated with the MNA alternative due to the greater degree of sampling involved in the river
(and the separate source control NTCRA in the vicinity of the GE Hudson Falls plant). For the three
active remediation alternatives (CAP-3/10/Select, REM-3/10/Select, and REM-0/0/3), potential
occupational risks to site workers from direct contact, ingestion, and inhalation of PCBs from the surfacewater and sediments and routine physical hazards associated with construction work and working on
water are significantly higher than for the No Action and MNA alternatives. For these alternatives, as
well as the No Action and MNA alternatives, personnel will follow a site-specific health and safety plan
and OSHA health and safety procedures, and will wear the necessary personal protective equipment.
9.5.3 Potential Adverse Environmental Impacts during Construction
No construction activities associated with the river sediments are conducted for the No Action
and MNA alternatives. Neither continuation of the existing limited sampling activities for the No Action
alternative nor the increased monitoring program for the MNA alternative is anticipated to have any
adverse effect on the environment, beyond that already caused by the PCB contamination of the
sediments in the Upper Hudson River.
For the three active remediation alternatives (CAP-3/10/Select, REM-3/10/Select, and REM-
0/0/3), the release of PCBs from the contaminated sediments into the surface water during construction
(dredging and cap placement), as well as the transport of PCBs over Federal Dam, will be controlled by
operational practices (e.g., control of sediment removal rates; use of enclosed dredge buckets; and use
of sediment barriers). Although precautions to minimize resuspension will be taken, it is likely that there
will be a temporary increase of suspended PCB concentrations, and possibly in fish PCB body burdens.
Studies have shown that such effects are controllable, small, and transient, and that longer term
improvement is seen (e.g., WRI, 2000; MDEQ, 1999).
Remedial activities may also result in temporary impacts to aquatic and wildlife habitat of the
Upper Hudson. Backfilling and habitat replacement measures will be implemented to mitigate these
9'22 400809 TAMS
impacts. A monitoring program will be established to verify the attainment of the habitat replacement
objectives. Although the degree of impact will be directly related to the area remediated and volume
dredged, these differences among the alternatives are not considered to be substantial due to their
transient nature and the mitigation measures that will be utilized.
As part of this evaluation, a semi-quantitative analysis of the possible increase in PCB loads and
concentrations due to sediment resuspension was performed for the regions downstream and outside of
the target areas. These areas in fact represent the largest portion of the Upper Hudson within the site
boundaries. This calculation is intended to describe the mean increase in water column PCB
concentration over each dredging season in these areas. The detailed description of the model and
analysis to estimate resuspension losses is provided in Appendix E.6. The results of the analysis are
summarized here.
Resuspension losses for the CAP-3/10/Select alternative apply only to the areas undergoing
dredging. Areas undergoing capping only are assumed to yield minor additional resuspension. Since
this alternative involves the least sediment removal of the three engineered alternatives, additional PCB
loads are smallest. Only mechanical dredging, as represented by an enclosed bucket dredge, is
considered for sediment removal under this alternative. For the REM-3/10/Select and REM-0/0/3
alternatives, the short-term impacts of a 12-inch cutterhead dredge and an enclosed bucket dredge are
considered for sediment removal. For all comparisons between the two dredging methods, the
production rate of dredge spoil material is the same for both methodologies. Specifically, the production
rate of a 12-inch cutterhead dredge is comparable to that of three 4-cubic-yard enclosed bucket dredges,
given productivity assumptions made for dredging concepts in this FS.
The resuspension rate calculated for the bucket dredge represents a relatively conservative
estimate since the available data describe the impacts of a less sophisticated dredge than that selected
for the engineering concepts for all active remedial alternatives. For this reason, although the results
indicate somewhat greater PCB concentrations and loads due to mechanical dredges versus hydraulic
equipment, resuspension will not be the major consideration in selecting one dredging concept over
another. Rather, other engineering issues, such as sediment transfer, processing and handling, as well £o
as operational logistics, will be more important. coo
9-23 TAMS

The magnitude of the short-term impacts due to resuspension varies with the overall scope of the
alternative, in terms of volume of material excavated. The table below shows a summary of the
extensiveness of each alternative and the expected short-term impacts due to resuspension during
dredging.
Summary of Sediment Resuspension Impacts
Metric
Implementation
schedule
Sediment volume
removed (106 cy)
Increase in average
Tri+ PCB
concentration (ng/L)
Baseline Tri+ PCB
load (kg) over FD:
•2004-2008
• 2004-2010
Add'l. PCB load
(kg) from
resuspension
No Action
NA
NA
NA
461 (92ann.)
637 (91 ann.)
NA
MNA
NA
NA
NA
295 (59 ann.)
383 (55 ann.)
NA
CAP-
3/10/Select
2004-2008
5 years
1.7
5 (mechanical)
32 (6 ann.)
(2004-2008)
REM-3/10/SeIect
2004-2008
5 years
2.7
4 (hydraulic)
7 (mechanical)
28 (6 ann., hyd.)
47 (9 ann., men.)
(2004-2008)
REM-0/0/3
2004-2010
7 years
3.8
3 (hydraulic)
5 (mechanical)
29 (4 ann., hyd.)
48 (7 ann., mch.)
(2004-2010)
It is important to place these estimated increases in the Tri-t- PCB load in perspective. In
particular, current concentrations of Tri+ PCBs in the water column at the TI Dam are in the range of
14.4 to 532 (mean of 66 ng/L) in May through November 1999, the period of the year corresponding to
the proposed remedial operations. At the expected time of implementation, the mean concentration at
the TI Dam during this period is expected to be 29 ng/L based on the HUDTOX forecast.
Concentrations in River Section 2 are generally similar to those in River Section 1 while those in River
Section 3 are reduced by about 25 to 50 percent, depending on distance downstream due to dilution from
tributary flow. Thus, in all river sections, these expected increases represent relatively minor changes
as compared to current or projected water column concentrations. Indeed, these additions are within the
year-to-year and season-to-season variations regularly observed in the Upper Hudson. They are also well
9-24 400811 TAMS
below the order-of-magnitude increase in mean water column concentrations seen in the early 1990s.
The water column PCB concentration increases observed in the early 1990s resulted in an approximate
doubling of some fish levels. Thus, by analogy, the PCB releases associated with dredging for any of
the three active alternatives should have only a minor impact on fish body burdens in the Upper Hudson.It should be noted that total PCB concentration increases may be greater, perhaps two to three times
higher than those for Tri+ PCBs. However, current and projected water column total PCB
concentrations at the TI Dam are also two to three times higher than those for Tri+ PCBs. Thus the
expected increase in total PCB represents the same percentage increase relative to projected conditions
as anticipated for the Tri+ increase.
In addition to the examination of the increase in PCB concentration, the analysis also included
an estimate of the Tri+ PCB mass released by dredging operations. Overall, depending on the
alternative, the remediation would generate an additional 4 to 9 kg per year of Tri+ PCBs over the five-
or seven year operation. This value should be compared to the estimated release of Tri+ PCBs during
the remediation period in the absence of remediation (about 91 to 92 kg/yr for No Action and 55 to 59
kg/yrforMNA). The increase is only about 10 to 16 percent of the expected annual release under MNA
and even less under No Action. In fact, the modeled PCB load increase is well within the range of year-
to-year variability. The current annual release of Tri+ PCBs is 109 kg/year. This rate of release, which
is largely unchanged over the last 10 years, would generate a load of 545 kg over a period equivalent to
the remedial operations for the CAP-3/10/Select or REM-3/10/Select alternatives, and 763 kg over a
period equivalent to construction for the REM-0/0/3 alternative.
The additional release from any of the three active alternatives is less than the PCB release
estimated from a single 100-year flood event (i.e., about 60 kg), as noted in the RBMR (USEPA, 2000a).
As discussed in the RBMR, the 100-year flood was not expected to have a major impact on fish or river
PCB levels, with associated increases not lasting more than one to two years. With the remedial releases
spread out over five or seven years, the impact should be much smaller with a residual impact (after
completion of construction) of even shorter duration than the 100-year flood.
oBased on these analyses, it appears unlikely that the removal of sediments associated with any ooo
of the three alternatives will yield substantially higher levels of PCB in the water or fish of the Upper [^
Hudson during dredging. For the REM-3/10/Select and REM-0/0/3 alternatives, water column
9-25 TAMS

concentrations may reach from 25 to 60 percent over those forecast using HUDTOX in River Sections
2 and 3 but the higher levels are short-lived. Based on the similarity to the release associated with the
100-year flood event, it is unlikely that the residual effects will last more than a few years after the
construction is completed.
For the CAP-3/10/Select alternative there is a potential transient impact from the temporary
exposure of deeper, contaminated sediments during the time interval between excavation and cap
placement. It may be possible to reduce impacts associated with exposure of deeper sediments by
detailed planning of all phases of the dredging and capping operations. However, the level of
coordination between the different elements of this alternative will render the overall remedial program
under CAP-3/10/Select particularly complex. In addition, it will not be possible to fully avoid water
quality and related ecological impacts resulting from the temporary exposure of contaminated sediments
that are targeted for capping. Due to the transient and variable nature of this exposure, the impact cannot
be quantified. Nonetheless, barring a major flood event, it is unlikely to be greater than that originating
from sediment resuspension.
9.5.4 Time until Remedial Response Objectives Are Achieved
For all five alternatives, the risk-based PRO for protection of human health of 0.05 ppm PCBs
(wet weight) in fish fillets is not met in any of the river sections in the short term. The target
concentration of 0.2 ppm PCBs (one meal per month) in fish fillets is also not met in any river section
in the short term for all five alternatives. The alternate target concentration of 0.4 ppm PCBs (one meal
every two months) in fish fillets is not met in River Sections 1 and 2 in the short term by any of the five
alternatives, but is met in River Section 3 in the year 2010 for the three active remediation alternatives
and in the year 2011 for the MNA alternative. The 0.4 ppm PCBs target fish concentration is not met
in the short term in River Section 3 by the No Action alternative.
The risk-based PRG for protection of the environment is a range from 0.3 to 0.03 mg/kg in
whole fish (this corresponds to a range from 0.13 to 0.013 mg/kg total PCBs in fish fillets), based on the
LOAEL and NOAEL fish concentrations consumed by the river otter. The corresponding LOAEL and
NOAEL whole fish target concentrations for the mink are 0.7 and 0.07 mg/kg PCBs. For the river otter,
the PRGs are not met in River Sections 1, 2, and 3 in the short term for all five remedial alternatives.
400813
For the mink, the LOAEL target concentration is not met in River Section 1 in the short term, but is met
in River Sections 2 and 3 prior to 2010 for the three active remediation alternatives. For the mink, under
the MNA alternative, the LOAEL target concentration is not met in River Sections 1 and 2 in the short
term, but is met in River Section 3 prior to 2010. For the mink, the NOAEL target concentration is not
met in River Sections 1, 2, and 3 in the short term for any of the five remedial alternatives.
9.6 Implementability
The implementability of the alternatives are compared through evaluation of the following
criteria:
• Technical feasibility;
• Administrative feasibility; and
• Availability of services.
9.6.1 Technical Feasibility
Both the No Action and MNA alternatives are technically feasible.
Technical feasibility for the active remediation alternatives is discussed below in terms of the
main components of the alternatives:
• Dredging (mechanical and hydraulic);
• Capping;
• Transfer facilities; and
• Rail transport and disposal.
9.6.1.1 Dredging Feasibility
Mechanical Dredging
Removal of targeted sediments solely by mechanical means has been evaluated for the CAP-
3/1 0/Select, REM-3/1 0/Select, and REM-0/0/3 alternatives. Removal of targeted sediments by hydraulic
9-27 TAMS
oooo
dredging has also been evaluated for the REM-3/10/Select and REM-0/0/3 alternatives. With regard to
mechanical dredging, the following are the principal distinctions between the capping and removal
alternatives:
• Capping requires the least total dredging (about 35 percent less than REM-3/10/Select) and least
annual output (about 35 percent less than REM-3/ 10/Select);
• REM-0/0/3 requires the most removal work (about 43 percent more than REM-3/10/Select);
• Annual removal rates for REM-3/10/Select and REM-0/0/3 are approximately equal; and
• REM-0/0/3 entails significantly more removal of sediments in shallow cuts (less than 2.0 feet)
than does REM-3/10/Select.
Technical feasibility was discussed in Chapter 8 in terms of the capability of mechanical
equipment to productively remove as little as one or two feet of sediment. As a result of recent advances
in mechanical systems, buckets are now available that can efficiently remove sediments in wide, shallow
cuts. Therefore, it has been concluded that efficient removal of sediments, as proposed under each of
the three active alternatives, is technically feasible.
Feasibility was also evaluated in terms of the ability of mechanical dredging systems to maintain
acceptably low rates of sediment resuspension. An analysis of sediment resuspension during dredging
operations is presented in Appendix E, and (conservative) estimates of both total and annual increased
Tri-l- PCB loads to the water column is presented in Chapter 8. It is concluded there that substantial
water quality impacts are not expected to occur as a result of mechanical dredging operations. Thus,
from the perspective of sediment resuspension, each alternative that involves mechanical dredging is
considered feasible.
Hydraulic Dredging
Hydraulic dredging has been evaluated for the REM-3/10/Select and REM-0/0/3 alternatives.
Under these alternatives, most removal will be accomplished with a suction cutterhead dredge; dredging
in River Section 3 will be accomplished by means of mechanical equipment. The principal differences
between the use of hydraulic and mechanical systems, insofar as those systems have been evaluated in
this FS, are as follows:
9-28 A ^ TAMS400815
• Only one hydraulic dredge is needed to remove targeted sediments in River Sections 1 and 2, as
opposed to several mechanical dredges;
• Hydraulically dredged sediments are conveyed to the transfer facility by means of a slurry
pipeline and not in barges;
• Hydraulically dredged sediments are dewatered and not stabilized; and
• Hydraulic dredging entails operation of a substantial water treatment facility.
As was discussed in Chapter 8, hydraulic dredging is considered technically feasible for either
active alternative to which it is being applied. One distinction between REM-0/0/3 and REM-
3/10/Select is that REM-0/0/3 entails substantially more removal of sediments where contamination is
limited to the upper 1.0 or 1.5 feet. Since it is not considered practical to dredge less than two feet of
sediment with the selected hydraulic technology, it will be necessary to dredge 90,000 cubic yards of
non-targeted sediments should hydraulic dredging be selected under the REM-0/0/3 alternative.
As for the mechanical equipment discussed above, sediment resuspension rates and water quality
impacts have also been estimated for hydraulic dredging. Based on available data, it has been calculated
that hydraulic dredging operations will resuspend 40 percent less sediment than will mechanical removal
operations for the same production rate. This analysis, however, does not reflect a number of recent
improvements made to mechanical systems which were specifically formulated to reduce resuspension
and for which published data is not yet available. Therefore, the difference in performance between the
two technologies (mechanical and hydraulic dredging), as estimated in Appendix E, is not expected to
be a determining factor in equipment selection and the two technologies are considered equally feasible
from the perspective of sediment resuspension.
9.6.1.2 Capping Feasibility
Capping involves considerably less dredging than does the corresponding removal alternative
since principal reliance is being placed on an impervious cap to effectuate the remediation. As
mentioned in Chapter 8, evaluation of the AquaBlok™ system is currently in progress at several sites
is reasonable expectation that AquaBlok™ will ultimately prove to be technically feasible. The
9-29 TAMS
and final feasibility of this technology must await results of those studies. However, the materials ofoo
which AquaBlok™ is composed have served reliably in other, similar applications, and, therefore, there
™

scheduling of in-river work (dredging and capping) and overall program logistics will be somewhat more
complex under the CAP-3/ 10/Select alternative than under REM-3/10/Select or REM-0/0/3.
9.6.1.3 Transfer Facilities Feasibility
Each active alternative, as evaluated in this FS, requires that transfer facilities be established at
two locations: one facility would be adjacent to River Section 1, and another would be in the Port of
Albany area. Utilization of these sites is somewhat different under the capping and mechanical dredging
alternatives. About 35 percent less dredged material would be processed annually at the transfer
facilities if the capping alternative were selected. This suggests a substantially lower level of activity
at the transfer facilities (and potentially smaller sites). However, capping also requires that large
quantities of AquaBlok™ be manufactured and distributed throughout the river. Doing so may
substantially increase the use of the transfer facility sites (or result in separate sites being set up for
distribution of AquaBlok™). Consequently, establishing transfer facilities at two locations for either
the capping or mechanical removal remedies is considered equally feasible.
Should hydraulic dredging be selected as the removal technology, establishing a transfer facility
adjacent to River Section 1 will be somewhat complicated by the need to operate relatively large slurry
processing and water treatment systems. Several acres may be needed to house these systems and any
associated equipment. Nonetheless, as concluded in Chapter 8, it is expected that a transfer/processing
site can be assembled should hydraulic dredging be the selected dredging technology.
9.6.1.4 Rail Transport and Disposal Feasibility
The capping alternative would result in least stabilized dredged material being shipped to off-site
disposal facilities. The two removal alternatives generate approximately the same quantity of stabilized
dredged material on an annual basis. Thus, the scale of rail operations for the REM-3/10/Select and
REM-0/0/3 is approximately the same. However, REM-0/0/3 has a duration of seven ye.ars and REM-
3/10/Select has a duration of five years. It is expected that railroads that serve the Upper Hudson area
can handle the additional traffic that would be generated by any of the alternatives.
9.30 400817 TAMS

9.6.2 Administrative Feasibility
In general, the principal administrative task under the MNA alternative is the institutional
controls, such as the fish consumption advisories. Fish consumption advisories and a "catch and release
only" fishing restriction are currently in place, so institutional controls are considered administratively
feasible.
For the active remediation alternatives (CAP-3/10/Select, REM-3/10/Select, and REM-0/0/3),
it is expected that the two transfer facilities, constructed on land adjacent to the Upper Hudson River,
will be considered "on-site" for the purposes of the permit exemption under CERCLA Section 121(e),
although any such facilities will comply with the substantive requirements of any otherwise necessary
permits. Since the requirements for these facilities are equivalent for all three alternatives, assuming
mechanical dredging, there is little difference in the administrative feasibility among the three. The
hydraulic dredging option for the REM-3/10/Select and REM-0/0/3 alternatives will require somewhat
greater land area, but properties meeting the requirements appear to exist. Although procurement of
appropriate properties with reasonably close rail access presents certain marketplace and administrative
challenges, research conducted for this FS suggests that sufficient options exist to provide workable
solutions under a variety of possible scenarios.
It is assumed that review and concurrence on siting and design of these facilities by the State of
New York will be obtained in a reasonably expeditious manner. While it is possible that local
opposition to permanent dredged sediment disposal in the vicinity of the Upper Hudson River may
translate to concerns regarding (and possible local administrative opposition to) a temporary northern
transfer facility, it is likely that the tangible concerns can be addressed by proper design and engineering
controls. It is also expected that, for any of the active remedial alternatives, there will be substantial
restrictions on construction activity, including controls on the types of dredging and capping equipment
to be used, restrictions on the speed of operations, constraints on barge filling practices, and controls on £otemporary storage of contaminated dredge spoils. Construction activities will also have to be oo
coordinated with the Canal Corporation, which operates the Locks on the Upper Hudson River from May °°
through November.
9-31 TAMS

The major difference among the three alternatives in regard to local administrative feasibility
relates to the lengths of the respective construction programs. The CAP-3/10/Select and REM-
3/10/Select alternatives are projected to require five years of construction each, while the REM-0/0/3
alternative is estimated at seven years. Compensating economic benefits (expected to be roughly
proportionate to the overall cost of each alternative) to the labor force for both skilled and unskilled
workers, as well as local businesses such as lodging and food services and equipment and raw materials
suppliers, may mitigate potential local administrative opposition.
Since the concepts for these alternatives call for shipment of sediments to disposal by rail, local
highways will not be required to carry substantially increased heavy truck traffic, although some increase
will be experienced during mobilization activities and possibly for delivery of certain materials and
commodities. If beneficial use of dredged sediments proves a reality during design and implementation,
some options may entail additional truck traffic, but the possibility exists for moving the material to the
southern transfer facility by barge for loading onto trucks so as to minimize impacts on the secondary,
local highway systems.
9.6.3 Availability of Services
For the No Action and MNA alternatives, the necessary services are available. For the active
remedies, the services and materials listed below appear to present the principal limitations.
Barges and Towboats
Since most commercial activity on the Upper Hudson has ceased, it is not likely that a sufficient
number of barges and tow boats suitable for river work can be readily found in the project vicinity.
Obtaining barges and towboats will necessitate early planning for procurement and may require that
some equipment be fabricated for this program. The number of barges and towboats required for
mechanical dredging related to the REM-3/ 10/Select and REM-0/0/3 alternatives is approximately the
same since the volume of material being removed on an annual basis is approximately the same. With
regard to the CAP-3/10/Select alternative, the quantity of material being removed is approximately 35
percent less than that under the REM-3/10/Select alternative. Even though the capping operation will
also require barges and towboats, the amount of work required for capping and backfill under CAP-
9-32 400819 TAMS
3/10/Select is about the same as the amount of work required for backfill alone under REM-3/10/Select.
Consequently, the difference in the number of barges and towboats required is not strictly proportional
to the difference in dredging volume between the two alternatives. It is estimated that the number of
barges and towboats will be about 20 to 25 percent less for CAP-3/ 10/Select.
Hydraulic dredging utilizes only three to four larger-capacity hopper barges (loaded to 1000
tons) to transport dewatered sediments from the northern to the southern transfer facility, while
mechanical dredging utilizes about four hopper barges and seven or eight lower-capacity deck barges
(loaded to 200 tons) for transport of sediments directly to the northern and southern transfer facilities.
Since some of the deck barges can make more than one trip per day to the northern transfer facility for
the REM-3/10/Select alternative, the number of barges required is somewhat lower than the daily barge
loads shown on Table 8-10a. Because hydraulic dredging will require fewer barges and towboats than
a comparable mechanical dredging program, there will be a substantially reduced requirement for
procurement or fabrication of barges associated with hydraulic dredging.
Rail Cars
Availability of rail cars fluctuates with economic conditions. The number of cars required to
support operations for any active alternative is directly proportional to the volume of material processed
on an annual basis. Therefore, on an annual basis, CAP-3/10/Select will require approximately one-third
fewer cars than either of the removal alternatives. Since the active remedial alternatives are relatively
long-term projects, and will require considerable pre-planning, it is expected that the needed rolling
stock can be obtained for any of the active alternatives.
Cement
The amount of Portland cement required varies with the volume of sediment processed for an
alternative. Specifically, hydraulic dredging for either of the removal alternatives is projected to require
no stabilizing agent due to the use of mechanical dewatering. The CAP-3/10/Select alternative requires •*>•oabout one-third less stabilizing agent than either REM-3/10/Select or REM-0/0/3 on an annual basis. ^
toAvailability of this commodity also fluctuates with economic conditions. However, since there are °
several potential, less costly substitutes for Portland cement, it is not likely that adverse conditions in
9-33 TAMS

the Portland cement market would make project implementation infeasible, although, depending on the
amount required, use of substitutes could conceivably be more costly due to the potentially higher
volume to be disposed.
9.7 Cost
The present worth for all five alternatives has been calculated for the year 2000 using a 7 percent
discount rate. The net present worth for all five alternatives, including the beneficial use option, is
presented in Table 9-1.
9.7.1 Net Present Worth
The net present worth of the remedial alternatives ranges from $140,000 for No Action to $570
million for the REM-0/0/3 alternative. The net present worth of the REM-3/10/Select alternative is $460
million, which is $110 million less than the cost for the REM-0/0/3 alternative. For the active remedial
alternatives (CAP-3/10/Select, REM-3/10/Select, and REM-0/0/3), these costs are estimated for the use
of mechanical dredging techniques to remove PCB-contaminated sediments from the Upper Hudson
River, and assume the disposal of the dredged materials at existing permitted TSCA and non-TSCA
landfills, as appropriate.
For the beneficial use option for non-TSCA material, the net present worth of the active remedial
alternatives ranges from $338 million for the CAP-3/10/Select alternative to $496 million for the REM-
0/0/3 alternative. These beneficial use option costs are also based on the use of mechanical dredging
techniques.
For the hydraulic dredging removal option and the dredged materials are disposed at TSCA and
non-TSCA landfills, the net present worth costs are $448 million for the REM-3/10/Select alternative
and $550 million for the REM-0/0/3 alternative. •
9-34 400821 TAMS

9.7.2 Capital Costs
The No Action alternative has no capital cost. The MNA alternative has a present worth capital
cost of $417,000 for further refining and recalibration of the mathematical model for the Upper Hudson
River. The present worth of the capital costs for the active remedial alternatives ranges from $344
million for the CAP-3/10/Select alternative to $556 million for the REM-0/0/3 alternative. The net
present worth of the capital costs for the REM-3/10/Select alternative is $448 million, approximately
$ 108 million less than the net present worth of the capital costs for the REM-0/0/3 alternative. For these
active remediation alternatives, the present worth of the capital costs includes the disposal of the
stabilized dredged materials at TSCA and non-TSCA landfills, and assumes the use of mechanical
dredging techniques to remove PCB-contaminated sediments from the Upper Hudson River.
For the option where the non-TSCA material is utilized for beneficial uses, the present worth of
the capital costs for the active remedial alternatives ranges from $314 million for the CAP-3/10/Select
alternative to $483 million for the REM-0/0/3 alternative. The net present worth of the capital costs of
the REM-3/10/Select alternative under the beneficial use option is $399 million. These beneficial use
option costs are also based on the use of mechanical dredging techniques.
For the option where hydraulic dredging techniques are utilized to remove PCB-contaminated
sediments and the dredged materials are disposed at TSCA and non-TSCA landfills, the net presentworth of the capital costs is $434 million for the REM-3/10/Select alternative and $536 million for the
REM-0/0/3 alternative.
9.7.3 O&M Costs
Due to the varying frequency of different elements of the monitoring program, and the five-year
period for NCP reviews, O&M costs will vary on an annual basis. The present worth of the O&M costs
for the remedial alternatives ranges from $140,000 for the No Action alternative to $38 million for the
MNA alternative. The net present worth of the O&M costs for the CAP-3/10/Select alternative is $24 oo
million, for the REM-3/10/Select alternative is $13 million, and for the REM-0/0/3 alternative is $12 °°to
million. For the active remediation alternatives, this present worth of the O&M costs assumes the use
9-35 TAMS

of mechanical dredging techniques to remove PCB-contaminated sediments from the Upper Hudson
River, and disposal of the stabilized dredged materials at TSCA and non-TSCA landfills.
For the option where the non-TSCA material is utilized for beneficial uses, the present worth of
the O&M costs for the active remedial alternatives ranges from $12 million for the REM-0/0/3
alternative to $24 million for the CAP-3/10/Select alternative. These beneficial use costs are also based
on the use of mechanical dredging techniques.
For the option where hydraulic dredging techniques are utilized to remove PCB-contaminated
sediments and the dredged materials are disposed at TSCA and non-TSCA landfills, the net present
worth of the O&M costs is $14 million for the REM-3/10/Select alternative and $13 million for the
REM-0/0/3 alternative.
9.8 Cost Sensitivity Analyses
Sensitivity analyses have been performed to assess the significance that changing principal
features of the CAP and REM alternatives will have on overall project costs. Based on results of the
base case analysis, the parameters that influence the quantity of sediments needing to be stabilized,
shipped, and disposed have the greatest impact on costs. In addition, disposal costs for sediments
classified as TSCA-regulated materials are significantly greater than for those considered to be non-
TSCA materials. A comparison of the costs for the base case alternatives (mechanical dredging and
landfill disposal), beneficial use option (mechanical dredging and beneficial use), and the hydraulic
dredging option (hydraulic dredging and landfill disposal) are presented in Table 9-1. Thus, the
sensitivity analysis presented below addresses changes in several parameters that influence either the
volume of sediment removed and the fraction of removed sediments considered to be TSCA-regulated.
The sensitivity of the cost estimates for the three active remediation alternatives to the assumed
non-TSCA threshold PCB concentration is provided in subsection 9.8.1. Subsection 9.8.2 presents the
sensitivity of the cost estimates for these three active remediation alternatives to an adjustment of the
remediation boundary (i.e., the areas targeted for remediation). Further, for the capping with select
removal alternative, the sensitivity of the cost estimate to a reduction in the cap thickness was examined;
the results of this evaluation are shown in subsection 9.8.3. Also, the sensitivity of the cost estimates
9-36 4Q0823 TAMS

for the two removal alternatives to the depth of sediments targeted for removal is presented in subsection
9.8.4. An analysis of the impact of the disposal site location (i.e., distance from the Upper Hudson River
is provided in subsection 9.8.5. A summary of these cost sensitivity analyses is included in subsection
9.8.6.
9.8.1 Cost Sensitivity to an Increase in the Assumed Non-TSCA PCB Threshold Concentration
As described in subsection 5.2.5.2, dredged sediments with PCB concentrations greater than 33
mg/kg will be managed by disposal in a TSCA landfill. The sediments with less than 33 mg/kg PCBs
will be sent for disposal to a non-TSCA landfill. The 33 mg/kg threshold PCB concentration was used
in this FS to provide a safety margin so that the non-TSCA landfill always receives sediments with PCB
concentrations less than 50 mg/kg. A sensitivity analysis was performed to determine the change in the
cost estimates of changing the threshold PCB concentration from 33 mg/kg to 50 mg/kg; i. e., eliminating
the safety margin. A summary of the quantity changes for each of the three active remediation
alternatives as a result of making this change in the threshold PCB concentration is presented in Table
9-2. A summary of the corresponding present worth costs for the CAP-3/10/Select, REM-3/10/Select,
and REM-0/0/3 alternatives are outlined in Tables 9-3a, 9-3b, and 9-3c, respectively.
The tabulation below shows the mass of TSCA material that will be targeted under the REM-
3/10/Select alternative for the two assumed values for the non-TSCA threshold PCB concentration.
REM-3/10/Select
Cost Sensitivity to Assumed Non-TSCA Threshold PCB Concentration
Assumed Threshold
Concentration
PCBs > 33 mg/kg
PCBs > 50 mg/kg
TSCA Sediments Targeted
(106 tons)
1.68
1.39
Present Worth Costs
($million)
$460 million
$449 million
As shown, the present worth costs do decrease when the assumed non-TSCA threshold PCB
concentration is increased from 33 mg/kg to 50 mg/kg. However, since less than 294,000 tons of
sediments are excluded from being handled as a TSCA-regulated material (and need to be handled as
oo00toit*
9-37 TAMS

non-TSCA material), the reduction in costs is only about 2 percent. A maximum cost reduction of $ 14million occurs under the REM-0/0/3 alternative, and a minimum reduction of $9 million under the CAP-
3/10/Select alternative, when the assumed non-TSCA threshold PCS concentration is increased to 50
mg/kg. For the CAP-3/10/Select alternative, a net present worth cost reduction of about 2 percent is
obtained by increasing the assumed non-TSCA threshold PCB concentration.
9.8.2 Cost Sensitivity to Remediation Target Area Boundary Adjustment
The remediation target areas were defined for this FS using the criteria of Full-Section
remediation (i.e., in which the MPA targets are 0 g/m2 or greater), Expanded Hot Spot remediation (i.e.,
in which the nominal MPA targets are 3 g/m2 PCBs or greater), Hot Spot remediation (i.e., in which the
nominal MPA targets are 10 g/m2 or greater), and Select remediation (i.e., in which the targets are
roughly based on nominal MPA of 10 g/m2 or greater, modified by potential for scour). Areas involving
Full-Section remediation were not varied for this analysis because Full-Section remediation involves the
entire river cross-section. The remediation target area boundaries for Select remediation, Hot Spot
remediation and Expanded Hot Spot remediation were varied by plus or minus 50 feet. If the
remediation target area is adjusted by plus 50 feet, additional sediment will have to be removed,
transported, stabilized, and disposed of off-site. Additional backfill will also be required during site
mitigation. The reverse is true for the minus 50 feet adjustment in the remediation target area.
A summary of the quantity changes for each of the three active remediation alternatives as a
result of making this adjustment is shown on Table 9-4. The corresponding present worth costs for the
CAP-3/10/Select alternative are outlined in Tables 9-5a (target area plus 50 feet) and 9-5b (target area
minus 50 feet), respectively. The corresponding present worth costs for the REM-3/10/Select alternative
are outlined in Tables 9-5c (target area plus 50 feet) and 9-5d (target area minus 50 feet), respectively.
Similarly, the corresponding present worth costs for the REM-0/0/3 alternative are outlined in Tables
9-5e (target area plus 50 feet) and 9-5f (target area minus 50 feet), respectively.
The following table illustrates results of the analysis for the REM-3/10/Select alternative.
9-38 400825 TAMS

REM-3/10/Select
Cost Sensitivity to Modified Target Area Boundaries
Remediation Target Area
Base Case
Base Case + 50 feet
Base Case - 50 feet
Volume Targeted (106 cy)
2.65
2.95
2.08
Present Worth Costs ($million)
$460 million
S503 million
S378 million
As shown, a change in target area boundary of 50 feet has a significantly lower impact on overall
project costs than does a one-foot change in dredging depth (applicable to REM alternatives only; see
subsection 9.8.4, below). The impact on costs in this case results from the same factors that influence
costs when dredge depth is modified, i.e., a change in target area changes target volumes which, in turn,
impacts dredging, transportation, and disposal costs.
Table 9-5b shows that for the CAP-3/10/Select alternative, reducing target area boundary by 50
feet reduces the net present worth costs by about $87 million (approximately 24 percent). Similarly,
Table 9-5a shows that for the CAP-3/10/Select alternative, increasing the target area boundary by 50 feet
increases the net present worth costs by $35 million (approximately 9 percent).
For the two removal alternatives, reducing the target area boundary by 50 feet reduces the net
present worth costs by approximately 5 percent (for the REM-0/0/3 alternative) and 18 percent (for the
REM-3/10/Select alternative). Similarly, for these two removal alternatives, increasing the target area
boundary by 50 feet increases the net present worth costs by approximately 1 percent (for the REM-0/0/3
alternative) and 9 percent (for REM-3/10/Select alternative). The maximum change in costs occurs
under the REM-3/10/Select alternative; costs increase by $43 million when the target area boundary is
increased (plus 50 feet) and decrease by about $82 million when the boundary is reduced (minus 50 feet).
9.8.3 Cost Sensitivity to Reduction in Cap Thickness for Capping with Select RemovalAlternative
As described in subsection 5.2.4.1, a one-foot-thick cap consisting of AquaBlok™ was used forthe CAP-3/10/Select alternative. For the sensitivity analysis, a six-inch cap thickness was used instead.
A summary of the quantity changes as a consequence of such a reduction in the cap thickness is shown
on Table 9-6. A summary of the corresponding present worth costs is outlined in Table 9-7.
oo00to
9-39 TAMS
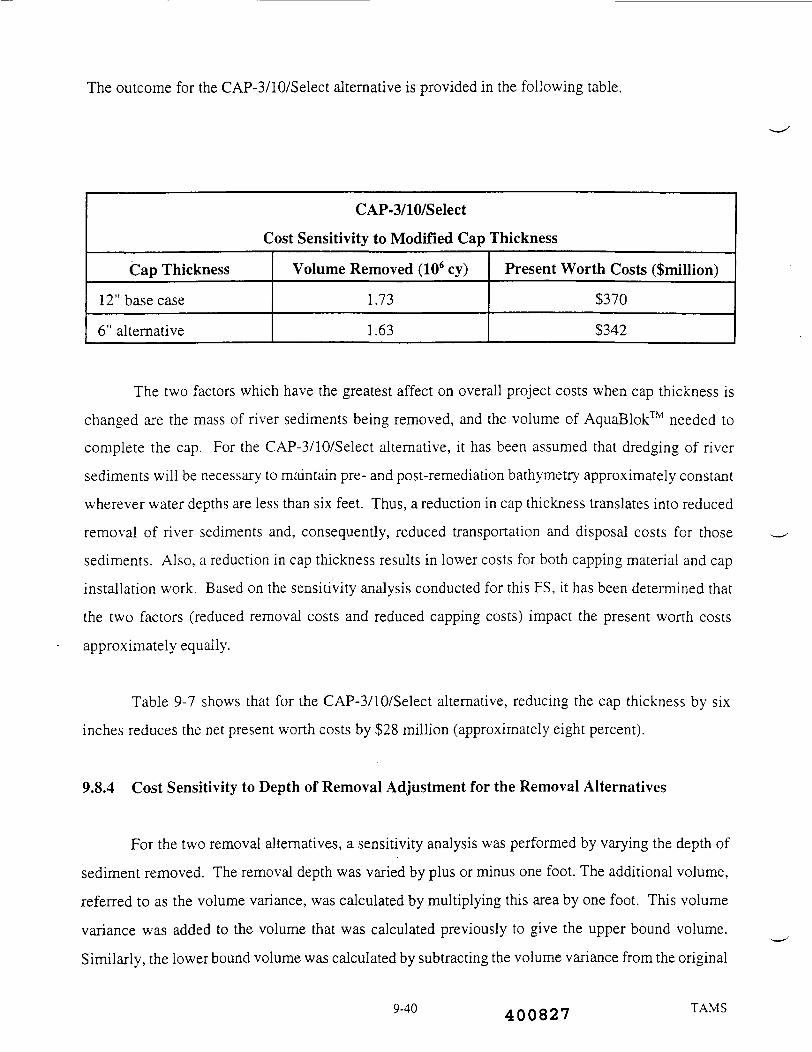
The outcome for the CAP-3/10/Select alternative is provided in the following table.
CAP-3/10/Select
Cost Sensitivity to Modified Cap Thickness
Cap Thickness
12" base case
6" alternative
Volume Removed (106 cy)
1.73
1.63
Present Worth Costs ($million)
$370
$342
The two factors which have the greatest affect on overall project costs when cap thickness is
changed are the mass of river sediments being removed, and the volume of AquaBlok™ needed to
complete the cap. For the CAP-3/10/Select alternative, it has been assumed that dredging of river
sediments will be necessary to maintain pre- and post-remediation bathymetry approximately constant
wherever water depths are less than six feet. Thus, a reduction in cap thickness translates into reduced
removal of river sediments and, consequently, reduced transportation and disposal costs for those
sediments. Also, a reduction in cap thickness results in lower costs for both capping material and cap
installation work. Based on the sensitivity analysis conducted for this FS, it has been determined that
the two factors (reduced removal costs and reduced capping costs) impact the present worth costs
approximately equally.
Table 9-7 shows that for the CAP-3/10/Select alternative, reducing the cap thickness by six
inches reduces the net present worth costs by $28 million (approximately eight percent).
9.8.4 Cost Sensitivity to Depth of Removal Adjustment for the Removal Alternatives
For the two removal alternatives, a sensitivity analysis was performed by varying the depth of
sediment removed. The removal depth was varied by plus or minus one foot. The additional volume,
referred to as the volume variance, was calculated by multiplying this area by one foot. This volume
variance was added to the volume that was calculated previously to give the upper bound volume.
Similarly, the lower bound volume was calculated by subtracting the volume variance from the original
9-40 400827 TAMS
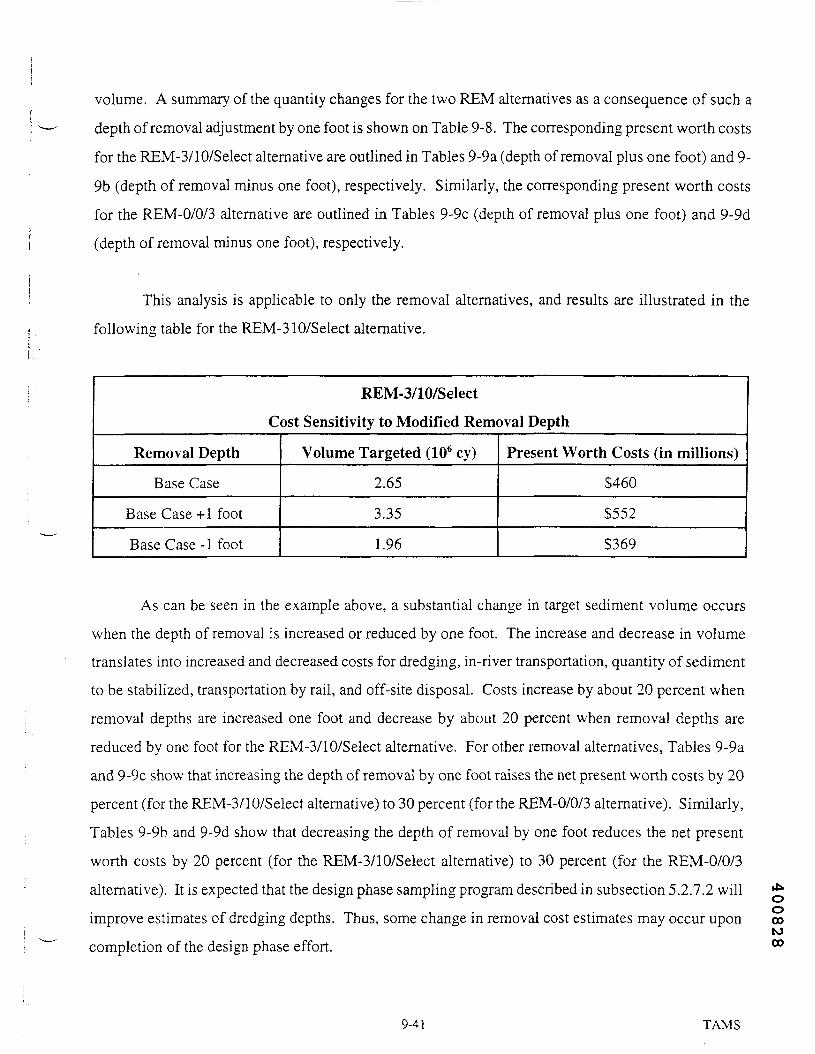
volume. A summary of the quantity changes for the two REM alternatives as a consequence of such a
depth of removal adjustment by one foot is shown on Table 9-8. The corresponding present worth costs
for the REM-3/10/Select alternative are outlined in Tables 9-9a (depth of removal plus one foot) and 9-
9b (depth of removal minus one foot), respectively. Similarly, the corresponding present worth costs
for the REM-0/0/3 alternative are outlined in Tables 9-9c (depth of removal plus one foot) and 9-9d
(depth of removal minus one foot), respectively.
This analysis is applicable to only the removal alternatives, and results are illustrated in the
following table for the REM-310/Select alternative.
REM-3/10/Select
Cost Sensitivity to Modified Removal Depth
Removal Depth
Base Case
Base Case+1 foot
Base Case -1 foot
Volume Targeted (106 cy)
2.65
3.35
1.96
Present Worth Costs (in millions)
$460
$552
$369
As can be seen in the example above, a substantial change in target sediment volume occurs
when the depth of removal is increased or reduced by one foot. The increase and decrease in volume
translates into increased and decreased costs for dredging, in-river transportation, quantity of sediment
to be stabilized, transportation by rail, and off-site disposal. Costs increase by about 20 percent when
removal depths are increased one foot and decrease by about 20 percent when removal depths are
reduced by one foot for the REM-3/10/Select alternative. For other removal alternatives, Tables 9-9a
and 9-9c show that increasing the depth of removal by one foot raises the net present worth costs by 20
percent (for the REM-3/10/Select alternative) to 30 percent (for the REM-0/0/3 alternative). Similarly,
Tables 9-9b and 9-9d show that decreasing the depth of removal by one foot reduces the net present
worth costs by 20 percent (for the REM-3/10/Select alternative) to 30 percent (for the REM-0/0/3
alternative). It is expected that the design phase sampling program described in subsection 5.2.7.2 will
improve estimates of dredging depths. Thus, some change in removal cost estimates may occur upon
completion of the design phase effort.
oo00to00
9-41 TAMS

9.8.5 Cost Sensitivity to Disposal Site Location
Since transportation costs and tipping fees are such a large fraction of overall remedial costs
(approximately 50 percent of the capital cost for the REM-3/10/Select alternative is related totransportation and disposal, exclusive of sediment stabilization), it is useful to provide context for these
costs by considering alternate approaches. One possibility would be to reduce the distance that stabilized
sediments must be hauled. In order to assess the cost implications of the landfill being closer to the
Upper Hudson, rough cost estimates were generated for options not considered in development of
alternatives in Chapter 6 (since they were screened out in Chapter 4 based on administrative
infeasibility).
In one case it was assumed, for purposes of this analysis, that a lined landfill, dedicated to
handling dredged material, could be constructed within a one-day round-trip (by truck) of one of the
transfer facilities. A second option was also evaluated assuming that the distance to the landfill would
allow a truck to make two round trips each day. An additional disposal option considered was the use
of a Confined Disposal Facility (CDF) constructed adjacent to River Section 1. This concept would
consist of a naturally lined landfill that would receive hydraulically dredged sediments from River
Sections 1 and 2 and mechanically dredged sediments from River Section 3. In this case, essentially all
off-site transportation costs would be eliminated as would the need for northern and southern transfer
facilities (although a transfer operation would be needed immediately adjacent to the CDF).
Transportation (trucking) and landfill construction and operating costs were estimated from
information in technical publications, cost estimating manuals, and personal communications. CDF
costs were estimated based on the hydraulic dredging concept presented in Chapter 5 and Appendix H.
The following tabulation presents a comparison of costs for the REM-3/10/Select alternative considering
the various transportation and disposal options evaluated:
400829 TAMS

Option
Existing Permitted Landfills
New Landfill-one RT/day
New Landfill-two RT/day
Confined Disposal Facility
Distance to Disposal Site
(miles)
250 to > 1000
<200
<100
Near-River
Estimated Capital Costs($million)
$660
$520
$460
$200 to $250
As can be seen from the table, capital costs associated with a CDF are lowest (by over $400
million) because all off-site transportation is eliminated and because neither the northern nor southern
transfer facilities is necessary. Disposal in a new dedicated landfill would reduce project cost by about
$130 million if the landfill were within 200 miles of the transfer facilities. If the landfill were situated
within 100 miles of the Upper Hudson, capital costs for the REM-3/10/Select alternative could be
reduced by about $200 million or approximately 30 percent. For disposal in a new dedicated landfill,
much of the difference in the costs compared to more remote disposal is related to the TSCA-regulated
material. Estimated costs for disposal of the non-TSCA material at a new landfill, including
transportation, are only about 25 percent less than those for remote disposal, while costs for disposal of
TSCA-regulated material are less than half (i.e., about 60 percent less).
9.8.6 Summary of Cost Sensitivity Analyses
Of the several parameters that have been evaluated here, except for the landfill location analysis
presented in subsection 9.8.5, changing dredging depth has the greatest cost significance. A change of
one foot in targeted removal areas impacts the total present value of removal alternatives by up to 30
percent. One conclusion that can be drawn from this is that when additional data related to the vertical
distribution of sediment contamination becomes available, project costs may be substantially altered.
Varying other parameters, such as the assumed non-TSCA threshold PCB concentration and the targeted
removal areas, results in considerably lower cost impacts. Table 9-10 presents a summary of the cost
sensitivity analyses discussed.
It should be noted, however, that beneficial use of the sediments may markedly alter the outcome
of the sensitivity analysis. Remedial costs, in the base case, are heavily influenced by the stabilization,
oo00
9-43 TAMS
shipping, and disposal of the PCB-contaminated sediments. As the shipping of sediments to TSCA and
non-TSCA landfills is reduced, project costs will become more sensitive to factors such as the assumed
TSCA PCB concentration threshold and potentially less sensitive to dredging depth. The full import of
beneficial use cannot be assessed until a detailed strategy for its implementation is developed.
9-44 400831 TAMS

ftrevs
400832

REFERENCES
Abramowicz, D.A.,MJ. Brennan andH.M. VanDort. 1989. Microbial Dechlorination of PCBs 1.Aroclor Mixtures. In Research and Development Program for the Destruction of PCBs, EighthProgress Report. Schenectady: General Electric Company Corporate Research and DevelopmentCenter.
Abramowicz, D.A. 1990. Aerobic and Anaerobic Biodegradation of PCBs: A Review. CriticalReviews in Biotechnology, 10(3).
Alder, A.C., M. Haggblom and L.Y. Young. 1990. Reductive dechlorination of PCBs in sedimentsfrom the Hudson River and New Bedford Harbor. In Research and Development Program for theDestruction of PCBs, Ninth Progress Report. Schenectady: General Electric Company CorporateResearch and Development Center.
Aluminum Company of America (ALCOA). 1999. In-River Particle Broadcasting Treatability StudyWork Plan prepared by Blasland, Bouck and Lee for ALCOA. September 1999.
Alien, J.P. and I.G. Torres. 1993. Physical Separation Technology: A First Step in ContaminatedSediment Treatment. Salt Lake City Research Center. U.S. Department of Interior, Bureau ofMines. Salt Lake City, UT.
American Conference of Governmental Industrial Hygienists (ACGffl). 1999.1999 TLVs and BEIs -Threshold Limit Values for Chemical Substances and Physical Agents/Biological Exposure Indices,ACGIH, Cincinnati, OH.
Averett, D.E., B.D. Perry, J. Torrey and J.A. Miller. 1990. Review of Removal, Containment andTreatment Technologies for Remediation of Contaminated Sediment in the Great Lakes. U.S. ArmyCorps of Engineers, Waterways Experiment Station, Vicksburg, MS. Miscellaneous Paper EL-90-25. December 1990.
Averett, D.E. and M.R. Palermo. 1989. New Bedford Harbor Superfund Project, Acushnet RiverEstuary Engineering Feasibility Study of Dredging and Dredged Material Disposal Alternatives.Report 11. Evaluation and Conceptual Dredging and Disposal Alternatives. U.S. Army Corp ofEngineers, Waterways Experiment Station, Vicksburg, MS.
Barnard, W. D. 1978. Prediction and Control of Dredged Material Dispersion Around Dredging andOpen Water Pipeline Disposal Operations. Technical Report DS-78-13. U.S. Army Corps ofEngineers Waterways Experiment Station, CE, Vicksburg, Mississippi.
Bedard, D.L. 1990. Bacterial Transformation of Polychlorinated Biphenyls. D. Kamely, A.Chakrabarty and G.S. Omen [eds.] In Biotechnology and Biodegradation, Advances in AppliedBiotechnology, Vol. 4. Portfolio Publishing Co., The Woodlands, TX. *•
oBedard, D.L., R.E. Wagner, M.J. Brennan, M.L. Haberl and J.F. Brown. 1987a. Extensive 2Degradation of Aroclors and Environmentally Transformed Polychlorinated Biphenyls by w
Alcaligenes eutropus H850. Applied And Environmental Microbiology, 53(5).
Ref. - 1 TAMS
Bedard, D.L., R.E. Wagner, M.L. Habrel, RJ. May and MJ. Brennan. 1987b. Evidence for NovelMechanisms of Polychlorinated Biphenyl Metabolism in Alcaligenes eutropus H850. Applied andEnvironmental Microbiology, 53(5).
Bedard, D.L., R. Unterman, L.H. Bopp, M.J. Brennan, M.L. Haberl and C. Johnson. 1986. RapidAssay for Screening and Characterizing Microorganisms for the Ability to Degrade PolychlorinatedBiphenyls. Applied and Environmental Microbiology 51 (4).
Bopp, R.F. and H. J.-Simpson. 1989. Contamination of the Hudson River, the Sediment Record, pp.401-416 in Contaminated Marine Sediments - Assessment and Remediation. National AcademyPress, Washington, DC.
Brown Jr., J.F., R.E. Wagner, D.L. Bedard, M.J. Brennan, J.C. and RJ. Carnahan. 1984. PCBTransformations in Upper Hudson Sediments. Northeastern Environ Sci., 3:184-189.
Brown, M.P. and M.B. Werner. 1984. Work/Quality Assurance Project Plan- Sediment Survey ofPCB Contaminated Sediments in Thompson Island Pool of the Hudson River. Prepared forNYSDEC. Albany, NY
Brown, M.P., M.B. Werner, C.R. Carusone and M. Klein. 1988. Distribution of PCBs in theThompson Island Pool of the Hudson River: Final Report of the Hudson River PCB ReclamationDemonstration Project Sediment Survey. Prepared for NYSDEC. Albany, NY.
Buckley E.H. and TJ. Tofflemire. 1983. Uptake of Airborne PCBs by Terrestrial Plants in theTailwater of a Dam. Proc. Nat. Conf. on Environ. Eng. 1983 ASCE Specialty Conf. July 6-8,1983,Boulder, CO, pp. 662-669.
Brunner, C. 1988. Site Cleanup by Incineration. Hazardous Materials Control Research Institute.Silver Spring, MD.
BSD Costlink (Cost Estimating Software for the Microsoft Windows Environment) User Manual(MCACES Compatible), Buildup System Design, 1998.
Burton, W., S. Wiesberg and P. Jacobson. 1992. Entrainment Effects of Maintenance HydraulicDredging in the Delaware River Estuary on Striped Bass Ichthyoplankton. Report by Versar, Inc.Submitted to the Delaware Basin Fish and Wildlife Management Cooperative, Trenton, NJ.
Chen, M., C.S. Hong, B. Bush and G.-Y. Rhee. 1988. Anaerobic Biodegradation of PolychlorinatedBiphenyls by Bacteria from Hudson River Sediments. Ecotoxicology and Environmental Safety 16.
Colorado Cooperative Fishery Research Unit. 1984. Methods to Estimate Aquatic Habitat Variables.Colorado State University, Fort Collins, CO.
Collamer & Associates, Inc. 1990. Stage 1A and IB Cultural Resource Investigation of the HudsonRiver PCB Remnant Site Remediation Project Towns of Moreau & Fort Edward & Saratoga &Washington Counties, New York. Prepared for GE. October 1990.
Ref.-2 400834 TAMS

Connelly, N.A., B.A. Knuth, and C.A. Bisogni. 1992. Effects of the Health Advisory Changes onFishing Habits and Fish Consumption in New York Sport Fisheries. Human Dimension ResearchUnit, Department of Natural Resources, New York State, College of Agriculture and Life Sciences,Fernow Hall, Cornell University, Ithaca, NY. Report for the New York Sea Grant Institute ProjectNo. R/FHD-2-PD, September. (Raw survey data also received electronically from study authors.)
Cornell University. 2000. New York State Regulated Wetlands Maps downloaded fromhttp://cugir.mannlib.Cornell.edu/browse_lis/browse_lis.html on August 14, 2000.
Cullinane, J.C., D.E. Averett, R.A. Shafer, J.W. Male, C.L. Train and M.R. Bradbury. 1986.Guidelines for Selecting Control and Treatment Options for Contaminated Dredged MaterialRequiring Restrictions. Final Report. Department of the Army. U.S. Army Corps of Engineers,Waterways Experiment Station, Vicksburg, MS.
Dames & Moore. 1994. Investigative Work Plan and Interim Abatement Measure (Revised).February 3, 1994. General Electric Co., Fort Edward, NY.
dePercin, P. USEPA. 1999. Personal Communication to J. Higgins of TAMS Consultants, Inc.,Concerning Pennsylvania Mine Reclamation Project. March 21,2000.
Dergosits, J. NYSDEC. 2000. Personal Communication to J. Szeligowski of TAMS ConsultantsInc., from John Dergosits, New York State Canal Corporation. Concerning canal sweeps and canaltraffic.
Dunn Engineering Co. 1994a. Interim Remedial Investigation Report Operable Unit #2. Volume 1of 4, April 8, 1994. General Electric Co., Hudson Falls, NY.
Dunn Engineering Co. 1994b. Hudson Falls Site Investigation Operable Unit #1 and #2, March 1994Monthly Progress Report. April 8, 1994. General Electric Co., Albany, NY.
Dunn Engineering Co. 1994c. Hudson Falls Site Investigation Operable Unit #1 and #2, April 1994Monthly Progress Report. May 9, 1994. General Electric Co., Hudson Falls, NY.
Dunn Geoscience Corp. 1989. Site Investigation Report; General Electric Co. Hudson Falls Plant.Prepared for General Electric Co., Albany, NY.
Dunn Engineering Corp. 1994a. Interim Remedial Investigation Report, Operable Unit #2;GeneralElectric Co. Hudson Falls Plant. Volume 1 of 4, April 18, 1994. Prepared for General Electric Co.,Hudson Falls, NY.
Ellicott International Internet Website. 2000. Information obtained from http://www.dredge.com.
Ebasco Services Inc. 1990. Draft Final Feasibility Study of Remedial Alternatives for the Estuary ^and Lower Harbor/Bay, New Bedford Harbor, Massachusetts. Volume H Report prepared for °USEPA by Ebasco Services. August 2000. oo
COCJ1
Ref. - 3 TAMS

Erickson, Mitchell. 1997. Analytical Chemistry of PCBs (Second Edition). Lewis Publishers, NewYork.
Erie Boulevard Hydropower. 2000. Upper Hudson/Sacandaga River Offer of Settlement. UnitedStates of America before the Federal Energy Regulatory Comission. March 2000.
Farrar, K. 1996a. Personal Communication to Michael Spera, TAMS, from Kevin Farrar, NYSDEC,March 5,1996.
Farrar, K. 1996b. Personal Communication to Michael Spera, TAMS, from Kevin Farrar, NYSDEC,November 22, 1996.
Federal Interagency Stream Restoration Working Group. October 1998. Stream CorridorRestoration: Principles, Processes, and Practices.
Federal Remediation Technologies Roundtable (FRTR) Web Site. 1999. Information obtained fromhttp://www.frtr.gov.
Fletcher, J. S., P.K. Donnelly and R.S. Heagle. 1995. Biostimulation of PCB-degrading Bacteriaby Compounds Released from Plant Roots. Bioremediation of Recalcitrant Organics. R. E.Hinchee, D.B. Anderson, and R. E. Hoeppel, eds., Battelle Press, Columbus, OH, 131-136.
Flood, R.D. 1993. Analysis of Side-Scan Sonar, Bathymetric, Subbottom, and Sediment Data fromthe Upper Hudson River between Bakers Falls and Lock 5. State University of New York at StonyBrook, Marine Science Research Center. Report to TAMS Consultants, Inc. for the Hudson RiverPCB Reassessment RMFS. September 1993.
Francingues, N.R., MJ. Otis and D.E. Averett. 1988. New Bedford Harbor Superfund Project,Acushnet River Estuary Engineering Feasibility Study of Dredging and Dredged Material DisposalAlternatives. Report 1. Study Overview. U.S. Army Corps of Engineers, Waterways ExperimentStation, Vicksburg, MS.
Funderburk, R. 1999. Personal Communication to Jennifer Higgins of TAMS Consultants, Inc.Concerning Dechlorination Immobilization Process. August 30, 1999.
Furakawa, K. 1982. Microbial Degradation of Polychlorinated Biphenyls. In Biodegradation andDetoxification of Environmental Pollutants, Editor A.M. Chakarabarty. CRC Press, Boca Raton, FL.
Garvey, E.A. and D. Tomchuk, USEPA Region 2, 1997. Evidence for Limits on the Extent ofAnaerobic Dechlorination of PCBs in the Hudson River Sediments. Presented at the Society ofEnvironmental Toxicology and Chemistry 18th Annual Meeting, Philadelphia, PA. November 1997.
Garvey, E.A., C. Hunt, H. Pang and J.B. Butcher. 1999. PCB Loss from the Water Column of theUpper Hudson River by Aerobic Degradation and Gas Exchange. Presented at the Society ofEnvironmental Toxicology and Chemistry 20th Annual Meeting, Philadelphia, PA. November 1999.
400836 TAMS

General Electric Company Corporate Research and Development. 1991. In Situ Hudson RiverResearch Study: A Field Study on Biodegradation of PCBs in Hudson River Sediments, FinalReport. February 1992.
General Electric Co. 1994a. Letter to William Daigle, NYSDEC, from John Haggard, GeneralElectric Co., Response to NYSDEC Comments on OU#3 RI Report, including Revised Table 1-1:Hudson River Water Column PCB Monitoring Results. May 12,1994. General Electric Co., Albany,NY.
General Electric Co. 1994b. Letter to William Ports, NYSDEC, from Edward LaPoint, GeneralElectric Co., May 11, 1994. General Electric Co., Albany, NY.
General Electric Co. 1994c. General Electric Co. Fort Edward Monthly Progress Report June 1994.General Electric Co., Albany, NY.
General Electric Co., Applied Environmental Management, Inc. (AEM), and Blasland, Bouck & Lee,Inc. (BBL). 1999. Major Contaminated Sediments Sites Database, Release 1.0, June 1999.
Gilbert, R.O. 1987. Statistical Methods of Environmental Pollution Monitoring. Van NostrandReinhold, New York.
Gradient Corporation. 1999. Development of Preliminary Human Health Based Target ContaminantRanges in Fish. September 29, 1999. (2 page, draft, submitted under cover of letter dated 9/29/99from David Merrill [Gradient] to Bruce Fidler [TAMS]).
Hammer, D. A. 1992. Creating Freshwater Wetlands. Lewis Publishers, Inc., Chelsea, ML
Harza Engineering Co. 1990. Fort Edward Dam PCB Remnant Deposit Containment EnvironmentalMonitoring Program. General Electric Co.
Harkness, M.R., J.B. McDermott, D.A. Abramowicz and J.J. Salvo. 1993. In Situ Stimulation ofAerobic PCB Biodegradation in Hudson River Sediments. General Electric Corporation Report.January 1993.
Harza Engineering Company. 1992. Fort Edward Dam PCB Remnant Deposit ContainmentEnvironmental Monitoring Program, Report of 1991 Results Jan.-Nov. 1991, Volume I. Preparedfor General Electric Corporation.
Hazardous Substance Research Center. 1995. Capping Contaminated Sediments In-situ. Centerpoint,Volume Two, No. 2.
Heaton, S.N., S.J. Bursian, J.P. Giesy, D.E*. Tillitt, J.A. Render, P.O. Jones, D.A. Verbrugge, T.J.Kubiak and R.J. Aulerich. 1995. Dietary exposure of mink to carp from Saginaw Bay, Michigan. ^1. Effects on reproduction and survival, and the potential risk to wild mink populations. Archives oof Environmental Contamination and Toxicology. 28:334-343. w
•jHerbich, J.B. 1992. Handbook of Dredging Engineering. McGraw Hill Inc. NY, USA.
Ref. - 5 TAMS
HSI GeoTrans. 1997. Investigation of Groundwater Seepage in the Upper Hudson River, Preparedfor General Electric Company. October, 1997
Ingersoll et al. 1996. J. Great Lakes Res. 22(3):602-623).
Isaacks, E.H. and R.M. Srivastava. 1989. An Introduction to Geostatistics. Oxford University Press,New York, NY.
Kennish, M. J. 1992. Ecology of Estuaries: Anthropogenic Effects. CRC Press, Boca Raton, FL.
Kong, H.-L. and G.S. Sayler. 1983. Degradation and Total Mineralization of MonohalogenatedBiphenyls in Natural Sediment and Mixed Bacterial Culture. Applied and EnvironmentalMicrobiology 46.
Kurta, A. 1995. Mammals of the Great Lakes Region. The University of Michigan Press, AnnArbor, MI.
Lee, C.R., R.E. Hoeppel, P.G. Hunt and C.A. Carlson, C.A. 1976. Feasibility of the Functional useof Vegetation to Filter, De-water, and Remove Contaminants from Dredged Material, TechnicalReport D-76-4, U.S. Army Corps of Engineers, Waterways Experiment Station, Vicksburg, MS.
Linanne, P. 1999. Personal Communication to J. Higgins of TAMS Consultants, Inc., (PA) Bureauof Abandoned Mine Reclamation. September 1999.
Mackay, D., W.Y. Shiu andK,C. Ma. 1992. Illustrated Handbook of Physical-Chemical Propertiesand Environmental Fate for Organic Chemicals. Volume I - Monoaromatic Hydrocarbons,Chlorobenzenes, and PCBs. Lewis Publishers, Chelsea, MI.
Malcolm Pirnie. 1978. Environmental Assessment: Remedial Measures, Remnant Deposits, FormerFort Edward Pool, Fort Edward, New York. NYSDEC, Albany, NY.
Malcolm Pirnie, Inc. 1984. New York State Barge Canal Environmental Report, MaintenanceDredging Program, 1985-1995, Vol. 1. NYSDOT, Albany, NY.
McDermott, J.M., R. Unterman, MJ. Brennan, R.E. Brooks, D.P. Mobley, C.C. Shwartz and D.K.Dietrich. 1989. Two Strategies for PCB Soil Remediation: Biodegradation and SurfactantExtraction. Environmental Progress, 8(1). 1989.
Menzie Cura &. Associates, Inc (MCA). 1999a. Fax to Bruce Fidler (from Katherine Von.Stackelberg). Target Fish Levels for Hudson River. November 1999.
MCA. 1999b. Memorandum from Katherine Von Stackelberg re: Background Concentrations forFish at River Miles 201 - 216. December, 1999.
Michigan Department of Environmental Quality (MDEQ). 1999. Presentation on U.S.Environmental Protection Agency, Sediment Cleanups, Dredging Results, May 1999.
Ref.-6 400838 TAMS
Montgomery, J. and L. Welkom. 1990. Groundwater Chemicals Desk Reference. Lewis Publishers,Chelsea, MI.
Moore, D.R.J., B.E. Sample, B. R. Parkhurst and R.S. Teed. 1999. A Probabilistic Risk Assessmentof the Effects of Methylmercury and PCBs on Mink and Kingfishers along East Fork Poplar Creed,Oak Ridge, TN. Environmental Toxicology and Chemistry 18(12):2941-2953
Murphy, T., H. Brouwer, A. Moller, M. Fox, D. Jeffries, J. Thachuk, H. Saville and D. Henk. 1993.Proceedings of Workshop on the Removal and Treatment of Contaminated Sediments, EnvironmentCanada's Great Lakes Cleanup Fund, 1993, Toronto. Preliminary Analysis of In-Situ Bioremediationin Hamilton Harbor. Lake Research Branch, National Water Research Institute, Burlington, Ontario.
Myers, T.E. and M.E. Zappi. 1988. New Bedford Harbor Superfund Project, Acushnet RiverEstuary Engineering Feasibility Study of Dredging and Dredged Material Disposal Alternatives.Report 9.Vol. EL-88-15. Laboratory Scale Application of Solidification/Stabilization Technology.U.S. Army Corps of Engineers, Waterways Experiment Station, Vicksburg, MS.
National Oceanic and Atmospheric Administration (NOAA). 1989. Waterproof Chart No. 11Champlain Canal and Southern Lake Champlain, 1989 as derived from NOAA Chart No. 14786,Edition No. 10.
NOAA Damage Assessment Center, E. Monosson. 1999a. Reproductive, Developmental, andImmunotoxic Effects of PCBs in Fish: A Summary of Laboratory and Field Studies. March 1999.
NOAA Damage Assessment Center. 1999b. Development and Evaluation of Consensus-BasedSediment Effects Concentrations for PCBs in the Hudson River. Prepared by MacDonaldEnvironmental Services, Ltd. March 1999.
NOAA Damage Assessment Center. 2000. Maptech BSB Format Digital Nautical Charts, Edition2.2, Region 26.
National Research Council. 1997. Contaminated Sediments in Ports and Waterways: Clean-UpStrategies and Technologies. Marine Board, Commission on Engineering and Technical Systems.
New York State Department of Environmental Conservation (NYSDEC) Division of Air Resources.1991. Air Guide 1 (Draft). 1991.
NYSDEC. 1978. Summary of Hudson River PCB Study Results.. Tech. Paper No. 51. Prepared forNYSDEC by L.J. Hetling, E.G. Horn, and T.J. Tofflemire, Albany, NY.
NYSDEC. 1985. Hudson River PCB Reclamation/Demonstration Project, Evaluation of AlternativePCB Sites/Disposal Technologies. Prepared for NYSDEC by Malcolm Pirnie, Inc. March 1985.
oNYSDEC. 1987. Division of Fish and Wildlife. Niagara River Biota Contamination Project: Fish ^Flesh Criteria for Piscivorous Wildlife, pp 41-48 and Table 26. Technical Report 87-3, Prepared for w
NYSDEC by Newell et al. July 1987.
Ref. - 7 TAMS
NYSDEC. 1989. Fish and Their Habitats in the Upper Hudson Estuary. Prepared by D.M. Carlson,NYSDEC Division of Fish and Wildlife. Albany, NY.
NYSDEC, 1990. PCBS. Newcore:Transmittal Memo from R.F. Bopp at NYSDEC to D. Merrill atGradient Corp. dated 11/19/00. 1976-78 Sediment Survey: Core Samples and Grab Samples.
NYSDEC. 1991. Final Report, Waterford Drinking Water Supply Evaluation. (Hudson River PCBRemnant Site Project - Task 3). Prepared for NYSDEC by Metcalf & Eddy. Albany, NY. 1991
NYSDEC. 1992. Proposed Dredging Locations for the Thompson Island Pool, Lock 5 and 6 Pools,and Lock 2,3,4 Pools. Prepared for NYSDEC by Malcolm Pirnie, Inc. Albany, NY.
NYSDEC. 1993a. Inactive Hazardous Waste Disposal Sites in New York State. Vol. 5. NYSDECRegion 5, Albany, NY.
NYSDEC. 1993b. General Electric Hudson Falls Plant Site. Site Number 5-58-013 (Operable UnitOne) Record of Decision. NYSDEC, Albany, NY.
NYSDEC. 1993c. GE Agrees to Clean Up PCBs at Hudson Falls Plant Site. Remediation Review.6(2): Fall/Winter 1993.
NYSDEC. 1993d. SPDES Discharge Permit NY-0007048, General Electric Fort Edward. November9, 1993. NYSDEC, Albany, NY.
NYSDEC. 1994a. Interim Guidance on Freshwater Navigational Dredging. October 1994. Albany,NY.
NYSDEC. 1994b. Division of Fish Wildlife and Marine Resources, Fish and Wildlife ImpactAnalysis (FWIA) for Inactive Hazardous Waste Sites. October 1994
NYSDEC. 1994c. Letter from William Ports, NYSDEC, to John Haggard, General Electric Co.April 20, 1994
NYSDEC. 1994d. SPDES Limit/Measurement/Violation Report for General Electric Co.,NY0007048. Database Printout Dated June 16, 1994, 53pp.
NYSDEC. 1998. Technical and Operational Guidance Series 1.1.1 (TOGS). Ambient WaterStandards and Guidance Values, June 1998.
NYSDEC. 1999a. Division of Fish, Wildlife and Marine Resources. Technical Guidance forScreening Contaminated Sediment. January 1999.
NYSDEC. 1999b. Natural Heritage Program Report on Rare Species and Ecological Communities.Prepared for TAMS Consultants by the New York Natural Heritage Program, NYSDEC, LathamNY. May 1999.
Ref-'8 400840 TAMS

NYSDEC. 1999c. Table 2, NYSDEC Hale Creek Field Station 1998 Fish Tissue Sample Results,Hudson River Sherman Island Pool, Queensbury New York. Telefax from Bill Ports (NYSDEC)to Bruce Fidler (TAMS) [Table created by Parsons Engineering Science, based on footer],December 1999.
NYSDEC, 1999d. Proposed Remedial Action Plan: GE Capacitor Products Division (Fort Edward),Operable Units 03 & 04.
NYSDEC, 1999e. Fact Sheet. Proposed Remedial Action Plan Announced For General ElectricHudson Falls Plant. November 1999.
NYSDEC, 1999f. Fact Sheet. Public Comment Period Extended on Remedial Action Plan for GEFort Edward Plant Site. March 1999.
NYSDEC, 2000. Natural Heritage Program Report on Rare Species and Ecological Communities.Prepared by NY Natural Heritage Program, NYSDEC, Latham, NY upon the request of TAMSConsultants, Inc. July 27, 2000.
New York State Department of Health (NYSDOH). 1999. Health Consultation: 1996 Survey of TheHudson River Anglers, Hudson Falls to Tappan Zee Bridge at Tarrytown, NY. February 1999.(Raw survey data received electronically from Edward Horn of NYSDOH in June 1998).
NYSDOS. 1987. Hudson River Significant Habitats, Habitat documentation. November 15, 1987.
New York State Department of State (NYSDOS) and the Nature Conservancy. 1990. Division ofCoastal Resources and Waterfront Revitalization and The Nature Conservancy. Hudson RiverSignificant Tidal Habitats: A Guide to the Functions, Values, and Protection of the River's NaturalResources. 184pp.
New York State Thruway Authority, NYS Canal Corporation. 1999. Dredging Chart Section 1Champlain Canal 1999 Navigation Season. Albany, NY. 1999.
Nies, L., P.J. Anid and T.M. Vogel. 1990. Sequential Anaerobic- Aerobic Biodegradation of PCBs.In Research and Development Program for the Destruction of PCBs, Ninth Progress Report. GeneralElectric Company Corporate Research and Development Center. Schenectady NY.
Normandeau Associates, Inc. 1977. Hudson River Survey: 1976-1977. NYSDEC, Albany, NY.
NTIS. 1989. In-Situ Stabilization/Solidification of PCB (Polychlorinated Biphenyls) -ContaminatedSoil. Foster Wheeler Enviresponse, Incorporated, Edison, NJ
Nye, P. 2000. New York State Division of Fish, Wildlife and Marine Resources. EndangeredSpecies Unit. Delmar, NY. Personal Communication by e-mail to H. Chernoff, TAMS Consultants, oInc. August 8, 2000.
O'Brien & Gere Engineers, Inc. 1993a. Data Summary Report: 1991-92 Temporal Water ColumnMonitoring Program, Hudson River Project. Prepared for GE.
Ref. - 9 TAMS

O'Brien and Gere. 1993b. Fort Edward Dam PCB Remnant Containment 1992 Post-ConstructionMonitoring Program. August 1993. General Electric Co., Albany, NY.
O'Brien and Gere. 1994a. Bakers Falls Remedial Investigation Operable Unit 3. January 1994.General Electric Co., Albany, NY.
O'Brien and Gere. 1994b. Fort Edward Dam PCB Remnant Containment 1993 Post-ConstructionMonitoring Program. May 1994. General Electric Co. Albany, NY.
O'Brien & Gere Engineers, Inc. 1995. Fort Edward Dam, PCB Remnant Containment, 1994 Post-Construction Monitoring Program, Hudson River Project. Prepared for GE.
O'Brien & Gere Engineers, Inc. 1998. Data Summary Report Hudson River Project 1996-1997Thompson Island Pool Studies. Prepared for GE. February, 1998.
Ontario Centre for Environmental Technology Advancement (OCETA). 1999. The ErikssonSystem™ Contaminated Sediment Removal and Dewatering. Downloaded fromhttp://www.oceta.on.ca. November 9, 1999.
O'Connor, J. M., D. A. Neumann and J. A. Sherk Jr. 1977. Sublethal Effects of Suspended Sedimenton Estuarine Fish. Technical Paper 77-3. U.S. Army Corps of Engineers, Coastal EngineeringResearch Laboratory, Fort Belvoir, VA.
Ohio Division of Wildlife. 2000. http://www.ngpc.state.ne.us/wildlife/otters.html. River otter webpage accessed November 10, 2000.
Oliver, J.S. and L.W. Hulberg. 1977. Patterns of Succession in Benthic Infaunal CommunitiesFollowing Dredging and Dredged Material Disposal in Monterey Bay. Dredged Material ResearchProgram. Technical Report D-77-27. US Army Corps of Engineers, Waterways Experiment Station,Vicksburg, MS.
Olsen, C.R., P.E. Biscaye, H.J. Simpson, R.M. Trier, N. Kostyk, R.F. Bopp, Y.H. Li and H.W. Feely.1980. Reactor-released Radionuclides and Fine-grained Sediment Transport and AccumulationPatterns in Barnegat Bay, New Jersey and Adjacent Shelf Waters. Estuarine and Coastal MarineScience 10:119-142.
Palermo, M.R., J.E. Clausner, M.P. Rollings, G.L. Williams, T.E. Meyers, TJ. Fredette and R.E.Randall. 1998. Guidance for Subaqueous Dredged Material Capping. Technical Report DOER-1U.S. Army Corps of Engineers, Waterways Experiment Station, Vicksburg, MS. June 1998.
Palermo, M.R. and V.R. Pankow. 1988. New Bedford Harbor Superfund Project, Achushnet RiverEstuary Engineering Feasibility Study of Dredging and Dredged-Material Disposal Alternatives.Report 10. Evaluation of Dredging and Dredging Control Technologies. U.S. Army Corps ofEngineers, Waterways Experiment Station, Vicksburg, MS.
Ref.-10 400842 TAMS

Payne, B.S., A.C. Miller and T. Ussery. 1993. Effects of Benthic Barriers on MacroinvertebrateCommunities. Technical Report A-93-5. US Army Corps of Engineers (USAGE), WaterwaysExperiment Station, Vicksburg, MS. October 1993.
Peddicord, R. K. and V.A. McFarland. 1978. Effects of Suspended Dredged Material on AquaticAnimals. Technical Report D-78-29. U. S. Army Corps of Engineers, Waterways ExperimentStation, Vicksburg, MS.
Ports, W. 1994a. Personal Communication to Michael Spera, TAMS Consultants, Inc., fromWilliam Ports, NYSDEC, August 18, 1994.
Ports, W. 1994b. Personal Communication to Michael Spera, TAMS Consultants, Inc., from WilliamPorts, NYSDEC, May 24, 1994.
Ports, W. 1994c. Personal Communication to Michael Spera, TAMS Consultants Inc., from WilliamPorts, NYSDEC, July 20, 1994.
Ports, W. 1996. Personal Communication to Michael Spera, TAMS Consultants Inc., from WilliamPorts, NYSDEC, March 20, 1996.
Ports, W. 2000. Personal Communication to Ed Garvey, TAMS Consultants Inc., from WilliamPorts, NYSDEC, June 8, 2000.
Price, R.A. and Lee, C.R. 1999. Evaluation of Dredged Material for Phytoreclamation Suitability,DOER Technical Notes Collection (TN-DOER-C3), U.S. Army Engineer Research andDevelopment Center, Vicksburg, MS. Provided at http://www.wes.army.mil/el/dots/doer.
Price, R.A., C.R. Lee and J.W. Simmers. 1999. Phytoreclamation of Dredged Material: A WorkingGroup Summary, DOER Technical Notes Collection (TN-DOER-C9), U.S. Army Engineer Researchand Development Center, Vicksburg, MS. Provided at http://www.wes.army.mil/el/dots/doer.
Quantitative Environmental Analysis, LLC. (QEA). 1999. PCBs in the Upper Hudson River.Volume 2- A Model of PCB Fate, Transport, and Bioaccumulation. Prepared for GE by QEA.Albany, NY. May 1999.
Quensen, J.F., S.A. Boyd and J.M. Tiedje. 1990. Dechlorination of Four CommercialPolychlorinated Mixtures (Aroclors) by Anaerobic Microorganisms from Sediments. Applied andEnvironmental Microbiology 56.
Quensen, J.F., J.M. Tiedje and S.A. Boyd. 1988. Reductive Dechlorination of PolychlorinatedBiphenyls by Anaerobic Microorganisms from Sediment. Science 242:752-754.
Remediation Technologies Network Remediation Information Management System (RIMS)Database. 2000. Owned and Operated by the Research Technologies Network, L.L.C. provided onhttp://www. enviroglobe.com.
u>
Ref. - 11 TAMS
Renholds, J. 1998. In Situ Treatment of Contaminated Sediments. Prepared for USEPA Office ofSolid Waste and Emergency Response, Technology Innovation Office by Jon Renholds, NationalNetwork of Environmental Management Studies Fellow. December 1998.
Restum, J.C., SJ. Bursian, J.P. Giesy, J.A. Render, W.G. Helferich, E.B. Ship and D.A. Verbrugge.1998. Multigenerational Study of the Effects of Consumption of PCB-Contaminated Carp fromSaginaw Bay, Lake Huron, on Mink. 1. Effects on Mink Reproduction, Kit Growth and Survival,and Selected Biological Parameters. Journal of Toxicology and Environmental Health, Part A,54:343-375.
Rhee, G.-Y. and B. Bush. 1990. Dechlorination and Biodegradation of Chlorinated Biphenyls inAnaerobic Sediments. In Biological Remediation of Contaminated Sediments with SpecialEmphasis on the Great Lakes, Report of a Workshop. C.T. Jafvert and J.E. Rodgers [eds.j.Manitowoc, WI: 17-19, July 1990.
Rhee, G.-Y., B. Bush, M.P. Brown, M. Kane and L. Shane. 1989. Anaerobic Biodegradation ofPolychlorinated Biphenyls in Hudson River Sediments and Dredged Sediments in ClayEncapsulation. Water Research 23(8):957-964.
Safe, S. 1984. Microbial Degradation of Polychlorinated Biphenyls. Microbio. Ser. 13.
Safe, S. 1990. Polychlorinated Biphenyls (PCBs), dibenzo-p-dioxins (PCDDs), dibenzofurans(PCDFs) and Related Compounds: Environmental and Mechanistic Considerations which Supportthe Development of Toxic Equivalency Factors (TEFs). Critical Reviews in Toxicol. 21:51-88.
Scott, M.L. 1977. Effects of PCBs, DDT, and Mercury Compounds in Chickens and JapaneseQuail. Federation Proceed. 36:1888-1893.
Shiaris, M.P. and G.S. Sayler. 1982. Biotransformation of PCB by Natural Assemblages ofFreshwater Microorganisms.. Environmental Science and Technology 16 (6).
Singh, S., F.K. Higson, L.M. Nadim and D.T. Gibson. 1988. Oxidation of PolychlorinatedBiphenyls by Pseudomonas putida LB400. In Land Disposal, Remedial Action, Incineration andTreatment of Hazardous Waste, Proceedings of the Thirteenth Annual Research Symposium.Cincinnati, Ohio: May 6-8,1987. USEPA-600/9-88/021, Cincinnati: Hazardous Waste EngineeringResearch Laboratory, USEPA.
Sirrine Environmental Consultants. 1990. Feasibility Study, Final Report, 102nd Street LandfillSite, Niagara Falls, New York, Vol. 1. Greenville, SC.
Slpan, R.J., K.W. Simpson, R.A. Schroeder and C.R. Barnes. 1983. Temporal Trends TowardStability of Hudson River PCB Contamination. Bull, of Environ Contam. Toxicol. 31.
Sofaer, A.D. 1976. Interim Opinion and Order in the Matter of Alleged Violations of theEnvironmental Conservation Law of the State of New York by General Electric Co., Respondent.NYSDEC File No. 2833. February 9, 1976. Albany, NY.
Ref.-12 400844 TAMS
Stanne, S.P., R.G. Panetta and B.E. Forist. 1996. The Hudson: An Illustrated Guide to the LivingRiver. Rutgers University Press. New Brunswick, NJ.
Stern, E. M. and W. B. Stickel. 1978. Effects of Turbidity and Suspended Material in AquaticEnvironments, Literature Review. Technical Report D-78-21. U. S. Army Corps of EngineersWaterways Experiment Station, Vicksburg, MS.
Sturgis, T.C. and D. Gunnison. 1988. New Bedford Harbor Superfund Project, Acushnet RiverEstuary Engineering Feasibility Study of Dredging and Dredged Material Disposal Alternatives,Report 6, Laboratory Testing for Subaqueous Capping. Vol. EL-88-15. U.S. Army Corps ofEngineers, Waterways Experiment Station, Vicksburg, MS.
Sumeri, A. 1996. Dredged Material is Not Spoil: A Report on the Use of Dredged Material in PugetSound to Isolate Contaminated Sediments. Proceedings from In-situ Capping of ContaminatedSediment - A Seminar for Decision Makers, Chicago, EL. November 20-21, 1996.
ThermoRetec Consulting Corp. 1999. Draft Feasiblity Study for the Lower Fox River, Wisconsin.Prepared for Wisconsin Department of Natural Resources. February 1999.
Thibodeaux, L. J. 1992. Louisiana State University Short Course: Transport and Fate of Chemicalsin the Environment.
Tiedje, J.M., S.A. Boyd and J.F. Quensen. 1987. Reductive Dechlorination of PCBs in AnaerobicMicrobial Communities. In Research and Development Program for the Destruction of PCBs, SixthProgress Report. General Electric Company Corporate Research and Development Center,Schenectady, NY.
Tiedje, J.M., S.A. Boyd, J.F. Quensen and J. Schimel. 1989. Reductive Dechlorination of PCBs byAnaerobic Microorganisms. In: Research and Development Program for the Destruction of PCBs,Eighth Progress Report. General Electric Company Corporate Research and Development Center,Schenectady, NY.
Tofflemire, TJ. and S.O. Quinn. 1979. PCB in the Upper Hudson River: Mapping and SedimentRelationships. NYSDEC Technical Paper No. 56, Albany, NY.
Tofflemire, T. J. 1984. PCB Transport in the Fort Edward Area. Northeastern Environ Sci. Volume3. Numbers 3 & 4.
U. S. Army Corps of Engineers (USAGE). 1987a. Beneficial Uses of Dredged Material. EngineerManual No. 1110-2-5026. Department of the Army, Corps of Engineers, Office of the Chief ofEngineers.
USAGE. 1987b. Confined Disposal of Dredged Material. Engineer Manual No. 1110-2-5027. ^oo
USAGE. 1990. New Bedford Harbor Superfund Pilot Study. Evaluation of Dredging and Dredged ooMaterial Disposal. New England Division. m
Ref. - 13 TAMS
USAGE. 1993. Engineering and Design, Dredging and Dredged Material Disposal. Departmentof the Army, Corps of Engineers, Office of the Chief of Engineers.
USAGE. 1999. Draft Dredged Material Management Plan for the Port of New York and NewJersey. U.S. Army Corps of Engineers, New York District.
US Army Corps of Engineers Waterways Experiment Station (USAGE WES). 1989. Predicting andMonitoring Dredge Induced Dissolved Oxygen Reduction. Environmental Effects of DredgingTechnical Notes, EEDP-06-9.
USAGE WES. 1998. Entrainment by Hydraulic Dredges - A Review of Potential Impacts. DredgingOperations and Environmental Research Technical Note, DOER-EL
U.S. Department of Agriculture (USDA), US Environmental Protection Agency (USEPA),Tennessee Valley Association (TVA), Federal Emergency Management Agency (FEMA), USDepartment of Commerce, US Department of Defense, US Department of Housing and UrbanDevelopment, and US Department of the Interior. 1998. Steam Corridor Restoration, Principles,Processes, and Practices. October 1998.August 1991.
U.S. Department of Commerce. 1999. Bureau of Census. Census of Population and HousingSTF3A July 1999.
U. S. Environmental Protection Agency (USEPA). 1982. Final Environmental Impact Statement(EIS) On The Hudson River PCS Reclamation Demonstration Project. October 1982
USEPA. 1984a. Record of Decision, Hudson River PCB Site. USEPA, Region ft September.
USEPA. 1984b. Feasibility Study, Hudson River PCBs Site, New York, Volume I. Prepared forUSEPA Region by NUS Corporation, April 1984.
USEPA. 1985. Covers for Uncontrolled Hazardous Waste Sites, EPA/540/2-85-002. September1985.
USEPA. 1988. Guidance for Conducting Remedial Investigations and Feasibility Studies underCERCLA. Interim Final. EPA 540/G-89/004. Office of Emergency and Remedial Response,Washington, DC. October 1988.
USEPA. 1989a. Methods for Evaluating the Attainment of Cleanup Standards, Volume 1: Soils andSolid Media, Report No. PB89-234959. Prepared by USEPA, Statistical Policy Branch (PM-223),Office of Policy, Planning, and Evaluation. February 1989.
USEPA. 1989b. Risk Assessment Guidance for Superfund (RAGS), Volume I. Human HealthEvaluation Manual (Part A). USEPA, Office of Emergency and Remedial Response, Washington,D.C. USEPA/540/1-89/002, December 1989.
Ref.-14 400846 TAMS
USEPA. 1990a. Office of Emergency and Remedial Response. Guidance on Remedial Actions forSuperfund Sites with PCB Contamination. EPA/540/G-90/007; OSWER Directive 9355.4-01,August 1990.
USEPA. 1990b. National Oil and Hazardous Substances Pollution Contingency Plan, Final Rule,codified as amended at 40 CFR Part 300.
USEPA. 1990c. Scope of Work - Hudson River PCB Reassessment RVFS. December 1990.
USEPA. 199la. Phase 1 Report - Review Copy - Interim Characterization and Evaluation, HudsonRiver PCB Reassessment RI/FS. USEPA Work Assignment No. 013-2N84. Prepared for USEPAby TAMS Consultants, Inc. and Gradient Corporation. August 1991.
USEPA. 199 Ib. EPA Handbook. Remediation of Contaminated Sediments. Office of Research andDevelopment. Washington, D.C.
USEPA. 1991c. Innovative Treatment Technologies. Overview and Guide to Information Sources.EP A/540/9-91/002.
USEPA. 1992. Responsiveness Summary for Phase 1 Report - Interim Characterization andEvaluation, Hudson River PCB Reassessment RI/FS. Prepared for USEPA by TAMS Consultants,Inc. and Gradient Corporation. July 1992.
USEPA. 1993a. Interim Report on Data and Methods for Assessment of 2,3,7,8-Tetrachlorodibenzo-p-dioxin Risks to Aquatic Life and Associated Wildlife (Table E-l). EPA/600/R-93/055. Office ofResearch and Development. March 1993.
USEPA. 1993b. Selecting Remediation Techniques for Contaminated Sediment. EPA/823/B93/001.June 1993.
USEPA. 1993c. Technology Alternatives for the Remediation of PCB-Contaminated Soil andSediment. EPA/540/S-93/506. October 1993.
USEPA. 1993d. Seminars - Bioremediation of Hazardous Waste Sites: Practical Approaches toImplementation. EPA/600/K-93/002.
USEPA. 1994. Assessment and Remediation of Contaminated Sediments (ARCS) ProgramRemediation Guidance Document. Great Lakes National Program Office. EPA-905-B94-003.
USEPA. 1995. Phase 2 Report - Review Copy. Further Site Characterization and Analysis, Volume2A- Database Report, Hudson River PCBs Reassessment RI/FS. Prepared for USEPA Region 2,New York by TAMS Consultants, Inc. and Gradient Corporation. October 1995.
USEPA. 1996a. Phase 2 Report- Review Copy. Further Site Characterization and Analysis, Volume ^2B - Preliminary Model Calibration Report, Hudson River PCBs RI/FS. Prepared for USEPA, gRegion n by Limno-Tech, Inc., Menzie-Cura & Associates and the Cadmus Group, Inc. October oo1996. S
Ref. - 15 TAMS
USEPA. 1996b. Calculation and Evaluation of Sediment Effect Concentrations for the AmphipodHyalella azteca and the Midge Chironomus riparius. Great Lakes National Program Office,Assessment and Remediation of Contaminated Sediments (ARCS) Program (EPA 905-R96-008).September 1996.
USEPA. 1996c. Office of Research and Development 600/P-96/001F. PCBs: CancerDose-Response Assessment and Application to Environmental Mixtures. Prepared for the USEPAby J. Cogliano. January 1996.
USEPA. 1997a. Phase 2 Report, Further Site Characterization and Analysis, Volume 2C - DataEvaluation and Interpretation Report (DEER), Hudson River PCBs RJ7FS. Prepared for USEPARegion 2 and USAGE by TAMS Consultants, Inc., the Cadmus Group, Inc., and GradientCorporation. February 1997.
USEPA. 1997b. Landfill/Treatment Facility Siting Survey, Hudson River PCBs ReassessmentRI/FS. Prepared for USEPA Region 2 and USAGE, Kansas City District by TAMS Consultants, Inc.December 1997.
USEPA. 1997c. The incidence and severity of sediment contamination in surface waters of theUnited States. EPA 823/R-97-006. Office of Science and Technology, Washington, DC.
USEPA. 1997d. Rules-of-Thumb for Superfund Remedy Selection. EPA/540R-97/013.August 1997.
USEPA. 1998a. Hudson River PCBs Reassessment RI/FS; Responsiveness Summary for Volume2A: Database Report; Volume 2B: Preliminary Model Calibration Report; Volume 2C: DataEvaluation and Interpretation Report. Prepared for USEPA Region 2 and USAGE, Kansas CityDistrict by TAMS Consultants, Limno-Tech, Inc, Menzie-Cura & Associates, Inc., and TetraTech,Inc. December 1998.
USEPA. 1998b. Further Site Characterization and Analysis. Volume 2C-A Low ResolutionSediment Coring Report (LRC), Addendum to the Data Evaluation and Interpretation Report,Hudson River PCBs Reassessment RI/FS. Prepared for USEPA Region 2, New York by TAMSConsultants, Inc., Gradient Corporation, and TetraTech, Inc. July 1998.
USEPA. 1998c. National Conference on Management and Treatment of Contaminated SedimentsProceedings, Cincinnati, OH, May 13-14, 1997. EPA/625/R-98/001. August 1998.
USEPA. 1998d. Hudson River PCB's Reassessment RI/FS Phase 3 Feasibility Study Scope of Work.Prepared for USEPA Region 2 and USAGE by TAMS Consultants, Inc. September 1998.
USEPA. 1998e. Contaminated Sediment Management Strategy. 823/R-98-001. 1998.
USEPA. 1999a. Further Site Characterization and Analysis, Volume 2D - Baseline Modeling Report(BMR), Hudson River PCBs Reassessment RI/FS. Prepared for USEPA Region 2 and USAGE byLimno-Tech, Inc, Menzie-Cura & Associates, Inc., and Tetra-Tech, Inc. May 1999.
Ref.-16 400848 TAMS

USEPA. 1999b. Responsiveness Summary for Volume 2C-A Low Resolution Sediment CoringReport, Addendum to the Data Evaluation and Interpretation Report. Prepared for USEPA Region2 and the USAGE, Kansas City District by TAMS and TetraTech, Inc. February 1999.
USEPA. 1999c. Further Site Characterization and Analysis, Volume 2E - Baseline Ecological RiskAssessment (ERA), Hudson River PCBs Reassessment RI/FS. Prepared for USEPA Region 2 andUSAGE, Kansas City District by TAMS Consultants, Inc. and Menzie-Cura & Associates, Inc.August 1999.
USEPA. 1999d. Further Site Characterization and Analysis, Volume 2F - Human Health RiskAssessment (HHRA), Hudson River PCBs Reassessment RI/FS. Prepared for USEPA Region 2 andUSAGE, Kansas City District by Gradient Corporation and TAMS Consultants, Inc. August 1999.
USEPA. 1999e. Phase 2 Report - Review Copy. Further Site Characterization and Analysis,Volume 2E-A Baseline Ecological Risk Assessment for Future Risks in the Lower Hudson River,Hudson River PCBs Reassessment RI7FS. Prepared for USEPA Region 2 and USAGE, Kansas CityDistrict by TAMS Consultants, Inc. and Menzie-Cura & Associates, Inc. December 1999.
USEPA. 1999f. Phase 2 Report - Review Copy. Further Site Characterization and Analysis,Volume 2F-A Human Health Risk Assessment for the Mid-Hudson River, Hudson River PCBsReassessment RI/FS. Prepared for USEPA Region 2 and USAGE, Kansas City District by TAMSConsultants, Inc. and Gradient Corporation. December 1999.
USEPA. 1999g. The Superfund Innovative Technology Evaluation (SITE) Program: TechnologyProfiles, Tenth Edition. EPA/540/R-99/500.
USEPA. 1999h. Issuance of Final Guidance: Ecological Risk Assessment and Risk ManagementPrinciples for Superfund Sites. OSWER Directive 9285.7-28P. October 1999.
USEPA. 1999L Integrated Risk Information System (IRIS) Chemical Files for Aroclor 1016;Aroclor 1254, and Polychlorinated Biphenyls. National Center for Environmental Assessment,Cincinnati, Ohio.
USEPA. 1999J. Use of Monitored Natural Attenuation at Superfund, RCRA Corrective Action, andUnderground Storage Tank Sites. Office of Solid Waste and Emergency Response Directive 9200.4-17P. April 1999.
USEPA. 1999k. Hudson River PCBs Reassessment RI/FS Responsiveness Summary for Phase 3-Feasibility Study Scope of Work. Prepared for USEPA Region 2 and USAGE, Kansas City Districtby TAMS Consultants, Inc. June 1999.
USEPA. 1999m. Fast Track Dredged Material Decontamination Demonstration for the Port of NewJersey and New York. Report to Congress on the Water Resources and Development Acts of 1990,1992 and 1996. EPA 000-0-99000. December 1999.
USEPA. 1999n. Evaluation of Removal Action Alternatives Thompson Island Pool Early ActionAssessment. March 1999.
Ref. - 17 TAMS

USEPA. 2000a. Further Site Characterization and Analysis, Revised Baseline Modeling Report(RBMR), Hudson River PCBs Reassessment RI/FS Volume 2D. Prepared for USEPA Region 2 andUSAGE, Kansas City District by TAMS Consultants, Inc., Limno-Tech, Inc., Menzie-Cura &Associates, Inc., and Tetra-Tech, Inc. January 2000.
USEPA. 2000b. Responsiveness Summary for Volume 2D - Baseline Modeling Report. Preparedfor USEPA Region 2 and USAGE, Kansas City District by TAMS Consultants, Inc., Limno-Tech,Inc., Menzie-Cura & Associates, Inc. and TetraTech, Inc. February 2000.
USEPA. 2000c. Responsiveness Summary for Volume 2E - Baseline Ecological Risk Assessment.Prepared for USEPA Region 2 and USAGE, Kansas City District by TAMS Consultants, Inc. andMenzie-Cura & Associates, Inc. March 2000.
USEPA. 2000d. Responsiveness Summary for Volume 2F - Human Health Risk Assessment,Hudson River PCBs Reassessment RI7FS. Prepared for USEPA Region 2 and USAGE, Kansas CityDistrict by TAMS Consultants, Inc. and Gradient Corporation. March 2000.
USEPA. 2000e. Hazardous Waste Clean-up Information (CLU-IN) Web Site. Provided athttp://www.clu-in.org.
USEPA. 2000f. Remediation and Characterization Innovative Technologies (USEPA REACH IT)Database (includes VISITT; Vendor FACTS; and ITT). Provided at http://www.epareachit.org.
USEPA. 2000g. Response to Peer Review Comments on Volume 2B- Preliminary ModelCalibration Report, Hudson River PCBs RI/FS. Prepared for USEPA, Region 2 by Limno-Tech,Inc., Menzie-Cura & Associates, and the Cadmus Group, Inc. February 2000.
USEPA. 2000h. Responsiveness Summary for Volume 2E-A- Baseline Ecological Risk Assessmentfor Future Risks In The Lower Hudson River, Hudson River PCBs Reassessment RI/FS. Preparedfor USEPA, Region 2 and USAGE, Kansas City District by TAMS Consultants, Inc. andMenzie-Cura & Associates, Inc. August 2000.
USEPA. 2000L Responsiveness Summary for Volume 2F-A- Human Health Risk Assessment forthe Mid-Hudson River, Hudson River PCBs Reassessment RI/FS. Prepared for USEPA Region 2and USAGE by TAMS Consultants, Inc. and Gradient Corporation. August 2000.
USEPA. 2000J. Response to Peer Review Comments on Volume 2C-(DEIR) and 2C-A-(LRC),Hudson River PCBs Reassessment RI/FS. Prepared for the USEPA, Region 2 and USAGE by byTAMS Consultants, Inc. November 2000. .
USEPA. 2000k. Response to Peer Review Comments on the Baseline Ecological Risk Assessment(ERA), Hudson River PCBs Reassessment RI/FS. Prepared for the USEPA Region 2 and USAGEby TAMS Consultants, Inc. and Menzie-Cura & Associates, Inc. November 2000.
USEPA. 2000m. Response to Peer Review Comments on the Human Health Risk Assessment(HHRA), Hudson River PCBs Reassessment RI/FS. Prepared for the USEPA Region 2 and USAGEby TAMS Consultants, Inc. and Gradient Corporation. November 2000.
Ref.-18 400850 TAMS

USEPA. 2000n. Response to Peer Review Comments on the Revised Baseline Modeling Report(RMBR), Hudson River PCBs Reassessment RI/FS. Prepared for the USEPA Region 2 and USAGEby TAMS Consultants, Inc., Limno-Tech, Inc., Menzie Cura & Associates, Inc. and Tetra-Tech, Inc.November 2000.
USEPA. 2000p. Further Site Characterization and Analysis, Revised Human Health RiskAssessment (HHRA) Volume 2F, Hudson River PCBs Reassessment RI/FS. Prepared for theUSEPA Region 2 and USAGE by TAMS Consultants, Inc. and Gradient Corporation, November2000.
USEPA. 2000q. Further Site Characterization and Analysis, Revised Baseline Ecological RiskAssessment (ERA), Volume 2E. Prepared for USEPA Region 2 by TAMS Consultants, Inc. andMenzie-Cura & Associates, November 2000.
USEPA. 2000r. Institutional Controls: A Site Managers Guide to Identifying, Evaluating andSelecting Institutional Controls at Superfund and RCRA Corrective Action Cleanups. Office ofSolid Waste and Emergency Response. OSWER 9355.0-74FS-P, EPA 540-F-00-005. September2000.
USEPA, 2000s. Office of Research and Development, National Center for EnvironmentalAssessment Integrated Risk Information Sysem. Chemical Substance file for PolychlorinatedBiphenyls. Last updated 6/1/97. Accessed 10/27/00 at http://www.epa.gov.iris.
USEPA. 2000t. Database for the Hudson River PCBs Reassessment RI/FS. Release 5.0 (CompactDisk). Prepared for USEPA Region 2 and the USAGE, Kansas City District by TAMS Consultants,Inc. October, 2000.
U. S. Fish and Wildlife Service (USFWS). 1999. Letter from M.W. Clough for D.A. Stillwell,Acting Field Supervisor to H. Chernoff, TAMS Consultants, regarding federal endangered andthreatened species.
USFWS. 2000. National Wetland Inventory Maps downloaded from http://wetlands.fws.gov onAugust 14, 2000.
U.S. Geological Survey (USGS). 2000. U.S. Department of the Interior. Flow rates downloadedfrom http://water.usgs.gov.
Unterman, R., D.L. Bedard, M.J. Brennan, L.H., Bopp, F.J. Mondello, R.E. Brooks, D.P. Mobley,J.B. McDermott, C.C. Schwartz and D.K. Dietricho. 1988. Biological Approaches forPolychlorinated Biphenyl Degradation. Basic Life Science, Volume 45, p.253-269. 1988.
Wade, P.M., as cited in Geoffrey Petts and Peter Calow. 1996. River Restoration. Blackwell ^Science, Inc., Maiden, MA. g
ooWalker, E.P. 1997. Walker's Mammals of the World. John Hopkins University Press, Baltimore, £1MD. ISBN 0-8018-3790-X.
Ref. - 19 TAMS
Water Resource Institute (WRI). 2000. Evaluation of the Effectiveness of Remediation Dredging:The Fox River Deposit N Demonstration Project November 1998 - January 1999. Fox RiverRemediation Advisory Team WRI University of Wisconsin-Madison. Madison WI June 2000.
White, E. and C. Bolattino. 1998. Realizing Remediation: A Summary of Contaminated SedimentRemediation Activities in the Great Lakes Basin. Great Lakes Nation Program Office. March 1998.
Wiemeyer, S.N., C.M. Bunck and C.J. Stafford. 1993. Environmental Contaminants in Bald EagleEggs - 1980-84 - and Further Interpretations of Relationships to Productivity and Shell Thickness.Archives of Environmental Contamination and Toxicology. 24:213-227.
Zeman, A.J., S. Sills, J.E. Graham and K.A. Klein. 1992. Subaqueous Capping of ContaminatedSediments: Annotated Bibliography. National Water Research Institute. NWRI Contribution No.92-65.
Ref--20 400852 TAMS
Related Documents