30 Reasons for Variations in the Levels of Efficiency in Smallholder Dairy Milk Production in Sri Lanka: A Cross Sectional Data Analysis J.C. Edirisinghe 1 , M.P. Edirisinghe 2 and D.M. Auwardt 2 ABSTRACT In the light of poverty of dairy smallholders and the inability of the Sri Lankan dairy production sector to meet the national demand for dairy milk and milk products, this study looks into why there is a variation in the levels of efficiency achieved by farmers to highlight the policy measures to combat this issue. Using a production frontier, the average levels of efficiency was found to be very low at 52% relative to the most efficient farmer in the sample. This indicates that an efficiency gain of 48% can be achieved if this problem is properly addressed. Identified reasons for this high inefficiency is discussed in detail in this article. Findings suggest that a policy on development of smallholder dairy farming would essentially incorporate the development of veterinary services and knowledge transfer in the producing areas. Keywords: Efficiency, Dairy smallholders INTRODUCTION airy milk production is an important activity at smallholder level. It plays a vital role in the lives of rural base farm families in providing regular cash income and gainful employments. Further, this sector makes a major contribution to the economy by utilizing large areas of marginal lands and substantial amounts of crop residues which would otherwise have a little alternative use. According to the annual report of the Central Bank of Sri Lanka (CBSL), 193 million litres of milk has been produced in the country in the year 2005. Majority of 1 Department of Agribusiness Management Faculty of Agriculture and Plantation Management Wayamba University of Sri Lanka, Makandura, Gonawila (NWP) [email protected] 2 Milco (Pvt.) Limited Nawala Road, Narahenpita which was cow’s milk (161.8 million litres) while the balance came from buffaloes (30.9 million litres). However, this milk supply only met 15% of the total national demand. Therefore, the value of milk and milk products imported to the country was US$133 million in 2005 (UNCTAD/WTO 2006). (Figure 1) Thus, it is important to study how improvements can be made in the dairy milk production for two reasons. One, it generates vital incomes for poor farmers and can be used as a vehicle out of poverty. Second, increases in production reduce the wastage of foreign exchange earnings on imports of dairy milk and milk products. With this view in mind, this research looks at one part of this massively complicated problem of improving smallholder dairy production; ‘the efficiency of production’. Why Study Efficiency? The smallholder farmers are resource poor by nature. According to the agricultural census (2002), 80% of the dairy smallholdings had less than 1ha of land (Department of Census and Statistics, 2002). Further, most of the cattle producing farm families are poor. Due to this reason, rather than advocating investments for the small farmer, which may be beyond their present capacity, it is prudent to inquire into the ways and means of using the existing resources to the maximum. Thus, efficiency analysis is tantamount. Most importantly, it enables us to analyse the impact exogenous influences characterising the ‘environment’ which production takes place, on producer performances which is paramount in policy decisions. These influences can be in the nature of quality of inputs, ownership form, managerial characteristics, etc (Kumbharkar and Lovell, 2003). Thus, many studies involving efficiency analysis hitherto have concentrated on this issue as this paper does. D

Welcome message from author
This document is posted to help you gain knowledge. Please leave a comment to let me know what you think about it! Share it to your friends and learn new things together.
Transcript
30
Reasons for Variations in the Levels of Efficiency in Smallholder Dairy Milk Production in Sri Lanka: A Cross Sectional Data Analysis
J.C. Edirisinghe1, M.P. Edirisinghe2 and D.M. Auwardt2
ABSTRACT
In the light of poverty of dairy smallholders and the inability of the Sri Lankan dairy production sector to meet the national demand for dairy milk and milk products, this study looks into why there is a variation in the levels of efficiency achieved by farmers to highlight the policy measures to combat this issue. Using a production frontier, the average levels of efficiency was found to be very low at 52% relative to the most efficient farmer in the sample. This indicates that an efficiency gain of 48% can be achieved if this problem is properly addressed. Identified reasons for this high inefficiency is discussed in detail in this article. Findings suggest that a policy on development of smallholder dairy farming would essentially incorporate the development of veterinary services and knowledge transfer in the producing areas. Keywords: Efficiency, Dairy smallholders
INTRODUCTION
airy milk production is an important activity at smallholder level. It plays
a vital role in the lives of rural base farm families in providing regular cash income and gainful employments. Further, this sector makes a major contribution to the economy by utilizing large areas of marginal lands and substantial amounts of crop residues which would otherwise have a little alternative use. According to the annual report of the Central Bank of Sri Lanka (CBSL), 193 million litres of milk has been produced in the country in the year 2005. Majority of
1Department of Agribusiness Management Faculty of Agriculture and Plantation Management Wayamba University of Sri Lanka, Makandura, Gonawila (NWP) [email protected]
2Milco (Pvt.) Limited Nawala Road, Narahenpita
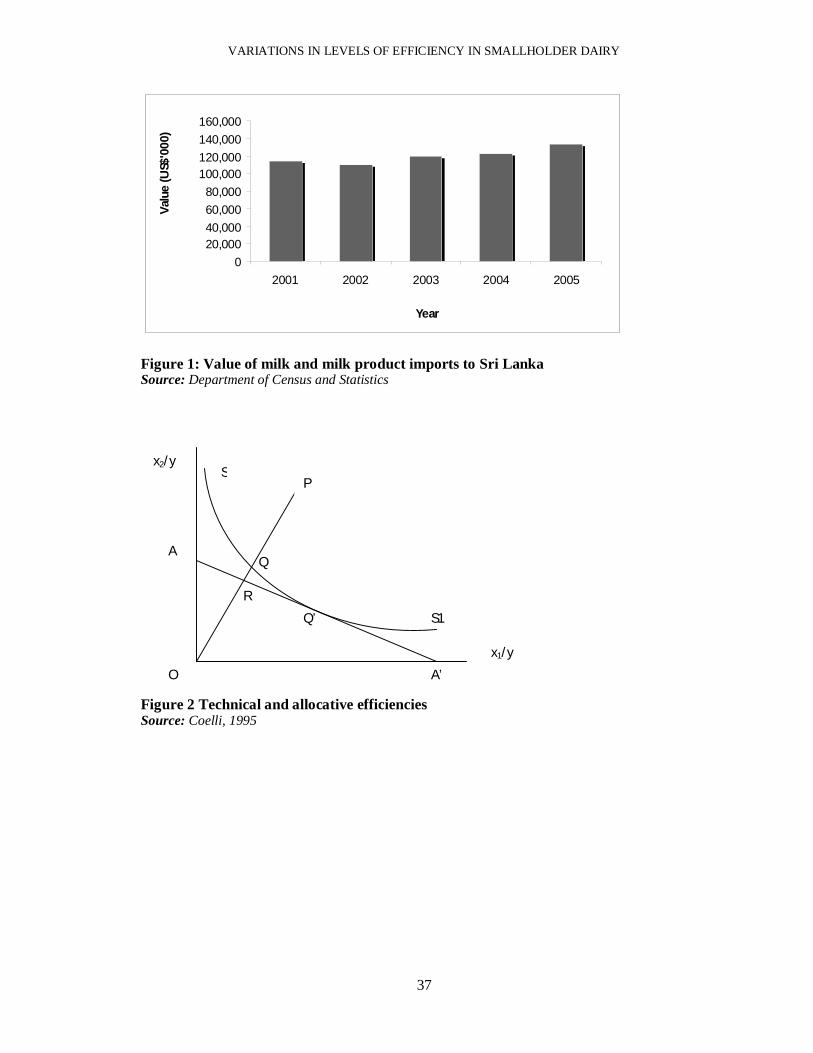
which was cow’s milk (161.8 million litres) while the balance came from buffaloes (30.9 million litres). However, this milk supply only met 15% of the total national demand. Therefore, the value of milk and milk products imported to the country was US$133 million in 2005 (UNCTAD/WTO 2006). (Figure 1) Thus, it is important to study how improvements can be made in the dairy milk production for two reasons. One, it generates vital incomes for poor farmers and can be used as a vehicle out of poverty. Second, increases in production reduce the wastage of foreign exchange earnings on imports of dairy milk and milk products. With this view in mind, this research looks at one part of this massively complicated problem of improving smallholder dairy production; ‘the efficiency of production’. Why Study Efficiency?
The smallholder farmers are resource poor by nature. According to the agricultural census (2002), 80% of the dairy smallholdings had less than 1ha of land (Department of Census and Statistics, 2002). Further, most of the cattle producing farm families are poor. Due to this reason, rather than advocating investments for the small farmer, which may be beyond their present capacity, it is prudent to inquire into the ways and means of using the existing resources to the maximum. Thus, efficiency analysis is tantamount. Most importantly, it enables us to analyse the impact exogenous influences characterising the ‘environment’ which production takes place, on producer performances which is paramount in policy decisions. These influences can be in the nature of quality of inputs, ownership form, managerial characteristics, etc (Kumbharkar and Lovell, 2003). Thus, many studies involving efficiency analysis hitherto have concentrated on this issue as this paper does.
D
VARIATIONS IN LEVELS OF EFFICIENCY IN SMALLHOLDER DAIRY
31
The next section summarises the concept of efficiency followed by the methods used in data collection and analysis. Succeeding sections reports results and the conclusions derived.
METHODOLOGY
Theoretical Framework
Theoretical literature on productive efficiency began in the 1950s with the work of Koopmans (1951), Debreu (1951) and Shephard (1953). Productive efficiency was first measured empirically by Farrell (1957). Farrell used the terms Technical Efficiency (TE), Pricing Efficiency and Overall efficiency1 in his seminal paper. Technical efficiency refers to the ability of a firm to obtain maximum output from a given set of inputs and pricing efficiency refers to the ability of a firm to use inputs in optimal proportions when their input prices are given2. When a firm is achieving both TE and AE it is said to be economically efficient. The concept used by Farrell is illustrated in figure 2. In figure 1, SS1 refers to a unit iso-quant. If SS1 of the fully efficient firm is known and a given firm is using input quantities at point P to produce unit output, the TE is defined as OQ/OP. When OP is more than OQ, the firm is less than efficient. When OP is equal to OQ, the firm is fully efficient given the available technology. That is, a firm who is operating at point Q (on the efficient iso-quant) is technically efficient. However, if the input price ratio is represented by the AA’ line in the above figure, the allocative efficiency of the firm at P is defined as OR/OQ because RQ represents the reduction in production costs that would occur if production were to
1 Later, others used terms Allocative Efficiency (AE) instead of pricing efficiency and Economics Efficiency for overall efficiency.
2 Allocative(pricing) efficiency refers to a situation where marginal cost of inputs is equal to the value of marginal product of the output.
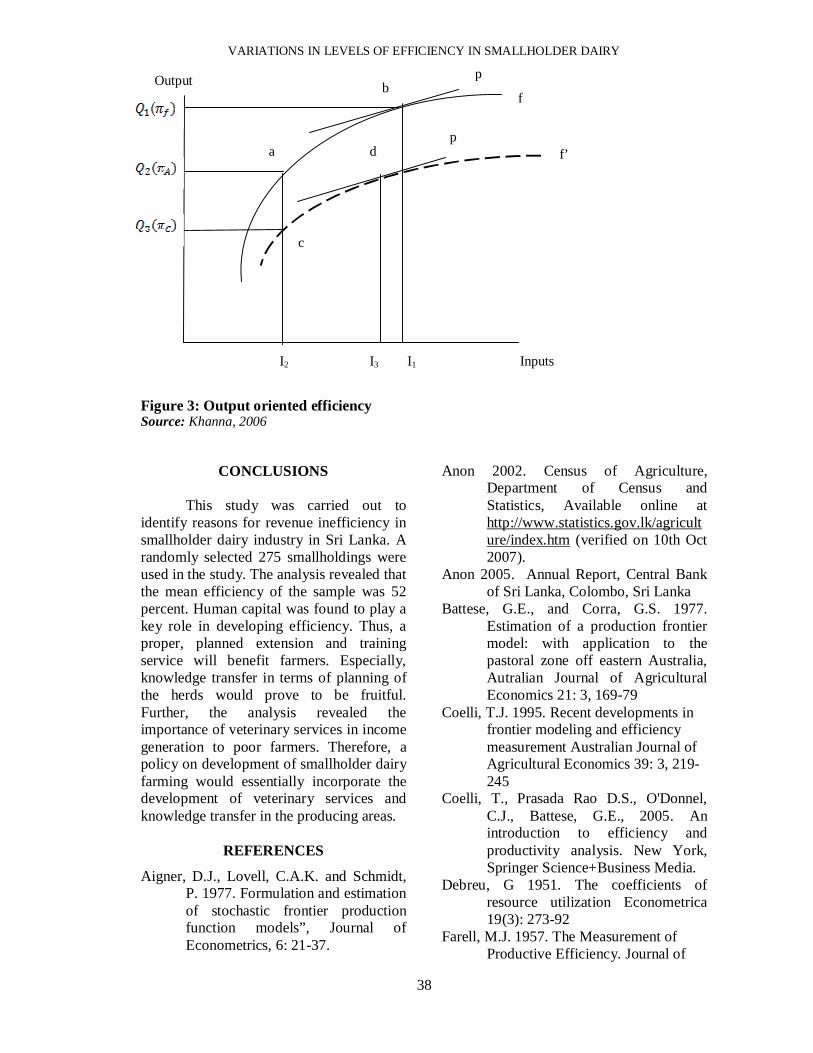
occur allocatvely efficient point Q’. The total economic efficiency is the ratio OR/OP. Thus, it is obvious that the economic efficiency is the product between technical and allocative efficiency viz., (OQ/OP)(OR/OQ)=(OR/OP). Here, Farrell has used an input oriented scheme in measuring efficiency. The output oriented measure of efficiency analysis which is used in this paper is illustrated in figure 3.
In figure 2, the line f gives the best practice production frontier. Line p shows the price line. As is well known, when the price line is tangent to the production frontier at b, the firm is economically efficient. That is, the firm is technically as well as allocatively efficient. However, due to various reasons, farmers may not operate on the best practice output curve and may operate below on the line f ’. As the price line p is tangent to the output frontier f ’ at d, a farmer operating at d also is allocatively efficient as marginal cost of input is equal to the value of the marginal product of the output. However, it should be noted that frontier f ’ lie below the best practice line f and therefore the production could be raised to output levels at frontier f. Hence, any level of production lying on f ’ is not technically efficient as the production could be raised further with the same input bundle. It is evident from the foregoing discussion that farmers operating at point a are technically efficient but inefficient in pricing while farmers operating at point c are neither technically nor allocatively efficient. Literature on efficiency analysis has taken two major paths as parametric and non-parametric, depending on whether the functional form of the efficient frontier is pre-defined (parametric) or estimated from the sample observations empirically (non-parametric). The parametric analysis is further subdivided into ‘deterministic’ and ‘stochastic’ frontiers. In the deterministic framework the frontier is defined such that it envelopes all the observations and any deviations from the frontier is assumed to be due to inefficiency. This implies that the deviation from the frontier is assumed to be
VARIATIONS IN LEVELS OF EFFICIENCY IN SMALLHOLDER DAIRY
32
under the control of the farmer. However, this may not be a valid assumption as there may be situations such as weather, socio-economic factors, uncertainty etc which are beyond the control of the farmer. Therefore, stochastic frontier analysis was developed. In this case, the deviation from the frontier is assumed to have two parts, viz. the noise effect and the inefficiency effect (Murillo-Zamorano, 2004). Accordingly, this study used the stochastic frontier analysis or the composed error framework as it effectively takes this set back in to account of the noise effect. The stochastic frontier model was independently and simultaneously developed by Aigner, Lovell and Schmidt (1977), Meeusen and van den Broeck (1977) and Battese and Corra (1977). The stochastic frontier is defined as;
Where, yi is the production vector while xi denotes the input vector. The vector ‘ ’ represents the parameters of the production frontier to be estimated. What is important in this linear model is the composition of the error term. Here, Vi is the idiosyncratic error. It is assumed to have a symmetric distribution. The term Ui is assumed to be one sided (non-negative) and commonly referred to as the variation due to inefficiency. While ix' in the equation (1) above maps the deterministic part of the frontier3. The shape of the distribution of Ui is an important assumption in efficiency 3 Actual observed value of the output can either lie above or below this depending on the sign and magnitude of the idiosyncratic error. However, the actual observations tend to lie below the frontier. They may lie above the frontier in situations where the noise effect is positive and larger than the inefficiency effect (Coelli et al, 2005).
analysis and has been discussed and debated in literature. Many of the previous researches were focussed up on the distribution of this one sided error. Several candidate distributions such as half normal, exponential, truncated normal, gamma etc have been tried and tested by various authors. (cited in Green, 2007; Murillo-Zamorano, 2004). The measurement of efficiency is central to any study that uses the stochastic frontier. The most popular output oriented measure of technical efficiency is given as (Coelli et al, 2005), The choice of distributional assumption of the inefficiency term affects these efficiency scores. It is best to test all the distributional assumptions but it comes with computational costs. Some computer programs have automated some of these distributions and others have not. Although different distributional assumptions can give different efficiency predictions, ranking of efficiencies are robust to distributional assumptions (Coelli et al, 2005). Hence this study used a simpler truncated normal assumption available in FRONTIER computer program for analysis. Incorporation of Exogenous Influences on Efficiency
In a policy oriented research on efficiency analysis, most important is to see the exogenous shocks on efficiency. Early approaches in efficiency analysis used a two step procedure where at first, the stochastic frontier is estimated and the efficiencies predicted. Then in a second stage regression, the predicted efficiencies are regressed with firm specific variables in an attempt to see whether efficiency scores vary with these variables. However, this method is criticised for its assumption of independence of inefficiency effects in the two stages (Coelli et al, 2005). Hence, here
yi = x'i + i i = 1,2,………N (1) i = Vi – Ui (2) Where, Ui 0
TEi = yi
exp(x'i + Vi ) exp(x'i + Vi – Ui)
exp(x'i + Vi ) (3) exp(– Ui) = =
VARIATIONS IN LEVELS OF EFFICIENCY IN SMALLHOLDER DAIRY
33
we used the second method automated in FRONTIER V4.1. Where, Ui is assumed to account for the inefficiency in production and distributed as
),( 2uimN with truncations at zero where,
ii zm . Here, zi represents a vector of variables that affects the efficiency of the firm while is a vector of parameters to be estimated. The important parameterizations in this model are, Where,
2 = total variation u
2 =variation due to inefficiency v
2 =variation due to noise Hence, gamma specifies the ratio of variation due to inefficiency to the total variation. It is evident that this should be between 1 and 0. A higher value of gamma is an indication of presence of inefficiency. The Econometric Model
A functional form is needed to get the above estimates. Most commonly used forms include the Translog function and the Cobb-Douglas function. A Cobb-Douglas function is used here because the complications due multicollinearity in the Translog specification. Thus, the model estimated is given by,
(8) Taking natural log of both sides of equation (8) enables us to use linear regression procedure to this non-linear equation.
Where, Yi refers to the dependent variable while Xi refers to independent variables used in the study (Table 1) Data and Variables
Data used for the study was collected in the year 2006. Data pertaining to production levels, revenue, inputs and other socio economic variables were collected. The size of the sample was 275 dairy smallholdings and thus the unit of analysis is a dairy holding. The description the variables used in the analysis is given in table 1.
RESULTS AND DISCUSSION
Summary Statistics
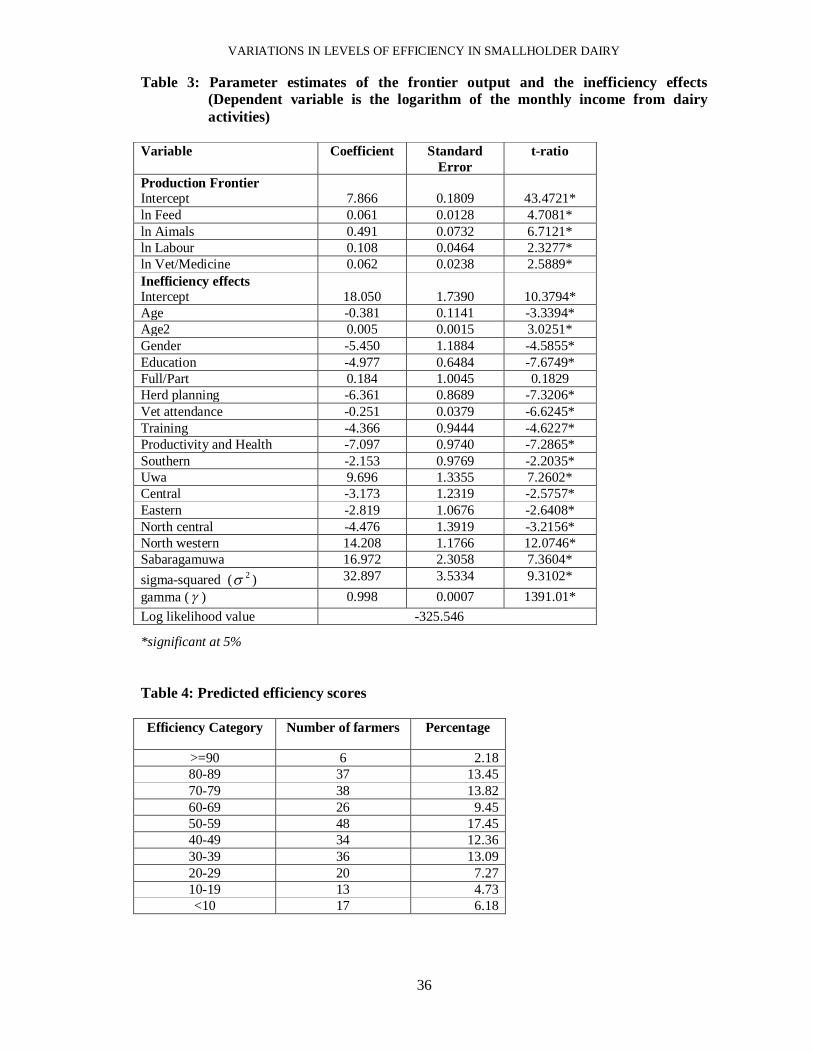
The descriptive statistics of the variables used in the analysis are given in table 2. The regression output is reported in table 3. A very high value of was observed indicating that observed variation in production among farmers was mainly due to inefficiency (see equation 5). The significant log likelihood value indicates that the model is a good fit. All the inputs are found to be significant in the estimated frontier with the expected positive sign. It is evident from table 3, that elasticity4 of output with respect to the number of animals in milk is the highest. A 10% increase in animals in milk increases revenue by 4.9% when evaluated at the variable means. In other words, doubling the number of animals in milk (an increase by 50%) will increase the revenue by 24.55%. If a farmer has one animal in milk, she can increase the income by approximately 25% by having another animal in milk. This highlights the importance of proper planning of the herd. However, the sum of the regression
4 Since a Cobb-Douglas form was estimated, the coefficients directly estimate the elasticity with respect to each input.
yi = x'i +( Vi – Ui ) (4)
mi = i (6)
(5)
(7) 2 u ( 2 u + 2 )
2 = 2 + 2 and =
1 (9)
VARIATIONS IN LEVELS OF EFFICIENCY IN SMALLHOLDER DAIRY
34
coefficients are less than one indicating a decreasing returns to scale in production5. A negative sign with respect to the variables in the inefficiency effects reflects that the higher values of these variables, reduces inefficiency. The variables age, education and training represents human capital available in the household. From the results in the table 3, it is clear that human capital play a vital role in obtaining maximum revenue from available resources as all these variables are significant and has a negative sign. Development of human capital available in the dairy holdings will increase incomes by reducing inefficiency (wastage of productive resources). Suitable training programs, extension activities etc can be used to enhance the levels in efficiency. Apart from the dummy variables representing the provinces, the highest coefficient estimates were found with respect to ‘productivity and health’ and ‘herd planning’ variables. As discussed before (table 1), the former variable represents the farmers’ perception on the health of their animals which is given a score of 1 to 3 by farmers where 3 being the animals are healthy. This shows the importance of maintaining the good health of the animals. This implies the key role played by the veterinary services. This is further strengthened by the significant and negative coefficient of the ‘Vet attendance’ variable. The mean level of attendance of veterinary services to dairy herds in the sample was found to be 4.8 times per year, which is substandard. Thus, improving veterinary services in these dairy producing areas will provide fruitful results. The significant negative coefficient of the herd planning variable reflects that the farmers who plan their herds and manage them are more efficient than others. As noted before the importance of herd planning was evident in the high significance of animals in milk in the production frontier itself. Therefore, farmers should be educated on
5 The returns to scale is measured as
its importance. A proper extension service may be in need. The dummy variables for the provinces were developed relative to the western province. Thus, all the coefficients reported in table 3 are relative to the western province. These dummies were incorporated in the analysis in order to control for the different effects due to location that could not be measured. These may include environmental factors, developments in markets, roads, and other infrastructure facilities. Incidentally, it was found that farmers in Southern, Central, Eastern and North Central provinces were efficient in revenue generation than the farmers in western province. The Efficiency Scores
The efficiency levels were found to be on the lower side. The distribution of efficiency scores is given in table 4. The efficiency levels reported in table 4 are relative the most efficient farmer in the sample. That is, given the most efficient farmer in the sample had an efficiency level of 100, majority of the farmers in the sample had a level of efficiency below 60%. In fact the average level of efficiency was 52% indicating a heavy wastage of resources, which could have used to generate more revenue, had they been managed properly.
VARIATIONS IN LEVELS OF EFFICIENCY IN SMALLHOLDER DAIRY
35
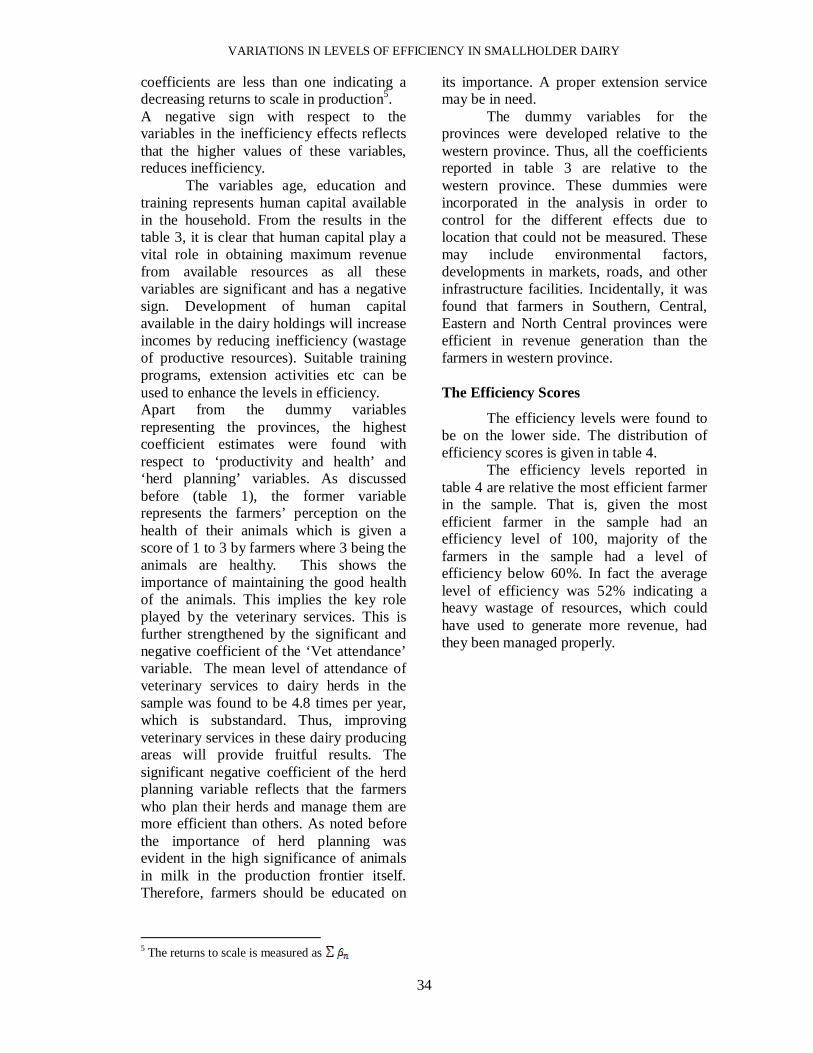
Table1: Description of variables used
Variable Name Description Variables in the
Stochastic Frontier
ln Y Log of Income generated from dairy production activities ln Feed Log of expenditure on buying feed for animals ln Aimals Log of number of animals in milk ln labour Log of number of hours spent in dairy activities per day ln vet/medicine Log of expenditure on veterinary services and medicine
Inefficiency effects Age Age of head of household. This represents the human capital gained
through experience. Age2 Square of age. Expects efficiency to decrease with Age2 as older farmers
may not be efficient as relatively younger farmers. Gender 1 = if household head is male, o = otherwise Education Number of years in education Full/Part 1 = it is a full time farmer, 0 = otherwise Herd planning 1 = the household plans the herd, 0 = otherwise Vet attendance Number of visits by veterinary officer to the household during the year Training 1 = household head had a training on dairy activities before,
0 = otherwise Productivity and Health Farmers’ valuation of the health and productivity of animals. Southern 1 = households from Southern province, 0 = otherwise Uwa 1 = households from Uwa province, 0 = otherwise Central 1 = households from Central province, 0 = otherwise Eastern 1 = representing households from Eastern province, 0 = otherwise North central 1 = households from North Central province, 0 = otherwise North western 1 = households from North Western province, 0 = otherwise Sabaragamuwa 1 = households from Sabaragamuwa province, 0 = otherwise Table 2: Descriptive statistics of the continuous variables
Variable Mean Standard deviation Milk income 5197.69 3614.49 Expenditure on feed 1254.21 973.07 No. Of animals in milk 2.68 2.62 Labour hours 8.34 4.34 Age of household head 45.54 11.46 Vet attendance per year 4.88 7.45
VARIATIONS IN LEVELS OF EFFICIENCY IN SMALLHOLDER DAIRY
36
Table 3: Parameter estimates of the frontier output and the inefficiency effects (Dependent variable is the logarithm of the monthly income from dairy activities)
Variable Coefficient Standard
Error t-ratio
Production Frontier Intercept
7.866
0.1809
43.4721*
ln Feed 0.061 0.0128 4.7081* ln Aimals 0.491 0.0732 6.7121* ln Labour 0.108 0.0464 2.3277* ln Vet/Medicine 0.062 0.0238 2.5889* Inefficiency effects Intercept
18.050
1.7390
10.3794*
Age -0.381 0.1141 -3.3394* Age2 0.005 0.0015 3.0251* Gender -5.450 1.1884 -4.5855* Education -4.977 0.6484 -7.6749* Full/Part 0.184 1.0045 0.1829 Herd planning -6.361 0.8689 -7.3206* Vet attendance -0.251 0.0379 -6.6245* Training -4.366 0.9444 -4.6227* Productivity and Health -7.097 0.9740 -7.2865* Southern -2.153 0.9769 -2.2035* Uwa 9.696 1.3355 7.2602* Central -3.173 1.2319 -2.5757* Eastern -2.819 1.0676 -2.6408* North central -4.476 1.3919 -3.2156* North western 14.208 1.1766 12.0746* Sabaragamuwa 16.972 2.3058 7.3604* sigma-squared ( 2 ) 32.897 3.5334 9.3102* gamma ( ) 0.998 0.0007 1391.01* Log likelihood value -325.546
*significant at 5% Table 4: Predicted efficiency scores Efficiency Category Number of farmers Percentage
>=90 6 2.18 80-89 37 13.45 70-79 38 13.82 60-69 26 9.45 50-59 48 17.45 40-49 34 12.36 30-39 36 13.09 20-29 20 7.27 10-19 13 4.73 <10 17 6.18
VARIATIONS IN LEVELS OF EFFICIENCY IN SMALLHOLDER DAIRY
37
0
20,00040,000
60,000
80,000
100,000120,000
140,000
160,000
2001 2002 2003 2004 2005
Year
Val
ue (U
S$'0
00)
Figure 1: Value of milk and milk product imports to Sri Lanka Source: Department of Census and Statistics
Figure 2 Technical and allocative efficiencies Source: Coelli, 1995
A’
R
Q’
Q
S
S1
A
O
x2/y
x1/y
P
VARIATIONS IN LEVELS OF EFFICIENCY IN SMALLHOLDER DAIRY
38
Figure 3: Output oriented efficiency Source: Khanna, 2006
CONCLUSIONS
This study was carried out to identify reasons for revenue inefficiency in smallholder dairy industry in Sri Lanka. A randomly selected 275 smallholdings were used in the study. The analysis revealed that the mean efficiency of the sample was 52 percent. Human capital was found to play a key role in developing efficiency. Thus, a proper, planned extension and training service will benefit farmers. Especially, knowledge transfer in terms of planning of the herds would prove to be fruitful. Further, the analysis revealed the importance of veterinary services in income generation to poor farmers. Therefore, a policy on development of smallholder dairy farming would essentially incorporate the development of veterinary services and knowledge transfer in the producing areas.
REFERENCES
Aigner, D.J., Lovell, C.A.K. and Schmidt, P. 1977. Formulation and estimation of stochastic frontier production function models”, Journal of Econometrics, 6: 21-37.
Anon 2002. Census of Agriculture, Department of Census and Statistics, Available online at http://www.statistics.gov.lk/agriculture/index.htm (verified on 10th Oct 2007).
Anon 2005. Annual Report, Central Bank of Sri Lanka, Colombo, Sri Lanka
Battese, G.E., and Corra, G.S. 1977. Estimation of a production frontier model: with application to the pastoral zone off eastern Australia, Autralian Journal of Agricultural Economics 21: 3, 169-79
Coelli, T.J. 1995. Recent developments in frontier modeling and efficiency measurement Australian Journal of Agricultural Economics 39: 3, 219-245
Coelli, T., Prasada Rao D.S., O'Donnel, C.J., Battese, G.E., 2005. An introduction to efficiency and productivity analysis. New York, Springer Science+Business Media.
Debreu, G 1951. The coefficients of resource utilization Econometrica 19(3): 273-92
Farell, M.J. 1957. The Measurement of Productive Efficiency. Journal of
Inputs
Output
I1 I3 I2
c
a d
b
p
p
f’
f
VARIATIONS IN LEVELS OF EFFICIENCY IN SMALLHOLDER DAIRY
39
the Royal Statistical Society. Vol. 120.
Green, W. 2007. "The econometric approach to efficiency analysis", Tenth European workshop on efficiency and productivity analysis IESEG school of management, Lille.
Koopmans, T.C. 1951. An analysis of production as an efficient combination of activities. In T.C. Koopmans, ed., Activity analysis of production and allocation, Cowles Commision for Research in Economics, Monograph No.13. New York: Wiley
Kumbhakar, S.C. and Lovell, C.A.K. 2003. Stochastic frontier analysis. Cambrdge University Press 327pp
Meeusen, W. and van den Broeck, J 1977. Efficiency estimation from Cobb-Douglas production functions with composed error. International Economics Review, 18: 435-444
Murillo-Zamorano, L.R. 2004. Economic Efficiency and Frontier Techniques. Journal of Economic Surveys, 18:33-77.
Shephard, R. W. 1953. Cost and production functions. Princeton University Press, Princeton
UNCTAD/WTO., 2006 International Trade Statistics by Country and Product Group, Rue de Montbrillant: International Trade Centre UNCTAD/WTO.
Related Documents