2 CERTIFICATE This is to certify that thesis titled “ Implementation of Lean Six Sigma in Indian Construction” is a bona-fide record of work done by Ravi Jain (Entry No2013 CET2150) to the department of Civil Engineering, Indian Institute of Technology, Delhi, India. He has fulfilled the requirements of this thesis, which to the best of my knowledge has reached the required standard. This thesis is carried under my supervision and guidance and has not been submitted else-where for the award of any other degree. Dr. Kumar Neeraj Jha Associate Professor Department of Civil Engineering Indian Institute of Technology Delhi

Welcome message from author
This document is posted to help you gain knowledge. Please leave a comment to let me know what you think about it! Share it to your friends and learn new things together.
Transcript

2
CERTIFICATE
This is to certify that thesis titled “Implementation of Lean Six Sigma in Indian
Construction” is a bona-fide record of work done by Ravi Jain (Entry No2013 CET2150) to
the department of Civil Engineering, Indian Institute of Technology, Delhi, India. He has fulfilled
the requirements of this thesis, which to the best of my knowledge has reached the required
standard. This thesis is carried under my supervision and guidance and has not been submitted
else-where for the award of any other degree.
Dr. Kumar Neeraj Jha
Associate Professor
Department of Civil Engineering
Indian Institute of Technology Delhi

3
ACKNOWLEDGEMENTS
I take this opportunity to express my sincere gratitude to my supervisor Dr. Kumar Neeraj Jha,
Department of Civil Engineering for his guidance, support and continuous encouragement
throughout the research.
I also express my extreme gratitude to Mr. Harsh Raghuvanshi and Mr. Dilip A Patel, Research
Students for help in research plans and obtaining contact details of the construction
professionals.
I am extremely thankful to all the construction professional who provided their valuable time to
fill the questionnaire.
I am thankful to all my friends who have helped in the research.
Ravi Jain
2013CET2150

4
ABSTRACT
Construction projects are facing are large cost and schedule overruns in India. This can be
attributed to different types of waste in the industry. It is necessary to understand nature of waste
and causes of waste in Indian construction and then find suitable tools to eliminate or reduce
them. The Lean Construction and Six Sigma can provide such tools.
The purpose of the research is to analyze the wastes in the Indian Construction, the awareness of
Lean and Six Sigma and the extent of use of Lean and Six Sigma tools. The research also tries to
access the possible ways of interaction of Lean and Six Sigma.
In the research work a questionnaire has been prepared according to research objectives and sent
to construction professionals. The responses will be analyzed and practical framework for the
implementation of Lean Six Sigma will be developed.
The research will help the construction industry to systematically address the wastes and
maximize value provided to the customer.

5
CONTENTS
Certificate………………………………………………………………………………………….2
Acknowledgement………………………………………………………………………………...3
Abstract………………………………………………………………………………………........4
Table of Contents………………………………………………………………………………….5
List of tables……………………………………………………………………………………….7
List of figures……………………………………………………………………………………...8
Abbreviations………………………………………………………………………………….......9
1 Introduction…………………………………………………………………………………….10
1.1 Research need……………………………………………………………………….......10
1.2 Research Objectives……………………………………………………………….........10
1.3 Research Methodology………………………………………………………………….10
1.4 Organization of the
Thesis………………………………………………………………................................11
2 Literature Review……………………………………………………………………………12
2.1 Introduction………………………………………………………………………….......12
2.2 Lean
Construction………………………………………………………………………..........12
2.2.1 Introduction……………………………………………………………………....12
2.2.2 Waste…………………………………………………………………………......12
2.2.3 Principles of Lean Construction……………………………………………….....14
2.3 Six
Sigma………………………………………………………………………………..15
2.3.1 Definition………………………………………………………………………...15
2.3.2 Six Sigma Methodologies ………………………………………………….........17
2.3.3 Statistical definition of Six Sigma…………………………………………….....18
2.3.4 Six Sigma Techniques and Tools…………………………...................................19
2.4 Lean Six
Sigma…………………………………………………………………………................21
2.5 Chapter Summary…………………………………………………………………….....23
3 Research Methodology………………………………………………………………….......24
3.1 Data Collection………………………………………….................................................24
3.1.1 Data Collection tool………………………………...............................................24
3.1.2 Questionnaire
Preparation………………………………………………………………………24

6
3.2 Data Analysis…………………………………………………………………….............25
3.2.1 Response collection…………………………………………………………..........26
3.2.2 Responses analysis………………………………………………………………...26
3.2.3 Graphical Result Presentation……………………………………………………...27
4. Work Progress and Future Plan…………………………………………………………........28
4.1 Work Progress……………………………………………………………………………28
4.2 Future plan……………………………………………………………………………….30
References………………………………………………………………………………………..31
Appendix…………………………………………………………………………………………33

7
LIST OF TABLES
Table1-1: Research Methodology……………………………………………………………......11
Table 2-1: Type of Wastes……………………………………………………………………….13
Table 2-2: Top 10 Types and Causes of Waste in Abu-Dhabi
Industry…………………………………………………………………………………………14
Table2-3: Basic Six Sigma Conversion Table to DPMO……………… ………….....................19
Table3-1: The research objectives and question format in the questionnaire…………………...24
Table 3-2: Type of waste and causes of waste used in the questionnaire survey of the project…25
Table3-3: Identification of Possible ways of interaction of Lean and Six Sigma…….. ……….26
Table3-4: Cronbach alpha and internal
consistency……………………………………………...27

8
LIST OF FIGURRES
Fig. 2-1: Cause and Effect Diagram……………………………………………………………..20
Fig. 2-2: Lean Project Delivery System and Six Sigma…………………………………………21
Fig.2-3: Concept of Six Sigma integrated approach with lean construction…………………….22
Fig.4-1: Profile of the construction professionals ……………………………………………....28
Fig.4-2: Familiarity with Lean Construction in Participants ……………………………………29
Fig.4-3: Familiarity with Six Sigma in Participants ……………………………………………29

9
ABBREVIATIONS
DPMO Defects per million opportunity
JIT Just in Time
NVA Non Value adding
TFV Transform Flow Value
VA Value adding
VSM Value Stream Mapping

10
1 INTRODUCTION
1.1 RESEARCH NEED
The waste is the most important problem of the construction of India. These wastes causes large
time and schedule overruns. The wastes are defined as the activities which use resources, cost
and time but do not provide value to the customer. It is required to reduce these wastes. Lean
Construction and Six Sigma can be useful in this. Lean Construction seeks to reduce wastes
while Six Sigma is used to reduce process variation. These two techniques are derived from
manufacturing process. Use of these in India is in initial phase. Research tries to understand how
Lean Construction and Six Sigma can interact to reduce wastes.
1.2 RESEARCH OBJECTIVES
The aim of the research is to analyze wastes in Indian construction and how tools of Lean and
Six Sigma can be used to reduce theses wastes.
The objectives of the research are:
To identify types and causes of waste in the Indian Construction Industry.
To understand the acceptability and suitability of the tools and techniques of Lean
Construction and Six Sigma in the Indian Construction.
To access the current level of application of Lean Construction and Six Sigma in India.
To understand how Lean Construction and Six Sigma can interact together for Indian
Construction and suggest a framework for implementation of Lean Six Sigma.
1.3 RESEARCH METHODOLOGY
Research Methodology can be summarized in the following table 1-1:

11
Table1-1: Research Methodology
Step Description
1. Literature Survey To get data for questionnaire preparation
2. Questionnaire Survey Online questionnaire preparation and sent
to construction Professionals
3. Data analysis Statistical analysis
4. Results and Recommendation Results displayed using various Statistical
Parameters and Suggestion of Framework
for Implementation of Lean Six Sigma In
India
The detailed research methodology is given in chapter 3.
1.4 ORGANIZATION OF THE THESIS
Chapte1 Introduction: This chapter covers the need of the research, objectives and research
methodology.
Chapter2 Literature Study: This chapter provides identification of wastes, tools and techniques of
Lean and Six Sigma in construction from existing literature.
Chapter3 Research Methodology: Data collection and data analysis methodology has been
presented.
Chapter4 Work progress and Future Plan: This chapter provides work done and future plan of the
research.

12
2 LITERATURE STUDY
2.1 INTRODUCTION
This chapter describes the concepts of waste, Lean Construction, Six Sigma and Lean Six Sigma.
It provides an explanation of the tools and techniques of Lean and Six Sigma from the literature
study. It also provides the case studies and frameworks for implementation of Lean and Six
Sigma in the construction industry by various authors.
2.2. LEAN CONSTRUCTION
2.2.1 Introduction
Lean Construction is inspired from the Toyota Production. Toyota production provided the
Transform -Flow –Value(TFV) philosophy of production in 1950’s.(Koskela, 1992).According
to this philosophy the production is not only transformation of the inputs to outputs but there
exists a flow of resources and information which seeks to generate the value to the customer.
The value of a process is defined as the requirements of the ultimate customer of that process.
This production system identified that it should reduce the share of waste in order to establish
flow. Waste is defined as non-value adding activity or process. Non-value adding element is
defined as the activity which consume time, resources and space but not create the value to the
customer.
Koskela (1992) presented that TFV theory can be applied to construction. Construction is not
only conversion of building materials to standing structures but there is a flow of material and
information to provide value to the customer. (Abdelhamid, 2003)
Lean Construction is defined as the removal or minimization of waste that would result in better
work flow.(Abdelhamid, 2003; Koskela, 1992).
2.2.2 Waste
Lean concept is focused on identification of waste(Chaturvedi, 2013) .Waste is defined as the
non-value adding element of the construction.
Activities in construction has been defined of two types, namely, value adding (VA) elements
and non-value adding elements (NVA). Value adding elements are defined as the activities

13
which use material and information and convert into value to the customer. Non value adding
elements or waste is defined as the activities which use resources, efforts, time, space and cost
but do not add value to the customer. Value is defined in the relation to the customer. For a
building contractor or constructor the customer can be the purchaser of the building. The
requirements of the cost, time, quality and other desired characteristics of the building by the
purchaser is defines as the value. For a designer the customer is the contractor and
constructability may be a value for the customer (Koskela, 1992).Toyota Production categorized
wastes in seven types(Howell, 1999). Liker (2004) added one more type of waste, unused
creativity of the worker, in the list. The Description of these wastes has been given in the table 2-
1. All the wastes have been defined to relation to the construction context.Table 2-1 :Type of
Wastes(Howell, 1999; Liker, 2004)
Type of Waste Description
1. Waiting Waiting for information or material to start an activity.
2. Overproduction It includes the production process more than requirement. It also
includes the activity which is done before requirement.
3. Rework Products that are not in conformance to quality requirements
(Defects) lead to Rework.
4. Unnecessary
Movement
It is the unrequired movement of equipment and worker to reach
the information and material.
5. Over
processing
It is the application of information and resources more than
requirement in an activity.
6. Excess
Inventory
It includes the in process and finished products as an excess
inventory.
7. Excess
Transport
This waste is due to improper scheduling and long distance motion
of material.
8. Unused
Employee
Creativity
It is due to not being able to involve all the employee to use their
creativity, thoughts and skills for the production process.

14
Al-aomar (2012) identified 27 types of construction wastes in the Abu Dhabi Construction
industry and identified the 18 causes of theses wastes in the construction industry.
Top 10 Types of waste and causes of these waste identified are presented in Table 2-2.
Table 2-2: Top 10 Types and Causes of Waste in Abu-Dhabi Industry (Al-aomar, 2012)
Type of Waste Cause of Waste
Late Work Delivery Lack of Manpower and Labour Resources
Long Approval Process Consultant Approval Process
Activity Start Delays Material Supply Delay and Shortage
Repair Work Bad Workmanship
Equipment Breakdown Lack of Proper Maintenance
Wait Periods Waiting for Authority approval and Permits
Long Transport Time Long Distance Procurement /Remote Site
Work Defects Poor/Bad Supervision
Damaged material Bad Storage/Storing Method
Work Interruptions Weather Conditions
Chaturvedi (2013) identified the major causes of waste in the Indian construction industry. The
wastes identified were in the order of occurrence were frequent changes in the design , changing
customer requirements , unnecessary movement of materials and equipment ,defects, poor
planning ,poor planning ,defective , unclear information, excessive management control,
frequent shortage of material.
Chandrasekar & Kumar ( 2014) tried to categorize the wastes in the Indian construction related
to resources, management, operation, procurement and manpower.
The questionnaire survey has been prepared with these types of wastes and causes of these
wastes identified from the previous research done. Appendix represents the wastes in the
construction. Table 2-3 provides the type of wastes and causes of wastes used in the
questionnaire survey.

15
2.2.3 Principles of Lean Construction
Lean Construction has different sets of principles, tools and techniques that is applied to
construction which lead to reduction in waste.
Womac, Jones & Roos (1990) provided five key principles of lean construction to be adopted by
an organization as follows:
Value: The organization should identify and maximize the requirements of the customers or
value.
Value Stream: Value stream is defined as the identification of all the value adding elements.
The organization should focus on value stream.
Flow: The organization should strive to achieve steady and uninterrupted flow of material
and information.
Pull: The production system should be driven by the customer demand. Just-in –Time (JIT)
approach is the adoption of the pull approach.
Perfection: After applying the first four principles of lean construction the organization
should evaluate the performance and improve the process to obtain perfection.
2.2.4 Tools and Techniques of Lean Construction
Some tools of lean construction are described as follows:
Value Stream Mapping (VSM)
Value stream mapping provides a visual representation of processes and the flows of material
and information to deliver the end products.
In VSM all the flow of materials and information is recorded. By observing the flow one
registers the value adding and non-value adding activities. VSM is generally done with paper and
pencil. New tools and software are also being developed VSM studies. It provides the blue print
of the current state of the process and can create and plan a route map for desired future state
(Jens & Henrik, 2011). The dynamic nature and the inclusion of the mapping of the flow of
material and equipment distinguish it from conventional project planning methods (Koskela,
1992).

16
5S System
5S system is a system of workplace organization which improves efficiency. The 5S are as
follows:
1S – Sort: It is the segregation of what is needed, not needed and needed later. Remove what is
not needed. Arrange the needed according to frequency of use.
2S-Staraighten: It is arrangement of the items so that they are easy to locate.
3S-Shine: It is the regular cleaning of the items to remove dust and grease.
4S-Satndardize: It is the adoption of all the best practices throughout the place.
5S-Sustain: It is continuous recognition of improvement and set high standards to sustain
practices.
5S provides efficiency of the operations and reduce waste such as waiting, excess motion,
accidents by improving work environment.
JIT (Just-in-Time)
Just –in- Time is defined as the delivery of material, equipment, products, execution of an
activity, when the customer or the next activity is ready to receive them. JIT leads to reduction in
excess inventory waste.
A3 Reports
This is systematic way to solve a problem on a report generated on A3 size paper. This includes
the statement of the problem, cause identification, solution steps, implementation plan and
follow up plan(Chaturvedi, 2013).
Last Planner System (LPS)
The Last Planner System was developed by (Howell, 1999).This system is defined as the last
planner because in this system the last person in the decision chain is involved in the planning.
It is a collaborative and dynamic approach to planning. It is the integration of the Should-Can-
Will-Did analysis to provide different schedule. It is opposite to the conventional planning
process where adherence to the master schedule is the most important.

17
Lean Project Delivery System (LPDS)
Lean Project Deliver system is a conceptual framework to implement the lean construction for a
project in all the stages in the project definition, design and construction.
Collaboration
It is defined as the collaboration of all the stakeholders in the planning, design, and construction
process. Various tools like Building Integrated Modelling (BIM), Lean Project delivery system,
communication techniques facilitate it.
Kaizen
Kaizen is defined as the continuous improvement while using the techniques of lean
construction. The organization implementing lean construction has a mechanism to evaluate
performance of the techniques and continues improvements based on lessons. Implementation of
lean construction is a continuous pursuit of perfection.
Visual Aids
Visual Aids help to understand the process and elements for all the part of the construction. They
are also used to guide the workforce to do difficult tasks.
2.3 SIX SIGMA
2.3.1 Definition
Six Sigma was developed by Motorola in 1985 to reduce the defects and achieve near perfect
production. Six Sigma is a methodology to reduce the process variations by an organization. It
uses systematic and scientific methodology for process improvements. It leads to reduction in
customer defined defects (Abdelhamid, 2003; Firat, 2012).
2.3.2 Six Sigma Methodologies
Six Sigma can be used for improvement new products and processes as well as for existing
process and products with two different methodologies. These two methodologies are as follows:
DMAIC -( Define, Measure, Analyze, Improve, Control )
It is used for improvement in an existing process. The steps of this methodology are as follows

18
Define – Defining customer requirements and deliverables of the process improvement.
Measure- Measuring the current performance of the process improvement
Analyze – Analyzing the root cause of the variations.
Improve- Implementing the measures to improve performance.
Control- Control the future performance improvement.
DMADV- (Define ,Measure , Analyze , Design, Verify )
This methodology is used for designing a new product or a new process.
Define- Defining the process deliverables or requirements of the customer...
Measure- Measuring the process deliverables.
Analyze –Analyzing the options to achieve process deliverables.
Design – Designing the process or product.
Verify- Verifying the achievement of objectives by performance evaluation.
Steps described above are completed by using different techniques of Six Sigma some of which
are derived from quality improvement tools
2.3.3 Statistical definition of Six Sigma
Six Sigma uses statically based methodology to measure the process variation or defect rate. This
definition is used in the ‘measure’ step of Six Sigma Methodologies.
Sigma, defined as the standard deviation, in statistics is a measurement of variation with respect
to mean. The sigma level of an organization is related to defects free products.
For a product upper specification limit (USL) and lower specification limit (LSL) are defined
according to customer requirements. The distance in terms of sigma of the mean from the
specification limits denote sigma level. The organization try to achieve maximum sigma level.
Six Sigma level is achieved when the mean of the process is at the distance of six sigma from the
nearest specification limit.
The sigma level is related to different process capability matrix.(Desale & Deodhar, 2013;
Tenera & Pinto, 2014).
DPMO (Defects per million opportunity) is such a matrix which is related to sigma level.
Table 2-3 shows the sigma level conversion with DPMO and Yield Level.

19
Table2-3: Basic Six Sigma Conversion Table To DPMO(Pheng & Hui, 2004)
Yield=Percentage of items
without defects
DPMO(Defects Per Million
Opportunity)
Sigma Level
30.9 690000 1
69.2 308000 2
93.3 66800 3
99.4 6210 4
99.98 320 5
99.9997 3.4 6
2.3.4 Six Sigma Techniques and Tools
Process Flow Chart-
It is used to show and analyze all the activities for a product. It is similar to value stream
mapping in the lean construction.
Process Capability Matrix and Process Performance Matrix
These matrix are calculated by the yield level or DPMO and USL, LSL and mean of the process.
Process capability matrix is used to evaluate existing process while process performance matrix
is used for evaluation of performance measures. It is used in ‘measure’ phase of Six Sigma
implementation.
Cause and Effect Diagram
It is used in Analyze phase of Six Sigma implementation .This is used to obtain the root cause of
a problem or variation. It is also known as Fishbone Diagram or Ishikawa Diagram because it
was developed by Ishikawa and looks like Fish structure. It uses 7M’s, namely, Man, Materials,
Machine, Method, Measurement, Milieu to find the root cause of an effect as depicted in fig.2-1.

20
Fig 2-1 Cause and Effect Diagram ( Banawi ,2013)
CTQ(Critical to quality )
Critical to quality characteristics are defined as the deliverables of the process
improvement with relation to customer’s requirements. It is the ‘Define’ Step of six
Sigma. Han et al. (2008) used the cycle time of concreting as the CTQ. The DPMO or
process capability matrix has been calculated for this CTQ.
Pareto Chart
Pareto chart are the part of Analyze phase. They are charts on 2-dimension where vertical axis
shows the different factors or causes for variation or a problem in descending order of their
frequency of occurrence. The top most factor causing a problem is given most priority by this
way.
SIPOC
This is used in ‘define phase’ of the six sigma where supplier, input, process, output and
customer are identified of a process.
Six Sigma has many tools and techniques other than described above. Some of them are 5 why
analysis, control charts, design of experiments (DOE), Taguchi loss function.
21
2.4 Lean Six Sigma
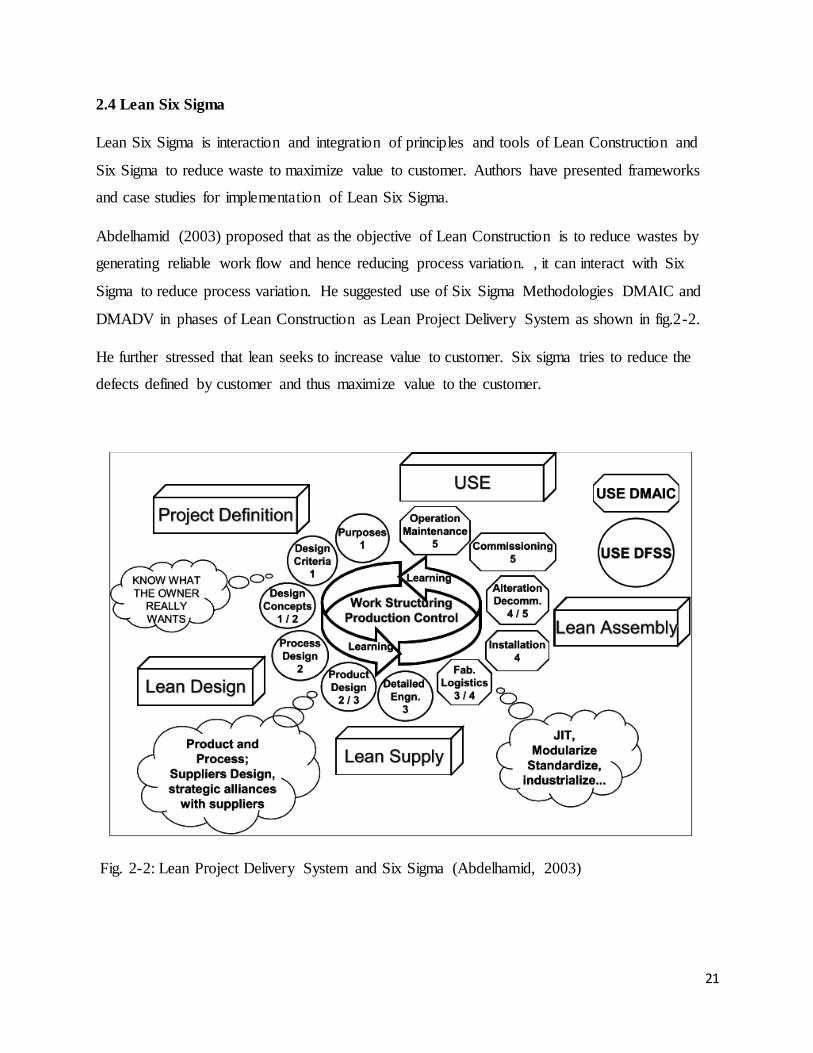
Lean Six Sigma is interaction and integration of principles and tools of Lean Construction and
Six Sigma to reduce waste to maximize value to customer. Authors have presented frameworks
and case studies for implementation of Lean Six Sigma.
Abdelhamid (2003) proposed that as the objective of Lean Construction is to reduce wastes by
generating reliable work flow and hence reducing process variation. , it can interact with Six
Sigma to reduce process variation. He suggested use of Six Sigma Methodologies DMAIC and
DMADV in phases of Lean Construction as Lean Project Delivery System as shown in fig.2-2.
He further stressed that lean seeks to increase value to customer. Six sigma tries to reduce the
defects defined by customer and thus maximize value to the customer.
Fig. 2-2: Lean Project Delivery System and Six Sigma (Abdelhamid, 2003)

22
Al-aomar(2012) proposed that six sigma rating can be used as a performance indicator.
Pheng & Hui(2004) presented use of six sigma in building industry with a case study. DPMO
level was measured for quality of internal finish. Sigma level was found low .The contractor took
improvement measures. It improved sigma level and quality of production.
Tenera & Pinto (2014) presented a framework to implement Lean construction using Six Sigma
steps DMAIC. It helped company to identify the project management problems and their
solutions.
Banawi (2013) presented a framework to integrate lean, green and six sigma .He proposed 3
steps of this framework as follows:
Waste Identification using Lean Construction tool, Value Stream Mapping.
Assessment of impact of waste on environment using Green Tool, Life cycle assessment.
Elimination of waste using Tools of Six Sigma.
Han et al.(2008) proposed a framework to integrate lean and six sigma so that they can be used
to reduce the weakness of each other as shown in fig.2-4.
Fig.2-3 Concept of Six Sigma integrated approach with lean construction(Han et al., 2008)

23
2.5 CHAPTER SUMMARY
This chapter presents the literature related to waste, Lean construction, Six Sigma and Lean Six
sigma. Lean Six Sigma implementation is still in starting phase and limited research papers are
available in this area.

24
3 RESEARCH METHODOLGY
This chapter represents the data collection and data analysis steps of the research.
3.1 DATA COLLECTION
3.1.1 Data Collection Tool
The data collection tool is an online questionnaire. The questionnaire has been prepared
according to research objectives. The table 3-1 represents research objective and the related
attributes in the questionnaire. The questionnaire has been given in annexure.
Table3-1: The research objectives and question format in the questionnaire
Research Objectives Attributes in the questionnaire
1. Identification of types of waste and
causes of waste in Indian Construction
Frequency of different types of wastes ,
causes of wastage
2. Acceptability and suitability of Lean
and Six Sigma in Indian Construction
Awareness of Lean and Six Sigma, Barriers
on implementation of Lean and Six Sigma.
Techniques of Lean and Six Sigma
3. Level of application of Lean and Six
Sigma Tools in Indian construction
Extent of use of tools and techniques of
Lean and Six Sigma
4. Integration of Lean and Six Sigma in
Indian Construction
Analysis of Possible ways of Interaction of
Lean and Six Sigma
3.1.2 Questionnaire Preparation
The questionnaire starts with the brief information about the project. The questionnaire is
designed to receive the participant information and experience. The questionnaire consists of 12
questions related to research objectives. These questions have been prepared by literature survey
presented in chapter2.
The table 3-2: provides the types of waste and causes of waste and literature reference.

25
Table 3-2: Type of waste and causes of waste used in the questionnaire survey of the project
Literature Type of waste Cause of Waste
Al-aomar (2012), Chaturvedi,
(2013)
Long Approval Process, Idle
Periods/wait periods, Activity
Start Delays ,Frequent
interruptions in work , Repair
Work
Lack of Coordination,
Improper Site Management,
Lack of Skilled Manpower,
Poor planning, Poor Quality
Control, Material Shortage
Al-aomar (2012), Chaturvedi,
(2013), Chandrasekar &
Kumar (2014), Banwai (2013)
Rework , Defects ,
uncompleted work ,
Equipment Downtime, Need
for clarification in design,
Error in design /lack of
constructability in design
,Long transport time, Damage
of inventory , Excessive
Supervision
Weather Conditions,
Accidents, Poor maintenance
of equipment ,frequent
changes in design , frequent
changes in customer demand,
remoteness of site, poor
storage methods
The table3-3 represents the possible ways of interaction of Six Sigma with Lean Construction
and the literature source.
The barriers on implementation of Lean and Six Sigma are lack of awareness, lack of
commitment, financial constraint, less research in this area, no governmental support have been
identified by Al-aomar, (2012, Chandrasekar & Kumar( 2014) in India.

26
Table3-3: Identification of Possible ways of interaction of Lean and Six Sigma
Type of Interaction Literature Source
Understanding customer requirements ,
measuring customer satisfaction level
Abdelhamid (2003)
Identifying root cause of wastes Tenera & Pinto (2014)
Greater involvement of leadership Firat( 2012)
Systematic Approach to reduce waste Chandrasekar & Kumar( 2014)
Setting Performance Improvement Goals Han et al.( 2008)
Broader quality concept Firat (2012)
Awareness within organization Banawi( 2013), Desale & Deodhar (2013)
Six sigma Rating as a measure of lean
application
Al-aomar (2012)
3.2 DATA ANALYSIS
3.2.1 Response Collection
Likert Scale
The questionnaire consists of close ended questions. This will provide objective answers. The
choice of the answer by respondent is represented by a number 1 to 5 based on Likert scale.
Likert scale was developed by Likert in 1931. The respondent are asked to provide to rate an
attribute based on their agreement. Here attribute refers to items on list of type of waste, cause of
waste, tools and techniques of Lean Construction and Six Sigma. The scale is as follows.5-
Strongly agree, 4- Agree, 3- Undecided (neutral), 2-Disagree, 1- Strongly Disagree. The data
converted on Likert scale is suitable for statistical analysis.
3.2.2 Response Analysis
The statistical analysis is done by using software Microsoft excel and SPSS (Statistical Package
for Social sciences).SPSS is a software by IBM which can be used questionnaire survey analysis.
This software will be used to analyze the data by following analysis

27
Internal Consistency analysis of the data
Cronbach’s alpha will be used to find the internal consistency of the questionnaire based
responses. It measures the consistency of a responses with the other set of responses. It
represents the reliability of the data. It can be calculated by SPSS. The range of cronbach’ alpha
for the internal consistency as given in table 3-4.
Table3-4: Cronbach alpha and internal consistency (George & Mallery, 2013)
Cronbach’s alpha Internal consistency
α≥0.9 Excellent
0.7≤α0.9 Good
0.6≤α≤0.7 Acceptable
0.5≤α≤0.6 Poor
α≤0.5 Unacceptable
Ranking of the attributes
This will be done to rank the attributes which needs to be given priority. This will guide the
author to suggest a framework on implementation of Lean and Six Sigma in Indian construction.
It will be done by the following parameters obtained from SPSS, Frequency Index and Relative
Importance Index.
3.2.2 Graphical Result Presentation
Different attributes according to different parameters as received can be plotted by Pareto chart,
pie charts and other formats according to requirements.

28
4 WORK PROGRESS AND FUTURE PLAN
4.1 WORK PROGRESS
The questionnaire has been prepared with the literature study. The questionnaire has been
provided in appendix.
Questionnaire has been sent to the construction profession working in construction companies.
The questionnaire has been sent to the construction professionals working in large scale
construction companies of India and local construction companies in Delhi. The questionnaire
has been sent to around 100 individuals. It also has been sent to institute working in the field of
lean construction and six sigma as Institute of Lean Construction Excellence, Mumbai (ILCE).
The companies include L&T Construction, Samsung industries, DMRC (Delhi Metro
Corporation Ltd. 25 responses have been received yet.
The participant profile has been shown in fig. 4-1.
Fig 4-1: Profile of the construction professionals
Familiarity of Lean Construction and six sigma is represented in fig4-2 and 4-3 of the
participants who have replied till now.
Senior/Mid level Manageemnt, , 46%
Si te Engineer20%
Planning Engineeer27%
Des igner/Architect7%
Participatnts Profile
Senior/Mid level Manageemnt
Site Engineer
Planning Engineeer
Designer/Architect

29
Fig4-2: Familiarity of Lean Construction in Participants
Fig .4-3: Familiarity with Six Sigma
All other attributes will be analyzed after receiving of all the responses.
Familiar with Lean Construction, 80%
Unfamiliar with Lean Construction,, 20%
Familiar with Lean Construction
Unfamiliar with Lean Construction
97
3
Familiar with Six Sigma
Unfamiliar with Six Sigma

30
4.2 FUTURE PLAN
The future plan consist of the following:
To follow –up the participants to request them to fill the questionnaire as the response rate
has been low.
To approach more construction professionals to fill the questionnaire survey.
To interact with the respondents after they have replied. It is done to understand the
application of Lean and Six Sigma in their organization.
To understand case studies of Lean and Six Sigma in Indian construction and Site visits to
wastes on construction sites.
Analysis of Data
To suggest a framework for implementation of Lean and Six Sigma in India.

31
REFERENCES
Abdelhamid, T. S. (2003). Six -Sigma in Lean Construction Systems: Opportunities and Challenges. In IGLC-13. Blacksburg , VA. Retrieved from
http://leanconstruction.dk/media/16779/Six-Sigma in Lean Construction Systems_Opportunities and Challenges.pdf
Achanga, P., Shehab, E., Roy, R., & Nelder, G. (2006). Critical success factors for lean
implementation within SMEs. Journal of Manufacturing Technology Management, 17(4), 460–471. doi:10.1108/17410380610662889
Al-aomar, R. (2012). Analysis of lean construction practices at Abu Dhabi construction industry. Lean Construction Journal, 105–121.
Banawi, A. A. (2013). Improving Construction Processes by integarting Lean , Green and Six
Sigma. University of Pittsburgh.
Chandrasekar, A., & Kumar, M. L. (2014). Effective Utilization of Lean Management in Construction Industry. International Journal of Engineering and Innovative Technology,
3(12), 29–33.
Chang, L., Chao, C., & Lin, Y. (2005). The Application of Six Sigma Approach in Construction : A Case Study for Improving Precast Production Management. Retrieved from
http://management.kochi-tech.ac.jp/ssms_papers/sms12-9979_dfbfdcdc4799458bbc835d4a465fa59f.pdf
Chaturvedi, V. R. (2013). The Integration of Lean Principles with BIM in the Construction Industry in India .
Desale, S. V, & Deodhar, S. V. (2013). An Application of Lean and Six Sigma Principle for
Constructional Process Improvement in Indian Organizations, 3, 149–154.
Firat, M. (2012). Six Sigma within Construction Context As a Quality Initiative.
George, D., & Mallery, P. (2013). IBM SPSS Statistics 21 Step by Step: A Simple Guide and Reference (13th ed.).
Gliem, J. A., & Gliem, R. R. (2003). Calculating, Interpreting , and Reporting Cronbach ’ s
Alpha Reliability Coefficient for Likert-Type Scales. In Midwest Research-to-Practice Conference (pp. 82–88).
Han, S. H., Asce, M., Chae, M. J., Ph, D., Im, K. S., & Ryu, H. D. (2008). Six Sigma-Based
Approach to Improve Performance in Construction Operations, (January), 21–31.
Hilton, C. (2010). Lean Construction : A new Paradigm for Managing Construction. San Jaun.
32
Howell, G. (1999). What is Lean Construction. In proceedings of the 7th Conference of the International Group for Lean (pp. 26–28). Berkeley, California, USA.
Jens, A., & Henrik, K. (2011). Waste in Lean Construction. Chalmers University of Technology.
Koskela, L. (1992). Application of the new production philosophy to construction.
Liker, J. (2004). The Toyota Way: Fourteen Management Principles from the World’s Greatest Manufacturer (1st ed.). New York: McGraw-Hill Professional Publishing.
Pheng, L. S., & Hui, M. S. (2004). Implementing and Applying Six Sigma in Construction. Journal of Construction Engineering and Management, (August), 482–489.
Shanmugapriya, S., & Subramanian, K. (2013). Investigation of Significant Factors Influencing Time and Cost Overruns in Indian Construction Projects. International Journal of Emerging Technology and Advanced Engineering, 3(10), 734–740.
Tenera, A., & Pinto, L. C. (2014). A Lean Six Sigma (LSS) Project Management Improvement
Model. Procedia - Social and Behavioral Sciences, 119, 912–920. doi:10.1016/j.sbspro.2014.03.102
Womac, J. P., Jones, D. T., & Roos, D. (1990). The Machine that changed the world. New York:
Harper Collins.

33
APPENDIX – QUESTIONNAIRE
Implementation of Lean Six Sigma in India
1. Ravi Jain , an M. Tech. Student (Construction Engineering and Management ) at Indian
Institute of Technology , Delhi invites and requests you to participate in a research project
titled " Implementation of Lean Six Sigma in Indian Construction " .
2. This research is being conducted under the Guidance of Dr .Kumar Neeraj Jha, Associate
Professor at Indian Institute of Technology, Delhi (http://web.iitd.ac.in/~knjha/)
3.The objective of the study is to understand current state of application of Lean and Six Sigma
Tools in Indian Construction Industry and how Lean and Six Sigma can interact together to
remove wastes in Indian construction . More information about Lean and Six Sigma can be
obtained from here, http://en.wikipedia.org/wiki/Lean_construction and
http://en.wikipedia.org/wiki/Six_Sigma.
4. Your Participation is voluntary. Information provided will be used only for research purpose
only and treated CONFIDENTIALLY .Please help by replying to following Survey. It would take around 15 minutes. In case of need of any clarifications, please contact at
[email protected] or [email protected]
Thank u very much for filling survey.
1. Your Name (optional )
2. Please indicate the name of the company you currently work for?
3. Your position in the company?
Senior/Mid- level Management
Site Engineer
Planning Engineer
Designer/Architect
Other (Please specify)

34
4. Type of work your company does?
Constructor/Builder
Developer/Designer
Architect
Consulting
Supplier
Others Please Specify
5. How long you have been working in Construction Industry?
Less than 5 years
5-10 years
10-20 years
More than 20 years
35
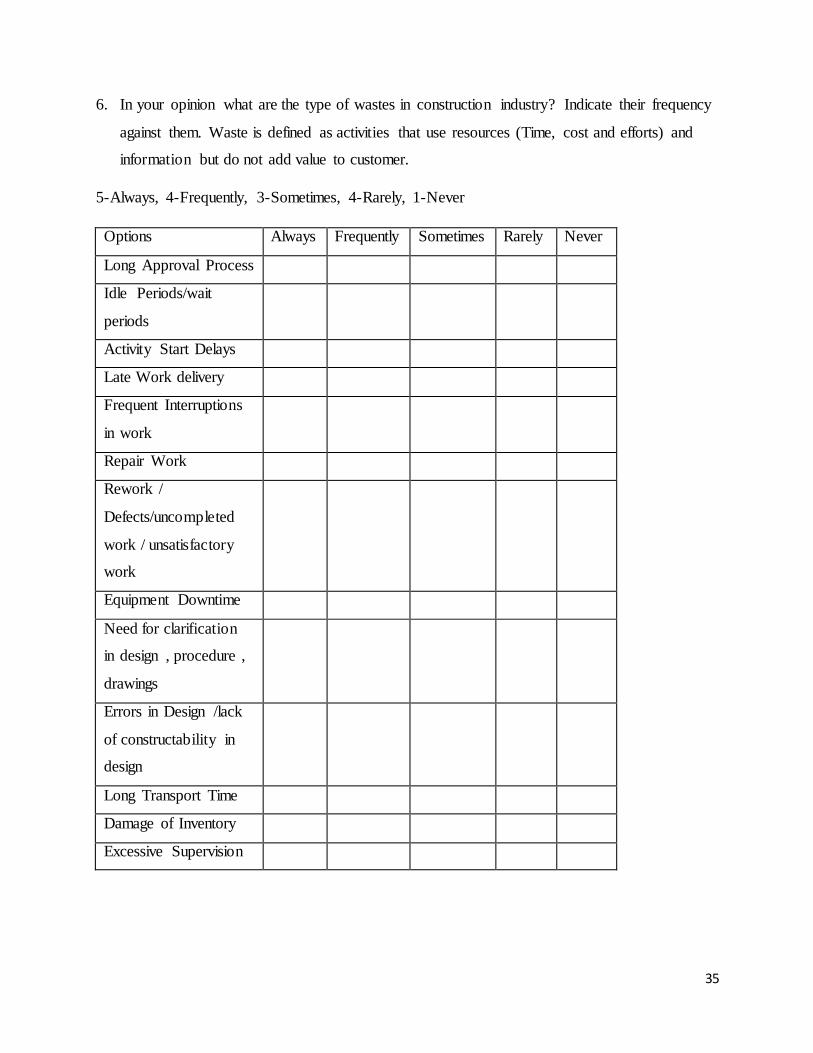
6. In your opinion what are the type of wastes in construction industry? Indicate their frequency
against them. Waste is defined as activities that use resources (Time, cost and efforts) and
information but do not add value to customer.
5-Always, 4-Frequently, 3-Sometimes, 4-Rarely, 1-Never
Options Always Frequently Sometimes Rarely Never
Long Approval Process
Idle Periods/wait
periods
Activity Start Delays
Late Work delivery
Frequent Interruptions
in work
Repair Work
Rework /
Defects/uncompleted
work / unsatisfactory
work
Equipment Downtime
Need for clarification
in design , procedure ,
drawings
Errors in Design /lack
of constructability in
design
Long Transport Time
Damage of Inventory
Excessive Supervision

36
7. In your opinion what are causes of the above wastes? Please select among the following
using 5 to 1 rating for your answers.
Options Strongly
Agree
Agree Disagree Strongly
Disagree
Cannot
say
Lack of Skilled Manpower
Poor planning
Poor Quality Control
Material Shortage
Weather Conditions
Accidents
Poor Maintenance of equipment
Frequent design Changes
Frequent Changes in Customer Demand
Remoteness of site
Poor Storage Method
8. Have u heard of lean Construction?
Yes
No
9. What is the level of use of lean construction application in your company?
Implementing on demand of client
Trying to implement
Studying lean construction techniques
Not interested or required

37
10. Following is the list of some lean construction techniques, tools and concepts. Please
indicate the level of use these techniques in your company. Consider 5 to 1 rating for options
as in previous question.
Options Always Frequently Sometimes Rarely Never
Value Stream Mapping
Just in Time(JIT)
5S system
A3 Reports
Last Planner System
Lean Project Delivery System
Collaboration
Kaizen (Continuous improvement)
Visual Aids
Pull Production
11. Please tell any other tool which your company is using, which leads to minimization of waste
while maximizing the value to customer (lean Construction).
12. Do u feel that variability in the process (e.g. Cycle time of same amount of concreting is
different for different time) or defect (Customer is not satisfied with the product) is a
common problem in construction?
Yes
No
Can’t say.
13. Have u heard of Six Sigma?
Yes
No

38
14. Following is the list of tools and techniques which are used in six sigma methodologies?
Please indicate level of use of these methodologies in your company?
Options Always Frequently Sometimes Rarely Never
Process flow chart
Process Capability Analysis
Process Performance Indicators
Cause and Effect Diagram
CTQ (Critical to Quality )
Pareto Chart
SIPOC analysis(Supplier Input
Process Output Customer)
5 Why Analysis
15. Please indicate any other method employed in your company which leads to reduction in
variability of a process or reduction in defects level in your products (Six Sigma).
39
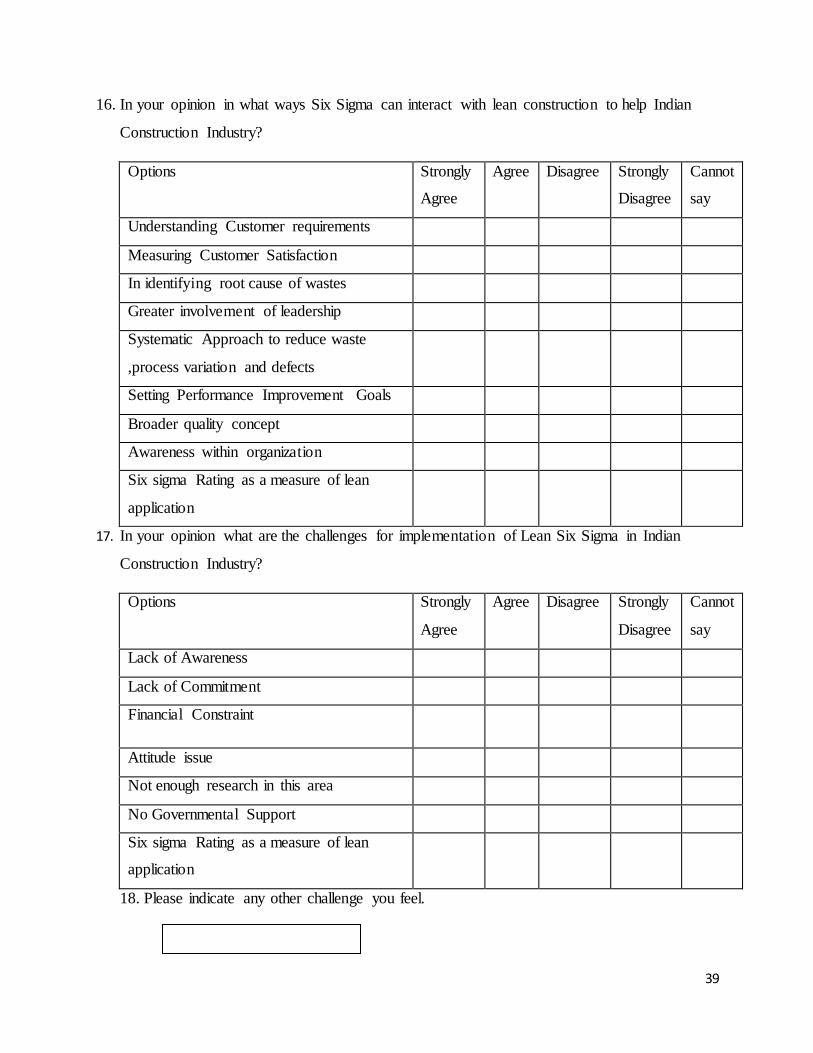
16. In your opinion in what ways Six Sigma can interact with lean construction to help Indian
Construction Industry?
Options Strongly
Agree
Agree Disagree Strongly
Disagree
Cannot
say
Understanding Customer requirements
Measuring Customer Satisfaction
In identifying root cause of wastes
Greater involvement of leadership
Systematic Approach to reduce waste
,process variation and defects
Setting Performance Improvement Goals
Broader quality concept
Awareness within organization
Six sigma Rating as a measure of lean
application
17. In your opinion what are the challenges for implementation of Lean Six Sigma in Indian
Construction Industry?
Options Strongly
Agree
Agree Disagree Strongly
Disagree
Cannot
say
Lack of Awareness
Lack of Commitment
Financial Constraint
Attitude issue
Not enough research in this area
No Governmental Support
Six sigma Rating as a measure of lean
application
18. Please indicate any other challenge you feel.