13 th World Conference on Earthquake Engineering Vancouver, B.C., Canada August 1-6, 2004 Paper No. 1390 REALTIME DAMAGE ESTIMATION OF BUILDINGS USING THE LIMIT STRENGTH METHOD Naoya YAMAGUCHI 1 , Tomoya IWASAKI 2 , Kaoru MIZUKOSHI 3 , Iwao SUETOMI 4 and Fumio YAMAZAKI 5 SUMMARY Early earthquake damage assessment systems have been installed by national government and many local municipalities in Japan, especially, after the 1995 Hyogoken-Nanbu earthquake. The estimation method of building damage included in the existing assessment systems mostly uses the fragility curves constructed based on the building damage data of past earthquakes in Japan and calculates the building damage ratios of a stricken area. However, the useful estimation method of building damage for the assessment systems is estimates the damage levels of all buildings individually in the damaged area. In this paper, the method of earthquake building damage estimation in Japan is developed, employing one of the seismic design methods of structures, the limit strength method. This calculation method is simpler than the time history response analysis, and the spectral characteristics of seismic ground motion and the natural period of a building can be considered because the earthquake response spectrum is used as an input ground motion in this method. In order that the yield base-shear coefficient reflects the conditions of present buildings, identification of the coefficient is conducted by using the building damage survey data and the strong ground motion records from the 1995 Hyogoken-Nanbu earthquake. This estimation method may be conveniently used as the method of estimating building damage individually throughout a stricken city in a short time. INTRODUCTION After the 1995 Hyogoken-Nanbu earthquake, national government and many local municipalities in Japan have introduced earthquake monitoring systems and early earthquake damage assessment systems [1], which support rescue operations, information gathering activities and disaster emergency responses by estimating damage areas quickly after the occurrence of a large earthquake. In these systems, some 1 Dr. Eng., Researcher, Kawasaki Laboratory, EDM, National Research Institute for Earth Science and Disaster Prevention, Kanagawa, Japan. Email: [email protected] 2 Dr. Eng., Chief, Engineering & Risk Services Corporation, Tokyo, Japan. 3 Dr. Eng., Senior Supervisory Engineer, Engineering & Risk Services Corporation, Tokyo, Japan. 4 Dr. Eng., Deputy Team Leader, Kawasaki Laboratory, EDM, National Research Institute for Earth Science and Disaster Prevention, Kanagawa, Japan. 5 Dr. Eng., Professor, Faculty of Engineering, Chiba University, Chiba, Japan.

Welcome message from author
This document is posted to help you gain knowledge. Please leave a comment to let me know what you think about it! Share it to your friends and learn new things together.
Transcript
13th World Conference on Earthquake Engineering Vancouver, B.C., Canada
August 1-6, 2004 Paper No. 1390
REALTIME DAMAGE ESTIMATION OF BUILDINGS USING THE LIMIT STRENGTH METHOD
Naoya YAMAGUCHI1, Tomoya IWASAKI2, Kaoru MIZUKOSHI3, Iwao SUETOMI4 and Fumio YAMAZAKI5
SUMMARY Early earthquake damage assessment systems have been installed by national government and many local municipalities in Japan, especially, after the 1995 Hyogoken-Nanbu earthquake. The estimation method of building damage included in the existing assessment systems mostly uses the fragility curves constructed based on the building damage data of past earthquakes in Japan and calculates the building damage ratios of a stricken area. However, the useful estimation method of building damage for the assessment systems is estimates the damage levels of all buildings individually in the damaged area. In this paper, the method of earthquake building damage estimation in Japan is developed, employing one of the seismic design methods of structures, the limit strength method. This calculation method is simpler than the time history response analysis, and the spectral characteristics of seismic ground motion and the natural period of a building can be considered because the earthquake response spectrum is used as an input ground motion in this method. In order that the yield base-shear coefficient reflects the conditions of present buildings, identification of the coefficient is conducted by using the building damage survey data and the strong ground motion records from the 1995 Hyogoken-Nanbu earthquake. This estimation method may be conveniently used as the method of estimating building damage individually throughout a stricken city in a short time.
INTRODUCTION After the 1995 Hyogoken-Nanbu earthquake, national government and many local municipalities in Japan have introduced earthquake monitoring systems and early earthquake damage assessment systems [1], which support rescue operations, information gathering activities and disaster emergency responses by estimating damage areas quickly after the occurrence of a large earthquake. In these systems, some
1 Dr. Eng., Researcher, Kawasaki Laboratory, EDM, National Research Institute for Earth Science and Disaster Prevention, Kanagawa, Japan. Email: [email protected] 2 Dr. Eng., Chief, Engineering & Risk Services Corporation, Tokyo, Japan. 3 Dr. Eng., Senior Supervisory Engineer, Engineering & Risk Services Corporation, Tokyo, Japan. 4 Dr. Eng., Deputy Team Leader, Kawasaki Laboratory, EDM, National Research Institute for Earth Science and Disaster Prevention, Kanagawa, Japan. 5 Dr. Eng., Professor, Faculty of Engineering, Chiba University, Chiba, Japan.
earthquake damage estimation is conducted on the basis of the results of building damage estimation, for example, the estimation of human suffering and the estimation of road blocks. There are a few ways to estimate building damage [2], for instance, the way using fragility curves as a function of the strong motion index, e.g. the peak ground acceleration (PGA), the peak ground velocity (PGV) and the instrumental Japan Meteorological Agency (JMA) intensity, and the way using the time history response analysis with seismic waveform and a building model. The building damage estimation included in the existing earthquake damage assessment systems mostly uses the fragility curves constructed based on the building damage data of past earthquakes in Japan. So, the results of the damage estimation tend to have large errors because of the characteristics of each earthquake and the geographical characteristics of buildings. In using fragility curves, the building damage estimation calculates the building damage as the damage ratios, e.g. heavy damage and moderate damage, of the area that the buildings stand such as a ward and a district block (corresponding to the postal address), so the information which buildings are hard hit is not gotten from the estimation. Therefore, the accuracy of the estimation that is dependent on the results of building damage estimation is not high and the results are not useful to make plans of disaster response activities. It is also a problem that the fragility curves can be applied only to the areas of the same building characteristics as the curves were constructed. In addition, we are now developing integrated early earthquake disaster simulation system [3] and, in the system, a few analyses are conducted based on the estimation results of the damage levels for individual buildings. For these reasons, it is desirable that building damage estimation uses the method of estimating the damage levels of all buildings individually in the damaged area, also it is required that the results are come out in the shortest possible time because the information is needed at headquarters for disaster countermeasures as soon as possible. In this paper, in order to meet these demands and construct the useful estimation system for the earthquake damage assessment systems, we develop the method of earthquake building damage estimation in Japan. The proposed method uses one of the seismic design methods of structures in Japan, the limit strength method, which is no need to conduct the time history response analysis of buildings. In order that the yield base-shear coefficient reflects the conditions of present buildings, identification of the coefficient is conducted by using the building damage survey data and the strong ground motion records from the 1995 Hyogoken-Nanbu earthquake. THE METHOD FOR ESTIMATING EARTHQUAKE DAMAGE TO INDIVIDUAL BUILDINGS In this paper, the method for earthquake building damage estimation is developed based on the limit strength method, which is one of the seismic design methods in Japan, in order to evaluate the damage levels for individual buildings properly. The limit strength method is the seismic design method that was defined by the Ministry of Construction (that is now the Ministry of Land, Infrastructure and Transport) in 2000 [4-6] and the method is said to be based on the concept of ATC-40 [7]. The methodology of the seismic performance evaluation of buildings in this method uses the technique to estimate peak building response as the intersection of the building capacity curve, which describes the plot of the building’s lateral load resistance of each building type and seismic design level as a function of the characteristic lateral displacement (i.e., the force-deflection plot), and the demand spectrum, which is the 5%-damped input spectrum reduced for higher levels of effective damping at the building’s location (e.g., effective damping includes both elastic damping and hysteretic damping associated with post-yield cyclic response of the building) (Figure 1) [8]. The reasons that this way is adopted in this paper are following:
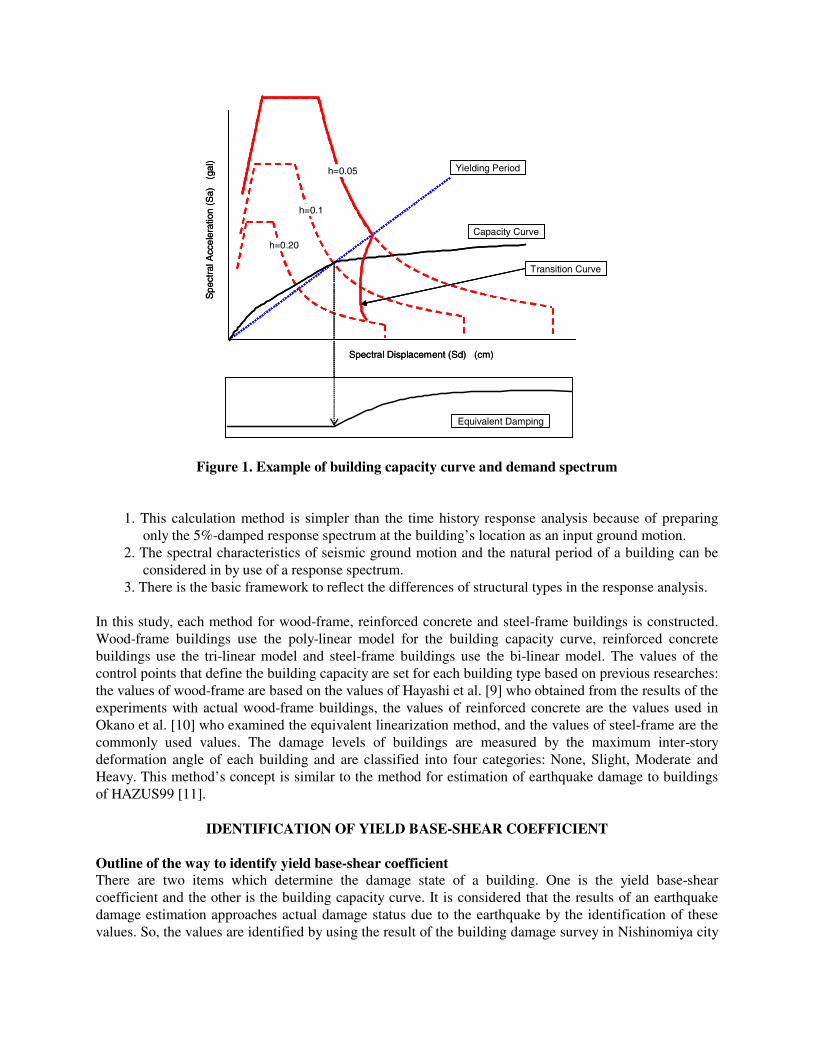
Figure 1. Example of building capacity curve and demand spectrum
1. This calculation method is simpler than the time history response analysis because of preparing only the 5%-damped response spectrum at the building’s location as an input ground motion.
2. The spectral characteristics of seismic ground motion and the natural period of a building can be considered in by use of a response spectrum.
3. There is the basic framework to reflect the differences of structural types in the response analysis. In this study, each method for wood-frame, reinforced concrete and steel-frame buildings is constructed. Wood-frame buildings use the poly-linear model for the building capacity curve, reinforced concrete buildings use the tri-linear model and steel-frame buildings use the bi-linear model. The values of the control points that define the building capacity are set for each building type based on previous researches: the values of wood-frame are based on the values of Hayashi et al. [9] who obtained from the results of the experiments with actual wood-frame buildings, the values of reinforced concrete are the values used in Okano et al. [10] who examined the equivalent linearization method, and the values of steel-frame are the commonly used values. The damage levels of buildings are measured by the maximum inter-story deformation angle of each building and are classified into four categories: None, Slight, Moderate and Heavy. This method’s concept is similar to the method for estimation of earthquake damage to buildings of HAZUS99 [11].
IDENTIFICATION OF YIELD BASE-SHEAR COEFFICIENT Outline of the way to identify yield base-shear coefficient There are two items which determine the damage state of a building. One is the yield base-shear coefficient and the other is the building capacity curve. It is considered that the results of an earthquake damage estimation approaches actual damage status due to the earthquake by the identification of these values. So, the values are identified by using the result of the building damage survey in Nishinomiya city
Yielding Period
h=0.1
h=0.05
h=0.20
Transition Curve
Capacity Curve
Equivalent Damping
Spe
ctra
l Acc
eler
atio
n (S
a)
(gal
)
Spectral Displacement (Sd) (cm)
Yielding Period
h=0.1
h=0.05
h=0.20
Transition Curve
Capacity Curve
Equivalent Damping
Spe
ctra
l Acc
eler
atio
n (S
a)
(gal
)
Spectral Displacement (Sd) (cm)
in several building damage surveys which were conducted by groups of researches and engineers after the Hyogoken-Nanbu earthquake [12]. In this paper, the building capacity curves are not the objects of identification and only the yield base-shear coefficients are identified. The way of identification is following:
1. The yield base-shear coefficient of objective structural type is set to a parameter. 2. 500 lognormal distributed random variables are created, the median of the lognormal distribution
is the above coefficient and the standard deviation is 0.4, and the building data are made, which yield base-shear coefficients are the created random variables.
3. Ten areas are selected in Nishinomiya city for this verification, and the input response spectra of each area are calculated.
4. The damage levels of the created building data are computed with each response spectrum for selected areas by using this study’s method.
5. From the above results, the total building damage ratios of selected areas are calculated. 6. The damage ratios are compared to those obtained from the result of building damage survey in
Nishinomiya city for selected 10 areas. 7. These operations are repeated until the error between the two damage ratios becomes a minimum
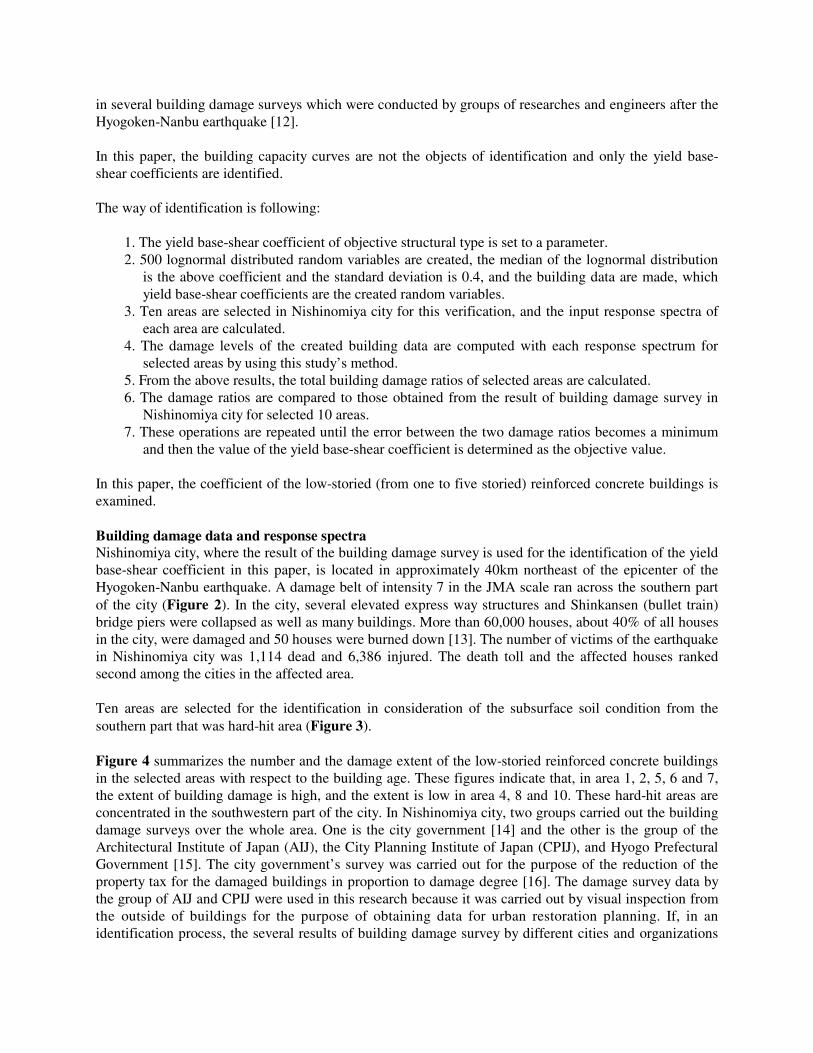
and then the value of the yield base-shear coefficient is determined as the objective value. In this paper, the coefficient of the low-storied (from one to five storied) reinforced concrete buildings is examined. Building damage data and response spectra Nishinomiya city, where the result of the building damage survey is used for the identification of the yield base-shear coefficient in this paper, is located in approximately 40km northeast of the epicenter of the Hyogoken-Nanbu earthquake. A damage belt of intensity 7 in the JMA scale ran across the southern part of the city (Figure 2). In the city, several elevated express way structures and Shinkansen (bullet train) bridge piers were collapsed as well as many buildings. More than 60,000 houses, about 40% of all houses in the city, were damaged and 50 houses were burned down [13]. The number of victims of the earthquake in Nishinomiya city was 1,114 dead and 6,386 injured. The death toll and the affected houses ranked second among the cities in the affected area. Ten areas are selected for the identification in consideration of the subsurface soil condition from the southern part that was hard-hit area (Figure 3). Figure 4 summarizes the number and the damage extent of the low-storied reinforced concrete buildings in the selected areas with respect to the building age. These figures indicate that, in area 1, 2, 5, 6 and 7, the extent of building damage is high, and the extent is low in area 4, 8 and 10. These hard-hit areas are concentrated in the southwestern part of the city. In Nishinomiya city, two groups carried out the building damage surveys over the whole area. One is the city government [14] and the other is the group of the Architectural Institute of Japan (AIJ), the City Planning Institute of Japan (CPIJ), and Hyogo Prefectural Government [15]. The city government’s survey was carried out for the purpose of the reduction of the property tax for the damaged buildings in proportion to damage degree [16]. The damage survey data by the group of AIJ and CPIJ were used in this research because it was carried out by visual inspection from the outside of buildings for the purpose of obtaining data for urban restoration planning. If, in an identification process, the several results of building damage survey by different cities and organizations
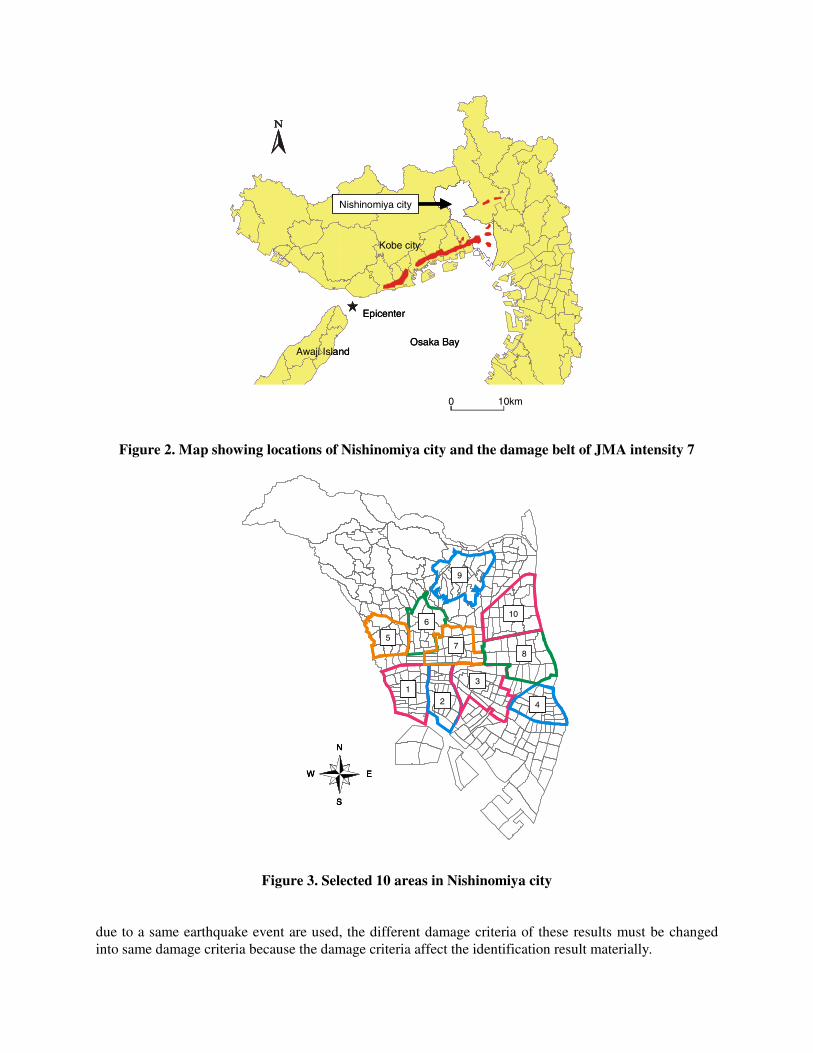
Figure 2. Map showing locations of Nishinomiya city and the damage belt of JMA intensity 7
Figure 3. Selected 10 areas in Nishinomiya city due to a same earthquake event are used, the different damage criteria of these results must be changed into same damage criteria because the damage criteria affect the identification result materially.
Nishinomiya city
Kobe city
Epicenter
Awaji IslandOsaka Bay
0 10km
Nishinomiya city
Kobe city
Epicenter
Awaji IslandOsaka Bay
0 10km
N
S
W E
12
3
7
6
5
9
10
8
4
N
S
W E
N
S
W E
12
3
7
6
5
9
10
8
4
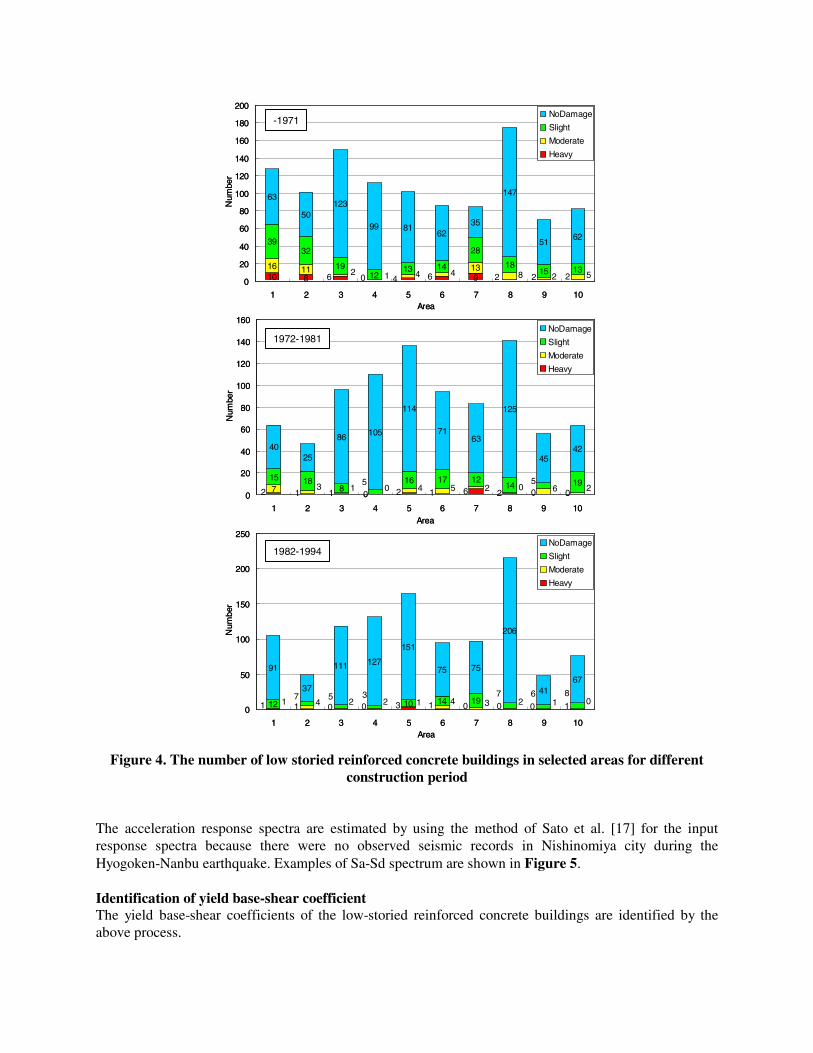
Figure 4. The number of low storied reinforced concrete buildings in selected areas for different construction period
The acceleration response spectra are estimated by using the method of Sato et al. [17] for the input response spectra because there were no observed seismic records in Nishinomiya city during the Hyogoken-Nanbu earthquake. Examples of Sa-Sd spectrum are shown in Figure 5. Identification of yield base-shear coefficient The yield base-shear coefficients of the low-storied reinforced concrete buildings are identified by the above process.
10 8 916 11 13
3932
1912
13 14
28
1815 13
63
50123
99 8162
35
147
5162
4 6 2 2 206 52844120
20
40
60
80
100
120
140
160
180
200
1 2 3 4 5 6 7 8 9 10Area
Num
ber
NoDamage
Slight
Moderate
Heavy
715 18
816 17 12
14 19
4025
86 105
114
7163
125
4542
2 1 1 0 2 1 6 2 0 03 1 0 4 5 2 0 6 2
5 5
0
20
40
60
80
100
120
140
160
1 2 3 4 5 6 7 8 9 10Area
Num
ber
NoDamage
Slight
Moderate
Heavy
12 10 14 19
91
37
111 127
151
75 75
206
4167
1000130011 0123412241867357
0
50
100
150
200
250
1 2 3 4 5 6 7 8 9 10Area
Num
ber
NoDamage
Slight
Moderate
Heavy
-1971
1972-1981
1982-1994
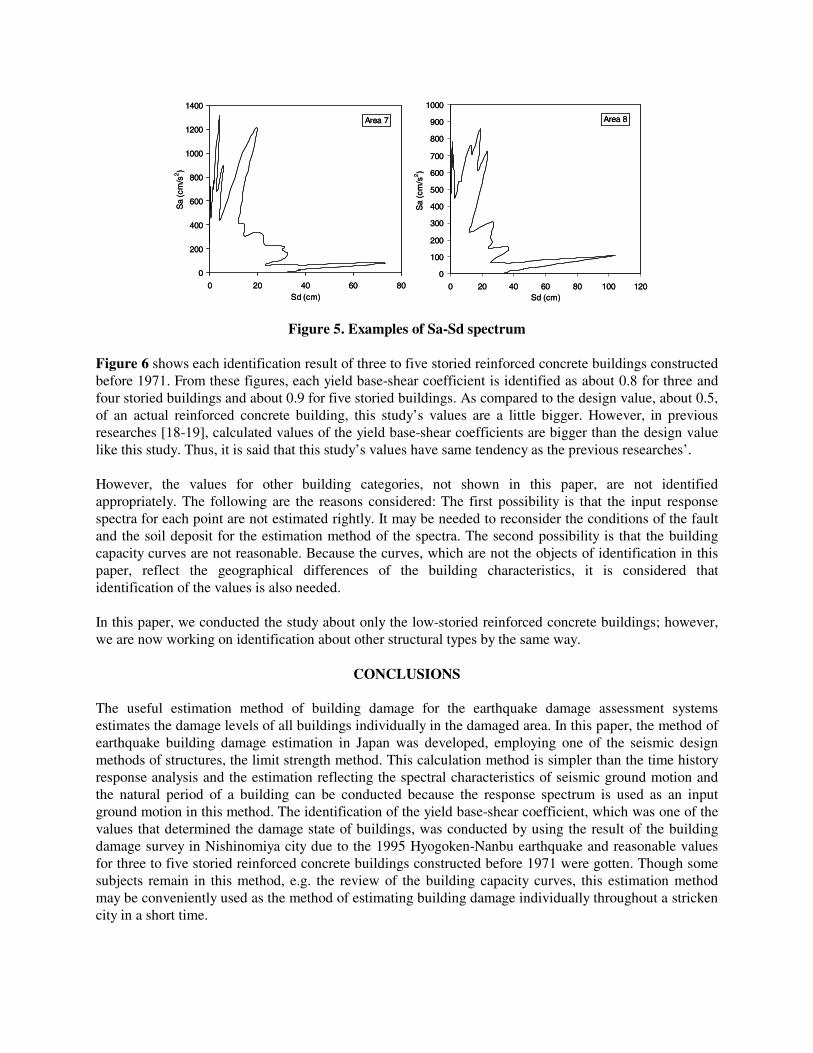
Figure 5. Examples of Sa-Sd spectrum Figure 6 shows each identification result of three to five storied reinforced concrete buildings constructed before 1971. From these figures, each yield base-shear coefficient is identified as about 0.8 for three and four storied buildings and about 0.9 for five storied buildings. As compared to the design value, about 0.5, of an actual reinforced concrete building, this study’s values are a little bigger. However, in previous researches [18-19], calculated values of the yield base-shear coefficients are bigger than the design value like this study. Thus, it is said that this study’s values have same tendency as the previous researches’. However, the values for other building categories, not shown in this paper, are not identified appropriately. The following are the reasons considered: The first possibility is that the input response spectra for each point are not estimated rightly. It may be needed to reconsider the conditions of the fault and the soil deposit for the estimation method of the spectra. The second possibility is that the building capacity curves are not reasonable. Because the curves, which are not the objects of identification in this paper, reflect the geographical differences of the building characteristics, it is considered that identification of the values is also needed. In this paper, we conducted the study about only the low-storied reinforced concrete buildings; however, we are now working on identification about other structural types by the same way.
CONCLUSIONS The useful estimation method of building damage for the earthquake damage assessment systems estimates the damage levels of all buildings individually in the damaged area. In this paper, the method of earthquake building damage estimation in Japan was developed, employing one of the seismic design methods of structures, the limit strength method. This calculation method is simpler than the time history response analysis and the estimation reflecting the spectral characteristics of seismic ground motion and the natural period of a building can be conducted because the response spectrum is used as an input ground motion in this method. The identification of the yield base-shear coefficient, which was one of the values that determined the damage state of buildings, was conducted by using the result of the building damage survey in Nishinomiya city due to the 1995 Hyogoken-Nanbu earthquake and reasonable values for three to five storied reinforced concrete buildings constructed before 1971 were gotten. Though some subjects remain in this method, e.g. the review of the building capacity curves, this estimation method may be conveniently used as the method of estimating building damage individually throughout a stricken city in a short time.
0
200
400
600
800
1000
1200
1400
0 20 40 60 80Sd (cm)
Sa
(cm
/s2)
Area 7
0
100
200
300
400
500
600
700
800
900
1000
0 20 40 60 80 100 120Sd (cm)
Sa
(cm
/s2)
Area 8
0
200
400
600
800
1000
1200
1400
0 20 40 60 80Sd (cm)
Sa
(cm
/s2)
Area 7
0
100
200
300
400
500
600
700
800
900
1000
0 20 40 60 80 100 120Sd (cm)
Sa
(cm
/s2)
Area 8
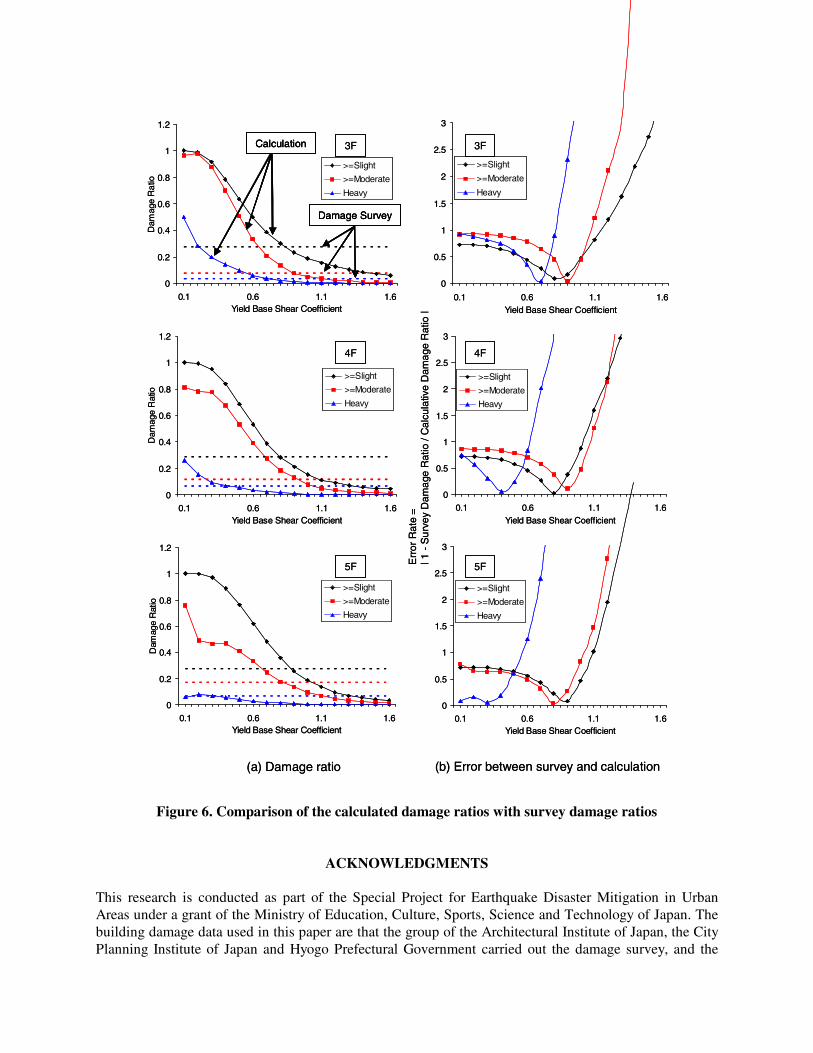
Figure 6. Comparison of the calculated damage ratios with survey damage ratios
ACKNOWLEDGMENTS This research is conducted as part of the Special Project for Earthquake Disaster Mitigation in Urban Areas under a grant of the Ministry of Education, Culture, Sports, Science and Technology of Japan. The building damage data used in this paper are that the group of the Architectural Institute of Japan, the City Planning Institute of Japan and Hyogo Prefectural Government carried out the damage survey, and the
0
0.5
1
1.5
2
2.5
3
0.1 0.6 1.1 1.6Yield Base Shear Coefficient
>=Slight
>=Moderate
Heavy
0
0.5
1
1.5
2
2.5
3
0.1 0.6 1.1 1.6Yield Base Shear Coefficient
>=Slight
>=Moderate
Heavy
0
0.5
1
1.5
2
2.5
3
0.1 0.6 1.1 1.6Yield Base Shear Coefficient
>=Slight
>=Moderate
Heavy
0
0.2
0.4
0.6
0.8
1
1.2
0.1 0.6 1.1 1.6Yield Base Shear Coefficient
Dam
age
Rat
io
>=Slight
>=Moderate
Heavy
Err
or R
ate
=| 1
-S
urv
ey D
amag
e R
atio
/ C
alcu
lativ
e D
amag
e R
atio
|
Calculation
Damage Survey
(a) Damage ratio (b) Error between survey and calculation
3F 3F
4F4F
5F 5F
0
0.2
0.4
0.6
0.8
1
1.2
0.1 0.6 1.1 1.6Yield Base Shear Coefficient
Dam
age
Rat
io
>=Slight
>=Moderate
Heavy
0
0.2
0.4
0.6
0.8
1
1.2
0.1 0.6 1.1 1.6Yield Base Shear Coefficient
Dam
age
Rat
io
>=Slight
>=Moderate
Heavy
0
0.5
1
1.5
2
2.5
3
0.1 0.6 1.1 1.6Yield Base Shear Coefficient
>=Slight
>=Moderate
Heavy
0
0.5
1
1.5
2
2.5
3
0.1 0.6 1.1 1.6Yield Base Shear Coefficient
>=Slight
>=Moderate
Heavy
0
0.5
1
1.5
2
2.5
3
0.1 0.6 1.1 1.6Yield Base Shear Coefficient
>=Slight
>=Moderate
Heavy
0
0.2
0.4
0.6
0.8
1
1.2
0.1 0.6 1.1 1.6Yield Base Shear Coefficient
Dam
age
Rat
io
>=Slight
>=Moderate
Heavy
Err
or R
ate
=| 1
-S
urv
ey D
amag
e R
atio
/ C
alcu
lativ
e D
amag
e R
atio
|
CalculationCalculation
Damage SurveyDamage Survey
(a) Damage ratio (b) Error between survey and calculation
3F 3F
4F4F
5F 5F
0
0.2
0.4
0.6
0.8
1
1.2
0.1 0.6 1.1 1.6Yield Base Shear Coefficient
Dam
age
Rat
io
>=Slight
>=Moderate
Heavy
0
0.2
0.4
0.6
0.8
1
1.2
0.1 0.6 1.1 1.6Yield Base Shear Coefficient
Dam
age
Rat
io
>=Slight
>=Moderate
Heavy
Building Research Institute (BRI), the Ministry of Construction (at the time), digitized the results of the survey to a database on GIS [20].
REFERENCES 1. Yamazaki F, Noda K, Meguro K. “Development of early earthquake damage assessment systems in
Japan.” Structural Safety and Reliability, Proceedings of ICOSSAR’97, 1998; 1573-1580. 2. Saeki T, Tsubokawa H, Shiomi K. “A survey of earthquake damage assessments executed by the
local governments post the Hyogo-ken Nanbu earthquake.” Journal of Social Safety Science 1999; 1: 165-172 (in Japanese).
3. Goto Y, Takeuchi I, Kakumoto S. “Integrated earthquake disaster simulation system for the highly-networked information society.” Proceedings of the 13th World Conference of Earthquake Engineering, 2004 (in Press).
4. Ministry of Construction. “Notification No.1457 by the Ministry of Construction.” 2000 (in Japanese).
5. BRI, JSSI, JABRP. “Technical background for the notification on the structural calculation procedure for building with seismic isolation 2000.” 2001 (in Japanese).
6. BRI. “Technical background for the notification on the structural calculation procedure for building with structure 2000.” 2001 (in Japanese).
7. Applied Technology Council (ATC). “ATC-40: Seismic Evaluation and Retrofit of Concrete Buildings.” 1996.
8. Kani N, Koshika N, Midorikawa M, Iiba M, Wada A. “Technical background on the Japanese linearized equivalent method for seismically isolated buildings.” Proceedings of the Structural Engineers World Congress 2002, Yokohama, Japan, 2002.
9. Hayashi Y, Kitahara A, Hirayama T, Suzuki Y. “Evaluation of peak ground velocities in western Tottori earthquake of 2000.” Journal of Structural and Construction Engineering 2001; 548: 35-41 (in Japanese).
10. Okano H, Miyamoto Y. “Equations derived from equivalent linearization method, Consideration based on energy balance and its application to evaluation of probability of excess of deformation capacity.” Journal of Structural and Construction Engineering 2002; 562: 45-52 (in Japanese).
11. Federal Emergency Management Agency. “HAZUS99 Technical Manual.” 1999. 12. Murao O, Yamazaki F. “Comparison of building damage evaluation by local governments after the
1995 Hyogoken-Nanbu earthquake.” Journal of Architecture, Planning and Environmental Engineering 1999; 515: 187-194 (in Japanese).
13. Nishinomiya City Government. “The Great Hanshin-Awaji Earthquake disaster: the record on Nishinomiya city.” 1996 (in Japanese).
14. Yamaguchi N, Yamazaki F, Wakamatsu K. “Analysis of building damage in Nishinomiya city due to the Hyogoken-Nanbu earthquake.” Proceedings of the 6th U.S National Conference on Earthquake Engineering, CD-ROM, Seattle, Washington, U.S.A., Earthquake Engineering Research Institute, 1998.
15. Architectural Institute of Japan and City Planning Institute of Japan. “Report of emergency damage survey of the 1995 Hyogoken-Nanbu earthquake.” 1995 (in Japanese).
16. Yamaguchi N, Yamazaki F. “Fragility curves for buildings in Japan based on damage surveys after the 1995 Kobe earthquake.” Proceedings of the 12th World Conference on Earthquake Engineering, CD-ROM, Auckland, New Zealand, Paper no. 2451, 2000.
17. Sato T, Kita K, Maeda T. “Estimation of acceleration response spectra in the severely damaged aera due to the 1995 Hyogoken-Nambu earthquake.” Journal of Structural Mechanics and Earthquake Engineering 1997; 563: 149-159 (in Japanese).
18. Miyakoshi J, Hayashi Y, Tamura K. “Study of seismic performance of building groups based on building damage data and earthquake response analysis.” Proceedings of the 10th Japan Earthquake Engineering Symposium, Japan, vol. 1, 1998; 327-332 (in Japanese).
19. Nagato K, Kawase H. “Damage evaluation models of reinforced concrete buildings based on the building damage statistics and simulated strong motions.” Journal of Structural and Construction Engineering 2001; 544: 31-37 (in Japanese).
20. Building Research Institute. “Final report of damage survey of the 1995 Hyogoken-Nanbu earthquake.” 1996 (in Japanese).
Related Documents