Realizing the Development Promise of the Doha Agenda 2004 Global Economic Prospects Global Economic Prospects 2004 Global Economic Prospects 2004 Realizing the Development Promise of the Doha Agenda

Welcome message from author
This document is posted to help you gain knowledge. Please leave a comment to let me know what you think about it! Share it to your friends and learn new things together.
Transcript
Realizing the Development Promise of the Doha Agenda 2004
Global Economic Prospects
Global Economic Prospects
2004G
lobal Econom
ic Prospects2004
ISBN 0-8213-5582-1
THE WORLD BANK
Realizing the Development Promise of the Doha Agenda
The World Trade Organization(WTO) round of trade negotiations
initiated in November 2001 inDoha, Qatar, was intended to be a“development round.”Those good
intentions are now being tested.Trade ministers from all over the
world are discussing ways to reducetrade barriers—barriers that greatly
harm development and povertyreduction. Global Economic Prospects
2004 explores the tough issuesunder discussion—protection of
agriculture, trade in labor-intensivemanufactures, labor services, andspecial treatment for developing
countries, among others—to presentoptions that would indeed reduce
poverty and advance development.The global talks will not be easy and
may take time, but allowing poorpeople greater access to world
markets will offer them new opportunities to improve their living
standards. If agreements are to begenuinely pro-development, thesediscussions must be informed byclear analysis of measures that arelikely to benefit poor people themost.That is the purpose of this
Global Economic Prospects.
—Nicholas SternSenior Vice President and
Chief Economist
The Doha Development Agenda of the Fourth MinisterialConference of the WTO opened many contentious andimportant questions. Global Economic Prospects 2004:
Realizing the Development Promise of the Doha Agenda analyzes themost critical multilateral trade issues and suggests policy options that would raise living standards in developing countries and reduce global poverty.
The fourteenth annual edition of Global Economic Prospects
• explores the short-, medium-, and long-term outlook for the global economy, including driving forces, commodity prices,and capital flows, and their implications for major regions
• reviews recent trends in exports from developing countries,trade barriers that work to the disadvantage of poor people,and policies to reduce protection and other inequities in theworld trading system
• examines trade in agriculture—the most important and politicallycontentious sector for global poverty reduction—including keylessons from development experience, possible changes to the current system of subsidies and protection, and the potential for liberalization in both rich and poor countries
• investigates the temporary movement of labor—so-called Mode 4 of the General Agreement on Trade in Services—evaluating its advantages and disadvantages to both the home and the host countries
• discusses trade facilitation in light of post-9/11 concerns for security to suggest new policies that would promote greater and more-secure trade
• reviews the special treatment of developing countries in the world trading system and the role of trade preferences,exemptions from WTO rules, and technical assistance to implement WTO trade regulations.
Global Economic Prospects 2004 provides essential information forthose concerned with developments shaping today’s global economy.
GlobalEconomicProspects
Realizing the Development Promiseof the Doha Agenda
2004

© 2003 The International Bank for Reconstruction and Development / The World Bank1818 H Street, NWWashington, DC 20433Telephone 202-473-1000Internet www.worldbank.orgE-mail [email protected]
All rights reserved.
1 2 3 4 04 03
This volume is a product of the staff of the World Bank. The findings, interpretations, andconclusions expressed herein do not necessarily reflect the views of the Board of ExecutiveDirectors of the World Bank or the governments they represent.
The World Bank does not guarantee the accuracy of the data included in this work. Theboundaries, colors, denominations, and other information shown on any map in this work do not imply any judgment on the part of the World Bank concerning the legal status of anyterritory or the endorsement or acceptance of such boundaries.
Rights and Permissions
The material in this work is copyrighted. Copying and/or transmitting portions or all of thiswork without permission may be a violation of applicable law. The World Bank encouragesdissemination of its work and will normally grant permission promptly.
For permission to photocopy or reprint any part of this work, please send a request with complete information to the Copyright Clearance Center, Inc., 222 Rosewood Drive,Danvers, MA 01923, USA, telephone 978-750-8400, fax 978-750-4470, www.copyright.com.
All other queries on rights and licenses, including subsidiary rights, should be addressed to the Office of the Publisher, World Bank, 1818 H Street NW, Washington, DC 20433, USA, fax 202-522-2422, e-mail [email protected].
ISBN 0-8213-5582-1 ISSN 1014-8906
Cover photo credit: AFP/CORBIS.
Workers at the Los Ausoles coffee plantation in Ahuachapan, El Salvador, clean coffee beans,August 14, 2002.

iii
Foreword ix
Acknowledgments xi
Overview xiii
Abbreviations and Data Notes xxxi
Chapter 1 Global Outlook and the Developing Countries 1The industrial countries: Deficits, confidence, capital spending, and the dollar 4The external environment for developing countries: Gradual improvement, but a
bumpy road ahead 19The developing countries: Back on track toward growth? 28Trade, growth, and poverty in developing countries 38Looking ahead to the Doha Round 47Annex 1 Historical trade dynamics for developing countries 55Notes 59References 60
Chapter 2 Trade Patterns and Policies: Doha Options to Promote Development 63Changing patterns in developing-country exports 65Behind the patterns: Economic and policy determinants 73Market access for development: The agenda 78From Doha to Cancún and beyond: How should protection be reduced? 88Notes 98References 98
Chapter 3 Agricultural Policies and Trade 103Poverty, rural households, and trade in agriculture 105Trade and export growth in agriculture 109Global agricultural protection: The bias against development 114Proposals for reforms in the Doha Round 131Notes 138References 139
Contents

Chapter 4 Labor Mobility and the WTO: Liberalizing Temporary Movement 143The bigger picture: Global migration and remittance trends 145Temporary movement of workers 150Bilateral and regional approaches to labor mobility 152Understanding the impact of temporary foreign workers 155Mode 4 and the WTO 166Notes 172References 174
Chapter 5 Reducing Trading Costs in a New Era of Security 179Why transport, trade facilitation, and logistics matter 181The new international security dimension in trade 182The anticompetitive effects of international transport regulations 188Trade facilitation 191Trade facilitation and the WTO agenda 195Lowering transport costs, increasing security, and facilitating trade 198Notes 200References 202
Chapter 6 Development and the Doha Agenda 205Special and differential treatment and the WTO 207Market access for development 208Toward a new regime for WTO rules 220Putting development into the Doha agenda 227Notes 228References 229
Appendix 1 Regional Economic Prospects 233
Appendix 2 Global Commodity Price Prospects 257
Appendix 3 Global Economic Indicators 279
Figures1.1 Growth in the OECD countries falters 41.2 OECD manufacturing shows a distinct “double dip” 51.3 Consumer confidence recovers from pre-war lows 61.4 The drop in U.S. household net worth has been offset by real estate appreciation 81.5 Capital spending has been hesitant in all industrial countries 91.6 Corporate profits have risen moderately in the United States and Japan 91.7 Business confidence remains poor, but better in the United States than in Europe 101.8 The U.S. fiscal deficit is widening quickly 111.9a The U.S. current account deficit is at record levels 111.9b The U.S. current account deficit is at record levels 131.10 Market interest rates have dropped 141.11 Is deflation a danger for Europe and the United States? 15
G L O B A L E C O N O M I C P R O S P E C T S
iv

1.12 Output gaps are widening, bringing deflationary pressures to bear 161.13 The dollar has fallen sharply since early 2002 161.14 OECD recovery begins in the United States 181.15 OECD-area imports have declined sharply since April 2000 211.16 China’s share of East Asian exports keeps rising 211.17 The price of oil fell sharply before the war in Iraq 231.18 Agricultural prices have begun to decline as crop prospects improve 251.19 Emerging-market spreads rallied sharply after late 2002 261.20 Bond issuance dominates capital market flows in 2003 271.21a Regional trends in industrial production are mixed 29121b Inflation is moderating in the developing world 291.21c Major currencies in Latin America and East Asia are firming up 301.22 Developing countries are on track toward long-term growth 311.23 Growth rates in developing countries will rise through 2005 311.24 Before the SARS outbreak, East Asian GDP was growing robustly 321.25 Argentina, Brazil, and Chile see strong upturn in production 331.26 Growth will cool in CIS while picking up in Central and Eastern Europe 341.27 Middle East oil production has increased to prevent shortages 351.28 Indian production of food and automobiles recovered sharply in early 2003 371.29 Growth in Africa is expected to improve modestly 381.30 Income elasticity has risen globally, but particularly in the developing world 401.31 Export-to-GDP ratios have risen sharply in developing countries 411.32 Productivity will contribute more to GDP growth through 2015 than will capital or
labor 441.33 The pro-poor reform scenario promises substantial income gains 501.34 Exports should rise sharply 521.35 Millions of people would be moved out of poverty 521.36 Gains for most, but adjustment costs for some 531.37 Significant shifts in global output patterns 542.1 Developing countries have become important exporters of manufactured
products 652.2 Manufactures account for a growing share of exports in all regions 672.3 Technology-laden manufactures have increased as a share of exports from each group
of countries, while the share of resource-based exports has diminished 702.4 Global production sharing is increasingly important for China and India 712.5 Soaring exports from China and India had only a moderate effect on China’s and
India’s terms of trade 722.6 Many developing countries face an adjustment when quotas are lifted 802.7 Antidumping barriers by sector and by country group 883.1 Countries that produce more cash crops also produce more food 1093.2 Import growth rates of nontraditional export commodities decreased in industrial
countries but increased in developing countries 1123.3 Developing countries’ exports of nontraditional products have surged, but industrial
countries’ exports have changed little 1143.4 Developing countries lowered tariffs on manufactured products more than on
agricultural products 119
C O N T E N T S
v

3.5 Rich countries use non–ad valorem tariffs more often than do developingcountries 122
3.6 Throughout the world, tariff rates escalate with degree of processing 1233.7 The proportion of tariff lines containing non–ad valorem duties increases with degree
of processing 1253.8 Tariff rate quotas protect a substantial portion of output in many industrial
countries 1263.9 High protection of sugar and wheat has increased domestic production and reduced
net imports 1284.1 Workers’ remittances are an important source of income for many developing
countries 1495.1 Customs clearance takes longer in the developing world than in the OECD,
lowering the competitiveness of developing-country trade 1855.2 Higher trade costs reduce global welfare 1865.3 Facilitating trade in less-efficient countries would bring significant gains 1945.4 The impact of individual trade-facilitation measures differs significantly from region
to region 1955.5 Domestic reforms alone would produce many of the same gains as global
reform 1966.1 The benefits of U.S. trade preferences are distributed unequally 2116.2 Countries “graduating” from U.S. generalized system of preferences have better export
performance than those still in program 2126.3 Preferences have not increased the share of the least developed countries in imports
into the European Union and the United States 2156.4 Market shares of countries eligible for three U.S. “deep preference” programs have not
increased 2156.5 Preferred countries’ apparel exports to the United States have risen 2166.6 Agricultural exports from Mexico and Spain rose dramatically after the two countries
joined regional trade blocs 2176.7 The trade policies of countries in the U.S. generalized system of preferences are more
protectionist than those of countries not in the program 2186.8 Countries enjoying preferences have increased their exports of apparel to the
United States 219
Tables1.1 Global growth should accelerate, but risks persist 31.2 Weak fundamentals underlie sluggish growth in the rich countries 51.3 The difficult environment for developing-country growth should improve 201.4 Developing countries’ exports will grow faster than those of the high-income
countries 221.5 GDP per capita will grow faster in the developing world than in the OECD area 431.6 Global poverty will decrease significantly, but not uniformly across regions 461.7 Tariffs could be cut clearly and simply 481.8 The pro-poor tariff scenario would significantly lower protection 491.9 A large share of real income gains comes from lowering of barriers in agriculture and
food 511.A1 Sectoral export decomposition for developing countries 55
G L O B A L E C O N O M I C P R O S P E C T S
vi
1.A2 Regional export decomposition for developing countries 572.1 Developing countries are becoming exporters of high-value products 682.2 Developing countries’ exports became more competitive in the 1990s 742.3 Investment in people and in capital grew rapidly 752.4 Tariffs hurt exports—but less so in the 1990s than in the 1980s 772.5 Quota abolition in China will move resources from other activities to textiles
and clothing 812.6 Industrial countries levy higher tariffs on imports from developing countries than from
other industrial countries—and some regions have high tariff walls 822.7 Developing countries pay large amounts in tariffs to their neighbors 832.8 Most antidumping actions are filed by developing countries against other developing
countries 862.9 Antidumping rates are much higher than tariff rates 862.10 Antidumping duties are high 872.11 Competing formulas make a big difference for tariffs 952A.1 The various liberalization proposals have very different features 973.1 Most of the world’s poor live in rural areas outside the least developed countries
1063.2 Rural poverty is higher in poorer countries 1073.3 Even in subsistence economies, cash is important 1073.4 U.S. farmers earn less from farming than from other sources 1073.5 Manufacturing exports grew much faster than agricultural exports 1103.6 South-South exports in agriculture are rising as South-North export shares fall 1103.7 Developing countries have shared unequally in export market gains 1173.8 Agricultural tariffs are higher than manufacturing tariffs in both rich and poor
countries 1183.9 Agricultural tariffs: High peaks and deep valleys 1193.10 Most subsidies go to producers—and come from border protection 1203.11 Subsidies account for a large share of farmers’ revenues 1213.12 Specific tariffs are higher than ad valorem rates 1233.13 Tariffs rise with level of processing 1243.14 The Harbinson proposals could greatly reduce applied tariffs in the European Union
and the United States 1333.15 The Harbinson proposals would not significantly reduce protection in the developing
world—if reductions were taken from bound rates 1333.16 U.S. trade preferences—a plethora of programs 1364.1 Migration is rising in many OECD countries 1474.2 Workers’ remittances are the second-largest source of external funding for developing
countries 1484.3 Remittances are a significant source of income in all regions of the developing
world 1494.4 Temporary movement is rising in rich countries 1504.5 Foreign-born workers meet skill shortages in rich countries 1524.6 The distribution of costs and benefits associated with Mode 4 trade 1574.7 TMNP is the smallest of the four modes of international service supply 1684.8 Most Mode 4 commitments by WTO members are in management categories 169
C O N T E N T S
vii
5.1 Elimination of anticompetitive private practices can cut costs drastically 1906.1 Developing countries rarely receive significant preferences in sectors in which they
would have a comparative advantage 2096.2 Utilization rates for preference-eligible products with high MFN tariffs are low 2106.3 Actual use of preference programs is declining 211
Boxes1.1 Consumer confidence and U.S. private consumption 71.2 Financing the U.S. current account deficit: From equity to debt 121.3 OPEC struggles to achieve higher prices amid growing supply competition 241.4 Economic effects of Severe Acute Respiratory Syndrome (SARS) 331.5 AIDS is taking a rising toll in Sub-Saharan Africa 392.1 Poor export performance in 43 countries 692.2 Swimming upstream: The case of Vietnamese catfish 852.3 The scourge of the specific 892.4 “Average cuts,” the cut you have when you’re not having a cut 922.5 The implications of five tariff-cutting proposals 933.1 The impact of national trade integration and reform on poverty 1063.2 Did agricultural exports slow down solely because of falling prices? 1113.3 Decomposing export growth in manufacturing 1133.4 Food safety standards: From barriers to opportunities 1153.5 Decoupling agricultural support from production decisions 1273.6 Fewer subsidies, stronger agricultural sector 1323.7 The potential impact of real preferences 1343.8 Rules of origin in preferential schemes are complicated—and often
contradictory 1363.9 Food aid principles 1374.1 Population aging and migration 1464.2 Temporary labor movement and the East Asian crisis of 1997–98 1514.3 Recent initiatives to facilitate temporary movement of highly skilled workers 1534.4 A trade facilitation approach to labor mobility: NAFTA and APEC 1544.5 Initiatives to encourage return migration 1604.6 Wages and conditions 1634.7 E-commerce and temporary movement 1644.8 Boosting intra-EU labor mobility 1654.9 Measuring Mode 4 is still imprecise 1674.10 Key impediments to Mode 4 trade 1694.11 Elements of a possible GATS visa/permit regime 1715.1 The evolving definition of trade facilitation 1815.2 The logistics needs of a German car part manufacturer in Tunisia 1925.3 Tackling corruption in customs: Peru 1975.4 Customs reform in Lebanon 1986.1 EU and U.S. preference programs 2136.2 Major WTO provisions allowing developing countries greater freedom to use
restrictive trade policies 2216.3 A “development box” for the Agreement on Agriculture? 223
G L O B A L E C O N O M I C P R O S P E C T S
viii
The international community finds itself at a crossroads as it goes into the last quar-ter of 2003. Will the Doha Agenda regenerate the multilateral consensus that has been thehallmark of successive rounds of trade liberalization since 1947 and in doing so provide
new impetus for global integration? Or will the Doha Agenda collapse in stalemate and perhapsbe viewed as the moment when the international community retreated from multilateralism andopened the floodgates for less desirable bilateral and regional arrangements?
The answers to these questions matter a great deal to the world’s poor. The round of tradetalks launched in November 2001 in Doha, Qatar, is the first negotiation focused primarily on is-sues of concern to developing countries, and the first trade round since the birth of the WorldTrade Organization (WTO). Moreover, the Doha round is the first trade round for many newWTO members, including the world largest developing economy, China. Consequently, the roundhas the opportunity to remove many of the inequities in the global trading system that put de-veloping countries—and poor people in particular—at a disadvantage in their trade.
Three trade barriers are of particular concern. Poor people work in agriculture, and agricul-tural products are subject to the highest barriers to trade. In addition, poor people produce labor-intensive manufactures, which are subject to peak tariffs in a world that has already reducedaverage tariffs in manufactures to historic lows. Poor people could benefit from greater tempo-rary migration.
Governments everywhere have worked hard to create the opportunity to reduce these andother barriers. And they will have to work hard to capitalize on that opportunity. To fulfill thedevelopment promise of the Doha Agenda, rich countries will have to reduce protection of their(relatively wealthy) farmers. Their tariff walls and huge subsidies depress global prices of theproducts that poor farmers produce throughout the developing world. These subsidies cost theaverage working family in the European Union, Japan, and the United States more than $1,000a year. Middle-income countries, though their protection is generally lower and less distorting inagriculture, have high average tariffs in all sectors, and are more restrictive in services. As south-south trade increases in importance, protection of sectors in middle-income countries underminestheir poorer trading partners and often undercuts the countries’ own productivity growth. Fi-nally, low-income countries should look to the international system to meet their very reasonabledemands—not for special preferences to some markets and exemptions from rules, but fornondiscriminatory market access to every market in products in which they have a comparativeadvantage, for appropriately phased introduction of international regulations, and for develop-ment assistance in implementing administratively costly WTO rules. Like other countries, low-
ix
Foreword

income countries will find it in their interest to reduce their own external levels of protection aspart of an integrated development strategy aimed at reducing poverty.
Reducing barriers to trade is not enough to fulfill the development promise of Doha. Trademust be part of a larger development strategy for each country, a strategy that includes attentionto macroeconomic policy, infrastructure, education, and health as well as to accountable andresponsible governance. These elements of investment climate take time to develop but are es-sential for growth and poverty reduction and are crucial to make a sound trade strategy pay itsgrowth and poverty reduction dividends.
The World Bank, working in partnership with the other international institutions and bilateraldonors, is committed to supporting a pro-poor Doha outcome. Our objectives in trade are two-fold: promoting a world trading system in which global, regional, and bilateral rules are con-ducive to development and poverty reduction, and helping individual developing countries lever-age trade to promote their own growth. The latter objective hinges on integrating appropriatelysequenced trade reforms into national development and poverty reduction strategies.
The Bank is increasing its investment in research, technical assistance, and lending for trade.A casual perusal of the bibliography in each chapter of this report will give the interested readeran idea of the scope of the Bank’s research program. Moreover, in the last two years, the Bankhas undertaken at the request of governments more than 20 diagnostic studies of obstacles totrade integration. In conjunction with six partner institutions, the Bank has led the IntegratedFramework program—studies of trade obstacles in a dozen least-developed countries to date. Ithas completed several regional studies of trade.
In addition to studies and policy advice, the Bank has provided technical assistance in the formof lending to improve trade-related institutions and transport logistics. The Bank has programsthat finance activities in 49 countries (approximately one-third of its active client countries).These projects span all regions and range from export competitiveness projects in Ghana andBangladesh, to transport and trade facilitation projects in Eastern Europe, to support for im-proving customs–border control agencies and training the trading community in Pakistan. TheBank is also implementing projects to improve quality standards and is leading the “Standardsand Trade Development Facility,” an interagency partnership with the WTO, the FAO, and theWorld Health Organization, to deliver technical assistance for food safety and related standards.Should trade ministers reach an agreement on the Doha Agenda, the Bank will expand its lend-ing and technical assistance to help countries take advantage of new market access, to use tradeto promote their domestic competitiveness, and to manage any transitional costs—such as thosearising from erosion of trade preferences, changes in prices of imports, or reallocation of domes-tic resources from inefficient sectors to more efficient ones.
A pro-poor outcome in the Doha Agenda is only one step toward a world more supportive ofdevelopment. But this step is an important one. And it can be achieved only if everyone under-stands what is at stake in this historical moment—and moves purposefully and together to seizethe opportunity.
Nicholas SternChief Economist and Senior Vice PresidentWorld Bank
G L O B A L E C O N O M I C P R O S P E C T S
x

THIS REPORT WAS prepared by the World Bank Development Prospects Group, drawing on re-sources throughout the Development Economics Vice Presidency and the World Bank’s op-erational units. Richard Newfarmer was the lead author and manager of the report, under
the direction of Uri Dadush. The principal chapter authors were Richard Newfarmer (Overview);Elliot Riordan and Dominique Van der Mensbrugghe (Chapter 1); William Martin and VladManole (Chapter 2); Ataman Aksoy (Chapter 3); Pierre Sauvé, drawing on work by the OECD(Chapter 4); John Wilson, Shweta Bagai, and Carsten Fink (Chapter 5); and Bernard Hoekmanand Caglar Ozden (Chapter 6). We are grateful for the ideas and insights of several peer reviewerswho provided comments at various stages: Bijit Bora (World Trade Organization); J. Michael Fin-ger (American Enterprise Institute); Gary Hufbauer (Institute for International Economics); MariPangestu (Center for Strategic and International Studies), Gary Horlick (Wilmer, Cutler, and Pick-ering), and Julia Nielson (OECD); Julio Nogues (United Nations Development Programme); andOlivier Cattaneo (Agence Française de Développement). The report was prepared under the gen-eral guidance of World Bank Chief Economist and Senior Vice President Nicholas Stern.
Many staff from inside and outside the World Bank contributed to the report. In the Overview,Aart Kraay contributed a note on trade and poverty, and Carsten Fink, Bernard Hoekman,William Martin, and Aaditya Mattoo provided helpful suggestions. In Chapter 1, Hans Timmer,Caroline Farah, Himmat Kalsi, Robert Keyfitz, Annette I. De Kleine, Robert Lynn, FernandoMartel Garcia, Mick Riordan, and Bert Wolfe contributed to the global trends analysis; Do-minique Van der Mensbrugghe provided the long-term analysis; Shaohua Chen and MartinRavallion contributed to the poverty analysis; and Katherine Rollins was the staff assistant.Chapter 2 benefited from background papers and other inputs from J. Michael Finger and AndriZlate. For Chapter 3, John Beghin, Donald Mitchell, John Baffes, Harry De Gorter, NdiameDiop, Paul Brenton, Steve Jaffee, and Mirvat Sewadeh provided background papers, and BarisSivri, Tarek Soueid, Konstantin Senyut, and Gaston Gohou undertook data collection and analy-sis. Chapter 4 drew on research papers prepared by the OECD Trade Directorate and on the an-nual OECD report Trends in International Migration; the chapter reflects insights from JeffreyLewis, Julia Nielson (OECD), and Olivier Cattaneo (AFD). Tsunehiro Otsuki and KatherineMann (IIE) worked closely with the team on Chapter 5, and Ranga Rajan Krishnamani providedresearch assistance. Chapter 6 draws on research by Bernard Hoekman, ConstantineMichalopoulos, and L. Alan Winters. The regional annexes benefited from the written input ofregional chief economists around the Bank and their staff, particularly Milan Brahmbhatt. JohnBaffes, Betty Dow, Donald Mitchell, and Shane Streifel prepared the commodity annex. The staffassistant for the report was Awatif Abuzeid. Steven Kennedy provided editorial assistance. Denis
xi
Acknowledgments

Medvedev provided research assistance. Dorota Nowak coordinated the report’s publication anddissemination activities, working closely with the World Bank’s Office of the Publisher.
Several experts provided written comments that have immeasurably improved the quality ofthe report at various stages: Paul Brenton, Robin Carruthers, Jean-Jacques Dethier, ShahrokhFardoust, Coralie Gevers, Ian Goldin, Gary Horlick, Elena Ianchovichina, Mark Juhel, HansPeter Lankes, Jeffrey Lewis, Patrick Low (WTO), Kunio Mikuriya (World Customs Organiza-tion), John Nash, David Rosenblatt, John Panzer, Luiz Perreira da Silva, Byungdoo Sohn, MarkSundberg, Helena Tang, Yvonne Tsikata, and L. Alan Winters.
G L O B A L E C O N O M I C P R O S P E C T S
xii

ON THE EVE of the World Trade Organi-zation’s (WTO) Fifth Ministerial Meet-ing in Cancún in September 2003, the
world’s trade ministers—and the governmentsthey represent—face enormous challenges. Theglobal trade talks are stalled in several policydomains vital to developing countries—agricul-ture, nonfarm trade, access to patented drugsfor countries without domestic drug industries,special and differential treatment, and disputesettlement. Nor is there much progress in othercontentious areas, such as the “Singapore is-sues” of investment, competition, trade facilita-tion, and government procurement.
At the same time, the global recovery con-tinues to sputter. Although some signs of aturnaround have been evident in the UnitedStates, Europe seems to be losing momentum,and Japan appears positioned for another dis-appointing year. The Chinese economy, rein-forced by a positive performance in East Asiain 2002, continues to bustle along, but con-cerns over Severe Acute Respiratory Syndrome(SARS) and lost export momentum in the faceof the world slowdown haunted the regionaloutlook. South Asia continues to grow morerapidly than the world average. Latin Americais showing signs of an upturn, driven in part byrenewed confidence in Brazil, a tentative re-bound in Argentina, and an increase in Mex-ico’s growth; however, the recession in theRepública Bolivariana de Venezuela, whencoupled with political difficulties in the An-
dean countries, continues to weigh down re-gional performance. Africa, suffering from lowcommodity prices, is growing slowly; althoughfaster than in the 1980s and 1990s, today’sgrowth is far short of the pace necessary tomake significant dents in the poverty head-count or to achieve the Millennium Develop-ment Goals in health and education. War hasadversely affected regional performance in theMiddle East and North Africa; sluggish per-formance in Europe, especially Germany, hasadversely affected many countries in Centraland Eastern Europe. Even though progress ontrade would undoubtedly boost investor confi-dence, politicians coping with slow growthand high unemployment at home have beenfinding it more difficult to risk alienating in-fluential constituencies by accepting bold pro-posals in the world trade talks.
The outlook for the remainder of this yearand for 2004, though somewhat improved, isunlikely to produce growth strong enough tocut sharply into unemployment rates (figure 1).Uncertainty in the global environment remainsunusually high. Structural problems persist—overcapacity in high-tech industries globally,rising twin deficits in the U.S. fiscal and cur-rent accounts, and lingering bad loans inJapanese and (to a lesser extent) Europeanbanks. Other problems may prove more tran-sitory. The cessation of conflict in Iraq has notyet produced complete calm, and the inabilityto reach consensus at the UN Security Council
xiii
Overview

xiv
has created a lingering distrust among multi-lateral partners that clouds the global businessenvironment. Nonetheless, policy responsesare promising. Governments in the UnitedStates and Europe reacted to weak economicconditions with fiscal and monetary policy tostimulate their economies. And at the globalpolitical level, the June meeting of the G-8, to-gether with several subsequent bilateral meet-ings, began to mend frayed multilateral rela-tions. It remains to be seen whether this newpositive momentum will extend into multilat-eral collaboration in trade.
The precarious international environment isonly one reason why the global trade talkshave progressed slowly. Deeper explanationscan also be found in the history of multilateraltrade talks themselves. With the incorporationof ever more countries—mainly from the de-veloping world—the sheer number of actorshas expanded, making coalitions more difficultto build and consensus more elusive. More-over, previous multilateral rounds producedagreements in areas of primary interest to therich countries that dominated these discus-sions, particularly in manufactured goods. Itwas only with the Uruguay Round, concluded
in 1994, that tentative steps toward freeing uptrade in products of particular interest to de-veloping countries—notably agriculture andtextiles—were included. Consequently, manyof the hardest issues for rich countries havebeen left to this negotiation.
Realizing the developmentpromise of the Doha agenda
The challenge is daunting. But so is the re-ward to success. With room for addi-
tional fiscal and monetary stimulus rapidlyvanishing, progress on structural reforms suchas trade is important. In addition to bolsteringinvestor confidence in the short term, a DohaRound agreement that slashed trade barriers,particularly in agriculture, would stimulatetrade and raise incomes around the world,leading to a substantial reduction in globalpoverty.
The open question is whether a new multi-lateral agreement will live up to the develop-ment promise of the Doha Agenda. Severalissues under discussion are pivotal to develop-ment outcomes. They are the focus of thisreport:
• Because most poor people live in rural areas,trade barriers in agriculture are among themost important to poverty reduction.
• Labor-intensive manufactures have been themost dynamic market segment for everymajor region, including Africa, yet manydeveloping countries find that their exportsmeet obstacles in foreign markets—hightariffs, quotas, specific duties, and “anti-development” tariff structures that discour-age adding value in poor countries.
• In services, the potential for development-promoting reciprocal gains is especially high.Regulations in some developing countriesstill protect some inefficient state monopo-lies from competition—a drag on growth.(To be sure, proper regulation in some sec-tors must precede liberalization to avoid po-tential disruptions in socially important mar-kets, such as finance or basic services.) Also,
G L O B A L E C O N O M I C P R O S P E C T S
Figure 1 The recovery is building . . . but slowlyGDP growth, percent per annum
Source: World Bank data and projections.
Developingeconomies
Forecast
�
High-incomeeconomies
�
02000 2001 2002 2003 2004 2005
1
2
3
4
5

xv
O V E R V I E W
access for developing countries’ services ex-ports to industrial countries has yet to befully bound in the General Agreement onTrade in Services (GATS) (World Bank2001). Finally, national laws prevent greaterlabor mobility that would otherwise con-tribute to higher standards of living in bothreceiving and sending countries.
• Reducing the costs of trading by improvinginternational transportation services, cus-toms and ports, and logistics management—trade facilitation—requires substantial newinvestment, additional technical assistance,and coordinated multilateral efforts. Tradefacilitation is fundamental to realizing theexpanded trade promise of Doha, but theWTO agenda constitutes a small part of the challenge.
• Finally, the issue of special treatment for de-veloping countries cuts across all of thesepolicy domains and affects trade preferencesand exemptions from WTO regulations.The pursuit of trade preferences and exemp-tions from multilateral rules have not al-ways served developing countries partic-ularly well, both because preferences have not proven reliable and because selec-tive coverage has often left productivity-detracting trade barriers in place. The resid-ual barriers sap growth in the protectedeconomies and in developing-country trad-ing partners that are denied access. Perhapsmost important, the majority of the world’spoor do not live in the least developed coun-tries (LDCs). Trade preferences targeted atthese countries do not benefit the three-quarters of the world’s poor that live onUS$1 per day in other countries. In imple-menting new WTO rules, new accords willbe most effective if they recognize differ-ences among individual countries’ capacityto undertake new, resource-intensive rules.These differences require a new approach tospecial and differential treatment.
These areas pose difficult political chal-lenges for all segments of the internationalcommunity—rich countries, middle-income de-
veloping countries, and low-income countriesalike. Rich countries account for two-thirds ofworld trade and comprise nearly three-quartersof world GDP, so their domestic policies—mostevident in agriculture—have the greatest effecton the global marketplace. Despite the fact thatagricultural protection, tariff peaks, and anti-dumping measures shield powerful lobbies,rich-country leadership in reducing this protec-tion is a prerequisite for a pro-poor develop-ment outcome.
Today’s middle-income developing coun-tries have increased their global market sharein the last two decades. Because they includemany of the most dynamic global economies,their domestic policies no longer have onlyminor consequences for trade. With protectionrates in manufactures three times the level ofthose in rich countries and with ubiquitous re-strictions on services, the middle-income coun-tries have ample scope for undertaking reduc-tions in protection that will accelerate theirgrowth and provide access and a growth im-pulse to neighboring countries. High protec-tion in these countries taxes their growth andtheir poor in much the same way as protectionin the North.
Low-income countries have a special inter-est in greater market access, but they cannotsuccumb to the siren calls of preferential mar-ket access nor opt out of reducing border pro-tections at home, which tax exports and cutinto productivity growth. Preferences forLDCs can help, but would be more effective ifthey were made less restrictive and more reli-able than at present—and if benefiting coun-tries take the necessary policy steps, includingreductions in border protection, to promote asupply response. Moreover, because other de-veloping countries are unlikely to be grantednew trade preferences, global reciprocal re-duction in trade barriers holds the mostpromise for the world’s poor.
Market access is not the whole develop-ment story. Even if developing countries suc-ceed in obtaining access to new markets, theywill have to adopt complementary policies—removing obstacles to private investment, im-

proving public investment in infrastructure,and providing education—to ensure that do-mestic firms respond to new opportunities as-sociated with greater integration, and that thebenefits of integration are transmitted to thepoor. Put differently, trade policies must beembedded in a coherent national developmentstrategy—they are not a substitute for it. Forall of these reasons, realizing the developmentpromise of the Doha Agenda requires the par-ticipation of all groups of the internationalcommunity.
This report: toward a pro-poor Doha outcomeThis report analyzes central elements of theDoha Agenda that are important to developingcountries. Chapter 1 describes the prospectsfor the global economy that form the back-drop to the Doha trade negotiations. Chapters2–6 focus on agriculture, nonagricultural trade,services, transport and trade facilitation, andspecial development provisions. In each area,we expand on themes that have received lessanalysis in previous World Bank reports—among them specific duties in agriculture, an-tidumping in manufactures trade, temporarymovement of labor in services, security issuesin trade facilitation, and trade preferences andexemptions from rules as part of special anddifferential treatment (SDT). The remainder ofthis overview weaves these findings togetherwith those of previous Bank studies1 to lay outthe principal elements of a pro-poor outcomefor the Doha Agenda.
A Doha deal for development
Agriculture is at the heart of a development roundAgriculture is central to the developmentpromise of this trade round for two reasons:most of the world’s poor work in agricultureand most of the world’s protection is directedat agriculture. Some 70 percent of the world’spoor live in rural areas and earn their incomefrom agriculture. Largely exempt from pre–
Uruguay Round trade agreements to reduceprotection, agriculture is among the most dis-torted sectors in international trade. Eventhough levels of average tariff protection arecomparable in rich and poor countries, the ex-tensive use of producer subsidies in the OECDcountries and the fact that the OECD consti-tutes two-thirds of world agricultural trade un-derscore the centrality of their policies to de-velopment outcomes. Reducing protection inagriculture alone would produce roughly two-thirds of the gains from full global liberaliza-tion of all merchandise trade.
A few facts are enough to establish the con-text: protection facing developing country ex-porters in agriculture is four to seven timeshigher than in manufactures in the North andtwo to three times higher in developing coun-tries (IMF-World Bank 2002). Tariff peaks areparticularly high in rich countries againstproducts from poor countries. Tariff escalationthat discourages development of further pro-cessing is more pronounced in agriculture inboth rich and poor countries (figure 2). Heftyspecific duties are particularly common in richcountries; they automatically increase protec-
G L O B A L E C O N O M I C P R O S P E C T S
xvi
Figure 2 Escalating tariff rates discouragedevelopmentTariff rates
Sources: World Bank staff.
Raw
�
Final
Intermediate
�
�
0QUAD Canada Japan United
StatesEuropean
Union
5
10
15
20
25

O V E R V I E W
xvii
tion when commodity prices fall, throwing theburden of adjustment onto global prices andpoor countries. Subsidies in OECD countriesamount to US$330 billion—of which someUS$250 billion goes directly to producers. Theeffect is to stimulate overproduction in high-cost rich countries and shut out potentiallymore competitive products from poor coun-tries. It is no wonder that agricultural exportsfrom developing countries to rich countriesgrew in the 1990s at just half the rate they didto other developing countries.
Consider how agricultural protection playsthrough individual commodity markets. Sugarin the European Union (EU), Japan, and theUnited States is commonly protected through a combination of quotas, tariffs, and subsidiesallowing domestic sugar producers in thosecountries to receive more than double theworld market price. OECD governments sup-port sugar producers at the rate of US$6.4 bil-lion annually—an amount nearly equal to alldeveloping country exports. Prices are so highthat it has become economic to grow sugarbeets in cold climates and to convert corn tohigh-fructose corn syrup. Sugar imports in theOECD have shrunk to next to nothing. U.S.subsidies to cotton growers totaled US$3.7 bil-lion last year, three times U.S. foreign aid toAfrica. These subsidies depress world cottonprices by an estimated 10–20 percent, reducingthe income of thousands of poor farmers inWest Africa, Central and South Asia, and poorcountries around the world. In West Africaalone, where cotton is a critical cash crop formany small-scale and near-subsistence farmers,annual income losses for cotton growers areabout US$250 million a year. Rice support inJapan amounts to 700 percent of production atworld prices, stimulating inefficient domesticproduction, reducing demand, and denying ex-port opportunities to India, Thailand, Vietnam,and other countries.
More than 70 percent of subsidies in richcountries are directed to large (often corporate)farmers. These farmers have incomes that arehigher—often substantially so—than averageincomes in Europe, Japan, and, to a lesser ex-
tent, the United States. The net effect of subsi-dizing the relatively rich in wealthy countries atthe expense of adverse price penalties for theproducts of the relatively poor in developingcountries is to aggravate global income inequal-ities. Said differently, subsidies make the rela-tively rich even richer and the poor even poorer.
Realizing the development potential ofDoha requires phased reductions of borderprotection and subsidies. Of these, border pro-tection is the most important. These reductionsought to be done in a way that cuts off anti-development tariff peaks, reduces tariff escala-tion, and phases out specific duties. A pro-poor reform also means reforming policies thatdistort particular commodities of importanceto developing countries—sugar, cotton, rice,wheat, and dairy products.
Because global prices may rise in some com-modities, the international community maywant to design—and help finance—a programof adjustment in vulnerable countries that suf-fer deterioration in their terms of trade. Theseeffects are likely to be confined to a few coun-tries for several reasons: many food importersalso export other agricultural products thatwill experience positive terms-of-trade changesfrom liberalization; others now have tariffs onthose same food imports, tariffs that can be re-duced to offset any increase in global prices;some food importers will gain access to newmarkets in nonagricultural products and beable to export; and, because prices will changerelatively slowly, some food importers will in-crease domestic production in response tohigher prices and become self-sufficient or evennet exporters. Nonetheless, even though thechanges are likely to be manageable at theglobal level, the issue requires study and insome countries may require action.
Because rich and poor countries alike willbenefit from liberalization, all must make thepolicy changes necessary to realize its develop-ment promise. The rich countries, whose poli-cies arguably distort international trade themost, cannot escape leadership on agriculture.Moreover, leadership among donors to fi-nance a program to cushion adjustment is

G L O B A L E C O N O M I C P R O S P E C T S
xviii
Countries that trade more grow faster, according toevidence emerging from case studies of trade liberal-
ization and from large cross-country and time-serieseconometric studies. Although the links from specifictrade policy instruments to trade outcomes and growthis less clear, the basic association between increased tradeand growth is clear (box figure 1).a
Even when trade raises average incomes, its effects on poverty will depend on whether poverty in a given country is sensitive to growth in average in-comes, and on how the increase in trade affects the dis-tribution of income in the country. The first of these is-sues is empirically well understood. The sensitivity ofpoverty to growth in average incomes depends in an im-portant way on initial inequalities in a country (Raval-lion 1997). When incomes and opportunities are distrib-uted relatively equally, the effect of growth on povertyis larger than when initial inequality is high. Thus,growth associated with increased trade (or from anyother source) is likely to have larger proportional effectson poverty in countries where initial inequality is low.
More interesting and potentially more importantare the effects of increased trade on the distribution ofincome. Almost by definition, if increased trade dispro-portionately benefits the poor, poverty will fall fasterthan if trade disproportionately benefits the nonpoor.Understanding the likely distributional consequences oftrade liberalization is therefore crucial to understandingthe overall effects of trade on poverty. In many cases,there are very direct channels through which trade liber-alization is likely to disproportionately benefit the poor.For example, agricultural trade liberalization that al-lows previously suppressed prices of agricultural goodsto rise to world levels will benefit farmers, who are netproducers, but will hurt consumers. If farmers are morelikely to be poor, the liberalization will be, on average,pro-poor. Similarly, reductions in tariffs on manufactur-ers will hurt previously protected urban workers, who
Box 1 Trade and poverty: what are the links?
in many developing countries are likely to be relativelywell off, but will benefit poorer consumers of theirproducts by lowering prices.
At the same time, however, the distributional conse-quences of trade liberalization can also work againstpoor people. For example, reductions in tariffs imply re-ductions in trade tax revenues that can be important indeveloping countries that rely disproportionately on thissource of revenue. To the extent that public spending dis-proportionately benefits poor people (and this is by nomeans universal), reductions in tax revenues that accom-pany trade liberalization can have adverse distributionalconsequences.
The likely distributional consequences of trade lib-eralization, therefore, are complex and country-specific.Determining whether a given action would be pro- oranti-poor requires careful analysis. Looking back acrosscountries, there is little evidence that increased trade issystematically associated with either increases or de-creases in inequality (box figure 2).
On average, trade can be a powerful force forpoverty reduction, especially over longer horizons wherethe cumulative effects of growth on incomes of the poorare large. But this will not be true for all countries at alltimes—underscoring the importance of complementarypro-poor policies at the country level to ensure maximumpositive effects in every situation.
Box Figure 1 Integration with globalmarkets is associated with faster growthAverage annual per capita growth, 1980–99
Source: World Bank (2001).
0Decreasing export
share in GDPIncreasing export
share in GDP
0.51
1.52
2.53
3.5
–4
–3
–2
–1
0
1
2
3
4
–0.08 –0.06 –0.04 –0.02 0 0.02 0.04 0.06 0.08
Box Figure 2 Changes in trade have little relation to inequalityAverage annual change in Gini coefficient
Note: This figure shows changes in trade as a fraction of GDP andchanges in the Gini measure of income inequality, for a large sample of growth episodes of at least five years in duration.Source: Dollar and Kraay (2001).
Average annual change in trade/GDP
Series 1
Linear(Series 1)
y = 2.5227x + 0.0139R2 = 0.0013
Trade and the Gini coefficient
�
�
a For contrasting views on the state of the evidence on trade,trade policies, and growth, see Srinivasan and Bhagwati (2000),Rodriguez and Rodrik (1997), Bernanke and Rogoff (2001).Source: World Bank staff.

essential; their technical assistance to helpimplement standards and facilitate trade isneeded to help developing countries take ad-vantage of new trade opportunities. Middle-income countries, whose own policy reformswould produce a large share of the benefit todeveloping countries from global liberaliza-tion in agriculture, have to move more as-sertively than in the past. Their high tariffshave an adverse impact on growing South-South trade, especially with neighboringcountries. In a pattern common to all regions,agricultural exporters in East Asia, for exam-ple, paid one-third of all their tariff duties toother East Asian governments (second only to tariffs paid to get into rich countries). Agri-cultural exporters in the Middle East paid 44 percent of their tariff duties to regionalneighbors.
Nonfarm trade is increasingly essential to growth in poor countriesOver the past two decades, developing coun-tries have increased their share of global tradefrom just under one-quarter to about one-third. As a group, they have moved beyondtheir traditional specialization in agriculturaland resource exports into manufactures trade.Exports of manufactures have grown at nearlytwice the rate of agriculture, and now consti-tute nearly 80 percent of exports from all de-veloping countries. Countries that were low in-come in 1980 managed to raise their exports ofmanufactures from roughly 20 percent of theirtotal exports to more than 80 percent (figure3). As a result, many grew quickly and enteredthe ranks of today’s middle-income countries.The middle-income group of 1980 also in-creased its manufactures share, but somewhatless rapidly, to reach nearly 70 percent. Thisdramatic change in trade magnitudes and com-position has given developing countries a newinterest—and a powerful voice—in the ongo-ing Doha Round.
One reason for this change was the dra-matic reduction in border barriers in develop-ing countries since the mid-1980s, in combi-nation with increased access to rich-country
markets. Because import tariffs indirectly taxexports, reducing trade barriers in developingcountries stimulated trade. The burden of im-port protection on all export activities in de-veloping countries declined, but more so formanufactures than for agriculture and naturalresources. At the same time, the fact that suc-cessive multilateral trade rounds liberalizedglobal manufactures, while rich countries con-tinued to protect their agriculture (and devel-oping countries eventually began to followsuit) meant that developing countries’ exportsof manufactures were free to grow morerapidly than those in agriculture.
Today, trade in manufactures is still im-peded. Although tariffs on manufacturing inrich countries are on average lower than in de-veloping countries, the tariffs rich countriescharge developing countries are substantiallyhigher than those they charge other industrialcountries. For example, exporters of manufac-tures from industrial countries face, on aver-age, a tariff of 1 percent on their sales to otherindustrial countries; exporters in developingcountries pay anywhere from 2 percent if theyare from Latin America (where NAFTA weighsheavily) to 8 percent if they are from SouthAsia. Overall, rich countries collect from de-veloping countries about twice the tariff rev-enues per dollar of imports that they collectfrom other rich countries. However, the prob-lem is not solely a North-South issue. LatinAmerican exporters of manufactures, for ex-ample, face tariffs in neighboring Latin Ameri-can markets that are seven times higher than inindustrial countries. In Sub-Saharan Africa, thesame multiple is six; in South Asia, two.
Protection takes forms other than tariffs—among them quotas, specific duties, and con-tingent protection measures such as antidump-ing duties. As with tariffs, these measures tendto be used more frequently against labor-intensive products from developing countries.The quota arrangements in the WTO Agree-ment on Textiles and Clothing (ATC) stillshackle the exports of many poor countries.Although these arrangements are scheduled tobe removed in only 15 months, rich countries
O V E R V I E W
xix

to date have freed up only 15 percent of thequotas, obliging them to implement majorchanges at the end of the phase-in period. Av-erage antidumping duties are seven to tentimes higher than tariffs in industrial coun-tries, and about five times higher in developingcountries. Today’s protection remains heavilyconcentrated in the most politically sensitiveareas—textiles, clothing, and other labor-in-tensive manufactures, as well as agriculture—in both rich and poor countries.
Realizing the development promise ofDoha depends particularly on three efforts.
• First, rich countries desirous of promotingdevelopment can do so by ensuring that thenow lagging phase-out of the ATC is com-pleted according to the agreement—and notreversed through antidumping actions. TheATC phase-out will also require reforms bysome exporters facing increased competi-tion, many of which are LDCs, to ensure a
G L O B A L E C O N O M I C P R O S P E C T S
xx
Figure 3 Developing countries have become important exporters of manufactures
0
10
20
30
40
50
60
70
80
1981 1982 1983 1984 1985
Manufacturing exports (%)
Agricultural exports (%)
Resources exports (%)
1986 1987 1988 1989 1990 1991 1992 1993 1994 1995 1996 1997 1998 1999 2000 2001�
�
�
In middle-income countries, manufactures make up 70 percent of exports
Middle-income countries’ share of world exports, 1981–2001 (percent)
In low-income countries, manufactures make up 80 percent of exports
Low-income countries’ share of world exports, 1981–2001 (percent)
1981 1982 1983 1984 1985 1986 1987 1988 1989 1990 1991 1992 1993 1994 1995 1996 1997 1998 1999 2000 2001
Manufacturing exports (%)
Agricultural exports (%)
Resources exports (%)
0
10
20
30
40
50
60
70
80
90
�
�
�
Source: UN COMTRADE.

smooth adjustment; trade-related develop-ment assistance could play a role in easingthe transition.
• Second, in both rich and poor countries, ef-forts to cut back on antidumping measuresthat create a patchwork of ad hoc protectionare essential if market access granted by theright hand of quota elimination and tariff re-ductions is not to be withdrawn by the lefthand of antidumping suits. Developing coun-tries themselves have become accomplishedpractitioners of contingent protection.
• Third, moving forward in nonfarm trade re-quires a Swiss-type formula approach thatwill require disproportionately greater re-ductions in high tariffs so as to mitigate theantidevelopment bias embedded in mosttariff structures around the world. Thechoice of the formula, and of its coefficientsof reduction, is important. Applying thesecuts to bound rates will effectively credit de-veloping countries that have unilaterally re-duced their applied tariffs since the end ofthe Uruguay Round.
Services liberalization could raiseproductivity Services are the fastest-growing component ofthe global economy. Even in developing coun-tries, services exports grew more rapidly thanmanufactures in the 1990s (World Bank 2001,chapter 3). More efficient backbone services—in finance, telecommunications, domestic trans-portation, retail and wholesale distribution,and professional business services—improvethe performance of the whole economy becausethey have broad linkage effects. Yet most devel-oping regions trail the industrialized world inexposing service sectors to competition. Figure4 shows that only Latin American countries are beginning to approximate the high-incomecountries in their degree of competition. Esti-mates suggest that, after controlling for otherdeterminants of growth, countries that fully lib-eralized trade and investment in finance andtelecommunications grew on average 1.5 per-centage points faster than other countries overthe past decade (Mattoo, et al. 2001).
No less important, developing countrieshave an interest in locking in market access fortheir services exports to rich-country markets—exports that are growing more rapidly thanmerchandise exports. Examples include China’sincipient software industry as well as softwareand back-office services from India.
The Doha Round has the potential of lock-ing in access to foreign markets for servicesexports. Just as many rich countries have notyet bound access for developing countries’ ser-vices exports, many developing countries haveyet to schedule with the WTO liberalizing re-forms that have already been undertaken. Of-fering to bind unilateral reforms can be usedto lock in existing access to overseas servicesmarkets. Active participation in the servicesnegotiations could help accelerate these twinprocesses (Mattoo 2003).
The GATS process allows governments toliberalize services at their own pace. It does notrequire that a government forgo its regulatoryresponsibilities. Nor does the GATS frame-work require a cessation of subsidies or pre-empt pro-poor regulation on universal serviceaccess. The main requirement is that, once asector is scheduled, governments are requiredto have transparent regulations, treat domesticand foreign companies alike, and permit allforeign companies access to the domestic mar-ket on the same terms as domestic companies.In fact, many governments have chosen toliberalize—but not to make commitments with the GATS that would bind this opening.Some two-thirds of the WTO members havescheduled fewer than 60 sectors of the approx-imately 160 sectors covered by the GATS. Forexample, only 12 developing countries havemade commitments in education. None havemade commitments in the provision of water.
Why the reluctance? Liberalization in ser-vices is more complicated than in goods mar-kets. Privatization without competition andproper regulation may achieve nothing morethan transforming a public monopoly into aprivate monopoly—with no improvement inservices. And too many developing countrieshave been content to change ownership
O V E R V I E W
xxi

through privatization while retaining limits onentry that buttress monopolies.
Effective regulation is critical to ensure thatthe poor have access to basic services (WorldBank 2002a, 2002b). Some sectors, such asretail and wholesale services, can be openedexpeditiously because competition can be re-lied on to discipline firms’ pricing and invest-ment decisions. Others, however, require well-formulated regulations before liberalization toensure proper market functioning and ade-quate access for low-income groups to ser-vices. In China’s financial sector, for example,the World Bank recommended that financialmarkets be opened gradually to allow regula-tions and institutional developments to pre-cede liberalization. The goal was to avoiddestabilizing financial losses by state bankssaddled with poor portfolios as efficientbanks, domestic and foreign, entered the mar-ket (World Bank 1996). China’s WTO acces-sion agreement generally reflected this phasedapproach. In network sectors, such astelecommunications and water, ensuring ade-quate pricing and universal access are simi-larly important if the poor are to benefit fromthe expansion of the system (World Bank
2001, chapter 3). Trade ministers wishing toharness the reciprocal negotiating frameworkof the GATS to spur domestic reforms whileleveraging market access abroad must ensurethat sectoral ministries have properly se-quenced regulations to support liberalization.
Liberalized trade in labor services couldcontribute much more To date, virtually all GATS commitments havefocused on the first three “modes” of interna-tional service delivery. Most trade in serviceshas occurred through those same modes.Twenty-eight percent of the value of servicestrade, for example, has been in Mode 1, “cross-border supply of services.” Another 14 percenthas been in Mode 2, “consumption abroad,”such as tourism. Fifty-six percent has been in Mode 3, “commercial presence,” such asthrough foreign direct investment in services.
Mode 4, which involves the temporarymovement of labor to provide services, ac-counts for only 1.4 percent of services trade(figure 5). Temporary movement has some ad-vantages over permanent migration for bothdeveloped and developing countries. Richcountries can obtain workers whose skills are
G L O B A L E C O N O M I C P R O S P E C T S
xxii
Source: World Bank Global Economic Prospects 2002, based on data from Mattoo, et al. (2001).
Figure 4 Developing countries lag behind rich countries in services liberalization
0 2 4 6 8 10
South Asia
East Asia
Middle East and North Africa
Europe and Central Asia
Latin America and the Caribbean
High income
Middle East and North Africa
Europe and Central Asia
South Asia
East Asia
Latin America and the Caribbean
High income
Financial services
Telecommunications
Greater competitiveness
�
�
�

in short supply, with minimal disruption oflabor markets and without taxing social ser-vices. Temporary migration allows develop-ing countries to obtain access to new, higher-paying jobs without necessarily suffering the“brain drain” that would occur with perma-nent migration. Poor countries also gain fromremittances sent home by temporary migrants,and returning workers bring new skills back tothe sending country. In 2001, remittances frompermanent as well as temporary migrants pro-vided some US$71 billion to developing coun-tries, nearly 40 percent more than all officialdevelopment assistance and significantly morethan net debt flows to developing countries. Iftemporary movement of labor up to 3 percentof the total labor force in rich countries werepermitted, developing countries would standto gain as much as US$160 billion in addi-tional income (Walmsley and Winters 2003).
To date, however, even after the significantliberalization of trade in services during theUruguay Round, little has been done to loosenconditions governing the temporary movementof natural persons (TMNP) supplying services.Present commitments refer almost exclusively
to higher-level personnel. More than 40 per-cent of workers covered by existing Mode 4commitments are intracorporate transfereeswhose mobility is intimately related to foreigndirect investment (often in services); another50 percent are executives, specialists, and salespersonnel who are business visitors. To date,therefore, Mode 4 has been of limited signifi-cance for developing countries, whose compar-ative advantage lies in the export of mediumand low-skilled, labor-intensive services.
In addition to other concerns associatedwith broader migration issues, two fundamen-tal tensions hamper progress on Mode 4 tem-porary labor mobility. The first is that govern-ments are reluctant to undertake permanentcommitments when employment demand varieswith cyclical conditions. Wanting to maintainpolicy flexibility, immigration and labor marketofficials have made GATS commitments farbelow the degree of TMNP access already af-forded under domestic laws and regulations.TMNP liberalization has been greatest in sec-tors (and for categories of workers) where labordemand routinely exceeds supply—tourism, in-formation technology, health services. The sec-ond tension stems from the fact that regionalpatterns of migration create domestic politicalsupport for programs that favor neighboringcountries, whereas Mode 4 programs necessar-ily are open to all countries on a most-favored-nation (MFN) basis. Preferential migrationschemes are commonly negotiated at the bilat-eral and regional levels—and MFN-based liber-alization would undermine these. Becausemany bilateral labor agreements are usually nottied to trade policy or other agreements, theyafford governments a greater degree of flexibil-ity to adjust programs to evolving migrationtrends and labor-market needs.
Tensions notwithstanding, present levels ofMode 4 use fall far short even of Mode 4’s rel-atively modest potential. To rectify this, devel-oping countries should expand their requestsand offers in the Doha Round. Only six re-quests had been tabled by June 2003, and onlytwo from developing countries (India and Co-lómbia). Also, WTO members should adopt
O V E R V I E W
xxiii
Figure 5 Temporary labor mobility is anunderused mode of trade in service
Mode 4(movement of natural persons)1%
Value of world trade in services by mode, (percent)
Mode 1(cross-border
supply)28%
Mode 2(consumption
abroad)14%
Mode 3(commercialpresence)57%
Source: IMF, Balance of Payments Yearbook.

rules that would provide greater clarity andpredictability. To help regularize entry andexit while improving security, countries couldadopt a GATS visa system that would facili-tate national visas for up to one year, subjectto appropriate security checks and oversight(see Hatcher 2003 and Self and Zutshi 2003).
Reducing transport costs and facilitatingtrade can have a powerful effectThe cost of moving goods across internationalborders is often as important as formal tradebarriers in determining the cost of landedgoods—and ultimately of market share. Onestudy estimated that every day spent in cus-toms adds nearly 1 percent to the cost of goods(Hummels 2001). In developing countries,transit costs are routinely two to four timeshigher than in rich countries. Transparent cus-toms regimes, modern port facilities, densetransportation networks, and access to infor-mation and telecommunications systems—allcan help lower transit costs.
Since September 11, 2001, security has be-come a dominant issue in international trade.Border inspections, cargo review, and othermeasures have increased transport times anddriven up costs. Each 1 percent increase incosts to trade from programs to tighten bordersecurity reduces world income by US$75 bil-lion per year. Developing countries, too, arevulnerable to security threats and terrorism,but limited budgets, dependence on foreigntrade and investment, and outdated infrastruc-ture and technology present serious challengesfor these countries. New security protocolsbeing deployed at ports, customs offices, andborder posts around the world have the poten-tial to add costs and diminish market accessfor developing countries—at least in the shortterm. But managed correctly, the same mea-sures can streamline trade transactions whilepromoting safety and security. To achieve thistrade-expanding result, a global frameworkmust be established to ensure that the needs of developing countries are addressed as en-hanced security regimes take shape.
To counter any trade-reducing effects ofsecurity measures, every effort to cut trade-related costs in other areas is imperative. Reg-ulatory restrictions on international air andmaritime transport services inflate transportcosts—on some routes by amounts that dwarfthe value of tariffs. International air transport,which carries about 30 percent of developingcountries’ exports by value, is heavily pro-tected from international competition. Bilat-eral air service agreements commonly bar entryto efficient outside carriers, thereby raising ex-port costs for developing countries. City-pairroutes on which more than two passenger air-lines or dedicated freight airlines operate cancut costs by an average of 10.7 percent. Mar-itime transport, too, is often subject to prac-tices, such as cargo-reservation schemes andlimitations on port services, which protect in-efficient service providers. Such competition-restricting practices among shipping lines and port-terminal operators can increasefreight rates up to 25 percent on some routes.Rising concentration in the market for port-terminal services has increased the risk thatprivate firms may capture the benefits of gov-ernment reforms. Abusive practices by privateoperators are of special concern in develop-ing countries, where traffic volumes are lower and competitive forces inherently more limited.Regulations governing such practices are nowoutside the WTO mandate, but logically theyshould be reviewed for reformulation.
Facilitating trade by eliminating delays indeveloping countries would lower tradingcosts significantly, particularly if accompaniedby liberalization of transport and telecommu-nications, and streamlined regulations to pro-mote domestic competition. Trade facilitationrequires modernizing customs, improving portfacilities, and making investments in trade-related information technology—a huge insti-tutional and infrastructural agenda. Countriesdisplay wide variation in customs efficiencyand clearance times, for example (figure 6). Ifthose whose trade-facilitation capacity wasbelow average could be brought halfway up to
G L O B A L E C O N O M I C P R O S P E C T S
xxiv

the global average, international trade wouldincrease by US$380 billion annually.
Multilateral efforts are under way outsidethe WTO to promote—and in some cases fi-nance—institutional changes in trade facilita-tion. Key players include the World CustomsOrganization, the regional development banks,and the World Bank. Their efforts focus onpolicy reform, technical assistance, and infra-structure modernization.
Should trade facilitation, investment, andcompetition be the subject of newmultilateral disciplines in the WTO?As one of the four Singapore issues, tradefacilitation is under discussion in Geneva forpossible inclusion in the Doha Agenda. Al-ready the WTO, through the GATS, has a po-tentially important role to play in interna-tional transport and trade logistics—many ofthe transport service sectors could be immedi-ately scheduled with the GATS if countriessaw fit to do so. However, few countries havetaken advantage of its provisions.
Aspects of trade facilitation are part of theWTO’s trade-related disciplines, particularlythe provisions that encourage uniform treat-ment of transit trade and transparency of fees.Strengthening provisions related to transit,fees, and transparency, issues originally in theGeneral Agreement on Tariffs and Trade(GATT), would be helpful. However, bestpractice cannot be established in a vacuum; ithas to be gradually created in sound domesticlaws, regulations, and practices. A sustainedprogram of institutional reform must be tai-lored to each country, and it often requirestechnical assistance. The bilateral donors andmultilateral development banks and agen-cies are best positioned to provide the thor-ough diagnostics and technical assistancerequired to promote needed institutionalchange.
If the dynamics of the Doha negotiationspropel the WTO into a role in the broadertrade-facilitation agenda, any agreement, if it isto be effective, should recognize limitations indomestic capacity for implementation. Anagreement would be most effective if it in-cluded a serious commitment by developed na-tions to finance new trade-facilitation systems.Development assistance delivered under thecommitment could be provided by the WorldCustoms Organization, the multilateral devel-opment banks, and bilateral donors. The obli-gations of developing countries should be tai-lored to their implementation capacity. Andbecause the WTO’s dispute settlement provi-sions are largely inappropriate to promotinginstitutional changes, conventional enforce-ment of dispute settlement through trade sanc-tions ought to be set aside.
Other Singapore issues would stretch theWTO mandate into yet new areas, probablywith only marginal development benefits iftaken up in isolation. As discussed in GlobalEconomic Prospects 2003, there is no evidencethat an investment agreement would, by itself,promote new foreign investment. Similarly,adopting an agreement in competition policy—as currently framed in the negotiations—would
O V E R V I E W
xxv
Figure 6 Clearing customs takes longerin developing countriesAverage number of days to clear customs for sea cargo
Note: This is based on a sample of countries in each area;see figure 5.1 in chapter 5.Source: International Exhibition Logistics Associates.Available at http://www.iela.org.
Developed
East Asia andPacific
Latin Americaand the Caribbean
Africa
South Asia
0 2 4 6 8 10 12
have minimal effects on the terms of trade ofdeveloping countries, unless the agreementwere to establish new disciplines on nationalexport cartels and illegal international cartels(World Bank 2002a, chapter 4). Finally, a newagreement on government procurement thatfocuses on transparency is unlikely to improvemarket access substantially (Evenett 2002).Virtually all of the disciplines proposed in thesearrangements would require new policy actionsonly in developing countries. Although some ofthese may promote development, the main ben-efits of WTO agreements in these areas wouldbe in the market access that new agreementsleverage (Newfarmer 2003).
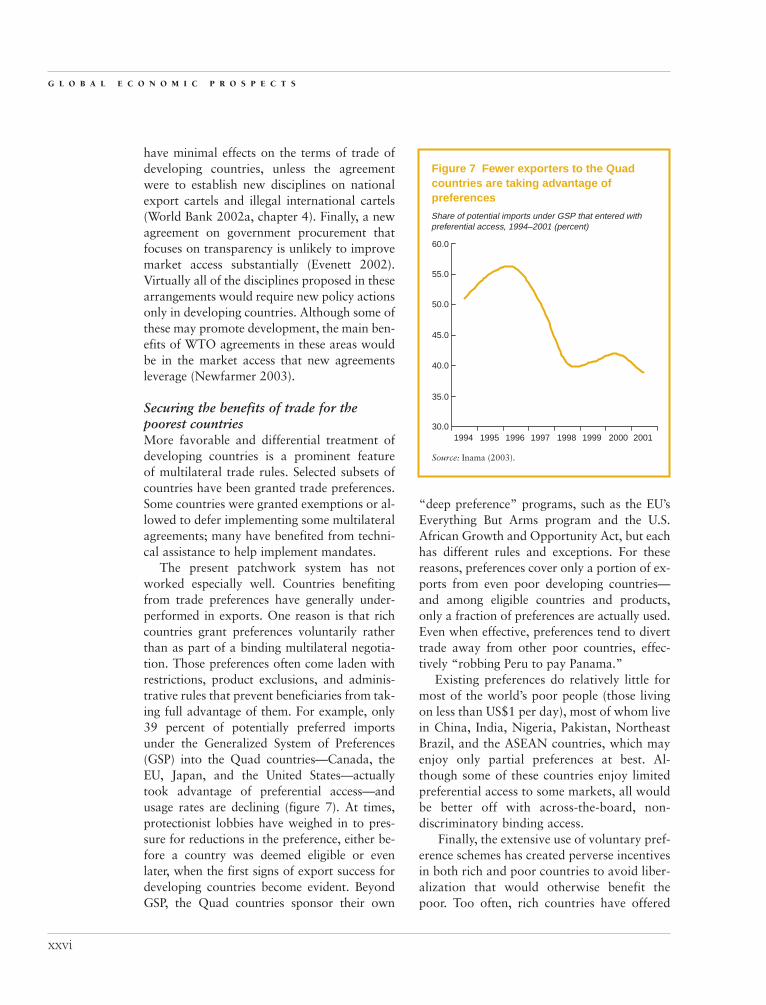
Securing the benefits of trade for thepoorest countriesMore favorable and differential treatment ofdeveloping countries is a prominent feature of multilateral trade rules. Selected subsets ofcountries have been granted trade preferences.Some countries were granted exemptions or al-lowed to defer implementing some multilateralagreements; many have benefited from techni-cal assistance to help implement mandates.
The present patchwork system has notworked especially well. Countries benefitingfrom trade preferences have generally under-performed in exports. One reason is that richcountries grant preferences voluntarily ratherthan as part of a binding multilateral negotia-tion. Those preferences often come laden withrestrictions, product exclusions, and adminis-trative rules that prevent beneficiaries from tak-ing full advantage of them. For example, only39 percent of potentially preferred importsunder the Generalized System of Preferences(GSP) into the Quad countries—Canada, theEU, Japan, and the United States—actuallytook advantage of preferential access—andusage rates are declining (figure 7). At times,protectionist lobbies have weighed in to pres-sure for reductions in the preference, either be-fore a country was deemed eligible or evenlater, when the first signs of export success fordeveloping countries become evident. BeyondGSP, the Quad countries sponsor their own
“deep preference” programs, such as the EU’sEverything But Arms program and the U.S.African Growth and Opportunity Act, but eachhas different rules and exceptions. For thesereasons, preferences cover only a portion of ex-ports from even poor developing countries—and among eligible countries and products,only a fraction of preferences are actually used.Even when effective, preferences tend to diverttrade away from other poor countries, effec-tively “robbing Peru to pay Panama.”
Existing preferences do relatively little formost of the world’s poor people (those livingon less than US$1 per day), most of whom livein China, India, Nigeria, Pakistan, NortheastBrazil, and the ASEAN countries, which mayenjoy only partial preferences at best. Al-though some of these countries enjoy limitedpreferential access to some markets, all wouldbe better off with across-the-board, non-discriminatory binding access.
Finally, the extensive use of voluntary pref-erence schemes has created perverse incentivesin both rich and poor countries to avoid liber-alization that would otherwise benefit thepoor. Too often, rich countries have offered
G L O B A L E C O N O M I C P R O S P E C T S
xxvi
60.0
55.0
50.0
45.0
40.0
35.0
30.01994 1996 1997 1998 1999 2000 20011995
Figure 7 Fewer exporters to the Quadcountries are taking advantage ofpreferences
Source: Inama (2003).
Share of potential imports under GSP that entered withpreferential access, 1994–2001 (percent)

differential treatment to a subset of poorcountries instead of arriving at MFN reduc-tions in trade barriers that would benefit alldeveloping countries. And, too often, develop-ing countries have sought preferential accessand exemptions from agreed MFN reductionsin trade barriers that would benefit themselvesand other developing countries. In otherwords, the present system of preferences re-duces the incentives to negotiate effectively forreductions in trade barriers abroad and withdomestic protectionist constituencies at home.
Making trade regime more supportive ofdevelopment therefore involves four importantpolicy directions. • Central to any new regime is improvement
in market access for all developing countrieson an MFN basis, especially in products thathave hitherto escaped WTO disciplines,such as agriculture and labor-intensive prod-ucts. Broad market access would allow tradereform to reach the 70 percent of the world’spoor not living in the 49 least developedcountries.
• Trade preferences would be more effective if they were consistent and uniform, shornof restrictions that raise the cost of tak-ing advantage of preferences. WTO rulesthat require institutional improvements—especially “behind the border” policies, asdistinct from trade policy changes that canbe implemented at the “stroke of the pen”—would be more effective if they were cali-brated to developing countries’ capacity to implement them. As countries move upthe ladder of development, they should beexpected to assume the full obligations ofWTO members.
• Integrating technical assistance into the na-tional priorities for development while in-creasing “aid for trade”—a part of theMonterrey consensus—could help poor de-veloping countries identify and addresstrade-capacity priorities. Increased develop-ment assistance—for ports, customs, andlogistics management—would augment thecapacity of developing-country firms tobenefit from market-access opportunities.
• Finally, the WTO membership must learnwhich of its policies promote, and which de-feat, the interests of developing countries.Getting the rules right is arguably the majorchallenge confronting WTO members from a development perspective. Among otherthings, getting the rules right means limitingnew rule-making to cases in which the payofffor developing countries is clearly positive.
TRIPS and Public HealthNegotiations at the WTO on patents and pub-lic health have stalemated over the question ofimproving access to generic drugs for poorcountries. The WTO’s Agreement on Trade Re-lated Aspects of Intellectual Property Rights(TRIPS), which took effect in 1995, obligescountries to extend patent protection to phar-maceutical products and processes after aphase-in period linked to level of development(World Bank 2001, chapter 5). Under theserules, countries that are able to manufacture thedrugs themselves would continue to have legalaccess to generics if they chose to issue compul-sory licenses. These tend to be the larger andbetter-off developing countries such as Brazil,China, India, and Thailand. Countries that lacksufficient manufacturing capability—typicallythe world’s poorest and often most disease-ravaged states—may be barred from importinggeneric versions of patent-protected drugs, oncerules take effect. Hence, the Doha mandate onTRIPS and Public Health included finding amechanism by which such countries can importgeneric drugs protected by patents abroad.
These rules are important for poor people.For example, one day’s supply of patented an-tiretrovirals to treat a single HIV/AIDS patientcan cost as much as US$30 in rich countries.Such prices are prohibitive for the nearly 3 bil-lion people who live on less than US$2 perday. Generics are not always cheaper, but thethreat of competition has helped to reduceprices of patented antiretrovirals supplied todeveloping-country governments (Fink 2003).
Patents create incentives for research by of-fering temporary monopolies on new drugs,and developing countries need that research as
O V E R V I E W
xxvii

much as the rest of the world. Indeed, in-creased R&D for medicines to treat diseasesthat are more prevalent in developing coun-tries is desperately needed. Yet poor countriesthat lack pharmaceutical manufacturing capa-bility form only a tiny portion—perhaps lessthan 1 to 2 percent—of the global pharma-ceuticals market. In the 12 months to October2002, developed countries accounted for morethan 95 percent of the US$270 billion of salesin the world’s leading 20 country marketsworldwide. The group of developing countriesthat may benefit from a WTO agreement onimporting generic drugs under compulsorylicensing probably accounts for less than 1 or2 percent of global pharmaceutical sales. Per-mitting the export to these markets of genericversions of patented medicines developed forrich-country markets is unlikely to erode in-centives for research and development (Fink2003). Despite this unlikelihood, the negotia-tions going into the summer of 2003 werestalemated on possible restrictions of the listof diseases that would be covered by any newagreement.
Governments everywhere have potentiallycompeting interests. They have an interest inmaintaining R&D and in preventing illegalgenerics entering rich-country markets fromundercutting patent rights that finance it.Strengthening mechanisms that prevent suchillegal trade is important, such as by prohib-iting generic manufacturers from mimickingthe packaging of patented drugs. At the sametime, governments everywhere have an inter-est in ensuring that limited budgets for drugsto improve health in poor countries go as faras possible, and this means that all developingcountries have access to drugs at the cheapestmost competitive prices. In balancing theseobjectives, any eventual agreement should putthe developing countries with insufficientmanufacturing capacity on the same footingas those countries that have manufacturingcapacity.
Resolving the Doha issue is only one smallpiece of the larger problem of delivering drugsand health care to sick people in developing
countries. Of equal importance to the health ofthe poor is undertaking the large investmentsin complementary health infrastructure, in-cluding hospitals, roads, warehouses, and doc-tors and nurses. For example, even in somecountries that manufacture anti-AIDS genericsor that get AIDS drugs free, governments havenot succeeded in providing medicines to signif-icant shares of the needy population. Second,funding for fighting the developing world’shealth crisis needs to be scaled up—and mas-sively. For example, the latest projections byUNAIDS put the cost of the global struggleagainst AIDS at US$10.5 billion a year by2005 and US$15 billion a year by 2007; evenif governments in affected countries cover partof this amount, estimated aid flows of aboutUS$3 billion in 2002 are still insufficient. TheGlobal Fund to Fight Aids, Tuberculosis, andMalaria remains cash-strapped. The recentU.S. commitment of US$15 billion to fightHIV/AIDS will, when disbursed, partially re-lieve resource constraints, but a substantialfunding gap remains. The TRIPS issue is smallwhen compared with the real obstacles pre-venting access to better health in developingcountries, and it concerns a small corner of theglobal pharmaceutical market—two reasonswhy the international community should moveswiftly to resolve it.
Delivering the Doha deal for development
The potential for reciprocal reductions intrade protection holds the promise of bet-
ter lives for everyone. To illustrate, we considerthe effects of a pro-poor agreement in whichrich countries cut tariff peaks to 10 percent inagriculture and to 5 percent in manufacturing,and in which these reductions are reciprocatedwith cuts to 15 and 10 percent in developingcountries (table 1). This program, combinedwith reductions in prevailing tariff averages, adecoupling of agricultural subsidies, and an endto agricultural subsidies could realize nearlythree-quarters of the gains that might be antic-ipated from full merchandise liberalization.
G L O B A L E C O N O M I C P R O S P E C T S
xxviii

This illustrative pro-poor program, dis-cussed in detail in chapter 1, if implementedprogressively over the five years to 2010 andaccompanied by a realistic productivity re-sponse, would produce gains for developingcountries of nearly US$350 billion in addi-tional income by 2015. Rich countries wouldbenefit, too, with gains on the order of US$170billion. All of this would mean that 8 percentfewer people would be living in poverty in2015—140 million fewer people living belowUS$2 per day. If greater opening of services, in-cluding Mode 4, were to occur, the benefitswould be substantially greater.2
Delivering a Doha deal that spurs develop-ment will not be easy. Negotiators may wellhave to transcend the mercantilist mind-setthat tends to dominate trade negotiations. Allsegments of the international community mustkeep their focus on potential gains, not onlyfrom “winning concessions” from foreignpartners, but also on the gains from domesticreforms that “pay for” foreign concessions.Rich-country negotiators will do better, forthemselves and for the developing world, ifthey keep in mind that their own countries canbenefit by directing agricultural subsidiesaway from production subsidies for largefarmers toward income subsidies to relativelysmall family farms, delivered in a form that isdecoupled from output. Middle-income coun-try negotiators likewise have to keep in mindthat their telecommunications and financialservices could be much more efficient and lessexpensive if more competitors were allowed to enter well-regulated markets. Low-income
countries that have high protection will findthey benefit from domestic reforms that lowercosts of imported inputs, increase domesticcompetition that spurs productivity growth,and expand exports. Study after study hasshown that trade reforms redound first andfastest to the reformer.
Negotiations will determine the pace anddetails of a final package, but the broad out-lines of a potentially good deal for develop-ment are already evident from this analysis.Realizing that agricultural reform in a time ofrapidly rising budget deficits will contributepositively to their own economic growth, richcountries would benefit from reforms in agri-culture. Lopping off tariff peaks and phasingout the ATC at the end of 2004 will benefitdeveloped-country poor who are forced to pay more for food and clothing because ofexternal protection (Gresser 2002). Furtherprogress on the part of all countries in reduc-ing tariffs in manufactures would benefit de-veloping countries and stimulate healthySouth-South trade. For the rich countries, theprospect of greater access to markets in devel-oping countries—home to 80 percent of theworld’s population with markets growing twoto three times faster than their own—is also aworthy prize.
Developing countries, too, have much togain. Middle-income countries—continuing aprocess begun over the last two decades—maydo well to open selected services markets, oftenplagued by inefficiency that dampens produc-tivity of the whole economy, in exchange forgreater access in agriculture and labor-inten-sive goods. Because many countries have al-ready lowered tariffs, the issue is now to bindthose new lower levels. Finally, low-incomecountries would benefit if, in relinquishing de-mands for exemption from disciplines on theirown tariffs, they succeed in obtaining commit-ments to greater market access in products andservices of importance to them, a new commit-ment to consistency in the administration ofpreferences, and development assistance to fa-cilitate trade and implement new WTO rules inaccord with domestic capacities and develop-
O V E R V I E W
xxix
Table 1 A pro-poor tariff reductionprogram(percent)
Rich Developing
AgricultureAverage 5 10Maximum 10 15
ManufacturingAverage 1 5Maximum 5 10

ment priorities. Delivering this type of dealwould go far toward fulfilling the developmentpromise of the Doha Agenda.
Notes1. Global Economic Prospects 2002: Making Trade
Work for the World’s Poor (World Bank 2001), in ad-dition to analyzing agriculture, labor-intensive manu-factures, and services, dealt with regulatory impedi-ments in transportation (chapter 4) and intellectualproperty rights and TRIPS (chapter 5). Global Eco-nomic Prospects 2003: Investing to Unlock Global Op-portunities (World Bank 2002a) analyzed two of theSingapore issues—investment and competition policy—from a development perspective (chapter 4).
2. Global Economic Prospects 2002 presents illus-trations of the gains from services liberalization. Whilewe do not have firm estimates of relative parameters,several studies have shown that gains are likely to be amultiple of merchandise liberalization. See World Bank(2001), chapter 6.
ReferencesBernanke, Ben, and Kenneth Rogoff, eds. 2001.
Macroeconomics Annual 2001. Cambridge, Mass.:MIT Press.
Dollar, David, and Aart Kraay. 2001. “Trade, Growth,and Poverty.” World Bank Policy Research De-partment Working Paper 1615.
Evenett, S. 2002. “The WTO Government Procure-ment Agreement: An Assessment of Current Re-search and Options for Reform.” Paper presentedat the roundtable “Informing the Doha Process:New Trade Research for Developing Countries.”Egypt. May 20–21.
Fink, C. 2003. “Implementing the Doha Mandate onTRIPS and Public Health.” Trade Note 5. Wash-ington, D.C.: World Bank. May (www.worldbank.org/trade).
Gresser, E. 2002. “America’s Hidden Tax on the Poor:The Case for Reforming U.S. Tariff Policy.” Pro-gressive Policy Institute Policy Report. Washing-ton, D.C.: Progressive Policy Institute. March.
Hatcher, Mark. 2003. Draft Model Schedule for Mode4: A Proposal. In Aaditya Mattoo and AntoniaCarzaniga, eds., Moving People to Deliver Ser-vices. Washington, D.C.: Oxford University Pressand World Bank, 2003.
Hummels, D. 2001. “Time as a Trade Barrier.” Mimeo.Department of Economics, Purdue University,Lafayette, Ind.
Inama, Stefano. 2003. “Trade Preferences and theWTO Negotiations on Market Access.” Mimeo.UNCTAD.
International Monetary Fund (IMF). Balance of Pay-ments Statistics Yearbook. Washington, D.C.: IMF.
IMF-World Bank. 2002. “Market Access for Develop-ing Country Exports—Selected Issues.” Washing-ton, D.C.: World Bank, September 26.
Mattoo, Aaditya. 2003. “Services in a DevelopmentRound.” Paper presented to the OECD GlobalForum on Trade, OECD, Paris, June 5–6, 2003.
Mattoo, A., R. Rathindran, and A. Subramanian.2001. “Measuring Services Trade Liberalizationand Its Impact on Economic Growth: An Illustra-tion.” World Bank Policy Research WorkingPaper 2655. World Bank, Washington, D.C.
Newfarmer, R. 2003. “From Singapore to Cancún:Investment.” Trade Note 2. Washington, D.C.:World Bank. May (www.worldbank.org/trade).
Ravallion, Martin. 1997. “Can High-Inequality Coun-tries Escape Absolute Poverty?” Economics Letters56(1): 51–57.
Rodriguez, Francisco, and Dani Rodrik. 1999. “TradePolicy and Economic Growth: A Skeptic’s Guideto the Cross-National Evidence.” NBER WorkingPaper W7081. NBER, Cambridge, Mass.
Self, R. J., and B. K. Zutshi. 2003. “Mode 4: Negoti-ating Challenges and Opportunities.” In Aaditya-Mattoo and Antonia Carzaniga, eds., MovingPeople to Deliver Services. Washington, D.C.:Oxford University Press and World Bank, 2003.
Srinivasan, T.N., and Jadgish Bhagwati. 2000. “Out-ward-Orientation and Development: Are Revi-sionists Right?” Macroeconomics Annual 2000.Cambridge: MIT Press.
Walmsley, T. L., and A. Winters. 2003. “Relaxing theRestrictions on the Temporary Movements ofNatural Persons: A Simulation Analysis.” CEPRDiscussion Paper 3719. London: Center for Eco-nomic Policy Research.
World Bank. 1996. The Chinese Economy: FightingInflation, Deepening Reforms. Washington, D.C.:World Bank. April.
———.2001. Global Economic Prospects 2002: Mak-ing Trade Work for the World’s Poor. Washing-ton, D.C.: World Bank.
———.2002a. Global Economic Prospects 2003: In-vesting to Unlock Global Opportunities. Wash-ington, D.C.: World Bank.
———.2002b. World Development Report 2003: Sus-tainable Development in a Dynamic World.Washington, D.C.: World Bank.
G L O B A L E C O N O M I C P R O S P E C T S
xxx

ACE Automated commercial environment
ACP African Caribbean and Pacific states
ACPC Association of Coffee Producing Countries
AGOA African Growth and Opportunity Act
APEC Asia Pacific Economic Cooperation
ASAs Air service agreements
ASCM Agreement on Subsidies and Countervailing Measures
ASEAN Association of Southeast Asian Nations
ASECNA Agency for Air Transport Security in Africa
ATC Agreement on Textiles and Clothing
ATPA Andean Trade Preferences Act
ATPDEA Andean Trade Promotion and Drug Eradication Act
CACM Central American Common Market
CAP Common Agricultural Program
CARICOM Caribbean Community
CBERA Caribbean Basin Economic Recovery Acts
CBI Caribbean Basin Initiative
CBTPA Caribbean Basin Trade Partnership Act
CEE Central and Eastern Europe
CEPR Center for Economic and Policy Research
CIS Commonwealth of Independent States
COMTRADE U.S. Commodity Trade Statistics
CSI Container Security Initiative
C-TPAT Customs-Trade Partnership Against Terrorism
DFID Department for International Development
DRIFE Danish Research Institute of Food Economics
DTIS Diagnostic Trade Integration Study
ECB European Central Bank
xxxi
Abbreviationsand Data Notes

EEA European Economic Area
EMBI Emerging Markets Bond Index
EU European Union
FAO Food and Agricultural Organization
FDA Food and Drug Administration
FDI Foreign direct investment
FTA Free Trade Area
GATS General Agreement on Trade in Services
GATT General Agreement on Tariffs and Trade
GCC Gulf Cooperation Council
GDP Gross domestic product
GSP Generalized System of Preference
GTAP Global Trade Analysis Project
HITS Harmonized Tariff Schedule
HIV/AIDS Human immunodeficiency virus/acquired immune deficiency syndrome
HKSC Hong Kong Shippers Council
IADB Inter-American Development Bank
ICAO International Civil Aviation Organization
ICO International Coffee Organization
ICTSD International Center for Trade and Sustainable Development
IISD International Institute for Sustainable Development
ILO International Labour Organization
IMF International Monetary Fund
IMO International Maritime Organization
INS Immigration and Naturalization Service
ISM Institute for Supply Management
LDCs Least developed countries
LME London Metals Exchange
LNG Liquid natural gas
MFN Most favored nation
NAFTA North America Free Trade Agreement
NASDAQ National Association of Security Dealers
NAV Non-ad-valorem
NIEs Newly industrialized economies
OECD Organisation for Economic Co-operation and Development
OPEC Organization for Petroleum Exporting Countries
PECC Pacific Economic Cooperation Council
PPI Purchasing Parity Index
G L O B A L E C O N O M I C P R O S P E C T S
xxxii

A B B R E V I A T I O N S A N D D A T A N O T E S
xxxiii
Data notesThe “classification of economies” tables at the end of this volume classify economies byincome, region, export category, and indebt-edness. Unless otherwise indicated, the term“developing countries” as used in this volume
covers all lower- and middle-income coun-tries, including countries with economies intransition.
All dollar figures are U.S. dollars.
PROCAMPO Programa de Apoyos Directos al Campo (National Program for AgriculturalDirect Support)
PSRE Program de soutien à la relance economique
QUAD Canada, European Union, Japan, and United States
RDS Research, development, and statistics
SAARC South Asian Association for Regional Cooperation
SARS Severe Acute Respiratory Syndrome
SDT Special and differential treatment
SMEs Small and medium-sized enterprises
SOLAS Safety of Life at Sea Convention
SOPEMI Continuous Reporting System on Migration
STAR Secure Trade in the APEC Region
TMNP Temporary movement of natural persons
TN Trade NAFTA
TRIPS Trade-related aspects of intellectual property rights
TRQs Tariff rate quotas
UN/ECE United Nations Economic Commission for Europe
UNCTAD United Nations Conference for Trade and Development
UNDCP United Nations International Drug Control Program
UNECE United Nations Economic Commission for Europe
USAID United States Agency for International Development
USCS U.S. Customs Service
USDA U.S. Department of Agriculture
USTR U.S. Trade Representative
WCO World Customs Organization
WFP World Food Program
WITS World Integrated Trade Solutions
WTO World Trade Organization


The global economy continues to be weakFor the third year in a row the global economyin 2003 is growing well below potential, at anexpected rate of 2 percent. The global slow-down that began in 2001 with the bursting ofthe equity-market bubble evolved into a sub-dued recovery during 2002. Initially, the sharpdownturn in business investment was a criticalfactor behind sluggish growth, as corporationsworldwide redressed the substantial financialimbalances that had emerged during the boomof the late 1990s. The pace of activity falteredagain at end-2002 and early 2003 in responseto events that undermined confidence: thebuildup to war in Iraq, transatlantic tensions,persistent concerns about terrorism, and theoutbreak of Severe Acute Respiratory Syn-drome (SARS). Consumer and business con-fidence waned again—and so did spending.
Manufacturing production as well as GDPgrowth in the rich countries slowed consider-ably at the turn of the year. The momentum ofgoods production retrenched to negative terri-tory, and G-7 GDP growth braked from anannualized pace of 2.8 percent during thethird quarter of 2002 to 0.8 percent by thefirst quarter of 2003.
Developing countries faced a difficult envi-ronment in 2002 to mid 2003. Latin America’sGDP contracted in 2002 because of politicalproblems in Venezuela, investor concernsabout Brazil in the run-up to elections, andfallout from Argentina’s default. Per capita in-comes will barely rise this year, despite an en-
couraging rebound in most countries of theregion. Activity in South Asia is holding upwell. Countries in East Asia lost some growthmomentum due to SARS, but its apparent con-tainment has opened the way to a resumptionof rapid growth. Africa continues to underper-form: although the region’s commodity priceshave firmed, they are still well below long-termtrends. War has affected regional performancein the Middle East and North Africa; whilemany countries in Central and Eastern Europeare undergoing sluggish growth tied to lacklus-ter conditions in Western Europe, especially inGermany.
Macro policy response has been stronglysupportive, but it is approaching limitsPolicymakers, particularly in the United States,reacted to the slowdown in 2001 with signifi-cant monetary easing and fiscal stimulus. Thestimulus and the effects of automatic stabilizersprevented a sharper downturn in the globaleconomy and helped improve the external en-vironment for developing-country growth.
But the scope for substantial further ma-croeconomic stimulus is rapidly dissipating.Fiscal deficits threaten to become part of theproblem instead of part of the solution, espe-cially since a quick reversal of the deficit is not anticipated. The U.S. general governmentbudget position (including Social Security), forexample, shifted dramatically from a surplusof 2.3 percent of GDP in 2000 to a deficit of3.2 percent as of the first quarter of 2003. The
1
Global Outlook and theDeveloping Countries
1

Congressional Budget Office projects that thebudget position is unlikely to return to surplusuntil 2012. In Europe, several large countrieshave breached the 3-percent-of-GDP fiscaldeficit limits embedded in the Maastricht cri-teria for the common currency. And Japan haslimited fiscal scope, given persistent deficits inthe 6–7 percent range. Interest rates have beenbrought down sharply in the United States aswell as in Japan, where they stand at an effec-tive rate of zero. Following the recent 50-basispoint cut in rates, Europe still has modestheadroom for monetary easing should the Eu-ropean Central Bank choose to relax its infla-tion target. In fact, downward price trends inthe United States and Europe have triggeredconcerns of possible deflation.
Activity should build gradually through2004–05, but risks remainBarring additional shocks, global growthshould pick up to 3 percent in 2004, as firmsin the rich countries make progress in adjust-ing balance sheets and begin to upgrade capi-tal stock and replenish inventories (table 1.1).The financial headwinds that have con-strained investment are apparently diminish-ing across the OECD centers. Early signs of re-newed economic activity are appearing in theUnited States—including an upturn in orders,production, and exports, as well as firmingequity markets. Yet conditions in Europe andJapan remain extremely slack. Improvementin confidence will prove the key to a revival incapital spending and growth. Following anadvance of 4 percent in 2003, developingcountries are likely to grow at 4.9 percent in2004, grounded in a revival of world trade,the fading of global tensions, and the rekin-dling of domestic demand.
But risks to the outlook remain. First, thepace of stabilization in the Middle East re-mains uncertain. Second, SARS, though nowapparently under control, could reemerge nextflu season and would present challenges topolicymakers worldwide, especially in China.Third, and more broadly, a reversal of the in-cipient investment rebound in the industrial
countries cannot be ruled out, as investmentgrowth dropped sharply during the first quar-ter of 2003. Finally, the U.S. current accountdeficit is surpassing historic levels. During2002, U.S. external financing needs claimed10.3 percent of the savings of the rest of theworld—more than double the levels of 1998.Moreover, the composition of finance alsoshifted toward short-term flows: net FDIflows were negative by almost $100 billion;U.S. banks’ overseas lending had ceased; andforeign official inflows (most from East Asia)increased to nearly $100 billion, from $5 bil-lion in 2001. A sudden reversal in these short-term flows could undercut U.S. and worldgrowth. The 25 percent fall of the U.S. dollaragainst the euro in the last 18 months repre-sents at least a partial adjustment.
Structural reforms could boost confidenceWith scope for additional macroeconomicstimulus fading, the focus of policy in the richcountries should arguably shift toward struc-tural reforms that help restore business andconsumer confidence. These could include ef-forts to resolve the nonperforming loan prob-lem in the Japanese banking system and toachieve positive inflation rates there; addressingcorporate governance and related issues in theUnited States, and needed labor market reformsin Europe. A rekindling of multilateral consen-sus on economic policy would also contributeto renewed confidence, which had been shakenby geopolitical tensions and security concerns.
Intensified trade underpins strongdeveloping country growth in the long runOne important and ongoing program is theDoha Development Agenda, where progresscould do much for near-term sentiment andeventually for global growth. Intensified traderelations during the 1990s and the increas-ingly global nature of production and distri-bution have sharply increased productivity intradable sectors and drastically changed tradepatterns, laying the foundation for futuregrowth. Productivity growth in manufacturingsectors that compete in international markets
G L O B A L E C O N O M I C P R O S P E C T S 2 0 0 4
2
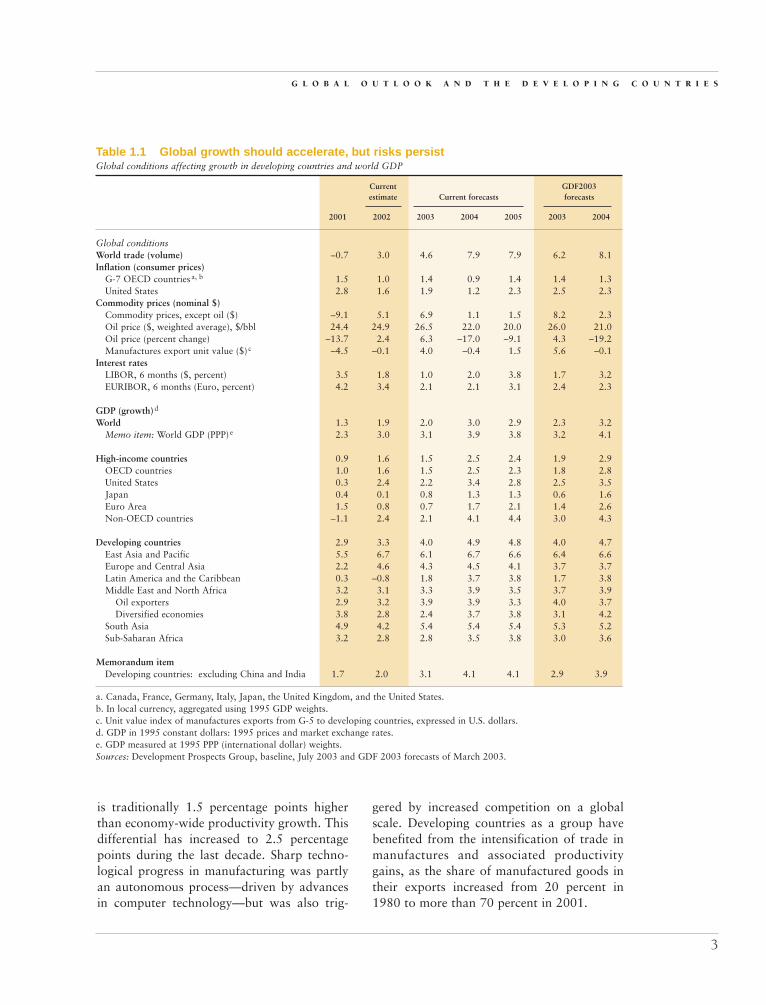
Table 1.1 Global growth should accelerate, but risks persistGlobal conditions affecting growth in developing countries and world GDP
Current GDF2003estimate Current forecasts forecasts
2001 2002 2003 2004 2005 2003 2004
Global conditionsWorld trade (volume) –0.7 3.0 4.6 7.9 7.9 6.2 8.1Inflation (consumer prices)
G-7 OECD countriesa, b 1.5 1.0 1.4 0.9 1.4 1.4 1.3United States 2.8 1.6 1.9 1.2 2.3 2.5 2.3
Commodity prices (nominal $)Commodity prices, except oil ($) –9.1 5.1 6.9 1.1 1.5 8.2 2.3Oil price ($, weighted average), $/bbl 24.4 24.9 26.5 22.0 20.0 26.0 21.0Oil price (percent change) –13.7 2.4 6.3 –17.0 –9.1 4.3 –19.2Manufactures export unit value ($) c –4.5 –0.1 4.0 –0.4 1.5 5.6 –0.1
Interest ratesLIBOR, 6 months ($, percent) 3.5 1.8 1.0 2.0 3.8 1.7 3.2EURIBOR, 6 months (Euro, percent) 4.2 3.4 2.1 2.1 3.1 2.4 2.3
GDP (growth)d
World 1.3 1.9 2.0 3.0 2.9 2.3 3.2Memo item: World GDP (PPP)e 2.3 3.0 3.1 3.9 3.8 3.2 4.1
High-income countries 0.9 1.6 1.5 2.5 2.4 1.9 2.9OECD countries 1.0 1.6 1.5 2.5 2.3 1.8 2.8United States 0.3 2.4 2.2 3.4 2.8 2.5 3.5Japan 0.4 0.1 0.8 1.3 1.3 0.6 1.6Euro Area 1.5 0.8 0.7 1.7 2.1 1.4 2.6Non-OECD countries –1.1 2.4 2.1 4.1 4.4 3.0 4.3
Developing countries 2.9 3.3 4.0 4.9 4.8 4.0 4.7East Asia and Pacific 5.5 6.7 6.1 6.7 6.6 6.4 6.6Europe and Central Asia 2.2 4.6 4.3 4.5 4.1 3.7 3.7Latin America and the Caribbean 0.3 –0.8 1.8 3.7 3.8 1.7 3.8Middle East and North Africa 3.2 3.1 3.3 3.9 3.5 3.7 3.9
Oil exporters 2.9 3.2 3.9 3.9 3.3 4.0 3.7Diversified economies 3.8 2.8 2.4 3.7 3.8 3.1 4.2
South Asia 4.9 4.2 5.4 5.4 5.4 5.3 5.2Sub-Saharan Africa 3.2 2.8 2.8 3.5 3.8 3.0 3.6
Memorandum itemDeveloping countries: excluding China and India 1.7 2.0 3.1 4.1 4.1 2.9 3.9
a. Canada, France, Germany, Italy, Japan, the United Kingdom, and the United States.b. In local currency, aggregated using 1995 GDP weights.c. Unit value index of manufactures exports from G-5 to developing countries, expressed in U.S. dollars.d. GDP in 1995 constant dollars: 1995 prices and market exchange rates.e. GDP measured at 1995 PPP (international dollar) weights.Sources: Development Prospects Group, baseline, July 2003 and GDF 2003 forecasts of March 2003.
is traditionally 1.5 percentage points higherthan economy-wide productivity growth. Thisdifferential has increased to 2.5 percentagepoints during the last decade. Sharp techno-logical progress in manufacturing was partlyan autonomous process—driven by advancesin computer technology—but was also trig-
gered by increased competition on a globalscale. Developing countries as a group havebenefited from the intensification of trade inmanufactures and associated productivitygains, as the share of manufactured goods intheir exports increased from 20 percent in1980 to more than 70 percent in 2001.
G L O B A L O U T L O O K A N D T H E D E V E L O P I N G C O U N T R I E S
3

Under a set of favorable but plausible as-sumptions, developing countries are expectedto experience an acceleration of per capita in-come growth through 2015. The East Asiaregion is an exception because its already highgrowth of 6 percent annually over the lastdecades will be difficult to maintain, as econo-mies mature and the gap with high-incomecountries narrows, even though it is likely toremain the fastest-growing region in the devel-oping world.
Poverty remains a challenge, especially for AfricaBroad acceleration of per capita growthwould translate into a sharp reduction in theincidence of poverty, from 28.3 percent in1990 to a projected 12.5 percent by 2015,meeting, on average, the millennium develop-ment goal (MDG) of 14.8 percent. However,the gap between strong and weak performerswill remain large. Even if Sub-Saharan Africacould turn falling per capita incomes into an-nual increases of 1.6 percent—as assumed inthe baseline scenario—its rate of growth wouldbe less than one-third the rate of growth that isexpected in East Asia. The relatively poor per-formance of Sub-Saharan Africa makes theMDGs for that region especially challenging.For example, under the baseline scenario thepercentage of people living on $1 per day orless will be only 42.3 percent in 2015 insteadof 24 percent as targeted by the MDGs.
The industrial countries: Deficits,confidence, capital spending, and the dollar
Confidence is the key to the long-awaitedbreakthrough to growth The high-income OECD countries have facedsubstantial difficulties in overcoming the lega-cies of the second half of the 1990s, includingthe equity market downturn. The recovery thatbegan in early 2002 faltered after the summerof that year as the rebound in investmentshowed signs of weakness. Government ex-
penditure could not continue to grow at thehigh rates achieved in the early phase of re-covery, though deficits continued to widen.Late in 2002 and through early 2003, U.S.consumption, a major driver of global de-mand, slowed from an earlier pace of 4 per-cent to near 2 percent—partly as a reflectionof the dramatic drop in consumer confidenceon the eve of the Iraqi conflict and partly inreaction to high oil prices and weakening ofthe dollar. By the first quarter of 2003, GDPgrowth had slowed from generally strongerfirst-half 2002 rates to 1.4 percent (saar) inthe United States, to 0.6 percent in Japan, to0.2 in the Euro Area (figure 1.1).
Manufacturing output advances sloweddiscernibly at the turn of the year, and intensi-fied during the spring. Growth momentum ingoods production suffered a “double dip,” tostand at –1.2 percent for the Euro Area, –2.0percent for Japan, and –2.3 percent for theUnited States as of April–June 2003 (figure1.2). The end to combat in the Iraqi campaignhelped to boost U.S. consumer confidencefrom nine-year troughs reached in March; butresponse of consumers in Japan and especiallyin Europe was muted, despite an incipient up-
G L O B A L E C O N O M I C P R O S P E C T S 2 0 0 4
4
Figure 1.1 Growth in the OECD countriesfaltersQuarter/quarter, percent change, saar
Sources: National agencies and Eurostat.
2002 H1
United States Japan Euro Area
�
�
2002 Q4
�
2003 Q1
–0.5
0.0
0.5
1.0
1.5
2.0
2.5
3.5
3.0

turn in equity markets. Rather, focus returnedto the set of weak fundamentals underlyingsluggish growth in the rich countries—notablysubstantial debt overhangs in the U.S. corpo-rate, household, and, increasingly, governmentsectors.
The sharp depreciation of the dollar beganto yield shifts in the contribution of net ex-ports to GDP growth (table 1.2). In the United
States, a contribution of –1.0 percentagepoints during the first half of 2002 changedinto one of +0.9 percentage points in the firstquarter of 2003. The opposite occurred in Eu-rope and Japan. There, during the first half of2002, net exports added respectively 0.9 and1.4 percentage points to GDP growth, butthese rates turned around in the first quarterof 2003, to –1.8 and –0.2 percentage points.
G L O B A L O U T L O O K A N D T H E D E V E L O P I N G C O U N T R I E S
5
Figure 1.2 OECD manufacturing shows a distinct “double dip”Manufacturing IP, 3-month/3-month, percent change, saar
�
�
�
United States
Euro Area
Japan
Sources: National agencies and Eurostat.
15
10
5
0
–5
–10
–15
–20
Jan.2000
April2000
July2000
Oct.2000
Jan.2001
April2001
July2001
Oct.2001
Jan.2002
April2002
July2002
Oct.2002
Jan.2003
April2003
Table 1.2 Weak fundamentals underlie sluggish growth in the rich countries Recent developments in GDP and components, United States, Euro Area, and Japan (percent)
United States Euro Area Japan
Growth H1-02 H2-02 Q4-02 Q1-03 H1-02 H2-02 Q4-02 Q1-03 H1-02 H2-02 Q4-02 Q1-03
GDP 3.5 2.7 1.4 1.4 1.0 1.1 0.3 0.2 0.9 3.0 1.5 0.6Private consumption 3.5 3.0 1.7 2.0 0.0 1.6 1.4 1.7 2.0 1.5 –0.2 0.8Fixed investment –2.8 0.7 4.4 –0.2 –3.2 –0.9 0.9 –4.8 –5.3 1.0 3.2 –1.9Government 5.7 3.0 4.6 0.4 3.3 2.0 1.2 1.4 2.4 1.7 0.4 2.5
Growth contributionsPrivate consumption 2.4 2.1 1.2 1.4 0.0 0.9 0.8 1.0 1.1 0.9 –0.1 0.4Investment 1.0 0.9 1.0 –0.9 –0.5 –0.2 0.7 0.8 –2.0 1.5 0.1 0.0
Fixed capital –0.5 0.1 0.7 0.0 –0.7 –0.2 0.2 –1.0 –1.4 0.3 0.8 –0.5Change in stocks 1.5 0.7 0.3 –0.9 0.2 0.0 0.5 1.8 –0.6 1.2 –0.7 0.5
Government 1.0 0.5 0.8 0.1 0.7 0.4 0.2 0.3 0.4 0.3 0.1 0.4Net exports –1.0 –0.9 –1.9 0.9 0.9 0.0 –1.4 –1.8 1.4 0.4 1.6 –0.2
Note: H=half year; Q=quarter year.Sources: National agencies, OECD, and World Bank data.

Although the depreciation of the dollar andturnaround in U.S. exports was a movementtoward more balanced conditions, weak de-mand in external markets now poses specialchallenges for Europe and Japan. For the lat-ter, the near-term effects of SARS in East Asiawill likely exact an additional toll on exports.
Recently, the issue of deflation has emergedin the United States, and more so in Europe inthe wake of 25 percent currency appreciationand flat output growth there. Labor marketconditions continued to deteriorate across theOECD centers, with expectations widely heldfor a more prolonged period of sub-par growthin the global economy.
From this set of initial conditions, a break-through to stronger growth will hinge on arestoration of confidence among consumersand businesses. Under these circumstances, andin an environment of low interest rates (cou-pled with moderate gains in financial markets),the standard factors that boost investment af-ter a recession—increasing obsolescence of thecapital stock, improved expectations for de-mand—are likely to yield a gradual upturn inthe pace of investment growth, and with it a re-sumption of economic recovery. Indeed, some
signs of revival in the U.S. economy are nowemerging, but the worst may not be over forEurope and Japan.
Consumer spending has slowedFrom late 2002 to early 2003, anticipation of war in Iraq provided a “non-economic”overlay to the fundamental factors dampeningconsumer sentiment. Consumer confidenceplunged to near-record lows on both sides ofthe Atlantic in the months leading up to war(figure 1.3). Though the estimated sensitivity ofpersonal spending to changes in sentiment issurprisingly small, the relationship suggests thatfor the United States, the decline in confidencesince late 2000, tied to economic conditionsand war jitters, yielded a fall-off in consump-tion of a cumulative 1.2 percent, or $75 billion(box 1.1). Recovery of U.S. sentiment since thattime, boosted by incipient gains in equity mar-kets, has been moderately encouraging. How-ever, the Conference Board index flattened-outin May and fell in June (to 83.5) to bring themeasure to its level of late Fall 2002. Europeanconfidence has recovered little, as economicgrowth slows and developments in Germany inparticular have deteriorated markedly.
G L O B A L E C O N O M I C P R O S P E C T S 2 0 0 4
6
Figure 1.3 Consumer confidence recovers from pre-war lowsConference Board (U.S.) and EU Commission surveys of consumer confidence
Source: Conference Board, European Commission.
–22
–20
–18
–16
–14
–12
–10
–8
–6
–4
–2
0
2
70
60
January2000
July2000
January2001
July2001
January2002
July2002
January2003
July2003
80
90
100
110
120
130
140
150
United States (left scale)
European Union (right scale)
��
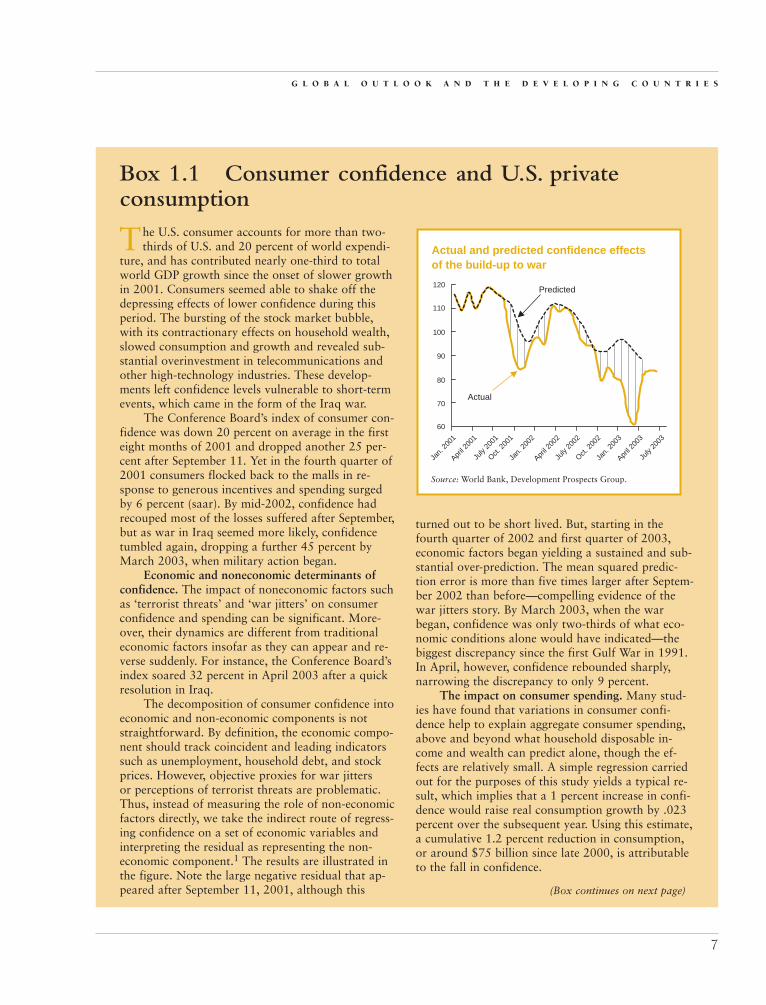
G L O B A L O U T L O O K A N D T H E D E V E L O P I N G C O U N T R I E S
7
The U.S. consumer accounts for more than two-thirds of U.S. and 20 percent of world expendi-
ture, and has contributed nearly one-third to totalworld GDP growth since the onset of slower growthin 2001. Consumers seemed able to shake off thedepressing effects of lower confidence during thisperiod. The bursting of the stock market bubble,with its contractionary effects on household wealth,slowed consumption and growth and revealed sub-stantial overinvestment in telecommunications andother high-technology industries. These develop-ments left confidence levels vulnerable to short-termevents, which came in the form of the Iraq war.
The Conference Board’s index of consumer con-fidence was down 20 percent on average in the firsteight months of 2001 and dropped another 25 per-cent after September 11. Yet in the fourth quarter of2001 consumers flocked back to the malls in re-sponse to generous incentives and spending surgedby 6 percent (saar). By mid-2002, confidence hadrecouped most of the losses suffered after September,but as war in Iraq seemed more likely, confidencetumbled again, dropping a further 45 percent byMarch 2003, when military action began.
Economic and noneconomic determinants ofconfidence. The impact of noneconomic factors suchas ‘terrorist threats’ and ‘war jitters’ on consumerconfidence and spending can be significant. More-over, their dynamics are different from traditionaleconomic factors insofar as they can appear and re-verse suddenly. For instance, the Conference Board’sindex soared 32 percent in April 2003 after a quickresolution in Iraq.
The decomposition of consumer confidence intoeconomic and non-economic components is notstraightforward. By definition, the economic compo-nent should track coincident and leading indicatorssuch as unemployment, household debt, and stockprices. However, objective proxies for war jitters or perceptions of terrorist threats are problematic.Thus, instead of measuring the role of non-economicfactors directly, we take the indirect route of regress-ing confidence on a set of economic variables andinterpreting the residual as representing the non-economic component.1 The results are illustrated inthe figure. Note the large negative residual that ap-peared after September 11, 2001, although this
Box 1.1 Consumer confidence and U.S. privateconsumption
turned out to be short lived. But, starting in thefourth quarter of 2002 and first quarter of 2003,economic factors began yielding a sustained and sub-stantial over-prediction. The mean squared predic-tion error is more than five times larger after Septem-ber 2002 than before—compelling evidence of thewar jitters story. By March 2003, when the warbegan, confidence was only two-thirds of what eco-nomic conditions alone would have indicated—thebiggest discrepancy since the first Gulf War in 1991.In April, however, confidence rebounded sharply,narrowing the discrepancy to only 9 percent.
The impact on consumer spending. Many stud-ies have found that variations in consumer confi-dence help to explain aggregate consumer spending,above and beyond what household disposable in-come and wealth can predict alone, though the ef-fects are relatively small. A simple regression carriedout for the purposes of this study yields a typical re-sult, which implies that a 1 percent increase in confi-dence would raise real consumption growth by .023percent over the subsequent year. Using this estimate,a cumulative 1.2 percent reduction in consumption,or around $75 billion since late 2000, is attributableto the fall in confidence.
Actual and predicted confidence effectsof the build-up to war
Source: World Bank, Development Prospects Group.
60
Jan.
200
1
Oct. 2
001
July
2001
April 2
001
Jan.
200
2
July
2002
April 2
002
Oct. 2
002
April 2
003
July
2003
Jan.
200
3
Predicted
Actual70
80
90
100
110
120
�
�
(Box continues on next page)

Since 2000, spending in the rich countrieshas been buffeted by divergent trends in networth; most households suffered sharp de-clines in the value of financial assets. In theUnited States and the United Kingdom, how-ever, rapid appreciation of housing values haspartially offset the deterioration in financialworth (figure 1.4). For example, U.S. house-holds suffered loss of $7.7 trillion in net finan-cial worth since peak levels of the first quarter
of 2000—mitigated to $4.4 trillion by real es-tate appreciation. Moreover, low interest rateshave encouraged widespread refinancing andequity cash-outs to supplement flows of per-sonal income and spending. On the other hand,rapid buildup of mortgage and other consumerdebt has placed U.S. households in an exposedposition should interest rates begin to rise witheventual recovery. At record levels of $8.9 tril-lion, representing 80 percent of GDP or 111percent of disposable income as of the firstquarter of 2003, burgeoning household debtcould hamper vigorous spending responses inlater stages of the anticipated recovery.
And the investment rebound relapsedThe sluggish pace of economic recovery is alsolinked to hesitant patterns of business capitalspending, common across the industrial coun-tries. After picking up to a 2.5 percent pace inthe final quarter of 2002, G-7 fixed investmentrelapsed to growth of just 0.3 percent duringthe first quarter of 2003. U.S. business outlaysdropped by a disappointing 3.4 percent, capitalspending in Japan fell by 2 percent, and EuroArea investment plummeted by 4.8 percent, asthat in Germany fell 6.8 percent (figure 1.5).
At midpoints of the business cycle, theprime mover for growth would normally tran-sition from consumer spending and inventorybuilding to more robust advances in fixed cap-ital formation. Unlike in previous business cy-
G L O B A L E C O N O M I C P R O S P E C T S 2 0 0 4
8
What happens next? The equation predicts thatthe 30 percent improvement in confidence after thewar, if sustained, could add as much as an additional30*.023 = 0.7 percent, or around $45 billion to con-sumption levels over the next year. It is likely thatdurables such as housing and automobiles would bethe main beneficiaries. But the experience after the1991 Gulf War sounds a note of caution. Then, too,confidence dipped sharply as the war approached, andsurged by 36 percent in March 1991 following theceasefire. Less than a year later, however, it had more
Box 1.1 (continued)
than given up this gain. The reason? Soaring unem-ployment. It was not until 1993 that U.S. consumptionagain recovered to near its long-run average growthrate. Moreover, our model attributes a cumulative 1.2percent reduction in consumption since 2000 to confi-dence, but 9.2 percent to changes in income andwealth. In short, the future course of employment, in-come, and asset prices will be by far the most impor-tant determinants of consumption spending.
Source: World Bank staff.
Figure 1.4 The drop in U.S. household networth has been offset by real estateappreciationTrillions of dollars
Source: Federal Reserve Board.
40
35
30
25
20
15
10
5
0
First quarter
1995
1996
1997
1998
1999
2000
2001
2002
2003
Households’ net financial worth
Value of real estate holdings

cles, however, several factors have combinedto inhibit a vigorous rebound in investment.
Corporate debt legacies of the 1990s’ boomcontinue to curtail investment plans across theOECD. For example, U.S. non-financial cor-porate debt as a proportion of GDP rose from38 percent in 1995 to 47 percent in 2002. Re-cent data, however, show U.S. debt rates stabi-lizing over the last quarters of 2002 and thefirst of 2003—a positive sign that adjustmentefforts are beginning to yield fruit. Corporateprofits fell 10 percent in the United States in2001, while those of Japanese manufacturersplummeted 48 percent, reflecting onset of re-cession. The tortuous road toward restorationof profit growth has involved substantial cutsto capital spending and to employment overthe last years. However, there is evidence thatprofits are staging recoveries in the UnitedStates and Japan, as well as in several sectorsof industry in Europe. U.S. profits enjoyed a 15percent rebound in 2002, but growth eased to a 5 percent pace in the first quarter of 2003.In Japan, profits of major manufacturers ex-perienced a substantial comeback, rising 38percent in recent quarters (y/y)—despite nu-merous challenges (figure 1.6). These develop-ments offer additional evidence that the corner
to growth in capital spending, at least for theUnited States—and possibly for Japan—maybe approaching.
Business sentiment is now displaying dis-tinct divergence between the United States and
G L O B A L O U T L O O K A N D T H E D E V E L O P I N G C O U N T R I E S
9
Figure 1.5 Capital spending has been hesitant in all industrial countriesReal fixed investment, quarter/quarter, percent change, Q/Q, saar
Sources: National agencies and Eurostat.
2001 Q1 2001 Q2 2001 Q3 2001 Q4 2002 Q1 2002 Q2 2002 Q3 2002 Q4 2003 Q1
4
2
0
–2
–4
–6
–8
–10
–12
–14
–16
UnitedStates
Japan
Euro Area
�
�
�
Figure 1.6 Corporate profits have risenmoderately in the United States and Japan
Sources: Department of Commerce, Bank of Japan, ESRI.
5,000
6,000
7,000
8,000
9,000
10,000
11,000
350
300
United States[left scale]
Japan[right scale]
1994
Q1
1995
Q3
1997
Q1
1998
Q3
2000
Q1
2001
Q3
2003
Q1
400
450
500
550
600
650
700
750
Adjusted profits in billions of dollars (2Q-ma) and trillionsof yen (3Q-MA)
�
�

Europe and Japan, where assessments of con-ditions have worsened. The ISM survey cover-ing U.S. manufacturing and non-manufacturingsectors fell below the 50 percent line that di-vides expansion from contraction during Marchand April—before manufacturing reboundedto 49.8 in June—and services sharply to 54.5in May. In contrast, the composite PMI for theEuro Area entered the “contraction zone” inMarch, and fell further to 48.1 in June, reflect-ing declines in both services and manufactur-ing indicators (figure 1.7). It appears thatfinancial conditions weighing against capitalspending are easing across the OECD, andbusiness sentiment is now reviving in theUnited States. Yet a key uncertainty persists: therobustness of future demand, which is stronglytied to the effects of policy.
After providing substantial stimulus,economic policy is reaching limitsOn both fiscal and monetary fronts, policy-makers in the rich countries injected signifi-cant stimulus, first to limit the global eco-nomic downturn of 2001, and over the last 18 months to foster conditions conducive forstronger recovery. On the fiscal front, the U.S.
government’s general budget position shifteddramatically from a surplus of 2.3 percent ofGDP in 2000 to a deficit of 3.2 percent duringthe first quarter of 2003. In part this reflectsreduced revenues associated with sluggish ac-tivity and the operation of automatic stabiliz-ers. But the shift to deficit has been more pro-nounced due to tax reduction and funding ofthe Iraqi campaign at the federal level, and byincreasing shortfalls at the state and local lev-els (figure 1.8). Before the recent additional$350 billion tax reduction was enacted, theCongressional Budget Office projected thatthe federal on-budget fiscal position was un-likely to return to surplus until 2012. Persis-tent deficits of such magnitude carry the po-tential to constrain growth in the mediumterm and beyond, largely as long-term interestrates rise in response to much-increased sup-ply of Treasury securities.
Fiscal deterioration and the current accountThe deterioration of the fiscal position hasplayed a role in the doubling of the U.S. currentaccount deficit from 2.3 percent of GDP in1998 to 4.6 percent in 2002. The public-sectorfinancial balance (saving less investment)
G L O B A L E C O N O M I C P R O S P E C T S 2 0 0 4
10
Figure 1.7 Business confidence remains poor, but better in the United States than in EuropeEuropean and U.S. business confidence, January 2000–June 2003
Sources: ISM and Reuters (Euro Area PMI).
62.5
60.0
57.5
55.0
52.5
50.0
47.5
45.0
42.5
40.0
62.5
60.0
57.5
55.0
52.5
50.0
47.5
45.0
42.5
40.0
Jan. 2000
June2000
Nov.2000
April2001
Sept.2001
Feb.2002
July2002
Dec.2002
May2003
Euro area manufacturing PMI [right scale]
ISM manufacturing index [left scale]�
�

shifted from balance in 1999 to deficit of 3.6percent of GDP in 2002, and further to a short-fall of 4.3 percent in the first quarter of 2003.At the same time, improvement in the private-sector balance (largely through compression of
investment), although substantial, was far fromsufficient to make up the gap (figure 1.9a).
Aside from the underlying savings-investmentimbalance that drives the need for foreign cap-ital, the widening of the U.S. external deficit is attributable to several factors. Booming do-mestic conditions during the second half of the1990s attracted imports at a growth rate of 10percent annually, while the strong dollar andonly moderate growth in U.S. trade partnersserved to constrain export growth to 6 percent.In turn the trade balance deteriorated from adeficit of $175 billion in 1995 to $485 billionin 2002. Foreign capital flows funding the cur-rent account deficit have become increasinglyvolatile over the last years, shifting rapidly incomposition and in region of origin. The ef-fects of sustaining such capital inflows over anextended period remain a question of someconcern (box 1.2).
The present level of the current accountdeficit, at 5.1 percent of GDP in the first quar-ter of 2003, is an historic record. Of particu-lar concern is the unprecedented level of deficitoccurring at an early phase of economic recov-ery, when external positions are normally closer to balance given only moderate changes in
G L O B A L O U T L O O K A N D T H E D E V E L O P I N G C O U N T R I E S
11
Figure 1.8 The U.S. fiscal deficit iswidening quickly
Source: Department of Commerce.
–250State/local balance
–300
–350
–100
–150
–200
50
1999
Q1
1999
Q3
2000
Q1
2000
Q3
2001
Q1
2001
Q3
2002
Q1
2002
Q3
2003
Q1
0
–50
250
200
150
100
�
U.S. federal, state, and local current fiscal balances,1999–2003 (billions of dollars)
Federal balance
Figure 1.9 The U.S. current account deficit is at record levels
Source: U.S. Department of Commerce.
Percent of GDP
a. The public sector balance is driving the deficit
–62000 Q1 2000 Q3 2001 Q1 2001 Q3
Private sectorfinancial balance
Public-sectorfinancial balance
Current account balance
2002 Q1 2002 Q3 2003 Q1
–5
–4
–3
–2
–1
0
1
2
�
�
�
(Figure continues on page 13)

G L O B A L E C O N O M I C P R O S P E C T S 2 0 0 4
12
As the U.S. current account deficit more than dou-bled in dollar terms between 1998 and 2002 to
reach $480 billion, U.S. calls on international finan-cial markets increased in tandem. The country’s ex-ternal financing requirement climbed to 4.6 percentof GDP in 2002, representing some 10.3 percent ofthe savings of the rest of the world. U.S. financingrequirements largely have been smoothly met by netinflows from abroad. But the form of financing (thatis, the composition of the net foreign-asset flow) haschanged dramatically over just the last three years,while the region of origin of the inflow has shifted aswell. The underlying nature of the capital inflow can,as demonstrated aptly in recent years, lead to ques-tions of medium-term sustainability of the externaldeficit; while shifts in origin of flows can influencemarket expectations for adjustment in the value ofthe dollar against its major partner currencies.
During 2000, the final year of the boom, theUnited States required net inflows of some $457 bil-lion to cover its current account deficit. Financingwas readily available, through increased mergers-and-acquisitions activity that yielded net purchases of cor-porate bonds of $281 billion; complemented bystrong $160 billion in FDI flows and some $85 bil-lion attracted to 45 percent gains in NASDAQ (seefirst figure). Together the equity component of flows(FDI and stocks) accounted for more than 50 percentof requirements—a strong fundamental position. Theonset of recession in the United States during 2001was clearly a transition year for investor perceptions.The fall of equity markets (NASDAQ down 50 per-cent) forced a compression of the highly diversifiedflows of 2000, as equity and FDI dropped to negligi-ble amounts and investors flocked into debt instru-ments. Long-term debt-related securities almost cov-ered the U.S. requirement of some $420 billion in theyear. The transition in composition of inflowsevolved more fully in the difficult environment of2002. FDI recorded net outflow of almost $100 bil-lion; purchases of Treasuries by risk-averse investorsincreased by $100 billion; a virtual cessation in over-seas lending by U.S. banks yielded a net buildup inbank liabilities of $70 billion; and foreign official as-sets (largely East Asian) increased by $90 billion froman inflow of $5 billion during the previous year.
Box 1.2 Financing the U.S. current account deficit:From equity to debt
The source of inflows to U.S. equity and “corpo-rate” bond markets shifted over recent years (secondfigure). Although the United Kingdom’s status as amajor financial hub for the European region domi-nates flows, a discernible shift is clear: from “otherWestern Europe” (Euro Area) and Japan as centersof demand for U.S. securities to “other countries” (East Asia and Latin America). During 2000, theEuro Area accounted for 25 percent of total net
U.S. external financing requirements andnet financial flows
Source: U.S. Department of Commerce.
1996 1998 2000 2001 2002
Billions of dollars
U.S. financingrequirements
�
Bonds
700
600
500
400
300
200
100
0
–100
–200
700
600
500
400
300
200
100
0
–100
–200
Treasury bills andother official debt
�
Equities
�
FDI�
�
Banking�
Net flows into U.S. private securities byregion of originBillions of dollars
Source: U.S. Department of Commerce.
0
50
100
150
200
250
300
350
400
450
1996
United Kingdom
OtherWestern Europe
Japan
Shares %
Other countries
1998 2000 2001 2002
35%
17
43
5
(Box continues on next page)

demand (figure 1.9b). In looking forward, withcontinued requirements for massive net inflowsof foreign capital, the U.S. income-accountdeficit is likely to widen, while terrorism-relatedissues may continue for an extended period,pressuring U.S. services and net transfer posi-tions. Yet assuming a gradual buildup of global
economic activity, an expected improvement inthe goods balance should build, bringing aboutmedium-term stabilization of the deficit in dol-lar terms, declining as a proportion to GDP.
Member states of the Euro Area have strug-gled to cope with the requirements of theStability and Growth Pact of the Maastricht
G L O B A L O U T L O O K A N D T H E D E V E L O P I N G C O U N T R I E S
13
foreign purchases, falling to 5 percent in 2002—alarge decline in relative demand for dollar-based as-sets, tending to boost the value of the euro; in con-trast Japan’s share increased from 9 to 17 percent,while East Asia and Latin America almost doubledtheir shares in purchases from 19 to 35 percent by2002. Such a shift in the origin of funds may set thestage for future currency movements.
In looking ahead, the downshift in equity, per-sistence of large debt flows and dependence onvolatile official reserve assets for some 20 percent ofcoverage, and the fall of the U.S. dollar against theeuro, augur poorly for the inherent stability of fi-nancing in the short to medium terms. A “less than
Box 1.2 (continued)
virtuous” circle may result, as sources of finance be-come less stable. Greater volatility may be impartedto the dollar, leading in turn to higher and morevolatile interest rates. When combined with percep-tions of a persistently growing current accountdeficit, the confidence of foreign investors in dollar-denominated assets may be adversely affected.
Implications for the availability of finance fordeveloping countries also arise from the increasingU.S. share of international capital flows. Although“crowding out” has yet to be in clear evidence, thepotential for it exists should deficits continue to rise.The U.S. current account appears to have increasedas a source of financial risk for the global outlook.
Figure 1.9 (continued)
1980 1982 1984 1986 1988
Current account balanceMerchandise
Services/Income/Transfers
1990 1992 1994 1996 1998 2000 2002
�
� �
100
0
—100
—200
—300
—400
—500
Source: U.S. Department of Commerce.
Billions of dollars
b. The magnitude of the current account deficit is unprecedented for an early recovery phase of the cycle

Treaty, which, to set a foundation for the sin-gle currency, limits fiscal deficits to 3 percentof GDP and outstanding government debt lev-els to about two-thirds of GDP. During 2004Italy is anticipated to join France, Germany,and Portugal in the group of countries thathave breached the 3 percent limit. The consol-idated balance for the Euro Area has deterio-rated by 1.5 points of GDP over the periodsince early 2000, while that for Germany hasshifted markedly from a 1.1 percent surplus toa 3.8 percent deficit. For the latter, especially,the tightening of policy to return to within thelimits by 2005–06 is inopportune because eco-nomic conditions have deteriorated sharply;fiscal “austerity” only adds to these tendencies.
Japan’s fiscal stance continues to deterio-rate, moving from a deficit of 6 percent ofGDP in 2000 to 7 percent during 2002. Al-though public-sector investment outlays asso-ciated with public works and other traditionalsupplementary budget measures have been cur-tailed in recent years (falling by a cumulative4.5 percent since 2000), more public monieshave been allocated to shoring up the bankingsystem and underpinning social safety nets
for those falling into unemployment. Japan’spublic-debt burden, however, at some 150percent of GDP, against the background of arapidly aging demographic profile, suggeststhat a required movement toward balance incurrent budget terms will present considerablechallenges to policymakers.
In monetary policy, authorities in the in-dustrial countries have been aggressive—moreso in the United States, less in Europe (figure1.10). While operating with effective policyinterest rates at zero, the Bank of Japan (BOJ)has proposed a wide range of policy measuresaimed at easing the deflationary state of theeconomy. But evidence to date suggests thatlittle has been achieved in this area. Aggressiveeasing of policy rates by the Federal Reserve,from 6.5 percent at end-2000 to 1 percent at present, clearly supported consumer andhousing-related activity, though with littleapparent effect on business capital formation.Consumption of durable goods, especially autos,has found support from record low interestrates. And mortgage refinancings have beenspurred to new highs, placing extra disposableincome into consumers’ pockets.
G L O B A L E C O N O M I C P R O S P E C T S 2 0 0 4
14
Figure 1.10 Market interest rates have dropped
Source: Datastream.
Benchmark U.S. and European interest rates, 2001–2003 (percent)
1
U.S. 10-year
EURIBOR
U.S. LIBOR2
3
4
5
6
7
�
�
�
Jan.
200
0
Mar
ch 2
000
May
200
0
July
2000
Sept.
2000
Nov. 2
000
Jan.
200
1
Mar
ch 2
001
May
200
1
July
2001
Sept.
2001
Nov. 2
001
Jan.
200
2
Mar
ch 2
002
May
200
2
July
2002
Sept.
2002
Nov. 2
002
Jan.
200
3
Mar
ch 2
003
May
200
3
July
2003
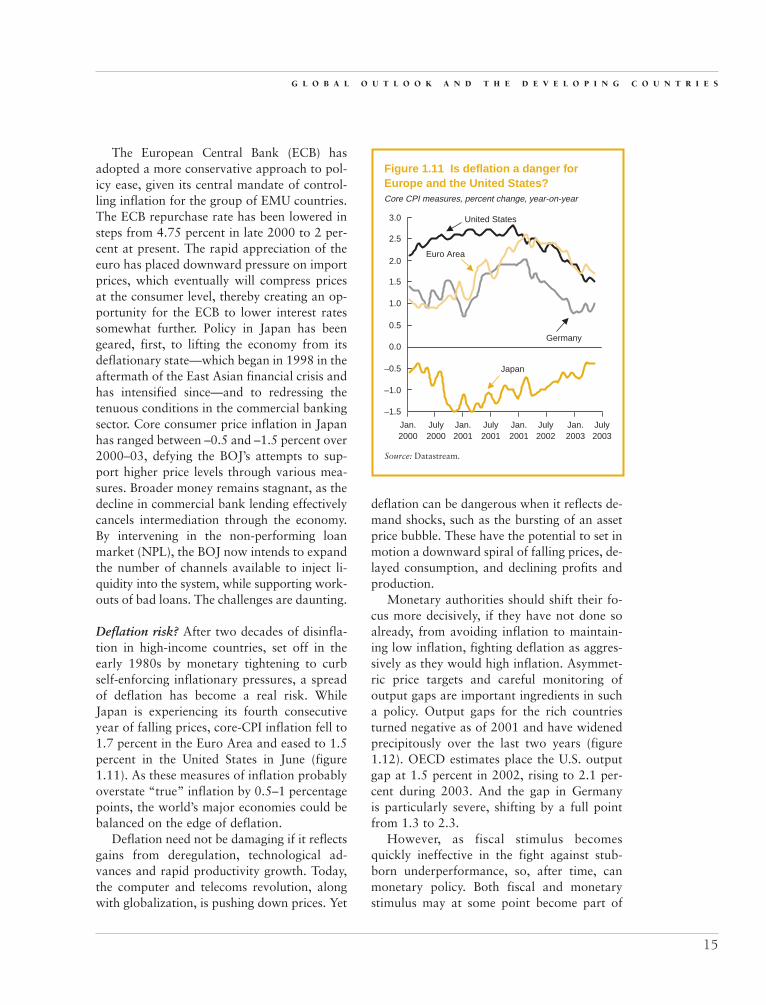
The European Central Bank (ECB) hasadopted a more conservative approach to pol-icy ease, given its central mandate of control-ling inflation for the group of EMU countries.The ECB repurchase rate has been lowered insteps from 4.75 percent in late 2000 to 2 per-cent at present. The rapid appreciation of theeuro has placed downward pressure on importprices, which eventually will compress pricesat the consumer level, thereby creating an op-portunity for the ECB to lower interest ratessomewhat further. Policy in Japan has beengeared, first, to lifting the economy from itsdeflationary state—which began in 1998 in theaftermath of the East Asian financial crisis andhas intensified since—and to redressing thetenuous conditions in the commercial bankingsector. Core consumer price inflation in Japanhas ranged between –0.5 and –1.5 percent over2000–03, defying the BOJ’s attempts to sup-port higher price levels through various mea-sures. Broader money remains stagnant, as thedecline in commercial bank lending effectivelycancels intermediation through the economy.By intervening in the non-performing loanmarket (NPL), the BOJ now intends to expandthe number of channels available to inject li-quidity into the system, while supporting work-outs of bad loans. The challenges are daunting.
Deflation risk? After two decades of disinfla-tion in high-income countries, set off in theearly 1980s by monetary tightening to curbself-enforcing inflationary pressures, a spreadof deflation has become a real risk. WhileJapan is experiencing its fourth consecutiveyear of falling prices, core-CPI inflation fell to1.7 percent in the Euro Area and eased to 1.5percent in the United States in June (figure1.11). As these measures of inflation probablyoverstate “true” inflation by 0.5–1 percentagepoints, the world’s major economies could bebalanced on the edge of deflation.
Deflation need not be damaging if it reflectsgains from deregulation, technological ad-vances and rapid productivity growth. Today,the computer and telecoms revolution, alongwith globalization, is pushing down prices. Yet
deflation can be dangerous when it reflects de-mand shocks, such as the bursting of an assetprice bubble. These have the potential to set inmotion a downward spiral of falling prices, de-layed consumption, and declining profits andproduction.
Monetary authorities should shift their fo-cus more decisively, if they have not done soalready, from avoiding inflation to maintain-ing low inflation, fighting deflation as aggres-sively as they would high inflation. Asymmet-ric price targets and careful monitoring ofoutput gaps are important ingredients in sucha policy. Output gaps for the rich countriesturned negative as of 2001 and have widenedprecipitously over the last two years (figure1.12). OECD estimates place the U.S. outputgap at 1.5 percent in 2002, rising to 2.1 per-cent during 2003. And the gap in Germany is particularly severe, shifting by a full pointfrom 1.3 to 2.3.
However, as fiscal stimulus becomesquickly ineffective in the fight against stub-born underperformance, so, after time, canmonetary policy. Both fiscal and monetarystimulus may at some point become part of
G L O B A L O U T L O O K A N D T H E D E V E L O P I N G C O U N T R I E S
15
Figure 1.11 Is deflation a danger forEurope and the United States?Core CPI measures, percent change, year-on-year
Source: Datastream.�
�
�
�
Japan
United States
Euro Area
Germany
3.0
2.5
2.0
1.5
1.0
0.5
0.0
–0.5
–1.0
–1.5
Jan.2000
Jan.2001
July2000
July2001
July2002
Jan.2001
Jan.2003
July2003
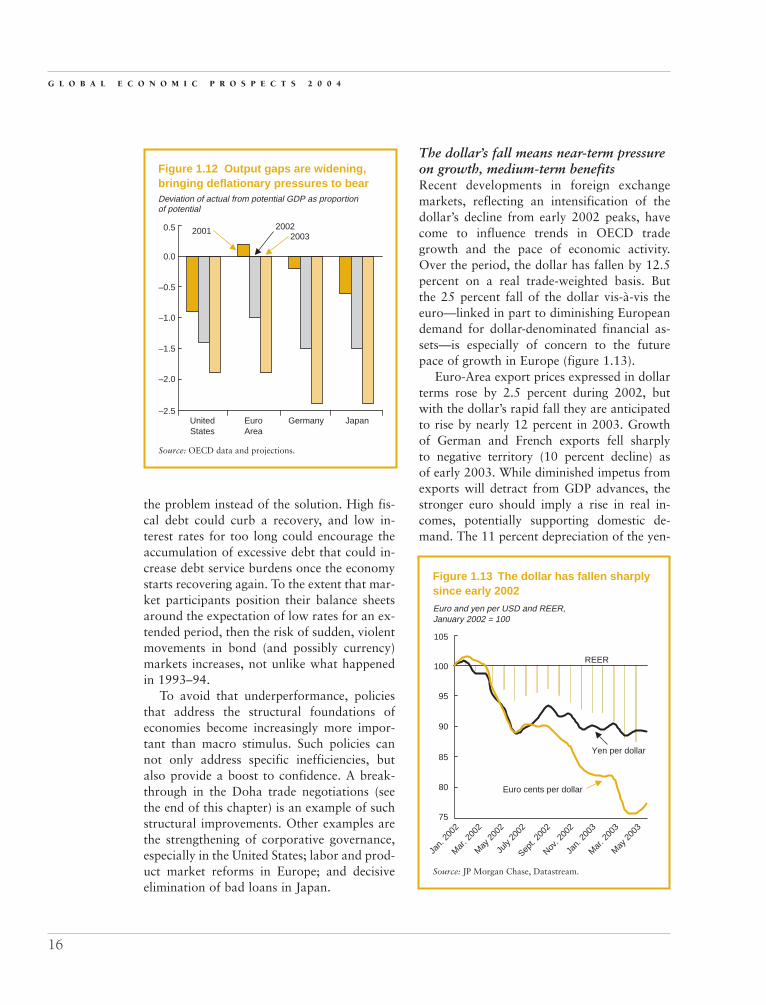
the problem instead of the solution. High fis-cal debt could curb a recovery, and low in-terest rates for too long could encourage theaccumulation of excessive debt that could in-crease debt service burdens once the economystarts recovering again. To the extent that mar-ket participants position their balance sheetsaround the expectation of low rates for an ex-tended period, then the risk of sudden, violentmovements in bond (and possibly currency)markets increases, not unlike what happenedin 1993–94.
To avoid that underperformance, policiesthat address the structural foundations ofeconomies become increasingly more impor-tant than macro stimulus. Such policies cannot only address specific inefficiencies, butalso provide a boost to confidence. A break-through in the Doha trade negotiations (seethe end of this chapter) is an example of suchstructural improvements. Other examples arethe strengthening of corporative governance,especially in the United States; labor and prod-uct market reforms in Europe; and decisiveelimination of bad loans in Japan.
The dollar’s fall means near-term pressureon growth, medium-term benefits Recent developments in foreign exchangemarkets, reflecting an intensification of thedollar’s decline from early 2002 peaks, havecome to influence trends in OECD tradegrowth and the pace of economic activity.Over the period, the dollar has fallen by 12.5percent on a real trade-weighted basis. But the 25 percent fall of the dollar vis-à-vis theeuro—linked in part to diminishing Europeandemand for dollar-denominated financial as-sets—is especially of concern to the futurepace of growth in Europe (figure 1.13).
Euro-Area export prices expressed in dollarterms rose by 2.5 percent during 2002, butwith the dollar’s rapid fall they are anticipatedto rise by nearly 12 percent in 2003. Growth of German and French exports fell sharply to negative territory (10 percent decline) as of early 2003. While diminished impetus fromexports will detract from GDP advances, thestronger euro should imply a rise in real in-comes, potentially supporting domestic de-mand. The 11 percent depreciation of the yen-
G L O B A L E C O N O M I C P R O S P E C T S 2 0 0 4
16
Figure 1.12 Output gaps are widening,bringing deflationary pressures to bearDeviation of actual from potential GDP as proportion
Source: OECD data and projections.
�
��
0.5
0.0
–0.5
–1.0
–1.5
–2.0
–2.5UnitedStates
EuroArea
Germany Japan
2001 20022003
of potential
Figure 1.13 The dollar has fallen sharplysince early 2002
Source: JP Morgan Chase, Datastream.
Yen per dollar
Euro cents per dollar
REER
�
�
Euro and yen per USD and REER,January 2002 = 100
100
105
95
90
85
80
75
Jan.
200
2
Mar
. 200
2
May
200
2
July
2002
Sept.
2002
Nov. 2
002
Jan.
200
3
Mar
. 200
3
May
200
3

dollar rate poses complications, in a mannersimilar to Europe, for sustaining economic ac-tivity in Japan. Momentum underlying Japaneseexports plummeted from 35 percent growthduring spring 2002 to decline in early 2003,tied to a sharp 35 percent fall-off in shipmentsto the United States and slowing exports toAsia, from 45 to 3.5 percent rates. Authoritieshave been active in market intervention to slowthe pace of dollar depreciation.
Ongoing realignment of currency values,however, will carry medium-term benefits. Re-cent moves are in a balancing direction, as thestrength of the dollar over most of the 1990sraised the question of overvaluation against alonger-term equilibrium rate for the currencybased on fundamental factors. The strong dol-lar contributed to the massive U.S. externalimbalance, but at the same time maintaineddownward pressures on inflation, allowingroom for substantial interest rate reductions.A medium term boost to U.S. competitivenessmay be expected, provided that the dollar sta-bilizes or moves only gradually. Still, prospectsfor stabilization of the current account deficitremain at some risk.
Expansion is likely by 2004As additional impetus to growth from policyaction is anticipated to be small, recoveryamong the rich countries will hinge on the ef-fects of policy actions taken to date, and im-portantly, a restoration of confidence. The mo-mentum of economic activity will likely buildover 2003, reaching more robust proportionsby 2004. Recovery should be paced by ad-vances in the United States and by a return tostronger domestic demand in the emerging andhigh-income economies of East Asia. Revivalof growth in the Euro Area will be tortuous,lagging that of the United States, and may findits focus in domestic rather than external de-mand. A lower dollar will help European con-sumers—as real incomes rise with lower infla-tion, and a virtuous cycle of stronger businessoutput and eventually more substantial in-creases in capital expenditure could emerge.
The risk of weaker growth is substantial, how-ever, given deterioration of conditions in Ger-many. Short-to-medium-term growth in Japanwill be conditioned to a large degree by de-velopments in export markets, especially inbroader East Asia; the competitiveness of theyen; and the success or failure of policy in mit-igating the deep-seated problems in the bank-ing system.
Some positive developments have becomeapparent in the U.S. landscape. If sustained,these developments may augur well for gradualrecovery. Since September 2002, consumer con-fidence has recovered moderately, while theDow Jones index has recouped some 20 per-cent of its value (figure 1.14a). Manufacturingsentiment has improved and production risen,while sentiment for services has returned to itsearly fall levels. A possible upturn in the high-tech/semiconductor cycle has been underpinnedby near 30 percent gains in orders for comput-ers and communications equipment. And theeffects of dollar depreciation may be cominginto evidence as export momentum breachedpositive territory with a 3 percent advance fromApril to May. Yet the pace of consumer demandremains cloudy, and evidence for incipient re-covery in capital spending is sketchy.
Against this background, the projectionsposit a subdued 1.5 percent growth outturn in2003 for the high-income OECD countries,marking a 0.1 point deterioration of growthfrom 2002, largely because of sluggish con-ditions in the United States and particularly in Europe during the first half of the year. Theadvance in aggregate GDP is anticipated to riseto 2.5 percent by 2004—closer to long-termaverages—as momentum builds in U.S. invest-ment and output growth achieves 3.4 percentrates there. A revival in world trade toward 8percent growth should help buoy performancein Europe and Japan. Interest rates will beginto respond to improved economic prospects,leading U.S. growth to taper off moderatelyinto 2005, while Europe and Japan continue toregister improvement, given the later start oftheir recoveries (figure 1.14b).
G L O B A L O U T L O O K A N D T H E D E V E L O P I N G C O U N T R I E S
17

But downside risks have not disappearedSome of the global uncertainties related tononeconomic events—the war in Iraq andSARS—have eased, but have not completelydisappeared. Prospects for eventual stabiliza-tion and resolution of developments in theMiddle East remain uncertain, and the poten-tial for adverse events remains, while SARS
will continue to present challenges to policy-makers worldwide (box 1.4). However, theseuncertainties do not constitute the most seri-ous risk to the global recovery. More impor-tant risks are to be found in the high-incomecountries.
A noteworthy feature of current globalprospects is that many of the downside risks
G L O B A L E C O N O M I C P R O S P E C T S 2 0 0 4
18
Figure 1.14 OECD recovery begins in the United States
Sources: Conference Board, Dow Jones, Institute for Supply Management, and U.S. Department of Commerce.
Index: Sept. 2002 = 100
a. Signs of revival in the U.S. economy
�
�
�
130
120
110
100
90
80
70
60Consumer confidence Dow Jones
Sept. 2002
March 2003
Latest
ISMmanufacturing
Computers andcommunications orders
b. OECD recovery to build through 2004
Percent
Source: World Bank, DECPG.
OECD United States Japan Euro Area
��
�
�
2002 2003
2004
2005
0.0
0.5
1.0
1.5
2.0
2.5
3.5
3.0

originate in high-income countries, and that astrong recovery is not predicted for any ofthese countries in the near term. The reboundin the investment cycle, which is crucial to theoverall recovery, remains uncertain. Althougheconomic and financial conditions—low inter-est rates, rising equity prices, improved corpo-rate balance sheets, and increased profits—arefavorable for a recovery in investment, a lackof confidence could delay or even abort the re-bound. Other risks are of a financial nature.The weakening of the dollar has, until now,been a movement toward equilibrium. But thedollar’s fall is likely not enough to sustaindemand for dollar-denominated assets, as theburgeoning U.S. fiscal and current accountdeficits are likely to call for an additional $1.5trillion in net foreign inflows over the periodthrough 2005. A further sharp fall in thedollar could destabilize the recovery in thehigh-income countries. Additional risk mayarise if vulnerabilities in the banking sector of the main industrialized economies intensifyin response to deflationary pressures. Risks in the high-income countries call for decisivepolicy initiatives to improve the structure ofeconomies. Moreover, uncertainties surround-ing the recovery in high-income countriestransmit to the international environment andto the medium-term outlook for developingcountries, implying that expected improvementin developing-country growth should not betaken for granted.
The external environment fordeveloping countries: Gradualimprovement, but a bumpy road ahead
The external environment facing develop-ing countries has been shaped by the set
of recent developments in the rich countries aswell as expectations for OECD growth andimport demand. The evolution of trade prices,interest rates, and financial flows will play amajor role in determining external balances,while influencing reserves and liability man-
agement decisions in emerging markets. Over-all, the environment of the last few years hasbeen a difficult one, but conditions should im-prove gradually through 2005 (table 1.3).
Although export market growth for devel-oping countries chalked-up a meager 2.5 per-cent advance during 2002, export volumes forthe group accelerated from nil in 2001 to 7.7percent in the year, implying substantial gainsin market share. As market growth rises towarda 7–8 percent range by 2003–05, emerging-market exports should continue to gain shareand expand at rates around 10 percent. Tradeprices bode well for improvement in exportrevenues during 2003, with terms of trade an-ticipated to rise by 0.4 percent, but modera-tion in non-oil commodity prices and in oilmarkets by 2004–05 should serve to dampeninitial gains.
Advanced market interest rates are ex-pected to trough during 2003, to rise moder-ately in 2004, and return to long-term averagerates by 2005, a net increase of some 280 basispoints from current 1 percent levels of US$-LIBOR, and 100 points for EURIBOR, as Eu-ropean growth fundamentals remain subduedfor a longer period. Meanwhile, there has beensharp compression in average emerging-mar-ket spreads, and a continuation of that trendwould help keep the cost of capital for devel-oping countries at moderate levels.
The near-term outlook for capital flows todeveloping countries is mixed, however, as con-tinued restraint on the part of commercialbanks in extending new loans is offset by muchstronger trends in bond issuance. Gross capitalmarket flows are anticipated to rise by some 9percent in 2003. But FDI flows in the currenteconomic and geopolitical environment, poten-tially exacerbated by the SARS epidemic inChina (the major recipient country), are antici-pated to experience no growth during 2003—an assessment that may prove somewhat opti-mistic. On balance, the outlook envisions anenvironment increasingly conducive for growth,but a potentially bumpy road for policymakersto navigate.
G L O B A L O U T L O O K A N D T H E D E V E L O P I N G C O U N T R I E S
19

World trade is growing more slowly thanexpected in 2003, but fundamentalssuggest a buildup of momentum into 2004 A decidedly soft patch in trade momentum de-veloped over the second half of 2002 andthrough early 2003. Demand was boggeddown by widespread weakness in the automo-tive, air travel, and technology sectors. Andslackening of domestic demand conditions inthe OECD countries compounded these trends.European import demand went through sharpcompression: trade among EU member statesespecially affected by recession-like conditionson the Continent, and demand from outside theUnion falling rapidly as well. After a pick-up to12 percent rates at year-end, U.S. import vol-umes retrenched to a decline of 5 percent byApril 2003—a pattern echoed by Japanese for-eign demand—before rising again in May (fig-ure 1.15). Against this background, followingan advance of 3 percent in 2002, estimates forworld trade growth in the current year havebeen marked down from 6.2 percent antici-pated in spring 2003 projections to 4.6 percent.
A gradual advance in OECD industrialproduction and investment, combined withsomewhat diminished strength in East Asianintraregional trade, underpin the anticipatedrecovery of trade volumes over the second halfof 2003 and into 2004. And the medium-termoutlook appears generally positive, as domes-tic demand in the rich countries, as well aslow-and-middle income countries, should even-tually rise in response to substantial policystimulus. In contrast, the view for a revival oftrade related to the global semiconductorcycle is uncertain at present. Sales may havereached a local peak, as unit shipments arenow close to 2000 levels, while prices arelikely to remain soft, reflecting the recent shiftof production toward developing East Asia.
East Asia has been generating strong trademomentum on its own account, led by China.Chinese nominal imports (excluding oil) havegrown at a compound rate of 12.2 percentsince 1995, with much of the demand beingmet by regional producers. China’s share in themerchandise exports of East Asia (Indonesia,
G L O B A L E C O N O M I C P R O S P E C T S 2 0 0 4
20
Table 1.3 The difficult environment for developing-country growth should improveExternal factors affecting developing-country growth, 2001–05 (percent change, except as noted)
2001 2002 2003 2004 2005
OECD import demand –0.7 1.7 4.1 6.3 6.7Export market growtha –0.2 2.5 6.8 8.0 7.7Developing export volume 1.1 7.7 10.0 10.9 9.7
Non-oil commodity prices –9.1 5.1 6.9 1.1 1.5Oil price $/bbl 24.4 24.9 26.5 22.0 20.0MUVb –4.5 –0.1 4.0 –0.4 1.5Terms of trade –0.7 –1.1 0.4 –1.5 –2.7
US LIBOR 3.5 1.8 1.0 2.0 3.8EURIBOR 4.2 3.4 2.1 2.1 3.1Emerging market spread (bp) 797 728 610 — —
Financial flows ($ billion) 326 293 309 — —FDI inflow 171 143 145 — —Gross capital market flows 155 150 164 — —
Equity placement 7 11 12 — —Bond financing 62 55 70 — —Bank lending 86 84 82 — —
— Not available.a. Import demand in partner markets. b. Manufactures Unit Value index, expressed in U.S. dollars.Source: World Bank data and projections.

Republic of Korea, Taiwan (China), Malaysia,Thailand) has doubled over the last two yearsand quadrupled over the last ten (figure 1.16).
The dollar’s weakness may improvemerchandise trade balances for developing countries For exporters who sell at a markup to localcurrency costs, dollar weakness implies higherdollar revenues per unit sold. Over the lasttwo years developing countries’ export priceshave tended to grow at higher rates than thoseof high-income countries, yielding a cumula-tive improvement in the terms of trade. Yet,this development must be interpreted as adouble-edged sword, with much of the im-provement explained by higher oil prices.
As a group, developing countries are netenergy exporters; but within the group thereare significant net importers, many of whichhave been experiencing deterioration in theirterms of trade. Indeed, two-thirds of develop-ing countries, with GDP of $2.9 trillion (56percent of total developing-country GDP) andpopulation of 3.5 billion (75 percent of the de-veloping world) are net energy importers. To a
G L O B A L O U T L O O K A N D T H E D E V E L O P I N G C O U N T R I E S
21
Figure 1.15 OECD-area imports have declined sharply since April 2000
Note: EU weighted intra- and outside-EU imports.Sources: National agencies.
U.S. and EU growth of merchandise import values, 3 month moving average, saar
25
20
15
10
5
0
–5
–10
–15
25
20
15
10
5
0
–5
–10
–15
EU external
EU internalJapan
United States
�
� �
�
Jan.2000
April2000
July2000
Oct.2000
Jan.2001
April2001
July2001
Oct.2001
Jan.2002
April2002
Jan.2003
April2003
July2002
Oct.2002
Figure 1.16 China’s share of East Asianexports keeps risingShare in percent
Note: Chart shows Mainland China’s 3-month movingaverage imports from Korea, Taiwan (China), Malaysia,Thailand, and Indonesia as a percent of total exports ofgoods from these countries to all destinations. All data inU.S. dollars for January of the respective year.Source: Global Trends Team, national sources viaDatastream.
1990
1991
1992
1993
1994
1995
1996
1997
1998
1999
2000
2001
2002
2003
0
5
10
15
20

degree, the decline in terms of trade for netenergy importers may have been moderatedby price increases for non-oil commodities,but much of the improvement in price hasbeen limited to a few products—among themcocoa, rubber, and coarse grains. True terms-of-trade gains for this group are likely to waitfurther softening in oil price and a firming in non-oil prices associated with global eco-nomic recovery.
The medium-term outlook for developingcountry exports is encouraging, given expectedgrowth in export markets, combined withcontinuing pickup in market shares. East Asiais likely to dominate developing country tradeflows over the forecast period, but betterperformance is anticipated for Latin America,Europe and Central Asia, and South Asia (table 1.4).
The eventual return of Iraqi oil exportswill pressure OPEC and the oil price . . .Oil prices averaged $31.3/bbl during the firstquarter of 2003. Fears of loss of oil suppliesfrom war in Iraq, low stocks, strong weather-related demand, and sharply reduced exportsfrom Venezuela all contributed to the pricehike. In response to the rise, supplies from
other OPEC countries increased significantly.Saudi Arabia raised output to more than9mb/d to help offset the prevailing and poten-tial shortfall, and other OPEC members out-side Venezuela added more than 1mb/d. Theglobal oil price began falling shortly before theIraq war began, as traders did not want to becaught short as the conflict commenced, par-ticularly if a release of strategic stocks were tocause prices to crash as they did at the start ofthe Gulf War in 1991. Iraq’s oil infrastructurewas only minimally damaged during the war,and prices declined below $25/bbl duringApril. But Iraqi exports did not resume shortlyafter the war’s end, as widespread looting of oilfield equipment and of service industries thatsupply the oil sector, such as electricity andwater, significantly delayed restart of produc-tion. Global crude oil inventories have re-mained persistently low, particularly in theUnited States, as OPEC has well-managed salesof its surplus production into the market.While U.S. imports have risen, continued tight-ness in physical markets has caused prices torebound to around $27/bbl as of mid-June2003 (figure 1.17).
Conditions surrounding Iraqi oil exportswill likely be the most important drivers of oil
G L O B A L E C O N O M I C P R O S P E C T S 2 0 0 4
22
Table 1.4 Developing countries’ exports will grow faster than those of the high-incomecountriesMerchandise export volumes, 2001–05 (percent change)
2001 2002 2003 2004 2005
World –0.7 3.2 4.6 7.9 7.9High-income countries –1.2 2.1 3.2 7.1 7.4OECD –0.5 1.5 2.6 7.0 7.4
United States –5.9 –4.2 0.0 7.6 9.7Japan –8.3 7.3 6.7 7.0 6.5Euro Area 3.2 1.1 2.1 5.7 7.1
Other high income –6.8 7.1 7.7 8.1 7.3
Developing countries 1.1 7.7 10.0 10.9 9.7East Asia and Pacific –0.6 15.5 14.5 13.7 11.4Latin America and Caribbean –1.2 2.6 7.9 11.4 10.4Europe and Central Asia 4.9 6.3 8.5 8.7 8.5South Asia 2.1 –1.8 5.4 7.7 8.2Middle East and North Africa 5.0 –0.2 4.2 5.5 5.2Sub-Saharan Africa 2.5 1.2 2.7 5.4 5.7
Source: World Bank data and projections.

prices in the near term. Iraq’s production fordomestic needs resumed quickly after the war,but export volumes were limited to pre-warstorage that was shipped in late June. Oil ex-ports are scheduled to resume in the thirdquarter of the year, but technical difficulties aswell as recent pipeline explosions will initiallyconstrain shipments to about 1mb/d. However,the risk of further disruption is high, and it isunlikely that Iraq will achieve pre-war produc-tion levels of some 2.5mb/d during 2003. Agradual return of exports should enable OPECto curtail production in a timely manner andkeep the oil price within its target band of$22–28/bbl during 2003, particularly given theextremely low level of global inventories. Dif-ficulties for OPEC could deepen in 2004 whenIraq’s exports are anticipated to reach pre-warlevels.
Initial investment in Iraq’s oil sector will fo-cus on refurbishing and improving efficiency ofthe present infrastructure. Limited growth incapacity could occur in 2004, but production isnot expected to rise significantly above pre-warlevels until 2005 and beyond. There are sugges-
tions to double or triple capacity, but such anendeavor would take several years to achieveand require substantial investment. Neverthe-less higher capacity in Iraq, along with growingcapacity within other OPEC members and sig-nificant expansion outside OPEC, is expectedyield lower prices over the forecast period (box1.3). Large increases in non-OPEC supplies thatwill capture much of the expected moderategrowth in world oil demand are expected in thenext several years. A “high-side” risk to themedium-term outlook for the oil price is thatOPEC might exert stronger discipline to sustainhigher prices. Such a policy, however, wouldraise incentives for non-OPEC producers tobring additional supplies to market.
But the dollar’s decline and supply-sideconditions outweigh the effects of the Iraqwar on non-oil prices Non-oil commodity prices have patently beenaffected by the war in Iraq—through increasedfreight costs, a buildup of inventories prior tothe war, and the continuing reduction of stocksin the wake of military engagement. In addi-tion, the war generally dampened consumerand industrial demand. Other factors, how-ever, have been more important in influencingrecent commodity price trends—among themthe weakening of the dollar, supply conditionsin individual commodities, and extremely de-pressed levels of some commodity prices be-fore the recent recovery. The index of non-oilcommodity prices rose 5.1 percent in 2002after having declined by a cumulative 33 per-cent from 1997 to 2001. Prices are anticipatedto increase an additional 7 percent during 2003and advance at a modest 1 percent per year forthe following three years. But even after recov-ery in 2003, nominal prices will remain wellbelow their peaks of the mid-1990s.
The recovery in agriculture prices is expected to be modestThe index of nominal agricultural prices rose8.5 percent in 2002. It is projected to increaseby 7 percent in 2003 and by a more modest 1percent per year for the next three years. The
G L O B A L O U T L O O K A N D T H E D E V E L O P I N G C O U N T R I E S
23
Figure 1.17 The price of oil fell sharplybefore the war in IraqBrent oil price $/bbl
Source: DECPG Commodities Group.
March 20 April 9
12/3
1/02
1/30
/03
3/3/
03
6/3/
03
35
33
31
29
27
25
23
4/2/
03
5/2/
03

G L O B A L E C O N O M I C P R O S P E C T S 2 0 0 4
24
Oil markets suffered minimal disruption as a re-sult of the Iraqi conflict, as other OPEC produc-
ers, particularly Saudi Arabia, raised production inanticipation of reduced Iraqi output and to replaceVenezuelan exports. Oil prices peaked at $34.2/bbljust before the conflict commenced but quickly fellbelow $25/bbl. Oil stocks have stayed persistentlylow and prices have since recovered.
Oil prices have been extremely volatile duringthe last few years, largely because of fluctuations inOPEC production. Beginning in 2000,OPEC has targeted a price band of$22–$28/bbl for its basket of crude. Byand large the organization has been suc-cessful. With the exception of the post-September 11th slump, oil prices haveaveraged about $27/bbl since late 1999.This compares with an average price ofabout $17.6/bbl over the 1986–99 periodwhen OPEC was mainly concerned withregaining market share.
OPEC’s new strategy is to keep in-ventories low and prices high, but doingso requires it to both raise and lowerproduction during the year because ofthe seasonal pattern of oil consumption.Typically the industry builds stocks in thesummer for use during the peak-demandwinter season. However, it is difficult toprecisely anticipate demand and supplythree to six months forward, and this canresult in large imbalances and volatile prices.
Achieving higher prices has been counter-balanced by loss of OPEC’s market share. In recentyears virtually all of the modest growth in world oildemand (less than 1 percent annually from 1997 to2002) has been captured by non-OPEC producers—and much by the former Soviet Union. For OPEC 10(excluding Iraq), its crude oil production as a share of total world supply fell from 35 percent in 1996–97to 30 percent in 2002. Continued high oil prices willdampen future demand growth and, more importantly,stimulate development of non-OPEC supplies. Risingcapacity within OPEC, desires for higher quotas (Alge-ria and Nigeria), and a recovery of Iraq’s exports couldstrain OPEC’s efforts to support higher prices.
Oil prices are expected to decline from $26.5/bblin 2003 to $22/bbl in 2004 because of rising supply
Box 1.3 OPEC struggles to achieve higher pricesamid growing supply competition
competition and below-trend demand growth, and tofall below $20/bbl by mid-decade. By 2006–07, sig-nificant new supplies from West Africa, the Caspian,Russia, deepwater-areas of the Atlantic basin, andelsewhere are expected to come on stream and, cou-pled with rising capacity within OPEC, exert severedownward pressure on prices. A risk to the forecastis that OPEC could maintain strong production disci-pline over the next few years to keep prices at orabove $25/bbl. To achieve this goal, however, the
cartel would have to yield market share for higherprices. High prices would add to the growing pres-sures on world demand and competing supplies. Inthe end, it is probable that prices would still fallbelow $20/bbl within a few years.
In the longer term, demand growth will be mod-erate, as it has been for the past 20 years, but newtechnologies, environmental pressures, and govern-ment policies could further reduce growth. Pricesbelow $20/bbl are sufficiently high to generate ade-quate development of conventional and unconven-tional oil supplies, and there are no apparent re-source constraints far into the future. In addition,new areas continue to be developed (for example,deep-water offshore sites and the Caspian Sea), anddevelopment costs continue to fall because of newtechnologies, shifting supply curves outward.
Before and during war in Iraq, OPEC raised productionand quotasMillions of barrels per day, January 1996–July 2003
Sources: IEA and DECPG Commodities Group.
30
29
28
27
26
25
24
23
22
21
Jan. 1996 Jan. 1997 Jan. 1998
OPEC-10 OPEC including Iraq
OPEC-10 Quota
Jan. 1999 Jan. 2000 Jan. 2001 Jan. 2002 Jan. 2003
�
�
�

advance in 2003 is driven primarily by the re-covery of coffee, rubber, and vegetable oilprices after severe declines from 1997 to 2001.Most other agricultural commodity prices areexpected to show only modest gains, however,because of high stock levels, excess productioncapacity, and slow demand growth associatedwith the modest recovery of global economicactivity. Sharp increases in wheat prices at mid-2002 were quickly reversed as supply condi-tions in the United States improved and non-traditional exporters—Ukraine and Russia—increased international shipments. Other com-modities, such as coffee and sugar, are bur-dened by large stock overhang; price increasesare not anticipated despite historically low lev-els (figure 1.18).
Metals prices have undergone rallies overthe past years but have faltered—mainly be-cause of renewed expectations of weak de-mand. Recently, worries about the impact ofthe SARS virus on East Asian demand has alsotaken the luster out of metals prices. Invento-ries remain high for most metals and most mar-kets are expected to remain in surplus this year.Nickel is the exception; stocks are low, therehas been strong demand for stainless steel—
especially in China—and prices have risenquite sharply. Gold also posted higher pricestied to reduced producer hedging and concernsabout U.S. equity markets and the dollar. Al-though production cutbacks have been madefor most metals, idle capacity will haunt themarket even after the anticipated recovery indemand is finally underway. Metals prices areexpected to increase by about 6 percent peryear for the next two years, after decreasing byabout 3 percent in 2002. Copper, the most bal-anced market among base metals, could tiltinto deficit next year along with nickel. Othermetals are expected to remain in surplus for alonger period, unless further production cutsoccur, and prices are likely to lag behind that ofcopper during the recovery.
Financial markets have shown some surprisesThe divergence between the sharp rally in de-veloping countries’ fixed-income asset pricesand the fairly tepid capital flows in response tothose prices has been the hallmark of market-based financing during early 2003. This devel-opment was not expected at the start of theyear (see World Bank 2003). While asset prices
G L O B A L O U T L O O K A N D T H E D E V E L O P I N G C O U N T R I E S
25
Figure 1.18 Agricultural prices have begun to decline as crop prospects improve
Source: DECPG Commodities Group.
Prices in US$, indices May 2001 = 100
130.0
122.5
115.0
107.5
100.0
92.5
85.0
May 2001 Aug. 2001 Nov. 2001 Feb. 2002 May 2002 Aug. 2002 Nov. 2002 Feb. 2003 May 2003
Raw materials
Food
Beverages
�
�
�
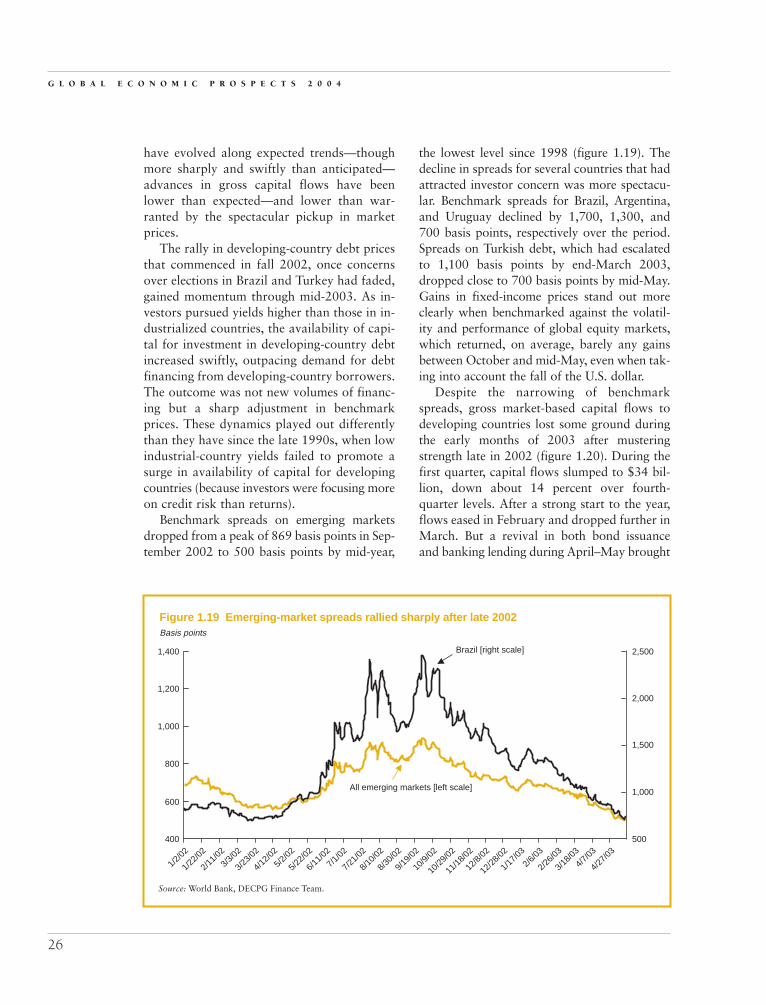
have evolved along expected trends—thoughmore sharply and swiftly than anticipated—advances in gross capital flows have beenlower than expected—and lower than war-ranted by the spectacular pickup in marketprices.
The rally in developing-country debt pricesthat commenced in fall 2002, once concernsover elections in Brazil and Turkey had faded,gained momentum through mid-2003. As in-vestors pursued yields higher than those in in-dustrialized countries, the availability of capi-tal for investment in developing-country debtincreased swiftly, outpacing demand for debtfinancing from developing-country borrowers.The outcome was not new volumes of financ-ing but a sharp adjustment in benchmarkprices. These dynamics played out differentlythan they have since the late 1990s, when lowindustrial-country yields failed to promote asurge in availability of capital for developingcountries (because investors were focusing moreon credit risk than returns).
Benchmark spreads on emerging marketsdropped from a peak of 869 basis points in Sep-tember 2002 to 500 basis points by mid-year,
the lowest level since 1998 (figure 1.19). Thedecline in spreads for several countries that hadattracted investor concern was more spectacu-lar. Benchmark spreads for Brazil, Argentina,and Uruguay declined by 1,700, 1,300, and700 basis points, respectively over the period.Spreads on Turkish debt, which had escalatedto 1,100 basis points by end-March 2003,dropped close to 700 basis points by mid-May.Gains in fixed-income prices stand out moreclearly when benchmarked against the volatil-ity and performance of global equity markets,which returned, on average, barely any gainsbetween October and mid-May, even when tak-ing into account the fall of the U.S. dollar.
Despite the narrowing of benchmarkspreads, gross market-based capital flows todeveloping countries lost some ground duringthe early months of 2003 after musteringstrength late in 2002 (figure 1.20). During thefirst quarter, capital flows slumped to $34 bil-lion, down about 14 percent over fourth-quarter levels. After a strong start to the year,flows eased in February and dropped further inMarch. But a revival in both bond issuance and banking lending during April–May brought
G L O B A L E C O N O M I C P R O S P E C T S 2 0 0 4
26
Figure 1.19 Emerging-market spreads rallied sharply after late 2002
Source: World Bank, DECPG Finance Team.
Basis points
�
�
1,400
1,200
1,000
800
600
400 500
1,000
1,500
2,000
2,500Brazil [right scale]
All emerging markets [left scale]
1/2/02
1/22/0
2
2/11/0
2
3/3/02
3/23/0
2
4/12/0
2
5/2/02
5/22/0
2
6/11/0
2
7/1/02
7/21/0
2
8/10/0
2
8/30/0
2
9/19/0
2
10/9/
02
10/29
/02
11/18
/02
12/8/
02
12/28
/02
1/17/0
3
2/6/03
2/26/0
3
3/18/0
3
4/7/03
4/27/0
3

flows to a rate of $40 billion, comparable to the patterns established during the secondquarter of 2002. The ups and downs in over-all capital flows were led by bond financing,which is sensitive to short-run developments. Anoteworthy feature in bond financing was theeasing of access for Latin American borrowerscompared with 2002. Brazil was able to cometo the market with a $1 billion issue after beingabsent for a year. However, the major portionof bond issuance from Latin America has beenaccounted for by investment-grade-rated coun-tries. Contrasted with 2002 outturns, bank lend-ing to developing countries has remained sub-dued, with monthly lending standing some 20percent below comparable 2002 levels, as banksof almost all domiciles have been slow in ex-tending credit to developing countries.
Market-based capital flows to developingcountries have so far performed below the es-timates set out for 2003 earlier this year, byabout $2 billion a month on average. The sub-dued response of capital flows to the strongperformance of asset prices can be traced toseveral factors: (a) uncertainty in the runup tothe Iraq war, (b) renewed concerns over thestrength of the economic recovery, and (c) in-
creased volatility in financial markets duringthe early months of 2003. Many borrowersavoided or postponed borrowing.
The demand for external debt financing bydeveloping countries remained limited, asmany (especially in East Asia) have learned tolive with less debt, while others are being keptin check even though financing conditionshave eased relative to 2002. Capital flowscould strengthen during the remainder of 2003.Borrowers may (a) take advantage of favorablefinancing conditions and move up their financ-ing targets; (b) establish benchmarks for thepurpose of setting favorable pricing in the fu-ture, or (c) undertake liability management,given the improvement in terms of borrow-ing over terms on previously contracted debt.Novel aspects of financing are already beingencouraged. Mexico arranged a $2 billionbank loan to retire some of its Brady debt. And bond issues with collective action clauseshave swiftly become more acceptable with rel-atively little or no premium. Mexico, Brazil,and South Africa issued bonds with suchclauses between March and April.
The stimulus to developing-country capitalflows from low industrial-country yields couldpersist over the short-to-medium terms, asyields in the G-3 countries are unlikely to risesharply and swiftly even if they do turn thecorner. Barring major fallout, investors maycontinue to grow less risk averse. Most of thevulnerabilities in emerging-market economiesand in high-yield industrial-country marketshave been exposed and have evolved throughchanges in market prices. Substantial falloutfrom the troubled Latin American borrowerswas largely avoided. Foreign exchange reservepositions of developing countries in generalare holding steady, and their dependency onexternal debt is falling. Vulnerability to ad-verse external shocks appears to have been re-duced from the high levels of the last twoyears, and flexible exchange rates have helpedin this area. And for several countries, themacroeconomic implications of accession tothe European Union have vastly improvedcredit risk perceptions.
G L O B A L O U T L O O K A N D T H E D E V E L O P I N G C O U N T R I E S
27
Figure 1.20 Bond issuance dominatescapital market flows in 2003Billions of dollars, monthly averages
Source: World Bank data.
02002 Q1 Q2 Q3 Q4 2003 Q1 April-
May
Bonds Banking
Equities
2
4
6
8
10
12
14
�
�
�

The developing countries: Back ontrack toward growth?
Developing countries appear poised forgrowth to resume at more rapid rates. De-
spite continuing geopolitical uncertainties andsubdued conditions in the rich countries atpresent, developments in several areas are con-verging to support the expectation of a step-upin output growth. Should conditions in theexternal environment improve as expected overthe next years, countries should have the op-portunity to advance export-market shares and grow export volumes at more robust rates.International financial markets have becomemore accessible to developing countries, andcompression of spreads has reduced the cost ofraising capital. International reserves haverisen to record proportions, especially in devel-oping East Asia, providing a degree of cush-ioning against potential vagaries in global fi-nancial markets.
Developing-country fundamentals are improvingOn the domestic front, fiscal positions havegenerally improved across developing regions,allowing a degree of stimulus to be undertakento bolster domestic demand, and prospectively,more can be achieved here. While industrialproduction supporting both external and inter-nal demand growth is currently mixed acrossregions, the seeds of firmer recovery appear tobe fairly widespread. Inflation is moderating,and this trend should be enhanced as the oilprice moves downward over the next years—and for several countries, currency apprecia-tion will abet improved inflation performance.Finally, recent political and financial difficul-ties in Latin America appear to have moder-ated, though uncertainties persist. In contrast,developments in the Middle East and NorthAfrica region (MENA) remain unsettled in theaftermath of conflict, and heightened uncer-tainty and risk aversion among exporters, in-vestors, and tourists is likely to affect growthfor the countries of the region for some time.
Recent trends in industrial production high-light the current mixed picture across key re-
gions, to a large degree, integrated with on-going global developments. For developingcountries as a group, output has recovered to 7percent year-over-year rates from troughs expe-rienced in early 2002 (figure 1.21a). TheMENA region, which accounts for some 9 per-cent of developing-country value added, has en-joyed a 15 percent surge in crude petroleumand other energy production, as OPEC mem-bers have exceeded quota levels in expectationof the loss of Iraqi output. In contrast, some un-derlying influences of SARS may be discernedin drooping production figures for the EastAsia and Pacific region (EAP), though otherfactors, including the slowdown of world tradeand poor conditions in high-tech markets, arelikely the more important elements at work.Latin America, meanwhile, is building on revi-talization of output in Argentina, and earlier in Brazil and Mexico, but activity in the lattercountries appears to have eased recently. Eu-rope and Central Asia (ECA) has benefitedfrom Turkey’s dramatic recovery from its fi-nancial crisis of 2001, while hydrocarbon ex-porters in the Commonwealth of IndependentStates (CIS), including Russia, have ramped upoil and gas production to fill part of the gap leftby loss of Iraqi crude oil. As some of the near-term distortions to production dissipate—therecovery now underway for low- and middle-income countries should firm and broaden overthe coming quarters and into 2004.
Inflation has moderated for developingcountries as a group, from recent peaks of 5.5percent as of mid-2001 toward a 3 percentyear-over-year pace at present (figure 1.21b).Improvement has been spearheaded by devel-opments in the EAP region, where tendenciestoward deflation in China (largely productiv-ity driven), and easing of price pressures inmost ASEAN countries have yielded a reduc-tion of 3 percentage points in annual inflation,from 5 toward 2 percent rates. And develop-ments in the ECA region have been quitepromising as well, with a 4 point fall in CPIover the like period, from 6 to 2 percent, re-flecting improvement in Turkey, Russia, andmany of the countries of Central Europe. In-
G L O B A L E C O N O M I C P R O S P E C T S 2 0 0 4
28

flation remains at moderate 3 percent rates in South Asia (SA), but has re-accelerated inLatin America and Sub-Saharan Africa, re-flecting earlier currency devaluations in theformer region, and adverse fiscal conditionsand large-scale currency decline in severallarge African states.
The fall of the dollar vis-à-vis partner cur-rencies has affected more than the cross-ratesfor the euro, yen, or sterling. Since October2002, the brunt of dollar depreciation hasfallen upon several Latin American currencies,importantly the Brazilian real and Argentinepeso (20–25 percent appreciation), reflecting
G L O B A L O U T L O O K A N D T H E D E V E L O P I N G C O U N T R I E S
29
Figure 1.21a Regional trends in industrial production are mixed
Sources: National agencies.
IP, 3-month/3-month, percent change, year/year
�
Jan.2000
Latin AmericaAll developing
Middle Eastand North Africa
Europe andCentral Asia
East Asia
April2000
July2000
Oct.2000
Jan.2001
April2001
July2001
Oct.2001
Jan.2002
April2002
Jan.2003
April2003
July2002
Oct.2002
�
�
�
16.0
12.0
8.0
4.0
0
–4.0
–8.0
�
Figure 1.21b Inflation is moderating in the developing world
Note: GDP weighted growth.Source: National Agencies.
Consumer price index, percent change, year/year
Jan.2000
5.5
4.5
3.5
2.5
1.5
April2000
July2000
Oct.2000
Jan.2001
April2001
July2001
Oct.2001
Jan.2002
Jan.2003
April2002
July2002
Oct.2002

in part strong rallies in financial markets inthose countries, along with sharply narrowingspreads on benchmark bonds and fixed-income funds (figure 1.21c). Several EastAsian currencies have also appreciated moremoderately against the U.S. unit—notably theThai baht and Korean won, while the Russianrouble has risen in like proportion. Currencyappreciation in Latin America is likely to de-liver mixed results: while serving to dampenexport prospects—an important vehicle foreconomic recovery—appreciation will help toreduce inflationary tendencies in both Ar-gentina and Brazil, providing room for neededinterest rate reductions and a stronger founda-tion for domestic growth.
Growth should pick up across regionsduring 2004–05Over the last years, GDP growth for the de-veloping and transition countries has under-gone dramatic shifts and suffered volatilityassociated with global business-cycle develop-ments, as during the recessions of the early1980s and 1990s. Several region-specific crises
and transformations also have induced sharpvariations in aggregate growth—among themthe Latin debt crisis of the early 1980s, theperiod of recession associated with transitionin the former COMECON countries duringthe early 1990s, the East Asian financial cri-sis of 1997–98, and the Russian devaluationof 1999 (figure 1.22). The global downturn of 2001 exacted a toll on developing coun-try growth, but the deceleration of output hasbeen much less dramatic than in earlierepisodes.
In the base-case projections, developing-country growth is expected to reaccelerate inall regions from the relatively sluggish perfor-mance of 2001–02 to an average GDP ad-vance of 4 percent during 2003, reachingabout 5 percent growth by 2004–05, consis-tent with previous peaks in 2000 and 1996–97(figure 1.22). Latin America is expected to seethe most substantial gain, as the region con-solidates following the Argentine crisis. A re-turn to stronger growth in India powers theSouth Asia region, while more moderate gainsare achieved in Europe and Central Asia—tracking the slower pace of revival in EU ac-tivity. The pickup in growth will be lower in the Middle East and North Africa, whereuncertainty regarding the regional politicaland economic situation is likely to persist, and in Sub-Saharan Africa, where only moderategains in commodity prices and sluggish Euro-pean growth play a role (figure 1.23).
SARS carries some adverse economicaffects for the East Asian economy The East Asia and Pacific region was able toovercome a retrenchment in world trade, asluggish high-tech sector, geopolitical uncer-tainty, and soaring oil prices in 2002 to registersolid 6.7 percent growth (figure 1.24). Chinaand Vietnam, at 8 percent and 6 percent re-spectively, were the engines of the regionaleconomy, as exports spilled over into domesticdemand and generated strong demands for in-termediate imports from other countries in theregion, including Korea, Thailand, Malaysia,and the Philippines. The main exceptions to the
G L O B A L E C O N O M I C P R O S P E C T S 2 0 0 4
30
Figure 1.21c Major currencies in LatinAmerica and East Asia are firming up
Source: Datastream.
–0
–5
–10
–15
–20
–25
Br Rea
l
Ar Pes
oEur
o C$
Sterlin
gYen
Baht
Rouble S$
K Won NT$
Dollar depreciation against major currencies sinceOctober 2002, percent change

buoyant performance were Hong Kong (China)and Singapore, which failed to capitalize onburgeoning intraregional trade, and Indonesia.
Growth in East Asia is expected to slow bymore than half a percent to 6.1 percent in
2003, in part because of the outbreak of SARScentered in China and Hong Kong. Accord-ing to favorable World Bank estimates, SARSmay subtract about 0.5 percent from regionalgrowth during 2003 through its effects ontravel, tourism, and domestic consumption andinvestment (box 1.4). Some countries are likelyto be more affected than others—because ofhigh tourism shares in GDP or their impor-tance as hubs of international trade. In HongKong (China) and Singapore, growth may dropby several percentage points from 2002 results.Meanwhile, growth in the Philippines is ex-pected to ease because of consolidation of gov-ernment finance, and Indonesia is vulnerable toa fall in confidence, especially in conjunctionwith high levels of household debt.
Though near-term prospects are muted,longer-term performance is expected to re-main strong. In 2004, growth is expected toreach 6.7 percent based on a quick contain-ment of the SARS epidemic, together with re-covery in industrial countries and an upturn inthe high-tech cycle. By 2005, the EAP region isexpected to return to a long-term trend rate ofoutput growth of around 6.5 percent.
G L O B A L O U T L O O K A N D T H E D E V E L O P I N G C O U N T R I E S
31
Figure 1.22 Developing countries are on track toward long-term growth
Source: World Bank data and projections.
GDP growth, percent per annum, 1981–2005
1
0
1990s recessiontransition countries
2001 globaldownturn
Early 1980sdebt crisis
Trend
East Asiafinancial crisis
2
3
4
5
1981
1982
1983
1984
1985
1986
1987
1988
1989
1990
1991
1992
1993
1994
1995
1996
1997
1998
1999
2000
2001
2002
2003
2004
2005
�
Figure 1.23 Growth rates in developingcountries will rise through 2005GDP growth, 2001–02 and 2003–05 (percent)
Source: World Bank Development Prospects Group.
All Developing
East Asia
Latin Americaand the Caribbean
Europe andCentral Asia
South Asia
Middle Eastand North Africa
Africa
2001–02
2003–05
–1 0 1 2 3 4 5 6 7
��

Latin America shows signs of renewed recoveryLatin America showed increasing evidence of a recovery during 2003, after growth fell to–0.8 percent in 2002. In fact, the negativegrowth performance for 2002 results exclu-sively from severe contractions in Argentina,Uruguay, and Venezuela; and a regional aver-age excluding these countries registers positivegrowth of 1.6 percent, underscoring that con-tagion had been limited. Industrial productionreturned to positive growth during the fourthquarter of 2002, up 5.6 percent, underpinnedby gains in Argentina, Chile, and Brazil (figure1.25). Falling yield spreads confirmed the im-pression of an improvement in financial health.In Brazil, for example, spreads declined from apeak of 2,067 basis points in October 2002 to 754 basis points by April 2003, as risk aver-sion eased among global investors. Thoughcapital flows, especially bank lending, to LatinAmerica and the Caribbean remain weak, thestrengthening of several local currencies againstthe dollar (Argentine peso, Brazilian real,Chilean and Mexican pesos) has occurred in
parallel with improving investor sentiment re-garding local equity and fixed-income markets.Though still dependent on an accommodatingexternal environment, threats of financialcrises and attendant spillovers appear to havereceded.
In Brazil, President Lula da Silva’s commit-ment to balanced macroeconomic policies hashelped to restore confidence, and has alreadyfacilitated access to international finance, whileadditional support from the InternationalMonetary Fund should be forthcoming. Mean-while, rising consumer confidence and recedingunemployment in Argentina indicate a growingconsensus that the worst may be over. Yet in-flation risks persist, and the credibility of eco-nomic policy will need to be established by thenew president. Both countries continue to facethe challenges of supporting growth in the con-text of tight constraints to fiscal and monetarypolicy. In contrast, the Republica Bolivarianade Venezuela restarted its oil exports followinga strike-induced shut-in lasting some 60 days.But, there the political crisis appears to beunresolved and macroeconomic performancecontinues to suffer, with GDP declining by 9percent in 2002 and forecasted to fall 14 per-cent for 2003. Peru’s performance has been re-markable for 2002 and prospects for 2003 arestill favorable, but recent political turmoil willpotentially be a drag on growth and raise pub-lic deficits. Recent political unrest in Boliviaalso had damaging repercussions, and in theDominican Republic a massive bank fraud trig-gered the collapse of the second-largest finan-cial institution, with potentially heavy financialand economic costs.
Given the extent of recent difficulties andremaining uncertainties, near-term growthprospects remain subdued. However, thelonger-term outlook is more optimistic. Multi-lateral trade agreements and regional market-opening initiatives in the European Union (EU)and U.S. markets bode well for external per-formance. Exports are diversifying into areassuch as tourism and other services. Macro-economic stability and commitment to sound
G L O B A L E C O N O M I C P R O S P E C T S 2 0 0 4
32
Figure 1.24 Before the SARS outbreak,East Asian* GDP was growing robustlyGDP growth, percent change, Q/Q saar
*Indonesia, Malaysia, Philippines, and Thailand.Source: Aggregation from national agencies.
9.0
6.0
3.0
0.0
2001
Q1
2001
Q2
2001
Q3
2001
Q4
2002
Q1
2002
Q2
2002
Q3
2002
Q4

G L O B A L O U T L O O K A N D T H E D E V E L O P I N G C O U N T R I E S
33
While the threat of Severe Acute RespiratorySyndrome (SARS)—a virus that spreads easily
and has no known antidote—has shaken China,Canada, and the world at large, the spread of theoutbreak has stopped and public panic has largelysubsided. The outbreak seems to have been broughtunder control as a result of stringent public healthmeasures in the affected countries, though there mayalso be a seasonal component to the disease. The eco-nomic impact should thus be concentrated in the sec-ond quarter of 2003, and is expected to be largelylimited to the East Asia region, with a relatively smallimpact on global growth. As of end-June 2003, it isestimated that SARS had infected 8,450 people in 32countries and to have killed over 800 people.
Short-term economic activity—particularly in‘face-to-face’ exchanges such as in the retail sector—slowed in the most affected countries. Overall, theeconomic impact was largely transmitted through ag-gregate demand, but also to a lesser extent throughsupply mechanisms. Tourism and trade-related ser-vices declined as people became less willing to travel
Box 1.4 Economic effects of Severe Acute RespiratorySyndrome (SARS)
to areas where there were SARS outbreaks. The air-line industry was hit especially hard, as the SARSvirus came at an already difficult time, following theSeptember 11 attack and the war in Iraq, which al-ready diminished vacation travel, in particular, butalso corporate travel, given sluggish world growth.Manufacturing trade was also affected. Internationalfirms with production lines in affected countries suf-fered some interruptions to production because ofrestrictions on travel. Some (temporary) substitutionsmay have been made; however, sustained losses inmarket share are unlikely. Finally, the SARS outbreaktemporarily depressed consumer and business confi-dence in the countries most affected, but contain-ment of the outbreak should result in a quick returnto pre-SARS confidence levels. The macroeconomicpolicy response to the outbreak is expected to bemost evident in increased fiscal outlays throughtransfers and tax breaks, in addition to increasedhealth care expenditures to respond to the outbreak.
Source: World Bank staff.
Figure 1.25 Argentina, Brazil, and Chile see strong upturn in production
Sources: National agencies.
IP, 3-month/3-month, percentage change, year/year
�
�
�
�
Chile
Brazil
�
Venezuela [right scale]
Argentina [right scale]
Latin America
–5
0
5
10
15
–25
–20
–15
–10
–5
0
5
10
15
2000 Q2 2000 Q4 2001 Q2 2001 Q4 2002 Q2 2002 Q4 2003 Q2
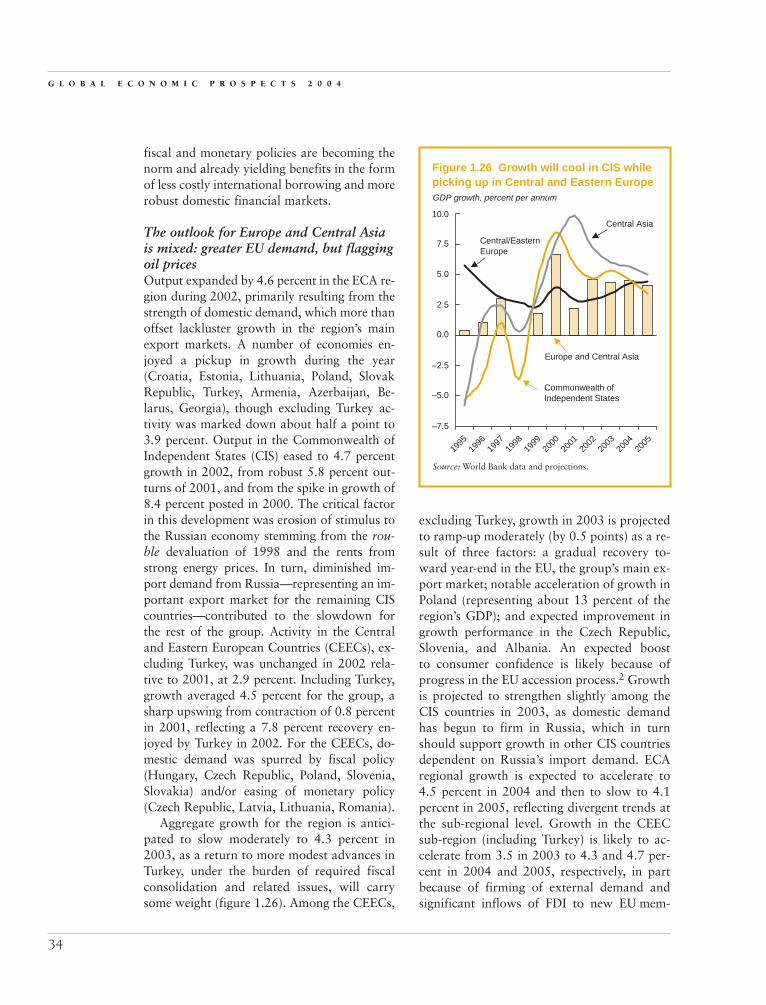
fiscal and monetary policies are becoming thenorm and already yielding benefits in the formof less costly international borrowing and morerobust domestic financial markets.
The outlook for Europe and Central Asiais mixed: greater EU demand, but flaggingoil pricesOutput expanded by 4.6 percent in the ECA re-gion during 2002, primarily resulting from thestrength of domestic demand, which more thanoffset lackluster growth in the region’s mainexport markets. A number of economies en-joyed a pickup in growth during the year(Croatia, Estonia, Lithuania, Poland, SlovakRepublic, Turkey, Armenia, Azerbaijan, Be-larus, Georgia), though excluding Turkey ac-tivity was marked down about half a point to3.9 percent. Output in the Commonwealth ofIndependent States (CIS) eased to 4.7 percentgrowth in 2002, from robust 5.8 percent out-turns of 2001, and from the spike in growth of8.4 percent posted in 2000. The critical factorin this development was erosion of stimulus tothe Russian economy stemming from the rou-ble devaluation of 1998 and the rents fromstrong energy prices. In turn, diminished im-port demand from Russia—representing an im-portant export market for the remaining CIScountries—contributed to the slowdown forthe rest of the group. Activity in the Centraland Eastern European Countries (CEECs), ex-cluding Turkey, was unchanged in 2002 rela-tive to 2001, at 2.9 percent. Including Turkey,growth averaged 4.5 percent for the group, asharp upswing from contraction of 0.8 percentin 2001, reflecting a 7.8 percent recovery en-joyed by Turkey in 2002. For the CEECs, do-mestic demand was spurred by fiscal policy(Hungary, Czech Republic, Poland, Slovenia,Slovakia) and/or easing of monetary policy(Czech Republic, Latvia, Lithuania, Romania).
Aggregate growth for the region is antici-pated to slow moderately to 4.3 percent in2003, as a return to more modest advances inTurkey, under the burden of required fiscalconsolidation and related issues, will carrysome weight (figure 1.26). Among the CEECs,
excluding Turkey, growth in 2003 is projectedto ramp-up moderately (by 0.5 points) as a re-sult of three factors: a gradual recovery to-ward year-end in the EU, the group’s main ex-port market; notable acceleration of growth inPoland (representing about 13 percent of theregion’s GDP); and expected improvement ingrowth performance in the Czech Republic,Slovenia, and Albania. An expected boost to consumer confidence is likely because ofprogress in the EU accession process.2 Growthis projected to strengthen slightly among theCIS countries in 2003, as domestic demandhas begun to firm in Russia, which in turnshould support growth in other CIS countriesdependent on Russia’s import demand. ECAregional growth is expected to accelerate to4.5 percent in 2004 and then to slow to 4.1percent in 2005, reflecting divergent trends atthe sub-regional level. Growth in the CEECsub-region (including Turkey) is likely to ac-celerate from 3.5 in 2003 to 4.3 and 4.7 per-cent in 2004 and 2005, respectively, in partbecause of firming of external demand andsignificant inflows of FDI to new EU mem-
G L O B A L E C O N O M I C P R O S P E C T S 2 0 0 4
34
Central/EasternEurope
Europe and Central Asia
Commonwealth ofIndependent States
Central Asia
�
�
�
�
Figure 1.26 Growth will cool in CIS whilepicking up in Central and Eastern EuropeGDP growth, percent per annum
Source: World Bank data and projections.
10.0
7.5
5.0
2.5
0.0
–2.5
–5.0
–7.5
1995
1996
1997
1998
1999
2000
2001
2002
2003
2004
2005

bers, in addition to EU transfers. Growth islikely to slow in the CIS from 5.3 percent in 2003 to 4.6 and 3.4 percent in 2004 and2005, respectively, assuming a substantial fallin the oil price in both 2004 and 2005 and adecline in growth impetus through fiscal link-ages, especially in Russia.
The war in Iraq and its aftermath are the key factors for the Middle Eastand North Africa regionThe buildup to the war in Iraq and its after-math have dominated events in the Middle East and North Africa region over the pastyear. The developments were, on balance, pos-itive for oil exporters. The oil price surged,peaking at $38/bbl, and production quotaswere raised in early 2003 (figure 1.27). Buoy-ant oil revenues boosted economic perfor-mance by supporting higher fiscal expendi-tures. Elsewhere in the region, however,tourism and trade, not fully recovered from theeffects of September 11, 2001, were furtherbattered by the prospect of conflict in Iraq. Themost affected countries were those closest tothe conflict. Tourism in Jordan and Egypt wasseriously affected; for Jordan, where tourismaccounts for some 10 percent of GDP, the con-
sequences were particularly adverse. For Egypt,lower non-oil trade also affected revenues fromthe Suez Canal.
Short-term prospects for the region will beconditioned by political resolution in post-conflict Iraq. Uncertainties over the future ofthe country, with respect to governance, aidflows, and reconstruction, will continue to af-fect the region for some time. Nevertheless,growth should accelerate somewhat during2003. The oil-exporting countries are expectedto grow more quickly in 2003 as a result offiscal pump priming and increased oil pro-duction quotas. For the diversified exporters,particularly Jordan and Egypt, a gradual re-covery in tourism and other sectors affected bythe conflict could unfold in the second half of 2003, but such recovery would be fragile.Other factors, not directly associated with re-cent developments in Iraq, will shape the near-term outlook. Egypt is suffering from a periodof extended weakness in the domestic sector,and despite reforms to the exchange rate re-gime earlier in 2003, growth expectations forthe year have dimmed as private investmentremains subdued. Moroccan agriculture willprovide a substantial boost to output in 2003following the severe drought in that country. A
G L O B A L O U T L O O K A N D T H E D E V E L O P I N G C O U N T R I E S
35
Figure 1.27 Middle East oil production has increased to prevent shortages
Source: World Bank data.
Oil prices, and production three-month moving average, percent change, year/year
30 32
30
28
26
24
22
20
18
25
20
15
10
5
0
–5
–10
–15
Jan. 2000 June 2000 Nov. 2000 April 2001 Sept. 2001 Feb. 2002 July 2002 Dec. 2002 May 2003
�
�
�
Saudi Arabia production[left scale]
Algeria production[left scale]
Oil price, 3mma [right scale]

similar situation exists in Tunisia, where agri-cultural output fell by an estimated 11 percentduring 2002.
The economic consequences of the conflictin Iraq will play out through its impacts onconfidence and investment spending. A pro-tracted process of reconstruction could exac-erbate these problems. A downward trend inthe oil price presents a further risk. With slug-gish growth in world demand, oil prices couldtrend lower than anticipated, cutting ex-porters’ incomes and putting fiscal expendi-ture programs at risk. Moreover, further polit-ical instability in the tense environs of theregion cannot be ruled out, a developmentthat would hamper investment and growth foran extended period of time.
A stronger external environment, upswingin agricultural cycle, should boost SouthAsian growthGrowth in the South Asia region slowed to 4.2percent during 2002 from 4.9 percent in 2001,marking a downward revision from previousestimates, largely because of adverse weatherconditions and declines in agricultural outputin India, Bangladesh, and Nepal. Nepal experi-enced a plunge in tourism receipts and a sharpfall in manufacturing output, as domestic in-surgency intensified. Pakistan and Sri Lankaboth enjoyed a pickup in growth during theyear linked to strong government spending inPakistan; and for Sri Lanka, a recovery in theservices sector and improved political stabilitytied to progress in peace talks and implemen-tation of a year-long cease-fire. Current ac-count balances for the two largest economies,India and Pakistan, posted surpluses and the re-gion’s aggregate external balance strengthened.A number of economies experienced a signifi-cant increase in remittances during 2002.These were driven largely by: incentives intro-duced by the Bangladeshi government to chan-nel remittances through official sources; highinterest rate differentials in India—reflectingsignificant government borrowing require-ments there; and improvements in the security
situation and progress in macroeconomic sta-bilization in both Pakistan and Sri Lanka.
Growth is anticipated to accelerate through-out the region in 2003, to an average of 5.4percent, assuming a return to trend agriculturalproduction, a recovery in external demand,continued improvement in political stabilityand regional security, and a firming of domes-tic demand, especially in India (figure 1.28). Inthe medium term South Asian growth is likelyto be sustained near 5.4 percent, assuming acontinued recovery in external demand and es-tablishment of normal trends in agriculturaloutput. Bangladesh and India should benefitfrom an ongoing recovery in domestic demand.Both Pakistan and Sri Lanka are projected toenjoy continued macroeconomic stability andan associated acceleration of growth. Similarly,Nepal is anticipated to experience a pick-up in growth, assuming continued improvement in the security situation there, with a recovery indomestic demand and in tourism receipts.
Furthermore, recently improved relationsbetween India and Pakistan are hoped to leadto greater stability in the region, paving theway for increased business confidence and sta-bility. The fiscal positions of the South Asianeconomies are forecast to improve moderately,assuming some progress in raising budget rev-enues (as a share of GDP) and improvement inthe management of government expenditure.Inflation is projected to increase somewhat, al-beit still at moderate levels, because of strongergrowth and assumptions of a more accom-modative monetary stance in many countries.Falling oil prices are expected to provide someoffset to these domestic factors.
Sub-Saharan Africa maintains positive per capita growth in spite of a difficultexternal environmentA subdued world economy together with famil-iar problems of drought and civil strife heldgrowth in Sub-Saharan Africa (SSA) to 2.8 per-cent in 2002. Import demand from Europe, theregion’s main trading partner, was particularlyweak. Though most (dollar denominated) com-
G L O B A L E C O N O M I C P R O S P E C T S 2 0 0 4
36

modity prices have rebounded from recentlows, terms of trade for non-oil exporters haverecovered little of their losses of the past fewyears. At the same time, travel and tourism suf-fered not only from slower world incomegrowth, but also from terrorist fears and thebuildup to war in Iraq. As a result, foreign trademade a negative contribution to the region’sgrowth. Domestic economies also slowed aspoor weather or civil disorder disrupted agri-cultural production in countries containingover half the region’s population, depressing in-comes and demand. Notably, though, invest-ment spending was relatively resilient. Therewere pluses to note as well. South Africa over-came the depressed tourism market to becomethe world’s fastest growing tourist destinationin 2002, with arrivals up over 20 percent. Non-traditional exports covered by AGOA prefer-ences—transportation equipment, textiles andapparel, and agricultural products—registeredstrong growth despite the slowdown in the U.S.economy, indicating that with the right incen-tives and opportunities, SSA countries can becompetitive. Most encouraging of all, according
to preliminary estimates 12 countries in the re-gion achieved growth of 4 percent or better andaverage per capita income rose for a fourth suc-cessive year—the longest sustained rise in overtwo decades.
The region’s largest economy, South Africa,registered relatively sound performances dur-ing 2002. Growth slowed toward the end ofthe year, but remained in positive territory as it has since 1999. Because of the increasingstrength of the rand, foreign trade contributednegatively to growth, but domestic absorption was strong enough to offset that impact andgrowth overall reached 3.0 percent. Invest-ment was particularly strong, up 6.5 percent inspite of high real interest rates. In Nigeria, thepicture was mixed. The successful presidentialelection helped cement the fledgling demo-cratic process; however, progress on fiscal andeconomic reforms continues to be frustratinglyslow. Despite high oil prices, budget grid-lock and a reduced OPEC quota held growthto only 1.9 percent. Progressively weaker oilprices over the next few years will put pressureon fiscal and external accounts, though expan-
G L O B A L O U T L O O K A N D T H E D E V E L O P I N G C O U N T R I E S
37
Figure 1.28 Indian production of food and automobiles recovered sharply in early 2003Industrial production, 3-month/3-month, percent change, year/year
Sources: Feri and national sources.
�
�
Transport equipFood
Total production
24
20
16
12
8
4
0
–4
–8
Jan.2000
April2000
July2000
Oct.2000
Jan.2001
April2001
July2001
Oct.2001
Jan.2002
April2002
Jan.2003
April2003
July2002
Oct.2002

sion of the energy sector, especially of liquidnatural gas (LNG), should sustain moderatereal growth in the medium term.
In the medium term, the economic perfor-mance of Sub-Saharan Africa should benefit asthe global recovery consolidates. Yet, with ex-pectations for Europe at best moderate, the ex-ternal impetus to growth will remain weak. Forthe region as a whole, growth is expected to re-main unchanged at 2.8 percent in 2003, thenrise to 3.5 percent in 2004. Both oil and non-oilproducers will share in the acceleration. For oilproducers—including additions to the list suchas Côte d’Ivoire—rising capacity presages sub-stantial growth in medium-term productionand exports, even though prices and terms oftrade are expected to fall sharply. Major energy-related infrastructure projects will further sup-port demand. For the rest of the region, the re-cent rebound in commodity prices has largelyrun its course, but at least the expectation is fora measure of stability in key export markets atlevels where exporters in Sub-Saharan Africacan continue to compete. With luck, betterweather conditions will stimulate domestic in-comes and expenditure as well (figure 1.29).
In the longer term, per capita growth is ex-pected to average 1.6 percent—a substantialimprovement on long-run historical trends,though barely half what would be needed toachieve the MDGs. The region continues toface immense development challenges fromHIV/AIDS, to low savings and investment, poorinfrastructure, shortages of human capital, andnegative perceptions of international investors(box 1.5). Nor does the forecast anticipate any significant help from a reversal of recentterms of trade losses. But the region’s most crit-ical need is to re-establish civil order, wherelacking, and to raise standards of governanceand policymaking, for these are the most pow-erful predictors of economic performance.Here there is encouraging progress to report,with signs of institutional strengthening atboth the country and regional levels. On bal-ance, assuming a continuation of this trend,the forecast of positive, albeit moderategrowth for the region should be achievable.
Trade, growth, and poverty in developing countries
World trade growth reached unprece-dented levels in the 1990s, accompanied
by accelerating flows of foreign direct invest-ment (FDI). The sectoral and regional compo-sition of trade changed dramatically with thespectacular growth of export volumes. Whilenatural resource–based commodities—agricul-ture, oil and gas, minerals—were driving fac-tors in developing countries’ export growth inthe past, more recent trade growth has beendriven largely by manufactured goods—high-tech products as well as low-skill-intensivegoods. These trends have led to stronger eco-nomic growth in many countries and signifi-cant reductions in global poverty.
Can these trends be sustained over the next10–15 years? And can they be broadened to in-clude countries that have not benefited fromtrade growth, but have very large proportionsof poor people? The answer to both questions is“probably.” The long-term forecast anticipatesthat the MDG of halving the number of theworld’s people living in extreme poverty will bereached by 2015. Nonetheless, significant pock-ets of poverty will persist, and the goal will notbe achieved in all developing regions.
G L O B A L E C O N O M I C P R O S P E C T S 2 0 0 4
38
Figure 1.29 Growth in Africa is expectedto improve modestlyGDP growth, 2001–02 and 2003–05
Note: RSA is Republic of South Africa.Source: DECPG.
Sub-SaharanAfrica
East/SouthRSA
WestNigeria
CFAcountries
Oilexporters
RSA andNigeria
0
2001–022003–05
1 2 3 4

G L O B A L O U T L O O K A N D T H E D E V E L O P I N G C O U N T R I E S
39
Sub-Saharan Africa continues to be the epicenter ofthe AIDS epidemic. According to UNAIDS, 28.5
million Africans were infected in 2001 and 2.2 mil-lion died, lowering population growth by one-thirdof a percentage point. Given social and financial hur-dles, treatment and care programs are likely to haveat best a modest impact on the course of the epi-demic. UNAIDS predicts 55 million deaths attribut-able to AIDS in Africa between 2000 and 2015 (UNAIDS 2002).
Although effective antiretroviral therapies havebeen developed, they are not in widespread use. Partof the explanation is cost. Providing these drugs tothe entire infected population of Sub-Saharan Africawould cost nearly $9 billion, about 70 percent ofcurrent official development assistance to the region.Nevertheless, it can be argued that such an expendi-ture, equivalent to just 0.04 percent of OECD GDP,would be cost effective from a development stand-point, by alleviating the burden on health-care sys-tems and raising productivity (Moatti and others2002). While more money is becoming available, itremains only a fraction of what is needed.
In addition to the financial obstacles to treat-ment, there is a deadly culture of denial to be over-come. In Botswana, the most afflicted country in theregion, the incidence rate in the adult population isnear 40 percent and life expectancy has droppedfrom more than 65 to less than 40. Yet a $100 mil-lion partnership between the Bill and Melinda GatesFoundation and Merck to provide free antiretroviralsto all who need them has, so far, achieved only lim-ited success. Less than 5 percent of Botswanans havebeen tested for HIV, and fewer than 0.1 percent ofthose thought to be infected are enrolled for freetreatment.
Many researchers have explored the economicsof HIV/AIDS using macroeconometric and CGEmodels. The magnitudes of impact appear surpris-ingly small, seemingly out of proportion to thehuman tragedy. From a macroeconomic standpoint,impacts of HIV/AIDS arise from:
Box 1.5 AIDS is taking a rising toll in Sub-Saharan Africa
• Slower labor-force growth and a higher proportionof younger, less-skilled, and less productive workers
• Lower productivity because of illness or worry onthe job, or more time off work
• Higher costs to governments and employers ofhealth care, training, and sick pay
• Reduced household savings after payments fortreatment or funerals, and, simultaneously, lesspublic and private investment because of financingconstraints, uncertainty, and lower expectedprofits.
Quantifying these channels is not straight-forward, but the preponderance of results suggestsan overall reduction of per capita growth somewherebetween 0.5 and 1 percentage point. This reductionis a significant cost to a region where long-termgrowth lies in the 0.8 to 1.6 percent per capita range, and it underscores Greener’s point (2002) that economic policy is important so that bettereconomic performance can offset the enormousdevastation.
HIV/AIDS has major implications for publicfinance and the provision of health services. Evenwithout the epidemic, African public health bud-gets, which average $50 per capita, would bewoefully inadequate. In addition, the disease mayhave major, though not well studied, implications for income distribution. An individual household iseither affected or not; and for those vulnerable tobeing tipped into poverty by the loss of one or morebreadwinners, the effect can be tragic. The threatposed by large numbers of homeless, uneducated,angry youths with no parents and no prospects may,in the long run, turn out to be the greatest cost of the epidemic.
Sources: Greener (2002), Moatti et al. (2002).

Trade performance over the 1990s was unprecedented From several points of view, trade perfor-mance during the 1990s was unprecedented.The overall volume of trade accelerated rela-tive to output, growing nearly 2.5 times fasterthan GDP, compared to an historical averageof 1.5. Such increase in income elasticity wasa global phenomenon, although it was clearlymore pronounced in developing countries,which had experienced a sharp fall in tradeduring the debt crises of the 1980s, and asharp boom just before the financial crises of1997 and 1998 (figure 1.30).
The robustness of the recent trade expan-sion was highlighted following the East Asianfinancial collapse. Trade flows recovered fromthat crisis much more quickly than they didafter the Latin American debt crises of theearly 1980s. During the 1990s, developingcountries’ merchandise exports increased atan annual rate of 8.5 percent, up from growthtrends of less than 2 percent during the 1980s.Despite the financial crisis of 1997, exportsfrom East Asia increased on average by 13.4percent per year during the decade, almostdoubling the strong performance of the 1980s.
Within a decade export revenues in develop-ing countries rose from less than 15 percent ofGDP to almost 25 percent (figure 1.31).
The change in the composition of exportswas a major factor underpinning growthMore remarkable than the overall growth oftrade was the transformation in the productmix of exports. Developing countries now relyless on shipments of primary commodities thanon manufactured goods. Whereas two decadesago developing countries derived 70 percent ofmerchandise export revenue from sales of pri-mary commodities—agriculture and energy—the situation is now completely reversed, with80 percent of revenue coming from exports ofmanufactures. Even exports from Sub-SaharanAfrica are no longer primarily resource-based,as the share of manufactures in African exportshas risen from 25 percent during the late 1970sto 56 percent today. Almost all of the increasewas realized during the last decade.
With the rising share of manufactures intotal exports, underlying high growth rates inmost manufacturing sectors have an increas-ingly large impact on overall export growth.The shift toward manufacturing clarifies some
G L O B A L E C O N O M I C P R O S P E C T S 2 0 0 4
40
Figure 1.30 Income elasticity has risen globally, but particularly in the developing worldTrade to GDP elasticity by region, 1967–2001
–2
1967
1970
1973
1976
1979
1982
1985
1988
1991
1994
1997
2000
–1
0
1
2
3
4
�
�
�
World total
Industrial countries
Developing countries
Source: World Bank data.

of the regional differences in overall trade per-formance—growth has been fastest where theshare of manufactured products in total ex-ports was already large—and suggests that theacceleration of overall trade growth was not atemporary phenomenon, as the share of man-ufactured products is likely to increase further.
To illustrate the importance of the exportmix, annual growth of export revenue duringthe 1990s for East Asia and Sub-SaharanAfrica are calculated with different sectoralweights, while using actual growth rates at asectoral level. Merchandise export revenue inSub-Saharan Africa advanced at an annualrate of 5.4 percent during the 1990s. How-ever, if the region had already reached the ma-turity of East Asia, with a significantly largershare of manufactures in total exports, thesame sectoral growth rates—double digit formanufacturing and small for natural re-sources—would have led to 10.6 percent over-all revenue growth. Alternatively, applyingEast Asian growth rates to Sub-Saharan shareswould have led to 10 percent growth, insteadof the 17 percent annual growth actually real-ized. This suggests that roughly half of thedifference in overall growth between the two
regions was due to differences in sectoralgrowth rates, the other half to the larger shareof manufactures in East Asia.
Such compositional effect will continue toinfluence overall growth numbers during thecoming decade as the share of manufacturedproducts rises further. Should all developingcountries achieve the same growth of exportrevenue at a sector level as during the 1990s,overall revenue growth would rise to 20 per-cent per year, instead of the 11 percent real-ized annually during the 1990s. The composi-tion effect of 9 percent a year applies to mostregions, with regional effects ranging from 5.1percent in Latin America to 10.6 percent inEurope and Central Asia.
Changes in the composition of trade canbe traced to several factors What accounts for the growth in manufac-tured exports? Will trade continue to grow atsuch robust rates? The driving forces are acombination of policy reforms, structuralchange in global production processes, andgeneral economic trends related to continuousincreases in real per capita incomes. The con-tribution of these various forces cannot be de-composed in a linear fashion, because some aretightly linked with others. However, becausethe strong links work in a virtuous circle, it islikely that the combined effects evident in cur-rent trends will continue into the coming years.
Policy reforms began in the 1970s in EastAsia. They were later initiated in other regions,culminating in a rapid acceleration of reformsduring the 1990s. A key element of the policychange was lowering of trade barriers in man-ufacturing—unilaterally, regionally, and multi-laterally. But in all successful cases, change wasembedded in broader domestic institutionalreforms. Technological progress lowered trans-portation costs, improved communications andbusiness practices, and made it possible tobuild global production networks. The lastchange radically altered geographic specializa-tion patterns and intensified trade in interme-diate products. Income growth triggered con-sumers’ desire for more and newer varieties of
G L O B A L O U T L O O K A N D T H E D E V E L O P I N G C O U N T R I E S
41
Figure 1.31 Export-to-GDP ratios haverisen sharply in developing countriesMerchandise exports, percent of GDP, 1980–2002
Source: World Bank data.
25.0
22.5
20.0
17.5
15.0
12.5
10.0
1980
1982
1984
1986
1988
1990
1992
1994
1996
1998
2000
2002
High-income countries
Developing countries
�
�
goods, creating markets for foreign products.These factors reinforced one another: Lowertrade barriers triggered a new, global organi-zation of production to take advantage of di-versity in comparative advantage across theworld. Desire for new products and a searchfor new markets provided a strong incentivefor lower trade barriers. And importantly, tech-nological progress and income growth werespurred by increased global competition andefficiency gains through global networks.
The decline in manufactures trade pricesrelative to domestic price deflators is a clearindicator of strong productivity growth insectors operating on global markets. Prices ofmerchandise exports from high-income coun-tries fell by almost 2 percent per year relativeto domestic prices. This marked a significantacceleration of the price differential comparedto the 1980s, when relative export prices fell 1 percent per year. A similar indication of ac-celerating productivity growth in sectors pro-ducing for global markets was observable inEast Asia, where exports were already heavilyconcentrated in manufactures. In that regionthe price differential changed almost 2 per-centage points during the 1990s. Though forother developing regions price trends aremixed—partly because of different specializa-tion patterns, partly because of imperfectionsin domestic-factor markets—an accelerationof productivity growth in manufacturing sec-tors that compete in global markets appears tobe a worldwide phenomenon.
While there are several key factors drivingthe changes in trade, there is no doubt that thesustained dismantling of trade barriers has beena primary driver. For example, the growth ofproduction networks and their association withtrade growth would not have been possible iftrade barriers had remained high. Expandingthe benefits of trade to a broader range of coun-tries will require significant further decline intrade barriers, particularly for those commodi-ties in which poor countries have a comparativeadvantage—agriculture and low-skill-intensivemanufacturing. While expanding market accessis not a sufficient condition to catalyze the
economies of poor countries, it is a necessarycondition to be able to justify indispensable in-vestments—in public and private infrastructureand education—to enable these economies totake off. The Doha Round will be a key com-plement to other more limited efforts to reducetrade barriers, for example, regional free tradeagreements and unilateral reform efforts.
Greater trade will build on ongoingreforms to spur per capita growth in all regionsIntensified trade relations have laid the foun-dations for continuation of a virtuous circle inwhich access to new markets, increased com-petition, and productivity growth reinforceeach other. Such an upward spiral would ac-celerate per capita income growth in many de-veloping countries, especially those in whichthe effect of reforms is visible in certain sec-tors—even if not yet on an aggregate level. Ascompetitive manufacturing sectors grow andreforms spread further, the results will becomeevident in economic figures over the next 10years (table 1.5). The growing reliance onmanufacturing will also reduce vulnerabilityto sharp and disruptive commodity cycles.
The impact of industrialization on produc-tivity is reflected, for example, in the sharpacceleration of per capita income growth inSub-Saharan Africa, from annual decline of 0.2percent during the 1990s to an increase of 1.6percent per year during the coming years. Onthe other hand, countries that, over the lastdecades, have experienced a rapid catching-upin productivity as a result of integration inglobal markets are bound to experience someslowdown, as the gap with the technologicalfrontier narrows in some sectors. However,East Asia is still anticipated to outperformother regions, with average per capita incomegrowth of 5.4 percent—lower than the 6.4 per-cent growth achieved during the 1990s.
As these fundamental structural shifts pro-mote development, other conditions acrosscountries are improving. Reduced imbalancesin the external and internal accounts of devel-oping countries have lowered their vulnerabil-
G L O B A L E C O N O M I C P R O S P E C T S 2 0 0 4
42
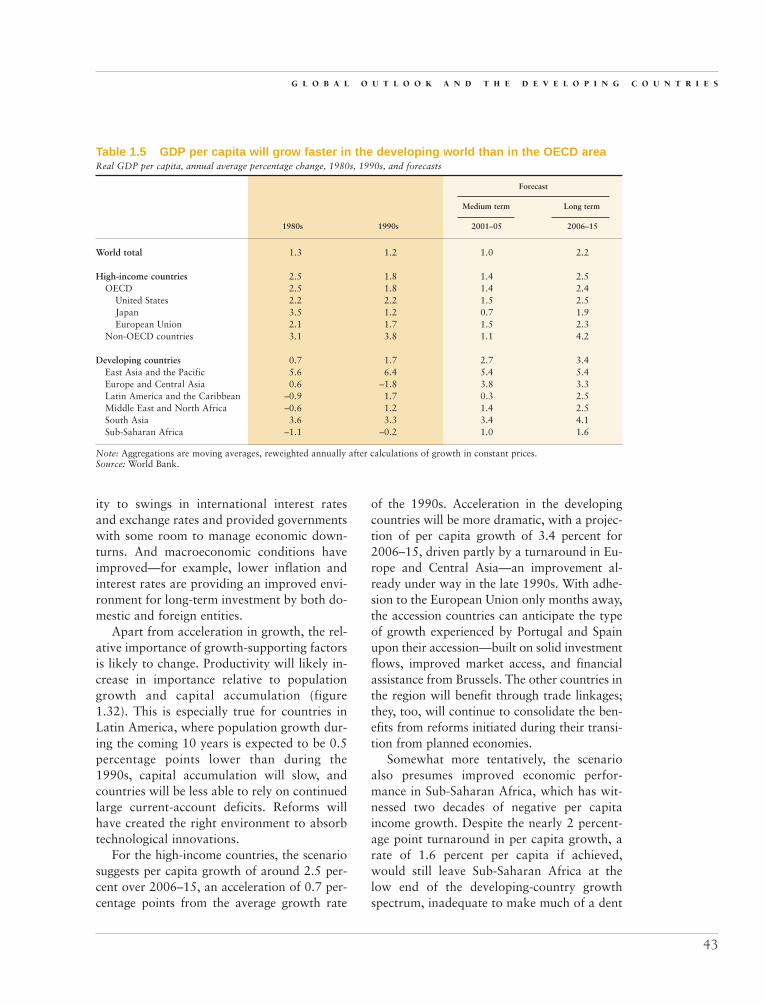
ity to swings in international interest rates and exchange rates and provided governmentswith some room to manage economic down-turns. And macroeconomic conditions haveimproved—for example, lower inflation andinterest rates are providing an improved envi-ronment for long-term investment by both do-mestic and foreign entities.
Apart from acceleration in growth, the rel-ative importance of growth-supporting factorsis likely to change. Productivity will likely in-crease in importance relative to populationgrowth and capital accumulation (figure1.32). This is especially true for countries inLatin America, where population growth dur-ing the coming 10 years is expected to be 0.5percentage points lower than during the1990s, capital accumulation will slow, andcountries will be less able to rely on continuedlarge current-account deficits. Reforms willhave created the right environment to absorbtechnological innovations.
For the high-income countries, the scenariosuggests per capita growth of around 2.5 per-cent over 2006–15, an acceleration of 0.7 per-centage points from the average growth rate
of the 1990s. Acceleration in the developingcountries will be more dramatic, with a projec-tion of per capita growth of 3.4 percent for2006–15, driven partly by a turnaround in Eu-rope and Central Asia—an improvement al-ready under way in the late 1990s. With adhe-sion to the European Union only months away,the accession countries can anticipate the typeof growth experienced by Portugal and Spainupon their accession—built on solid investmentflows, improved market access, and financialassistance from Brussels. The other countries inthe region will benefit through trade linkages;they, too, will continue to consolidate the ben-efits from reforms initiated during their transi-tion from planned economies.
Somewhat more tentatively, the scenarioalso presumes improved economic perfor-mance in Sub-Saharan Africa, which has wit-nessed two decades of negative per capitaincome growth. Despite the nearly 2 percent-age point turnaround in per capita growth, arate of 1.6 percent per capita if achieved,would still leave Sub-Saharan Africa at thelow end of the developing-country growthspectrum, inadequate to make much of a dent
G L O B A L O U T L O O K A N D T H E D E V E L O P I N G C O U N T R I E S
43
Table 1.5 GDP per capita will grow faster in the developing world than in the OECD areaReal GDP per capita, annual average percentage change, 1980s, 1990s, and forecasts
Forecast
Medium term Long term
1980s 1990s 2001–05 2006–15
World total 1.3 1.2 1.0 2.2
High-income countries 2.5 1.8 1.4 2.5OECD 2.5 1.8 1.4 2.4
United States 2.2 2.2 1.5 2.5Japan 3.5 1.2 0.7 1.9European Union 2.1 1.7 1.5 2.3
Non-OECD countries 3.1 3.8 1.1 4.2
Developing countries 0.7 1.7 2.7 3.4East Asia and the Pacific 5.6 6.4 5.4 5.4Europe and Central Asia 0.6 –1.8 3.8 3.3Latin America and the Caribbean –0.9 1.7 0.3 2.5Middle East and North Africa –0.6 1.2 1.4 2.5South Asia 3.6 3.3 3.4 4.1Sub-Saharan Africa –1.1 –0.2 1.0 1.6
Note: Aggregations are moving averages, reweighted annually after calculations of growth in constant prices.Source: World Bank.

in poverty and other MDGs. Nonethelessthere are positive signs emerging from parts of Sub-Saharan Africa, with per capita incomegrowth positive for the fourth consecutiveyear, and a dozen countries achieving growthrates in excess of 4 percent per annum.
The main difference with the long-termscenarios contained in Global EconomicProspects 2003 resides in the Middle East and
North Africa. Recent and prospective policychanges suggest that the region could attain aper capita growth rate of 2.5 percent over thenext 10 years. Such an achievement wouldfacilitate effort—particularly in private-sectordevelopment—to absorb the rapid increase inthe labor force.
Growth rates in East Asia and Pacific areexpected to remain strong through the long
G L O B A L E C O N O M I C P R O S P E C T S 2 0 0 4
44
Figure 1.32 Productivity will contribute more to GDP growth through 2015 than will capital or labor
Source: DECPG staff estimates.
a. Decomposition of GDP growth, 1990–2000
Average percent per annum
b. Decomposition of GDP growth, 2005–2015
Average percent per annum
High-incomecountries
East Asiaand Pacific
Europe and Central Asia
Latin Americaand the
Caribbean
Middle Eastand
North Africa
South Asia
Sub-SaharanAfrica
LaborCapital
Productivity
–4
–2
0
2
4
6
8
–4
–2
0
2
4
6
8
High-incomecountries
East Asiaand Pacific
Europe and Central Asia
Latin Americaand the
Caribbean
Middle Eastand
North Africa
South Asia
Sub-SaharanAfrica
�
�
�
LaborCapital
Productivity�
�
�
term. At official exchange rates, incomes inrich countries remain more than 20 timeshigher than the average in East Asia and Pa-cific, and even at purchasing-power exchangerates, incomes are six times higher.
After the Middle East and North Africa,South Asia is the region least integrated intothe global economy. Growth over the lastdecade can be attributed partly to trade policyreforms. Those reforms are expected to bepursued by local governments over the nextdecade, giving rise to sustained growth at ratesapproaching those of East Asia.
Latin America, like many of the other re-gions, has significantly diversified its exportsover the last years and gained a strongfoothold in global production networks. It isstill, on average, relatively closed compared tosome other developing regions and thereforewill benefit from pursuing trade reformswithin the hemisphere and beyond. Improvedmacroeconomic conditions—lower inflation-ary expectations and more flexible exchangerates—will provide better starting conditionsto achieve higher potential growth of around2.5 percent in per capita terms.
The risks to the long-term forecast are nev-ertheless not to be minimized. Many countriesare still grappling with relatively low revenue-collection rates, which could become critical ascountries attempt to make up for lost tariff rev-enues. The limits on government revenues arestraining the capacity for required investmentin public infrastructure—roads, ports, educa-tion, and other social services. The private sec-tor can (and will) fill in some of the gaps, pro-vided the right structures are in place. Conflictcould affect growth prospects, particularly atthe regional level, as we have seen in someparts of Sub-Saharan Africa in recent years orin the Middle East and Central Asia. Finally, alack of progress in trade reforms or, worse yet,a return to protectionist tendencies could curbthe expansion of trade and the ensuing bene-fits. The final section of this chapter assessessome of the economic benefits to be derivedfrom further trade reform, above and beyondthe baseline forecast presented here.
And growth will greatly reduce povertyStrong economic growth—particularly inChina and India, with yet-high concentrationsof poor—will lead to substantial reductions inthe incidence of poverty through 2015, withthe MDG of halving extreme poverty beingachieved on a global level—if not in eachcountry or region. Sub-Saharan Africa—un-less dramatic changes occur—almost surelywill not reach the goal. Even under a some-what optimistic economic forecast, the per-centage of the African population living on$1/day or less will remain above 42 percentthrough 2015, far from the goal of 23.7 per-cent. Sub-Saharan Africa will have nearlythree times the incidence of poverty as thenext poorest region (table 1.6).
South Asia, having approximately the sameinitial level of poverty as Sub-Saharan Africain 1990, had already achieved impressivegains by 2000 (from 42 percent to 32 percentaccording to the latest figures) and will likelyalmost halve that level by 2015.3
According to current projections, LatinAmerica will reach 2015 some 38 percentabove the target, and Europe and Central Asia,90 percent above—the latter after recoveringsharply from the large rise in poverty duringthe transitional 1990s.
This year’s poverty forecast contains somenoteworthy changes from last year. The changescan be attributed to four factors—changes inthe initial estimation of the number of poor,4
changes in the macroeconomic relation be-tween per capita consumption growth andpoverty reduction, changes in the economicforecast, and changes in the population fore-cast. The first two factors are derived fromupdated surveys and National Account data.The third factor—changes to the economicforecast—are mainly attributable to changesin the short- and medium-term forecast withlittle or no change to the long-term forecast(with one exception, noted below). The povertyforecast also incorporates the World Bank’smost recent population projections. Growth in population has been revised downward inmany regions. If per capita consumption
G L O B A L O U T L O O K A N D T H E D E V E L O P I N G C O U N T R I E S
45

Table 1.6 Global poverty will decrease significantly, but not uniformly across regionsRegional breakdown of poverty estimates in developing countries, various measures
GEP 2003 GEP 2004
Region 1990 1999 2015 1990 2000 2015
Number of people living on less than$1 per day (millions)
East Asia and Pacific 486 279 80 470 261 44China 377 223 73 361 204 41Rest of East Asia and Pacific 110 57 7 110 57 3
Europe and Central Asia 6 24 7 6 20 6Latin America and the Caribbean 48 57 47 48 56 46Middle East and North Africa 5 6 8 5 8 4South Asia 506 487 264 466 432 268Sub-Saharan Africa 241 315 404 241 323 366
Total 1,293 1,168 809 1,237 1,100 734Excluding China 917 945 735 877 896 692
$1 per day headcount index (percent)
East Asia and Pacific 30.5 15.6 3.9 29.4 14.5 2.3China 32.9 17.8 5.3 31.5 16.1 3.0Rest of East Asia and Pacific 24.2 10.6 1.1 24.1 10.6 0.5
Europe and Central Asia 1.4 5.1 1.4 1.4 4.2 1.3Latin America and the Caribbean 11.0 11.1 7.5 11.0 10.8 7.6Middle East and North Africa 2.1 2.2 2.1 2.1 2.8 1.2South Asia 45.0 36.6 15.7 41.5 31.9 16.4Sub-Saharan Africa 47.4 49.0 46.0 47.4 49.0 42.3
Total 29.6 23.2 13.3 28.3 21.6 12.5Excluding China 28.5 25.0 15.7 27.2 23.3 15.4
Number of people living on less than$2 per day (millions)
East Asia and Pacific 1,114 897 339 1,094 873 354China 819 627 219 800 599 256Rest of East Asia and Pacific 295 269 120 295 273 98
Europe and Central Asia 31 96 45 31 101 48Latin America and the Caribbean 121 132 117 121 136 124Middle East and North Africa 50 68 62 50 72 38South Asia 1,010 1,128 1,139 971 1,052 968Sub-Saharan Africa 386 480 618 386 504 612
Total 2,711 2,801 2,320 2,653 2,737 2,144Excluding China 1,892 2,173 2,101 1,854 2,138 1,888
$2 per day head count index (percent)
East Asia and Pacific 69.7 50.1 16.6 68.5 48.3 18.2China 71.6 50.1 15.7 69.9 47.3 18.4Rest of East Asia and Pacific 64.9 50.2 18.4 64.9 50.8 17.6
Europe and Central Asia 6.8 20.3 9.3 6.8 21.3 10.3Latin America and the Caribbean 27.6 26.0 18.9 27.6 26.3 20.5Middle East and North Africa 21.0 23.3 16.0 21.0 24.4 10.2South Asia 89.8 84.8 68.0 86.3 77.7 59.2Sub-Saharan Africa 76.0 74.7 70.4 76.0 76.5 70.7
Total 62.1 55.6 38.1 60.8 53.6 36.4Excluding China 58.7 57.5 44.7 57.5 55.7 42.0
Source: World Bank staff estimates.
G L O B A L E C O N O M I C P R O S P E C T S 2 0 0 4
46

growth rates remain unchanged, the revisedrates of population growth will have no effecton the poverty headcount index (all elseequal), but it would lower the absolute num-ber of poor.
One of the changes in table 1.6 is the use of the year 2000, rather than 1999, as the base year for the forecast. Because developingcountries were booming in 2000, the head-count index—assuming distribution neutral-ity—would have declined substantially.5 Mostregions indeed witnessed a decline in the head-count index in 2000, compared with the 1999headcount index reported last year, except forthe Middle East and North Africa, and Sub-Saharan Africa.6 At the global level, the esti-mate of the headcount index in 2000 is 21.6percent, compared with the 23.2 percent esti-mate for 1999 in last year’s report—represent-ing a decline of 6.9 percent.
However, not all of the changes can be at-tributed to the change in the base year. Thisyear’s estimates are also based on new surveysand methodology affecting, among others, thetwo largest developing countries—China andIndia. The estimate of the number of poor inChina has been revised downward for tworeasons. The first is that, for the first time,consumption-based data—deemed more ap-propriate for poverty analysis—are availableon a time-series basis. The second is that rural/urban population shares have been revised,with the urban share higher than previouslyestimated. The lower incidence of poverty inurban areas accounts for the downward re-vision in the overall poverty level for China.The new survey used in India has also led to a downward revision in the estimate of thepoverty level. A new household survey pro-vided the basis for our revision of Pakistan’spoverty profile. The Middle East and NorthAfrica regime benefits from new surveys inMorocco and Tunisia. The estimated level ofinitial poverty in Yemen has raised the regionallevel of poverty, but from a very low base.7
There are eleven new surveys for Latin Ameri-can countries, including Brazil and Mexico.
Looking forward to 2015, there are somerather sharp changes in the poverty forecast,focusing on the $1/day indicator. At a globallevel, the new forecast for 2015 for the head-count index drops to 12.5 percent, comparedwith 13.3 percent in last year’s report—a 5.9percent decline. The projected number of poorin 2015 declines to 734 million, from 809 mil-lion last year. Part of the decline in the numberof poor can be attributed to a decline in thepopulation growth rate through 2015.
Compared with last year’s forecast, theheadcount index for East Asia declines by44 percent, from 3.9 percent to 2.3 percent. Byand large, the decline is the result of a newestimate of the headcount elasticity, since thelong-term GDP growth rates remain largelyunchanged. The other key difference is for theMiddle East and North Africa region. The in-cidence of poverty starts from a low level (be-tween 2 and 3 percent). With growth prospectsrevised upward, the headcount index is ex-pected to drop to 1.2 percent, compared withlast year’s 2.1 percent, despite the upward re-vision in the base number of poor. In SouthAsia, the headcount index in 2015 has been re-vised upward from 15.7 percent to 16.4 per-cent, despite the decrease in the initial level.The new survey information suggests that theestimate of the headcount elasticity has de-clined, as the shape of the income distributioncurve has shifted the poor toward the left endof the distribution tail, away from the povertyline. For Sub-Saharan Africa, the 2015 head-count index is forecast at 42.3 percent, a dropfrom last year’s 46 percent. This improvementincorporates some new survey information,but positive trends in the short- and medium-term forecast, particularly for the oil exporters,account for most of the change.
Looking ahead to the Doha Round
Asuccessful outcome of the multilateraltrade negotiations known as the Doha De-
velopment Agenda, or the Doha Round, would
G L O B A L O U T L O O K A N D T H E D E V E L O P I N G C O U N T R I E S
47
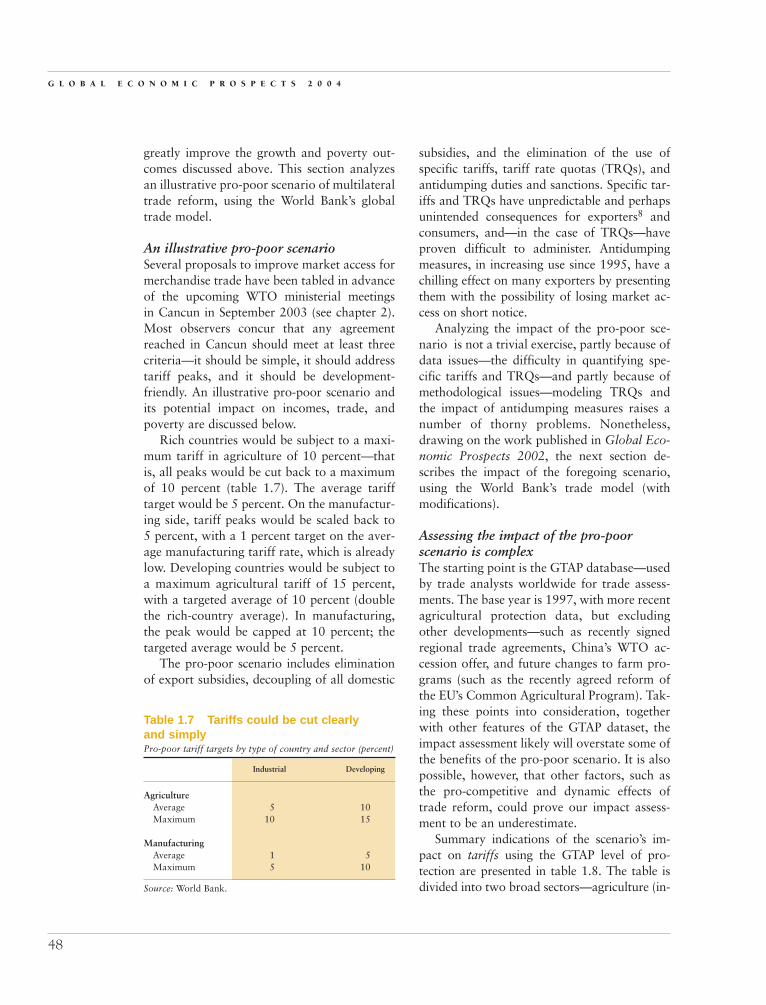
Table 1.7 Tariffs could be cut clearly and simplyPro-poor tariff targets by type of country and sector (percent)
Industrial Developing
AgricultureAverage 5 10Maximum 10 15
ManufacturingAverage 1 5Maximum 5 10
Source: World Bank.
greatly improve the growth and poverty out-comes discussed above. This section analyzesan illustrative pro-poor scenario of multilateraltrade reform, using the World Bank’s globaltrade model.
An illustrative pro-poor scenarioSeveral proposals to improve market access formerchandise trade have been tabled in advanceof the upcoming WTO ministerial meetings in Cancun in September 2003 (see chapter 2).Most observers concur that any agreementreached in Cancun should meet at least threecriteria—it should be simple, it should addresstariff peaks, and it should be development-friendly. An illustrative pro-poor scenario andits potential impact on incomes, trade, andpoverty are discussed below.
Rich countries would be subject to a maxi-mum tariff in agriculture of 10 percent—thatis, all peaks would be cut back to a maximumof 10 percent (table 1.7). The average tarifftarget would be 5 percent. On the manufactur-ing side, tariff peaks would be scaled back to5 percent, with a 1 percent target on the aver-age manufacturing tariff rate, which is alreadylow. Developing countries would be subject toa maximum agricultural tariff of 15 percent,with a targeted average of 10 percent (doublethe rich-country average). In manufacturing,the peak would be capped at 10 percent; thetargeted average would be 5 percent.
The pro-poor scenario includes eliminationof export subsidies, decoupling of all domestic
subsidies, and the elimination of the use ofspecific tariffs, tariff rate quotas (TRQs), andantidumping duties and sanctions. Specific tar-iffs and TRQs have unpredictable and perhapsunintended consequences for exporters8 andconsumers, and—in the case of TRQs—haveproven difficult to administer. Antidumpingmeasures, in increasing use since 1995, have achilling effect on many exporters by presentingthem with the possibility of losing market ac-cess on short notice.
Analyzing the impact of the pro-poor sce-nario is not a trivial exercise, partly because ofdata issues—the difficulty in quantifying spe-cific tariffs and TRQs—and partly because ofmethodological issues—modeling TRQs andthe impact of antidumping measures raises anumber of thorny problems. Nonetheless,drawing on the work published in Global Eco-nomic Prospects 2002, the next section de-scribes the impact of the foregoing scenario,using the World Bank’s trade model (withmodifications).
Assessing the impact of the pro-poorscenario is complexThe starting point is the GTAP database—usedby trade analysts worldwide for trade assess-ments. The base year is 1997, with more recentagricultural protection data, but excludingother developments—such as recently signedregional trade agreements, China’s WTO ac-cession offer, and future changes to farm pro-grams (such as the recently agreed reform ofthe EU’s Common Agricultural Program). Tak-ing these points into consideration, togetherwith other features of the GTAP dataset, theimpact assessment likely will overstate some ofthe benefits of the pro-poor scenario. It is alsopossible, however, that other factors, such asthe pro-competitive and dynamic effects oftrade reform, could prove our impact assess-ment to be an underestimate.
Summary indications of the scenario’s im-pact on tariffs using the GTAP level of pro-tection are presented in table 1.8. The table isdivided into two broad sectors—agriculture (in-
G L O B A L E C O N O M I C P R O S P E C T S 2 0 0 4
48

cluding processed foods) and manufacturing.The first column in each sector provides the (im-port weighted) average tariff.9 Thus for Japan,the average tariff is 50 percent in agriculture butless than 2 percent in manufacturing.
The second column shows the targetedaverage tariff rate. The rich-country agricul-tural target of 5 percent is achieved in theUnited States, for example. In Japan and someregions, it is not achieved. In Japan, for exam-ple, the scenario would lead to an average rateof 10 percent, twice the target rate, becauseJapan’s peaks are high and cover a wide per-centage of agricultural trade. Initial tariffsbelow the peaks would have to become nega-tive for the target to be achieved.10 In some
cases cutting the peaks is sufficient to achieveor surpass the targeted tariff level. This is thecase, for example, for Indonesian agriculture,where the average tariff is already below thetarget and reducing the peaks simply drops theaverage.
The third column provides the level of re-duction in non-peak tariffs. In the UnitedStates, for example, non-peak agricultural tar-iffs would be reduced by an average of 60 per-cent to achieve the 5 percent average target.
Rich countries would see a significant dropin the average agricultural tariff. In the ad-vanced countries of Asia, in particular, averageagricultural tariffs would fall from near 50 per-cent to somewhere around 10 percent—still
G L O B A L O U T L O O K A N D T H E D E V E L O P I N G C O U N T R I E S
49
Table 1.8 The pro-poor tariff scenario would significantly lower protectionAnalysis of initial and final average tariffs in agriculture and manufacturing under the World Bank’s tariff scenario, using World Bank trade model (percent)
Agriculture Manufacturing
Percent Percentreduction reduction
in non-peak in non-peakInitial Final tariffs Initial Final tariffs
OECD Cairns countries 15.9 6.0 100.0 2.2 1.0 56.3European Union with EFTA 22.4 7.4 100.0 4.2 1.2 100.0United States 10.8 5.0 60.6 2.4 1.0 57.7Japan 50.3 10.0 100.0 1.6 0.9 0.0Korea, Rep. of, and Taiwan (China) 49.4 8.2 100.0 5.7 3.1 100.0Hong Kong (China) and Singapore 1.6 1.6 0.0 0.0 0.0 0.0Brazil 12.0 10.0 21.3 14.6 6.9 100.0China 38.8 11.0 100.0 13.8 8.6 100.0India 25.9 13.2 100.0 21.7 8.8 100.0Indonesia 9.0 7.4 0.0 8.6 5.0 29.0Russian Federation 11.8 10.0 12.3 12.3 5.6 100.0Mexico 23.6 10.0 61.5 2.7 2.3 0.0Southern African Customs Union 45.7 12.2 100.0 9.4 5.0 32.4Vietnam 32.5 11.4 100.0 16.9 5.2 100.0Rest of South Asia 23.6 10.3 100.0 31.3 9.9 100.0Rest of East Asia 22.9 11.9 100.0 7.9 5.0 29.6Rest of Latin America and Caribbean 14.5 10.0 77.9 12.0 6.3 100.0EU accession countries 24.9 12.8 100.0 7.5 5.0 35.5Rest of Europe and Central Asia 22.4 10.0 92.5 5.0 4.7 0.0Middle East 76.4 12.8 100.0 8.4 5.0 49.4North Africa 35.5 10.2 100.0 18.6 9.1 100.0Rest of Sub-Saharan Africa 20.6 10.5 100.0 16.0 8.8 100.0Rest of WORLD 8.1 6.0 0.0 7.5 5.0 15.6
Note: Agricultural tariff peaks are cut to 10 and 15 percent respectively in high-income and developing countries. Manufacturingtariff peaks are cut to 5 and 10 percent respectively in high-income and developing countries. The targets for average agriculturaltariffs are respectively 5 and 10 percent, respectively, for high-income and developing countries. Targets for the average manufac-turing tariff are 1 and 5 percent, respectively, for high-income and developing countries.Sources: GTAP release 5.3 and World Bank staff calculations.
Average tariff Average tariff

above the target level. The United States wouldachieve the target, but from a more modest 11percent initial level, whereas the EuropeanUnion would see a drop in the average (extra-EU) tariff from 22 percent to just above 7 per-cent. Developing countries would also see sig-nificant reductions, higher on average than inrich countries. Many regions would not meetthe 10 percent target because of the many tar-iffs higher than the 15 percent cutoff point.
In manufacturing, the average tariff rate inrich countries would decline slightly followingthe removal of peaks. In developing countries,the 5 percent target could be met in manyregions, with Mexico and the EU-accessioncountries already below the target with theirprevailing initial tariff rates.11
The “decoupling” part of the scenario isachieved by removing all domestic support inagriculture—input and output subsidies andpayments to land and capital. These would bereplaced by direct payments to farm house-holds. Such lump-sum transfers, not modeledexplicitly, are important in determining in-come distribution within each region, but theyhave no direct effects on the distribution ofproduction, on income across regions, or onthe results described below. Export subsidies,which have played a relatively small role re-cently, are also removed. The impacts of spe-cific tariffs and TRQs in agriculture are cap-tured in the base protection data and aremodeled as part of the ad valorem equivalenttariff. The full ad valorem tariff is subject tothe reductions described in table 1.8.
The scenario would yield significant gainsThe scenario described and analyzed abovewould generate $291 billion in global eco-nomic gains—nearly 75 percent of the totalpotential gains from full merchandise trade re-form.12 Measured in static terms, some$159 billion13 in additional income would bereaped by developing countries in 2015 (com-pared to the baseline); rich countries wouldgain around $132 billion (figure 1.33). Thegains, which would raise income levels by 1.5and 0.5 percent, respectively, for developing
and rich countries, could be much higher if dy-namic effects—such as increases in productiv-ity14 and increasing FDI—are taken into con-sideration. Varying the trade model to linksectoral productivity to the export/output ratioshows that dynamic effects can indeed be sub-stantial. In developing countries, the dynamicgains from the trade reform scenario are some120 percent higher than the static gains. Thedynamic gain for rich countries is less dra-matic, because of the low GDP weight of agri-culture, for which protection is strongest.
The reduction of trade barriers in agricul-ture and food yield $193 billion (in 2015), two-thirds of the total static gains from merchandisetrade reform of $291 billion (table 1.9). Morethan 50 percent of these gains in agricultureand food, $101 billion, are reaped by develop-ing countries, of which 80 percent is the resultof own-reform in these two sectors. In otherwords, reform of agriculture and food in richcountries would lead to a gain of some $20 bil-lion for developing countries as a whole. Man-ufacturing liberalization by rich countrieswould lead to gains of $25 billion to develop-ing countries and could potentially even lead toa (small) loss to rich countries as increased mar-
G L O B A L E C O N O M I C P R O S P E C T S 2 0 0 4
50
Figure 1.33 The pro-poor reform scenariopromises substantial income gains
Source: World Bank staff simulations.
�
�
High-income countries
Static gainsDynamic gains
Developing countries
Change in real income in 2015 relative to baseline($1997 billion)
0
50
100
150
200
250
300
350

Table 1.9 A large share of real income gains comes from lowering of barriers inagriculture and food(real income gains in 2015 relative to the baseline in $1997 billion)
Liberalizing region
Low- and middle- High-income income countries countries All countries
Decomposition of static impacts
Gains to low- and middle-income countriesAgriculture and food 80 20 101Manufacturing 33 25 58All merchandise trade 114 44 159
Gains to high-income countriesAgriculture and food 23 64 91Manufacturing 44 –3 41All merchandise trade 67 63 132
Global gainsAgriculture and food 103 84 193Manufacturing 77 22 98All merchandise trade 181 107 291
Decomposition of dynamic impacts
Gains to low- and middle-income countriesAgriculture and food 167 75 240Manufacturing 95 9 108All merchandise trade 265 85 349
Gains to high-income countriesAgriculture and food 19 100 117Manufacturing 36 13 48All merchandise trade 55 115 169
Global gainsAgriculture and food 185 174 358Manufacturing 131 22 156All merchandise trade 321 199 518
Source: World Bank staff simulations.
ket access by developing countries generatesterms-of-trade losses for rich countries—lossesnot fully compensated by the gains in allocativeefficiency. There is a degree of asymmetry in theimpacts of the reforms on rich and on develop-ing countries. The former gain significantlymore from their own reforms ($114 billion ofthe $159 billion total), whereas the impacts for rich countries are more or less evenly spreadbetween own-reform and developing-countryreforms.
Trade would increase sharply under thescenario—particularly in the most severelyprotected sectors: agriculture and food (figure
G L O B A L O U T L O O K A N D T H E D E V E L O P I N G C O U N T R I E S
51
1.34). Globally, merchandise trade would in-crease by about 10 percent (more than$800 billion), but exports from developingcountries would rise by 20 percent (nearly$540 billion). The largest percentage increasein trade (nearly 50 percent) would occur inprocessed foods. Agricultural trade would riseby 32 percent. Developing countries shouldsee an increase in their exports of textiles,clothing, and footwear, although its magni-tude would depend on the final implementa-tion of the Uruguay Round.
The number of poor would decline sub-stantially under the partial reform scenario de-

scribed here. At the world level, the number ofpersons living on $1/day or less would declineby 61 million, or 8 percent of the current fore-cast for 2015 of 734 million (figure 1.35).15
The number living on $2/day or less would de-cline by 144 million. The greatest reduction
in absolute terms would come in Sub-SaharanAfrica. The region’s unskilled workers wouldsee the largest percentage increase in nominalwages and decreases in the cost of living. Thelargest percentage fall would occur in theMiddle East. This region has the highest over-
G L O B A L E C O N O M I C P R O S P E C T S 2 0 0 4
52
Figure 1.34 Exports should rise sharply
Source: World Bank staff simulations.
Change in export volumes in 2015 relative to baseline ($1997 billion)
Agriculture Energy Processedfoods
Textile, clothingand footwear
Othermanufacturing
Developing countries
High-income countries
�
�
0
50
100
150
200
Figure 1.35 Millions of people would be moved out of poverty
Source: World Bank staff simulations.
Changes in number of poor in 2015 relative to base (millions)
East Asiaand Pacific
Europe andCentral Asia
Latin Americaand the
Caribbean
Middle Eastand
North Africa
South Asia Sub-SaharanAfrica
$2 per day
$1 per day
�
�
70
60
50
40
30
20
10
0
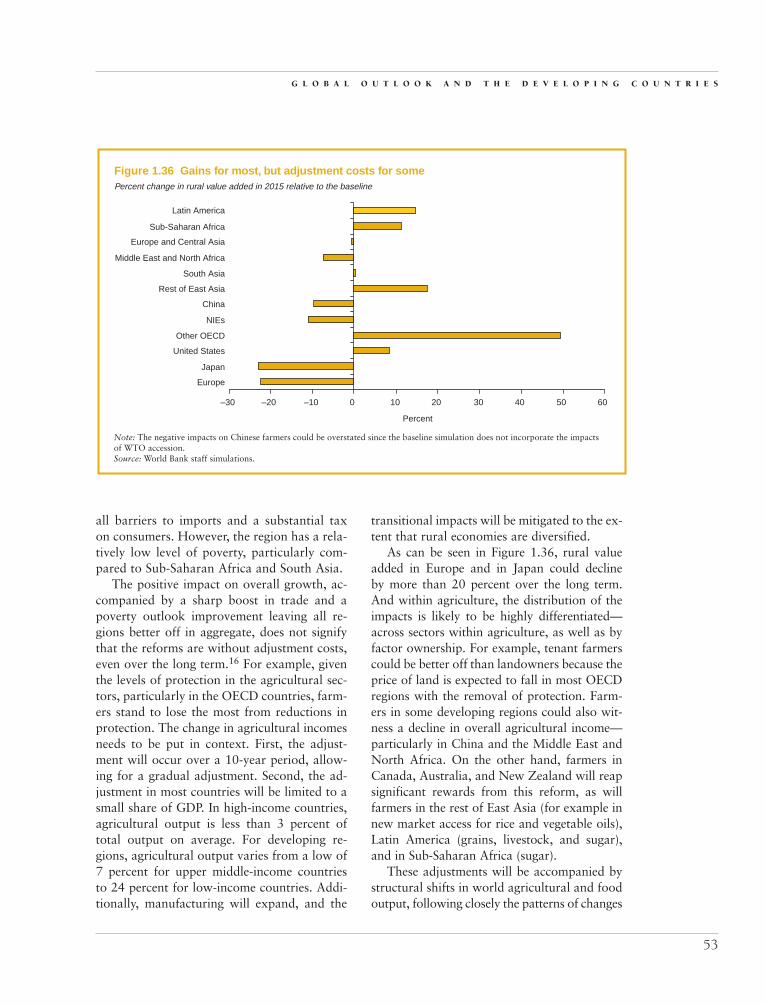
all barriers to imports and a substantial tax on consumers. However, the region has a rela-tively low level of poverty, particularly com-pared to Sub-Saharan Africa and South Asia.
The positive impact on overall growth, ac-companied by a sharp boost in trade and apoverty outlook improvement leaving all re-gions better off in aggregate, does not signifythat the reforms are without adjustment costs,even over the long term.16 For example, giventhe levels of protection in the agricultural sec-tors, particularly in the OECD countries, farm-ers stand to lose the most from reductions inprotection. The change in agricultural incomesneeds to be put in context. First, the adjust-ment will occur over a 10-year period, allow-ing for a gradual adjustment. Second, the ad-justment in most countries will be limited to asmall share of GDP. In high-income countries,agricultural output is less than 3 percent oftotal output on average. For developing re-gions, agricultural output varies from a low of7 percent for upper middle-income countries to 24 percent for low-income countries. Addi-tionally, manufacturing will expand, and the
transitional impacts will be mitigated to the ex-tent that rural economies are diversified.
As can be seen in Figure 1.36, rural valueadded in Europe and in Japan could decline by more than 20 percent over the long term.And within agriculture, the distribution of theimpacts is likely to be highly differentiated—across sectors within agriculture, as well as byfactor ownership. For example, tenant farmerscould be better off than landowners because theprice of land is expected to fall in most OECDregions with the removal of protection. Farm-ers in some developing regions could also wit-ness a decline in overall agricultural income—particularly in China and the Middle East andNorth Africa. On the other hand, farmers inCanada, Australia, and New Zealand will reapsignificant rewards from this reform, as willfarmers in the rest of East Asia (for example innew market access for rice and vegetable oils),Latin America (grains, livestock, and sugar),and in Sub-Saharan Africa (sugar).
These adjustments will be accompanied bystructural shifts in world agricultural and foodoutput, following closely the patterns of changes
G L O B A L O U T L O O K A N D T H E D E V E L O P I N G C O U N T R I E S
53
Figure 1.36 Gains for most, but adjustment costs for some
Note: The negative impacts on Chinese farmers could be overstated since the baseline simulation does not incorporate the impactsof WTO accession.Source: World Bank staff simulations.
Percent change in rural value added in 2015 relative to the baseline
Latin America
Sub-Saharan Africa
Europe and Central Asia
Middle East and North Africa
South Asia
Rest of East Asia
China
NIEs
Other OECD
United States
Japan
Europe
–30 –20 –10 0 10
Percent
20 30 40 50 60

in rural value added (figure 1.37). The changesin agricultural output tend to dominate thosein processed foods, despite relatively similarlevels of protection, in part because of thelower costs of inputs—that is, raw agriculturalcommodities—for the processing sectors. Themain reductions in output occur in Europe,Japan, and the Middle East and North Africa
for both agriculture and processed foods. Thebeneficiaries include Canada, Australia, andNew Zealand among rich countries; Asia out-side of China; Sub-Saharan Africa; and LatinAmerica. The NIEs—particularly Korea andTaiwan (China)—show that they could becompetitive in processed foods were they to re-move agricultural protection.
G L O B A L E C O N O M I C P R O S P E C T S 2 0 0 4
54
Figure 1.37 Significant shifts in global output patterns
Source: World Bank staff simulations.
Percent change in output in 2015 relative to the baseline
Latin America
Sub-Saharan Africa
Europe and Central Asia
Middle East and North Africa
South Asia
Rest of East Asia
China
NIEs
Other OECD
United States
Japan
Europe
Percent
Processed foods
Agriculture
–30 –20 –10 0 10 20 30 40
�
�
55
Annex 1 Historical trade dynamics for developing countries
Table 1.A1 Sectoral export decomposition for developing countriesa
Percent
Share Average growth Contribution to(percent) (percent per annum) growth (percent)
1977 1987 1997 1977–87 1987–97 1977–87 1987–97
High income Asia excluding Japanb
Agriculture 5.1 1.8 0.3 4.6 –5.9 0.9 –0.4Oil and gas 0.6 0.1 0.1 –6.5 12.6 –0.1 0.1Other natural resources 0.9 0.4 0.2 5.6 5.5 0.2 0.1Processed foods 8.7 5.1 2.3 9.7 3.1 4.0 0.9Textiles, apparel, and leather goods 30.0 25.1 13.5 13.8 4.9 23.7 7.7Motor vehicles and parts 0.4 1.8 3.4 33.6 19.0 2.2 4.2Electronic equipment 10.9 17.1 31.7 21.2 18.7 19.0 39.0Other machinery 12.6 17.3 22.4 19.6 14.5 18.7 24.9Other manufacturing 30.9 31.4 26.1 16.0 9.6 31.5 23.4Total 100.0 100.0 100.0 15.9 11.6 100.0 100.0
East Asia and PacificAgriculture 19.1 13.1 2.2 7.0 –1.8 9.9 –0.6Oil and gas 25.3 20.7 3.6 8.9 –1.4 18.3 –0.7Other natural resources 11.3 5.5 2.1 3.5 6.3 2.4 1.2Processed foods 20.3 15.2 6.9 8.0 8.5 12.5 4.8Textiles, apparel, and leather goods 5.1 14.0 22.4 23.0 23.0 18.8 24.5Motor vehicles and parts 0.1 0.7 0.7 36.9 17.3 1.0 0.7Electronic equipment 1.8 7.2 20.9 27.7 30.7 10.0 24.4Other machinery 2.8 4.4 13.8 16.2 31.5 5.3 16.1Other manufacturing 14.3 19.1 27.4 14.4 21.7 21.7 29.5Total 100.0 100.0 100.0 11.1 17.4 100.0 100.0
South AsiaAgriculture 27.8 22.1 5.9 5.3 –1.1 16.9 –1.0Oil and gas 0.3 1.7 0.1 29.4 –15.9 2.9 –0.6Other natural resources 13.4 16.9 5.2 10.3 0.4 20.1 0.3Processed foods 19.8 12.8 10.3 3.2 10.5 6.5 9.3Textiles, apparel, and leather goods 14.0 27.9 46.5 15.4 18.8 40.2 54.4Motor vehicles and parts 0.9 0.6 1.2 3.9 20.6 0.4 1.4Electronic equipment 0.3 0.4 1.2 10.5 25.0 0.5 1.6Other machinery 5.3 4.7 4.5 6.4 12.5 4.1 4.5Other manufacturing 18.2 13.0 25.0 4.2 20.5 8.4 30.1Total 100.0 100.0 100.0 7.8 12.8 100.0 100.0
Latin America and the CaribbeanAgriculture 26.0 17.8 10.0 4.3 2.8 11.1 4.1Oil and gas 14.2 16.3 6.9 9.7 0.0 17.9 0.0Other natural resources 7.1 5.8 4.4 6.0 6.0 4.7 3.4Processed foods 20.1 14.1 12.0 4.5 7.1 9.1 10.4Textiles, apparel, and leather goods 2.7 3.8 8.5 12.2 18.1 4.7 12.0Motor vehicles and parts 1.5 3.6 8.4 18.5 18.6 5.3 12.0Electronic equipment 1.7 3.1 5.9 14.9 16.2 4.2 7.9Other machinery 3.6 7.6 13.3 16.7 15.1 11.0 17.5Other manufacturing 23.1 27.9 30.6 10.4 9.9 31.9 32.6Total 100.0 100.0 100.0 8.3 8.9 100.0 100.0
(Table continues on next page)
G L O B A L E C O N O M I C P R O S P E C T S 2 0 0 4
56
Europe and Central AsiaAgriculture 22.8 14.7 5.2 5.2 10.6 9.6 3.8Oil and gas 0.2 2.6 11.0 45.1 41.7 4.2 12.2Other natural resources 18.6 9.7 4.7 3.1 14.1 4.2 3.9Processed foods 15.0 13.4 6.3 8.7 13.8 12.4 5.2Textiles, apparel, and leather goods 9.9 18.0 12.6 16.8 18.4 23.2 11.8Motor vehicles and parts 1.3 1.5 3.0 11.7 31.4 1.7 3.2Electronic equipment 0.6 0.6 2.1 10.3 38.8 0.6 2.3Other machinery 10.1 8.5 9.3 8.1 24.0 7.5 9.5Other manufacturing 21.6 30.9 45.9 14.0 27.7 36.8 48.1Total 100.0 100.0 100.0 9.9 22.8 100.0 100.0
Middle East and North AfricaAgriculture 1.8 2.4 1.9 2.5 2.1 –15.9 1.0Oil and gas 86.2 69.4 42.4 –2.5 –0.4 586.9 –5.0Other natural resources 1.0 2.3 2.0 8.1 3.0 –37.8 1.4Processed foods 0.9 1.5 1.4 4.7 4.6 –16.0 1.4Textiles, apparel, and leather goods 1.0 2.1 5.8 7.1 15.6 –31.6 12.2Motor vehicles and parts 0.5 0.3 0.5 –5.9 11.2 6.6 0.9Electronic equipment 0.2 0.6 2.0 13.6 18.0 –12.6 4.4Other machinery 0.8 2.4 4.1 11.4 10.1 –47.7 6.9Other manufacturing 7.6 19.0 39.9 9.3 12.7 –332.0 76.7Total 100.0 100.0 100.0 –0.3 4.6 100.0 100.0
Sub-Saharan AfricaAgriculture 23.9 20.4 13.2 1.1 0.9 8.8 2.8Oil and gas 37.9 38.2 18.3 2.8 –2.1 39.2 –10.8Other natural resources 13.3 12.7 12.2 2.2 4.9 10.6 11.4Processed foods 8.9 7.0 6.5 0.3 4.5 0.9 5.6Textiles, apparel, and leather goods 0.3 1.2 4.7 16.5 20.8 4.0 9.7Motor vehicles and parts 0.1 0.2 0.9 9.2 25.2 0.4 2.0Electronic equipment 0.1 0.2 0.4 12.7 13.1 0.6 0.7Other machinery 1.0 1.7 4.1 8.6 15.1 4.0 7.6Other manufacturing 14.4 18.4 39.8 5.3 13.8 31.5 70.9Total 100.0 100.0 100.0 2.7 5.4 100.0 100.0
Low- and middle-income countriesAgriculture 13.4 12.6 5.2 4.1 1.9 11.2 1.4Oil and gas 51.6 33.5 12.0 0.4 0.5 3.3 0.8Other natural resources 6.3 6.3 3.8 4.8 5.9 6.3 2.5Processed foods 9.5 10.0 7.4 5.4 8.0 10.9 6.0Textiles, apparel, and leather goods 2.6 7.1 15.5 16.1 20.3 14.8 19.8Motor vehicles and parts 0.6 1.4 2.8 13.6 19.4 2.6 3.5Electronic equipment 0.7 2.7 9.8 20.4 26.6 6.1 13.5Other machinery 2.1 4.7 10.6 13.8 20.8 9.1 13.6Other manufacturing 13.4 21.7 33.0 10.0 16.1 35.7 38.9Total 100.0 100.0 100.0 4.8 11.3 100.0 100.0
a. The years represent three-year averages to remove some of the volatility from the data. Thus 1977 represents the average of1975–77, 1987 is the average of 1985–87, and 1997 is the average of 1995–97. Relative caution is advised regarding Europe andCentral Asia, where data prior to 1990 are not always reliable. This would have only a small impact on the total because of theregion’s relatively small weight.b. High-income Asia is excluded from the low- and middle-income region in the totals. It is provided for information andincludes Hong Kong (China), Republic of Korea, Singapore, and Taiwan (China).Source: GTAP release 5.0.
Table 1.A1 (continued)Percent
Share Average growth Contribution to(percent) (percent per annum) growth (percent)
1977 1987 1997 1977–87 1987–97 1977–87 1987–97

G L O B A L O U T L O O K A N D T H E D E V E L O P I N G C O U N T R I E S
57
Table 1.A2 Regional export decomposition for developing countriesa
Percent
Share Average growth Contribution to(percent) (percent per annum) growth (percent)
1977 1987 1997 1977–87 1987–97 1977–87 1987–97
High income Asia excluding Japanb
Quad countries 65.6 69.4 47.0 16.5 7.4 70.5 35.9High income Asia excluding Japan 7.8 8.6 15.1 16.9 18.1 8.8 18.3East Asia and Pacific 8.5 9.2 25.0 16.9 23.3 9.5 32.8South Asia 0.7 2.1 1.6 28.7 8.5 2.5 1.3Latin America and the Caribbean 1.3 1.1 2.8 13.5 22.6 1.0 3.6Europe and Central Asia 0.2 0.2 1.6 13.2 39.3 0.2 2.3Middle East and North Africa 7.1 3.9 2.1 9.1 5.2 2.9 1.3Sub-Saharan Africa 2.6 1.2 1.2 7.1 11.8 0.8 1.2Rest of the world 6.1 4.4 3.6 12.0 9.5 3.9 3.2World total 100.0 100.0 100.0 15.9 11.6 100.0 100.0
East Asia and PacificQuad countries 66.1 58.6 54.8 9.8 16.6 54.6 53.8High income Asia excluding Japan 18.7 26.2 26.2 15.0 17.4 30.3 26.2East Asia and Pacific 4.8 4.9 7.1 11.4 21.7 5.0 7.6South Asia 1.3 2.1 1.5 16.4 13.2 2.6 1.3Latin America and the Caribbean 2.4 1.3 2.0 4.8 22.2 0.7 2.1Europe and Central Asia 0.3 0.7 1.4 21.3 26.6 0.9 1.6Middle East and North Africa 2.9 2.6 2.6 10.1 17.5 2.5 2.7Sub-Saharan Africa 1.4 0.7 1.0 3.6 21.5 0.3 1.1Rest of the world 2.1 2.8 3.4 14.2 19.8 3.1 3.6World total 100.0 100.0 100.0 11.1 17.4 100.0 100.0
South AsiaQuad countries 52.7 64.8 62.3 10.0 12.4 75.6 61.2High income Asia excluding Japan 4.4 7.3 9.5 13.4 16.0 9.8 10.5East Asia and Pacific 4.6 2.8 7.3 2.7 24.0 1.3 9.1South Asia 4.7 4.8 3.5 8.1 9.1 5.0 2.9Latin America and the Caribbean 0.6 0.6 1.6 7.8 24.2 0.6 2.0Europe and Central Asia 2.0 1.2 2.9 2.7 22.9 0.5 3.5Middle East and North Africa 22.2 12.8 7.4 2.0 6.8 4.3 5.1Sub-Saharan Africa 4.1 2.2 2.8 1.3 15.9 0.5 3.1Rest of the world 4.7 3.5 2.8 4.5 10.5 2.4 2.5World total 100.0 100.0 100.0 7.8 12.8 100.0 100.0
Latin America and the CaribbeanQuad countries 75.0 77.2 68.9 8.6 7.7 79.1 62.8High income Asia excluding Japan 0.7 1.9 2.9 20.1 13.6 2.9 3.7East Asia and Pacific 1.0 1.6 2.8 13.6 15.0 2.1 3.7South Asia 0.3 0.6 0.4 15.2 5.9 0.8 0.3Latin America and the Caribbean 15.9 12.0 20.2 5.3 14.7 8.8 26.2Europe and Central Asia 1.0 0.7 1.0 5.2 12.5 0.5 1.2Middle East and North Africa 3.3 2.9 1.8 6.9 4.1 2.6 1.1Sub-Saharan Africa 1.0 1.4 0.8 11.4 2.8 1.6 0.3Rest of the world 1.8 1.6 1.1 7.1 4.6 1.5 0.7World total 100.0 100.0 100.0 8.3 8.9 100.0 100.0
(Table continues on next page)

G L O B A L E C O N O M I C P R O S P E C T S 2 0 0 4
58
Europe and Central AsiaQuad countries 75.7 68.3 57.9 8.8 20.8 63.6 56.4High income Asia excluding Japan 0.9 0.5 3.2 4.1 46.2 0.3 3.5East Asia and Pacific 0.6 2.3 5.5 26.0 33.7 3.4 5.9South Asia 1.1 1.5 0.6 13.1 11.5 1.7 0.4Latin America and the Caribbean 2.6 1.5 1.3 4.0 21.2 0.8 1.3Europe and Central Asia 0.9 1.9 23.5 18.7 57.5 2.6 26.7Middle East and North Africa 10.9 19.4 3.9 16.4 4.6 24.8 1.6Sub-Saharan Africa 1.5 0.4 0.3 –4.2 20.7 –0.3 0.3Rest of the world 5.7 4.2 3.9 6.4 22.0 3.1 3.9World total 100.0 100.0 100.0 9.9 22.8 100.0 100.0
Middle East and North AfricaQuad countries 77.3 74.6 66.6 –0.7 3.4 158.5 52.4High income Asia excluding Japan 5.1 6.5 11.3 2.2 10.6 –37.8 19.8East Asia and Pacific 1.9 2.1 6.3 0.5 16.7 –3.1 13.6South Asia 1.0 3.5 3.6 13.3 4.6 –75.5 3.6Latin America and the Caribbean 6.0 3.2 1.9 –6.4 –0.7 89.1 –0.4Europe and Central Asia 1.1 2.7 2.8 9.1 5.2 –46.0 3.1Middle East and North Africa 4.6 4.8 4.0 0.0 2.8 0.4 2.6Sub-Saharan Africa 0.9 0.7 1.4 –2.7 11.6 6.8 2.5Rest of the world 2.1 1.9 2.2 –1.2 6.1 7.6 2.8World total 100.0 100.0 100.0 –0.3 4.6 100.0 100.0
Sub Saharan AfricaQuad countries 83.7 84.4 70.8 2.8 3.5 86.6 50.9High income Asia excluding Japan 1.1 2.3 6.5 10.6 16.6 6.3 12.5East Asia and Pacific 0.6 0.8 4.8 4.6 26.5 1.2 10.6South Asia 0.5 1.0 1.9 8.7 12.9 2.3 3.3Latin America and the Caribbean 3.3 3.9 2.9 4.4 2.5 5.7 1.6Europe and Central Asia 0.3 0.6 1.3 11.1 14.1 1.6 2.3Middle East and North Africa 2.0 1.4 1.7 –0.7 7.4 –0.5 2.1Sub-Saharan Africa 3.9 4.0 7.2 3.1 11.7 4.5 11.9Rest of the world 4.6 1.7 2.9 –7.1 11.4 –7.8 4.7World total 100.0 100.0 100.0 2.7 5.4 100.0 100.0
Low and middle incomeQuad countries 75.5 72.1 61.7 4.3 9.6 66.5 56.2High income Asia excluding Japan 5.1 8.9 13.5 10.8 16.0 15.3 15.9East Asia and Pacific 2.1 2.6 5.6 7.2 20.3 3.5 7.2South Asia 1.0 2.0 1.5 12.8 8.5 3.8 1.3Latin America and the Caribbean 6.9 5.1 6.1 1.8 13.2 2.2 6.6Europe and Central Asia 0.9 1.3 4.4 9.3 25.7 2.1 6.0Middle East and North Africa 4.5 4.4 2.9 4.5 7.0 4.2 2.2Sub-Saharan Africa 1.5 1.3 1.4 3.0 12.2 0.9 1.4Rest of the world 2.6 2.2 2.9 3.3 14.2 1.6 3.2World total 100.0 100.0 100.0 4.8 11.3 100.0 100.0
a. The years represent three-year averages to remove some of the volatility from the data. Thus 1977 represents the average of1975–77, 1987 is the average of 1985–87, and 1997 is the average of 1995–97. Relative caution is advised regarding Europe andCentral Asia, where data prior to 1990 are not always reliable. This would have only a small impact on the total because of theregion’s relatively small weight.b. High-income Asia is excluded from the low- and middle-income region in the totals. It is provided for information andincludes Hong Kong (China), Republic of Korea, Singapore, and Taiwan (China).Source: GTAP release 5.0.
Table 1.A2 (continued)Percent
Share Average growth Contribution to(percent) (percent per annum) growth (percent)
1977 1987 1997 1977–87 1987–97 1977–87 1987–97

Notes1. Technically, the non-economic component of
confidence is modeled as an unobserved state variableand estimated using a Kalman filter/smoother, withdata pertaining to economic conditions as exogenouscontrols. The model was fitted on monthly data overthe period 1984–2001 (September). Then the estimatewas used together with actual, observed economic datato predict confidence out of sample over the period Oc-tober 2001–April 2003.
2. It was decided at the December 2002 Copen-hagen Summit to invite eight transition countries tojoin the EU in May 2004.
3. The differences between Sub-Saharan Africa andSouth Asia are not limited to the higher growth rate inthe latter over the last decade. The poverty gap indi-cator—a measure of the average distance to the povertyline for the poor—has been much higher in Sub-Saharan Africa. This implies that even at identical growthrates, poverty would have decreased more rapidly inSouth Asia.
4. The initial poverty estimate will also be subjectto revisions in the national income and product ac-counts because adjustments to the survey-based con-sumption levels will follow adjustments to consump-tion derived from the national accounts.
5. A numerical example may help clarify the proce-dure. Say population is 1,000 in 1999 and per capitaconsumption growth in 2000 is 5 percent and popula-tion growth is 1 percent. If the headcount index is40 percent in 1999, then the number of poor is 400.With a headcount elasticity of 1.5, the headcount indexwould improve from 40 to 37 percent (40*(1–1.5*0.05)), assuming there is no change in the distributionof income. Total population in 2000 reaches 1,010,thus the number of poor is 374, a decline of 6.5 per-cent, whereas the headcount index improves by 7.5 per-cent. The difference is the population growth rate.
6. These comparisons are not strictly exact becauselast year’s 1999 levels do not incorporate the new sur-vey information nor other adjustments to the historicaldata.
7. The survey coverage in the Middle East andNorth Africa region is particularly sparse compared tomost other developing regions. Per capita GDP acrossthe region tends to be relatively high and thereforepoverty rates low, so small changes to poverty levels inone or two sizeable countries with a fair number ofpoor—for example Egypt or Yemen—can have a dis-proportionate impact on the regional poverty level.
8. For example specific tariffs penalize more com-petitive exporters with relatively lower prices.
9. In the case of the European Union, intra-EUtrade is excluded from the average tariff calculationand the reduction.
10. The formula for cutting the non-peak tariffs isgiven by the following expression:
The target average is τa1. The import levels are given by
M. All tariff peaks are reduced to τp1. All other tariffs
are reduced by the factor χ, given by the formulaabove. There is nothing preventing the adjustment fac-tor from being above 1 (that is, initial tariffs could in-crease to achieve the target reduction) or below 0 (thatis, non-peak tariffs would have to become negative toachieve the target). In the illustrative pro-poor sce-nario, the reduction factor is capped above by 1—inwhich case the average will be below the target, andbound below by 0 in which case the average will beabove the target. This is the case of Japan in agricul-ture. An alternative would be to further reduce thepeaks so that the target is achieved.
11. Setting the level of the maximum tariff can havesome unintended consequences. In the case of develop-ing country manufacturing tariffs, for example, settingthe maximum tariff to 20 percent instead of 15 percentcould actually reduce the overall average. The reason isthat all tariffs in the 15 to 20 percent band in the lat-ter (15 percent) case are bound to below 15 percent. Inthe former (20 percent) case those tariffs would be re-duced by a certain percentage amount—perhaps even100 percent. The difference in the average tariff willdepend on the number of tariffs within the 15 to 20percent band and the relative import weights.
12. The model is similar to that used to produce thegains from trade reform in Global Economic Prospects2002. More information regarding the nature of the simulations and a more detailed description of theresults is given in that report. The model documen-tation is available at //http://www.worldbank.org/prospects/pubs/techref.pdf. Global Economic Prospects2002 reported global merchandise trade reform gainsof $355 billion (in the static exercise). The gains haverisen modestly in this report—essentially for two rea-sons. We have upgraded the database from release 5.0of the GTAP data set to release 5.3, and we have a newbaseline reflecting two years of observed changes ineconomic performance and a (minor) reevaluation oflong-term growth prospects. The current model is alsobased on a different regional and sectoral aggregation,which can affect the impacts of trade reform. (Thereare more regions and sectors and, all else being equal,one would expect this to raise the real income gains byremoving some of the aggregation bias of trade policy
τ χ τ
χτ τ
τ
i i
a i p iii
i ii
i
M M
M
1 0
1 1
0
= ⋅ ∈
=−
∈
∈
∑∑∑
for {
{
{
Agric, Manu
Peak
Peak}
} where
}
G L O B A L O U T L O O K A N D T H E D E V E L O P I N G C O U N T R I E S
59

instruments). There have also been a few minor changesto model specification and parameters.
13. All figures, unless otherwise stated, refer tochanges in 2015 compared with the baseline level. Dol-lar amounts are measured in real terms and are basedon 1997 dollars. Figures can be converted to 2003terms by adjusting for economic growth and inflation.The former would involve dividing a figure by(1.03)^(2015–2003), where it is assumed that theglobal economy grows at 3 percent per annum in realterms between 2003 and 2015. The inflation adjust-ment involves multiplying a figure by (1.025)^(2003–1997) where it is assumed that the rate of infla-tion is 2.5 percent per annum between 1997 and 2003.(Both growth and inflation rates are approximations.)The total adjustment factor is 81 percent, so that theglobal gain of $295 billion in 2015 is more or lessequivalent to $235 billion in 2003 global GDP andprices.
14. Few dispute that trade openness will improveproductivity. There is nonetheless great incertitudeabout the channels—greater domestic competitiveness,imports of technology-laden goods, FDI, export-drivencompetitiveness—and the magnitude. The results re-ported herein are intended to illustrate the potentialmagnitudes.
15. This compares with a reduction of 114 millionpersons in the case of full merchandise trade reform.
16. The positive income gains—identified in virtu-ally all of the model’s regions—imply that transitionalmechanisms can be implemented, leaving everyone bet-ter off. Whether these mechanisms are designed andimplemented is an important issue, but typically the de-cision of local governments.
ReferencesGreener, Robert. 2002. “AIDS and Its Macroeconomic
Impact.” In Steven Forsythe, ed., State of the Art:AIDS and Economics. International AIDS andEconomics Network, 49–55. Available at http://www.iaen.org/library/statepidemic/chapter7.pdf.
Moatti, J. P., I. N’Doye, S. M. Hammer, P. Hale, and M.D. Kazatchkine. 2002. “Antiretroviral Treatmentfor HIV-Infected Adults and Children in Develop-ing Countries: Some Evidence in Favor of Ex-panded Diffusion.” In Steven Forsythe, ed., Stateof the Art: AIDS and Economics. InternationalAIDS and Economics Network, 96–117. Avail-able at http://www.iaen.org/library/statepidemic/chapter12.pdf.
UNAIDS. 2002. Fact Sheet: Regional Roundup: Sub-Saharan Africa. July. Available at http://www.unaids.org/barcelona/presskit/factsheets/FSssafrica_en.pdf
World Bank. 2003. Global Development Finance 2003.Washington, D.C.: World Bank.
G L O B A L E C O N O M I C P R O S P E C T S 2 0 0 4
60


Developing countries have become majorplayers in the global economyOver the past two decades, developing coun-tries have increased their share of global tradefrom about one-quarter to one-third. As agroup, they have moved beyond their tradi-tional specialization in agricultural and re-source exports into manufactures. Countriesthat were low income in 1980 managed to raiseexports of manufactures from roughly 20 per-cent of their total exports to more than 80 per-cent, and many have entered the ranks oftoday’s middle-income countries. The middle-income group of 1980 also increased its manu-factured share, but somewhat less rapidly, toreach nearly 70 percent. This dramatic changein trade volume and composition has given de-veloping countries a new interest—and a pow-erful voice—in the ongoing Doha round.
These changes are not just due to declines inthe prices of agricultural and resource com-modities relative to manufactures—the strongshift in the composition of exports shows upeven when price changes are removed. Further,it is not just an artifact of a few large, high-growth exporters such as China and India. Theshare of manufactures in the exports of devel-oping countries other than China and Indiarose from one-tenth in 1980 to almost two-thirds in 2001. It increased sharply, but notequally, in all regions. The share of manufac-tures in merchandise exports is now between80 and 90 percent in East Asia, Europe and
Central Asia, and South Asia, but only 60 per-cent in Latin America. Sub-Saharan Africa andthe Middle East and North Africa have yet toreach the 30 percent mark, and many coun-tries—particularly poor countries—remain de-pendent on exports of agricultural and resourcecommodities.
The rising tide of exports did not lift allboats. Forty three countries had no increase onaverage in their merchandise exports for the 20years after 1980. Of this group, 20 countries re-mained strongly dependent on oil or other nat-ural resources, such as phosphates for Nauru orcopper for Zambia. Severe conflicts undercutthe performance of another 18 countries, in-cluding Rwanda and Timor Leste. Trade em-bargos stifled the export performance of fiveother countries, including Libya and Sudan. Inalmost all these countries, the investment cli-mate was not sufficiently favorable—for arange of reasons, sometimes resource depletion,sometimes poor economic management—to at-tract the investments needed to transform thepattern of exports.
Developing countries are moving intohigh-value-added productsGrowth in traditional labor-intensive manufac-tures accounts for only part of the gain in ex-ports of manufactures. Exports of textiles andclothing from low-income countries grew at 14 percent per year between 1981 and 2001,but other commodity groups grew even faster.
63
Trade Patterns and Policies:Doha Options toPromote Development
2
Exports of electronic products, many of whichdid not exist in 1980, grew at 21 percent peryear—fast enough to double every few years.Further, developing countries expanded theirrange of markets, with the share of developing-country markets growing from 15 to 35 per-cent over the period. The continual move tonew products and new markets helped high-growth exporters like India and China to avoidsharp declines in their terms of trade, which,given the rapidity of their export growth, mightotherwise have been expected.
Between 1991 and 2001, all regions im-proved their competitiveness in the globalmarketplace as measured by market share. Eu-rope and Central Asia, Latin America, andSouth Asia outperformed the other regions,but all gained market share at the expense ofthe rich countries. This was not true in thepreceding decade, when several regions lostmarket share, notably Europe and CentralAsia, the Middle East and North Africa, andSub-Saharan Africa.
Why did such rapid and fundamentalchanges in trade patterns occur?Investments in people and in factories bothplayed a role. Average educational levels andcapital stock per worker rose sharply through-out the developing world. Also, improvementsin transport and communications, in conjunc-tion with developing-country reforms, allowedthe production chain to be broken up intocomponents, with developing countries play-ing a key role in global production sharing.
Policy was no less important. The dramaticliberalization of tariff and nontariff barriers indeveloping countries after the mid-1980s in-creased developing countries’ competitiveness.The negative impacts of protection on all ex-port activities declined, but more so for manu-factures and processed primary products thanfor agriculture and natural resources. Althoughsuccessive multilateral trade rounds liberalizedglobal manufactures, rich countries continuedto protect their agriculture. That pattern has
been progressively emulated by developingcountries over the last two decades, with the re-sult that developing countries’ agricultural ex-ports grew more slowly than if agriculture hadtaken the liberalizing path of manufactures.
Now comes the hard part: reducingprotection of sensitive sectorsDeveloping-country exports now face obsta-cles in the most sensitive sectors. Industrial-country tariffs on manufactures from develop-ing countries are five times higher than theyare on manufactures from other industrialcountries. The barriers imposed by developingcountries on other developing countries, how-ever, are even higher. Of course, protectiontakes forms other than ad valorem tariffs—among them quotas, specific duties, and an-tidumping duties. As with tariffs, these mea-sures tend to be used more frequently againstthe labor-intensive products from developingcountries. Average antidumping duties are tentimes higher than tariffs in industrial coun-tries, and around five times higher than in de-veloping countries. In short, both groups ofcountries impose substantially higher barrierson exports from developing countries.
The way in which protection is reduced willmake a difference to developing countriesSeveral approaches—modalities—for negotia-tions have been proposed for reducing tariffson agricultural and nonagricultural goods. The146 World Trade Organization (WTO) mem-bers are now discussing formulas that provideenough discipline to bring about liberalizationand address tariff peaks and escalation, whileoffering enough flexibility to accommodate theconstraints of all members. Besides tariffs, re-form of the rules on antidumping measures is acritical priority. Antidumping measures, origi-nally intended as a response to anticompetitivebehavior, are now widely regarded as beingused to facilitate market cartelization and areincreasingly a source of nontransparent andcostly protection.
G L O B A L E C O N O M I C P R O S P E C T S 2 0 0 4
64
Changing patterns in developing-country exports
Historically, developing countries havebeen regarded as exporters of primary
commodities and importers of manufactures,a theme repeated even in recent textbooks ondevelopment (Todaro 1994). The situation haschanged drastically since the beginning of the1980s, however, as developing countries havebecome important exporters of manufactured
products (figure 2.1). Manufacturing exportshave risen in importance in high-income coun-tries, with their share in total exports risingfrom around 70 percent to more than 80 per-cent in the 20 years preceding 2001. This shiftwas much more marked in the middle- andlow-income countries. In the middle-incomegroup, the share of manufactures in total ex-ports rose from 20 percent to almost 70 per-cent over the period. In low-income countries,
T R A D E P A T T E R N S A N D P O L I C I E S : D O H A O P T I O N S T O P R O M O T E D E V E L O P M E N T
65
Figure 2.1 Developing countries have become important exporters of manufactured products
Share of exports by sector, 1981–2001 (percent)
d. During the same period, export patterns ofhigh-income countries have remained stable
0
Manufacturing exports
Agricultural exports
Resources exports
1981
1983
1985
1987
1989
1991
1993
1995
1997
1999
2001
10
20
30
40
50
60
70
80
90
100
�
�
�
Share of exports by sector, 1981–2001 (percent)
b. When China and India are excluded, manufacturesstill make up more than 60 percent of exports
0
Manufacturing exports
Agricultural exports
Resources exports
1981
1983
1985
1987
1989
1991
1993
1995
1997
1999
2001
10
20
30
40
50
60
70
80
90
100
�
��
Share of exports by sector, 1981–2001 (percent)
c. Manufactures make up nearly 70 percent of exportsfrom middle-income countries
0
Manufacturing exports
Agricultural exports
Resources exports
1981
1983
1985
1987
1989
1991
1993
1995
1997
1999
2001
10
20
30
40
50
60
70
80
90
100
�
�
�
Share of exports by sector, 1981–2001 (percent)
a. Manufactured products now make up approximately80 percent of exports from low-income countries
0
Manufacturing exports
Agricultural exports
Resources exports
1981
1983
1985
1987
1989
1991
1993
1995
1997
1999
2001
10
20
30
40
50
60
70
80
90
100
�
�
�

the share of manufactures rose from 20 per-cent to more than 80 percent.
Nor are China and India the only countriesdriving these changes. Even when China andIndia are excluded, the rise in the share of man-ufactures is from 10 percent to more than 60percent of total exports. Clearly, China andIndia are important, but much broader changesin the composition of developing-country ex-ports are under way. If we eliminate the dispro-portionate effects of large exporters altogether,by considering simple average export shares,the average share of manufacturing exportsrose from 25 percent to 50 percent in the un-weighted low-income country group, and from28 to 48 percent in the middle-income group.
The share of manufacturing exports in totalexports has risen sharply in all regions (figure2.2). In East Asia and the Pacific, the increasebegan from a high base—over 50 percent—butthen increased to almost 90 percent by 2001. InEurope and Central Asia, the manufacturesshare began at an even higher level, over 60percent, and rose to almost 90 percent by2001. Because of Latin America’s strong nat-ural resource endowments (de Ferranti, Perry,Lederman, and Maloney 2002) the situationthere was quite different initially, with manu-factures contributing only 20 percent of totalexports in 1981. That share had almost tripledby 2001—to more than 60 percent. In the Mid-dle East and North Africa, resource exports,particularly oil, remain dominant, althoughtheir share fell from more than 90 percent toaround 60 percent during the period underscrutiny, while the importance of manufactur-ing exports rose from close to zero to around30 percent. In South Asia, manufacturing ex-ports rose from around half of total exports tomore than 80 percent. Resource-based exportsand agricultural exports remained important in Sub-Saharan Africa, although the share ofmanufactures rose from 10 to 27 percent.
Clearly, agricultural and resource exportsremain important for many countries and re-gions, particularly in Africa. However, thebroad-based nature of the shift into manufac-turing exports means that developing-countrypolicymakers and others concerned about de-
velopment must consider the impact of poli-cies on trade in manufactured products.1
Developing countries are moving up thevalue-added ladderA decomposition of the growth rates of ex-ports from each group of countries by level oftechnology indicates that developing countriesare gaining ground in higher-technology ex-ports (table 2.1). The low-income group hadby far the highest growth rate of total exports,at 14 percent per year—a rate sufficient tocause exports to expand 14-fold over the 20-year period considered.2 The middle-incomecountries also experienced substantially highergrowth rates than the high-income countries,suggesting that developing countries have beencatching up with developed countries in theirtrade patterns—in strong contrast with the in-dications of divergence observed in many anal-yses of economic growth (Pritchett 1997).
At the product level, growth in exports ofraw primary products was relatively low, at 2 percent per year globally. In processed agri-cultural products, such as meats, processedfoods, alcoholic beverages, tobacco products,and processed woods, growth rates were sub-stantially higher, at 6 percent globally, 7 per-cent for the low-income country group ex-cluding China and India, and 12 percent forChina and India.
Trade in low-technology manufactures(such as textiles and clothing), simple manu-factures (toys, sporting goods), and iron andsteel products grew at rates substantially abovethe world average rate. Exports of these prod-ucts from the low-income country group grewat much higher rates than from other coun-try groups, with export growth rates of 14 per-cent for textiles and 16 percent for other low-technology products.
In medium-technology manufactures, a sim-ilar pattern emerges, with global growth ratesabove the world average, and growth rates ofexports from low- and middle-income coun-tries greatly outstripping rates from the high-income countries. Exports of automobiles andcomponents from low- and middle-incomecountries grew particularly rapidly, at more
G L O B A L E C O N O M I C P R O S P E C T S 2 0 0 4
66
T R A D E P A T T E R N S A N D P O L I C I E S : D O H A O P T I O N S T O P R O M O T E D E V E L O P M E N T
67
Figure 2.2 Manufactures account for a growing share of exports in all regions
Source: COMTRADE.
Share of exports by sector, East Asia and Pacific, 1981–2001(percent)
a. Manufactures now make up almost 90 percent ofexports from East Asian developing countries
0
Manufacturing exports
Agricultural exports
Resources exports
1981
1983
1985
1987
1989
1991
1993
1995
1997
1999
2001
10
20
30
40
50
60
70
80
90
100
Share of exports by sector, Europe and Central Asia,1981–2001 (percent)
b. The same is true of the developing countries of Europeand Central Asia
0
Manufacturing exports
Agricultural exports
Resources exports
1981
1983
1985
1987
1989
1991
1993
1995
1997
1999
2001
10
20
30
40
50
60
70
80
90
100
�
�
�
�
��
Share of exports by sector, Latin American and theCaribbean, 1981–2001 (percent)
c. The share of manufactures in exports from LatinAmerica and the Caribbean tripled in the last two decades
0
Manufacturing exports
Agricultural exports
Resources exports
1981
1983
1985
1987
1989
1991
1993
1995
1997
1999
2001
10
20
30
40
50
60
70
80
90
100
�
�
Share of exports by sector, Middle East and North Africa,1981–2001 (percent)
d. Manufactures grew from insignificance in exports from the Middle East and North Africa
0
Manufacturing exports
Agricultural exports
Resources exports
1981
1983
1985
1987
1989
1991
1993
1995
1997
1999
2001
10
20
30
40
50
60
70
80
90
100
�
��
�
Share of exports by sector, South Asia, 1981–2001(percent)
e. Manufactures grew to almost 80 percent of exports from South Asia
0
Manufacturing exports
Agricultural exports
Resources exports
1981
1983
1985
1987
1989
1991
1993
1995
1997
1999
2001
10
20
30
40
50
60
70
80
90
100
�
�
Share of exports by sector, Sub-Saharan Africa, 1981–2001(percent)
f. The share of manufactures in exports from Sub-SaharanAfrica nearly tripled, but from a low baseline
0Manufacturing exports
Agricultural exports
Resources exports
1981
1983
1985
1987
1989
1991
1993
1995
1997
1999
2001
10
20
30
40
50
60
70
80
90
100
�
�
�
�

Table 2.1 Developing countries are becoming exporters of high-value productsAnnual growth rates (percent)
Low income,less China Low China and Middle Highand India income India income income World
Primary products 1 2 5 1 4 2Resource-based manufactures
Agricultural 7 8 12 6 6 6Other 4 7 10 5 5 5
Low-technology manufacturesTextiles 14 15 15 7 5 8Other 16 19 20 10 6 8
Medium-technology manufacturesAutomotive and components 22 20 19 19 7 8Process industry products 14 13 12 11 6 7Engineering products 21 23 24 12 7 8
High-technology manufacturesElectronic 21 26 36 17 10 13Other 10 16 20 12 9 9
Total 13 15 17 10 6 7
Note: Table 1 presents the annual growth rates by product group and by country groups assigned on the basis of 1981 incomelevels to avoid the selection bias that results when end-of-period attributes are used as the basis for selection. Product definitionsare supplied by the WTO. Data analysis undertaken in World Integrated Trade Solutions (WITS) using “mirror” data from UNCOMTRADE. Country groups defined by income status in 1981.While the results from this approach must be treated with somecaution, because the level of technology of the process involved is frequently more important than the technology level of theproduct, examining the nature of the products being traded is clearly of interest. Source: COMTRADE, WITS, WTO.
than 22 percent per year. Exports of engineer-ing products such as engines, pumps, andinstruments from low-income countries grewat close to 21 percent per year. The highestgrowth rates of all occurred in high-technologyproducts—particularly electronic goods, suchas computers, televisions, and components.World trade in these goods grew more thantwice as fast as overall world trade. Exportgrowth from low- and middle-income coun-tries was much faster again, with exports ofelectronic products from low-income countriesgrowing at the extraordinary rate of more than21 percent per year—enough to expand ex-ports almost 50-fold over the period.
Low-income countries are less reliant thanbefore on resource-based exportsThe importance of the growth rates notedabove depends greatly on the share of eachbroad product type—resource-based, low-technology, medium-technology, and high-technology—in total exports.
Low-income countries showed the mostdramatic transformation of export patterns
between 1981 and 2001 (figure 2.3). In 1981,these countries depended on resource-basedproducts for 87 percent of their exports, ashare that had fallen to 25 percent by 2001.The share of low-technology manufacturesrose substantially, from 13 to 38 percent,while that of medium-technology exportswent from 3 to 15 percent. High-technologyexports exploded from 2 to 21 percent.
The middle-income countries in 1981 wereoriginally much more dependent than othercountries on resource-based products—an im-portant contributor to their economic successup to that point (figure 2.3b). In 1981, re-source-based products accounted for 81 per-cent of their exports, a share that fell to a still-substantial 39 percent in 2001. The share oflow-technology manufactures rose from 9 to18 percent in the same countries, while theshare of medium-technology exports morethan tripled from 6 to 27 percent, and high-technology manufactures jumped from 3 to 24percent.
The transformation of high-income coun-tries’ exports was much less dramatic than for
G L O B A L E C O N O M I C P R O S P E C T S 2 0 0 4
68

the developing countries. The share of resource-based exports fell from 37 to 5 percent, whilethe share of low-technology exports remainedclose to 13 percent (figure 2.3c). The exportshare of medium-technology manufacturesrose from 36 to 38 percent, while that of high-technology exports increased sharply—from13 to 24 percent of total exports.
Global production sharing is creating new opportunitiesMuch of the change in developing-countryexport patterns, and particularly the rise inhigh-technology exports, is associated withthe phenomenon of global production sharing(Deardorff 2001; Hummels, Ishii, and Yi2001). Production sharing benefits rich andpoor countries by allowing production to bebroken into discrete stages, each performed in
the countries best suited to it. Labor-intensivestages of production, for example, are typi-cally done in labor-abundant countries. Poten-tially, production sharing can greatly expandthe range of activities in which developingcountries can participate—holding out thepromise of increasing employment and reduc-ing poverty.
Of course, breaking the once-rigid linkagesamong stages in the production process makesit more difficult to interpret the implications ofthe shift to manufactures—particularly high-technology products. In many cases, developingcountries undertake only those production ac-tivities that require low-skilled labor—a low-tech part of the production of high-tech com-modities. However, the buoyant demand forsuch commodities helps offset the relativelystagnant demand for some traditional agricul-
T R A D E P A T T E R N S A N D P O L I C I E S : D O H A O P T I O N S T O P R O M O T E D E V E L O P M E N T
69
Not all countries participated in the otherwisepositive trends for developing countries. Forty-
nine countries experienced negative real growth ratesover the 20-year period for merchandise exports. Six of the 49 were tourism-based economies that did poorly in merchandise trade but in fact experi-enced rising national incomes associated withtourism exports.
Of the 43 export-contracting countries, poorperformance was attributable to combinations ofexcessive dependence on one or two primary prod-ucts, civil conflict, and politically motivated tradeembargoes—often complicated by inept governance.In 1981, these countries derived an average of 85percent of their export earnings from primary prod-ucts; 20 years later the average was 75 percent. Ofthe 43 countries, 20 were less-developed countries.
Twenty cases were heavily dependent on one ortwo primary products, such as oil (Cameroon), phos-phates (Nauru), or copper (Zambia), and failed todiversify over the next two decades. Cameroon, forexample, despite its richness in natural resources,relies on oil for about one-third of export revenues,and timber or cocoa for much of the rest, leaving itvulnerable to fluctuation in the prices of these com-
Box 2.1 Poor export performance in 43 countriesmodities. The oil boom led to a significant increasein public spending and a top-heavy civil service,which makes it difficult to respond swiftly to de-creases in the price of oil. To make matters worse,the lack of a clear agricultural policy transformed thecountry into a net importer of food, accelerating thealready deteriorating trade balance.
Eighteen countries experienced severe conflictsor war—among them Comoros, Rwanda, and TimorLeste. Another five countries, including Libya andSudan, experienced trade embargoes.
A more felicitous tale is that of Barbados, one ofthe tourism-based economies. In 1981 the countrywas highly dependent on sugar. But progressive andstable political leadership, investments in education,and public investments in infrastructure to supporttourism diversified and transformed the economy.Barbados once had the same per capita income asJamaica; today it is one of the most prosperouscountries in the Caribbean, with a per capita GDP of $9,700 in 2000.
Source: World Bank staff.

tural commodities and can create importantproductivity gains through learning-by-doingand the expansion of productive firms.
The move to global production sharingheightens the importance of timely, efficient,and low-cost transportation. Even quite smalldifferences in transport costs and the timelinessof transportation services can have quite dra-matic consequences for national incomes.Hummels (2001) estimates that an increase ofone day in the time taken to deliver a good isequivalent to an increase of 0.8 percent in thecost, not just of transportation, but of the gooditself. Redding and Venables (2001) concludethat differences in transport costs in a world ofglobal production sharing may account for alarge proportion of the observed differences inincomes among countries. In this mode of pro-duction, countries must pay transport costs toobtain their inputs and to consign their out-puts. If value added is a small share of outputvalue, as is frequently the case, then transportcosts have enormous leverage on the residualreturns available to pay workers and owners of capital. If value added is 20 percent of thegross output value in the absence of tradecosts, for example, then a transport cost of 10percent of output to ship products out, and anequal cost to bring in components, could wipeout returns to productive factors.
To gain an idea of the potential importanceof global production sharing in developingcountries, we have calculated indexes of verti-cal specialization of the type developed byHummels, Ishii, and Yi (2001) for several de-veloping countries. These indexes expose theshare of imported inputs embodied in each unitof goods exported—either directly or after indi-rect use of imported inputs is taken into ac-count. Although imperfect—they do not allowfor differences between export- and domesti-cally oriented sectors in their use of inter-mediate inputs—these measures provide astructured assessment of the extent and changesin production sharing.3 Two sets of results arepresented in figure 2.4. The lower bars estimatethe share of export value accounted for by di-rect use of imported intermediates, whereas the
G L O B A L E C O N O M I C P R O S P E C T S 2 0 0 4
70
Figure 2.3 Technology-laden manufactureshave increased as a share of exports fromeach group of countries, while the share ofresource-based exports has diminished
100
a. Low-income countries are moving out of resource-based industries into low-technology exports
1981
2001
90
80
70
60
50
40
30
20
10
0Resource-
basedLow tech Medium
techHigh tech
Share of exports by sector, low-income countries,1981–2001 (percent)
100
90
80
70
60
50
40
30
20
10
0Resource-
basedLow tech Medium
techHigh tech
b. Middle-income countries are increasing the level oftechnology in their exports
Share of exports by sector, middle-income countries,1981–2001 (percent)
100
90
80
70
60
50
40
30
20
10
0Resource-
basedLow tech Medium
techHigh tech
c. In high-income countries, the share of high-technology exports has risen rapidly
Share of exports by sector, high-income countries,1981–2001 (percent)
�
�
Source: COMTRADE.

higher bars represent direct plus indirect use ofimported intermediates.
The importance of global production shar-ing in India has more than doubled since1980. In China, even though production shar-ing began from a considerably higher levelthan in India, it almost doubled over the pe-riod, to 22 percent. Even so, the estimates un-derstate the importance of global productionsharing in China, where policy has strongly fa-vored the use of imported inputs in labor-intensive production of manufactures (Iancho-vichina 2003), and where exports based onthe processing of imported intermediates ac-count for about half of total exports. How-ever, the graph highlights the substantial in-crease in the importance of the phenomenonin China over the period—particularly since1987, when duty-free access was extended toa wide range of imported intermediates usedin the production of exports.
To take several other examples, Singapore’seconomy is much more integrated into theworld economy than is middle-income Colom-bia. Singapore’s total vertical specializationindex hovered around 60 percent of the valueof its exports over the past two decades, witha direct specialization index of more than 50percent. By contrast, in Colombia, the total
index rose from 6.4 to 7.9 percent—not muchmore than a tenth of Singapore’s. AlthoughColombia’s larger economy would be expectedto show less vertical specialization than Singa-pore’s, the fact that it is so much less integratedthan China’s or India’s suggests that con-straints on transport and communications maybe inhibiting Colombia’s participation inglobal production sharing.4
China and India have tightened their inte-gration with the world economy since 1980.Their experience suggests that successful ex-porters of manufactures can avoid the prob-lems of declining terms of trade that preoccu-pied many thinkers in the 1950s and 1960s(Bloch and Sapsford 2000) and that remain im-plicit in many current models of world tradeand growth. A striking feature of the expansionof exports from developing countries is that theterms of trade of countries whose exports haverisen extremely rapidly have not deteriorated tothe extent that one might predict using conven-tional economic models. Most of the modelsused by economists would predict that large in-creases in exports would be followed by sub-stantial declines in export prices, as countriesexported more and more of the same products.
Declines in the terms of trade of China,India, and other high-export-growth countries,
T R A D E P A T T E R N S A N D P O L I C I E S : D O H A O P T I O N S T O P R O M O T E D E V E L O P M E N T
71
Figure 2.4 Global production sharing is increasingly important for China and IndiaShare of imported inputs in a unit of exports, India, 1980–1998 (percent)
25
20
15
10
5
01980
Direct use(India) Direct use
(China)
Direct andindirect use(India)
Direct andindirect use(China)
1985 1990 1995 1998
�
�
�
�
Source: World Bank staff.

however, have been much more modest thanwould be expected given their high rates of ex-port expansion. China’s export revenues grewalmost thirty-fold (3,000 percent) in valueterms between 1979 and 2001 (figure 2.5).Over the same period, the ratio of China’sexport prices to import prices—its terms oftrade—declined by nearly 30 percent. Clearly,China’s gains in export value would have been
considerably greater had the terms of trade not deteriorated in this way, but the gains ingrowth of export value, and its purchasingpower, were clearly enormous. While reapingimmense benefits from its burgeoning exporttrade, China essentially shared some of thosebenefits with its trading partners in the form ofimprovements in their terms of trade. India’sexports grew sevenfold during the same period,
G L O B A L E C O N O M I C P R O S P E C T S 2 0 0 4
72
Figure 2.5 Soaring exports from China and India had only a moderate effect on China’sand India’s terms of trade
Terms of trade and exports of goods and services, 1979–2001 (billions of dollars)
a. China
Terms of trade and exports of goods and services, 1979–2001 (billions of dollars)
b. India
0
20
40
60
80
100
120
140 350
300
250
200
150
100
50
0
1979 1981 1983 1985 1987 1989 1991
Terms of trade [left scale]
Exports of goods and services[right scale]
1993 1995 1997 1999 2001
�
�
1979 1981 1983 1985 1987 1989 1991
Terms of trade [left scale]
Exports of goods and services[right scale]
1993 1995 1997 1999 2001
�
�
0
10
20
30
40
50
60
70
80
0
20
40
60
80
100
120
140
160
Source: World Bank staff.

while its terms of trade deteriorated by perhaps4 percent.
A key to the apparent discrepancy betweenthe predictions of economic models and actualoutcomes is that export growth in some devel-oping countries appears to have been accom-panied by vigorous expansion in the range of products exported and in the markets inwhich those exports were sold (Hummels andKlenow 2002; Kehoe and Ruhl 2002; Evenettand Venables 2003), and by increases in thequality of the goods exported (Schott 2002).These important developments mean that pol-icymakers in developing countries can worrymuch less about declining terms of trade ifthey can focus on reform of policies—both atthe border and behind it—and on competingsuccessfully in new products and markets.
Clearly, the dramatic changes seen in devel-oping countries’ export patterns can be ex-pected to have a major impact on their inter-ests in the current WTO negotiations. In theearly 1980s, before the Uruguay Round, de-veloping countries relied heavily on exports ofresource-based products and had relativelylimited interest exports of manufactured prod-ucts, which until then had been the focus ofWTO negotiations on market access. Sincethat time, however, the interests of the middle-income countries and the many poor countriesthat now export high-technology productshave broadened dramatically. Further, giventhe dramatic increase in vertical specializationin production, all countries are much more de-pendent on the availability of the servicesneeded to support decentralized production—giving developing countries a much greaterstake in negotiations under the General Agree-ment on Trade in Services (GATS).
Behind the patterns: Economicand policy determinants
What caused the transformation in worldtrade patterns described in the previous
section? Did exports grow “passively” in re-sponse to expansion in world markets? Or did the observed growth depend on improve-
ments in competitiveness resulting from re-forms in policies, or on growth in investmentand productivity?
Differences between export growth in agiven region and average world growth ratescan be ascribed to two key factors: (1) growthin world demand for the region’s products and(2) increases in competitiveness because oflower output prices, improvements in quality,or shifts in the pattern of exports to productsin greater demand.
From 1981 to 1991, the developing coun-tries of East Asia experienced export growth of 232 percent, compared with the global aver-age growth rate of 115 percent. The demand forthe products exported from East Asia grewslightly faster than the world average, at 124percent, but East Asian export performance wasoutstanding primarily because of an increase in competitiveness that raised East Asia’s ex-ports by 109 percentage points relative to over-all market growth. Europe and Central Asia lostcompetitiveness over the same period, causingtheir exports to grow by 94 percent relative togrowth in the market for their exports of 124percent and to world export growth of 115 per-cent. The commodity-dependent exporters ofthe Middle East and North Africa sufferedheavily from contractions in the demand for the products they produced; the world marketfor their exports shrank by 21 percent. In addi-tion, they lost competitiveness within their ownproduct markets, with the result that their ex-ports fell by 24 percent over the period. By con-trast, the product mix of South Asian exporterswas helpful; the markets for their products grewby 129 percent over the period. South Asiancountries also experienced substantial improve-ments in competitiveness, which accounted foran additional 70 percentage points of exportgrowth, bringing their total export growth tojust under 200 percent. The market for theproducts exported by Latin America and theCaribbean expanded by 54 percent—less thanhalf the average for the world as a whole—butthese countries managed to gain an additional21 percent increase in their exports through in-creases in competitiveness.
T R A D E P A T T E R N S A N D P O L I C I E S : D O H A O P T I O N S T O P R O M O T E D E V E L O P M E N T
73

Table 2.2 Developing countries’ exports became more competitive in the 1990sSource of export growth relative to world average growth, 1981–2001 (percent)
1981–91 1991–2001
Total Demand Competitiveness Total Demand Competitiveness
Industrial countries 133 148 –16 48 70 –22Europe and Central Asia 94 122 –28 255 48 206East Asia and Pacific 232 124 109 139 75 64Latin America and Caribbean 75 54 21 137 50 87Middle East and North Africa –24 –21 –3 60 58 3South Asia 199 129 70 113 36 77Sub-Saharan Africa 10 20 –10 68 35 33World 115 — — 68 — —
Source: COMTRADE.
For 1991 to 2001, export growth in all de-veloping country regions outstripped that ofthe industrial countries (table 2.2). While highin East Asia and the Pacific, it was even higherin the developing countries of Europe and Cen-tral Asia, where market share responded to a dramatic improvement in competitiveness.5
Of the developing country regions, only EastAsia and the Pacific benefited from above-average growth in demand. But all regions ex-cept the Middle East and North Africa grew ator above world average growth rates throughincreases in competitiveness.
What explains improvements in competitiveness?Changes in production factors used by devel-oping countries probably improved their com-petitiveness. One of the most misunderstoodpredictions of economics is that changes in the factors employed in open economies willchange the mix of goods produced and ex-ported, rather than the prices of the input fac-tors. Increases in the amount of capital perworker in an open economy can, for instance,be expected to increase the share of outputfrom capital-intensive sectors, rather than de-press the return on capital. Similarly, increasesin the amount of education per worker can beexpected to increase the share of output fromknowledge-intensive activities, rather than de-clines in returns to education and increases inunemployment of skilled workers. In this re-spect, open economies are much better placed
than closed economies, where growth in anyfactor can be expected to depress its price, asthe domestic demand for the goods in which it is used intensively becomes saturated. Ofcourse, world markets, too, are finite, andrapid increases in supply can lead to declinesin world prices—as appears to have occurredin coffee markets in recent years. But worldmarkets are much larger than those of indi-vidual countries. The problem of saturation ismuch less likely to become serious for trade in manufactures, because there is much moretwo-way trade among developing countries inthese goods. For this reason, Martin (1993)found that each developing country was likelyto be better off if all developing countries ben-efited from increases in manufacturing pro-ductivity than if it alone benefited.
Other likely influences on the structure ofoutputs and exports include changes in tradeand investment policies; changes in the marketopportunities facing developing countries; andthe development of new market opportuni-ties in which developing countries alreadyhave, or can develop, a comparative advantage.Clearly, these influences are related—increasesin market opportunities and improvements intrade and investment policies are likely to stim-ulate investment in physical and human capital.
Increases in the importance of foreign di-rect investment are another contributing fac-tor to the changes in developing countries’participation in international trade. As docu-mented in World Bank (2002), foreign direct
G L O B A L E C O N O M I C P R O S P E C T S 2 0 0 4
74

investment grew dramatically during the 1990s.Not only did it bring capital to developingcountries, augmenting the total supply of cap-ital per worker, but it brought know-how, andconnections with other elements in the net-work of global production sharing.
One likely contributor to the observedchange in the mix of developing-country ex-ports is the rising amount of capital per workeravailable in some developing economies. InEast Asian economies, the annual growth ratesof capital per worker have been almost oneand a half times those in the advanced indus-trial countries (Nehru and Dhareshwar 1993;Nehru, Swanson and Dubey 1995). In otherregions, the average rate of growth in capitalper worker has been lower than in the indus-trial countries, even though some developingcountries outside East Asia have rates of savingand investment that match those found in EastAsia. Increases in the amount of secondary andtertiary education per worker have been muchhigher for most developing country regionsthan in the industrialized world—albeit fre-quently from a low level.
To the extent that these resources have beeneffectively employed, this deepening of finan-cial and human capital per worker can be ex-pected to encourage a shift away from labor-intensive activities toward activities that usemore capital and skills. Broad estimates of thegrowth rates of financial and educational cap-ital are presented in table 2.3 for each devel-oping country region. The first column mea-
sures the growth of capital per worker, whilesubsequent columns measure years of educa-tion and average years of secondary and ter-tiary education per worker. While these areonly crude measures of the growth of these in-puts per worker, they do represent an indica-tion of the efforts that have been made in de-veloping countries to increase the capital andskills available per worker.
The relationship between accumulation offactors of production and the export mix islikely to be quite complex, with countries firstexpanding their output of labor-intensive man-ufactures and then, beyond a certain level ofcapital and skills, moving into a different rangeof products (Schott 2003). Further, questionshave arisen regarding how effectively manycountries have been able to use the additionalcapital and human skills (Pritchett 2000,2001). It seems highly likely, however, that theobserved rapid increases in capital and skillsper worker have been important in many casesof successful development and that they arevital to long-term progress. Without large in-creases in the availability of skilled labor, itwould be difficult to explain the rapid in-creases in the exports of high-technology prod-ucts from developing countries—especiallyfrom the low-income countries. Even wherehigh-technology exports involve routine opera-tions performed on sophisticated imported in-puts, advanced organizational and technicalskills are needed to ensure consistent and reli-able supplies of high-quality exports.
T R A D E P A T T E R N S A N D P O L I C I E S : D O H A O P T I O N S T O P R O M O T E D E V E L O P M E N T
75
Table 2.3 Investment in people and in capital grew rapidlyPercent annual changes in factor endowments, 1960–90
Secondary TertiaryCapital Education education education
per worker per worker per worker per worker
Industrial 3.7 0.3 2.2 4.9Developing
East Asia and Pacific 5.1 4.2 9.2 3.4Latin America and Caribbean 2.4 2.0 5.3 6.7Middle East and North Africa 3.4 2.3 1.9 6.3South Asia 3.2 3.3 4.3 6.4Sub-Saharan Africa 2.1 4.2 9.7 12.6
Source: Nehru and Dhareshwar (1993); Nehru, Swanson, and Dubey (1995).

Lowering protection throughout thedeveloping world created newopportunities—Since the mid-1980s, the large-scale liberaliza-tion of trade policies in developing countrieshas widened market access and lowered theimplicit taxation on exports that import tariffsentail. Average tariffs in developing countriesfell to around 12 percent by 2000—aboutone-third of their level in 1983. This large re-duction was accompanied by even larger re-ductions in nontariff barriers and exchange-rate overvaluation—both of which stronglyexacerbated the protectionist effects of tariffsin the 1980s (World Bank 2000).
Absolute reductions in protection were evenlarger in individual countries. India, for exam-ple, reduced its average tariff from 100 percentin 1986 to 32 percent in 1999. While some re-ductions in protection have occurred in indus-trial countries—through tariff reductions andthrough abolition of nontariff barriers—thechanges have been quite small relative to thosein developing countries. Between 1980 and2001, the average tariff in industrial countriesfell from 9.8 to 3.7 percent—a significant fall,but much smaller than that observed in devel-oping countries, where the average tariff fellfrom 30 percent to 12.7 percent over the sameperiod.
These figures, and some standard assump-tions, allow us to divide up the contribution oftrade reform to developing country exportgrowth into a component due to countries’own liberalization and one due to improvedmarket access and export demand. The tariffreductions in developing countries reduced theprice of imports to domestic consumers by anaverage of 12 percent, while import prices inthe industrial countries were reduced by 3.4percent. The increase in the demand for ex-ports from developing countries is determinedby the reductions in import prices in their mar-kets—both in industrial countries and in otherdeveloping countries. Over the period from1986 to 2001, the industrial countries ab-sorbed two-thirds, on average, of developing-country exports. Therefore, we estimate the im-
provement in market access by weighting theprice change due to tariff cuts in industrialcountries by two-thirds and the reduction indeveloping countries by one-third, yielding anaverage price reduction for developing countryexports of 6.4 percent, almost exactly half thestimulus that comes from developing countries’own exports. This suggests that, in aggregate,developing countries’ own liberalization hasbeen the primary channel through which tradereform has expanded developing countries’export growth. Because reform in any one de-veloping country benefits other developingcountries as well, the total contribution of de-veloping country reform can be captured bycombining the “own-liberalization” effect withthe market-access benefits provided by otherdeveloping countries. When we do this, we findthat 88 percent of the stimulus to developing-country exports following tariff liberalizationderives from developing-country liberalization.
Such large reductions in protection can beexpected to have marked effects on the patternof exports, as well as their level. Protectionraises the costs of all domestic industries by in-creasing the costs of their inputs—includingboth intermediate inputs and factors.6 How-ever, this effect varies among sectors. Typically,manufactures are much more vulnerable to the adverse effects of protection because theyare more dependent than agricultural andresource-based activities on imported inter-mediate inputs. Further, this vulnerability hasgrown over time as production has movedfrom regionally integrated production—theoriginal approach taken by firms such as Fordand the large integrated steel mills in an earlierera of industrialization—to internationally in-tegrated production networks involving manyfirms and countries.
Protection regimes are often erected to pro-mote industrialization without thorough con-sideration of their impact on the production ofmanufactured goods and the structure of ex-ports. Tariffs and other trade barriers affectexports primarily by raising the costs of pro-duction inputs. Because protection policiesrarely improve the returns small developing
G L O B A L E C O N O M I C P R O S P E C T S 2 0 0 4
76

countries can obtain from sales of their ex-ports, their impact on exports can be judgedby considering their effect on the costs of in-termediate inputs—and hence on the returnsavailable for payment to factors. This can bedone simply by applying the concept of the ef-fective rate of protection to measure the effectof protection on the value added in exportproduction. While this approach underesti-mates the adverse effects of protection by ig-noring indirect cost-increasing effects, it pro-vides a simple and transparent indication ofthe direct effects.
—by reducing the implicit taxes on exportsThe burden on exports of tariffs on intermedi-ate input costs7 is illustrated by the cases ofBrazil, China, India, and Malawi in 1986,when estimated rates of average protectionwere first available for each country, and1997, following large reductions in protection(table 2.4). The impact of protection on ex-ports differs considerably from country tocountry, but two key features are evident.First, agricultural processing and manufactur-ing (whether labor or capital intensive) for ex-port are much more heavily taxed than areagricultural and resource commodities. Sec-ond, the rate of taxation has generally de-clined substantially since the mid-1980s, whileremaining substantial for industrial products.
At the levels of protection prevailing in1986, export activities in agricultural process-
ing and in capital- or labor-intensive manufac-tures were taxed at essentially prohibitivelevels. In India, the taxes directly imposed by protection on agricultural processing andcapital-intensive manufacturing averaged morethan 60 percent. (Nontariff measures, domes-tic licensing requirements, and exchange-ratedistortions, if computed, would have furtherincreased the effective tax.) In Brazil, the esti-mated impact of tariffs on returns from ex-porting manufactured products and processedagricultural goods was even more sharply neg-ative—around 70 percent. In China, the directimpacts of protection appear to have been onthe same order of magnitude, with agriculturalprocessing facing taxes of more than 70 per-cent and labor-intensive manufactures close to60 percent. These problems were compoundedby strong policy-driven obstacles to the expan-sion of state-run firms, which eventually weremitigated by the emergence of an entirely newclass of firms—the township and village enter-prises—not subject to the constraints of thestate-run firms. The export tax rates in Malawiappear to have been much lower than in Chinaand India, even before the reforms, perhaps be-cause such a small and trade-dependent econ-omy simply could not maintain the types oftrade barriers found in the bigger countries.
Although a very few agricultural processingand manufacturing activities that dependedless on intermediate inputs might have beenable to survive at average tariff rates of 100percent (as in India), it seems highly likely that
T R A D E P A T T E R N S A N D P O L I C I E S : D O H A O P T I O N S T O P R O M O T E D E V E L O P M E N T
77
Table 2.4 Tariffs hurt exports—but less so in the 1990s than in the 1980sCost penalties on exports associated with import tariffs (percent)
Brazil China India Malawi
1986 1997 1986 1997 1986 1997 1986 1997
Agriculture –43 –5 –28 –15 –14 –5 –9 –7Agricultural processing –83 –28 –72 –54 –64 –39 –20 –16Resources –45 –6 –14 –7 –9 –3 –6 –5Labor-intensive manufacturing –72 –17 –54 –35 –45 –23 –18 –15Capital-intensive manufacturing –79 –22 –46 –28 –60 –35 –11 –9Services –31 –3 –26 –14 –16 –6 –5 –4
Note: Effective rate of protection applying to exporters is the proportional change in returns to value-adding factors resultingfrom tariff protection.Source: World Bank data.

reductions in tariffs—and nontariff barriers—of the type observed around the world between1986 and 2001 (World Bank 2000) must havecontributed to the great expansion of develop-ing countries’ manufacturing exports.
Reductions in average tariffs were comple-mented by the introduction of duty-exemptionor drawback arrangements under which exportproducers obtained access to duty-free inputsfor use in export production. These arrange-ments offer one way, legal under GATT, to re-duce the burdens imposed by import duties.Some exporters, such as China, have used themsuccessfully to develop labor-intensive exports(Ianchovichina 2003; Ianchovichina and Mar-tin 2003).
However, such policies are an imperfect so-lution to the problems created by protection.Whether introduced throughout the economyor in specific free-trade zones, such arrange-ments are administratively demanding. In manycases, particularly in Africa, they have failed to operate successfully (Madani 1999). Further,they tend to encourage firms to concentrate onproduction activities that add a small amount ofvalue to imported inputs, rather than on activi-ties more closely integrated with domestic pro-duction. Ianchovichina (2003) found that ex-porting activities had become much moreimport-intensive than other industries as a resultof the incentives created by duty exemptions.Since one of the key lessons of the new eco-nomic geography is that there may be substan-tial gains from activities that encourage the development of backward—as well as for-ward—linkages (Amiti 2003), incentives to-ward shallow processing activities may causehighly protected economies to miss many op-portunities for growth. Reductions in overalltariffs are a much better alternative than dutyexemption. Not only do they remove the incen-tive for unnecessarily shallow specialization, butthey also reduce the price of nontraded goodsand factor inputs (Corden 1997), and furtherincrease the stimulus to production for export.
Another problem with relying on duty ex-emptions rather than relatively low and uni-form tariff rates is that their introduction re-
duces the pressure for more general reductionsin protection, since exporters—a potentiallypowerful source of pressure for reductions intariffs—no longer suffer the direct impact ofprotection (Cadot, de Melo, and Olarreaga2002).
Redressment of behind-the-border costs im-posed by inadequate infrastructure and ex-cessive, inappropriate regulation has alsohelped developing-country exports (Dollar,Hallward-Driemeier, and Mengistae 2003).Other behind-the-border problems includethose associated with clearance through cus-toms—excessive or arbitrary inspections or re-quests for documentation, demands for bribesor other informal payments, and so on. Sev-eral of these problems are dealt with in greaterdetail in chapters 5 and 6.
The dramatic changes in the nature of theirparticipation in world trade have greatlychanged the incentives of developing countriesto participate in the world trading system.When developing countries exported goods—cocoa, rubber, coffee—that did not compete di-rectly with those produced in developed coun-tries, they had little incentive to participate inpolitically difficult exchanges of market-accessconcessions that characterized the multilateraltrading system. At the same time, the effects onexports of their protection regimes were rela-tively subdued, since their primary exports—aswe have seen—required fewer intermediate in-puts. The shift to manufactures increases theimportance of access to markets in which thereis likely to be strong domestic competition.And the prices of export-oriented manufac-tures are, of course, very sensitive to the costsof intermediate inputs, since exporters are un-able to pass these costs on without pricingthemselves out of the market.
Market access for development:The agenda
Reciprocal exchanges of tariff reductions,the key element of all previous WTO ne-
gotiations, will be a critical element in the cur-rent negotiations. Tariffs, however, are not the
G L O B A L E C O N O M I C P R O S P E C T S 2 0 0 4
78

only issue. Two additional topics central tomarket access for developing countries are:
• The phasing out of textile and clothingquotas, and
• Frequent recourse to antidumping mea-sures.
Phasing out quotas on textiles andclothing is crucialThe commitment to phase out quotas on tex-tiles and clothing was made in 1994 as part ofthe Uruguay Round agreement. That commit-ment took the form of an Agreement on Tex-tiles and Clothing, under which quotas were to be phased out in three tranches. Productsaccounting for 16 percent of 1990 importswere to return to GATT disciplines immedi-ately, with an additional 17 percent returning in1998, and 18 percent in 2002. However, be-cause the imports used as the baseline includedproducts typically traded only by the industri-alized countries, importing countries were ableto meet their commitments without abolishingany significant quotas until the third phase ofintegration, beginning January 1, 2002. Thedelay in the abolition of quotas has meant thatperhaps 85 percent of the effective quotasagainst developing countries remain in effect—including the most restrictive. Unless the indus-trial countries go back on their solemn com-mitments, often reaffirmed, all of the remainingquotas will be abolished on January 1, 2005.
It is difficult to predict the impact of quotaabolition, since the textile industry is so heavilydistorted by quota and tariff protection in bothindustrial and developing countries. What isclear is that some countries, such as China andIndia, with strong underlying comparative ad-vantage in the production of these goods, havehad their exports sharply restricted by the pres-ence of the quotas. Other suppliers, much lessseverely restricted by quotas and/or tariffs, havebeen able to expand their exports considerably.This group includes three distinct categories:
• Exporters such as Hong Kong, China;Taiwan, China; and the Republic of
Korea, for which clothing and textiles areindustries that likely will be allowed todecline and “sunset”
• Exporters such as Mauritius and Cambo-dia, whose exports have been less tightlyrestricted by quotas and which have hadpreferential tariff access for at least somecommodities
• Countries such as Mexico and Turkeythat face neither quota constraints nortariff barriers in their major markets.
Abolition of quotas will remove much ofthe incentive for continued production in thefirst group of exporting countries and reducethe margin of preference enjoyed by the free-access countries. (Their preference will dropfrom the margin provided by tariffs plus theexport-tax equivalent of other countries’ quo-tas, to just the margin provided by tariffs.)
Results provided by simulation models sug-gest that countries such as China and India,which have relatively low production costs,are likely to make substantial gains in marketshare following abolition of the quotas (Yang,Martin, and Yanagishima 1997; François andSpinanger 2002). These results are condi-tioned on the assumptions of the models, andparticularly on differentials in the extent towhich the quotas restrict the exports of differ-ent countries. While some countries, such asChina, provide high-quality data on the extentto which the quotas restrict their exports, datafor many other exporters are much less widelyavailable. Another indicator of the underlyingcompetitiveness of individual exporters is theshare of their exports shipped to nonquotamarkets. The more efficient the supplier andthe more restrictive the quotas it faces, themore of its exports it will tend to ship to lesslucrative nonquota markets (figure 2.6).
While the share of clothing exports (usingWTO categories) exported to nonquota mar-kets is a crude index of the extent to which ex-ports are restricted by quotas, some interestingpatterns appear. The first is that some coun-tries—Albania, Costa Rica, Mexico, Morocco,Pakistan, and Tunisia—directed almost all of
T R A D E P A T T E R N S A N D P O L I C I E S : D O H A O P T I O N S T O P R O M O T E D E V E L O P M E N T
79

their clothing exports to the quota-restrictedcountries, suggesting that their quotas werelarge enough to let them focus on these mar-kets, or that their competitiveness did not allowthem to export to less-lucrative nonquota mar-kets. Another group of countries, such as theCzech Republic, India, Indonesia, and SouthAfrica, exported more than 10 percent of theirexports to nonquota markets—suggesting bothrestrictive quotas and an ability to compete atcurrently depressed world prices for clothing.Finally, Colombia and China exported 50 and79 percent, respectively, of their exports to non-quota markets. Countries in this category ap-pear likely to be highly restricted and to havestrong potential for expanding their exportsfollowing abolition of the quotas.
The abolition of some restrictive quotas inJanuary 2002 provides another source of in-sight into the implications of quota abolition.Because the abolished quotas covered only asmall fraction of total textile and clothing trade,one would expect a disproportionate responseto their disappearance, since additional re-sources waiting to be channeled into textilesand clothing could, for the moment, be redi-rected only into the products liberalized. In fact,a key feature of the adjustment to abolition of
these quotas has been rapid growth in exportsof these products, particularly from China.
Whether current supplying countries main-tain or lose market share following quota abo-lition will depend on whether they undertakereforms in advance to maintain their com-petitiveness. The current system contains, formany countries, disincentives for policy re-forms that lower costs, improve efficiency, andincrease supply. Increases in the supply of ex-ports from a country that has filled its quotasmust be shipped to a limited range of marketsnot constrained by quotas, where prices arelikely to decline if significant additional quanti-ties are exported (Elbehri, Hertel, and Martin2003). Once the quotas are abolished in theworld’s largest markets, however, the gainsfrom reforms that reduce costs are likely to bemuch greater. If countries use the greater com-petition that follows the abolition of quotas asa stimulus for reforms that increase productiv-ity, they stand to gain much more than theycould have hoped to gain in the past. Bhard-waj, Kathuria, and Martin (2001) point toareas in India, for example, where such reformsare needed to allow the industry to becomemore competitive. Needed reforms include:eliminating policies that create disincentives for
G L O B A L E C O N O M I C P R O S P E C T S 2 0 0 4
80
Figure 2.6 Many developing countries face an adjustment when quotas are liftedShare of clothing exports to nonquota markets by developing-country exporters, 2001 (percent)
AlbaniaMoroccoMauritius
TunisiaCosta Rica
MexicoPakistan
IndiaCzech Republic
MalaysiaTaiwan, China
South AfricaThailand
IndonesiaHong Kong, ChinaKorea, Republic of
ColombiaChina
0 10 20 30 40 50 60 70 80 90
Source: COMTRADE.

factory production, eliminating reservation ofparticular activities for handloom production,and improving duty exemption arrangements.The specific needs for policy reform will, ofcourse, vary across countries.
How will the phase-out of quotas on tex-tiles and clothing affect other sectors? By in-ducing highly competitive producers to shiftfrom other activities into textiles and clothing,the abolition of quotas is likely to reduce sup-plies of other goods, creating opportunities forother exporters. The likely response of Chi-nese industry, for example, to the abolition ofcurrent quotas on textiles and clothing is ashift in resources away from other goods(table 2.5). The specific results presented intable 2.5, produced using a model by Ian-chovichina and Martin (2001, 2003), shouldnot be seen as predictions of outcomes, how-ever, since the phase-in of China’s liberaliza-tion commitments under its WTO accession,and the continuing high rates of investment inphysical and human capital in China, tend tostimulate the output of many activities, in-cluding some of those mentioned in the table.
But the changes anticipated by the modeldo suggest the importance of examining thedisincentives for production of goods otherthan textiles and clothing. If a country has, forexample, a duty-exemption arrangement cov-ering the needs of the textile and clothing sec-tors and has not developed exports of other
manufactured goods, it is more likely to sufferfrom increased competition following aboli-tion of the textile and clothing quotas than ifit had a more balanced export pattern. Thus,policy should not only seek to improve pro-ductivity in the textiles and garment sector,but also to improve productivity in other sec-tors, where competition may be less intensefollowing abolition of the quotas.
How tariffs are reduced will affect thedevelopment promise of DohaGiven the mercantilist nature of internationaltrade negotiations, developing-country policy-makers contemplating the Doha DevelopmentAgenda will want to identify the export sec-tors in which they face the most significanttrade barriers. The average tariff barriers fac-ing exporters from each region are shown intable 2.6. Because separate negotiations onmarket access are being conducted for agricul-tural goods and nonagricultural goods, thetable is divided into two sections.
Tariffs imposed by the industrial countrieson imports from developing countries are typ-ically much higher than those they levy onother industrial countries. In agriculture, theindustrial countries impose an average 15 per-cent tariff on imports from other industrialcountries, whereas the rates on imports fromdeveloping countries range from 20 percent(Latin America) to 35 percent (Europe andCentral Asia). Outside of agriculture, the dis-crepancy is even more striking. Tariffs on im-ports from other industrial countries average 1percent, while those from developing countriesface tariff averages ranging from 2.1 percent(Latin America) to 8.1 percent (South Asia).
The differences in tariff averages reflect inpart the presence of major trading blocs suchas the European Union and the North Ameri-can Free Trade Agreement (NAFTA), whichinclude key industrial-country trade partners.In part, also, they reflect differences in the pat-tern of exports and the broad profile of tariffs.In the GATT trade rounds during which thegreatest strides toward liberalization weremade (the Kennedy and Tokyo Rounds of the
T R A D E P A T T E R N S A N D P O L I C I E S : D O H A O P T I O N S T O P R O M O T E D E V E L O P M E N T
81
Table 2.5 Quota abolition in China willmove resources from other activities totextiles and clothingPercent change in export volumes
Sector Anticipated change
Apparel 125.7Automobiles and parts –22.8Cotton –8.6Electronics –10.6Leather and shoes –5.0Metal products –11.9Textiles 41.9Other manufactures –14.1
Source: Staff results from model of Ianchovichina and Martin(2001, 2003).
1960s and 1970s), developing countries werenot active participants in the trading of recip-rocal market-access concessions. Under the cir-cumstances, it was more likely that theirproducts would be omitted from the sharp re-ductions in tariffs made in those rounds.8
A reasonable objection to this interpreta-tion is that some developing countries facesubstantially lower tariff rates than are pre-sented in table 2.6 and may even benefit fromaccess to industrial country markets at pricesabove world market levels. This is true formany countries and groups of countries. Thecountries of the African, Caribbean, and Pa-cific group enjoy preferences on many of theirexports to the European Union. The least-developed countries receive preferences underthe Union’s Everything But Arms Agreement.Other countries receive preferences as mem-bers of Euro-Mediterranean agreements, theU.S.–Caribbean Basin Initiative, the U.S AfricaGrowth and Opportunity Act, and preferencesprovided to least developed countries and
other developing countries under the General-ized System of Preferences.
Recent research suggests, however, that con-ditions such as rule-of-origin requirements re-duce the benefits provided by such agreementssubstantially below the gains implied by thenominal preferences (Brenton 2003). Further-more, many of these countries suffer from re-strictions on their access to markets for a widerange of other products. And other countrieswith a large fraction of the world’s poor receiveno benefit at all from these preferences—in factthey are harmed by diversion of their exportsto preference-receiving countries. China andIndia alone contain well over 500 million peo-ple living on $1 per day or less (World Bank2003). These countries receive only minimalbenefit from these preferential arrangements.
Developing countries tend to levy highertariffs on imports from other developing coun-tries than do the industrial countries (table2.7). This is particularly striking in the case ofagricultural products, where the tariffs levied
G L O B A L E C O N O M I C P R O S P E C T S 2 0 0 4
82
Table 2.6 Industrial countries levy higher tariffs on imports from developing countriesthan from other industrial countries—and some regions have high tariff wallsProtection rates facing exporters in each region, 1997 (percent)
Importing Region
Europeand Sub-
East Central Latin Middle South SaharanExporting Region Asia Asia America East Asia Africa Industrial
AgricultureEast Asia 31.0 30.3 15.5 45.3 38.4 19.0 30.5Europe and Central Asia 24.2 36.4 23.8 55.3 34.2 12.7 35.1Latin America and Caribbean 42.1 36.0 14.8 50.3 29.7 24.7 20.4Middle East 23.0 43.4 14.9 76.4 31.8 18.9 23.4South Asia 16.6 34.6 13.7 41.1 27.7 11.0 25.8Sub-Saharan Africa 26.7 20.3 14.4 39.1 30.9 33.6 23.6Industrial 33.3 43.7 20.1 65.4 16.4 24.0 15.3
NonagricultureEast Asia 8.2 13.8 15.1 12.2 28.1 14.5 5.1Europe and Central Asia 6.4 6.4 11.4 8.6 25.8 12.8 5.9Latin America and Caribbean 4.3 6.7 15.4 8.9 19.4 11.9 2.1Middle East 5.4 11.5 8.8 11.4 33.6 11.7 6.0South Asia 7.1 11.0 13.6 10.2 19.0 17.4 8.1Sub-Saharan Africa 4.4 6.1 11.7 6.1 27.6 20.6 4.2Industrial 7.4 9.6 8.5 10.4 25.2 12.2 1.0
Source: Weighted averages calculated using GTAP Version 5 Database (www.gtap.org). Most-favored-nation rate except for major free-trade blocs such as the European Union and the North American Free Trade Agreement. Does not include otherpreference schemes.

on developing-country exports are frequentlytwice as high as the already high rates levied bythe industrial countries. For nonagriculturalproducts, the differences are even greater inproportional terms. The tariffs imposed bySouth Asia on imports from developing coun-tries, for instance, are frequently five times ashigh as the rates imposed by industrial coun-tries. It is also notable that countries levy hightariffs on imports from other countries in theirregion, particularly in Sub-Saharan Africa,where the average tariff levied is higher onAfrican products than on imports from anyother region.
How important are the effects of the tariffrates discussed above? The answer depends onthe size of the trade volumes to which theyapply. One way to get a rough indication of theimportance of tariffs in particular markets is toexamine the value of the duty charged on ex-ports to that market. This measure effectivelyweights each tariff rate by the value of the tradeto which it applies. Although clearly flawed in
cases where trade flows are strongly inhibitedby high tariff rates or where much trade takesplace at preferential rates, the measure doesprovide at least a crude adjustment for the rel-ative importance of different markets.9
In agriculture, all developing regions facetheir most significant barriers in the industrialcountries. Although the burden is greatest inSub-Saharan Africa, where over 70 percent ofthe barriers faced are imposed by the indus-trial countries, the industrial countries ac-count for more than 50 percent of the barriersfacing all developing regions except SouthAsia and the Middle East and North Africa.Even there, industrial-country barriers aresubstantial, accounting for almost half of thetotal direct burden imposed on their exports.In only one region, the Middle East and NorthAfrica—where barriers imposed by othercountries of the region loom particularlylarge—do the barriers erected by the develop-ing world approach the effect of those im-posed by developed countries. After the devel-
T R A D E P A T T E R N S A N D P O L I C I E S : D O H A O P T I O N S T O P R O M O T E D E V E L O P M E N T
83
Table 2.7 Developing countries pay large amounts in tariffs to their neighborsThe share of the burden on each region’s exports imposed by region of destination (percentage of total barriers faced byexporting region)
Importing Region
Europeand Sub-
East Central Latin Middle South SaharanExporting Region Asia Asia America East Asia Africa Industrial Total
AgricultureEast Asia 32.8 0.7 0.6 5.6 4.7 2.1 53.6 100Europe and Central Asia 1.7 19.8 0.6 13.9 0.4 1.4 62.3 100Latin America (LAC) and Caribbean 13.7 1.6 10.8 14.8 1.4 1.9 55.6 100Middle East and North Africa 2.1 3.0 0.6 44.4 1.6 1.0 47.3 100South Asia 12.6 2.0 0.7 28.2 7.5 1.8 47.4 100Sub-Saharan Africa 7.1 2.3 0.4 4.8 4.0 10.0 71.4 100Industrial 16.1 3.2 5.0 19.1 0.6 2.7 53.3 100
NonagricultureEast Asia 37.4 1.5 6.3 4.8 5.9 4.2 39.9 100Europe and Central Asia 2.8 13.5 2.1 5.8 2.0 2.9 71.0 100Latin America and Caribbean 3.7 0.3 63.8 1.7 1.2 1.5 27.7 100Middle East and North Africa 8.2 1.8 2.4 12.4 28.6 3.1 43.4 100South Asia 8.8 0.6 3.1 9.7 6.8 7.9 63.0 100Sub-Saharan Africa 9.0 0.7 4.2 1.7 7.7 40.4 36.3 100Industrial 31.1 6.8 15.3 14.3 6.5 6.1 19.9 100
Source: Weighted averages calculated using GTAP Version 5 Database (www.gtap.org). Most-favored-nation rate except for majorfree-trade blocs such as the European Union and the North American Free Trade Agreement.

oped countries, however, the most importantbarriers are often found in neighboring coun-tries, as in the case of East Asia, where neigh-bors’ barriers account for almost a third of thebarriers facing exporters, and the Middle East,where they account for close to 50 percent.
In nonagricultural trade, industrial-countrybarriers are clearly much more important thanwould be implied by the relatively low tariffrates shown in table 2.7. Their importance toexporters, however, varies substantially by re-gion. For developing countries in Europe andCentral Asia, they are particularly important,accounting for over 70 percent of total levieson exports. Industrial-country barriers arealso particularly important in South Asia,where they account for close to two-thirds ofthe tariff burden. By contrast, the industrial-country share is closer to 40 percent in EastAsia, the Middle East and North Africa, andSub-Saharan Africa, and under 30 percent inLatin America and the Caribbean. For the in-dustrial countries themselves, barriers in otherindustrial countries are now relatively small,at under 20 percent of the total, a fact that un-doubtedly contributes to developed countries’interest in securing trade liberalization in de-veloping countries. These generalizations not-withstanding, the differences mask country-level patterns, obliging policymakers in eachcountry to do their own analysis.
Use of antidumping actions to generate protection has reached an advanced stageGATT and the WTO acknowledge the sover-eign rights of member countries to impose cer-tain new trade restrictions or to replace oldones. A number of these are “exceptions” tothe general intention of providing an open in-ternational trading system, such as import re-strictions that relate to national security. Oth-ers are part of the management of the tradingsystem. These are usually described as being al-lowed under “GATT/WTO rules” rather thanas “exceptions.”
Within the GATT/WTO system the generaljustification for such rules is that they allow
members to accommodate and at the sametime isolate a powerful interest that might oth-erwise set back an entire liberalization pro-gram.10 Since the Uruguay Round these traderules—particularly antidumping—have beeninvoked with increasing frequency—particu-larly by developing economies. Moreover,WTO members increasingly treat their use asa reserved right of unilateral protection simi-lar to the national-security exception, ratherthan as an instrument to manage an ongoingand multilateral process of liberalization. (Seebox 2.2.)
Recent data on the incidence of use of an-tidumping rules by broad country groups re-veal several ominous patterns. The first is atendency for both developed and developingcountries to resort to antidumping measures—1,979 between 1995 and June 2002 (table2.8). More antidumping actions were initiatedby developing countries against other develop-ing countries than by or against industrialcountries.
The emergence of developing countries asmajor users of antidumping measures is a re-cent phenomenon. The use of this form of pro-tection, which requires complex and expen-sive administrative processes, has traditionallybeen eschewed by developing countries. How-ever, perhaps in part because WTO has be-come less tolerant of some other avenues forintroducing discretionary protection, such asmeasures for balance-of-payment purposes,many developing countries have begun tomake use of antidumping measures. In 1996,767 antidumping actions were pending, ofwhich 581 had been introduced by industrialcountries. By June 2002, the number of pend-ing actions had grown to 1,189, of which 636had been initiated by industrial countries and553 by developing and transition economies.
All groups of countries show a striking ten-dency to impose antidumping measures dis-proportionately against the exports of devel-oping and transition economies. But when theactions shown in table 2.8 are divided by the dollar value of imports from each group,the result is that industrial countries impose
G L O B A L E C O N O M I C P R O S P E C T S 2 0 0 4
84

T R A D E P A T T E R N S A N D P O L I C I E S : D O H A O P T I O N S T O P R O M O T E D E V E L O P M E N T
85
On July 22, 2003, the New York Times wrote thefollowing editorial that illustrates well the vicissi-tudes of exporters in antidumping waters:
. . . After embracing decidedly un-Marxist re-forms, Vietnam became one of globalization’sbrightest stories in the 1990’s. The nation, a one-time rice importer, transformed itself into theworld’s second largest rice exporter and a playerin the global coffee trade. The rural poverty ratewas slashed to 30 percent from 70 percent. Thenormalization of ties between Hanoi and Washing-ton brought American trade missions bent on ex-panding Vietnamese free enterprise. One of thesedelegations saw in the Mekong Delta’s catfish agolden export opportunity, with the region’s nat-ural conditions and cheap labor affording Vietnama competitive advantage. Sure enough, within afew years, an estimated half-million Vietnamesewere living off a catfish trade nurtured by privateentrepreneurs. Vietnam captured 20 percent of the frozen catfish-fillet market in the UnitedStates, driving down prices. To the dismay of theMississippi Farm Bureau, even some restaurants in that state—the center of the American catfishindustry—were serving the Vietnamese species.
Soon . . . Vietnamese farmers were caught in anasty two-front war being waged by the CatfishFarmers of America, the trade group representingMississippi Delta catfish farmers. The Mississippicatfish farmers are generally not huge agribusi-nesses, and many of them struggle to make endsmeet. But that still does not explain how theUnited States, the international champion of freemarket competition, could decide to rig the cat-fish game to cut out the very Vietnamese farmerswhose enterprise it had originally encouraged.
Last year . . . the American catfish farmers man-aged to persuade Congress to overturn science.An amendment, improbably attached to an ap-propriations bill, declared that out of 2,000 cat-fish types, only the American-born family—named Ictaluridae—could be called ‘catfish.’ Sothe Vietnamese could market their fish in Americaonly by using the Vietnamese terms “basa” and
Box 2.2 Swimming upstream:The case of Vietnamese catfish
‘tra’. . . . Catfish Farmers of America, ran adver-tisements warning of a ‘slippery catfish wannabe,’saying such fish were ‘probably not even sportingreal whiskers’ and ‘float around in Third Worldrivers nibbling on who knows what.’ Not satisfiedwith its labeling triumph—an old trade-war trickperfected by the Europeans—the American groupinitiated an antidumping case against Vietnamesecatfish. And for the purposes of this proceeding,Congressional taxonomy notwithstanding, the fishin question were once again regarded as catfish,not basa or tra. . . .
Antidumping cases involve allegations that im-ports are being sold more cheaply than they areback home or below cost, practices rightly bannedby trade laws. . . . In this case, the Commerce De-partment had no evidence that the imported fishwere being sold in America more cheaply than inVietnam, or below their cost of production. Butrather than abandoning the Mississippi catfishfarmers to the forces of open competition, the de-partment simply declared Vietnam a “nonmarket”economy. The designation allowed it simply tostipulate that there must be something suspectgoing on somewhere—that Vietnamese farmersmust not be covering all the costs they would in afunctioning market economy. Tariffs ranging from37 percent to 64 percent have been slapped by thedepartment on Vietnamese catfish. . . .
Prices along the Mekong crashed, as the expor-ters who buy his fish moved to protect their mar-gins. . . . Faced with the prospect of losing theirinvestment, [farmers] might be shocked to learnthat [the] Commerce Department says they do not operate in a free market. . .
The United States International Trade Commission,an administrative agency in Washington, provided itsfinal verdict on July 23. The verdict stated that theAmerican catfish industry was hurt by unfair compe-tition due to dumping by Vietnam—making the tar-iffs permanent.
Source: New York Times, July 22, 2003.

G L O B A L E C O N O M I C P R O S P E C T S 2 0 0 4
86
antidumping measures on developing coun-tries more than twice as frequently as the de-veloping countries’ volume of exports wouldimply. Against transition countries, the statis-tics are even worse, with measures being ap-plied four times as frequently as their volumeof trade would imply. Developing countriesare only marginally better in their treatment ofdeveloping countries, and impose antidump-ing measures against other developing coun-tries 50 percent more frequently than would besuggested by the volume of imports. Industrialcountries are treated relatively lightly by bothindustrial and developing countries, with only43 percent as many actions imposed on themas would be implied by their value of imports.
Rates of protection being applied throughantidumping measures are astonishingly high(table 2.9). Though industrial economy tariffs
now average only 4 percent, their antidumpingrates have been seven to ten times higher. Thisis new protection, not a temporary return torates of protection previously negotiated downunder WTO auspices. The antidumping dutiesimposed by developing countries also are muchhigher than their tariff rates, with provisionalmeasures ranging from 84 to 126 percent.
And antidumping rates are discriminatory.Antidumping decisions often apply differentrates to imports from different sources (table2.9).11 The same biases are found in anti-dumping rates as have been reported for tar-iffs and various nontariff forms of protection:rates applied by developing economies arehigher, and the bias against imports from de-veloping economies is even more pronouncedin rates applied by developing economies thanin those applied by industrial economies.
Table 2.8 Most antidumping actions are filed by developing countries against otherdeveloping countries Antidumping actions initiated between 1995 and June 2002
Initiated against
Industrial Developing Transition AllInitiated by economies economies economies economies
Industrial economiesa 198 494 127 819Developing economiesb 357 649 138 1,144Transition economiesc 4 6 6 16All economies 559 1,149 271 1,979
a. Australia, Canada, 15 European Union members, Iceland, Japan, New Zealand, Norway, Switzerland, and the United States.b. All other economies excluding industrial economies and transition economies. China is included in the totals for developingeconomiesc. 27 transition economies, as defined by World Development Report 1996 (Albania, Armenia, Azerbaijan, Belarus, Bosnia-Herzegovina, Bulgaria, Croatia, Czech Republic, Estonia, Macedonia (FYR), Georgia, Hungary, Kazakhstan, Kyrgyzstan, Latvia,Lithuania, Moldova, Poland, Romania, Russian Federation).Source: WTO Antidumping Committee Reports.
Table 2.9 Antidumping rates are much higher than tariff ratesAverages of highest and lowest rates applied in antidumping cases (percent)
Average antidumping margins
Provisional measures Definitive dutiesAverage
Low High Low High tariff rates
Industrial economies 28 41 31 48 4Developing economies 84 126 58 83 13All economies 50 75 43 64 5
Note: Post-Uruguay Round applied tariff rates; antidumping measures in place as of December 31, 2002; ad valorem rates.Source: Calculations based on countries’ notifications to the WTO.

T R A D E P A T T E R N S A N D P O L I C I E S : D O H A O P T I O N S T O P R O M O T E D E V E L O P M E N T
87
The scale of the antidumping duties leviedvaries a great deal by country within groups,with some countries imposing extraordinarilyhigh duties and other countries relatively mod-erate rates—although virtually all such dutiesare very high relative to currently prevailingtariff rates. While some countries, such as Aus-tralia, impose duties in the same order of mag-nitude as current tariffs, some countries are im-posing duties at truly astronomical rates, andrates that seem likely to be prohibitive underalmost all circumstances. A number of LatinAmerican countries have measures above 100percent, and frequently substantially above thislevel—the rates in Argentina, Mexico, and Peruexceed 300 percent (table 2.10). Further, these
rules are frequently applied to much broadergroups of products in developing countriesthan has been the case in the past.
The large differences among countries inantidumping duty rates highlight the flexi-bility in the WTO rules on antidumping, flex-ibility that allows countries to “find” highmargins of dumping, and to allow countries to impose high duties against them. It strainscredulity to believe that exporters to Mexicoand Argentina are 10 times as prone to dump-ing as exporters to the United States. Differentinterpretations of the same WTO rules, there-fore, are leading to widely different outcomes,raising serious questions about the objectivityof the process.
Table 2.10 Antidumping duties are highAverage dumping margins for measures currently in place, by country (percent)
Average antidumping margins Against all economies
Provisional measures Definitive duty
By country Low High Low High
Argentina 163 328 62 63Australia 6 16 20 43Brazil 54 64 38 47Canada 40 41 42 42China 28 50 27 50Colombia 34 40 53 67Czech Republic n/a n/a 29 73Egypt n/a n/a 22 55European Union (15) 33 45 32 46India 64 91 69 105Israel 4 10 11 26Jamaica 256 256 104 104Korea 47 56 31 41Malaysia 28 65 10 25Mexico 269 345 51 65New Zealand 42 42 28 62Peru 75 330 73 246Poland n/a n/a 23 23South Africa 40 63 38 53Taiwan, China n/a n/a 76 116Thailand 36 47 32 36Trinidad and Tobago 119 119 135 135Turkey n/a n/a 93 101United States 30 49 29 50Venezuela 116 119 123 123
n/a not applicable.Note: Dumping margins associated with definitive measures in place as of December 31, 2002. Where applicable, numbers reflectdumping margins determined during the latest review of each case. For several countries (China, India, Peru, and Thailand), thetable illustrates dumping margins related to antidumping measures in place as of June 30, 2002. Source: Semiannual reports under Article 16.4 of Antidumping Agreement, submitted by individual WTO members to Committeeon Antidumping Practices. The list of countries currently maintaining antidumping measures has been extracted from the Report(2002) of the Committee on Antidumping Practices, and from the above-mentioned Semiannual Reports of WTO members. Nodata were available for Indonesia or the Philippines.

on their export opportunities. The MinisterialDeclaration launching the Doha DevelopmentAgenda includes consideration of antidump-ing measures, and provides an opportunity forbeneficial reform. Although reform will be dif-ficult given the strong political support for thistype of protection from industries in both de-veloped and developing countries, the rapidlygrowing economic damage to all economies—those imposing these duties and those suffer-ing from them—makes reform a high priority.
From Doha to Cancún andbeyond: How should protectionbe reduced?
Most of the protection in world markets is imposed through barriers to market
access—an essential pillar of other elements ofprotection regimes, such as export subsidies inagriculture. Without a supporting tariff to pre-clude imports, an export subsidy will becomemerely a subsidy on return—exports will flowout in order to collect the subsidy, but thegoods exported will be replaced by imports,with no significant impact on domestic pro-ducer prices. Reducing tariffs and other bar-riers to market access, therefore, is the centralissue in removing the protection that distortsworld markets.
WTO members are negotiating, in accor-dance with the agenda agreed at Doha, on ap-proaches to reduce protection on agriculturaland nonagricultural goods. For nonagriculturalgoods, in particular, the negotiations are to in-clude reduction or elimination of tariff peaksand tariff escalation, and to emphasize prod-ucts of interest to developing countries (WTO2001). An emphasis on reducing tariff peaks isimportant both because such peaks are verycostly to the countries imposing such tariffs,and because they are frequently on products of particular interest to developing countries.Francois, Martin, and Manole (2003) find thatapproaches to trade reform that most sharplyreduce peak tariffs result in larger reductions inthe average tariffs facing low-income countries.
G L O B A L E C O N O M I C P R O S P E C T S 2 0 0 4
88
The intensity of use of antidumping mea-sures depends heavily upon the sectors in whichit is applied. Figure 2.7 shows the height of thebarriers imposed against developing countriesby the level of technology in their exports. It re-veals that antidumping barriers are dispropor-tionately high against their exports of primaryproducts, resource-based manufactures, andlow-technology manufactured exports. For pri-mary products, the average antidumping dutyagainst developing countries is three times ashigh, at around 60 percent, as against the in-dustrial countries. This means that antidump-ing barriers are relatively lower on the mostdynamic exports of developing countries, high-technology exports. However, the antidumpingbarriers against these exports remain very highin absolute terms, at 65 percent.
The use of antidumping actions to generateprotection has reached an advanced stage. Itnow threatens developing countries’ tradeboth through the damaging effects on theirown economies, and through adverse impacts
Figure 2.7 Antidumping barriers bysector and by country group
Source: Calculations based on countries’ notifications tothe WTO.
0 20 40 60 80 100 120 140
High TechnologyManufactures
Medium TechnologyManufactures
Low TechnologyManufactures
Resource BasedManufactures
PrimaryProducts
Average dumping margins (%)
Transitioneconomies
Developingeconomies
Industrialeconomies
�
�
�
Dumping margins in place, as of December 2002:target countries and sectors

T R A D E P A T T E R N S A N D P O L I C I E S : D O H A O P T I O N S T O P R O M O T E D E V E L O P M E N T
89
For most products, most coun-tries impose protection
through ad valorem tariffs. Thisform of protection is more trans-parent than other types of tariffs,such as specific or compound tar-iffs. A 10 percent tariff rate raisesthe price of an imported good bythe same 10 percent whether thegood is a car worth $20,000 or abicycle valued at $50. A specifictax of $50, by contrast, has anenormously different impact onthe bicycle and the car. Further,the impact of the specific tariffdepends on market conditions. Ifbicycle prices tumble to $20, thenthe specific tariff of $50 will raiseprices by 250 percent instead of100 percent.
Specific tariffs, which arevery common on agriculturalproducts, also are important on anumber of industrial products ofinterest to developing countries,particularly textiles, clothing, andfootwear. Recent research bySchott (2001) has revealed astriking tendency for poorercountries to export versions ofmany manufactured productswith lower unit values than thoseexported by higher-income coun-tries. As countries develop, theyfrequently upgrade their prod-ucts, using more capital and skillto produce a better version of thesame product. Schott finds thatthe unit value of a shirt fromJapan, for instance, is 20 timesthat of the same good from thePhilippines. In this situation, spe-cific tariffs are likely to be muchmore of a burden on poorer de-veloping countries than on indus-trial countries.
Box 2.3 The scourge of the specific
Ad valorem equivalents of specific tariffs are usually higher on imports fromdeveloping countries than from high-income countries
Ad valorem equivalents of U.S. specific tariffs on overcoats (percent)
a. Ad valorem equivalent (AVE) protection on overcoat exports to the United States
0
Morocco
VietnamAVE
Linear (AVE)
Ecuador
New Zealand
Spain
Venezuela
UruguayTurkey
Thailand
Bolivia
ChinaFrance
JapanUnited Kingdom
Belgium
Ireland
Canada
Australia
ItalyGermanyIndia
Pakistan
36,00021,30014,9004,8001,200900400 23,300
5
10
15
20
25
30
GNI($)/capita
Ad valorem equivalents of EU specific tariffs on starch (percent)
c. Ad valorem equivalent (AVE) protection on starch exports to the European Union
300
250
200
150
100
50
01,970
Canada
Thailand
AustraliaJapan
Czech Republic
5,270 19,770
GNI($)/capita
21,340 35,990
Linear AVE (compound)
AVE (compound)
AVE
Linear (AVE)
�
�
Ad valorem equivalents of specific tariffs are usually higher onimports from developing countries than from high-income countries
Ad valorem equivalents of EU specific tariffs on leather shoes (percent)
b. AVE tariffs on exports of leather shoes from Pakistan to Japan
GNI/cap
410
420
500
700
800
9001,
200
1,70
02,
0002,
5003,
000
7,00
0
10,7
00
11,8
00
13,4
00
14,9
00
19,5
00
22,7
00
23,7
00
23,9
00
24,0
00
24,2
00
25,3
00
34,9
00
��
�
�
Source: Stawowy (2001) and unit value data from COMTRADE.
USA
HKGGBR
NLDAUTDEUFRAITAESP
TWN
GRCPRTARGBRATUR
THA
ROMMARCHN
LKA
IDN
IND
PAK
VNM
–100
0
100
200
300
400
500
600
700
800
(Box continues on next page)

G L O B A L E C O N O M I C P R O S P E C T S 2 0 0 4
90
Using a formula is importantA key choice in multilateral market-accessnegotiations is whether to proceed using a“request-and-offer” approach or a formula ap-proach. Under a request-and-offer approach,countries with major supply-and-demand in-terests in a particular area agree on bilateraltariff “concessions” that are then generalizedto all other members on a most-favored-na-tion basis. As noted by Baldwin (1987), thisapproach was successful in achieving substan-tial reductions in protection under the GATTonly in the initial Geneva Round of negotia-tions in 1947. The request-and-offer approachmade disappointingly slow progress in thefour following rounds of negotiations.12 Onlywith the introduction of a comprehensive for-mula approach during the Kennedy Round(1963–67) was it again possible to cut protec-tion substantially—35 percent versus an aver-age of 2.5 percent in the previous four negoti-ations. The next round, the Tokyo Round(1974–79), used a more sophisticated for-mula, the so-called Swiss formula. It achieveda 30 percent reduction in average tariffs andbrought down the higher tariffs by much morethan the lower ones. Unfortunately, however,many products of particular interest to devel-
oping countries were excluded, partly becausedeveloping countries were not active deman-deurs in these negotiations.
The Uruguay Round (1986–94) used a sim-pler approach for nonagricultural tariffs thatinvolved setting broad tariff-reduction goals,such as a 30 percent reduction on industrialproducts, but left the distribution of the cutacross sectors up to negotiations between trad-ing partners. This approach was successful inachieving substantial tariff reductions. It wasnot, however, successful in achieving higherproportional cuts in higher tariff rates andthereby in reducing tariff escalation. Abreu(1996) observes that manufactured goods withhigher tariff rates typically had smaller pro-portional tariff cuts.
In the Doha negotiations, there appears tobe a broad consensus that some sort of for-mula will be required to obtain reductions inprotection sufficiently broad-based to achieveincreases in market access. The increase in thenumber of active participants seeking to usethe WTO to achieve increases in marketaccess—and to lock in reductions in tariffs—would make the one-on-one, request-and-offerprocedures even less likely to succeed than theyhave in past GATT negotiations.
We draw on a detailed analysis of ad valoremequivalents undertaken at UNCTAD (Stawowy2001) to compare these burdens across countries.
We find many cases where the ad valoremequivalents of specific tariffs are sharply higher onpoor than on rich countries. The top figure shows,for instance, that Vietnam and Ecuador face tariffson overcoats twice as high as Japan does—a type ofdiscrimination covered up by the specific tariff. Ex-ports of leather shoes from Pakistan to Japan feel theboot strongly—they are subject to tariffs of around700 percent, while exports from the advanced indus-trial countries are taxed at less than 100 percent.
Box 2.3 (continued)
Also in the EU market, Japan pays less than 50 per-cent, while Thailand and the Czech Republic payover 100 percent on their exports of starch—surelyenough to stiffen resistance to this form of protectiononce the facts are known.
The nontransparency of specific tariffs, and thefact that they can discriminate so strongly againstlower-income countries, are two good reasons forsupporting proposals (WTO 2003a, Annex I) toeliminate specific tariffs under the Doha Develop-ment Agenda. The proposals for the elimination ofspecific tariffs clearly deserve strong support fromeveryone concerned about the welfare of the poor.
Some formulas are more prodevelopmentthan othersEven with a broad agreement to employ a for-mula, much needs to be done to bridge the gapamong alternative approaches. Many differentapproaches have been proposed, and not allcan be considered in this study, but examina-tion of a few key proposals is instructive. Inagriculture, the United States and the CairnsGroup have proposed a Swiss-formula ap-proach that would reduce all tariffs below 25percent, regardless of their initial level. At theother end of the spectrum, Europe and Japanhave proposed an approach involving a “head-line” reduction of 36 percent that could easilybe evaded, and only a 15 percent required re-duction in individual tariffs. This would allowprotection for Japanese rice, for example, toremain at close to 600 percent.
In nonagricultural market access, China,India, and Korea all have made proposals forformulas that would sharply reduce tariffs andreduce high tariffs relative to average tariffs.The European Union has advocated an ap-proach involving different tiers for tariffs, anapproach that would facilitate larger reduc-tions in high tariffs relative to lower rates.Japan has proposed a formula that would givecountries flexibility with individual tariffs butthat would require larger reductions in aver-age tariffs on high-tariff goods.
Adopting a formula that limits tariff peaksrelative to average tariffs is important for de-veloping countries. Some countries have pro-posed “flexible” approaches allowing reten-tion of peak tariffs, while others have proposedapproaches that sharply reduce peaks relativeto other tariffs. Politically, it is frequently at-tractive to retain high tariffs on sensitive prod-ucts where political support for protection isstrong. This political convenience needs to beweighed against the adverse implications forthe country itself, and for its trading partners,if high protection is retained in some sectors.Retaining high levels of protection in some sec-tors is likely to be costly to the importing econ-omy because high rates of protection mean
large distortions in production and consump-tion patterns. The economic costs of these dis-tortions rise with the square of the tariff, so thecosts of a tariff twice as high as the average arefour times those of an average tariff. Further,high tariffs are inefficient in raising tariff rev-enues because the volume of imports acrossthese tariff barriers is likely to be small.
From the point of view of developing-coun-try exporters, approaches that allow countriesto retain tariff peaks—and especially approachesthat would allow the industrial countries to re-tain high peaks—are likely to be problematicfor another reason. The tariff structures of mostindustrial countries involve quite low averagetariffs as a result of the eight previous rounds ofGATT/WTO negotiations. But they continue tocontain many high peaks on products of partic-ular interest to developing countries (Hoekmanand Olarreaga 2002). The coefficient variationof industrial country tariffs—the variation rela-tive to the average level—is now much higher inthese countries than it is in developing coun-tries, where the wave of tariff reductions duringthe 1980s and 1990s cut higher tariffs in linewith average tariffs.
There is a particular concern with ap-proaches that allow the retention of highpeaks—such as the average-cut approach pro-posed by a number of high-protection coun-tries in the negotiations on agricultural marketaccess.13 Such an approach, based on a mean-ingless measure, provides scope for evasion ofcountries’ commitments in the Doha Develop-ment Agenda to reduce protection and to pro-vide special and differential treatment in favorof developing countries.
A wide range of formulas is available, theeffects of which depend upon a combination offactors, including the extent to which the for-mulas would reduce average rates of protec-tion, as well as the variability of tariffs aroundthat average (see box 2.4). An important issueto understand is the extent to which changingthe dispersion of overall protection, for a givenaverage cut in tariffs, affects the average re-duction in protection facing developing coun-
T R A D E P A T T E R N S A N D P O L I C I E S : D O H A O P T I O N S T O P R O M O T E D E V E L O P M E N T
91

G L O B A L E C O N O M I C P R O S P E C T S 2 0 0 4
92
tries. Approaches that attack tariff peaks moreaggressively will be more beneficial to develop-ing countries, since developing countries facedisproportionately high tariffs. Francois andMartin (2003) derive a flexible Swiss formulathat allows higher tariffs to be addressed moreor less aggressively for any given reduction in
average tariffs. Francois, Martin, and Manole(2003) show that approaches that are more ag-gressive in reducing high rates of protectionwill result in larger cuts in average rates of pro-tection faced by developing countries. Such ap-proaches also reduce variation in tariffs, whichis a major source of cost to the importing
Years ago, as concern grew about the impacts ofdrunk driving, the venerable Clayton’s Nonalco-
holic Tonic repositioned its advertising with the slo-gan “Clayton’s, the drink you have when you’re nothaving a drink.” Macho individuals could still exhibitthe bravado of having one or two “for the road”while avoiding the sharply increased penalties associ-ated with drunk driving. Today, as concern buildsabout the adverse impacts of agricultural policy dis-tortions for world trade, and particularly for develop-ing country farmers, the notion of an average cut intariffs takes on a similar tone. With this device, poli-cymakers can commit to sharp cuts in agriculturalprotection without actually doing anything at all.
To see how this paradox arises, consider a puta-tive agreement to cut agricultural protection by 50percent in a country with just two agricultural tar-iffs—one of 1 percent and one of 100 percent. A cutof 100 percent in the 1 percent tariff, and of zero inthe 100 percent tariff, yields the necessary 50 percentaverage cut in tariffs—great for the headlines.
But in reality, virtually nothing has been done.The average tariff has fallen by half of 1 percent,from 50.5 percent to 50 percent. Of course, policy-makers could load the cuts onto the high tariff, tak-ing the average tariff from 50.5 percent to 0.5 per-cent. It is unlikely that they would do this, however.The 100 percent tariff is high because it is supportedby strong interest groups, which would surely op-pose their industry being “sacrificed.” The funda-mental problem with the average-cut approach isthat it provides no reward for cutting a high tariffrather than a low one, and hence allows policymak-ers to avoid the agreed goal of achieving substantialimprovements in market access.
As we have seen, the “average-cut” approachprovides little or no guidance on the effects of liber-
Box 2.4 “Average cuts,” the cut you have whenyou’re not having a cut
alization. It can be totally deceptive in its suggestionthat sizable reductions in protection are required.Even when it is built into a tiered reduction in pro-tection, such as the three-band system of tariff cuts with higher cuts in higher tariffs proposed in the Harbinson draft (WTO 2003c), the use of theaverage-cut approach makes the average cuts speci-fied in each group almost meaningless, by providingan incentive to reduce the highest tariffs in each bandby the smallest possible amount.
The proponents of the average-cut approachargue that more specific formulas are not acceptablebecause they do not provide the flexibility needed toreduce their agricultural tariffs. But, as we have seen,the average-cut approach provides complete flexi-bility to do nothing (or anything), and none of thediscipline that is the sine qua non of world traderules. To provide some discipline, proponents of theaverage-cut approach allow for a minimum cut ineach tariff line. But this approach is extremely rigidunless the minimum cut is very low, in which casethere is no discipline.
If the desire for flexibility made by the propo-nents of average cuts were accepted, what could bedone to provide some discipline? Fortunately, there isa simple and nondeceptive alternative. A rule thatspecifies a “cut in average tariffs” would allow forflexibility while ensuring that protection was reducedon average, while providing some reward for cuttinghigh tariffs, rather than low tariffs. The simple, butnot purely semantic, move to a requirement for a cutin the average—rather than an average-cut—wouldpreserve flexibility, while introducing some discipline.
Source: World Bank staff.

T R A D E P A T T E R N S A N D P O L I C I E S : D O H A O P T I O N S T O P R O M O T E D E V E L O P M E N T
93
country (Martin, Van der Mensbrugghe, andManole 2003).
A much wider range of approaches has beenoffered in the negotiations on nonagriculturalmarket access than in agriculture (see chapter3). We examine five proposals on market ac-cess for nonagricultural products that are suf-ficiently specific to allow analysis of their im-plications for tariffs—those from China, theEuropean Union, India, the United States, andfrom the chair of the WTO’s Market AccessCommittee. The implications of any of theseformulas (box 2.5) depend heavily upon the
base tariff rates to be cut, the approach takento cutting, the treatment of tariffs that are ini-tially unbound, and whether any supplemen-tary provisions call for eliminating tariffs onparticular groups of products. To gain someidea of the consequences of these measures, weexamine their implications for tariffs facinglow-income countries in four major markets—Brazil, the European Union, India, and theUnited States.
One key issue in any of the formulas is theselection of the base tariff rates. Traditionally,the GATT/WTO system has used bound rates
As is evident from the table, the proposal byChina uses a Swiss-formula approach, but with
a ceiling for each country based on the average levelof its own tariffs (see Annex table 2A.1). After theapplication of the formula, all tariffs will be belowthe original average, and countries with higher aver-age tariffs have tariff reductions that are, in percent-age points, larger than those in countries with lowertariffs. Countries with more variable tariffs will, ingeneral, face larger percentage reductions in tariffs,because the tariff peaks that give rise to variabilityare reduced very sharply. In industrial countries, theformula is applied to countries’ applied tariff rates.In developing countries, the formula is generally ap-plied to the average of applied and bound tariffs.
The proposal by the European Union seeks tocompress the distribution of tariffs by dividing tariffsup into bands and applying higher proportional cutson tariffs in higher bands. Tariffs below some thresh-old to be negotiated, such as 2 percent, are to be setto zero. A specific proposal to set the bands is of-fered in an addendum to the proposal, and it is thatspecific proposal that we analyzed.
The proposal by India involves making a pro-portional cut, of a magnitude to be negotiated, in alltariffs. The proportional cut in developing-countrytariffs would be two-thirds of that in developedcountries. After application of the formula, tariffsabove three times the average would be reduced tothree times the average after application of the for-
Box 2.5 The implications of five tariff-cuttingproposals
mula. Bound tariff rates are to be used as the baserates, with unbound tariffs for each product to be re-placed initially with the higher of the highest boundrate in its schedule, or the applied rate for that prod-uct. For illustrative purposes, we set the proportionalcut at 50 percent.
The U.S. approach involves reducing to zero alltariffs of 5 percent or less. Then, a Swiss formulawith a ceiling parameter of 0.08 is applied to allother tariffs. Applied rates, rather than bound rates,are generally used as the base. This approach is to beimplemented by 2010, with all tariffs being reducedto zero by 2015.
The proposal by the chair of the Market AccessCommittee involves use of a Swiss formula with theceiling parameter equal to each country’s averagetariff, scaled up or down by a parameter, B, to benegotiated. The base rate is to be the bound rate, un-less the tariff line is unbound, in which case it is tobe twice the applied rate. In addition, the proposalcalls for reductions of tariffs to zero in a range ofsectors, including electronics, fish, footwear, leathergoods, motor vehicle parts, and textiles and clothing.In this initial assessment of the effects of the propos-als, these elements—whose inclusion is still to benegotiated—have not been included.
Source: World Bank staff.

G L O B A L E C O N O M I C P R O S P E C T S 2 0 0 4
94
as the basis for subsequent negotiations. Aswell as having the advantage of familiarity,this approach has an important dynamic ad-vantage. If countries believe that bound rateswill be the basis for future negotiations, theywill feel free to reduce applied rates when theyare convinced that this is in their economic in-terests. Negotiations based on bound ratesembody a pure, one-for-one form of credit forsuch autonomous liberalization.14 If a countrychooses to reduce its applied rates below thebound level, then reductions in applied ratesflowing from any future agreements to cutbound rates by a particular percentage will besmaller since any given cut in bound rates willrequire a correspondingly smaller reduction inapplied rates. Use of applied rates as the basefor tariff reductions creates potential incen-tives to increase applied rates and is certainlylikely to have a chilling effect on future au-tonomous liberalization.
In examining the implications of the differ-ent formulas, we build on the analysis of WTO(2003b), which examines the implications oftariff reduction formulas for a hypotheticalschedule of tariff bindings. We apply the tariffreduction formulas to the specified base tariffs(bound, applied, or a combination), and thenexamine the implications for applied rates bycomparing the resulting tariff bindings withapplied rates prior to the analysis. If the newbinding is below the prior applied rate, thenthe new applied rate is reduced to the newbound rate. Table 2.11 presents weighted av-erage tariffs for each of the four focus econo-mies under each of the five proposals.
A striking feature of the results is just howsharply all five formula approaches reducetariffs in the industrial-country markets con-sidered. Average tariffs facing the low-incomecountries in the United States, for example,are reduced from 4.3 percent to 1.4 percent bythe Chinese formula and 1.3 percent by theU.S. formula. All of the formulas also wouldsubstantially reduce the standard deviation oftariffs in the industrial countries—indicatingthat they would reduce tariff peaks sharply.
The situation in developing-country marketsis considerably different, however. There, tariffreductions are much smaller as a proportion ofthe initial tariff rates—although not necessarilyin percentage points of tariff, since the initialtariff rates are much higher. The smaller reduc-tions as a percentage of initial tariffs are a re-flection in large measure of the “tariff bindingoverhang”—the situation where tariff bindingsare substantially above applied rates. They alsoreflect the smaller percentage reductions for de-veloping countries inherent in India’s formula,as well as India’s proposal to allow unboundtariffs to be set at the highest binding in theschedule, or at the applied rate for the com-modity being liberalized, whichever is higher.The U.S. formula would lead to substantial re-ductions in applied tariffs in India and Brazil,with tariffs facing low-income exporters fallingto 6 percent in India and 5 percent in Brazil.The EU formula also would result in large cutsin applied rates in developing countries, withtariffs facing low-income exporters falling to10.8 in India and just over 8 percent in Brazil,a striking finding given that this approach isbased on bound tariff rates.
A key issue is whether the reductions in tar-iffs are to be measured using percentage cutsin tariffs or alternative measures, such as thepercentage-point reduction in tariffs or thepercentage-point reduction in the price of im-ports brought about by the tariff reduction.15
As noted above, only the U.S. formula and, toa lesser extent, the European formula, bringabout large percentage-point reductions intariffs in India or Brazil. If however, progressis measured in terms of the percentage-pointcut in tariffs or the percentage-point cut in im-port prices, then the reductions in India andBrazil look much more substantial, even underthe Indian formula or the Chinese formula,where the percentage cut in tariffs is relativelysmall. Clearly, much patient analysis will berequired to assess the consequences of the pro-posed reforms for individual countries—and alot of hard bargaining before WTO membersare likely to agree on a specific package of re-

T R A D E P A T T E R N S A N D P O L I C I E S : D O H A O P T I O N S T O P R O M O T E D E V E L O P M E N T
95
forms. We hope that the analysis presentedhere will make an important contribution toclarifying the issues and tradeoffs involved inthese choices.
Putting development into the DohaDevelopment Agenda requires seriousliberalizationAlthough trade policy reform has contributedto an unprecedented shift in export composi-tion and trade growth, the next steps will bedifficult. Today’s protection remains heavilyconcentrated in the most politically sensitive
areas—textiles, clothing, and other labor-intensive manufactures, as well as agriculture—in both rich and poor countries. In nonagri-cultural goods, three efforts are particularlycrucial:
• First, the progressive phase-out of quotasunder the Agreement on Textiles andClothing, now lagging, is critical to pro-viding market access for developingcountries. Reforms in current quota-holding countries may be necessary toensure a smooth adjustment.
Table 2.11 Competing formulas make a big difference for tariffsWeighted average on tariffs (percent) for Brazil, European Union, India, and the United States under various proposed formulas
Tariffs facing exporters
Applied tariffs, Applied tariffs,weighted average, weighted average,
Applied tariff, low-income middle-income StandardAffected area Formula average countries countries deviation
Brazil Initial tariff 15.95 14.55 14.00 5.96Chinese formula 12.34 11.47 10.17 3.49European formula 10.11 9.66 8.14 2.51Indian formula 15.50 14.20 12.28 5.83U.S. formula 5.04 4.71 4.00 1.20Chairman’s formula B=2 15.60 14.20 12.37 5.68Chairman’s formula B=1 13.33 12.17 10.64 4.08
European Union Initial tariff 4.18 5.28 3.76 3.72Chinese formula 1.85 1.99 1.45 1.14European formula 2.06 2.67 1.87 2.02Indian formula 1.94 2.49 1.78 1.77U.S. formula 1.29 1.73 1.23 1.87Chairman’s formula B=2 2.18 2.52 1.80 1.64Chairman’s formula B=1 1.56 1.74 1.25 1.08
India Initial tariff 32.99 28.12 26.71 8.57Chinese formula 28.19 24.09 21.98 8.48European formula 11.98 11.24 10.82 1.90Indian formula 28.30 24.23 21.96 8.67U.S. formula 6.31 5.93 5.71 0.73Chairman’s formula B=2 29.40 25.15 22.96 8.14Chairman’s formula B=1 23.78 20.99 19.36 5.82
United States Initial tariff 3.70 4.26 3.23 4.53Chinese formula 1.40 1.35 1.11 1.14European formula 1.76 2.10 1.56 2.20Indian formula 1.50 1.69 1.25 1.67U.S. formula 1.00 1.31 0.82 1.80Chairman’s formula B=2 1.63 1.75 1.37 1.59Chairman’s formula B=1 1.13 1.17 0.95 1.03
Source: World Bank staff.

G L O B A L E C O N O M I C P R O S P E C T S 2 0 0 4
96
• Second, efforts to cut back antidumpingmeasures that create a patchwork of adhoc protection are essential if market ac-cess granted by the right hand, throughquota elimination and tariff reductions, isnot to be withdrawn by the left hand ofnew access-restricting antidumping suits.
• Third, moving forward in nonfarm traderequires a Swiss-formula, or related top-down approach, that will require dis-proportionately greater reductions inhigh tariffs so as to mitigate antidevelop-ment policy embedded in trade regimesaround the world. The choice of the for-
mula, and of its coefficients of reduction,is important.
Much must be done behind the border toensure that countries that have missed out dur-ing the current wave of international integra-tion will be able to take advantage of the op-portunities provided by a more streamlinedand development-friendly trading system. Ifthese measures are adopted—along with oth-ers associated with agricultural trade, labormobility, and the special treatment some devel-oping countries enjoy—then the promise of theDoha Development Agenda may be realized.

T R A D E P A T T E R N S A N D P O L I C I E S : D O H A O P T I O N S T O P R O M O T E D E V E L O P M E N T
97
Table 2A.1 The various liberalization proposals have very different featuresFeatures of trade liberalization proposals advanced by China, the European Union, India, the United States, and the Chair of theWTO Market Access Committee
Proposal Base rate (T0) Unbound tariff Sectoral tariff elimination Formula
China
EuropeanUnion
India
United States
Chair, WTOMarket AccessCommittee
A=1 for developed countriesA=0.67 for developing
countries
Step 2. Minimum of T1 andthree times the average ofresults from Step 1
Developed:applied rateDeveloping:simple average of applied andbound rate
Bound rate
Bound rate
Lesser of appliedrate and boundrate
Bound rate
Applied duty,November 14,2001
Higher ofmaximum boundrate and appliedrate on cut-off date
Two times theMFN applied rate (2001).If MFN appliedrate is zero, then 5 percent.
Wood products; non-ferrous metals; bicycle parts; soda ash;photographic film;electronics; fish and fishery products; scientificequipment; environmentalgoods; InformationTechnology Agreement(ITA) products and goodscovered by the Agreementon Trade in Civil Aircraft,Uruguay Round zero-for-zero sectors
Electronics and electricalgoods; fish and fishproducts; footwear; leathergoods; motor vehicle partsand components; stones,gems, and precious metals;and textiles and clothing
TA B P T
A P T1
02
0
=+ × ×+ +
( )
( )
T B T BB B
B BL L
U L
U L1 1 0 01 1
0 0
= + − ×−−
( )
T A Y T1 01 100= − × ×( ( / ))
T if T1 00 5= ≤ %
TTT
if T10
00
88
5=×+
> %
TB T TB T T
a
a1
0
0=
× ×× +
A: Simple average of T0P=T0/AB=3 for 2010, B=1 for 2015
BL0 and BU
0 are lower andupper limits in the basebracketBL
1 and BU1 in the new bracket
Step 1.
Ta is the initial average tariffB is a coefficient to bedetermined
Source: WTO.
Step 1. Period to 2010.
Step 2. From 2015, all tariffsgo to zero.

G L O B A L E C O N O M I C P R O S P E C T S 2 0 0 4
98
Notes1. One potential concern with any measure of the
share of particular exports is the impact of pricechanges. If, for instance, changes in the observed sharesof exports reflect primarily changes in prices over thesample, then they might be reversed by subsequent pricechanges. It is difficult to fully adjust for price changes,but at least a crude indication was obtained by deflat-ing each component of exports by a suitable deflatorand comparing the result with undeflated export shares.It appears that the changes in shares have primarilybeen the result of changes in the volume of exports.This implies that they are much more likely to be sus-tained than changes resulting only from changes in theprices of particular export goods. Increases in the pricesof resources—and particularly oil—have caused in-creases in the importance of exports of these goods inthe past, but these have been reversed by subsequentprice declines.
2. The use of categories defined by income status atthe beginning of the sample period makes an enormousdifference. If we define our low-income sample by in-come status at the end of the period, the trade growthrate of the low-income group is below average.
3. This analysis was undertaken using the 1997input-output data from the Global Trade Analysis Proj-ect (GTAP), input-output information for 1997, andthe GTAP time series database of trade and trade pat-terns. See Hummels, Ishii, and Yi (2001) for precise de-finitions of these measures.
4. While the resistances to integration graphicallycaptured in the book “Why the Emperor’s New ClothesAre Not Made in Colombia” (Morawetz 1981) havecertainly abated, the continuing low level of integrationsuggests the continued existence of considerable resis-tance to the level of integration associated with globalproduction sharing.
5. The growth performance of this region is biasedupward because of large-scale under-reporting of tradeprior to 1990.
6. The rise in the price of factor inputs and theprices of nontraded goods is frequently identified as thereal exchange rate appreciation associated with protec-tion policies.
7. This is an underestimate of the costs imposed byprotection on exporters. In addition, tariffs raise costsby raising the costs of nontraded goods and nontradedfactors of protection. This adverse impact, the so-calledreal exchange rate effect, should also be taken intoaccount.
8. Baldwin (1987) estimates that the average tariffreductions by the industrial countries were 35 percentin the Kennedy Round and 30 percent in the TokyoRound.
9. Details on the barriers faced by individual coun-tries on individual products in particular markets canbe obtained using the WITS software (see www.wits.worldbank.org).
10. Another justification might be that such rulesguide members toward good policy actions—actionsthat advance the national economic interest of themembers that apply them. This historically is not therationale for their inclusion in the GATT/WTO. Em-pirically, extensive research has shown that antidump-ing actions are not “good” protection, they are ordi-nary protection with a good public relations program.
11. The average of rates actually applied is thus atleast as high as the lower figure, no higher than thehigher figure.
12. A simple formula was first tried out in the Dil-lon Round (Ernest Preeg, personal communication).
13. This approach focuses on achieving specifiedaverage tariff cuts, rather than cuts in the average. Un-fortunately, a given average cut can likely be achievedwith minimum political impact by imposing large cutsin the lowest tariffs, rather than the large cuts in thehighest tariffs that are economically desirable.
14. Approaches that use historical applied rates,such as applied rates at the end of the Uruguay Round,would also have this feature of providing credit forsubsequent, autonomous liberalization.
15. This measure, which involves measuring thechange in the tariff rate divided by one plus the tariffrate, is widely used in analytical work, and reportedextensively in Finger, Ingco, and Reincke (1996).
ReferencesAbreu, M. 1996. “Trade in Manufactures, the Out-
come of the Uruguay Round, and DevelopingCountry Interests.” In Will Martin and L. AlanWinters, eds., The Uruguay Round and the De-veloping Countries. Cambridge: Cambridge Uni-versity Press.
Amiti, M. 2003. “How the Sequence of Trade Liberal-ization Affects Industrial Location.” Mimeo, Jan-uary 17. World Bank, Washington, D.C.
Baldwin, R. E. 1987. “Multilateral Liberalization.” InJ. Michael Finger and A. Olechowski, eds., TheUruguay Round: a Handbook for the MultilateralTrade Negotiations. World Bank, WashingtonD.C.
Bhardwaj, A., S. Kathuria, and Will Martin. 2001.“Implications for South Asian Countries of Abol-ishing the Multifibre Arrangement.” Policy Re-search Working Paper 2721. World Bank, Wash-ington, D.C.
Bloch, H., and D. Sapsford. 2000. “Whither the Termsof Trade: an Elaboration of the Prebisch/Singer

Hummels, D., and P. Klenow. 2002. “The Variety andQuality of a Nation’s Trade.” Working Paper8712. National Bureau of Economic Research,Cambridge, Mass.
Hummels, D., J. Ishii, and K.M. Yi. 2001. “The Natureand Growth of Vertical Specialization in WorldTrade.” Journal of International Economics54:75–96.
Ianchovichina, E. 2003. “GTAP-DD: A Model for An-alyzing Trade Reforms in the Presence of DutyDrawbacks.” GTAP Technical Paper 21, Centerfor Global Trade Analysis, Department of Agri-cultural Economics, Purdue University, Lay-fayette, Ind. [www.gtap.org.]
Ianchovichina, E., and Will Martin. 2001. “Trade Lib-eralization in China’s Accession to the WTO.”Journal of Economic Integration 16 (4): 421–45.
_______. 2003. “Economic Impacts of China’s Acces-sion to the WTO.” World Bank, Washington,D.C. [www.worldbank.org/trade]
Kehoe, T., and K. Ruhl. 2002. “How Important is theNew Goods Margin in International Trade?”Mimeo. University of Minnesota, Minn.
Madani, D. 1999. “A Review of the Role and Impactof Export Processing Zones.” Policy ResearchWorking Paper 2238. World Bank, Washington,D.C.
Martin, Will. 1993. “The Fallacy of Composition andDeveloping Country Exports of Manufactures.”World Economy 16 (2): 159–72.
Martin, W., van der Mensbrugghe D., and V. Manole.2003. “Is the devil in the details?: Assessing theWelfare Implications of Agricultural and Non-agricultural Trade Reform.” World Bank Work-ing Paper forthcoming, World Bank, Washington,D.C.
Morawetz, D. 1981. Why the Emperor’s New Clothesare not Made in Colombia: a Case Study in LatinAmerican and East Asian Exports. Washington,D.C.: Oxford University Press for the WorldBank.
Nehru, V., and A. Dhareshwar. 1993. “A New Data-base on Physical Capital Stock: Sources, Method-ology, and Results.” Revisita de Análisís Econó-mico 8 (1): 37–59.
Nehru, V., E. Swanson, and A. Dubey. 1995. “A NewDatabase on Human Capital Stock in Developingand Industrial Countries: Sources, Methodology,and Results.” Journal of Development Economics46: 379–401.
OECD (Organisation for Economic Co-operation andDevelopment). 2002. Monitoring and OutlookReport. Paris.
Pritchett, L. 1997. “Divergence, Big Time.” Journal ofEconomic Perspectives 11 (3): 3–17.
T R A D E P A T T E R N S A N D P O L I C I E S : D O H A O P T I O N S T O P R O M O T E D E V E L O P M E N T
99
Hypothesis.” Cambridge Journal of Economics24: 461–81.
Brenton, Paul. 2003. “Integrating the Least DevelopedCountries into the World Trading System: TheCurrent Impact of EU Preferences under Every-thing But Arms.” Policy Research Working Paper3018. World Bank, Washington, D.C.
Cadot, O., J. de Melo, and Marcelo Olarreaga. 2002.“The Protectionist Bias of Duty Drawbacks: Evi-dence from Mercosur.” Journal of DevelopmentEconomics 59 (1): 161–82.
Corden, M. 1997. Trade Policy and Economic Welfare,2nd edition. Oxford: Oxford University Press.
Deardorff, A. 2001. “International Provision of TradeServices, Trade and Fragmentation.” Review ofInternational Economics 9 (2): 233–48.
de Ferranti, D., G. Perry, D. Lederman, and W. Mal-oney. 2002. From Natural Resources to theKnowledge Economy: Trade and Job Quality.Latin America and Caribbean Studies, WorldBank, Washington, D.C.
Dollar, D., M. Hallward-Driemeier, and T. Mengistae.2003. “Investment Climate and Firm Perfor-mance in Developing Economies.” Mimeo,March 5. World Bank, Washington, D.C.
Elbehri, A., T. Hertel, and Will Martin. 2003. “Esti-mating the Impact of WTO and Domestic Re-forms on the Indian Cotton Industry.” Review ofDevelopment Economics 7 (3):343–59.
Evenett, Simon J., and A. Venables. 2003. “ExportGrowth by Developing Countries: Market Entryand Bilateral Trade.” Mimeo. World Trade Insti-tute, Berne, Switzerland.
Finger, J. Michael, Ingco M.D., and U. Reincke. 1996.“The Uruguay Round: Statistics on Tariff Con-cessions Given and Received.” World Bank,Washington, D.C.
François, J., and Will Martin. 2003. “Formula Ap-proaches for Market Access Negotiations.”World Economy 26 (1):1–28.
François, J., Will Martin, and V. Manole. 2003.“Choosing Formulas for Market Access Negotia-tions.” Revised version of paper prepared forFestschrift conference for Professor Peter Lloyd,Melbourne.
François, J., and D. Spinanger. 2002. “China Acces-sion, ATC Phaseout, and Market Access in Tex-tiles and Clothing.” Mimeo. Erasmus University,Rotterdam.
Hoekman, B. and M. Olarreaga. 2002. “Une proposi-tion pour l’OMC: La « Super » clause de NationPlus Favorisée.” Reflets et Perspectives de la VieEconomique, XLI, 2.
Hummels, D. 2001. “Time as a Trade Barrier.” Mimeo.Krannert School of Management, Purdue Univer-sity, West Lafayette, Ind.
G L O B A L E C O N O M I C P R O S P E C T S 2 0 0 4
100
_____. 2000. “The Tyranny of Concepts: CUDIE (Cu-mulated, Depreciated Investment Effort) Is NotCapital.” Journal of Economic Growth 5: 361–84.
______. 2001. “Where Has All the Education Gone?”World Bank Economic Review 15 (3): 367–91.
Redding, Stephen, and Anthony Venables. 2001. “Eco-nomic Geography and International Inequality.”CEP Working Paper 495. London School of Eco-nomics, London.
Schott, P. 2001. “Do Rich and Poor Countries Special-ize in a Different Mix of Goods? Evidence fromProduct-Level U.S. Trade Data.” Working Paper8492. National Bureau of Economic Research,Cambridge, Mass.
_____. 2002. “Across-Product Versions Within-ProductSpecialization in International Trade.” Mimeo.Yale School of Management, New Haven, Conn.
_____. 2003. “One Size Fits All? Heckscher-Ohlin Spe-cialization in Global Production.” American Eco-nomic Review 93(3): 686–708.
Stawowy, Wojciech. 2001. “Calculation of Ad ValoremEquivalents of Non-Ad Valorem Tariffs.” Mimeo,UNCTAD, October.
Todaro, M. 1994. Economic Development. New York:Longman.
World Bank. 2000. Global Economic Prospects 2001.Washington, D.C.
World Bank. 2002. Global Economic Prospects 2003.Washington, D.C.
World Bank. 2003. World Development Indicators.Washington, D.C.
WTO. 2001. “Ministerial Declaration.” Document WT/MIN(01)/DEC/1, November 20.
WTO. 2003a. “Draft Elements of Modalities for Ne-gotiations on Non-Agricultural Products.” WorldTrade Organization, Negotiating Group on Mar-ket Access, TN/MA/W/35, Geneva.
WTO. 2003b. Formula Approaches to Tariff Nego-tiations: Note by the Secretariat.” Document TN/MA/S/Rev 2, April 11.
WTO. 2003c. “Negotiations on Agriculture: FirstDraft of Modalities for the Further Comments.”Document TN/AG/W/1/Rev. 1, March 18.
Yang, Y., W. Martin, and K. Yanagishima. 1997.“Evaluating the Benefits of Abolishing the MFAin the Uruguay Round Package.” In T. Herteb,ed., Global Trade Analysis: Modeling and Appli-cations. Cambridge, Mass.: Cambridge UniversityPress.


Trade in agriculture is important to theworld’s poor—Agriculture is the largest employer in low-income countries, accounting for about 60 per-cent of the labor force and producing about 25percent of GDP. Even in middle-income coun-tries, where agriculture’s share of GDP is onlyabout 15 percent, the sector still accounts formore than 25 percent of employment. Whencoupled with agro-related industries and food-related services, its share, even among middle-income countries, is typically 25 to 40 percentof GDP. About 73 percent of the poor in de-veloping countries live in rural areas. Ruraldevelopment, therefore, is central to alleviatingpoverty.
Government policy has heavily distortedagricultural performance in both developingand developed countries. Until the 1990s, in-dustrial countries generally protected agricul-ture, whereas developing countries generallytaxed it (Schiff and Valdes 1992). Industrialcountries supported their agricultural sectorsthrough subsidies to producers, high tariffs,and other nontariff measures such as importrestrictions and quotas.
—but agricultural policies have oftenworked to the detriment of the poorMost of the developing countries generatedthe bulk of their agricultural GDP in lower-efficiency production for the domestic market,supplying the world market with tropical com-modities that could not easily be produced in
the industrial countries. In products for whichthey competed with industrial countries, suchas sugar and beef, some countries could exportlimited amounts under preferential-access pro-grams. In an effort to generate public revenuesfrom commercialized export activities, govern-ments levied export taxes on agricultural prod-ucts while protecting manufacturing throughhigh import tariffs and other import restric-tions. Even for agricultural products that werenot exported, price controls, exchange ratepolicies, and other restrictions kept prices lowfor urban consumption.
In the last decade, developing countriesshifted from taxing agriculture to protecting it.Import restrictions on manufactured productshave declined dramatically, exchange rates havebeen devalued, multiple-exchange-rate systemspenalizing agriculture have been abandoned,and export taxes have effectively disappeared(World Bank 2000; Jansen, Robinson, and Tarp2002; Quiroz and Opazo 2000). Meanwhile,reforms in most industrial countries, includingmany of the successful middle-income coun-tries, have been modest—despite the inclusionof agriculture under the World Trade Organi-zation (WTO) in the Uruguay Round of inter-national trade negotiations. The result of thesepolicies has been overproduction and price de-clines in many commodities, reducing opportu-nities for many developing countries to expandexports and penalizing the world’s poor.
Consequently, although developing coun-tries have almost doubled their share of world
103
Agricultural Policiesand Trade
3
trade in manufactures over the last twodecades, their share in agricultural trade hasbeen stuck at around 30 percent. During the1990s, the growth of developing-country agri-cultural exports to industrial countries slowedas exports to other developing countries ac-celerated. During this period, 56 percent ofthe growth of developing-country agriculturaltrade was accounted for by sales to other de-veloping countries and 44 percent by sales toindustrial countries. The middle-income coun-tries have managed to increase global marketshare, principally by entering into other devel-oping countries’ markets and by aggressivelydiversifying into nontraditional exports, suchas seafood products, fruits, vegetables, cutflowers, and processed foods. Growth of thesenontraditional exports has outpaced growthof traditional commodities by three to one.Meanwhile, many low-income countries, ex-cept for China, have had less success—theirshare of world agricultural trade has declined.
High border protection in rich countriesfrustrates developmentThese patterns reflect—among other things—the structure of global protection. Border pro-tection in rich countries continues to be high,nontransparent, and antidevelopment. Averageagricultural tariffs in industrial countries,when they can be measured, are two to fourtimes higher than manufacturing tariffs. In ad-dition, about 28 percent of domestic produc-tion in countries belonging to the Organisationfor Economic Co-operation and Development(OECD) is protected by tariff rate quotas(TRQs). More than 40 percent of the tarifflines in the European Union (EU) and UnitedStates contain specific duties, which make itdifficult to calculate average tariffs and ob-scure actual levels of protection. Tariff peaksas high as 500 percent confront imports fromdeveloping countries. Tariffs also increase bydegree of processing, creating a highly esca-lating tariff structure that limits access forprocessed foods. Preferences do not compen-sate for these high levels. In the United States,only 34 percent of agricultural imports from
countries covered by the Generalized System ofPreferences (GSP) were eligible for preferences,and 26 percent of imports received them. De-veloping countries, too, have maintained highborder protection and, on average, have higheragricultural tariffs than industrial countries.However, direct comparisons are difficult be-cause of the complex nature of protection inindustrial countries.
Within OECD countries, budget subsidiesand transfers from consumers (from high tar-iffs and quantitative restrictions on domesticproduction of selected commodities) amountedto about $250 billion in 1999–2001. This pro-tection decreased from 62 percent of farmrevenues in 1986–88 to 49 percent in 1999–2001—still a very high percentage. Of this sup-port, 70 percent came from consumers viahigher prices associated with border protectionand 30 percent from direct subsidies. In devel-oping countries, almost all support is gener-ated by border barriers. A silver lining to thisdark cloud is that some developed-countrysubsidies have been at least partially delinkedfrom levels of production, lowering the incen-tive to overproduce. These partially decoupledsubsidies increased from 9 percent of total sub-sidies in 1996–98 to more than 20 percent in1999–01.
Although official export subsidies may besmall and shrinking, effective export subsidiescreated by domestic support are increasing,lending unfair advantage to industrial coun-try producers. Currently, cotton is not classi-fied as receiving export subsidies. Its domes-tic and export prices in the United States andthe European Union are the same—and thoseprices are less than half the cost of production.Similar differences exist in many other prod-ucts, a gap that will increase as industrialcountries move from protection through bor-der barriers to support through coupled orpartially decoupled subsidies.
Success in the Doha Round requiresreductions in agricultural protectionTo be meaningful for the world’s poor, theDoha Round must bring reductions in agricul-
G L O B A L E C O N O M I C P R O S P E C T S 2 0 0 4
104

tural protection around the world. The benefitsof global liberalization in agriculture—elimina-tion of all border barriers and subsidies—areestimated to be very large for industrial and de-veloping countries alike, topping $350 billionfor the world. With liberalization, agriculturalproduction would marginally shift from Northto South, and the highly depressed world pricesfor many commodities would increase: 10–20percent for cotton, 20–40 percent for dairyproducts, 10–20 percent for groundnuts, 33–90percent for rice, and 20–40 percent for sugar(Beghin and Aksoy 2003). The impact of theseprice changes on low-income net importerswould be small and manageable. To date, how-ever, many of the proposals designed to elicitconsensus on agricultural reform are modest.The average applied tariffs in the Quad coun-tries would be halved at best under such pro-posals. Tariff peaks would remain above 100percent for many countries. The outcomes fordeveloping countries are even less significant.For most of them, the cuts required by oneprominent proposal would leave their boundtariffs above their current applied rates, and tar-iff escalation and peaks would still be very high.
A serious agreement to reduce border pro-tections would produce benefits for theworld’s poor that far exceed those that can beanticipated from present levels of develop-ment assistance. A first order of business is tocreate a more transparent and simpler traderegime in all countries by converting specifictariffs to ad valorem tariffs, eliminating mini-mum price regulations, cutting peak tariffs,changing the structure of TRQs so they in-crease over time, and introducing a transpar-ent system of reallocation to more efficientproducers. Rich countries should phase outexport subsidies and subsidies that encourageoverproduction, both of which are directlyprejudicial to poor farmers around the world.
These reforms would also make the agri-culture in industrial countries more efficient,environmentally sustainable, and more sup-portive of the small family farms. The experi-ence of New Zealand, the only OECD countryto reform fully, clearly demonstrates that agri-
culture without support can be more dynamicand efficient.
Finally, along with greater market access,low-income countries need help in eliminatingbehind-the-border barriers, especially the seg-mentation of their rural markets. Those mar-kets should be linked to wider markets athome and abroad (box 3.1).
Poverty, rural households, and trade in agriculture
Agriculture is the livelihood of the world’s poorGrowth in agriculture has a disproportionateeffect on poverty because more than half ofthe population in developing countries residesin rural areas.1 Some 57 percent of the devel-oping world’s rural population live in lower-middle-income countries; 15 percent in theleast developed countries (LDCs).2 Althoughmost of the world’s poor countries are in Sub-Saharan Africa, they account for about only12 percent of developing world’s rural popu-lation, whereas Asia accounts for 65 percent.
Using the $1-a-day measure of poverty,most of the world’s poor live in India, China,and other lower-middle-income countries(table 3.1). National poverty data—whichallow separation of rural and urban householdinformation but are not available for all coun-tries—yield results that are very similar tothose obtained using the $1-a-day measure.They show that four countries—India, Bangla-desh, China, and Indonesia—account for 75percent of the world’s rural poor. It is in Asia,therefore, that rural income growth will havethe greatest impact on rural poverty.
Poverty is more common in rural areasIn countries for which separate rural andurban income data are available, 63 percent of the population, and 73 percent of the poor,live in rural areas. This is true for all regions.
A high incidence of rural poverty is found inall developing countries, whatever their level ofincome. More of the population is poor in low-
A G R I C U L T U R A L P O L I C I E S A N D T R A D E
105

income countries, however, and in the LDCsthe poverty rate for rural households reachesalmost 82 percent (table 3.2). The rural shareof the total number of poor households is de-clining with urbanization. Still, with currenttrends, the rural share of the global number ofpoor will not fall below 50 percent before2035 (Ravallion 2000).
Most poor countries are very dependent on agriculture for household income. In Ethio-pia and Malawi, for example, about three-quarters of household income is derived fromagricultural activities, mainly subsistence farm-ing. But cash income is also crucial (table 3.3).Whether derived from cash (export) crops orother sources, cash income allows farmers to
G L O B A L E C O N O M I C P R O S P E C T S 2 0 0 4
106
Table 3.1 Most of the world’s poor live in rural areas outside the least developed countriesDistribution of poor in developing countries (1999)
Percentage Poverty headcount,Population in millions (2001) of world’s under $1/day in 1999
Percent ruralNational Rural Urban rural population (percent) (millions)
Least developedcountries 596 443 153 74 15 49 292
Other low income 839 501 338 60 17 26 218Middle incomea 1,435 478 957 33 16 8 114China 1,272 805 467 63 27 18 226India 1,032 745 288 72 25 35 358Total 5,175 2,972 2,203 57 100 23 1,209
a. Excluding China and India.Source: World Bank data.
Poverty in rural areas of low-income countries isclosely correlated with distance to local and na-
tional markets. In addition to geographic distance,the concept of distance to market includes variouscosts of moving goods to and from markets.
Case studies in Armenia, Malawi, and Nepalshow that reductions in transportation costs bringstrong gains in household welfare for individualfarmers. Among these households, the poorer onesbenefit disproportionately because transportationcosts make up a larger percentage of their householdexpenditures.
Case studies in Ethiopia and Guinea reveal thatmany of the poor will be left behind by trade reformif no improvements are made in domestic markets. In Ethiopia, for example, 80 percent of the poorwould benefit from freer trade under conditions offull market participation and price transmission, but
Box 3.1 The impact of national trade integration andreform on poverty
only 55 percent would benefit without these condi-tions. Without improvements in the functioning oflocal and national markets, economic gains for thepoor may reach only one-fourth of their potential.
A case study in Madagascar illustrates thatimprovements in trade policies may not be sufficientto restore sustained growth in the agricultural sectorwithout better transport infrastructure and other re-forms. In Madagascar, where poverty is closely relatedto remoteness, defined to include lack of infrastructureand access to basic services, integrating the poor intoregional markets and the national economy will makea real contribution to increasing their incomes. In theabsence of integration, economic growth will tend tobenefit those who are already favored.
Source: Kudat, Ajwad, and Sivri (2003).

buy inputs—such as fertilizers—that increasefood-crop yields, lowering the incidence ofpoverty and malnutrition.
The share of nonfarm income in ruralhouseholds increases with a country’s level of development. In Mexico, for example, theshare of farm income in total rural income ismuch lower than in Ethiopia and Malawi. In-comes from farming are complemented byother sources, so that the direct impact of agri-cultural price and output variations have amuch smaller impact on rural households. Inindustrial countries, when a broad definitionof farm households is adopted, the share offarm income declines even further. Other
sources of income include salaries and wagesfrom other activities; investment income suchas interest, dividends, and rents; and socialtransfers from health, pension, unemployment,and child-allowance schemes.
Farmers in industrial countries earnabove-average incomesIn many industrial countries, the average in-comes of farmers are higher than the nationalaverage, reaching almost 250 percent of aver-age income for the Netherlands, 175 percentfor Denmark, 160 percent for France, and 110percent for the United States and Japan. Inmost other countries, the level of income iseither equal to or marginally lower than theaverage income (OECD 2002d). In lower in-come OECD countries such as Greece, Korea,and Turkey, rural incomes are lower—around75–80 percent of urban incomes.
As countries become wealthier, the share ofrural household income from nonfarm sourcesrises. Off-farm income for major field crops inthe United States, for example, is more than tentimes greater than farm income and eight timesgreater than government payments (table 3.4)Government payments exceed what U.S. farm-ers make from the market in farming. In fact,most farms lose money from farming alone.3
Of agricultural subsidies, only half reachesfarmers, and most goes to the richest Agricultural protection in industrial countrieshelps the relatively better-off rural house-holds—and it does so very inefficiently.4 Ac-
A G R I C U L T U R A L P O L I C I E S A N D T R A D E
107
Table 3.3 Even in subsistence economies,cash is importantPercentage of total household income derived from varioussources in rural areas, 1990s
Ethiopia Malawi Mexico
Total agricultural income 77 76 24Agricultural cash income 18 16 21Subsistence farming 59 60 3
Transfers 16 7 13Wages 3 8 42Other 4 9 21Total 100 100 100
Source: World Bank household data.
Table 3.2 Rural poverty is higher in poorercountriesShare of national population and of poor living in rural areas(percent)
Samplea All developing
Share of ruralcountries
Rural dwellers who Rural dwellers are poor dwellers
Upper middleincome 19 37 22
Lower middleincome 64 72 61
Low income 65 74 60Least developed 76 82 68All developing
countries 63 73 56
a. Sample consists of 52 countries for which separate ruraland urban income data are available.Source: World Bank data.
Table 3.4 U.S. farmers earn less fromfarming than from other sourcesShares of U.S. farmers’ income from various sources(billions of dollars)
Income source Value
Farming 11.6Government payments 14.7Off-farm activities 122.7
Source: USDA, “Agricultural Income and Finance Outlook,”September 26, 2002.

cording to OECD estimates, agricultural sup-port policies deliver additional income to farmhouseholds at a rate of 50 percent or less of theamounts transferred from consumers and tax-payers for support purposes (OECD 2002e). In the case of market price support and defi-ciency payments, the share is one-fourth orless; for input subsidies, less than one-fifth.Only one-quarter of every dollar of producersupport actually finds its way into the pro-ducer’s pocket—the rest goes to input suppliersand owners of other factors of production(OECD 1999, De Gorter 2003). The most im-portant outcome of these programs is that theylead to much higher land prices.
The largest farm operations, which gen-erally are also the most profitable and thewealthiest, receive most of the benefits of sup-port systems. In the United States, the largest25 percent of farms have average gross farm re-ceipts of more than $275,000 and average farmnet worth of more than $780,000. They receive89 percent of all support—in part because theyproduce a similar share of output. The remain-ing 1.6 million U.S. farms on average receivelittle support. Through the lens of householdincome surveys, the story is similar: At one ex-treme, farm households with an average in-come of $275,000 received payments averaging$32,000. At the other end of the spectrum,farm households with incomes averaging$13,000 received $2,200 in program payments.
In the European Union, where farm num-bers and structures differ somewhat, the distri-bution of support is not markedly different.The largest 25 percent of farms have averagegross farm receipts of more than €180,000 andaverage farm net worth of almost €500,000.They produce 73 percent of farm output andreceive 70 percent of support. Farms of thenext largest size have much smaller gross farmreceipts, averaging just over €43,000, and av-erage farm net worth of about €230,000. Theyproduce 17 percent of output and receive 19percent of support payments. The remaining 2million EU farms produce little, receive littlesupport, but have a sizeable average farm net
worth. In Japan and Canada, the largest 25percent of farms receive 68 percent and 70 per-cent of support payments, respectively.
In short, the subsidy programs prominent incurrent food and agriculture policy are not tar-geted to keeping small, struggling family farmsin business but instead provide hefty rents to large farmers. Nor are current production-based policies effective in achieving their vari-ous other objectives (such as environmentalsustainability and rural development). By in-creasing land prices they also lead to thecreation of larger farms and the elimination ofsmall family farms. Meanwhile, their unin-tended spillover effects on global markets, andon other countries, are large and negative.
At the most general level, it is probable thatagricultural protection in rich countries wors-ens global income distribution. First, farmers in the North earn more on average than theirown national averages. Second, the lion’s shareof farm aid goes to the largest and wealthiestfarmers. At the other end of the global distribu-tion spectrum, more of the poor tend to live inrural areas, and protection in rich countriestends to depress prices and demand for theirgoods.
International markets are important tosustained income growth in developingcountriesWhen subsidies depress prices the impacts inpoor countries can be severe. To illustrate theimpact of commodity price changes, Minotand Daniels (2002) used household incomedata to estimate the potential impact of cottonprice declines in Benin and tobacco price de-clines in Malawi, the major export crops ofthose two countries. Cotton prices have de-clined by almost 40 percent over the last fewyears. In Benin, a poor country, the impact ofthis decline in world cotton prices, if it werefully passed on to farmers, would reduce over-all welfare in rural areas by 6–7 percent andthat of cotton farmers by about 19 percent.The richest quintile of households, meanwhile,would experience a decline in income of 4 per-
G L O B A L E C O N O M I C P R O S P E C T S 2 0 0 4
108

cent. Thus this price change alone would in-crease the poverty rate in Benin by up to 8 per-centage points (depending on the simulations),from 40 percent to 48 percent.
Tobacco constitutes about 80 percent ofMalawi’s exports. A 30 percent decrease inworld tobacco prices over the last few yearshas reduced the income of small growers by anaverage of 8 percent. The poorest quintile haslost about 13 percent, the richest 7 percent.For a typical farmer, the annual net returnsfrom tobacco, the country’s most profitablecrop, declined from $108 to $26 (IntegratedFramework 2003). These rough estimates un-derstate the overall impact of the price de-clines, however, because cash incomes allowfarmers to purchase inputs, such as fertilizerand pesticides, that increase the yields for theirsubsistence crops and have a significant impacton their levels of poverty and malnutrition.
The importance of the global market goesbeyond price changes. For countries with a rel-atively small urban population, agricultural ex-ports can produce faster growth than can do-mestic market demand—however fast domesticdemand might be growing. In such cases, theinternational market provides growth opportu-nities without the constraint of sharply lowerprices, which often accompany an increase inagricultural production. Although food pro-duction for home consumption and the domes-tic market accounts for most agricultural pro-duction in the developing world, agriculturalexports and domestic food production areclosely related. Export growth contributes sig-nificantly to the growth of nonexport agricul-ture by providing cash income that can be usedto modernize farming practices. For those leav-ing the farm, growth and modernization ofagriculture create jobs in agricultural process-ing and marketing.
On balance, cash-crop income complementsand enhances food production, particularly inpoorer countries where opportunities to earnnonfarm income are more limited (figure 3.1)(Watkins 2003; Von Braun and Kennedy 1994;Minot and others 2000).
Trade and export growth in agriculture
The last two decades were periods of veryrapid growth in exports from developing
countries to other developing countries and tothe industrialized world (table 3.5). Growth inthe world economy accounts for some of thisexport growth, but lower trade barriers, im-proved supply capabilities, and increases inspecialization are more important. The rapidgrowth in exports was true both in manufac-turing, where levels of protection have beenreduced significantly, and in agriculture,where significant protection remains. Never-theless, manufacturing export growth rateswere much higher.
Agricultural trade makes up a growingshare of trade among developingcountries, but agricultural export shares to rich countries are stableAlthough developing countries’ exports accel-erated during the 1990s, agricultural exports
A G R I C U L T U R A L P O L I C I E S A N D T R A D E
109
Figure 3.1 Countries that produce morecash crops also produce more food
Annual growth rates of food and cash crop production in25 countries having agricultural output equal to at least15 percent of GNP, 1980–2001 (percent)
0
–.05 0 .05
Cash crop production growth rate
.1 .15
.02
.04
.06nga
ben
tgo
chdidaind
civ
kny
mdg
myrsen
carcam mlw
npl
bng
gmb
tnz
mlingr
zmb
zmb
pak
bfa
gha

did not keep pace with manufactured exports,largely because agricultural export growth ac-celerated only to the other developing coun-tries (table 3.6).5
Developing countries increased their shareof global manufacturing exports from 19 per-cent in 1980–81 to 33 percent in 2000–01. Ex-panding trade among developing countriescontributed to the gain in share, but higherexports to industrial countries also played asignificant part. In agriculture, by contrast, thedeveloping countries maintained, but did notexpand, their one-third share of world agri-cultural trade over the last two decades. Thesteady decline in the developing countries’ shareof agricultural exports to industrial countriesover the period was counterbalanced by an in-crease in their share of exports to other devel-oping countries. In other words, the significantdeceleration of nominal import growth in in-
dustrial countries, from 5.4 percent annuallyduring the 1980s to 1.9 percent in the 1990s,was offset by the increase in import growth indeveloping countries, which increased from 3percent annually to 6 percent.
Product trends differWhat accounts for the shift in markets for theagricultural exports of developing countries?Price changes alone do not appear to explainit (box 3.2). Static markets in industrial coun-tries for traditional developing-country prod-ucts such as coffee and tea probably contri-buted to declining import growth rates, as didthe decline in GDP growth rates, combinedwith low elasticity of demand.6
To explore the phenomenon further, we sep-arated agricultural exports into four sub-groups. The first consists of mostly tropical,developing-country products such as coffee,
G L O B A L E C O N O M I C P R O S P E C T S 2 0 0 4
110
Table 3.6 South-South exports in agriculture are rising as South-North export shares fallShare of global agricultural and manufacturing exports by source and destination, 1980–2001 (percent)
Developing countries Industrialized countries
1980–81 1990–91 2000–01 1980–81 1990–91 2000–01
Agriculture exports 35.9 32.9 36.9 64.1 67.1 63.1To developing 9.9 9.2 13.7 15.3 11.9 14.7To industrialized 26.0 23.7 23.2 48.8 55.3 48.4
Manufacturing exports 19.3 22.7 33.4 80.7 77.3 66.6To developing 6.6 7.5 12.3 21.7 15.2 19.0To industrialized 12.7 15.2 21.1 59.0 62.1 47.6
Source: COMTRADE.
Table 3.5 Manufacturing exports grew much faster than agricultural exportsExport growth rates (percent)
Developing countries’ export growth rates
World export growth rates Total Developing to developing Developing to industrialized
1980–81 to 1990–91 to 1980–81 to 1990–91 to 1980–81 to 1990–91 to 1980–81 to 1990–91 to1990–91 2000–01 1990–91 2000–01 1990–91 2000–01 1990–91 2000–01
Agriculture 4.3 3.6 3.4 4.8 3.6 7.8 3.4 3.3Manufacturing 5.9 4.8 7.6 8.9 7.3 10.0 7.8 8.3
Note: Manufacturing exports are deflated by the U.S. purchasing parity index (PPI) for finished goods less food and energy. Agri-culture exports are deflated by the U.S. PPI for farm products.Source: COMTRADE.
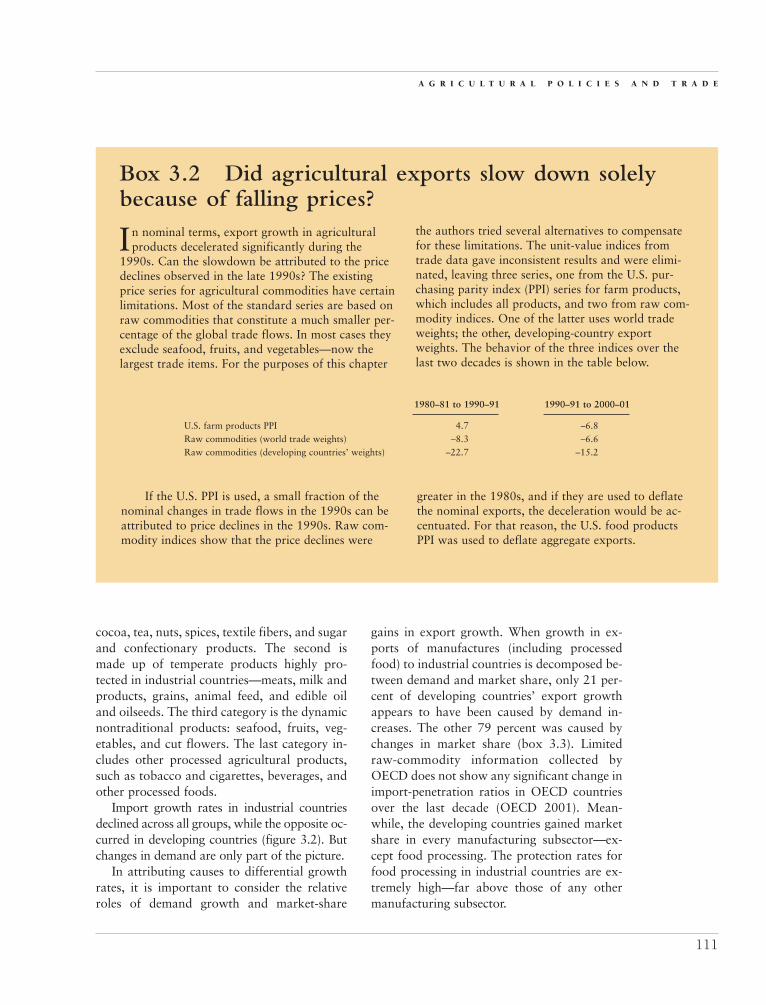
cocoa, tea, nuts, spices, textile fibers, and sugarand confectionary products. The second ismade up of temperate products highly pro-tected in industrial countries—meats, milk andproducts, grains, animal feed, and edible oiland oilseeds. The third category is the dynamicnontraditional products: seafood, fruits, veg-etables, and cut flowers. The last category in-cludes other processed agricultural products,such as tobacco and cigarettes, beverages, andother processed foods.
Import growth rates in industrial countriesdeclined across all groups, while the opposite oc-curred in developing countries (figure 3.2). Butchanges in demand are only part of the picture.
In attributing causes to differential growthrates, it is important to consider the relativeroles of demand growth and market-share
gains in export growth. When growth in ex-ports of manufactures (including processedfood) to industrial countries is decomposed be-tween demand and market share, only 21 per-cent of developing countries’ export growthappears to have been caused by demand in-creases. The other 79 percent was caused bychanges in market share (box 3.3). Limitedraw-commodity information collected byOECD does not show any significant change inimport-penetration ratios in OECD countriesover the last decade (OECD 2001). Mean-while, the developing countries gained marketshare in every manufacturing subsector—ex-cept food processing. The protection rates forfood processing in industrial countries are ex-tremely high—far above those of any othermanufacturing subsector.
A G R I C U L T U R A L P O L I C I E S A N D T R A D E
111
In nominal terms, export growth in agriculturalproducts decelerated significantly during the
1990s. Can the slowdown be attributed to the pricedeclines observed in the late 1990s? The existingprice series for agricultural commodities have certainlimitations. Most of the standard series are based onraw commodities that constitute a much smaller per-centage of the global trade flows. In most cases theyexclude seafood, fruits, and vegetables—now thelargest trade items. For the purposes of this chapter
Box 3.2 Did agricultural exports slow down solelybecause of falling prices?
the authors tried several alternatives to compensatefor these limitations. The unit-value indices fromtrade data gave inconsistent results and were elimi-nated, leaving three series, one from the U.S. pur-chasing parity index (PPI) series for farm products,which includes all products, and two from raw com-modity indices. One of the latter uses world tradeweights; the other, developing-country exportweights. The behavior of the three indices over thelast two decades is shown in the table below.
1980–81 to 1990–91 1990–91 to 2000–01
U.S. farm products PPI 4.7 –6.8Raw commodities (world trade weights) –8.3 –6.6Raw commodities (developing countries’ weights) –22.7 –15.2
If the U.S. PPI is used, a small fraction of thenominal changes in trade flows in the 1990s can beattributed to price declines in the 1990s. Raw com-modity indices show that the price declines were
greater in the 1980s, and if they are used to deflatethe nominal exports, the deceleration would be ac-centuated. For that reason, the U.S. food productsPPI was used to deflate aggregate exports.

The evolving structure of trade: towardnontraditional products with lower ratesof protectionWorld trade has moved away from traditionalexport commodities to other categories ofgoods. This is true of both developing and in-dustrial countries. The product groups thatgained significantly between 1980–81 and2000–01 are fruits, vegetables, and cut flowers(19 percent); fish and seafood (12.4 percent);and alcoholic and nonalcoholic drinks (8.7percent). Although products in these categoriestend to have high income elasticities, they alsoenjoy lower rates of protection in industrialand large developing countries. Product groupsthat showed significant declines during the pe-riod were grains (14.3 to 9.5 percent); coffee,cocoa, and tea; sugar and sugar products; andtextile fibers—all of which are among the tra-ditional exports of developing countries. Thedeclines were caused by a combination of pricedeclines, low demand elasticities, and—in thecase of sugar, grains, meats, and milk—highrates of protection and expanded productionin industrial countries.
While moving away from traditional ex-ports and into expanding subsectors, develop-
ing countries also have marginally expandedtheir exports of temperate products (grains,meats, and milk)—but mostly to other devel-oping rather than industrial countries. Theseimportant developments will require changesin how developing countries’ agricultural tradeis conceived and analyzed (figure 3.3).
Their trade gains have brought more devel-oping countries up against rising food safetystandards in the developed world. Meetingsuch standards has a cost—not just in compli-ance, but also in documenting that compliance.This cost can be repaid in the form of highertrade. Various mechanisms exist to help devel-oping countries rise to the standards (box 3.4).
Industrial-country export structures alsohave changed. Exports of protected productshave declined, whereas those of beverages,fruits, and vegetables have grown. Thesechanges are discernible despite the fact thatintra-EU trade is included in the global exportdata. One cause of the change is that greaterdomestic production of protected productshas made many industrial countries more self-sufficient in those products, reducing trade.
As a group, developing countries lost ex-port market share during the 1980s, but
G L O B A L E C O N O M I C P R O S P E C T S 2 0 0 4
112
Figure 3.2 Import growth rates of nontraditional export commodities decreased in industrialcountries but increased in developing countriesa. Industrial countries
Import growth rates (nominal USD, percent per annum)
b. Developing countries
Import growth rates (nominal USD, percent per annum)
Tropicalproducts
Temperateproducts
Seafood,fruits,
vegetables,and flowers
Otherprocessedproducts
Total Tropicalproducts
Temperateproducts
Seafood,fruits,
vegetables,and flowers
Otherprocessedproducts
Total0
1981–1991
1981–19911991–2001
��
�
�
1991–2001
1
2
3
4
5
6
7
8
9
10
0
1
2
3
4
5
6
7
8
9
10
Source: COMTRADE.
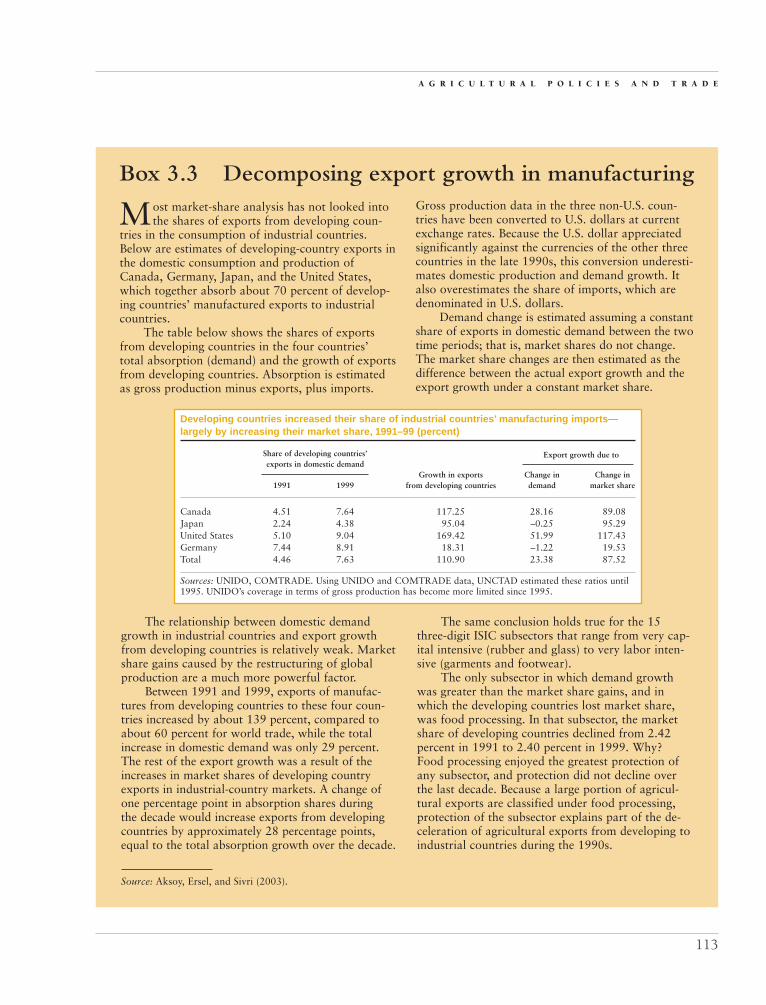
A G R I C U L T U R A L P O L I C I E S A N D T R A D E
113
Most market-share analysis has not looked intothe shares of exports from developing coun-
tries in the consumption of industrial countries.Below are estimates of developing-country exports inthe domestic consumption and production ofCanada, Germany, Japan, and the United States,which together absorb about 70 percent of develop-ing countries’ manufactured exports to industrialcountries.
The table below shows the shares of exportsfrom developing countries in the four countries’ total absorption (demand) and the growth of exportsfrom developing countries. Absorption is estimatedas gross production minus exports, plus imports.
Box 3.3 Decomposing export growth in manufacturingGross production data in the three non-U.S. coun-tries have been converted to U.S. dollars at currentexchange rates. Because the U.S. dollar appreciatedsignificantly against the currencies of the other threecountries in the late 1990s, this conversion underesti-mates domestic production and demand growth. Italso overestimates the share of imports, which aredenominated in U.S. dollars.
Demand change is estimated assuming a constantshare of exports in domestic demand between the twotime periods; that is, market shares do not change.The market share changes are then estimated as thedifference between the actual export growth and theexport growth under a constant market share.
Developing countries increased their share of industrial countries’ manufacturing imports—largely by increasing their market share, 1991–99 (percent)
Share of developing countries’ Export growth due toexports in domestic demand
Growth in exports Change in Change in1991 1999 from developing countries demand market share
Canada 4.51 7.64 117.25 28.16 89.08Japan 2.24 4.38 95.04 –0.25 95.29United States 5.10 9.04 169.42 51.99 117.43Germany 7.44 8.91 18.31 –1.22 19.53Total 4.46 7.63 110.90 23.38 87.52
Sources: UNIDO, COMTRADE. Using UNIDO and COMTRADE data, UNCTAD estimated these ratios until1995. UNIDO’s coverage in terms of gross production has become more limited since 1995.
The relationship between domestic demandgrowth in industrial countries and export growthfrom developing countries is relatively weak. Marketshare gains caused by the restructuring of globalproduction are a much more powerful factor.
Between 1991 and 1999, exports of manufac-tures from developing countries to these four coun-tries increased by about 139 percent, compared toabout 60 percent for world trade, while the totalincrease in domestic demand was only 29 percent.The rest of the export growth was a result of theincreases in market shares of developing countryexports in industrial-country markets. A change ofone percentage point in absorption shares during the decade would increase exports from developingcountries by approximately 28 percentage points,equal to the total absorption growth over the decade.
The same conclusion holds true for the 15three-digit ISIC subsectors that range from very cap-ital intensive (rubber and glass) to very labor inten-sive (garments and footwear).
The only subsector in which demand growthwas greater than the market share gains, and inwhich the developing countries lost market share,was food processing. In that subsector, the marketshare of developing countries declined from 2.42percent in 1991 to 2.40 percent in 1999. Why?Food processing enjoyed the greatest protection ofany subsector, and protection did not decline overthe last decade. Because a large portion of agricul-tural exports are classified under food processing,protection of the subsector explains part of the de-celeration of agricultural exports from developing toindustrial countries during the 1990s.
Source: Aksoy, Ersel, and Sivri (2003).

reversed that trend in the 1990s (table 3.7).Modest expansion in the 1990s brought themback to where they had been in the early1980s. Global gains were made by middle- andlow-income countries, mostly to other devel-oping countries. China is an exception to thistrend, having increased its export shares in allmarkets. Even in the 1990s low-income coun-tries continued to lose market share in theirexports to industrial countries, making up the loss by expanding their export shares indeveloping-country markets. In tropical prod-ucts, where global shares declined, low-incomecountries increased their shares to the otherdeveloping countries.
The LDCs lost export market share in bothmarkets during both decades. Unlike other de-veloping countries, they have not been able tomake up their market-share losses in tropicalproducts by expanding their shares in thegrowing subsectors: seafood and fruits andvegetables. Their only gains have come in sea-food, and much of the expansion has comefrom industrial-country vessels fishing in theirwaters. In highly protected products, South-South trade has expanded, possibly as a resultof regional trading arrangements.
Global agricultural protection:The bias against development
Progress in the Uruguay Round was moreformal than realSince the 1980s, two important developmentshave occurred in agricultural trade policy.First, most developing and a few industrialcountries have made major reforms in theirprotection regimes involving unilateral and re-gional reductions in tariffs and quotas. Forexample, unilateral reforms in the 1990s ef-fectively eliminated export taxation in mostdeveloping countries. Average tariffs havedeclined rapidly, while other import restric-tions, such as foreign exchange allocations forimports, have effectively disappeared (WorldBank 2001). Manufacturing tariffs droppedmore than agricultural tariffs. In at least oneway, agricultural protection expanded: Manymiddle-income countries began subsidizingtheir agricultural products.
Second, the Uruguay Round Agreement on Agriculture brought agricultural trade intoWTO disciplines. Before Uruguay, agriculturalproducts had no bound tariffs, and tariffs oftenwere supplemented by nontariff measures such
G L O B A L E C O N O M I C P R O S P E C T S 2 0 0 4
114
Figure 3.3 Developing countries’ exports of nontraditional products have surged, butindustrial countries’ exports have changed littlea. Developing countries
Percent of developing country exports
b. Industrial countries
Percent of developing country exports
Tropicalproducts
Temperateproducts
Seafood,fruits,
vegetables,and flowers
Otherprocessedproducts
Tropicalproducts
Temperateproducts
Seafood,fruits,
vegetables,and flowers
Otherprocessedproducts
Source: COMTRADE.
0
10
20
30
40
50
60
1981
1991
2001
�
�
�
0
10
20
30
40
50
60
1981
1991
2001�
� �

A G R I C U L T U R A L P O L I C I E S A N D T R A D E
115
Agricultural trade is shifting toward high-value,perishable commodities such as fresh fruits, veg-
etables, meats, and fish. With this change have comeconsumer concerns over food safety. In response,governments and private companies have developeda growing array of rules, regulations, and standards.Some fear that these standards will be used by high-income countries as a tool of trade protection.
Some developing countries have risen to thehigher standards. Kenya’s exporters send fresh veg-etables and salad greens by air freight to majorEuropean supermarket chains. In that industry, foodsafety standards have accelerated the adoption ofmodern supply-management techniques and stimu-lated public-private collaboration (Jaffee 2003).Many developing-country suppliers, however, willnot be able to meet the more stringent standardswithout technical advice, upgraded production andprocessing facilities, better enforcement of standards,and closer working relationships with importers inhigh-income countries.
Box 3.4 Food safety standards: From barriers to opportunities
Nearly all of the cases of allegedly protectionistuse of food safety measures brought before the WTOhave involved trade between developed countriesover issues such as hormone residues in meat and ge-netically modified foods. Although some food-importbans have been heavily publicized, their applicationagainst developing countries is quite rare and typi-cally has involved complementary rather than com-petitive products. However, some evidence suggeststhat developing countries employ safety regulationsas a protectionist measure against other developingcountries.
The available evidence suggests that most food-safety-related problems that developing-country ex-porters encounter are well within their capacities toresolve. According to data from the U.S. Food andDrug Administration, most detentions of developing-country food products involve labeling violations orvery basic problems of food hygiene—and thus ofquality assurance (see table). No firm can operatelong without addressing such problems.
Even for more complex food safety issues, de-veloping countries have room to maneuver. An arrayof strategies exists to help them meet product andprocess standards for international markets. Espe-cially in middle-income countries, the good manu-facturing practices and good agricultural practices
long demanded by overseas customers and con-sumers are now being demanded by discerningdomestic consumers as well. They are well withinproducers’ reach.
The European Union lays down harmonizedhygiene requirements governing the catching, pro-
Detentions by U.S. Food and Drug Administration of imports from developingcountries 1997 and 2001 (percent)
Latin America and Asia IndiaReasons for contravention the Caribbean 1996–97 1996–97 2001
Food additives 1.4 7.4 7.4Pesticide residues 20.6 0.4 1.9Heavy metals 10.7 1.5 0.6Mold 11.9 0.8 0.4Microbiological contamination 6.2 15.5 15.3Decomposition 5.2 11.5 0.3Filth 31.4 35.2 26.4Low acid canned food 3.6 14.3 4.1Labeling 5.0 10.8 15.7Other 1.7 2.6 27.8Total 100.0 100.0 100.0Total number 3,985 5,784 2,148
Source: USFDA.
(Continues on next page)

G L O B A L E C O N O M I C P R O S P E C T S 2 0 0 4
116
cessing, transportation, and storage of fish and fish-ery products. Processing facilities must be inspectedand approved by a specified authority in the countryof origin. Countries whose local requirements havebeen found by the Commission to be at least as strin-gent as those in the European Union and for whichspecific import requirements have been establishedare placed on “List I” and enjoy reduced physical in-spection at the border.
Between 1997 and October 2002, the number ofcountries achieving List 1 status increased from 27 to72. More than half are low-income or lower middle-income countries; half of these are low-incomeAfrican countries. Another 35 countries are on ListII, including the United States (Henson and Mitullah2003).
Food safety compliance costs can include thecost of adjusting production and processing facilities;the recurrent costs to implement food safety manage-ment systems; and the costs of certification, monitor-ing, and enforcement. Relatively few estimates areavailable on the magnitude of these costs. When acountry is already exporting high-valued foods, com-pliance may require only incremental productionchanges and public-sector oversight. However, forother suppliers the costs of reaching internationallycompetitive levels may be high. The Bangladeshishrimp industry invested an estimated $18 million in the latter half of the 1990s to upgrade fish-processing facilities and product-testing laboratories,and to make other changes in response to repeatedquality and safety detentions on exports to the Euro-pean Union and the United States. However, theseexpenditures have been rewarded with rapidly in-creasing (and better priced) shrimp exports—whichtotaled $296 million in 2000 (Cato and others2000).
Standards can also be a barrier to trade. Con-sider the case of camel milk cheese exports to the EU.Tiviski SARL, a dairy processor in Nouakchott, Mau-ritania, developed a technology to produce “patemolle” cheese from camel milk. It obtained the milkfrom nomad milk producers who were very poor. Inreturn, Tiviski provided the producers with cheap ac-
Box 3.4 (continued)
cess to credit and vaccinated their animals to ensure asupply of healthy milk. The camel cheese, after trans-port and production costs, was priced at $10 perkilogram in the EU. After winning a prize at a tradefair, the cheese soon found its way into elite storeslike Harrods in London and Fauchon in Paris. How-ever, it proved to be difficult to find the correct tar-iff line for the product, and grouping it with “otherdairy, cheese” exposed it to a much higher tariff thanregular cheese. To make matters worse, the EU soondecided to abolish imports of camel cheese fromMauritania, arguing that the presence of “hoof andmouth” disease in Mauritania could be transmittedfrom camels to other livestock, even though there isno real evidence that camels are capable of spreadingthe disease. The EU then imposed another restriction:camel cheese could indeed be imported—but only ifmechanical methods were used to obtain milk used in its production—an unworkable proposal for thelow-income milk producers who were located milesaway from major ports. Mauritania did not disputethis case at the WTO because of the sheer costs in-volved—costs that were not justified for exports of $3 million to $5 million worth of cheese per year.Catfish producers in Vietnam have had similardifficulties accessing the American market, initiallybecause of labeling rulings (and then later because of anti-dumping judgments; see box in Chapter 2).
The emerging set of international and developed-country food safety standards present challenges formany exporters in developing countries. Concerted ef-forts to address basic hygiene and quality-assurancerequirements and to provide relatively simple train-ing for farmers could go a long way in ensuring com-pliance with most official food safety standards. Incircumstances where compliance requires greater in-vestment—both by the public and private sectors—partnerships between developed and developing coun-tries and among developing countries may fill the bill.Beyond this, the public has to remain vigilant thatstandards do not become misused as instruments ofprotection.
Source: World Bank staff.

as import quotas or bans, quantitative restric-tions, variable levies, and monopoly purchas-ing by state-owned or other companies. Importbarriers were coupled with the widespread useof production-related subsidies, such as pricesupports, which often led (and still leads) toincreases in production above the level of mar-ket equilibrium. Excess production had to bestockpiled or exported, sometimes with thehelp of further subsidies. With the intention ofaligning agricultural trade rules with those ap-plying to trade in other goods, the UruguayRound negotiators agreed that all import barri-ers, other than those in place for health andsafety reasons, should take the form of transpar-ent tariffs. Before agreeing on tariff reductions,all border measures had to be converted intotheir tariff equivalents—a process known as“tariffication.”
The conversion of nontariff measures intotariffs was generally done using the price-gapmethod—the gap being the difference betweendomestic and world market prices. After es-tablishing the tariff equivalent of an import re-striction, reductions were applied from boundtariffs. Developed countries reduced their tar-iffs by an average of 36 percent and a mini-mum of 15 percent over six years; developingcountries by an average of 20 percent and aminimum of 10 percent over ten years. Theagreed reductions were simple averages, notweighted for the volume of trade, so somecountries made large reductions in tariffs thatwere already low—for example, achieving a
50 percent reduction by dropping a tariff from2 percent to 1 percent—or in areas of low sen-sitivity, while making only the minimum re-duction in sensitive product areas. The Roundoffered limited opportunities to make mini-mum import commitments for certain prod-ucts instead of adopting tariffs on them. Theminimum import option was taken by Japan,Korea, and the Philippines for rice, and by Is-rael for certain sheep and dairy products. (Ja-pan has since tariffied rice imports.)
Once a tariff was established, bindings andreductions were negotiated. In cases wheretariffs were high, or where quotas had been al-lowed in some imports, minimum and currentmarket-access opportunities were also negoti-ated. The typical result was the establishmentof a minimal tariff rate for a limited volume ofimports—called a tariff rate quota (TRQ).
With the removal of nontariff measures,some countries worried that they would not beable to prevent surges in import volumes orfalling import prices. To allay these concerns,negotiators agreed that a special agriculturalsafeguard could be applied to certain products.
The Uruguay Round yielded no meaningfulreduction in protection in industrial countries.In many cases, in fact, protection may have in-creased as a result of so-called dirty tariffica-tion (Nogues 2002, Ingco 1997). Continuedprotection has led to greater import substitu-tion, while the geographical restructuring ofproduction that occurred in manufacturingdid not occur—at least not to the same de-
A G R I C U L T U R A L P O L I C I E S A N D T R A D E
117
Table 3.7 Developing countries have shared unequally in export market gainsExport shares of food and agricultural products by income level (as percentage of total world trade)
Exports to industrial countries Exports to developing countries Total exports
Income level 1980–81 1990–91 2000–01 1980–81 1990–91 2000–01 1980–81 1990–91 2000–01
Industrial 48.8 55.3 48.4 15.3 11.9 14.7 64.1 67.1 63.1 Middle-income* 19.6 18.4 17.0 7.3 6.4 9.8 26.9 24.8 26.8 Low-income 5.2 3.4 3.4 1.4 1.3 2.0 6.5 4.8 5.4 of which LDCs 1.6 0.8 0.7 0.7 0.4 0.5 2.3 1.3 1.1
China 0.7 1.3 2.1 0.9 1.2 1.4 1.7 2.5 3.5 India 0.5 0.5 0.6 0.3 0.3 0.5 0.8 0.8 1.1 Total 74.9 78.9 71.6 25.1 21.1 28.4 100.0 100.0 100.0
* Excluding India and China.Source: COMTRADE.

gree—in agriculture. Review of the experienceto date with the new rules on market access,export subsidies, and domestic support indi-cates that the effects of implementation of theUruguay Round Agricultural Agreement havebeen modest. The reasons include weaknessesin specific aspects of the agreement, such ashigh baseline support levels from which re-ductions were made. In some countries, in-cluding the United States, reforms undertakenbefore the negotiations were adequate to ful-fill the new rules on reducing domestic sup-port (OECD 2001).
Today, protection in agriculture takes dif-ferent forms—tariff protection, subsidies, tar-iff peaks, TRQs, tariff escalation, and opaquetariffs. In reviewing these forms, the followingsection makes two fundamental points:
• First, the various forms of protection areoften linked. For example, goods pro-duced behind high tariff walls and withproduction subsidies often require exportsubsidies to be sold in the world market.That said, border barriers are more im-portant than subsidies.
• Second, virtually the entire interlinkedsystem of protection, even when used byother developing countries, is heavily bi-
ased against developing countries—andagainst the world’s poor.
Import barriers are the most importantinstrument of protection
Although the conversion of nontariff barri-ers to tariffs during the Uruguay Round wasan important step forward, average agricul-tural tariffs in most industrial and developingcountries were and remain much higher thantariffs for nonagricultural products.
This section evaluates the agricultural traderegimes of the Quad countries (Canada, Euro-pean Union, Japan, United States) and 25developing countries in light of the UruguayRound’s objectives. Eight of the developingcountries in the sample are large middle-income countries with significant agriculturalsectors. Eight more middle-income countriesare included to ensure regional balance. Eightlower-income countries round out the sample.Emphasis has been placed on the nature oftariffs because a key objective of the UruguayRound was to lower tariffs and make themmore transparent.
The tariff data in table 3.8 underestimateactual border protection. First, specific duties,which generally are higher than ad valoremrates, are not fully reflected in the simple av-
G L O B A L E C O N O M I C P R O S P E C T S 2 0 0 4
118
Table 3.8 Agricultural tariffs are higher than manufacturing tariffs in both rich and poorcountriesMost-favored-nation, applied, ad valorem, out-of-quota duties (percent)
Percentage of lines Agriculture Manufacturing covered in agriculture
Quad countries 10.7 4.0 86.7Canada (2001) 3.8 3.6 76.0European Union (1999) 19.0 4.2 85.9Japan (2001) 10.3 3.7 85.5United States (2001) 9.5 4.6 99.3
Large middle-income countriesa 26.6 13.1 91.3Other middle-income countriesb 35.4 12.7 97.7Lower-income countriesc 16.6 13.2 99.8
a. Brazil (2001), China (2001), India (2000), Korea (2001), Mexico (2001), Russian Federation (2001), South Africa (2001), andTurkey (2001).b. Bulgaria (2001), Costa Rica (2001), Hungary (2001), Jordan (2000), Malaysia (2001), Morocco (1997), Philippines (2001),and Romania (1999).c. Bangladesh (1999), Guatemala (1999), Indonesia (1999), Kenya (2001), Malawi (2000), Togo (2001), Uganda (2001), andZimbabwe (2001).Source: WTO Integrated Database.
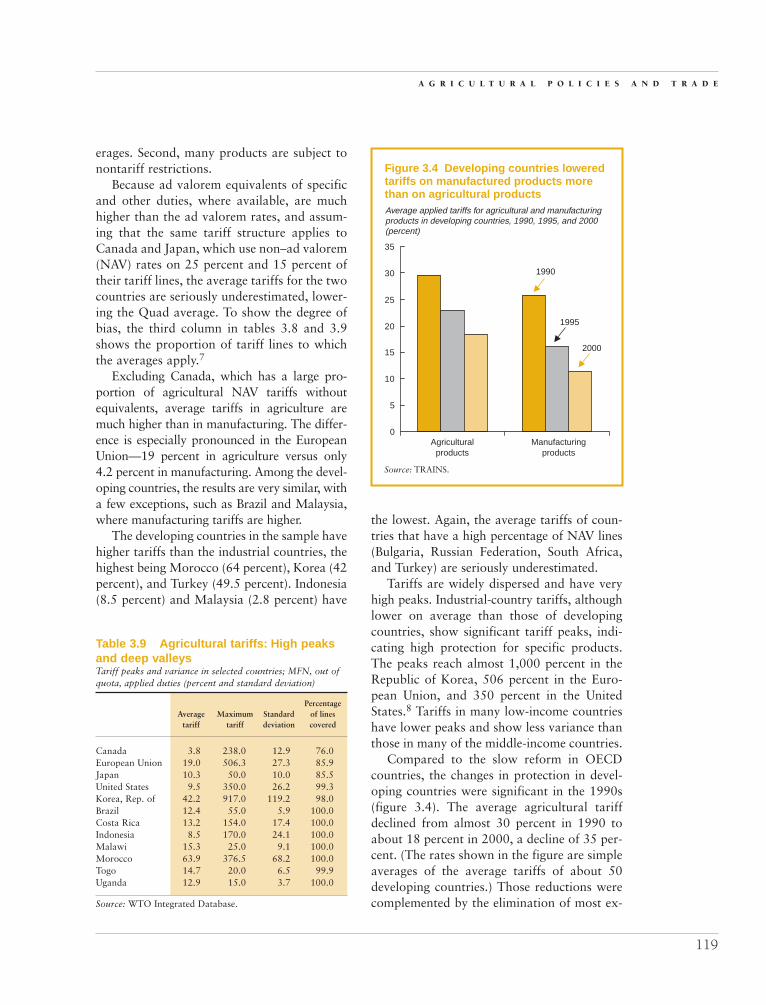
erages. Second, many products are subject tonontariff restrictions.
Because ad valorem equivalents of specificand other duties, where available, are muchhigher than the ad valorem rates, and assum-ing that the same tariff structure applies toCanada and Japan, which use non–ad valorem(NAV) rates on 25 percent and 15 percent oftheir tariff lines, the average tariffs for the twocountries are seriously underestimated, lower-ing the Quad average. To show the degree ofbias, the third column in tables 3.8 and 3.9shows the proportion of tariff lines to whichthe averages apply.7
Excluding Canada, which has a large pro-portion of agricultural NAV tariffs withoutequivalents, average tariffs in agriculture aremuch higher than in manufacturing. The differ-ence is especially pronounced in the EuropeanUnion—19 percent in agriculture versus only4.2 percent in manufacturing. Among the devel-oping countries, the results are very similar, witha few exceptions, such as Brazil and Malaysia,where manufacturing tariffs are higher.
The developing countries in the sample havehigher tariffs than the industrial countries, thehighest being Morocco (64 percent), Korea (42percent), and Turkey (49.5 percent). Indonesia(8.5 percent) and Malaysia (2.8 percent) have
the lowest. Again, the average tariffs of coun-tries that have a high percentage of NAV lines(Bulgaria, Russian Federation, South Africa,and Turkey) are seriously underestimated.
Tariffs are widely dispersed and have veryhigh peaks. Industrial-country tariffs, althoughlower on average than those of developingcountries, show significant tariff peaks, indi-cating high protection for specific products.The peaks reach almost 1,000 percent in theRepublic of Korea, 506 percent in the Euro-pean Union, and 350 percent in the UnitedStates.8 Tariffs in many low-income countrieshave lower peaks and show less variance thanthose in many of the middle-income countries.
Compared to the slow reform in OECDcountries, the changes in protection in devel-oping countries were significant in the 1990s(figure 3.4). The average agricultural tariffdeclined from almost 30 percent in 1990 toabout 18 percent in 2000, a decline of 35 per-cent. (The rates shown in the figure are simpleaverages of the average tariffs of about 50developing countries.) Those reductions werecomplemented by the elimination of most ex-
A G R I C U L T U R A L P O L I C I E S A N D T R A D E
119
Table 3.9 Agricultural tariffs: High peaksand deep valleysTariff peaks and variance in selected countries; MFN, out ofquota, applied duties (percent and standard deviation)
Percentage Average Maximum Standard of lines
tariff tariff deviation covered
Canada 3.8 238.0 12.9 76.0European Union 19.0 506.3 27.3 85.9Japan 10.3 50.0 10.0 85.5United States 9.5 350.0 26.2 99.3Korea, Rep. of 42.2 917.0 119.2 98.0Brazil 12.4 55.0 5.9 100.0Costa Rica 13.2 154.0 17.4 100.0Indonesia 8.5 170.0 24.1 100.0Malawi 15.3 25.0 9.1 100.0Morocco 63.9 376.5 68.2 100.0Togo 14.7 20.0 6.5 99.9Uganda 12.9 15.0 3.7 100.0
Source: WTO Integrated Database.
Figure 3.4 Developing countries loweredtariffs on manufactured products morethan on agricultural products
1990
1995
2000
�
�
�
0Agricultural
productsManufacturing
products
5
10
15
20
25
30
35
Average applied tariffs for agricultural and manufacturing products in developing countries, 1990, 1995, and 2000 (percent)
Source: TRAINS.

port taxes as well as import licensing andmany other quantitative restrictions (WorldBank 2001). Average tariffs in agriculture re-main much higher than those in manufactur-ing, however, indicating that the general ten-dency in the 1980s—to protect the industrialsector—no longer holds. In their study of 15developing countries, Jensen, Robinson, andTarp (2002) concluded that the bias againstagriculture in the 1980s no longer exists. Theeconomy-wide system of indirect taxes, in-cluding tariffs and export taxes, significantlydiscriminated against agriculture in only onecountry. It was largely neutral in five, pro-vided a moderate subsidy to agriculture infour, and strongly favored agriculture in five.
Subsidies underpin the system of border protectionAn extensive network of subsidies has evolvedto support agriculture, particularly in the richcountries. Protection takes three major forms.
• Border barriers such as tariffs and quan-titative restrictions, designed to support
prices in domestic markets, account forabout 70 percent of total protection inthe OECD countries.
• Production-related subsidies given tofarmers under different schemes, called“direct support,” usually take the formof direct budget transfers.
• General support for agriculture—throughresearch, training, marketing, and infra-structure programs—usually is not includedin the estimates of producer supports.
In addition, many countries have subsidiesfor their consumers, but generally these do notaffect production and thus are not included inproducer-support estimates.
The support accorded to OECD-countryproducers through higher domestic prices anddirect production subsidies was $248 billion in1999–2001 (table 3.10). Some two-thirds ofthe total—$160 billion—came from the bor-der barriers described above or from marketprice support mechanisms. The remaindercame in the form of direct subsidies to farmers.Another $80 billion in subsidies came from
G L O B A L E C O N O M I C P R O S P E C T S 2 0 0 4
120
Table 3.10 Most subsidies go to producers—and come from border protectionAgricultural support in the OECD countries, 1999–2001 (billions of dollars)
EuropeanUnion Other
United European Emerging accession OECD TotalStates Union Japan supportersa countriesb countries OECD
Where total support goesConsumers 21.4 3.8 0.1 0.7 0.0 0.2 26.2General services 22.8 9.6 12.7 7.1 0.6 2.3 55.1Producers 51.3 99.3 52.0 30.4 3.0 12.3 248.3Total 95.5 112.7 64.8 38.2 3.6 14.9 329.6
Where producer support goesCorn 8.3 2.7 Nc 1.7 –0.1 0.2 12.9Meatc 2.6 34.0 4.1 3.4 0.5 2.8 47.3Milk 12.4 16.7 4.9 2.7 0.7 4.7 42.1Rice 0.7 0.2 18.0 7.6 Nc –0.2 26.4Wheat 4.9 9.5 0.8 0.9 0.3 0.9 17.3Other 22.3 36.2 24.1 14.1 1.9 3.6 102.2
Where producer support comes fromDomestic measuresd 32.6 38.5 5.0 4.4 1.4 6.3 88.2Border measurese 18.7 60.9 47.0 26.0 2.0 5.7 160.1
a. Includes Korea, Turkey, and Mexico.b. Includes Czech Republic, Hungary, Poland, and Slovak Republic.c. Beef and pork.d. Direct payments to producers.e. Tariffs and tariff equivalents of other border measures.Sources: OECD (2002) and authors’ calculations.
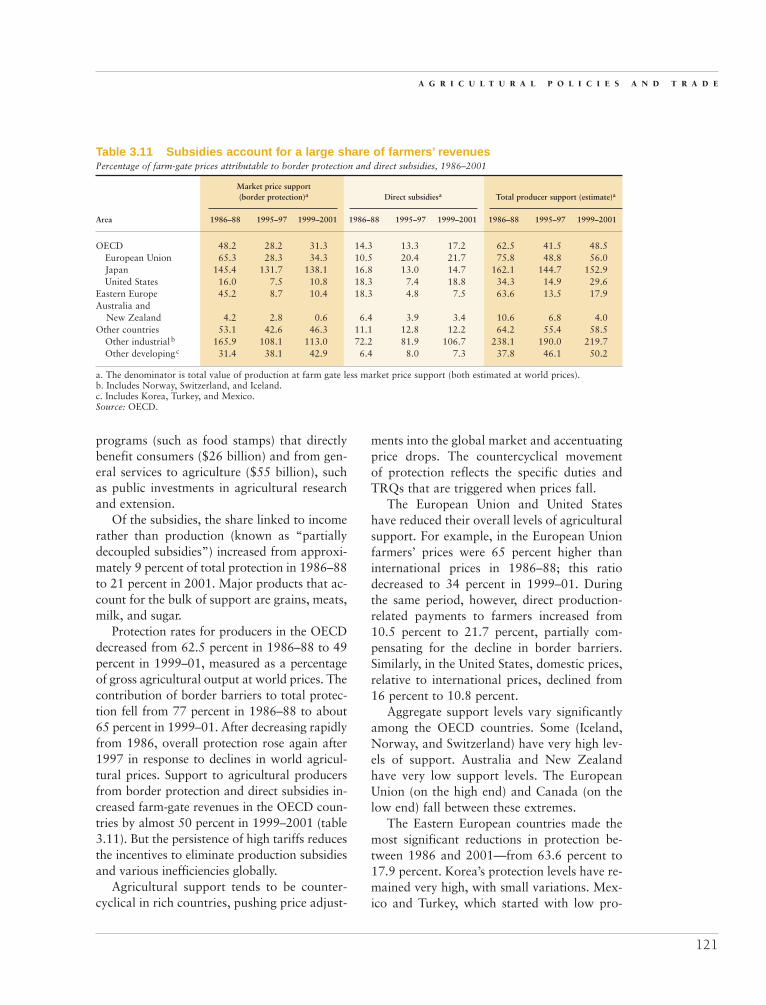
programs (such as food stamps) that directlybenefit consumers ($26 billion) and from gen-eral services to agriculture ($55 billion), suchas public investments in agricultural researchand extension.
Of the subsidies, the share linked to incomerather than production (known as “partiallydecoupled subsidies”) increased from approxi-mately 9 percent of total protection in 1986–88to 21 percent in 2001. Major products that ac-count for the bulk of support are grains, meats,milk, and sugar.
Protection rates for producers in the OECDdecreased from 62.5 percent in 1986–88 to 49percent in 1999–01, measured as a percentageof gross agricultural output at world prices. Thecontribution of border barriers to total protec-tion fell from 77 percent in 1986–88 to about65 percent in 1999–01. After decreasing rapidlyfrom 1986, overall protection rose again after1997 in response to declines in world agricul-tural prices. Support to agricultural producersfrom border protection and direct subsidies in-creased farm-gate revenues in the OECD coun-tries by almost 50 percent in 1999–2001 (table3.11). But the persistence of high tariffs reducesthe incentives to eliminate production subsidiesand various inefficiencies globally.
Agricultural support tends to be counter-cyclical in rich countries, pushing price adjust-
ments into the global market and accentuatingprice drops. The countercyclical movement of protection reflects the specific duties andTRQs that are triggered when prices fall.
The European Union and United Stateshave reduced their overall levels of agriculturalsupport. For example, in the European Unionfarmers’ prices were 65 percent higher thaninternational prices in 1986–88; this ratiodecreased to 34 percent in 1999–01. Duringthe same period, however, direct production-related payments to farmers increased from10.5 percent to 21.7 percent, partially com-pensating for the decline in border barriers.Similarly, in the United States, domestic prices,relative to international prices, declined from16 percent to 10.8 percent.
Aggregate support levels vary significantlyamong the OECD countries. Some (Iceland,Norway, and Switzerland) have very high lev-els of support. Australia and New Zealandhave very low support levels. The EuropeanUnion (on the high end) and Canada (on thelow end) fall between these extremes.
The Eastern European countries made themost significant reductions in protection be-tween 1986 and 2001—from 63.6 percent to17.9 percent. Korea’s protection levels have re-mained very high, with small variations. Mex-ico and Turkey, which started with low pro-
A G R I C U L T U R A L P O L I C I E S A N D T R A D E
121
Table 3.11 Subsidies account for a large share of farmers’ revenues Percentage of farm-gate prices attributable to border protection and direct subsidies, 1986–2001
Market price support (border protection)a Direct subsidiesa Total producer support (estimate)a
Area 1986–88 1995–97 1999–2001 1986–88 1995–97 1999–2001 1986–88 1995–97 1999–2001
OECD 48.2 28.2 31.3 14.3 13.3 17.2 62.5 41.5 48.5European Union 65.3 28.3 34.3 10.5 20.4 21.7 75.8 48.8 56.0Japan 145.4 131.7 138.1 16.8 13.0 14.7 162.1 144.7 152.9United States 16.0 7.5 10.8 18.3 7.4 18.8 34.3 14.9 29.6
Eastern Europe 45.2 8.7 10.4 18.3 4.8 7.5 63.6 13.5 17.9Australia and
New Zealand 4.2 2.8 0.6 6.4 3.9 3.4 10.6 6.8 4.0Other countries 53.1 42.6 46.3 11.1 12.8 12.2 64.2 55.4 58.5
Other industrialb 165.9 108.1 113.0 72.2 81.9 106.7 238.1 190.0 219.7Other developingc 31.4 38.1 42.9 6.4 8.0 7.3 37.8 46.1 50.2
a. The denominator is total value of production at farm gate less market price support (both estimated at world prices).b. Includes Norway, Switzerland, and Iceland.c. Includes Korea, Turkey, and Mexico.Source: OECD.

tection, increased it over this period, mainlythrough higher border protection.
The high domestic price differentials intable 3.11 indicate that domestic production isprotected much more significantly than the un-weighted average tariff rates shown in table3.8 would imply. In Japan, for example, borderprotection raises market prices by some 138percent, whereas the average tariff is just 10percent and the maximum ad valorem tariff isonly 50 percent. The difference can only be at-tributed to specific duties and TRQs, which arenot included in the data set. For the EuropeanUnion, the situation is similar. Border protec-tion raises prices by more than 34 percent, wellabove the average tariff of 19 percent. In bothareas, tariffs on many local specialties are veryhigh. For example, in the European Union theaverage tariffs for grains, meats, and milk andmilk products are 34.6 percent, 32.5 percent,and 54.6 percent respectively.
Specific duties produce hidden tariffincreases in downturnsThe Uruguay Round objective of providinggreater transparency of protection levelsthrough tariffication has not been fully realized,especially in the key industrial and somemiddle-income countries. First, many agricul-tural tariffs are still specific, compound, ormixed. In such cases it is almost impossible toestimate the real level of protection because itmay change over time and with the relativeprice of imports. Even more important are thecyclical implications of such tariff structures:protection from specific duties rises as prices de-cline in the world markets; protection will behigher for lower-priced products from the de-veloping countries.9
The proportion of agricultural tariff linesthat carry specific, compound, and mixed dutiesis much higher in rich countries than in de-veloping countries (figure 3.5).10 This means,among other things, that the transparency ofagricultural tariffs in developing countries ishigher than in industrial countries—and signifi-cantly higher than in manufacturing. Of the 24developing countries included in this sample, 11have no NAV rates, 5 have them in fewer than
1 percent of their tariff lines, and 4 in fewer than 5 percent of tariff lines. Only 4 countries,all middle income, have a higher proportion oftariff lines with NAV rates. Within the Quad,Japan has specific, compound, or mixed rates in15 percent of its tariff lines; Canada in 24 per-cent; the United States in 40 percent; and the Eu-ropean Union in 44 percent. The United Statesand European Union also have duties that varyaccording to the content of the products in 1percent and 4 percent, respectively, of their tar-iff lines. Thus the difference in the transparencyof tariff rates is consistent for most developingand industrial countries, and the biggest prob-lem with nontransparency lies with the indus-trial and a few middle-income countries.11
Within the Quad, tariff structures showsome differences. In the United States, almost allcategories of products have NAV rates between30 and 60 percent. In the European Union, cer-tain product groups—such as beverages, grains,milk and milk products, and sugar and sugarproducts—have more than 90 percent of tarifflines under NAV. In many developing countries,NAV rates are clustered within a few product
G L O B A L E C O N O M I C P R O S P E C T S 2 0 0 4
122
Figure 3.5 Rich countries use non–advalorem tariffs more often than dodeveloping countriesTariff lines containing specific, compound, or mixed duties,for agriculture and manufacturing by class of country(as percentage of all lines)
Quad Largemiddleincome
Othermiddleincome
Lowerincome
0
5
10
15
20
25
30
35
Agriculture
Manufacturing�
�
Source: WTO IDB.

groups. For example, in Malaysia NAV ratesapply to tobacco and alcohol products; in Mex-ico on chocolate and confectionary products;and in Korea on nuts, spices, and sugar.
Only four countries in the sample reportthe ad valorem equivalents of their NAV rates(table 3.12). For those four, the average equiv-alents are much higher than the average advalorem rates, suggesting that average dutiesfor countries with a large proportion of NAVduties are seriously underestimated.
The specific duties are being used primarilyas an instrument of disguised protection. First,
as shown in table 3.12, the ad valorem equiva-lents of specific duties, where known, are higherthan the ad valorem rates. Second, the propor-tion of specific duties increases with the degreeof processing (figure 3.6). They are found mostfrequently in lines covering final products—those classified under food processing.
Tariff escalation is particularly harmful to developmentTariff codes that apply higher tariffs to semi-processed and fully processed raw materialsare strikingly antidevelopment. By hindering
A G R I C U L T U R A L P O L I C I E S A N D T R A D E
123
Table 3.12 Specific tariffs are higher than ad valorem ratesAverage applied, out-of quota, ad valorem and ad valorem equivalents of non–ad valorem tariffs in areas for which equivalentsare reported (percent)
Average ad valorem Percentage of linesAverage ad valorem tariff equivalent of NAV rates containing NAV rates
Australia 1.2 5.0 0.9European Union 10.6 35.2 43.6Jordan 21.6 58.0 0.8United States 8.1 11.7 40.4
Source: WTO Integrated Database (IDB).
Figure 3.6 Throughout the world, tariff rates escalate with degree of processing
Note: a. Bangladesh (1999), Guatemala (1999), Indonesia (1999), Kenya (2001), Malawi (2000), Togo (2001), Uganda (2001), and Zimbabwe (2001).
b. Brazil (2001), China (2001), India (2000), Korea (2001), Mexico (2001), Russian Federation (2001), South Africa (2001),and Turkey (2001).
c. Bulgaria (2001), Costa Rica (2001), Hungary (2001), Jordan (2000), Malaysia (2001), Morocco (1997), Philippines (2001),and Romania (1999).
Source: WTO Integrated Database (IDB).
Tariff rates by area and stage of processing (percent)
Quad Canada Japan United States EuropeanUnion
Lowerincome
Large middleincome
Other middleincome
Raw
Intermediate Final
10
0
20
30
40
50
60
�
�
�
a b c

diversification into value-added and processedproducts, areas in which trade is expandingrapidly, such escalation directly penalizes in-vestors in developing countries who seek toadd value to production for export.
Tariff escalation has long been a feature ofagricultural and food-processing trade and con-tinues to be so (Golub and Finger 1979, Lind-land 1997, and Gallezot 2003). Protection es-calates with the level of processing in almost allcountries and across all products (table 3.13).Almost all groups of countries have highly es-calating tariffs (see figure 3.6), and the manu-facturing component of agriculture and foodprocessing has very high protection, explainingthe developing countries’ lack of penetration infood processing in industrial countries. Devel-oping economies also apply systematic tariff es-calation and high tariffs to the final stage of
processing, suggesting potentially large gains ifescalation were removed by developing econo-mies (Rae and Josling 2003).
Tariff escalation is common in both tradi-tional and new products. For traditional prod-ucts (except sugar), raw stages are accordedextremely low tariffs, whereas extremely hightariffs apply to the final stages. A similar pat-tern appears in fruits and vegetables, for whichthe developing countries have found expandingmarkets and trade barriers are generally lower.The averages reported in table 3.13 mask veryhigh peaks on individual products. In theUnited States, for example, the maximum tariffon final fruit products is 136 percent; on cocoaproducts it is 186 percent. In the EuropeanUnion the maximum rates on processed fruitsand vegetables are 98 percent and 146 percent;on cocoa products, 63 percent.
G L O B A L E C O N O M I C P R O S P E C T S 2 0 0 4
124
Table 3.13 Tariffs rise with level of processingTariff escalations in selected product groups (percent)
European Union United States Korea Japan
Tropical productsCoffee
Raw 7.3 0.1 5.2 6.0Final 12.1 10.1 8.0 18.8
CocoaRaw 0.5 0.0 5.0 0.0Intermediate 9.7 0.2 5.0 7.0Final 30.6 15.3 12.3 21.7
SugarRaw 18.9 2.0 a 25.5Intermediate 30.4 13.8 19.3 11.6b
Final 36.4 20.1 50.0 a
Expanding commoditiesFruits
Raw 9.2 4.6 49.6 8.7Intermediate 13.3 5.5 30.0 13.2Final 22.5 10.2 41.9 16.7
VegetablesRaw 9.9 4.4 135.4 5.0Intermediate 18.5 4.4 52.2 10.6Final 18.0 6.5 34.1 11.6
SeafoodRaw 11.5 0.6 15.6 4.9Intermediate 5.1 3.2 5.8 4.3Final 16.2 3.5 20.0 9.1
a. All lines are specific.b. 56 percent of lines are specific. Source: WTO Integrated Database.

Specific duties are applied more frequentlyto goods with higher degrees of processing. Forexample, in Canada and the European Union,the share of specific duties is 17 percent and 22percent for raw materials but 30 percent and 58percent, respectively, for final products. Amongdeveloping countries, the Russian Federationapplies specific duties in 12 percent of its tarifflines for raw materials versus 53 percent oflines covering final products (figure 3.7).
Tariff rate quotas allow a little in—and then add a tariff bite TRQs, designed to maintain some market ac-cess, have resulted in more complex tariffregimes. Although the number of tariff linesunder TRQs is small, TRQs cover some of the main commodities produced in the OECDcountries (figure 3.8). According to OECD data,almost 28 percent of domestic agriculturalproduction is protected by TRQs. Rates rangefrom a high of 68 percent in Hungary to 0percent in Australia and New Zealand. TheEuropean Union and United States have 38percent and 26 percent of their productionprotected by the TRQs.
Export subsidies directly depress global pricesInternational trade rules have prohibited ex-port subsidies on nonagricultural productssince 1955. Export subsidies are still allowedin agricultural products, although these subsi-dies were capped and subjected to reductioncommitments in the Uruguay Round. During1995–98, WTO members used 42 percent ofthe budgetary expenditure and 64 percent ofthe volume allowed for export subsidies, withthe European Union accounting for 90 percentof all OECD export subsidies.
Although their use has been reduced, ex-port subsidies continue to distort world mar-kets.12 The Uruguay Round placed limits onexport subsidies for individual commodities,but allowed some flexibility. Early in the im-plementation period, when world prices werehigh, usage was low and several countriescarried forward their unused export subsidycredits to be used at a later date. At the sametime, lower tariffs and the move toward di-rect production subsidies has and will con-tinue to reduce the need for official exportsubsidies.
A G R I C U L T U R A L P O L I C I E S A N D T R A D E
125
Source: WTO IDB.
Figure 3.7 The proportion of tariff lines containing non–ad valorem duties increases withdegree of processingTariff lines containing specific, compound, or mixed duties, by stage of processing (as percentage of all lines)
Norway European Union United States Canada Russia Turkey
Raw
Intermediate
Final
�
�
�
0
10
20
30
40
50
60
70
[zero]

Even if tariffs were eliminated altogether,current production subsidies for agriculturewould cause the domestic and export price ofmany commodities to remain lower than theircosts of production in industrial countries. Bylowering production costs, production sub-sidies favor industrial-country farmers overdeveloping-country producers, who do not re-ceive direct subsidies. Cotton subsidies in theEuropean Union and the United States are aclear case in point. Tariffs are zero, and do-mestic prices are the same as world or exportprices (Baffes 2003, Watkins 2003). Yet in theUnited States in 2001 production subsidies ef-fectively increased the prices farmers received(or reduced their costs of production) by 51percent, leading to increased production anddepressing the global price. At the same time,export prices for U.S. wheat, corn, and ricewere 58, 67, and 77 percent of their costs ofproduction (Watkins 2003).
Decoupling subsidies from productionwould reduce such distortions. To fully decou-ple subsidy payments, the definition of decou-pling must make it clear that the payments areindependent of production decisions (box 3.5).
The development tale of five commodities:sugar, wheat, cotton, peanuts, and riceThe development consequences of high protec-tion in industrial countries can be tracedthrough the story of key commodities. Althoughthe stories are different, they share commonplots: high protection, regressive subsidies, andlow prices that hurt poor producers all overthe world (Beghin and Aksoy 2003).
Sugar is one of the most policy-distortedcommodities in the world. The EuropeanUnion, Japan, and the United States accountfor the bulk of OECD-zone support to sugarproducers, which, at $6.4 billion, is approxi-mately equal to developing-country exports.But other countries (Mexico, Turkey, Poland,and all almost all temperate-zone sugar beetproducers) also provide significant support totheir producers. High border barriers in com-bination with the subsidies keep domesticprices in the United States and the EuropeanUnion about twice as high as the world mar-ket price.
High domestic sugar prices in the EuropeanUnion, Japan, and the United States have en-couraged high-cost, inefficient domestic pro-
G L O B A L E C O N O M I C P R O S P E C T S 2 0 0 4
126
Source: OECD, Agriculture Market Access Database (AMAD).
Figure 3.8 Tariff rate quotas protect a substantial portion of output in many industrial countriesCommodities covered by tariff rate quotas, expressed as a percentage of output
0
10
20
30
40
50
60
OECDaverage
EuropeanUnion
UnitedStates
Japan EasternEurope
Australia,New Zealand
[zero]
Otherindustrial
Otherdeveloping

duction of sugar and sugar substitutes. At thesame time, they have reduced overall consump-tion and gradually transformed these countriesfrom net buyers of about half of the world’s ex-ports during the 1970s into net sellers in inter-national markets in the 1990s. Meanwhile, theproduction and consumption of sugar substi-tutes (such as high-fructose corn syrups) in-
creased to displace 10 million tons of sugarconsumption—equivalent to one-third of worldexports—since 1970 (Mitchell 2003). Conse-quently, the world prices of sugar today arebelow the costs of production of some of themost efficient producers. Many producers man-age to keep exporting, either because they enjoylimited preferential access at high prices in
A G R I C U L T U R A L P O L I C I E S A N D T R A D E
127
Decoupling subsidies from production is designedto support producers not on the basis of current
output, input use, or prices, but on historical mea-sures, thereby limiting distortion to production andtrade. Debated since 1945, decoupling became a seri-ous option with the passage of the U.S. Food Secu-rity Act of 1985, which reduced set-asides of farmland, public stockholding, and yield payments. TheEuropean Union restructured its Common Agricul-tural Policy in 1992, replacing some price supportswith direct payments. Mexico reformed its price-support policies along similar lines with the intro-duction of the Programa de Apoyos Directos alCampo (PROCAMPO) in 1994. The United Statesthen went a step further in the 1996 Farm Bill, re-placing “deficiency payments” with decoupled sup-port based on historical data. Turkey introduced adirect income-support program in 2001, aided inpart by a World Bank adjustment lending operation.
Following a sharp decline in commodity pricesin the late 1990s, the United States reintroduceddeficiency payments in 1999—initially as emergencyassistance and subsequently as countercyclical pay-ments legitimized in the 2002 Farm Bill. Respondingto the U.S. reversal, Mexico reintroduced price sup-ports in 2002 by setting target prices similar to thosein the United States.
The move to decoupled support is a step in theright direction. However, if governments wish tohelp farmers adjust to free markets—the avowedpurpose of decoupling—a simple and minimally dis-torting way to do that would be to make a one-timeunconditional payment to everyone engaged in farm-ing or deemed in need of compensation. Short ofthat, decoupling mechanisms should exhibit the fol-lowing characteristics:
Box 3.5 Decoupling agricultural support fromproduction decisions
No constraints on input use. Support to specificsectors should be in the form of taxpayer-fundedpayments and should not require production. Neitherland, labor, nor any other input should be requiredto be in “agricultural use.”
Government credibility. Eligibility rules shouldbe clearly defined and not allowed to change. Thetime period on which payments are based should notchange. Payments should not be increased. New sec-tors should not be added to the program. Updatingbaselines and adding crops results in a governmentcredibility problem, making the decoupling policy in-consistent over time. As market conditions change,governments have discretion to change eligibilitycriteria and payment levels, leaving them unable tomake and hold to a binding commitment. As farmerschange their production decisions and apply pressurefor changes in supposedly decoupled support pro-grams, decoupling is in effect preempted.
Other programs. Every decoupling program in-stituted to date has left other support programs inplace. Coupled programs tend to interact with the de-coupled program, adding incentives to overproduce.
Time limit. Payments must not extend beyond amaximum number of years. The European Unionand Turkey have no limit; the United States had one(at least implicitly) but violated it; Mexico’s remainsin effect. A time limit ensures that payments are tran-sitory and for adjustment purposes only.
Reform within WTO. The level of payments inaggregate and per farm, and the terms describedabove, should be bound in the WTO so that gov-ernments can make credible commitments withoutbacksliding.
Source: Baffes and de Gorter (2003).
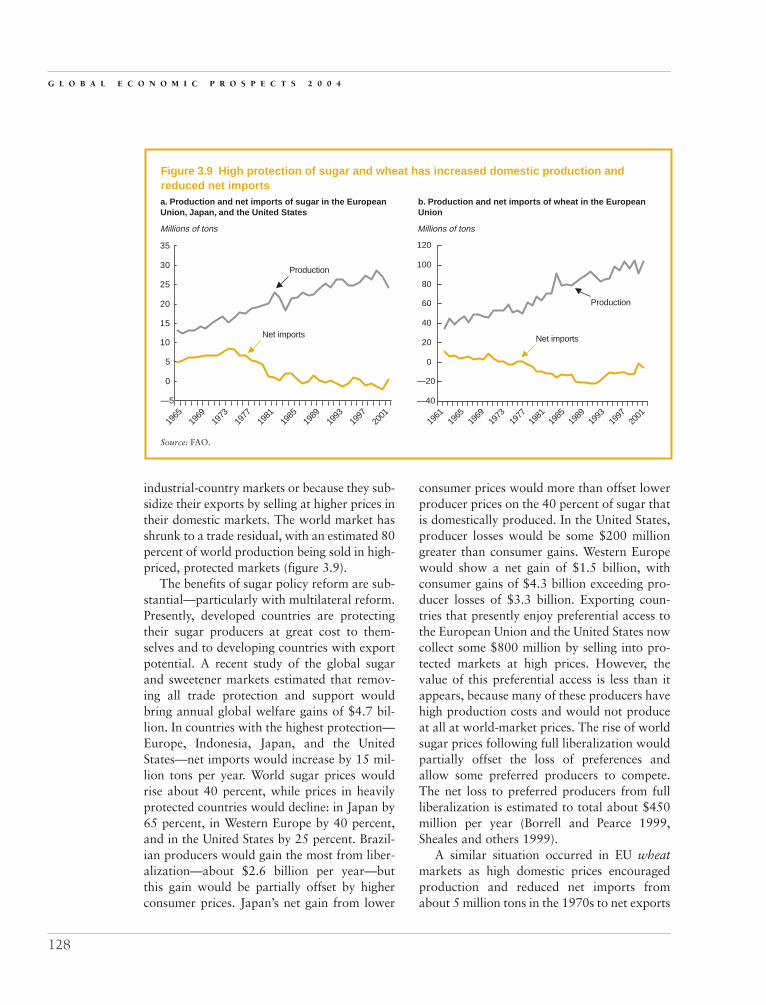
industrial-country markets or because they sub-sidize their exports by selling at higher prices intheir domestic markets. The world market hasshrunk to a trade residual, with an estimated 80percent of world production being sold in high-priced, protected markets (figure 3.9).
The benefits of sugar policy reform are sub-stantial—particularly with multilateral reform.Presently, developed countries are protectingtheir sugar producers at great cost to them-selves and to developing countries with exportpotential. A recent study of the global sugarand sweetener markets estimated that remov-ing all trade protection and support wouldbring annual global welfare gains of $4.7 bil-lion. In countries with the highest protection—Europe, Indonesia, Japan, and the UnitedStates—net imports would increase by 15 mil-lion tons per year. World sugar prices wouldrise about 40 percent, while prices in heavilyprotected countries would decline: in Japan by65 percent, in Western Europe by 40 percent,and in the United States by 25 percent. Brazil-ian producers would gain the most from liber-alization—about $2.6 billion per year—butthis gain would be partially offset by higherconsumer prices. Japan’s net gain from lower
consumer prices would more than offset lowerproducer prices on the 40 percent of sugar thatis domestically produced. In the United States,producer losses would be some $200 milliongreater than consumer gains. Western Europewould show a net gain of $1.5 billion, withconsumer gains of $4.3 billion exceeding pro-ducer losses of $3.3 billion. Exporting coun-tries that presently enjoy preferential access tothe European Union and the United States nowcollect some $800 million by selling into pro-tected markets at high prices. However, thevalue of this preferential access is less than itappears, because many of these producers havehigh production costs and would not produceat all at world-market prices. The rise of worldsugar prices following full liberalization wouldpartially offset the loss of preferences andallow some preferred producers to compete.The net loss to preferred producers from fullliberalization is estimated to total about $450million per year (Borrell and Pearce 1999,Sheales and others 1999).
A similar situation occurred in EU wheatmarkets as high domestic prices encouragedproduction and reduced net imports fromabout 5 million tons in the 1970s to net exports
G L O B A L E C O N O M I C P R O S P E C T S 2 0 0 4
128
Figure 3.9 High protection of sugar and wheat has increased domestic production andreduced net importsa. Production and net imports of sugar in the EuropeanUnion, Japan, and the United States
Millions of tons Millions of tons
b. Production and net imports of wheat in the EuropeanUnion
Source: FAO.
—5
Production
Net imports
1965
1969
1973
1977
1981
1985
1989
1993
1997
2001
0
5
10
15
20
25
30
35
�
�
Production
Net imports
�
�
—40
—20
0
20
40
60
80
100
120
1961
1965
1969
1973
1977
1981
1985
1989
1993
1997
2001

of 20 million tons in the early 1990s, beforepolicy reforms reduced net exports. Subsidizedwheat exports from the European Union con-tinue to depress world prices. Wheat is one ofthe most protected products in the EuropeanUnion; total production support averaged al-most $10 billion annually during 1999–2001,corresponding to a protection rate of almost 50 percent.
World trade in cotton shows severe policydistortions, but, unlike sugar, the distortionscome through producer support rather thanfrom border measures such as tariffs and quo-tas (Baffes 2003). The United States providesthe greatest support to its producers—$3 bil-lion annually. The European Union providesabout $0.6 billion each year to its producers.Producer prices in the United States were 91percent higher than the world-market price in 2001–02. In Greece they were 144 percenthigher; in Spain, 184 percent higher. High-producer support encouraged U.S. cotton pro-duction to grow about 25 percent faster thanworld production after 1970, and EU produc-tion accelerated once Greece and Spain joinedthe (then) European Community in 1981 and1986. While the United States and EuropeanUnion were maintaining high support, sev-eral cotton-producing developing countries(especially those in Sub-Saharan Africa) un-dertook substantial policy reform to increasethe efficiency of their cotton sectors. Priceand export prospects of developing-countryexporters—especially in Sub-Saharan Africa—would be greatly improved if support in devel-oped countries were reduced or eliminated.
Removal of protection and support wouldcause a drop in production in the United Statesand European Union and thus boost prices.Simulations show that with full liberalizationin the cotton sector—removal of trade barriersand production support, along with liberaliza-tion in all other commodity sectors—cottonprices would increase over the next 10 years byan average of 13 percent over the price thatwould have prevailed in the absence of re-forms. World cotton trade would increase by 6percent. Africa’s cotton exports would increase
by 13 percent. Uzbekistan would increase itsexports by 5.8 percent and Australia by 2.7percent, while exports from the United Stateswould decline by 3.5 percent. Cotton produc-tion in the United States would decline by 6.7percent; in the European Union, by 70.5 per-cent. In effect, cotton production in the Euro-pean Union would fall back to levels that ex-isted prior to the Common Agricultural Policy.
Groundnuts (peanuts) are one of theworld’s main oilseed crops. Widely cultivatedin developed and developing countries, theyprovide livelihood and cash income to manypoor farmers in the developing world, espe-cially in Sub-Saharan Africa and Asia. In Sene-gal, for example, an estimated one millionpeople (one-tenth of the population) are in-volved in groundnut production and process-ing. Groundnuts account for about 2 percentof GDP and 9 percent of exports. China is theworld’s largest exporter of groundnuts, fol-lowed by the United States and Argentina.Sub-Saharan Africa (where the major produc-ers are The Gambia, Malawi, Nigeria, Sene-gal, South Africa, and Sudan) has lost groundin world edible groundnut markets, account-ing for only 5 percent of the world market in2001, compared to 17 percent in 1976. In theoil segment of the market, Senegal is the world’slargest exporter. Governments in Sub-SaharanAfrica taxed production until the early 1990s.These taxes, borne by domestic groundnutusers and taxpayers, had an important domes-tic cost (Diop and others 2003).
Historically, world groundnut markets havebeen distorted by heavy government interven-tion designed to stimulate production throughsubsidies and price supports or to protect pro-ducers by controlling imports. China and Indiahave price-control schemes and impose veryhigh tariffs on imports. Since the mid-1990s,all major exporters have gradually liberalizedtheir groundnut sectors, in part to fulfill theircommitments under WTO agreements. Resultsare mixed, however, and trade in groundnutsremains heavily distorted. Both China andIndia have removed some import restrictionsand allowed wider private-sector participation
A G R I C U L T U R A L P O L I C I E S A N D T R A D E
129

in importing groundnuts. But tariffs ongroundnut products remain very high in bothcountries; the removal of trade distortions byChina and India is essential to successful re-form of groundnut markets.
The U.S. groundnut policy, highly distortedby large subsidies and prohibitive tariffs be-tween 1930 and 2001, was recently reformed,but with high and redundant tariffs still inplace. The 2002 Farm Bill eliminated someunsustainable features of previous legislation(high support prices and production quotas)but introduced new distortions that have thepotential to depress world market prices andsubsidize producers (for example, throughcountercyclical payments and a price floormechanism that becomes effective when worldprices are low). Prohibitive tariffs of almost150 percent remain.
Full trade liberalization would raise marketprices by about 19 percent for groundnuts, 18percent for meal, and 17 percent for oil. Be-cause the current U.S. peanut program ismostly a domestic affair, liberalization of theU.S. market would not have a far-reaching ef-fect on world prices or on exports of the poor-est developing countries. As a bloc, the OECDcountries would experience welfare losses aftertrade liberalization—moderate gains in theUnited States offset by losses in Canada, theEuropean Union, and Mexico, which wouldlose from trade liberalization because, withfew policy distortions in these markets, theywould be penalized by higher world pricesafter liberalization.
Although the net world welfare gains ofliberalizing groundnut markets are moderate,they are still significant for small agrarianeconomies such as Malawi and other WestAfrican countries. In China and India, gains to consumers would be partially offset bylosses to producers under full trade liberaliza-tion. Specifically, buyers in India and southernChina, where groundnuts and groundnut oilare heavily used in food, would reap signifi-cant gains from liberalization.
Liberalization of the value-added markets—oil and meal—would result in even larger wel-fare gains in African countries. The African
countries modeled in our analysis (The Gam-bia, Malawi, Nigeria, Senegal, and SouthAfrica) would experience aggregate net welfaregains of $72 million, with Senegal and Nigeriagaining most. The increase in world pricesafter trade liberalization would lead to a totalgain for African groundnut producers of some$124 million in profits. These figures are siz-able for small African economies. The rest ofthe world would experience a net welfare lossbecause consumers would face higher pricesfor groundnut oil.
Rice is the most important food grain in theworld. Production and consumption are con-centrated in China, India, and Indonesia. Con-sumers in low-income, food-deficit countriesget 28 percent of their calorie intake from rice.The rice market is a mature market, with sta-tic demand in the North and demand in devel-oping economies growing with demographicsrather than income. Prospects for growth intrade therefore rely on policy reforms.
Tariff and related border protection is veryhigh, averaging about 40 percent globally andrising to 200 percent in some markets. TotalOECD-zone support is more than $26 billion,and in Japan support is a staggering 700 per-cent of production cost (at world prices). Tar-iff escalation is prevalent (from paddy tomilled rice) in many countries, including theEuropean Union, where the tariff on milledrice is prohibitive, except for small preferentialimport quotas granted to a few countries. Forexample, the tariff on milled rice imports intothe European Union is 80 percent, comparedto 46 percent for brown rice. In Mexico, paddyrice enters with a 10 percent tariff, whereasbrown and milled rice enter with a 20 percenttariff. This pattern of protection depressesworld prices for high-quality, milled long-grainrice and discriminates against the milling sec-tors of exporting nations such as Thailand, theUnited States, and Vietnam (Wailes 2003).
Global reforms—elimination of all borderbarriers and support—would lead to averageprice increases of about 33 percent, rising to90 percent for medium- and short-grain rice.Producers in Cambodia, China, and Vietnamwould be the main beneficiaries, along with
G L O B A L E C O N O M I C P R O S P E C T S 2 0 0 4
130

consumers in most of high-income Asia. Sincemost production is by small farmers in thesecountries, the gains would be very pro-poor aswell. Following trade liberalization, net riceimporters could be negatively affected by theresulting world price increase wherever theconsumer prices rise following reform; that is,wherever the current ad valorem tariffs arelower than the potential world price increase.Estimates show that in Indonesia, Nigeria,and the Philippines, three large rice importers,consumer prices would fall after the reforms.
The tale of these five commodities has animportant moral for those who would pro-mote development. Cutting back on subsidiesand other protection that primarily benefit rel-atively wealthy farmers in rich-country mar-kets (and in some cases middle-income coun-try markets) can open up opportunities forpoor farmers in Africa, Asia, and Latin Amer-ica. The effects on incomes in poor countrieswould be strong and immediate. In many casesthe gains would be a substantial order of mag-nitude greater than development assistance tothese same countries.
Proposals for reforms in theDoha Round
The potential gains for developingcountries are largeOne way to evaluate reform proposals is tocompare their likely results with the potentialgains from full removal of all barriers, whichwould yield global welfare gains of $400–900billion, more than half of which would go todeveloping countries. If all trade barriers weredismantled, agriculture and food would ac-count for 70 percent of these gains. A majorshare—60 percent—would derive from reformsin developing countries. The largest gains are tobe had from tariff reforms in agriculture under-taken in a context of a global reform program.
Can agriculture adjust to new prices? The ex-perience of New Zealand, which implementedthe most far-reaching reforms of any industrialcountry, suggest that the answer is yes. NewZealand has almost no tariffs or subsidies in
agriculture. Its reforms have led to higher pro-ductivity and growth rates, no changes in ruralpopulation, and a much more dynamic and en-vironmentally sustainable agricultural sector(box 3.6). Particularly noteworthy is the factthat New Zealand farmers are able to competeeffectively on world markets, expanding theirshare of world trade in dairy products from 6.7percent in 1985 to 9.5 percent in 2001.
Harbinson splits the differenceDespite the large potential gains from liberal-ization, many of the proposals for the DohaRound are modest. Proposals range from theJapanese suggestion to impose an “averagecut,” which can be predicted to have little ef-fect, to the more ambitious proposal of theCairns Group.
The Harbinson proposal, named for StuartHarbinson, the chairman of the WTO negoti-ating group on agriculture, takes the middleground (DRIFE 2003).13 For industrial coun-tries, it proposes average tariff cuts of 60 per-cent on bound tariffs above 90 percent, a 50percent cut on bound tariffs between 15 and90 percent, and a 40 percent cut on boundtariffs below 15 percent.14 For the developingcountries and for products not consideredstrategic, it proposes average tariff cuts frombound rates of 40 percent for tariffs above 120percent, a cut of 35 percent for tariffs between60 percent and 120 percent, a cut of 30 per-cent for tariffs between 20 percent and 60 per-cent, and an average reduction of 25 percent in tariffs below 20 percent. These cuts wouldbe implemented by industrial countries inequal installments over five years and over tenyears for developing ones (WTO 2003). TheHarbinson cuts look significant—some groupshave called them radical—but their impact, de-pending on how they are interpreted, wouldnot be as significant as first appears.
For the industrial world, the results woulddepend on whether countries achieve the aver-age cuts by reducing lower tariffs by greaterpercentages (which would have relatively littleeffect) or cut all tariffs at the average rate. The“average cuts” called for under the UruguayRound were interpreted loosely, with many
A G R I C U L T U R A L P O L I C I E S A N D T R A D E
131

countries reducing already-low tariffs by highpercentages to avoid cutting higher tariffs sig-nificantly (see chapter 2, box 2.2).
For the developing countries, the key issueis reductions from the bound, not the applied,rates. Most developing countries have boundtheir tariffs at relatively high rates, but re-
duced applied rates to much lower levels.15 Ifcuts were applied to the bound rates, suchcountries would get credit for past unilateralreforms, but the reductions would not lead tosignificant tariff reductions.
The Harbinson proposals would imply sub-stantial tariff cuts in the United States and Eu-
G L O B A L E C O N O M I C P R O S P E C T S 2 0 0 4
132
There is a strong belief among policymakers inOECD countries that trade reform in agriculture
would destroy their rural communities and the agri-cultural sector. Yet, as the experience of one OECDcountry shows, protection and subsidies are not a nec-essary condition for the continued growth of the farmsector. Indeed, the removal of protection can be ac-companied by faster agricultural growth and increasesin productivity, achieved without a significant declinein the farming population or its standard of living.
Today, New Zealand has the lowest level offarm support among OECD countries—its producersupport, estimated to be around 1 percent of thevalue of agricultural production, is primarily dedi-cated to research funding. This was not always thecase. Producer support reached 33 percent of outputin 1983, when almost 40 percent of the income of an average sheep or cattle farmer came from govern-ment subsidies. Yet, these policies were clearly unsus-tainable, as the loss of preferential access to theBritish market and an escalating inflation spiral ledthe government to abandon most payments to agri-cultural producers.
Government deregulation was quick and sub-stantial. Nearly all subsidies were removed in 1984.The sectors involved included wheat, egg, milk, pota-toes, honey, raspberries, hops, tobacco, apples, poul-try, pork, and other meats. Altogether, almost 30 dif-ferent production subsidies and export incentiveswere abolished (Bell and Elliott 1993). The govern-ment made only limited efforts to soften the impacton farmers; those who decided to exit the agricul-tural sector received a one-time “exit grant” of ap-proximately two-thirds of annual income.
At the time, estimates pointed to 8,000 farms(10 percent of total) going out of business, prompt-ing widespread opposition to the government’s plan.However, only 800 farms exited the market, andthose that remained became more dynamic. Since
Box 3.6 Fewer subsidies, stronger agricultural sector1986–87, output of the agricultural sector has grown by more than 40 percent in constant terms.The share of farming in GDP rose from 14.2 percentin 1986–87 to 16.6 percent in 1999–2000, andgrowth in the farming sector has outpaced economicgrowth of New Zealand as a whole. The reform alsoprompted greater competition and lower input costsamong suppliers, and brought environmental benefitsthrough reduced waste. Although land values fellduring late 1980s and early 1990s, they recoveredduring the later part of the decade. The share ofrural population has remained constant since theabolition of subsidies.
Some of the most impressive effects of subsidyremoval have been the changes in agricultural pro-ductivity. Since 1986, the annual average rate ofproductivity growth in agriculture has reached 5.9percent, compared with 1 percent prior to subsidyabolition. The fact that total lamb production has in-creased while the number of sheep has declined by 29percent attests to the increased efficiency of the sec-tor. However, some studies, such as Morrison Paul,Johnston, and Frengley (2000), have questioned thepositive effects of the reforms on productivity. Thelatter, using an unbalanced panel of 32 farms be-tween 1969 and 1991, found that agricultural reformcaused changes in the composition of output—a shiftout of wool and lamb and into beef and deer—butdid not affect technical efficiency. On the other hand,work using aggregate data, such as Kalaitzandonakesand Bredahl (1994), has confirmed improvements intechnical efficiency following the reforms.
Overall, the removal of support did not have agrave effect on New Zealand’s farmers. Instead, thepolicy of liberalization created a more vibrant, diversi-fied, and sustainable rural economy in New Zealand.
Source: World Bank staff.

ropean Union at the end of the program underan optimistic scenario in which all tariffs werecut by the average rate from the applied rates(table 3.14).16
Under this optimistic scenario, the averageeffective tariffs in the European Union and theUnited States would be halved by the end of thereform process. EU tariffs would come down toabout 10 percent from 20 percent, while U.S.tariffs would fall below 5 percent from 9 per-cent. Even so, the average agricultural tariffs inboth areas would remain significantly higherthan manufacturing tariffs—which stand at 4.2and 4.6 percent respectively. Tariff peaks wouldremain above 140 percent in the United Statesand above 200 percent in the European Union.
For the developing countries, the optimisticscenario reduced the bound rates by the aver-age cut. Four country examples are given intable 3.15 above. Cuts from bound rates donot significantly lower protection in most de-veloping countries. In India and Costa Rica, at
the end of 10 years, the Harbinson reformwould leave bound tariffs significantly aboveapplied rates. For Jordan and Korea, boundrates after 10 years would be marginally belowthe current applied rates. Because these resultswould hold for most developing countries, ex-isting levels of protection in the developingworld would not be significantly reduced underthe Harbinson proposals.
Cushioning adjustment: The impact of reforms on net food importersSerious reforms in global trade policies wouldlead to price increases for many products now protected. These price changes could leadto balance-of-payments problems for low-income developing countries that are net agri-cultural importers. Currently, the developingcountries as a group—low- and middle-income alike—enjoy a trade surplus in agri-culture. But many countries are net importers,and they could be negatively affected. Of 58
A G R I C U L T U R A L P O L I C I E S A N D T R A D E
133
Table 3.14 The Harbinson proposals could greatly reduce applied tariffs in the EuropeanUnion and the United States Tariffs in the European Union and United States before and after average reduction from applied tariffs (percent)
United States European Union
Before Harbinson After Harbinson Before Harbinson After Harbinson
Average Peaks Average Peaks Average Peaks Average Peaks
Raw 5.5 350.0 2.7 140.0 13.2 131.8 6.9 52.7Intermediate 7.1 159.3 3.8 63.8 16.6 284.8 8.3 113.9Final 11.7 180.8 6.2 72.3 26.8 506.3 13.1 202.5Overall 8.8 350.0 4.6 140.0 19.7 506.3 9.9 202.5
Note: The analysis excludes cigarettes and alcoholic drinks. Source: WTO Integrated Database.
Table 3.15 The Harbinson proposals would not significantly reduce protection in thedeveloping world—if reductions were taken from bound ratesTariffs in selected areas before and after average reductions from bound rates (percent)
Costa Rica India Jordan Korea
Bound rates Average Peak Average Peak Average Peak Average Peak
Before Harbinson 49.0 245.0 115.3 300.0 21.5 180.0 50.8 917.0After Harbinson 33.8 147.0 72.3 180.0 14.9 108.0 33.2 550.2Current applied rates 13.1 154.0 36.7 115.0 18.5 120.0 42.7 917.0
Note: The analysis excludes cigarettes and alcoholic drinks. Source: WTO Integrated Database.

countries classified as low income in 2000–01,29 were net importers; of 89 classified asmiddle-income, 51 were net importers.
Among the middle-income countries, thetotal net imports of the net importers were al-most $56 billion; 46 percent of the importswent to high-income, industrialized develop-ing countries such as Hong Kong (China),Republic of Korea, Singapore, and Taiwan
(China). Another 35 percent went to the oilexporting countries—Algeria, Saudi Arabia,and the United Arab Emirates. Excludingthese and small island states, Egypt and Omanaccount for 57 percent of remaining imports.Thus the impact of agricultural price increaseson the middle-income countries would belimited, particularly as a proportion of theirtrade.
G L O B A L E C O N O M I C P R O S P E C T S 2 0 0 4
134
Given the high level of agricultural protection inmany industrial countries, the value of prefer-
ences should be very high and should lead to highrates of export expansion in the countries that re-ceive them. After Spain and Portugal joined theEuropean Union, and after Mexico joined NAFTA,exports rose dramatically, especially in highly pro-tected milk products (see figures below).
Milk and milk products are the most protectedof all commodities, and, at $42 billion, they have thehighest level of OECD support. However, this highlyprotected subsector responds similarly to other pro-
Box 3.7 The potential impact of real preferencestected sectors such as grains and meat products. Join-ing NAFTA or the European Union implies more thansimple preferential access—for example, membershipin a trade bloc offers a more secure and predictableenvironment for investment than is usually providedby unilateral preferences—but the experiences ofMexico, Portugal, and Spain illustrate the potentialresponse of many developing countries if they weregiven free access with few other restrictions.
Source: COMTRADE.
Exports of milk products shot up after Mexico, Spain, and Portugal joined regional trade blocs
1994 Mexico joins NAFTA
�
Exports of milk products from Mexico, 1961–2001(millions of dollars)
0
1961 1965 1969 1973 1977 1981 1985 1989 1993 1997 2001
10
20
30
40
50
1986 Portugal joins EU
�
1961
1986 Spain joins EU
�
Exports of milk products from Spain, 1961–2001(millions of dollars)
1965 1969 1973 1977 1981 1985 1989 1993 1997 2001
0
50
100
150
200
250
300
350
400
Exports of milk products from Portugal, 1961–2001(millions of dollars)
1961 1965 1969 1973 1977 1981 1985 1989 1993 1997 2001
0102030405060708090
100110120

Among low-income countries, oil-producingAngola, Nigeria, and Yemen account for almost32 percent of the total deficit. Twelve countriesin conflict account for another 21 percent. Only14 low-income countries are real net food im-porters; their total net imports were only $2.8billion in 2000–01. In this group, three coun-tries account for 80 percent of the net imports:Bangladesh, Pakistan, and the Democratic Re-public of Korea. The rest of the low-incomecountries have a deficit of just $565 million, asmall percentage of their trade. These countrieswould gain from price increases, because theirexports are also predominantly agricultural, as well as from other aspects of a multilateraltrade negotiation. Nonetheless, the internationalcommunity should be prepared to provide assis-tance to countries to help them adjust to andtake advantage of new trade opportunities.
Can tariff preferences substitute for reform?Some have argued that the poor are not harmedby the protection practices of rich countries be-cause the Quad countries are generous in grant-ing trade preferences. To be sure, the levels ofprotection in industrial countries are moder-ated by tariff and quota preferences. However,as we saw earlier in this chapter, most of thepoor live not in the least developed countries,which get deep preferences, but in Asia, whichgets fewer preferences, if any. Thus deep prefer-ences do not reach the majority of the world’spoor living on less than $1 day. Aside from theLDCs, many of the countries that enjoy prefer-ences are not among the world’s poorest. Forexample, a significant portion of the EU’s low-tariff sugar quota benefits Mauritius, the rich-est country in Sub-Saharan Africa. Half of thecountries that benefit from U.S. sugar quotasare net sugar importers. Rules governing pref-erences are typically complex and cumbersome,preventing many producers from taking advan-tage of them (see chapter 6).
The United States is the only country thatcollects data on the effect and degree of use ofpreferences. Agricultural exports from all de-veloping countries total about $25 billion; ofthat total, approximately $15 billion, repre-
senting mainly tropical products not producedin the United States, enters the country duty-free—here preferences have no effect. Of prod-ucts in the GSP, most agricultural productswith nonzero tariffs are not eligible for prefer-ences—only 34 percent of imports covered bythe GSP were eligible for preferences; only 26percent received them.
Preferences are more generous in other,mainly regional, programs. U.S. preferencesfor Mexico and the LDCs are much more ex-tensive than for the rest of the world, and theeligibility ratio is almost 100 percent. How-ever, this measure reveals little about the actualcoverage of these schemes because it recordsonly products actually exported and not thosethat would have been exported if granted pref-erences or lower tariffs. For example, the totalexports of agricultural products with nonzerorates from the 64 GSP countries come to nomore than the exports of Mexico, which re-ceives almost full preferences (table 3.16).
Tighter rules of origin also complicate pref-erences. For example, seafood imports underEurope’s Everything But Arms preferencescheme for least developed countries havestricter rules of origin than do its other prefer-ence programs, the GSP and Cotonou agree-ments. Similarly, the NAFTA agreement, theworld’s most extensive preferential traderegime, is associated with very detailed andproduct-specific rules of origin (box 3.8).
Although preferences may help some verypoor countries, they are no substitute formultilateral reform that will benefit all theworld’s poor.
Summary: A pro-poor agenda for policy change Realizing the development promise of the DohaAgenda will require the international commu-nity to tackle some of the most difficult prob-lems of agricultural trade. Agriculture remainsone of the most distorted areas of internationaltrade, and those distortions impede develop-ment. A pro-poor program of trade reformwould contain several important elements:
A reduction in the use of specific duties and greater transparency is necessary to bring
A G R I C U L T U R A L P O L I C I E S A N D T R A D E
135

G L O B A L E C O N O M I C P R O S P E C T S 2 0 0 4
136
Rules of origin are a key element in determiningthe extent to which countries are able to use the
preferences available to them. EU rules of origin areproduct-specific and sometimes complex. For someproducts a change of tariff heading is required.Others must meet a value-added requirement. Stillothers are subject to a specific manufacturing-processrequirement. In some cases these requirements arecombined. For certain industrial products, alternativemethods of conferring origin are specified—for ex-ample, change of tariff heading or satisfaction of avalue-added requirement. Although clearly moreflexible, such an approach is not available for anyagricultural products. For many products the EUrules require a change of chapter, which is even morerestrictive than a change of heading. In certain casesthe EU rules provide for a negative application of thechange of tariff classification by proscribing the useof certain imported inputs. For example, the rule oforigin for bread, pastry, cakes, biscuits, and so onrequires a change of tariff heading except from anyheading in chapter 11 (products of the milling indus-try). Hence, bakery products cannot use importedflour and still qualify for the preferential rates.
Although the European Union has sought toharmonize the processing requirements for eachproduct, some of the general rules vary substantially,
Box 3.8 Rules of origin in preferential schemes arecomplicated—and often contradictory
particularly with regard to the nature and extent of “cumulation” and the “tolerance rule.” In thisregard the rules of origin for the Everything But Arms scheme differ from those of the CotonouAgreement—and also from those of other free-tradeagreements. The Cotonou Agreement, for example,provides for full cumulation—inputs from otherCotonou countries can be freely used. The GSPallows more limited diagonal cumulation, which may occur only within four regional groupings:ASEAN, CACM, the Andean Community, andSAARC. The EU agreement with South Africa con-tains a general tolerance rule of 15 percent, whereasthose with Mexico and Chile allow only 10 percent.
The rules of origin for the U.S. GSP scheme de-fine a 35 percent value-added criterion that is com-mon across all included products. In later bilateraltrade agreements, such as the NAFTA and the re-cently signed free-trade agreement with Singapore,the United States has stipulated extensive and oftenvery complicated product-by-product rules of originwhich run to several hundred pages. In any event,the common rule applied in the GSP is that sensitiveproducts are excluded from preferences.
Source: World Bank staff.
Table 3.16 U.S. trade preferences—a plethora of programsU.S. trade preferences for agricultural products, 2002 (millions of dollars)
Share of (a) Share of (b) Share of (b)for which duty for which no eligible for Eligible but Preference
Country group (number is greater than preference is preference not requesting receivedof countries in group) Total value (a) zero (b) available (c) (d=b–c) preference (e) (f=d–e)
ATPA (Andean) (4) 2,242.6 870.2 106.7 763.4 256.4 507.0U.S. LDCs (40) 369.0 65.6 0.0 65.6 12.2 53.3Non-LDC AGOA (15) 600.5 168.9 0.4 168.5 20.0 148.5Non-LDC CBI (19) 3,005.3 1,391.3 0.7 1,390.6 10.8 1379.8Jordan 1.2 1.0 0.1 0.9 0.1 0.8Mexico 6,319.6 3,866.9 0.0 3,866.9 13.8 3,853.1Other GSP countries (64) 9,769.6 3,662.0 2,408.5 1,253.6 300.6 952.9Non-GSP developing 2,906.5 939.9 855.8 84.1 0.7 83.5Total developing 25,214.3 10,965.7 3,372.1 7,593.5 614.6 6,979.0
Source: U.S. International Trade Commission.

agricultural protection regimes closer to thetariff structures used for manufacturing. Allspecific, mixed, composite, and seasonal tar-iffs should be replaced with transparent advalorem duties. Not only will this make theprotection clear, but also it will eliminate dis-crimination against lower-priced exports fromdeveloping countries. Since tariff peaks arevery high—and will stay high under the exist-ing reform proposal—the peaks must be capped,
with some arrangement for reducing tariffescalation on agricultural products.
The combination of tariff walls and domes-tic subsidies that annually channel some $248billion to producers in the industrial countriesmust be dismantled, as must the high levels of protection in developing countries. Exportsubsidies must be further reduced and ideallyeliminated. Discipline should also extend tofood aid (see box 3.9). Finally, border barriers
A G R I C U L T U R A L P O L I C I E S A N D T R A D E
137
Food aid recipients constitute a special group of low-income, food-importing countries with urgent needs
arising from natural disasters, disease, and civil con-flict. In June 2003, FAO identified 37 countries requir-ing food assistance, most of them in Sub-SaharanAfrica, but others in Asia, the Middle East, Europe andCentral Asia, and Central America and the Carib-bean.17 Overall, food aid accounts for a relatively smallproportion of world trade, around 2 to 4 percent oftraded cereal volumes during the period 1995– 2000.18
Though needed and effective immediately afterdisasters, food aid raises development and trade con-cerns when extended for longer periods or driven by supply. From a commercial standpoint, food aidmay disguise export subsidies, or it may be used fordeveloping commercial export markets or promot-ing strategic objectives. Furthermore, it may alleviatepressure on governments to reform policies and pro-mote self-sufficiency.
When given in kind, food aid may be detrimentalto local producers by lowering prices and by alteringtraditional dietary preferences. When distributed out-side of normal indigenous commercial channels, as isusually the case, in-kind food aid also undermines thedevelopment of those channels and disrupts move-ment of food to the deficit areas from surplus regionsin the country and neighboring countries. These eventscan then increase the likelihood and severity of futurefamine situations.
The trade aspects of food aid are regulated bymany agreements and conventions. The UruguayRound Agreement on Agriculture (URAA, Section10.4) requires that food aid not be tied to commercialexports of agricultural products, that it accord withthe FAO Principles of Surplus Disposal and Consulta-tive Obligations, and that it be given under genuinelyconcessional terms. Nevertheless, the distinction be-
Box 3.9 Food aid principlestween legitimate food aid and commercial interests isdifficult to make. Thus, although the actual food aidbudgets of the five largest donors in 1998 were $2.9billion, Trueblood and Shapouri (2002) estimate theannual cost of an insurance scheme to provide foodsecurity for 67 needy countries would have cost lessthan $450 million per year from 1988 to 1999.19
Any WTO agreement should tighten the URAAprovisions to facilitate genuine food aid while pre-venting the abuse of aid to circumvent export subsidyrestrictions. Proposals include limiting food aid togrants only or to in-kind provision only in response to appeals from the United Nations or other appro-priate international bodies. Donations in cash orchanneled through international agencies would bemost desirable.20 Several principles, some beyond the purview of the WTO, should govern the provisionof food aid:
• Food aid should be in the form of full grants andprovided only for needs of well-defined vulnerablegroups or in response to an emergency as deter-mined by the United Nations.
• Cash aid should be provided unless in-kind food aidis a more appropriate response to the crisis (for ex-ample, because marketing channels are not func-tioning, in-kind aid can be better targeted).
• Food aid should never be used as surplus disposalby industrial countries.
• An impact assessment on marketing and local in-centives should be undertaken when food aid isprovided, and designs should be altered or mitiga-tion should be undertaken if significant negative im-pacts are observed.
Source: World Bank staff.
against processed foods, which constitute theexpanding part of agricultural and food trade,must be brought explicitly into the negotia-tions. Policies governing such products shouldbe aligned with those governing other manu-factured products. Reform of these policieswill yield immense global benefits, especiallyin developing countries.
Decoupling subsidies can be positive. Re-ducing subsidies without lowering border bar-riers will have only marginal effects. Similarly,decoupling subsidies from direct productionwill have no effect if border barriers are notslashed. However, if border protection is re-duced and subsidies decoupled from produc-tion requirements, the effects would be posi-tive. To succeed, the decoupling programsmust have characteristics that most past ef-forts have lacked (see box 3.5).
A global effort should be made on particu-lar commodities with large development con-sequences. Certain individual commodities canhave important effects on both developing andindustrial countries. Sugar, cotton, wheat, andgroundnuts all illustrate ways in which policyregimes—particularly in the OECD coun-tries—can adversely affect developing coun-tries when allowed to operate over long peri-ods of time.
A program of development assistance tomanage the adjustment to reform—particu-larly in food-importing countries—is a prior-ity. The effects of tariff and subsidy reform areunlikely to affect most countries adversely, butthe risk that a handful of countries may ex-perience a net terms-of-trade loss cannot betreated lightly. Adjustment is not likely to becostly. Careful analysis shows that most netfood importers are either high-income indus-trialized countries or major oil exporters.Many of the remaining net food importershave high tariff walls, so that reducing the tar-iffs could offset all or most of the increase inthe global price. Nonetheless, such countrieswould lose the revenues associated with thehigh tariffs and so would experience some dis-location. Development assistance can also help
countries take advantage of new trading op-portunities that arise with trade liberalization.
Notes1. Global poverty rates have been estimated on a
consistent basis at $1 a day. Unfortunately, the povertydata are not separated for rural and urban populations.The only source of data where the poverty rates can beseparated between rural and urban households is basedon the national poverty rates that vary across countries,and the country coverage of these surveys is limited.Data used here cover the surveys for 52 country house-hold surveys conducted between 1990 and 2001. Thesample has a higher share of rural population than theoverall average and both ratios are given in the tablesfor reference.
2. A comprehensive analysis of (a) protection indi-cators (tariff protection, nontariff barriers, and trade-distorting domestic policies such as market pricesupports and export subsidies), and (b) performanceindicators (export structure and output) requires con-sistent information that is available only for the OECDcountries and then only for some product groups.
Even for the OECD, the focus of data is more theprotection of selected commodities than the overalltrade regime. Thus, the measures covered by OECDdata systems and the tariff data from the WTO are notfully consistent. Definitions of the agricultural sectoralso vary. The OECD database focuses on key rawcommodities that have high protection; others excludefisheries, which have become the biggest food tradeitem. Many agricultural items are covered under foodprocessing and thus are classified under manufacturingrather than agriculture. Because processed foods con-stitute a growing share of consumption and trade, theirabsence from the data seriously understates trade inagricultural products. Finally, trade regimes in agricul-ture include complicated duty structures, extensive useof quotas and other restrictions, and complicated andchanging subsidy schemes, all of which make it im-possible to devise simple measures of protection anddistortions.
Information for the developing countries is morelimited and is only partially consistent. In the analysispresented in this chapter, partial data will be patchedtogether to give a picture of agricultural trade regimesand export performance in industrial and developingcountries.
For the purposes of this study, the agricultural sec-tor is defined broadly to include fisheries and processedfood products in all subgroups. For example, theseafood and seafood products subgroup includes raw,frozen, and processed seafood. This classification al-
G L O B A L E C O N O M I C P R O S P E C T S 2 0 0 4
138
lows us to include all stages of processing and to con-struct data series that are economically consistent. Seeannex I for the details of the coverage and definition ofsubgroups.
3. Of 20 categories of farms tracked by the U.S. De-partment of Agriculture, 12 lose money from farmingalone. Most of the money-losing categories consist ofsmaller farms. USDA, Agricultural Income and FinanceOutlook, September 26, 2002.
4. OECD (2002) The Incidence and Income Trans-fer Efficiency of Farm Support Measures.
5. From the trade data, it is very difficult to separateout food processing from raw agricultural trade. Thedefinition used here treats food processing within agri-culture and manufacturing excludes food processing.
6. Annual GDP growth in industrial countriesslowed from 3.0 percent in the 1980s to 2.3 percent inthe 1990s. In the developing countries, during the sameperiod, annual GDP growth accelerated from 3.1 per-cent to 3.7 percent. Unless there was a significantchange in income elasticities between the 1980s and1990s, the changes in GDP growth rates are not largeenough to cause the shift in import growth rates. Butfaster liberalization in developing countries can explainsome of the shift.
7. Annex 2 Table 4 shows the ad valorem and non-ad valorem rates separately, as well as the proportionof the tariff lines to which the average applies.
8. In the European Union and United States, veryhigh tariffs are all specific. The variance and peaks forCanada and Japan probably do not reflect the realpeaks because specific duties are excluded.
9. For example, in the European Union the dutieson wine are 13 Euros per hectoliter, which correspondsto about 12 cents per bottle. For wines that come fromdeveloping countries such as Bulgaria and Moldova,CIF prices per bottle are less than $1, which gives a tar-iff rate of about 12 percent, a high rate. For a $10 dol-lar bottle from California, the tariff rate would be just1.2 percent, a very low one.
10. Individual country details are given in annex 2. 11. A recent OECD publication argues that the ad-
ministration of ad valorem rates could cause difficul-ties for the customs administration; the developingcountries have been administering such rates with muchlower administrative capacity (OECD 2002a).
12. Additional distortion is produced by circum-vention, possibly through the subsidy elements in ex-port credits, export restrictions, and revenue-poolingarrangements in major products.
13. The Harbinson proposal presents the currentstatus of agricultural negotiations on establishing nu-meric targets, formulas, and other ‘modalities’ forcountries’ commitments to increase market access, de-crease export subsidies, and reduce distorting domesticsupport as mandated by the Uruguay Round Agree-
ment on Agriculture. The proposal also spells outpropositions on special and differential treatment andthe role of nontrade-concerns.
14. These are average cuts, so the actual cuts ineach line could be lower.
15. This is also true of many industrial countriesbut the difference between the bound, and appliedrates is much smaller.
16. The European Union and United States were se-lected because there are tariff equivalents for the spe-cific duties. The data for the European Union is for1999, the last year for which the tariff equivalents wereavailable.
17. http://www.fao.org/docrep/005/y9643e/y9643e04.htm
18. http://www.foodgrainsbank.ca/downloads/fjfa_foodaid.pdf
19. Trueblood, Michael, and Shahla Shapouri.2002. “Safety Nets: An Issue in Global AgriculturalTrade Liberalization.” Agricultural Outlook (Eco-nomic Research Service/U.S. Department of Agricul-ture). March. http://www.ers.usda.gov/publications/agoutlook/Mar2002/ao289f.pdf
20. WTO, Committee on Agriculture Special Ses-sion. 2002. “Negotiations on Agriculture: Overview.”TN/AG/6. Pages 58–61. December 18, 2002. http:// www.wto.org/english/tratop_e/agric_e/negoti_ modoverview_e.pdf
ReferencesAksoy, M. Ataman, Z. Ersel, and B. Sivri. 2003. “De-
mand Growth versus Market Share Gains: De-composing Export Growth in the 1990s.”Mimeo. World Bank, Washington, D.C.
Baffes, John. 2003. “Cotton Market Setting Policies, Is-sues, and Facts.” Mimeo. World Bank, Washing-ton, D.C. March.
Baffes, John, and Harry de Gorter. 2003. “DecouplingSupport to Agriculture: An Economic Analysis andRecent Experience.” Annual World Bank Confer-ence on Development Economics. Paris, May15–16.
Beghin, John, and M. Ataman Aksoy. 2003. “Agricul-tural Trade and the Doha Round. Lessons fromCommodities Studies.” Annual World Bank Con-ference on Development Economics. Paris, May15–16.
Bell, B., and R. Elliott. 1993. “Aspects of New Zea-land’s Experience in Agricultural Reform Since1984,” Ministry of Agriculture and Forestry,Auckland, New Zealand.
Borrell, Brent, and David Pearce. 1999. “Sugar: theTaste Test of Trade Liberalization.” Center for In-
A G R I C U L T U R A L P O L I C I E S A N D T R A D E
139

ternational Economics, Canberra and Sydney,Australia, September.
Cato, James C., and C. A. L. Dos Santos. 2000. “Coststo Upgrade the Bangladesh Frozen Shrimp Pro-cessing Sector to Adequate Technical and SanitaryStandards.” In L. J. Unnevehr, ed., The Econom-ics of HACCP. Saint Paul, Minn.: Eagan Press.
DRIFE (Danish Research Institute of Food Economics).2003. “Note on the Harbinson Draft on Modali-ties in the WTO Agriculture Negotiations.” Agri-cultural Policy Research Division, Frederiksberg,Denmark.
De Gorter, H. 2003. “Agricultural Support Programsand Farm Household Incomes.” Mimeo. WorldBank, Washington, D.C.
Diop, Ndiame, John Beghin, and Mirvat Sewadeh.2003. “Groundnut Policies, Global Trade Dy-namics, and the Impact of Trade Liberalization.”Mimeo. World Bank, Washington, D.C. March.
Federated Farmers of New Zealand. 2002. “Life afterSubsidies: The New Zealand Farming Experience15 Years Later.” Wellington, New Zealand.
Gallezot, J. 2003. “La progressivité tarifaire de l’UE visà vis des produits agricoles et agroalimentaires.”Mimeo. Institut National de Recherche Agrono-mique, Unité Mixte de Recherche ÉconomiePublique, Paris-Grignon. January.
Golub, S., and J. Michael Finger. 1979. “The Process-ing of Primary Commodities: Effects of Devel-oped-country Tariff Escalation and DevelopingCountry Export Taxes.” Journal of PoliticalEconomy 83 (3): 559–77.
Henson, Spencer, Ann-Marie Brouder, and Winnie Mi-tullah. 2000. “Food Safety Requirements andFood Exports from Developing Countries: TheCase of Fish Exports from Kenya to the EuropeanUnion.” American Journal of Agricultural Eco-nomics, No. 5.
Hoekman, Bernard, Francis Ng, and Marcelo Olar-reaga. 2002. “Reducing Agricultural Tariffs ver-sus Domestic Support: What’s More Importantfor Developing Countries?” Mimeo. World Bank,Washington, D.C. September.
Ingco, M. 1997. “Has Agricultural Trade Liberaliza-tion Improved Welfare in the Least-DevelopedCountries? Yes.” Policy Research Working Paper1748. World Bank, Washington, D.C.
Integrated Framework. 2003. “Malawi Diagnostic In-tegration Study, Integrated Framework Diagnos-tic.” Trade Integration Studies, Washington,D.C., May.
Jaffee, Steven. 2003. “From Challenge to Opportunity:The Transformation of Kenyan Vegetable Tradein the Context of Emerging Food Safety and
Other Standards.” Mimeo. World Bank, Wash-ington, D.C.
Jansen, H. Tarp, Sherman Robinson, and Finn Tarp.2002. “General Equilibrium Measures of Agricul-tural Policy Bias in Fifteen Developing Coun-tries.” TMD Discussion Paper 105. InternationalFood Policy Research Institute, Washington, D.C.
Kalaitzandonakes, N. G., and M. E. Bredahl. 1994.“Protectionism, Efficiency, and ProductivityGrowth.” In M. Hartmann, P. M. Schmitz, and H. von Witzke, eds., Agricultural Trade andEconomic Integration in Europe and in NorthAmerica. Kiel, Germany: WissenschaftsverlagVauk Kiel KG.
Kudat A., M. I. Ajwad, and B. Sivri. 2003. “A Synthe-sis of Trade and Poverty Country Studies in Diag-nostic Trade Integration Studies.” Mimeo. WorldBank, Washington, D.C.
Lindland, J. 1997. “The Impact of the Uruguay Roundon Tariff Escalation in Agricultural Products.”Food Policy 22: 487–500.
Minot, Nicholas, and Lisa Daniels. 2002. “Impact ofGlobal Cotton Markets on Rural Poverty inBenin.” International Food Policy Research Insti-tute, Washington, D.C. November.
Minot, Nicholas, M. Kherallah, and P. Berry. 2000.“Fertilizer Market Reform and the Determinantsof Fertilizer Use in Benin and Malawi.” MSSDDiscussion Paper 40. International Food PolicyResearch Institute, Washington, D.C. October.
Mitchell, Donald. 2003. “Sugar Policies: Opportunityfor Change.” Mimeo. World Bank, Washington,D.C. March.
Morrison Paul, Catherine J., Warren Johnston, andGerald Frengley. 2000. “Efficiency in NewZealand Sheep and Beef Farming: The Impacts ofRegulatory Reform.” Review of Economics andStatistics 82 (2): 325–37.
Nogues, Julio J. 2002. “Comment to ‘Trade, Growth,and Poverty—A Selective Survey,’ by AndrewBerg and Anne Krueger, and ‘Doha and the WorldPoverty Target,’ by L. Alan Winters.” Commen-tary presented at the Annual World Bank Confer-ence on Development Economics, May.
Nogues, Julio J. 2003. “Agricultural Exports in a Pro-tectionist World: Assessing Trade Strategies forMERCOSUR.” Paper prepared for the Trade andIntegration Division of the Inter-American Devel-opment Bank.
OECD (Organisation for Economic Co-operation andDevelopment). 1999. “Distributional Effect ofAgricultural Support in Selected OECD Coun-tries.” Directorate for Food, Agriculture, andFisheries, Committee for Agriculture, Paris.
G L O B A L E C O N O M I C P R O S P E C T S 2 0 0 4
140

_____. 2001. “The Uruguay Round Agreement onAgriculture: an Evaluation of Its Implementationin OECD Countries.” Paris.
_____. 2002a. “A Positive Agenda.” Directorate forFood, Agriculture, and Fisheries, Committee forAgriculture. Paris.
_____. 2002b. “Methodology for the Measurement ofSupport and Use in Policy Evaluation.” Paris.
_____. 2002c. “Agricultural Policies in OECD Coun-tries: Monitoring and Evaluation.” Paris.
_____. 2002d. “Farm Household Income Issues inOECD Countries: A Synthesis Report.” Direc-torate for Food, Agriculture, and Fisheries, Com-mittee for Agriculture. Paris.
_____. 2002e. “The Incidence and Income Transfer Ef-ficiency of Farm Support Measures.” Directoratefor Food, Agriculture, and Fisheries, Committeefor Agriculture. Paris.
Quiroz, J., and L. Opazo. 2000. “The Krueger-Schiff-Valdés Study 10 Years Later: A Latin AmericanPerspective.” Economic Development and Cul-tural Change 49 (1): 181–96.
Rae, A., and T. Josling. 2003. “Processed Food Tradeand Developing Countries: Protection and TradeLiberalization.” Food Policy 28: 147–66.
Ravallion, Martin. 2000. “On the Urbanization ofPoverty.” Mimeo. World Bank, Washington, D.C.
Rosengrant, M. W., and S. Meijer. 2002. “AgriculturalTrade Liberalization to 2020: Impact on Trade,Price, and Economics Benefits.” InternationalFood Policy Research Institute, Washington, D.C.September.
Schiff, Maurice, and Alberto Valdés. 1992. The Politi-cal Economy of Agricultural Pricing Policy. Vol-
ume 4 of A Synthesis of the Economics in De-veloping Countries. Baltimore: Johns HopkinsUniversity Press.
Sheales, T., S. Gordon, A. Hafi, and C. Toyne. 1999.“Sugar International Policies Affecting MarketExpansion.” ABARE Research Report 99.14.Australian Bureau of Agricultural and ResourceEconomics, Canberra, Australia. November.
USDA (U.S. Department of Agriculture). 2002. “Agri-cultural Income and Finance Outlook.” Washing-ton, D.C. September 26.
Von Braun J., and E. Kennedy. 1994. AgriculturalCommercialization, Economic Development, andNutrition. Baltimore: Johns Hopkins UniversityPress.
Wailes, Eric. J. 2003. “Global Trade and ProtectionRegimes in Rice Trade.” Mimeo. University ofArkansas, Fayetteville. April.
Watkins, Kevin. 2003. “Northern Agricultural Policiesand World Poverty: Will the Doha ‘DevelopmentRound’ Make a Difference?” Annual World BankConference on Development Economics. Paris,May 15–16.
World Bank. 2000. Global Economic Prospects andthe Developing Countries 2001. Washington,D.C.: World Bank.
_____. 2001. Global Economic Prospects and the De-veloping Countries 2002. Washington, D.C.
WTO (World Trade Organization). 2003. “Negotia-tions on Agriculture First Draft of Modalities forthe Further Commitments.” WTO Document No:TN/AG/W/1/Rev.1. Geneva.
A G R I C U L T U R A L P O L I C I E S A N D T R A D E
141

Globalization is driving the movement of people across bordersWith globalization—the dramatic expansion ofcross-border trade and investment—has comean upsurge in international labor mobility.Falling costs of transportation and communica-tion have reduced the distances between peo-ples, and the drive for better lives has motivatedworkers to move to areas where jobs are moreplentiful and pay is better. Foreign-born personsnow account for 10 percent of the total popula-tion in the United States, 5 percent in Europe,and 1 percent in Japan. In Canada and Aus-tralia, foreign-born persons represent 17 and 24percent of the total population, respectively.1
Even so, today’s movement of people is stillwell below levels experienced in the late nine-teenth century, and migration rates, now ham-pered by restrictive policies, are well belowcross-border flow of goods and investment. By2000, according to the United Nations, 175million persons were living outside their coun-try of birth—about 3 percent of the world’spopulation. By contrast, global exports ofgoods reached almost a third of GDP, and fi-nancial flows were well above 10 percent(OECD 2001c; World Bank 2003; United Na-tions 2000).
While long term and settlement migrationare still predominant in most developed coun-tries, migrant flows are now more diverse andcomplex, with migrants moving back and forth
more readily and rapidly. Temporary move-ment, in particular by highly skilled workers,has seen the largest growth in the past decade.
Both rich and poor countries can benefitBoth developed and developing countries havemuch to gain from an increased flow of work-ers. Rich countries benefit because they gainworkers whose skills are in short supply. Also,as demographics drive up the average age inrich countries, migration allows an influx ofyounger workers who contribute to pensionsystems that would otherwise be actuariallyunviable. Poor countries gain from higherwages as well as from the remittances thataccrue from migration. In 2001, worker re-mittances alone provided some $70 billion todeveloping countries, nearly 40 percent morethan all development assistance and signifi-cantly more than net debt flows to developingcountries. Returning workers also often bringnew skills back to the sending country. To besure, there are costs to both receiving and send-ing countries: labor markets and social servicesmay be strained in the rich countries, and de-veloping countries may lose skilled workerswho have been educated with public resources.Nonetheless, if a temporary visa system wereintroduced in rich countries permitting move-ment of labor up to 3 percent of the total laborforce, world incomes would rise by nearly$160 billion (Walmsley and Winters 2002).
143
Labor Mobility and the WTO:Liberalizing Temporary Movement
4

The GATS could facilitate temporarymovementsTemporary movement of certain types of work-ers—service suppliers—is included under theWorld Trade Organization (WTO) GeneralAgreement on Trade in Services. This is de-signed to facilitate the movement of people in away analogous to the movement of goods andcapital. This type of temporary movement—called Mode 4 in the GATS—is treated as otherservices in the global negotiations. They allowcountries to negotiate fixed limits accorded toall foreign workers on a most-favored-nation(MFN) basis. Some developing countries seetemporary movement under GATS Mode 4 astheir key interest in services trade and are ex-pecting real progress in the context of the DohaDevelopment Agenda negotiations.
However, progress has been minimalbecause of policy restrictionsTo date, however, even judging by the relativelylimited liberalization of trade in services duringthe Uruguay Round, little has been done toloosen conditions governing the temporarymovement of natural persons supplying services(Mode 4). Mode 4 today accounts for less than2 percent of the total value of services trade.Present commitments refer almost exclusivelyto higher level personnel. More than 40 percentof Mode 4 commitments are for intracorporatetransferees whose mobility is intimately relatedto foreign direct investment; another 50 percentof commitments cover executives, managersand specialists, and business visitors. All thismeans that the Mode 4 liberalization achievedto date has been of limited significance for de-veloping countries whose comparative advan-tage lies in the export of medium- and low-skilled, labor-intensive services.
Two fundamental tensions hamper progresson Mode 4 labor mobility. The first is that gov-ernments are reluctant to undertake perma-nent commitments when employment demandvaries with cyclical conditions, and when sev-eral OECD countries are facing difficulties inintegrating existing immigrant communitiesinto their labor market and societies. Wanting
to maintain immigration and labor marketpolicy flexibility, countries have made GATScommitments far below the degree of TMNPaccess already afforded under domestic lawsand regulations. An important corollary of thistension is that the extent of TMNP liberali-zation for some sectors and categories of workers where labor demand routinely exceedssupply (for example, in tourism, informationtechnology, and medical-related services) maybe significantly greater than in other categoriesof labor, particularly unskilled labor.
A second tension stems from the fact thatthe strong regional character of migration pat-terns creates domestic political support forprograms that favor neighboring countries,while Mode 4 commitments necessarily areopen to all countries on an MFN basis. Pref-erential migration schemes are commonly ne-gotiated at the bilateral and regional levels,and MFN-based liberalization would under-mine these. Because the many bilateral laboragreements are usually untied to trade policyor other agreements, they afford governmentsa greater degree of flexibility to adjust pro-grams to evolving migration trends and labor-market needs.
While the potential gains from increasingtemporary labor mobility, including for ser-vice suppliers under GATS Mode 4, could besizeable, the analysis presented in this chaptercautions that expectations of far-reaching for-ward movement need to be tempered becauseof the political sensitivity of such trade in re-ceiving countries. That sensitivity has becomemore pronounced in the context of decelerat-ing worldwide economic growth and height-ened security concerns.
Expanding Mode 4 requires changes to realize its modest potentialTensions notwithstanding, present levels ofMode 4 access fall far short of even its rela-tively modest potential. One possible responseis for developing countries to actively expandtheir requests and offers in the Doha Round.Also, WTO members could adopt rules thatwould provide greater clarity and predictabil-
G L O B A L E C O N O M I C P R O S P E C T S 2 0 0 4
144

ity. And to help regularize entry and exit whileensuring improved security, countries couldadopt a GATS visa system that would facili-tate national visas for up to one year, subjectto appropriate checks and strict rules ofadministration.
The bigger picture: Globalmigration and remittance trends
Although on an upward trend over the lasttwo decades, migration is still far below
its historic peak. The greatest migratory flowstook place between the middle of the nine-teenth century and the onset of World War I,when an estimated 10 percent of the world’slabor force relocated permanently across bor-ders (World Bank 2001). Mass migration wasa major factor in equalizing incomes acrosscountries throughout this period, by someestimates exerting a greater influence than ei-ther trade or capital movements (Lindert andWilliamson 2001).
Since World War II, globalization has led to more unrestricted movement of both goodsand capital, while international policies towardmigration have become more restrictive. As aresult, the overall scale of labor migration re-mains relatively smaller than that of capital ortrade flows. Only 3 percent of the world’s pop-ulation—some 175 million people—live outsidetheir country of citizenship, and the number of permanent legal immigrants to the UnitedStates is less today than it was in 1914, both inabsolute terms—850,000 vs. 1.2 million—andas a percentage of the total population—0.35percent vs. 1.5 percent. By contrast, global ex-ports of goods represent almost one-third ofworld GDP (World Bank 2003; OECD 2001c).
While South-North migratory flows receivethe most attention, much cross-border labormobility—representing roughly half of the totalnumber of migrants—takes place between de-veloping countries. While poorly measured andless well understood than flows into the North,some patterns are evident: South Asians typi-cally travel to the Middle East and East Asia,while South Africa, Nigeria, and Côte d’Ivoire
together have accounted until recently for up tohalf of Africa’s migratory flow. Almost every-where, most migrants tend to stay within theirregions, reflecting the importance of cultureand language and the lower costs associatedwith geographical proximity.
Around the world, migration is on the riseFive forces have governed world migrationsince the mid-nineteenth century:
• Wage and opportunity gaps between richand poor countries
• Regional conflicts and political instabil-ity in developing countries
• The relative share of young adults in the populations of sending and receivingcountries
• Numbers of migrant stock residing in re-ceiving countries
• Reductions in the cost and inconvenienceof travel.
These forces are still driving South-North,and South-South, migration. Successful devel-opment and poverty eradication in the develop-ing world almost certainly will release part ofthe poverty constraint on potential emigrantswhile simultaneously reducing the motivationof many to move. In regions where developmenthas been slower and poverty more obstinate,rising populations, dwindling opportunities,and lower travel costs will combine to impelemigration. The shrinking share of young adultsin the developed countries, particularly in Japanand Western Europe, and the rising share ofyoung people in South Asia, Africa, and otherparts of the world are complementary drivers oflabor movement. Growing numbers of youngpeople in the developing world have acquiredthe education and training needed to assumeskilled positions in developed economies. Andas the numbers of the foreign-born grow in de-veloped countries, their presence makes it easierand more attractive for newcomers to join them(Hutton and Williamson 2002).
Wage differentials remain high. The averagehourly wage in manufacturing is about $30 in
L A B O R M O B I L I T Y A N D T H E W T O : L I B E R A L I Z I N G T E M P O R A R Y M O V E M E N T
145

Germany, while in some parts of China andIndia it is only 30 cents. Between the UnitedStates or France and newly emerging countriessuch as Thailand or Malaysia the gap is ten-fold. Meanwhile, the supply of labor is swellingin developing countries—particularly in SouthAsia and Africa, where poverty is concentrated.Each year 83 million people are added to theworld’s population, 82 million of them in thedeveloping world (World Bank 2001).
The continuing demographic transition inindustrial countries adds to these pressures. As their populations age and average levels oftraining and education rise, developed coun-tries face a declining ratio of workers to re-tirees and an increasing scarcity of lower-
skilled labor (box 4.1). In some service occu-pations, particularly those most directly re-lated to population aging (medical care andassociated personal care services), where thereis no substitute for human labor, the demandfor—and benefits of—movement of lower-skilled labor are likely to continue to increase(Winters 2003).
The foreign and foreign-born make up agrowing share of the population of mostmajor industrial countries, rising over the lastdecade from 4.6 to 5.4 percent in the Euro-pean Economic Area, and from 7.9 to 10.4percent in the United States (table 4.1) Be-cause the population of developing countriesis about five times greater than that of devel-
G L O B A L E C O N O M I C P R O S P E C T S 2 0 0 4
146
The combined demographic effects of the babyboom that marked the immediate post-war
period, the fall in fertility rates that began in OECD countries in the late 1960s, and longer lifeexpectancy have led to a striking acceleration inpopulation aging in virtually all advanced industrialsocieties.
Population aging is much more marked inEurope and Japan than in North America, but allthree regions will be affected. According to demo-graphic projections by the United Nations, thepopulations of the European Union and Japan areexpected to fall by 10 percent and 14 percent, re-spectively, between 2000 and 2050, representing adecline of some 55 million in all. In both Japan andthe European Union, the dependency ratio (definedas the ratio of pensioners to workers) is expected todecline from five to one today to three to one in2015. For the United States, projections still point toan increased total population over the same period,but the dependency ratio also rises.
Recent research has considered the economicand fiscal impact of these demographic trends in theOECD area (OECD 2000, 2001c, 2002; Visco2000). Without offsetting measures, the growing de-pendency could place enormous strains on social se-curity, Medicare, and pensions systems. Far-reachingdecisions are required over the medium and longterm to meet shifting labor demands and to safe-
Box 4.1 Population aging and migrationguard balance and equity in the systems of socialprotection—decisions related to the length of work-ing life, levels of contributions and benefits, and pro-ductivity advances.
One solution receiving increased considerationin several countries is to increase levels of permanentimmigration to modify population structures andmitigate the social and economic costs of aging. Im-migration has advantages. It can quickly increase theeconomically active population because new immi-grants tend to be younger and more mobile. Also,fertility rates among immigrant women are oftenrelatively high, which can help boost populationgrowth. This has only a limited impact in the shortrun, however.
Immigration alone cannot provide the answer topopulation aging, as demonstrated by simulationsproduced by the United Nations (2000). The simula-tions show that maintaining steady dependency ra-tios until 2050 would require an enormous increasein migration flows—for the United States and the Eu-ropean Union, migration balances would have to beat least 10 times the annual averages of the 1990s.Such scenarios seem implausible by historical stan-dards, and in light of the likely political reactions.
Source: OECD (2001f).

Table 4.1 Migration is rising in many OECD countriesMigration flows and stocks of foreign and foreign-born population in OECD countries, annual averages, 1990–2000(thousands, except where otherwise noted)
1990–94 1995–99 2000
ImmigrationAustralia
Permanent 99 87 92Temporary 104 154 224
CanadaPermanent 236 204 227Temporary workersa 64 69 86
European economic areab 1,614 1,352 1,426Japan 244 251 346United States
Permanent 1,209 747 850Temporaryc 1,357 1,893 2,741
Net migration per thousand inhabitantsAustralia 4.3 5.1 5.4Canadad .. 5.4 5.1European economic areae 3.1 1.7 2.5Japan –0.03 –0.04 0.3United States 3.3 3.3 3.1
Asylum seekersAustralia 9 9 12Canada 30 26 36Central and Eastern Europe 3 13 26European economic area 516 326 427United States 136 105 57
Acquisitions of nationalityAustralia 107 102 80Canada 130 160 205European economic areaf 460 690 720Japan 12 16 18United States 315 680 900
1990 (percent) 2000 (percent) 2000 (thousands)
Stock of foreign populationEuropean economic areag 4.6 5.4 20,381Japan 0.9 1.3 1,686
Stock of foreign-born populationAustralia 22.8 23.6 4,517Canadah 16.1 17.4 4,971United States 7.9 10.4 28,400
.. negligible a. Inflows of foreign workers entering Canada to work temporarily (excluding seasonal workers) provided by initial entry.b. Includes Austria, Greece, Italy, and Spain. No 2000 data for Denmark available; 1999 data substituted. c. Excluding visitors, transit migrants, foreign government officials, and students. d. Fiscal years (July to June).e. Data relate to 1999–2000 average instead of 2000.f. Excluding Greece and Ireland.g. Excluding Greece. No 2000 data available for France; 1999 data substituted.h. Data are for 1991 instead of 1990 and for 1996 instead of 2000.Source: OECD (2002f).
oped countries, migrants comprise a largershare of the total population in rich countries(6 percent) than in poor countries (1 percent).
The uneven composition of immigrationflows reflects differing policy objectives and
historical and institutional backgrounds in var-ious countries. Some countries, such as Aus-tralia, Switzerland, and the United Kingdom,explicitly give priority to foreign workers, sothat this group accounts for around half of all
L A B O R M O B I L I T Y A N D T H E W T O : L I B E R A L I Z I N G T E M P O R A R Y M O V E M E N T
147

immigration. Other OECD countries, becausethey tend to restrict work-related migration,implicitly give priority to nonselective migra-tion arising from family reunification (whichaccounts for approximately 80 percent of flowsinto the United States and France, for example)or requests for asylum (approximately half inthe Nordic countries) (OECD 2002f).
Because legal immigration is restricted, ille-gal migration has risen noticeably in recentyears, as have trafficking in human beings andexpenditures to combat both phenomena. Ille-gal migration into the European Union soaredtenfold in the 1990s, reaching half a millionpeople annually by the end of the decade. Inthe United States, an estimated net inflow of300,000 undocumented workers occurs eachyear, although this could well underestimatethe actual scale of illegal migration.
Newer factors are compounding the morefamiliar drivers of migration. The developingworld’s rising share of educated workers—thosewho have completed secondary education—has jumped from one-third to nearly one-halfover the past three decades. Increasingly, thegrowing pool of skilled developing-countrylabor is meeting industrial-country shortages,as the marketplace for skills widens to encom-pass the entire globe. Meanwhile, continueddeclines in transportation and communication
costs and thus greater access to informationon migration opportunities via global media,the Internet, and diaspora networks in receiv-ing countries are breaking down barriers to mi-gration (Nielson 2002).
Remittances by migrants are an importantsource of income for many developingcountriesRemittances from foreign workers, both per-manent and temporary, are the second-largestsource of external funding for developingcountries, after foreign direct investment(FDI). In 2001, workers’ remittances to devel-oping countries stood at $72.3 billion, consid-erably higher than total official developmentassistance and private non-FDI flows, and 42 percent of total FDI flows to developingcountries that year (table 4.2). For most of the1990s, remittance receipts exceeded officialdevelopment assistance (World Bank 2003).
As with actual movements of people, thedata on payments are susceptible to measure-ment problems—not all flows, even from legalmigration, are captured in the balance of pay-ments accounts, and in situations where sub-stantial illegal migration occurs, the bulk of the international resource flows also may bemissed. Such difficulties notwithstanding, ini-tial estimates of these flows can be derived
G L O B A L E C O N O M I C P R O S P E C T S 2 0 0 4
148
Table 4.2 Workers’ remittances are the second-largest source of external funding fordeveloping countriesRemittance receipts and payments by developing countries in 2001 (billions of dollars)
Lower middle Upper middleAll developing Low income income income
Total remittance receipts 72.3 19.2 35.9 17.3As percentage of GDP 1.3 1.9 1.4 0.8As percentage of imports 3.9 6.2 5.1 2.7As percentage of domestic investment 5.7 9.6 5.0 4.9As percentage of FDI inflows 42.4 213.5 43.7 21.7As percentage of total private capital inflows 42.9 666.1 44.9 20.2As percentage of official development assistance 260.1 120.6 361.7 867.9
Other current transfersa 27.2 6.1 14.0 7.1Remittances and other current transfers 99.5 25.3 49.9 24.4
Total remittance payments 22.0 1.2 1.7 19.1Excluding Saudi Arabia 6.9 1.2 1.7 4.0
a. Other current transfers include gifts, donations to charities, pensions received by currently retired expatriate workers, and soon. They also may include personal transfers by migrant workers to families back home.Source: World Bank (2003).

from balance of payments statistics by com-bining workers’ compensation (transfers re-lating to work abroad of less than one year)and workers’ remittances (transfers made byworkers whose stay abroad exceeds one year)(World Bank 2003).
In nominal terms, the top recipients of re-mittances included several large developingeconomies—India, Mexico, and the Philip-pines—although as a share of GDP, remit-tances were larger in other low-income coun-tries in 2001 (figure 4.1). Broken down alongregional lines, countries in Latin America and
the Caribbean were the largest recipient ofremittances in nominal terms in 2001, but rel-ative to the size of GDP, South Asia was thelargest recipient, with remittances of nearly 2.5percent of GDP. Remittance flows to countriesin Sub-Saharan Africa also were significant, ac-counting for 1.3 percent of GDP (table 4.3).
Workers’ remittances are spread moreevenly among developing countries than arecapital flows—the top 10 recipient countries in2001 received 60 percent of total remittancesto developing countries as compared with atop 10 share of 68 percent of GDP, 72 percent
L A B O R M O B I L I T Y A N D T H E W T O : L I B E R A L I Z I N G T E M P O R A R Y M O V E M E N T
149
Figure 4.1 Workers’ remittances are an important source of income for many developingcountriesTop developing-country recipients of workers’ remittances, 2001 (billions of dollars and percent of GDP)
IndiaMexico
PhilippinesMorocco
Egypt, Arab Rep.Turkey
LebanonBangladesh
JordanDominican Republic
El SalvadorColombia
Yemen, Rep.Pakistan
BrazilEcuador
Yugoslavia, FR (Serb./Mont.)Thailand
ChinaSri Lanka
LesothoJordanAlbaniaNicaraguaYemen, Rep.MoldovaLebanonEl SalvadorCape VerdeJamaicaYugoslavia, FR (Serb./Mont.)MoroccoDominican RepublicVanuatuPhilippinesHondurasUgandaEcuadorSri Lanka
0 5 10 15 20 25 30024681012
Source: World Bank (2003).
Table 4.3 Remittances are a significant source of income in all regions of thedeveloping worldWorkers’ remittances received by developing countries, by region, 1999–2002 (in billions of dollars and as percentage of GDP)
1999 2000 2001 2002
(billions of dollars) $ billions % GDP $ billions % GDP $ billions % GDP $ billions % GDP
Total 67 1.2 66 1.1 72 1.3 80 1.3East Asia and Pacific 11 0.7 10 0.7 10 0.6 11 0.6Europe and Central Asia 8 0.9 9 0.9 9 0.9 10 1.0Latin America and Caribbean 17 1.0 19 1.0 23 1.2 25 1.5Middle East and North Africa 12 2.2 11 1.9 14 2.3 14 2.2South Asia 15 2.6 13 2.3 14 2.3 16 2.5Sub-Saharan Africa 4 1.3 3 0.8 3 1.0 4 1.3
Sources: IMF, Balance of Payments Yearbook; World Bank, World Development Indicators (2001).

of exports, and 74 percent of FDI. Remittancesalso are more stable than private capital flows,which tend to move in a pro-cyclical manner.
Temporary movement of workers
Many people move only temporarily—students, tourists, business visitors ex-
ploring or conducting trade and investmentactivities, and people working abroad under arange of schemes. People working or conduct-ing business are thus a subset of temporarymovement, and GATS Mode 4, temporarymovement of natural persons as service sup-pliers, is a further subset of this group.
Most of the developed economies experi-enced significant growth in certain types oftemporary migration during the 1990s (table4.4). In the United States, for example, the av-erage number of temporary immigrants peryear doubled between 1990–94 and 2000, atwhich point the total was more than three timeslarger than permanent immigrants (see table4.1).
The absence of global figures on temporaryforeign workers and the limitations of existingmigration data2 make analysis difficult and de-finitive conclusions impossible. However, ac-cording to the OECD (2001), some trendshave begun to emerge.
Although available statistics are insufficientto identify conclusively the primary traders in
temporary mobility, the picture is not a simpleone. Developed countries are major exporters,as well as importers, of labor. Similarly, somedeveloping countries are significant importers.By some value indicators—for example, com-pensation of employees—developed countriesaccount for most of the flow in both direc-tions. On the other hand, developing countriesare the major receivers of remittances (see fig-ure 4.1). Temporary movement is by no meansunidirectional. Relative to the overall size oflabor markets, the number of temporary for-eign workers remains small for most countries,except for the Arab states of the Persian Gulf.The areas of highest growth are short-termmovements (from three to six months) (OECD2001b). Movements of both skilled and un-skilled workers appear to be concentrated inthe service sectors of major receiving countries,notably in construction, commerce, catering,education, health care, services to households,and other services. In developing countries,foreign workers tend to be concentrated in pri-mary activities (agriculture, fishing, and min-ing) as well as in manufacturing, although theshare in services (particularly tourism-related)is rising in several countries (UNCTAD 2001).
Although the volume of global trade repre-sented by temporary foreign workers remainssmall compared to overall trade in goods andservices, it is very important for some indus-tries and for some countries. Indeed, exports
G L O B A L E C O N O M I C P R O S P E C T S 2 0 0 4
150
Table 4.4 Temporary movement is rising in rich countriesEntries of temporary foreign workers in selected OECD countries, 1992–2000 (thousands)
1992 1993 1994 1995 1996 1997 1998 1999 2000
Australia 40.5 14.9 14.2 14.3 55.7 81.7 92.9 99.7 115.7Canada 70.4 65.4 67.5 69.5 71.5 75.4 79.5 85.4 93.7France 18.1 — — — 13.6 12.9 11.8 13.4 15.4Germany 332.6 69.1 53.9 61.7 271.0 267.7 244.0 274.1 331.6Italy — — — — — — — 18.7 24.52Japan — — — — 124.1 143.5 151.7 156.0 183.9Korea, Rep. of 8.3 12.4 33.6 47.0 81.4 105.0 75.4 111.0 122.5Sweden — — — — — — — 15.0 19.4Switzerland 127.8 — — — 63.4 47.4 40.3 46.1 50.3United Kingdom 57.6 25.9 26.3 32.9 78.7 89.7 98.8 107.9 134.1United States 143.0 112.5 130.7 147.5 191.2 — 342.7 422.5 505.1
— Not available.Note: Definitions vary among countries and the figures are not strictly comparable.Source: OECD (2002f).

of labor services in many developing countriesaccount for a substantial share of output andtrade. In several developing countries (mainlylower income), such flows dwarf the value oftotal services exports (OECD 2001b). More-over, migration flows are resilient—for exam-ple, they were much more stable than capitalflows in the wake of the recent Asian financialcrisis (box 4.2).
Burgeoning cross-border investment—hori-zontally through mergers or joint ventures
and vertically through relocation or so-calledgreenfield investments—accounts for muchnew temporary movement, helped along byadvances in transportation, communications,logistics, and organization that have altered allphases of the business process. Today’s compa-nies not only can but must respond quickly toemerging opportunities by forming specializedtask teams, regardless of where the personnelare based. Business functions previously han-dled by expatriate staff, resident representa-
L A B O R M O B I L I T Y A N D T H E W T O : L I B E R A L I Z I N G T E M P O R A R Y M O V E M E N T
151
Increased labor migration, particularly the tempo-rary movement of unskilled labor, was an impor-
tant dimension of structural change and globaliza-tion within much of Northeast and Southeast Asia inthe 1980s and 1990s. Conservative estimates suggestthat the number of migrants doubled or even tripledin most net labor importing countries from the early1980s to the onset of the financial crisis in 1997(Athukorala and Manning 1999). By the onset of the crisis, some 2 million overseas migrant workerswere employed in Northeast Asian economies out-side China, and an even larger number—some 3 to 4 million—worked in Southeast Asia.
The Asian financial crisis changed the contextwithin which those labor movements occurred, pos-ing a major threat to economic growth. Internationalcapital flows reversed, many firms went bankrupt,and unemployment rates rose steeply in the crisis-affected countries (World Bank 2000). Demand forlabor plummeted in the modern sectors of labor-receiving countries. Yet a recent examination oflabor mobility patterns before and after the financialcrisis suggests that the economic turmoil did notalter the fundamental conditions underpinning highlevels of intraregional migration, especially of un-skilled contract workers (Manning 2002)—a widen-ing wage gap and imbalances between supply anddemand for labor across East Asia.
Countries in the region—especially the net laborimporters: Hong Kong (China), Malaysia, Republicof Korea, and Thailand—have continued to rely oninflows of migrant workers. Many such migrants areunskilled. Indeed, the willingness of migrant workers
Box 4.2 Temporary labor movement and the EastAsian crisis of 1997–98
to undertake so-called 3-D jobs (difficult, dirty, anddangerous) shunned by nationals in export-orientedindustries has helped economic recovery. The largereal gains to workers who migrate to more developedcountries were documented in a recent study: un-skilled Indonesian workers can earn $2 or more perday in neighboring Malaysia compared to 28 centsper day at home (World Bank 2001).
The migration of skilled and professional work-ers also was an important part of the international-ization of East Asian labor markets during the1990s. FDI and associated trade flows resulted in sig-nificant skilled migration from developed to develop-ing countries—as well as considerable out-migrationof skilled and professional migrants from countriesin the region. Workers from the Philippines domi-nated the latter flows, reflecting both slower rates ofFDI and economic growth domestically, and a mod-ern sector incapable of absorbing enough graduatesfrom the well-developed education sector.
Several countries have sought to develop a morecoherent migration policy in light of the social effectsof the cutback in labor demand and unemploymentthat accompanied the crisis. This may be good newsfor many migrant workers who need protectionagainst exploitation. In-migration of unskilled over-seas workers, meanwhile, can be expected to con-tinue to support production in both tradable andnontradable industries in the more affluent EastAsian economies.
Source: World Bank staff.
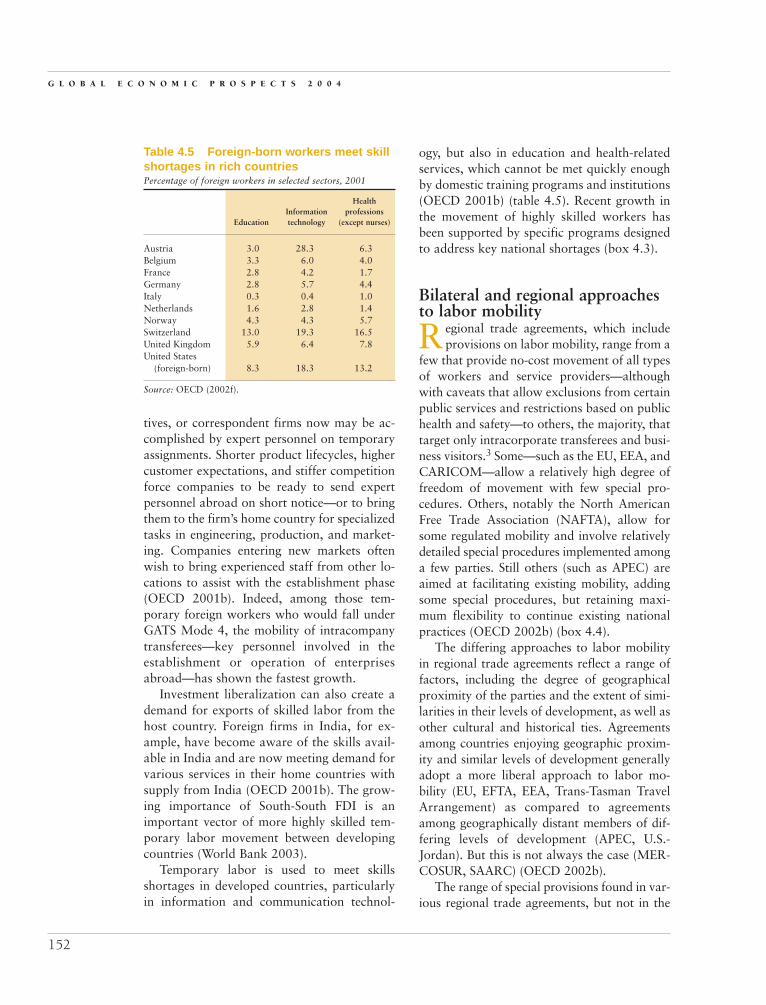
tives, or correspondent firms now may be ac-complished by expert personnel on temporaryassignments. Shorter product lifecycles, highercustomer expectations, and stiffer competitionforce companies to be ready to send expertpersonnel abroad on short notice—or to bringthem to the firm’s home country for specializedtasks in engineering, production, and market-ing. Companies entering new markets oftenwish to bring experienced staff from other lo-cations to assist with the establishment phase(OECD 2001b). Indeed, among those tem-porary foreign workers who would fall underGATS Mode 4, the mobility of intracompanytransferees—key personnel involved in theestablishment or operation of enterprisesabroad—has shown the fastest growth.
Investment liberalization can also create ademand for exports of skilled labor from thehost country. Foreign firms in India, for ex-ample, have become aware of the skills avail-able in India and are now meeting demand forvarious services in their home countries withsupply from India (OECD 2001b). The grow-ing importance of South-South FDI is animportant vector of more highly skilled tem-porary labor movement between developingcountries (World Bank 2003).
Temporary labor is used to meet skillsshortages in developed countries, particularlyin information and communication technol-
ogy, but also in education and health-relatedservices, which cannot be met quickly enoughby domestic training programs and institutions(OECD 2001b) (table 4.5). Recent growth inthe movement of highly skilled workers hasbeen supported by specific programs designedto address key national shortages (box 4.3).
Bilateral and regional approachesto labor mobility
Regional trade agreements, which includeprovisions on labor mobility, range from a
few that provide no-cost movement of all typesof workers and service providers—althoughwith caveats that allow exclusions from certainpublic services and restrictions based on publichealth and safety—to others, the majority, thattarget only intracorporate transferees and busi-ness visitors.3 Some—such as the EU, EEA, andCARICOM—allow a relatively high degree offreedom of movement with few special pro-cedures. Others, notably the North AmericanFree Trade Association (NAFTA), allow forsome regulated mobility and involve relativelydetailed special procedures implemented amonga few parties. Still others (such as APEC) areaimed at facilitating existing mobility, addingsome special procedures, but retaining maxi-mum flexibility to continue existing nationalpractices (OECD 2002b) (box 4.4).
The differing approaches to labor mobilityin regional trade agreements reflect a range offactors, including the degree of geographicalproximity of the parties and the extent of simi-larities in their levels of development, as well asother cultural and historical ties. Agreementsamong countries enjoying geographic proxim-ity and similar levels of development generallyadopt a more liberal approach to labor mo-bility (EU, EFTA, EEA, Trans-Tasman TravelArrangement) as compared to agreementsamong geographically distant members of dif-fering levels of development (APEC, U.S.-Jordan). But this is not always the case (MER-COSUR, SAARC) (OECD 2002b).
The range of special provisions found in var-ious regional trade agreements, but not in the
G L O B A L E C O N O M I C P R O S P E C T S 2 0 0 4
152
Table 4.5 Foreign-born workers meet skillshortages in rich countriesPercentage of foreign workers in selected sectors, 2001
Health Information professions
Education technology (except nurses)
Austria 3.0 28.3 6.3Belgium 3.3 6.0 4.0France 2.8 4.2 1.7Germany 2.8 5.7 4.4Italy 0.3 0.4 1.0Netherlands 1.6 2.8 1.4Norway 4.3 4.3 5.7Switzerland 13.0 19.3 16.5United Kingdom 5.9 6.4 7.8United States
(foreign-born) 8.3 18.3 13.2
Source: OECD (2002f).

general GATS provisions related to the tempo-rary movement of service suppliers, includes:
• Access to the labor market (EU, EFTA,EEA, Trans-Tasman Travel Arrangement)
• Full national treatment and market ac-cess for service suppliers (ANZCERTA)
• Commitments on visas (NAFTA; U.S.-Jordan, which extends the commitmentbeyond service providers)
• Special market access or facilitated ac-cess for service providers and others(APEC, Canada-Chile, CARICOM, Eu-rope Agreements, NAFTA)
• Separate chapters dealing with all tem-porary movement, including movementrelated to investment (Japan-Singapore)
or to trade in goods or investment(Group of Three)
• Specific reference to key personnel in re-lation to investment (EU-Mexico, FTAA)
• Extension of WTO treatment to non-WTO members (AFTA); and nondiscrim-inatory conditions for workers, extend-ing beyond service suppliers (Euro-Med)(OECD 2002b).
To assess the degree of liberalization offeredin a regional trade agreement, provisions re-lated to labor mobility should be considered inconjunction with provisions in the same agree-ments related to supply of services. Generally,the right to labor mobility does not automati-cally entail the right to practice a certain pro-
L A B O R M O B I L I T Y A N D T H E W T O : L I B E R A L I Z I N G T E M P O R A R Y M O V E M E N T
153
Australia has established a number of business-sponsored temporary entry programs, supported
by business service centers for employers seekingskilled foreign workers. Canada initiated a pilot pro-gram related to software development workers underwhich Human Resources Development Canada pre-identified a general need within the labor market forsuch workers. This enabled suitably qualified appli-cants with a job offer from a Canadian employerand any necessary visa (depending upon country oforigin) to be automatically validated (that is, notsubjected to labor market needs tests). Under a pilotproject, spouses of “highly skilled foreign workers”who are admitted to Canada for at least six monthsalso are permitted employment authorizations with-out being subjected to labor market testing.
France published a decree in 1998 permittingcompanies to hire foreign workers skilled in com-puter science if the company can demonstrate its in-ability to fill the post with a local candidate. Ger-many offered 20,000 employment permits (“greencards”) for up to five years to computer and infor-mation technology specialists recruited outside theEuropean Union. By August 2000, 13,000 greencards had been issued.
Box 4.3 Recent initiatives to facilitate temporarymovement of highly skilled workers
Japan announced a plan in November 2000 torecruit 30,000 skilled IT engineers and researchersfrom overseas by 2005. In the United Kingdom high-volume nonimmigrant visa employers with a proventrack record receive streamlined and fast-tracked visaapproval. Simplified fast-track procedures are nowapplied for issuing work permits for certain occupa-tions, and the list of occupations susceptible to laborshortages has been extended. The maximum lengthof a work permit also has been extended from fourto five years. The United States raised the annualquota of H-1B visas for professional and skilledworkers by nearly 70 percent in 2000, providingtemporary admission for 195,000 people over thenext three fiscal years. The 7 percent ceiling on theproportion of visas going to nationals of any givencountry also was dropped. Faced with adverse cy-clical developments in its labor market, the UnitedStates recently set the annual quota of H-1B visas at65,000, the level set prior to the dot com boom ofthe late 1990s.
Source: OECD (2001b, 2002f).
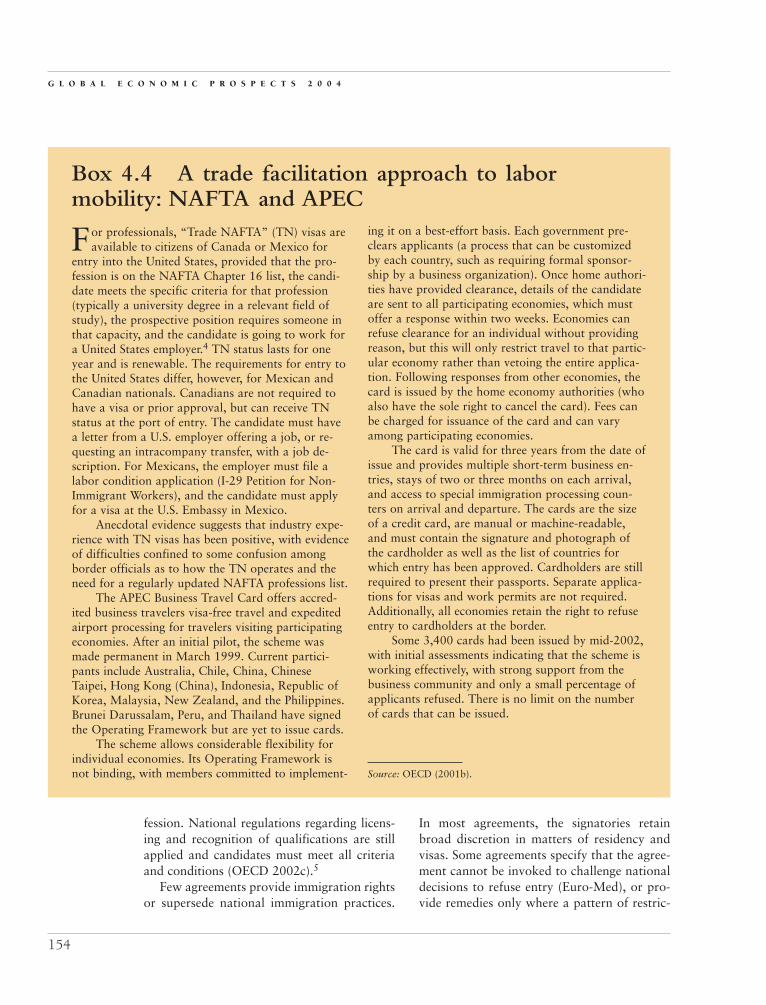
fession. National regulations regarding licens-ing and recognition of qualifications are stillapplied and candidates must meet all criteriaand conditions (OECD 2002c).5
Few agreements provide immigration rightsor supersede national immigration practices.
In most agreements, the signatories retainbroad discretion in matters of residency andvisas. Some agreements specify that the agree-ment cannot be invoked to challenge nationaldecisions to refuse entry (Euro-Med), or pro-vide remedies only where a pattern of restric-
G L O B A L E C O N O M I C P R O S P E C T S 2 0 0 4
154
For professionals, “Trade NAFTA” (TN) visas areavailable to citizens of Canada or Mexico for
entry into the United States, provided that the pro-fession is on the NAFTA Chapter 16 list, the candi-date meets the specific criteria for that profession(typically a university degree in a relevant field ofstudy), the prospective position requires someone inthat capacity, and the candidate is going to work fora United States employer.4 TN status lasts for oneyear and is renewable. The requirements for entry tothe United States differ, however, for Mexican andCanadian nationals. Canadians are not required tohave a visa or prior approval, but can receive TNstatus at the port of entry. The candidate must havea letter from a U.S. employer offering a job, or re-questing an intracompany transfer, with a job de-scription. For Mexicans, the employer must file alabor condition application (I-29 Petition for Non-Immigrant Workers), and the candidate must applyfor a visa at the U.S. Embassy in Mexico.
Anecdotal evidence suggests that industry expe-rience with TN visas has been positive, with evidenceof difficulties confined to some confusion amongborder officials as to how the TN operates and theneed for a regularly updated NAFTA professions list.
The APEC Business Travel Card offers accred-ited business travelers visa-free travel and expeditedairport processing for travelers visiting participatingeconomies. After an initial pilot, the scheme wasmade permanent in March 1999. Current partici-pants include Australia, Chile, China, ChineseTaipei, Hong Kong (China), Indonesia, Republic ofKorea, Malaysia, New Zealand, and the Philippines.Brunei Darussalam, Peru, and Thailand have signedthe Operating Framework but are yet to issue cards.
The scheme allows considerable flexibility forindividual economies. Its Operating Framework isnot binding, with members committed to implement-
Box 4.4 A trade facilitation approach to labormobility: NAFTA and APEC
ing it on a best-effort basis. Each government pre-clears applicants (a process that can be customizedby each country, such as requiring formal sponsor-ship by a business organization). Once home authori-ties have provided clearance, details of the candidateare sent to all participating economies, which mustoffer a response within two weeks. Economies canrefuse clearance for an individual without providingreason, but this will only restrict travel to that partic-ular economy rather than vetoing the entire applica-tion. Following responses from other economies, thecard is issued by the home economy authorities (whoalso have the sole right to cancel the card). Fees canbe charged for issuance of the card and can varyamong participating economies.
The card is valid for three years from the date ofissue and provides multiple short-term business en-tries, stays of two or three months on each arrival,and access to special immigration processing coun-ters on arrival and departure. The cards are the sizeof a credit card, are manual or machine-readable,and must contain the signature and photograph ofthe cardholder as well as the list of countries forwhich entry has been approved. Cardholders are stillrequired to present their passports. Separate applica-tions for visas and work permits are not required.Additionally, all economies retain the right to refuseentry to cardholders at the border.
Some 3,400 cards had been issued by mid-2002,with initial assessments indicating that the scheme isworking effectively, with strong support from thebusiness community and only a small percentage ofapplicants refused. There is no limit on the numberof cards that can be issued.
Source: OECD (2001b).

tive practice can be proved (Canada-Chile,NAFTA) (OECD 2002c).
Overall, progress in facilitating movementof less-skilled temporary foreign workers hasnot been extensive at the regional level. Indeed,regional trade agreements tend to replicate thetwo key biases found in GATS favoring highlyskilled (mostly professional) workers and theclose links between investment and the special-ized skills such investments require.
Additionally, bilateral foreign worker pro-grams, which have been designed to fill bothskilled and unskilled labor shortages, haveexisted in a number of countries for sometime. Such agreements often cover seasonalworkers in agriculture and tourism; projectworkers in construction; and various otheremployment-specific workers.
Understanding the impact oftemporary foreign workers
What are the determinants of migration?Economic models of migration tend to focuson the economic incentives facing migrants. In the absence of legal restrictions on immi-gration, cross-border labor mobility is oftenassumed to depend on the size of the gap inlabor and income that existed between in-dustrialized and developing countries (wages,working conditions, social security arrange-ments), and on the extent of information onthat gap available to potential migrants. Mi-gration would increase when the gap widenedor when more information on the gap becameavailable. Accordingly, it is not rare to see mi-gration described in terms of a pent-up flood:if the tap is opened a little bit, more immi-grants will come in; if it is closed, fewer willcome. Yet there are strong reasons, rooted inobserved trends in international migration, tobelieve that such a characterization is not fullyaccurate.
Labor mobility tends to be more complexthan either trade or capital mobility. Even verylarge differences in economic returns (mea-sured by wages) are not sufficient to induce
migration in most people. Demographic, edu-cational, and labor market conditions in boththe source and destination countries affect mi-gration decisions, as well as laws and policiesin both countries, information and informa-tion flows, chain migration effects (amongfamily members or those from the same originarea), transport and transaction costs, capitalconstraints (which may influence potentialmigrants’ ability or willingness to incur thesecosts), and “exogenous” factors such as civilunrest and climate. There may well be sub-stantial “disutility” costs associated with relo-cation from one’s social-cultural-linguisticcontext into an alien one. These costs can infact be among the most important factors in cross-border migration. The fact that theworld’s poorest countries supply a very smallshare of internationally mobile workers lendscredence to the oft-observed notion that bind-ing poverty constrains out-migration.
Moreover, migration decisions often are de-picted as essentially on-off and unidirectionalin nature when in practice people migrate fora host of economic and non-economic rea-sons. They initially may intend to stay tem-porarily and then return or move on to a thirdcountry, or they may intend to settle. Global-ization increases the number and complexityof these flows. For this reason, some analystsprefer to talk about migration and migrantsrather than immigration and immigrants(Home Office 2001).
Economic analysis of the temporary move-ment of foreign workers straddles the twoworlds of trade and migration. This is in lightof significant differences in the nature and skillprofile of worker categories concerned and bythe sharply differing lengths of time such work-ers can spend in foreign labor markets. Thus abusiness visitor going abroad to assess futureopportunities or to conclude contract negotia-tions may stay only a few days. Such a transac-tion is largely akin to cross-border trade in ser-vices (so-called Mode 1 trade under GATS) anddiffers little from goods trade to the extent thatit does not involve lasting factor movement.Not so for revolving teams of contract-based
L A B O R M O B I L I T Y A N D T H E W T O : L I B E R A L I Z I N G T E M P O R A R Y M O V E M E N T
155

workers in construction services or for intra-company transferees, who may be deployedabroad for several years (and yet may consti-tute a transaction for the purposes of theGATS). In the latter cases, such “trade” in ser-vices has more in common with the economicsof migration, as migrating workers reduce thesupply of labor in the sending country whileadding to it in receiving countries. Further-more, the temporary movement of labor isoften tied to longer-term flows of capital (in theform of foreign direct investment).
The essence of international trade lies insecuring the gains from cross-country differ-ences in costs, prices, endowments, or tastes.The larger such differences, the greater the po-tential gains from removing obstacles to suchtrade. The disparity between the abundance oflabor in developing countries and its scarcityin the developed world suggests that signifi-cant pro-development returns—potentiallygreater than those stemming from the full lib-eralization of trade in goods—could be had ifmedium- and less-skilled workers in develop-ing countries were allowed to provide theirservices temporarily in developed countries.
What are the gains from temporary movement?Although labor remains far less mobile thangoods and capital, the increasing diversity ofmigrants’ nationalities and the migrationchannels used, as well as the growing share oftemporary and skilled workers in total migra-tion flows, does indicate a growing promi-nence for migration in the broader context ofeconomic globalization.6 Links between labormobility and the liberalization of trade and in-vestment have gained in visibility, as moderntrade agreements have proliferated and broad-ened at both the regional and multilaterallevels. Such developments have sparked an in-terest within the research community in mea-suring the potential effects of liberalizinglabor flows.
Several recent studies have drawn attentionto the potential benefits arising from a pro-
gressive relaxation of barriers to labor mobil-ity (table 4.6). Winters (2003a) suggested thatif developed countries were to raise to 3 per-cent of their labor force their quotas on the in-ward movements of temporary workers fromdeveloping countries, they would realize anoverall gain of $150 billion each year. Hiswork concludes that the gains from such lib-eralization would be shared equally by devel-oped and developing countries. Most impor-tant, from a development perspective, thesefindings suggest that the largest benefits (toboth sending and receiving countries) wouldcome from the movement of lower-skilledworkers, as those workers are spread moreevenly over the economy, benefiting more sec-tors, than highly skilled ones (OECD 2002a).
Winters and Walmsley (2002) recognizethat adjusting wage levels in response to com-petition from low-skilled developing countryworkers could entail high social costs. Suchfindings underscore the long-term importanceof enhancing the educational levels and humancapital of lower-skilled individuals to ensurethat fewer developed country nationals arecompeting directly with unskilled workersfrom poorer countries. To manage the complexpolitical economy that TMNP liberalizationcould entail and to minimize adverse (or exces-sively concentrated) distributional effects forvulnerable workers in receiving countries, theauthors suggest that the liberalization processshould be incremental, with the most sensitivesectors exempted. Affected workers may behelped through adjustment schemes similar tothe U.S. Trade Adjustment Assistance Act, theassistance provisions of NAFTA, Canada’sGeneral Adjustment Assistance Programme,and Australia’s Special Adjustment Assistance(Borjas 2000; Borjas, Freeman, and Katz 1997;OECD 2002a).
Because liberalization of merchandise tradehas reduced price differentials between devel-oped and developing countries to a ratio oftwo to one—whereas service prices and wagedifferentials continue to differ by a factor often or more—the gains from liberalizing cross-
G L O B A L E C O N O M I C P R O S P E C T S 2 0 0 4
156
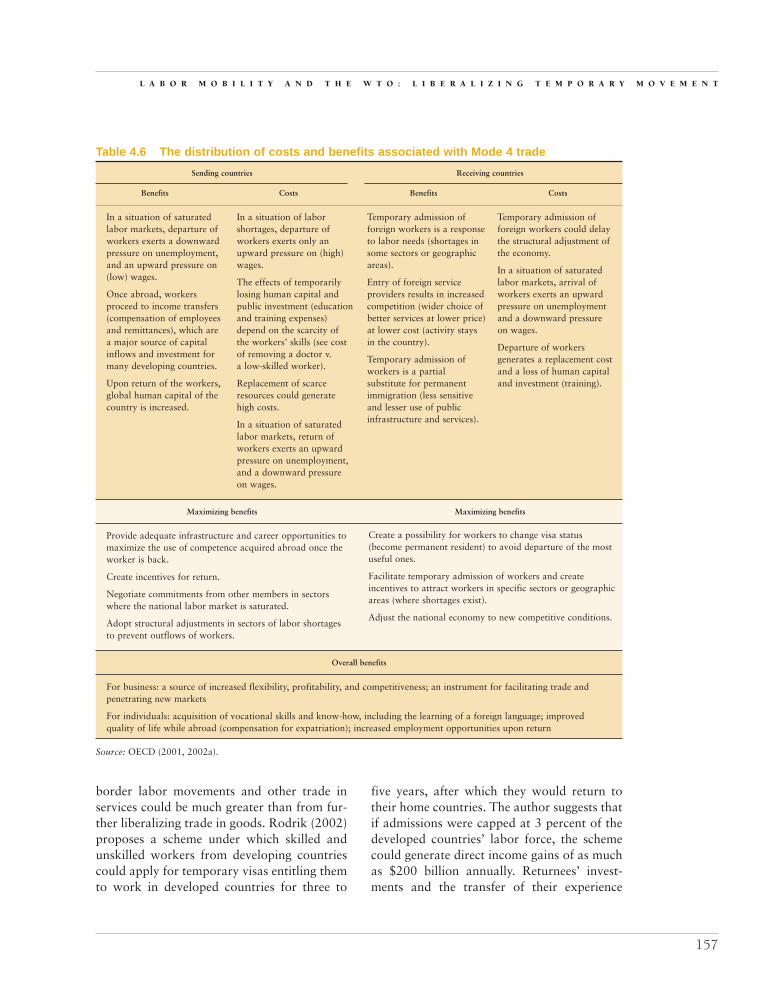
border labor movements and other trade inservices could be much greater than from fur-ther liberalizing trade in goods. Rodrik (2002)proposes a scheme under which skilled andunskilled workers from developing countriescould apply for temporary visas entitling themto work in developed countries for three to
five years, after which they would return totheir home countries. The author suggests thatif admissions were capped at 3 percent of thedeveloped countries’ labor force, the schemecould generate direct income gains of as muchas $200 billion annually. Returnees’ invest-ments and the transfer of their experience
L A B O R M O B I L I T Y A N D T H E W T O : L I B E R A L I Z I N G T E M P O R A R Y M O V E M E N T
157
Overall benefits
Source: OECD (2001, 2002a).
In a situation of saturatedlabor markets, departure ofworkers exerts a downwardpressure on unemployment,and an upward pressure on(low) wages.
Once abroad, workersproceed to income transfers(compensation of employeesand remittances), which are a major source of capitalinflows and investment formany developing countries.
Upon return of the workers,global human capital of thecountry is increased.
Provide adequate infrastructure and career opportunities tomaximize the use of competence acquired abroad once theworker is back.
Create incentives for return.
Negotiate commitments from other members in sectorswhere the national labor market is saturated.
Adopt structural adjustments in sectors of labor shortages to prevent outflows of workers.
For business: a source of increased flexibility, profitability, and competitiveness; an instrument for facilitating trade andpenetrating new markets
For individuals: acquisition of vocational skills and know-how, including the learning of a foreign language; improved quality of life while abroad (compensation for expatriation); increased employment opportunities upon return
Create a possibility for workers to change visa status(become permanent resident) to avoid departure of the mostuseful ones.
Facilitate temporary admission of workers and createincentives to attract workers in specific sectors or geographicareas (where shortages exist).
Adjust the national economy to new competitive conditions.
In a situation of laborshortages, departure ofworkers exerts only anupward pressure on (high)wages.
The effects of temporarilylosing human capital andpublic investment (educationand training expenses)depend on the scarcity of the workers’ skills (see costof removing a doctor v. a low-skilled worker).
Replacement of scarceresources could generate high costs.
In a situation of saturatedlabor markets, return ofworkers exerts an upwardpressure on unemployment,and a downward pressure on wages.
Temporary admission offoreign workers is a responseto labor needs (shortages insome sectors or geographicareas).
Entry of foreign serviceproviders results in increasedcompetition (wider choice ofbetter services at lower price)at lower cost (activity staysin the country).
Temporary admission ofworkers is a partialsubstitute for permanentimmigration (less sensitiveand lesser use of publicinfrastructure and services).
Temporary admission offoreign workers could delaythe structural adjustment ofthe economy.
In a situation of saturatedlabor markets, arrival ofworkers exerts an upwardpressure on unemploymentand a downward pressure on wages.
Departure of workersgenerates a replacement costand a loss of human capitaland investment (training).
Maximizing benefits Maximizing benefits
Table 4.6 The distribution of costs and benefits associated with Mode 4 trade
Sending countries Receiving countries
Benefits Costs Benefits Costs

would produce further gains for sending coun-tries (OECD 2002d).
The source of the gains identified in thestudies discussed above is a narrowing ofwage differentials between rich and poorcountries—a politically sensitive subject. Inthe regulated labor markets of many WTOmember countries, domestic legislation limitsor opposes downward pressure on wages.Moreover, many recipient (developed) coun-tries require equality of treatment for tempo-rary workers (equal wages and social pro-tection parity requirements) with nationals atcomparable levels of skill and experience(OECD 2002d). For these and other reasons,most models assume no more than a halvingof differentials. To the extent that nationalprovisions sustain domestic wages, the overallgains of Mode 4 liberalization may be lower,but in such cases adjustment costs will be con-comitantly lower as well.
Other factors that may affect the overallgains of greater mobility of temporary laborare the cost of creating or scaling up tempo-rary visa schemes7 and the possibility thattemporary workers might join the ranks of theunemployed in the developed countries. Over-shadowing such technical factors, however,are the doubts and fears arising from the re-cent rise in legal and illegal migration in theOECD area. The bursting of the dot-com bub-ble of the late 1990s and the security implica-tions of the ongoing war against terrorismhave compounded those fears, making signif-icant liberalization of temporary movementless probable than was believed possible a fewyears ago.
And the costs?Temporary movement may help address sev-eral concerns often associated with the politi-cal debate over more permanent migration inboth developing and developed countries (seetable 4.6). One such concern revolves aroundthe possible impact on developing countries of a “brain drain,” and its longer-term conse-quences for capital accumulation and growthin the developing world. Indeed, if the pattern
of trade growth reduces the demand for skilledlabor in skill-scarce developing countries whileincreasing the demand for skilled labor in skill-abundant developed countries, the result couldbe a widening of the gap in labor income ofskilled workers between the North and theSouth while narrowing the gap in labor incomeof unskilled workers. Ghose (2002) concludesthat “in a world without restrictions on labormobility, increased trade worsens the braindrain from developing countries but has uncer-tain effects on overall migration. Trade andflows of skilled labor are complements whiletrade and flows of unskilled labor are substi-tutes.” Under such circumstances, measures toincrease the mobility of skilled workers can re-inforce the initial comparative advantage of thetrading countries, so that skill-abundant coun-tries become ever more skill abundant, whilelabor-abundant countries become ever more(low-skill) labor abundant. Trade expansioncombined with the unrestricted mobility ofskilled workers could conceivably put the accu-mulation of human capital beyond the reach ofmany developing countries.8
Much of the existing literature on braindrain focuses on the short-term costs in send-ing countries. Indeed, such costs can be sub-stantial—higher education is subsidized heav-ily in developing countries and skilled migrantscarry away scarce human capital built throughpublic investments. But some of the purporteddisadvantages associated with the migration ofskilled workers from developing to developedcountries can be partially mitigated if themovement is temporary. Temporary migrantsmay generate sizeable remittance flows which,along with the accumulation and subsequentrepatriation of embodied knowledge andglobal experience when workers return, couldsubstantially increase the benefits associatedwith greater temporary movement. Key toachieving this outcome are changes in the de-sign of both trade and immigration policies inreceiving countries and stepped-up efforts onthe part of sending countries to increase returnmigration of skilled workers while pursuingenhanced temporary movement of lower-
G L O B A L E C O N O M I C P R O S P E C T S 2 0 0 4
158

skilled workers in developed country markets.Doing so would help to ensure that the growthof trade does not exacerbate developing coun-try skill shortages.
For sending countries, TMNP has risksand rewards9
The impact of the temporary movement ofworkers on the sending country can be con-sidered at three levels. First, there are eco-nomic effects of removing the worker from the labor market (departure). Next, during thestay abroad, the worker will maintain con-tacts with the home country, remitting fundsto family or making direct investments. Fi-nally, there is the economic impact of the mi-grant’s return to the home country. Each ofthese effects is considered in turn.
Departure: Temporary migration and domes-tic labor markets. A genuine risk associatedwith sending workers abroad is that scarce re-sources, such as human capital, will be lost—often at a substantial public cost in educationand training investments.10 Workers who goabroad are generally young, highly motivated,well educated, and not easy to replace, espe-cially in developing countries, where wagesare lower, career paths are limited, and work-ing conditions less satisfactory than abroad(PSI/EI 1999, OECD 2002d). An importantcorollary of the “brain drain” is indeed therisk that developing countries will indirectlysubsidize industrial country R&D by export-ing the human capital embedded in locallytrained workers. Indeed, the cost of providinguniversity education to professionals whothen move to wealthier countries for increasedopportunities may represent a net resourceloss for developing nations. Tax policy can beused to recover some of the loss—for example,by requiring students who choose to leave thecountry to repay their education expenses be-fore departing.
Further, because highly skilled workersearn more, consume more, pay more taxes,and are more productive than the unskilled,their departure, even if temporary, can have a
significant impact on a developing country’seconomy and impede its development (WTO1998, Devan and Tewari 2001). Moreover, be-cause skilled migrants are often from rela-tively affluent households that do not requireregular income support, they may be lesslikely than unskilled migrants to send back re-mittances (Ghose 2002). As long as the move-ment of such workers remains temporary,however, it is certainly preferable to the morelasting brain drain caused by permanent emi-gration (WTO 1998, OECD 2002d).
Temporary movement of workers can helpto ease the strain on domestic labor markets—work abroad can be an escape route from un-employment, and can reduce a country’s over-all unemployment rate (Werner 1996). This is most often the case for unskilled workers,although in some countries the number ofpeople trained for certain occupations exceedsthe absorptive capacity or needs of the localmarket—as is the case for Indian engineers,for example.11 Whether out-migration sus-tains wages in the sending country (Ghosh1998) or exacerbates an existing skills short-age (Werner 1996), its effect will be less if themigration is temporary than if it were perma-nent—thereby reducing not only the potentialrisk but also the potential reward of tempo-rary mobility as a policy tool (OECD 2002d).
Receiving countries can play a part in pre-venting particularly harmful shortages ofskilled personnel in developing countries. Forexample, the British government has publisheda code of conduct for trusts under the Na-tional Health Service (NHS) that prohibits the recruitment of nurses from countries wherethey are in short supply, such as in South Africaor the West Indies. The code is not legallybinding (OECD 2002d).
Through appropriate policies and incen-tives, sending countries can encourage skilledmigrants to return (box 4.5). To date, incen-tive policies have a mixed record, often failingto address the real reasons behind workers’decisions to settle abroad permanently—ac-culturation, better career opportunities, andaccess to and integration within personal and
L A B O R M O B I L I T Y A N D T H E W T O : L I B E R A L I Z I N G T E M P O R A R Y M O V E M E N T
159

professional networks. Chinese Taipei ad-dressed those reasons by investing heavily inresearch and education. More than half of theenterprises in Chinese Taipei’s Hsinchu Sci-ence Park were created by engineers who had
worked for a time in California’s Silicon Val-ley. Today the park accounts for nearly 10 per-cent of Chinese Taipei’s gross national product(Devan and Tewari 2001). The Hsinchu ex-ample illustrates the positive economic impact
G L O B A L E C O N O M I C P R O S P E C T S 2 0 0 4
160
Up to one-third of R&D professionals from thedeveloping world reside in the OECD area.
Foreign studies constitute a major channel for migra-tion, especially in science and technology—79 per-cent of 1990–91 PhD graduates in science and tech-nology from India and 88 percent of those fromChina were still working in the United States in1995, compared to only 11 percent of Koreans and15 percent of Japanese. The migration of skills canbe slowed through the return of expatriates to theircountry of origin. Returnees contribute to economicdevelopment through their valuable managementexperience, entrepreneurial skills, and access toglobal networks. The Ministry of Science and Tech-nology in China, for example, estimates that most of China’s Internet-based ventures were started byreturning overseas students.
Taiwan (China), the Republic of Korea, andSingapore have been successful in fostering returnmigration by opening up their economies and em-ploying policies to foster domestic investments in in-novation and R&D. Korea has focused on upgradingits research institutions, such as the Korea Institutefor Science and Technology, as a way of attractingreturnees (UNDP 2001). The government of Taiwan(China) likewise played an important role in drawingback American-trained scientists and engineers, whohave subsequently helped to develop the country’sinformation technology sector. A National YouthCommission has been established there as a clear-inghouse for potential employers and returningscholars seeking employment, and an airfare subsidyis granted to the graduating student, spouse, and upto two children, if they decide to return to Taiwan(China). The Commission also has established chan-nels of communication with overseas scholars tosimplify recruitment when the need arises (CulturalDivision of Taipei 1998).
Opportunities for research, innovation, andentrepreneurship at home are needed to stimulate
Box 4.5 Initiatives to encourage return migrationreturns of migrants and capital. Developing countriessuch as India, for example, have the capacity toinvest in R&D and human infrastructure, and thusare more able to draw migrants back. China recentlylaunched a project to develop 100 universities intoworld-class institutions that not only provide highereducation, but also academic employment andresearch opportunities. An alternative for less-developed countries is to create a good communica-tion network among expatriates by linking them to counterparts in their county of origin. Scientificdiaspora and other expatriate knowledge networkscan help sending countries reap benefits and know-how from emigrants overseas. Forty-one expatriateknowledge networks have been identified around theworld. The FORS Foundation, for example, seeks toinvolve Romanian scientists in Romania and abroadin contributing to economic reform in Romania.Grassroots initiatives in South Africa and LatinAmerica have been developed to connect researchersabroad to networks in their home countries.
The worldwide network of Indian professionalshas been investing in skill development at home toraise endowments and bolster the finances of some of India’s institutions of higher education. The Indiangovernment also has contributed to the emergence ofprivate networks among Indian professionals abroadthrough legislative and tax rules that encourage re-mittances and investment. The Return of QualifiedAfrican Nationals Program, conducted by the Inter-national Organization for Migration, has attemptedto encourage the return of qualified nationals andhelped them to reintegrate. Even Switzerland haspromoted networking and contact among Swiss sci-entists in the United States through Swiss-List.com,an online network. France has a similar network.
Source: World Bank staff.
that workers can have upon their return froma temporary stay abroad (OECD 2002d).
Staying in touch: Temporary migration as asource of increased financial inflows. Becausebanning temporary movement by workers isneither feasible nor desirable, sending govern-ments have an interest in optimizing the bene-fits of such movement, for example, by offer-ing incentives for the repatriation of foreignearnings (OECD 2002d).
The economic impact of remittances and as-sociated labor receipts depends significantly onthe use to which the funds are put in the send-ing country. They may be consumed, invested,or saved. Moreover, if they are consumed, theimpact will differ again depending on the na-ture (consumer or capital goods) and origin(local or imported) of the goods consumed(Werner 1996). An ILO study on Indonesiashows that income from temporary workabroad was applied by workers and their fam-ilies to pay off debts, sustain consumption,raise savings, and finance investments, in thatorder (ILO 1996). In India, expatriate engi-neers working either permanently or temporar-ily in Silicon Valley have accounted for most ofthe investments made in the cities of Bangaloreand Hyderabad, which have become new polesof growth for the country, establishing India asan export powerhouse in software design andIT-outsourcing industries (Devan and Tewari2001, OECD 2002d). The current Mexicanadministration has reshaped the government’sattitude toward migrants to the U.S., includinggreater advocacy on their behalf with the U.S.government. The Ecuadorian government hasa program designed to increase the earnings ofits citizens working abroad, whose remittancesare the country’s largest source of foreign ex-change after petroleum.
An important feature of TMNP is the ob-served tendency for workers to retain closerlinks with their home country if the length oftheir stay abroad is relatively short and pre-determined. Remittances seem to be greatestwhen a worker expects to return at a fixeddate (Galor and Stark 1991). Temporary mi-
gration may thus do more to encourage remit-tances than permanent migration. Many visaregimes require proof of a fixed-term contract(pre-established and limited duration); itcould be argued that this type of regulationmay therefore have benefits for sending andreceiving countries alike (OECD 2002d).
Returning: Returning migrants as a source ofincreased human capital. Where labor mobil-ity is only temporary, the net benefits of de-parture may be partially offset by the effectson return. Yet the balance need not be zero, asthe country’s stock of human capital will havegrown between the time of departure and thetime of return (OECD 2002d).
The additional skills (languages, experi-ence, know-how) acquired by temporaryworkers can be put to work upon their return,thereby contributing to economic growth anddevelopment. Indeed, as endogenous growththeories suggest, increases in human capitalcan yield significant positive externalities anddurably affect the long-term growth prospectsof developing countries. In particular, the ac-cumulation of human capital can be instru-mental in helping developing countries tomove into more skill-intensive production. Yetjust as with firms, taking advantage of suchcapital requires a suitable enabling environ-ment. In particular, the home country must beable to provide the infrastructure and careeropportunities necessary to meet the aspirationsworkers may have developed during their stayabroad (OECD 2002d).
Temporary movement may be an impor-tant vector for enhancing two-way trade andinvestment flows between sending and receiv-ing countries. The Indian experience confirmssuch linkages, for while India may have ex-ported a number of its skilled workers in re-cent years, the flow has not been one-way; thecountry saw its IT exports increase from $150million in 1990 to $4 billion in 2000. The re-cent surge in FDI directed toward India’s high-tech centers is similarly related to the presenceabroad of a large group of scientists, engi-neers, and entrepreneurs (Nielson 2002).
L A B O R M O B I L I T Y A N D T H E W T O : L I B E R A L I Z I N G T E M P O R A R Y M O V E M E N T
161

For receiving countries, temporarymovement is politically sensitive butusually beneficialWhile the temporary movement of workers isnot likely to unduly disrupt the sending coun-try’s labor market, the potential effects of suchmobility on segments of the receiving country’slabor market may at times be more significant.There, the concern arises that mobile foreignworkers may be in direct competition with na-tionals of the host country working perma-nently in the same occupations. Even if the mi-grant’s stay is temporary, the growing numberof foreign workers and the continuous influxof workers over different time horizons undercontract-based flows could increase competi-tion in the labor market (OECD 2002d).
From this angle it is easy to see why immi-gration can be controversial in receiving coun-tries. There is evidence that unskilled migra-tion reduces the relative wages of unskilledworkers in industrial countries (Borjas, Free-man, and Katz 1997). An inflow of unskilledworkers from the South will benefit highlyskilled workers in the North. Their jobs arenot threatened by the latter, and the presenceof immigrants will lower prices for manygoods and services consumed by the skilledworkers. But the same inflow will reduce realwages of unskilled northern workers (WorldBank 2001), and over time contribute to a de-terioration in income distribution. Against thislatter trend, however, demographic and educa-tional trends in affluent countries will combinein the coming decades to raise the relativewages of unskilled labor in the absence of mi-gration (see box 4.1). As these demographic ef-fects will likely be large, scope may thereforeexist for increased flows of unskilled labor inan environment of relative wage stability.
Despite the acknowledged benefits of tem-porary migration, the norm in receiving coun-tries is to continue to impede the movement of low-skilled or unskilled workers throughvarious restrictions. Such restrictions can con-tribute to the recent sharp rise observed in un-documented low-skilled workers throughoutthe OECD area. The stricter border controls
enacted to contain such flows may inhibit theability of undocumented workers to maintaincloser two-way links with sending countries(in part because of a reluctance to incur thehigh costs and attendant risk of illegal reentry)through formal temporary migration channels.As a result, undocumented workers becomeparticularly vulnerable to various forms ofwork-related abuse and often become caughtin a poverty trap (Papademetriou 2001).
Impact on the receiving country labor market.Migrants, especially workers involved in tem-porary movement, tend to concentrate in sec-tors and regions characterized by labor short-ages at both the high and low end of the skillsspectrum. It may thus be less likely for them tocompete directly with native workers than iscommonly assumed.12 In the majority of re-ceiving countries, temporary foreign workersare found mainly in the following five sectors:(a) health (especially doctors and nurses; doc-tors are more likely to practice in remote/ruralareas); (b) education, particularly higher edu-cation (that is, academic and research staff);(c) information technology; (d) catering; and(e) agricultural labor.
It is important, however, to understandwhy migrants (including temporary migrants)are concentrated in these sectors. In healthand education, wages in most countries are setby policy or collective bargaining, and rela-tively clear procedures for recognizing foreigncredentials are in place. Migration in thesesectors benefits the public sector—and hencethe general public—as workers become tax-payers and consumers of public services. In ITand other private sector professions prone to labor shortages, wages are more likelymarket-determined. But supply is constrainedby lags in training home-country specialists. Inthe absence of migration, firms would bid upwages and after a lag, supply would respond.But with flexible work permit systems, firmscan import migrants, especially on temporarycontracts. In low-paying sectors such as ca-tering and domestic services, unskilled localworkers are typically unwilling or unable to
G L O B A L E C O N O M I C P R O S P E C T S 2 0 0 4
162

fill the available jobs. The effect of temporaryforeign workers in these sectors again is tobenefit firms, but it is not likely that workersin receiving countries will be significantly dis-advantaged: if migrants do not fill these jobs,they simply tend to go unfilled or are not cre-ated in the first place (Home Office 2001).
In all three cases, the receiving countrytends to benefit overall from filling labor mar-ket gaps through migration/temporary move-ment. The result of such mobility is likely toinclude reduced inflationary pressures and anincrease in the overall efficiency of firms.Expansion of such temporary schemes hasthus become a preferred means of respondingto labor shortages in receiving countries,whether these are seasonal, cyclical, regional,sectoral, or skills-related (Werner 1996). Froman economic viewpoint, the ability to bring inforeign labor is essential, since human capitallimitations can depress investment and create
significant income transfers to the most highlyqualified workers at the expense of the rest ofthe workforce and of the country’s consumers(Hodge 1999, OECD 2002d). However, theimpact of temporary workers on the work-force in receiving countries is the subject ofsignificant debate, in particular with regard towages and working conditions (box 4.6).
Temporary foreign workers may also bringmore direct benefits. Intracompany transfereesconsume the bulk of their income in the hostcountry (housing, food, clothing) and makeuse of that country’s services (banks, trans-portation, communications). Their incometherefore generates wealth to the host country,which would not be the case if the serviceswere provided remotely across borders (underonline outsourcing, for example), or if con-sumers required such services abroad. Thepresence of the temporary foreign worker’semployer in the host country is itself a source
L A B O R M O B I L I T Y A N D T H E W T O : L I B E R A L I Z I N G T E M P O R A R Y M O V E M E N T
163
The basic question is whether temporary workersshould receive the same wages and conditions
as nationals employed in the same industry. In manycountries (particularly OECD countries), this is alegal obligation—and 50 WTO members have in-cluded this stipulation in their Mode 4 commitments.But some developing-country advocates contend that such requirements undermine the comparativeadvantage upon which Mode 4 trade should bebased—the relatively inexpensive labor of sendingcountries.
Such arguments are met with fierce resistancefrom unions in developed countries, which fear thatcheaper temporary foreign workers could underminethe hard-won gains of workers in developed coun-tries. To prevent foreign “strike breakers,” 22 WTOmembers also have reserved the right to suspendMode 4 commitments in the event of labor-manage-ment disputes. Even where foreign workers may notactually be paid less, their presence may act as animpediment to reform. For example, some claim thatthe temporary employment of foreign nurses hasallowed governments to ignore the root causes of
Box 4.6 Wages and conditionstheir nursing shortages—the need for better wagesand working conditions (OECD 2002f).
Proponents of wage parity argue that because atemporary foreign worker in an OECD country facesliving costs in that country, there is no justificationfor paying lower wages. Moreover, temporary for-eign workers, particularly women in domestic ser-vices and other lower-skilled activities, can be highlyvulnerable to exploitation if not fully subjected tolocal labor laws.
Equal treatment, however, does not always re-sult in equitable outcomes. In many countries, tem-porary workers are required to contribute to socialsecurity programs in the receiving country fromwhich they receive no, or minimal, benefits. Onealternative in this regard could be for social secur-ity charges from temporary migrant workers to bepaid into separate funds and reimbursed uponworkers’ return to their home country.
Source: Nielson (2002) and OECD (2001b).

of wealth (jobs preserved, intermediate con-sumption of goods and services, business taxes,and so on) (OECD 2002d).
In fact, by focusing on the physical mobil-ity of temporary movement of foreign workerscritics may miss a key point: A country cannotrestrain international competition in hopes ofpreserving the market share of domestic pro-ducers simply by blocking the entry of tempo-rary foreign workers. For example, India iswidely recognized for expertise in computerservices, thus explaining the heavy flow of In-dian computer specialists to more advancedcountries. It is likely that if those countrieswere to refuse temporary visas to these work-ers or introduce stricter limitations on theirissuance, the work could still be outsourced to India over electronic networks via Modes 1and 2 (Chadah 2000, OECD 2002d). Indeed,some developing countries point to outsourc-ing of work, including over the Internet, as
an alternative to sending qualified personnelabroad (box 4.7).
Temporary movement as a first step towardpermanent migration. Temporary movementcan be a first step to permanent residence,either legally (by changing visa categories) or illegally (overstaying). Overstaying is a riskwith all forms of temporary entry, includingfor tourists. Administered schemes for tempo-rary movement arguably could help discour-age employers from using undocumentedworkers by making available legal temporaryforeign workers for seasonal activities. Wheretemporary workers are permitted to apply forpermanent-resident status, their temporarystay may serve as a useful preselection of can-didates for future migration (OECD 2002a,Nielson 2002).
Available data show little evidence of large-scale transfer of workers from temporary to
G L O B A L E C O N O M I C P R O S P E C T S 2 0 0 4
164
Some WTO members, in particular developingcountries, have expressed concern that the growth
of trade in services via information and communica-tions technologies will become a substitute for tradevia temporary movement of service suppliers (Mode4). In some cases, services are now delivered over theInternet that previously required physical presence.This tends to be more common in knowledge-inten-sive fields of activity and can be attractive to compa-nies wishing to pay developing-country wages ratherthan local (developed country) wages, as is generallyrequired for workers temporarily relocated. Still, theInternet is not always a good substitute. Security andconfidentiality requirements may limit its use, and insome countries the infrastructure is not yet capableof fulfilling contracts remotely.
Trade in services over the Internet can offer ser-vice suppliers from developing countries the opportu-nity to participate in global trade, notwithstandingtheir lack of commercial presence in foreign markets.While some of this trade may be in knowledge-intensive areas, primarily benefiting those developing
Box 4.7 E-commerce and temporary movementcountries with a large pool of skilled labor, a rangeof lower skilled “back-office” services are nowtraded over the Internet—among them basic dataentry and customer call centers.
Technological developments may be changingthe nature of temporary movement, rather than re-moving the need for it, with increasing numbers ofemployees managing their international responsibili-ties through a combination of regular communica-tion link-ups and frequent, shorter business trips tothe local operations, referred to as “virtual assign-ments.” Replacing longer-term assignments withmore frequent shorter ones, in addition to virtualworking, helps companies manage the costs of inter-national responsibilities. ICT also may play a role inencouraging employees to accept longer-term assign-ments by reducing the sense of isolation from friends,family, and cultural context.
Source: OECD (2001b).

permanent status. The U.K. work permit sys-tem allows employees to apply for permanentsettlement after four years of continuous em-ployment, but in practice, a relatively smallproportion seem to settle permanently (in1998, 3,160 work permit holders settled in the United Kingdom against approximately70,000–80,000 work permits approved eachyear). Indeed, even where all, or most, barriershave been removed, floods of foreign workersgenerally have failed to materialize, as intra-EU labor flows show in the context of a singlelabor market (OECD 2001b) (box 4.8).
Security concerns. Any attempt to facilitateindividual mobility must confront today’s in-creased concerns about national security.While all countries ultimately share such con-cerns, they tend to pose a greater challenge forpolicy officials in major receiving countries.Brought into sharper focus since September11, 2001, security considerations are changingthe balance between the facilitation and en-forcement aspects of immigration controls,with measures to facilitate the entry of foreignworkers increasingly scrutinized to ensurethey do not become conduits for entry by ille-gal or undesirable individuals. There can be
little doubt that tightening immigration con-trols because of heightened concerns over na-tional security is likely to have a chilling effecton TMNP liberalization. Meaningful expan-sion of temporary worker programs requiresthat security clearance be quick and reliable.The challenge politically is to separate the se-curity arguments from labor market or serviceexport considerations, and to strike an accept-able balance between economic efficiency andnational security (Mattoo 2003).
It estimated that up to 250,000 information-technology professionals from India work inthe United States, some on temporary visas andothers on work permits. But with almost allvisa applications taking longer to process, In-dian technology companies are taking steps to adapt to the increasingly limiting conditions.For example, Infosys, a leading provider ofsoftware services, is ensuring that the bulk ofits outsourcing activities are undertaken on sitein India rather than in the United States orEurope. The spectacular recent growth of IToutsourcing in developing countries, whileminimizing the need for labor movement, isnonetheless proving controversial, with fears ofan exodus of white-collar jobs in service indus-tries. A case in point is the recent set of legisla-
L A B O R M O B I L I T Y A N D T H E W T O : L I B E R A L I Z I N G T E M P O R A R Y M O V E M E N T
165
The Treaty of Rome recognizes the principle offree movement for nationals of EU countries
wishing to reside or work within the area formed by the signatory states. More recently, measures have been taken to facilitate intra-European mobility.These include a directive on free movement of non-workers, students, and retired persons, and a seriesof directives on mutual recognition of skills and ac-cess to certain public service jobs previously reservedfor nationals.
Nevertheless, intra-European mobility remainsvery low, involving less than 0.2 percent of the totalpopulation of the Union, a level seven times lowerthan movements among the nine major census areasin the United States. The low mobility within Europe
Box 4.8 Boosting intra-EU labor mobilityis partly attributable to linguistic and cultural barri-ers, but it is also a result of structural rigidities in thelabor markets of individual member states.
In 2002, the European Commission launched an action plan for mobility and skills with a view tofacilitating geographic mobility in the period up to2005 by removing remaining administrative and legalbarriers, increasing the portability of supplementarypension rights of migrant workers, and improvingexisting regimes of skills recognition in the regulatedprofessions.
Source: OECD (2002f).

tive measures passed by the states of Connecti-cut, Maryland, New Jersey, and Washington,restricting outsourcing of state government ser-vices. Similar concerns, and calls for similarpolicy responses, have been voiced in Europe.
Besides restricting the movement of work-ers, delays in travel can harm the competitive-ness of firms. There is evidence that the com-petitiveness of subsidiaries of U.S. companiesestablished in China has been adversely af-fected as tightened security has hampered theability of U.S. companies to obtain visas forChinese nationals to conclude deals, under-take training, and even attend strategic semi-nars and meetings in the United States. Parentcompanies in the United States are complain-ing about lost contracts and the move of Chi-nese clients to European companies that canoffer faster and more predictable issuance ofvisas.
While recognizing the importance of bordersecurity in an environment of heightened risk,care must be taken that the granting of visasand work permits does not become a disguisedbarrier to trade. India’s minister for trade andcommerce recently termed the denial of visasand restrictions on the movement of naturalpersons as an indirect method by developednations of denying market access to developingnations. Care also must be taken to reconcilethe need for increased security at entry pointswith that of allowing commerce to flow asfreely as possible. This includes recourse to newtechnologies, notably biometrics, a system offingerprint and retinal recognition, and moretraditional methods such as permanent resi-dent cards.
Mode 4 and the WTO
As noted above, some types of temporaryforeign workers—service suppliers—are
covered under the WTO General Agreementon Trade in Services (GATS). Greater freedomfor the temporary movement of individual ser-vice suppliers is being negotiated under theGATS, as part of the multilateral negotiations
set in process following the WTO meetings inDoha in November 2002.
These discussions go by the label of “Mode4” negotiations, in reference to the classifi-cation of the modes of service delivery in theGATS agreement. Mode 1, or “cross-bordersupply,” is analogous to trade in goods; Mode2 is “consumption abroad” (for example,tourism or study abroad); Mode 3 is “commer-cial presence” (as in the supply of a servicethrough a subsidiary or branch in another coun-try); and Mode 4 is “temporary movement ofindividual service suppliers.”13 WTO memberscan elect to commit to providing market accessand/or national treatment for each mode ofsupply for any number of around 160 possibleservices sectors and sub-sectors.
Mode 4 is defined as the supply of a serviceby a service supplier of one WTO member,through presence of natural persons of a mem-ber in the territory of another member on atemporary basis. While there is some debateabout what exactly this means, Mode 4 ser-vice suppliers generally:
• Gain entry for a specific purpose (for ex-ample, to fulfill a service contract as self-employed or as an employee of a servicesupplier);
• Are confined to one sector (as opposedto workers who enter under general mi-gration or asylum programs who canmove among sectors);
• Are temporary (that is, they are neithermigrating on a permanent basis nor seek-ing entry to the labor market). “Tem-porary” is not defined under the GATS,but permanent migration is explicitly ex-cluded, and thus this issue is left to thediscretion of each country. In practice, the time frames set out in WTO members’commitments on Mode 4 range fromseveral weeks to up to three to five years,varying among countries, sectors, andprofessions. Thus, for example, Japan al-lows foreign business travelers to stay fora maximum of 90 days, but certain cate-
G L O B A L E C O N O M I C P R O S P E C T S 2 0 0 4
166

gories of intracorporate transferees canstay as long as five years.
• Are service suppliers. Being a servicesagreement, GATS Mode 4 only covers ser-vice suppliers—there are no parallel WTOrules covering movement of people relatedto agriculture or manufacturing.14
• Are service suppliers at all skill levels, al-though in practice WTO members’ com-mitments are limited to the higher skilled(see below) (Nielson 2002).
Measurement of Mode 4 trade suffers from poor data, tepid commitments, and a range of barriersThere are two ways to measure Mode 4 trade:by value or by number of service suppliers (seebox 4.9). Services trade statistics face a num-ber of conceptual and practical problems and, despite progress, reliable figures are someway off. Nonetheless, available estimates—andthey are very rough—suggest that, in terms ofthe monetary value of trade, Mode 4 is the
L A B O R M O B I L I T Y A N D T H E W T O : L I B E R A L I Z I N G T E M P O R A R Y M O V E M E N T
167
Value of trade: Balance-of-payments statisticsBalance-of-payments statistics capture some labor-related flows of relevance to the estimation of tradeunder Mode 4:
“Compensation of employees” (wages, salaries,and other compensation received by individualsworking abroad for less than one year). This mea-sures both overestimates (includes workers otherthan service providers) and underestimates (excludesbusiness visitors and individuals staying more than ayear abroad) trade under Mode 4.
“Workers’ remittances” (transfers from workerswho stay abroad for a year or longer). This measureoverestimates (covers all expatriates, regardless ofthe sector in which they work) and underestimates(only a residual income after expenditure and savingsin the host country, and many such remittances arenot effected through official channels) trade underMode 4.
Statistics on trade in services are available onlyfor some services sectors and traditionally have notbeen broken down by modes. Figures for Mode 4 are likely to be significantly underestimated.
The number of people: Migration and labor statisticsStatistics on the number of people moving underMode 4 are scarce and highly imprecise. Statistics areavailable for temporary foreign workers for severalcountries, but they are not an exact match to GATSMode 4. Main problems include:
• Business visitors may be excluded or hidden undertourist visas (a significant part of Mode 4 trade).
Box 4.9 Measuring Mode 4 is still imprecise• Migration statistics consider “temporary” to be 12
months or less; under the GATS it is undefined butin practice can be up to 6 years.
• Migration categories generally do not distinguishbetween service and non-service activities.
• It is not always possible to judge whether the ac-tivities covered by some visa categories are com-mercial and would qualify as the supply of a ser-vice under the GATS (for example, occupationaltrainees, professional exchange programs).
• Some visa categories include persons both consum-ing and supplying services (for example, exchangevisitors encompass exchange students and visitinglecturers).
Neither of these sources—value of trade andnumbers of people—capture the dynamic effects ofMode 4 and its essential role in facilitating tradeunder other modes (for example, Mode 3, commer-cial presence; Mode 1, cross-border supply).
Some national figures for entries under specificvisa programs may closely correspond with Mode 4(for example, temporary medical practitioner visas),but because of the above problems, no aggregatefigures are available for all entrants falling underMode 4 at the national level. Additionally, given theabsence of detailed temporary entry visa regimes inmany countries, aggregate global estimates of thenumber of people moving to supply services underMode 4 are not possible.
Source: OECD (2001b) and Nielson and Cattaneo (2003).
smallest of the four modes of services supply(table 4.7).
Negotiations on Mode 4 first took placeduring the Uruguay Round of trade talks heldfrom 1986 to 1993, but they were not partic-ularly successful—in fact, they served primar-ily to facilitate exploratory business visits andthe movement of high-level personnel withinmultinational corporations. While the UruguayRound negotiations were formally concludedin December 1993, negotiations in severalareas—basic telecommunications, financialservices, maritime transport services, and themovement of natural persons—were extendedbeyond the end of the Round because of wide-spread dissatisfaction with the level of liberal-ization achieved in those areas. Further negoti-ations on Mode 4, concluded on June 30,1995, produced no major breakthrough. OnlyAustralia; Canada; the European Communi-ties; and its member states, India, Norway, andSwitzerland improved on the commitmentsthey made in the Uruguay Round, and theseimprovements were annexed to the Third Pro-tocol to the GATS. The improvements mainlyconcern access opportunities for additionalcategories of services suppliers, usually inde-pendent foreign professionals in a number ofbusiness sectors, or the extension of such pro-fessionals’ permitted duration of stay.
A look at members’ current GATS sched-ules shows that levels of commitments varystrongly across modes of supply. Within agiven sector, trade conditions for Mode 4 tendto be significantly more restrictive than condi-tions for other modes. No developed countryhas scheduled a “none” entry (signifying un-fettered access) for its Mode 4 commitments,and only 1 percent of market-access commit-ments undertaken by developing countries arefully liberal. This compares with one out oftwo entries for Mode 2 (consumption abroad)being full commitments.15
Many schedules have established linksacross modes of supply. Members’ schedules aremostly biased in favor of intracorporate trans-ferees, hence making the economic value ofsuch commitments dependent on access condi-tions for Mode 3 (table 4.8). Such commitmentsare of limited interest to WTO members which,given their level of economic development, arenot significant foreign investors. Schedules arealso more open for highly skilled labor, wheredeveloping countries tend to be net importers,since their comparative advantage lies with rel-atively unskilled labor-intensive services.
As of April 2002, an overview of members’horizontal commitments shows that the major-ity of the entries scheduled—nearly 280 out of a total of 400—concern executives, man-
G L O B A L E C O N O M I C P R O S P E C T S 2 0 0 4
168
Table 4.7 TMNP is the smallest of the four modes of international service supplyService exports by mode of supply, 2001 (billions of dollars and percentage of total)
1997 2001
Percentage PercentageMode of international service supply Value of total Estimate of total Proxy
1 Cross-border supply 890 41.0 1,000 28.2 BOP: commercial servicesminus travel
2 Consumption abroad 430 19.8 500 14.1 BOP: travel exports
3 Commercial presence 820 37.8 2,000 56.3 FATS statistics turnover
4 Movement of natural persons 30 1.4 50 1.4 BOP: compensation ofemployees
Total 2,170 100.0 3,550 100.0
BOP is balance of payments. FATS is Foreign Affiliate Trade in Services.Source: IMF, Balance of Payments Yearbook.

agers, and specialists. Of these, some 170 en-tries explicitly relate to intracorporate transfer-ees. Only 17 percent of all horizontal entriesmay cover low-skilled persons as well (“busi-ness sellers” and “other”). It is also revealingthat few significant differences exist between
the commitments scheduled by developed anddeveloping countries. Both groups seem to havebeen equally hesitant in undertaking very lib-eral commitments for Mode 4 (box 4.10).16
The periods for which entry may be permit-ted have not always been indicated. This is sur-prising because it might be expected that, in theabsence of a definition of “temporary” in theGATS, members would provide more precisionin their schedules. Where time limits have beenspecified, the relevant periods are shorter forbusiness visitors than for executives, managers,and specialists. The focus of existing commit-ments on employed persons is reflected also inmembers’ frequent use of employment links asan entry criterion: “Pre-employment,” usuallyof one year, is one of the most recurrent re-strictions. Numerical quotas and economicneeds tests rank next in terms of frequency oflimitations. While most of the quotas relate tothe total staff of a company, some membersalso have reserved the right to operate quotasbased on parameters, such as senior staff orwages. Significant administrative discretion re-sults from the frequent scheduling of economicneeds tests without indication of the criteria onwhich they are operated; with such entries, therelevant government agency grants access to
L A B O R M O B I L I T Y A N D T H E W T O : L I B E R A L I Z I N G T E M P O R A R Y M O V E M E N T
169
Table 4.8 Most Mode 4 commitments by WTO members are in managementcategoriesEntries by WTO members that have made Mode 4commitments in the horizontal section of their GATSschedules as of April 2002, by type of natural person
Number of Percentage ofentries entries
Intracorporate transferees,of which 168 42
Executives 56Managers 55Specialists 56Others 1
Executives 24 28Managers 42Specialists 44Business visitors, of which 93 23
Commercial presence 41Sales negotiations 52
Contract suppliers 12 3Other 17 4Total 400 100
Source: Mattoo and Carzaniga (2003).
Five policy impediments discourage Mode 4 trade.
• Quantitative restrictions on the movement of nat-ural persons with a view to protecting local labormarkets.
• Economic needs tests and labor certificationrequirements, whereby prospective employersmust certify that no domestic workers were avail-able prior to hiring a foreign worker. Particularlytroublesome is the lack of transparency and thehigh degree of administrative discretion applied to such tests, which reduces the predictability oftrading conditions. The administration of such
Box 4.10 Key impediments to Mode 4 tradetests also may cause significant delays in hiringprocedures.
• Issuance and renewal of visas and work permitsmay be cumbersome, expensive, stringent, andlack transparency.
• Social security contributions (lack of tax credits inthe home country), double taxation burdensplaced on foreign workers, non-portability ofpension and other social contributions.
• Lack of recognition of qualifications, educationaldegrees, training, and experience, especially inregulated professions.
Source: Mattoo (2003).

foreign natural persons provided that unspeci-fied economic conditions are met.
What’s on the table in the currentnegotiations?Proposals related to Mode 4 in the current ser-vices negotiations by both developed and de-veloping countries address many of the issuesidentified above.17 Six proposals relate specif-ically to Mode 4; others raise Mode 4 in thecontext of sectoral proposals. Some proposeways to expand existing market access, eitherthrough the development of sectoral commit-ments or by expanding access available to onegroup (such as intracorporate transferees) orthe categories of personnel that benefit fromfavorable Mode 4 access. Other proposals seekto improve the level of access by removing ob-stacles to existing commitments, such as lackof information or cumbersome and inappro-priate administrative procedures. Some makelinks to the development of broader regulatorydisciplines under GATS Article VI.4, or raisespecific barriers such as economic needs testsor recognition of qualifications.
The negotiating proposals on Mode 4tabled by WTO members pursue two core ob-jectives. One class of proposals, favored by de-veloping countries, focuses on widening mar-ket access. Another, preferred by developedcountries, aims at increasing the effectivenessof existing market-access commitments (Niel-son 2002). Together, such proposals provide auseful roadmap of what an improved and moreequitable outcome on Mode 4 trade couldcomprise within the framework of the DohaDevelopment Agenda. Key issues under dis-cussion include:
Greater clarity and predictability in WTOmembers’ commitments. Common definitionsfor main personnel categories are included inmany WTO members’ commitments. Manymembers refer to “executives, managers, spe-cialists,” but there is no common understand-ing of who is covered by these categories; use ofa worker category nomenclature developed bythe ILO could be useful in this regard.
Providing clearer information on economicneeds tests (where entry of foreigners is sub-ject to an assessment of needs in the domesticmarket), such as criteria used, responsible au-thorities, likely timeframe for determinations,and record of recent decisions (Nielson 2002).
Greater transparency. Existing access is notalways used because service suppliers lack information on the necessary requirements and procedures. WTO members could provide one-stop information on all relevant proce-dures and requirements via a dedicated websitecovering all WTO members, through notifica-tions to the WTO, or by creating a one-stopcontact point at the national level. Other sug-gestions include prior consultation on regula-tory changes, timely responses to applications,and the right of appeal (Nielson 2002).
Adoption of a GATS visa. This would facili-tate entry of Mode 4 workers, including avoid-ance of the detailed visa procedures currentlyrequired in many countries (often not sepa-rated from permanent migration). India hasput forward the idea of a GATS visa, whichwould be issued rapidly, be time-limited, coverboth independent service suppliers and intra-corporate transferees, feature rights of appeal,and be backed up by a bond, with sanctionsfor abuse. The main idea behind the proposalis to distinguish between temporary and per-manent flows of migrants in the administra-tion of entry procedures.18 The key elementsof a GATS visa scheme are presented in box4.11 (Nielson 2002).
Enhanced market access commitments. Thereare several additional areas where expandedmarket access for specific groups would sub-stantially increase the scope for developingcountries’ Mode 4 entry:
• Commitments for particular service sec-tors in high demand (such as ICT, pro-fessional services) rather than the currentblanket treatment for Mode 4 entry acrossall sectors;
G L O B A L E C O N O M I C P R O S P E C T S 2 0 0 4
170

• Better access for some groups, in par-ticular intracorporate transferees, via“blanket” applications by companies orby charging companies for streamlinedprocessing (including via a GATS visa);
• More access for other types of skilled,but not necessarily highly skilled, per-sonnel such as “technical support person-nel,” “nonprofessional essential per-sonnel,” and trainees (future executives)(Nielson 2002);
• Progressively reducing the range of ad-missible worker categories subject tolabor market/economic needs tests, withno economic needs tests applied to in-tracompany transferees or to certain pro-
fessional service providers working on a con-tract basis.
Of the six proposals tabled specifically onMode 4 by WTO members to date, four areby developed countries—Canada, the Euro-pean Union, Japan, and the United States—whereas only two are from developing coun-tries—Colombia and India. The fact that sofew developing country members of the WTOhave articulated negotiating proposals in anarea of obvious export interest is somewhatsurprising. This lack of interest may connote apreference for the guaranteed access affordedto sending countries by bilateral guest workerprograms (an outcome that appears to mirror
L A B O R M O B I L I T Y A N D T H E W T O : L I B E R A L I Z I N G T E M P O R A R Y M O V E M E N T
171
Coverage: Either all categories of service providerscovered by sectoral and horizontal commitmentsunder Modes 3 and 4 (visas), or only intracorporatetransferees (including at trainee level) and key per-sonnel providing services pursuant to a contractbetween two businesses (permits).
Duration of stay: Less than 12 months; no sin-gle visit to exceed 365 days; 3 years for intracorpo-rate transferees. Stays of less than 3 months (butpossibly multiple entries over the course of a year)would not require a visa.
Procedure: A separate body dealing with GATSvisas as contact point within the overall immigrationframework; a one-source availability of all relevantrules and regulations; information on the status ofapplications to be available upon request; authoritiesrequired to provide notification of delays; expeditedsecurity checks; consultation mechanism for anychanges to the rules.
Time for issuance: 2 to 4 weeks from filing ofapplication to issuance of visa, but with proceduresfor issuance in one day or at port of entry underspecial circumstances.
Conditions: For intracorporate transferees,proof of employment with current employer for adefined period (6 months) and performance bonds;
Box 4.11 Elements of a possible GATS visa/permit regime
demonstrated experience of performing services atsenior level; proof of qualifications for some seniorlevels of personnel; contracts above a certain valuenot subject to economic needs tests.
Role of companies: A company-specific GATSvisa for personnel working for well-known and rep-utable companies. Following certification by immi-gration authorities, companies could self-administertransfers.
Appeal rights: Appeal against rejection, with adecision within one month.
Renewal: Simple procedures with fees reflectingadministrative costs.
Prevention of abuse: Declaration of intentionnot to establish a permanent residence; inability tochange to another visa category during life of theGATS visa; payment of bonds by sponsoring com-pany to local embassy or consulate; imposition ofspecial safeguard of one year’s duration against anyWTO member whose companies have a pattern ofvisa abuse.
Sources: OECD (2001), drawing on Chanda (1999), Zutshi(2000), and European Services Forum (2001).

the tendency for some developing countries topursue preferential bilateral trade agreementsrather than multilateral agreements). It alsomay reflect the difficulties many developingcountries have faced in identifying their exportinterests in services trade, an area of high de-mand in trade-related capacity building. Thedearth of negotiating proposals need not, how-ever, imply that individual developing coun-tries are not formulating specific requests forgreater access for their workers to developed-country markets in the context of ongoingbilateral request-offer negotiations under theGATS.
Discovering mutual interests is essentialnot only for the success of Mode 4negotiations but also for the GATS as a wholeThe success of the GATS negotiations may de-pend on progress on Mode 4 trade. As Mattoo(2003) notes, liberalizing advances in the mul-tilateral trading system have always derivedfrom the reciprocal exchange of market-accessconcessions. It is important that developingcountries understand the potential of, and pressfor, enhanced access in an area of natural com-parative advantage. Such an understanding, ifnot opposed by the OECD countries, shouldenable developing countries to engage more ef-fectively in the GATS negotiations.
Furthermore, there is reason to believe thatreduced barriers to the temporary movementof service providers will produce substantialglobal benefits. Significant gains already arebeing realized, for example, in the software in-dustry—some 60 percent of India’s burgeon-ing exports are provided through the move-ment of software engineers to the site of theconsumer. And with greater liberalization ofbarriers to the movement of people, manymore developing countries could “export” atleast the significant labor component of ser-vices such as construction, professional ser-vices, environmental services, and transport.A benefit of the temporary nature of suchmovement is the potential for both the hostcountry and the home country to gain. For ex-
porting countries the financial and knowledgebenefits would be greatest if service suppliersreturn home after a certain period abroad, andfor importing countries the temporary move-ment would create fewer domestic problemsthan immigration.
However, there are a number of significantissues and concerns to be addressed. Experiencewith bilateral or regional temporary workerschemes might highlight some of the practicalmeans of tackling policy challenges and con-cerns associated with temporary movement—issues such as the operation of bonding re-quirements, avoidance of double taxation oftemporary workers, repatriating social securityand pension contributions to the sending coun-try, ensuring that the temporary nature of entrynot be abused, and on-site inspections of worksites employing TMNP workers.19
None of these issues are insurmountable—but they require a new level of policy dialogueand coordination among trade, labor, and mi-gration authorities, both at the national andinternational level, to find workable solutions(Nielson 2002).
Notes1. Two definitions of migrants are used: Europe and
Japan usually refer to country of citizenship in defining“foreign,” whereas in the United States, Australia, andCanada country of birth is the relevant definition.
2. Available statistics are incomplete and not read-ily comparable between countries. While most migra-tion systems distinguish between temporary and foreignmigration, the definition varies among countries. To acertain extent, statistics on highly skilled workers tendto be better, because data on such workers are collectedin connection with their temporary visas. Work permitsand visas are valuable sources of data (OECD 2001b).The situation is even more difficult for statistics onthose temporary foreign workers falling under GATSMode 4—for example, Mode 4 entrants usually cannotbe separated from broader groups, and even when mi-gration data provide occupations—such as “man-agers”—they are not disaggregated by sector. Further,many business visitors may enter under tourist visasand not appear in employment-related figures, particu-larly where no short-term business visitor visa exists. In-dustry surveys can be a useful, but limited, source ofdata for Mode 4 (Nielson and Cattaneo 2003).
G L O B A L E C O N O M I C P R O S P E C T S 2 0 0 4
172

3. This section draws heavily upon the chapter onlabor mobility prepared by Julia Nielson of the OECDSecretariat in the study “Regional Trade Agreementsand the Multilateral Trading System” prepared for theTrade Committee of the OECD (OECD 2002c).
4. H-1B visas are also available for professionalsentering the United States. Some main differences be-tween H-1B and TN visas include: H-1B visas includerequirements to show that temporary hires will not ad-versely affect U.S. workers; TNs are granted for oneyear, but renewals are unlimited, whereas H-1B visashave a three-year duration with one renewal (up to sixyears). Similar conditions to TNs are applied to tradersand investors and intracompany transferees underE1/E2 and L1 visas, respectively (OECD 2001b, citingGloberman 2000).
5. Provisions facilitating mutual recognition are in-cluded in some agreements (for example, EFTA), andothers have complementary arrangements. For exam-ple, the ANZCERTA Services Protocol, the Trans-Tasman Travel Arrangement, and the Trans-TasmanMutual Recognition Arrangement together providethat persons registered to practice an occupation in onecountry can practice an equivalent profession in an-other (OECD 2002e).
6. This section of the chapter relies heavily on“Service providers on the move: economic impact ofMode 4” prepared by Olivier Cattaneo and Julia Niel-son of the OECD Secretariat for the Trade Committeeof the OECD (OECD 2002d).
7. With the exception of the “settlement countries”(Australia, Canada, New Zealand, United States), orothers with significant migration (Germany, UnitedKingdom), many WTO members do not currently havespecialized regimes in place to deal with temporary en-trants as service providers (OECD 2002d).
8. Not everyone agrees that permitting workers tomove abroad temporarily, or indeed to emigrate perma-nently, reduces the sending country’s welfare. Stark andWang (2001) suggest that emigration can have the op-posite effect—that is, improve the welfare of those leftbehind. They argue that migration opportunities createa strong incentive to acquire greater skills through edu-cation. Only a portion of graduates will emigrate, whilemany will remain behind, better educated than theywould have been if immigration opportunities had notbeen provided (Winters 2003b). Such effects thus cangenerate spillover benefits in sending countries, effectsthat are likely to be felt intergenerationally (Comman-der, Kangasniemi, and Winters 2002).
9. This section of the chapter draws heavily on“Service providers on the move: economic impact ofMode 4” prepared by Olivier Cattaneo and Julia Niel-son of the OECD Secretariat for the Trade Committeeof the OECD (OECD 2002d).
10. In health services, the World Health Organiza-tion has suggested offsetting earnings generated by mi-grant service workers against (1) reduced domestic ac-cess to these services, (2) loss in the quality of services,and (3) loss of public investment (Scholtz 1999).
11. Circumstances may even induce a deliberatepolicy of encouraging migration as a way of combatingunemployment (Abella and Abrerar-Mangahas 1997).The effectiveness of such a strategy may be limited bythe reluctance of workers to accept a job abroad as asubstitute for one at home (OECD 2002d).
12. Borjas (2000) suggests that immigration maycontribute to improving domestic-factor use by com-pensating for the reluctance of native workers to movefrom areas of relative labor surplus to areas of short-age. Such findings hold especially in health-related pro-fessions, with obvious social benefits for populations inmore geographically remote areas.
13. Mode 4 is defined in Article I:2(d) as entailing“the supply of a service . . . by a service supplier of oneMember, through presence of natural persons of aMember in the territory of any other Member.” TheAnnex on Movement of Natural Persons Supplying Ser-vices under the Agreement (hereinafter the Annex)specifies that two categories of measures are covered:those affecting natural persons who are “service suppli-ers of a Member”; that is, self-employed suppliers whoobtain their remuneration directly from customers; andthose affecting natural persons of a Member who are“employed by a service supplier of a Member in respectof the supply of a service.” These natural persons canbe employed either in their home country and be pre-sent in the host market to supply a service, or employedby a service supplier in the host country.
The Annex clarifies that the GATS does not applyto measures affecting individuals seeking access to theemployment market of a member, or to measures re-garding citizenship, residence, or permanent employ-ment. There is no specified timeframe in the GATS ofwhat constitutes “temporary” movement; this is de-fined negatively, through the explicit exclusion of per-manent presence. A cursory look at members’ sched-ules shows that the maximum length of stay permittedunder Mode 4 varies with the underlying purpose.Thus, while business visitors generally are allowed tostay up to 90 days, the presence of intracorporatetransferees, another frequently scheduled category,tends to be limited to periods of between two and fiveyears. The Annex does provide for the possibility thatcommitments, and therefore access conditions, may bescheduled by “categories of natural persons,” therebyintroducing an additional element of flexibility.
The Annex also clarifies that, regardless of theirobligations under the Agreement, members are free toregulate the entry and stay of individuals in their terri-
L A B O R M O B I L I T Y A N D T H E W T O : L I B E R A L I Z I N G T E M P O R A R Y M O V E M E N T
173

tory, including through measures necessary to protectthe integrity of their borders and to ensure the orderlymovement of natural persons across those borders,provided that the measures concerned “are not appliedin such a manner as to nullify or impair the benefits ac-cruing to any Member under the terms of a specificcommitment.” The operation of visa requirements onlyfor natural persons of certain members, but not forothers, is not per se regarded as nullifying or impairingsuch benefits.
14. This is a strange distinction—are temporaryforeign workers engaged in picking apples temporaryagricultural workers or suppliers of fruit-picking ser-vices? Is an employee of General Electric’s consumercredit arm engaged in service or manufacturing activi-ties? (Nielson 2002)
15. Calculated on a sample of 37 sectors deemedrepresentative for various services areas. (See docu-ment S/C/W/99, March 2, 1999). The shallow level ofcommitments for Mode 4 is to a certain extent also re-flected in the pattern of horizontal limitations, whichapply across all sectors: there are five times as manylimitations scheduled for Mode 4 than for Mode 2. In turn, this reflects many members’ basic method to scheduling Mode 4 entries. Contrasted with othermodes, the “negative list” approach to scheduling lim-itations has been turned upside down: schedules startwith a general “unbound” which is then qualified byliberalization commitments, mostly limited to specifiedtypes of persons (for example, managers), movements(intracorporate), and stays (up to four years).
Commitments are often exclusively governed bywhat is inscribed in the horizontal part of the schedule,so that identical access conditions apply to all sched-uled sectors. Commitments usually are based on func-tional or hierarchical criteria, related either to the typeof person involved (executive, manager, specialist) orto the purpose of their movement (for example, to es-tablish business contacts, negotiate sales, set up a com-mercial presence). Besides, no generally agreed defini-tions or precise descriptions exist of the types ofnatural persons to which access is granted, which candetract from the predictability of entry conditions.
16. Access conditions scheduled by countries ac-ceding to the WTO after 1995 also are substantiallyidentical to the ones scheduled by Uruguay Round par-ticipants. This contrasts with the situation in the threeother modes of supply, for which recently accededmembers have generally undertaken deeper commit-ments. The only detectable difference with regard toMode 4 is a relatively higher number of commitmentsscheduled by recent WTO members for “contract sup-pliers”—that is, employees of a foreign enterprise whohave completed a contract to supply a service in a
country but does not have a commercial presence inthat market.
17. This section of the chapter relies heavily onNielson (2002) and OECD (2001b).
18. Although the Indian proposal for the adoptionof a GATS visa has helped to broaden the scope ofMode 4 discussions among trade and immigration of-ficials, the odds of seeing such a scheme adopted in theDDA seem remote. Indeed, the sobering experienceemerging from attempts to implement the APEC Busi-ness Travel Card, epitomized by the reluctance of threekey APEC Members (Canada, Japan, and the UnitedStates) to implement the scheme, suggests a long roadahead in liberalizing TMNP at the multilateral level(OECD 2001b). It should be noted that from the pointof view of migration authorities, TMNP represents asmall proportion of those crossing borders every day.The additional resources required to create specialtreatment for such persons—which a GATS visa wouldentail—are hard to justify in the face of other priorities,notably in border security, arising for larger groups ofmigrants. Such resources also could be well beyond theadministrative capacities of many developing countryWTO members (Nielson 2002). See OECD (2001b) formore discussion of the potential impact of a GATS visascheme.
19. Winters and others (2002, pp. 43–50) provide auseful summary of such programs and the means to en-force them in France, Germany, the United Kingdom,and the United States.
ReferencesAbella, Manolo I., and M. A. Abrera-Mangahas. 1997.
Sending Workers Abroad: A Manual for Low-and Middle-Income Countries. Geneva: Interna-tional Labor Office.
Athukorala, P., and C. Manning. 1999. StructuralChange and International Migration in East Asia.Melbourne: Oxford University Press.
Borjas, George J. 2000. Labour Economics, 2nd ed.Boston: McGraw Hill.
Borjas, George, Richard B. Freeman, and Lawrence F.Katz. 1997. “How Do Immigration and Trade Af-fect Labour Market Outcomes?” In BrookingsPapers on Economic Activity, pp. 1–67.
Chadah, Rajesh. 2000. GATS Negotiations and Devel-oping Countries: A Case Study of India. Mimeo.Washington, D.C.: The World Bank.
Chanda, R. 1999. “Movement of Natural Persons andTrade in Services: Liberalising Temporary Move-ment of Labour under the GATS.” New Delhi: In-dian Council for Research on International Eco-nomic Relations. Available at www.icrier.res.in.
G L O B A L E C O N O M I C P R O S P E C T S 2 0 0 4
174

Chanda, Rupa. 2002. “Movement of Natural Personsand the GATS: Major Trade Policy Impedi-ments.” In Bernard Hoekman, Aaditya Mattoo,and Philip English, eds., Development, Trade, andthe WTO. Washington, D.C.: World Bank.
Commander, S., M. Kangasniemi, and L. Alan Winters.2002. “The Brain Drain: Curse or Boon? A Sur-vey of the Literature.” Paper prepared for Inter-national Seminar on International Trade, May,Stockholm.
Devan, J., and P. S. Tewari. 2001. “Brains Abroad.”The McKinsey Quarterly, No. 4.
European Services Forum. 2001. “Draft Model Sched-ule Covering the Temporary Entry of Natural Per-sons under the General Agreement on Trade inServices.” July 20. Brussels: European ScienceFoundation.
Galor, O., and O. Stark. 1991. “The Probability ofReturn Migration, Migrants’ Work Effect, andMigrants’ Performance.” Journal of DevelopmentEconomics, No. 35.
Ghose, Ajit K. 2002. “Trade and International LaborMobility.” Employment Paper 2002/33. Interna-tional Labor Office, Geneva.
Ghosh, Bimal. 1998. Gains from Global Linkages:Trade in Services and Movements of Persons.New York: St. Martins’ Press.
Globerman, Steve. 2000. Trade Liberalisation and theMigration of Skilled Professionals and Managers:The North American Experience. London: Black-well Publishers.
Hodge, James. 1999. “Examining the Cost of ServicesProtection in a Developing Country: the Case ofSouth Africa.” Paper presented at the World Ser-vices Congress, November, Atlanta.
Home Office. 2001. “Migration: an Economic and So-cial Analysis.” RDS Occasional Paper 67. Lon-don: Home Office.
Hutton, T., and J. G. Williamson. 2002. “What Funda-mentals Drive World Migration?” NBER WorkingPaper 9159. National Bureau of Economic Re-search, Cambridge, Mass. September.
International Labor Office (ILO). 1996. EmigrationPressures and Structural Change: Case Study ofIndonesia. Geneva.
Lindert, Peter H., and Jeffrey G. Williamson. 2001.“Does Globalization Make the World More Un-equal?” National Bureau of Economic Research(NBER) Paper 8228. Cambridge, Mass.
Manning, Chris. 2002. “Structural Change, EconomicCrisis, and International Labor Migration in EastAsia.” The World Economy 25(3): 359–85.
Mattoo, Aaditya. 2003. “Introduction and Overview.”In Aaditya Mattoo and Antonia Carzaniga, eds.,Moving People to Deliver Services. New York
and Washington, D.C.: Oxford University Pressand World Bank.
Mattoo, Aaditya, and Antonia Carzaniga, eds. 2003.Moving People to Deliver Services. New Yorkand Washington, D.C.: Oxford University Pressand World Bank.
Nielson, Julia. 2002. “Service Providers on the Move.”Evian Group Compendium, Lausanne: EvianGroup.
OECD (Organisation for Economic Co-operation andDevelopment). 1998. Migration, Free Trade, andRegional Integration in North America. Paris.
———. 2000. Globalisation, Migration, and Develop-ment. Paris.
———. 2001a. Migration Policies and EU Enlarge-ment: The Case of Central and Eastern Europe.Paris.
———. 2001b. “Service Providers on the Move: ACloser Look at Labor Mobility and the GATS.”TD/TC/WP/Final. Paris.
———. 2001c. Trends in International Migration.2001 SOPEMI Report. Paris.
———. 2002a. International Mobility of the HighlySkilled. Paris.
———. 2002b. “Labor Mobility in Regional TradeAgreements.” TD/TC/WP/Final. Paris.
———. 2002c. Migration and the Labour Market inAsia: Recent Trends and Policies. Paris.
———. 2002d. “Service Providers on the Move: TheEconomic Impact of Mode 4.” TD/TC/WP/Final.Paris.
———. 2002e. “Service Providers on the Move: MutualRecognition Agreements,” TD/TC/WP/48. Paris.
———. 2002f. Trends in International Migration.2002 SOPEMI Report. Paris.
Papademetriou, Demetrios G. 2000. “Labor Mobilityand Human Resources Development Policies.”Globalisation, Migration, and Development. Paris:OECD.
PSI (Public Services International). 1999. “The WTOand the GATS: What Is at Stake for PublicHealth?” Common Concerns for Workers in Edu-cation and the Public Sector Series. Brussels. June.
Rodrik, Dani. “Feasible Globalisations.” NBER Work-ing Paper W9129. National Bureau of EconomicResearch, Cambridge, Mass. August.
Scholtz, Peter. 1999. “International Trade Agreementand Public Health: WHO’s Role.” Paper preparedfor conference on Increasing Access to EssentialDrugs in a Globalized Economy, Geneva, WorldHealth Organization, April 11–12.
Stark, Oded, and Yong Wang. 2001. Inducing HumanCapital Formation: Migration as a Substitute forSubsidies. Reihe Okonomie Economics Series100. Vienna: Institute for Advanced Studies.
L A B O R M O B I L I T Y A N D T H E W T O : L I B E R A L I Z I N G T E M P O R A R Y M O V E M E N T
175

UNCTAD (United Nations Commission on Trade andDevelopment). 2001. “Movement of Natural Per-sons under the GATS: Perspectives for the NewNegotiations.” Mimeo. Geneva.
United Nations. 2000. “Replacement Migration: Is it aSolution to Declining and Ageing Populations?”Population Division, Department of Economicand Social Affairs, New York: United Nations.
Visco, Ignazio. 2000. “Immigration, the Labour Mar-ket, and Development.” Paper presented at con-ference on Migration Scenarios for the 21st Cen-tury, Rome, July.
Werner, Heinz. 1996. Temporary Migration for Em-ployment and Training Purposes, Social Cohesion,and Quality of Life. Brussels: Council of Europe.
Winters, Alan. 2001. “Assessing the Efficiency Gainfrom Further Liberalisation: A Comment.” InRoger Porter, Pierre Sauve, Arvind Subramaniam,and Americo Beviglia-Zampetti, eds., Efficiency,Equity and Legitimacy: The Multilateral TradingSystem at the Millennium. Washington, D.C.:Brookings Institution Press.
Winters, Alan. 2003a. “The Economic Implications ofLiberalising Mode 4 Trade.” In Aaditya Mattooand Antonia Carzaniga, eds., Moving People toDeliver Services. New York and Washington,D.C.: Oxford University Press and World Bank.
———. 2003b. “GATS Mode 4: The Temporary Move-ment of Natural Persons.” Mimeo. Brighton: Uni-ersity of Sussex.
Winters, Alan O., and Terrie L. Walmsley. 2002. “Re-laxing the Restrictions on the Temporary Move-
ment of Natural Persons.” Mimeo. Brighton: Uni-versity of Sussex.
Winters, Alan, T. L. Walmsley, Z. K. Wang, and R.Grynberg. 2002. “Liberalising Labor Mobilityunder the GATS.” Economics Discussion Paper87, University of Sussex, Brighton, U.K. October.
World Bank. 1995. World Development Report 1995:Workers in an Integrating World. Washington,D.C.
World Bank. 2000. East Asia: Recovery and Beyond.Washington, D.C.: The World Bank.
———. 2001. Globalization, Growth, and Poverty:Building an Inclusive World Economy. Washing-ton, D.C.
———. 2001. Global Economic Prospects and the De-veloping Countries 2002: Making Trade Work forthe World’s Poor. Washington, D.C.
———. 2002. Global Economic Prospects and the De-veloping Countries 2003: Investing to UnlockGlobal Opportunities. Washington, D.C.
———. 2003. Global Development Finance 2003:Striving for Stability in Development Finance.Washington, D.C.
WTO (World Trade Organization). 1998. “Presence ofNatural Persons (Mode 4).” Background note bythe Secretariat, S/C/W/75, Council for Trade inServices. Geneva. December 8.
Zutshi, B.K. 2000. “Liberalisation of Temporary Mo-bility of Natural Persons.” Intervention before theEuropean Services Forum International Confer-ence on GATS 2000 negotiations, Brussels, No-vember 27.
G L O B A L E C O N O M I C P R O S P E C T S 2 0 0 4
176


Security measures can drive uptransport costsIn the wake of September 11 and worldwideworries about terrorism, governments every-where have enacted security measures thatcould, if not managed properly, drive up tradecosts and shut out exports from developingcountries. This action has focused attention onthe search for greater efficiency in interna-tional transportation, the need for cooperationin adopting collective measures to promotetransport security, and the imperative of im-proving customs regimes, port facilities, andlogistics management.
The cost of moving goods between destina-tions and across international borders is oftenas important as formal trade barriers in deter-mining the cost of landed goods—and ulti-mately of market share. The costs of transportamong many points are as significant as tar-iffs. Other delays are equally costly. One studyestimates that every day spent in customs addsnearly 1 percent to the cost of goods. In devel-oping countries, transit costs are routinely twoto four times higher than in rich countries.
But they hold out the promise offacilitating and securing tradeA study of the trade effects of September 11estimated that world welfare declined by $75billion per year for each 1 percent increase incosts to trade from programs to tighten bordersecurity. Developing countries are particularly
vulnerable to cost increases related to securitythreats. Limited budget resources, dependenceon foreign trade and investment, and outdatedinfrastructure and technology present seriouschallenges for these countries.
Fortunately, new security protocols beingdeployed at ports, customs offices, and borderposts around the world have the potential tostreamline trade transactions as well as pro-mote safety and security. However, a globalframework must be established to ensure thatthe needs of developing countries are addressedas security regimes take shape. The G-8 anddeveloping-country partners should take thelead in drafting such a framework.
Regulations hamper competition ininternational transport systems and raise costsAnticompetitive regulations and private com-mercial practices inflate trade costs by restrict-ing international air and maritime transportservices to developing countries. The share oftrade shipped by air has grown to 30 percentfor U.S. imports in 1998, but international airtransport is one of the service sectors that ismost heavily shielded from international com-petition. By denying entry to efficient outsidecarriers, bilateral air service agreements in-crease export costs for developing countries.Though international airline alliances increasenetwork efficiency, they can be harmful if theyimpede effective competition. City-pair routes
179
Reducing Trading Costsin a New Era of Security
5

on which more than two passenger airlines ordedicated freight airlines operate can cut costsby an average of more than 10 percent.
Maritime transport is often subject to prac-tices such as cargo reservation schemes andlimitations on port services that protect inef-ficient service providers. Such competition-restricting practices among shipping lines andport operators can increase freight rates up to25 percent on some routes. Rising concentra-tion in the market for port terminal serviceshas increased the risk that private firms maycapture the benefits of government reforms.Abusive practices by private operators are ofspecial concern in developing countries, wheretraffic volumes are lower and competitiveforces inherently more limited.
Investments in improving ports, customs,and trade-related institutions can have asubstantial payoffBuilding capacity in trade-related services canprovide the great gains in this new environ-ment. If the countries now below the worldaverage in trade-facilitation capacity could beraised halfway to the average, trade among 75countries would increase by $377 billion an-nually, according to new analyses outlined inthis chapter. Facilitating trade to improveexport-led growth therefore depends on policyreform, technical assistance, and moderniza-tion of infrastructure. All trading partners canbenefit when barriers are removed and capac-ity is strengthened—with many of the benefitsof reform and modernization flowing directlyto developing countries.
Domestic policy reform is now even more important—Domestic policy reform is needed to ensurethat the benefits of modernized customs, portfacilities, and related investments in informa-tion technology are realized. Streamlining reg-ulations to remove technical barriers and lib-eralizing transport and telecommunicationscan promote domestic competition and signif-icantly lower transport costs while expandingthe availability and choice of services in many
developing countries. In particular, appropri-ate legal and regulatory frameworks areneeded to ensure competition. Developingcountries need to address such domestic re-form to take advantage of the opportunitiesoffered by a liberalized trading system.
—and new multilateral efforts could provebeneficialMultilateral efforts to reduce transport fric-tions could include revamping competition-restricting regulations in air and maritimetransport. Such an effort might include revisit-ing antiquated exemptions of transport fromOECD antitrust legislation. Involving develop-ing countries more centrally in global securityplanning, together with a program of appropri-ate technical assistance, would help developingcountries mitigate security-driven cost increasesthat would otherwise reduce their participationin the global market. A commitment to multi-lateral efforts on trade facilitation would alsohave a high payoff—the World Customs Orga-nization (WCO), the multilateral developmentbanks, bilateral donors, and private groups areall important players. The leadership of the G-8 should join multilateral and other develop-ment institutions in a plan to facilitate and ex-pand trade, strengthen security, and promotedomestic development.
Broad trade facilitation goals do not fitneatly into the disciplines of the World TradeOrganization (WTO). In contrast to stroke-of-the-pen tariff reductions, improving ports,customs, and logistics involves a continuingprocess of institutional changes that movecountries toward best practice. The lion’sshare of the agenda requires national action,supported by multilateral development agen-cies to promote—and in some cases finance—institutional changes. However, if the DohaRound propels the WTO into a supporting rolein the broader trade-facilitation agenda, nego-tiations on simplified and harmonized tradeprocedures could advance best practice in ad-ministering fees and formalities in trade and inreducing the costs and uncertainty of transittrade, especially for land-locked countries.
G L O B A L E C O N O M I C P R O S P E C T S 2 0 0 4
180
Most importantly, obligations undertakenby developing countries should be carefully tai-lored to long-term implementation capacity.Any new agreement should include innovativeprocedures for settling disputes before theymove toward WTO-sanctioned action.
Why transport, trade facilitation,and logistics matter
The costs of transporting developing-coun-try exports to foreign markets are a much
greater hindrance to trade than are tariffs. Acomparison of countries’ “transport cost inci-dence” (the share of international shippingcosts in the value of trade) and their tariff in-cidence (the trade-weighted ad valorem dutyactually paid) shows that for 168 out of 216U.S. trading partners, transport cost barriersoutweigh tariff barriers. For the majority ofSub-Saharan African countries, the tariff inci-dence was relatively insignificant, at less than2 percent, while their transport cost incidenceexceeded 10 percent (World Bank 2001). Adoubling of shipping costs is associated withslowdowns in annual growth equivalent tomore than one-half of a percentage point.
Trade-related transaction costs—freightcharges as well as other logistical expenses—are a crucial determinant of a country’s abilityto participate in the global economy. Trans-
port costs determine potential access to for-eign markets, which in turn explains up to 70percent of the variance in countries’ GDP percapita. Among the problems that add to thecosts of trade are:
• Frequent reloading of goods• Port congestion affecting turnaround
time for feeder vessels• Complicated customs-clearance proce-
dures• Complex and nontransparent adminis-
trative requirements, often pertaining todocumentation
• Limited use of automation leading tohigh costs for processing information
• Uncertainty about the enforceability oflegal trade documents such as bills oflading or letters of credit.
Policies to remove nontariff barriers and ac-celerate the flow of goods and services acrossborders—in short, to facilitate trade—are thusat the forefront of today’s trade-policy debate.1
Cross-country evidence suggests that hightransport costs tax growth in countries withunderdeveloped transport links (World Bank2001). Inefficient internal transport systemscan widen income inequalities within countriesby separating the hinterland regions from theglobal marketplace.
R E D U C I N G T R A D I N G C O S T S I N A N E W E R A O F S E C U R I T Y
181
OECD: “Simplification and standardization of pro-cedures and associated information flows required tomove goods internationally from seller to buyer andto pass payments in the other direction.”
UN/ECE: A “comprehensive and integrated approachto reducing the complexity and cost of the tradetransactions process, and ensuring that all these ac-tivities can take place in an efficient, transparent, andpredictable manner, based on internationally acceptednorms, standards, and best practices.”
Box 5.1 The evolving definition of trade facilitationAPEC: “Trade facilitation generally refers to the sim-plification, harmonization, use of new technologies,and other measures to address procedural and ad-ministrative impediments to trade.”
APEC: “The use of technologies and techniques whichwill help members to build up expertise, reduce costsand lead to better movement of goods and services.”
Source: Wilson and others (2002), citing various institutionalsources.

The new international securitydimension in trade
The terror and tragedy of September 11,2001, have emphasized the need for re-
forms in border and transport infrastructure.Terrorist attacks can seriously disrupt the pas-sage of people, goods, and modes of transportacross borders. Measures designed to stop ter-rorism can add certainty and stability to theglobal economy, raise investor confidence, andfacilitate trade. Secure trade is now as impor-tant as free trade—and the two need not bemutually exclusive.2
Since the September 11 attacks, billions of dollars have been spent to enhance portsecurity, install airport security equipment,strengthen customs authorities, and bolsterborder security. While much attention hasbeen devoted to new security protocols in theUnited States, security plans in other parts ofthe world also have been revised and strength-ened.3 The G-8 has committed itself to in-creasing security for all transport modes andto promoting policy coherence and coordina-tion among international organizations suchas the International Civil Aviation Organiza-tion (ICAO), International Maritime Organi-zation (IMO), and WCO.
The bombing of the VLCC Limburg off the coast of Yemen in 2002 was a stark re-minder of weaknesses in global maritime sys-tems, which handle 95 percent of world trade.The event alarmed the shipping world andprompted sweeping new security proposals,several of which are outlined below.
The security of maritime transport hasbeen strengthened, but the costs andbenefits of the new security programs have yet to be assessedA series of measures aimed at strengtheningmaritime security and suppressing acts of ter-rorism was adopted by the IMO at its diplo-matic conference in December 2002. These in-cluded changes to the 1974 Safety of Life atSea Convention (SOLAS), which covers 98percent of the world’s fleets. The InternationalShip and Port Facility Security Code, which
will go into force on July 1, 2004, for vessels ininternational trade, contains detailed security-related requirements for shipping companies,port authorities, and governments, togetherwith guidelines on meeting the requirements.The new rules cover security plans, security of-ficers, and certain security equipment.
In the United States, the Maritime Trans-portation Security Act of 2002 (MTSA), signedby President Bush in November 2002, is in-tended to improve safeguards at the country’s361 sea and river ports and to improve intelli-gence on cargo and personnel entering U.S.ports. Many of the requirements imposed bythe IMO protocol also are mandated by theMTSA. Port-security efforts have been ex-tended with the introduction of the Anti-Terrorism and Port Security Act of 2003.
In April 2002, the trade community and theU.S. Customs Service (USCS) launched theCustoms-Trade Partnership Against Terrorism(C-TPAT) to improve security along the entiretransport chain. The initiative encompassesmanufacturers, warehouse operators, andshipping lines. Participation in the voluntaryscheme is open to all importers, airfreight con-solidators, carriers, and non-vessel-owningcommon carriers that agree to comply with thesupply-chain security profile. Under the pro-gram, importers or carriers provide USCS withdocumentation relating to security measures ateach step along the route of goods—from thefactory to the warehouse, the port, and theocean carrier.4
The United States has imposed new controlsto increase the screening of freight containersarriving at and leaving ports with goods boundfor the United States. Almost 90 percent of all freight is transported in containers, 244 mil-lion of which move annually among theworld’s seaports. The Container Security Ini-tiative (CSI), introduced in January 2002 bythe USCS, is designed to prevent terroristsfrom concealing personnel or weapons of massdestruction in U.S.-bound cargo. Participatingcountries agree to help the USCS identify andscreen high-risk containers at the earliest stage.Beginning with the world’s 20 busiest ports,
G L O B A L E C O N O M I C P R O S P E C T S 2 0 0 4
182

CSI initiative will be extended until 100 per-cent of containerized cargo is covered.5
The bilateral agreements that underpin theCSI may discriminate against ports not coveredby CSI. The European Commission, concernedthat the United States had approached onlysome large European ports, argued that the CSIcould divert trade to Rotterdam, for example,and create competitive distortions among portsin the European Union—violating EU fair traderules. Although the top nine northwest Euro-pean ports handle 80–90 percent of Europe’scontainerized cargo bound for the UnitedStates, the other 11 that also export to theUnited States would be affected. In a recent de-velopment, the European Union has given theEuropean Commission the power to negotiatea maritime security agreement with the UnitedStates to replace the bilateral deals with eightEU countries. In return, the Commission hasdecided to drop legal action against EU mem-bers that signed deals with Washington.6
The CSI measure is especially important forcountries that send a substantial share of theirexports to the United States—for example, 20percent of Malaysian exports are to the UnitedStates. By not joining the CSI, Malaysiangoods could lose competitiveness in the globalmarket—a risk not many nations are willingto take. Countries that do not implement therequired procedures would have a competitivedisadvantage because their shipments wouldundergo more complex examinations and thusbe cleared more slowly.
The WCO passed a resolution on Securityand Facilitation of the International Trade Sup-ply Chain in June 2002 to enable ports in all161 member nations to develop programs simi-lar to the CSI and consider adopting strictersecurity measures. These measures are intendedto enhance security and improve facilitationthrough a comprehensive reform of customs.With nations seeking reciprocal inspectionrights, Japanese officers have been positioned atthe ports of Los Angeles and Long Beach toscreen high-risk cargo containers bound forJapan. Canadian customs inspectors also havebeen posted at Newark, New Jersey, and Seattle.
Under the USCS’s 24-Hour Advance CargoManifest Rule, which took effect on February2, 2003, carriers must provide cargo manifestselectronically via the Automated Manifest Sys-tem (AMS) 24 hours before loading a containerbound for a U.S. port. USCS will use the infor-mation to identify containers that pose a po-tential risk and determine whether containerscan be cleared for loading. Ships unable to meetthe requirements risk receiving “no load” or-ders and thus being detained at the port of ori-gin. Failure by a shipper to comply with the no-tification requirement carries a fine and thepossibility of seizure and forfeiture of the cargo.Even freight not bound for the United States—a shipment from Hong Kong to Canada via the United States, for example—must meet therequirements. Canada’s Customs and RevenueAgency adopted a similar manifest rule for ma-rine cargo imports in April 2003.
The U.S. Food and Drug Administration(FDA) has proposed registration of an esti-mated 400,000 domestic and foreign food fa-cilities to prevent a threat to the U.S. food supply as mandated by the Bioterrorism Act of2002. Starting December 12, 2003, importersmust file advance notice of food shipmentswith the FDA. Estimates by the FDA suggestthat the U.S. food industry could lose as muchas $6.5 million in perishable imports if the rulefor importers is adopted.7 Many agriculturalcommodities such as bananas and broccoli arestill growing on the stalk, vine, or tree the daybefore loading, and in some cases as few as sixhours before.8 Such cargo may spoil if ship-ments are held up because of documentationrequirements. In the highly competitive marketfor agricultural commodities, this risk couldprompt importers in other countries to moveaway from U.S. suppliers. The BioterrorismAct may also be harmful to Indonesia’s smalland medium enterprises, which are big ex-porters of food and agricultural products.
The USCS intends to extend the advanceelectronic cargo reporting requirement to im-ports and exports transported by air and onland. Final rules are expected by October 1,2003. Since September 11, airlines have spent
R E D U C I N G T R A D I N G C O S T S I N A N E W E R A O F S E C U R I T Y
183

$43 billion on security measures—among themmore thorough baggage checks, greater in-flight inspection, and new regulations for se-cure cockpit doors.9 A new passenger datacollection system, the Advance Passenger In-formation System (APIS), was recently intro-duced by the United States; already it hasraised ethical questions about a passenger’sright to privacy.10 With regard to air cargo,new security proposals are expected this yearfrom the U.S. Transport Security Administra-tion. Road and rail transport operators alsohave also been the subject of new measures toforestall attacks.11
Canada has tightened security at airports,ports, and border crossings to prevent ship-ments to the United States from being delayed.The Canadian government will spend $112.7million over the next five years to improve se-curity at maritime borders. Canada’s CustomsSelf-Assessment and Partners in Protectionprograms, like C-TPAT in the United States,are based on the hypothesis that if companiesadopt secure practices, inspectors will be freeto focus on shipments from companies whosepractices are uncertain. With respect to airtransport, the Canadian Air Transport Secu-rity Association has improved luggage screen-ing by installing explosive-detection equip-ment at many large airports in Canada.12 InMay 2003, the EU adopted a brief that sug-gested high security standards on maritimetransport to be applied across the memberstates, new requirements on passenger ships ondomestic voyages, and heightened security ofthe entire maritime transport security chain.
Accounting for nearly 60 percent of worldGDP and half of all trade, the 21 countries ofthe Asia Pacific Economic Cooperation group(APEC) have had to adopt new technologies tostrengthen security without impeding trade. Ata recent meeting in Bangkok, APEC adoptedSecure Trade in the APEC Region (STAR)—aset of measures to protect cargo, ships makinginternational voyages, international aviation,and people in transit. Ports in the APEC regionnow must upgrade security to meet STARstandards. At a meeting in February 2003 inThailand, APEC announced its commitment to
protect cargo through programs of containersecurity, container risk assessment, and ad-vance electronic information on container con-tent. The group also will endeavor to intro-duce more effective baggage screening inairports in the region, improve coordinationamong immigration officials, establish newcyber-security standards, develop an advancedpassenger information system, and devise sys-tems for tracking and monitoring potentialthreats. APEC’s new counterterrorism taskforce will coordinate these activities.13
Developing countries may have a hardtime meeting new security requirementsBalancing new security priorities with eco-nomic and trade objectives is complicated. Se-curity proposals can affect global supply chainsby requiring costly changes in business prac-tices, process redesigns, and new equipment.Critics fear that developing nations could besqueezed out of the global trading system be-cause of their limited capacity to implement thenew international initiatives. High transportcosts, poor infrastructure, and the high costs of border clearance already pose a large obsta-cle to their development. Customs services inmany less-developed countries lack qualifiedpersonnel to operate advanced security equip-ment and the ability to execute the necessaryreforms in their domestic administration. In re-sponse to new security demands, for example,shippers are adding extra cycle time to theirsupply chain rather than risk delays or fines.14
The USCS 24-hour rule has affected portsthat accept cargo as few as six hours beforedeparture, dealers in perishable commoditiesthat are harvested and loaded within 24 hours,and shipments of emergency replacement partsand medical supplies. Holding additional in-ventories to hedge against delays and disrup-tions requires more storage space and moreoperating capital.
The 24-hour rule also has introduced extracosts for Indian exporters. Almost 35 percentof outbound trade from India is headed to theUnited States, including 600,000 containers.Exporters must now pay additional costs tolocal agencies that help them with documenta-
G L O B A L E C O N O M I C P R O S P E C T S 2 0 0 4
184

tion. While large manufacturers can providedetailed commodity descriptions, the small-scale and cottage industry units, which are bigexporters, may be unable to provide the cor-rect description that is required at a level con-sistent with the Harmonized Tariff Schedule(HTS) codes of USCS.
Descriptions such as “freight of all kinds”are no longer acceptable. If officials are uncer-tain about their contents, containers may misstheir scheduled carrier sailing dates. Electronicfiling and paperless clearance are additionalchallenges. Most transactions handled by oceancarriers are still conducted by fax or phone.Many shippers in India still use manual type-writers—obviously hindering their ability toprovide data in electronic form. Many govern-ments may be unaware of the potentially nega-tive trade-related repercussions from inactionon security.
Despite limited finances and capacity tofacilitate trade, some developing countriessuch as Sri Lanka have adopted cargo securitymeasures that are on par with ports in manydeveloped countries. The same applies toBangladeshi facilities that boast advanced de-tection devices. These measures, however, arefocused on imports into the country, emphasiz-ing the need to enhance inspection of exports.
Airlines and airports throughout Asia areworking toward the goal of screening allchecked baggage. The Agency for Air Trans-port Security in Africa (ASECNA) is investing$27 million to modernize member states’ air-port security infrastructure.15
Security-driven improvements canbenefit tradeNew programs to combat terrorism and cor-ruption clearly will involve investment in newtechnology and infrastructure—possibly rais-ing the costs of trade in the short to mediumterm. At the same time, the prospect of reduc-ing future threats through technology-inten-sive customs inspections should be viewed asan investment in greater trade efficiency.16 Au-tomated technology—such as bar codes, wire-less communications, radio frequency ID tags,tamper-proof seals for containers with global
positioning technology, and other electronicmeasures—could accelerate global trade whileimproving security (Reddy 2002). Sharinginformation among terminal operators, ship-pers, and customs brokers can help expeditethe movement of freight through terminalswithout any new physical investment. By re-ducing delays in container clearance throughcustoms, the need for shippers to pay “teamoney”17 to officials would be diminished—contributing to port efficiency (figure 5.1). Inaddition, simplification of customs procedurescan increase the chances of detection of fraudand criminal activities.
R E D U C I N G T R A D I N G C O S T S I N A N E W E R A O F S E C U R I T Y
185
Figure 5.1 Customs clearance takeslonger in the developing world than in theOECD, lowering the competitiveness ofdeveloping-country trade
Note: The number in parenthesis indicates the number ofcountries selected from each region to calculate the average.Developed includes France, Germany, Greece, Netherlands,Spain, Sweden, United States; East Asia and Pacific includes China, Hong Kong (China), Indonesia, Malaysia,Philippines, Singapore, Taiwan (China), Thailand, Vietnam;Latin America and Caribbean includes Argentina, Brazil,Chile, Mexico; Africa includes Mozambique, South Africa,Egypt, Guinea Bissau, Angola; South Asia includes India.Source: International Exhibition Logistics Associates(http://www.iela.org).
Average days required for customs clearance by sea,by region
Developed (7)
East Asiaand Pacific (9)
Latin America andCaribbean (4)
Africa (5)
South Asia (1)
0 2 4 6 8 10 12

Security-inspired modernization can bringabout overdue improvements to ocean ship-ping. The USCS Automated Commercial Envi-ronment (ACE) project, which replaces paperdocuments with electronic methods of identify-ing high-risk containers, is expected to saveU.S. importers $22.2 billion and the U.S. gov-ernment $4.4 billion in administrative costsover 20 years. Hong Kong recently launchedelectronic filing for cargo manifests for allmodes, which will enhance the efficiency andaccuracy in submitting these documents. Pak-istan has introduced electronic filing of a singleshipping document at Port Qasim as part of an effort by its customs service to streamlineclearance and reduce transaction costs. Ac-cording to recent research, automated customscan lower the direct costs of customs clearanceby the equivalent of 0.2 percent of the value oftraded goods. By accounting for the indirectbenefits of reduced delays, costs are reduced by 1 percent of merchandise value. (Hertel,Walmsley, and Ikatura 2001).
Implementation of these measures, whichinvolve important changes throughout the sup-ply chain, may prove a difficult task for manydeveloping countries. But if the costs of com-plying with new security-inspired measures canbe recovered later through greater efficienciesin the supply chain, the end result will be a global trading system that works better foreveryone—securing trade and smootheningtrade flows simultaneously.
Can the impact of security measures be quantified?The recent introduction of the new securityprotocols and their even more recent imple-mentation make it difficult to quantify theirimpact on trade. Leonard (2001) estimated thenew security-related costs at 1–3 percent of thevalue of traded goods, while analysis by theOECD (2002a, 2002b) suggests a more modestimpact.18
Security-driven frictional costs of transport,handling, insurance, and customs can affecttrade even in the medium and long run.Walkenhorst and Dihel’s 2002 study of the ef-
fects of September 11 on international tradeindicates that even countries not directly in-volved in a terrorist event may expect theirincome to decline by $75 billion per year as a result of a 1 percent ad valorem increase infrictional costs to trade.19 While Western Eu-rope and North America suffer the greatestloss in absolute terms, other regions, such asSouth Asia, North Africa, and the Middle East,are the main losers when income losses are re-lated to the size of the economies (figure 5.2).20
A one-percentage-point increase in trade costswould cost South Asia $6 billion, more thanone-half of one percentage point when ex-pressed as a percentage of GDP. Regions withhigh trade-to-GDP ratios and sectors with elas-tic import demand incur the greatest trade andincome losses in relative terms.
G L O B A L E C O N O M I C P R O S P E C T S 2 0 0 4
186
Figure 5.2 Higher trade costs reduceglobal welfare
Note: The measure of welfare loss—“equivalent variation”divided by GDP—was devised by Walkenhorst and Dihel(2002). “High-risk” regions will suffer greater welfarelosses than lower risk regions from an identical increase infrictional costs of trade. Similarly, some sectors are moresensitive than others to increases in frictional costs.Source: Walkenhorst and Dihel (2002).
Eastern Europe
Latin America
North Africaand Middle East
North America
North Asia
Oceania
South Asia
Sub-SaharanAfrica
Western Europe
0 0.1 0.2 0.3 0.4 0.5 0.6 0.7
Overall welfare losses, by region, from a one-percentage-point ad valorem increase in trade costs

The threat of terrorism is not the onlysource of frictional costs. War and epidemicdisease, too, call for extraordinary measuresthat often disrupt trade. The 2003 war in Iraqimposed significant costs on manufacturers,shippers, wholesalers, and retailers stemmingfrom supply-chain disruptions, blockages ofvital sea routes, and delays in shipments. Thiswas especially true for manufactures linkingfactories in Asia with markets in North Amer-ica and Europe. New protocols at seaportsand airports have been implemented this yearto prevent the spread of severe acute respira-tory syndrome, or SARS, a virus that hasswept large parts of Asia. The outbreak hassharply reduced passenger travel to, from, andwithin Asia, especially Hong Kong and China.Tourism has fallen sharply.21
A coordinated action plan on trade andsecurity is clearly neededEven though the costs of compliance could belarge and disproportionate for smaller coun-tries, all participants in the global trading sys-tem have an incentive to invest in counterter-rorism efforts. As noted above, the initial costsof new security procedures will pay off in thelong run through efficiency gains, better man-agement of information, and greater use ofelectronic commerce. It is easy to square en-hanced security with improved trade facilita-tion at a theoretical level, however; it may wellbe more difficult in practice.
The importance of partnerships at variouslevels in the global security campaign is clear.The IMO, ICAO, and other organizationsshould step up their technical cooperation ac-tivities to help developing countries improvetheir capacity to bolster security and trade.Assistance should be coordinated so as toensure absorption and nonduplication ofcapacity-building initiatives provided by thedeveloped world. The WCO has conducted asurvey of members’ capacity-building needs toensure that security measures do not impededevelopment. Initiated by the World Bank in1999, the Global Facilitation Partnership forTransportation and Trade, which includes sev-
eral international, private, and professionalorganizations, has focused on facilitatingtrade—with security one of its themes.
Development institutions, in partnershipwith national governments, have a role to playin risk assessment, training, development ofhuman capital, and improving customs ad-ministration and infrastructure in their clientcountries. They also can help track interna-tional initiatives and assess implications fordeveloping countries.
Because containers travel by sea, road, andrail, their regulation is especially problematic.The container may be subject to IMO regula-tions when on ship, but on land national gov-ernments may impose a different set of legis-lations. The interdependence and linkagesamong different transport modes call for a co-ordinated security approach among sectorsand modes. A ship may be owned by a com-pany in one country, crewed by national of asecond country, and carry the cargo of a thirdto a port of a fourth. Regional and bilateralpartner-ships among countries and stakehold-ers can strengthen information exchange, co-operation in training, and sharing of best prac-tices, resulting in mutual enhancement ofsecurity efforts.22 The United Nations Interna-tional Drug Control Program (UNDCP) con-tainer security project and the United NationsEconomic Commission for Europe (UNECE)supply chain model are particularly promisingin this regard.
The APEC STAR initiative has stressedgreater cooperation between governments andprivate business to protect the global econ-omy.23 Sustained dialogue between governmentsand industry is needed to implement measuresto protect supply chains against security threats.The private sector needs to be directly involvedwith governments in crafting the most efficientways of complying with the requirements andto ensure the integrity of trade from the point ofmanufacture to the port of delivery. In October2001, for example, a joint venture plan betweenBoeing and Israel’s El Al airline was aimed atintegrating airlines’ security concerns into theearly stages of the aircraft production process,
R E D U C I N G T R A D I N G C O S T S I N A N E W E R A O F S E C U R I T Y
187

with a view to providing a higher level of secu-rity at a lower cost (OECD 2002a).
A risk-assessment template should be de-veloped to ensure that high-risk areas are tar-geted for special security programs. The mea-sures adopted should be those that distorttrade the least and provide the greatest bene-fits, especially for exports from developingnations. Since it is impossible to screen andinspect all containers, procedures to identifyhigh-risk containers—by detecting irregulari-ties in shipping patterns—could be deployed.Emphasis on detecting corrupt practices suchas bribery will be needed to prevent controlsfrom being evaded.
A formula for cost-sharing that is optimalfor all also must be developed. The HongKong Shippers Council (HKSC) and theASEAN Federation of Forwarders Associa-tions (AFFA) have urged USCS to subsidizethe cost of its new requirements and U.S. im-porters to share with Asian exporters the bur-den of providing information.
Caution must be exercised to ensure thatsecurity barriers do not become trade barriers.One possible solution may be a new intergov-ernmental program with the mandate to plancoordinated and comprehensive trade-relatedsecurity programs. Such a program could en-sure the win-win outcome that is achievable insecurity and trade, while recognizing the spe-cial needs of developing countries. The G-8, incooperation with developing countries, is onelogical forum for development of a coordi-nated “Action Plan for Security and Trade.”
The anticompetitive effects of international transportregulations
Costs rise and fall with public policies andprivate practices. For a long time, many
transport services came under the aegis of pub-lic monopolies, and state-owned enterprises ex-erted a powerful force in the transport sectorsof many countries. Such public monopolies arebecoming increasingly difficult to jusify. Privateentry and competitive market structures have
proved viable for almost all transport modesand generally have brought greater efficiencyand lower prices for consumers. However, pub-lic and private barriers remain pervasive in airand maritime transport—restricting competi-tion and increasing costs. In general, theyshould be replaced with systems that rely onprivate provision of services.
International air transport services areheavily protectedEfficient air transportation is an important de-terminant of an economy’s export competitive-ness. This is especially true for high-value, non-bulky manufactures, perishable horticulturaland agricultural products, and time-sensitiveintermediate inputs traded within internationalproduction networks. Efficient air cargo ser-vices play a critical role in attracting invest-ment—including foreign direct investment(FDI)—in these sectors, which can be an im-portant source of employment and economicgrowth.
The share of world trade shipped by air hasgrown continuously over the past decades—for example, from 7 percent of U.S. imports in1965 to 30 percent in 1998. In terms of ton-miles shipped worldwide, air cargo has grownby almost 10 percent annually from 1970 to1996, while ocean shipping grew only 2.6 per-cent per year over the same period (WorldBank 2001). More than 20 percent of Africanexports enter the United States by air, and, fora quarter of all product groups, the share ofair-shipped exports exceeds 50 percent.24
For many developing countries, the cost ofair transportation often far exceeds the costsobserved on developed-country routes. Amjadiand Yeats (1995) found, for example, that air transport costs made up between 10 and 50 percent of the value of African exports to the United States, a much higher propor-tion than for U.S. imports from non-Africancountries.
High air freight rates on developing-countryroutes are primarily due to two factors. First,the cost of serving developing countries may behigher. Developing countries are farther from
G L O B A L E C O N O M I C P R O S P E C T S 2 0 0 4
188

the world’s economic centers, increasing thecost of operating aircraft. And overall tradevolumes tend to be smaller on routes servingless-developed countries, preventing operatorsfrom reaping economics of scale and scope.Thin traffic densities also may adversely affectthe quality of air transportation, as servicesmay be offered less frequently. Second, differ-ent degrees of competition in the provision ofair services may affect the markup that aircargo operators may be able to charge on aparticular route. The extent of competitionamong cargo carriers again depends on trafficvolumes—as economies of scale and scopelimit the number of providers that can be sus-tained on a particular route. Competition alsomay be influenced by government policies—inparticular, restrictive market-access agreementsfor the provision of air transport.
In an econometric investigation conductedfor this report, we attempted to quantify thedeterminants of air transport costs using asample of 139 randomly selected city-pairroutes in the Western Hemisphere. Preliminaryresults suggest that distance is a key determi-nant of international air cargo freight rates—most likely due to the cost of fuel and thecapital cost of operating aircraft. Across thesample, a one-percentage-point increase incity-pair distance leads to a 0.72 percent in-crease in prices—a higher distance elasticitythan that typically found for maritime trans-port. Countries located far from economic cen-ters are therefore at a disadvantage.
Moreover, the investigation confirms thatthere are sizeable economies of scale in theprovision of air transport. On average, a 10percent increase in city-pair traffic volumesleads to a drop of slightly more than 1 percentin the observed freight rate. In view of thewide variance in freight traffic volumes, thescale effect can be quite large—and in mostcases it works against poorer nations. Finally,competition among airlines is found to exertdownward pressure on freight rates. City-pairroutes on which more than two passenger air-lines or dedicated freight airlines operateenjoy, on average, 10.7 percent lower prices.
Liberalizing air services can help reduce costs—What are the implications of these findings forpublic policy? First, there remain significantpolicy-induced barriers to competition in aircargo services. The complex system of air ser-vice agreements (ASAs) still governs the mar-ket for international air cargo services. ASAsare typically negotiated bilaterally, althoughrecent years have seen the emergence of re-gional arrangements. Among other things,they designate the airlines allowed to operateon city-pair routes and the number and fre-quency of flights they can operate.
Over time, ASAs have become increasinglyliberal. For example, the so-called Bermuda-type agreements do not regulate capacity oneach route but allow the designated airlines tonegotiate the number and frequency of flights.“Open skies” agreements are even less restric-tive, allowing all airlines to fly on all routesbetween two countries without any ex antecontrols on capacity.
More liberal ASAs can be a way of promot-ing competition and thus lowering air cargofreight rates. Moreover, greater freedom in de-signing air transport networks could allow airservice operators to reap greater economies ofscale and scope, offering additional cost sav-ings. Indeed, it is thought that liberalization inprotected air service markets may lead to con-solidation among airlines, as operators seek togenerate larger scale and network economies.Consolidation may not necessarily be associ-ated with lessened competition, as fewer opera-tors may compete on a larger number of routes.But it does suggest that liberalization needs tobe accompanied by competition policies thatensure a review of mergers, acquisitions, andother forms of private cooperation on eco-nomic efficiency grounds (World Bank 2001).
—but important challenges remainNotwithstanding the benefits of air-service lib-eralization, thin traffic densities and the asso-ciated lack of economies of scale are likely toremain a key obstacle to substantially lower-ing air cargo freight rates in the developing
R E D U C I N G T R A D I N G C O S T S I N A N E W E R A O F S E C U R I T Y
189
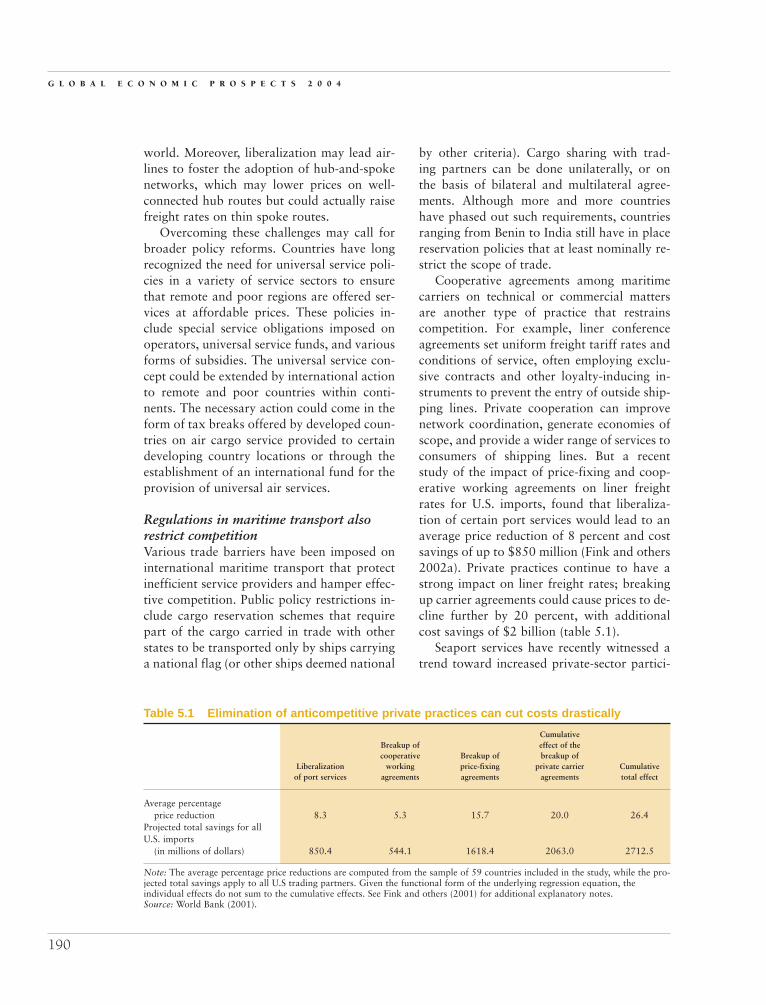
world. Moreover, liberalization may lead air-lines to foster the adoption of hub-and-spokenetworks, which may lower prices on well-connected hub routes but could actually raisefreight rates on thin spoke routes.
Overcoming these challenges may call forbroader policy reforms. Countries have longrecognized the need for universal service poli-cies in a variety of service sectors to ensurethat remote and poor regions are offered ser-vices at affordable prices. These policies in-clude special service obligations imposed onoperators, universal service funds, and variousforms of subsidies. The universal service con-cept could be extended by international actionto remote and poor countries within conti-nents. The necessary action could come in theform of tax breaks offered by developed coun-tries on air cargo service provided to certaindeveloping country locations or through theestablishment of an international fund for theprovision of universal air services.
Regulations in maritime transport alsorestrict competitionVarious trade barriers have been imposed oninternational maritime transport that protectinefficient service providers and hamper effec-tive competition. Public policy restrictions in-clude cargo reservation schemes that requirepart of the cargo carried in trade with otherstates to be transported only by ships carryinga national flag (or other ships deemed national
by other criteria). Cargo sharing with trad-ing partners can be done unilaterally, or on the basis of bilateral and multilateral agree-ments. Although more and more countrieshave phased out such requirements, countriesranging from Benin to India still have in placereservation policies that at least nominally re-strict the scope of trade.
Cooperative agreements among maritimecarriers on technical or commercial mattersare another type of practice that restrainscompetition. For example, liner conferenceagreements set uniform freight tariff rates andconditions of service, often employing exclu-sive contracts and other loyalty-inducing in-struments to prevent the entry of outside ship-ping lines. Private cooperation can improvenetwork coordination, generate economies ofscope, and provide a wider range of services toconsumers of shipping lines. But a recentstudy of the impact of price-fixing and coop-erative working agreements on liner freightrates for U.S. imports, found that liberaliza-tion of certain port services would lead to anaverage price reduction of 8 percent and costsavings of up to $850 million (Fink and others2002a). Private practices continue to have astrong impact on liner freight rates; breakingup carrier agreements could cause prices to de-cline further by 20 percent, with additionalcost savings of $2 billion (table 5.1).
Seaport services have recently witnessed atrend toward increased private-sector partici-
G L O B A L E C O N O M I C P R O S P E C T S 2 0 0 4
190
Table 5.1 Elimination of anticompetitive private practices can cut costs drastically
CumulativeBreakup of effect of thecooperative Breakup of breakup of
Liberalization working price-fixing private carrier Cumulativeof port services agreements agreements agreements total effect
Average percentageprice reduction 8.3 5.3 15.7 20.0 26.4
Projected total savings for allU.S. imports
(in millions of dollars) 850.4 544.1 1618.4 2063.0 2712.5
Note: The average percentage price reductions are computed from the sample of 59 countries included in the study, while the pro-jected total savings apply to all U.S trading partners. Given the functional form of the underlying regression equation, theindividual effects do not sum to the cumulative effects. See Fink and others (2001) for additional explanatory notes. Source: World Bank (2001).

pation and greater competition within andamong ports. Different ownership and opera-tion structures have emerged with respect toport management, provision of infrastructure,and the supply of services. With the emergenceof large global port operators, there is now agreater risk of abuse of market power—abusethat could reduce the benefits gained fromport liberalization. Creating regulatory capac-ity and strengthening institutions is necessaryfor the success of port reforms.
Trade facilitation
To be effective, trade-facilitation measuresmust include or be accompanied by im-
provements in domestic regulatory proceduresand institutional structures. Above all, theymust include development assistance to raisetrade-related capacity—individual, institu-tional, and social—in developing nations. Oneexample of the need for capacity building andtechnical assistance in the trade-facilitationagenda relates to the technology required forexpediting cargo clearance. International com-merce depends increasingly on informationtechnology—most basically for the electronictransmission of trade information. Moderncustoms methods of profiling consignments ortraders based on risk-assessment techniquescan help expedite cargo clearance. Compiling a unique set of computerized information foreach shipment enables data to be processedbefore cargo arrives, thus expediting clearanceand speeding delivery.
Measures to speed the flow of goods andservices across international borders haveplayed a critical role in the expansion of globaltrade over the past decades. Cross-border tradein raw materials, components, and intermedi-ate goods by multinationals with integratedproduction and distribution facilities now con-stitutes more than one-third of world trade.This expansion would not have been possiblewithout precisely timed maritime containerservices, express door-to-door delivery of airfreight, new information and communicationstechnologies, and other services. All parties to a
transaction gain from fast, easy, and low-costtrading conditions.25
High logistic costs affect competitivenessAlthough the incidence of logistics costs varies,with some developing countries more efficientthan others in providing trade services, a studyby the United Nations Commission on Tradeand Development (UNCTAD) estimates thataverage customs transactions in developingcountries involve 20 to 30 parties; 40 docu-ments; and 200 data elements, 30 of which hadto be repeated at least 30 times. Subramanianand Arnold (2001) broke down the cost ofinternational shipment into five categories:ocean freight, inland transport cost, and threeindicators of logistics costs—custom inspec-tion, cargo handling and transfer, and process-ing of trade documentation. Their analysisshows that logistics accounted for no less thana third of the cost of door-to-door shipment ofcontainerized carpets from Nepal to Germanyand teabags from India to the United King-dom. Using a similar methodology, a WorldBank (1997) study of the performance ofBrazilian ports reported that per-containercosts for administrative procedures and cus-toms clearance could be reduced by more than20 percent (from $1,727 to $1,320) if interna-tional best practices were followed.
For small economies, higher logistics coststranslate directly into higher import and exportprices. To remain competitive in industrieswhere profit margins are thin, exporters musteither pay lower wages to workers, acceptlower returns on capital, or enhance productiv-ity. The pressure on factory prices and produc-tivity is even higher for countries exportingproducts that have a high import content, suchas domestic export-oriented firms producinggarments or electronic final goods using im-ported materials—as is the case with many de-veloping countries. In these cases, where smalldifferences in transaction costs can determinewhether the export venture is commerciallyviable or not, logistical efficiency can meangreater retention of the value-added benefits oftrade-led growth. Particularly in labor-intensive
R E D U C I N G T R A D I N G C O S T S I N A N E W E R A O F S E C U R I T Y
191

industries in developing countries, high trans-port costs may preclude wage growth, thus af-fecting the standard of living of workers.
A study that examined the effect of highershipping and port charges in the garment in-dustry of Bangladesh estimated that exportscould rise by 30 percent, raising hard-currencyearnings by 125 percent, if port inefficiencieswere reduced. One recent estimate, based oncomparisons between air and ocean freightrates for U.S imports, puts the per-day cost forshipping delays at 0.8 percent of the value oftrade for manufactured goods—with only asmall fraction attributable to the capital costsof the goods while on the ship (box 5.2).
Minimizing transit time is particularly im-portant in modern commerce, given the trendtoward just-in-time production systems that
enable firms to outsource stages of produc-tion to geographically dispersed locations. Re-search by Hummels (2001) showed that deliv-ery times had a pronounced effect on importsof intermediate products, suggesting that rapiddelivery of goods is crucial for the maintenanceof multinational vertical product chains. Hum-mels found that each day saved in shippingtime due to a faster transport mode and fastercustoms clearance was worth almost one per-cent, ad valorem, for manufactured goods. Un-certain order-to-delivery times impose implicitproduction costs as well. If logistics servicesare unreliable and infrequent, firms are likelyto maintain higher inventory holdings at everystage of the production chain, requiring addi-tional working capital. Forgone earnings canbe significant for firms in countries with high
G L O B A L E C O N O M I C P R O S P E C T S 2 0 0 4
192
As the subsidiary of a large German car part sup-plier, Leoni Tunisie S.A. produces cable and elec-
tronic components for Daimler Chrysler and otherEuropean car manufacturers. The just-in-time supplychains in the car industry put high demands in thelogistics system. Leoni has outsourced all logisticsneeds to an international forwarder that has a legalsubsidiary in Tunisia.
A full production and logistics cycle lasts aboutnine days. Raw materials and intermediate productsare sourced from across Europe, Asia, and theUnited States. They are consolidated at Leoni’s head-quarters in Germany and shipped to about a dozenfactories in various countries. Several trucks leaveGermany for Tunisia each week. The trailers arecleared and sealed by German customs on the firm’spremises, where they are picked up by the logisticsprovider. The forwarder drives the trailers to Genoaor Marseilles (2–2.5 days), places them without adriver on RoRo ferries (20–24 hours by sea), claimsthem at Rades’s port, and delivers them to a factoryin Sousse (2–3 hours by land). Once assembled, thefinished components are cleared by a Tunisian cus-toms officer on the premises before they are sent on
Box 5.2 The logistics needs of a German car partmanufacturer in Tunisia
their return journey. Eight trucks carrying approxi-mately 350 tons of finished parts leave Tunisia eachweek. The company considers the chain to be effi-cient and reliable.
Even so, the just-in-time demands of the indus-try are posing a threat to Tunisia as a productionbase—more and more clients require six-day cycles.Because internal production processes have beenstreamlined, further time savings depend on logisticsefficiency. Leoni Tunisie recently lost an internalcompany competition for a new factory with a po-tential for 1,700 jobs to Leoni’s Romanian sub-sidiary. The reasons cited for the loss were not wagecompetitiveness or the investment environment—thecompany regards Tunisia as very competitive—butEastern Europe’s logistics advantage. The land jour-ney between Romania and Germany takes one dayless in each direction. According to the CEO ofLeoni Tunisie, Tunisia will need to economize on lo-gistics costs (including better air cargo connectionsor high-speed ferries to Europe) if it is to retain itscompetitive advantage in time-sensitive industries.
Source: Mueller-Jentsch (2002).

real interest rates. Gausch and Kogan (2001)found that inventory holdings in the manufac-turing sector in many developing countries aretwo to five times higher than in the UnitedStates. Their estimates further show that de-veloping countries could reduce the unit cost of production by as much as 20 percent by re-ducing inventory holdings by half.
Better measures of trade facilitation areyielding some positive resultsWith increased attention to the benefits of re-ducing nontransport barriers to trade, effortshave been made to assess the importance oftrade facilitation. Because empirical measures oftrade facilitation are lacking, however, progresshas been limited.
Several recent studies quantify the benefitsof improved trade facilitation, modeled as areduction in the costs of international trade oras an improvement in the productivity of theinternational transportation sector. UNCTAD(2001) considers trade facilitation in thebroader context of creating an environmentconducive to developing e-commerce usageand applications. The results show that a re-duction of one percentage point in the cost ofmaritime and air transport services could in-crease Asian GDP by $3.3 billion.26 If tradefacilitation is expanded to include improve-ments in wholesale and retail trade services,an additional $3.6 billion could be gained bya one-percentage-point improvement in theproductivity of that sector. APEC (1999)found that the shock-derived reduction intrade costs ranged from 1 percent of importprices for industrial countries and the Repub-lic of Korea, Taiwan, and Singapore, to 2 per-cent for developing countries.27 The studyestimated that APEC merchandise exportswould increase by 3.3 percent from trade-facilitation efforts.
Empirical studies of the impact of enhancede-commerce and telecommunication access,improved customs procedures, and harmo-nized or improved standards also demonstratethe benefits of trade facilitation in specific
fields. Freund and Weinhold (2000) found thata 10-percentage-point increase in the relativenumber of web hosts in one country wouldhave increased trade flows by 1 percent in 1998and 1999. Fink, Mattoo, and Neagu (2002b)found that a 10 percent decrease in the bilat-eral calling price was associated with an 8 per-cent increase in bilateral trade.
Moenius (2000) estimated the effect of bi-laterally shared and country-specific standardson goods trade, finding that shared standardsgenerally promoted trade. Hertel, Walmsley,and Itakura (2001) quantified the impact ontrade of greater harmonization of e-businessstandards and of automating customs proce-dures between Japan and Singapore, conclud-ing that such reforms would increase tradeflows between these countries as well as withthe rest of the world. In agricultural trade,Wilson and Otsuki (2003) find that the majorexporters of nuts and cereals would gain$38.8 billion if divergent national food-safetystandards relating to aflatoxins were replacedby the Codex international standard.
Those results show clearly that when tradeis facilitated, trade volumes riseIn their study of APEC manufacturing trade,Wilson, Mann, and Otsuki (2003a) incorpo-rate indicators linked to multiple categories oftrade facilitation into a single model, thus al-lowing a synthetic analysis that prioritizesareas for reform. The authors estimate the re-lationship among four indicators and tradeflows using a gravity model.28 Wilson, Mann,and Otsuki (2003b) expand the scope of theanalysis to include 75 countries worldwide,including 52 developing countries. The indica-tors in the analysis are:
• Port efficiency (through measurementsof port infrastructure)
• Customs environment (including nontar-iff fees)
• Regulatory environment (including trans-parency of government policy and con-trol on corruption)
R E D U C I N G T R A D I N G C O S T S I N A N E W E R A O F S E C U R I T Y
193

• Use of e-commerce by businesses, aproxy for the service-sector infrastruc-ture necessary to implement e-business.
The study estimates the potential increase intrade following improvements in each trade-facilitation area. The authors examine a sce-nario in which trade-facilitation capacity inbelow-average countries is raised halfway to theaverage for the entire set of countries. This ap-proach recognizes that in some countries tradeis already being facilitated at levels approachingthe global best, leaving little room for improve-ment, whereas in others a standardized im-provement of, say, 10 percent in trade facilita-tion would be quite difficult, requiringadditional capacity-building assistance. Figure5.3 illustrates the projected gain, by trade-facil-itation indicator, for the 75 countries examined.
Preliminary findings suggest that bettertrade facilitation would increase trade amongthe 75 countries by approximately $377 bil-lion dollars—an increase of about 9.7 percent.About $33 billion (0.8 percent) of the gain
would come from improved customs regimes,and about $107 billion (2.8 percent) frommore efficient ports. But the largest gain—$154 billion, or 4.0 percent—would comefrom enhancing infrastructure in the servicessector (figure 5.3). Reforms and improve-ments affecting exports would have a greatereffect on trade growth than would changes af-fecting imports, suggesting that the export-promotion effect of trade facilitation shouldnot be underestimated in designing capacity-building efforts.
The impact of individual trade-facilitationmeasures differs significantly from region toregion, but improvements in service-sector in-frastructure would provide the largest gain insum of imports and exports in all regions—particularly in South Asia (figure 5.4). The po-tential gains from improvements in port effi-ciency also are great—again, particularly inSouth Asia.
The gains to be expected from domestic re-form alone (figure 5.5) show similar patternsto those projected for global reforms, imply-ing that priority areas for domestic reform areconsistent with reforms to raise capacity glob-ally. In assigning priorities for capacity build-ing, enhancing port efficiency and improvingservice-sector infrastructure appear to be mostimportant for domestic and global action.
Reforming domestic policies is indispensableThe benefits from investment in modern cus-toms, port facilities, and new technology, how-ever, can only be realized if an appropriate reg-ulatory framework is in place. In this regard,domestic reforms have an important role toplay, by making better use of existing resourcesand improving the efficiency of services. Liber-alization of transport and telecommunicationnetworks can help encourage domestic compe-tition and produce substantial cost reductions.Liberalization also offers the added advan-tage of widening the availability and choice of services in many developing countries. Asdiscussed earlier, the prevalence of anticom-petitive practices by transport service providers
G L O B A L E C O N O M I C P R O S P E C T S 2 0 0 4
194
Figure 5.3 Facilitating trade in less-efficient countries would bringsignificant gainsTrade gains from raising handling capacity in 75 below-average countries halfway to the global average(percent change and dollar gain)
Source: Calculations based on table 4 in Wilson, Mann,and Otsuki (2003b).
4.5
4
3.5
3
2.5
2
1.5
1
0.5
0Ports
Exportpromotion
Importpromotion
Customs Regulations Services
�
�
0
20
40
60
80
100
120
140
160

calls for the development of efficiency-orientedcompetition policies. Replacement of ineffi-cient public monopolies in international trans-port systems with private operators can thusincrease competition.
Cross-country comparisons provided inWilson, Mann, and Otsuki (2003b) reveal sig-nificant difference in countries’ potential forgains from trade facilitation. Guatemala, forexample, has great potential to reap trade gainsby reforming its service-sector infrastructure.In contrast, the potential importance of regu-latory reform predominates in Indonesia. InNigeria, reform of the customs system wouldhave the most productive outcome. In all coun-tries, domestic reform would have greater im-pact on total trade than would reforms by trad-ing partners.
Trade facilitation and the WTO agenda
The Singapore Ministerial Declaration in1996 empowered the WTO for the first
time to look at trade facilitation in a compre-
hensive fashion.29 Exploratory work on thetrade-facilitation agenda centered on ways tosimplify trade procedures, to harmonize themto conform to a rule-based multilateral frame-work, and to integrate the work of other in-ternational organizations involved in trade-facilitation into the WTO framework. Butprogress on trade facilitation at WTO’s nexttwo ministerial conferences was limited.30
The Doha Declaration raised the issue of negotiations on trade facilitationThe Doha ministerial raised the possibility oflaunching multilateral negotiations on tradefacilitation at the Cancun ministerial meetingin September 2003.31 The “Doha agenda” ontrade facilitation referenced simplifying tradeprocedures, enhancing technical assistance andcapacity building, and recognizing limitationsin capacity associated with a country’s level ofdevelopment. The Doha ministerial declara-tion was explicit in recognizing the need to in-crease trade-related capacity in developingcountries and address the issue of implementa-tion costs associated with capacity building,
R E D U C I N G T R A D I N G C O S T S I N A N E W E R A O F S E C U R I T Y
195
Figure 5.4 The impact of individual trade-facilitation measures differs significantly from region to region
Source: Wilson, Mann, and Otsuki (2003b).
Trade gains (exports plus imports) under the “halfway to average” scenario; gains from domestic and partners’ reforms (percent change)
20
18
16
14
12
10
8
6
4
2
0OECD
Ports Services
Regulations
East Asia Europe and Central Asia
Latin Americaand the
Caribbean
Middle East and
North Africa
South Asia Sub-SaharanAfrica
��
�
�
Customs

particularly in developing and least-developedcountries.
Some proposals under discussion envisageeither building new or strengthening existingrules and principles of transparency, simplifi-cation, efficiency, proportionality, nondiscrim-ination, and due process within the country forindependent litigations involving trade dis-putes, as well as recourse to the WTO DisputeSettlement Undertaking, if need be, to ensurenondiscriminatory treatment of traders in mem-ber countries.
Not everyone agrees that trade facilitationmeasures should be on the agenda at Cancun.Proposals advanced by the proponents of arules-based approach to trade facilitation focuson the role and importance of the WTO. Arenational governments free, they ask, to followthe recommendations of the WCO’s revisedKyoto convention on customs procedures? Arethey likely to do so? Or should these recom-mendations be a reference point for WTOrules?32 The WTO has many more membersthan WCO, the proponents point out, and therevised recommendations of the Kyoto con-
vention have not been ratified by all WCOmember countries. To the proponents, a bind-ing framework would help establish effectivecompliance with the recommendations of therevised Kyoto convention.
The challenges to negotiations on trade fa-cilitation center on two concerns. First, it isnot clear that binding multilateral rules oncustoms and border-crossing procedures areactually needed; implementing institutionalchanges requires country ownership and vol-untary actions. Second, it is not clear that anynew rules could be enforced through con-ventional dispute-settlement proceedings andpenalties, since violations of those rules oftenstem from the limited capacity of governmentsto meet their obligations. Rules alone are notlikely to produce the desired reforms or mod-ernizations. Those depend on capacity building,and capacity building depends on resources—financial and other.
Simplifying administrative and proceduralrequirements in customs and border-crossingprocedures—unlike negotiations on tariff cuts,for example—depends directly on improve-
G L O B A L E C O N O M I C P R O S P E C T S 2 0 0 4
196
Figure 5.5 Domestic reforms alone would produce many of the same gains as global reform
Trade gains (exports plus imports) under the “halfway to average” scenario; gains from domestic reforms only(percent change)
Source: Wilson, Mann, and Otsuki (2003b).
OECD East Asia Europe andCentral Asia
Latin Americaand the
Caribbean
Middle Eastand
North Africa
South Asia Sub-SaharanAfrica
0
2
4
6
8
10
12
14
16
��
�
�
Services
Regulations
Ports
Customs

ments in physical infrastructure, institutionalreform, and other complex development ob-jectives that typically involve large commit-ments of resources for training and capitalequipment. In an environment of constrainedresources, expenditures on such improvementsmust be made in accordance with the priori-ties of the national development strategies.
The trade-facilitation agenda requires a broad multilateral effort Trade facilitation necessarily involves both in-frastructure investments and revisions in legalframeworks, technology training, and othermeasures. A little capacity building could go along way. Expediting customs clearance proce-dures by providing transparent and clear guide-lines, for example, reduces the discretionarypower of customs officials, thereby reducingthe scope for corruption by establishing a rightof independent judicial appeal (box 5.3). Assis-tance to modernize customs procedures by up-grading information technology and applyingrisk-based criteria in reviews of documentationand cargo, allowing for self-assessment andaudit-based (as opposed to transactions-based)release of goods can also have high payoffs(box 5.4).
Because behind-the-border policies affectcross-border trade, trade-related capacity
building must have a broad scope. The proce-dural and administrative burdens on tradersare often aggravated by overlapping and du-plicative informational requirements from sev-eral ministries, departments, or agencies. Newways of minimizing such requirements includethe single-window concept: official controls areadministered by a single agency. This and otherinnovations often require coordination of sev-eral government agencies, as well as changes in domestic regulatory procedures and institu-tional structures.
Multilateral agreement on standards oftransparency and acceptable fees as well as new ways to publish and disseminate applica-ble trade laws, rules, fees, and schedules—per-haps through a new information clearinghouseor inquiry center for WTO members—couldhelp countries facilitate trade. Discussions alsocould include development of harmonized andquantifiable measures of “timely release ofgoods.” Consideration of wider use of the “sup-plier’s declaration of conformity” with techni-cal regulations for low-risk goods—along witha parallel program to expand information tech-nology systems and databases—could decreaseand simplify documentation requirements.Strengthening the provisions of GATT ArticleV (Freedom of Transit) could be particularlybeneficial to land-locked countries.
R E D U C I N G T R A D I N G C O S T S I N A N E W E R A O F S E C U R I T Y
197
Eliminating customs corruption in Peru requiredchanges in laws, regulations, and human-
resources policy. After firing corrupt employees, the Peruvian cus-
toms service established a uniform code of conductand contracted with a university to develop tests ofemployee competence. Continued employment wascontingent on passing the tests. Although substantialpressure was exerted on the customs service to rehiredischarged employees, it was able to resist the pres-sure with support from government allies. As a resultof these efforts, employee corruption decreased,while competence levels improved. Salaries of
Box 5.3 Tackling corruption in customs: Peruretained personnel were increased by nearly 10 timesthe previous salaries.
To increase the competence of customs officers,hiring for professional positions was limited to uni-versity graduates. The service established a trainingacademy, offering up to one year of training to newand incumbent employees. In addition to these ef-forts, customs embarked on a program to bring newskills and knowledge to the organization throughexternal recruitment of mid-career professionals—economists, auditors, statisticians, and informationtechnology experts.
Source: Wilson et. al (2002).

Any negotiation on trade-facilitation mea-sures, however, must carefully consider how theWTO’s dispute-settlement provisions could betailored to ensure that the capacity constraintsof developing countries are taken into accountwhen enforcing commitments undertaken bygovernments. Important capacity-building workdone by several institutions outside the WTOframework provides a model for a future mul-tilateral agenda to raise trade-facilitation ca-pacity in developing countries. It is difficult tosee how this level of institutional change andassistance coordination could be “enforced”through dispute settlement mechanisms.
Lowering transport costs,increasing security, and facilitating trade
The costs of moving goods across interna-tional borders are a crucial determinant of
a country’s export competitiveness. Every dayspent in customs adds almost 1 percent to the
costs of goods. High costs also result from reg-ulations and practices that impede effectivecompetition in international transport systems.
Open skies and universal service canlower international transport costs fordeveloping countriesImproving competition in air transport will re-quire revisions in air service agreements to re-duce barriers to entry into markets. Movingprogressively toward “open skies” agreementswould allow all airlines to fly on all routes be-tween two countries without any ex ante con-trols on capacity. This would lower air cargofreight rates and could allow air service opera-tors to obtain greater economies of scale andscope, offering additional cost savings. It maywell be that liberalization in protected air ser-vice markets may lead to consolidation amongairlines, as operators seek to generate largerscale and network economies. (Consolidationmay not necessarily reduce competition, how-ever, as fewer operators may compete on a
G L O B A L E C O N O M I C P R O S P E C T S 2 0 0 4
198
Lebanon’s ongoing customs reform project is partof a fiscal reform project under the sponsorship
of the United Nations Development Programme andthe World Bank. An inefficient customs service haslong been a major logistical bottleneck in Lebanon.Procedures were nontransparent and time-consum-ing. Most of the 7–12 days needed for container de-livery were due to customs delays. Such deficienciesnot only imposed unnecessary economic costs butalso bred corruption.
Under the reform project, customs clearance wasreduced from 13 to 5 basic steps—entry and accep-tance of declaration, inspection of goods for verifica-tion of declared information, assessment of informa-tion, automatic calculation of taxes, and payment oftaxes. Clearance procedures were then aligned withinternational procedures, with UN and EU standardstranslated into Arabic for the first time. A one-pageadministrative document replaced 26 complex andoutdated forms. These reforms enabled the clearanceprocess to be computerized, with a new software
Box 5.4 Customs reform in Lebanonprogram monitoring the days required for clearance.The computerization process was accompanied bystaff training and a restructuring of work procedures.Clearance operations were set up on the shop floorsof some of the main importers and exporters, withinspectors using risk-assessment criteria to conductselective inspections. To inform users of their rightsand responsibilities and to further streamline the in-spection process, the customs service published asummary of its border regulations.
Preliminary results of the ongoing reform indi-cate that although the percentage of consignmentscleared without inspection had quadrupled between1997 and 1999 (from 10 to 40 percent) and the aver-age days needed for clearance had declined from sixto four as a result of more selective testing, the aver-age rate of tariff collection remained constant.
Source: Mueller-Jentsch (2002).

larger number of routes.) Even with open entry,thin traffic densities and the associated lack ofeconomies of scale are likely to remain key ob-stacles to lowering air freight rates in the de-veloping world. If liberalization leads airlinesto adopt hub-and-spoke networks, prices couldfall on well-connected hub routes, while risingon some spoke routes. To reduce this risk bycross-subsidizing transport to remote and poorareas within continents, the concept of univer-sal service should be embraced internationally.Rich countries could offer tax breaks on aircargo service provided to certain developingcountry locations. Alternatively, an interna-tional fund for the provision of universal airservices could be established.
For maritime transport, one avenue to im-provement would be to subject the industry toMFN treatment in routes as part of the largerGATS discussion on services. Doing so wouldundermine the competition-restricting linercodes that prevent new entries in designatedshipping routes. Another avenue would be toreview exemptions in U.S. and EU antitrustlaw for maritime transport.
Security can be increased withoutjeopardizing trade flows from developing countriesEven though the costs of compliance with newsecurity measures could be large and dispro-portionate for smaller countries, all partici-pants in the global trading system have an in-centive to invest in counterterrorism. Suchinvestments are likely to pay off in the longrun through efficiency gains, better manage-ment of information, and greater use of elec-tronic commerce. To ensure that they do, sev-eral steps must be taken.
First, technical assistance must be increased.The IMO, ICAO, and other organizationsshould step up their technical cooperation ef-forts to provide more training in risk assess-ment, customs administration, and infrastruc-ture planning in their client countries.
Second, nations must coordinate trade-re-lated actions not only with other countries, butalso with their own private sectors. The inter-
dependence and linkages among differenttransport modes call for a coordinated ap-proach to security among sectors and modes.Regional and bilateral partnerships amongcountries can strengthen channels for informa-tion exchange and cooperation in training andsharing of best practices, resulting in mutualenhancement of security efforts. Other regionscould follow APEC’s lead by looking for waysto design collaborative programs with the pri-vate sector to implement security measures.
Third, a risk-assessment template wouldensure that high-risk areas are targeted forspecial security programs. The measuresadopted should be those that distort trade theleast and provide the greatest benefits, espe-cially for exports from developing nations.
Fourth, a formula for cost-sharing must bedeveloped. The Hong Kong Shippers Coun-cil (HKSC) and the ASEAN Federation ofForwarders Associations (AFFA) have urgedthe USCS to subsidize the cost of its newrequirements and U.S. importers to share with Asian exporters the burden of providinginformation.
Trade facilitation depends on capacitybuilding and development assistance Capacity building and development assistanceare necessary if countries are to make the mostof trade-facilitation measures—whether thosemeasures stem from security imperatives ormultilateral trade talks. Attempts to build tradecapacity may require several elements—frombuilding basic transport infrastructure to mak-ing legislative changes and training regulators.Some developing countries may require onlytechnical assistance to expedite cargo clearancethrough electronic trade documentation. Oth-ers will need much more help. No single pack-age will meet the needs of all countries.
Whether or not trade facilitation becomespart of multilateral trade negotiations, mea-sures that lower transport costs, remove barri-ers to goods and services moving across bor-ders, and build capacity in trade facilitationmust be pursued. Success will depend first ongovernments and the private sector in devel-
R E D U C I N G T R A D I N G C O S T S I N A N E W E R A O F S E C U R I T Y
199

oping countries, but also on the G-8, UNagencies, the WCO, the World Bank, and otherinternational development institutions. Multi-lateral efforts to support domestic policy re-form and institutional improvements in devel-oping countries are particularly important ifinvestments in trade facilitation are to yieldtheir full potential—a potential that is greatindeed.
Notes1. These sections draw on Wilson and others
(2002), among other sources.2. A study of the effect of security on private in-
vestment and growth by Poirson (1998) spanning 53developing countries from 1984–95 indicates that en-hanced security fosters private investment and growthin developing economies. Private investment in theshort run increased by 0.5 to 1 percentage point ofGDP, in relatively insecure countries that adopted se-curity measures to the levels in “best practice” regions.Moreover, economic growth received a boost by 0.5 to1.25 percentage points per year in the long term.
3. The newly created Department of Homeland Se-curity includes Customs, Immigration and Naturaliza-tion Services (INS), Border Patrol, and the federal Agri-cultural Inspection Service. The Department provided$170 million in port security grants in June 2003.Under discussion is a plan that would include an addi-tional $1 billion for the Transportation Security Ad-ministration, $200 million to $700 million more forthe Coast Guard, and an increase in federal grants tolocal police and fire departments for counterterrorismtraining.
4. Some overseas suppliers are covered under the C-TPAT because they are subsidiaries of U.S. compa-nies enrolled in the initiative.
5. The Swedish port of Goteborg has become thetwelfth to join the Container Security Initiative (as ofMay 2003). Those already participating include: Rot-terdam, LeHavre, Bremerhaven, Hamburg, and Ant-werp in Europe; Singapore, Hong Kong, and Yoko-hama in Asia; and Vancouver, Montreal, and Halifaxin Canada. These ports are at different stages of imple-mentation of the CSI framework. CSI is now movinginto its second phase, which will include Turkey, Dubai,and about 20 other nations in Asia, Latin America,Europe, and Africa.
6. On a related note, Europe’s largest air cargo car-riers, which are calling for a level playing field amongthe United States, Europe, and the rest of the world as
far as security and its costs are concerned, criticizedU.S. government aid of $10 billion to its airlines toconform to increased security measures. European car-riers believe that the aid has helped U.S. carriers slashrates on very competitive North Atlantic routes.
7. Another proposal under consideration is the fil-ing of a bill of lading by U.S. Agricultural exporters 24hours before loading the containerized freight.
8. The Agricultural Ocean Transport Coalition hasurged Customs to require no more than 12 hours ad-vance notice for agricultural products and 6 hours forperishable products.
9. U.S. VISIT, a new entry-exit system to be in-stalled in U.S. airports and seaports by January 1, 2004,will be based on visas that include biometric featuressuch as fingerprints and photographs to identify foreignvisitors. The EU has also earmarked Euro 140 millionto fund biometric identification technology for visas.
10. A U.S.-EU dilemma arose over reservationrecords demanded by the United States that violatedEU’s data privacy rules. An interim agreement wasreached, after the United States assured the Europeanairlines of “appropriate handling” of the records,which include not only names but also the passenger’sitinerary, contact phone number, and other details,such as credit card numbers.
11. The United States has initiated “smart border”programs with Canada and Mexico, that use moderntechnology to enhance security and expedite movementacross borders.
12. Canada levied a C$24 (US$15) Air Traveller’sSecurity Charge on all round-trip tickets in April 2002,to finance the increased airport security measures. Thetax—the highest security tax in the world—contributedto a 10.2 percent decline in passenger traffic acrossCanada since the beginning of 2002, and resulted in asteep fall of 50 percent on some short routes.
13. Recognizing the lack of resources to buy newtechnology, the United States intends to provide fi-nancing to developing countries with transportationsecurity projects. Two security experts from the UnitedStates have arrived in Indonesia to assist in upgradingcargo security and assess the implementation of secu-rity measures at the country’s seaports and airports.The United States announced a joint initiative withThailand to transform Laem Chabang port into a safetransportation port.
14. Given that a ship carries thousands of contain-ers at any time, inspection of the cargo could cause de-lays. While the scanning process is quite fast, the prob-lem lies with the turnaround time of the containerstargeted for scanning. It would take time to transportthe container to and from the scanning area, and con-
G L O B A L E C O N O M I C P R O S P E C T S 2 0 0 4
200

tainers that are late for loading would tie up haulingequipment and reduce stowage efficiency.
15. In other developments:• The Japanese Ministry of Land, Infrastructure,
and Transport (MLIT) is set to introduce anti-terrorist legislation that will prevent foreignships from entering Japanese ports unless theyhave a security crew on board and can provideidentification.
• Hong Kong’s customs authorities have created aterrorist response system, acquiring mobile x-raymachines and a radiation detector to scan cargoand beefing up its intelligence capabilities withmore staff and equipment.
• The ICAO has adopted resolutions designed toassure the safety of passengers, ground crew per-sonnel, and the public. Its Regulated Agent Re-gime requires parties in the flight chain to imple-ment measures to strengthen air-cargo security.
• The Australian government’s Aviation TransportSecurity Bill aims to provide screening of all bag-gage checked on international flights. A $100million federal plan to protect the nation’s mar-itime gateways also has been enacted.
• The New Zealand government will be allocating$5.9 million next year and $1.9 million in futureyears to the Ministry of Foreign Affairs andTrade, for security.
16. A recent online survey by BDP International in-dicated by a three to two margin that exporters believedthe implementation of the 24-hour rule would enhancesecurity. About 23 percent of those surveyed said thatthe impact was extreme, 30 percent reported moderateto significant costs of compliance, half did not knowhow to recover costs, and 42 percent plan to absorb ex-penses. With respect to implementation of the advancemanifest filing rule, USCS has issued less than 400 “No-Load” directives for violations of cargo description re-quirements in its first three months of enforcement.
17. Tea money refers to the use of illegal or unfairmeans, such as bribery to gain an advantage in busi-ness. Ports and airports all over the world are placeswhere tea money comes in handy to expedite deliveriesand shipments.
18. Estimates by Leonard were made soon after theevents and could reflect the major disruptions facedduring the period.
19. This figure is comparable to the estimates of$30–58 billion losses for the insurance industry by theOECD (2002b).
20. The authors employ four alternative scenarios to quantify the trade and welfare impacts, in which allfrictional costs are increased by 1 percent ad valorem.
However, assumptions are made regarding such in-creases as varying across regions and sectors accordingto exposure to terrorism risks following the Septem-ber 11 attacks. For example, high-risk regions (NorthAmerica, Middle East, North Africa) are assumed to ex-perience increases in frictional costs that are two and ahalf times as high as cost increases in low risk regions.The figure shows only the uniform increase in frictionalcosts to trade.
21. Since a large part of the airfreight is transportedin the bellies of passenger planes, a cutback in passen-ger flights has an impact on cargo.
22. Australia and New Zealand are strengtheningtheir Pacific regions border control relationship by co-operating and exchanging information regardingsmuggling, air and sea cargo security approaches,SARS, and general border protection issues.
23. In its “Cargo Security White Paper,” the Na-tional Customs Brokers and Forwarders Association ofAmerica (NCBFAA) has outlined ways for the tradingindustry to assess risks, build information links to helpgovernment officials, and use technology to improvecargo security. It recommends building a “chain of cus-tody dataset” to verify people connected to a shipmentand assess cargo security throughout the supply chain.
24. See Amjadi and Yeats (1995).25. This part draws extensively from the WTO
(1999). 26. See UNCTAD 2001, table 8, page 33.27. APEC (1999). 28. See Global Competitiveness Report 2001–2002,
World Competitiveness Yearbook 2001–2002, andKaufmann, Kraay, and Zoido-Lobaton (2002), for thelist of countries in the dataset.
29. The ICC, a nongovernmental organization thathas long advocated trade facilitation, promoted thesubject on the WTO agenda at the Singapore minister-ial meeting.
30. The Ministerial conference in Geneva (1998)concentrated on the perceived threat to the globaleconomy due to the ensuing Asian financial crisis. Al-though there were several proposals in favor of andagainst launching trade negotiations in the period priorto the Singapore ministerial meeting in 1999, trade fa-cilitation was overshadowed by other events at theSeattle ministerial (Woo 2002).
31. The Doha declaration states: “Recognizing thecase for further expediting the movement, release, andclearance of goods, including goods in transit, and theneed for enhanced technical assistance and capacitybuilding in this area, we agree that negotiations willtake place after the fifth session of the ministerial onthe basis of a decision to be taken, by explicit consen-
R E D U C I N G T R A D I N G C O S T S I N A N E W E R A O F S E C U R I T Y
201

sus, at the session on the modalities of the negotiations.In the period until the fifth session, the Council forTrade in Goods shall review and, as appropriate, clar-ify and improve relevant aspects of Articles V, VIII, andX of the GATT 1994 and identify the trade-facilitationneeds and priorities of members, in particular develop-ing and least-developed economies. We commit our-selves to ensuring adequate technical assistance andsupport capacity building in this area.” WTO (2001).
32. See WTO (2002) and Messerlin and Zarrouk(2000).
ReferencesAmjadi and Yeats. 1995. “Have Transportation Costs
Contributed to the Relative Decline of Sub-SaharanAfrican Exports? Some Preliminary Evidence.”World Bank Working Paper 1559.
APEC (Asia Pacific Economic Cooperation). 1999. “As-sessing APEC Trade Liberalization and Facilita-tion.” Update, Economic Committee. September.
Fink, Carsten, Aaditya Mattoo, and Ileana CristinaNeagu. 2002a. “Trade in International MaritimeServices: How Much Does Policy Matter?” WorldBank Economic Review 16(1): 81–108.
———. 2002b. “Assessing the Impact of Communica-tion Cost on International Trade.” World BankWorking Paper 2929.
Freund and Weinhold. 2000. “On the Effect of the In-ternet on International Trade.” Board of Gover-nors of the Federal Reserve System InternationalDiscussion Paper 693.
Gausch and Kogan. 2001. “Inventories in DevelopingCountries: Levels and Determinants, a Red Flagon Competitiveness and Growth.” World BankWorking Paper 2552.
Hertel, T., T. Walmsley, and K. Ikatura. 2001. “Dy-namic Effects of the ‘New Age’ Free Trade Agree-ment between Japan and Singapore.” Journal ofEconomic Integration 24: 1019–49.
Hummels, D. 2001. “Time as a Trade Barrier.” Unpub-lished. Department of Economics, Purdue Univer-sity, West Lafayette, Ind.
Kaufmann, Kraay, and Zoido-Lobaton. 2002. “Gover-nance Matters II: Updated Indicators for 2000–01.”World Bank Working Paper 2772.
Leonard, J. 2001. “Impact of the September 11, 2001,Terrorist Attacks on North American TradeFlows.” E – Alert, Manufacturers Alliance, Ar-lington, Virginia.
Messerlin, Patrick A., and Jamel Zarrouk. 2000.“Trade Facilitation: Technical Regulations andCustoms Procedures.” The World Economy 23(4): 577–593.
Mueller-Jentsch, Daniel. 2002. Transport Policies forthe Euro-Mediterranean Free-Trade Area. AnAgenda for Multi-modal Transport Reform in theSouthern Mediterranean. World Bank TechnicalPaper 527. Washington, D.C.
Moenius, Johannes. 2000. “Three Essays on TradeBarriers and Trade Volumes.” Ph.D. dissertation.University of California, San Diego.
OECD (Organisation for Economic Development andCo-operation). 2002a. “The Impact of the Ter-rorist Attacks of 11 September 2001 on Interna-tional Trading and Transport Activities.” Unclas-sified Document TD/TC/WP (2002)9/Final. Paris.
———. 2002b. “Economic Consequences of Terror-ism.” OECD Economic Outlook 71: 117–40.Paris.
Poirson. 1998. “Economic Security, Private Investmentand Growth in Developing Countries.” IMFWorking Paper WP/98/04.
Reddy, R. 2002. “Friction over Security Gaps,” Intelli-gent Enterprise. October 8 (Available at http://www.intelligententerprise.com/021008/516infosc1-1.shtml)
Subramanian U., and J. Arnold. 2001. Forging Subre-gional Links in Transportation and Logistics inSouth Asia. World Bank, Washington, D.C.
UNCTAD (United Nations Commission on Trade andDevelopment). 2001. E-Commerce and Develop-ment Report.
Walkenhorst, Peter, and Nora Dihel. 2002. “Trade Im-pacts of the Terrorist Attacks of 11 September2001: A Quantitative Assessment.” Paper preparedfor the Workshop on The Economic Consequencesof Global Terrorism. Berlin, June 12–13.
Wilson, John S., and Tsunehiro Otsuki. 2003. “FoodSafety and Trade: Winners and Losers in a Non-harmonized World.” Journal of Economic Inte-gration 18 (2): 266–87.
Wilson, John S., Catherine L. Mann, and TsunehiroOtsuki. 2003a. “Trade Facilitation and EconomicDevelopment: Measuring the Impact.” WorkingPaper 2933. World Bank, Washington, D.C.
———. 2003b. “Trade Facilitation and CapacityBuilding: Global Perspective.” Unpublished. WorldBank, Washington, D.C.
Wilson, John S., Catherine L. Mann, Yuen Pau Woo,Nizar Assanie, and Inbom Choi. 2002. Trade Fa-cilitation: A Development Perspective in the Asia-Pacific Region. Singapore: APEC Secretariat.
Woo, Yuen Pau. 2002. “Trade Facilitation in theWTO: Singapore to Doha and Beyond.” In WillMartin and Mari Pangestu, eds., Options for theNext Trade Round: View from East Asia. Cam-bridge, U.K.: Cambridge University Press.
G L O B A L E C O N O M I C P R O S P E C T S 2 0 0 4
202

World Bank. 1997. “Multilateral Freight Transport:Selected Regulatory Issues.” Report 16361-BR.
———. 2001. Global Economic Prospects 2002: Mak-ing Trade Work for the World’s Poor. Washing-ton, D.C.
WTO (World Trade Organization). 1999. “Develop-ment Aspects of Trade Facilitation.” WT/COMTD/W/57. Geneva.
———. 2001. “Doha WTO Ministerial Declaration.”WT/MIN(01)/DEC/1. Geneva. November.
———. 2002. “Compendium of WCO Capacity Build-ing Tools.” G/C/W/445. Geneva.
R E D U C I N G T R A D I N G C O S T S I N A N E W E R A O F S E C U R I T Y
203


The challenges confronting developingcountries seeking to expand their inter-national trade are primarily domestic.
Countries that have expanded their share ofglobal markets have generally shared certainconditions: a progressively more open domes-tic trade regime; a supportive investment cli-mate; and complementary policies relating toeducation, health, and infrastructure. Most ofthis agenda is national and requires domesticpolicies to deal with prevailing constraints toincreasing trade. The World Trade Organiza-tion (WTO) negotiating agenda is necessarilylimited to a narrow subset of issues that over-laps only partially with priority developmentconcerns for most countries (Finger 2001).
In this sense, the WTO is not a comprehen-sive development institution. It is a negotiat-ing forum in which governments make tradepolicy commitments that improve access toeach others’ markets and establish rules gov-erning trade. Developing countries can gainfrom both functions: first, because trade open-ness, growth, and poverty reduction are mutu-ally reinforcing; and, second, because a rules-based world trading system protects smallplayers that have little ability to influence thepolicies of large countries. Rules can reduceuncertainty by placing mutually agreed limitson the policies that governments may adopt—thus potentially helping to increase domesticinvestment and lower risks.
Historically, many WTO rules evolved to re-flect the perceived interests of developed coun-tries in an era when the participation of devel-oping countries was limited. Many rules reflectthe status quo practices that have already beenadopted in industrial countries. The wider lati-tude accorded agricultural subsidization re-flects the use of such support policies in manydeveloped countries. The same is true for thepermissive approach historically taken towardthe use of import quotas on textile products—in principle prohibited by General Agreementon Tariffs and Trade (GATT) rules. New disci-plines adopted in the WTO often mirror regu-latory practices of rich countries. For example,the recent inclusion of rules on the protectionof intellectual property rights has led to the per-ception that the WTO contract demands regu-latory changes in developing countries withoutany corresponding changes in regulatory poli-cies in industrial countries.1
As developing countries have become moreactively involved in the WTO, the challenge isto design rules that promote development.Meeting that challenge means evaluating theimplications of various ways to achieve thisobjective. Rarely is this a straightforwardprocess, especially when it comes to the“behind-the-border” regulatory policies thatare increasingly the subject of multilateral dis-cussions. Negotiating pro-development rulesin such a context requires the active engage-ment of developing countries.
205
Development and the Doha Agenda
6

The developing countries’ traditional ap-proach has been to seek differential treatment.“Special and differential treatment” (SDT) pro-visions in the WTO span three core areas: pref-erential access to developed-country markets,typically without reciprocal commitments fromdeveloping countries; exemptions or deferralsfrom some WTO rules; and technical assistanceto help implement WTO mandates. What con-stitutes a developing country is not defined inthe WTO—a country’s status is a matter of self-declaration. All in all, the current system hasnot worked especially well, and many countriesare seeking a new approach.
Trade preferences have been disappointingin delivering market access: the dilemmaDeveloped countries grant preferences volun-tarily rather than as part of a binding multilat-eral negotiation. Those preferences often comeladen with restrictions, product exclusions, andadministrative rules. Preference programs oftencover only a share of exports from developingcountries, and among those eligible countriesand products, only a fraction of preferences areactually utilized. Products and countries withexport potential often do not receive prefer-ences, whereas eligible countries and productcategories often lack export capacity.
Another problem is that preferences, evenwhen effective, are likely to divert trade awayfrom other excluded developing countries be-cause the exports of developing countries tendto overlap more with each other than withthose of developed countries.
Finally, preferences do little to help themajority of the world’s poor. Most of thoseliving on less than $1 per day live in countrieslike China, India, Pakistan, and Association of Southeast Asian Nations (ASEAN) membercountries, which receive limited preferences in products in which they have a comparativeadvantage. Meanwhile, many middle-incomecountries justify relatively high barriers to tradeon SDT grounds, to the detriment of poorer de-veloping countries whose access is impeded.
Nondiscriminatory trade liberalization for poor countries—and poor people—is criticalRecent initiatives by developed countries to ex-tend duty- and quota-free market access for theleast developed countries (LDCs) could, if fullyimplemented, make preferences more effective.But because offering deep, unilateral prefer-ences to larger countries is not politically feasi-ble, preferences can do little for the majority ofthe poor in non-LDCs. Providing opportunityfor all of the world’s poor, therefore, requiresmultilateral, nondiscriminatory liberalizationof trade, so that all developing countries candevelop their comparative advantage. Most of the gains from trade liberalization resultfrom a country’s own reforms. As reciprocityin the exchange of liberalization commitmentsis the engine of the WTO process, both low-and middle-income countries should harnessreciprocity to gain market access.
Elements of a development-supportive traderegime would include a binding commitmentby developed countries to abolish export sub-sidies, decouple agricultural support, and sig-nificantly reduce—or eliminate—tariffs onproducts of export interest to developing coun-tries. Negotiations should target tariff peaks,specific tariffs, and tariff quotas, while aimingfor a significant overall reduction in the aver-age level of applied tariffs. The pursuit of theseobjectives would be more supportive of devel-opment than one that continues to emphasizenonreciprocal preferential access to markets.
Negotiating WTO rules that supportdevelopment is a major challengeTrade-policy disciplines that can be imple-mented through a stroke of pen, such as tariffreductions, are fundamentally different fromregulatory disciplines and administrative rulesthat require institutional changes. In contrastto tariff reforms, administrative rules mayrequire substantial resources to establish orstrengthen implementing institutions. Domes-tic rules and regulations must be customized to
G L O B A L E C O N O M I C P R O S P E C T S 2 0 0 4
206

local circumstances. Thus, rules relating to reg-ulatory practices are unlikely to be a develop-ment priority for every country, nor are thebenefits to global partners likely to be propor-tional in all countries. The experience after theUruguay Round with implementation of agree-ments by developing countries has demon-strated that limiting recognition of differentialcapacities and levels of development to uni-form transition periods is inadequate, as arenonbinding offers of technical assistance. Al-lowing for greater differentiation among devel-oping countries in determining the reach ofWTO rules is important.
Aid for trade must be complemented byaction in developing countriesDevelopment assistance must play an impor-tant role in helping to expand and improve thetrade capacity needed for countries to benefitfrom better access to markets. Low-incomecountries confront many challenges in identi-fying and addressing trade-related policy andpublic investment priorities. Those prioritiesshould be made explicit in the form of a na-tional development strategy. That strategy, nota WTO agenda, should drive technical andfinancial assistance. Diagnostic trade-integra-tion studies completed for several LDCs revealthat action is required in areas lying far be-yond the scope of WTO agreements. Trade fa-cilitation and logistics are especially impor-tant. Additional development assistance couldhelp low-income countries address such prior-ities. Such assistance should also help coun-tries adjust and adapt to a gradual reductionin trade preferences and address the effects ofpossible increases in world food prices.
Special and differential treatmentand the WTO
The idea that developing countries shouldreceive SDT has a long history in the
GATT/WTO system. It has three related di-mensions. First, for certain products, develop-
ing countries are granted access to developed-country markets at tariffs lower than the most-favored-nation (MFN) rates through policiessuch as the Generalized System of Preferences(GSP). Second, they may be temporarily ex-empted from certain disciplines or grantedgreater discretion to apply restrictive tradepolicies. Third, they may request technical as-sistance from high-income countries to imple-ment trade rules and related reforms.
The intellectual foundation of SDT was laidin the 1960s by Raoul Prebisch and HansSinger, who argued that developing-countryexports were concentrated mainly in com-modities with volatile and declining terms oftrade. They called for import-substitution poli-cies, supported by protection of infant indus-tries at home, and preferential access to exportmarkets. Although the rationale for these poli-cies remains controversial (see, for example,Bhagwati 1988), in 1968 the Generalized Sys-tem of Preferences (GSP) was launched underUnited Nations Conference on Trade and De-velopment (UNCTAD) auspices. This calledon developed countries to provide preferen-tial access to developing-country exports on avoluntary basis.2 Because GSP programs vio-late the GATT’s MFN rule, GATT contractingparties waived the MFN requirement in 1971for 10 years, thereby placing GSP within theGATT framework. In 1979, at the conclusionof the Tokyo Round, permanent legal coverfor the GSP was obtained through the so-called Enabling Clause,3 which called for pref-erential market access for developing countriesand limited reciprocity in GATT negotiatingrounds to levels “consistent with developmentneeds.” It also confirmed that developingcountries should have greater freedom to userestrictive trade policies. An important featureof the Enabling Clause was that SDT was to bephased out when countries reached a certainlevel of development. That level was never de-fined, however, leaving eligibility for tradepreferences to the discretion of preference-granting countries.
D E V E L O P M E N T A N D T H E D O H A A G E N D A
207

The existence of the GSP and limited reci-procity in GATT negotiations affected thepatterns of MFN trade liberalization in boththe Kennedy (1964–67) and Tokyo Rounds(1973–79) (see chapters 2 and 3). The end re-sult was larger tariff reductions in goods pri-marily of export interest to industrializedeconomies.4 Average levels of trade protectionin developing countries were reduced rela-tively little. Lack of engagement by developingcountries also facilitated the emergence of re-strictive quota regimes for textiles under theMulti-fiber Arrangement (MFA) and the effec-tive removal of GATT disciplines on agricul-ture-related trade policies (Hudec 1987).
Under the pre-WTO trade regime, new rulesextending the original GATT treaty were ap-plied on a voluntary basis. Extensions werecalled “codes,” whose disciplines bound onlythe contracting parties that signed them (Hoek-man and Kostecki 2001). This approach to ruleextension was removed with the creation of theWTO. In contrast to the GATT, all WTOagreements and disciplines, with the exceptionof rules on government procurement and tradein civil aircraft, apply to all members regardlessof level of development—although in manycases transition periods apply to developingcountries. A consequence of this so-called Sin-gle Undertaking and the expansion in the cov-erage of multilateral rules to new areas, such as intellectual property and trade in services,was that developing-country governments wereconfronted with a significant implementationagenda as well as new policy constraints.5
In the runup to WTO’s 1999 Seattle minis-terial meeting, SDT and implementation con-cerns figured prominently. The 2001 DohaMinisterial Declaration emphasized the impor-tance of SDT, stating that “provisions for spe-cial and differential treatment are an integralpart of the WTO agreements.” Paragraph 44called for a review of SDT provisions with aview to “strengthening them and making themmore precise, effective, and operational.” Onthe basis of this mandate, developing countriesmade over 85 suggestions to strengthen SDT
language in various WTO agreements. Theproposals included calls for improved preferen-tial access to industrialized countries, furtherexemptions from specific WTO rules, andbinding commitments on developed countriesto provide technical assistance to help imple-ment multilateral rules. Despite intensive talksduring 2002, no agreement on these proposalsemerged. One reason was that many of theproposals sought to convert nonbinding, “bestendeavors” language into obligations bindingon developed countries. Another was disagree-ment over what types of provisions would pro-mote development. The latter issue is funda-mental, of course, but it was never the focus ofexplicit analysis and discussion in the relevantWTO committee (Keck and Low 2003).
Market access for development
International trade helps raise and sustaingrowth—a fundamental requirement for re-
ducing poverty—by giving firms and house-holds access to world markets for goods,services, and knowledge; lowering prices andincreasing the quality and variety of consump-tion goods; and fostering specialization of eco-nomic activity in areas where countries have acomparative advantage. Through the diffusionand absorption of technology, trade fosters theinvestment and positive externalities that areassociated with learning. Policies that sheltereconomic agents from the world market im-pede these benefits and dynamic gains. Whileadjustment costs and measures to safeguardthe interests of poor households should not beneglected in the design of policies, openness totrade is associated with higher incomes (Irwin2002). Moving toward an open trade policyand identifying the needed complementarydomestic policies should consequently figurecentrally in the design of national poverty-reduction strategies. Many developing coun-tries have pursued unilateral liberalization oftheir trade regimes in the last two decades.They have also concentrated on obtaining pref-erential access to rich-country markets.
G L O B A L E C O N O M I C P R O S P E C T S 2 0 0 4
208

Preferences result in limited market access and are uncertainTrade preferences granted by developed coun-tries are voluntary. They are not WTO obli-gations. Donor countries determine eligibilitycriteria, product coverage, the size of prefer-ence margins, and the duration of the prefer-ence. Developed-country governments rarelyhave granted deep preferences in sectors wheredeveloping countries had the largest export po-tential. Indeed, preferences tend to be the mostlimited for products protected by tariff peaks(Hoekman, Ng, and Olarreaga 2002).
Developing countries often obtain only lim-ited preferences in sectors where they have acomparative advantage (table 6.1).6 In somecases, developing countries face higher averagetariffs because of the composition of their ex-ports. Some subcategories include tariff peaksthat further restrict access for developing coun-tries. The primary reason for this pattern ofprotection is that in some sectors there is strongdomestic opposition to liberalization in devel-oped countries. However, it is also partly a con-sequence of the limited engagement by devel-oping countries in reciprocal negotiations.
Benefits are often limited by design. Marketshare or value thresholds limit the extent towhich recipients can export on preferentialterms. In the United States, for example, a
country’s GSP eligibility for a given productmay be removed if annual exports of that prod-uct reach $100 million7 or if there is significantdamage to domestic industry. In the EuropeanUnion, products classified as “sensitive” onlybenefit from a 3.5-percentage-point reductionof the MFN tariff rate, except for clothing, forwhich the reduction is 20 percent.8 Most chem-icals, almost all agricultural and food products,and all textiles, apparel, and leather goods areclassified as “sensitive.”9 The European Unionalso excludes from GSP eligibility certain prod-ucts from large countries—regardless of theirper capita income. Examples include Brazil,China, India, and Indonesia. Finally, the Euro-pean Union has a safeguard clause allowingpreferences to be suspended if imports “causeor threaten to cause serious difficulties to aCommunity producer.”
In numerous instances, products or coun-tries have been removed from GSP eligibility, ei-ther as the result of specific criteria having beensatisfied (see above) or because of lobbying bydomestic interest groups in importing coun-tries. The resulting uncertainty can only have anegative impact on incentives to invest in ex-port sectors. Binding multilateral liberalizationcommitments under the WTO are more secure.The uncertainty of unilateral preferences alsoarises from conditions that may be attached
D E V E L O P M E N T A N D T H E D O H A A G E N D A
209
Table 6.1 Developing countries rarely receive significant preferences in sectors in whichthey would have a comparative advantage Import revenues, market shares, and tariff rates for key products without GSP preferences in the European Union and United States in 2001 (percent, except where otherwise noted)
Average tariffTotal imports GSP recipients’ LDC Average rate faced by
(billions of dollars) market share market share tariff rate GSP recipients
EU U.S. EU U.S. EU U.S. EU U.S. EU U.S.
Dairy products 1.4 1.2 15 11 1 1 9.9 13.4 15.9 19.7Textiles and yarn 15.3 9.6 42 21 3 1 5.4 7.8 4.6 7.2Apparel and clothing 48.7 60.8 54 47 8 7 10.2 15.3 8.8 15.9Leather products 6.1 7.6 74 24 1 1 2.3 10.4 1.9 11.5Footwear 6.5 16.1 67 18 1 1 7.5 10.6 7.4 10.0Ceramics and glassware 6.2 8.7 27 13 1 1 5.1 6.3 3.8 8.2
Note: GSP countries only; LDCs may obtain deeper preferential treatment. China is included under EU GSP but excluded by theUnited States.Source: World Integrated Trade Solution.

to eligibility. Such conditions often relate toworker protection, human rights, intellectualproperty, and the environment.10
Recent initiatives by the European Union,the United States, and several other industrial-ized countries to provide either full or much in-creased duty- and quota-free access to theirmarkets for exports from LDCs clearly im-proves the situation. However, excessively re-strictive rules of origin remain an importantimpediment to full use of these deeper prefer-ences, which, moreover, do not extend to manypoor countries with substantial trade capacity.
The use of preferences is limitedAll preferential programs, whether unilateralor reciprocal (under free-trade agreements),impose significant administrative costs relatedto enforcement of rules of origin.11 These rulesare imposed to prevent transshipment—thatis, reexport of products produced in non-eligible countries. Rule-of-origin requirementsand related inspection procedures can be quitecostly. They also may be explicitly protection-ist in intent. An example is the so-called tripletransformation rule in textiles, which requiresimported clothing to be made from textiles
produced with yarn spun in either the prefer-ence-granting or the beneficiary country. Al-though rules of origin are necessary for pref-erences to work and are beneficial in ensuringthat value is added and employment created inthe recipient country, it is important to ensurethat rules of origin are not intentionally or in-advertently protectionist.
Rules of origin and associated paperworkand administrative requirements are likely to be a major reason that many eligible productsdo not enter developed-country markets underpreference provisions—instead exporters paythe applicable MFN tariff. Except for certainalcohols, sugar, flowers, and jewelry, less thanone-third of eligible exports from beneficiarycountries entered the United States under anypreference program in 2001 (table 6.2). An in-dicator of the restrictiveness of these rules isthat only 65 percent of eligible apparel exportsfrom the Caribbean and Central America enterthe United States under all preference pro-grams, despite a preference margin of morethan 14 percent.
Limited use of preference programs is alsoobserved in other countries. Sapir (1997)showed that in 1994, only one-half of Euro-
G L O B A L E C O N O M I C P R O S P E C T S 2 0 0 4
210
Table 6.2 Utilization rates for preference-eligible products with high MFN tariffs are lowPreference use by GSP recipients in the U.S. market, 2001 (percent, except where otherwise noted)
Imports from Share under Average appliedTotal imports GSP recipients Share imported all preference tariffs on
Category (billions of dollars) (billions of dollars) under GSP programs all imports
Cut flowers 0.72 0.43 3 95 6Prepared fish 0.72 0.47 7 13 9Cane or beet sugar 0.56 0.41 29 77 6Fruit, nuts 0.78 0.34 20 33 15Unmanufactured tobacco 0.75 0.58 3 7 68Acrylic alcohols 1.56 0.73 55 94 5Ethers, ether-alcohols 1.78 0.34 84 84 5Carboxylic acids 1.64 0.73 4 4 5Trunks, suitcases 4.59 1.17 0 6 10Articles of leather 2.68 0.52 18 21 8Plywood and panels 1.10 0.46 18 22 5Footwear 13.87 2.39 0 1 11Apparel, knitted 25.00 11.50 0 25 14Apparel, not knitted 35.10 15.90 1 15 14Hats, headgear 0.96 0.33 0 2 7Articles of jewelry 5.40 2.10 54 70 6
Note: Table reports data on imports (at the 4-digit HS classification) of products on which the United States applied tariffs thatexceeded 4 percent in 2001, and where GSP recipient countries had significant exports to the United States.Source: U.S. International Trade Commission.

Table 6.3 Actual use of preference programs is decliningQuad country imports from GSP beneficiaries (billions of dollars) and ratio of use of available preferences (percent), 1994–2001
Rate of useEligible for Receiving of preferences
Year Total imports Dutiable imports preference preference (percent)
1994 448 283 162 83 51.11995 539 331 195 108 55.11996 585 351 178 100 56.01997 575 346 200 100 50.11998 543 311 183 74 40.61999 548 290 166 68 40.72000 623 308 171 72 42.02001 588 296 184 71 38.9
Source: Inama (2003).
pean imports that could potentially benefitfrom GSP entered under this preferentialregime, reflecting the combined effect of rulesof origin and tariff quotas. In 2001, importsby the Quad (Canada, the European Union,Japan, and the United States) from GSP bene-ficiaries totaled $588 billion, of which $296billion were subject to duties and $184 billionwere covered under various preferential pro-grams (table 6.3). Only $71 billion of the eli-gible exports actually received preferentialtreatment (approximately 39 percent of eligi-ble exports). The share for LDCs, however, ishigher at approximately 60 percent (Inama2003), reflecting less restrictive treatment.
Who benefits from preferences?A relatively small number of mostly middle-income countries are the main beneficiaries ofpreference programs. These countries have thecapacity to exploit the opportunities offeredby meeting the administrative requirements. In2001, 10 of the 130 eligible countries ac-counted for 77 percent of U.S. non-oil importsunder GSP provisions (figure 6.1). The samecountries accounted for only 49 percent of allimports from GSP-eligible countries. How-ever, some small countries have benefited sig-nificantly from preferential access to marketswhere high tariffs, subsidies, or other policiesare used to drive the domestic price of theproduct to levels well above the world marketprice. An example is Mauritius, which has
preferential access to the EU market for sugarand has been granted a relatively large quota(Mitchell 2003). Such benefits are obtained athigh cost to EU taxpayers and consumers, andto other excluded developing countries.
There also is evidence that GSP programsare associated with success stories in countrieswith the capacity to benefit from access oppor-tunities. Ozden and Reinhardt (2003b) com-pare the export performances of U.S. GSPbeneficiaries with those of countries removedfrom eligibility (those said to have “graduated”).Their results suggest that countries removed
D E V E L O P M E N T A N D T H E D O H A A G E N D A
211
Figure 6.1 The benefits of U.S. tradepreferences are distributed unequally
All other26%
Russia4%
Venezuela6%
Turkey4%
Thailand20%
South Africa5%
Philippines7%
Indonesia13%
India11%
Chile4%
Top 10 beneficiaries of U.S. generalized system ofpreferences, 2001 (percentage of total GSP benefits)
Source: USITC Dataweb.

from the GSP outperform those remaining eli-gible for GSP treatment (figure 6.2). Countriesthat are not on GSP tend to have higher ratiosof exports to GDP, as well as higher exportgrowth rates. This could be interpreted as evi-dence that for some countries—the successfulones—GSP played a role in generating the ini-tial export expansion. While great care is re-quired in attributing causality—clearly manyother factors will be important in determiningexport performance—one reason for the betterperformance of countries that were removedfrom GSP is probably their own trade policies.Because import protection is equivalent to taxation of exports, liberalization is a precon-dition for substantially expanding exports.
Preferences have a hierarchyThe foregoing discussion has focused primar-ily on GSP. In practice, unilateral preferencesgranted by the European Union and theUnited States are implemented under manydifferent programs (box 6.1). The differences
among these programs in product coverage,eligibility criteria, and administrative rules (es-pecially rules of origin) have important impli-cations, not only for the countries who benefitfrom them, but also for those excluded.
The United States, for example, has imple-mented the African Growth and OpportunityAct, the Caribbean Basin Initiative, and theAndean Trade Promotion Act, as well as sev-eral reciprocal free-trade agreements (withIsrael, Jordan, and Mexico). Major EU pro-grams include the Cotonou convention cover-ing the African, Caribbean, and Pacific (ACP)countries, and the Everything-But-Arms initia-tive, which covers LDCs. The European Unionalso has concluded a large number of preferen-tial trade agreements with neighboring coun-tries in Europe, North Africa, and the MiddleEast (Schiff and Winters 2003).
These unilateral and reciprocal programsdiffer in several important respects from theGSP. First, they include sectors excluded bystandard GSP programs—for example, appareland food products. Thus, by 2009 EverythingBut Arms will cover all exports of beneficiarycountries (the 49 LDCs) without exception—all duties and quotas will have been removed.Similarly, the Caribbean, Andean, and Africanprograms of the United States include apparel,in contrast to its GSP program. Second, the ad-ministrative requirements of these deeper pref-erential schemes tend to be more relaxed re-garding rules of origin and competitive needstests (USTR 2002).
Notwithstanding these improvements, theoverall impact of these programs has not yetbeen very significant, with the exception ofapparel exports to the United States from cer-tain African countries (more on this below).The share of LDCs in total imports of theUnited States and the European Union has notincreased significantly in recent years (figure6.3). In the case of Everything But Arms, thismay reflect, in part, that the products thatmatter most to a number of LDCs—bananas,rice, sugar—will be liberalized only in 2006 or 2009. Most of the products exported byLDCs already were eligible for duty-free entry
G L O B A L E C O N O M I C P R O S P E C T S 2 0 0 4
212
Figure 6.2 Countries “graduating” fromU.S. generalized system of preferenceshave better export performance thanthose still in program
Source: Ozden and Reinhardt (2003b).
Exports/GDP
Dropped from GSP
In GSP
Industrialexports/GDP
Growth rateof exports
0
5
10
15
20
25
30
35
40
45
50
�
�
Export performance of countries dropped from U.S. GSPprogram in 1976–2000 vs. those remaining in program(percent)

D E V E L O P M E N T A N D T H E D O H A A G E N D A
213
United StatesGeneralized System of Preferences (GSP): The U.S.GSP program has existed since 1976. Criteria foreligibility include not aiding international terroristsand complying with international environmental,labor, and intellectual property laws. Unlike the Eu-ropean GSP (see below), the U.S. program grantscomplete duty- and quota-free access to eligibleproducts from eligible countries. China and several“graduated” countries are not eligible—among themHong Kong (China), Republic of Korea, Malaysia,Singapore, Taiwan (China), and Malaysia.
Textiles and apparel, footwear, and manyagricultural products are not eligible for the GSP.Certain products from certain countries can be ex-cluded if the total exports pass the “competitiveneeds limit”—$100 million per tariff line or $13 mil-lion if the exporting country has more than a 50 per-cent share of U.S. imports. Total imports to theUnited States under GSP provision totaled $14.5 bil-lion in 2001, or 1.5 percent of total U.S. non-oil im-ports and 13 percent of all non-oil exports to theUnited States from GSP recipients. In most eligiblesectors where the MFN tariff rate is above 5 percent,the share of exports entering under the programfrom eligible countries is only 30–40 percent, in partas a result of rules-of-origin requirements.
Caribbean Trade Preferences: The CaribbeanBasin Economic Recovery Act (CBERA), commonlyknown as the Caribbean Basin Initiative (CBI), wasenacted in 1984 and modified in 1990. Twenty-fourcountries are eligible. Duty-free treatment is grantedon all products other than textiles and apparel, cer-tain footwear, handbags, luggage, petroleum and re-lated products, certain leather products, and cannedtuna. In 1998, only 18 percent of exports from bene-ficiary countries were in eligible product categories.The 2000 Caribbean Basin Trade Partnership Act(CBTPA), provides NAFTA-equivalent treatment forcertain items (mainly apparel) excluded from duty-free treatment under the CBI program.
Andean Trade Preferences: The Andean TradePreferences Act (ATPA) extends preferences to Bo-livia, Colombia, Ecuador, and Peru. Enacted in 1991as part of U.S. efforts to reduce narcotic productionand trafficking, it was modeled after the CBI and hassimilar eligibility requirements and product coverage.
Box 6.1 EU and U.S. preference programsDuty-free treatment is granted on all products excepttextiles and apparel, certain footwear, petroleum andrelated products, certain leather products, cannedtuna, rum and sugar, syrup, and molasses. The maindifferences with GSP are that the Andean schemecovers more products, has more liberal qualifyingrules, and is not subject to competitive need limits.ATPA rules of origin permit inputs from CBERAbeneficiaries. ATPA was renewed in 2002 as the An-dean Trade Promotion and Drug Eradication Act(ATPDEA) and expanded to include tuna, leatherand footwear products, petroleum products, and ap-parel—subject, however, to restrictive rules of origin.For example, if apparel is assembled from U.S. fab-rics, no quotas or duties apply, but if local inputs areused, duty-free imports are subject to a cap of 2 per-cent of total U.S. imports (increasing to 5 percent inequal annual installments).
African Trade Preferences: The African Growthand Opportunity Act (AGOA), passed in 2000, of-fers beneficiary Sub-Saharan African countries duty-free and quota-free market access for essentially allproducts. AGOA excludes textiles but extends toduty- and quota-free treatment for apparel made inAfrica from U.S. yarn and fabric. If regional fabricand yarn are used, there is a cap of 1.5 percent ofU.S. imports, increasing to 3.5 percent over eightyears. African LDCs are exempt from all rules oforigin for a limited period of time, helping to signifi-cantly expand apparel exports from countries such asLesotho.
European Union Generalized System of Preferences: Preferences underGSP are available to all developing countries, in-cluding China. Overall, 36 percent of tariff lines areeligible for reduced tariffs, and 32 percent are eligiblefor duty-free access. Twelve percent of tariff lines(mostly agricultural) are excluded and subject to full MFN duty. Excluded products include meat,dairy products, cereals, sugar, wine, and products forwhich the European Union sets minimum importprices. Approximately 36 percent of all products areclassified as “sensitive”—often those with the highestMFN tariffs (Panagariya 2002). Sensitive products
(Continues on next page)

under GSP or Cotonou provisions. As a result,Everything But Arms had no immediate im-pact (Brenton 2003). In the case of the UnitedStates, export market shares of countries eligi-ble under the three primary deep preferenceprograms have not increased (figure 6.4).12
The primary exception is apparel, whichshows remarkable export growth, especially inthe case of AGOA. Total exports of apparelsince 1996 increased by more than 200 percentfor AGOA countries, and approximately 60percent for Caribbean and Andean countries.As a result, in 2002, apparel exports to theUnited States from AGOA countries were ap-
proximately $1.1 billion, compared to $750million from Andean countries and $9.5 bil-lion from Caribbean countries. These coun-tries accounted for some 20 percent of the $58 billion U.S. apparel import market. Thisgrowth is mainly a result of exemptions fromquotas and tariffs imposed on other exporters.In the case of AGOA, rules of origin are re-moved temporarily for some countries for alimited period, providing an extra advantage.A crucial issue is how these regions will farewhen remaining quotas (mostly faced by coun-tries in South and East Asia) are phased out at the end of 2004, as required by the WTO
G L O B A L E C O N O M I C P R O S P E C T S 2 0 0 4
214
are subject to a flat 3.5-percentage point-reduction in the MFN tariff, implying that the higher the duty,the smaller the proportionate impact of the prefer-ence. Specific duties are reduced by 30 percent; if aproduct is subject to both ad valorem and specificduties, the specific duty is not reduced.
Additional tariff reductions are available underspecial incentive schemes for the protection of laborrights (an additional 5-percentage-point reduction),the environment (an additional 5 percentage points),and for countries that combat drug production andtrafficking (duty-free access for certain products).Currently only one country, Moldova, has requestedand satisfied the requirement relating to labor rights(but not the environment). A group of Latin Ameri-can countries and Pakistan benefit from arrange-ments relating to drugs.
Countries can be excluded from the GSP (basedon their development level) or from particular prod-uct categories. Sectoral exclusions are determined byspecific criteria based on shares of EU imports fromGSP-beneficiary countries and certain indicators of development and specialization.a For example,Argentina is excluded from preferences for live ani-mals and for edible products of animal origin, whileThailand is excluded from preferences for fisheryproducts.
ACP countries (Cotonou Agreement): ACPcountries are granted preferences that often exceedthose available under the GSP. Most industrial prod-
Box 6.1 (continued)
ucts are duty and quota free. Preferences are lesscomprehensive for agricultural products. In 2000duties were still applied to 856 tariff lines (837 ofwhich were agricultural products). Of these, 116lines were excluded from the Cotonou Agreement,although specific protocols govern access for sugarand bananas on a country-specific basis. An addi-tional 301 tariff lines were eligible for reducedduties, subject to specific quantitative limits (tariffquotas) set for the ACP countries as a group. Theremaining 439 products were eligible for reducedduties without limits on exported quantities.
Everything But Arms: Introduced in March2001, this program grants duty-free access to im-ports of all products from the LDCs, with the excep-tion of arms and munitions, without any quantitativerestrictions. Liberalization was immediate except forthree major products: fresh bananas, rice, and sugar.Tariffs on these three items will be reduced graduallyto zero (in 2006 for bananas; in 2009 for rice andsugar), while tariff quotas for rice and sugar will beincreased annually. Access to the EU market is gov-erned by the rules of its GSP scheme. A key featureof the program is that in contrast to the GSP, prefer-ences for the LDCs are granted for an unlimitedperiod and are not subject to periodic review.
a. Some ad hoc exclusions are applied to China, the CIS coun-tries, and South Africa in the fisheries and iron and steel sectors.

Agreement on Textiles and Clothing. This isalso the time when liberal rules of origin underAGOA are set to expire. Competitive pressuresare likely to increase substantially, giving rise toa need for adjustment and for investment pro-grams to improve productivity and diversifica-tion of the export base. Extending the liberalrules of origin under AGOA would help reducethe impact of the abolition of the remainingimport quotas on textiles and clothing.
The available evidence suggests that pref-erences by industrialized countries have thegreatest effect on developing-country exportsif they are granted on a reciprocal basis as partof a deep regional free-trade agreement. Span-ish exports to the European Union and Mexi-can exports to the United States rose dramati-cally following accession to the EuropeanUnion and NAFTA, respectively (figure 6.6).This supply response is not just the result ofremoving import barriers by northern part-ners, but also of the “regime change” that oc-curred in these countries and the consequentchange in risk premiums, uncertainty, and in-vestment incentives. A large part of the regimechange involved changes in investment, regu-latory, and administrative policies, not justpreferential trade liberalization. These data
therefore suggest that a reciprocal liberaliza-tion strategy supported by complementary do-mestic policies may have a much larger impactthan unilateral preferences.
D E V E L O P M E N T A N D T H E D O H A A G E N D A
215
Figure 6.3 Preferences have not increased the share of the least developed countries in imports into the European Union and the United States
Source: WITS.
Share of LDCs in total imports of European Union and United States, 1966–2002 (percent)
1.0
0.9
0.8
0.7
0.6
0.5
0.4
0.3
0.2
0.1
01986 1987 1988 1989 1990 1991 1992
United States
European Union
1993 1994 1995 1996 1997 1998 1999 2000 2001 2002
�
�
Figure 6.4 Market shares of countrieseligible for three U.S. “deep preference”programs have not increased
Source: US ITC.
2.0
1.8
1.6
1.4
1.2
1.0
0.8
0.6
0.4
0.2
0.01996 1997
CBI
Andean
AGOA
1998 1999 2000 2001 2002
�
�
�
Shares of AGOA, Andean, and CBI countries in U.S.imports (excluding oil and previous metals), 1996–2002(percent)

Preferences have unintended consequencesNumerous side effects of unilateral preferencesalso must be considered when assessing thecase for them. Preferences can lead to moreprotectionist trade policies in recipient coun-tries. Ozden and Reinhardt (2003b) show thatU.S. GSP recipients implement more protec-tionist trade policies than countries removedfrom the GSP program (figure 6.7). Althoughtheir finding does not prove causality, prefer-ences can decrease the incentives for domesticexporters to mobilize in favor of more liberaltrade policies. Because domestic trade policiesaffect developing countries’ growth prospectsmore than barriers in their export markets, the perverse-incentive effect of unilateral pref-erences may be quite damaging. Similarly,preferential market access may lower the in-centives for developing countries to participateactively in multilateral negotiations, in part be-cause they believe that they will not receiveany further concessions in the multilateralprocess or because of concerns about erosionof preferences. The latter may create conflictsof interest between preferred and nonpreferreddeveloping countries. To the extent that coun-tries specialize in similar product categories
and sell at low margins in competitive mar-kets, even small preferences in certain cate-gories could make a difference for some coun-tries, fueling those conflicts of interest.
As an example, 36 countries in Sub-SaharanAfrica are eligible to export apparel productsinto the United States without any tariffs orquantitative restrictions under AGOA. Thesecountries risk losing preference margins ifMFN protection is reduced in the United States.Many of these countries temporarily face norules of origin requirements. Twenty-four coun-tries in the Caribbean and Central Americaenjoy similar privileges under the CBPTA.Through bilateral NAFTA preferences and uni-lateral Caribbean and African preferences, ben-eficiary countries managed to increase theirshare of U.S. apparel imports to around 32 per-cent (figure 6.8). Such countries may be con-cerned about the erosion of their preferences ifMFN protection is reduced.
Sugar is a product for which preference ero-sion will have important consequences for sev-eral countries. Quota allocations in protectedmarkets, such as the European Union, are cur-rently very concentrated in a few countries thattend to have high costs relative to other pro-ducers. For example, Mauritius has 38 percentof EU quotas (Mitchell 2003). Given the ex-tension by 2009 of duty- and quota-free accessto the EU market for all LDCs, Mauritius willconfront much greater competition in the EUmarket.
Most of the academic research on prefer-ence programs has concluded not only thatthey generally yield modest export increases (at best), but also that a significant portion of these gains is because of trade diversionfrom nonbeneficiaries. Multilateral liberaliza-tion would reduce some of the detrimental ef-fects of preferential access to highly distortedmarkets. For example, moving to free trade insugar markets not only would result in esti-mated global welfare gains (the sum of pro-ducer, consumer surpluses, and tax revenues)of $4.7 billion, but also would yield a 38 per-cent increase in world sugar prices and boostsugar trade by about 20 percent. Brazil alone
G L O B A L E C O N O M I C P R O S P E C T S 2 0 0 4
216
Figure 6.5 Preferred countries’ apparelexports to the United States have risen
Source: US ITC.
Growth of apparel exports to United States, 1996–2002(percent)
250
200
150
100
50
01996 1997 1998 1999
AGOA
2000
Andean
CBI
2001 2002
�
�
�

would experience a real income gain of some$1.6 billion. Although countries such as Mau-ritius could lose significantly, coordinatedglobal liberalization across all products wouldoffset some of the lost rents. World sugar priceincreases alone would offset about one-half ofthe lost quota rents for countries that currentlyhave preferential access. Moreover, the loss inpreference rents would be much less than iscommonly expected, because many of the ben-eficiaries are high-cost producers. Indeed, thecost to the European Union and United Statesof providing each $1 of preferential access hasbeen estimated to be more than $5—a very in-
efficient way to provide development assis-tance (Beghin and Aksoy 2003).
How much preferences are likely to beeroded as a result of further multilateral tradeliberalization will depend both on the benefitscountries currently obtain from preference pro-grams and the speed with which preferences areeroded. The foregoing discussion suggests thatthe overall benefits of unilateral market accesspreferences are limited by exclusions for sensi-tive products, rules of origin, and limited sup-ply capacity. The fact that a substantial share oftotal exports from eligible countries underAGOA and Everything But Arms preferences
D E V E L O P M E N T A N D T H E D O H A A G E N D A
217
1965
1969
1973
1977
1981
1985
1989
1993
1997
2001
Figure 6.6 Agricultural exports from Mexico and Spain rose dramatically after the twocountries joined regional trade blocs
0
Agriculturalproducts, total
1
2
3
4
5
6
7
8
Mexican exports of certain agricultural products, 1961–2001(billions of dollars)
1961
1961
1965
1969
1973
1977
1981
1985
1989
1993
1997
2001
1961
1961
1965
1969
1973
1977
1981
1985
1989
1993
1997
2001
�
Agriculturalproducts, total
�
Milk
Meat
Mexican exports of certain agricultural products, 1961–2001(millions of dollars)
Spanish exports of certain agricultural products, 1961–2001(billions of dollars)
Spanish exports of certain agricultural products, 1961–2001(millions of dollars)
�
Meat
�
�
Milk
�
0
1,400
1,200
1,000
800
600
400
200
0
1965
1969
1973
1977
1981
1985
1989
1993
1997
2001
50
100
150
200
250
300
0
3
5
8
10
13
15

do not enter duty free (Inama 2003, Brenton2003) is one illustration.
One way of obtaining a sense of the magni-tude of possible preference erosion is first toassume that LDCs obtain full preferential ac-cess to Quad markets and then to assess theimpact of a reduction in MFN tariffs. A recentexercise along these lines suggests that the ag-gregate impact of a 40 percent reduction in av-erage MFN tariffs would lower LDC exportsby about $440 million, or 1.6 percent of totalexports (IMF 2002). This estimate does nottake into account terms-of-trade changes fromthe MFN tariff reductions, which on averagecan be expected to be positive for exportingcountries, reducing the losses from preferenceerosion. Moreover, in practice, it is likely thatpart of the rents from preferences accrues tothe importing countries, and especially to in-termediaries (Tangermann 2002). Account alsoshould be taken of the benefits to countrieswith preferences of the erosion in preferentialaccess of other countries—especially members
of free-trade agreements—and, as noted ear-lier, of the impact of rules of origin. As MFNtariffs are by definition not associated withrules of origin, such liberalization may well re-sult in export gains for countries in productsthat in principle benefit from preferences.Thus, it may be more beneficial for developingcountries to obtain more secure MFN reduc-tions on their key exports than to seek to pre-serve preference margins on products with rel-atively high MFN tariffs (Laird, Safadi, andTurini 2003).
The available evidence and analysis sug-gests that preference erosion is unlikely to bea major issue for many countries, given thatautomatic compensation will result frombroad-based multilateral liberalization of mar-ket access. However, specific developing coun-tries and sectors in these countries may behurt, and resources for adjustment need to bemobilized and allocated. Governments shouldprepare by determining where adjustmentneeds are likely to be most significant, so thattechnical and financial assistance can be pro-vided. Actions of the type discussed in chap-ters 2 and 5 to facilitate trade, complementedby the adoption of more liberal rules of origin,will help to attenuate the impact of preferenceerosion.
The low share of exports entering underpreferences, and the recent research suggestingthat rules of origin play a role in that lowshare, suggest that the rules used to determineorigin should be simplified. The recent experi-ence under AGOA, under which several bene-ficiary countries significantly expanded ap-parel exports to the United States after originrestrictions were relaxed, illustrates this point.The WTO includes an Agreement on Rules ofOrigin that aims to foster the harmonizationof the rules used by members. The agreementcalls for a work program to be undertaken bya Technical Committee, in conjunction withthe World Customs Organization, to developa classification system regarding changes intariff subheadings based on the HarmonizedSystem (Hoekman and Kostecki 2001). Theharmonization program provides a potential
G L O B A L E C O N O M I C P R O S P E C T S 2 0 0 4
218
Figure 6.7 The trade policies of countriesin the U.S. generalized system ofpreferences are more protectionist thanthose of countries not in the program
Source: Ozden and Reinhardt (2002).
Import policies of countries in U.S. GSP versus those ofcountries dropped from GSP (percent)
60
50
40
30
20
10
0Duties/imports
Droppedfrom GSP
In GSP
Averagenominal
tariff
Imports/GDP
�
�

solution to rules-of-origin problems. Whilethe harmonized rules are intended to be ap-plied in cases of nonpreferential commercialpolicy—tariffs, import licensing, antidump-ing—they could be applied to preferentialtrade as well. A recent proposal by Canada touse a common value-added criterion and toallow for comprehensive cumulation (extend-ing to major players such as China) is an al-ternative approach. Yet another option is toemulate the “visa” procedure for textile prod-ucts used under AGOA—this could help tosubstantially reduce uncertainty for traders.Indeed, minimizing uncertainty is a critical fea-ture of making preferential regimes effective.13
The ultimate goal is MFN-based,reciprocal liberalizationMFN-based market access will have the great-est beneficial impact on development.14 Onereason is that it implies that elements of “re-verse SDT”—special opt-outs and exemptionsthat benefit interest groups in industrializedcountries at the expense of developing coun-tries—will be removed. Eliminating agricul-tural subsidy programs, high protection for
textile and apparel products, tariff peaks, andtariff escalation would not only be benefi-cial to developing countries (and developed-country consumers), but also would facilitatefurther trade reforms in developing countries.
Developed and developing countries alikecould affirm their commitment to poverty alle-viation by accepting an ambitious program ofliberalization that would include the abolitionof export subsidies, substantial decoupling ofagricultural support, and significant reductionof MFN tariffs on labor-intensive products ofexport interest to developing countries. Theprogram must include significant trade liberal-ization by developing countries, a major sourceof the total potential gains. MFN liberalizationshould extend to middle-income countries,which are among the most dynamic markets inthe world and where trade barriers are oftensubstantially higher than in developed coun-tries, and would usefully extend to LDCs aswell.
In defining negotiating modalities to pursuedesired MFN liberalization, WTO membersshould set a concrete timetable and agree onspecific benchmarks for product coverage and
D E V E L O P M E N T A N D T H E D O H A A G E N D A
219
Figure 6.8 Countries enjoying preferences have increased their exports of apparel to theUnited States
Source: U.S. International Trade Commission.
U.S. apparel imports, 1989–2002, by source (millions of dollars)
70
60
50
40
30
20
10
0
1989 1990 1991 1992 1993 1994 1995 1996 1997 1998 1999 2000 2001 2002
Rest of the world
NAFTA countriesunder preferences
Africa and Caribbeanunder preferences
NAFTA countrieswithout preferences
�
�
Africa and Caribbeanwithout preferences
�
�

maximum tariffs. The challenge is to identifyreciprocal commitments that make economicsense and support development. The overuseof nonreciprocity in past market-access negoti-ations has excluded developing countries fromthe major source of gains from trade liberal-ization—namely the reform of their own poli-cies. Nonreciprocity is also a reason why tariffpeaks today are largely on goods produced indeveloping countries. A willingness to pursueliberalization at home is critical to increasedeveloping countries’ participation in globaltrade, particularly South-South trade, which issubject to significant barriers (see chapter 3).15
Services are of great importance to develop-ment—it is difficult for firms to be competitivein the absence of efficient services sectors. Sub-stantial opportunities exist to expand develop-ing-country services exports and to liberalizefurther access to developing-country markets.While the latter would bring the greatest gains,temporary access to service markets (particu-larly labor markets) in developed countriesalso would generate large gains for developingcountries (see chapter 4). In addition, bindingthe current set of liberal policies applied tocross-border trade (GATS Modes 1 and 2)would assist governments in pursuing domes-tic reforms. Many developing countries havebegun to exploit opportunities offered by theInternet and telecommunication networks toprovide services through cross-border trade.Currently such trade is generally free of re-strictions, but that freedom is not locked inthrough the GATS (Mattoo 2003).
Toward a new regime for WTO rules
Several WTO agreements offer developingcountries some latitude to pursue restric-
tive trade policies and provide transition peri-ods and technical assistance to help in imple-menting agreements (box 6.2).16
Should trade rules apply to all developingcountries? If so, should account be taken ofdifferences in national capacities to implementand benefit from multilateral rules? In answer-
ing these questions, it is helpful to distinguishbetween (a) agreements and disciplines thatpertain to the core business of the WTO—traditional trade policies such as tariffs, quo-tas, and export subsidies—and (b) rules whoseimplementation requires significant resourcesor the existence of well-functioning comple-mentary institutions. With respect to the firstcategory, developing countries would benefitfrom abiding by the same trade-policy disci-plines that apply to developed countries. Theoverwhelming conclusion in the economic lit-erature is that traditional trade-policy instru-ments should not be used in pursuit of devel-opment objectives.17
A country’s trade policy is a key link in thetransmission of price signals from the worldmarket to the national economy. Undistortedprice signals from world markets, in com-bination with an exchange rate that reflectsmacroeconomic conditions, encourages effi-cient resource allocation consistent with com-parative advantage. An open trade regime givesconsumers and firms access to a greater vari-ety of goods and services, including capitaland intermediate goods, and contributes toproductivity growth through access to globaltechnology and by forcing domestic firms tobecome more efficient.
Although numerous arguments have beendeveloped that potentially provide a rationalefor intervention to protect infant industries—most of which revolve around some type ofmarket failure or externality—trade policy israrely if ever an appropriate instrument. More-over, well-known political economy problemsare associated with protection of infant indus-tries. The prospect of protection can give rise tounproductive rent-seeking behavior with asso-ciated scope for (legal) lobbying and (illegal)corruption (Bhagwati 1988). Moral hazardproblems can easily arise because the reward foran industry doing well is the removal of protec-tion, which can generate perverse incentives forfirms to underperform so as to retain protection.
Economic first principles suggest that a sub-sidy-type policy generally will be less distorting(more efficient) than trade policy in offsetting
G L O B A L E C O N O M I C P R O S P E C T S 2 0 0 4
220

an externality. From an economic viewpoint,the drafters of the GATT were therefore justi-fied in placing relatively stringent constraints onthe use of trade policy, and in particular, on theuse of quantitative restrictions and local contentrequirements. Moreover, in cases in which im-port competition proves too fierce, the WTOallows for safeguards—emergency protectionthrough safeguards. However, WTO safeguardprovisions impose conditions that enhance cer-tainty and help ensure that interventions aremade only for good cause.
The foregoing does not imply that develop-ing countries should be forced to sign awaytheir ability to use trade policies—all countrieshave the right under the WTO to impose tariffsor export taxes if they so desire. Committing to
abide by the same rules on the use of traditionaltrade polices that pertain to developed coun-tries, however, will benefit consumers and en-hance welfare in developing countries.
The WTO does not identify or constrainwhat governments can do in the realm of non-trade policy to maximize the benefits of trade.As emphasized by Stern (2002), any crediblepoverty reduction strategy must rest on twopillars: a good investment climate to propelgrowth, and empowerment of poor peoplethrough participation in decisions that shapetheir lives. Although a sound trade policy is amajor element of any successful developmentstrategy, other factors are equally important.Institutions to manage the distributional impli-cations of trade reforms and to ensure that
D E V E L O P M E N T A N D T H E D O H A A G E N D A
221
Infant industry protection. GATT Articles XVIII:aand XVIII:c allow for removal of tariff concessionsor use of quotas if necessary to establish an industryin a developing country. Compensation must be of-fered to countries that would be negatively affected.
Balance-of-payments protection. Article XVIII:ballows a nation to impose trade measures to safe-guard its balance of payments. In contrast to ArticlesXVIII:a and c, surveillance and approval proceduresare less burdensome, and compensation need not beoffered to affected countries. Not surprisingly, nocountry has invoked the infant industry provisions ofthe GATT since 1967, but numerous countries havemade use of Article XVIII:b. In the Uruguay Round,Article XVIII:b was revised and surveillance proce-dures were tightened. WTO members must nowpublicly announce time schedules for the removal of restrictive import measures taken for balance ofpayments purposes and must, in principle, use price-based measures (such as tariffs).
Subsidies: The WTO Agreement on Subsidiesand Countervailing Measures (ASCM) attempts todistinguish between subsidies (defined as financialcontributions by government) that can be justified onthe grounds of market failure, or on noneconomic
Box 6.2 Major WTO provisions allowing developingcountries greater freedom to use restrictive trade policies
grounds, and those that distort the incentive to tradein a major way. Nonspecific subsidies (defined asthose for which access is general or eligibility auto-matic on the basis of clear, objective criteria) arepermitted and cannot be countervailed. Subsidiescontingent on export performance or on the use ofdomestic rather than imported goods are generallyprohibited. Permitted measures that create “seriousprejudice”—defined to exist if the total ad valoremsubsidization of a product exceeds 5 percent, if subsi-dies are used to cover operating losses of a firm orindustry, or if debt relief is granted for government-held liabilities—can be countervailed or disputed.Subsidies that can be shown to have had a negativeeffect on a partner’s exports likewise may be counter-vailed or disputed. LDCs and countries with GNPper capita below $1,000 are exempted from the pro-hibition on export subsidies. Developing countriesthat have become competitive in a product—definedas having a global market share of 3.25 percent—must phase out any export subsidies over a two-yearperiod.
Source: Hoekman and Kostecki (2001).

consumers, enterprises, and farmers have ac-cess to competitive markets for goods and ser-vices are critical to harnessing greater trade fordevelopment.
Nor does the WTO constrain the ability ofgovernments to address market failures throughsubsidies or taxes. In many cases the interven-tion required to address an externality will behorizontal (general), not sector- or industry-specific, and thus be nonactionable. For exam-ple, food subsidies, household energy subsidies,and health and education programs are not vul-nerable to WTO action. Similarly, factor-usesubsidies—for example, for the wages of work-ers taken directly off the unemployment rolls—are permissible unless they are configured insuch as way as to make them de facto subsidiesto specific sectors. Overall, therefore, the sortsof subsidies of most use in fighting poverty andoffsetting market failures are not constrainedby WTO disciplines (McCulloch, Winters, andCirera 2001).
Several policy options are open for futurerules and regulationsSome developing countries and many civil so-ciety groups have charged that some WTOagreements do not support development. Insuch cases, the appropriate solution may be toreopen (renegotiate) agreements where mem-bers perceive the rules to be unbalanced ordetrimental to their interests. This has been theapproach taken by some proponents of the so-called Development Box in the Agreement onAgriculture (box 6.3). It is also the approachthat has been suggested by the chair of theWTO General Council to address several pro-posals made by developing countries on SDT.In addition to the Agreement on Agriculture,an agreement often viewed as unbalanced isthe Agreement on Trade-Related Aspects of In-tellectual Property Rights (TRIPS).18
One lesson that emerged from the UruguayRound is that it is important but difficult toassess what makes sense from a developmentperspective. In large part this is a reflection ofthe absence of strong trade interests and stake-
holders in developing countries who might in-form their governments of their preferencesand clarify the implications of various propos-als (Finger 2001; Hoekman 2002). As a result,the “trade-related” aspects of international is-sues are often identified by constituencies inmajor trading powers and may not have muchrelevance for development.
Because countries differ widely in their do-mestic priorities and in their capacities to im-plement change, it is as important as it is dif-ficult to identify how and where developmentwill be promoted by proposals to expand thereach of the WTO into (new) regulatory areas.
With respect to behind-the-border policiesaffecting trade, it is difficult to design genericrules that apply to all. Even if negotiators getthe economics right, there is a danger thatgood policies may be resisted. Dealing withthese types of issues in the context of negotia-tion may also induce a predominant focus oncosts, as reforms will be seen as concessions toforeign interests, as opposed to being in the na-tional interest (Finger 2002). Given their com-plexities and the limited negotiating resourcesavailable in most low-income countries, suchissues may be best left off the negotiating table(Winters 2002). However, if negotiations arelaunched on these topics, it will be importantto recognize that for many countries they maynot have a high priority.
Differential interests and capacities mustbe recognizedAs noted previously, the challenge is to get therules right from a development perspective.Even if this is done, in the sense that con-stituencies in developing countries are enthusi-astic about what has been negotiated and gov-ernments regard implementation as being inthe national interest, other issues may consti-tute a higher priority for investment of scarceadministrative and financial resources.
These observations suggest the need for dif-ferentiation among developing countries indetermining the reach of WTO rules that areresource intensive; that is, those that require
G L O B A L E C O N O M I C P R O S P E C T S 2 0 0 4
222
D E V E L O P M E N T A N D T H E D O H A A G E N D A
223
The primary focus of the Uruguay Round Agree-ment on Agriculture was to bring this sector
back into the trading system—that is, to reimposemultilateral disciplines on trade-distorting domesticsupport policies. A major feature of the agreementwas to distinguish between permitted subsidies (the“green box”) and subsidies subject to reduced com-mitments and disciplines. Because the objective ofnegotiators in the Uruguay Round was to reduce dis-torting types of support, it does not cover the typesof market imperfections likely to be found in devel-oping countries, nor does it recognize their need topursue “second-best” policies where they do nothave the institutional capacity to pursue the mostefficient policies to combat poverty. As a result,several countries have sought to introduce a “de-velopment box” into the agreement, which wouldidentify a set of measures to enhance food security,stimulate agricultural production, and reduce ruralpoverty in developing countries. Examples of suchproposals:
• Direct and indirect investment and input subsidiesor other supports to households below the na-tional poverty level to encourage agricultural and rural development. Such supports could beproduct-specific as well as general, as long as they are effectively targeted to the rural poor.
• Programs supporting product diversification insmall, low-income developing countries currentlydependent on limited commodities for their ex-ports, including programs involving governmentassistance for risk management.
• Domestic foodstuffs at subsidized prices in tar-geted programs aimed at meeting food require-ments of the poor, whether urban or rural, as part of an overall effort to enhance food security.
• Transportation subsidies for agricultural productsand farm inputs to poor remote areas.
• Programs involving government assistance for es-tablishment of agricultural cooperatives or other
Box 6.3 A “development box” for the Agreement on Agriculture?
institutions that promote marketing, quality con-trol, or otherwise strengthen the competitivenessof poor farmers.
• A “special” safeguard provision, available only to developing countries, to provide rapid, time-limited protection against import surges that hurtpoor producers, especially dumped imports ofsubsidized goods.
• Acceptance that some products—especially keystaple commodities critical to food security—wouldnot be subject to liberalization commitments.
While often defended as examples of needed prefer-ences, proposals for a development box effectivelyinvolve changing the terms of the Agreement onAgriculture. Many of the provisions have been in-cluded in the “Harbinson” draft, which suggests ap-proaches for future liberalization commitments inthe Doha negotiations on agriculture (WTO 2003).The draft also contains a large number of provisionspermitting developing countries far greater leeway inprotecting agriculture through border measures suchas tariffs and tariff quotas than would be the casefor developed countries. Such policies may be justi-fied because low-income developing countries do not have the fiscal capacity to support agriculturethrough less trade-distorting direct-income supports,but they may lead to the same inefficiencies thathave undermined competitiveness of many industriesnurtured behind high protective barriers. While get-ting the economics right is important and requirescareful analysis, the efforts to alter the terms of theAgreement on Agriculture is arguably the most ap-propriate method of addressing rules that are notperceived to support development.
Sources: Ruffer, Jones, and Akroyd (2002); Hoekman, Michalo-poulos, and Winters (2003).

significant complementary legal, administra-tive, and institutional investments or capacityor that will result in large transfers from de-veloping countries. The basic rationale for dif-ferentiation is that certain agreements may notbe development priorities for some countriesor may require that other preconditions besatisfied before implementation can be benefi-cial. Such preconditions can be proxied by theattainment of a minimum level of per capitaincome, institutional capacity, and economicscale (size). Some WTO disciplines may not beappropriate for very small countries, for ex-ample, in that the regulatory institutions re-quired may be unduly costly.19
Several options could be considered to takecountry differences into account in WTO agree-ments.20 Options include:
• Adopting a rule of thumb that makes agroup of countries eligible to opt out ofprovisions that entail substantial imple-mentation costs until specific criteria orbenchmarks have been met. This rulewould require renegotiating the currentset of country groups recognized in theWTO (the LDCs, all developing coun-tries, and developed countries). It wouldalso require establishing criteria to iden-tify which agreements are affected.
• Establishing an agreement-specific ap-proach under which application of rulesto any given country is determined byagreement-specific criteria, possibly linkedto availability of technical assistance andan action plan for implementation.
• Adopting a country-specific aproach thatplaces trade-reform priorities in the con-text of national development plans asdefined in Poverty Reduction Strategy Pa-pers, and relying on multilateral monitor-ing to establish a cooperative frameworkunder which countries may be assisted ingradually adopting WTO norms.
A common feature of these possibilities isthat they require a narrower definition of eligi-bility for temporary exemptions from WTO
rules. Country classification is inevitably a sen-sitive issue, as is the question of determiningthe “coherence” of WTO rules with nationaldevelopment priorities and identifying the im-plications of different types of WTO rules.What constitutes “resource intensive,” for ex-ample? And what agreements would give riseto large implementation costs? These questionswill require analysis. Determining implementa-tion criteria would require input from relevantdevelopment institutions, national and interna-tional, to strengthen policy coherence at bothlevels. One advantage of an agreement-specific“implementation audit mechanism” is that itcould avoid explicit country classifications, giv-ing rise instead to a monitoring process to sup-port developing countries in managing tradereforms and implementing WTO agreementsby recognizing competing demands on scarceresources.
Involving development agencies may reducethe risk of inducing countries to adopt and pur-sue a program of trade and regulatory reformthat may not, in fact, be suited to the country.During the Uruguay Round many countrieswere concerned about avoiding possible “cross-conditionality” between WTO and interna-tional financial institutions; this led to a minis-terial declaration on “coherence” to call for“avoiding the imposition on governments ofcross-conditionality or additional conditions”resulting from cooperation between the WTOand the international financial institutions.21
Indeed, care would be required to avoid “cross-conditionality.”
Several alternative options may therefore befeasible in recognizing differences in the abilityto benefit from implementation of resource-intensive rules. Deciding on the best approachwill require considerable thought and discus-sion. What matters most at this point is thatWTO members acknowledge the issue. It mightbe expeditious to make a decision in Cancun toconsider alternative approaches along the linessketched out above. Given the steady expan-sion of the WTO into regulatory areas, doingso would help make development relevancemore than a slogan.
G L O B A L E C O N O M I C P R O S P E C T S 2 0 0 4
224

WTO commitments must be enforcedthrough monitoring and dispute settlementWhile getting rules right is important, so is en-forcement and accountability. Two aspects ofenforcement of commitments are particularlyimportant. The first is regular information onimplementation of agreements and comple-mentary actions being pursued in other forumsand organizations. The second concerns theability of developing countries to use WTOdispute-settlement mechanisms in instances inwhich partners have not respected the terms ofan agreement. Developing countries may be ata disadvantage in using such mechanisms be-cause of resource constraints and lack of retal-iatory power. Proposals to address such biasesare discussed below.
Strengthened assessment and monitoringStrengthening mechanisms for regular monitor-ing of implementation of agreements and per-formance of both developed and developingcountries would help improve transparencyand accountability. This should extend to theprovision of information on national trade-related priorities by developing countries, thefunding and investment requirements these pri-orities involve, and the extent to which in-ternational and bilateral donors have providedassistance. A first step in compiling informa-tion on assistance provided was taken in 2002by the WTO and the Development AssistanceCommittee of the Organisation for EconomicCo-operation and Development (OECD),building on a database of bilateral and multi-lateral development projects. The WTO’s TradePolicy Reviews provide a potential mechanismfor bolstering monitoring, although the publi-cation schedule of reports would need to beincreased for timely information to be madeavailable to WTO members. The type of mech-anisms to put in place would depend in part onthe approach taken to determine the reach ofresource-intensive rules.
The weaker social safety nets and insurancemechanisms in the developing world, as well as higher rates of poverty and vulnerability to
external shocks, suggest that more attentionand resources should be devoted to costing outthe implementation requirements of proposedrules and to calculating their costs and bene-fits. The multiagency Integrated Frameworkfor Trade-Related Technical Assistance couldbe used to support this objective in LDCs.Developing-country think tanks and policyresearch networks—for example, the GlobalDevelopment Network—also have an impor-tant role to play in assisting governments withthe required assessments at the national level,supported by bilateral and multilateral devel-opment institutions.
Dispute settlementWhatever agreements eventually emerge fromthe Doha Round, enforcement will be impor-tant. But how well can low-income countriesdefend their rights in the WTO? During 1995–2002, 305 bilateral disputes were brought tothe WTO, entailing over 1,800 “grievances”—specific allegations of violation of a WTO pro-vision (Horn and Mavroidis 2003). Developingcountries brought 123 of the 305 disputes,about one-third. Most of these complainantswere middle-income economies. Low-incomecountries (defined by Horn and Mavroidis asthose with a per capita income below $800)were complainants in only 18 cases and respon-dents in only 21. LDCs did not participate atall—they never acted as complainant or respon-dent. Thus, well over half of the WTO mem-bership does not participate in WTO disputesettlement.22
That many developing countries have notparticipated in WTO dispute settlement re-flects the manifold challenges of such partici-pation. A first challenge to defending rightsthrough the WTO is obtaining knowledge thata WTO provision may have been violated bya partner government. A second is convincingthe government to bring the case forward—enterprises alone have no legal standing beforethe WTO. A third is expectation of a positivepayoff from bringing a case—a function of theremedy available and the likelihood that thetrading partner will actually implement it.
D E V E L O P M E N T A N D T H E D O H A A G E N D A
225

Small countries cannot credibly threaten re-taliation—the ultimate threat that can be madeagainst a member that does not comply with aWTO panel recommendation—because raisingimport barriers will have little impact on thetarget market, while being costly in welfareterms.23 Thus, pressure to comply with panelrulings is largely moral. In practice, the systemhas worked rather well, in that recourse to re-taliation has rarely been required to enforcemultilateral dispute-settlement decisions. Thisis a reflection of the repeated nature of WTOinteractions and the resulting value that gov-ernments attach to maintaining a good reputa-tion. Nonetheless, asymmetry in enforcementability can affect incentives to use the system.The classic recommendation by economists toaddress the problem is to change the rules sothat nonimplementation of panel recommen-dations would be punished by withdrawal ofmarket-access commitments by all WTO mem-bers. But suggestions to this effect have alwaysbeen resisted (Hudec 1987, 2002).
Retaliation involves raising barriers to trade,which is generally detrimental to all parties. Thepower of retaliation may also be captured byprotectionist interests in an importing country.A superior approach would be to strengthencompensation provisions. Developing countrieshave proposed, for example, that WTO panelsshould be authorized to recommend payment offinancial compensation in cases where a devel-oping country loses its trade in a product as aresult of actions by a developed country that areinconsistent with WTO norms.24 Such sugges-tions have a long history (Hudec 2002).25 Mex-ico recently suggested allowing countries thathave won a dispute but where implementationhas not occurred to auction off the resulting re-taliation rights.26
While compensation or fines would be lessdistorting than trade sanctions, they may notbe very effective in inducing compliance, as thecosts would disperse among all taxpayers.Other options should therefore be considered,including stronger surveillance mechanismsand greater opportunities for interested partiesto bring cases in national forums. Whatever is
done, it is important to halt the emerging trendtoward escalating retaliation and the use oftrade sanctions.
Aid for trade: addressing national prioritiesTrade capacity is critical in ensuring that low-income countries are able to benefit fromtrade opportunities. Numerous studies—mostrecently the Diagnostic Trade Integration Stud-ies undertaken in LDCs under the auspices of the Integrated Framework initiative—haveidentified institutional weaknesses and an ad-verse investment climate as a major source ofcomparative disadvantage.27
The reports reveal that many countries re-main largely without the appropriate institu-tional frameworks and systems to managetheir trade policy and that trade costs severelylimit the competitiveness of developing-coun-try firms in export markets. Transport costsare often the single most important componentof cost for exporters in several of the countries.The transport sectors (air, ports, trucking) areoften plagued by a lack of domestic competi-tion (see chapter 5).
These anticompetitive conditions impingedirectly on the welfare of the poor. In mostLDCs, the majority of poor households derivetheir income from agriculture and agro-processing. Agricultural trade integration cantherefore increase both productivity and ruralincomes by providing better access to moderninputs and technologies and by encouragingexports.28 In addition to the fragmentation ofmarkets and the remoteness of many farmingcommunities, binding constraints include trans-portation bottlenecks that, combined with nu-merous informal fees and internal checkpoints,lead to high transaction costs (in Ethiopia,Guinea, and Nepal), lack of basic post-harvestmarketing infrastructure (in Ethiopia, Guinea,Malawi, Mauritania, and Yemen), lack ofwater control infrastructure (in Ethiopia andSenegal), and a pervasive degradation of nat-ural resources (Tsikata 2003). To improve com-petitiveness and extend the benefits of trade tothe poorer segments of the population, better
G L O B A L E C O N O M I C P R O S P E C T S 2 0 0 4
226

domestic market integration should be a keypolicy objective in many LDCs.
Development assistance can play an impor-tant role in bolstering trade capacity, thereby al-lowing countries to benefit from liberalized ac-cess to international markets. Additional fundsare needed to address both policy and public-investment priorities, to help low-income coun-tries adapt to a reduction in trade preferencesfollowing further nondiscriminatory trade lib-eralization, and to assist poor net-importingcountries to deal with the potential detrimentaleffects of a significant increase in world foodprices, should these materialize. The worldcommunity made general commitments to thiseffect at the International Conference on Fi-nancing for Development in Monterrey inMarch 2002—the need now is to translate the“Monterrey consensus” into identification andfinancing of trade-related investment priorities.
Although more “aid for trade” would bebeneficial, it is important to avoid a situationin which a desire by donor countries to see de-veloping countries implement certain WTOagreements diverts assistance away from recip-ients’ own development priorities. This is oneof the risks of suggestions to make technicalassistance a requirement of new WTO rulesand to link implementation of WTO agree-ments to the provision of such assistance. Ide-ally, identification and delivery of trade-relatedtechnical assistance should be embedded in thenational policy-setting processes used by gov-ernments and the donor community—for ex-ample, the Poverty Reduction Strategy Papers.This would ensure that trade priorities areconsidered for funding along with other devel-opment priorities.
Putting development into theDoha agenda
Putting development into the Doha agendarequires actions by developing and devel-
oped countries alike. Interests and prioritiesdiffer from country to country, but improvedaccess to markets in agriculture, manufac-tures, and services would be most beneficial.
In fact, liberalized market access on an MFNbasis has the greatest potential payoff, interms of development and poverty reduction,of any issue on the Doha agenda.
Because duty- and quota-free access tomajor markets can help to offset the many dis-advantages that confront firms in poor coun-tries, developed countries should continue togrant trade preferences to LDCs and similarlydisadvantaged countries, emulating Europe’sEverything But Arms initiative. To maximizethe benefits of such deep preferences, con-certed action should be taken to minimize thetrade-restricting effect of rules of origin andrelated administrative requirements.
But preferences are best viewed as a transi-tional instrument. What matters most in anyeffort to expand exports on a sustained basisis a good investment climate, including open-ness to trade. Indeed, most of the potentialgains from trade reform could be realized byunilateral liberalization.
Traditional forms of preferential treatmentcannot be the primary instruments to enhancethe development-relevance of the WTO. In-stead, countries must commit to engage in thereciprocal exchange of market-access conces-sions. Continuing to exempt developing coun-tries from trade-policy disciplines is not likelyto achieve development goals.
With regard to behind-the-border regulation,the same principle should apply as with trade-policy disciplines: ensuring that the rules sup-port development.29 Getting the rules right re-quires each country to think hard about whatis in its national interest. Even where the po-tential benefit of an agreement may be clear,poor countries may not have the resources re-quired to implement it immediately, perhapsbecause other issues command higher priorityor because complementary policies and insti-tutions must be put in place before implemen-tation will be beneficial. In this regard, a newconcept of special and differential treatment,one that would establish clear criteria andmechanisms to link implementation to de-velopment priorities and capacities, could bemost fruitful.
D E V E L O P M E N T A N D T H E D O H A A G E N D A
227
Promoting the trade and developmentprospects of low-income countries requires ac-tion on many fronts. The key needs—to estab-lish priorities for reforming domestic policyand enhancing trade-related capacity—growmore acute as MFN trade barriers are reduced,and the value of preferences is eroded. A pre-condition for effective use of additional de-velopment assistance—whether in the form ofgrants or development loans—is that the nec-essary priorities are determined appropriately.In many low-income countries much moreshould be done to integrate trade priorities intonational development strategies and invest-ment allocation decisions.
It should be possible to move rapidly to-ward providing greater access for all countriesto others’ markets in goods and services. Asfar as rule-making is concerned, agreement onan approach that recognizes the significantdifferences among countries will give develop-ment a much more solid place in the WTO.Most important is to address what is by farthe most urgent challenge of expanding tradefor development—identifying and dealing withtrade constraints within countries, whetherthose constraints derive from policies, poor in-frastructure, or limitations in capacity.
Notes1. See World Bank (2002), Finger and Schuler
(2000), and Hoekman and Kostecki (2001) for a dis-cussion and references to the literature.
2. Hudec (1987) and Finger (1991) review thebackground in some depth, noting that SDT was heav-ily influenced by foreign policy considerations, espe-cially the Cold War.
3. The full name is Decision on Differential andMore Favorable Treatment, Reciprocity and Fuller Par-ticipation of Developing Countries. See Hudec (1987)for further discussion of the history.
4. This was first documented by Finger (1974,1976).
5. Because WTO rules are often based on those pre-vailing in OECD countries, implementation costs areasymmetrically distributed. Post-Uruguay Round re-search—for example, Finger and Schuler (2000) andFinger (2001)—revealed that the costs associated withcomplying with certain WTO disciplines can be signif-icant. This is in part because of the rules themselves,
but mostly because of the ancillary investments that arerequired to allow the rule to be applied.
6. Note that China and Mexico are included in theEuropean Union’s GSP recipients’ list while they areexcluded from the U.S. list. The United States has a freetrade area agreement (FTA) with Mexico and does notgrant GSP status to China. On the other hand, SouthAfrica, Turkey, and Eastern European countries haveFTAs with the European Union and, hence, are ex-cluded from its GSP while they receive GSP status fromthe United States.
7. The limit is $13 million if the exporting countryhas more than 50 percent market share.
8. For most textile and clothing products, the 20percent reduction is less than 3.5 percentage points.
9. According to EU Council regulation 2501/2001,there are some nonsensitive agricultural and foodproducts. According to Annex IV, these are artichokes,castor oil, frogs’ legs, grapefruit, green tea, inactiveyeasts, licorice extract, malt beer, papayas, pepper, andsweet potatoes.
10. U.S. intellectual property advocacy groups haveused GSP eligibility as an instrument to induce a num-ber of countries (including El Salvador, Honduras,Panama, Paraguay, Poland, and Turkey) to take actionsin such areas.
11. Rules of origin are intended to prevent trade de-flection and to determine where a good originates forduty purposes when two or more countries are in-volved in the production of a product. The general ruleis that the origin of a product is the one in which thelast substantial transformation took place, that is, thecountry in which significant manufacturing or process-ing occurred most recently. Significant or substantial isdefined as the level of transformation sufficient to givethe product its essential character. Various criteria canbe used to determine if a substantial transformationoccurred. These include a change in tariff heading (aswhen, as a result of whatever processing was per-formed the good is classified under another category ofthe Harmonized System), the use of specific processingoperations, tests based on the value of additional ma-terials embodied in the transformed product, or theamount of value added in the last country where thegood was transformed.
12. These categories make up around 65–75 per-cent of the exports of the AGOA and Andean Programbeneficiaries and tend to dominate general patternswith their volatile prices.
13. A major benefit of Everything But Arms is thatthe preferences are not time-limited.
14. This was the approach used in the GATT beforethe creation of the GSP. See Hudec (1987) and Finger(1991).
G L O B A L E C O N O M I C P R O S P E C T S 2 0 0 4
228

15. Given that many developing countries eitherhave not bound tariffs at all or have high tariff bind-ings, this will automatically imply that credit will begiven for past reductions in applied tariffs and—pro-vided formulas are used—that autonomous liberaliza-tion (reduction in applied tariff rates) will not prejudicefuture WTO negotiations. See Francois and Martin(2003) for an in-depth analysis of alternative formula-based approaches.
16. This section draws in part on Hoekman,Michalopoulos, and Winters (2003).
17. See, for example, Hoekman, Michalopoulos,and Winters (2003), Noland and Pack (2003), Irwin(2001, 2003), and Hausmann and Rodrik (2002).
18. Research on the effects of TRIPS suggests thatnet transfers from low- to high-income countries couldbe substantial (World Bank 2001).
19. For example, despite remarkable reductions incustoms clearance times that have been achieved bysome LDCs (sometimes from weeks to days or hours,as in Senegal), the customs regimes in many participat-ing countries are characterized by long clearance times,a plethora of informal fees, and inadequate perfor-mance monitoring indicators (see chapter 5). Manycountries are struggling to implement the Agreementon Customs Valuation and to work with and reformother institutions whose actions impinge on customsefficiency such as security and enforcement.
20. These options are discussed further in Stevens(2002), Prowse (2002), Wang and Winters (1999), andHoekman, Michalopoulos, and Winters (2003).
21. Declaration on the Contribution of the WorldTrade Organization to Achieving Greater Coherence inGlobal Economic Policymaking, December 15, 1993.
22. Busch and Reinhardt (2002) found that devel-oping countries accounted for around 30 percent ofcomplaints under both GATT and WTO, but that theshare of cases against developing countries had risenfrom 8 percent to 37 percent during the period coveredby their study. This suggests that the shift to theWTO—with the associated expansion of disciplines ondeveloping countries—has given rise to a significant in-crease in the probability of engaging in dispute settle-ment. However, Holmes, Rollo, and Young (2002)concluded that the simple hypothesis that disputes willbe proportionate to trade shares is not borne out by thedata. They also found that income per head or mea-sures of openness did not help to explain the incidenceof disputes, suggesting that there is no significant biasbetween small and large countries, or between richerand poorer countries, in terms of participation in thesystem as complainants or respondents. Horn, Mavroi-dis, and Nordström (1999) similarly conclude that theevidence for “bias” is not particularly strong once onecontrols for the fact that disputes should be correlated
with the number of incompatible measures a country’sexporters encounter and the volume of trade, and takesinto account that there is likely to be a threshold belowwhich it is not worth bringing a case.
23. See Bown (2002) for a recent analysis and ref-erences to the relevant literature.
24. WT/GC/W/16225. For a discussion of a proposal by Brazil and
Uruguay to reform the dispute settlement system to in-clude financial compensation, see Dam (1970, 368–73).
26. In their analysis of this proposal, Bagwell,Staiger, and Mavroidis (2003) conclude that the prob-ability of the winning country being compensated ishighest if such rights extend to the losing party.
27. The Diagnostic Trade Integration Study (DTIS)is an analytical tool developed to reexamine the policyand institutional constraints to trade for LDCs, and toidentify technical assistance needs for the purpose ofenhancing LDCs’ integration into the global economy.As of July 2003, DTIS reports had been completed for Burundi, Cambodia, Ethiopia, Guinea, Lesotho,Madagascar, Malawi, Mali, Mauritania, Nepal, Sene-gal, and Yemen. See www.worldbank.org/trade.
28. Increasing productivity in agriculture is criticalfor the transformation of these economies. Reducingthe price of food products increases the real income ofthe whole population and allows higher householdspending in nonagricultural products, thus favoringdiversification.
29. The GATT/WTO may have it right when itcomes to rules on the use of trade policy; for example,the ban on the use of quotas and the focus on bindingtariffs. This is much less clear when it comes to otheragreements, such as TRIPS. The solution in such casesis to reopen existing agreements, something that canreadily be done. Many of the agreements are alreadysubject to ongoing negotiations.
ReferencesBagwell, K., R. Staiger, and Petros C. Mavroidis. 2003.
“The Case for Auctioning Countermeasures in theWTO.” Mimeo, Columbia University, New York.
Beghin, John, and M. Ataman Aksoy. 2003. “Agricul-tural Trade and the Doha Round: PreliminaryLessons from Commodity Studies.” Mimeo.World Bank, Washington, D.C.
Bhagwati, Jagdish. 1988. Protectionism. Cambridge,Mass.: MIT Press.
Bown, Chad. 2002. “The Economics of Trade Dis-putes, the GATT’s Article XXIII and the WTO’sDispute Settlement Understanding.” Economicsand Politics 14: 283–323.
Brenton, Paul. 2003. “Integrating the Least DevelopedCountries into the World Trading System: The
D E V E L O P M E N T A N D T H E D O H A A G E N D A
229

Current Impact of EU Preferences under Every-thing But Arms.” Policy Research Working Paper3018. World Bank, Washington, D.C.
Brenton, Paul, and M. Manchin. 2002. “Making EUTrade Agreements Work: The Role of Rules ofOrigin.” CEPS Working Document 183. Brussels.
Busch, M., and E. Reinhardt. 2003. “Developing Coun-tries and GATT/WTO Dispute Settlement.” Mi-meo. Emory University, Atlanta, Georgia.
Dam, Kenneth. 1970. The GATT: Law and the Inter-national Economic Organization. Chicago: Uni-versity of Chicago Press.
Evenett, Simon. Editor. 2003. The Singapore Issuesand the World Trading System. Berne: State Sec-retariat for Economic Affairs.
Finger, J. Michael. 1974. “GATT Tariff Concessionsand the Exports of Developing Countries: UnitedStates Concessions at the Dillon Round.” Eco-nomic Journal 84 (335).
———. 1976. “Effects of the Kennedy Round TariffConcessions on the Exports of Developing Coun-tries.” Economic Journal 86 (341).
———. 1991. “Development Economics and the Gen-eral Agreement on Tariffs and Trade.” In J. deMelo and André Sapir, eds., Trade Theory andEconomic Reform: North, South, and East. Ox-ford, U.K.: Basil Blackwell.
———. 2001. “Implementing the Uruguay RoundAgreements: Problems for Developing Coun-tries.” The World Economy 24 (9): 1097–1108.
Finger, J. M. 2002. “The Doha Agenda and Develop-ment: A View From the Uruguay Round,”Manila: Asian Development Bank.
Finger, J. Michael, and Philip Schuler. 2000. “Imple-mentation of Uruguay Round Commitments: TheDevelopment Challenge.” The World Economy 23:511–25.
Francois, J., and Will Martin. 2003. “Formula Ap-proaches for Market Access Negotiations.” TheWorld Economy 26: 1–28.
Hausmann, R., and Dani Rodrik. 2002. “EconomicDevelopment as Self-Discovery.” CEPR Discus-sion Paper 3356, Center for Economic Policy Re-search, London.
Hoekman, Bernard. 2002. “Strengthening the GlobalTrade Architecture for Development.” World TradeReview 1: 23–46.
Hoekman, Bernard, and Michel Kostecki. 2001. ThePolitical Economy of the World Trading System.Oxford, U.K.: Oxford University Press.
Hoekman, Bernard, Aaditya Mattoo, and Philip English,eds. 2002. Development, Trade and the WTO: AHandbook. Washington D.C.: World Bank.
Hoekman, Bernard, Constantine Michalopoulos, andL. Alan Winters. 2003. “Development and MoreFavorable and Differential Treatment of Develop-ing Countries.” Mimeo, Development ResearchGroup, World Bank, Washington, D.C.
Hoekman, Bernard, Francis Ng, and Marcelo Olar-reaga. 2002. “Tariff Peaks in the Quad and LeastDeveloped Country Exports.” World Bank Eco-nomic Review 16: 1–22.
Holmes, P., J. Rollo, and A. Young. 2002. “EmergingTrends in WTO Dispute Settlement: Back to theGATT?” Mimeo. University of Sussex, U.K.
Horn, Henrik, and Petros C. Mavroidis. 2003. “WhichWTO Provisions are Invoked by and Against De-veloping Countries?” Mimeo. Institute for Inter-national Economics, Stockholm.
Horn, Henrik, Petros C. Mavroidis, and Hakan Nord-ström. 1999. “Is the Use of the WTO Dispute Set-tlement System Biased?” CEPR Discussion Paper,Center for Economic Policy Research, London.
Hudec, Robert. 1987. Developing Countries in theGATT Legal System. London: Trade Policy Re-search Centre.
———. 2002. “The Adequacy of WTO Dispute Settle-ment Remedies: A Developing Country Perspec-tive.” In Bernard Hoekman, Aaditya Mattoo, andPhilip English, eds., Development, Trade, and theWTO: A Handbook. Washington, D.C.: WorldBank.
IMF (International Monetary Fund). 2002. “Financingof Losses Due to Preference Erosion.” Washing-ton, D.C. Mimeo.
Inama, Stefano. 2003. “Trade Preferences and theWTO Negotiations on Market Access.” Mimeo.United Nations Commission on Trade and Devel-opment (UNCTAD), Geneva.
Irwin, Douglas. 2002. Free Trade Under Fire. Prince-ton: Princeton University Press.
———. 2003. “Interpreting the Tariff-Growth Corre-lation of the Late Nineteenth Century.” AmericanEconomic Review 91 (May 2002): 165–69.
Keck, Alexander, and Patrick Low. 2003. “Special andDifferential Treatment.” Mimeo. World Trade In-stitute, Berne.
Laird, Sam, Raed Safadi, and Alessandro Turini. 2003.“The WTO and Development.” Mimeo. UnitedNations Commission on Trade and Development(UNCTAD), Geneva.
Mattoo, Aaditya. 2003. “Shaping Future Rules forTrade in Services: Lessons from the GATS.” InTakatoshi Ito and Anne O. Krueger, eds., Trade in Services in the Asia Pacific Region. NBER.Chicago: University of Chicago Press.
G L O B A L E C O N O M I C P R O S P E C T S 2 0 0 4
230

Mitchell, Donald. 2003. “Sugar Policies: Opportunityfor Change.” Mimeo. World Bank, Washington,D.C.
McCulloch, N., L. Alan Winters, and Xavier Cirera.2001. Trade Liberalization and Poverty: AHandbook. London: Center for Economic PolicyResearch.
Noland, Marcus, and Howard Pack. 2003. IndustrialPolicy in an Era of Globalization: Lessons fromAsia. Washington, D.C.: Institute of InternationalEconomics.
Ozden, Caglar, and E. Reinhardt. 2003a. “The Perver-sity of Preferences.” Policy Research Working Pa-per 2955, World Bank, Washington, D.C.
———. 2003b. “First Do No Harm: GSP and the Ef-fect of Trade Preferences on Developing CountryExports.” Mimeo. World Bank, Washington, D.C.
Panagariya, A. 2002. “EU Preferential Trade Policiesand Developing Countries.” The World Economy25 (10): 1415–32.
Prowse, Susan. 2002. “The Role of International andNational Agencies in Trade-Related CapacityBuilding.” The World Economy (9): 1235–61.
Rodrik, Dani, ed. 2003. In Search of Prosperity: Ana-lytic Narratives on Economic Growth. Princeton,N.J.: Princeton University Press.
Ruffer, Tim, S. Jones, and S. Akroyd. 2002. “Develop-ment Box Proposals and Their Potential Effect on Developing Countries.” Mimeo. Report forU.K. Department for International Development,London.
Sapir, André. 1997. “The Political Economy of ECRegionalism.” European Economic Review 42:717–32.
Schiff, M., and L. Alan Winters. 2003. Regional Inte-gration and Development. Oxford, U.K.: OxfordUniversity Press and Washington, D.C.: WorldBank.
Stern, Nicholas. 2002. A Strategy for Development.Washington D.C.: World Bank.
Stevens, Christopher. 2002. “The Future of SDT forDeveloping Countries in the WTO.” Mimeo. In-stitute of Development Studies, University of Sus-sex, U.K. May.
Tangermann, S. 2002. “The Future of PreferentialTrade Arrangements for Developing Countriesand the Current Round of WTO Negotiations onAgriculture.” Food and Agriculture Organiza-tion, Rome.
Tarr, David. 2002. “Arguments For and Against Uni-form Tariffs.” In Bernard Hoekman, AadityaMattoo, and Philip English, eds., Development,Trade, and the WTO: A Handbook. Washington,D.C.: World Bank.
Tsikata, Yvonne. 2003. “Integrating into the GlobalEconomy: Challenges, Experiences and PolicyLessons from the Integrated Framework.” Mimeo.World Bank.
USTR (United States Trade Representative). 2002.“Report on U.S. Trade and Investment Policy To-ward Sub-Saharan Africa and Implementation ofthe African Growth and Opportunity Act.” Re-port Submitted by the President to the Congress,Washington, D.C.
Wang, Z. K., and L. Alan Winters. 2000. “Putting‘Humpty’ Together Again: Including DevelopingCountries in a Consensus for the WTO.” CEPRPolicy Paper 4. London. March.
Winters, L. Alan. 2002. “Doha and the World PovertyTargets.” Paper presented at the Annual BankConference on Development Economics, WorldBank, Washington, D.C. April.
World Bank. 2001. Global Economic Prospects and theDeveloping Countries 2002: Making Trade Workfor the Poor. Washington, D.C.: World Bank.
World Bank. 2002. Global Economic Prospects and theDeveloping Countries 2003: Investing to UnlockOpportunities. Washington, D.C.: World Bank.
D E V E L O P M E N T A N D T H E D O H A A G E N D A
231

East Asia and Pacific
Recent developments
THE YEAR 2002 was one of solid recoveryin much of East Asia. GDP growth indeveloping East Asia rose from 5.5 per-
cent in 2001 to 6.7 percent in 2002. However,the renewed economic slowdown in the devel-oped world, relatively high oil prices in thefirst part of 2003, and the SARS outbreak inthe region, dampened the pace of the regionalrecovery in the first half of 2003. However,East Asian growth is expected to rebound pro-gressively, as economies get beyond the short-run impact of SARS, oil prices wane, andglobal growth revives.
A smart rebound in exports was one impor-tant driver in the regional recovery in 2002—regional exports rose nearly 14 percent in dol-lar terms, after having been flat in 2001 as aresult of the global slowdown and the deep re-cession in world high-tech demand. Intrare-gional exports were especially strong, in par-ticular to China, which is emerging as a majorhub for regional production and trade net-works. Robust household consumption pro-vided further support for the recovery, and, inseveral cases, the year saw the start of astronger trend in fixed investment as well. Butthe regional picture was not uniformly upbeat,with more modest growth rates, or even con-tinued outright recession in some of the smalleror lower-income economies.
As has been the case for some years,growth in 2002 was strongest in the transitioneconomies, China and Vietnam, where sus-tained strength in exports, consumption, andinvestment pushed 2002 GDP growth to 8percent and 7 percent, respectively. But growthalso strengthened in several of the countriesthat had been hardest hit by 2001’s fall inworld-trade growth and high-tech demand,exceeding 6 percent in Korea, 5 percent inThailand, and 4 percent in both Malaysia andthe Philippines. Prompt policy action helpedmute the impact of the Bali terrorist attack onIndonesia’s economy, which nevertheless man-aged only 3–4 percent growth for a secondyear. Overall, the robust performance sup-ported continued reductions in poverty.
The strong growth momentum of 2002became more diffused in the first quarter of 2003, continuing in some countries, waning in others, and falling sharply in yet others. The strongest performances were in China andThailand, where year-on-year first-quartergrowth reached 9.9 percent and 6.7 percent, re-spectively, supported by both domestic demandand export growth. First-quarter growth was4.5 percent in the Philippines—at the higherend of expectations. However, some signs of adownshift were already emerging in Malaysia,where first-quarter growth dipped to 4 percentfrom over 5 percent in the latter part of 2002,while in Indonesia growth continued at a mod-est 3.4 percent pace (figure A1.1).
233
Appendix 1Regional Economic Prospects

Second-quarter data for China, at 6.7 per-cent growth, shows the domestic effects ofSARS quite clearly. An increased decelerationwas observed in the high-income or newly in-dustrializing economies (NIEs) of the region.GDP in the first quarter fell by 1–2 percent in Korea and Hong Kong (at a quarter-on-quarter seasonally adjusted annual rate),while it rose at only 0.7 percent in Singapore(on the same basis). In Korea, policy efforts torestrict excessive growth in consumer borrow-ing and the impact of security concerns withregard to North Korea, contributed to a fall inconsumer spending and machinery and equip-ment investment. Exports also slowed fromthe end of 2002, though they increasedstrongly year-on-year in dollar terms. Theweaker trends in GDP growth and trade forthe NIEs continued into the second quarter.
Among the factors contributing to slowerEast Asian growth in 2003 was the downturnin growth in most parts of the developed worldin the last quarter of 2002 and early 2003. Thestill hesitant and uncertain pace of recovery inthe global high-tech industry, to which EastAsia is a key supplier, has been another factoraffecting exports. World semiconductor sales,which had slumped 31 percent in 2001, inched
forward by about 1 percent in dollar terms for2002 as a whole, despite a strong rebound ona quarter-to-quarter basis during much of2002. However, global semiconductor salespeaked in the three months prior to November2002, and trended lower in December andearly 2003. These erratic developments inglobal and sectoral demand have had some im-pact in slowing East Asian export growth inthe first part of 2003. Exports for East Asia asa whole started the year strongly, up 20 per-cent over year ago (oya) in the first quarter indollar terms, but by April–May dollar exportgrowth rates had slowed to below 10 percentin the majority of cases, or even below 5 per-cent in some. China and Thailand were theonly countries where dollar exports continuedto grow at rates of over 30 percent and 20 per-cent, respectively.
The World Health Organization’s Marchalert about SARS sparked extraordinary pub-lic concern throughout East Asia and aroundthe world. The number of cases worldwiderose from very few in mid-March to 8,360 bythe end of May (most of which were in Chinaand Hong Kong, with smaller numbers in Tai-wan, China, and Singapore), and then leveledoff at around 8,465 by mid-June, indicatingthat the outbreak had been brought undercontrol, at least for the time being. Most of theeconomic impacts of the outbreak were the re-sult of public perceptions and fears about thedisease, and from precautions taken against it,rather than from the disease itself. The princi-pal way SARS appears to spread is throughdroplet transmission, and so worst affectedwere service industries, which depend on face-to-face interaction between service providersand customers, especially tourism, and relatedsectors such as restaurants and hotels, retailsales, business travel, and transportation.
April tourist arrivals in Hong Kong and Sin-gapore were down by 65–70 percent from year-earlier levels, for example, while passenger traf-fic in all Asia-Pacific air carriers fell by 45percent in that month. With fears about SARSbeing at their height in April and May, beforeeasing substantially in June, the economic im-
G L O B A L E C O N O M I C P R O S P E C T S
234
Figure A1.1 Some slowing of growthinto the first quarter of 2003Real GDP, percent change, year/year
Source: National agencies.
7
6
5
4
3
2
1
0
–1
Q12001
Malaysia
Philippines
Thailand
Indonesia
Q32001
Q12002
Q32002
Q12003
�
�
��
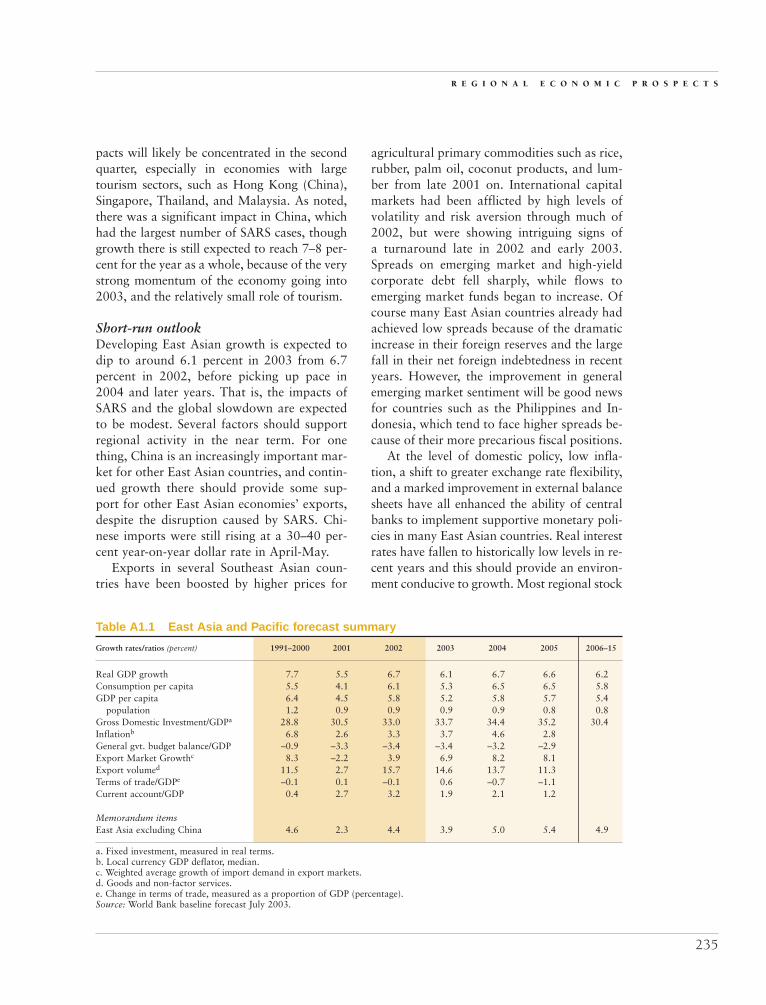
pacts will likely be concentrated in the secondquarter, especially in economies with largetourism sectors, such as Hong Kong (China),Singapore, Thailand, and Malaysia. As noted,there was a significant impact in China, whichhad the largest number of SARS cases, thoughgrowth there is still expected to reach 7–8 per-cent for the year as a whole, because of the verystrong momentum of the economy going into2003, and the relatively small role of tourism.
Short-run outlookDeveloping East Asian growth is expected todip to around 6.1 percent in 2003 from 6.7percent in 2002, before picking up pace in2004 and later years. That is, the impacts ofSARS and the global slowdown are expectedto be modest. Several factors should supportregional activity in the near term. For onething, China is an increasingly important mar-ket for other East Asian countries, and contin-ued growth there should provide some sup-port for other East Asian economies’ exports,despite the disruption caused by SARS. Chi-nese imports were still rising at a 30–40 per-cent year-on-year dollar rate in April-May.
Exports in several Southeast Asian coun-tries have been boosted by higher prices for
agricultural primary commodities such as rice,rubber, palm oil, coconut products, and lum-ber from late 2001 on. International capitalmarkets had been afflicted by high levels ofvolatility and risk aversion through much of2002, but were showing intriguing signs of a turnaround late in 2002 and early 2003.Spreads on emerging market and high-yieldcorporate debt fell sharply, while flows toemerging market funds began to increase. Ofcourse many East Asian countries already hadachieved low spreads because of the dramaticincrease in their foreign reserves and the largefall in their net foreign indebtedness in recentyears. However, the improvement in generalemerging market sentiment will be good newsfor countries such as the Philippines and In-donesia, which tend to face higher spreads be-cause of their more precarious fiscal positions.
At the level of domestic policy, low infla-tion, a shift to greater exchange rate flexibility,and a marked improvement in external balancesheets have all enhanced the ability of centralbanks to implement supportive monetary poli-cies in many East Asian countries. Real interestrates have fallen to historically low levels in re-cent years and this should provide an environ-ment conducive to growth. Most regional stock
R E G I O N A L E C O N O M I C P R O S P E C T S
235
Table A1.1 East Asia and Pacific forecast summary
Growth rates/ratios (percent) 1991–2000 2001 2002 2003 2004 2005 2006–15
Real GDP growth 7.7 5.5 6.7 6.1 6.7 6.6 6.2Consumption per capita 5.5 4.1 6.1 5.3 6.5 6.5 5.8GDP per capita 6.4 4.5 5.8 5.2 5.8 5.7 5.4
population 1.2 0.9 0.9 0.9 0.9 0.8 0.8Gross Domestic Investment/GDPa 28.8 30.5 33.0 33.7 34.4 35.2 30.4Inflationb 6.8 2.6 3.3 3.7 4.6 2.8General gvt. budget balance/GDP –0.9 –3.3 –3.4 –3.4 –3.2 –2.9Export Market Growthc 8.3 –2.2 3.9 6.9 8.2 8.1Export volumed 11.5 2.7 15.7 14.6 13.7 11.3Terms of trade/GDPe –0.1 0.1 –0.1 0.6 –0.7 –1.1Current account/GDP 0.4 2.7 3.2 1.9 2.1 1.2
Memorandum itemsEast Asia excluding China 4.6 2.3 4.4 3.9 5.0 5.4 4.9
a. Fixed investment, measured in real terms.b. Local currency GDP deflator, median.c. Weighted average growth of import demand in export markets.d. Goods and non-factor services.e. Change in terms of trade, measured as a proportion of GDP (percentage).Source: World Bank baseline forecast July 2003.

markets rebounded quite sharply between lateMarch (precisely when the SARS crisis wasstarting) and June, indicating that financialmarkets were looking beyond the near-termdisruptions while currencies in most flexibleexchange rate economies have also appreciatedagainst the dollar. In several countries govern-ments also felt able to undertake small pro-grams of fiscal stimulus to bolster economic ac-tivity during the temporary SARS shock, inparticular in Malaysia, Hong Kong, Singapore,and Korea.
Long-term outlookThe years since the 1997 financial crisis
have been ones of extraordinary volatility anduncertainty in the world economy. East Asianeconomies have actually come through this pe-riod reasonably well. Simple average growth inthe five crisis countries was 4.6 percent in1999–2002, while including China and Viet-nam it reached 5.1 percent. Contributing tothis reasonably positive experience has been abroad array of efforts at policy reform—albeitoften gradual and incomplete—accompaniedby a gradual strengthening of domestic de-mand. Robust household consumer spendinghelped underpin growth during 2001’s exportslowdown, and it also continued to bolster theregional recovery through much of 2002. Ef-forts to recapitalize and restructure the finan-cial sector have been successful enough forbanks to foster the emergence of new con-sumer credit markets, a positive developmentfrom a long-run standpoint, although bankmanagement and regulators will need to ensureit does not become a source of vulnerability.
Investment spending has been strong inChina and Vietnam, but in general it has re-mained erratic and, on the whole, still rela-tively weak in the crisis countries. But evenhere, there were some signs of an emergingpickup in 2002, for example in housing con-struction. A number of factors should supporta stronger investment revival in due course, in-cluding continued domestic economic growth,improvement in corporate profitability and re-duction in corporate indebtedness, the running
down of overcapacity, and continued macro-economic stability. And structural and institu-tional reform efforts to improve the investmentclimate will also be important. These includereducing barriers to foreign direct investmentin services; strengthening infrastructure and the provision of other public services impor-tant for business; and improving the regu-latory, legal, and judicial frameworks. Alsoimportant will be continued financial andcorporate sector restructuring and reform, in-cluding reforms to improve financial supervi-sion and regulation, and strengthen corporategovernance.
While some governments have undertakencounter-cyclical fiscal policies in 2003, giventhe significant public debt built up after thecrisis, policy attention in the medium term isbecoming more focused on the need for fiscalconsolidation, and also, to some extent, onbetter addressing the risks of implicit or con-tingent liabilities. Looking forward, there isscope to focus on better public administrationand financial accountability, improve publicservice delivery, and address questions ofgovernance more broadly—that is, to providegrowing volumes of critical public goodswhile maintaining sound fiscal positions. De-veloping East Asia is expected to achieve percapita growth of close to 5.5 percent in themedium to longer term, given continuedsteady efforts to improve structural policiesand the quality of institutions.
South Asia
Recent developments
GDP GROWTH in the South Asia regiondeclined to 4.2 percent in 2002 from4.9 percent in 2001, a downward revi-
sion from our previous estimate of an ac-celeration of growth as published in GlobalDevelopment Finance—2003. The slowdownlargely reflects adverse weather conditionsand a decline in agricultural output in India,Nepal, and near stagnation in Bangladesh.Additionally, Nepal experienced a plunge in
G L O B A L E C O N O M I C P R O S P E C T S
236

tourism receipts and a sharp decline in manu-facturing output, as the domestic insurgencyintensified. Pakistan and Sri Lanka both en-joyed a rise in growth rates in 2002 over2001, because of strong government con-sumption in Pakistan and a recovery in theservices sector—along with improved politicalstability tied to progress on peace talks and ayearlong cease-fire—in Sri Lanka.
Industrial production in the main econo-mies continued to register gains of 5–10 per-cent entering 2003 (figure A1.2). Driven largelyby a recovery in India’s exports, export vol-ume growth accelerated for the region on av-erage—despite sluggish external demand—thus reducing the region’s net trade deficit.Current account balances in the two largesteconomies, India and Pakistan, posted sur-pluses, and the region’s aggregate external bal-ance strengthened. But exports from Nepaldeclined significantly, because of weak exter-nal demand and heightened competition.
A number of regional economies experi-enced a significant increase in remittancesduring 2002 over 2001, notably Bangladesh,India, Nepal, Pakistan, and Sri Lanka. InBangladesh, the reported increase in inflows
of remittances is a reflection of incentives in-troduced by the government to channel remit-tances through official sources. In Pakistanand Sri Lanka, increases in remittances arelargely attributed to the improvements in theirdomestic security situations and to progress in macroeconomic stabilization. High interestrate differentials in India may have con-tributed to a rise in banking transfers there.While net FDI inflows to Pakistan rosemarkedly in 2002, attracted by increasedmacroeconomic stabilization and progress inreforms, net inflows to India declined. InBangladesh, FDI inflows fell by over 60 per-cent, mainly reflecting the determination of anabsence of export markets (gas exploration)and the lack of progress in reforms of the in-frastructure sector, such as in ports, power,and telecommunications.
India’s and Pakistan’s nominal exchangerates appreciated relative to the U.S. dollarduring 2002, while the exchange rates ofBangladesh and Sri Lanka remained relativelyflat. Nepal’s exchange rate is pegged to the In-dian rupee. Throughout much of South Asia,inflation remained broadly stable, as feed-through effects of higher oil prices were offsetby easing price pressures tied to generallyweaker domestic demand conditions. In SriLanka, inflationary pressures were reducedfrom 2001, but remained close to 10 percenton average in 2002.
There was some progress in the consolida-tion of persistent fiscal deficits, which areprevalent throughout the region (in large partbecause of weak revenue collection). By con-taining outlays and raising revenues, Bangla-desh reduced its budget deficit to 4.7 percentof GDP in 2002 from just below 6 percent ofGDP in 2001. It improved its financing profileby reducing its reliance on more expensive do-mestic financial markets and increasing its re-liance on external financing sources. Sri Lankaalso achieved a two-point reduction in its bud-get deficit, from 10.8 percent of GDP in 2001to 8.8 percent in 2002, and was able to shiftthe composition of its financing to longer-terminstruments. Pakistan brought its underlying
R E G I O N A L E C O N O M I C P R O S P E C T S
237
Figure A1.2 Industrial production inselected South Asian countries3-month moving average, percentage change, year/year
Source: National agencies.
20
15
10
5
0
–5
–10
–15
Jan.
199
8
July
1998
Jan.
199
9
July
1999
Jan.
200
0
July
2000
Jan.
200
1
July
2001
Jan.
200
2
July
2002
Jan.
200
3
Bangladesh
India
Pakistan
�
�
�

budget deficit down slightly to 5.1 percent ofGDP. India’s general government fiscal deficitwas little changed from 11 percent of GDP (in-cluding both central and state deficits), despiteincreased revenue collection.
Near-term outlookGrowth is forecast to accelerate throughout
the region in 2003, up to an average of 5.4percent, assuming a return to trend agricul-tural production, a recovery in external de-mand, and continued improvements in politi-cal stability and regional security. Domesticdemand, especially private consumption andfixed investment, is expected to accelerate,spurred by recovery in agricultural incomes.Growth in government spending is expectedto accelerate less strongly. A projection ofhigher growth in India underpins this forecast,as it represents nearly 80 percent of the re-gion’s aggregate GDP. Aside from a recoveryin agricultural output, growth in India is likelyto be supported by continued strong expan-sion in the services sector especially in infor-mation technologies now burgeoning in theBangalore area. A continued recovery in Pak-istan’s gross fixed investment rates, coupled
with a forecasted acceleration of private con-sumption growth, is projected to supportgrowth in 2003. With higher domestic de-mand, import volume growth is forecast to ac-celerate on aggregate for the region in 2003,leading to a narrowing of the current accountsurplus.
Medium-term prospectsSouth Asian growth is expected to main-
tain an average of close to 5.4 percent over the medium term, assuming normal weatherconditions—leading to recovery and accelera-tion of agricultural output—and a continuedrecovery in external demand. Declining oilprices, both in nominal and real terms, shouldreduce pressures on current account balancesfor the region, which is overwhelmingly a netenergy importer. India should benefit from arecovery in domestic demand (particularly inthe manufacturing sector) and firming exportvolume growth. Bangladesh is expected towitness strengthening domestic demand andrecovering exports, and on the supply side, astrong performance of SMEs and export-ori-ented manufacturing units (provided proposedstructural reforms are carried out). Both Pak-
G L O B A L E C O N O M I C P R O S P E C T S
238
Table A1.2 South Asia forecast summary
Growth rates/ratios (percent) 1991–2000 2001 2002 2003 2004 2005 2006–15
Real GDP growth 5.2 4.9 4.2 5.4 5.4 5.4 5.4Consumption per capita 2.0 3.5 1.5 2.9 3.3 3.5 3.3GDP per capita 3.3 3.1 2.5 3.7 3.7 3.8 4.1
population 1.9 1.7 1.7 1.6 1.6 1.5 1.3Gross Domestic Investment/GDPa 21.3 22.0 22.8 22.7 22.5 22.3 25.0Inflationb 7.8 3.0 1.8 5.1 5.8 4.7General gvt. budget balance/GDP –10.5 –8.3 –9.8 –9.7 –9.3 –8.5Export Market Growthc 7.7 0.2 2.9 6.0 7.5 7.3Export volumed 11.5 9.1 3.5 5.9 7.4 8.0Terms of trade/GDPe –0.1 0.0 0.5 0.7 0.4 0.1Current account/GDP –1.5 –0.5 0.5 0.4 0.2 –0.1
Memorandum itemsGDP growth: South Asia
excluding India 4.4 3.2 3.6 4.8 5.3 5.6 5.2
a. Fixed investment, measured in real terms.b. Local currency GDP deflator, median.c. Weighted average growth of import demand in export markets.d. Goods and non-factor services.e. Change in terms of trade, measured as a proportion of GDP (percentage).Source: World Bank baseline forecast July 2003.

istan and Sri Lanka are projected to benefitfrom continued macroeconomic stability andan associated acceleration of growth. Thepeace process is expected to yield significanteconomic gains in Sri Lanka. Similarly, Nepalis likely to experience strengthening growth,assuming continued improvement in the secu-rity situation there, with a recovery in domes-tic demand, exports, and in tourism receipts.Further, recent steps toward improving rela-tions between India and Pakistan may lead togreater stability in the sub-region, paving theway for increased business confidence and sta-bility. Throughout the region, growth shouldbe underpinned by continued firm expansionin services and industrial production.
Recovery in external demand and a gradualreturn to lower oil prices is likely to be morethan offset by generally firming import de-mand, which is expected to lead to a moderatedecrease in the region’s aggregate current ac-count surplus to an average balance near zeroas a share of GDP over the medium term(2004–05). At the individual country level,India and Pakistan’s projected current accountsurpluses are expected to roughly balance theprojected deficits in Bangladesh, Nepal, andSri Lanka.
The fiscal positions of the South Asianeconomies are forecast to improve moderately,assuming some progress in raising budget rev-enues and in the management of governmentexpenditures. Inflation is projected to increasesomewhat, albeit still at generally moderatelevels, because of the assumed pick-up ingrowth and assumptions of a more accom-modative monetary stance in a number ofcountries, though falling oil prices are ex-pected to partially offset these factors.
Long-term outlookLong-term growth in South Asia is forecast
to average about 5.4 percent, in line with theGEP 2003 growth forecast. This forecast issomewhat higher than the 5.2 percent averagereal growth posted during the 1990s. Thehigher projected growth over the comingdecade through 2015 reflects a number of
underlying assumptions, not least of which is alarger contribution to growth by the privatesector. This in turn reflects the expectation ofprogress with fiscal consolidation and contin-ued structural reforms, including reforms intrade, banking, privatization, and infrastruc-ture. These factors, combined with the im-provement in human capital indicators in re-cent years—such as rising literacy rates andschool enrollments and declining infant mor-tality rates—will lead to an increase in produc-tivity. Despite a projection of declining infantmortality rates, overall the South Asian popu-lation growth rate is projected to decelerate asbirth rates are expected to decline at fasterrates. Lower population growth in the comingdecade, along with the forecast growth rates,implies that per capita GDP growth will beclose to 4.0 percent per year.
RisksThere are a number of risks to the forecast.
Persistent fiscal deficits continue to be a risk in a number of the region’s economies, Indiain particular, as they can undermine fiscal sus-tainability, contribute to a growing debt-to-GDP ratio, and lead to higher interest rates,thereby crowding out private investment anddiverging public outlays from investment tointerest payments and limiting the scope forboth fiscal and monetary policies. Fiscal con-solidation is required, which would not onlymitigate such vulnerabilities, but also providefor broader scope of action in macroeconomicpolicies to pursue sustained higher growth.The forthcoming phase-out of the Multi-FibreArrangement (MFA) in 2005 will imply greatercompetition for the region’s textile exporters.While India and Pakistan appear to be gearingup for the impending increase in competition,the impact of the MFA phase-out on otherSouth Asian regional economies is more un-certain, particularly in Bangladesh, Nepal,and Sri Lanka (where garment exports repre-sent about 75 percent, 25 percent, and justover 50 percent of total merchandise exports,respectively). Given the importance of theagricultural sector to the region, the threat of
R E G I O N A L E C O N O M I C P R O S P E C T S
239

severe weather conditions and associated poorharvests remain a significant risk to growthoutcomes. Political risks and uncertaintiesalso remain a concern, because of both inter-nal and external factors. Heightened domesticand regional instability could underminegrowth prospects and slow the pace of eco-nomic reforms. Remittances could be affectedby increased instability in the Middle East.And significantly higher-than-forecast energyprices would pose an additional burden oncurrent account positions.
Latin America and the Caribbean
Recent developments
The Latin American region has begun torecover from last year’s recession. Theupturn this year reflects the tentative re-
covery in Argentina and Uruguay as well ascalming of pre-election jitters in Brazil at theend of 2002. As a result, regional growth in2003 is projected to reach 1.8 percent, com-pared to last year’s contraction of 0.8 percent.Although the region is on a favorable recoverypath, its growth rate remains well below poten-tial and below that of other regions. In additionto Argentina and Uruguay, Chile, Mexico, Co-lombia, and Brazil, countries with generallystronger policy frameworks, registered a some-what improved growth performance.
The fact that the 2002 recession was rela-tively short reflects both domestic structuralpolicy, renewed confidence, and external fac-tors. Domestic macropolicies have improvedsignificantly: the region managed to reduce in-flation to single-digit figures (for 2003–Q1,the regional inflation rate was 8.3 percent),proving that the commitment of central banksto low inflation is, although not universal,quite widespread across the region. Similarly,balanced fiscal policies have been applied andthe expected 2003 regional public deficitshould be about 2 percent of GDP. For ex-ample, the new president of Brazil has reiter-ated the country’s commitment to balanced
macropolicies, and this has rapidly thwartednegative expectations for the future.
A second domestic factor explaining the re-gion’s enhanced resilience to crisis is found inthe substitution of inward-oriented develop-ment policies (through the maintenance ofhigh trade barriers and other perverse price in-centives) by more liberal trade and market-friendly policies. This shift has helped theeconomies to diversify and has broadened theregional export base while diminishing itsdependency on a narrow set of commodityprices. As shown in figure A1.3a, during the1970s, exports of agricultural products, oiland other natural resources for the region as awhole, accounted for about one-quarter andone-fifth, respectively, of total exports; twodecades later, both sectors accounted forabout one-tenth of total exports, and manu-facturing has become an important source offoreign exchange.
Additional important elements contribut-ing to the success of this outward-orienteddevelopment strategy have been the NAFTAagreement—that directly benefited Mexico,but generated spillovers to other countries—and increased intraregional integration. In-deed, the revamping of Mercosur and othersub-regional integration arrangements arebeing discussed in Latin America, togetherwith the plans for a hemispheric free-tradearea. Chile and Mexico suffered least from the2001–2 economic downturn, thanks to theireffective integration in the global economyand good macroeconomic policies. Chile re-cently signed an FTA with the United Statesthat is anticipated to be ratified by the twogovernments by end-2003, and become opera-tional in 2004: the FTA grants free access to87 percent of Chilean exports to U.S. markets.
A final factor is the achievement of health-ier current account positions. The Latin Amer-ican region has witnessed a drop of more than3.5 points in the ratio of the current accountbalance to GDP (from –4.4 percent in 1998 to–0.8 percent in 2002) resulting from a reduc-tion of the region’s borrowing needs and the
G L O B A L E C O N O M I C P R O S P E C T S
240

reluctance of global investors to enter emerg-ing markets. The adoption of more flexible ex-change rate regimes is probably an importantstructural change. Anticipated increases in GDPgrowth are not expected to directly translateinto large unsustainable current accountdeficits.
Despite the sluggish global economy, somespecific improvements in the external environ-ment are also contributing to recovery in theregion. A weaker U.S. dollar is the first of theseimprovements: servicing the region’s dollar-denominated external debt becomes less oner-
ous, net oil importers suffer less from oil pricesurges, and usually non-oil commodity pricessurge with a falling dollar. Moreover, the weak-ening of the dollar against the euro should helpmanufacturing exporters with currencies fol-lowing the dollar by raising the competitive-ness of their goods in the euro zone and en-abling their share of exports to the EU to rise.
The recent dramatic reduction of spreads onyields of foreign sovereign debt for the regionis another favorable global financial develop-ment. The reduction in spreads—highlighted infigure A1.3b (in Brazil spreads narrowed from
R E G I O N A L E C O N O M I C P R O S P E C T S
241
Figure A1.3a Sectoral export shares (selected countries)
Source: World Bank, DECPG estimates from GTAP 5 databases.
Shares in percent of total exports
Agriculture
Shares in percent of total exports
Oil and other natural resources
26
18
10
0Latin America
and theCaribbean
Argentina Brazil Mexico Chile Colombia Peru Venezuela
10
20
30
40
50
60
70
1970s
1980s
1990s
�
�
�
1970s1980s
1990s
��
�
Latin Americaand the
Caribbean
Argentina Brazil Mexico Chile Colombia Peru Venezuela
21 22
11
0
10
20
30
40
50
60
70

a peak of 2,067 bp in October 2002 to 754 bpin April 2003, Mexican spreads have reachedan all-time low, those of Peru and Colombiaare at their lowest levels since 1998 and 2000,respectively)—has not yet been accompaniedby large capital inflows. For Latin America,average monthly flows during the first half of2003 registered $5.3 billion, modestly abovethe $4.3 billion average of the same period in2002. In fact the bond price rally may be tiedto an excess of global investors’ demand forhigher yield instruments over the supply ofnew issues by borrowers. However, it shouldbe mentioned that Mexico has been quite ac-tive in international capital markets and thateven Brazil has already been able to place is-sues twice this year.
Near-term outlookImproving world trade growth coupled withincreased OECD economic growth led by theUnited States should further boost the export-led recovery of Latin America in 2004–05.Also, by 2004, the region’s largest economieswill have surpassed the worst of their crises(Argentina and Uruguay) or potential for crises
(Brazil and Colombia) and, with some excep-tions, all countries should experience a recov-ery of domestic demand and record positiverates of growth. The regional average growthrate should climb to 3.7 percent in 2004 andto 3.8 percent in 2005. Even if current accountdeficits increase in most of the expandingeconomies of the region, low world interestrates, lower perceived risks for Latin Ameri-can assets (bonds, equities, or direct invest-ments), the continuation of fiscal prudence inthe region, and flexible exchange rates shouldmaintain a cap on these incipient deficits.Even though the 2003 –0.5 percent ratio ofcurrent account deficit to GDP for the regionis unlikely to be maintained, external deficitratios are not foreseen anywhere near the1995–99 average of more than 3 percent, butrather a modest –0.7 percent for 2004 and –1percent for 2005.
Clearly some uncertainty remains, giventhat these projections assume that no (domes-tic or external) adverse development reversesthe easing of financial pressure on the region’smost vulnerable countries. High levels of debtstill burden fiscal authorities and tight mone-
G L O B A L E C O N O M I C P R O S P E C T S
242
Figure A1.3b Latin American yield spreads
Source: World Bank, DECPG estimates from J.P. Morgan-Chase data.
EMBI Global, Jan. 2000 = 100
160
140
120
100
80
60
40
Jan.
2002
Feb. 2
002
April 2
002
May 20
02
June
2002
July
2002
Aug. 2
002
Sept. 2
002
Oct. 20
02
Nov. 2
002
Dec. 2
002
Jan.
2003
Feb. 2
003
Mar. 2
003
Mar. 2
002
April 2
003
May 20
03
June
2003
Brazil
Chile
Dominican Republic
Argentina
VenezuelaMexico
Latin Americaand the Caribbean
�
�
�
�
�
�
�

tary policies required to keep inflation undercontrol may limit expansion. This is especiallytrue for Brazil; however, thanks to its en-hanced credibility, the central bank in thiscountry may be able to ease its stance in thenear future.
Furthermore, some country risks persist.Several challenges await Argentina: a) restruc-turing the banking system to reactivate credit(which is still contracting); b) replacing in-efficient taxes, including on export and sav-ings, with new efficient taxes; c) building asolid regulatory and institutional frameworkto protect property rights and deal with othergovernance issues; d) renegotiating public util-ities tariffs that have been held well below therate of inflation; and e) eventual restructuringof the defaulted debt. The Republica Bolivari-ana de Venezuela started to export oil again,but its political crisis is not over and macro-economic instability, price controls, and otherdistortions need to be addressed. Recently, thegovernment endorsed an Economic Stabilityagreement that pledges to make every effort toimprove its external accounts by reestablish-ing the level of oil income and implementingthe necessary adjustments to the currency con-trol regime; however, previous similar at-tempts have failed.
The Caribbean countries, and this also ap-plies to some small Central American coun-tries, are still facing the difficult transition from being tropical agriculture export-orientedeconomies to becoming more diversified. Theirpreferential trade agreements are expiring orare severely eroded, and their successful at-tempts at diversifying toward tourism and fi-nancial services received a severe set-back in2002 from which they have not yet recovered.
Long-term prospectsIn the longer term, Latin American countriescould achieve higher growth rates if they over-come several critical structural constraints(table A1.3). On the external front, a numberof countries rely heavily on the United States
as a source of imports, as a destination for ex-ports, and as a source of external finance. Asshown in figure A1.3c, the United States hasbecome the region’s major export market des-tination, increasing from 36 percent of totalexports in the 1970s to almost 50 percent inthe 1990s.
Given the lackluster growth forecasts forthe Euro zone, a stronger link to the UnitedStates may be considered positive; however,geographical diversification may reduce risks.In particular, European markets have lost im-portance for Latin American exporters andthis may be corrected by pushing for more bi-lateral agreements and a more comprehen-sive lift of European restrictions to marketaccess.
The rising share of intraregional trade is apositive sign and may help Latin Americancountries negotiate trade and other integra-tion agreements as a block, vis-à-vis OECDcountries. In fact, trade integration should bea priority among the long-term developmentpolicies—Latin America, compared to EastAsia, shows much lower trade-to-GDP ra-tios—and deeper trade integration agreementsbring additional benefits in terms of increasedforeign investment and also boost credibilityto sound macro policies.
On the internal front, some of the majorimpediments of the past, such as large fiscalimbalances and perverse price incentives, havebeen removed (though not consistently in allcountries). However, smaller fiscal deficitshave been obtained mainly through expendi-ture restraints, with potential long-term issueson infrastructure development and povertyeradication, and most countries still have rela-tively (with respect to more developed coun-tries) low tax revenues to GDP ratios. Low taxrevenues result from a strong reduction of in-ternational trade duties (in itself a positive de-velopment), inefficient collection, evasion, andother governance issues. Low revenues havebeen compensated by recurring to unstablenon-tax revenues (oil royalties or other nat-ural resources form of taxation, privatiza-
R E G I O N A L E C O N O M I C P R O S P E C T S
243

tion), generating a situation of inadequate andvolatile government income.
In the long term, beyond macroeconomicstability and commitment to sound fiscal andmonetary policies, LAC countries will have totackle governance issues, attempt to correct a
skewed income distribution, and develop ma-ture financial markets necessary to generateenough resources to become less dependent onforeign finance, allowing important invest-ments in physical infrastructure and humancapital to be financed domestically.
G L O B A L E C O N O M I C P R O S P E C T S
244
Figure A1.3c Export shares by destination market (selected countries)
Source: World Bank, DECPG estimates from GTAP 5 databases.
Shares in percent of total exports
United States
Shares in percent of total exports
European Union
Shares in percent of total exports
Intra-Regional
Latin Americaand the
Caribbean
Argentina Brazil Mexico Chile Colombia Venezuela
Latin Americaand the
Caribbean
Argentina Brazil Mexico Chile Colombia Venezuela
Latin Americaand the
Caribbean
Argentina Brazil Mexico Chile Colombia Venezuela
3644
48
0
10
20
30
40
50
60
70
80
2925
15
05
101520253035404550
1612
20
05
101520253035404550
1970s
1980s
1990s�
��
1970s1980s
1990s�
�
�
1970s 1980s1990s
�
�
�

Eastern Europe and Central Asia
Recent developments
GDP IS NOW estimated to have expandedby 4.6 percent in 2002 for ECA, anupward revision from the 4.1 percent
projected in the last forecast presented inGlobal Development Finance 2003 (WorldBank 2003). Growth prospects proved to bemore resilient than previously anticipated, pri-marily because of the strength of domestic de-mand, which was more than able to offsetlackluster growth in the region’s main exportmarkets. The firming of ECA regional eco-nomic growth in 2002—over the 2.2 percentgrowth posted in 2001—was driven by thehuge 15 percentage point swing in Turkey’sperformance (from a contraction of 7.4 per-cent in 2001, following the financial crisis, toan upswing of 7.8 percent in 2002). The ECAaverage growth excluding Turkey registered a slowing to 3.9 percent in 2002, contrastedwith 4.5 percent in 2001. This latter trendlargely reflected the aggregate slowdown inthe CIS region.
Growth in the Central and Eastern Euro-pean Countries (CEECs), excluding Turkey,was unchanged in 2002 relative to 2001 at 2.9percent. Including Turkey, GDP growth aver-aged 4.5 percent for the group, swinging upsharply from a 0.8 percent contraction postedin 2001. Regional growth was underpinned byexpanding domestic demand, often spurred by fiscal policy (Hungary, Czech Republic,Poland, Slovenia, Slovakia) and/or easingmonetary policies (Czech Republic, Latvia,Lithuania, Romania). Furthermore, despitetepid external demand, export growth re-mained firm in many of the CEECs.
In the Commonwealth of IndependentStates (CIS), GDP growth continued to slow toan average of 4.7 percent in 2002, down from5.8 percent in 2001, and following the spike inCIS average growth of 8.4 percent posted in2000. The slowdown largely reflects a deceler-ation of growth in Russia, as the effects of thedevaluation of the 1998 crisis and the rentsfrom high energy prices eroded. Diminishedimport demand from Russia—representing animportant export market for the remaining CIS
R E G I O N A L E C O N O M I C P R O S P E C T S
245
Table A1.3 Latin America and the Caribbean forecast summary
Growth rates/ratios (percent) 1991–2000 2001 2002 2003 2004 2005 2006–15
Real GDP growth 3.4 0.3 –0.8 1.8 3.7 3.8 3.8Consumption per capita 2.4 –0.9 –3.5 –0.1 1.8 1.9 2.3GDP per capita 1.7 –1.2 –2.3 0.4 2.3 2.5 2.5
population 1.7 1.6 1.5 1.4 1.4 1.3 1.2Gross Domestic Investmenta 19.8 19.1 18.0 17.6 18.4 18.4 22.6Inflationb 12.0 5.5 4.7 4.1 4.0 4.0General gvt. budget balance/GDP –3.0 –1.8 –2.9 –2.0 –1.0 –0.6Export Market Growthc 9.4 –1.2 0.5 5.0 8.6 7.2Export volumed 8.7 1.0 2.2 9.2 11.2 10.2Terms of trade/GDPe 1.7 –0.2 0.1 –0.4 0.1 –0.7Current account/GDP –2.7 –2.7 –0.8 –0.5 –0.7 –1.0
Memorandum itemsGDP growth: LAC excludingArgentina 3.2 1.2 1.0 1.5 3.6 3.9Central America 4.4 1.5 1.9 2.4 3.1 3.8Caribbean 4.0 3.1 3.0 0.9 2.4 4.1
a. Fixed investment, measured in real terms.b. Local currency GDP deflator, median.c. Weighted average growth of import demand in export markets.d. Goods and non-factor services.e. Change in terms of trade, measured as a proportion of GDP (percentage).Source: World Bank baseline forecast July 2003.

countries—contributed to the easing of growthin the rest of the region. In addition, growthdecelerated in Turkmenistan, because of a poorcotton harvest and slower growth of naturalgas exports (the result of pipeline constraints),and suffered a decline in Kyrgyz Republic, tiedto an accident at its largest gold mine and a temporary decline in exports. The SouthCaucasus countries (Armenia, Azerbaijan, andGeorgia) and Belarus, however, experienced anacceleration of growth.
Near-term outlookECA aggregate growth is forecast to slowmoderately to 4.3 percent in 2003. This pro-jected growth rate for 2003 is higher than an-ticipated in GDF 2003, and reflects strongerthan expected growth in a number of coun-tries, particularly in Russia, which has exhib-ited firming domestic demand during the firstquarter of 2003 (figure A1.4). The decelera-tion of ECA aggregate growth between 2002and 2003 is primarily because of a projectedmoderation of growth in Turkey following thesharp upswing in 2002.
Growth in Turkey is projected to deceleratelargely because of base effects following thestrong recovery in 2002. Other factors affectingTurkey’s near-term outlook include the contin-ued required fiscal consolidation, the expectedslowdown in inventory building, weaker tour-ism revenues because of the Iraq conflict, andlimited foreign investment. The current accountdeficit has been rising rapidly, driven by risingimports, the recovery in domestic demand, andhigher oil prices. Export growth has remainedrelatively robust despite the recent real appreci-ation of the lira and weak external demand. Asof end-April, the Turkish government appearedon track for the Fund’s program, but the paceof reforms will need to accelerate to sustaingrowth.
In the CEECs, excluding Turkey, growth in2003 is projected to accelerate moderately (by0.5 percentage points) because of continuedpenetration in new export markets and an ex-pected boost to consumer confidence becauseof progress in the EU accession process.1 In
particular, growth is projected to acceleratemoderately in Albania, the Czech Republic,Poland (which represents 13 percent of the re-gion’s GDP), and Slovenia. Growth in the re-maining economies is forecast to either remainflat or decelerate moderately.
In the CIS, growth is projected tostrengthen in 2003, as domestic demand hasbegun to accelerate in Russia, underpinninggrowth there, which in turn should supportgrowth in other CIS countries dependent onRussia’s import demand. First-quarter data for2003 show strong growth in energy exportsand industrial activity in Russia, spurringstronger investment, especially in the energysector. This, coupled with an increase in pri-vate consumption—boosted by strong growthin real incomes and falling unemployment—isleading to higher output. Further, the recentappreciation of the euro against the dollar hasled to increased import prices for Russian im-ports from Europe, relative to US dollar-denominated oil export revenues, which in turnis stimulating increased demand for cheaperdomestic products. While oil prices have de-clined in recent months, they are still high rel-ative to the average over the last few years and
G L O B A L E C O N O M I C P R O S P E C T S
246
Figure A1.4 Industrial production inselected ECA countries3-month moving average, percentage change, year/year
Source: National agencies.
30
20
10
0
–10
–20Russia
Turkey [right scale]
Poland
May
200
1
Aug. 2
001
Nov. 2
001
Feb. 2
002
May
200
2
Aug. 2
002
Nov. 2
002
Feb. 2
003
May
200
3
60
45
30
15
0
–15
–30
�
�
�

are projected to average $26.5/bbl in 2003(given the spike during the first quarter), upfrom $24.9/bbl in 2002 (and well above the$21/bbl reference price used for the Russianbudget). The southern-tier energy exporters ofKazakhstan and Azerbaijan are expected tocontinue to post high growth rates, driven bythe ongoing oil sector investment boom, andsupported by strong FDI inflows. Manufactur-ing and services related to investment in the oilsector are expected to continue to expand aswell. GDP growth in most other CIS econo-mies is anticipated to either remain flat or de-celerate in 2003, with the exceptions of Geor-gia, where a rise in investment is projected,linked to the construction of oil and gas tran-sit pipelines, and the Kyrgyz Republic, whichis anticipated to benefit from a revival in itsgold production.
Medium-term prospectsECA regional growth is expected to first
accelerate to 4.5 percent in 2004, and then todecelerate to 4.1 percent in 2005, reflecting di-vergent trends at the sub-regional levels: accel-erating growth in the CEECs and slowing ac-tivity in the CIS.
Growth in the CEECs (including Turkey) isprojected to accelerate from 3.5 percent in2003 to 4.3 and 4.7 percent in 2004 and 2005,respectively, in part because of a gradualbuildup in external demand. The first round ofnew EU members, in particular, is expected tocontinue to receive significant inflows of FDI(in addition to EU transfers)—which will re-main an important source of external financeand support for long-term growth. Sustainedgrowth in Turkey assumes the country will re-main committed to the Fund’s program, andthat structural reforms will contribute to a cor-rection in internal and external balances. Thesefactors, along with the assumption of declininginterest rates, are expected to help spur domes-tic demand in Turkey.
Growth is expected to slow in the CIS from5.3 percent in 2003 to 4.6 and 3.4 percent in2004 and 2005, respectively, assuming signifi-cant decline in oil price in both 2004 and
2005—from $26.5/bbl in 2003 to $22/bbl and$20/bbl in 2004 and 2005, respectively—and acorresponding decline in the growth impetusthrough fiscal linkages.
Long-term prospectsHigher investment rates and ongoing restruc-turing of the capital base are expected to con-tribute to stronger growth in the CEE countriesduring the second decade of transition thanposted during the previous decade. Further,continued improvements in the policy environ-ment, including greater macroeconomic stabil-ity, are expected to underpin the projectedhigher growth rates. The EU accession processand coming membership will continue to act asan anchor for structural reforms and will helpattract significant inflows of FDI. While struc-tural reforms are being pursued in many CIScountries, in general, implementation is not asadvanced or as widespread as in the CEE sub-region’s economies, and in some cases there issignificant resistance to structural reforms.This implies lower long-run growth in com-parison. The recent boom in hydrocarbonrents has provided an impetus to growth, facil-itating the introduction of a number of reformsto oil-exporting countries, and contributing toan increase in investment outlays (particularlyin the energy sector). However, given thevolatility of energy market prices, theseeconomies will not be able to sustain recentlyachieved higher growth rates until diversifica-tion from energy becomes more broadly based.Given the degree of energy dependence inmany of the CIS economies, particularly Rus-sia, the projected softening of oil prices—to anaverage nominal price of about $19 per barrelfor the 2005–10 period, in the underlying fore-cast—implies a ratcheting down of the sub-region’s growth from recent high rates.
Risks There are three main risks to the forecast:
• Global trade and growth prospects:More sluggish than anticipated worldgrowth prospects, and/or a delayed re-
R E G I O N A L E C O N O M I C P R O S P E C T S
247

covery, especially in the EU, could under-mine or reduce the export led componentof growth, especially for the CEECs;
• Domestic policies and investor confi-dence: Delays in fiscal consolidation incountries with large budget deficits(Turkey, Hungary, Poland, Czech Repub-lic), which would risk diminished use of automatic stabilizers; skewed fiscal andmonetary policies (as witnessed in Poland,for example); crowding out of private in-vestment; and a slowdown of structuralreforms. In Turkey, failure to achieve sub-stantial decline in real interest rates wouldresult in significantly lower growth out-turns. For the EU accession candidatecountries with large fiscal deficits, overallfiscal consolidation as well as public ex-penditure restructuring will be necessaryto join the European exchange rate mech-anism and to absorb EU transfers, whichrequire national co-financing; the growthoutlook will also partly depend on a re-covery in external demand, which couldcushion the adjustment process. Coun-tries with large twin fiscal and externaldeficits (Turkey, Croatia, etc.) could un-
dermine confidence of foreign investorsand result in difficulties in maintaining ac-cess to financing;
• Energy prices: A sharper decline in oilprice (induced, for example, by low worldgrowth outcomes), could translate into amarked deceleration in growth for bothCIS energy exporters and countries de-pendent on Russia’s consumer markets.For the ECA region’s energy exporters, ef-fective management of large governmentoil revenues and continued structural re-forms are required to pave the way forsustained long-term growth, economic di-versification, and employment creation.Medium- and long-term prospects de-pend largely on rapid diversification ofthe production base and exports.
Sub-Saharan Africa
Recent developments
ASUBDUED EXTERNAL environment, to-gether with poor weather and home-grown problems of governance and
civil strife, held real growth in Sub-Saharan
G L O B A L E C O N O M I C P R O S P E C T S
248
Table A1.4 Europe and Central Asia forecast summary
Growth rates/ratios (percent) 1991–2000 2001 2002 2003 2004 2005 2006–15
Real GDP growth –1.6 2.2 4.6 4.3 4.5 4.1 3.4Consumption per capita 0.0 3.2 5.4 5.1 4.8 4.5 3.1GDP per capita –1.8 2.0 4.5 4.3 4.4 4.0 3.3
Population 0.2 0.1 0.1 0.1 0.1 0.1 0.1Gross Domestic Investment/GDPa 24.6 21.7 20.8 21.1 21.5 22.0 28.8Inflationb 76.0 6.1 4.0 5.8 6.5 2.7General gvt. budget balance/GDP –4.0 –8.4 –9.3 –8.4 –7.1 –6.2Export Market Growthc 6.6 4.6 2.4 8.2 7.2 7.4Export volumed 10.0 5.5 6.7 8.1 8.5 8.4Terms of trade/GDPe 0.8 0.9 –1.6 1.7 0.0 –0.3Current account/GDP –2.5 –1.4 1.1 0.6 0.1 –0.5
Memorandum itemsGDP growth: transition countriesf –2.5 4.5 3.9 4.5 4.4 3.8
Central and Eastern Europef 0.6 2.9 2.9 3.4 4.2 4.4CIS –4.4 5.8 4.7 5.3 4.6 3.4
a. Fixed investment, measured in real terms.b. Local currency GDP deflator, median.c. Weighted average growth of import demand in export markets.d. Goods and non-factor services.e. Change in terms of trade, measured as a proportion of GDP (percentage).f. Excluding Turkey.Source: World Bank baseline forecast July 2003.
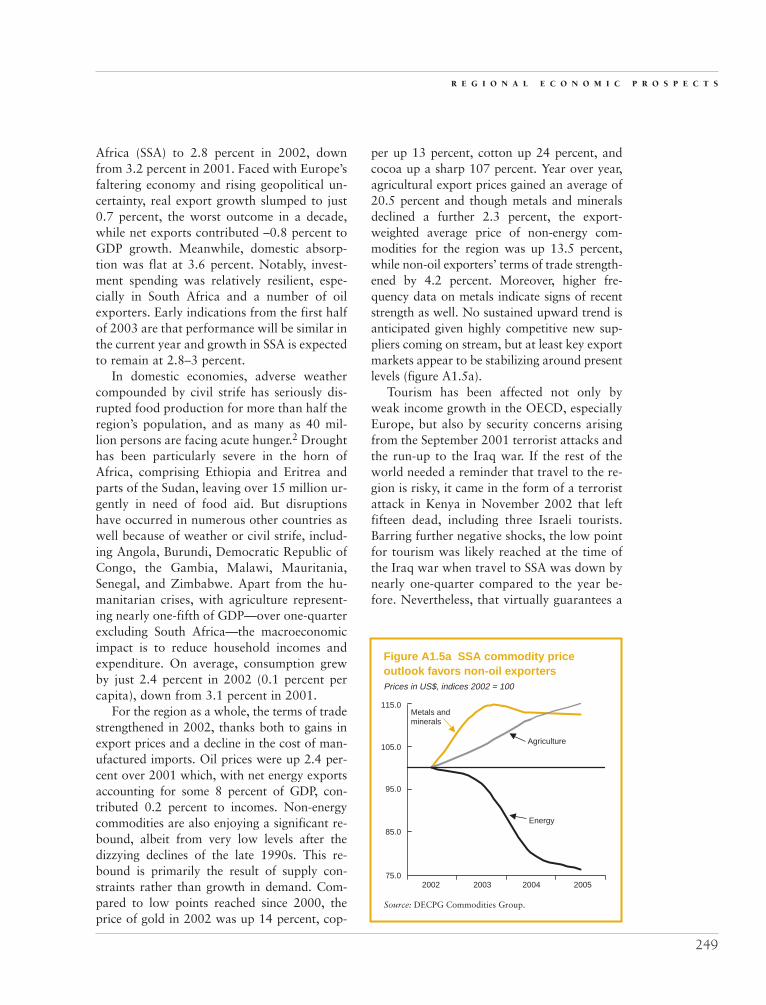
Africa (SSA) to 2.8 percent in 2002, downfrom 3.2 percent in 2001. Faced with Europe’sfaltering economy and rising geopolitical un-certainty, real export growth slumped to just0.7 percent, the worst outcome in a decade,while net exports contributed –0.8 percent toGDP growth. Meanwhile, domestic absorp-tion was flat at 3.6 percent. Notably, invest-ment spending was relatively resilient, espe-cially in South Africa and a number of oilexporters. Early indications from the first halfof 2003 are that performance will be similar inthe current year and growth in SSA is expectedto remain at 2.8–3 percent.
In domestic economies, adverse weathercompounded by civil strife has seriously dis-rupted food production for more than half theregion’s population, and as many as 40 mil-lion persons are facing acute hunger.2 Droughthas been particularly severe in the horn ofAfrica, comprising Ethiopia and Eritrea andparts of the Sudan, leaving over 15 million ur-gently in need of food aid. But disruptionshave occurred in numerous other countries aswell because of weather or civil strife, includ-ing Angola, Burundi, Democratic Republic ofCongo, the Gambia, Malawi, Mauritania,Senegal, and Zimbabwe. Apart from the hu-manitarian crises, with agriculture represent-ing nearly one-fifth of GDP—over one-quarterexcluding South Africa—the macroeconomicimpact is to reduce household incomes andexpenditure. On average, consumption grewby just 2.4 percent in 2002 (0.1 percent percapita), down from 3.1 percent in 2001.
For the region as a whole, the terms of tradestrengthened in 2002, thanks both to gains inexport prices and a decline in the cost of man-ufactured imports. Oil prices were up 2.4 per-cent over 2001 which, with net energy exportsaccounting for some 8 percent of GDP, con-tributed 0.2 percent to incomes. Non-energycommodities are also enjoying a significant re-bound, albeit from very low levels after thedizzying declines of the late 1990s. This re-bound is primarily the result of supply con-straints rather than growth in demand. Com-pared to low points reached since 2000, theprice of gold in 2002 was up 14 percent, cop-
per up 13 percent, cotton up 24 percent, andcocoa up a sharp 107 percent. Year over year,agricultural export prices gained an average of20.5 percent and though metals and mineralsdeclined a further 2.3 percent, the export-weighted average price of non-energy com-modities for the region was up 13.5 percent,while non-oil exporters’ terms of trade strength-ened by 4.2 percent. Moreover, higher fre-quency data on metals indicate signs of recentstrength as well. No sustained upward trend isanticipated given highly competitive new sup-pliers coming on stream, but at least key exportmarkets appear to be stabilizing around presentlevels (figure A1.5a).
Tourism has been affected not only byweak income growth in the OECD, especiallyEurope, but also by security concerns arisingfrom the September 2001 terrorist attacks andthe run-up to the Iraq war. If the rest of theworld needed a reminder that travel to the re-gion is risky, it came in the form of a terroristattack in Kenya in November 2002 that leftfifteen dead, including three Israeli tourists.Barring further negative shocks, the low pointfor tourism was likely reached at the time ofthe Iraq war when travel to SSA was down bynearly one-quarter compared to the year be-fore. Nevertheless, that virtually guarantees a
R E G I O N A L E C O N O M I C P R O S P E C T S
249
Figure A1.5a SSA commodity priceoutlook favors non-oil exportersPrices in US$, indices 2002 = 100
Source: DECPG Commodities Group.
115.0
105.0
95.0
85.0
75.02002
Metals andminerals
Agriculture
Energy
2003 2004 2005
�
��

mediocre year at best and the World Traveland Tourism Council (WTTC) forecasts aslight decline of 0.2 percent in GDP and em-ployment in the tourism sector in 2003. At thesame time, however, South Africa was theworld’s fastest growing tourist destination in2002, with 20 percent growth in arrivals overthe year before, and the momentum continuedinto 2003, though the pace is likely to slowwith the stronger rand. Thus, superimposedon the overall pattern of growth has been asouthward shift in the industry’s center ofgravity. Whether this will be reversed remainsto be seen.
In spite of the overall disappointing results,there were some positive developments. Aver-age per capita income rose for a fourth succes-sive year in 2002, which is the longest sustainedincrease in over two decades. Moreover, theslowdown was largely attributable to a smallgroup of poor performers. In Nigeria, a lowerOPEC quota and budget gridlock offset muchof the potential gain from higher oil prices,Ethiopia and Eritrea suffered through anotheryear of increasingly savage drought, and deep-ening political crises paralyzed Côte d’Ivoireand Zimbabwe. For this group of countries—representing around one-third of the region’spopulation and GDP—growth fell by two-thirds, from 1.7 percent to 0.6 percent in theyear. This same group also contributed to mostof the retrenchment in exports. By contrast,elsewhere in the region, GDP growth slowedonly marginally. As usual, politics played anoverarching role and countries in conflict or ex-periencing civil disruption were at the bottomof the league. Even here there is a glimmer ofhope, though, in the growing institutionalstrength of initiatives such as the African Union,NEPAD, and the East African Community.
Also encouraging is further evidence ofAfrica’s potential competitiveness, given theright incentives and opportunities. An impres-sive recent example is the growth of nontradi-tional exports under the U.S. African Growthand Opportunity Act (AGOA), which extendspreferential access to imports from a growinglist of eligible countries. So far, there have
been relatively few beneficiaries—Nigeria,South Africa, Gabon, Lesotho, and Kenya ac-count for nearly 93 percent of U.S. importsunder AGOA preferences—and three-quartersof the total consists of oil. But non-oil exportsgrew rapidly in 2002. Despite a slump in theU.S. economy that led to an overall decline ofnearly 16 percent in AGOA exports, nontradi-tional exports were sharply higher—textilesand apparel more than doubled from 2001,while transportation equipment and agricul-tural products were up 80 percent and 38 per-cent respectively.3
In South Africa, the sharp fall of the rand be-ginning in 2000 provided a strong stimulus togrowth, but much of that was reversed through2002 and into 2003 as the currency bouncedback because of tight money and the unwindingof the Reserve Bank’s net open forward positionwhich had unnerved investors. Growth in 2002was a still-robust 3.0 percent, though the con-tribution to growth from trade declined to neg-ative territory, while domestic demand soaredby 4.1 percent. Though the domestic economyslowed in the first quarter of 2003, growth re-mained relatively strong at 3.5 percent (saar),particularly investment, which was up an im-pressive 8 percent. Given the momentum evi-dent in the first quarter, domestic demandshould remain relatively strong, though withthe rand remaining firm, net exports will be adrag on growth and GDP is expected to growonly around 2.8 percent. Especially worthy ofnote is an auspicious turnaround in the labormarket in 2002, with formal sector payrolls in-creasing after seven straight years of decline,even though the increase of 70,000 jobs is smallcompared to the official estimate of 4.8 millionunemployed.
In Nigeria, slower growth in 2002 reflectedOPEC production constraints and the impactof budget gridlock that limited spillovers fromoil production to the rest of the economy inspite of strong prices. Hydrocarbons constitutealmost all Nigerian exports, but gas is takingan increasing share, and in 2002 a one-third in-crease in liquid natural gas (LNG) productionpartially offset a 6 percent fall in oil. Produc-
G L O B A L E C O N O M I C P R O S P E C T S
250

tion in the first quarter of 2003 was up around5 percent from 2002, somewhat below the av-erage increase for OPEC as a whole.4 Nigeriawould like an increase in its quota from thecurrent level of 2.1mb/d that is well below ca-pacity. But a significant rise in the near term isunlikely, as slow growth in the industrial econ-omies will constrain the global sector. Never-theless, higher production in 2003 in additionto further growth in LNG and continuing pricestrength, will underpin a stronger performancethis year. The most encouraging recent newsfrom Nigeria concerned the presidential elec-tion which has strengthened the fragile politicalprocess. But, equally important, meaningfulprogress on economic reform has been frus-tratingly slow. On balance, growth this yearand in the medium term is likely to be onlymoderate.
Near-term outlookThough the forecast calls for world economicgrowth to accelerate in the second half of2003, the pace of recovery is expected to re-main sluggish, especially in Europe where theeconomy stalled in the first quarter and therisk of outright recession has risen. Even witha pickup in momentum going into the secondhalf, the EU is expected to grow by only 0.9percent in 2003 and 1.9 percent in 2004. SSAshould benefit from a more rapid expansion ofEuropean imports thanks to the appreciationof the euro, but the 4.1 percent increase in EUimport demand anticipated over the next twoyears is barely half the pace of the late 1990s.Moreover, travel and tourism will continue toreflect security concerns, fanned recently bythe UK government’s decision in May (since re-tracted) to ban commercial flights to Kenya,though, as noted, there will be differenceswithin the region. However, for SSA overallthe external environment will provide onlymodest support for growth in the current year,with exports rising 2.9 percent. A further ac-celeration to 4.9 percent is expected in 2004 asthe recovery continues to build.
The forecast anticipates stronger growth forboth energy and non-energy exporters in the
medium term as the global recovery consoli-dates. Energy sectors are expected to contributesignificantly to regional growth, especially witha moderate rebound in Nigeria from a weakperformance in 2002. But, more generally,West Africa is emerging as an energy hot spot,with mainly offshore exploration and develop-ment activities underway from Angola throughthe Gulf of Guinea, and extending to nontradi-tional energy producers from São Tomé andPrincipe, to Mauritania. Major energy-relatedinfrastructure projects including the WestAfrican Gas Pipeline and Nigeria’s plan to endgas flaring by 2004 will also have a direct im-pact on investment and incomes. Though link-ages to non-energy sectors are generally weak,increased fiscal revenues will permit relativelyexpansionary fiscal policies. Overall, oil ex-porters’ growth is expected to reach 3.6 percentin 2003 and accelerate further to 3.9 percent by2005. Despite some retrenchment in non-oilcommodity prices in the second quarter, non-oil exporters will benefit from better terms oftrade in the current year and relative stabilityafter that. Policy improvements are expected tohave a cumulative impact on competitivenessand will help attract investment. Realistically,though, this is a slow process and many of thebenefits will be realized only in the longer term(figure A1.5b).
Long-term prospectsIn the longer run, SSA will continue to faceformidable obstacles to growth from low sav-ings and investment rates, limited quantityand quality of infrastructure and human capi-tal, and especially HIV/AIDS. As a result ofthe growing severity of the HIV/AIDS epi-demic, population growth for the region hasbeen revised downward by 0.3 percent to 1.9percent per annum. Total GDP growth hasbeen lowered by the same amount. The expec-tation is that per capita GDP growth will re-main at 1.6 percent. This expectation may beoptimistic given the long-run performance ofthe region, but even so it is barely half of whatis needed to achieve the MDGs. There is littledoubt that SSA will continue to lag behind
R E G I O N A L E C O N O M I C P R O S P E C T S
251

Table A1.5 Sub-Saharan Africa forecast summary
Growth rates/ratios (percent) 1991–2000 2001 2002 2003 2004 2005 2006–15
Real GDP growth 2.3 3.2 2.8 2.8 3.5 3.8 3.5Consumption per capita –0.3 0.6 0.1 0.5 0.8 1.1 1.2GDP per capita –0.3 0.8 0.5 0.5 1.3 1.6 1.6
Population 2.6 2.4 2.3 2.3 2.2 2.2 1.9Gross Domestic Investment/GDPa 17.4 19.3 19.8 20.2 20.0 20.1 20.8Inflationb 10.5 5.8 4.2 3.7 4.2 4.7General gvt. budget balance/GDP –4.5 –1.6 –1.0 –1.6 –1.6 –1.7Export Market Growthc 7.3 0.4 2.0 5.0 7.3 7.1Export volumed 4.5 3.8 0.7 2.9 4.9 5.4Terms of trade/GDPe 0.1 –1.5 0.5 –0.4 –0.8 –0.5Current account/GDP –2.0 –2.2 –2.2 –2.7 –2.5 –2.6
Memorandum itemsGDP growth: SSA excluding SouthAfrica 2.9 3.6 2.7 2.8 3.8 4.3Oil exporters 2.6 4.3 3.0 3.6 3.8 3.9CFA countries 2.6 3.1 1.9 2.2 3.1 3.5
a. Fixed investment, measured in real terms.b. Local currency GDP deflator, median.c. Weighted average growth of import demand in export markets.d. Goods and non-factor services.e. Change in terms of trade, measured as a proportion of GDP (percentage).Source: World Bank baseline forecast July 2003.SSA is Sub–Saharan Africa. CFA is Communaute Financiere Africaine.
other developing regions over the forecast pe-riod, with outcomes well behind best practicein other regions.
The expectation of a reversal of SSA’slengthy downward spiral hinges on strong as-sumptions about ending conflicts and improv-
ing governance and policymaking in general.For the region as a whole, real per capita in-come in absolute terms peaked in 1974, de-clining since then at an average annual rate of0.7 percent. Yet differences across the regionare striking. The worst performances have in-evitably been associated with failed states andcivil conflict, including Sierra Leone wheregrowth has averaged –3.0 percent over the pe-riod, Democratic Republic of Congo at –5.6percent, and Liberia at –5.8 percent. But, at theother end of the spectrum, long-term growthaveraged 4.4 percent in Mauritius and 5.6 per-cent in Botswana. In between, there are successstories of spectacular turnarounds. Mozam-bique, after a protracted civil war and averagegrowth of –1.8 percent during the 1980s, aver-aged 5.6 percent from 1992–2001. AlreadyMozambique, and other countries such asUganda and Tanzania, have made substantialprogress and have results to show for it, whilemany others are at an earlier stage of theprocess. By early 2003 almost all countries inthe region were participating in the PRSPprocess, with 15 having completed PRSPs and
G L O B A L E C O N O M I C P R O S P E C T S
252
Figure A1.5b Non-oil exportersincreasingly drive SSA growthGDP growth, percent
Note: RSA = Republic of South Africa.Source: World Bank staff simulations.
�
�
Non-oil exporters X RSAOil exporters
0.0
1.0
2.0
3.0
4.0
5.0
2002 2003 2004 2005

another 25 having I-PRSPs. Meanwhile, re-gional initiatives are enhancing the credibilityof governments and strengthening intra-regional cooperation. At the same time, how-ever, deep-seated conflicts in West and CentralAfrica remain to be resolved and in many areaspolitical processes remain fragile.
In principle, higher standards of gover-nance and improved policies will encouragehigher savings and investment, and raise pro-ductivity and growth. Yet, at the same time itwill remain a struggle to overcome low levelsof human and physical capital, poor infra-structure, HIV/AIDS, and negative percep-tions of international investors. Moreover, theregion remains highly dependent on primarycommodity exports, hence exposed to high ex-ternal volatility. While these factors indicatedownside risks to the projections, achievingthe moderate improvement in performanceenvisaged by the forecast seems a plausiblebaseline expectation.
Middle East and North Africa
Recent developments
THE OVERARCHING event in the MiddleEast and North Africa in 2002–03 wasthe buildup toward the war in Iraq,
provoking continued high oil prices, furthershocks to the tourism sector, and decliningconfidence in the private sector. Uncertaintybefore the war had an even larger impact thanthe war itself. However, the economic shocksresulting from the conflict highlighted severalweaknesses in regional economies—the slack-ening of the investment climate, weakness inthe private sector, and the relatively poorprospects for new foreign direct investment.
In the rise of uncertainty surrounding thesituation in the Gulf in 2002 and early 2003,oil prices surged and oil exporters lifted oilproduction. Combined with fiscal expansionprograms, it led to an acceleration of outputgrowth to 3.2 percent in oil-exporting coun-tries in 2002. High oil prices helped to keepcurrent account balances in surplus in 2002
for oil exporters at $20 billion, 4.8 percent ofGDP. Algeria continued expenditures underthe PSRE (Programme de soutien a la relanceéconomique), boosting the construction andservices sectors and offsetting weakness in theagricultural sector, which was affected by asevere drought, particularly devastating forcereal crops. Private sector growth in SaudiArabia and several Gulf countries is expectedto remain weak as a result of the disruptioncaused by the war in Iraq, but companies fromSaudi Arabia and Kuwait will benefit fromsubcontracting work associated with the re-construction of Iraqi infrastructure. In Iran,the lifting of import restrictions in the pastyear has allowed the non-oil industrial andmanufacturing sector to raise production, anddomestic demand has been a strong driver forgrowth.
Developments were more adverse for diver-sified exporters, particularly those in the Mid-dle East. The prospects for war in Iraq led tocontinued stagnation of tourism, which hadnot fully recovered from the events of Septem-ber 11. These factors and the waning of exter-nal demand, particularly in Europe in late2002, drought conditions in several countries,and a weak investment climate in severalNorth Africa countries all contributed to a fallin growth from 3.8 percent in 2001 to 2.8 per-cent in 2002. Growth in Egypt appeared setfor recovery in late 2002 with a recovery intourist arrivals and increasing business confi-dence, but tourist arrivals fell in the first halfof 2003. The Egyptian exchange rate wasfloated in January 2003, but the central bankis maintaining higher interest rates to preventfurther depreciation of the pound, curbing pri-vate investment. Production in Jordan plum-meted over late 2002 and into early 2003(figure A1.6). Contraction in the agriculturalsector was caused by drought conditions inTunisia, the fourth consecutive year ofdrought. Exports, particularly from the manu-facturing sector, were adversely affected by thewaning of demand from the European Unionin late 2002. A tighter fiscal stance, in the faceof a widening current account deficit, also con-
R E G I O N A L E C O N O M I C P R O S P E C T S
253

strained growth. However, Tunisia continuedto pursue reforms in the financial sector andcontinued to attract FDI in 2002 thanks to theaward of a second GSM license when globalflows to developing countries were shrinking.Conversely, Morocco had positive agriculturalgrowth in 2002, but the industrial moderniza-tion program under the Euro-Med AssociationAgreement and the privatization programshave tended to stagnate. The exception to thisgenerally gloomy picture is Jordan, with buoy-ant GDP and export growth despite a slow-down in export market growth and a stagnat-ing tourism sector.
Short-term prospectsProspects in 2003–04 will be shaped by thepath of oil prices and public expenditures inoil-exporting countries; the recovery of exter-nal demand; the speed of recovery in thetourism, trade, and transportation sectors inthe Middle East post-war; weather conditions;and the policy response to slackening of theinvestment climate in the diversified exporters.Growth in the region is expected to rise slightlyin 2003 to 3.3 percent as oil exporters increaseproduction and exports and diversified ex-
porters recover from the adverse impacts ofslowing external demand and drought condi-tions. The diversified exporters should beginto recover in 2004 as external demand im-proves and as growth in oil exporters isbuoyed by further fiscal expansion, somewhatoffsetting the impacts of lower oil prices andproduction.
Most of the acceleration in 2003 will occurin the oil-exporting countries, which are ex-pected to grow more quickly in 2003 as a re-sult of fiscal pump-priming and increased oilproduction quotas. GDP growth in oil ex-porters should reach 3.9 percent in 2003–04.Oil production levels for the oil exporters in2003 will be higher than 2002, ensuring thatthe oil sector will make large, positive contri-butions to GDP volume growth. High prof-itability in oil, and in services sectors, such astelecommunications and banking, has led tosurges in stock markets in Iran and SaudiArabia, particularly as a result of thin mar-kets. Firms in the Gulf Cooperation Council(GCC) countries are expected to benefit fromcontracting agreements as the reconstructionof Iraq gets underway in the second half of2003, helping to boost the weak private sec-tor. Evidence is also emerging that citizens of oil-exporting countries, particularly in theGulf, are traveling less and boosting domesticconsumption.
Saudi Arabia and Iran have begun to pushthrough needed reforms in several sectors suchas mining, capital markets, and insurance, aswell as privatizing state concerns to encourageforeign investment in the oil sector. But Alge-ria has abandoned proposed hydrocarbons re-forms. Moving into 2004, the impetus togrowth from the oil sector should wane inthese countries as oil prices and productionfall, but continued fiscal stimulus and a re-bound in private sector activity should main-tain GDP growth. Growth in Algeria will besupported in 2004 by the online debut of amajor gas project, but fiscal stimulus underthe PSRE is being absorbed more slowly thanexpected.
G L O B A L E C O N O M I C P R O S P E C T S
254
Figure A1.6 Some diversified economieshard-hit by events leading to Iraq warPercent change
Source: Egypt, Ministry of Foreign trade; Haver Analytics.
30.0
20.0
10.0
0.0
–10.0
–20.0
–30.0
–40.0
Q3 20
01
Q4 20
01
Q1 20
02
Q2 20
02
Q3 20
02
Q4 20
02
Q1 20
03
Egypt: Remittances(ch% y/y)
Jordan IP (ch% y/y)
Egypt: Tourism receipts(ch% y/y)
�
�
�

Growth in the diversified exporters is fore-cast to remain sluggish in 2003 at 2.4 percent,caused by stagnation in tourism in the first halfof the year because of the Iraq war. The agri-cultural sector in Tunisia will expand in thewake of good rains, and agricultural expansionwill continue in Morocco, but slow import de-mand in Europe will keep the manufacturingsectors depressed. The countries most affectedby the Iraq war were border nations Syria andJordan. Both countries have extensive tradelinks with Iraq, and Jordan sourced its oil fromIraq at concessional rates. Prior to the war, Jor-dan’s exports to Iraq were growing strongly.The disruption to oil supplies from Iraq and tohaulage routes through Iraq has meant thatoutput growth in the first half of 2003 in thesecountries was adversely affected. The Jordan-ian government has decreased fuel subsidiesand broadened the tax base to ease the impacton the fiscal accounts of higher oil prices,affecting the current balance. Jordanian ex-ports to other destinations, particularly to theUnited States through the “Qualified IndustrialZones,” are unaffected by the disruptioncaused by the conflict, but uncertainty in theprivate sector has decreased confidence.
In response to this range of negativegrowth factors, central banks in several coun-tries (Jordan, Morocco, Tunisia) have reducedinterest rates to stimulate domestic demand.Growth conditions should improve later in2003 and into 2004 as confidence returns tothe tourism market, the European economyrebounds, and the effects of lower interestrates filter through to domestic investment.Diversified economies are expected to grow3.7 percent in 2004. This is below the averageof the diversified exporters during the 1990s,where GDP growth achieved annual growthof 4.2 percent. The lackluster investment cli-mate in these countries requires further atten-tion in the reform process.
Long-term prospectsReducing unemployment through higher GDPgrowth remains the key challenge for the re-
gion, particularly given the very high rates ofgrowth expected in the labor force, as the agestructure of the population shifts to reduce the dependency ratio, constituting a “demo-graphic gift.” The region has achieved macro-economic stability for the most part, with lowinflation and stable external debt positions,but growth in the region is not reaching its po-tential, with many countries still stuck withper capita GDP growth of around 1.5 percent.Prospects for growth and sustainable employ-ment can be improved through reforms intrade regimes and a strengthened investmentclimate. Traditional trade liberalization, suchas lowering tariff and non-tariff barriers, isvital considering that the Middle East andNorth African (MENA) region is one of themore highly protected developing regions.While MENA’s export products (excluding oil)are not highly integrated into global trademarkets, the region has strong potential fornon-energy exports. The Mediterranean coun-tries are well on the way to trade reformsthrough their commitments over the comingdecade to the Euro-Med agreements, bilateraltrade agreements, and WTO membership. Buttrade reforms must also include ‘behind theborder’ reforms (trade facilitation, services lib-eralization, and improved competitiveness) de-signed to increase productive efficiency.
Reform of the investment climate is neededto ensure sustainable employment growth, be-cause trade reforms increase growth only whenthey stimulate new investment. Much of theimpetus to growth in recent years in manycountries has come from the public sector, andmuch of the FDI flowing into the region is tar-geted to extractive industries or parastatals thathave been privatized. To capture greater bene-fits from trade and financial market integra-tion, policy-makers in the region should focuson structural and microeconomic impedimentsto efficient resource allocation and to improvecompetition. Policy reforms are required to en-sure a sound regulatory environment in prod-uct and factor markets. Improving governance,improving the quality of public institutions,
R E G I O N A L E C O N O M I C P R O S P E C T S
255

and enforcing public accountability are neces-sary if a vibrant public sector is to evolve. Com-bating bureaucratic delays and inefficiency, im-proving the quality of infrastructure services,and fighting corruption are also essential ele-ments of a better investment climate.
With only one-third of the labor force activetoday, women represent a huge untapped re-source in the region. Experience from aroundthe world suggests that women, particularly theyoung and well-educated, can reap gains fromtrade and investment climate reforms. Thesegains are already evident in the garment andtextile industry in Egypt, Jordan, Morocco, andTunisia. Provided that economic and social bar-riers to women are dismantled, women canmore widely participate in economic life,thereby boosting economic growth and produc-tivity in the region.
Notes1. In April 2003, eight transition countries signed
the accession treaty to join the EU in May 2004, alongwith Malta and Cyprus.
2. The UN’s FAO’s Global Information and EarlyWarning System identifies 25 countries representing 56percent of total Sub-Saharan population where agricul-tural production has been seriously disrupted. (ftp://ftp.fao.org/docrep/fao/005/y9304e/y9304e00.pdf) Accord-ing to the UN WFP, 40 million persons in SSA are fac-ing acute hunger because of drought, disease, and con-flict (http://www.wfp.org/index.asp?section=3).
3. http://www.agoa.gov/resources/TRDPROFL03.pdf. AGOA rules of origin are to be tightened in 2004and it remains to be seen how long lasting the benefitswill be.
4. According to data from the Energy InformationAgency of the US Department of Energy. See http://www.eia.doe.gov/emeu/ipsr/t11a.xls.
G L O B A L E C O N O M I C P R O S P E C T S
256
Table A1.6 Middle East and North Africa forecast summary
Growth rates/ratios (percent) 1991–2000 2001 2002 2003 2004 2005 2006–15
Real GDP growth 3.4 3.2 3.1 3.3 3.9 3.5 4.3Consumption per capita 0.2 4.8 1.8 1.0 1.3 1.3 2.3GDP per capita 1.2 1.3 1.1 1.3 1.9 1.5 2.5
Population 2.2 1.9 1.9 1.9 1.9 1.9 1.7Gross Domestic Investment/GDPa 21.4 21.3 21.6 21.8 22.0 22.1 26.2Inflationb 7.5 2.6 3.8 4.0 4.0 4.0General gvt. budget balance/GDP –1.2 –0.8 –3.0 –2.3 –3.2 –2.2Export Market Growthc 7.5 –1.1 2.2 8.3 8.1 7.9Export volumed 5.7 3.6 1.2 4.2 5.5 5.2Terms of trade/GDPe 0.3 –1.8 0.1 –2.2 –1.7 –1.1Current account/GDP –1.9 4.2 3.5 0.3 –1.5 –2.6
Memorandum itemsGDP growth: Oil exporters 3.0 2.9 3.2 3.9 3.9 3.3
Diversified exporters 4.2 3.8 2.8 2.4 3.7 3.8
a. Fixed investment, measured in real terms.b. Local currency GDP deflator, median.c. Weighted average growth of import demand in export markets.d. Goods and non–factor services.e. Change in terms of trade, measured as a proportion of GDP (percentage).Source: World Bank baseline forecast July 2003.

Commodity prices increased signifi-cantly from the lows reached shortlyafter the terrorist attacks on Septem-
ber 11, 2001 (figure A2.1). Crude oil pricesrose 78 percent from the December 2001 lowsto the highs in February 2003, just prior to thestart of the war in Iraq, but have since de-clined. Agricultural prices were up 29 percentfrom the lows to recent monthly highs, whilemetals and minerals prices rose 15 percent.The decline of the dollar since early 2002 (10percent on a real-trade weighted basis) con-tributed to the rise in commodity prices. Pe-troleum and most agricultural prices are nowexpected to decline on rising supplies, whilemetals and minerals prices are expected tocontinue their recovery because of higher de-mand in the foreseen economic recovery.
The increase in crude oil prices resultedfrom strong OPEC production discipline, ex-tremely low inventories, cold winter weather,and supply disruptions in Venezuela, Iraq, andNigeria. Higher output from other OPECmembers leading up to the war in Iraq pre-vented prices from spiking sharply higher, anduse of strategic stocks was not required. Crudeoil stocks remain low and the return of Iraqiexports has been delayed, thus prices are likelyto remain relatively firm for the balance of2003. The return of Iraqi exports and risingcapacity in both OPEC and non-OPEC coun-tries is expected to lead to lower prices in2004 and beyond. Large increases in produc-tion are expected in a number of regions in the
coming years, in particular the Caspian, Rus-sia, West Africa, and several deepwater loca-tions. Much of the moderate growth in worldoil demand is expected to be captured by non-OPEC producers, thus rising supply competi-tion, both inside and outside OPEC, is ex-pected to lead to lower prices.
The rise in agricultural prices since October2001 was caused mostly by reduced suppliesfrom earlier low prices and severe El Niño-related droughts in 2002 (in Australia, Ca-nada, the Middle East, and the U.S.), whichreduced grain and oilseed production. Cocoasupplies were disrupted by conflict in Côted’Ivoire, while production was reduced fornatural rubber, robusta coffee, cotton, andvegetable oils because of earlier low prices.
Most of the sharp agricultural price increasesin 2002 and 2003 are expected to be reversed as surplus production capacity once again re-sults from higher prices. More rapid economicgrowth would strengthen demand somewhatand moderate the price declines. However, in-come elasticities for most agricultural commod-ities are low, and with weak demand growthagricultural prices are expected to decrease.
Fertilizer prices generally increased in 2003along with the recovery in agricultural com-modity prices. Higher prices for natural gas—a key input in nitrogen fertilizer production—caused nitrogen fertilizer prices to rise sharply.In addition, production capacity utilization inthe fertilizer industry increased to five-yearhighs and further contributed to the price in-
257
Appendix 2Global Commodity Price Prospects

creases. The recent downturn in agriculturalcommodity prices is expected to be reflected inlower fertilizer prices in 2004 and 2005.
The modest recovery in metals and miner-als prices resulted from production cuts be-ginning in 2001, and weakening of the U.S.dollar. Demand growth has been weak, andstocks of most metals remain high. The oneexception is nickel, where strong demand forstainless steel, low inventories, and tight sup-plies, caused prices to almost double since thelows in 2001. A recovery in metals demand isexpected to send most metals markets intodeficit and allow prices to increase over thenext several years. If global economic growthaccelerates more quickly than projected, met-als and minerals prices would increase morerapidly in the near term. Over the longer term,real prices are expected to decline as produc-tion costs continue to fall because of new tech-nologies and improved managerial practices.There is also little constraint on primary re-source availability.
Real commodity prices declined significantlyfrom 1980 to 2002, with the World Bank’sindex of agricultural prices down 47 percent,crude oil prices down 43 percent, and metalsand minerals prices down 35 percent (figure
A2.2). Such declines in commodity prices rela-tive to manufactures prices pose real challengesfor developing countries that depend on pri-mary commodities for a substantial share oftheir export revenues. For example, 57 percentof merchandise exports from Sub-SaharanAfrica in 2000 came from primary commodi-ties and fuels. The situation is not expected toimprove, with real non-oil commodity pricesexpected to increase only modestly through2015 and crude oil prices expected to declineby 23 percent from 2002 levels. Multilateraltrade negotiations could lead to higher agricul-tural prices if reforms reduce production subsi-dies and tariffs in major consuming and pro-ducing countries; however, little progress onreforms has thus far been achieved. (Specificcommodity prices and price indices forecastsfor 2003, 2004, 2005, 2010, and 2015 in cur-rent and constant dollars are given in appendixtables A2.14–16. The forecasts do not reflectthe effects of a multilateral trade agreement be-cause of the uncertainty of such an agreement.)
BeveragesThe World Bank’s index of beverage prices(composed of coffee, cocoa, and tea prices) is
G L O B A L E C O N O M I C P R O S P E C T S
258
Figure A2.1 Commodity price trendsIndex, January 2000 = 100
Source: World Bank.
�
�
�
60
Jan.2000
Metals and mineralsAgriculture
Crude oil
July2000
Jan.2001
July2001
Jan.2002
July2002
Jan.2003
July2003
80
100
120
140
Figure A2.2 Real commodity pricesIndex, 1990 = 100
Source: World Bank.
�
�
�
Agriculture
Forecast
Metals andminerals
Crude oil
0
1970
1975
1980
1985
1990
1995
2000
2005
2010
2015
50
100
150
200
250

expected to increase by about 6 percent in2003, largely reflecting coffee price increases(arabica up 7 percent and robusta up 33 per-cent) in response to reduced output fromBrazil (figure A2.3). Cocoa prices, which havebeen (and are likely to be) extremely volatilebecause of the political unrest in Côte d’Ivoire,are expected to remain unchanged. Fears thattea prices might suffer a major setback result-ing from the military conflict in Iraq did notmaterialize and the three-auction average for2003 is expected to remain at its 2002 level.
Coffee. Despite the increase in coffee pricesexpected in 2003, (robusta up US$0.22 toUS$0.88/kg and arabica up US$0.10 toUS$1.46/kg) prices will remain near historicallows—at about one-third of their 1960 reallevels. Low coffee prices reflect both the surgein supplies and weak demand. During the pastfive seasons, global coffee production has av-eraged 114 million 60 kg bags, compared to99 million bags during the five prior seasonswhen coffee prices peaked. Per capita con-sumption in the major importing countries hasbeen stagnant at 4.6 kgs of green coffee equiv-alent during the past ten years.
Surpluses over the past four seasons havekept the coffee market depressed, and this sit-uation has often been referred to as the “coffeecrisis” by the popular press. Attempts to dealwith the surpluses have either been largely un-successful or abandoned. The Association ofCoffee Producing Countries (ACPC), whichurged coffee-producing countries to join its ex-port retention scheme, ceased operating lastyear. The International Coffee Organization(ICO), in an effort to reduce coffee availabilityand thus push prices higher, called for the re-moval of low-quality coffee beans. This plantoo has met resistance because there is no well-defined compensation mechanism in place. In addition, improved roasting methods havemade it easier to remove the harsh taste of nat-ural arabicas and robustas, enabling roastersto produce the same coffee quality with lower-quality green beans, thus putting into questionICO’s proposal.
Global coffee production during the 2003–04 season is expected to be about 107million bags, down from last season’s 123 mil-lion bags (table A2.1). Almost all of the re-duction is because of reduced Brazilian output(from 52 million bags in 2002 to 34 millionbags in 2003), which is partly because of lessfavorable weather conditions and partly be-cause of the strength of the Brazilian currency.Still, Brazil will account for one-third ofglobal coffee output while Colombia and Viet-nam are expected to reach 12 and 11 millionbags, respectively, and be the second and thirdlargest coffee suppliers of arabica and robusta,respectively.
Coffee prices are projected to increase in2004, with arabica up 9 percent and robustaup 5 percent. Over the longer term, real coffeeprices are expected to increase relative to the2002 depressed levels but remain well belowthe historical highs of the 1970s and more re-cent highs of the mid-1990s. By 2015, realarabica and robusta prices are projected to in-crease about 50 and 70 percent, respectively,over their 2002 levels. Prices would still beonly about half of their 1990s peaks.
G L O B A L C O M M O D I T Y P R I C E P R O S P E C T S
259
Figure A2.3 Beverage pricesUS cents per kilogram
Sources: International Coffee Organization, InternationalCocoa Organization, International Tea Committee.
0
100
Jan.1997
Jan.1998
Jan.1999
Jan.2000
Jan.2001
Jan.2002
Jan.2003
Arabica coffee
Cocoa
Tea
Robusta coffee
200
300
400
500
600
�
�
�
�

Cocoa. Cocoa prices have staged a remark-able recovery, going from a 30-year low ofUS$0.86/kg in February 2000 to a 16-yearhigh of US$2.28/kg in February 2003. Priceshave been extremely volatile, especially duringthe last two years, with month-to-month pricechanges often exceeding 10 percentage points.While the recovery in prices is a result of thereturn to normal supply levels, the volatility isa reflection of the political instability in Côted’Ivoire, the world’s dominant supplier.
Global cocoa production is expected toreach 3 million tons during the marketing sea-son ending in September 2003, up from lastseason’s 2.85 million tons (table A2.2). All of
the increase is expected to come from Ghana,the world’s second-largest cocoa supplier (from341 to 450 thousand tons). Côte d’Ivoire’sshare is expected to remain largely unchangedat 1.26 million tons. Cocoa prices for 2003 areexpected to remain at their 2002 levels, but asmall decline is expected in 2004 as productioncontinues to increase, an assessment which isbased on the assumption that the strong pricesenjoyed during the last two seasons will pro-vide further incentives to cocoa growers tomaintain their trees and increase production.The degree of volatility in cocoa prices is likelyto remain high until the political unrest in Côted’Ivoire is settled.
G L O B A L E C O N O M I C P R O S P E C T S
260
Table A2.1 Coffee production in selected countries(million bags)
1998 1999 2000 2001 2002 2003
Brazil 35.6 30.8 34.1 35.1 51.6 33.6Colombia 10.9 9.5 10.5 12.0 10.9 11.8Vietnam 7.5 11.0 15.3 12.3 10.3 10.8Indonesia 7.0 6.7 6.5 6.2 6.0 6.1México 5.0 6.2 4.8 4.2 4.4 4.7Guatemala 4.3 4.4 4.6 3.5 3.8 3.8Ethiopia 3.9 3.8 3.7 3.8 3.0 3.3Uganda 3.6 3.1 3.2 3.5 3.1 3.2World 108.4 113.4 116.6 110.1 122.8 107.1
Note: Years refer to crop years beginning in April.Source: U.S. Department of Agriculture.
Table A2.2 Beverages global balances
Annual growth rates (percent)
1970 1980 1990 1999 2000 2001 1970–80 1980–90 1990–00
Coffee (Thousand bags)Production 64,161 86,174 100,181 116,581 110,104 122,759 2.1 1.4 1.2Consumption 71,536 79,100 96,300 106,343 108,186 110,750 1.0 2.0 0.2Exports 54,186 60,996 76,163 90,394 86,823 88,974 0.8 2.4 1.7
Cocoa (Thousand tons)Production 1,554 1,695 2,506 2,812 2,850 2,996 0.5 4.6 1.2Grindings 1,418 1,556 2,335 3,014 2,858 2,976 0.2 4.5 2.6Stocks 497 675 1,791 1,111 1,137 1,127 2.4 13.9 –4.7
Tea (Thousand tons)Production 1,286 1,848 2,516 2,895 3,021 3,000 4.1 2.9 1.5Exports 752 859 1,132 1,330 1,391 1,419 24 2.4 1.6
Notes: Time reference for coffee (production and exports) and cocoa are based on crop years (October to September for cocoaand April to March for coffee). For coffee consumption and tea time is calendar year.Sources: US Department of Agriculture, International Coffee Organization, International Cocoa Organization, International TeaCommittee, and World Bank.

Tea. The three-auction average tea price isexpected to remain largely unchanged in 2003vs. 2002 at about US$1.50/kg and thereforenot to recover from the 20 percent decline be-tween 2000 and 2002. The weakness in teaprices is expected to persist because of over-supply and a trend of slow growth of con-sumption. Production in 2002 was about thesame as in 2001, but production is expected toincrease in 2003. The rapid increase in pro-duction in Vietnam has contributed to alreadyample supplies and threatens to depress prices.Vietnam has doubled production since 1990.
Tea prices have been volatile because of theuncertainties associated with the war in Iraqand concerns that imports would be disrupted.In addition, excessive rains in Sri Lanka, thelargest exporter, disrupted supplies. By 2015real tea prices are expected to be slightly lowerthan in 2002.
FoodThe World Bank’s food price index is expectedto rise 4.3 percent in 2003 and be up 11.2 per-cent from the low in 2000. However, the indexis still well below highs reached in 1997 (figureA2.4). Following recent increases, the index isexpected to decline 2.4 percent in 2004 and an
additional 2.1 percent in 2005 as grain andoilseed prices decline from recent highs. Grainsprices have increased almost 15 percent fromthe lows in 2001 and fats and oils prices haveincreased 26 percent. Over the longer term,real food prices are projected to decline 2.7percent from 2003 to 2015.
Fats and oils. Prices of fats and oils are ex-pected to increase almost 7 percent in 2003,which gives a cumulative increase of 20 per-cent since 2001. However, prices have recov-ered less than half of the decline experiencedfrom 1997 to 2001. The price increase is ex-pected to be greatest in groundnut oil (up 60percent). Price increases are expected to be lessin the two major oilseed crops, soybean andpalm, with soybean oil up 16 percent and palmoil up 9 percent.
Global production of the 17 major fats andoils is expected to increase by 1.4 percent inthe season starting October 2003, followinglast season’s increase of 2.5 percent. Demandin 2003–04, to be fueled by increased importsby China and India, is projected to outpaceproduction by at least 1 percentage point.
Global soybean production has increasedby more than 5 percent per year since 1990,with the most rapid increase in Brazil andArgentina (table A2.3). Argentina and Brazilhave been increasing production at nearly 10percent per year since 1990.
Global palm oil production has doubledevery eight years during the past three decadeswith the largest increases coming from In-donesia and Malaysia (table A2.4).
G L O B A L C O M M O D I T Y P R I C E P R O S P E C T S
261
Figure A2.4 Food pricesIndex, 1990 = 100
Source: World Bank.
Jan.1997
Jan.1998
Jan.1999
Jan.2000
Jan.2001
Jan.2002
Jan.2003
70
80
90
100
110
120
130
Table A2.3 Soybean production(millions of tons)
UnitedYear Argentina Brazil States World
1990 11.5 15.8 52.4 104.11995 12.4 24.2 59.2 124.92000 27.8 39.0 75.1 175.12001 30.0 43.5 78.7 184.32002 35.0 51.0 74.3 194.0
Note: Argentina, Brazil, and the U.S. account for about 83percent of global production.Source: USDA.

Grains. Global grain stocks, relative to use,are expected to recover slightly from lastyear’s lows (excluding China where data isvery uncertain). However, stocks remain lowand there is still a risk that prices could risesharply if yields in the coming crop year aresignificantly below trends. If yields are neartrend, then prices should decline and stocksshould continue to rebuild.
Maize prices are projected to rise 6.7 per-cent in 2003 and then decline 5.7 percent in2004 as production increases and stocks re-build (table A2.5). Production in the U.S., themajor producer with 40 percent of world pro-duction, is projected to increase 12 percent in2003–04 compared to the previous year. Realprices are projected to decline about 4 percentfrom 2003 to 2015 as yields continue to growfaster than consumption, as was the case dur-ing the 1990s.
Rice prices are projected to rise about 4percent in 2003 and an additional 3.0 percentby 2005. Rice prices are well below historicalnorms relative to other food grains, and thisshould increase import demand for rice rela-tive to wheat. Lower Indian exports this yearbecause of drought will also contribute to theprice increases. Global rice stocks are low andprices could increase significantly if a poorcrop reduces stocks further. Over the longerterm, real rice prices are projected to rise 4.6percent by 2015 vs. 2003, while most othergrains prices are projected to decline.
Wheat prices are expected to decline in2003–05 as production recovers from severedrought. Prices increased from US$112/ton in1999 to US$148/ton in 2002, but are expectedto decline to US$133/ton by 2005. Productionin the major exporters (U.S., EU, Canada,Australia, and Argentina) is expected to in-crease 20 percent in the 2003–04 crop yearand stocks are expected to increase 17 per-cent. However, global wheat stocks remainlow (table A2.5) and there is a substantial riskthat prices could rise if the drought persists.
Sugar. Sugar prices averaged 15.2 cents/kilogram in 2002 (figure A2.5). They are ex-
G L O B A L E C O N O M I C P R O S P E C T S
262
Table A2.4 Palm oil production(million tons)
Year Indonesia Malaysia Nigeria World
1980 0.69 2.58 0.43 4.591985 1.24 4.13 0.39 7.041990 2.41 6.10 0.58 11.031995 4.22 7.81 0.66 15.222000 7.05 10.8 0.74 21.872001 8.03 11.8 0.77 23.922002 9.02 11.9 0.78 25.032003 9.60 12.7 0.79 26.59
Source: Oil World.
Table A2.5 Global grain stocks-to-usepercentages (excluding China)
Maize Rice Wheat Total grains
1997–98 10.1 9.3 16.5 13.01998–99 11.5 10.2 18.0 14.01999–00 11.4 11.8 17.1 13.62000–01 11.6 13.6 18.6 14.42001–02 10.4 13.1 20.4 14.92002–03 6.3 10.0 15.8 12.02003–04 8.9 10.2 16.9 12.590s Low 6.1 8.6 13.9 9.8
Note: Data for 2003–04 is the USDA’s May 2003 estimate forwheat and maize and World Bank estimate for rice.Source: USDA.
Figure A2.5 Sugar pricesU.S. cents per kilogram
Source: International Sugar Organization.
Jan.1997
Jan.1998
Jan.1999
Jan.2000
Jan.2001
Jan.2002
Jan.2003
0
5
10
15
20
25
30

Table A2.6 Foods global balances(million tons)
Annual growth rates (percent)
1970 1980 1990 2000 2001 2002 1970–80 1980–90 1990–00
GrainsProduction 1,079 1,430 1,769 1,839 1,872 1,807 2.88 1.55 1.04Consumption 1,114 1,451 1,717 1,862 1,902 1,906 2.58 1.78 1.02Exports 119 212 206 233 237 237 6.35 0.13 0.94Stocks 193 309 490 536 506 407 7.24 3.83 –0.56
SoybeansProduction 42.1 62.2 104.1 175.1 184.3 194.0 6.84 1.87 5.08Consumption 46.0 68.1 104.3 172.2 182.3 194.2 6.53 2.04 4.99Exports 12.3 20.8 25.4 55.5 55.1 63.2 5.24 0.80 2.88Stocks 3.4 10.3 20.6 30.6 32.0 31.0 13.83 –0.66 0.20
Sugar (raw equivalent)Production 70.9 84.7 109.4 130.4 134.7 143.3 2.80 1.59 3.26Consumption 65.4 91.1 106.8 130.3 134.9 136.6 3.30 1.40 3.00Exports 21.9 27.6 34.1 37.7 40.7 46.6 3.26 0.83 3.12Stocks 19.6 19.5 19.3 37.3 34.0 32.2 3.96 –0.77 4.52
Fats and oilsProduction 39.8 58.1 80.8 117.2 120.1 121.8 3.68 3.54 3.70Consumption 39.8 56.8 80.9 116.8 120.9 123.8 3.55 3.69 3.64Exports 8.8 17.8 26.9 38.3 41.0 42.2 7.05 4.19 3.39Stocks 5.2 9.3 12.2 14.8 13.6 12.1 7.09 2.44 0.69
Notes: Time references for grains, soybeans and sugar are based on marketing years, shown under the year in which productionbegan, and vary by country; for fats and oils, crop years begin in September. Fats and oils includes the 17 major fats and oils.Sources: USDA and Oil World.
pected to increase slightly in 2003 and 2004 as supplies are curtailed and stocks reduced.High crude oil prices have contributed to theprice increase by diverting sugar cane produc-tion to ethanol production in Brazil for use as vehicle fuel. Prices are projected to averageabout US$0.16/kg in 2003 and 2004, and riseslightly in 2005. The longer-term price pros-pects are not encouraging for producers unlessglobal policy reforms are agreed in the currentround of multilateral trade negotiations. With-out reforms, nominal prices are expected to re-main low except when supplies are reduced bydrought in a major producing country.
Brazil, the world’s lowest cost and largestsugar exporter, with about one-third of worldsugar exports, has increased production andexports dramatically since 1990 and is ex-pected to continue expanding. This has putdownward pressure on prices, as Brazilianexports have increased from 1.3 million tonsin 1990–91 to 14.2 million tons in 2002–03.
Global consumption grew by 3.0 percent perannum during the 1990s (table A2.6).
Raw MaterialsThe index of agricultural raw materials prices(composed of tropical hardwoods, cotton, andnatural rubber) declined sharply during theAsia crisis and then stabilized before decliningagain as supplies of commodities continued to increase (figure A2.6). Prices reached a lowin 2001 and have since recovered because ofhigher cotton and natural rubber prices. Nom-inal prices are projected to increase an addi-tional 6 percent by 2005 from 2003 levels,while real prices are projected to rise 10 per-cent from 2003 to 2015.
Cotton. Cotton prices are expected to in-crease 28 percent in 2003, following declinesin the two previous years that took prices to30-year lows. The price recovery is due mostlyto an 11 percent reduction in supplies in the
G L O B A L C O M M O D I T Y P R I C E P R O S P E C T S
263

2002–03 marketing season (table A2.7). Mostof the reduction came from China and theU.S., the world’s two dominant cotton suppli-ers, which account for over 40 percent ofglobal output.
The 2003 increase in cotton prices is ex-pected to lead to a strong supply response, ac-cording to the International Cotton AdvisoryCommittee. They estimate the 2003–04 globalcotton production will be 9 percent higherthan this season’s crop. Most of the increase isexpected to come from China (almost 1 mil-lion tons). Global consumption is expected tostay slightly higher than production, causingstocks to fall for a second consecutive season.
The A Index cotton price is expected to aver-age US$1.30/kg during 2003 and remain atapproximately the same level during the nexttwo seasons, as the market appears to havereached a balance. By 2015, real prices areprojected to increase 30 percent relative to2002 levels.
Natural Rubber. Rubber prices are ex-pected to increase 23 percent in 2003, afterfalling to historical lows in 2001 following theAsian financial crisis. The recent strength inrubber prices reflects increased demand as wellas supply controls by Thailand and Indonesia,the dominant natural rubber suppliers with acombined 60 percent of global output. Con-sumption in 2002 increased 3.6 percent over2001 and preliminary figures for 2003 indicatethat it will stay strong. China, the world’sdominant natural rubber consumer, has beenthe major source of increased demand (tableA2.8). In the 12-month period ending May2003, Chinese rubber demand increased 7 per-cent. Strong demand was also present by othermain buyers, notably the U.S., Japan, and Ger-many. The demand for natural rubber has alsobeen aided by lower demand for synthetic rub-ber, whose prices increased considerably be-cause of high crude oil prices (crude oil is amajor cost component of synthetic rubber).
Natural rubber prices are expected to re-main above US$0.90/kg for the next two tothree years. Over the longer term, real pricesare projected to increase slightly over the 2002levels.
G L O B A L E C O N O M I C P R O S P E C T S
264
Figure A2.6 Raw materialsIndex, 1990 = 100
Source: World Bank.
Jan.1997
Jan.1998
Jan.1999
Jan.2000
Jan.2001
Jan.2002
Jan.2003
60
70
80
90
100
110
120
130
Table A2.7 Cotton production in selected countries(million tons)
1998 1999 2000 2001 2002 2003
China 4.50 3.83 4.42 5.32 4.92 5.80United States 3.03 3.69 3.74 4.42 3.75 3.71India 2.71 2.65 2.38 2.69 2.35 2.68Pakistan 1.48 1.91 1.82 1.80 1.70 1.80Uzbekistan 1.00 1.13 0.98 1.06 1.03 0.99Franc Zone 0.90 0.93 0.70 1.03 0.93 0.95World 18.55 19.09 19.46 21.51 19.20 20.96
Notes: Years refer to crop years that begin in August.Source: International Cotton Advisory Committee.

Tropical Timber. Tropical timber prices re-covered in 2002 and 2003 from sharp declinesin 2001, with nominal prices up 9 percent in2002 and expected to be up an additional 5percent in 2003. The initial price increaseswere supported by the decline of the dollar vs.the Yen and Euro, but the price recovery ap-pears to have stalled in 2003 as demand hasweakened in Asia and Europe. China has be-come the largest tropical log importer, displac-
ing Japan, and has become a significant ply-wood producer and exporter. The partial banon log exports from Asian and African ex-porters, intended to increase domestic pro-cessing, has raised the prices of logs, andsomewhat restricted supplies, while depressingprices of sawnwood and plywood relative tologs. However, the bans have not been totallyeffective and illegal exports continue. Tropicaltimber prices are expected to continue to re-cover, up 3 percent in 2004 and up 7 percentin 2005, with demand in China, Japan, andEurope important factors determining the rateof price increase. Real tropical timber pricesare projected to increase 28 percent from2003 to 2015, but stay below the highs of the1990s as new technology allows better utiliza-tion of timber.
Fertilizers
Fertilizer prices generally increased in 2003as demand increased because of the rise
in agricultural commodity prices. Among the
G L O B A L C O M M O D I T Y P R I C E P R O S P E C T S
265
Table A2.8 Natural rubber consumption(thousand tons)
1999 2000 2001 2002
China 997 1,123 1,224 1,332United States 1,116 1,142 1,010 1,046Japan 733 753 729 774India 617 638 631 675Korea, Rep. of 325 331 327 321Germany 226 250 245 254France 253 262 262 241World 6,771 7,129 6,973 7,223
Sources: LMC International, International Rubber StudyGroup.
Table A2.9 Raw materials global balances
Annual growth rates (percent)
1970 1980 1990 2000 2001 2002 1970–80 1980–90 1990–00
Cotton (thousand tons)Production 11,740 13,832 18,970 19,461 21,510 19,200 1.2 3.1 0.8Consumption 12,173 14,215 18,576 19,886 20,194 21,000 1.1 3.1 0.2Exports 3,875 4,414 5,081 5,857 6,496 6,500 0.9 2.8 0.5Stocks 4,605 4,895 6,645 9,637 10,585 8,780 1.7 2.8 1.4
Natural rubber(thousand tons)
Production 3,140 3,820 5,080 6,730 7,190 7,110 1.8 3.2 3.1Consumption 3,090 3,770 5,190 7,340 7,080 7,390 1.6 3.2 3.3Net Exports 2,820 3,280 3,950 4,930 5,140 5,040 1.3 2.1 1.8Stocks 1,440 1,1480 1,500 1,930 2,040 1,760 0.6 0.2 3.7
Tropical timber(thousand cubic meters)
Logs, production 210 262 300 279.5 283.3 n.a. 1.5 1.7 0.5Logs, imports 36.1 42.2 25.1 18.6 17.9 n.a. 0.2 5.1 5.4Sawnwood, production 98.5 115.8 131.8 109.1 106.2 n.a. 1.2 1.7 2.0Sawnwood, imports 7.1 13.2 16.1 23.1 22.5 n.a. 5.0 2.6 3.3Plywood, production 33.4 39.4 48.2 58.1 55.5 n.a. 1.2 2.0 0.5Plywood, imports 4.9 6.0 14.9 19.0 19.2 n.a. 0.7 9.1 3.6
n.a. = Not available.Notes: Time reference for cotton is based on crop year beginning in August; for natural rubber and tropical timber, time refers tocalendar year.Sources: International Cotton Advisory Committee, International Study Rubber Group, FAO, and World Bank.
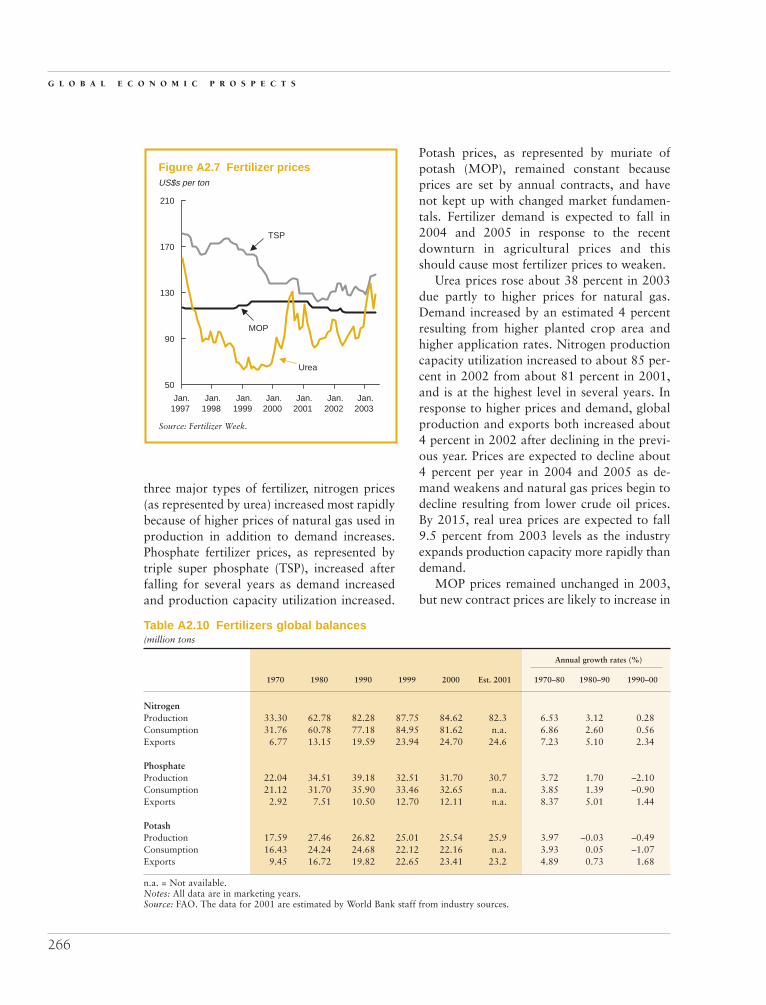
three major types of fertilizer, nitrogen prices(as represented by urea) increased most rapidlybecause of higher prices of natural gas used inproduction in addition to demand increases.Phosphate fertilizer prices, as represented bytriple super phosphate (TSP), increased afterfalling for several years as demand increasedand production capacity utilization increased.
Potash prices, as represented by muriate ofpotash (MOP), remained constant becauseprices are set by annual contracts, and havenot kept up with changed market fundamen-tals. Fertilizer demand is expected to fall in2004 and 2005 in response to the recentdownturn in agricultural prices and thisshould cause most fertilizer prices to weaken.
Urea prices rose about 38 percent in 2003due partly to higher prices for natural gas.Demand increased by an estimated 4 percentresulting from higher planted crop area andhigher application rates. Nitrogen productioncapacity utilization increased to about 85 per-cent in 2002 from about 81 percent in 2001,and is at the highest level in several years. Inresponse to higher prices and demand, globalproduction and exports both increased about4 percent in 2002 after declining in the previ-ous year. Prices are expected to decline about4 percent per year in 2004 and 2005 as de-mand weakens and natural gas prices begin todecline resulting from lower crude oil prices.By 2015, real urea prices are expected to fall9.5 percent from 2003 levels as the industryexpands production capacity more rapidly thandemand.
MOP prices remained unchanged in 2003,but new contract prices are likely to increase in
G L O B A L E C O N O M I C P R O S P E C T S
266
Figure A2.7 Fertilizer pricesUS$s per ton
Source: Fertilizer Week.
Jan.1997
Jan.1998
Jan.1999
Jan.2000
Jan.2001
Jan.2002
Jan.2003
50
TSP
MOP
Urea
90
130
170
210
�
�
�
Table A2.10 Fertilizers global balances(million tons
Annual growth rates (%)
1970 1980 1990 1999 2000 Est. 2001 1970–80 1980–90 1990–00
Nitrogen Production 33.30 62.78 82.28 87.75 84.62 82.3 6.53 3.12 0.28Consumption 31.76 60.78 77.18 84.95 81.62 n.a. 6.86 2.60 0.56Exports 6.77 13.15 19.59 23.94 24.70 24.6 7.23 5.10 2.34
PhosphateProduction 22.04 34.51 39.18 32.51 31.70 30.7 3.72 1.70 –2.10Consumption 21.12 31.70 35.90 33.46 32.65 n.a. 3.85 1.39 –0.90Exports 2.92 7.51 10.50 12.70 12.11 n.a. 8.37 5.01 1.44
PotashProduction 17.59 27.46 26.82 25.01 25.54 25.9 3.97 –0.03 –0.49Consumption 16.43 24.24 24.68 22.12 22.16 n.a. 3.93 0.05 –1.07Exports 9.45 16.72 19.82 22.65 23.41 23.2 4.89 0.73 1.68
n.a. = Not available.Notes: All data are in marketing years.Source: FAO. The data for 2001 are estimated by World Bank staff from industry sources.

2004 in response to improved demand and thehighest capacity utilization rates in five years.Production rose about 3 percent in 2002, withmost of the increase coming from Canada,which accounts for 40 percent of world ex-ports and one-third of production. Prices areexpected to increase by about 3 percent in2004 and remain at the higher level in 2005.Increased domestic production in China, alongwith large surplus global production capacity,is expected to keep price increases small. By2015, real prices are projected to fall 3.5 per-cent compared to 2003.
TSP prices increased 7 percent in 2003after falling 23 percent from 1998 to 2001and increasing 6 percent in 2002. Productionincreased by about 7 percent in 2002, withproduction in the U.S.—the world’s largestproducer with a 30 percent share—increasingby 13 percent, according to industry sources.Exports declined because of a sharp drop inChinese imports, which were replaced by in-creased domestic production. TSP prices areexpected to decrease marginally in 2004 and2005 as demand weakens; however, surplusproduction capacity is smaller than for othermajor fertilizers and is expected to remaintight over the next several years. Thus realprices are projected to remain about constantbetween 2003 and 2015.
Metals and Minerals
Metals and minerals prices have rallied anumber of times since the lows of Oc-
tober 2001, often on investor expectationsthat a global economic recovery would lead tohigher demand for metals. However, prospectsfor a strong economic recovery have keptbeing pushed back and the price rallies havebeen short-lived. Yet the index for metals andminerals is up 13 percent since October 2001on improving fundamentals—notably pro-ducer cutbacks, some modest reduction of in-ventories, and weakening of the U.S. dollar.
As major producers and consumers do nothave their currencies linked to the dollar, themetal prices in dollars fluctuate with the value
of the U.S. dollar, rising when the Euro orAustralian dollar appreciate and falling in theopposite case (figure A2.8).
Most metals markets are expected to re-main in surplus or a balanced position in2003, and slip into deficit in 2004 as demandrecovers. During the upturn of the next eco-nomic cycle metals prices could rise signifi-cantly, as is typical during a recovery. How-ever, higher prices will induce development ofnew capacity and the restart of idle facilities,and prices will eventually recede. Real pricesare expected to decline in the longer term (fig-ure A2.9), as production costs continue to fallfrom new technologies and improved manage-rial practices, and there is little constraint onprimary resource availability. The one excep-tion is nickel, where new supply prospects overthe next few years are quite limited, whichcould lead to much higher prices.
AluminumAluminum prices have been relatively steadythe past year (figure A2.10), despite extremelyhigh inventories and a market in surplus.Three main factors have limited an expectedwidening surplus and supported prices. First,
G L O B A L C O M M O D I T Y P R I C E P R O S P E C T S
267
Figure A2.8 Index: Metals prices andexchange ratesIndex, January 1990 = 100
Source: World Bank, Datastream.
Jan.1990
Jan.1992
Jan.1994
Jan.1996
Jan.1998
Jan.2000
Jan.2002
Jan.2004
60
70
80
90
100
110
120
130
$/Aus$
$/Euro
Metals &minerals
�
�
�

several production cuts have occurred inNorth America and elsewhere because of elec-tric power-related difficulties. Second, tight-ness in alumina supplies has resulted in highalumina prices, which may slow Chinese alu-
minum production growth—where much ofthe recent increase has occurred—as it is alarge importer of alumina. Finally, tightness inscrap supplies has generated higher demandfor primary aluminum.
If these conditions continue into 2004, thelarge surplus that had been forecast may notoccur. This may limit the price declines thatsome had forecast. However, world aluminumproduction in May was the highest on record,with Chinese production up 29 percent for thefirst five months of this year. There is also the possibility that shut-in capacity could berestarted.
The aluminum market is expected to moveinto deficit in 2005, but there are a number ofuncertainties in the near term, e.g., the extentof demand growth, reactivation of idle capac-ity, and the size of Chinese net exports. Realprices for primary aluminum are expected toslightly decline in the long term following amodest recovery during the next economiccycle. New low-cost capacity in a number ofcountries, e.g. Canada and the Middle East, isexpected to meet the relatively strong growthin demand, although new investment will con-tinue to require low-cost power supplies.There is not expected to be any constraint onalumina supply over the forecast period, andseveral new alumina capacity expansions areunderway, e.g., Australia and Brazil.
CopperCopper prices have risen more than 20 percentfrom the lows of October 2001, largely be-cause of a number of production cutbacks andcurtailments that began in 2001. This hashelped reduce the large surplus that emergedin 2001, and LME copper stocks have fallenabout 30 percent from the peak in 2001—yetthey remain relatively high (figure A2.11). Inthe first quarter of 2003, the global coppermarket moved into deficit according to the In-ternational Copper Study Group, because oflower world production and relatively strongdemand, particularly in China where con-sumption rose more than 20 percent from ayear earlier.
G L O B A L E C O N O M I C P R O S P E C T S
268
Figure A2.9 Index: Metals and mineralsIndex, 1990 = 100
Source: World Bank.
20
40
60
80
100
120
140
160
1960
1965
1970
1975
1980
1985
1990
1995
2000
2005
2110
2115
Nominal
1990$
��
Figure A2.10 Aluminum price and LME stocks$/ton tons
Sources: Platts Metals Week, London Metal Exchange.
1,100Jan.1997
Jan.1998
Jan.1999
Jan.2000
Jan.2001
Jan.2002
Jan.2003
1,200
1,300
1,400
1,500
1,600
1,700
1,800
200,000
400,000
600,000
800,000
1,000,000
1,200,000
1,400,000
�
�
Price[left scale]
Stocks[right scale]
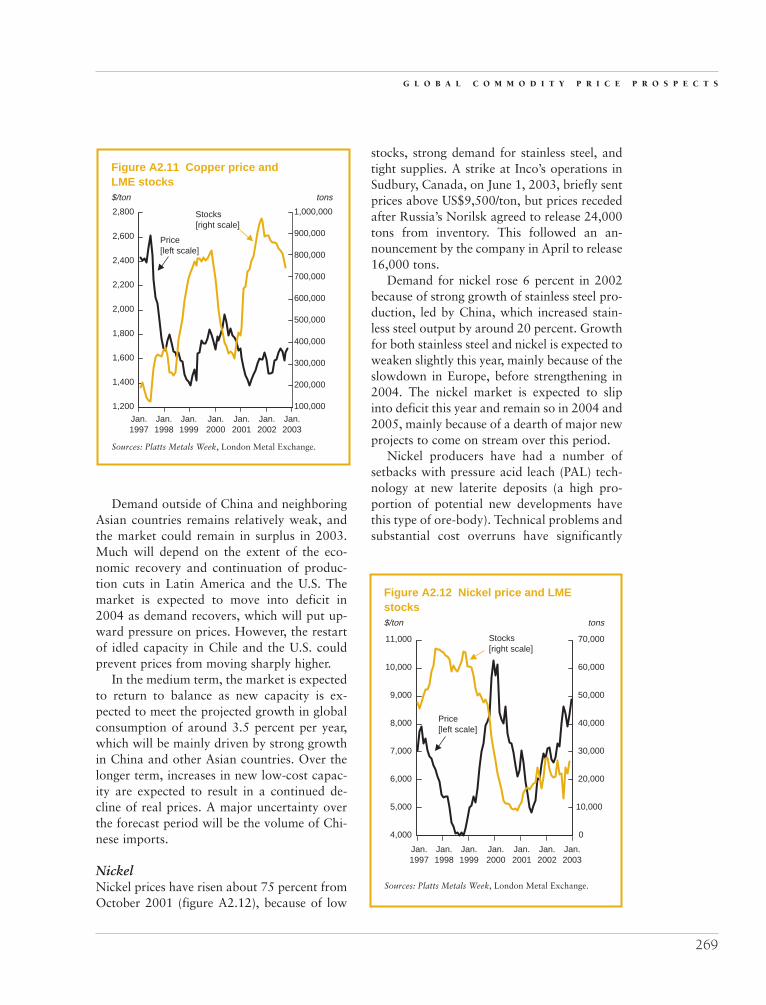
Demand outside of China and neighboringAsian countries remains relatively weak, andthe market could remain in surplus in 2003.Much will depend on the extent of the eco-nomic recovery and continuation of produc-tion cuts in Latin America and the U.S. Themarket is expected to move into deficit in2004 as demand recovers, which will put up-ward pressure on prices. However, the restartof idled capacity in Chile and the U.S. couldprevent prices from moving sharply higher.
In the medium term, the market is expectedto return to balance as new capacity is ex-pected to meet the projected growth in globalconsumption of around 3.5 percent per year,which will be mainly driven by strong growthin China and other Asian countries. Over thelonger term, increases in new low-cost capac-ity are expected to result in a continued de-cline of real prices. A major uncertainty overthe forecast period will be the volume of Chi-nese imports.
NickelNickel prices have risen about 75 percent fromOctober 2001 (figure A2.12), because of low
stocks, strong demand for stainless steel, andtight supplies. A strike at Inco’s operations inSudbury, Canada, on June 1, 2003, briefly sentprices above US$9,500/ton, but prices recededafter Russia’s Norilsk agreed to release 24,000tons from inventory. This followed an an-nouncement by the company in April to release16,000 tons.
Demand for nickel rose 6 percent in 2002because of strong growth of stainless steel pro-duction, led by China, which increased stain-less steel output by around 20 percent. Growthfor both stainless steel and nickel is expected toweaken slightly this year, mainly because of theslowdown in Europe, before strengthening in2004. The nickel market is expected to slipinto deficit this year and remain so in 2004 and2005, mainly because of a dearth of major newprojects to come on stream over this period.
Nickel producers have had a number ofsetbacks with pressure acid leach (PAL) tech-nology at new laterite deposits (a high pro-portion of potential new developments havethis type of ore-body). Technical problems andsubstantial cost overruns have significantly
G L O B A L C O M M O D I T Y P R I C E P R O S P E C T S
269
Figure A2.11 Copper price and LME stocks$/ton tons
Sources: Platts Metals Week, London Metal Exchange.
Jan.1997
Jan.1998
Jan.1999
Jan.2000
Jan.2001
Jan.2002
Jan.2003
�
1,200
1,400
1,600
1,800
2,000
2,200
2,400
2,600
2,800
100,000
200,000
300,000
400,000
500,000
600,000
700,000
800,000
900,000
1,000,000
Price[left scale]
Stocks[right scale]
�
Figure A2.12 Nickel price and LME stocks$/ton tons
4,000
5,000
6,000
7,000
8,000
9,000
10,000
11,000
0
10,000
20,000
30,000
40,000
50,000
60,000
70,000
�
�
Price[left scale]
Stocks[right scale]
Sources: Platts Metals Week, London Metal Exchange.
Jan.1997
Jan.1998
Jan.1999
Jan.2000
Jan.2001
Jan.2002
Jan.2003

limited the expected ramp-up of production atnew projects in Australia. In addition, Incohas temporarily suspended some constructionwork at its US$1.4 billion Goro project inNew Caledonia, after costs escalated by 30–45percent. The company’s current review of theproject may delay start-up of production into2006. These difficulties at laterite projects willlikely impact development of forthcoming PALoperations. Cost estimates for future develop-ments are being raised, which will likely resultin higher long-term nickel prices.
With no new major greenfield projects onthe immediate horizon, nickel prices couldjump significantly over the next couple ofyears before new supplies bring the marketback into balance. Over the longer term, largenew projects are planned for development,and a new generation of technology and oper-ational practices may help to reduce costs. Inaddition to the risks of higher costs, a majoruncertainty for the nickel market is the pace ofdemand growth in China.
GoldIn 2002, gold prices climbed above their four-year trading range of roughly US$250–$300/toz, largely because of the buyback of hedgedpositions by gold producers (referred to as de-
hedging). In addition, increased investmentdemand resulting from declining equity mar-kets and the U.S. dollar helped support prices.More recently, much of the movement in goldprices seems to have been largely currency re-lated (figure A2.13).
Producer dehedging totaled about 4.5 mil-lion ounces in the first quarter of 2003 (6 per-
G L O B A L E C O N O M I C P R O S P E C T S
270
Figure A2.13 Gold price and $/euroIndex, January 1997 = 100
250
275
300
325
350
375
0.80
0.85
0.90
0.95
1.00
1.05
1.10
1.15
1.20
�
�
Gold [left scale]
$/Eur [right scale]
Sources: Platts Metals Week, Datastream.
Jan.1997
Jan.1998
Jan.1999
Jan.2000
Jan.2001
Jan.2002
Jan.2003
Table A2.11 Metals and minerals global balances(thousand tons)
Annual growth rates (%)
1970 1980 1990 2000 2001 2002 1970–80 1980–90 1990–00
AluminumProduction 10,257 16,027 19,362 24,485 24,477 26,099 3.2 1.9 2.4Consumption 9,996 14,771 19,244 24,903 23,561 24,944 3.2 1.8 2.6LME Ending Stocks n.a. 68 311 322 821 1241 n.a. –0.3 0.3
CopperProduction 7,583 9,242 10,809 14,820 15,889 15,336 1.9 1.1 3.2Consumption 7,294 9,400 10,780 15,176 14,876 14,963 2.5 1 3.5LME Ending Stocks 72 123 179 357 799 856 7.4 –5.6 7.1
NickelProduction n.a. 717 842 1,107 1,145 1,177 n.a. 1.6 2.8Consumption n.a. 742 858 1,172 1,178 1,206 n.a. 1.5 3.2LME Ending Stocks 2 5 4 10 19 22 n.a. –0.5 9.6
n.a. = Not available.Sources: World Bureau of Metal Statistics, London Metal Exchange, and World Bank.

cent of producer hedges), about the same levelof reduction that occurred in each of the thirdand fourth quarters of 2002, according toGold Field Mineral Services. Many companieshave indicated a desire to further reduce theirhedges, and shareholder sentiment generallyappears to be against hedging. This was evi-denced in the first quarter of 2003 when, de-spite high prices, little new hedging took place.However, hedging of gold is unattractive atcurrent low interest rates.
It is expected that producer dehedging willslow in the second half of this year and in2004, and remove much of the support undergold prices. And at some point, higher interestrates may trigger another bout of hedging.
Higher gold prices have had a negative im-pact on consumer demand. In the first quarterof 2003, jewelry demand fell by more than 10percent (table A2.12), with declines in bothdeveloping and developed regions. In thelargest consuming country, India, demand fell13 percent, following a 20 percent drop in2002. High prices will continue to weaken theprice-sensitive jewelry demand market, andstimulate investment in new production, andfrom scrap. Over the medium term prices areexpected to fall below US$300/toz as suppliesfrom all sources exceed demand. Even belowUS$300/toz, mine production is expected tocontinue to increase moderately as new low-cost operations come on stream.
Finally, official central bank sales continueto take place. An important determinant ofmedium-term prices will be the decision bycentral banks whether to further stem officialgold sales when the Washington Agreementexpires in 2004 (the European Central Bankand 14 European central banks agreed in Sep-tember 1999 to sell only 400 tons of gold peryear, and not more than 2,000 tons in total,for the subsequent five years).
Petroleum
Since late 1999, the average oil price (forBrent, Dubai, and WTI) has generally been
above US$25/bbl, with the exception of theslump following the September 11, 2001, at-tacks (figure A2.14). Excluding the slump, oilprices averaged about US$27.1/bbl, comparedto US$17.6/bbl over the 1986–99 period. Thehigher prices are mainly because of strongproduction discipline by OPEC, but have alsobeen supported by periods of low stocks, sup-ply disruptions, and cold weather.
Following the collapse of prices in 1998,OPEC began adjusting production quotas asrequired to maintain prices within a band ofUS$22–$28/bbl for its basket of crudes. By andlarge the organization has been successful,though its market share has slowly eroded. ForOPEC-10 (excluding Iraq), its crude oil pro-duction as a share of total world oil supply fell
G L O B A L C O M M O D I T Y P R I C E P R O S P E C T S
271
Table A2.12 Gold global balance(tons)
2002 1Q032001 2002 (% y/y.) 1Q02 2Q02 3Q03 4Q04 1Q03 (% y/y.)
Jewelry 3,037 2,688 –11.5 655 638 657 738 586 –10.5Other Fabrication 476 485 1.9 125 117 117 126 151 20.8Bar Hoarding 248 252 1.6 80 53 61 58 35 –56.3Net Producer Hedging 151 423 180.1 31 104 149 139 145 367.7Implied Net Investment – 130 n.a. 40 48 24 17 64 60.0Total Demand 3,912 3,978 1.7 931 960 1,008 1,078 970 4.2Mine Production 2,623 2,587 –1.4 570 637 727 653 572 0.4Official Sector Sales 529 556 5.1 163 118 83 191 151 –7.4Old Gold Scrap 708 835 17.9 198 205 198 234 248 25.3Implied Net Disinvestment 52 – n.a. – – – – –
Total Supply 3,912 3,978 1.7 931 960 1008 1078 970 4.2
n.a. = Not available.Sources: Gold Field Minerals Service and World Bank.

from 35 percent in 1996–97 to 30 percent in2002.
The escalation of prices in 2002 resultedfrom large OPEC production cuts (figureA2.15), augmented by expectations of supplydisruption as the U.S.-led coalition preparedfor war in Iraq. The physical market tightenedin the second half of 2002 from lower OPEC
output, and then oil inventories fell precipi-tously after Venezuela’s oil exports ceased inDecember because of strikes, and as coldweather raised peak-winter demand. At end-winter 2003, oil inventories were near historiclows.
With the loss of Venezuela’s productionand impending loss of Iraq’s exports, otherOPEC producers raised production signifi-cantly, particularly from the Gulf. Saudi Ara-bia’s production rose from 7.7 mb/d in thefourth quarter of 2002 to more than 9.0 mb/dby March 2003, and the rest of OPEC (ex-cluding Venezuela and Iraq) added more than1 mb/d over this period, with the largest in-creases from Kuwait, UAE, and Algeria. Atthe same time, Venezuela’s production beganto recover, although it appears that some 0.4mb/d of capacity was permanently lost as a re-sult of the strikes.
The disruption to oil supplies from the warin Iraq was limited to Iraqi exports of about 2 mb/d. Higher output from other OPECmembers was sufficient to prevent a sharpspike in prices, and emergency stocks in con-suming countries were not withdrawn. Oilprices peaked in early March just before theconflict commenced at US$34.2/bbl.
G L O B A L E C O N O M I C P R O S P E C T S
272
Figure A2.14 Oil price and OECD stocks$bbl
Sources: International Energy Agency, World Bank.
10
Jan.1997
Jan.1998
Jan.1999
Jan.2000
Jan.2001
Jan.2002
Jan.2003
15
20
25
30
35
2,300
Stocks
WB price
2,350
2,400
2,450
2,500
2,550
2,600
2,650
2,700
2,750
2,800
�
�
mil bbl
Figure A2.15 OPEC-10 production and quotas
Sources: International Energy Agency, OPECNA.
mb/d
21Jan. 1997 Jan. 1998 Jan. 1999 Jan. 2000 Jan. 2001 Jan. 2002 Jan. 2003
22
23
24
25
26
27
28
29
30
Plus Iraq production
OPEC-10productionOPEC-10
quotas
�
�
�

Iraq’s exports did not restart soon after thewar ended because of widespread looting andproblems with pumping facilities and pipe-lines. Because of broader problems with elec-tricity, water, and other facilities that servicethe oil sector, it is unlikely that Iraq’s pre-warproduction of around 2.5 mb/d will be reachedthis year.
The delay in resumption of Iraqi exportsand the low level of oil inventories eases thetask for OPEC this year of maintaining priceswithin its band. However, the difficulty man-aging oil prices is expected to deepen in 2004,as Iraq oil exports exceed pre-war levels.OPEC will have to absorb Iraq back into itsquota system at some point, and quotas for allmembers may need to be adjusted. A numberof OPEC members are raising capacity andwill likely request higher quotas, e.g., Algeriaand Nigeria. The expansion of OPEC capacitywill occur when non-OPEC producers are ex-pected to capture virtually all of the growth inworld oil demand. Consequently, oil prices areexpected to fall to the lower end of OPEC’sprice band in 2004.
Downward pressures on oil prices are ex-pected to continue in subsequent years, asmuch of the moderate growth in world oil de-
mand, about 1.5 mb/d, will be captured bystrong gains in non-OPEC supply of morethan 1 mb/d per year. Large increases are ex-pected from Russia, the Caspian Sea, WestAfrica, and the Western Hemisphere, includ-ing the U.S. because of significant develop-ments in the deepwater Gulf of Mexico. BP re-ports that between 2002 and 2007, 5 mb/d ofnew supply are likely to come on stream fromthese regions alone.
This will leave little room for growth inOPEC production. With the build-up of newcapacity in many OPEC countries, includingIraq, oil prices are expected to decline. By2006–07, oil prices are expected to fall toUS$18/bbl (figure A2.16) as significant vol-umes of new production begin from the Cas-pian, and as production and export capacityincrease more broadly from the FSU, WestAfrica, and other regions.
A risk to the forecast is that OPEC willmaintain strong production discipline over thenext few years to keep prices at or aboveUS$25/bbl. If successful, it would further im-pact oil demand growth and stimulate evengreater supplies from competing sources. It isfelt that OPEC would only prolong a declinein oil prices that is expected by mid-decade.
G L O B A L C O M M O D I T Y P R I C E P R O S P E C T S
273
Figure A2.16 World Bank oil price$/bbl
Source: World Bank.
0
1960 1965 1970 1975 1980 1985 1990 1995 2000 2005 2019 2015
5
10
15
20
25
30
35
40
45
50
Nominal
�
1990$
�

In the longer term, demand growth willonly be moderate, as it has been the past twodecades (table A2.13), but new technologies,environmental pressures, and government poli-cies could further reduce this growth. Pricesbelow US$20/bbl are sufficiently high to gen-erate ample development of conventional andnon-conventional oil supplies, and there are noapparent resource constraints far into the fu-
ture. In addition, new areas continue to be de-veloped (e.g., deep water offshore), and devel-opment costs are expected to continue to fallfrom new technologies (shifting supply curvesoutward). In addition, OPEC countries are in-creasing capacity, and will add to the supplycompetition in coming years. Consequently,real oil prices are expected to continue theirlong-term decline.
G L O B A L E C O N O M I C P R O S P E C T S
274
Table A2.13 Petroleum global balance(million barrels per day)
Million barrels per day Annual growth rates (%)
1970 1980 1990 2000 2002 2003 1970–80 1980–90 1990–00
ConsumptionOECD 34.0 41.5 41.5 47.8 47.6 48.2 2.0 0.0 1.3FSU 5.0 8.9 8.4 3.6 3.7 3.8 5.9 –0.6 –7.2Other non-OECD 6.8 12.3 16.1 24.8 25.6 25.9 6.1 2.7 4.1Total 45.7 62.6 66.0 76.2 76.9 77.9 3.2 0.5 1.3
ProductionOPEC 23.5 27.2 24.5 30.7 28.6 29.8 1.5 –1.0 1.9FSU 7.1 12.1 11.5 7.9 9.4 10.2 5.4 –0.5 –2.6Other non-OPEC 17.4 24.6 30.9 38.0 38.6 39.1 3.5 2.3 1.9Total 48.0 63.9 66.9 76.6 76.5 79.1 2.9 0.5 1.3Stock Change, Misc. 2.3 1.3 0.9 0.4 –0.3 1.2
Sources: British Petroleum, International Energy Agency, and World Bank.
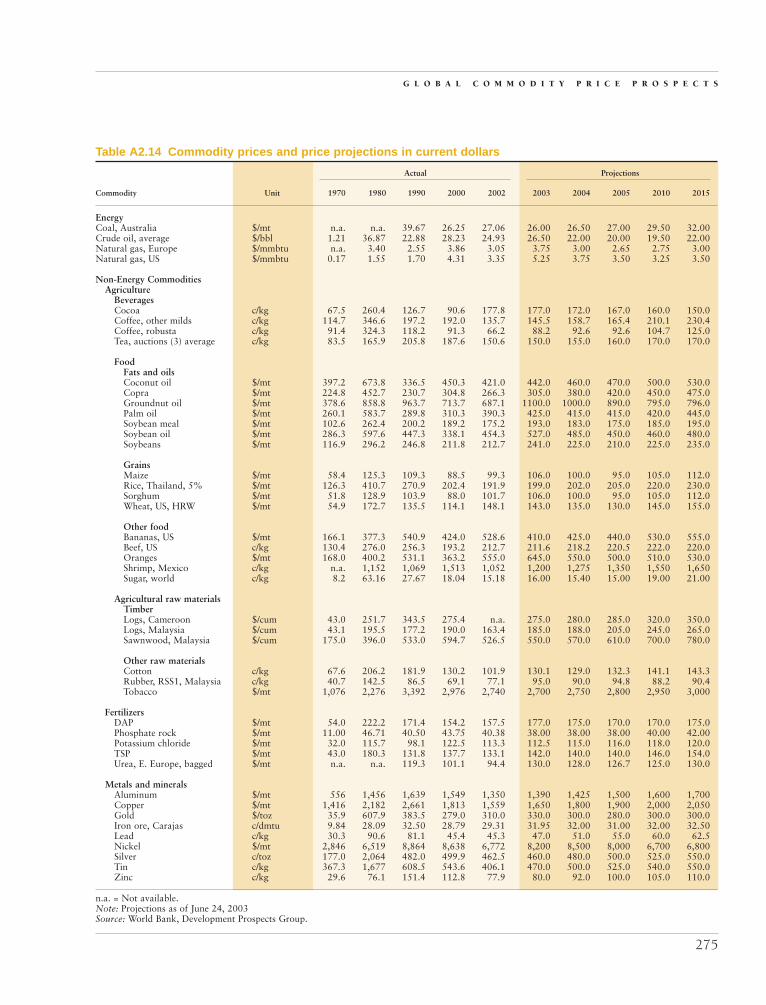
G L O B A L C O M M O D I T Y P R I C E P R O S P E C T S
275
Table A2.14 Commodity prices and price projections in current dollars
Actual Projections
Commodity Unit 1970 1980 1990 2000 2002 2003 2004 2005 2010 2015
EnergyCoal, Australia $/mt n.a. n.a. 39.67 26.25 27.06 26.00 26.50 27.00 29.50 32.00Crude oil, average $/bbl 1.21 36.87 22.88 28.23 24.93 26.50 22.00 20.00 19.50 22.00Natural gas, Europe $/mmbtu n.a. 3.40 2.55 3.86 3.05 3.75 3.00 2.65 2.75 3.00Natural gas, US $/mmbtu 0.17 1.55 1.70 4.31 3.35 5.25 3.75 3.50 3.25 3.50
Non-Energy CommoditiesAgriculture
BeveragesCocoa c/kg 67.5 260.4 126.7 90.6 177.8 177.0 172.0 167.0 160.0 150.0Coffee, other milds c/kg 114.7 346.6 197.2 192.0 135.7 145.5 158.7 165.4 210.1 230.4Coffee, robusta c/kg 91.4 324.3 118.2 91.3 66.2 88.2 92.6 92.6 104.7 125.0Tea, auctions (3) average c/kg 83.5 165.9 205.8 187.6 150.6 150.0 155.0 160.0 170.0 170.0
FoodFats and oilsCoconut oil $/mt 397.2 673.8 336.5 450.3 421.0 442.0 460.0 470.0 500.0 530.0Copra $/mt 224.8 452.7 230.7 304.8 266.3 305.0 380.0 420.0 450.0 475.0Groundnut oil $/mt 378.6 858.8 963.7 713.7 687.1 1100.0 1000.0 890.0 795.0 796.0Palm oil $/mt 260.1 583.7 289.8 310.3 390.3 425.0 415.0 415.0 420.0 445.0Soybean meal $/mt 102.6 262.4 200.2 189.2 175.2 193.0 183.0 175.0 185.0 195.0Soybean oil $/mt 286.3 597.6 447.3 338.1 454.3 527.0 485.0 450.0 460.0 480.0Soybeans $/mt 116.9 296.2 246.8 211.8 212.7 241.0 225.0 210.0 225.0 235.0
GrainsMaize $/mt 58.4 125.3 109.3 88.5 99.3 106.0 100.0 95.0 105.0 112.0Rice, Thailand, 5% $/mt 126.3 410.7 270.9 202.4 191.9 199.0 202.0 205.0 220.0 230.0Sorghum $/mt 51.8 128.9 103.9 88.0 101.7 106.0 100.0 95.0 105.0 112.0Wheat, US, HRW $/mt 54.9 172.7 135.5 114.1 148.1 143.0 135.0 130.0 145.0 155.0
Other foodBananas, US $/mt 166.1 377.3 540.9 424.0 528.6 410.0 425.0 440.0 530.0 555.0Beef, US c/kg 130.4 276.0 256.3 193.2 212.7 211.6 218.2 220.5 222.0 220.0Oranges $/mt 168.0 400.2 531.1 363.2 555.0 645.0 550.0 500.0 510.0 530.0Shrimp, Mexico c/kg n.a. 1,152 1,069 1,513 1,052 1,200 1,275 1,350 1,550 1,650Sugar, world c/kg 8.2 63.16 27.67 18.04 15.18 16.00 15.40 15.00 19.00 21.00
Agricultural raw materialsTimberLogs, Cameroon $/cum 43.0 251.7 343.5 275.4 n.a. 275.0 280.0 285.0 320.0 350.0Logs, Malaysia $/cum 43.1 195.5 177.2 190.0 163.4 185.0 188.0 205.0 245.0 265.0Sawnwood, Malaysia $/cum 175.0 396.0 533.0 594.7 526.5 550.0 570.0 610.0 700.0 780.0
Other raw materialsCotton c/kg 67.6 206.2 181.9 130.2 101.9 130.1 129.0 132.3 141.1 143.3Rubber, RSS1, Malaysia c/kg 40.7 142.5 86.5 69.1 77.1 95.0 90.0 94.8 88.2 90.4Tobacco $/mt 1,076 2,276 3,392 2,976 2,740 2,700 2,750 2,800 2,950 3,000
FertilizersDAP $/mt 54.0 222.2 171.4 154.2 157.5 177.0 175.0 170.0 170.0 175.0Phosphate rock $/mt 11.00 46.71 40.50 43.75 40.38 38.00 38.00 38.00 40.00 42.00Potassium chloride $/mt 32.0 115.7 98.1 122.5 113.3 112.5 115.0 116.0 118.0 120.0TSP $/mt 43.0 180.3 131.8 137.7 133.1 142.0 140.0 140.0 146.0 154.0Urea, E. Europe, bagged $/mt n.a. n.a. 119.3 101.1 94.4 130.0 128.0 126.7 125.0 130.0
Metals and mineralsAluminum $/mt 556 1,456 1,639 1,549 1,350 1,390 1,425 1,500 1,600 1,700Copper $/mt 1,416 2,182 2,661 1,813 1,559 1,650 1,800 1,900 2,000 2,050Gold $/toz 35.9 607.9 383.5 279.0 310.0 330.0 300.0 280.0 300.0 300.0Iron ore, Carajas c/dmtu 9.84 28.09 32.50 28.79 29.31 31.95 32.00 31.00 32.00 32.50Lead c/kg 30.3 90.6 81.1 45.4 45.3 47.0 51.0 55.0 60.0 62.5Nickel $/mt 2,846 6,519 8,864 8,638 6,772 8,200 8,500 8,000 6,700 6,800Silver c/toz 177.0 2,064 482.0 499.9 462.5 460.0 480.0 500.0 525.0 550.0Tin c/kg 367.3 1,677 608.5 543.6 406.1 470.0 500.0 525.0 540.0 550.0Zinc c/kg 29.6 76.1 151.4 112.8 77.9 80.0 92.0 100.0 105.0 110.0
n.a. = Not available.Note: Projections as of June 24, 2003Source: World Bank, Development Prospects Group.

G L O B A L E C O N O M I C P R O S P E C T S
276
Table A2.15 Commodity prices and price projections in constant 1990 dollars
Actual Projections
Commodity Unit 1970 1980 1990 2000 2002 2003 2004 2005 2010 2015
EnergyCoal, Australia $/mt n.a. n.a. 39.67 26.97 28.06 26.87 27.49 27.59 28.84 29.93Crude oil, average $/bbl 4.31 46.80 22.88 29.01 25.84 27.39 22.82 20.44 19.06 20.58Natural gas, Europe $/mmbtu n.a. 4.32 2.55 3.96 3.16 3.88 3.11 2.71 2.69 2.81Natural gas, US $/mmbtu 0.61 1.97 1.70 4.43 3.48 5.43 3.89 3.58 3.18 3.27
Non-Energy CommoditiesAgriculture
BeveragesCocoa c/kg 240.6 330.5 126.7 93.1 184.3 183.0 178.4 170.6 156.4 140.3Coffee, other milds c/kg 408.8 440.0 197.2 197.3 140.7 150.4 164.7 169.0 205.4 215.5Coffee, robusta c/kg 325.7 411.7 118.2 93.8 68.6 91.2 96.1 94.6 102.4 116.9Tea, auctions (3) average c/kg 297.7 210.6 205.8 192.8 156.1 155.0 160.8 163.5 166.2 159.0
FoodFats and oilsCoconut oil $/mt 1416.0 855.3 336.5 462.7 436.5 456.9 477.2 480.2 488.8 495.7Copra $/mt 801.6 574.7 230.7 313.1 276.1 315.3 394.2 429.1 439.9 444.3Groundnut oil $/mt 1349.5 1090.1 963.7 733.3 712.4 1137.0 1037.5 909.4 777.1 744.6Palm oil $/mt 927.1 740.9 289.8 318.8 404.6 439.3 430.5 424.0 410.6 416.2Soybean meal $/mt 365.7 333.1 200.2 194.4 181.6 199.5 189.9 178.8 180.8 182.4Soybean oil $/mt 1020.8 758.6 447.3 347.4 471.0 544.7 503.2 459.8 449.7 449.0Soybeans $/mt 416.8 376.0 246.8 217.7 220.5 249.1 233.4 214.6 219.9 219.8
GrainsMaize $/mt 208.2 159.0 109.3 91.0 102.9 109.6 103.8 97.1 102.6 104.8Rice, Thailand, 5% $/mt 450.3 521.4 270.9 208.0 198.9 205.7 209.6 209.5 215.1 215.1Sorghum $/mt 184.7 163.6 103.9 90.4 105.5 109.6 103.8 97.1 102.6 104.8Wheat, US, HRW $/mt 195.7 219.3 135.5 117.2 153.5 147.8 140.1 132.8 141.7 145.0
Other foodBananas, US $/mt 592.1 478.9 540.9 435.7 548.0 423.8 440.9 449.6 518.1 519.1Beef, US c/kg 465.0 350.3 256.3 198.5 220.6 218.7 226.4 225.3 217.0 205.8Oranges $/mt 599.1 508.0 531.1 373.2 575.5 666.7 570.6 510.9 498.5 495.7Shrimp, Mexico c/kg n.a. 1,462 1,069 1,554 1,090 1,240 1,323 1,379 1,515 1,543Sugar, world c/kg 29.32 80.17 27.67 18.5 15.7 16.5 16.0 15.3 18.6 19.6
Agricultural raw materialsTimberLogs, Cameroon $/cum 153.3 319.5 343.5 283.0 n.a. 284.2 290.5 291.2 312.8 327.4Logs, Malaysia $/cum 153.8 248.2 177.2 195.2 169.4 191.2 195.0 209.5 239.5 247.9Sawnwood, Malaysia $/cum 623.9 502.7 533.0 611.1 545.9 568.5 591.4 623.3 684.3 729.6
Other raw materialsCotton c/kg 241.1 261.7 181.9 133.8 105.7 134.4 133.8 135.2 137.9 134.0Rubber, RSS1, Malaysia c/kg 145.2 180.8 86.5 71.0 79.9 98.2 93.4 96.9 86.2 84.6Tobacco $/mt 3,836 2,889 3,392 3,058 2,841 2,791 2,853 2,861 2,884 2,806
FertilizersDAP $/mt 192.5 282.1 171.4 158.5 163.3 183.0 181.6 173.7 166.2 163.7Phosphate rock $/mt 39.2 59.3 40.5 45.0 41.9 39.3 39.4 38.8 39.1 39.3Potassium chloride $/mt 114.1 146.9 98.1 125.9 117.5 116.3 119.3 118.5 115.4 112.2TSP $/mt 153.3 228.8 131.8 141.5 138.0 146.8 145.2 143.1 142.7 144.1Urea, E. Europe, bulk $/mt n.a. n.a. 119.3 103.9 97.8 134.4 132.8 129.5 122.2 121.6
Metals and mineralsAluminum $/mt 1,982 1,848 1,639 1,592 1,400 1,437 1,478 1,533 1,564 1,590Copper $/mt 5,047 2,770 2,661 1,863 1,617 1,705 1,867 1,941 1,955 1,918Gold $/toz 128.1 771.6 383.5 286.7 321.4 341.1 311.2 286.1 293.3 280.6Iron ore c/dmtu 35.1 35.7 32.5 29.6 30.4 33.0 33.2 31.7 31.3 30.4Lead c/kg 108.0 115.0 81.1 46.6 46.9 48.6 52.9 56.2 58.7 58.5Nickel $/mt 10,147 8,275 8,864 8,876 7,021 8,475 8,818 8,174 6,549 6,360Silver c/toz 631.0 2619.4 482.0 513.7 479.5 475.5 498.0 510.9 513.2 514.5Tin c/kg 1309.6 2129.3 608.5 558.5 421.0 485.8 518.7 536.4 527.9 514.5Zinc c/kg 105.5 96.6 151.4 115.9 80.7 82.7 95.5 102.2 102.6 102.9
n.a. = Not available.Note: Projections as of June 24, 2003Source: World Bank, Development Prospects Group.

G L O B A L C O M M O D I T Y P R I C E P R O S P E C T S
277
Table A2.16 Weighted indices of commodity prices and inflation
Actual Projectionsa
Index 1970 1980 1990 2000 2002 2003 2004 2005 2010 2015
Current dollarsPetroleum 5.3 161.2 100.0 123.4 109.0 115.8 96.2 87.4 85.2 96.2Non-energy commoditiesb 43.8 125.5 100.0 86.9 83.0 88.8 89.7 91.1 97.7 102.6
Agriculture 45.8 138.1 100.0 87.7 86.5 92.7 92.6 93.7 102.0 107.6Beverages 56.9 181.4 100.0 88.4 84.6 89.1 92.4 93.6 106.1 111.6Food 46.7 139.3 100.0 84.5 90.1 94.0 91.7 89.8 96.5 101.1
Fats and oils 64.4 148.7 100.0 96.2 101.2 112.4 107.7 104.2 108.4 114.1Grains 46.7 134.3 100.0 79.5 88.1 89.8 87.0 85.0 93.2 98.8Other food 32.2 134.3 100.0 77.7 82.2 81.2 81.2 80.8 88.7 91.8
Raw materials 36.4 104.6 100.0 91.4 83.2 93.6 93.8 98.8 106.1 113.0Timber 31.8 79.0 100.0 111.0 98.1 103.3 106.8 114.6 132.2 146.7Other Raw Materials 39.6 122.0 100.0 78.0 73.1 86.9 84.9 88.0 88.3 90.0
Fertilizers 30.4 128.9 100.0 105.8 100.5 100.5 102.6 101.7 105.4 110.9Metals and minerals 40.4 94.2 100.0 83.0 72.8 78.1 81.6 83.6 86.4 89.5
Constant 1990 dollarsc
Petroleum 18.9 204.5 100.0 127.0 117.2 119.7 99.8 89.3 83.3 89.9Non-energy commodities 156.3 159.2 100.0 89.4 89.3 91.7 93.1 93.1 95.5 96.0
Agriculture 163.3 175.2 100.0 90.3 93.0 95.8 96.0 95.8 99.7 100.7Beverages 202.8 230.2 100.0 90.9 91.0 92.1 95.9 95.7 103.7 104.4Food 166.5 176.7 100.0 87.0 96.9 97.2 95.1 91.8 94.4 94.6
Fats and oils 229.5 188.6 100.0 99.0 108.8 116.2 111.7 106.4 105.9 106.7Grains 166.6 170.4 100.0 81.8 94.7 92.8 90.2 86.9 91.1 92.4Other food 114.9 170.5 100.0 80.0 88.4 84.0 84.2 82.5 86.7 85.9
Raw materials 129.8 132.7 100.0 94.0 89.5 96.7 97.3 100.9 103.7 105.7Timber 113.3 100.3 100.0 114.2 105.5 106.8 110.8 117.1 129.2 137.3Other Raw Materials 141.1 154.8 100.0 80.2 78.6 89.8 88.1 89.9 86.3 84.2
Fertilizers 108.3 163.6 100.0 108.9 108.1 103.9 106.5 103.9 103.0 103.7Metals and minerals 143.9 119.5 100.0 85.4 78.3 80.7 84.6 85.5 84.5 83.7
Inflation indices, 1990=100d
MUV indexe 28.05 78.81 100.00 97.17 92.99 96.75 96.39 97.87 102.30 106.91% change per annum 10.88 2.41 -0.29 –2.18 4.05 -0.37 1.53 0.89 0.88
US GDP deflator 33.59 65.93 100.00 123.56 127.91 129.96 132.69 135.87 152.83 172.07% change per annum 6.98 4.25 2.14 1.75 1.60 2.10 2.40 2.38 2.40
a. Commodity price projections as of June 24, 2003.b. The World Bank primary commodity price indices are computed based on 1987–89 export values in US dollars for low- and middle-incomeeconomies, rebased to 1990. Weights for the sub-group indices expressed as ratios to the non-energy index are as follows in percent: agriculture 69.1,fertilizers 2.7, metals and minerals 28.2; beverages 16.9, food 29.4, raw materials 22.8; fats and oils 10.1, grains 6.9, other food 12.4; timber 9.3 andother raw mterials 13.6.c. Computed from unrounded data and deflated by the MUV indexd. Inflation indices for 2002–2015 are projections as of June 10, 2003. MUV for 2001 is an estimate. Growth rates for years 1980, 1990, 2000, 2002,2005, 2010 and 2015 refer to compound annual rate of change between adjacent end-point years; all others are annual growth rates from the previousyear.e. Unit value index in US dollar terms of manufactures exported from the G-5 countries (France, Germany, Japan, UK, and US) weighted proportionallyto the countries’ exports to the developing countriesSource: World Bank, Development Prospects Group. Historical US GDP deflator: US Department of Commerce.


Appendix 3Global Economic Indicators

G L O B A L E C O N O M I C P R O S P E C T S
280
Figure A3.1 Real GDP growth
Source: World Bank data and staff estimates.
Percent
High-incomecountries
East Asiaand Pacific
1991–2000 2006–2015
SouthAsia
Latin Americaand the
Caribbean
Europe andCentral Asia
Middle Eastand North
Africa
Sub-Saharan
Africa
� �
8.0
6.0
4.0
2.0
0.0
–2.0
Table A3.1 Growth of Real GDP, 1971–2015GDP in 1995 prices and exchange rates, average annual growth (percent)
GDP in 2002(current billions Estimate Forecast
of dollars) 1971–80 1981–90 1991–00 2002 2003 2004–2005 2006–2015
World 32,016 3.7 3.0 2.6 1.9 2.0 2.9 3.2
High income economies 25,937 3.5 3.1 2.5 1.6 1.5 2.5 2.7Industrial countries 25,190 3.4 3.1 2.4 1.6 1.5 2.4 2.6
G-7 countries 21,350 3.4 3.1 2.3 1.4 1.4 2.3 ...United States 10,446 3.3 3.2 3.2 2.4 ... ... ...Japan 3,997 4.5 4.1 1.4 0.2 ... ... ...G-4 Europe 6,172 2.9 2.4 1.9 0.8 0.7 1.9 ...Germanya 1,990 2.7 2.2 1.7 0.2 ... ... ...
Euro Area 6,633 3.2 2.3 2.0 0.9 0.7 1.9 2.2Non-G-7 industrial 3,840 3.2 2.9 3.0 2.4 1.8 3.0 ...
Other high income 747 7.6 4.9 5.4 2.4 2.1 4.3 4.5Asian NIEs 531 9.5 7.4 6.0 3.0 2.2 4.6 ...
Low and middle income economies 6,079 5.0 2.6 3.3 3.3 4.0 4.9 4.6excluding CE.Eur / CIS 5,147 5.6 3.1 4.7 3.0 4.0 5.0 ...
Asia 2,403 5.3 6.9 7.0 6.1 5.9 6.3 ...East Asia and Pacific 1,757 6.7 7.3 7.7 6.7 6.1 6.6 6.2
China 1,237 6.2 9.3 10.1 8.0 ... ... ...Indonesia 173 7.9 6.4 4.2 3.8 ... ... ...South Asia 646 3.1 5.9 5.2 4.2 5.4 5.4 5.4India 515 3.0 6.1 5.4 4.4 ... ... ...
Latin America and Caribbean 1,658 5.9 1.1 3.4 –0.8 1.8 3.8 3.8Brazil 452 8.5 1.5 2.7 1.5 ... ... ...Mexico 637 6.7 1.8 3.5 1.0 ... ... ...Argentina 102 3.0 –1.5 4.5 –10.9 ... ... ...
Europe and Central Asia 1,114 3.9 1.5 –1.6 4.6 4.3 4.3 3.4Russian Federationb 347 3.9 1.5 –4.0 4.3 ... ... ...Turkey 183 4.1 5.2 3.6 7.8 ... ... ...Poland 188 5.1 –1.7 3.7 1.3 ... ... ...
Middle East and North Africa 587 7.0 2.5 3.4 3.1 3.3 3.7 4.3Saudi Arabia 193 10.3 0.3 2.3 0.8 ... ... ...Iran 108 2.6 2.7 4.2 6.3 ... ... ...Egypt 90 6.6 5.5 4.3 3.0 ... ... ...
Sub-Saharan Africa 316 3.5 1.7 2.3 2.8 2.8 3.7 3.5Republic of South Africa 104 3.5 1.3 1.7 3.0 ... ... ...Nigeria 44 4.7 1.1 2.6 1.9 ... ... ...
Notes: growth rates over intervals are computed using compound average methods;a. data prior to 1991 covers West Germanyb. data prior to 1992 covers former Soviet Union
Growth percent

G L O B A L E C O N O M I C I N D I C A T O R S
281
Figure A3.2 Real per capita GDP growth
Source: World Bank data and staff estimates.
Percent
High-incomecountries
East Asiaand Pacific
1991–2000 2006–2015
SouthAsia
Latin Americaand the
Caribbean
Europe andCentral Asia
Middle Eastand North
Africa
Sub-Saharan
Africa
� �
8.0
6.0
4.0
2.0
0.0
–2.0
Table A3.2 Growth of real per-capita GDP, 1971–2015GDP in 1995 prices and exchange rates, average annual growth (percent)
GDP per capita2002 (current Estimate Forecast
dollars) 1971–80 1981–90 1991–00 2002 2003 2004–2005 2006–2015
World 5,297 1.8 1.3 1.2 0.7 0.8 1.8 2.2
High income economiesa 27,185 2.6 2.5 1.8 1.2 1.1 2.1 2.5Industrial countries 27,710 2.6 2.5 1.8 1.2 1.1 2.1 2.4
G-7 countries 30,256 2.7 2.5 1.7 1.0 1.1 2.0 …United States 36,224 2.2 2.2 2.2 1.7 … … …Japan 31,437 3.3 3.5 1.2 0.1 … … …G-4 Europe 23,856 2.6 2.1 1.5 0.8 0.7 1.9 …Germanyb 24,123 2.6 2.0 1.4 0.3 … … …
Euro Area 21,721 2.7 2.1 1.7 0.8 0.7 1.9 2.3Non-G-7 industrial 18,879 2.2 2.2 2.4 2.0 1.5 2.8 …
Other high income 16,577 5.0 3.1 3.8 1.1 0.9 3.1 4.2Asian NIEs 15,891 7.2 5.9 4.7 2.0 1.3 3.7 …
Low & middle income economies 1,194 2.9 0.7 1.7 1.9 2.7 3.6 3.4excluding CE.Eur / CIS 1,066 3.2 1.0 3.0 1.5 2.5 3.6 …
Asia 742 3.0 4.9 5.4 4.8 4.6 5.1 …East Asia and Pacific 956 4.6 5.6 6.4 5.8 5.2 5.7 5.4
China 966 4.3 7.7 9.0 7.2 … … …Indonesia 817 5.4 4.4 2.5 2.4 … … …South Asia 461 0.7 3.6 3.3 2.5 3.7 3.8 4.1India 491 0.7 3.9 3.6 2.8 … … …
Latin America and Caribbean 3,149 3.3 –0.9 1.7 –2.3 0.4 2.4 2.5Brazil 2,593 5.9 –0.4 1.2 0.3 … … …Mexico 6,314 3.6 –0.3 1.7 –0.8 … … …Argentina 2,694 1.3 –2.9 3.2 –12.0 … … …
Europe and Central Asia 3,374 2.9 0.6 –1.8 4.5 4.3 4.2 3.3Russian Federationc 2,405 3.2 0.9 –3.9 4.6 … … …Turkey 2,626 1.7 2.8 2.0 6.3 … … …Poland 4,859 4.2 –2.4 3.5 1.2 … … …
Middle East and North Africa 1,917 4.0 –0.6 1.2 1.1 1.3 1.7 2.5Saudi Arabia 8,727 5.1 –4.8 –1.1 –2.2 … … …Iran 1,641 –0.6 –0.7 2.5 4.6 … … …Egypt 1,354 4.4 2.9 2.4 1.4 … … …
Sub-Saharan Africa 460 0.7 –1.1 –0.2 0.5 0.6 1.5 1.6Republic of South Africa 2,392 1.2 –1.2 –0.2 1.7 … … …Nigeria 328 1.7 –1.9 –0.2 –0.8 … … …
Notes: growth rates over intervals are computed using compound annual methods;a. regional aggregates computed as sum(GDPi)/sum(POPi), where “i” indicates country in the region, and are unweighted by pop-ulation or other measures;b. data prior to 1991 covers West Germany;c. data prior to 1992 covers former Soviet Union
Growth percent

Table A3.3 Inflation: GDP Deflators, 1971–2005Deflators in local currency units; 1995=100; percentage changea
Growth percent
Estimate Forecast1971–80 1981–90 1991–00 2001 2002 2003 2004–2005
World 9.1 5.9 3.7 2.2 1.5 1.6 1.8
High income economies 8.9 5.3 2.0 1.5 1.0 1.0 1.2Industrial countries 8.7 4.6 2.0 1.5 1.0 1.0 1.2
G-7 countries 8.3 4.2 1.7 1.2 0.8 0.8 1.0United States 7.0 4.3 2.1 2.4 1.1 1.5 1.5Japan 7.8 2.0 0.1 –1.6 –1.6 –2.1 –0.5G-4 Europe 9.9 5.7 2.6 1.9 2.2 1.8 1.5Germanyb 5.3 2.6 2.6 1.4 1.6 1.2 0.9
Euro Area 9.6 6.1 2.8 2.4 2.3 1.9 1.5Non-G-7 industrial 11.1 7.1 3.3 3.1 2.3 2.4 2.1
Other high income 19.6 33.7 3.7 0.1 –0.6 0.5 1.8Asian NIEs 9.5 4.7 2.4 –0.4 –1.4 –0.7 1.3
Low and middle income economies 9.8 8.8 11.8 5.2 4.0 4.0 4.1excluding CE.Eur / CIS 11.6 10.7 9.4 4.8 4.1 4.0 4.2
Asia 10.2 7.7 7.6 2.9 2.6 4.4 4.9East Asia and Pacific 9.8 6.6 6.8 2.6 3.3 3.7 3.7
China 0.9 5.4 6.3 0.0 0.4 ... ...Indonesia 20.6 8.8 14.9 12.6 7.2 ... ...
South Asia 11.9 9.0 7.8 3.0 1.8 5.1 5.2India 8.9 8.5 8.0 3.0 2.6 ... ...
Latin America and Caribbean 15.6 20.4 12.0 5.5 4.7 4.1 4.0Brazil 39.7 330.8 206.1 8.8 8.5 ... ...Mexico 18.1 63.7 18.1 5.4 4.9 ... ...Argentina 117.7 439.5 10.2 –1.1 30.8 ... ...
Europe and Central Asia 0.2 1.0 76.0 6.1 4.0 5.8 4.6Russian Federationc 0.0 31.6 104.5 18.0 10.7 ... ...Turkey 32.8 46.4 71.7 57.1 48.2 ... ...Poland 4.4 72.1 24.6 3.9 –3.5 ... ...
Middle East and North Africa 11.7 8.4 7.5 2.6 3.8 4.0 4.0Saudi Arabia 23.8 –3.1 3.8 –2.4 2.4 ... ...Iran 19.3 15.6 26.6 8.8 5.2 ... ...Egypt 11.0 13.1 8.7 3.8 4.0 ... ...
Sub-Saharan Africa 10.7 10.0 10.5 5.8 4.2 3.7 4.5Republic of South Africa 13.3 15.1 9.9 7.6 8.5 ... ...Nigeria 13.4 16.6 28.6 6.0 15.0 ... ...
Notes: growth rates over intervals are computed using compound annual squares method;a. High-income group inflation rates are GDP-weighted averages of local currency inflation; LMIC groups are medians; world isGDP-weighted average of the two groups. b. data prior to 1991 covers West Germanyc. data prior to 1992 covers former Soviet Union.
G L O B A L E C O N O M I C P R O S P E C T S
282
Figure A3.3 GDP inflation
Source: World Bank data and staff estimates.
Percent
High-incomecountries
East Asiaand Pacific
76%
SouthAsia
Latin Americaand the
Caribbean
Europe andCentral Asia
Middle Eastand North
Africa
Sub-Saharan
Africa
15.0
10.0
5.0
0.0
1991–20002004–2005�
�

G L O B A L E C O N O M I C I N D I C A T O R S
283
Figure A3.4 Current account balances-to-GDP ratio
Source: World Bank data and staff estimates.
Percent of GDP
High-incomecountries
East Asiaand Pacific
SouthAsia
Latin Americaand the
Caribbean
Europe andCentral Asia
Middle Eastand North
Africa
Sub-Saharan
Africa
2.0
1.0
0.0
–1.0
–2.0
–3.0
–4.0
1991–20002004–2005
��
Table A3.4 Current Account Balances, 1971–2005Expressed as shares of GDP (percent)
2002 CurrentAccount
Shares percent
(billions of Estimate ForecastU.S. dollars) 1971–80 1981–90 1991–00 2001 2002 2003 2004–2005
Worlda –106 –0.1 –0.6 –0.2 –0.5 –0.3 –0.5 –0.6
High income economies –177 –0.1 –0.3 0.0 –0.6 –0.7 –0.7 –0.7Industrial countries –238 –0.2 –0.5 –0.1 –0.9 –0.9 –0.9 –0.9
G-7 countries –304 –0.1 –0.4 –0.3 –1.4 –1.4 –1.4 –1.4United States –481 0.0 –1.9 –1.8 –3.9 –4.6 ... ...Japan 112 0.3 2.3 2.4 2.1 2.8 ... ...G-4 Europe 54 0.1 0.3 –0.2 0.1 0.9 1.0 1.1Germanyb 46 0.5 2.4 –0.9 0.0 2.3 ... ...
Euro Area 54 0.0 0.3 0.5 0.5 0.8 1.1 1.3Non-G-7 industrial 65 –1.1 –0.8 1.2 1.9 1.7 1.8 2.0Other high income 62 7.6 6.9 3.2 7.2 8.3 6.8 6.4
Asian NIEs 62 1.8 1.2 4.1 9.0 11.6 10.6 10.5
Low & middle income economies 70 0.2 –1.7 –1.6 0.1 1.2 0.5 –0.1excluding CE.Eur / FSU 58 0.6 –1.8 –1.6 0.2 1.1 0.3 –0.2
Asia 59 –0.3 –1.7 –0.2 1.8 2.5 1.5 1.2East Asia and Pacific 56 –0.1 –1.5 0.4 2.7 3.2 1.9 1.6
China 29 0.1 0.2 1.6 1.5 2.4 ... ...Indonesia 7 –2.3 –3.3 –0.4 4.7 4.2 ... ...South Asia 3 –0.4 –2.0 –1.5 –0.5 0.5 0.4 0.0India 3 0.2 –1.7 –1.1 –0.7 0.7 ... ...
Latin America and Caribbean –14 –1.4 –1.7 –2.7 –2.7 –0.8 –0.5 –0.9Brazil –8 –4.4 –1.6 –2.2 –4.6 –1.7 ... ...Mexico –14 –3.9 –0.8 –3.7 –2.9 –2.2 ... ...Argentina 9 –0.4 –2.2 –3.1 –1.7 8.8 ... ...
Europe and Central Asia 13 –0.8 –0.5 –2.5 –1.4 1.1 0.6 –0.2Russian Federationc 33 2.1 3.5 4.7 11.3 9.5 ... ...Turkey 0 –2.1 –1.3 –1.1 2.3 0.0 ... ...Poland –7 –0.9 –1.4 –3.7 –3.0 –3.5 ... ...
Middle East and North Africa 20 6.8 –1.5 –1.9 4.2 3.5 0.3 –2.0Saudi Arabia 12 21.1 –7.3 –6.5 7.6 6.2 ... ...Iran 4 11.8 –0.4 1.9 3.5 3.1 ... ...Egypt –1 –0.6 –2.6 1.5 –0.4 –1.3 ... ...
Sub-Saharan Africa –8 –2.1 –2.7 –2.0 –2.2 –2.2 –2.7 –2.6Republic of South Africa 0 –1.3 0.4 –0.2 –0.3 0.3 ... ...Nigeria 0 1.5 –0.6 –0.2 –0.7 0.0 ... ...
a. Current account as defined in BOP version 5.0, world represents statistical discrepancy; shares over intervals are period averages; b. data prior to 1991 covers West Germany;c. data prior to 1992 covers former Soviet Union.

G L O B A L E C O N O M I C P R O S P E C T S
284
Table A3.5 Exports of goods, 2002Merchandise exports (FOB), millions of dollars; average annual volume growth 1993–2002 (percent); effective market growth (EMG) 1993–2002 (percent)
Exports Growth EMG2 Exports Growth EMG2 Exports Growth EMG2
World 6,285,029 6.3 6.6
All developing countries 1,618,770 7.1 7.2
Asia 663,348 11.4 7.0
East Asia 595,377 12.0 7.0China 325,574 17.3 6.8Fiji 511 3.6 7.3Indonesia 56,922 5.1 7.0Malaysia 93,364 8.2 7.1Philippines 34,455 10.4 7.4Thailand 68,902 8.0 7.1Vietnam 16,159 18.4 6.9
South Asia 67,972 7.1 6.9Bangladesh 6,374 11.6 7.0India 46,129 7.6 6.8Nepal 733 8.2 6.4Pakistan 9,699 3.0 6.8Sri Lanka 5,036 7.4 7.2
Latin America 351,966 5.6 7.7Argentina 25,348 2.8 6.7Bolivia 1,241 7.1 5.9Brazil 60,362 –2.9 5.9Chile 18,340 5.1 6.7Colombia 12,803 4.5 7.3Costa Rica 5,007 11.0 7.8Dominican Republic 5,142 24.5 7.9
Ecuador 5,279 3.9 7.7El Salvador 2,526 17.2 7.8Guatemala 2,850 7.4 8.7Jamaica 1,466 2.4 7.7Mexico 160,834 13.5 9.0Panama 5,778 1.2 7.3Paraguay 2,176 –0.4 6.3Peru 7,551 –0.4 7.3Trinidad and Tobago 4,214 7.1 8.2
Uruguay 1,850 8.4 6.7Venezuela 26,735 –0.3 8.8
Europe and Central Asia 306,543 5.6 7.2
Armenia 435 2.8 5.2Azerbaijan 2,333 7.1 4.3
Europe and Central Asia (continued)
Belarus 8,035 –2.9 7.8Bulgaria 3,512 5.1 6.3Czech Republic 26,977 4.5 6.3Estonia 5,992 11.0 7.6Georgia 748 24.5 6.5Hungary 27,305 3.9 6.1Kazakstan 10,590 17.2 8.0Latvia 2,718 7.4 8.5Lithuania 4,365 2.4 7.9Poland 36,115 13.5 6.0Romania 12,820 1.2 5.8Russian Federation 79,059 –0.4 7.9
Slovak Republic 18,023 7.1 8.7Turkey 35,904 8.4 6.0Ukraine 19,260 –0.3 7.5Uzbekistan 7,005 4.3 7.2
Middle East and N. Africa 161,597 2.3 6.6
Algeria 17,648 2.7 6.4Egypt,Arab Rep. 7,323 6.1 6.3
Iran, Islamic Rep. 24,203 –0.3 6.4Jordan 2,466 7.0 5.8Morocco 7,427 3.6 6.1Oman 11,508 5.0 7.9Saudi Arabia 73,691 1.3 6.8Syrian Arab Rep. 6,173 5.1 5.4Tunisia 7,676 5.0 5.5Yemen, Rep. 3,483 9.4 8.8
Sub-Saharan Africa 91,060 3.1 6.8
Angola 7,582 4.4 8.7Cameroon 1,917 –1.2 6.2Côte d’Ivoire 4,275 2.8 5.6Ethiopia 326 10.3 5.1Gabon 2,403 –2.1 8.3Ghana 1,402 6.9 6.4Kenya 2,028 5.6 5.7Madagascar 962 10.9 5.9Nigeria 16,333 0.7 7.4South Africa 31,085 2.4 6.2Sudan 1,332 22.1 6.3Zambia 1,057 6.1 5.0Zimbabwe 1,519 –0.4 6.2
High income countries 4,666,260 6.1 6.9
Industrial countries 4,431,191 6.2 6.8
G-7 countries 2,857,740 5.4 7.0Canada 263,777 7.3 8.9France 339,050 6.1 5.9Germany 592,010 5.9 6.6Italy 284,552 5.5 6.2Japan 395,662 3.6 7.8United Kingdom 279,140 5.4 6.4United States 703,549 5.3 7.0
Other industrial 1,253,846 7.4 6.2Australia 64,988 6.2 6.5Austria 69,422 7.9 5.9Belgium1 200,696 6.7 5.9Denmark 53,531 2.1 5.8Finland 7,507 7.7 7.0Greece 3,158 10.8 5.8Iceland 2,150 2.8 6.3Ireland 88,970 9.7 6.2Korea, Rep. 162,412 14.4 7.5Netherlands 198,624 6.3 5.8New Zealand 14,860 3.7 7.1Norway 61,761 2.8 6.3Portugal 26,731 9.2 5.6Spain 121,572 7.7 6.1Sweden 85,304 3.7 6.1Switzerland 92,161 3.7 6.1
Other high income 554,674 7.0 8.3Bahrain 5,529 3.4 5.6Hong Kong, China 200,285 6.3 10.2
Israel 29,435 7.6 7.3Kuwait 15,477 6.2 6.7Singapore 125,172 8.8 7.5Taiwan, China 130,666 6.9 7.1United Arab Emirates 38,386 3.1 5.6
1. Includes Luxembourg.2. Effective market growth (EMG) is a weighted average of import volume growth in the country’s export markets.Source: see technical notes.

G L O B A L E C O N O M I C I N D I C A T O R S
285
Figure A3.5a Merchandise exports as share of GDP, 2002
Source: World Bank data.
Percent
40
30
20
10
0
Industrialcountries
East Asiaand Pacific
South Asia Latin Americaand the
Caribbean
Europe andCentral Asia
Middle Eastand
North Africa
Sub-SaharanAfrica
World
Figure A3.5b Annual growth rate of export volumes, 1993–2002
Source: World Bank data.
Percent
15.0
10.0
5.0
0.0
Industrialcountries
East Asiaand Pacific
South Asia Latin Americaand the
Caribbean
Europe andCentral Asia
Middle Eastand
North Africa
Sub-SaharanAfrica
World

G L O B A L E C O N O M I C P R O S P E C T S
286
Table A3.6 Imports of goods, 2002Merchandise imports (CIF), millions of dollars; average annual volume growth 1993–2002 (percent); merchandise imports share of GDP (percent)
Imports Growth Share Imports Growth Share Imports Growth Shares
Europe and Central Asia (continued)
Belarus 7,909 7.8 59.4Bulgaria 6,106 6.3 43.6Czech Republic 40,176 6.3 65.1Estonia 4,768 7.6 83.6Georgia 885 6.5 27.9Hungary 34,619 6.1 62.5Kazakstan 7,106 8.0 27.8Latvia 3,623 8.5 45.3Lithuania 6,188 7.9 47.1Poland 53,993 6.0 29.6Romania 15,527 5.8 35.1Russian Federation 63,956 7.9 19.3
Slovak Republic 11,980 8.7 49.6Turkey 29,933 6.0 17.5Ukraine 14,079 7.5 32.1Uzbekistan 3,523 7.2 32.5
Middle East and N. Africa 114,003 1.4 17.2
Algeria 11,378 4.2 19.8Egypt, Arab Rep. 14,364 4.3 15.0Iran, Islamic Rep. 20,260 –2.1 16.3Jordan 4,349 3.5 46.2Morocco 10,630 3.1 29.4Oman 5,614 4.1 24.4Saudi Arabia 30,418 0.0 15.8Syrian Arab Rep. 4,576 4.0 5.0Tunisia 9,864 4.5 47.4Yemen, Rep. 2,550 2.4 25.9
Sub-Saharan Africa 79,907 3.5 25.3
Angola 3,383 4.6 29.4Cameroon 1,866 5.7 20.8Côte d’Ivoire 2,339 1.1 22.5Ethiopia 1,494 5.6 23.0Gabon 1,113 2.5 25.3Ghana 2,513 6.1 45.1Kenya 3,202 6.8 27.4Madagascar 1,076 8.3 22.1Nigeria 11,570 4.7 24.7South Africa 26,712 3.5 24.8Sudan 1,306 6.5 9.9Zambia 1,021 2.8 27.3
Sub-Saharan Africa (continued)
Zimbabwe 798 –7.7 6.4
High income countries 4,791,272 6.4 18.5
Industrial countries 4,620,406 6.6 17.6
G-7 countries 3,099,228 6.6 14.5Canada 226,994 6.7 30.9France 316,953 5.8 22.1Germany 486,062 4.4 24.4Italy 244,491 4.6 20.7Japan 302,246 4.8 7.6United Kingdom 330,862 6.7 21.1United States 1,191,620 9.4 11.4
Other industrial 1,166,814 5.9 30.4Australia 70,178 8.1 17.6Austria 67,958 5.3 33.2Belgium1 184,178 5.6 74.8Denmark 46,896 2.9 27.2Finland 5,277 3.8 4.0Greece 10,207 4.8 7.8Iceland 2,206 3.0 25.9Ireland 52,381 8.7 42.8Korea 151,768 9.2 31.8Netherlands 177,228 6.0 42.4New Zealand 13,132 3.8 23.6Norway 35,619 2.2 18.6Portugal 39,530 3.3 32.8Spain 155,190 7.9 23.7Sweden 65,809 5.7 27.5Switzerland 89,257 2.4 33.3
Other high income 525,229 6.4 70.4
Bahrain 3,972 –0.8 46.7Hong Kong, China 205,337 6.9 127.1
Israel 33,317 5.8 29.6Kuwait 7,341 0.0 21.6Singapore 110,256 6.4 126.8Taiwan, China 112,957 5.9 40.0United Arab Emirates 41,882 9.2 104.1
1. Includes Luxembourg.Source: see technical notes.
World 6,232,809 6.6 19.4
All developing countries 1,441,537 7.5 23.5
Asia 579,564 9.6 23.7East AsiaChina 501,706 10.2 28.3Fiji 613 –0.1 36.2Indonesia 31,242 1.2 17.5Malaysia 75,043 7.2 78.9Philippines 32,547 7.1 41.8Thailand 64,317 4.8 50.8Vietnam 16,599 19.5 44.8
South Asia 77,858 5.6 11.5Bangladesh 8,514 9.1 17.0India 52,114 7.0 9.6Nepal 1,521 5.4 27.9Pakistan 9,937 –0.8 16.6Sri Lanka 5,772 5.9 33.3
Latin America 329,697 7.8 19.7Argentina 8,988 –4.7 8.8Bolivia 1,492 2.2 17.8Brazil 47,237 8.4 10.4Chile 15,827 4.9 23.8Colombia 12,304 7.2 14.3Costa Rica 6,533 11.3 38.7Dominican Republic 8,428 14.6 37.4
Ecuador 6,240 11.0 32.8El Salvador 4,702 11.8 32.7Guatemala 4,895 7.7 24.4Jamaica 3,063 7.2 38.1Mexico 168,731 11.0 26.6Panama 6,435 1.5 61.3Paraguay 2,460 0.6 34.1Peru 7,271 0.6 12.5Trinidad and Tobago 3,541 5.5 38.1
Uruguay 2,067 13.3 12.1Venezuela 15,204 –1.8 13.0
Europe and Central Asia 318,748 7.2 30.5
Armenia 807 5.2 33.0Azerbaijan 1,787 4.3 26.6
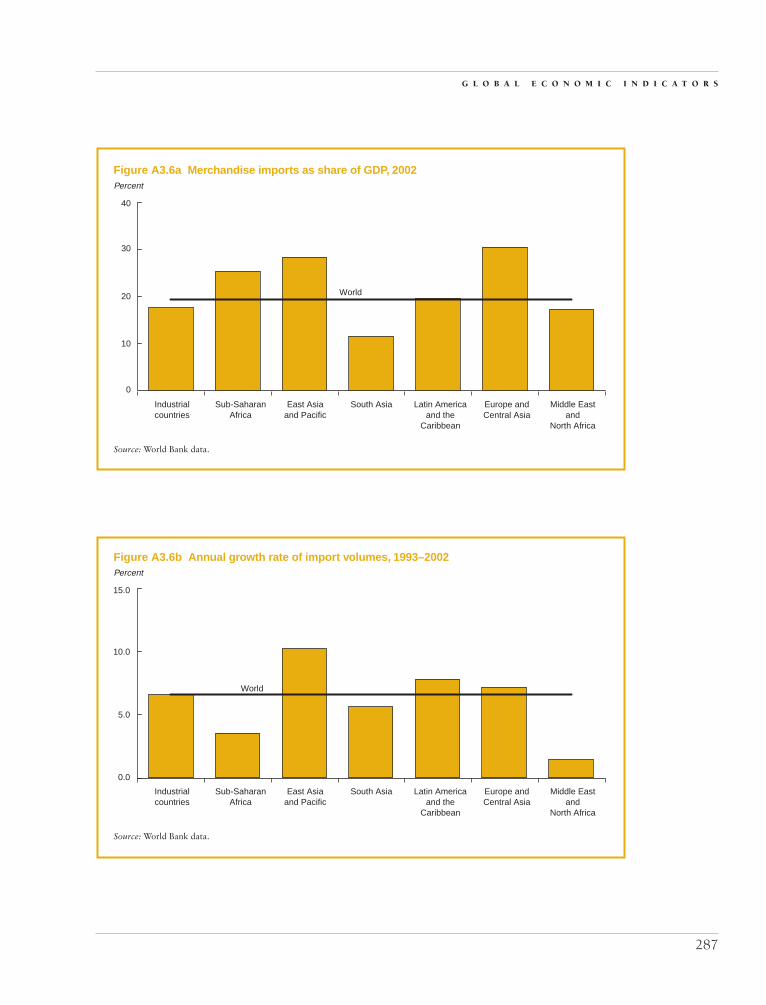
G L O B A L E C O N O M I C I N D I C A T O R S
287
Figure A3.6a Merchandise imports as share of GDP, 2002
Source: World Bank data.
Percent
40
30
20
10
0
Industrialcountries
East Asiaand Pacific
South Asia Latin Americaand the
Caribbean
Europe andCentral Asia
Middle Eastand
North Africa
Sub-SaharanAfrica
World
Figure A3.6b Annual growth rate of import volumes, 1993–2002
Source: World Bank data.
Percent
Industrialcountries
East Asiaand Pacific
South Asia Latin Americaand the
Caribbean
Europe andCentral Asia
Middle Eastand
North Africa
Sub-SaharanAfrica
World
15.0
10.0
5.0
0.0

G L O B A L E C O N O M I C P R O S P E C T S
288
Table A3.7 Direction of merchandise trade, 2002(percentage of world trade)
High-income importers Low- and middle-income importers
LatinMiddle America All
Sub- East Europe East and low-Other All Other All Saha- Asia and and the and
United indus- indus- high- high- ran and South Central North Carib- middle-Source of exports States EU-15 Japan trial trial income income Africa Pacific Asia Asia Africa bean income World
High-income econ. 12.3 27.4 3.0 6.5 50.7 5.5 56.2 0.8 6.5 0.7 3.7 1.5 4.0 17.1 73.4Industrial 10.7 26.2 2.2 6.2 46.6 4.3 50.9 0.7 4.1 0.5 3.5 1.4 3.8 14.1 65.0
United States 0.0 2.3 0.9 3.3 6.9 1.0 7.9 0.1 0.8 0.1 0.2 0.2 2.5 3.9 11.8EU-15 3.7 20.6 0.7 2.2 27.4 1.3 28.7 0.5 0.9 0.2 3.1 0.9 0.8 6.5 35.2Japan 2.1 1.0 0.0 0.3 3.9 1.2 5.2 0.0 1.4 0.1 0.1 0.1 0.2 1.9 7.1Other industrial 4.3 2.0 0.4 0.3 7.1 0.3 7.4 0.0 0.3 0.1 0.1 0.1 0.1 0.8 8.2
Other high-income 1.6 1.2 0.7 0.3 4.1 1.2 5.3 0.1 2.3 0.2 0.1 0.1 0.2 3.1 8.4
Low and middle-income economies 6.7 6.5 2.2 1.0 17.1 3.1 20.3 0.5 1.7 0.4 1.9 0.5 1.3 6.4 26.6
Sub-Saharan Africa 0.3 0.5 0.1 0.0 0.9 0.1 1.0 0.2 0.1 0.0 0.0 0.0 0.1 0.4 1.4East Asia
and Pacific 2.2 1.4 1.5 0.4 6.0 2.4 8.3 0.1 0.9 0.2 0.2 0.2 0.2 1.9 10.2South Asia 0.3 0.3 0.0 0.0 0.7 0.2 0.8 0.0 0.1 0.0 0.0 0.0 0.0 0.3 1.1Europe and
Central Asia 0.3 2.8 0.1 0.2 3.4 0.2 3.6 0.0 0.2 0.0 1.5 0.1 0.0 1.9 5.5Middle East and
North Africa 0.3 0.8 0.3 0.1 1.7 0.3 2.0 0.1 0.3 0.1 0.1 0.1 0.0 0.6 2.6Latin Americaand Caribbean 3.3 0.7 0.1 0.3 4.4 0.1 4.5 0.0 0.2 0.0 0.1 0.1 0.9 1.3 5.8
World 19.0 33.8 5.1 7.5 67.8 8.6 76.5 1.3 8.2 1.1 5.6 2.0 5.3 23.5 100.0
a. Expressed as a share (percent) of total world exports. World merchandise exports in 2002 amounted to some $6,300 billion.b. Other high-income group includes the Asian newly industrializing economies, several oil exporters in the Gulf region, and Israel.Source: IMF, Direction of Trade Statistics.

Table A3.8 Growth of current dollar merchandise trade, by direction 1993–2002(average annual percentage growth)
High-income importers Low- and middle-income importers
LatinMiddle America All
Sub- East Europe East and low-Other All Other All Saha- Asia and and the and
United indus- indus- high- high- ran and South Central North Carib- middle-Source of exports States EU-15 Japan trial trial income income Africa Pacific Asia Asia Africa bean income World
High-income econ. 5.6 1.2 1.8 4.0 2.7 3.9 2.8 1.5 8.3 3.7 11.1 0.1 5.7 6.5 3.5Industrial 6.2 1.2 1.4 4.1 2.6 3.5 2.7 1.6 8.2 2.5 11.0 0.1 5.7 6.2 3.3
United States 0.0 1.9 0.7 5.7 3.5 3.7 3.5 0.8 8.2 5.2 2.9 –2.1 7.1 6.1 4.3EU-15 7.4 1.1 2.8 2.6 1.9 4.7 2.0 1.5 6.6 1.3 12.1 0.6 4.7 6.4 2.7Japan 2.2 –1.8 0.0 0.1 1.1 1.6 1.2 –2.9 7.2 –0.5 3.3 –3.9 –0.3 4.1 1.9Other industrial 7.7 2.4 0.7 4.3 5.3 2.9 5.2 4.5 6.7 4.7 7.6 3.2 3.3 5.4 5.2
Other high-income 2.4 2.8 3.2 2.6 3.2 5.8 3.7 1.2 8.3 7.1 14.7 0.6 5.2 7.5 5.0
Low and middle-income economies 11.3 7.3 7.4 12.2 9.2 7.6 8.9 12.2 15.8 9.8 12.2 5.7 9.2 11.4 9.5Sub-Saharan Africa 5.6 5.5 18.1 4.2 6.4 18.5 6.9 11.4 25.7 7.6 15.1 7.8 13.7 13.4 8.4East Asia
and Pacific 14.6 11.1 9.5 14.1 12.2 7.4 10.6 16.6 17.4 14.9 13.2 8.8 19.7 15.6 11.3South Asia 10.8 4.8 0.0 7.5 7.0 10.1 7.5 11.1 13.9 8.1 5.9 3.2 20.1 9.1 7.9Europe and
Central Asia 17.8 9.7 2.8 12.7 10.2 15.9 10.4 10.0 9.9 8.6 13.4 4.6 9.8 11.8 0.0Middle East and
North Africa 1.8 2.5 2.9 2.1 3.0 5.3 3.3 15.3 16.3 4.8 0.0 3.9 –0.2 7.3 4.2Latin America
and Caribbean 11.3 2.5 2.1 16.7 9.2 3.5 9.0 4.6 13.9 11.2 12.8 5.4 8.1 8.6 8.9
World 7.3 2.1 3.8 4.8 3.9 5.1 4.1 4.3 9.4 5.7 11.5 1.2 6.4 7.6 4.8
Note: Growth rates are compound averages.Source: IMF, Direction of Trade Statistics.
G L O B A L E C O N O M I C I N D I C A T O R S
289

G L O B A L E C O N O M I C P R O S P E C T S
290
Table A3.9 Structure of long-term debt, 2001Share of long-term debt (%): concessional debt; nonconcessional debt at variable interest rates; nonconcessional debt at fixed interestrates
Non-concessional
Concessional Variable Fixed
Non-concessional
Concessional Variable Fixed
All developing countries 19.0 48.1 32.9
Asia 32.0 44.5 23.5East Asia 24.2 52.0 23.8China 20.7 45.3 34.0Indonesia 27.4 63.8 8.8Korea, Rep. .. .. ..Malaysia 8.3 56.9 34.8Myanmar 80.1 10.9 9.0Papua New Guinea 34.1 55.9 9.9Philippines 25.1 42.5 32.4Thailand 16.2 65.6 18.1Vietnam 73.2 11.7 15.1
South Asia 52.0 24.9 23.0Bangladesh 96.4 0.0 3.6India 38.9 29.4 31.7Nepal 99.8 0.0 0.2Pakistan 68.8 24.8 6.3Sri Lanka 81.7 10.2 8.1
Latin America andthe Caribbean 4.6 59.1 36.3
Argentina 1.3 38.5 60.2Bolivia 54.4 32.9 12.7Brazil 1.4 72.4 26.2Chile 0.9 94.1 5.0Colombia 2.7 56.9 40.4Costa Rica 15.1 23.1 61.8Dominican Republic 35.2 33.0 31.9Ecuador 15.8 32.5 51.7El Salvador 31.8 35.3 32.9Guatemala 40.3 31.7 27.9Jamaica 19.4 20.7 59.9Mexico 0.8 62.1 37.2Nicaragua 59.0 20.0 21.0Panama 4.2 42.7 53.1Paraguay 32.7 47.4 19.8Peru 15.0 61.5 23.5Trinidad and Tobago 0.7 38.3 60.9Uruguay 3.0 47.0 50.0Venezuela, RB 0.1 51.9 48.0
Europe and Central Asia 5.7 54.3 40.0Armenia 74.1 12.7 13.2Azerbaijan 55.4 41.0 3.6Belarus 12.6 59.7 27.7Bulgaria 4.2 86.0 9.8
Europe and Central Asia (continued)Czech Republic 2.0 72.8 25.2Estonia 1.3 97.6 1.1Georgia 74.8 11.9 13.2Hungary 0.5 63.6 35.9Kazakhstan 2.9 86.1 11.0Kyrgyz Republic 65.2 27.7 7.1Latvia 1.6 82.1 16.3Lithuania 3.0 51.7 45.3Moldova 19.9 54.7 25.4Poland 11.2 76.7 12.2Romania 2.6 72.4 25.0Russian Federation 0.4 34.7 64.9Slovak Republic 3.3 48.8 47.8Tajikistan 85.6 12.5 1.9Turkmenistan 19.4 67.4 13.3Turkey 5.0 50.3 44.7Ukraine 24.4 50.8 24.8Uzbekistan 23.5 68.1 8.4
Middle East andNorth Africa 36.1 32.8 31.1
Algeria 13.0 49.7 37.3Egypt, Arab Rep. 77.2 6.1 16.7Jordan 48.4 34.1 17.5Morocco 31.6 44.7 23.7Oman 18.5 64.7 16.8Syrian Arab Rep. 93.0 0.0 7.0Tunisia 25.4 31.6 43.0Yemen, Rep. 94.1 2.0 4.0
Sub-Saharan Africa 48.3 15.1 36.6Angola 21.1 8.5 70.5Botswana 69.0 7.1 23.9Côte d’Ivoire 38.9 46.8 14.3Cameroon 58.6 12.2 29.2Ethiopia 91.4 0.1 8.5Gabon 42.3 8.7 48.9Ghana 78.6 5.4 16.0Kenya 78.4 5.1 16.6Madagascar 72.8 5.0 22.2Nigeria 4.6 5.6 89.9Senegal 87.0 5.5 7.5South Africa 0.0 55.5 44.5Sudan 50.1 17.9 32.0Zambia 78.5 7.8 13.7Zimbabwe 45.7 20.3 34.0
Note: Nonconcessional debt data are available only for countries which report to the World Bank’s Debtor Reporting System. Foraggregate figures, missing values are assumed to have the same average value as the available data.Republic of Korea is not included in the aggregate figures.
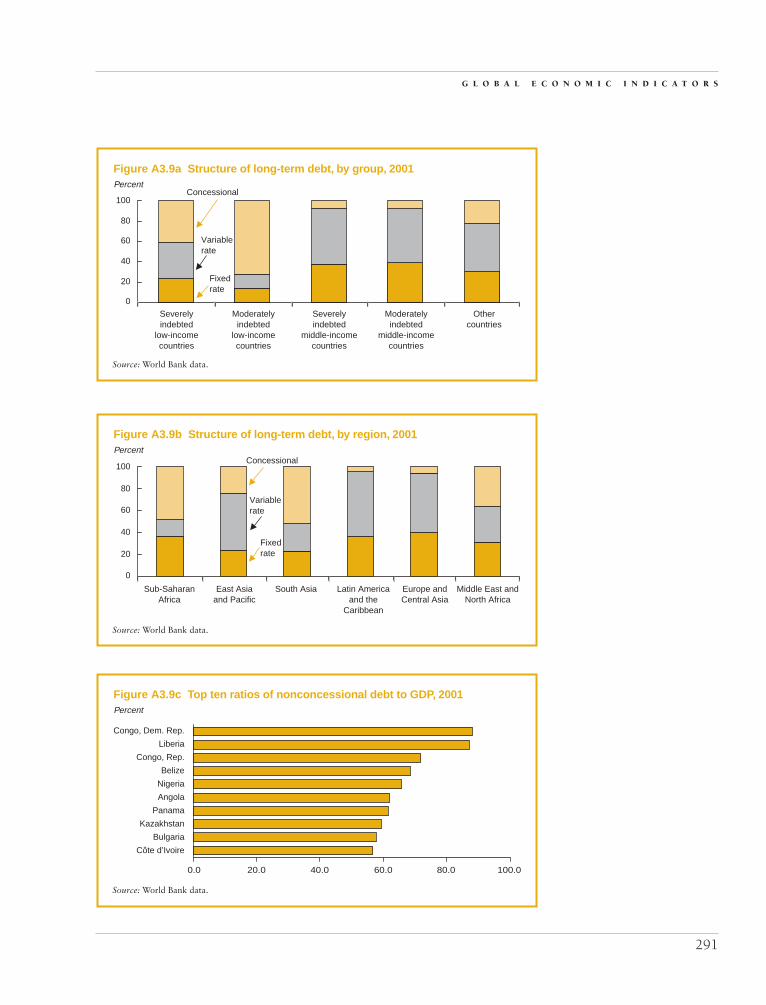
G L O B A L E C O N O M I C I N D I C A T O R S
291
Figure A3.9a Structure of long-term debt, by group, 2001
Source: World Bank data.
PercentConcessional
Variablerate
Fixedrate
Severelyindebted
low-incomecountries
Moderatelyindebted
low-incomecountries
Severelyindebted
middle-incomecountries
Moderatelyindebted
middle-incomecountries
Othercountries
100
80
60
40
20
0
�
�
�
Figure A3.9b Structure of long-term debt, by region, 2001
Source: World Bank data.
PercentConcessional
Variablerate
Fixedrate
Sub-SaharanAfrica
East Asiaand Pacific
South Asia Latin Americaand the
Caribbean
Europe andCentral Asia
Middle East andNorth Africa
100
80
60
40
20
0
Congo, Dem. Rep.
Liberia
Congo, Rep.
Belize
Nigeria
Angola
Panama
Kazakhstan
Bulgaria
Côte d’Ivoire
�
�
�
Figure A3.9c Top ten ratios of nonconcessional debt to GDP, 2001
Source: World Bank data.
Percent
0.0 20.0 40.0 60.0 80.0 100.0

G L O B A L E C O N O M I C P R O S P E C T S
292
Table A3.10 Long-term net resource flows to developing countries, 2001(millions of U.S. dollars)
Private Official
Total Percent Debt flowsmillions $ GDP Total (net) FDI Portfolio Total ODA Other
All developing countries 207,063 3.3 169,003 –8,648 171,693 5,958 38,060 37,875 184
Asia 54,524 2.4 40,616 –16,898 52,979 4,535 13,909 12,359 1,550East Asia 45,028 2.7 36,817 –15,025 48,913 2,930 8,211 6,649 1,561China 45,635 3.9 43,238 –4,017 44,241 3,015 2,396 874 1,522Indonesia –6,446 –4.6 –7,312 –4,198 –3,278 164 866 955 –89Korea, Rep. 9,046 2.1 9,279 –4,084 3,198 10,165 –233 –56 –177Malaysia 3,004 3.4 855 951 554 –650 2,149 1,413 736Myanmar 210 .. 145 –63 208 0 65 65 0Papua New Guinea 150 5.2 2 –61 63 0 148 78 70Philippines 2,014 2.8 2,077 –98 1,792 383 –62 164 –226Thailand –2,977 –2.6 –3,052 –6,891 3,820 18 76 534 –458Vietnam 1,946 5.9 710 –590 1,300 0 1,236 1,222 14
South Asia 9,496 1.5 3,798 –1,873 4,066 1,606 5,698 5,710 –12Bangladesh 1,305 2.8 304 230 78 –4 1,002 1,007 –5India 4,383 0.9 3,534 –1,608 3,403 1,739 849 813 36Nepal 255 4.6 19 0 19 0 236 236 0Pakistan 1,639 2.8 –308 –561 383 –130 1,947 2,066 –120Sri Lanka 525 3.4 243 71 172 0 282 271 11
Latin America 79,898 4.2 72,067 500 69,309 2,258 7,831 3,495 4,336Argentina –2,770 –1.0 –3,897 –7,030 3,214 –81 1,127 –225 1,353Bolivia 1,217 15.3 637 –26 662 0 580 549 32Brazil 26,159 5.1 23,337 –1,781 22,636 2,482 2,823 398 2,424Chile 5,634 8.5 5,727 1,470 4,476 –219 –93 8 –101Colombia 4,768 5.8 3,597 1,312 2,328 –43 1,171 81 1,090Costa Rica 451 2.8 630 176 454 0 –179 –31 –148Dominican Republic 1,719 8.1 1,729 530 1,198 0 –10 –31 21Ecuador 1,549 7.4 1,444 113 1,330 1 105 54 51El Salvador 982 7.1 674 406 268 0 308 132 175Guatemala 577 2.8 403 –52 456 0 174 102 71Jamaica 1,344 17.3 1,385 771 614 0 –41 –4 –38Mexico 27,429 4.4 28,079 3,198 24,731 150 –650 –64 –586Nicaragua 820 .. 13 –119 132 0 807 822 –15Panama 1,806 15.0 1,799 1,287 513 0 7 –17 24Paraguay 6 0.1 –14 –93 79 0 19 –13 33Peru 2,317 4.3 1,400 294 1,064 42 917 184 733Trinidad and Tobago 819 9.0 830 –5 835 0 –11 3 –14Uruguay 880 4.7 796 478 318 0 84 –37 121Venezuela 1,734 1.4 2,644 –730 3,448 –74 –910 0 –910
Europe andCentral Asia 40,319 4.0 36,162 5,774 30,130 258 4,157 7,347 –3,191
Armenia 174 8.2 74 4 70 0 101 110 –9Azerbaijan 348 6.1 216 –11 227 0 132 140 –7Belarus 87 0.7 83 –13 96 0 5 20 –16Bulgaria 1,028 7.6 1,043 360 692 –9 –15 170 –185Czech Republic 5,481 9.6 5,194 –346 4,924 616 287 150 137Estonia 658 11.9 625 54 539 32 34 43 –9Georgia 307 9.6 173 13 160 0 134 147 –13Hungary 3,935 7.6 3,952 1,378 2,440 134 –17 31 –48Kazakhstan 5,009 22.6 4,947 2,128 2,763 55 62 57 6Kyrgyz Republic 52 3.4 –73 –78 5 0 125 145 –19Latvia 977 12.7 880 697 177 6 97 80 17Lithuania 625 5.3 521 91 446 –16 104 91 14Moldova 125 8.4 70 –27 94 4 55 64 –9Poland 6,205 3.4 9,611 4,205 5,713 –307 –3,406 462 –3,868Romania 3,002 7.6 2,633 1,468 1,157 8 369 236 133Russian Federation 526 0.2 1,488 –1,524 2,469 543 –962 414 –1,376Slovak Republic 447 2.2 303 –1,173 1,475 0 144 63 81Tajikistan 179 17.0 39 17 22 0 141 134 6Turkmenistan .. .. .. .. .. .. .. .. ..Turkey 2,329 1.6 906 –2,281 3,266 –79 1,423 –302 1,725Ukraine 815 2.1 426 368 792 –734 389 126 263Uzbekistan 346 3.0 46 –25 71 0 300 217 83
Middle East & N. Africa 9,543 1.4 7,462 2,134 5,460 –132 2,082 2,553 –471Algeria –595 –1.1 243 –953 1,196 0 –838 –143 –695Egypt, Arab Rep. 2,073 2.1 2,067 1,519 510 39 5 130 –125Iran, Islamic Rep. 1,101 1.0 1,049 1,016 33 0 52 –28 80

Middle East & N. Africa (continued)Jordan 548 6.2 –114 –70 100 –145 662 472 190Morocco 2,346 6.9 2,633 –17 2,658 –8 –286 46 –332Oman –557 –2.8 –867 –905 42 –3 309 9 301Syrian Arab Rep. 167 2.1 204 –1 205 0 –37 –25 –12Tunisia 1,568 7.8 1,108 666 457 –15 460 247 213Yemen, Rep. –118 –1.3 –210 –5 –205 0 92 113 –22
Sub-Saharan Africa 22,778 7.2 12,697 –157 13,815 –961 10,081 12,121 –2,040Angola 1,793 18.9 1,924 –222 2,146 0 –131 –109 –23Botswana 41 0.8 55 –2 57 0 –14 8 –22Côte d’Ivoire 173 1.6 137 –110 246 1 36 155 –120Cameroon 254 3.0 –16 –91 75 0 270 277 –7Ethiopia 857 13.7 10 –10 20 0 847 860 –13Gabon –12 –0.3 170 –30 200 0 –182 –45 –138Ghana 818 15.4 244 154 89 0 574 567 7Kenya 188 1.6 –37 –43 5 0 225 371 –146Madagascar 257 5.6 9 –2 11 0 248 247 1Nigeria –454 –1.1 920 –184 1,104 0 –1,374 92 –1,466Senegal 439 9.5 167 41 126 0 273 294 –21South Africa 6,842 6.0 6,627 427 7,162 –962 215 211 4Sudan 716 5.7 574 0 574 0 142 143 –1Zambia 518 14.2 126 54 72 0 392 401 –9Zimbabwe 56 0.6 –28 –33 5 0 84 71 13
Note: Republic of Korea is not included in the aggregate figures.
Table A3.10 Long-term net resource flows to developing countries, 2001 (continued)(millions of U.S. dollars)
Private Official
Total Percent Debt flowsmillions $ GDP Total (net) FDI Portfolio Total ODA Other
G L O B A L E C O N O M I C I N D I C A T O R S
293
Figure A3.10a Distribution of long-term net resource flows, 2001
Source: World Bank data.
Percent
Official Private
�
�
100
80
60
40
20
0East Asia
and PacificSouth Asia Latin America
and theCaribbean
Europe andCentral Asia
Middle Eastand
North Africa
Sub-SaharanAfrica
Figure A3.10b Change in share of private long-term flows, 1990–2001
Source: World Bank data.
Percent
80
60
40
20
0East Asia
and PacificSouth Asia Latin America
and theCaribbean
Europe andCentral Asia
Middle Eastand
North Africa
Sub-SaharanAfrica

294
The principal sources for the data in this ap-pendix are the World Bank’s central databasesand several International Monetary Fund data-bases, combined with data sourced from the OECD and from Oxford Economics Inc.(OEF), covering the industrial and other high-income economies. The cut-off date for dataupdates was July 16, 2003. Data revisions andnew releases since that time have not been in-corporated in the tables. Regional aggregatesare based on the classification of economies byincome group and by region, following theBank’s standard definitions (see country classi-fication tables that follow).
Debt and finance data (tables A3.9 andA3.10) cover the 138 countries that report tothe Bank’s Debtor Reporting System (DRS),supplemented by data for non-DRS countries,for which commercial market information hasbeen utilized. Small countries have generallybeen omitted from the tables, but are includedin the regional totals. Current price data arereported in U.S. dollars.
Notes on tablesTables A3.1 through A3.4. Historic data
sourced from the databases noted above,while projections are consistent with thosehighlighted in chapter 1 and appendix 1.
Tables A3.5 and A3.6. Merchandise tradedata is sourced from combined IMF, WorldBank, OECD, and OEF sources. Merchandiseexports and imports exclude trade in services.Imports are reported on a cost-insurance-and-freight basis. Trade values are expressed in mil-
lions of current U.S. dollars, while growthrates are based on constant price data, whichare derived from current values deflated by rel-evant price indices or unit value measures. Ef-fective market growth (EMG) in table A3.5 isthe export-weighted growth of each country’strading partner imports.
Tables A3.7 and A3.8. The IMF’s Directionof Trade database serves as the underlyingsource for the bilateral trade share and growthinformation highlighted in these tables.Growth rates are compound annual averages,and are computed from current U.S. dollarmeasures of trade.
Table A3.9. Long-term debt covers publicand publicly guaranteed debt but excludesIMF credits. Concessional debt is debt with anoriginal grant element of 25 percent or more.Nonconcessional variable interest-rate debtincludes all public and publicly guaranteedlong-term debt with an original grant elementof less than 25 percent, whose terms dependon movements in a key market interest rate.This item conveys information about the bor-rower’s exposure to changes in internationalinterest rates.
Table A3.10. Long-term net resource flowsare the sum of net resource flows on long-termdebt (excluding IMF) plus non-debt-creatingflows. Foreign direct investment refers to thenet inflows of investment from abroad. Portfo-lio equity flows are the sum of country funds,depository receipts, and direct purchases ofshares by foreign investors.
Technical Notes

Classificationof Economies

G L O B A L E C O N O M I C P R O S P E C T S
296
Table 1 Classification of economies by income and region, July 2003
Europe and Middle EastSub-Saharan Africa Asia Central Asia and North Africa
East and EasternIncome Southern West East Asia South Europe and Rest of Middle Northgroup Subgroup Africa Africa and Pacific Asia Central Asia Europe East Africa Americas
Low-income
BeninBurkina FasoCameroonCentral
AfricanRepublic
ChadCongo, Rep.Côte d’IvoireEquatorial
GuineaGambia, TheGhanaGuineaGuinea-BissauLiberiaMaliMauritaniaNigerNigeriaSão Tomé
and PrincipeSenegalSierra LeoneTogo
CambodiaIndonesiaKorea, Dem.
Rep.Lao PDRMongoliaMyanmarPapua New
GuineaSolomon
IslandsTimor-LesteVietnam
AfghanistanBangladeshBhutanIndiaNepalPakistan
AzerbaijanGeorgiaKyrgyz
RepublicMoldovaTajikistanUzbekistan
Yemen,Rep. of
HaitiNicaragua
Middle-income
Subtotal
Lower
Upper
NamibiaSouth AfricaSwaziland
BotswanaMauritiusMayotteSeychelles
Cape Verde
Gabon
ChinaFijiKiribatiMarshall
IslandsMicronesia,
Fed. Sts.PhilippinesSamoaThailandTongaVanuatu
AmericanSamoa
MalaysiaN. Mariana
IslandsPalau
MaldivesSri Lanka
AlbaniaArmeniaBelarusBosnia and
HerzegovinaBulgariaKazakhstanMacedonia,
FYRa
RomaniaRussian
FederationSerbia and
MontenegroTurkmenistanUkraine
CroatiaCzech
RepublicEstoniaHungaryLatviaLithuaniaPolandSlovak
Republic
Turkey Iran, IslamicRep.
IraqJordanSyrian Arab
RepublicWest Bank
and Gaza
LebanonOmanSaudi Arabia
AlgeriaDjiboutiEgypt, Arab
Rep.MoroccoTunisia
Libya
BoliviaBrazilColombiaCubaDominican
RepublicEcuadorEl SalvadorGuatemalaGuyanaHondurasJamaicaParaguayPeruSt. Vincent
and theGrenadines
Suriname
ArgentinaBelizeChileCosta RicaDominicaGrenadaMexicoPanamaSt. Kitts and
NevisSt. LuciaTrinidad and
TobagoUruguayVenezuela,
RB
AngolaBurundiComorosCongo, Dem.
Rep.EritreaEthiopiaKenyaLesothoMadagascarMalawiMozambiqueRwandaSomaliaSudanTanzaniaUgandaZambiaZimbabwe
152 25 23 24 8 26 1 9 6 30

C L A S S I F I C A T I O N O F E C O N O M I E S
297
Definitions of groupsFor operational and analytical purposes, the World Bank’smain criterion for classifying economies is gross national in-come (GNI) per capita. Every economy is classified as low in-come, middle income (subdivided into lower middle and uppermiddle), or high income. Other analytical groups, based ongeographic regions and levels of external debt, are also used.
Low-income and middle-income economies are sometimesreferred to as developing economies. The use of the term isconvenient; it is not intended to imply that all economies inthe group are experiencing similar development or that other
economies have reached a preferred or final stage of develop-ment. Classification by income does not necessarily reflectdevelopment status.
This table classifies all World Bank member economies,and all other economies with populations of more than30,000. Economies are divided among income groups accord-ing to 2002 GNI per capita, calculated using the World BankAtlas method. The groups are: low income, $735 or less;lower middle income, $736–2,935; upper middle income,$2,936–9,075; and high income, $9,076 or more.
Table 1 Classification of economies by income and region, July 2003 (continued)
Europe and Middle EastSub-Saharan Africa Asia Central Asia and North Africa
East and EasternIncome Southern West East Asia South Europe and Rest of Middle Northgroup Subgroup Africa Africa and Pacific Asia Central Asia Europe East Africa Americas
High-income
AustraliaJapanKorea, Rep.New Zealand
CanadaUnited
States
OECD
Total
Non-OECD
209 25 23
BruneiFrench
PolynesiaGuamHong Kong,
Chinac
Macao,Chinad
NewCaledonia
SingaporeTaiwan,
China
36 8
Slovenia
27
AndorraChannel
IslandsCyprusFaeroe
IslandsGreenlandIsle of ManLiechtensteinMonacoSan Marino
28
BahrainIsraelKuwaitQatarUnited Arab
Emirates
14
Malta
7
Antigua andBarbuda
ArubaBahamas,
TheBarbadosBermudaCayman
IslandsNetherlands
AntillesPuerto RicoVirgin
Islands(U.S.)
41
AustriaBelgiumDenmarkFinlandFranceb
GermanyGreeceIcelandIrelandItalyLuxembourgNetherlandsNorwayPortugalSpainSwedenSwitzerlandUnited
Kingdom
a. Former Yugoslav Republic of Macedonia.b. The French overseas departments French Guiana, Guadeloupe, Martinique, and Réunion are included in France.c. On 1 July 1997 China resumed its exercise of sovereignty over Hong Kong.d. On 20 December 1999 China resumed its exercise of sovereignty over Macao.Source: World Bank data.

G L O B A L E C O N O M I C P R O S P E C T S
298
Timor-Leste
Marshall IslandsMicronesia, Fed. Sts.West Bank and Gaza
American SamoaMayotteN. Mariana IslandsPalau
Low-income
Middle-income
Lower
Upper
AfghanistanAngolaBeninBurkina FasoBurundiCentral African
RepublicChadComorosCongo, Dem.
Rep.Congo, Rep.Côte d’IvoireEthiopiaGambia, TheGuineaGuinea-BissauIndonesiaKyrgyz
Republic
BrazilCubaEcuadorGuyanaIraqJordanPeruSerbia and
MontenegroSyrian Arab
Republic
Lao PDRLiberiaMadagascarMalawiMauritaniaMoldovaMyanmarNicaraguaNigerNigeriaPakistanRwandaSão Tomé and
PrincipeSierra LeoneSomaliaSudanTajikistanZambia
ArgentinaBelizeGabonLebanonPanamaUruguay
BhutanCambodiaCameroonGhanaHaitiKenyaMaliMongoliaPapua New
GuineaSenegalTanzaniaTogoUgandaUzbekistanZimbabwe
BoliviaBulgariaColombiaHondurasJamaicaKazakhstanPhilippinesRussian
FederationSamoaSt. Vincent
and theGrenadines
ThailandTunisiaTurkeyTurkmenistan
ChileCroatiaDominicaEstoniaGrenadaHungaryLatviaMalaysiaSlovak
RepublicSt. Kitts and
Nevis
AzerbaijanBangladeshEquatorial
GuineaEritreaGeorgiaIndiaKorea, Dem.
Rep.LesothoMozambiqueNepalSolomon IslandsVietnamYemen, Rep.
AlbaniaAlgeriaArmeniaBelarusBosnia and
HerzegovinaCape VerdeChinaDjiboutiDominican
RepublicEgypt, Arab
Rep.El SalvadorFijiGuatemalaIran, Islamic
Rep.
BotswanaCosta RicaCzech RepublicLibyaLithuaniaMauritiusMexicoOmanPolandSaudi ArabiaSeychelles
KiribatiMacedonia,
FYRa
MaldivesMoroccoNamibiaParaguayRomaniaSouth AfricaSri LankaSurinameSwazilandTongaUkraineVanuatu
St. LuciaTrinidad and
TobagoVenezuela, RB
Table 2 Classification of economies by income and indebtedness, July 2003
Income Sub- Not classifiedgroup group Severely indebted Moderately indebted Less indebted by indebtedness
C L A S S I F I C A T I O N O F E C O N O M I E S
299
AustraliaAustriaBelgiumCanadaDenmarkFinlandFranceb
GermanyGreeceIcelandIrelandItalyJapan
AndorraAntigua and
BarbudaArubaBahamas, TheBahrainBarbadosBermudaBruneiCayman IslandsChannel IslandsCyprusFaeroe IslandsFrench
PolynesiaGreenlandGuamHong Kong,
Chinad
Korea, Rep.LuxembourgNetherlandsNew ZealandNorwayPortugalSpainSwedenSwitzerlandUnited KingdomUnited States
Isle of ManIsraelKuwaitLiechtensteinMacao, Chinac
MaltaMonacoNetherlands
AntillesNew CaledoniaPuerto RicoQatarSan MarinoSingaporeSloveniaTaiwan, ChinaUnited Arab
EmiratesVirgin Islands
(U.S.)
Definitions of groupsThis table classifies all World Bank member economies, andall other economies with populations of more than 30,000.Economies are divided among income groups according to2002 GNI per capita, calculated using the World Bank Atlasmethod. The groups are: low income, $735 or less; lowermiddle income, $736–2,935; upper middle income,$2,936–9,075; and high income, $9,076 or more.
Standard World Bank definitions of severe and moderateindebtedness are used to classify economies in this table.Severely indebted means either: present value of debt serviceto GNI exceeds 80 percent or present value of debt service toexports exceeds 220 percent. Moderately indebted means
either of the two key ratios exceeds 60 percent of, but doesnot reach, the critical levels. For economies that do not reportdetailed debt statistics to the World Bank Debtor ReportingSystem (DRS), present-value calculation is not possible.Instead, the following methodology is used to classify thenon-DRS economies. Severely indebted means three of fourkey ratios (averaged over 1999–2001) are above criticallevels: debt to GNI (50 percent); debt to exports (275percent); debt service to exports (30 percent); and interest toexports (20 percent). Moderately indebted means three of thefour key ratios exceed 60 percent of, but do not reach, thecritical levels. All other classified low- and middle-incomeeconomies are listed as less indebted.
High-income
Total
OECD
Non-OECD
209 50 39 55
Table 2 Classification of economies by income and indebtedness, July 2003 (continued)
Income Sub- Not classifiedgroup group Severely indebted Moderately indebted Less indebted by indebtedness
a. Former Yugoslav Republic of Macedonia.b. The French overseas departments French Guiana, Guadeloupe, Martinique, and Réunion are included in France.c. On 20 December 1999 China resumed its exercise of sovereignty over Macao.d. On 1 July 1997 China resumed its exercise of sovereignty over Hong Kong.Source: World Bank data.
65


Realizing the Development Promise of the Doha Agenda 2004
Global Economic Prospects
Global Economic Prospects
2004
Global E
conomic Prospects
2004
ISBN 0-8213-5582-1
THE WORLD BANK
Realizing the Development Promise of the Doha Agenda
The World Trade Organization(WTO) round of trade negotiations
initiated in November 2001 inDoha, Qatar, was intended to be a“development round.”Those good
intentions are now being tested.Trade ministers from all over the
world are discussing ways to reducetrade barriers—barriers that greatly
harm development and povertyreduction. Global Economic Prospects
2004 explores the tough issuesunder discussion—protection of
agriculture, trade in labor-intensivemanufactures, labor services, andspecial treatment for developing
countries, among others—to presentoptions that would indeed reduce
poverty and advance development.The global talks will not be easy and
may take time, but allowing poorpeople greater access to world
markets will offer them new opportunities to improve their living
standards. If agreements are to begenuinely pro-development, thesediscussions must be informed byclear analysis of measures that arelikely to benefit poor people themost.That is the purpose of this
Global Economic Prospects.
—Nicholas SternSenior Vice President and
Chief Economist
The Doha Development Agenda of the Fourth MinisterialConference of the WTO opened many contentious andimportant questions. Global Economic Prospects 2004:
Realizing the Development Promise of the Doha Agenda analyzes themost critical multilateral trade issues and suggests policy options that would raise living standards in developing countries and reduce global poverty.
The fourteenth annual edition of Global Economic Prospects
• explores the short-, medium-, and long-term outlook for the global economy, including driving forces, commodity prices,and capital flows, and their implications for major regions
• reviews recent trends in exports from developing countries,trade barriers that work to the disadvantage of poor people,and policies to reduce protection and other inequities in theworld trading system
• examines trade in agriculture—the most important and politicallycontentious sector for global poverty reduction—including keylessons from development experience, possible changes to the current system of subsidies and protection, and the potential for liberalization in both rich and poor countries
• investigates the temporary movement of labor—so-called Mode 4 of the General Agreement on Trade in Services—evaluating its advantages and disadvantages to both the home and the host countries
• discusses trade facilitation in light of post-9/11 concerns for security to suggest new policies that would promote greater and more-secure trade
• reviews the special treatment of developing countries in the world trading system and the role of trade preferences,exemptions from WTO rules, and technical assistance to implement WTO trade regulations.
Global Economic Prospects 2004 provides essential information forthose concerned with developments shaping today’s global economy.
Related Documents