http://www.hnei.hawaii.edu Realizing Enzymatic Biofuel Cells Through Nano-Engineering Realizing Enzymatic Biofuel Cells Realizing Enzymatic Biofuel Cells Through Nano Through Nano - - Engineering Engineering Bor Yann Liaw Bor Yann Liaw Electrochemical Power Systems Laboratory Electrochemical Power Systems Laboratory Hawaii Natural Energy Institute Hawaii Natural Energy Institute School of Ocean and Earth Science and Technology School of Ocean and Earth Science and Technology University of Hawaii at Manoa University of Hawaii at Manoa 1680 East 1680 East - - West Road, POST 109, Honolulu, HI 96822 West Road, POST 109, Honolulu, HI 96822 (808) 956 (808) 956 - - 2339, 2339, [email protected] [email protected] The 4 th US-Korea Forum on Nanotechnology, April 26, 2007, Hawaii

Welcome message from author
This document is posted to help you gain knowledge. Please leave a comment to let me know what you think about it! Share it to your friends and learn new things together.
Transcript
http://www.hnei.hawaii.edu
Realizing Enzymatic Biofuel Cells Through Nano-Engineering
Realizing Enzymatic Biofuel Cells Realizing Enzymatic Biofuel Cells Through NanoThrough Nano--Engineering Engineering
Bor Yann LiawBor Yann Liaw
Electrochemical Power Systems LaboratoryElectrochemical Power Systems LaboratoryHawaii Natural Energy InstituteHawaii Natural Energy Institute
School of Ocean and Earth Science and TechnologySchool of Ocean and Earth Science and TechnologyUniversity of Hawaii at ManoaUniversity of Hawaii at Manoa
1680 East1680 East--West Road, POST 109, Honolulu, HI 96822West Road, POST 109, Honolulu, HI 96822(808) 956(808) 956--2339, 2339, [email protected]@hawaii.edu
The 4th US-Korea Forum on Nanotechnology, April 26, 2007, Hawaii
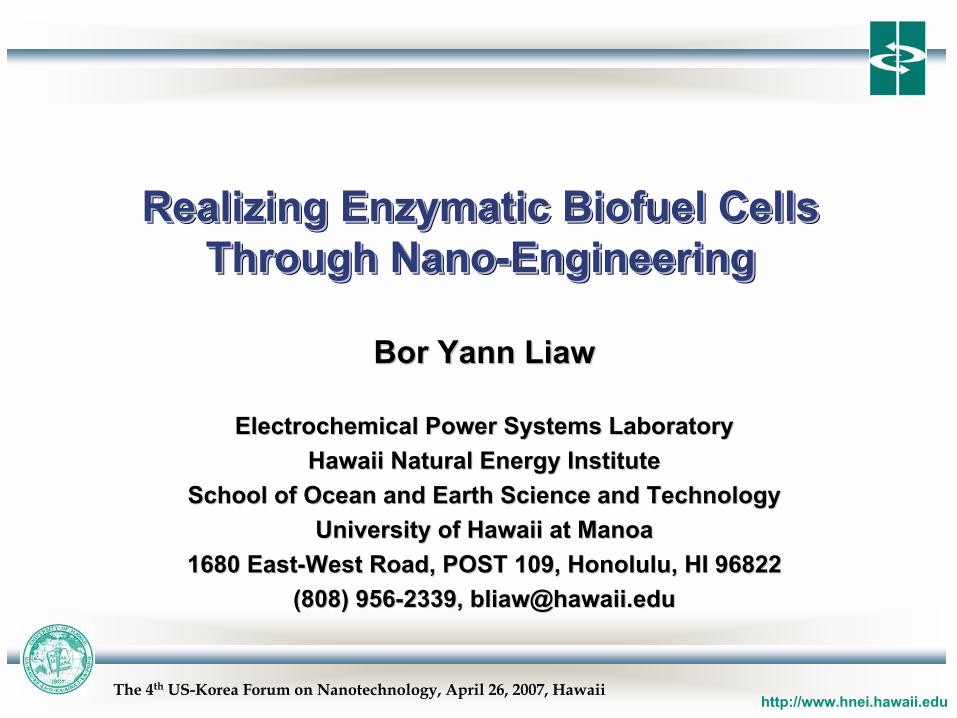
Enzymatic BioelectrocatalysisEnzymatic Bioelectrocatalysis
G.T.R. Palmore, et al. J. Electroanal. Chem. 443 (1998) 155.
Dehydrogenase Enzymes
Cofactor
Mediator
BV: Benzyl Viologen
6
6H+

Ethanol
Acetaldehyde
ADH
NADH
NAD+
H+
Proton ConductiveMembrane
H2O
½ O2
Anode Cathode
2 H+
BV: Benzyl Viologen
Alcohol BioAlcohol Bio--Fuel Cells Fuel Cells
N.L. Akers et al. Electrochim Acta 50 (2005) 2521
2e-
H+
Diaphorase
2 BV+
2 BV2+
G.T.R. Palmore, et al. J. Electroanal. Chem. 443 (1998) 155.
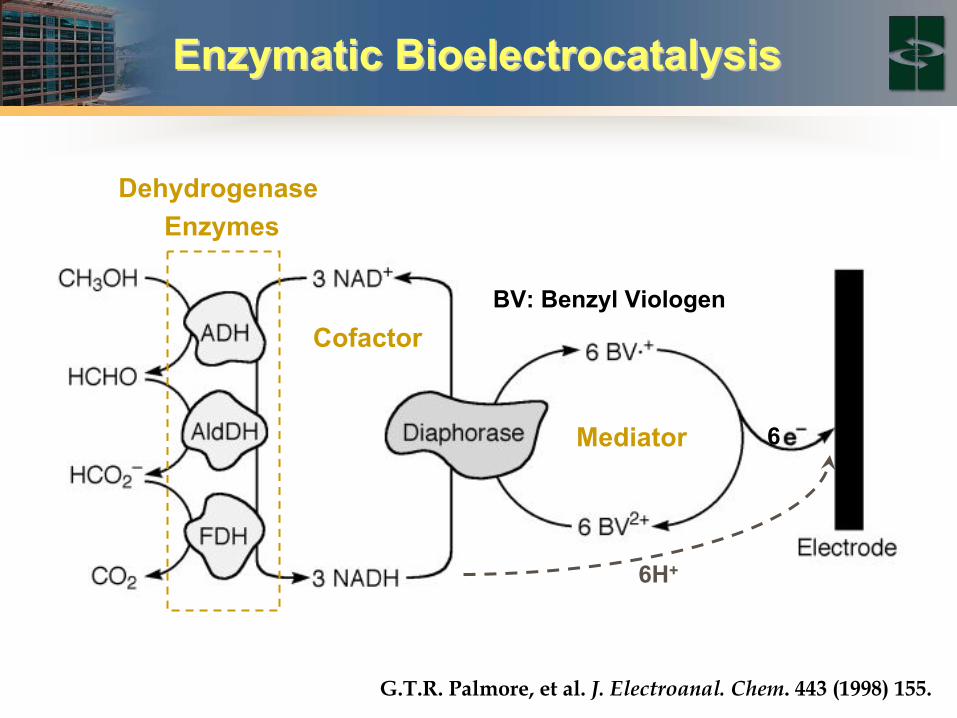
A Working Ethanol BioA Working Ethanol Bio--FC (EBFC)FC (EBFC)
Fuel in
Oxygen in Fuel out
Oxygen out
Cat
hode
con
t.
Ano
de c
ont.
RENaf
ion
112
0.0
0.5
1.0
1.5
2.0
2.5
3.0
3.5
4.0
0 10 20 30 40 50 60 70
Current (µA/cm2)Po
wer
( µW
/cm
2 )
V. Svoboda et al. (2006)
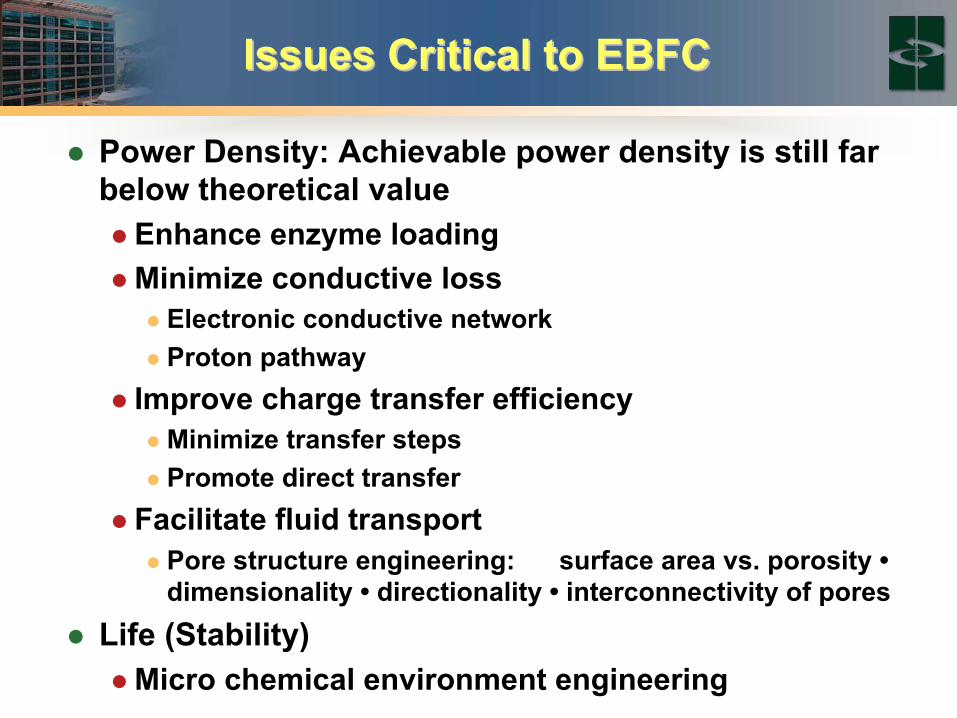
Issues Critical to EBFCIssues Critical to EBFC
Power Density: Achievable power density is still far below theoretical value
Enhance enzyme loadingMinimize conductive loss
Electronic conductive networkProton pathway
Improve charge transfer efficiencyMinimize transfer stepsPromote direct transfer
Facilitate fluid transportPore structure engineering: surface area vs. porosity •dimensionality • directionality • interconnectivity of pores
Life (Stability)Micro chemical environment engineering
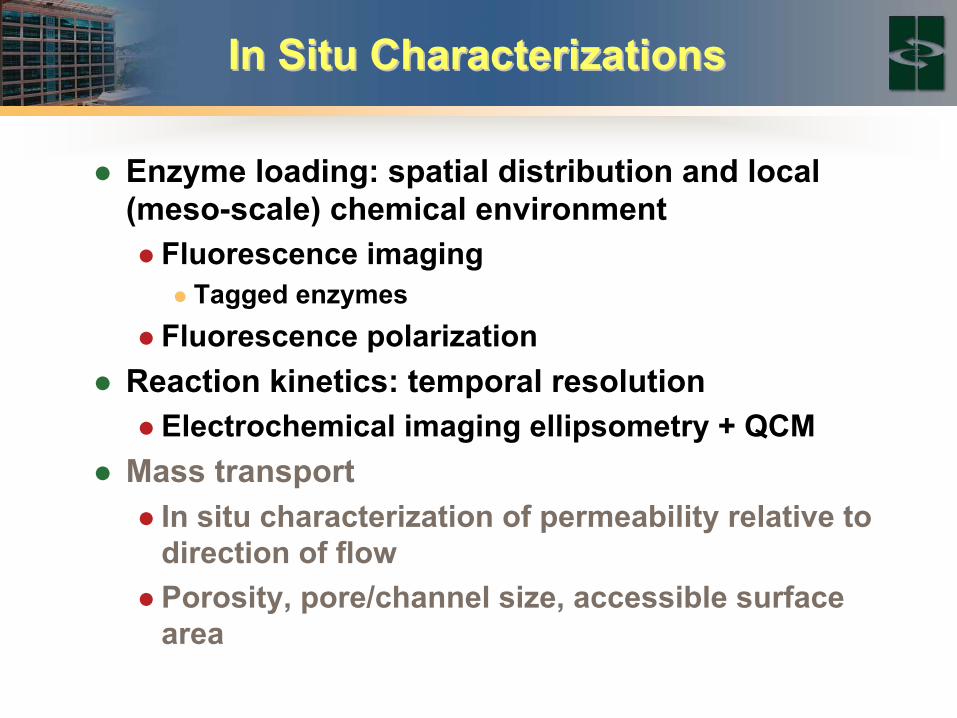
In Situ CharacterizationsIn Situ Characterizations
Enzyme loading: spatial distribution and local (meso-scale) chemical environment
Fluorescence imagingTagged enzymes
Fluorescence polarizationReaction kinetics: temporal resolution
Electrochemical imaging ellipsometry + QCMMass transport
In situ characterization of permeability relative to direction of flowPorosity, pore/channel size, accessible surface area

Need for In Situ CharacterizationsNeed for In Situ Characterizations
In today’s nano-material and bioengineering research, control of materials synthesis and process require fast, non-intrusive, in-situ characterization over a large sample area. For enzymatic biofuel cell applications, such in situ, non-intrusive observations are highly desirable. Example:
Imaging ellipsometry + quartz crystal microbalance (QCM) + electrochemical techniques (e.g., CV, EIS), to study nano-materials and their properties:
Microstructure & surface morphologyReaction kinetics
H+
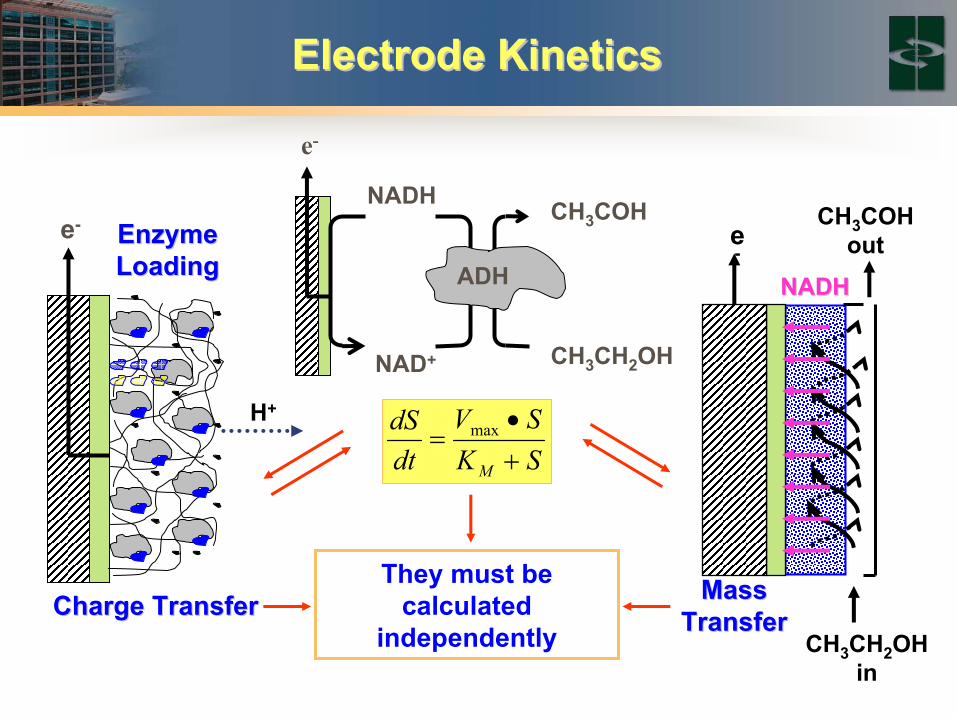
Electrode KineticsElectrode Kinetics
NADH
NAD+
ADH
CH3CH2OH
CH3COH
e-
SKSV
dtdS
M +•
= max
CH3COH oute
-
CH3CH2OH in
Mass Mass TransferTransfer
They must be calculated
independently
e-
Charge TransferCharge Transfer
NADHNADH
Enzyme Enzyme LoadingLoading
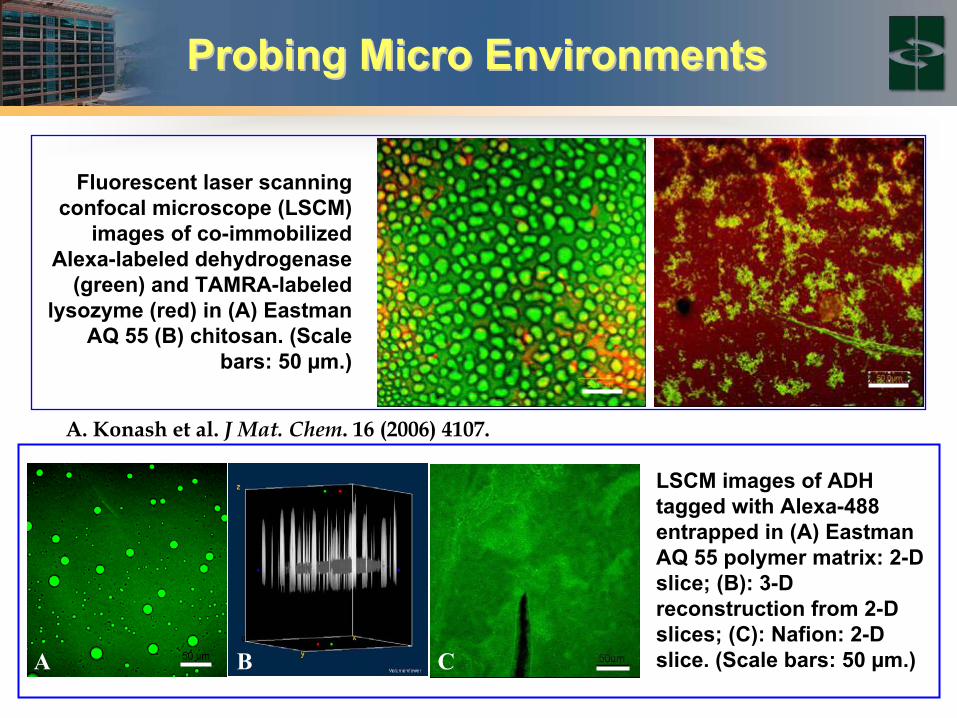
Probing Micro EnvironmentsProbing Micro Environments
Fluorescent laser scanning confocal microscope (LSCM)
images of co-immobilized Alexa-labeled dehydrogenase
(green) and TAMRA-labeled lysozyme (red) in (A) Eastman
AQ 55 (B) chitosan. (Scale bars: 50 µm.)
LSCM images of ADH tagged with Alexa-488 entrapped in (A) Eastman AQ 55 polymer matrix: 2-D slice; (B): 3-D reconstruction from 2-D slices; (C): Nafion: 2-D slice. (Scale bars: 50 µm.) A B C
A. Konash et al. J Mat. Chem. 16 (2006) 4107.
Micro and Nano Materials SynthesisMicro and Nano Materials Synthesis
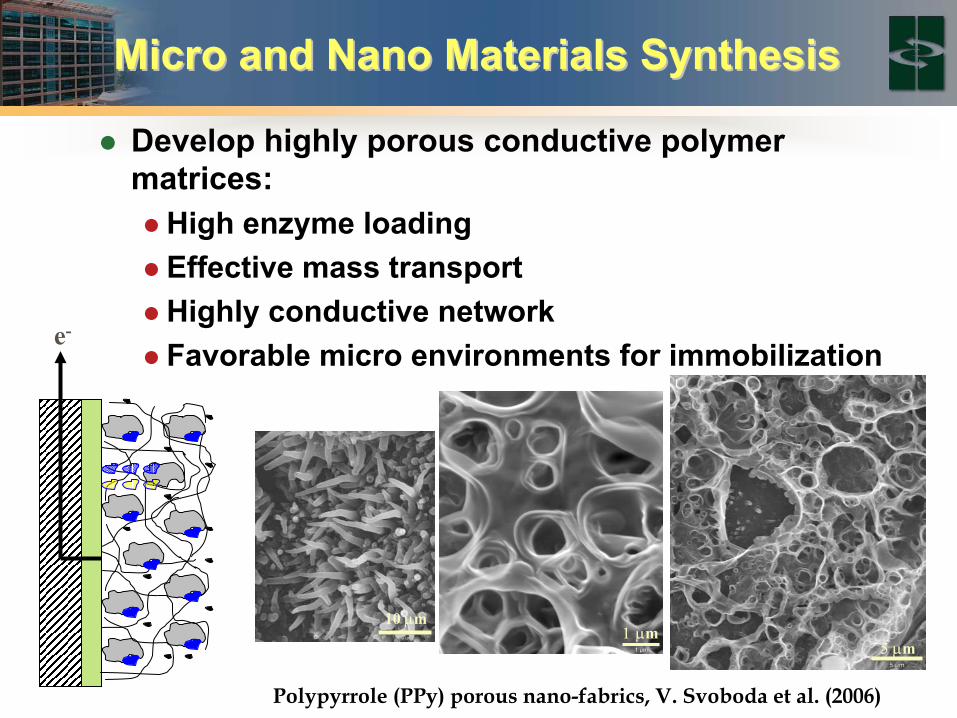
Develop highly porous conductive polymer matrices:
High enzyme loadingEffective mass transportHighly conductive networkFavorable micro environments for immobilization
Polypyrrole (PPy) porous nano-fabrics, V. Svoboda et al. (2006)
1 µm5 µm
10 µm
e-
Macro & Meso Pore Structure Macro & Meso Pore Structure Engineering Engineering
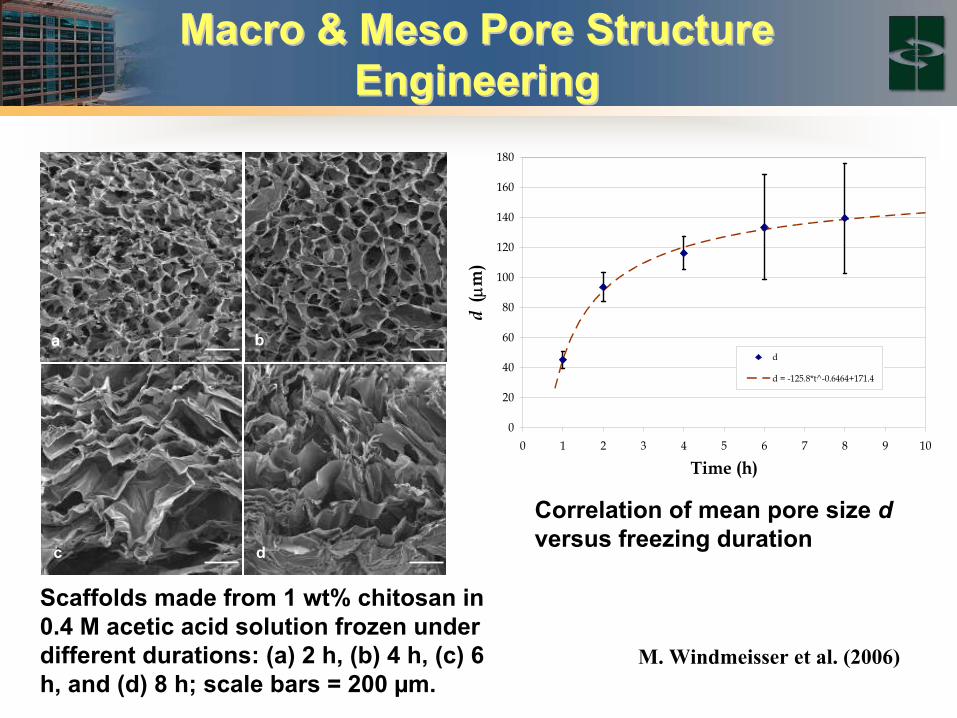
M. Windmeisser et al. (2006)
Correlation of mean pore size dversus freezing duration
0
20
40
60
80
100
120
140
160
180
0 1 2 3 4 5 6 7 8 9 10
Time (h)d
( µm
)
d
d = -125.8*t^-0.6464+171.4
Scaffolds made from 1 wt% chitosan in 0.4 M acetic acid solution frozen under different durations: (a) 2 h, (b) 4 h, (c) 6 h, and (d) 8 h; scale bars = 200 µm.
a b
c d
DET in PQQDET in PQQ--GDHGDH--ChitosanChitosan--CNTCNT
-0.4 -0.2 0.0 0.2 0.4
-0.4
-0.2
0.0
0.2
0.420 mV/s
b
a
i/µA
E/V(vs.Ag/AgCl)
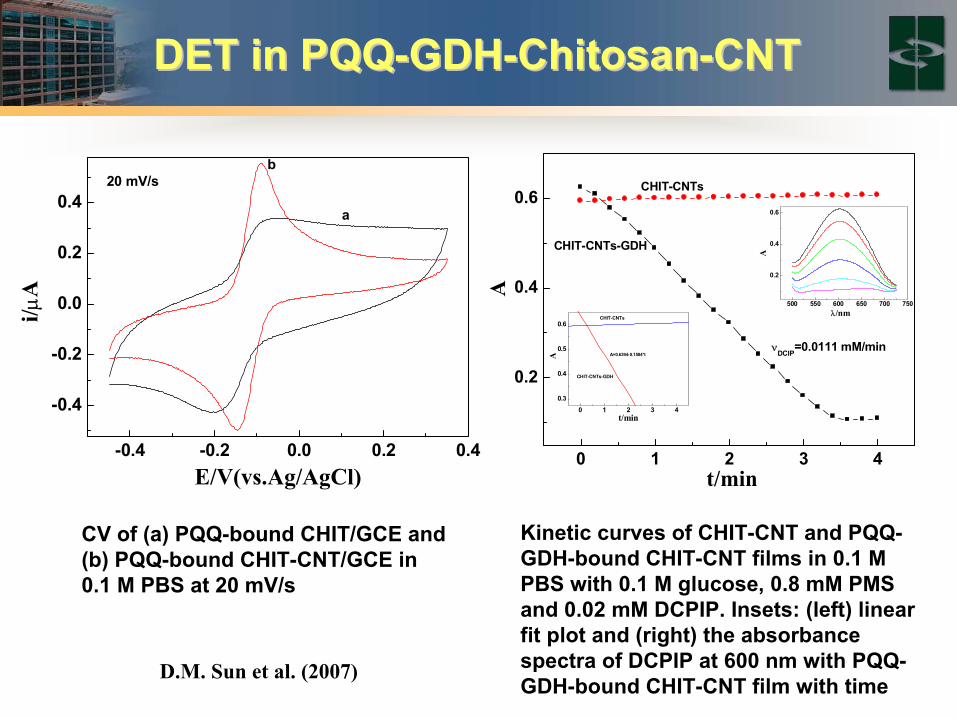
Kinetic curves of CHIT-CNT and PQQ-GDH-bound CHIT-CNT films in 0.1 M PBS with 0.1 M glucose, 0.8 mM PMS and 0.02 mM DCPIP. Insets: (left) linear fit plot and (right) the absorbance spectra of DCPIP at 600 nm with PQQ-GDH-bound CHIT-CNT film with time
500 550 600 650 700 750
0.2
0.4
0.6
0 1 2 3 40.3
0.4
0.5
0.6
0 1 2 3 4
0.2
0.4
0.6
A
λ/nm
A=0.6394-0.1584*t
CHIT-CNTs
CHIT-CNTs-GDH
A
t/min
νDCIP=0.0111 mM/min
CHIT-CNTs-GDH
CHIT-CNTs
At/min
CV of (a) PQQ-bound CHIT/GCE and (b) PQQ-bound CHIT-CNT/GCE in 0.1 M PBS at 20 mV/s
D.M. Sun et al. (2007)

Imaging Ellipsometry (IE)Imaging Ellipsometry (IE)
1) Locate region-of-interest 2) Real-time laser image
observation via CCD camera
3) Measurement of ∆ and Ψ in spatial distribution (600×400 µm)
Live microscopic laser contrast image( 600 × 400 µm )
Polypyrrole DepositionPolypyrrole Deposition
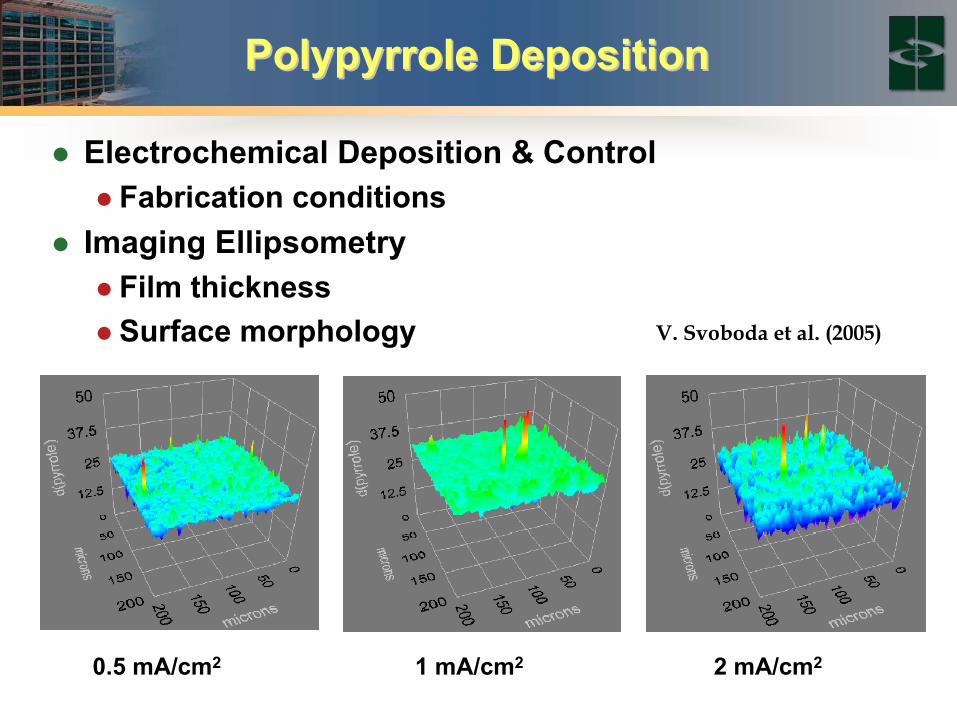
Electrochemical Deposition & ControlFabrication conditions
Imaging EllipsometryFilm thicknessSurface morphology
Nafion0.5 mA/cm2 1 mA/cm2 2 mA/cm2
V. Svoboda et al. (2005)
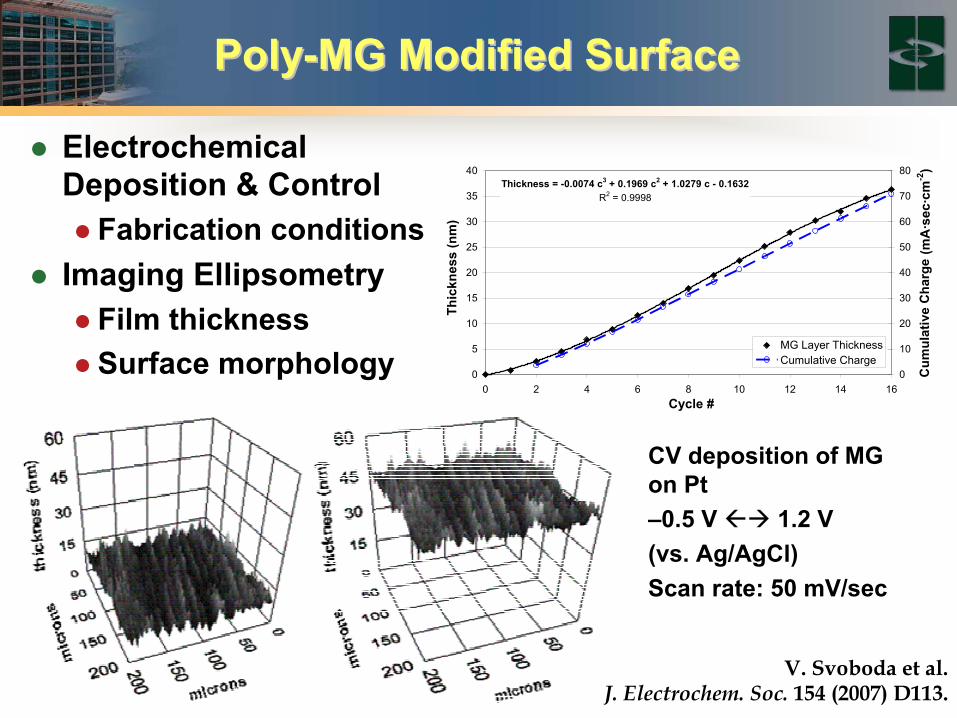
PolyPoly--MG Modified SurfaceMG Modified Surface
Nafion V. Svoboda et al. J. Electrochem. Soc. 154 (2007) D113.
Electrochemical Deposition & Control
Fabrication conditionsImaging Ellipsometry
Film thicknessSurface morphology
CV deposition of MG on Pt–0.5 V 1.2 V (vs. Ag/AgCl) Scan rate: 50 mV/sec
Thickness = -0.0074 c3 + 0.1969 c2 + 1.0279 c - 0.1632R2 = 0.9998
0
5
10
15
20
25
30
35
40
0 2 4 6 8 10 12 14 16Cycle #
Thic
knes
s (n
m)
0
10
20
30
40
50
60
70
80
Cum
ulat
ive
Cha
rge
MG Layer ThicknessCumulative Charge
(mA
·sec
·cm
-2)
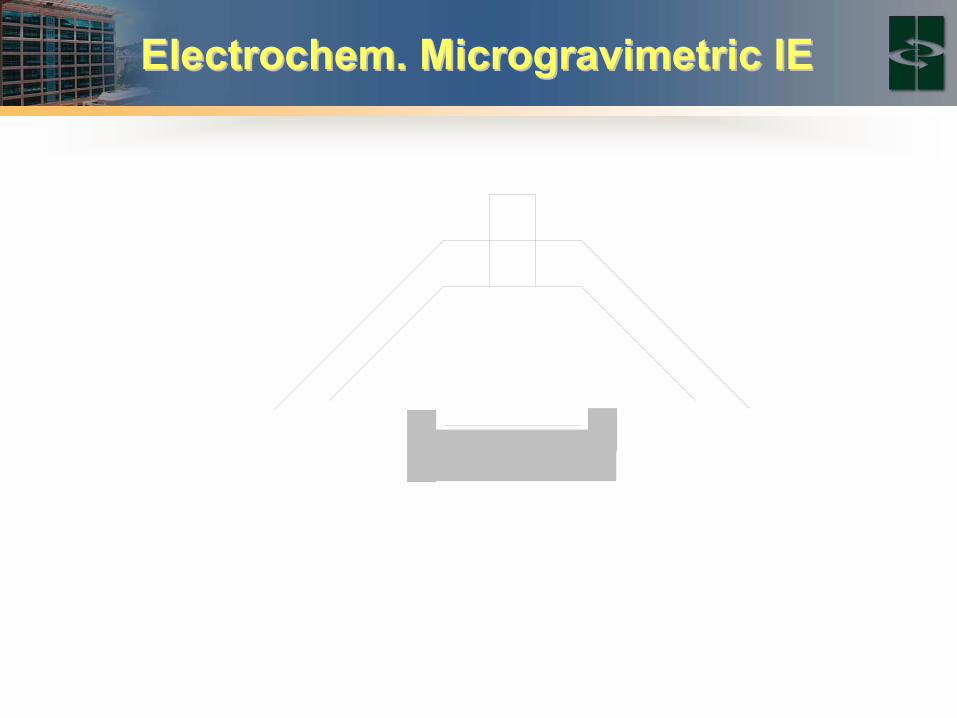
Electrochem. Microgravimetric IEElectrochem. Microgravimetric IE
WE onQCM
crystal
window
QCM crystal holder
window
Com
pens
ator
Pola
rizer
Laser source
ObjectiveAnalyzer
CCD detector
CE withdegassing channel
RE
QCMSolartron SI 1287
EP3 Imaging Ellipsometer
Maxtek
WE onQCM
crystal
window
QCM crystal holder
window
Com
pens
ator
Pola
rizer
Laser source
ObjectiveAnalyzer
CCD detector
CE withdegassing channel
RE
QCMSolartron SI 1287
EP3 Imaging Ellipsometer
Maxtek
QCM
EP3
CV
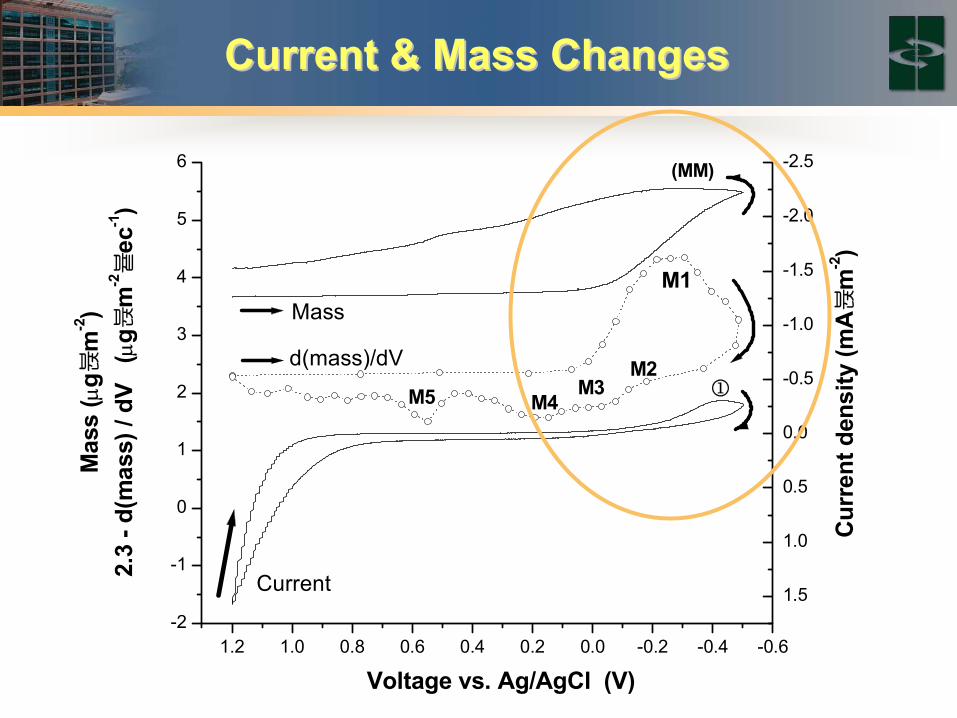
Current & Mass ChangesCurrent & Mass Changes
1.2 1.0 0.8 0.6 0.4 0.2 0.0 -0.2 -0.4 -0.6-2
-1
0
1
2
3
4
5
6
d(mass)/dV
Current
Mass
Mas
s (µ
gm뷵
-2)
2.3
- d(m
ass)
/ dV
(µ
gm뷵
-2ec븉
-1)
Voltage vs. Ag/AgCl (V)
1.5
1.0
0.5
0.0
-0.5
-1.0
-1.5
-2.0
-2.5
M2M5 M4
M3
(MM)
1
M1
Cur
rent
den
sity
(mA
m뷵
-2)
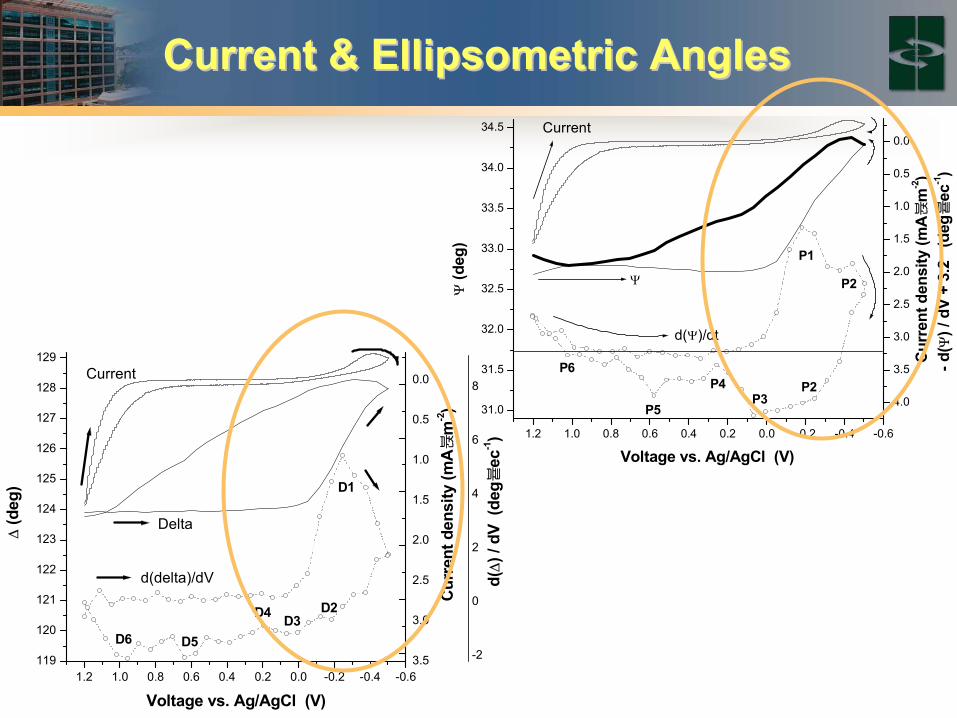
Current & Ellipsometric AnglesCurrent & Ellipsometric Angles
1.2 1.0 0.8 0.6 0.4 0.2 0.0 -0.2 -0.4 -0.6
31.0
31.5
32.0
32.5
33.0
33.5
34.0
34.5
P6P2P4
d(Ψ)/dt
P5P3
P2
P1
Ψ
Current
Ψ (d
eg)
Voltage vs. Ag/AgCl (V)
4.0
3.5
3.0
2.5
2.0
1.5
1.0
0.5
0.0
Cur
rent
den
sity
(mA
m뷵
-2)
- d(Ψ
) / d
V +
3.2
(de
gec븉
-1)
1.2 1.0 0.8 0.6 0.4 0.2 0.0 -0.2 -0.4 -0.6119
120
121
122
123
124
125
126
127
128
129
d(delta)/dV
Current
Delta
∆ (d
eg)
Voltage vs. Ag/AgCl (V)
3.5
3.0
2.5
2.0
1.5
1.0
0.5
0.0
D2D3
D6 D5
D4
D1
Cur
rent
den
sity
(mA
m뷵
-2)
-2
0
2
4
6
8
d(∆
) / d
V (d
egec븉
-1)
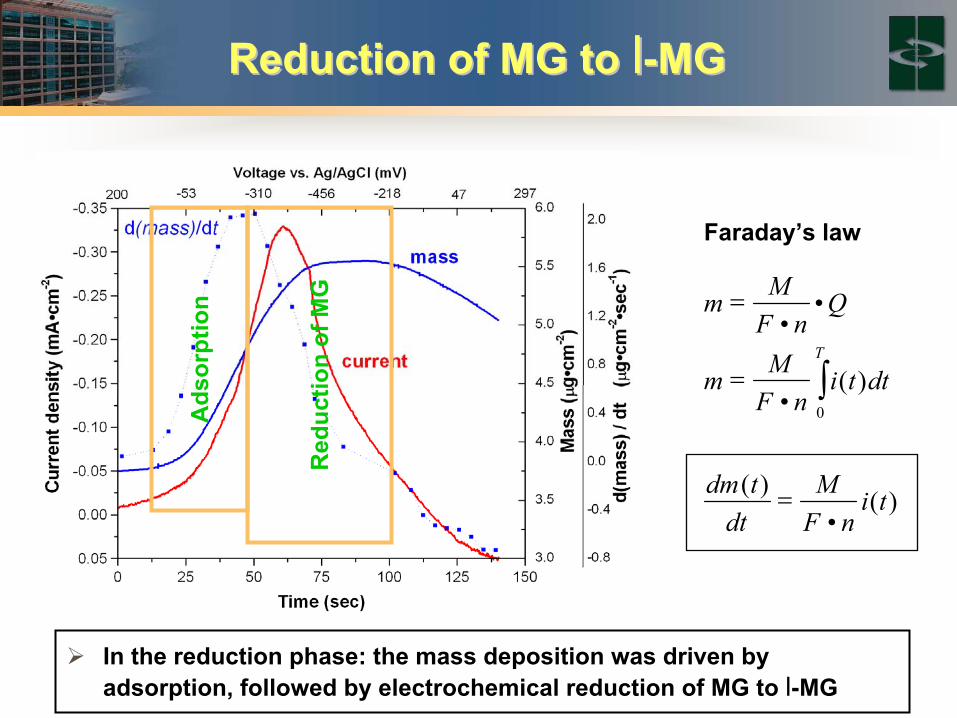
Reduction of MG to Reduction of MG to ll--MGMG
In the reduction phase: the mass deposition was driven by adsorption, followed by electrochemical reduction of MG to l-MG
Faraday’s law
)(•
)(
)(•
••
0
tinF
Mdttdm
dttinF
Mm
QnF
Mm
T
=
=
=
∫
Ads
orpt
ion
Red
uctio
n of
MG
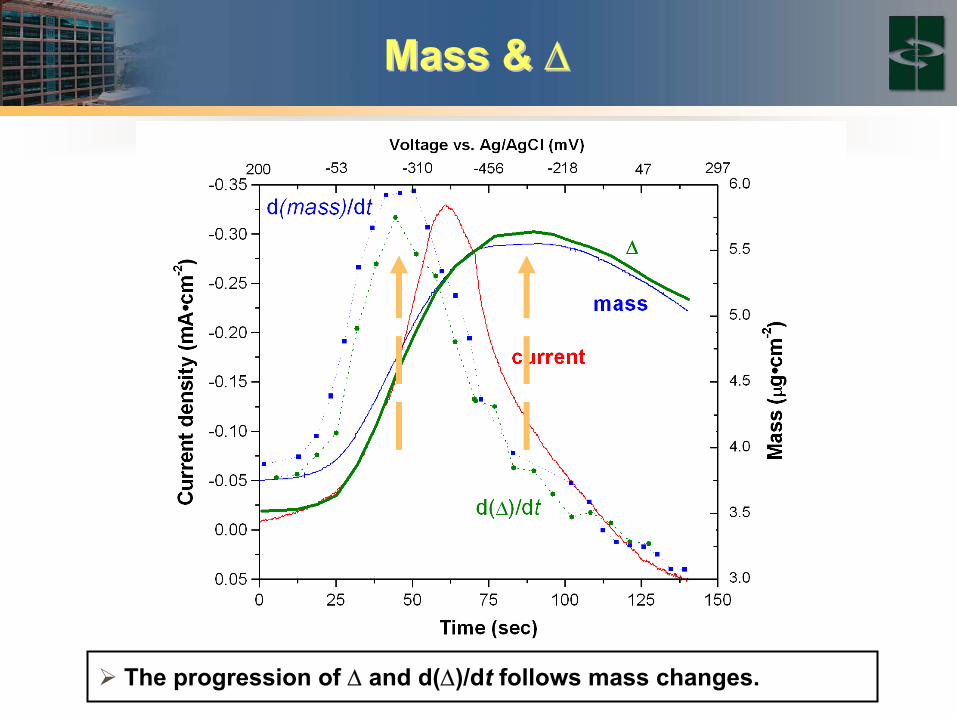
Mass & Mass & ∆∆
The progression of ∆ and d(∆)/dt follows mass changes.
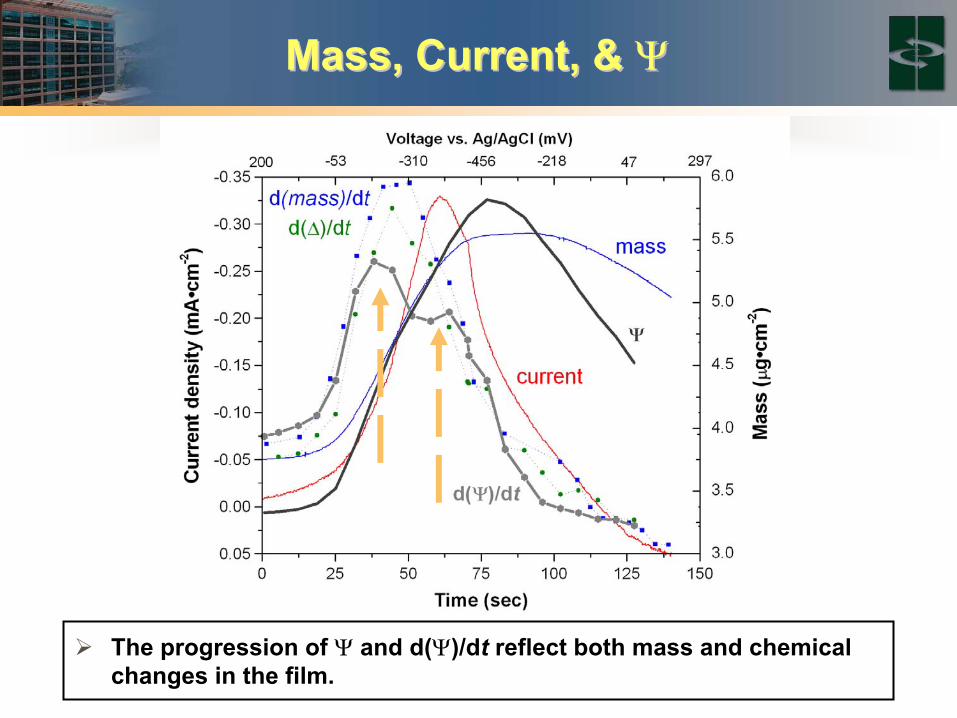
Mass, Current, & Mass, Current, & ΨΨ
The progression of Ψ and d(Ψ)/dt reflect both mass and chemical changes in the film.
ConclusionConclusion
Enzymatic bio-fuel cells need delicate optimization of electrode fabrication, which requires pore structure engineering, from macro- to meso-scale.Nano-material synthesis and electrode fabrication require in situ observations and non-intrusive characterizations of the process.Several intriguing in situ characterization techniques were demonstrated of their utility:
Fluorescence and polarizationImaging ellipsometry + QCM + Electrochem. tech.Microporometry
Dynamic transient observations mechanistic details

Thank you for your attention!Thank you for your attention!
AcknowledgementsAcknowledgements
Funding Support:ONR, Hawaii Environmental and Energy Technologies (HEET) initiative (R. Rocheleau, PI)DCI Postdoctoral Fellow Research ProgramAFOSR, MURI Program (P. Atanassov, PI)
Contributors:Faculty: Michael Cooney, David Jameson, Shelley MinteerPostdocs: Wayne Johnston, Forest Quinlan, Vojtech Svoboda, Stacey Konash, Dongmei Sun, Daniel ScottStudents: Chris Rippolz, Mona Windmeisser, Swati Nagpal, Ruey Hwu, Eric Brown
Related Documents