Real-time quantitative RT-PCR identifies distinct c-RET, RET/PTC1 and RET/PTC3 expression patterns in papillary thyroid carcinoma Kerry J Rhoden 1 , Chaline Johnson 2 , Guillerme Brandao 2 , John G Howe 3 , Brian R Smith 3 and Giovanni Tallini 2, * 1 JB Pierce Laboratory, Yale University School of Medicine, New Haven, CT, USA; 2 Department of Pathology, Yale University School of Medicine, New Haven, CT, USA and 3 Department of Laboratory Medicine, Yale University School of Medicine, New Haven, CT, USA RET/PTC1 and RET/PTC3 are the markers for papillary thyroid carcinoma. Their reported prevalence varies broadly. Nonrearranged c-RET has also been detected in a variable proportion of papillary carcinomas. The published data suggest that a wide range in expression levels may contribute to the different frequency of c- RET and, particularly, of RET/PTC detection. However, quantitative expression analysis has never been systematically carried out. We have analyzed by real-time RT-PCR 25 papillary carcinoma and 12 normal thyroid samples for RET/PTC1, RET/PTC3 and for RET exons 10–11 and 12–13, which are adjacent to the rearrangement site. The variability in mRNA levels was marked and four carcinoma groups were identified: one lacking RET/ PTC rearrangement with balanced RET exon levels similar to those of the normal samples (7/25 cases, 28%), the second (6/25 cases, 24%) with balanced RET expression and very low levels of RET/PTC1, the third with unbalanced RET exons 10–11 and 12–13 expression, high RET/PTC1 levels but no RET/PTC3 (7/25 cases, 28%), and the fourth with unbalanced RET expression, high RET/PTC1 levels and low levels of RET/PTC3 (5/25 cases, 20%). Papillary carcinomas with high RET/PTC1 expression showed an association trend for large tumor size (P ¼ 0.063). Our results indicate that the variability in c-RET and RET/PTC mRNA levels contributes to the apparent inconsistencies in their reported detection rates and should be taken into account not only for diagnostic purposes but also to better understand the role of c-RET activation in thyroid tumorigenesis. Laboratory Investigation (2004) 84, 1557–1570, advance online publication, 25 October 2004; doi:10.1038/labinvest.3700198 Keywords: RET; RET/PTC1; RET/PTC3; real-time quantitative RT-PCR; papillary thyroid carcinoma; RT-PCR variability Oncogenic c-RET activation in thyroid tumors composed of follicular cells is the result of chromo- somal rearrangements resulting in the fusion of the RET tyrosine-kinase (RET-TK) domain to the 5 0 - terminal region of heterologous genes. The rearran- gements are a molecular marker for papillary thyroid carcinoma as their very name, RET/PTC for papil- lary thyroid carcinoma, implies, 1 and consist of balanced inversions or translocations that involve the 3.0kb intron 11 of c-RET. To date, at least 16 chimeric mRNAs affecting 11 different genes have been reported (Saenko et al, 2 reviewed in Tallini and Asa 3 ), of which RET/PTC1 (consisting of the fusion of RET with H4) and RET/PTC3 (consisting of the fusion of RET with RFG/ELE1) are by far the most common. 3 Their prevalence varies broadly from zero to more than 60% in nonradiation-associated cases 3 and is close to 90% in some series of papillary carcinomas from the Chernobyl area diagnosed after the 1986 nuclear disaster. 4 While the high preva- lence of RET/PTC in radiation-associated thyroid tumors is consistent with misrepair of radiation- induced double-strand DNA breaks, 5,6 the high variability in the prevalence of RET/PTC in sporadic tumors has no specific explanation. In addition to rearranged RET forms, c-RET expression has also been identified in a highly variable proportion of papillary carcinoma samples. Although its signifi- Received 29 July 2004; revised and accepted 27 August 2004; published online 25 October 2004 Correspondence: Dr G Tallini, MD, Department of Pathology, Ospedale Bellaria, Via Altura 3, 40139 Bologna, Italy. E-mail: [email protected] *Dr Tallini’s current affiliation is with the University of Bologna School of Medicine, Bologna, Italy Laboratory Investigation (2004) 84, 1557–1570 & 2004 USCAP, Inc All rights reserved 0023-6837/04 $30.00 www.laboratoryinvestigation.org

Welcome message from author
This document is posted to help you gain knowledge. Please leave a comment to let me know what you think about it! Share it to your friends and learn new things together.
Transcript

Real-time quantitative RT-PCR identifiesdistinct c-RET, RET/PTC1 and RET/PTC3expression patterns in papillary thyroidcarcinoma
Kerry J Rhoden1, Chaline Johnson2, Guillerme Brandao2, John G Howe3, Brian R Smith3
and Giovanni Tallini2,*
1JB Pierce Laboratory, Yale University School of Medicine, New Haven, CT, USA; 2Department of Pathology,Yale University School of Medicine, New Haven, CT, USA and 3Department of Laboratory Medicine, YaleUniversity School of Medicine, New Haven, CT, USA
RET/PTC1 and RET/PTC3 are the markers for papillary thyroid carcinoma. Their reported prevalence variesbroadly. Nonrearranged c-RET has also been detected in a variable proportion of papillary carcinomas. Thepublished data suggest that a wide range in expression levels may contribute to the different frequency of c-RET and, particularly, of RET/PTC detection. However, quantitative expression analysis has never beensystematically carried out. We have analyzed by real-time RT-PCR 25 papillary carcinoma and 12 normal thyroidsamples for RET/PTC1, RET/PTC3 and for RET exons 10–11 and 12–13, which are adjacent to the rearrangementsite. The variability in mRNA levels was marked and four carcinoma groups were identified: one lacking RET/PTC rearrangement with balanced RET exon levels similar to those of the normal samples (7/25 cases, 28%), thesecond (6/25 cases, 24%) with balanced RET expression and very low levels of RET/PTC1, the third withunbalanced RET exons 10–11 and 12–13 expression, high RET/PTC1 levels but no RET/PTC3 (7/25 cases, 28%),and the fourth with unbalanced RET expression, high RET/PTC1 levels and low levels of RET/PTC3 (5/25 cases,20%). Papillary carcinomas with high RET/PTC1 expression showed an association trend for large tumor size(P¼ 0.063). Our results indicate that the variability in c-RET and RET/PTC mRNA levels contributes to theapparent inconsistencies in their reported detection rates and should be taken into account not only fordiagnostic purposes but also to better understand the role of c-RET activation in thyroid tumorigenesis.Laboratory Investigation (2004) 84, 1557–1570, advance online publication, 25 October 2004; doi:10.1038/labinvest.3700198
Keywords: RET; RET/PTC1; RET/PTC3; real-time quantitative RT-PCR; papillary thyroid carcinoma; RT-PCRvariability
Oncogenic c-RET activation in thyroid tumorscomposed of follicular cells is the result of chromo-somal rearrangements resulting in the fusion of theRET tyrosine-kinase (RET-TK) domain to the 50-terminal region of heterologous genes. The rearran-gements are a molecular marker for papillary thyroidcarcinoma as their very name, RET/PTC for papil-lary thyroid carcinoma, implies,1 and consist ofbalanced inversions or translocations that involvethe 3.0 kb intron 11 of c-RET. To date, at least 16
chimeric mRNAs affecting 11 different genes havebeen reported (Saenko et al,2 reviewed in Tallini andAsa3), of which RET/PTC1 (consisting of the fusionof RET with H4) and RET/PTC3 (consisting of thefusion of RET with RFG/ELE1) are by far the mostcommon.3 Their prevalence varies broadly from zeroto more than 60% in nonradiation-associated cases3
and is close to 90% in some series of papillarycarcinomas from the Chernobyl area diagnosed afterthe 1986 nuclear disaster.4 While the high preva-lence of RET/PTC in radiation-associated thyroidtumors is consistent with misrepair of radiation-induced double-strand DNA breaks,5,6 the highvariability in the prevalence of RET/PTC in sporadictumors has no specific explanation. In addition torearranged RET forms, c-RET expression has alsobeen identified in a highly variable proportion ofpapillary carcinoma samples. Although its signifi-
Received 29 July 2004; revised and accepted 27 August 2004;published online 25 October 2004
Correspondence: Dr G Tallini, MD, Department of Pathology,Ospedale Bellaria, Via Altura 3, 40139 Bologna, Italy.E-mail: [email protected]
*Dr Tallini’s current affiliation is with the University of BolognaSchool of Medicine, Bologna, Italy
Laboratory Investigation (2004) 84, 1557–1570& 2004 USCAP, Inc All rights reserved 0023-6837/04 $30.00
www.laboratoryinvestigation.org

cance is unclear, c-RET may also play a role inthyroid tumorigenesis.7–11
Analysis of the data published in the literaturesuggests a wide range in the expression levels ofRET/PTC and c-RET in tumor samples. This maycontribute more than geographical factors to thedifferences in the reported frequencies of c-RET and,particularly, of RET/PTC detection. However, quan-titative expression analysis has never been system-atically carried out. To this purpose, we haveanalyzed by real-time quantitative RT-PCR RNAextracted from both papillary carcinoma and normalthyroid samples for the expression of RET/PTC1 andRET/PTC3. We have also analyzed RET exons 10–11and 12–13 which are adjacent to the RET/PTCrearrangement site in c-RET intron 11. Thus, theprimers and probe set for c-RET exons 10–11identify nonrearranged c-RET only, whereas the setfor exons 12–13 identifies both c-RET and itsrearranged RET/PTC forms.
Materials and methods
Tissue Samples and Cell Lines
Thyroid samples were obtained from the Depart-ment of Pathology at the Yale University School ofMedicine. Excess fresh tissue from surgically re-sected specimens of thyroid tumors and perilesionalnormal thyroid samples were snap frozen and keptat �801C until RNA extraction. Pathologic materialin each case was reviewed and tumors wereclassified according to established criteria.12 BeforeRNA extraction, representative sections of thefrozen tissue were cut and examined histologicallyto confirm the adequacy of the sample, the diagnosisand to estimate the proportion of follicular cells vsstromal and inflammatory cells. The proportion offollicular cells in the perilesional samples of thenormal set was always greater than 80%. Onlytumor cases with at least 65% neoplastic follicularcells were included.
The cell lines utilized in the study were the TTmedullary thyroid carcinoma cell line (CRL-1803,American Type Culture Collection-ATCC, Manassas,VA, USA), the TPC1 thyroid follicular cell line,13 theARO undifferentiated thyroid carcinoma cell linetransfected with a RET/PTC3 construct,14 and themouse lymphoid line L1210 (Yale Cancer CenterTissue Culture Facility).
RNA Extraction and Quantitation
Frozen tissue sections and cell pellets from thecultured cells lines were incubated in 100 ml diges-tion buffer (0.01 M Tris pH 7.8, 0.005 M EDTA, 0.5%SDS) containing 2 mg of Proteinase K at 55oC over-night. RNA extraction was performed using Trizol(Invitrogen Corporation, Carlsbad, CA, USA) follow-ing the product insert instructions. The final RNA
pellet was resuspended in RNA Storage Solution(Ambion Inc., Austin, TX, USA). The RNA in thesolutions was DNAse treated using a DNA-free kit(Ambion Inc., Austin, TX, USA) following the insertinstructions. The DNAse-treated RNA was checkedand accurately measured using the RiboGreen RNAQuantitation kit (Molecular Probes, Inc, Eugene OR,USA). Fluorescence intensity was assessed with theCytofluor Series 4000 (Applied Biosystems, FosterCity, CA, USA).
Reverse Transcription
Total RNA was reverse transcribed to cDNA with theGeneAmp RNA PCR Core kit following the manu-facturer’s instructions (Applied Biosystems, FosterCity, CA, USA). Briefly, 1�PCR buffer II, 2.5 U/ml ofMuLV reverse transcriptase, 1 U/ml RNAase inhibi-tor, 5 mM MgCl2, 1 mM each dNTP and 2.5 mMrandom hexamers were incubated with the extractedtotal RNA for 10 min at 251C, for 60 min at 421C andfor 5 min at 951C with a PTC/200 thermocycler (MJResearch, Waltham, MA, USA). Unless otherwisespecified in the result section, 1mg of input RNA wasused to evaluate exons 10–11, 12–13, RET/PTC1 andRET/PTC3 mRNA expression in tissue samples.Negative controls were carried out in parallel byreplacing the RNA templates or the MuLV reversetranscriptase with DEPC water. cDNA reverse tran-scribed from the TPC1 cell line13 was used aspositive control for RET/PTC1 rearrangement. Thatobtained from the ARO cell line transfected with aRET/PTC3 construct14 was used as positive controlsfor RET/PTC3. RNA extracted from the medullarycarcinoma TT cell line was used as positive controlfor the amplification of c-RET exons 10/11 and12/13.
Primers and Probes
The primer and probe sequences are shown inFigure 1. They were custom designed using PrimerExpress software (Applied Biosystems, Foster City,CA, USA). The primer and probe set for c-RET exons10–11 identifies nonrearranged c-RET only, whereasthe set for exons 12–13 identifies both c-RET andits rearranged RET/PTC forms. The forward (nucleo-tides 274–288) and the reverse (nucleotides 318–339) primers as well as the probe (nucleotides290–316) for RET/PTC1 were based on the reportedNCBI database sequence accession numberM31213.1 The forward (nucleotides 670–688) andthe reverse (nucleotides 728–750) primers as well asthe probe (nucleotides 690–718) for RET/PTC3 werebased on the reported NCBI database sequenceaccession number X77548.15 The forward (nucleo-tides 1852–1867) and the reverse (nucleotides 1897–1913) primers as well as the probe (nucleotides1872–1895) for c-RET exons 10 and 11 were basedon the standard c-RET sequence (accession number
RET expression pattern in papillary carcinomaKJ Rhoden et al
1558
Laboratory Investigation (2004) 84, 1557–1570

X12949) with the numeration beginning from thestart codon of c-RET.16 The probe for c-RET exons10/11 spans the 10th intron of RET. The forward(nucleotides 2261–2277) and the reverse (nucleo-tides 2304–2324) primers as well as the probe(nucleotides 2279–2302) for c-RET exons 12 and 13were similarly designed with the RET exon 12/13probe spanning the 12th intron of RET. b-actin RNAwas used as a quantitative reference using primersand probes previously described.17 All primers weresynthetized by the program for Critical Technologiesin Molecular Medicine Laboratory (Department ofPathology, Yale University School of Medicine). Theprobes were synthetized by the Custom OligoSynthesis Service (Applied Biosystems, Foster City,CA, USA).
Real-Time Quantitative PCR
For real-time quantitative PCR, 50 ml aliquots con-tained 5 ml of the cDNA previously transcribed,1�TaqMan Universal PCR Master Mix (PE Applied
Biosystems, Foster City, CA, USA) and the opti-mized concentrations of primers and probes shownin Figure 1. Two-step PCR thermal cycling for DNAamplification and real-time data acquisition wereperformed with an ABI PRISM 7700 SequenceDetection System using the following cycle condi-tions: 501C for 2 min� 1 cycle, 951C for 10 min�1 cycle, and 951C for 15 s followed by 601C for1 min� 45 cycles. Each cDNA sample was assayedin triplicate. Negative cDNA controls (no cDNA orno MuLV reverse transcriptase, see above) werecycled in parallel with each run. Fluorescence datawere analyzed by the ABI7700 software and ex-pressed as Ct, the number of cycles needed togenerate a fluorescent signal above a predefinedthreshold. Baseline and threshold values were set bythe ABI7700 software.
Quantitation of Target Gene Expression
Target gene mRNA levels were expressed as 2�DCt
(normalized for b-actin) or 2�DDCt (normalized for
Figure 1 (a) Position of primers and probes relative to RET/PTC1, RET/PTC3 and c-RET. The primer and probe set for c-RET exons 10–11identifies nonrearranged c-RET only, whereas the set for exons 12–13 identifies both c-RET and its rearranged RET/PTC forms. Ex, exon.(b) Primer and probe sequences, optimized concentrations and amplicon sizes for RET/PTC1, RET/PTC3 and c-RET.
RET expression pattern in papillary carcinomaKJ Rhoden et al
1559
Laboratory Investigation (2004) 84, 1557–1570

b-actin and relative to a calibrator cell line) accord-ing to the equations derived by Livak and Schmitt-gen.18 The amount of target gene mRNA (XN),normalized to a reference gene, is given by theequation
XN ¼ Kð1þEÞ�DCt
where DCt is the difference in Ct values for the targetand reference genes, E is the efficiency of amplifica-tion and is assumed to be equal for target andreference genes, and K is a constant. If the efficiencyis close to one for both target and reference genes,then
XN ¼ K2�DCt
The value of K is unknown and depends on severalfactors including the reporter dye used in the probe,sequence context effects on the fluorescence proper-ties of the probe, the efficiency of probe cleavage,the purity of the probe and the setting of thefluorescence threshold.18 Each of these factors maydiffer between target and reference genes, andtherefore K may not necessarily equal 1. If K doesequal 1, then the normalized amount of target equals2�DCt . In order to allow a broad comparison of c-RETand RET/PTC gene expression levels in thyroidtissues, K was assumed to be 1 for all genes, andnormalized mRNA levels were expressed as 2�DCt
with respect to b-actin.The amount of target in a sample (q), normalized
to b-actin and relative to a calibrator (cb), is given bythe equation
XNq=XNcb ¼ 2�DDCt
where DDCt ¼ DCtq� DCtcb
. Relative levels of c-RETand RET/PTC mRNA in thyroid tissues wereexpressed as 2�DDCt using the TT cell line as thecalibrator for exons 10–11 and 12–13, the TPC1 cellline as the calibrator for RET/PTC1, and RET/PTC3-transfected ARO cells as the calibrator for RET/PTC3.
Validation of gene expression by the 2�DCt and2�DDCt method was achieved by preparing standardcurves for each gene using RNA extracted from TTcells (for exons 10–11 and 12–13), TPC1 (for RET/PTC1) and RET/PTC3-transfected ARO cells (forRET/PTC3). Efficiencies of amplification were closeto 1 for all genes (see Results), justifying theexpression of mRNA levels as 2�DCt and 2�DDCt
values.
Statistical Analysis
Intra-assay variability was assessed as the coeffi-cient of variance (CV) of Ct values measured intriplicate in a single run. Interassay variability wasassessed as the CV of mean Ct values measured on 3–10 independent runs performed on separate days.CVs were calculated as the standard deviationdivided by the mean and expressed as percent.
Differences between groups were analyzed by theMann–Whitney test for nonparametric data or byone-way ANOVA, with Po0.05 considered to besignificant.
Results
RET Exons 10–11, 12–13, RET/PTC1 and RET/PTC3mRNA Expression in Cell Lines
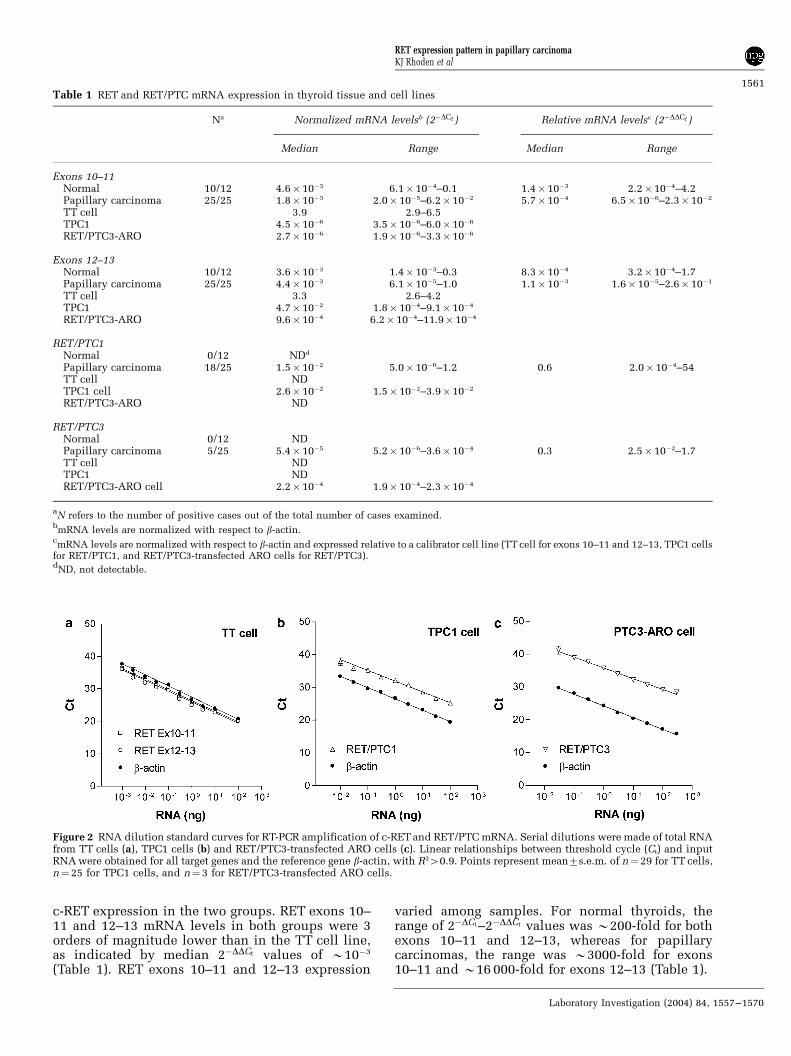
TT, TPC1 and RET/PTC3-transfected ARO cells wereused as controls for expression of RET (exons 10–11and 12–13), RET/PTC1 and RET/PTC3, respectively.As expected, rearranged RET forms were notdetected in TT cells. However, small amounts ofexons 10–11 were detected in TPC1 and RET/PTC3transfected ARO cells indicative of low c-RETexpression (Table 1). The control cell lines wereused to derive standard curves describing therelationship between Ct values and the amount ofinput RNA. Standard curves were also obtained forthe reference gene b-actin. For all genes studied, Ct
values were linearly related to input RNA with R2
values 40.9 (Figure 2). Efficiencies of amplification(defined as 10�1/slope�1) were always 40.95 andwere not significantly different from 1. To determinewhether the cellular environment influences theefficiency of amplification, standard curves werealso obtained by diluting each cell line expressing c-RET or RET/PTC in a background of nonexpressingmouse cells (L1210 cell line), and maintaining aconstant input of total RNA. Linear relationshipsbetween Ct values and cell number were obtainedfor all genes with R2 values 40.9 (Figure 3).Efficiencies of amplification were 0.99–1.05, withno difference in efficiencies derived by RNA dilu-tion vs those obtained by cell:cell dilution indicat-ing that the cellular environment does not affect theefficiency of amplification of RET exons 10–11 and12–13, RET/PTC1 and RET/PTC3.
The reproducibility of real-time RT-PCR measure-ments for each gene was evaluated on the respectivecontrol cell line. The intra-assay variability (%CV)of Ct values determined in triplicate within a singleanalytical run was consistently o2% for all genes.The interassay variability (%CV) of Ct valuesdetermined in separate analytical runs was 2.4%for exons 10–11 (n¼ 10), 2.5% for exons 12–13(n¼ 10), 2.0% for RET/PTC1 (n¼ 10), 0.4% for RET/PTC3, and 1.6% for b-actin (n¼ 10).
RET Exons 10–11, 12–13, RET/PTC1 and RET/PTC3mRNA Expression in Thyroid Tissue
RET exons 10–11 and 12–13 mRNA were detected inthe same 10 normal samples out of the 12 examinedand in all the 25 papillary carcinoma cases (Figure4a and b, Table 1). There was no difference betweennormal and neoplastic samples in median 2�DCt and2�DDCt values for RET exons 10–11 indicating similar
RET expression pattern in papillary carcinomaKJ Rhoden et al
1560
Laboratory Investigation (2004) 84, 1557–1570
c-RET expression in the two groups. RET exons 10–11 and 12–13 mRNA levels in both groups were 3orders of magnitude lower than in the TT cell line,as indicated by median 2�DDCt values of B10�3
(Table 1). RET exons 10–11 and 12–13 expression
varied among samples. For normal thyroids, therange of 2�DCt–2�DDCt values was B200-fold for bothexons 10–11 and 12–13, whereas for papillarycarcinomas, the range was B3000-fold for exons10–11 and B16 000-fold for exons 12–13 (Table 1).
Table 1 RET and RET/PTC mRNA expression in thyroid tissue and cell lines
Na Normalized mRNA levelsb (2�DCt ) Relative mRNA levelsc (2�DDCt )
Median Range Median Range
Exons 10–11Normal 10/12 4.6� 10�3 6.1� 10�4–0.1 1.4�10�3 2.2�10�4–4.2Papillary carcinoma 25/25 1.8� 10�3 2.0� 10�5–6.2�10�2 5.7�10�4 6.5�10�6–2.3�10�2
TT cell 3.9 2.9–6.5TPC1 4.5� 10�6 3.5� 10�6–6.0�10�6
RET/PTC3-ARO 2.7� 10�6 1.9� 10�6–3.3�10�6
Exons 12–13Normal 10/12 3.6� 10�3 1.4� 10�3–0.3 8.3�10�4 3.2�10�4–1.7Papillary carcinoma 25/25 4.4� 10�3 6.1� 10�5–1.0 1.1�10�3 1.6�10�5–2.6�10�1
TT cell 3.3 2.6–4.2TPC1 4.7� 10�2 1.8� 10�4–9.1�10�4
RET/PTC3-ARO 9.6� 10�4 6.2� 10�4–11.9�10�4
RET/PTC1Normal 0/12 NDd
Papillary carcinoma 18/25 1.5� 10�2 5.0� 10�6–1.2 0.6 2.0�10�4–54TT cell NDTPC1 cell 2.6� 10�2 1.5� 10�2–3.9�10�2
RET/PTC3-ARO ND
RET/PTC3Normal 0/12 NDPapillary carcinoma 5/25 5.4� 10�5 5.2� 10�6–3.6�10�4 0.3 2.5�10�2–1.7TT cell NDTPC1 NDRET/PTC3-ARO cell 2.2� 10�4 1.9� 10�4–2.3�10�4
aN refers to the number of positive cases out of the total number of cases examined.
bmRNA levels are normalized with respect to b-actin.
cmRNA levels are normalized with respect to b-actin and expressed relative to a calibrator cell line (TT cell for exons 10–11 and 12–13, TPC1 cells
for RET/PTC1, and RET/PTC3-transfected ARO cells for RET/PTC3).dND, not detectable.
Figure 2 RNA dilution standard curves for RT-PCR amplification of c-RET and RET/PTC mRNA. Serial dilutions were made of total RNAfrom TT cells (a), TPC1 cells (b) and RET/PTC3-transfected ARO cells (c). Linear relationships between threshold cycle (Ct) and inputRNA were obtained for all target genes and the reference gene b-actin, with R240.9. Points represent mean7s.e.m. of n¼29 for TT cells,n¼25 for TPC1 cells, and n¼ 3 for RET/PTC3-transfected ARO cells.
RET expression pattern in papillary carcinomaKJ Rhoden et al
1561
Laboratory Investigation (2004) 84, 1557–1570

RET/PTC1 was detected in 18/25 papillary carci-nomas cases, but in none of the normal thyroid cases(Figure 4c, Table 1). Median RET/PTC1 expressionin the positive papillary carcinoma cases was ofthe same order of magnitude as that measured inthe TPC1 cell line (2�DDCt ¼ 0:6, Table 1). However,RET/PTC1 mRNA expression varied widely, withB100 000-fold range in 2�DCt–2�DDCt values. In fact,two statistically distinct sets of cases could beidentified with 6/18 positive cases expressing lowRET/PTC1 levels (2�DCto10�3, or RET/PTC1 lessthan 0.1% of b-actin) and 12/18 positive casesexpressing high RET/PTC1 levels (2�DCt410�3, orRET/PTC1 greater than 0.1% of b-actin) (Po0.001,Mann–Whitney test). RET/PTC1 amplicons wereidentified by direct gel visualization and ethidiumbromide staining in 7/12 positive cases expressinghigh RET/PTC1 levels.
RET/PTC3 was detected in 5/25 papillary carci-noma cases, but in none of the normal thyroid cases(Figure 4d, Table 1). All five papillary carcinomacases expressing RET/PTC3 also had high levels(2�DCt410�3) of RET/PTC1. Median RET/PTC3 ex-pression in the positive papillary carcinomas wasof the same order of magnitude as that measuredin RET/PTC3-transfected ARO cells (2�DDCt ¼ 0:3,Table 1). RET/PTC3 mRNA expression varied overa 100-fold range for 2�DCt and 2�DDCt values. RET/PTC3 levels, normalized to b-actin (2�DCt ), weresimilar to RET/PTC1 levels in the set of papillary
carcinomas with low RET/PTC1 expression(2�DCto10�3, or less than 0.1% of b-actin) (Figure4c and d). RET/PTC3 amplicons were not identifiedby direct gel visualization and ethidium bromidestaining.
Balance of RET Exons 12–13 vs Exons 10–11Expression in Thyroid Tissue
In normal thyroid tissues, exons 12–13 mRNAexpression was linearly related to exons 10–11mRNA expression (Figure 5; R2¼ 0.99). The slopeof the linear regression line (0.98) was not signifi-
Figure 3 Cell dilution standard curves for RT-PCR amplificationof c-RET and RET/PTC mRNA. TT, TPC1 and RET/PTC3-transfected ARO cells were diluted in a background of L1210cells not expressing c-RET or its rearranged forms. Linearrelationships between threshold cycle (Ct) and cell number wereobtained for all target genes, with R240.9. Points representmean7s.e.m. of n¼ 4 for all cell lines.
Figure 4 Normalized mRNA levels in normal thyroid andpapillary carcinoma. mRNA levels for exons 10–11 (a), exons12–13 (b), RET/PTC1 (c) and RET/PTC3 (d) were measured innormal thyroid (N), papillary thyroid carcinoma (PC) andcalibrator cell lines (TT cells for exons 10–11 and 12–13; TPC1cells for RET/PTC1; RET/PTC3-transfected ARO cells for RET/PTC3). mRNA levels were normalized to b-actin and expressed as2�DCt . Points represent individual cases, and the bar representsthe median.
RET expression pattern in papillary carcinomaKJ Rhoden et al
1562
Laboratory Investigation (2004) 84, 1557–1570

cantly different from 1, confirming that exons 12–13mRNA expression reflects c-RET. In contrast, plot-ting exons 12–13 mRNA expression vs exons 10–11mRNA expression in papillary carcinomas demon-strated the presence of two distinct sets, one withbalanced expression of exons 10–11 and 12–13containing 13/25 cases, and one with an unbalancebetween RET exons 10–11 and 12–13 containing12/25 cases (Figure 5). The papillary carcinoma setwith balanced RET expression also exhibiteda linear relationship between exons 12–13 and10–11 mRNA expression (R2¼ 0.89, slope¼ 0.81),with no significant difference in the slope of thelinear regression line between it and normal thyroidcases. In contrast, the set with unbalanced RETexpression, failed to show a significant relationshipbetween exons 12–13 and 10–11 mRNA levels(R2¼ 0.32), and exhibited exon 12–13 expressionlevels higher than expected for a 1:1 relationshipbetween the two exons.
Exons 10–11 mRNA levels were similar inpapillary carcinomas with balanced and unbalancedRET, although there was a trend for lower exons 10–11 expression in the unbalanced samples (P¼ 0.081,Mann–Whitney test) (Figure 6a). In contrast, exons12–13 mRNA expression was significantly higher inthe unbalanced samples (Po0.0005, Mann–Whitneytest) (Figure 6b). RET/PTC1 mRNA was detected in6/12 cases with balanced RET expression (median2�DCt ¼ 2:3�10�5, or 0.002% RET/PTC1 relative to
b-actin), and in all cases with unbalanced RETexpression, with a significantly higher median 2�DCt
of 5.1� 10�2, or 5% RET/PTC1 relative to b-actin(Po0.001, Mann–Whitney test) (Figure 6c). RET/PTC3 mRNA was not detected in papillary carcino-mas with balanced RET expression but was detect-able in 5/13 of cases with unbalanced RET (median2�DCt ¼ 5:4�10�5, or 0.005% RET/PTC3 relative tob-actin) (Figure 6d).
Thus, papillary carcinoma with and withoutbalanced RET expression differ in RET/PTC levels.Tumors with balanced RET expression are charac-terized by low expression of exons 12–13 mRNA,low or no RET/PTC1 mRNA and no RET/PTC3mRNA. Those with unbalanced RET expressionexhibit higher levels of exons 12–13 and RET/PTC1 mRNA, and in some cases may also expressRET/PTC3 mRNA. Of note, the two papillarycarcinoma sets identified by examining the relation-ship between RET exons 10–11 and 12–13, corre-spond to the two distinct clusters identifiedpreviously as cases with low and high RET/PTC1mRNA levels. The balanced set corresponds to those
Figure 5 Relationship between exons 10–11 and 12–13 mRNAexpression in normal thyroid and papillary carcinoma (PC) withbalanced and unbalanced RET exons 10–11 vs 12–13 expression.mRNA levels were normalized to b-actin and expressed as 2�DCt .Data points represent individual cases. The dotted line representsthe linear regression line for normal thyroid tissue (R2¼ 0.99),with a slope of 0.98.
Figure 6 Normalized mRNA levels in papillary carcinoma withbalanced and unbalanced RET exons 10–11 vs 12–13 expression.mRNA levels for exons 10–11 (a), exons 12–13 (b), RET/PTC1 (c)and RET/PTC3 (d) were normalized to b-actin and expressed as2�DCt . Points represent individual cases and the bar represents themedian of positive cases.
RET expression pattern in papillary carcinomaKJ Rhoden et al
1563
Laboratory Investigation (2004) 84, 1557–1570

cases having 2�DCt RET/PTC1 values lower than10�3, whereas the unbalanced set corresponds tothose cases having 2�DCt values higher than 10�3.
Effect of Input RNA on the Detection Limit forRET/PTC1 and RET/PTC3 in Tissue Samples
In order to determine the minimum amount of inputRNA required to detect RET/PTC mRNA in papillarycarcinoma samples, RNA dilutions were preparedfrom 10 papillary carcinoma cases with unbalancedexons 12–13 vs 10–11 expression, that is, casesdisplaying high levels of RET/PTC1 mRNA. Asillustrated in Figure 7a, RET/PTC1 mRNA wasdetected in 10/10 cases using an input of 1 mgRNA, 9/10 cases with 100 ng input RNA, 7/10 caseswith 10 ng input RNA, 4/10 cases with 1 ng inputRNA and 1/10 cases with 0.1 ng input RNA. Of the10 cases examined, four also expressed RET/PTC3mRNA. RET/PTC3 mRNA was detected in 4/4 casesusing an input of 1 mg RNA, 1/10 cases with 100 nginput RNA and none at further dilutions (Figure 7b).
Proportion of RET and RET/PTC Producing Cells inPapillary Carcinoma as TT, TPC1 or RET/PTC3-Transfected ARO Cell Equivalents
The amount of RET and RET/PTC mRNA inpapillary carcinoma samples was compared tostandard curves (Figure 3) derived by diluting c-RET-, RET/PTC1- and RET/PTC3-expressing cells (ieTT cells, TPC1 cells or RET/PTC3-transfected AROcells) in a background of nonexpressing cells(L1210). This allows an estimate of the proportionof positive cells in tumor samples as TT, TPC1 orRET/PTC3-transfected ARO cell equivalents. The
expression levels of papillary carcinoma samples interms of cell equivalents are shown in Figure 8.Thus, median cell equivalents are 1:100 000-TT:L1210 cells for exons 10–11 mRNA, 1:20 000-TT:L1210 cells for exons 12–13 mRNA, 1:600-TPC1:L1210 cells for RET/PTC1 mRNA, and1:1000-RET/PTC3-transfected ARO:L1210 cells forRET/PTC3 mRNA. However, direct comparisons ofcell equivalents between RET and its rearrangedforms are not possible since each cell line producesdifferent amounts of target gene. In fact, whennormalized to b-actin levels, RET/PTC3 expression
Figure 7 Effect of input RNA amount on detection of RET/PTCmRNA expression in PC. mRNA levels of RET/PTC1 (a) and RET/PTC3 (b) were normalized to b-actin and expressed as 2�DCt .Points represent individual cases and the bar represents themedian of positive cases. Numbers in brackets represent thenumber of cases in which mRNA was detected at each RNAdilution out of 10 cases analyzed.
Figure 8 Cell equivalents for mRNA expression in papillarycarcinoma with RET/PTC rearrangements. Cell equivalents forexons 10–11 (a), exons 12–13 (b), RET/PTC1 (c) and RET/PTC3 (d)are expressed as the ratio of calibrator cells (TT, TPC1 or RET/PTC3-transfected ARO cells) to L1210 mouse cells. TT, TPC1 orRET/PTC3-transfected ARO cell equivalents were estimated fromcell dilution standard curves (see Figure 3). Data are representedas individual data points for all papillary carcinoma cases, andbox and whiskers for papillary carcinomas with balanced (B) andunbalanced (U) RET exons 10–11 vs 12–13 expression. Boxesextend from the 25th to 75th percentile, bars within boxesrepresent the median, and whiskers reflect the range.
RET expression pattern in papillary carcinomaKJ Rhoden et al
1564
Laboratory Investigation (2004) 84, 1557–1570

by transfected ARO cells is B100 times lower thanRET/PTC1 expression by the TPC1 cell line andB10 000 times lower than c-RET expression by TTcells (Figure 4).
As seen with the mRNA data normalized to b-actin (2�DCt values), cell equivalent expression ofRET and RET/PTC also showed wide variability.RET/PTC1 expression in terms of TPC1 cell equiva-lents revealed two distinct sets, one with a lowexpression of RET/PTC1 mRNA corresponding to acell dilution greater than 1:10 000 cells (median1:60 000-TPC1:L1210 cell equivalents), and theother with a high expression of RET/PTC1 corre-sponding to a cell dilution lower than 1:10 000 cells(median 1:100-TPC1:L1210 cell equivalents)(Po0.001, Mann–Whitney test). The cases in thesetwo sets are the same as those in the previouslyidentified clusters characterized by balanced RETexpression with low RET/PTC1 mRNA levels, andunbalanced RET expression with high RET/PTC1.
RET and RET/PTC Expression Groups and Correlationwith Clinicopathologic Features in PapillaryCarcinoma
In summary, quantitative analysis of RET and RET/PTC expression demonstrates four groups of papil-
lary carcinomas of comparable numerical size. Onegroup is characterized by the lack of RET/PTCrearrangement, and RET exons 10–11 and 12–13levels similar to those observed in the normalsamples. This group includes 7/25 cases (28%)(Table 2). The second group (6/25 cases or 24%,Table 2) also has RET expression similar to those ofthe normal samples, with balanced exons 10–11 and12–13. However, it expresses RET/PTC1 at a lowlevel in terms of b-actin normalization (2�DCto10�3,or RET/PTC1 less than 0.1% of b-actin, Figure 6c) aswell as in terms of TPC1 cell equivalents (RET/PTC1corresponding to dilutions greater than one TPC1cell in 10 000 nonrearranged cells Figure 8c). Thethird and fourth groups include cases with unba-lanced RET expression (Figure 5). These cases arecharacterized by higher RET/PTC1 in terms of b-actin normalization (2�DCt410�3, or RET/PTC1greater than 0.1% of b-actin, Figure 6c) as well asin terms of TPC1 cell equivalents (RET/PTC1corresponding to dilutions lower than one TPC1cell in 10 000 nonrearranged cells Figure 8c). Thethird and fourth groups differ only with respect toRET/PTC3, which is absent in the third but presentin the fourth (Figure 6d). They include 7/25 (28%)and 5/25 (20%) cases, respectively (Table 2).
All tumors were clinically evident with a medianpercentage of neoplastic follicular cells vs stromal
Table 2 Correlation of clinicopathologic features with RET and RET/PTC mRNA expression
Age Sexa Papillary carcinoma type Tumor size(cm)
Neoplasticfollicular cells
(%)b
Stage atdiagnosisc
UnbalancedRET expression
RET/PTC1(2�DCt )d
RET/PTC3(2�DCt )d
34 F Follicular variant 3.5 85 T2N0M0-I No 0 042 M Classic 1.5 80 T3N1bM0-I No 0 040 F Follicular variant 1.4 65 T1N0M0-I No 0 029 F Follicular variant 3.3 75 T2N0M0-I No 0 047 F Classic 1.2 70 T1N0M0-I No 0 031 F Classic 3 85 T2N0M0-I No 0 025 F Classic 1.8 70 T1N0M0-I No 0 044 F Classic 2.4 85 T2N0M0-I No 4.9� 10�6 058 M Follicular variant 3.8 80 T3N0M0-III No 5.5� 10�5 044 F Follicular variant 1.2 85 T1N0M0-I No 7.2� 10�6 047 M Classic 3 75 T2N1bM0-IVA No 3.9� 10�5 025 M Classic 4 80 T3N0M0-I No 6.8� 10�5 050 F Classic 5 75 T3N1aM0-III No 5� 10�6 041 M Follicular variant 2.5 80 T2N0M0-I Yes 6.0� 10�2 020 M Follicular variant 3 85 T2N0M0-I Yes 6.4� 10�2 09 M Diffuse sclerosing 5 80 T3N1aM0-I Yes 1.2� 10�2 0
26 F Classic 3 75 T2N0M0-I Yes 1.2 064 F Classic 4.5 80 T3N1bM0-III Yes 2.1� 10�2 075 F Classic 4.2 75 T3N1bM0-III Yes 5.3� 10�2 042 F Follicular variant 4.5 80 T3N0M0-I Yes 1.8� 10�3 050 F Follicular variant 3.8 85 T3N0M0-III Yes 4.8� 10�2 1.8�10�5
44 F Classic 4.5 65 T3N0M0-I Yes 2.8� 10�3 3.6�10�4
44 F Follicular variant 4.9 85 T3N0M0-I Yes 1.2� 10�1 8.7�10�5
35 F Classic 2.5 80 T3N1aM0-I Yes 8.8� 10�2 5.4�10�5
45 F Classic 1.2 65 T1N0M0-1 Yes 1.6� 10�2 5.2�10�6
aF, female patient; M, male patient.
bThe proportion of neopalstic follicular cells vs stromal and inflammatory cells was estimated on representative histology sections of the tissue
selected for RNA extraction.cAJCC, 2002.
dRET/PTC1 and RET/PTC3 values are normalized to b-actin and expressed as 2�DCt .
RET expression pattern in papillary carcinomaKJ Rhoden et al
1565
Laboratory Investigation (2004) 84, 1557–1570

and inflammatory cells of 80%. Median tumor sizewas 3.5 cm in cases with high RET/PTC1 expression(third and fourth papillary carcinoma groups),2.7 cm in cases with low RET/PTC1 (second papil-lary carcinoma group) and 1.5 cm in cases with noRET/PTC1 (first papillary carcinoma group). Thissuggests that tumor sizes may parallel RET/PTC1expression levels, although the difference did notreach statistical significance (P¼ 0.063, one-wayANOVA). Expression levels of RET or of its rear-ranged forms did not correlate with the papillarycarcinoma type, presence of lymph node metastasisor tumor stage.
Discussion
The prevalence of RET/PTC1 and RET/PTC3 re-ported in sporadic papillary carcinoma, variesbroadly and the reason for this variability is unclear.The existence of a geographic factor is shown bycomparing the prevalence of RET/PTC activation indifferent studies of nonradiation-associated papil-lary carcinomas, all of which have utilized compar-able techniques (ie RT-PCR followed byhybridization of the amplified products with RETspecific probes to detect RET/PTC)19–23 and by theobservation of regional variability within one coun-try in samples analyzed by the same laboratory.24
This points to the putative existence of unknownenvironmental agents favoring RET rearrangementand to the role of genetic susceptibility for papillarycancer.25 However, much of the difference in theprevalence of RET/PTC activation appears to berelated to the technique used to detect the rear-ranged DNA or RNA. The most common techniquesinclude Southern blotting, direct gel visualization ofthe RT-PCR amplicons and hybridization of blottedRT-PCR products. Meta-analysis of the data pub-lished worldwide over a greater than 10-year period(Table 3) demonstrates an average prevalence of18% for Southern blotting (67/370 cases tested,range 0–33%),26–31 15% for direct visualization ofthe RT-PCR amplicons (47/309 cases tested, range4–45%)7,32–35 and 48% for hybridization of blottedRT-PCR products (153/314 cases tested, range0–85%).4,21–23,36–39 Allowing for the fact that South-ern blotting permits the identification of allRET/PTC variants while the cases analyzed by RT-PCR listed above only screened the tumors forRET/PTC1, -2 and -3, there is a good correspondencebetween the sensitivity of Southern blotting and ofdirect gel visualization of RT-PCR products, as alsodemonstrated by parallel analysis of the samesamples with the two methods.44 When RT-PCR isfollowed by blotting of the amplicons and hybridi-zation with RET-specific probes the sensitivityincreases dramatically, by at least 100-fold accord-ing to some investigators.11 This is not only reflectedin the meta-analysis of the world literature but bythe higher rate of RET/PTC detected in the same
laboratory when direct gel visualization was re-placed by hybridization of blotted RT-PCR products(5% compared with 61%),23,45 or by the increase inthe proportion of positive cases from 4 to 76% intwo similar series from the same country.7,37 In fact,even accounting for different amplification efficien-cies of the PCR primers, technical details thatincrease the sensitivity of the methodology such asblotting larger amounts of RT-PCR product beforehybridization, result in an increased RET/PTCdetection rate.37 Although some increase in RET/PTC detection rate due to any combination of factorswhich affect sensitivity is certainly expected, theextent of such an increase23,45 is surprising andpoints to a wide range of RET/PTC expression inpapillary carcinoma.
A number of studies have noted expression ofc-RET in papillary thyroid carcinoma tumor sam-ples.7–11 Wild-type RET may coexist with RET/PTC9,10 and it has been proposed as a marker foraggressive disease.10 Similar to RET/PTC, c-RETmRNA has been reported in a variable proportion ofpapillary carcinomas with frequencies ranging from21%10 to 100%.8,9
To address the issue of the expression level of RETand its rearranged forms in thyroid papillarycarcinoma we have utilized real-time RT-PCR andquantitatively analyzed high-quality RNA extractedfrom frozen samples for the expression of RET/PTC1, RET/PTC3 and RET exons 10–11 and 12–13,which are adjacent to the RET/PTC rearrangementsite. RET/PTC1 was detectable in 18/25 (72%)papillary carcinomas. RET/PTC3 coexisted withRET/PTC1 in 5/25 (20%) tumors. Exons 10–11mRNA, indicative of c-RET expression, were detect-able in all the papillary carcinomas and in 10/12(83%) normal thyroids. Our results indicate aremarkable variability in mRNA levels. The varia-bility is highest for RET/PTC1. It is also significantfor c-RET and RET/PTC3 and it is not accounted forby the proportion of follicular cells in the samplesanalyzed. In fact, the range for the proportion ofneoplastic follicular cells in tumor samples waswithin one order of magnitude and overlapped withthat of the normal cases.
Statistical analysis of the quantitative data showsfour groups of papillary carcinomas of similar size.One lacks RET/PTC rearrangement and has normal-ized RET exons 10–11 and 12–13 levels similar tothose observed in the non-neoplastic samples. Thesecond group exhibits minimal expression of RET/PTC1. RET/PTC1 expression in this group is at least10 000 times lower as compared with b-actin,corresponds to a dilution of RET/PTC1 positiveTPC1 cells greater than one in 10 000 nonrearrangedcells, and it is so low that it is not associated withdetectable unbalance between normalized RETexons 10–11 and 12–13 levels. In the thirdand fourth carcinoma groups RET exons 10–11 and12–13 expression is clearly different from thenormal samples and from the carcinoma groups
RET expression pattern in papillary carcinomaKJ Rhoden et al
1566
Laboratory Investigation (2004) 84, 1557–1570

one and two. The RET exons expression pattern isunbalanced, as expected in the case of RET/PTCrearrangement. Cases are characterized by high RET/PTC1 expression compared to the second carcinomagroup both in terms of normalized RET/PTC1 levelsand TPC1 cell equivalents. The third and fourthgroups differ only with respect to RET/PTC3, whichis absent in the third but present in the fourth. Ofnote, RET/PTC3 levels in the fourth group are lowand of the same order of magnitude as RET/PTC1levels in the second carcinoma group.
RET/PTC1 in this study was identified by directgel visualization and ethidium bromide staining inonly a proportion of our cases with high-levelexpression. The prevalence of RET/PTC1 identifiedby direct gel visualization is within the range of thatreported in the literature. However, the majority ofthe RET/PTC1 rearranged cases and all of the RET/PTC3 rearrangements could only be identified withthe TaqMan assay, confirming its superior sensitiv-ity compared with the conventional solution phaseRT-PCR.42 The overall high prevalence of RET/PTC
Table 3 Prevalence of RET/PTC in sporadic papillary thyroid carcinoma in different series
Country Detection method Positive/tested Reference
Japan Southern blot 0/22 (0%) Namba et al, 199126
Japan Southern blot 1/38 (2.6%) Wajjwalku et al, 199227
USA Southern blot 4/36 (11%) Jhiang et al, 199228
USA Southern blot 11/65 (17%) Santoro et al, 199229
France Southern blot 8/70 (11%) Santoro et al, 199229
Italy Southern blot 14/42 (33%) Santoro et al, 199229
Portugal Southern blot 8/33 (24%) Soares et al, 199830
Italy Southern blot, extra-long PCR transfectionassay, RT-PCR (ethidium bromide staining)
21/64 (33%) Bongarzone et al, 199831
Australia RT-PCR (ethidium bromide staining) andsequencing
2/47 (4.2%) Learoyd et al, 19987a
Taiwan RT-PCR (ethidium bromide staining) andsequencing
6/11 (54.5%) Lee et al, 199832a
Germany RT-PCR (ethidium bromide staining) andsequencing
8/99 (8%) Mayr et al, 199833a
Germany RT-PCR (ethidium bromide staining) andsequencing
16/119 (13%) Musholt et al, 200034a
USA RT-PCR (Syber Green or silver staining) andsequencing
15/33 (45%) Fenton et al, 200035a
Japan RT-PCR followed by hybridization of theamplification products
1/11 (9%) Ishizaka et al, 199119b
Saudi Arabia RT-PCR followed by hybridization of theamplification products
1/40 (3%) Zou et al, 199420b
USA RT-PCR followed by hybridization of theamplification products
11/17 (65%) Nikiforov et al, 19974a
USA RT-PCR followed by hybridization of theamplification products
16/28 (57.1%) Tallini et al, 199822a
Canada RT-PCR followed by hybridization of theamplification products
51/84 (61%) Sugg et al, 199823a
Japan RT-PCR followed by hybridization of theamplification products
7/19 (37%) Motomura et al, 199821a
Korea RT-PCR followed by hybridization of theamplification products
0/24 (0%) Park et al, 199836a
Australia RT-PCR followed by hybridization of theamplification products
17/20 (85%) Chua et al, 200037a
New Caledonia RT-PCR followed by hybridization of theamplification products
19/27 (70%) Chua et al, 200037a
Italy RT-PCR followed by hybridization of theamplification products
19/47 (40%) Elisei et al, 200138a
Italy RT-PCR followed by hybridization of theamplification products
13/48 (27%) Puxeddu et al, 200339a
UK Nested RT-PCR 23/43 (54%) Williams et al, 199640c
Italy, France Interphase FISH 13/69 (19%) Cinti et al, 200041
Ireland TaqMan RT-PCR 12/50 (24%) Sheils et al, 200042b
Ireland TaqMan RT-PCR after laser capturemicrodissection
18/28 (64%) Finn et al, 200343d
aRET/PTC-1, -2, -3.
bRET/PTC1 only.
cNested RT-PCR for the RET tyrosine kinase domain only.
dRET/PTC-1, and -3.
Note: radiation-associated tumors present in some of the series have been excluded from the computation.
RET expression pattern in papillary carcinomaKJ Rhoden et al
1567
Laboratory Investigation (2004) 84, 1557–1570

in this study is thus consistent with the use of real-time RT-PCR technology, of high-quality RNAextracted from frozen tissue and accurately quanti-fied, and with the high median proportion ofneoplastic follicular cells in the samples analyzed.It is also in line with results obtained afterhybridization of blotted RT-PCR products, althoughpapillary carcinomas with low RET/PTC levels mayescape detection even after RET hybridization ofblotted RET/PTC amplicons.37
The highly variable expression of RET/PTC intumor samples explains the increase in RET/PTC1detection rate which parallels modifications toenhance the sensitivity of the methodology usedfor its detection.23,37,43 It is also consistent with thedrop in the RET/PTC detection rate that occurs asthe amount of input RNA is decreased.
The existence of papillary carcinomas with verylow RET/PTC expression, the identification ofwhich is highly dependent on any combination offactors that affect sensitivity, explains to a greatextent the variation in RET/PTC prevalence rates.Furthermore, the existence of quantitative variationin the expression levels should be taken intoaccount to investigate the correlation of RET/PTCwith clinical findings. Critical review of the dataavailable in the literature still indicates that RET/PTC has no definite role in the progression ofthyroid carcinoma to aggressive forms of cancerand may indeed identify a subset of tumors withbetter outcome.34 However, it is possible thatquantitative analysis may disclose new correlationswith clinical or pathologic features, as suggested bythe association trend between high RET/PTC1 levelsand tumor size in this small series. The biologicalrelevance of RET/PTC rearrangements expressed atvery low levels is also unclear. It is possible that incertain tumors the rearranged RET forms areparticularly unstable or that the rearrangement isonly present in a subset of the neoplastic cells.Regardless, it is reasonable to question the relevanceof RET/PTC1 when the rearrangement is present atlevels equivalent to less than one RET/PTC1-positive TPC1 cell in 10 000 nonrearranged cells.
The presence of low-level RET/PTC3 mRNA wasidentified in a subset of cases. The coexistence ofRET/PTC1 and RET/PTC3 rearrangements is knownto occur in papillary carcinoma.22,23,37,43 In fact, thepresence of more than two different RET rearrange-ments in a single tumor indicates multiple RET/PTCrearranged clones in at least some papillary carci-nomas.37 Since RET/PTC3 is only expressed at lowlevels in tumor cases with high RET/PTC1 expres-sion, RET/PTC3 rearrangement appears to be asecondary phenomenon possibly due to the pre-sence of minor neoplastic cell clones. Given theassociation, it is tempting to speculate that RET/PTC1 may even predispose the neoplastic cell toacquire the second RET rearrangement. RET/PTC3without RET/PTC1 coexpression is frequently de-tected in tall cell papillary carcinoma, but it is
uncommon in other types of papillary cancer. Tallcell papillary carcinoma is a rare but aggressivepapillary carcinoma variant.12 The higher mitogeniceffects of RET/PTC3 compared with RET/PTC1 haveindeed been postulated as the molecular basis forthe aggressive biologic behavior of tall cell papillarycarcinoma.46 However, none of our cases hadmorphologic findings to justify such a diagnosisand none expressed high RET/PTC3 levels. In fact,tumors with both RET/PTC3 and RET/PTC1 rear-rangements did not exhibit any particular clinico-pathologic feature.
Our study demonstrates that c-RET is detectablein all papillary carcinomas to a level comparablewith that of normal thyroid parenchyma. Theexpression level is variable, particularly amongtumor samples, explaining the apparent inconsis-tency of the reported detection rates.8–10 The levelsof c-RET expression are in any case B1000 timeslower when compared to the control TT medullarycarcinoma cell line. The expression level of RETexons 12–13 in individual cases is statisticallyhigher relative to that of exons 10–11 only in thosecases which express high levels of rearranged RET.This fully validates the use of methodologies thatrely on the unbalance in the expression of RETexons adjacent to the RET/PTC breakpoint in c-RETintron 11, although the variability in the relativeRET exon unbalance calls for great caution in thevisual interpretation of gels or of hybridized of blotsof RT-PCR products. The presence of detectableexons 10–11 mRNA even in those cases with highRET/PTC1 expression indicates that both c-RET andrearranged RET forms coexist in papillary carcinomasamples. The source of c-RET in such samples isdebated and challenges the notion that c-RET isexpressed by thyroid follicular cells only as aconsequence of RET/PTC rearrangements. c-RETmRNA in papillary carcinoma may be the result ofcontaminating C-cells or more likely neutrophilsand macrophages that express both mRNA and wild-type RET protein.47 However, low-level mRNAexpression by thyroid follicular cells is a likelypossibility.8,9,11 This is supported in our study by thelack of C-cell contamination in tumor samples asindicated by negative results for calcitonin immu-nohistochemistry (data not shown) and by theidentification of low-level exons 10–11 in the RET/PTC1 positive TPC1 thyroid follicular cell line andin the RET/PTC3-transfected ARO cells. Interest-ingly, among papillary carcinomas with high-levelRET/PTC1 expression there is a trend for lower RETexon 10–11 levels compared to those tumors withlow-level RET/PTC1 or no rearrangement. If c-RET isindeed expressed by follicular cells, the reduction inRET exon 10–11 levels may suggest the existence ofmolecular mechanisms that allow RET/PTC todownregulate c-RET expression.
In summary, this is the first report of quantitativeexpression analysis of RET and its rearranged formsin papillary thyroid carcinoma. Our results indicate
RET expression pattern in papillary carcinomaKJ Rhoden et al
1568
Laboratory Investigation (2004) 84, 1557–1570

that c-RET and RET/PTC levels are highly variable.This variability contributes to the apparent incon-sistencies in their reported detection rates andshould be taken into account not only for diagnosticpurposes but also to better understand the roleof RET activation in thyroid follicular cell tumor-igenesis.
Acknowledgements
This work was supported by the Departments ofPathology and Laboratory Medicine, Yale UniversitySchool of Medicine, New Haven, CT, USA.
References
1 Grieco M, Santoro M, Berlingieri MT, et al. PTC is anovel rearranged form of the ret proto-oncogene and isfrequently detected in vivo in human thyroid papillarycarcinomas. Cell 1990;60:557–563.
2 Saenko V, Rogounovitch T, Shimizu-Yoshida Y, et al.Novel tumorigenic rearrangement, Delta rfp/ret, in apapillary thyroid carcinoma from externally irradiatedpatient. Mutat Res 2003;527:81–90.
3 Tallini G, Asa SL. RET oncogene activation in papillarythyroid carcinoma. Adv Anatom Pathol 2001;8:345–354.
4 Nikiforov YE, Rowland JM, Bove KE, et al. Distinctpattern of ret oncogene rearrangements in morpholo-gical variants of radiation-induced and sporadicthyroid papillary carcinomas in children. Cancer Res1997;57:1690–1694.
5 Mizuno T, Kyoizumi S, Suzuki T, et al. Continuedexpression of a tissue specific activated oncogene inthe early steps of radiation-induced human thyroidcarcinogenesis. Oncogene 1997;15:1455–1460.
6 Nikiforova MN, Stringer JR, Blough R, et al. Proximityof chromosomal loci that participate in radiation-induced rearrangements in human cells. Science2000;290:138–141.
7 Learoyd DL, Messina M, Zedenius J, et al. RET/PTCand RET tyrosine kinase expression in adult papillarythyroid carcinomas. J Clin Endocrinol Metab 1998;83:3631–3635.
8 Bunone G, Uggeri M, Mondellini P, et al. RET receptorexpression in thyroid follicular epithelial cell-derivedtumors. Cancer Res 2000;60:2845–2849.
9 Fluge Ø, Haugen DR, Akslen LA, et al. Expression andalternative splicing of c-RET RNA in papillary thyroidcarcinomas. Oncogene 2001;20:885–892.
10 Kjellman P, Learoyd DL, Messina M, et al. Expressionof the RET proto-oncogene in papillary thyroidcarcinoma and its correlation with clinical outcome.Br J Surg 2001;88:557–563.
11 Nikiforova MN, Caudill CM, Biddinger P, et al.Prevalence of RET/PTC rearrangements in Hashimoto’sthyroiditis and papillary thyroid carcinomas. Int J SurgPathol 2002;10:15–22.
12 Rosai J, Carcangiu ML, DeLellis RA. Atlas of TumorPathology—Tumors of the thyroid gland, 3rd series.Washington: Armed Force Institute of Pathology, 1992.
13 Ishizaka Y, Ushijima T, Sugimura T, et al. cDNAcloning and characterization of ret activated in a
human papillary thyroid carcinoma cell line. BiochemBiophys Res Comm 1990;168:402–408.
14 Santoro M, Papotti M, Chiappetta G, et al. RETactivation and clinicopathologic features in poorlydifferentiated thyroid tumors. J Clin Endocrinol Metab2002;87:370–379.
15 Santoro M, Dathan NA, Berlingieri MT, et al. Mole-cular characterization of RET/PTC3: a novel rearrangedversion of the RET proto-oncogene in a human thyroidpapillary carcinoma. Oncogene 1994;9:509–516.
16 Takahashi M, Buma Y, Iwamoto T, et al. Cloning andexpression of the ret protooncogene encoding atyrosine kinase with two potential transmembranedomains. Oncogene 1988;3:571–578.
17 Kreuzer KA, Lass U, Landt O, et al. Highly sensitiveand specific fluorescence reverse transcription-PCRassay for the pseudogene-free detection of beta-actintranscripts as quantitative reference. Clin Chem 1999;45:297–300.
18 Livak KL, Schmittgen TD. Analysis of relative geneexpression data using real-time quantitative PCR andthe 2�DDCT method. Methods 2001;25:402–408.
19 Ishizaka Y, Kobayashi S, Ushijima T, et al. Detection ofret/PTC transcripts in thyroid adenomas and adeno-matous goiter by an RT-PCR method. Oncogene1991;6:1667–1672.
20 Zou M, Shi Y, Farid NR. Low rate of ret proto-oncogeneactivation (PTC/retTPC) in papillary thyroid carcinomasfrom Saudi Arabia. Cancer 1994;73:176–180.
21 Motomura T, Nikiforov YE, Namba H, et al. Retrearrangements in Japanese pediatric and adult papil-lary thyroid cancers. Thyroid 1998;8:485–489.
22 Tallini G, Santoro M, Helie M, et al. RET/PTConcogene activation defines a subset of papillarythryoid carcinomas lacking evidence of progressionto poorly differentiated or undifferentiated tumorphenotypes. Clin Cancer Res 1998;4:287–294.
23 Sugg SL, Ezzat S, Rosen IB, et al. Distinct multipleRET/PTC gene rearrangements in multifocal papillarythyroid neoplasia. J Clin Endocrinol Metab 1998;83:4116–4122.
24 Pierotti MA, Vigneri P, Bongarzone I. Rearrangementsof RET and NTRK1 tyrosine kinase receptors inpapillary thyroid carcinomas. Recent Results CancerRes 1998;154:237–247.
25 Lesueur F, Corbex M, McKay JD, et al. Specifichaplotypes of the RET proto-oncogene are over-represented in patients with sporadic papillary thyroidcarcinoma. J Med Genet 2002;39:260–265.
26 Namba H, Yamashita S, Pei HC, et al. Lack of PTC generearrangement in human thyroid tumors. EndocrinolJapan 1991;38:627–632.
27 Wajjwalku W, Nakamura S, Hasegawa Y, et al. Lowfrequency of rearrangement of the ret and trk proto-oncogenes in Japanese thyroid papillary carcinomas.Jpn J Cancer Res 1992;83:671–675.
28 Jhiang SM, Caruso DR, Gilmore E, et al. Detection ofthe PTC/ret oncogene in human thyroid cancers.Oncogene 1992;7:1331–1337.
29 Santoro M, Carlomagno F, Hay ID, et al. RET oncogeneactivation in human thyroid neoplasms is restricted tothe papillary carcinoma subtype. J Clin Invest 1992;89:1517–1522.
30 Soares P, Fonseca E, Wynford-Thomas D, et al.Sporadic ret-rearranged papillary carcinoma of thethyroid: a subset of slow growing, less aggressivethyroid neoplasms? J Pathol 1998;185:71–78.
RET expression pattern in papillary carcinomaKJ Rhoden et al
1569
Laboratory Investigation (2004) 84, 1557–1570

31 Bongarzone I, Vigneri P, Mariani L et al. RET/NTRK1rearrangements in thyroid gland tumors of the papil-lary carcinoma family: correlation with clinicopatho-logical features. Clin Cancer Res 1998;4:223–228.
32 Lee C-H, Hsu LS, Chi CW, et al. High frequency ofrearrangement of the RET protooncogene (RET/PTC) inChinese papillary thyroid carcinomas. J Clin Endocri-nol Metab 1998;83:1629–1632.
33 Mayr B, Potter E, Goretzki P, et al. Expression of Ret/PTC1, -2, -3, -D3, and -4 in German papillary thyroidcarcinoma. Br J Cancer 1998;77:903–906.
34 Musholt TJ, Musholt PB, Khaladj N, et al. Prognosticsignificance of RET and NTRK1 rearrangements insporadic papillary thyroid carcinoma. Surgery2000;128:984–993.
35 Fenton CL, Lukes Y, Nicholson D, et al. The ret/PTCmutations are common in sporadic papillary thyroidcarcinoma of children and young adults. J ClinEndocrinol Metab 2000;85:1170–1175.
36 Park KY, Koh JM, Kim YI, et al. Prevalences of Gsalpha, ras, p53 mutations and ret/PTC rearrangementin differentiated thyroid tumours in a Korean popula-tion. Clin Endocrinol 1998;49:317–323.
37 Chua EL, Wu WM, Tran KT, et al. Prevalence anddistribution of ret/ptc 1, 2, and 3 in papillary thyroidcarcinoma in New Caledonia and Australia. J ClinEndocrinol Metab 2000;8:2733–2739.
38 Elisei R, Romei C, Vorontsova T, et al. RET/PTCrearrangements in thyroid nodules: studies in irra-diated and not irradiated, malignant and benignthyroid lesions in children and adults. J Clin Endocri-nol Metab 2001;86:3211–3216.
39 Puxeddu E, Moretti S, Giannico A, et al. Ret/PTCactivation does not influence clinical and pathological
features of adult papillary thyroid carcinomas. Eur JEndocrinol 2003;148:505–513.
40 Williams GH, Rooney S, Thomas GA, et al. RETactivation in adult and childhood papillary thyroidcarcinoma using a reverse transcriptase-n-polymerasechain reaction approach on archival-nested material.Br J Cancer 1996;74:585–589.
41 Cinti R, Yin L, Ilc K, et al. RET rearrangements inpapillary thyroid carcinomas and adenomas detected byinterphase FISH. Cytogenet Cell Genet 2000;88:56–61.
42 Sheils OM, O’Leary JJ, Sweeney EC. Assessment of ret/PTC-1 rearrangements in neoplastic thyroid tissueusing TaqMan RT-PCR. J Pathol 2000;192:32–36.
43 Finn SP, Smyth P, O’Leary J, et al. Ret/PTC chimerictranscripts in an Irish cohort of sporadic papillarythyroid carcinoma. J Clin Endocrinol Metab 2003;88:938–941.
44 Bongarzone I, Fugazzola L, Vigneri P, et al. Age-relatedactivation of the tyrosine kinase receptor protoonco-genes RET and NTRK1 in papillary thyroid carcinoma.J Clin Endocrinol Metab 1996;81:2006–2009.
45 Sugg SL, Zheng L, Rosen IB, et al. Ret/PTC-1, -2, and -3oncogene rearrangements in human thyroid carcino-mas: implications for metastatic potential? J ClinEndocrinol Metab 1996;81:3360–3365.
46 Basolo F, Giannini R, Monaco C et al. Potentmitogenicity of the RET/PTC3 oncogene correlateswith its prevalence in tall-cell variant of papillarythyroid carcinoma. Am J Pathol 2002;160:247–254.
47 Gattei V, Celetti A, Cerrato A, et al. Expression of theRET receptor tyrosine kinase and GDNFR-alpha innormal and leukemic human hematopoietic cells andstromal cells of the bone marrow microenvironment.Blood 1997;89:2925–2937.
RET expression pattern in papillary carcinomaKJ Rhoden et al
1570
Laboratory Investigation (2004) 84, 1557–1570
Related Documents