Real-Time PCR Real-Time PCR

Real-Time PCR. Cockerill FR III. Arch Pathol Lab Med. 2003;127:1112 (www) (www)
Dec 27, 2015
Welcome message from author
This document is posted to help you gain knowledge. Please leave a comment to let me know what you think about it! Share it to your friends and learn new things together.
Transcript

Real-Time PCRReal-Time PCR

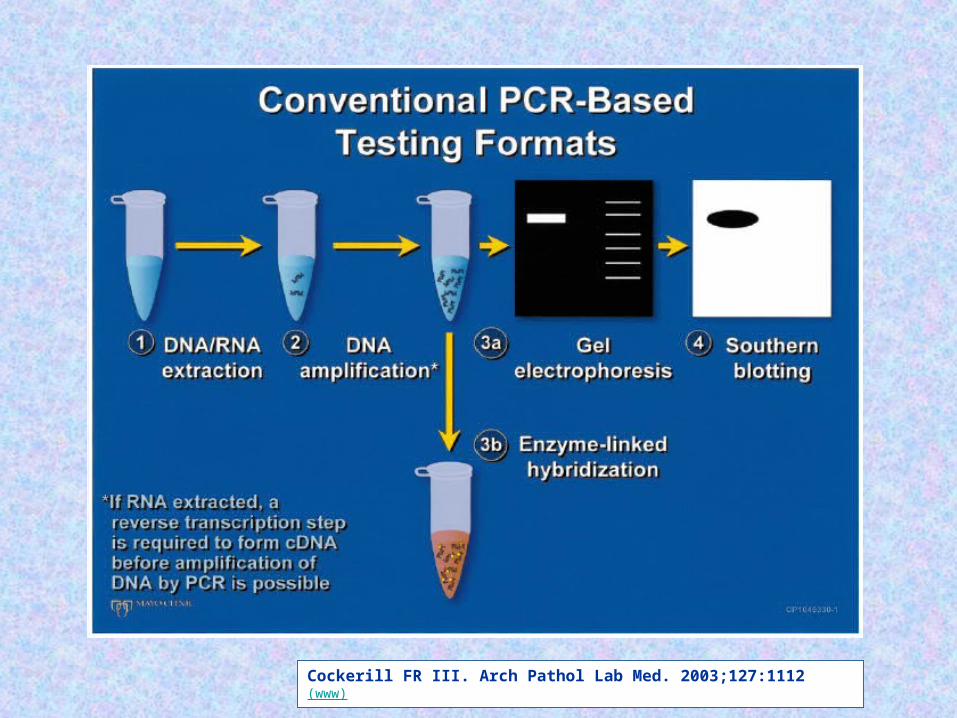
Cockerill FR III. Arch Pathol Lab Med. 2003;127:1112 (www)
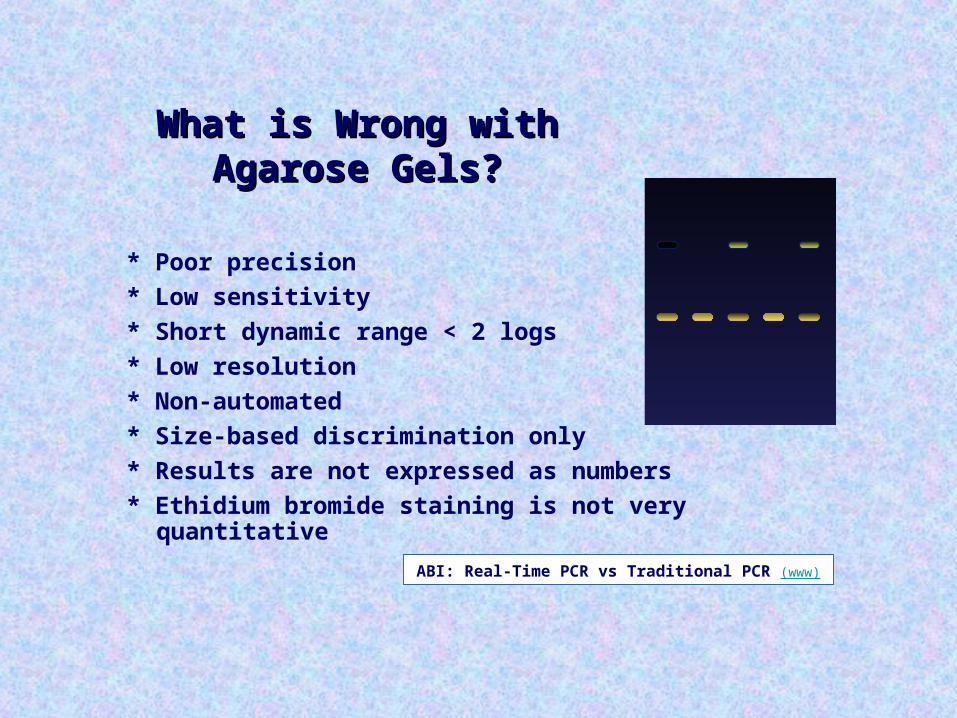
What is Wrong with What is Wrong with Agarose Gels?Agarose Gels?
* Poor precision* Low sensitivity* Short dynamic range < 2 logs* Low resolution* Non-automated* Size-based discrimination only* Results are not expressed as numbers* Ethidium bromide staining is not very quantitative
ABI: Real-Time PCR vs Traditional PCR (www)

Real-Time PCRReal-Time PCR
Real-time PCR monitors the fluorescence emitted during the reaction as an indicator of amplicon production at
each PCR cycle (in real time) as opposed to the endpoint detection


Real-time PCR advantagesReal-time PCR advantages
* not influenced by non-specific amplification
* amplification can be monitored real-time
* no post-PCR processing of products (high throughput, low contamination risk)
* ultra-rapid cycling (30 minutes to 2 hours)
* wider dynamic range of up to 1010-fold
* requirement of 1000-fold less RNA than conventional assays(3 picogram = one genome equivalent)
* detection is capable down to a 2-fold change
* confirmation of specific amplification by melting curve analysis
* most specific, sensitive and reproducible
* not much more expensive than conventional PCR(except equipment cost)

ABI-7700 User Bulletin #5
Wider Dynamic RangeWider Dynamic Range

Real-time PCR disadvantagesReal-time PCR disadvantages
* not ideal for multiplexing
* setting up requires high technical skill and support
* high equipment cost
* * *
* DNA contamination (in mRNA analysis)

Real-time PrinciplesReal-time Principles
* based on the detection and quantitation of a fluorescent reporter
* the first significant increase in the amount of PCR product
(CT - threshold cycle) correlates to the initial amount of
target template
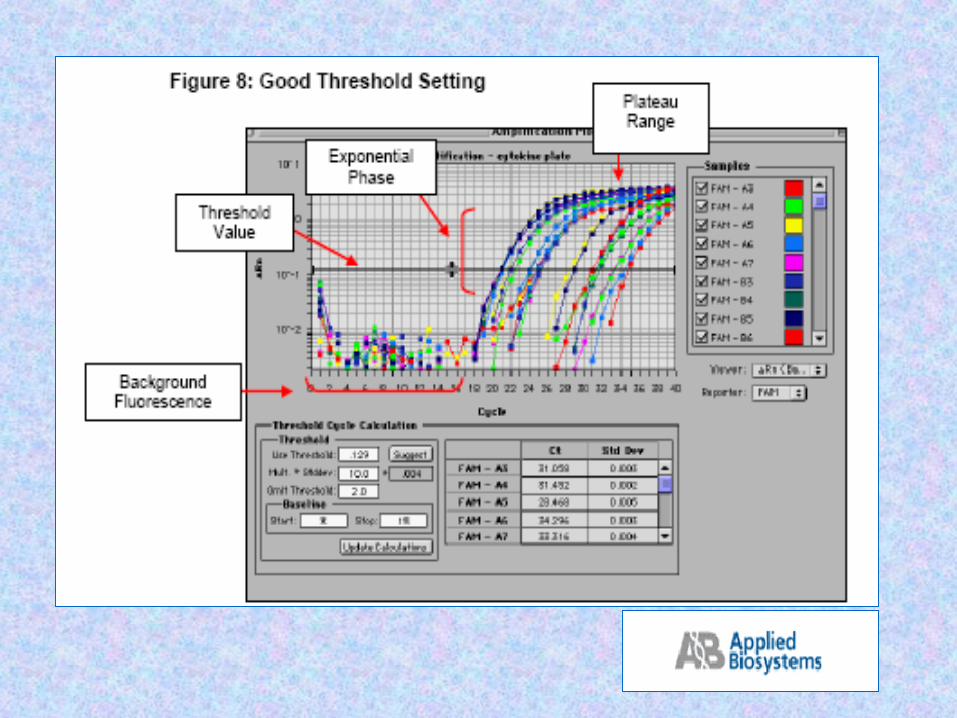

The five-fold dilution series seems to plateau at the same place even though the exponential phase clearly shows a difference between the points along the dilution series. This reinforces the fact that if measurements were taken at the plateau phase, the data would not truly represent the initial amounts of starting target material.

Real-Time PrinciplesReal-Time Principles
Three general methods for the quantitative assays:
1. Hydrolysis probes
(TaqMan, Beacons, Scorpions)
2. Hybridization probes
(Light Cycler)
3. DNA-binding agents
(SYBR Green)


Van der Velden, Leukemia 2003 (www)

Van der Velden, Leukemia 2003 (www)
Principles of Real-Time Quantitative PCR TechniquesPrinciples of Real-Time Quantitative PCR Techniques
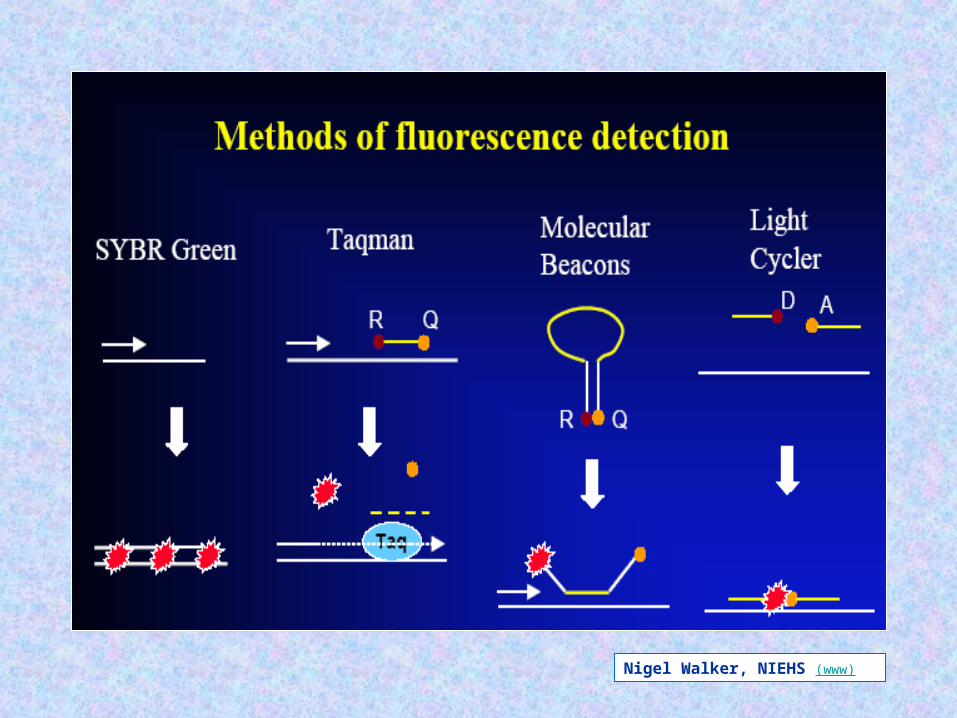
(a) SYBR Green I technique: SYBR Green I fluorescence is enormously increased upon binding to double-stranded DNA. During the extension phase, more and more SYBR Green I will bind to the PCR product, resulting in an increased fluorescence. Consequently, during each subsequent PCR cycle more fluorescence signal will be detected.
(b) Hydrolysis probe technique: The hydrolysis probe is conjugated with a quencher fluorochrome, which absorbs the fluorescence of the reporter fluorochrome as long as the probe is intact. However, upon amplification of the target sequence, the hydrolysis probe is displaced and subsequently hydrolyzed by the Taq polymerase. This results in the separation of the reporter and quencher fluorochrome and consequently the fluorescence of the reporter fluorochrome becomes detectable. During each consecutive PCR cycle this fluorescence will further increase because of the progressive and exponential accumulation of free reporter fluorochromes.
(c) Hybridization probes technique: In this technique one probe is labelled with a donor fluorochrome at the 3’ end and a second –adjacent- probe is labelled with an acceptor fluorochrome. When the two fluorochromes are in close vicinity (1–5 nucleotides apart), the emitted light of the donor fluorochrome will excite the acceptor fluorochrome (FRET). This results in the emission of fluorescence, which subsequently can be detected during the annealing phase and first part of the extension phase of the PCR reaction. After each subsequent PCR cycle more hybridization probes can anneal, resulting in higher fluorescence signals.
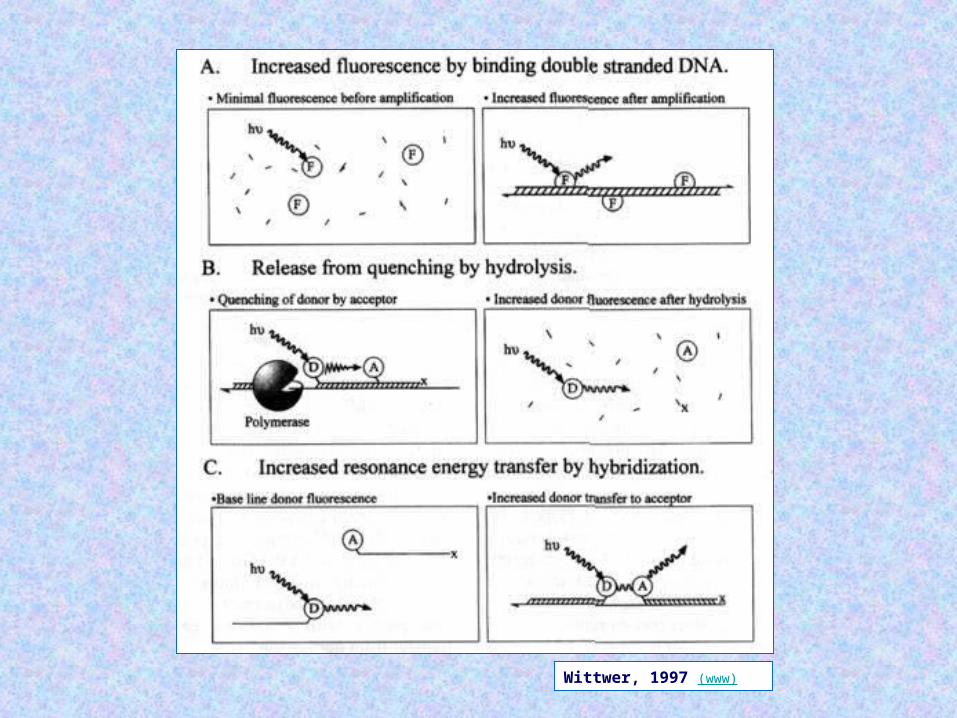

Wittwer, 1997 (www)
Schematic diagram comparing three different fluorescence-monitoring systems for DNA amplification. System A uses dsDNA-specific dyes (F) such as SYBR"Green I, which increase in fluorescence when bound to accumulating amplification product. System B uses dual-labelled probes and depends on the 5'-exonuclease activity of the polymerase to separate donor (D) and acceptor (A) by hydrolysis. Donor fluorescence is increased by removing acceptor quenching. System C depends on the independent hybridization of adjacent donor (D) and acceptor (A) probes. Their approximation increases resonance energy transfer from the donor to the acceptor. Other symbols are "hv" for excitation light and "x" for a 3'-phosphate.
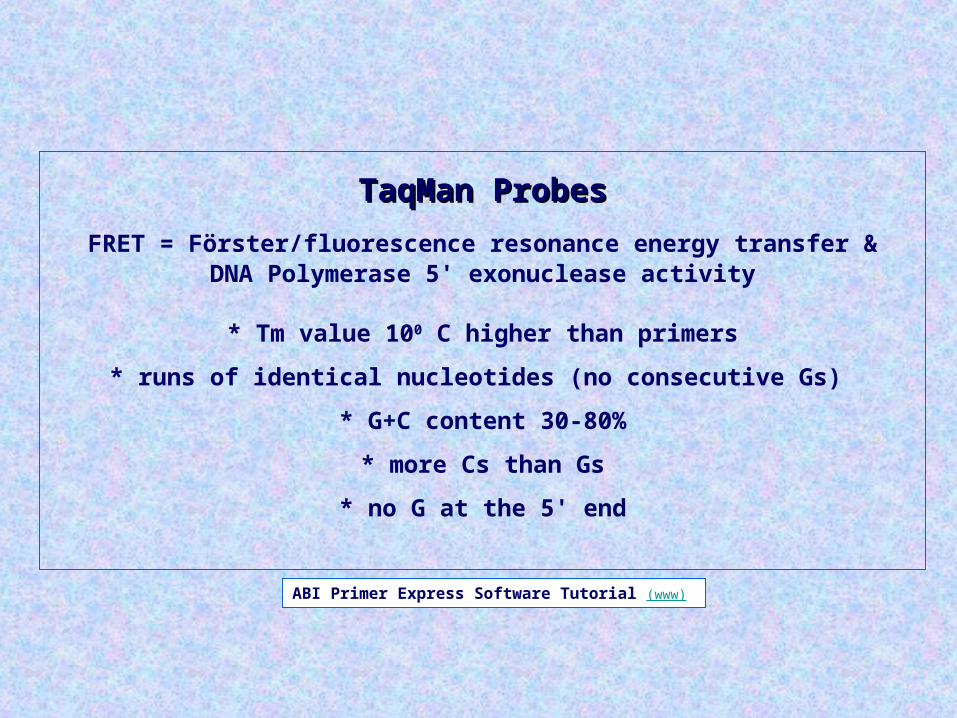
TaqMan ProbesTaqMan Probes
FRET = Förster/fluorescence resonance energy transfer &DNA Polymerase 5' exonuclease activity
* Tm value 100 C higher than primers
* runs of identical nucleotides (no consecutive Gs)
* G+C content 30-80%
* more Cs than Gs
* no G at the 5' end
ABI Primer Express Software Tutorial (www)

FRET = Förster/fluorescence resonance energy transfer FRET = Förster/fluorescence resonance energy transfer
ABI: Real-Time PCR vs Traditional PCR (www)

Mocellin et al. Trends Mol Med 2003 (www)
DNA Polymerase 5' Exonuclease ActivityDNA Polymerase 5' Exonuclease Activity
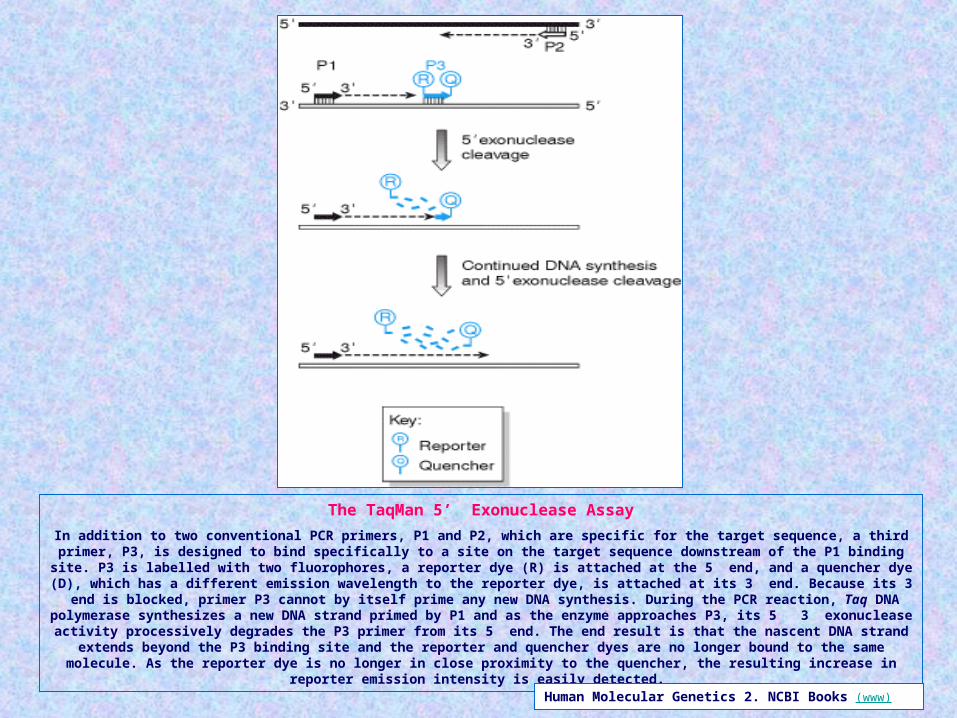
The TaqMan 5’ Exonuclease Assay
In addition to two conventional PCR primers, P1 and P2, which are specific for the target sequence, a third primer, P3, is designed to bind specifically to a site on the target sequence downstream of the P1 binding site. P3 is
labelled with two fluorophores, a reporter dye (R) is attached at the 5 end, and a quencher dye (D), which has a different emission wavelength to the reporter dye, is attached at its 3 end. Because its 3 end is blocked, primer
P3 cannot by itself prime any new DNA synthesis. During the PCR reaction, Taq DNA polymerase synthesizes a new DNA strand primed by P1 and as the enzyme approaches P3, its 5 3 exonuclease activity processively degrades the P3 primer from its 5 end. The end result is that the nascent DNA strand extends beyond the P3 binding site
and the reporter and quencher dyes are no longer bound to the same molecule. As the reporter dye is no longer in close proximity to the quencher, the resulting increase in reporter emission intensity is easily detected.
Human Molecular Genetics 2. NCBI Books (www)

(www)

TaqMan PrimersTaqMan Primers
* equal Tm (58-600 C)
* 15-30 bases in length
* G+C content 30-80%
* no runs of four or more Gs (any nucleotide)
* no more than two G+C at the 3’ end
* no G at the 5' end
* amplicon size 50-150 bp (max 400)
* span exon-exon junctions in cDNA
ABI Primer Express Software Tutorial (www)
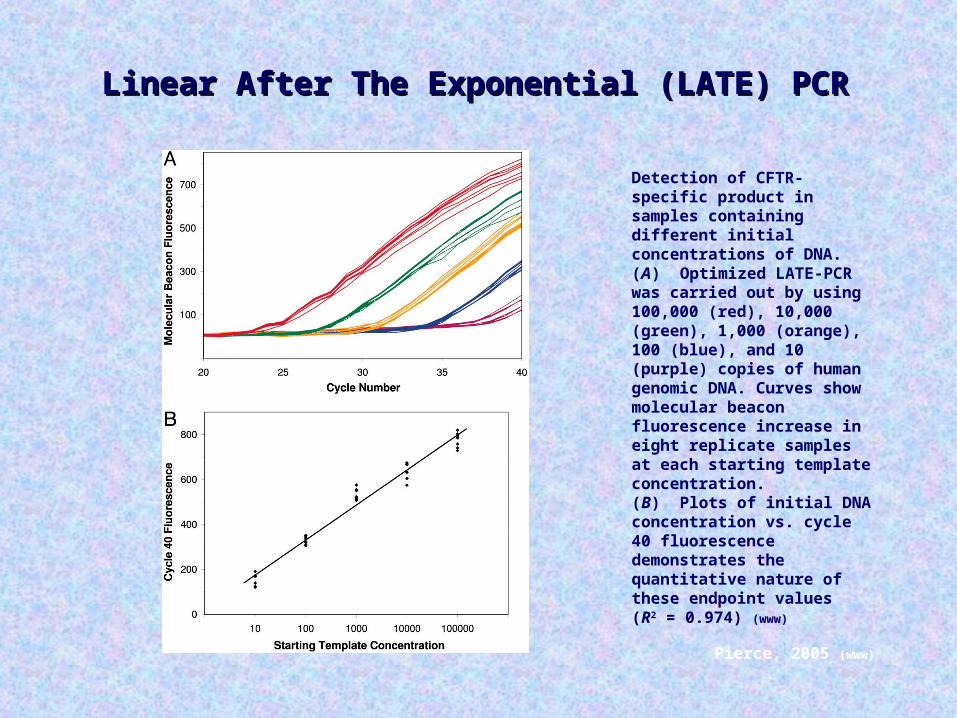
Detection of CFTR-specific product in samples containing different initial concentrations of DNA. (A) Optimized LATE-PCR was carried out by using 100,000 (red), 10,000 (green), 1,000 (orange), 100 (blue), and 10 (purple) copies of human genomic DNA. Curves show molecular beacon fluorescence increase in eight replicate samples at each starting template concentration. (B) Plots of initial DNA concentration vs. cycle 40 fluorescence demonstrates the quantitative nature of these endpoint values (R2 = 0.974) (www)
Pierce, 2005 (www)
Linear After The Exponential (LATE) PCRLinear After The Exponential (LATE) PCR

Latorra, 2003 (www)
Locked Nucleic Acid (LNA) Primers & ProbesLocked Nucleic Acid (LNA) Primers & Probes
SYBR GreenSYBR Green (double-stranded DNA binding dye)
* emits a strong fluorescent signal upon binding to double-stranded DNA
* nonspecific binding is a disadvantage
* requires extensive optimization
* requires melting point curve determination
* longer amplicons create a stronger signal
* may be multiplexed when coupled with melting curve analysis

Fluoresces when boundto dsDNA

SYBR Green(1) At the beginning of amplification, the reaction mixture contains the denatured
DNA, the primers, and the dye. The unbound dye molecules weakly fluoresce, producing a minimal background fluorescence signal which is subtracted during
computer analysis. (2) After annealing of the primers, a few dye molecules can bind to the double strand. DNA binding results in a dramatic increase of the SYBR Green I molecules to emit light upon excitation. (3) During elongation, more and more dye
molecules bind to the newly synthesized DNA. If the reaction is monitored continuously, an increase in fluorescence is viewed in real-time. Upon denaturation
of the DNA for the next heating cycle, the dye molecules are released and the fluorescence signal falls.
Mapping Protein/DNA Interactions by Cross-Linking (NCBI Books) (www)

* Assays that do not require specificity of probe based assays. Detection of 1000s of molecules
* General screening of transcripts prior to moving to probe based assays
* When the PCR system is fully optimized -no primer dimers or non-specific amplicons, e.g. from genomic DNA
When to Choose SYBR GreenWhen to Choose SYBR Green
When Not to Choose SYBR GreenWhen Not to Choose SYBR Green
* Allelic discrimination assays (not an absolute one)
* Multiplex reactions (not an absolute one)
* Amplification of rare transcripts
* Low level pathogen detection

Real-Time PrinciplesReal-Time Principles
Three general methods for the quantitative detection:
1. Hydrolysis probes
(TaqMan, Beacons, Scorpions)
2. Hybridization probes
(Light Cycler)
3. DNA-binding agents
(SYBR Green)

Mocellin et al. Trends Mol Med 2003 (www)
Molecular BeaconsMolecular Beacons

Real-Time PrinciplesReal-Time Principles
Three general methods for the quantitative detection:
1. Hydrolysis probes
(TaqMan, Beacons, Scorpions)
2. Hybridization probes
(Light Cycler)
3. DNA-binding agents
(SYBR Green)

Bustin SA. J Mol Endocrinol 2002 (www)
ScorpionsScorpions
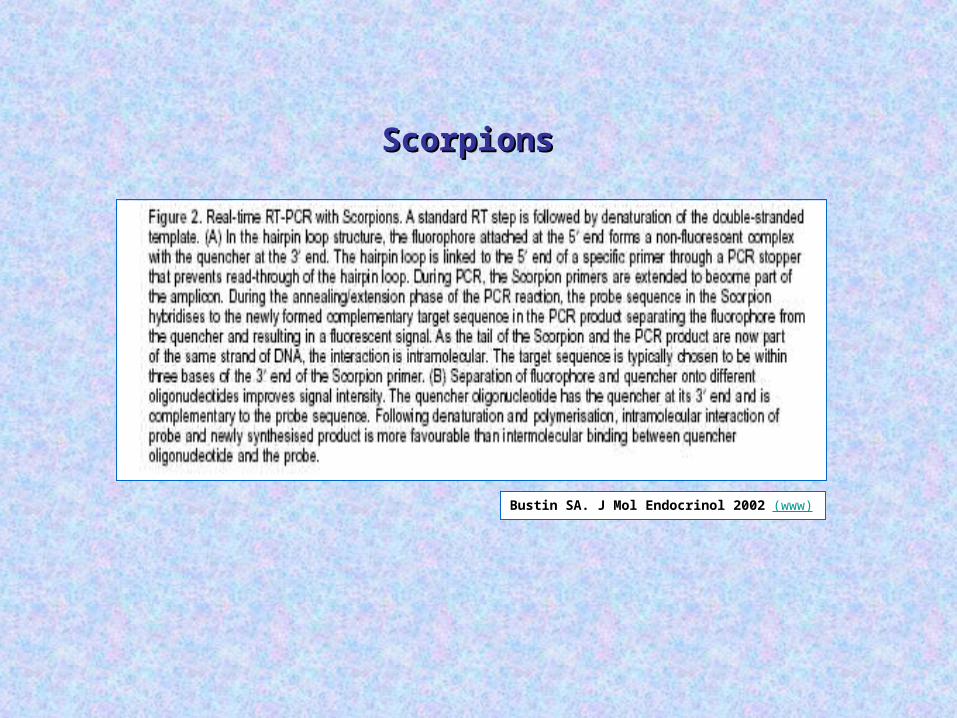
Bustin SA. J Mol Endocrinol 2002 (www)
ScorpionsScorpions
Threshold CycleThreshold Cycle
* threshold cycle or the CT value is the cycle at which a significant increase in Rn is first detected
* it is the parameter used for quantitation
* CT value of 40 or more means no amplification and cannot be included in the calculations

The Amplification Plot contains valuable information for the quantitative measurement of DNA or RNA. The Threshold line is the level of detection or the point at which a reaction reaches a
fluorescent intensity above background. The threshold line is set in the exponential phase of the amplification for the most accurate reading. The cycle at which the sample reaches this level is
called the Cycle Threshold, CT. These two values are very important for data analysis using the 5’ nuclease assay.
What is CWhat is CTT??

Van der Velden. Leukemia 2003 (www)


Albumin (ALB) gene dosage by real-time PCR
Laurendeau et al. Clin Chem 1999 (www)

Albumin (Albumin (ALBALB) Gene Dosage by Real-Time PCR) Gene Dosage by Real-Time PCR
Top, amplification plots for reactions with starting ALB gene copy number of 33 000 (A1, 100 ng), 8250 (A4, 25 ng), 2062 (A7, 6.25 ng), or 515 (A10, 1.56 ng). The cycle number is plotted vs the change in normalized reporter signal
(Rn). For each reaction tube, the fluorescence signal of the reporter dye (FAM) is divided by the fluorescence signal of the passive reference dye
(ROX) to obtain a ratio defined as the normalized reporter signal (Rn). Rn represents the normalized reporter signal (Rn) minus the baseline signal
established in the first 15 PCR cycles. Rn increases during PCR as ALB PCR product copy number increases until the reaction reaches a plateau. Ct
represents the fractional cycle number at which a significant increase in Rn above a baseline signal (horizontal black line) can first be detected. Three replicates were performed for each reference DNA sample, but the data for
only one are shown here. Bottom, calibration curve plotting log starting copy number vs Ct. The black symbols represent the triplicate PCR amplification of the reference DNA samples and red symbols the triplicate PCR amplification of unknown genomic DNA, all included inside the calibration curve. The copy number of ALB (x) can be calculated as follows: y = -3.374x + 40.593, where
the Ct value is substituted as y.
Laurendeau et al. Clin Chem 1999 (www)
RnRn
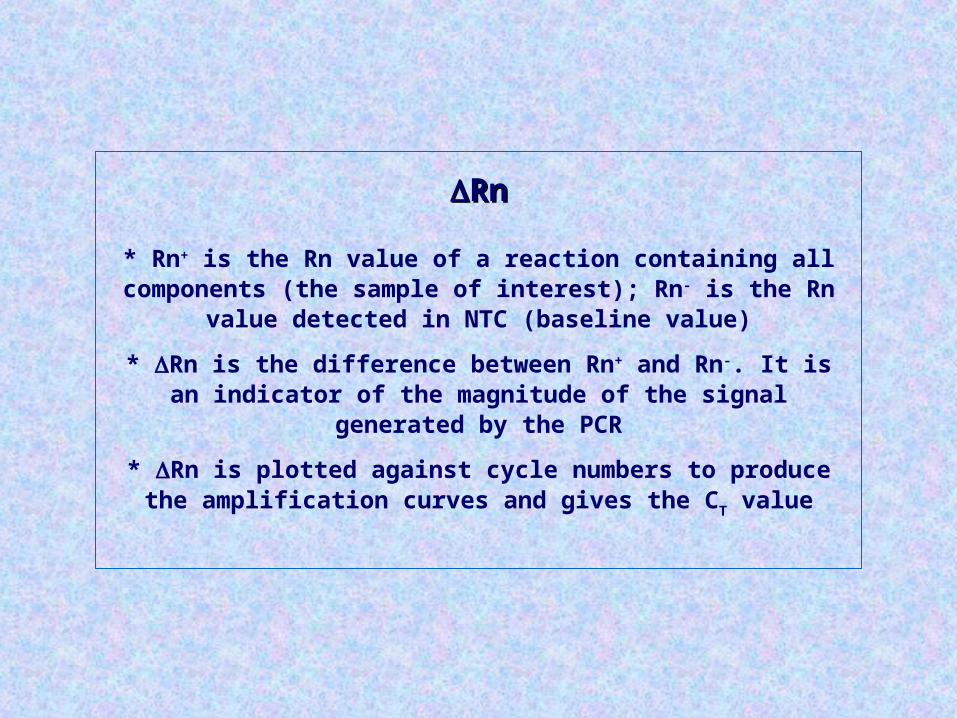
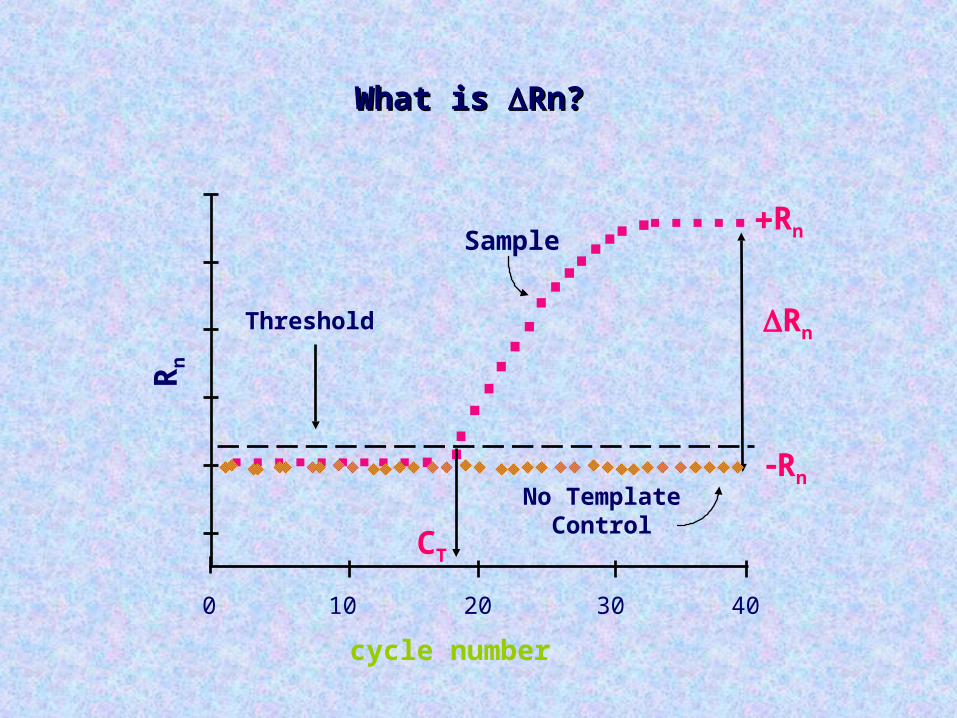
* Rn+ is the Rn value of a reaction containing all components (the sample of interest); Rn- is the Rn
value detected in NTC (baseline value)
* Rn is the difference between Rn+ and Rn-. It is an indicator of the magnitude of the signal generated by
the PCR
* Rn is plotted against cycle numbers to produce the amplification curves and gives the CT value
What is What is Rn?Rn?
0 10 20 30 40
cycle number
Rn
CT
Threshold Rn
Sample
No TemplateControl
Rn
Rn

(www)
What is What is Rn?Rn?


Endogenous/Internal ControlEndogenous/Internal Control(Normalization)
* usually an abundantly and constantly expressed housekeeping gene
* most commonly used ones are the least reliable ones
* best to run a validity test for the selected endogenous control
* combination may/should be used

Endogenous Control SelectionEndogenous Control Selection
Sabek et al. Transplantation 2002 (www)

MultiplexingMultiplexing
* TaqMan: different dyes for each target (FAM, TET, VIC and JOE)
* SYBR green: different melting points for each target
* extensive optimization is required

Real-time detection of four different retroviral DNAs in a multiplex format. Four assays were carried out in sealed tubes, each initiated with 100,000 molecules of a different retroviral DNA. Each reaction contained four sets of PCR primers specific for unique HIV-1, HIV-2, HTLV-I, and HTLV-II nucleotide sequences and four molecular beacons, each specific for one of the four amplicons and labelled with a differently coloured fluorophore. Fluorescence from the fluorescein-labeled molecular beacon (HIV-1-specific) is plotted in red, fluorescence from the tetrachlorofluorescein-labelled molecular beacon (HIV-2-specific) is plotted in green, fluorescence from the tetramethylrhodamine-labelled molecular beacon (HTLV-I-specific) is plotted in blue, and fluorescence from the rhodamine-labelled molecular beacon (HTLV-II-specific) is plotted in brown. The slight HTLV-I signal seen in the assay initiated with HTLV-II DNA is an artefact that resulted from a portion of the rhodamine fluorescence being interpreted by the spectrofluorometric thermal cycler as tetramethylrhodamine fluorescence. Vet JA et al. PNAS 1999 (www)
Multiplex Real-Time PCRMultiplex Real-Time PCR(fluorescein-labeled molecular beacon)(fluorescein-labeled molecular beacon)

Read SJ et al. J Clin Microbiol 2001 (www)
Multiplex Real-Time PCRMultiplex Real-Time PCR(fluorescein-labeled molecular beacon)(fluorescein-labeled molecular beacon)

EfficiencyEfficiency
The slope of the log-linear phase is a reflection of the amplification efficiency
The efficiency of the reaction can be calculated by the following equation: Eff=10(-1/slope) –1. The efficiency of the
PCR should be 90-100% (ideal slope = 3.3)
A number of variables can affect the efficiency of the PCR. These factors can include length of the amplicon, secondary structure, and primer design, to name a few
Approximation vs Pfaffl method
(Efficiency Determination)


Using the PCR EquationUsing the PCR Equation
Xn = X0(1 + E)n
Xn = PCR product after cycle nX0 = initial copy numberE = amplification efficiencyn = cycle number
Xn
XX00
cycle number

Effect of Amplification EfficiencyEffect of Amplification Efficiency
Xn = X0(1+E)n
Case 1: E = 0.9 Case 1: E = 0.9 Case 2: E = 0.8Case 2: E = 0.8
XXnn = 100 (1+0.9) = 100 (1+0.9)3030 XXnn = 100 (1+0.8) = 100 (1+0.8)3030
XXnn = 2.3 x 10 = 2.3 x 101010 XXnn = 4.6 x 10 = 4.6 x 1099
ResultA difference of 0.1 in amplification
efficiencies created a five-fold difference in thefinal ratio of PCR products after 30 cycles

Determination of real-time PCR efficiencies of reference gene (Gst), target gene 1 (TyrA) and target gene 2 (PyrB). CP cycles versus cDNA (reverse transcribed total RNA) concentration input were plotted to calculate the slope (mean ± SD; n = 3).
The corresponding real-time PCR efficiencies were calculated according to the equation: E = 10[–1/slope]
From: Pfaffl MW. A new mathematical model for relative quantification in real-time RT–PCR. Nucleic Acids Res 2001 (www)

If the CT values for each of the dilutions are plotted against concentrations, the result should be a linear graph with a high correlation coefficient (> 0.99). The slope of this graph is also a measure of efficiency, and can be readily used to calculate efficiency - this is done by most software (iCycler, for example).
Real-Time PCR Tutorial (University of South Carolina) (www)


Assay ValidationAssay Validation
* Test primer pairs in all combinations with the probe witha known template (plasmid clone, sDNA, RNA)
* Use standard assay conditions: 300-400 nM primers;100 nM probe, 3 mM MgCl2
* Choose the primer pair that gives the highest Rnand the lowest CT
* Make a dilution of a template, either sDNA, sRNA or totalRNA for a standard curve
* Correlation coefficient of the standard curve > 0.99?
* If the slope of the standard curve of the best primerpair is around -3.5 increase the MgCl2 to 5 mM
* If the slope is higher than -3.6, change primers
* An ideal assay will have a slope of -3.3

ValidationValidation of bcr-abl p210 of bcr-abl p210 real-time PCRreal-time PCR
A, Amplification, bcr032801. Standards were as follows: A, 105; B, 104; C, 103; D, 102; E, 101; and F, 100. Rn, change in fluorescence. B, Standard curve, bcr032801. Slope, -3.499; Y-intercept, 33.670; correlation coefficient, 0.998. Red, unknown; black, standards.
Jones et al, Am J Clin Pathol 2003 (www)


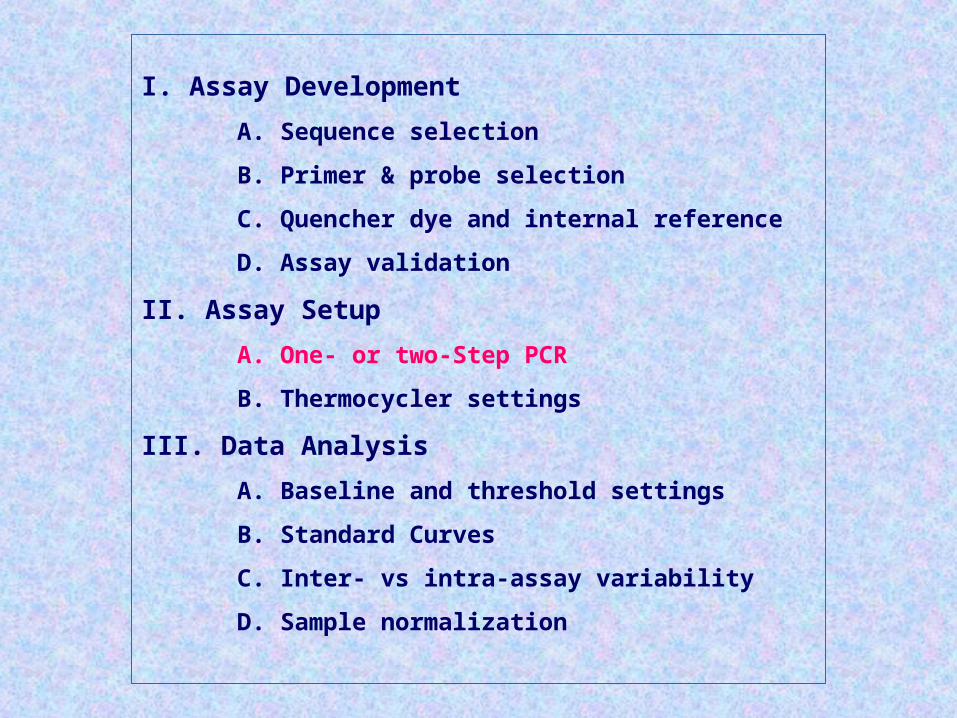
I. Assay Development
A. Sequence selection
B. Primer & probe selection
C. Quencher dye and internal reference
D. Assay validation
II. Assay Setup
A. One- or two-Step PCR
B. Thermocycler settings
III. Data Analysis
A. Baseline and threshold settings
B. Standard Curves
C. Inter- vs intra-assay variability
D. Sample normalization

One-Step or Two-Step PCROne-Step or Two-Step PCR
* one-step real-time RT-PCR performs reverse transcription and PCR in a single buffer system and in
one tube
* in two-step RT-PCR, these two steps are performed separately in different tubes

I. Assay Development
A. Sequence selection
B. Primer & probe selection
C. Quencher dye and internal reference
D. Assay validation
II. Assay Setup
A. One- or two-Step PCR
B. Thermocycler settings
III. Data Analysis
A. Baseline and threshold settings
B. Standard Curves
C. Inter- vs intra-assay variability
D. Sample normalization

Reporter, Quencher and InternalReporter, Quencher and Internal Reference DyesReference Dyes
* The classical reporter dye is 6-FAM (fluorescein)
* Other reporters used for multiplexing are Joe and Vic.
* Some other real-time machines, such as the Stratagene Mx4000, can use red dyes as reporters
* The classic quencher dye has been TAMRA (rhodomine)
* Newer quenchers are the dark dyes, DABYCL and the black hole quenchers (Biosearch Technologies)
* TAMRA-quenched probes do not require a reference dye; they can use the TAMRA itself
* Single probe reactions quenched by dark dyes should use an internal reference dye, classically ROX (dark red)
* Multiplex reactions usually use dark quenchers and ROX

Sample LayoutSample Layout20 unknowns in triplicate, standard curve, NACs and NTC
DL Shipley: Quantitative Real-time RT-PCR: A very short course (www)

InterpretationInterpretation * Melting curve analysis
* Absolute quantification
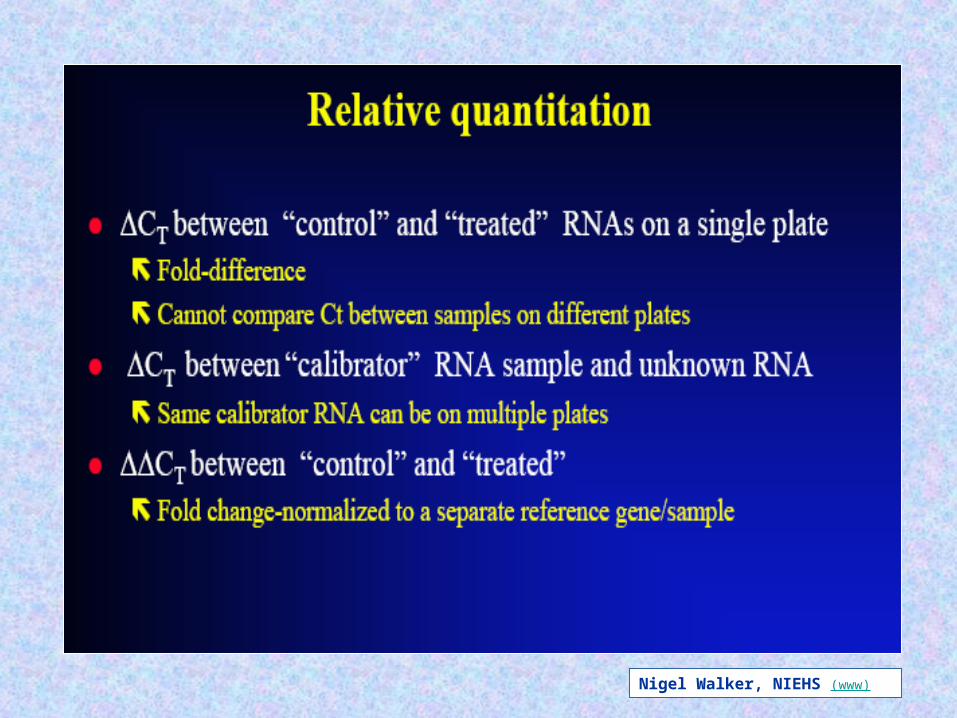
* Relative quantification
i. Relative standard method (relative fold change)
ii. Comparative threshold method

Van der Velden. Leukemia 2003 (www)

Read SJ et al. J Clin Microbiol 2001 (www)

Mamotte, Langan & Pocathikorn. DCIBG, Royal Perth Hospital, June 2004 (www)
Genotyping for the haemochromatosis G845A Genotyping for the haemochromatosis G845A mutation using melting curve analysis of FRET mutation using melting curve analysis of FRET hybridization probeshybridization probes AA, G845A homozygotes; GA, G845A heterozygotes; GG, or “wild-type” homozygotes. Right upper panel: Plot of red fluorescence relative to reference (F2/F1) versus temperature (T) for the three genotypes. Three different melting curves are shown for the three possible genotypes. These represent changes in fluorescence of the FRET complexes as they are heated through their melting temperature at the end of PCR amplification. Right Lower panel: -d(F2/F1)/dT versus temperature (T). The apex of the curves represents the melting point for the fluorescent complexes. The FRET probes bind to both alleles to form a fluorescent complex; however they are complementary to the A allele but mismatched to the G allele by one base. Consequently the melting temperature of the fluorescent complex is higher for the A allele than the G allele. Heterozygotes have two peaks representing both alleles.

InterpretationInterpretation * Melting curve analysis
* Absolute quantification
* Relative quantification
i. Relative standard method (relative fold change)
ii. Comparative threshold method

(www)

ASHI QuarterlyASHI Quarterly


InterpretationInterpretation * Melting curve analysis
* Absolute quantification
* Relative quantification
i. Relative standard method (relative fold change)
ii. Comparative threshold method
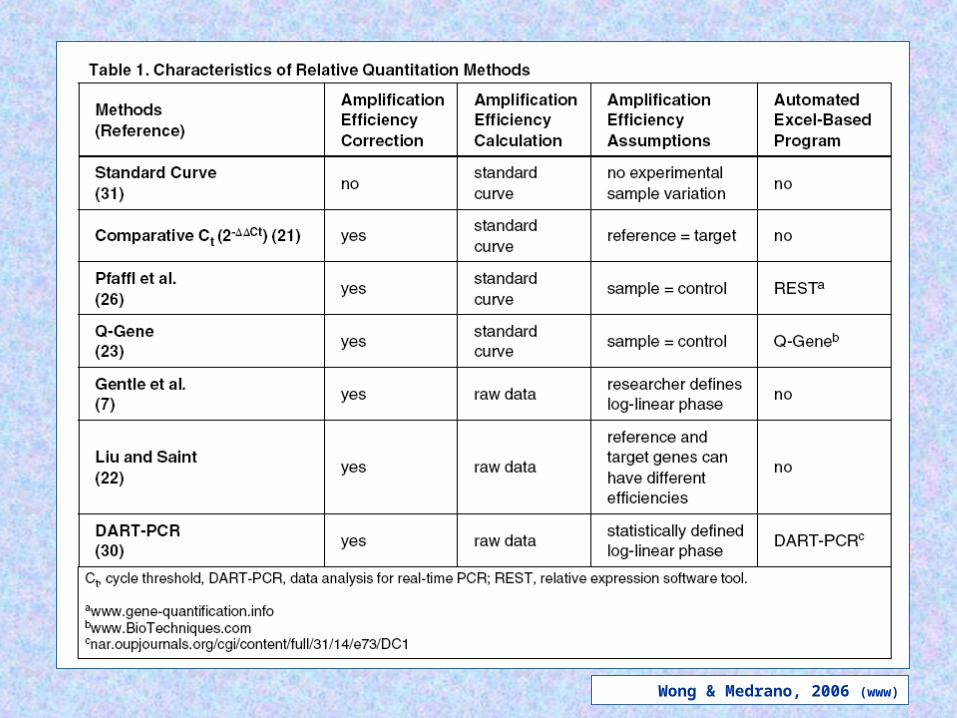
Wong & Medrano, 2006 (www)


InterpretationInterpretation * Melting curve analysis
* Absolute quantification
* Relative quantification
i. Relative standard method (relative fold change)
ii. Comparative threshold method

(www)

Validation Experiment for Comparative CValidation Experiment for Comparative CTT Method - I Method - I
ABI-7700 User Bulletin #2

ABI-7700 User Bulletin #2
Validation Experiment for Comparative CValidation Experiment for Comparative CTT Method - II Method - II

IL1-b vit
RPLP0 vit
IL1-b con
RPLP0 con
av =19.80
av =19.93
av =18.03
av =29.63
Ct = 9.70Ct = 9.70
Ct = -1.7Ct = -1.7
Ct = target - refCt = target - ref
Ct = target - refCt = target - ref
Difference = Difference = Ct-Ct-CtCt= = CtCt
= 9.70-(-1.7)= 9.70-(-1.7)= 11.40= 11.40
control
experiment
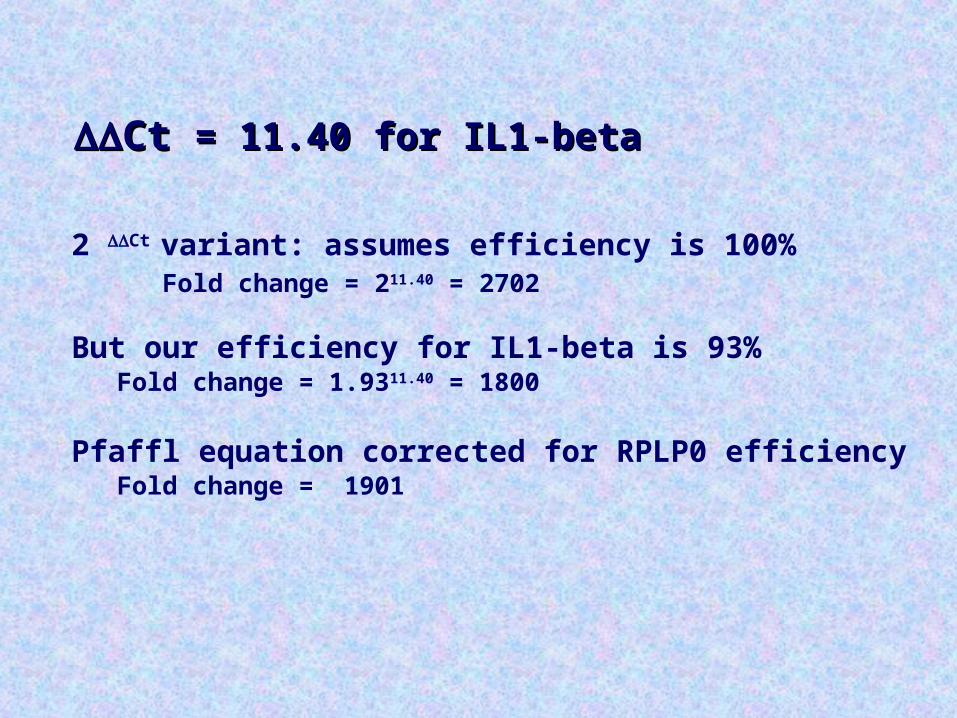
2 Ct variant: assumes efficiency is 100% Fold change = 211.40 = 2702
But our efficiency for IL1-beta is 93%Fold change = 1.9311.40 = 1800
Pfaffl equation corrected for RPLP0 efficiency Fold change = 1901
Ct Ct = 11.40 for IL1-beta= 11.40 for IL1-beta
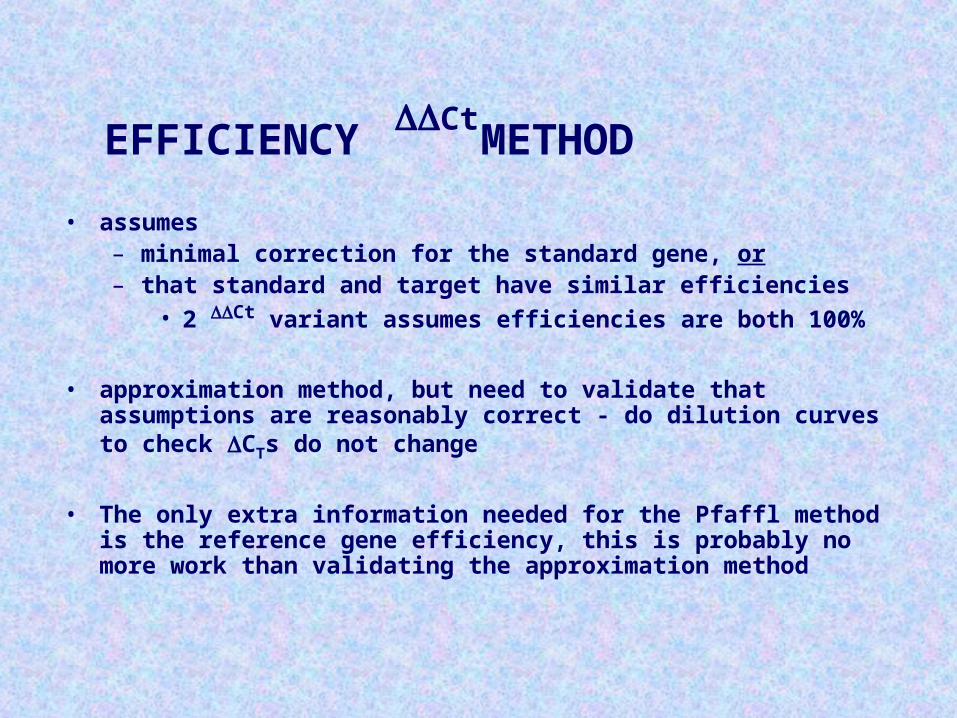
• assumes – minimal correction for the standard gene, or– that standard and target have similar efficiencies
• 2 Ct variant assumes efficiencies are both 100%
• approximation method, but need to validate that assumptions are reasonably correct - do dilution curves to check CTs do not change
• The only extra information needed for the Pfaffl method is the reference gene efficiency, this is probably no more work than validating the approximation method
Ct EFFICIENCY METHOD


Real-Time PCR ApplicationsReal-Time PCR Applications - I - I
* quantitation of gene expression
* array verification
* quality control and assay validation
* biosafety and genetic stability testing
* drug therapy efficacy / drug monitoring
* viral quantitation
* pathogen detection

Real-Time PCR ApplicationsReal-Time PCR Applications - II - II
* DNA damage (microsatellite instability) measurement
* radiation exposure assessment
* in vivo imaging of cellular processes
* mitochondrial DNA studies
* methylation detection
* detection of inactivation at X-chromosome
* linear-after-the-exponential (LATE)-PCR: a new method for real-time quantitative analysis of target numbers in small
samples, which is adaptable to high throughput applications in clinical diagnostics, biodefense, forensics, and DNA
sequencing


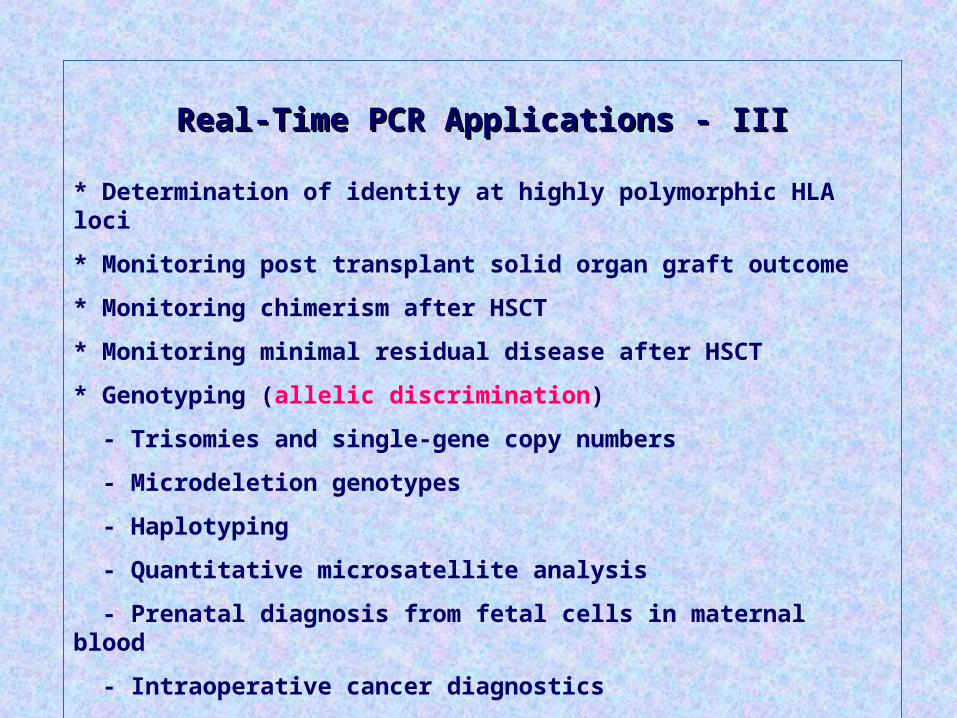
Real-Time PCR ApplicationsReal-Time PCR Applications - III - III
* Determination of identity at highly polymorphic HLA loci
* Monitoring post transplant solid organ graft outcome
* Monitoring chimerism after HSCT
* Monitoring minimal residual disease after HSCT
* Genotyping (allelic discrimination)
- Trisomies and single-gene copy numbers
- Microdeletion genotypes
- Haplotyping
- Quantitative microsatellite analysis
- Prenatal diagnosis from fetal cells in maternal blood
- Intraoperative cancer diagnostics

Allelic Discrimination Using TaqMan ProbesAllelic Discrimination Using TaqMan Probes

Allelic Discrimination Using TaqMan ProbesAllelic Discrimination Using TaqMan Probes

Mamotte, Langan & Pocathikorn. DCIBG, Royal Perth Hospital, June 2004 (www)
Genotyping for the haemochromatosis G845A Genotyping for the haemochromatosis G845A mutation using melting curve analysis of FRET mutation using melting curve analysis of FRET hybridization probeshybridization probes AA, G845A homozygotes; GA, G845A heterozygotes; GG, or “wild-type” homozygotes. Right upper panel: Plot of red fluorescence relative to reference (F2/F1) versus temperature (T) for the three genotypes. Three different melting curves are shown for the three possible genotypes. These represent changes in fluorescence of the FRET complexes as they are heated through their melting temperature at the end of PCR amplification. Right Lower panel: -d(F2/F1)/dT versus temperature (T). The apex of the curves represents the melting point for the fluorescent complexes. The FRET probes bind to both alleles to form a fluorescent complex; however they are complementary to the A allele but mismatched to the G allele by one base. Consequently the melting temperature of the fluorescent complex is higher for the A allele than the G allele. Heterozygotes have two peaks representing both alleles.
Allelic Discrimination Using SYBR GreenAllelic Discrimination Using SYBR Green

Real-Time PCR ApplicationsReal-Time PCR Applications - III - III
* Determination of identity at highly polymorphic HLA loci
* Monitoring post transplant solid organ graft outcome
* Monitoring chimerism after HSCT
* Monitoring minimal residual disease after HSCT
* Genotyping (allelic discrimination)
- Trisomies and single-gene copy numbers
- Microdeletion genotypes
- Haplotyping
- Quantitative microsatellite analysis
- Prenatal diagnosis from fetal cells in maternal blood
- Intraoperative cancer diagnostics

Barrois M et al. Clin Genet 2004 (www)

M. Tevfik DORAK, MD PhDM. Tevfik DORAK, MD PhD
Internet Website
Online CV
Current Affiliation
PubMed Search for Publications
Goggle Search
Last updated on March 6, 2007
Related Documents