IEEE SENSORS JOURNAL, VOL. 12, NO. 1, JANUARY 2012 85 Real-Time Monitoring of Railway Traffic Using Fiber Bragg Grating Sensors Massimo Leonardo Filograno, Pedro Corredera Guillén, Alberto Rodríguez-Barrios, Sonia Martín-López, Miguel Rodríguez-Plaza, Álvaro Andrés-Alguacil, and Miguel González-Herráez Abstract—In this work, we present field tests concerning the application of fiber Bragg grating (FBG) sensors for the moni- toring of railway traffic. The test campaigns are performed on the Spanish high-speed line Madrid–Barcelona, with different types of trains (S-102 TALGO-BOMBARDIER, S-103 SIEMENS-VE- LARO, and S-120 CAF). We located the FBG sensors in the rail track at 70 km from Madrid in the country side, where the trains primarily are tested during commercial operation with maximum speeds between 250–300 km/h. The FBG sensor interrogation system used allows the simultaneous monitoring of four FBG sensors at 8000 samples/s. The different position of the FBG sensors in relation with the rail can be used for different purposes such as train identification, axle counting, speed and acceleration detection, wheel imperfections monitoring, and dynamic load calculation. Index Terms—Bragg gratings, comfort, dynamic load, high- speed train, optical fiber, out-of-roundness, plane, rail, structural monitoring, wear, weight in motion. I. INTRODUCTION O VER THE LAST few decades, rail transport has become one of the most effective means of transporting passen- gers and goods. According to recent statistics, the number of passengers will be doubled within ten years, while the volume of goods transported by railway will be tripled [1]. Thus, it is ex- pected that the axle load will strongly increase in the next years, and the trains will operate at faster speeds. This fact puts major pressure on the infrastructures and therefore innovative main- taining and inspection techniques are required. Manuscript received November 15, 2010; revised February 02, 2011; ac- cepted March 07, 2011. Date of publication April 05, 2011; date of current ver- sion November 29, 2011. This work was supported in part by Ministerio de Fo- mento through project MIFFO (reference FOM/3774/2007 under the Strategic Infrastructure and Transport Program, PEIT). We also acknowledge financial support from the Ministerio de Educación y Ciencia through projects TEC2006- 09990-C02-01 and TEC2006-09990-C02-02, and the support from the Comu- nidad Autónoma de Madrid through project FACTOTEM2_CM (S2009/ESP- 1781). The associate editor coordinating the review of this paper and approving it for publication was Dr. William MacPherson. M. L. Filograno, P. Corredera Guillén, and Dra. S. Martin-Lopez are with the Instituto de Óptica “Daza de Valdés,” Consejo Superiorde Investigaciones Científicas (CSIC), Madrid 28006, Spain (e-mail: massimo.filograno@io. cfmac.csic.es; [email protected]; [email protected]; [email protected]). A. Rodríguez-Barrios and M. González-Herráez are with the Departa- mento de Electrónica, Universidad de Alcalá, Escuela Politécnica DO-231, Madrid 28871, Spain, Tel.: +34 91 885 65 43; Email: [email protected]; [email protected]). M. Rodríguez-Plaza and Á. Andrés-Alguacilis are with the Innovation and Technology Direction, Administrador de Infraestructuras Ferroviarias, ADIF, Madrid 28045, Spain (e-mail: [email protected]; [email protected]). Digital Object Identifier 10.1109/JSEN.2011.2135848 Conventional monitoring systems in railway infrastructures use strain gauge sensors to detect train dynamic load, train speed, axle load, and wheel flats. The working principle of the strain gauge sensor is based in a variation of resistance caused by the strain transmitted to the rail during the train passage. While this sensing technology is well-known and consolidated, it is also inefficient for railway systems since it can be adversely affected by electromagnetic interferences [2]. Optical fiber sensors have gained increased acceptance in the civil engineering domain and now their use is widespread for structural health monitoring. Other application domains include aerospace, marine, oil and gas, and smart structures. A partic- ularly new and interesting area of application of optical fiber sensors is railways. In opposition to conventional strain gauges, fiber Bragg grating (FBG) sensors assure immunity to electro- magnetic fields and simple multiplexing, allowing the use of tens of sensors in a single fiber cable. Additionally, the possi- bility of remote operation is key in the railway environment. Previous works using FBG sensors for railway applications have been reported [3]–[5]. These works showed the possibility to as- sess the health of the rail and wheels using FBGs. It was also shown that FBG-based sensing systems could be used as axle counters and imbalance detectors. In [6] and [7], the FBGs were used to assess railway bridges. In this work, we report on some tests using FBGs for dynamic load measurements in high-speed conditions ( km/h). These tests are carried out in the Madrid–Barcelona high-speed railway line, with trains running at commercial operation speeds. II. HIGH-SPEED LINE MADRID–BARCELONA:DESCRIPTION OF THE INSTRUMENTED SECTOR A set of FBG sensors were placed in different positions in relation to the rail, with the purpose of testing the deforma- tion on the rail caused by the trains in realistic conditions and high-speed operation. The final aim is to improve the current strategies of maintenance and increase safety level of the high- speed railway network. To install the sensors, a straight sector was selected near the Brihuega High-Speed Maintenance Base, around the KP 69+500 of the Madrid–Barcelona High-Speed Line, comprising the transition between an embankment and a trench. The section selected for the tests has a technical building to support the testing campaigns. There are two tracks, both selected for instrumentation. These tracks are considered as representative of the high-speed line be- cause they are in good condition and do not require usual main- 1530-437X/$26.00 © 2011 IEEE

Welcome message from author
This document is posted to help you gain knowledge. Please leave a comment to let me know what you think about it! Share it to your friends and learn new things together.
Transcript
IEEE SENSORS JOURNAL, VOL. 12, NO. 1, JANUARY 2012 85
Real-Time Monitoring of Railway Traffic UsingFiber Bragg Grating Sensors
Massimo Leonardo Filograno, Pedro Corredera Guillén, Alberto Rodríguez-Barrios, Sonia Martín-López,Miguel Rodríguez-Plaza, Álvaro Andrés-Alguacil, and Miguel González-Herráez
Abstract—In this work, we present field tests concerning theapplication of fiber Bragg grating (FBG) sensors for the moni-toring of railway traffic. The test campaigns are performed on theSpanish high-speed line Madrid–Barcelona, with different typesof trains (S-102 TALGO-BOMBARDIER, S-103 SIEMENS-VE-LARO, and S-120 CAF). We located the FBG sensors in the railtrack at 70 km from Madrid in the country side, where the trainsprimarily are tested during commercial operation with maximumspeeds between 250–300 km/h. The FBG sensor interrogationsystem used allows the simultaneous monitoring of four FBGsensors at 8000 samples/s. The different position of the FBGsensors in relation with the rail can be used for different purposessuch as train identification, axle counting, speed and accelerationdetection, wheel imperfections monitoring, and dynamic loadcalculation.
Index Terms—Bragg gratings, comfort, dynamic load, high-speed train, optical fiber, out-of-roundness, plane, rail, structuralmonitoring, wear, weight in motion.
I. INTRODUCTION
O VER THE LAST few decades, rail transport has becomeone of the most effective means of transporting passen-
gers and goods. According to recent statistics, the number ofpassengers will be doubled within ten years, while the volumeof goods transported by railway will be tripled [1]. Thus, it is ex-pected that the axle load will strongly increase in the next years,and the trains will operate at faster speeds. This fact puts majorpressure on the infrastructures and therefore innovative main-taining and inspection techniques are required.
Manuscript received November 15, 2010; revised February 02, 2011; ac-cepted March 07, 2011. Date of publication April 05, 2011; date of current ver-sion November 29, 2011. This work was supported in part by Ministerio de Fo-mento through project MIFFO (reference FOM/3774/2007 under the StrategicInfrastructure and Transport Program, PEIT). We also acknowledge financialsupport from the Ministerio de Educación y Ciencia through projects TEC2006-09990-C02-01 and TEC2006-09990-C02-02, and the support from the Comu-nidad Autónoma de Madrid through project FACTOTEM2_CM (S2009/ESP-1781). The associate editor coordinating the review of this paper and approvingit for publication was Dr. William MacPherson.
M. L. Filograno, P. Corredera Guillén, and Dra. S. Martin-Lopez are withthe Instituto de Óptica “Daza de Valdés,” Consejo Superior de InvestigacionesCientíficas (CSIC), Madrid 28006, Spain (e-mail: [email protected]; [email protected]; [email protected];[email protected]).
A. Rodríguez-Barrios and M. González-Herráez are with the Departa-mento de Electrónica, Universidad de Alcalá, Escuela Politécnica DO-231,Madrid 28871, Spain, Tel.: +34 91 885 65 43; Email: [email protected];[email protected]).
M. Rodríguez-Plaza and Á. Andrés-Alguacilis are with the Innovation andTechnology Direction, Administrador de Infraestructuras Ferroviarias, ADIF,Madrid 28045, Spain (e-mail: [email protected]; [email protected]).
Digital Object Identifier 10.1109/JSEN.2011.2135848
Conventional monitoring systems in railway infrastructuresuse strain gauge sensors to detect train dynamic load, trainspeed, axle load, and wheel flats. The working principle of thestrain gauge sensor is based in a variation of resistance causedby the strain transmitted to the rail during the train passage.While this sensing technology is well-known and consolidated,it is also inefficient for railway systems since it can be adverselyaffected by electromagnetic interferences [2].
Optical fiber sensors have gained increased acceptance in thecivil engineering domain and now their use is widespread forstructural health monitoring. Other application domains includeaerospace, marine, oil and gas, and smart structures. A partic-ularly new and interesting area of application of optical fibersensors is railways. In opposition to conventional strain gauges,fiber Bragg grating (FBG) sensors assure immunity to electro-magnetic fields and simple multiplexing, allowing the use oftens of sensors in a single fiber cable. Additionally, the possi-bility of remote operation is key in the railway environment.Previous works using FBG sensors for railway applications havebeen reported [3]–[5]. These works showed the possibility to as-sess the health of the rail and wheels using FBGs. It was alsoshown that FBG-based sensing systems could be used as axlecounters and imbalance detectors. In [6] and [7], the FBGs wereused to assess railway bridges. In this work, we report on sometests using FBGs for dynamic load measurements in high-speedconditions ( km/h). These tests are carried out in theMadrid–Barcelona high-speed railway line, with trains runningat commercial operation speeds.
II. HIGH-SPEED LINE MADRID–BARCELONA: DESCRIPTION OF
THE INSTRUMENTED SECTOR
A set of FBG sensors were placed in different positions inrelation to the rail, with the purpose of testing the deforma-tion on the rail caused by the trains in realistic conditions andhigh-speed operation. The final aim is to improve the currentstrategies of maintenance and increase safety level of the high-speed railway network. To install the sensors, a straight sectorwas selected near the Brihuega High-Speed Maintenance Base,around the KP 69+500 of the Madrid–Barcelona High-SpeedLine, comprising the transition between an embankment and atrench. The section selected for the tests has a technical buildingto support the testing campaigns.
There are two tracks, both selected for instrumentation. Thesetracks are considered as representative of the high-speed line be-cause they are in good condition and do not require usual main-
1530-437X/$26.00 © 2011 IEEE
86 IEEE SENSORS JOURNAL, VOL. 12, NO. 1, JANUARY 2012
TABLE IMAIN PROPRIETIES OF THE TESTED TRAINS
tenance work. The subgrade at this site is a geological formationdesignated as “Paramo limestone.”
The traffic conditions allow recording approximately 27 trainpassages every day on track I, and another 27 on track II. Thespeeds of these trains in the measurement section are in the in-terval ranging between 200 and 300 km/h. The trains were pri-marily tested during commercial operation. The different trainstested in the experimental campaigns are described in Table I.These three train types due to their characteristics, present dif-ferent values of the measurable parameters (weight per axle,number of axle, length, and distance between axles).
In relation to the high-speed line superstructure components,the construction parameters applied have been very demandingso as to allow the development of maximum speeds of 350 km/hin commercial service (currently limited to 300 km/h) and toguarantee the interoperability of this infrastructure in accor-dance with European legislation.
The tracks are laid on ballast, with a minimum thickness of35 cm. The sleepers are of single block AI-99 type, prefabri-cated and made of prestressed concrete with the following char-acteristics: weight of 320 kg, length of 2600 mm, maximumbase width of 300 mm, and minimum height of 242 mm. Thedistance between sleeper axes is 0.60 m.
The rail used is the 60E1 type (UIC 60) with a hardness2607300 HBW and tensile strength larger than 880 N/mm2.
The stiffness of the track must be limited in order to reducethe vertical dynamic forces between wheels and rails. This isachieved by the use of rail pads under the rail. With this aim, thepads used in this line have 7 mm thickness and a static verticalstiffness of 100 kN/mm.
III. FBG SENSORS AND INTERROGATION UNIT
FBGs are very small, short-length single-mode fiber devicesthat display a periodic refractive-index variation in its core [7],[9]. When a broadband light transmits through the optical fiber,the FBG written in the core reflects back a wavelength ( ) de-pending on the Bragg condition , where is theeffective refractive index of the core and is the grating period.The shift in the reflected wavelength of the Bragg grating
sensor is approximately linear to any applied strain or temper-ature (within a certain measurement range). Therefore, the de-tection technique used by the monitoring system is to identifythis wavelength shift as a function of strain or temperature.
The FBG sensors used for this application are 7 mm long witha reflectivity of more than 75% and bandwidths of 0.2 nm. Pre-vious laboratory experiments proved that the FBGs used showa strain sensitivity of 1.2 (maximum strain admitted
) and a temperature sensitivity of 10 C. Anotherunusual characteristics of the FBGs used is that the reflectionspectrum has a Gaussian peak profile with a side lobe suppres-sion .
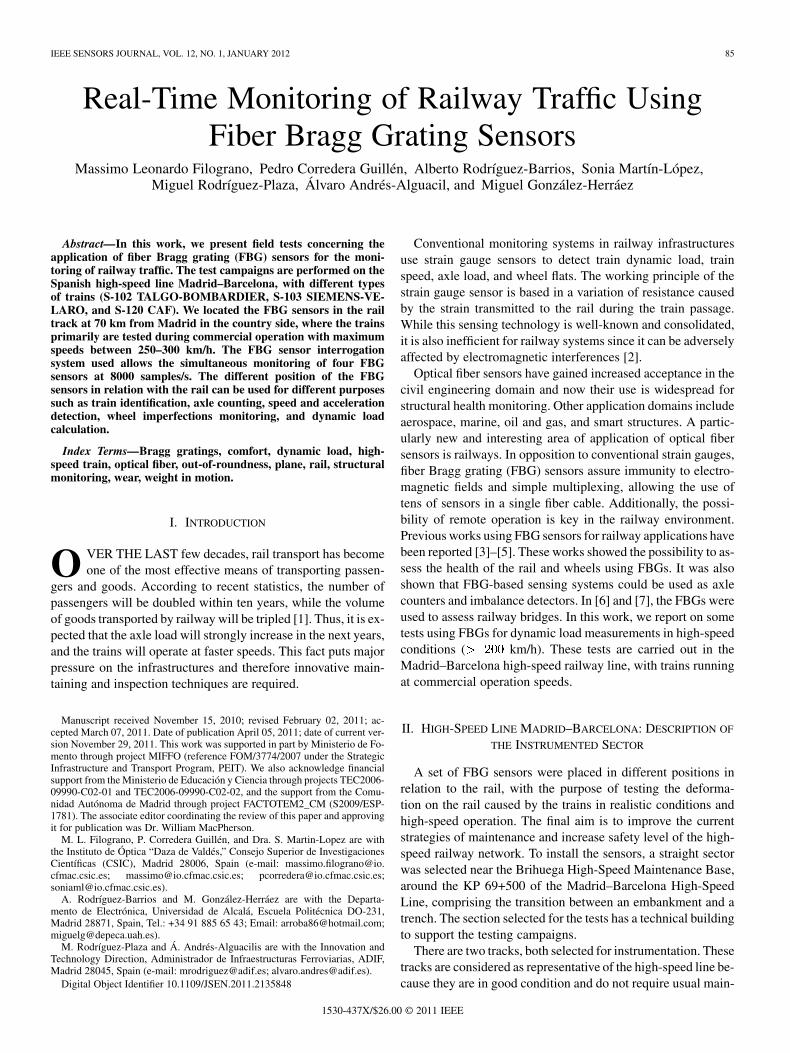
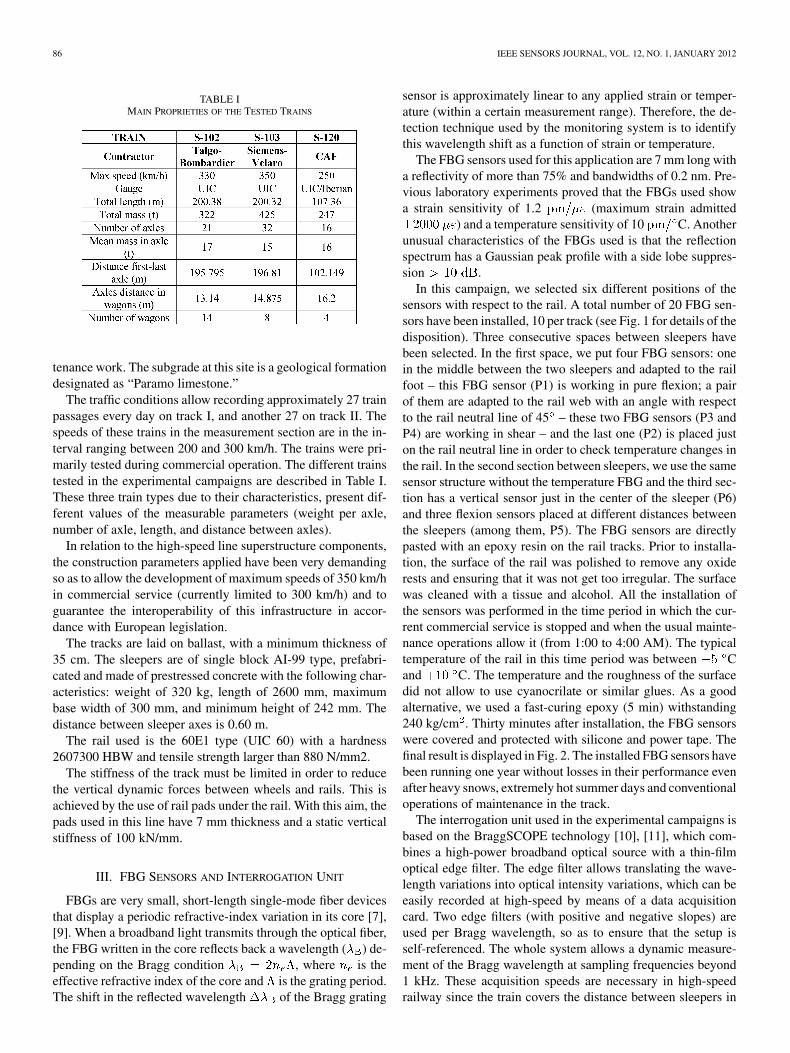
In this campaign, we selected six different positions of thesensors with respect to the rail. A total number of 20 FBG sen-sors have been installed, 10 per track (see Fig. 1 for details of thedisposition). Three consecutive spaces between sleepers havebeen selected. In the first space, we put four FBG sensors: onein the middle between the two sleepers and adapted to the railfoot – this FBG sensor (P1) is working in pure flexion; a pairof them are adapted to the rail web with an angle with respectto the rail neutral line of 45 – these two FBG sensors (P3 andP4) are working in shear – and the last one (P2) is placed juston the rail neutral line in order to check temperature changes inthe rail. In the second section between sleepers, we use the samesensor structure without the temperature FBG and the third sec-tion has a vertical sensor just in the center of the sleeper (P6)and three flexion sensors placed at different distances betweenthe sleepers (among them, P5). The FBG sensors are directlypasted with an epoxy resin on the rail tracks. Prior to installa-tion, the surface of the rail was polished to remove any oxiderests and ensuring that it was not get too irregular. The surfacewas cleaned with a tissue and alcohol. All the installation ofthe sensors was performed in the time period in which the cur-rent commercial service is stopped and when the usual mainte-nance operations allow it (from 1:00 to 4:00 AM). The typicaltemperature of the rail in this time period was between Cand C. The temperature and the roughness of the surfacedid not allow to use cyanocrilate or similar glues. As a goodalternative, we used a fast-curing epoxy (5 min) withstanding240 kg/cm . Thirty minutes after installation, the FBG sensorswere covered and protected with silicone and power tape. Thefinal result is displayed in Fig. 2. The installed FBG sensors havebeen running one year without losses in their performance evenafter heavy snows, extremely hot summer days and conventionaloperations of maintenance in the track.
The interrogation unit used in the experimental campaigns isbased on the BraggSCOPE technology [10], [11], which com-bines a high-power broadband optical source with a thin-filmoptical edge filter. The edge filter allows translating the wave-length variations into optical intensity variations, which can beeasily recorded at high-speed by means of a data acquisitioncard. Two edge filters (with positive and negative slopes) areused per Bragg wavelength, so as to ensure that the setup isself-referenced. The whole system allows a dynamic measure-ment of the Bragg wavelength at sampling frequencies beyond1 kHz. These acquisition speeds are necessary in high-speedrailway since the train covers the distance between sleepers in
FILOGRANO et al.: REAL-TIME MONITORING OF RAILWAY TRAFFIC USING FIBER BRAGG GRATING SENSORS 87
Fig. 1. Disposition of ten FBG sensors along one of the rails.
Fig. 2. A section between sleepers covered and protected.
less than 10 ms. By using add/drop wavelength-division mul-tiplexing, it also allows the measurement of four sensors con-nected in series, operating within predefined wavelength bands.The central wavelengths of the bands used in our experimentare: 1541.49, 1547.86, 1554.28 and 1560.75 nm. The opticalinterrogation unit is connected to a PXI architecture system, soit is possible to increase the number of electrical and opticalswitching modules in the extra slots of the rack. For the elec-trical acquisition, NI-PXI6040 data acquisition cards are used.A special software application running under LabView (Na-tional Instruments) was developed specifically for controllingthe source and detector system and for acquiring and savingthe data from each sensor. This software allows reading andstoring the data in wavelength variation of the four sensors upto a sampling frequency of 8000 samples/s in each of the foursensors. The data processing is made by a PC that records thetrain footprint traces and converts them to relative deformationunits ( ). The PC and the interrogation unit were placed in thetechnical building around 40 m away from the tracks. In opposi-tion to conventional electrical sensors, the virtually transparentbehavior of optical fibers allows to have the interrogation unitvery far from the measured points without any degradation onthe measurement performance.
The FBG sensors were connected by optical cables to an op-tical fiber backbone that runs below tracks to the auxiliary office.
In this office a PC and the demodulation unit read the sensors,store the data and display the train footprints. The passage ofthe trains displayed and stored with this PC can also be observedwith any other computer in real time through conventional wire-less communication technology.
In order to trigger the measurements, we do not use any extraelectrical or optical signal. Our system permanently takes mea-surements and the storage is activated whenever a train event isdetected. Only the traces which present train passing are stored.This way we can avoid the installation of additional presencesensors and solve the problem of synchronization.
IV. RESULT AND DISCUSSION
Samples of the traces detected by the sensors in positions P1,P3, P4, P5, and P6 are displayed in Fig. 3 (Bragg wavelengthshift and equivalent strain versus time). The trace recorded withP2 has no relevant mechanical response under the train passage(as expected, since it is placed in the neutral line of the rail). Thisis a good choice then to detect the ambient temperature changes.These changes are nevertheless significant in time scales muchlonger than the train passage, so the information given by thissensor is not strictly necessary for the adequate determinationof strain in the rail. Fig. 4 shows temperature changes recordedby these sensors throughout the first hours of the morning of asunny day in March.
Each individual wheel passing through the FBG sensor isclearly identifiable. The minimum induced strain due to a wheelpassing on the track is more than 140 pm – peak to peak- and thenoise in the determination of the Bragg wavelength is less than10 pm, giving a SNR better than 12 dB (1.2 pm means 1 ).
These FBG sensor traces show a high immunity to electro-magnetic fields. No noise coming from the catenary can be seen,in comparison with the one appearing in conventional straingauges in Fig. 5.
The analysis of these traces can lead to very interesting appli-cations in the railway domain, and in particular for high-speedsystems. In the following, we identify and validate several ofthem.
A. Axle Counter and Train Type Identification
Axle counting is an elementary security measure in railwaycontrol. As a train passes, the number of axles is counted bymeans of a magnetic sensor. Two of such counting units deter-mine when the train is on a section or not. In high-speed trains,

88 IEEE SENSORS JOURNAL, VOL. 12, NO. 1, JANUARY 2012
Fig. 3. Traces (time versus wavelength variation and time versus strain) ob-tained from sensors P1, P3, P4, P5, and P6 for a S103 train circulating withvelocity between 250 and 300 km/h.
magnetic brakes are used in the train vehicles. These are com-posed of large metal pieces mounted on the bogie of the vehicle,just a few centimeters above the track. Conventional axle coun-ters can sometimes detect these as another axle, leading to falsealarms. A way to avoid these false alarms would be to use op-tical axle counters.
Axle counting using the FBG sensing system shown above isobtained by counting the number of successive “rapid” shifts in
Fig. 4. Temperature variation of the rail between 5:00 and 11:00 AM in a sunnymorning of March.
Fig. 5. Strain gauge sensors trace obtained at train passage. The noise close tohorizontal line is due to electromagnetic interferences.
the wavelength of the optical signal reflected by the FBG. Bycomparing the number of axles counted and the characteristicsof the trains (Table I shows the principal differences betweentrains), we can also use this system to identify the type of traincirculating in the network. We have employed the FBG sensingsystem as a regular axle counter and have never observed anymiscount so far (operation over more than one year withoutfaults).
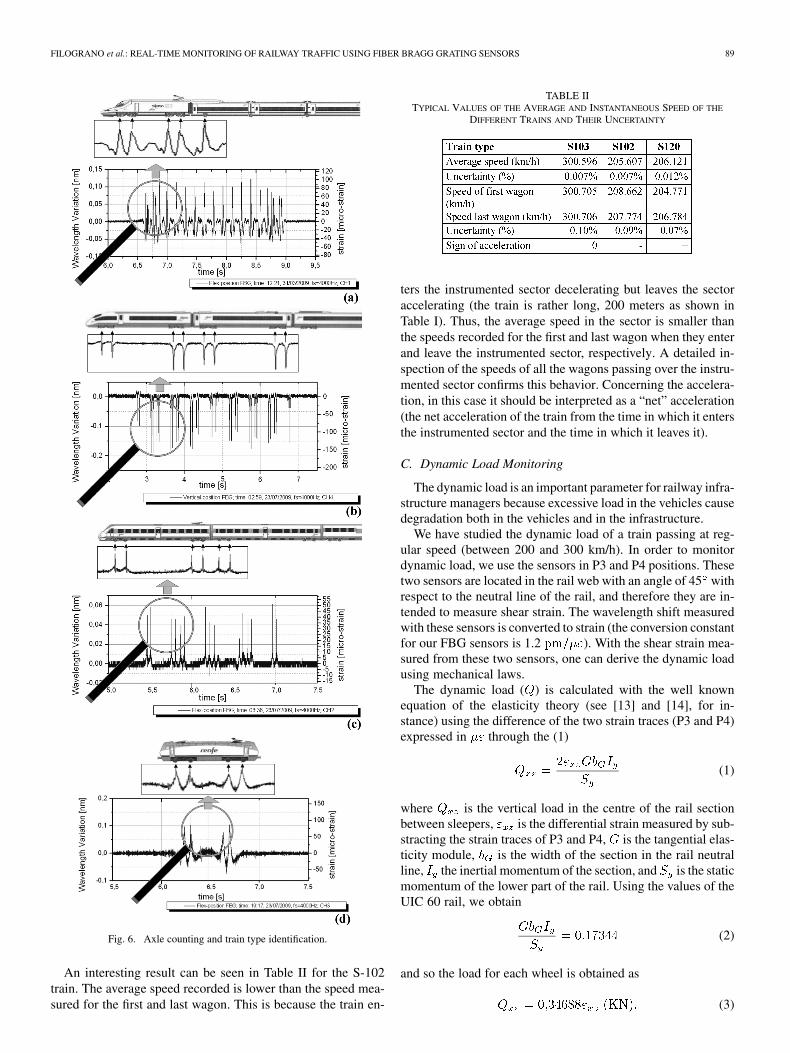
Fig. 6 shows some examples of axle counting and train typeidentification using different sensors and different trains. InFig. 6(a), we identified a S102 train (21 axles, 4 axles in thetractor head, 13 axles in 12 wagons, and 4 axles in the backtractor) using sensor P1. In Fig. 6(b), we use the sensor P4 toidentify a train type S103 (this train has distributed tractionin 32 axles, 4 axles in each wagon up to a total of 8 wagons).In Fig. 6(c), we use a sensor in position P5 that identifies aS120 train (the traction is distributed in 16 axles, four axles perwagon). Finally, in Fig. 6(d), we use a sensor in position P1that identifies a maintenance locomotive running at 70 km/h.
B. Train Speed and Acceleration
After having identified the train and given that the distancesbetween the wheels are known for each specific kind of train,the train speed can be simply computed by using the trace ob-tained with just one FBG sensor, independently of its positionin the rail. The average speed of the trains is calculated from thetotal distance between the first and last axle divided by the timespent between both detections. The instantaneous speed is ob-tained similarly using the first and the last axle but in the samewagons, so comparing the first car speed and last car speed, wecalculate the acceleration. Table II shows some of the results ob-tained. The uncertainty has been calculated using the time reso-lution of the acquisition system, the calibration uncertainty, andmechanical tolerances [12].
FILOGRANO et al.: REAL-TIME MONITORING OF RAILWAY TRAFFIC USING FIBER BRAGG GRATING SENSORS 89
Fig. 6. Axle counting and train type identification.
An interesting result can be seen in Table II for the S-102train. The average speed recorded is lower than the speed mea-sured for the first and last wagon. This is because the train en-
TABLE IITYPICAL VALUES OF THE AVERAGE AND INSTANTANEOUS SPEED OF THE
DIFFERENT TRAINS AND THEIR UNCERTAINTY
ters the instrumented sector decelerating but leaves the sectoraccelerating (the train is rather long, 200 meters as shown inTable I). Thus, the average speed in the sector is smaller thanthe speeds recorded for the first and last wagon when they enterand leave the instrumented sector, respectively. A detailed in-spection of the speeds of all the wagons passing over the instru-mented sector confirms this behavior. Concerning the accelera-tion, in this case it should be interpreted as a “net” acceleration(the net acceleration of the train from the time in which it entersthe instrumented sector and the time in which it leaves it).
C. Dynamic Load Monitoring
The dynamic load is an important parameter for railway infra-structure managers because excessive load in the vehicles causedegradation both in the vehicles and in the infrastructure.
We have studied the dynamic load of a train passing at reg-ular speed (between 200 and 300 km/h). In order to monitordynamic load, we use the sensors in P3 and P4 positions. Thesetwo sensors are located in the rail web with an angle of 45 withrespect to the neutral line of the rail, and therefore they are in-tended to measure shear strain. The wavelength shift measuredwith these sensors is converted to strain (the conversion constantfor our FBG sensors is 1.2 ). With the shear strain mea-sured from these two sensors, one can derive the dynamic loadusing mechanical laws.
The dynamic load ( ) is calculated with the well knownequation of the elasticity theory (see [13] and [14], for in-stance) using the difference of the two strain traces (P3 and P4)expressed in through the (1)
(1)
where is the vertical load in the centre of the rail sectionbetween sleepers, is the differential strain measured by sub-stracting the strain traces of P3 and P4, is the tangential elas-ticity module, is the width of the section in the rail neutralline, the inertial momentum of the section, and is the staticmomentum of the lower part of the rail. Using the values of theUIC 60 rail, we obtain
(2)
and so the load for each wheel is obtained as
(3)
90 IEEE SENSORS JOURNAL, VOL. 12, NO. 1, JANUARY 2012
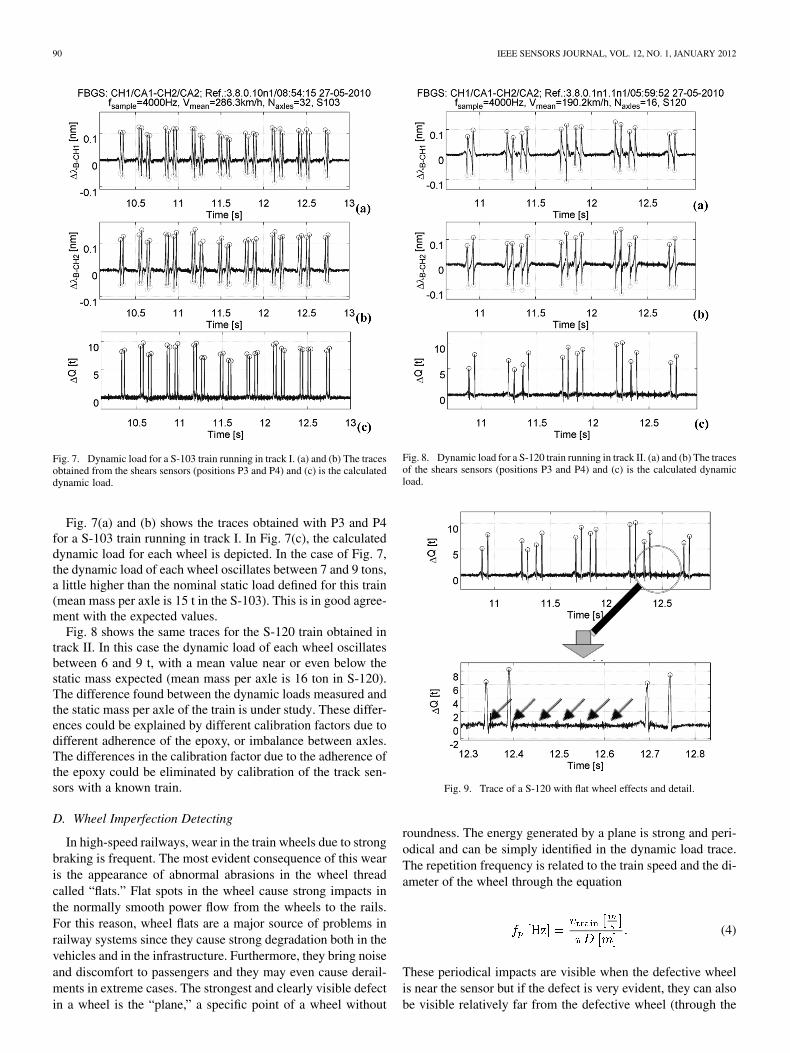
Fig. 7. Dynamic load for a S-103 train running in track I. (a) and (b) The tracesobtained from the shears sensors (positions P3 and P4) and (c) is the calculateddynamic load.
Fig. 7(a) and (b) shows the traces obtained with P3 and P4for a S-103 train running in track I. In Fig. 7(c), the calculateddynamic load for each wheel is depicted. In the case of Fig. 7,the dynamic load of each wheel oscillates between 7 and 9 tons,a little higher than the nominal static load defined for this train(mean mass per axle is 15 t in the S-103). This is in good agree-ment with the expected values.
Fig. 8 shows the same traces for the S-120 train obtained intrack II. In this case the dynamic load of each wheel oscillatesbetween 6 and 9 t, with a mean value near or even below thestatic mass expected (mean mass per axle is 16 ton in S-120).The difference found between the dynamic loads measured andthe static mass per axle of the train is under study. These differ-ences could be explained by different calibration factors due todifferent adherence of the epoxy, or imbalance between axles.The differences in the calibration factor due to the adherence ofthe epoxy could be eliminated by calibration of the track sen-sors with a known train.
D. Wheel Imperfection Detecting
In high-speed railways, wear in the train wheels due to strongbraking is frequent. The most evident consequence of this wearis the appearance of abnormal abrasions in the wheel threadcalled “flats.” Flat spots in the wheel cause strong impacts inthe normally smooth power flow from the wheels to the rails.For this reason, wheel flats are a major source of problems inrailway systems since they cause strong degradation both in thevehicles and in the infrastructure. Furthermore, they bring noiseand discomfort to passengers and they may even cause derail-ments in extreme cases. The strongest and clearly visible defectin a wheel is the “plane,” a specific point of a wheel without
Fig. 8. Dynamic load for a S-120 train running in track II. (a) and (b) The tracesof the shears sensors (positions P3 and P4) and (c) is the calculated dynamicload.
Fig. 9. Trace of a S-120 with flat wheel effects and detail.
roundness. The energy generated by a plane is strong and peri-odical and can be simply identified in the dynamic load trace.The repetition frequency is related to the train speed and the di-ameter of the wheel through the equation
(4)
These periodical impacts are visible when the defective wheelis near the sensor but if the defect is very evident, they can alsobe visible relatively far from the defective wheel (through the

FILOGRANO et al.: REAL-TIME MONITORING OF RAILWAY TRAFFIC USING FIBER BRAGG GRATING SENSORS 91
vibrations induced in the rail). An example of a plane wheel isvisible in Fig. 9(a) near and in detail in Fig. 9(b). Thewheel with plane is probably in .
V. CONCLUSION
In conclusion, we have shown that fiber optic sensing tech-nology is adequate for railway security monitoring systems. Inthis particular paper, we have presented a preliminary study onthe use of FBG sensors for monitoring railway footprints ofhigh-speed trains (passing at speeds between 200 and 300 km/h,in the high-speed line Madrid–Barcelona). The results illustratethat there is a consistence between the signals recorded and thewheel-rail interactions under the same operational conditions.
The health of the rail, like the wheel, can influence the defor-mation of the rail following the passage of the train and there-fore they can both be diagnosed by analyzing and comparing thestrain information measured by the FBG sensors along the time.We have demonstrated the possibility to use these sensors placedin different positions in the rail and track to know: temperatureof rail, train speed and acceleration, axle counter and train typeidentification, dynamic load estimation, and wheel defects. Fur-ther studies must be done in order to improve the dynamic loadestimation results and to refine the thresholds necessary to clas-sify a wheel as “defective.”
The experience obtained from this study also highlights thepotential difficulties in realizing this remote-sensing setup inpractice. This is undoubtedly very useful for defining furtherworks and seeking for improvements on both effectiveness andreliability of defect detection.
REFERENCES
[1] [Online]. Available: http://www.uic.org/[2] A. D. Kersey, M. A. Davis, H. J. Patrick, M. LeBlanc, K. P. Koo, C.
G. Askins, M. A. Putnam, and E. J. Friebele, “Fiber grating sensors,”J. Lightw. Technol., vol. 15, no. 8, pp. 1442–1463, Aug. 1997.
[3] K. Y. Lee, K. K. Lee, and S. L. Ho, “Exploration of using FBG sensorfor axle counter in railway engineering,” WSEAS Trans. Syst., vol. 6,pp. 2440–2447, 2004.
[4] S. L. Ho, K. Y. Lee, K. K. Lee, H. Y. Tam, W. H. Chung, S. Y. Liu,C. M. Yip, and T. K. Ho, “A comprehensive condition monitoringof modern railway,” in Proc. IET Int. Conf. Railway Condition Mon-itoring, 2006, pp. 125–129.
[5] H. Y. Tam, S. Y. Liu, B. O. Guan, W. H. Chung, T. H. T. Chan, and L.K. Cheng, “Fiber Bragg grating sensors for structural and Raihway ap-plications,” in Engineering Structures, Internation Society for OpticalEngineering (SPIE), Beijing, China, Nov. 8–12, 2004, pp. 85–97.
[6] T. H. T. Chan, L. Yu, H. Y. Tam, Y. Q. Ni, S. Y. Liu, W. H. Chung, andL. K. Cheng, “Fiber Bragg grating sensors for structural health moni-toring of Tsing Ma bridge: Background and experimental observation,”Eng. Structures, vol. 28, pp. 648–659, 2006.
[7] C. Barbosa, N. Costa, L. A. Ferreira, F. M. Araujo, H. Varum, A. Costa,C. Fernandes, and H. Rodrigues, “Weldable fibre Bragg grating sensorsfor steel bridge monitoring,” Meas. Sci. Technol., vol. 19, p. 125305,2008.
[8] J. Dakin and B. Culshaw, Optical Fiber Sensor: Principles and Com-ponents. Norwood, MA: Artech House, 1988.
[9] J. M. Lopez – Higuera, Ed., Handbook of Optical Fiber Sensing Tech-nology New York, Wiely, 2004.
[10] [Online]. Available: http://www.fibersensing.com/[11] M. Kreuzer, Strain Measurement With Fiber Bragg Grating Sensors.
Darmstadt, Germany: HBM, 2007.[12] P. Salgado, M. L. Hernanz-Sanjuán, S. Martín López, and P. Corredera,
“Desarollo de un método de calibración de interrogadores de redes deBragg en fibra óptica,” in Simposio de Metrología, Oct. 27 al 29, 2010,SM2010-S3B-3.
[13] A. López-Pita, Infraestructuras Ferroviarias. Barcelona, Spain: Edi-ciones UPC, 2006.
[14] B. Glisic and D. Inaudi, Fibre Optic Methods for Structural HealthMonitoring. New York: Wiley, 2007
.
Massimo Leonardo Filograno was born inMesagne, Italy, in January 1980. He received theLaurea (five year program) degree in electronicengineering from the Polytechnic of Bari, Bari,Italy, in 2009, discussing a thesis entitled “RealTime Monitoring of Railway Infrastructures UsingTechnology Based on Fiber Bragg Grating.” He iscurrently working towards the Ph.D. degree at theDepartment of Information Engineering, Universityof Alcala, Madrid, Spain.
From September 2008 until September 2010, hewas with the GRIFO (Group of Photonics Engineering), University of Alcala.He is currently working at the Spanish National Research Council (CSIC). Hisprincipal research interests include optical fiber sensors applied to high-speedtrain systems.
Pedro Corredera Guillén received the B.Sc. andPh.D. degrees in physics from the University ofSalamanca, Salamanca, Spain, in 1985 and 1989,respectively.
In 1985, he joined the Institute of Optics (CSIC),and the Institute of Applied Physics (CSIC)(1995–2010). He is currently a Research Managerof the Fiber Optics Laboratory. His current researchinterests include fiber-optic measurements, opticalfiber sensors, nonlinear fiber optics, and IR radiom-etry and detection.
Alberto Rodríguez Barrios was born in 1986. Hereceived the first level degree in industrial engineerfrom the Polytechnic University of Madrid, Madrid,Spain, in 2007 and the M.B.A. degree from the Uni-versidad Complutense de Madrid, Madrid, Spain, in2011.
His current research interests include fiber-opticsensors applied to structural systems.
Sonia Martín López received the Ph.D. degree from the Universidad Com-plutense de Madrid, Madrid, Spain, in May 2006. The topic of her Ph.D. disser-tation was on experimental and theoretical understanding of continuous-wavepumped supercontinuum generation in optical fibers.
She was with the Nanophotonics and Metrology Laboratory, Ecole Polytech-nique Federale de Lausanne, Switzerland. She is currently engaged as a Postdoc-toral Researcher in the Applied Physics Institute, Spanish Council for Research,Madrid, Spain. She is author or coauthor of over 30 papers in international ref-ereed journals and conference contribution. Her current research interests in-clude nonlinear fiber optics.
Miguel Rodríguez-Plaza, photograph and biography not available at the timeof publication.
Álvaro Andrés-Alguacil, photograph and biography not available at the timeof publication.
92 IEEE SENSORS JOURNAL, VOL. 12, NO. 1, JANUARY 2012
Miguel González-Herráez received the M.Eng. and D.Eng. degrees fromthe Polytechnic University of Madrid, Madrid, Spain, in 2000 and 2004,respectively.
While working towards the D.Eng. degree, he worked first as a Research As-sistant and then a Postdoctoral Fellow in the Applied Physics Institute, SpanishCouncil for Research, Madrid, Spain, and had several long stays at the Nanopho-tonics and Metrology Laboratory, Ecole Polytechnique Federale de Lausanne,Switzerland. In October 2004, he was appointed Assistant Professor in the De-partment of Electronics, University of Alcalá, Madrid, Spain, where he was pro-moted to Associate Professor in June 2006. He is the author or coauthor of over100 papers in international refereed journals and conference contributions andhas given several invited talks at international conferences. His research inter-ests cover the wide field of nonlinear interactions in optical fibers.
Related Documents


![Fiber Bragg Grating Sensors - Optical Sensing · Fiber Bragg Grating Sensors. ... Bragg grating production Commercial phase mask [Ibsen] with central pitch of 1061.27 nm and operating](https://static.cupdf.com/doc/110x72/5eb72771ad990c1bc0201c29/fiber-bragg-grating-sensors-optical-fiber-bragg-grating-sensors-bragg-grating.jpg)