REAL-TIME METABOLIC FLUX IN CHRONIC LYMPHOCYTIC LEUKAEMIA CELLS ADAPTING TO THE HYPOXIC NICHE by KATARZYNA MAŁGORZATA KOCZUŁA A thesis submitted to the University of Birmingham for the degree of DOCTOR OF PHILOSOPHY School of Cancer Sciences College of Medical and Dental Sciences University of Birmingham February 2015

Welcome message from author
This document is posted to help you gain knowledge. Please leave a comment to let me know what you think about it! Share it to your friends and learn new things together.
Transcript
REAL-TIME METABOLIC FLUX IN CHRONIC
LYMPHOCYTIC LEUKAEMIA CELLS ADAPTING TO
THE HYPOXIC NICHE
by
KATARZYNA MAŁGORZATA KOCZUŁA
A thesis submitted to the University of Birmingham for the degree of
DOCTOR OF PHILOSOPHY
School of Cancer Sciences
College of Medical and Dental Sciences
University of Birmingham
February 2015
University of Birmingham Research Archive
e-theses repository This unpublished thesis/dissertation is copyright of the author and/or third parties. The intellectual property rights of the author or third parties in respect of this work are as defined by The Copyright Designs and Patents Act 1988 or as modified by any successor legislation. Any use made of information contained in this thesis/dissertation must be in accordance with that legislation and must be properly acknowledged. Further distribution or reproduction in any format is prohibited without the permission of the copyright holder.

Abstract
ABSTRACT
Although knowledge of metabolic adaptations in cancer has increased
dramatically, little is known about the spontaneous adoptive adaptations of cancer
cells to changing conditions in the body. This is particularly important for chronic
lymphocytic leukaemia (CLL) cells which continually circulate between different
microenvironments in the blood, bone marrow and lymph nodes.
To study such metabolic adaptations, a nuclear magnetic resonance (NMR)
based approach; capable of monitoring real-time metabolism in primary CLL cells
was developed. Using this setup, this thesis demonstrates fast, reversible metabolic
plasticity in CLL cells during transition from normoxic to hypoxic conditions,
associated with elevated HIF-1α dependent glycolysis. This work also demonstrates
differential utilisation of pyruvate in oxygenated and hypoxic conditions where in
the latter, pyruvate was actively transported into CLL cells to protect against
oxidative stress. Moreover, real-time NMR experiments provided initial evidence
that CLL metabolism in hypoxia correlates with stage of disease, adding significant
relevance of our method for patient stratification. Additionally, to further investigate
alterations between normoxic and hypoxic metabolism, Metabolic Flux Analysis
(MFA) was carried out using primary CLL cell extracts, revealing modifications in
pyruvate carboxylase (PC) activity and the pentose phosphate pathway (PPP).
Abstract
III
Despite the recent advent of promising new agents, CLL currently remains
incurable and new therapeutic approaches are required. Understanding CLL cell
adaptation to changing oxygen availability will permit the development of therapies
that interfere with disease aetiology. This study makes several significant
contributions towards this goal. Moreover, the findings may be relevant to all
migratory cancer cells, and may have importance for the development of strategies to
prevent cancer metastasis.

Moim Rodzicom i Dziadkom,
Za ich miłość oraz niekończące się wsparcie
To my Parents and Grandparents,
For their love and endless support
Acknowledgements
V
ACKNOWLEDGEMENTS
I would like to say thank you to my supervisors Professor Ulrich Günther, Professor Christopher Bunce and Doctor Farhat Khanim for giving me the opportunity to undertake this PhD project in their groups. Thank you for encouraging my research and for allowing me to grow as a research scientist. Thank you for your ideas, for new and interesting experiments and for the critical opinion you gave about my work. Being a part of the Marie Curie project METAFLUX was a great privilege and I would like to say thank you to everyone who contributed to creating this exceptional network.
My work would not be possible without the help of very skilled and helpful academic staff from both the School of Biosciences and HWB-NMR Facility. I would like to express my special appreciation to Scientific Officer Christian Ludwig, who with enormous patience, taught me the basics of NMR theory as well as the practice. Chris, it was always a great pleasure to work with you and your charisma and sense of humour makes the most boring peak picking or shimming, a very nice and pleasant experience. I am so grateful for all the extra time you spent helping with the project, for all the urgent help during the work with the spectrometer and the data analysis. Thank you for listening to our needs and constantly updating our software, making our work more efficient.
I would also like to say a big thank you to Rachel, Andy, Nikos and Laura who were always very understanding, warm and caring; always ready to help in the laboratory and discuss all the PhD problems. I was very lucky to have you around.
I would like to warmly thank all my NMR colleagues: Karen, Sue and Sarah – three super women of the NMR facility, who ensured that our facility was running smoothly and who were always ready to solve urgent problems. It was a pleasure to work with you. I also want to say thank you for your support and well done to Mei, Tatiana and Sotiris, with whom we shared the ups and downs of the METAFLUX adventure. I would also like to acknowledge all of my great colleagues from the 4th and 3rd floors in Biosciences for creating a friendly atmosphere to work in, with a special thank you to Kay and Dorthe for their support in the most difficult moments.
More people without whom my work could not be conducted are Guy Pratt and Helene Parry, thanks to whom every week I could work on fresh primary CLL cells. Thank you for being very reliable and working hard to provide samples and clinical data. I am also grateful to Dr Daniel Tennant for very many fruitful scientific discussions.
Now I would also like to a say big thank you to my amazing friend and flatmate Iza, for her everyday support and encouragement, cooking and baking together and sharing all of the good and bad moments of PhD life.
Now it is time for Massive and Biggest thanks to Chib for being with me through the major part of my PhD, and being the best award compensating all the struggles I faced through the PhD time. Thank you for your support, patience and understanding and for always being able to make me laugh, when I would least expect it.
At the end I would like to say thank you to my Family; my Parents, Grandparents and my Sister Ania for supporting me, making me feel their presence and believing in me, even from far away.
Table of contents
VI
TABLE OF CONTENTS
ABSTRACT ....................................................................................................................................... II
ACKNOWLEDGEMENTS .............................................................................................................. V
TABLE OF CONTENTS ................................................................................................................ VI
LIST OF FIGURES ........................................................................................................................... XI
LIST OF TABLES ........................................................................................................................... XV
ABBREVIATIONS ........................................................................................................................ XVI
CHAPTER I - INTRODUCTION
1.1 HALLMARKS OF CANCER ..................................................................................................... 2
1.2 UNDERSTANDING CANCER METABOLISM .................................................................. 4
1.2.1 Metabolism pervades every aspect of biology ............................................................ 4
1.2.2 Lessons from Warburg ...................................................................................................... 6
1.2.3 The advantage of altered cancer metabolism .............................................................. 7
1.2.4 Role of ROS in cancer cells ............................................................................................... 9
1.2.5 Glutamine metabolism .................................................................................................... 11
1.3 THE HYPOXIC TUMOUR ENVIRONMENT .................................................................... 15
1.3.1 HIF-1α ................................................................................................................................. 16
1.4. HAEMATOLOGICAL CANCERS ...................................................................................... 19
1.4.1 Inhibitors of glycolysis in leukaemic cells .................................................................. 20
1.4.2 IDH1/2 mutations ............................................................................................................. 24
1.4.3 Mitochondrial uncoupling ............................................................................................. 25
1.5. CHRONIC LYMPHOCYTIC LEUKAEMIA (CLL) .......................................................... 27
1.5.1 CLL microenvironment ................................................................................................... 31
1.5.2 Current CLL therapies .................................................................................................... 33
1.5.3 CLL cell metabolism ........................................................................................................ 37
1.5.4 Metabolism of quiescent cells ........................................................................................ 38
1.6 TOOLS USED FOR INVESTIGATING CANCER METABOLISM ................................ 40
1.6.1 Spectroscopic methods used in metabolic analysis .................................................. 40
1.6.2 Metabolic Flux analysis .................................................................................................. 43
1.6.3 NMR as a tool for metabolomics studies .................................................................... 45
1.6.3.1 Metabolic profiles of cancer cells ......................................................................... 47
1.6.4 Leading NMR techniques for cancer metabolomics ................................................. 48
1.6.4.1 Magic Angle Spinning (MAS) ............................................................................... 48
1.6.4.2 NMR measurements of cell extracts .................................................................... 49
Table of contents
VII
1.6.4.3 Dynamic Nuclear Polarization (DNP) ................................................................. 49
1.6.4.4 Measurement of living cells in NMR ................................................................... 50
1.6.4.4.1 31P NMR as an indicator of pH in samples .................... 51
1.6.4.4.2 Challenges of recording real-time metabolic changes 52
1.6.4.4.3 Flow systems ........................................................................... 54
1.7. FUTURE PROSPECTS ........................................................................................................... 55
1.8. AIM OF THIS THESIS ........................................................................................................... 56
CHAPTER II - MATERIALS AND METHODS
2.1 CELLS FROM PATIENTS ...................................................................................................... 59
2.1.1 Purification of primary CLL cells ................................................................................. 59
2.1.2 Isolation of CD19+ve cells ................................................................................................... 60
2.2 ANALYSIS OF CELL PHENOTYPE USING FLOW CYTOMETRY ............................. 60
2.3 ASSESSMENT OF CELL VIABILITY AND PROLIFERATION..................................... 62
2.3.1 AV/PI staining ................................................................................................................... 62
2.3.2 Cell cycle analysis. ........................................................................................................... 62
2.4 CELL MORPHOLOGY: JENNER-GIEMSA STAINING ................................................. 63
2.5 REAL TIME NMR EXPERIMENTS WITH LIVING CELLS ........................................... 63
2.5.1 Sample preparation .......................................................................................................... 63
2.5.2 Set up of the NMR experiment ...................................................................................... 64
2.5.3 Real time NMR measurement 1D 1H NOESY ............................................................ 67
2.5.4 Proton-Carbon 1D spectra .............................................................................................. 67
2.5.5 NMR time course data processing................................................................................ 71
2.5.6 NMR time course data analysis .................................................................................... 72
2.5.7 Determination of the intracellular pH inside the NMR tube ................................. 74
2.6 CLL CELL EXTRACTION ..................................................................................................... 76
2.6.1 Incubation with the 13C labelled precursor ................................................................ 76
2.6.2 Quenching .......................................................................................................................... 76
2.6.3 Extraction ........................................................................................................................... 77
2.7 NMR METABOLIC FLUX EXPERIMENTS USING CELL EXTRACTS ....................... 78
2.7.1 Sample preparation .......................................................................................................... 78
2.7.2 HSQC acquisition ............................................................................................................. 78
2.7.3 HSQC data processing .................................................................................................... 79
2.7.4 HSQC data analysis ......................................................................................................... 79
2.8 QUANTITATIVE REAL-TIME POLYMERASE CHAIN REACTION (QRT-PCR) ... 80
2.8.1 RNA extraction ................................................................................................................. 80
Table of contents
VIII
2.8.2 RNA quantification .......................................................................................................... 81
2.8.3 Reverse transcription ...................................................................................................... 81
2.8.4 β-actin PCR ........................................................................................................................ 82
2.8.5 Agarose gel electrophoresis ........................................................................................... 83
2.8.6 Real-time PCR ................................................................................................................... 83
2.8.6.1 Measurement of gene expression. ........................................................................ 83
2.8.6.2 Q-PCR data analysis. ............................................................................................... 84
2.9 PROTEIN ANALYSIS: WESTERN BLOTTING ................................................................ 85
2.9.1 Protein extraction and quantification. ......................................................................... 85
2.9.2 Sample preparation and protein separation by sodium dodecyl sulphate –
polyacrylamide gel electrophoresis (SDS PAGE)..................................................... 85
2.9.3 Protein transfer ................................................................................................................. 86
2.9.4 Immunodetection of proteins ........................................................................................ 86
2.10 INVESTIGATION OF OXIDATIVE STRESS ................................................................... 88
2.10.1 Assessment of accumulation of Reactive Oxygen Species (ROS) ........................ 88
2.10.2 Assessment of accumulation of Mitochondrial Superoxide ................................. 88
2.11 TREATMENTS OF CLL CELLS WITH INHIBITORS .................................................... 89
2.11.1 HIF-1α inhibition with Chetomin .............................................................................. 89
2.11.2 Alanine aminotransferase inhibition with cycloserine and β-chloro-l-alanine.89
2.11.3 Pyruvate cellular transporter (MCT1) inhibition with CHC ................................ 89
2.12 HRP CHROMOGENIC STAINING OF CYTOSPINS .................................................... 90
2.12.1 Staining ............................................................................................................................. 90
2.12.2 Counterstain .................................................................................................................... 91
2.12.3 Dehydration and Mounting ......................................................................................... 91
2.13 FLUORESCENT STAINING OF CYTOSPINS ................................................................ 91
2.14 STATISTICAL ANALYSIS OF EXPERIMENTS .............................................................. 93
2.15 METABOLAB ROUTINES USED FOR DATA ANALYSIS .......................................... 93
2.15.1 MATLAB scripts ............................................................................................................. 93
2.15.1.1 Scale TMSP .............................................................................................................. 93
2.15.1.2 Peaking shifting peaks .......................................................................................... 94
2.15.1.3 Fit pH curve ............................................................................................................ 95
2.15.1.4 Calculate pH ........................................................................................................... 96
2.15.1.5 Calculate percentage of Keto and Enol form of pyruvate ............................ 96
CHAPTER III - ESTABLISHING NMR METHOD TO MEASURE METABOLIC
CHANGES IN LIVING CLL CELLS
3.1 INTRODUCTION .................................................................................................................... 99
3.2 RESULTS ................................................................................................................................. 102
Table of contents
IX
3.2.1 1D 1H NMR spectrum of living CLL cells ................................................................. 102
3.2.2 Viability of CLL cells was not affected by the NMR experiment ........................ 106
3.2.3 Changes can be seen in the intensity of metabolites .............................................. 107
3.2.4 Changes of intensities of metabolite signals ............................................................ 111
3.2.5 Apparently quiescent CLL cells show high metabolic activity ........................... 111
3.2.6 Metabolic changes were not affected by the stabilisation of extracellular pH . 115
3.2.7 Primary CLL cells survive extreme hypoxia ............................................................ 118
3.2.8 Kinetics of the metabolic changes .............................................................................. 119
3.3 DISCUSSION .......................................................................................................................... 125
CHAPTER IV - METABOLIC PLASTICITY OF CLL CELLS
4.1. INTRODUCTION ................................................................................................................. 137
4.2 RESULTS ................................................................................................................................. 141
4.2.1 Primary CLL cells adapt their metabolism to hypoxic conditions ...................... 141
4.2.2 HIF-1α shows hypoxia-inducible nuclear import ................................................... 145
4.2.3 Primary CLL cells exhibit reversible metabolic plasticity during the transition
between different oxygen environments ................................................................. 149
4.2.4 HIF-1α inhibition reverses changes in metabolism associated with hypoxia. . 153
4.2.5 HIF-1α inhibition by chetomin is toxic to CLL cells regardless of the oxygen
level .................................................................................................................................. 155
4.2.6 Alanine aminotransferase is not involved in the mechanism of hypoxic
adaptation. ...................................................................................................................... 157
4.3 DISCUSSION .......................................................................................................................... 162
CHAPTER V - INVESTIGATING THE ROLE OF PYRUVATE IN ADAPTING TO
HYPOXIA
5.1 INTRODUCTION .................................................................................................................. 170
5.2 RESULTS ................................................................................................................................. 173
5.2.1 Analysis of pyruvate changes during the NMR time course. .............................. 173
5.2.2. CLL cells export pyruvate in normoxia and take it up again in hypoxia......... 175
5.2.3 Pyruvate dynamics were not HIF-1α dependent. ................................................... 178
5.2.4 Inhibition by MCT1 prevents pyruvate re-uptake and causes apoptosis of CLL
cells. .................................................................................................................................. 180
5.2.5 Methyl pyruvate does not rescue CLL cells from CHC......................................... 183
5.2.6 Exogenous pyruvate reduces mitosox and ROS levels in CLL cells. .................. 186
5.2.7 Keto-enol tautomerism of pyruvate ........................................................................... 189
5.3 DISCUSSION .......................................................................................................................... 193
Table of contents
X
CHAPTER VI - METABOLIC FLUX ANALYSIS OF CLL CELLS IN DIFFERENT
OXYGEN ENVIRONMENTS
6.1. INTRODUCTION ................................................................................................................. 200
6.2 RESULTS ................................................................................................................................. 206
6.2.1 [1,2-13C]glucose flux through Glycolysis and Pentose Phosphate Pathway ..... 206
6.2.2 Pyruvate carboxylase is active only in hypoxic conditions .................................. 213
6.2.3 Glucose flux into the TCA cycle via PDH/PC .......................................................... 219
6.2.4 13C-3-Glutamine flux ...................................................................................................... 221
6.3 DISCUSSION .......................................................................................................................... 228
CHAPTER VII - GENERAL DISCUSSION
7.1 GENERAL DISCUSSION ..................................................................................................... 237
7.2 FUTURE WORK..................................................................................................................... 242
7.3 THE FUTURE OF NMR METABOLOMICS FOR BEATING CANCER .................... 244
7.4 CONCLUDING REMARKS ................................................................................................ 247
REFERENCES ................................................................................................................................ 249
APPENDICES ................................................................................................................................ 267
APPENDIX A1: Buffers and Recipes ...................................................................................... 268
APPENDIX A2: Purity of CLL preparations............................................................ ..............270
APPENDIX A3: Chetomin killing curves................................................................ ...............271

List of figures
XI
LIST OF FIGURES
Chapter 1
Figure 1.1. Hallmark of cancer cells ................................................................................................... 3
Figure 1.2. HIF-1α regulation by proline hydroxylation .............................................................. 18
Figure 1.3. The role of mTOR activation in supporting cancer cell survival ............................. 23
Figure 1.4. Model of the lifecycle of a CLL B cell ........................................................................... 30
Figure 1.5. New therapeutic agents and their targets in a chronic lymphocytic leukaemia
cell ......................................................................................................................................................... 36
Chapter 2
Figure 2.1. Example of flow cytometry analysis, assessment of CLL preparations purity. ...... 61
Figure 2.2. Scheme of NMR time course experiment .................................................................... 66
Figure 2.3. The pulse sequence for a set of two 1D-1H13C decoupled NMR spectra ................. 69
Figure 2.4. The principle of obtaining 13C% incorporation data from the 1D 1H spectra ......... 70
Figure 2.5. Colour time gradient of the 1D 1H noesy spectra ....................................................... 73
Figure 2.6. Changes of pH in the NMR tube .................................................................................. 75
Chapter 3
Figure 3.1. 1D 1H NMR spectrum of CLL cells ............................................................................. 103
Figure 3.2. J-res and HSQC spectra of the used medium ........................................................... 105
Figure 3.3. CLL cells can tolerate NMR analyses ......................................................................... 106
Figure 3.4. Changes in the NMR spectrum are the result of metabolic activity of CLL
cells ..................................................................................................................................................... 108
Figure 3.5. Spectrum of CLL cells in medium with agarose overlaid with spectrum of
medium alone ................................................................................................................................... 110
Figure 3.6. Representative peaks for chosen metabolites, changes over time ......................... 113
Figure 3.7. Cell cycle analysis of CLL cells. CLL cells remain in G0/G1 phases of cell cycle in
both normoxia and hypoxia ............................................................................................................ 114
List of figures
XII
Figure 3.8. Metabolic changes of CLL cells were not dependent of the extracellular pH
changes .............................................................................................................................................. 116
Figure 3.9. Spectrum of RPMI with HEPES vs spectrum of standard RPMI ........................... 117
Figure 3.10. Change of oxygen concentration over the time course experiment .................... 119
Figure 3.11.A Real-time changes in metabolite peaks intensities during the NMR time
course ................................................................................................................................................. 121
Figure 3.11.B Real-time changes in metabolite peaks intensities during the NMR time
course ................................................................................................................................................. 122
Figure 3.12. Kinetics of different peaks corresponding to the same metabolite were
similar ................................................................................................................................................ 124
Figure 3.13. Metabolic map presenting all of the metabolites assigned in the 1H NOESY
spectra recorded on samples with primary CLL cells ................................................................. 131
Chapter 4
Figure 4.1. HIF-1α level increases immediately after CLL cells reach hypoxia ....................... 142
Figure 4.2. Level of HIF-1α increases in hypoxia together with the expression of its target
genes, which can be blocked by chetomin .................................................................................... 144
Figure 4.3. HIF-1α shows hypoxia-inducible nuclear import .................................................... 146
Figure 4.4. HIF-1α is present at a low level in the cytoplasm of normoxic CLL cells ............ 147
Figure 4.5. HIF-1α is present in the nuclei of hypoxic CLL cells ............................................... 148
Figure 4.6. Viability of CLL cells is not affected by extreme changes in oxygen levels ......... 150
Figure 4.7. CLL cells are metabolically robust and plastic ......................................................... 151
Figure 4.8. Metabolic adaptation of CLL cells to hypoxia involves HIF-1α ............................ 154
Figure 4.9. HIF-1α inhibition by chetomin is toxic to CLL cells in both normoxia and
hypoxia .............................................................................................................................................. 156
Figure 4.10. Alanine aminotransferase (ALAT) inhibition in CLL cells ................................... 159
Figure 4.11. Alanine aminotransferase (ALAT) inhibition did not affect the viability of CLL
cells ..................................................................................................................................................... 160
Figure 4.12. Membrane permeable αKG did not affect ALAT inhibition ................................ 161
List of figures
XIII
Chapter 5
Figure 5.1. Analysis of the pyruvate concentration during the time course with CLL cells . 174
Figure 5.2. Flux of pyruvate ............................................................................................................ 177
Figure 5.3. The transition in pyruvate dynamics was independent of HIF-1α activation ..... 179
Figure 5.4. Inhibition of pyruvate transporter with CHC .......................................................... 181
Figure 5.5. Metabolic changes during CHC treatment ............................................................... 182
Figure 5.6. Methyl pyruvate does not rescue cells from CHC induced apoptosis .................. 185
Figure 5.7. Exogenous pyruvate reduces mitosox and ROS level in CLL cells ....................... 187
Figure 5.8. Exogenous pyruvate reduces mitosox and ROS level in CLL cells ....................... 188
Figure 5.9. Keto-enol pyruvate tautomerism ............................................................................... 191
Figure 5.10. Keto-enol pyruvate tautomerism in the NMR spectrum ...................................... 192
Chapter 6
Figure 6.1. 13C labelled glucose flux to lactate through glycolysis and PPP ............................ 202
Figure 6.2. 13C labelling patterns and corresponding multiplet structures .............................. 204
Figure 6.3. 13C NMR multiplet structures in metabolites with label incorporation in various
adjacent atoms, with different coupling constants ...................................................................... 205
Figure 6.4. Simplified presentation of 13C labelling patterns of metabolites after incubating
cells with [1,2-13C]glucose ............................................................................................................... 207
Figure 6.5. The theoretical label distribution in the glutamate molecule coming from the [1,2-
13C]glucose after multiple TCA rounds ........................................................................................ 208
Figure 6.6. Glucose flux in CLL cells in normoxia ....................................................................... 210
Figure 6.7. Glucose flux in CLL cells in hypoxia .......................................................................... 211
Figure 6.8. Pentose Phosphate Pathway is more active in normoxia ........................................ 212
Figure 6.9. Aspartate HSQC signals prove the presence of pyruvate carboxylase activity in
CLL cells incubated for 24 h in hypoxia ........................................................................................ 215
Figure 6.10. The glutamate HSQC signal proves pyruvate carboxylase activity in CLL cells is
higher in hypoxia than in normoxia .............................................................................................. 217
Figure 6.11. A 1D 13C column from the HSQC experimental data proves pyruvate
carboxylase activity in CLL cells is higher in hypoxia than in normoxia ................................ 218
List of figures
XIV
Figure 6.12. Glutamine flux in CLL cells in normoxia ................................................................ 222
Figure 6.13. Glutamine flux in CLL cells in hypoxia ................................................................... 223
Figure 6.14. In normoxia lactate can be labelled from glucose but not from glutamine in CLL
cells ..................................................................................................................................................... 225
Figure 6.15. In hypoxia lactate can be labelled from glucose but not from glutamine in CLL
cells ..................................................................................................................................................... 226
Figure 6.16. In CLL cells lactate can be labelled from glucose in normoxia and hypoxia in the
similar percentage ............................................................................................................................ 227
Figure 6.17. Metabolic shift of CLL cells entering hypoxia ........................................................ 230
Figure 6.18. Glycolysis is interconnected with PPP in CLL cells ............................................... 231
List of tables
XV
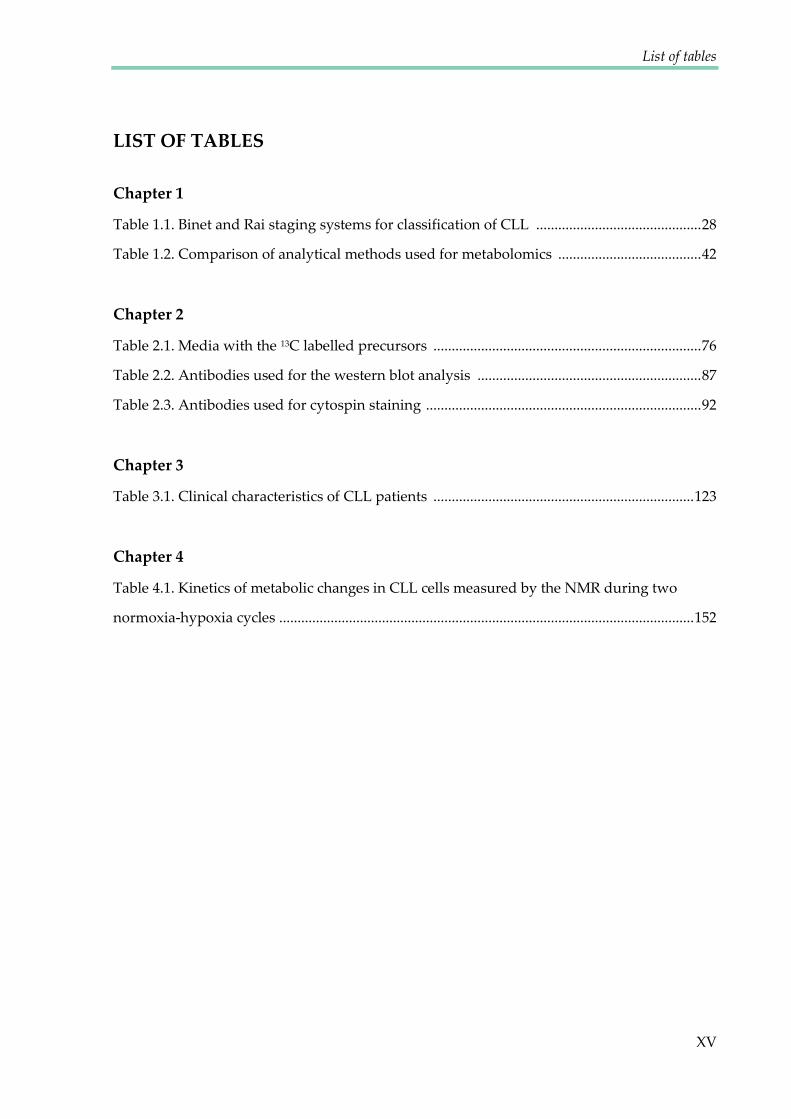
LIST OF TABLES
Chapter 1
Table 1.1. Binet and Rai staging systems for classification of CLL ............................................. 28
Table 1.2. Comparison of analytical methods used for metabolomics ....................................... 42
Chapter 2
Table 2.1. Media with the 13C labelled precursors ......................................................................... 76
Table 2.2. Antibodies used for the western blot analysis ............................................................. 87
Table 2.3. Antibodies used for cytospin staining ........................................................................... 92
Chapter 3
Table 3.1. Clinical characteristics of CLL patients ....................................................................... 123
Chapter 4
Table 4.1. Kinetics of metabolic changes in CLL cells measured by the NMR during two
normoxia-hypoxia cycles ................................................................................................................. 152

Abbreviations
XVI
ABBREVIATIONS
2DG 2-Deoxyglucose
2HG 2-Hydroxyglutarate
3BrPa 3-Bromopyruvate
3HB 3-Hydroxybutyrate
Acetyl-
CoA
Acetyl coenzyme A
ADCC Antibody-dependent cell-mediated cytotoxicity
ADP Adenosine diphosphate
ALAT Alanine aminotransferase
ALL Acute lymphoid leukaemia
AML Acute myeloid leukaemia
Ang-1 Angiopoietin 1
APRIL Proliferation-inducing ligand
aq Acquisition time
Asp Aspartate
AST Aspartate aminotransferase
ATP Adenosine triphosphate
AV Annexin V
BaP The redeployed drug combination of bezafibrate and medroxyprogesterone
acetate
BAFF B-cell-activating factor of the tumour necrosis factor (TNF) family
BCL2 B-cell lymphoma 2
BCR B-cell Receptor
BF Back-flux
bFGF Basic fibroblast growth factor
BPTES Bis-2-(5-phenylacetamido-1,2,4-thiadiazoyl-2-yl)ethyl sulfide
BR Bendamustine
BSA Bovine serum albumin
BTK Bruton’s tyrosine kinase
CAIX Carbonic anhydrase 9
CBP CREB-binding protein
CD19+ Positive for CD19
CD5 Cluster of differentiation 5
cDNA Complementary DNA
CHC α-cyano-4-hydroxycinnamate
CLL Chronic Lymphocytic Leukaemia
Abbreviations
XVII
CML Chronic myeloid leukaemia
coA Coenzyme A
CTM Chetomin
CXCL12 C-X-C motif chemokine 12
CXCR4 Chemokine (C-X-C motif) receptor type 4
d1 Interscan relaxation delay
DCA Dichloroacetate
DMSO Dimethyl sulfoxide
DNA Deoxyribonucleic acid
DNP Dynamic Nuclear Polarization
dNTPs Deoxynucleotide triphosphates
EM Exponential multiplication
ERK Extracellular signal-regulated kinase
FACS Fluorescence-activated cell sorting
FBA Flux Balance Analysis
FC Flow Cytometry
FCR Fludarabine and cyclophosphamide
FDG-PET Fluorodeoxyglucose positron emission tomography
FIMA Field Independent Metabolic Analysis
GAAC General amino acid control
GAPDH Glyceraldehyde 3-phosphate dehydrogenase
GC–MS Gas chromatography– mass spectrometry
GLUT1 Glucose transporter 1
GS Glutamine synthetase
GSH Glutathione
H2DCFDA 5-(and-6)-carboxy-2´,7´ dichlorodihydrofluorescein diacetate
HIF-1α Hypoxia-inducible factor 1-alpha
HMBD Human Metabolite Database
HPLC High-performance liquid chromatography
HREs Hypoxia-response elements
HRMAS High-Resolution Magic Angle Spinning
HRP Horseradish peroxidase
HSCs Haematopoietic stem cells
HSQC Heteronuclear single quantum coherence spectroscopy
Hx-PRTase Hypoxanthineguanine phosphoribosyl transferase
Hz Hertz
IDH1 Isocitrate dehydrogenase 1
IgVH Immunoglobulin variable region heavy chain
IMP Inosine 5’-monophosphate
Abbreviations
XVIII
ITS+ Culture supplement containing insulin, human transferrin and selenous acid
JNK JUN N-terminal kinase
J-RES J-resolved
Lat1 Large neutral amino acid transporter
LDHA Lactate dehydrogenase A
MAPK Mitogen-activated protein kinase
MAS Magic Angle Spinning
Mcl-1 Myeloid cell leukaemia 1
MCT1 Monocarboxylate Transporter 1
MFA Metabolic Flux Analysis
Mitosox Mitochondrial superoxide
MNCs Mononuclear cells
MRI Magnetic Resonance Imaging
mRNA Messenger RNA
MRS Magnetic resonance spectroscopy
mTOR1 Mammalian target of rapamycin complex 1
NADH Nicotinamide adenine dinucleotide reduced
NADPH Nicotinamide adenine dinucleotide phosphate
NFkB Nuclear factor-kappa-B
NLCs Nurse-like cells
NMR Nuclear Magnetic Resonance
NOESY Nuclear Overhauser effect spectroscopy
NS Number of scans
OAA Oxaloacetate
p21 Cyclin-dependent kinase inhibitor 1
PAG Phosphate activated glutaminase
PBS Phosphate buffered saline
PC Pyruvate Carboksylase
PDGF Platelet-derived growth factor
PDH Pyruvate Dehydrogenase
PDK1 Pyruvate Dehydrogenase Kinase 1
PI Propidium Iodide
PI3K Phosphoinositide 3-kinase
PKC Protein kinase C
PKM2 Pyruvate kinase M2
PLC Phospholipase C.
ppm Parts per million
PPP Pentose Phosphate Pathway
PTEN Phosphatase and tensin homolog
Abbreviations
XIX
PTPs Protein tyrosine phosphatases
pVHL The product of the von Hippel–Lindau tumour suppressor gene
QRT-PCR Quantitative real-time polymerase chain reaction
RNA Ribonucleic acid
ROS Reactive Oxygen Species
RPMI Roswell Park Memorial Institute medium
RT Room temperature
RT-PCR Reverse Transcription PCR
SDF-1 Stromal cell-derived factor 1
SEM Standard error of the mean
Syk Spleen tyrosine kinase
TCA Tricarboxylic Acid Cycle
TD Data points
TLC Thin-Layer Chromatography
TLR Toll-like receptor
TMSP Sodium 3-(trimethylsilyl) propionate-2,2,3,3-d4
TNFα Tumour necrosis factor alpha
TRX Thioredoxin
Ub Ubiquitin
UPLC Ultra performance liquid chromatography
UV Ultraviolet
VEGF Vascular endothelial growth factor
WT Wild-Type
α-KG α-ketoglutarate

Chapter I
Introduction
Chapter One - Introduction
2
1.1 HALLMARKS OF CANCER
Cancer is a disease involving dynamic changes in the genome. The foundation
of cancer research was set by the discovery of the mutations leading to the
production of oncogenes, as well as tumour suppressor genes specific for different
types of cancer. However studies carried out within the last two decades have shown
that the features that regulate the transformation of normal human cells into
malignant cancers are shared amongst cancers. Tumourigenesis is a multistep
process and these steps reflect genetic alterations that drive the progressive
transformation of normal human cells into highly malignant derivatives (Hanahan
and Weinberg 2000). Ten essential alterations in cell physiology that collectively
dictate malignant growth of the cell have been proposed (Figure 1.1). The main
hallmarks shared between the majority of cancer types include: genome instability
and mutations, self-sufficiency in growth signals, insensitivity to antigrowth signals,
tumour promoting inflammation, resistance to programmed cell death (apoptosis),
sustained angiogenesis, tissue invasion and metastasis, avoidance of immune
destruction, limitless replicative potential and deregulated cellular energetics. The
work presented in this thesis will focus on the final hallmark listed, the ability to
modify, or reprogram cellular metabolism in order to meet the bioenergetic and
biosynthetic demands of increased cell proliferation, and to survive environmental
fluctuations in external nutrient and oxygen availability.

Chapter One - Introduction
3
Figure 1. 1. Hallmarks of cancer cells.
The main hallmarks shared between the majority of cancer types (Adapted from
Hanahan and Weinberg 2011).
Chapter One - Introduction
4
1.2 UNDERSTANDING CANCER METABOLISM
The metabolism of cancer cells differs from healthy cells and various types of
cancer are characterised by specific metabolic alterations. Despite many recent
studies, our understanding of cancer metabolism remains enigmatic. It is crucial to
improve our understanding of metabolic deregulations in cancer since they have also
been shown to be linked to drug resistance in cancer therapy (Zhou, Zhao et al. 2010;
Zhao, Liu et al. 2011). A better understanding of the reprogrammed cellular
pathways in cancer is expected to lead to the identification of new therapeutic targets
(Hamanaka and Chandel 2012).
1.2.1 Metabolism pervades every aspect of biology
Metabolism is defined as the sum of biochemical processes in living organisms
that either consume or produce energy (DeBerardinis and Thompson 2012). At
present, there are over 16,000 metabolites and 8,700 reactions annotated in the Kyoto
Encyclopedia of Genes and Genomes (http://www.genome.jp /kegg/pathway.html).
Core metabolism can be simplified to the pathways involving carbohydrates, fatty
acids and amino acids essential to homeostasis and macromolecule synthesis. These
pathways can be separated into three classes: anabolic pathways – energy requiring
pathways that construct molecules from smaller units; catabolic pathways – which
degrade molecules to release energy; and waste disposal pathways – which eliminate
toxic by-products.

Chapter One - Introduction
5
Most of these metabolic networks were defined during the ‚golden age of
biochemistry‛ (1920s - 1960s). They include core pathways like glycolysis (Embden,
Meyerhof, and Parnas), respiration (Warburg), the tricarboxylic acid (TCA) and urea
cycles, glycogen catabolism (Cori and Cori), oxidative phosphorylation (Mitchell),
and the importance of ATP in energy transfer reactions (Lipmann). In the latter half
of the 20th century, interest in metabolism gradually disappeared as new areas of
biology, such as genetics, became more popular (DeBerardinis and Thompson 2012).
However, recent investigations of cell biology and disease have renewed interest in
metabolism (Recent reviews: (McKnight 2010; Benjamin, Cravatt et al. 2012; Cantor
and Sabatini 2012; Ward and Thompson 2012). Recent years have revealed new
metabolites and connections between their pathways which could not have been
predicted from the conventional understanding of biochemistry (Gross, Cairns et al.
2010). This has resulted in our current awareness of the relevance of metabolism to
all other cellular processes.
Interest in the altered metabolism exhibited by cancer cells has grown with the
discovery of oncogenic mutations in metabolic enzymes and has been aroused by the
development of tools that monitor metabolism in living cells. Abnormal metabolism
has now become the key target for anti-cancer therapies.
Chapter One - Introduction
6
1.2.2 Lessons from Warburg
Altered cancer metabolism contributes to its malignant transformation, as well
as to the initiation, growth and maintenance of tumours (Chen, Hewel et al. 2007;
Hanahan and Weinberg 2011). Common hallmarks for many cancer types are, energy
production based on aerobic glycolysis, increased fatty acid synthesis and increased
glutamine metabolism (Zhao, Butler et al. 2013). The principle of abnormal
metabolism in cancer is long-standing, dating back to the early 1920s when Otto
Warburg initiated investigations into cancer metabolism, studying the behaviour of
tissue slices ex vivo. He observed that cancer cells tended to convert glucose to lactate,
using anaerobic pathways (which are less efficient in ATP production), despite the
presence of oxygen. This was interpreted as a fundamental change in the way
glucose metabolism is regulated in cancer cells (Warburg, Wind et al. 1927; Warburg
1956). Amongst Warburg’s many other seminal contributions to biochemistry
(including work on respiration for which he received the Nobel Prize in 1931) he is
best remembered and most frequently cited for this observation, now called the
Warburg effect. Warburg suggested that the reason for these metabolic alterations
may be a consequence of mitochondrial defects that inhibited the ability of cancer
cells to effectively oxidize glucose carbon to CO2 (Koppenol, Bounds et al. 2011). A
later extension to this hypothesis, that dysfunctional mitochondria caused cancer was
also proposed (Koppenol, Bounds et al. 2011). Warburg’s seminal finding was

Chapter One - Introduction
7
supported by many studies performed on various cancer types. Later, other
hypotheses appeared claiming that mitochondria are functional in most tumour cells
and able to carry out oxidative phosphorylation and produce the majority of ATP for
cancer cells (Weinhouse 1976). Nowadays, Warburg’s observation of increased
glucose fermentation by cancer cells is successfully exploited in clinics for diagnostic
purposes, to detect tumours in the body. Using 2-18F-fluoro-2-deoxy-D-glucose
(FDG), a radiolabelled glucose analogue, positron emission tomography identifies
malignant tissues which consume much more glucose than healthy tissues (Gambhir
2002).
1.2.3 The advantage of altered cancer metabolism
The current challenge is to understand why cancer cells utilise a less efficient
metabolic pathway, despite their need to intensively grow and divide. In order to
determine the reason for increased aerobic glycolysis, it is important to realise the
purpose of cell metabolism in general and what the specific requirements of a cancer
cell may be. All cells take up nutrients from their environment and incorporate them
into pathways in order to sustain homeostasis. Cells need to carry out many
reactions that are energetically unfavourable, such us maintaining ion gradients
across membranes, actively transporting molecules through the membranes and
synthesising proteins. The coupling of these reactions with ATP hydrolysis,
providing free energy, enables them to proceed.
Chapter One - Introduction
8
Cancer cells need efficient ways to produce ATP, but they must also adapt to
their specific environment. As a consequence of irregular vascularization, the tumour
microenvironment is often lacking nutrients (Hirayama, Kami et al. 2009; Ackerman
and Simon 2014). Therefore, cancer cells are forced to shift their metabolism to
anabolic reactions. It has been proposed that in order to produce all of the necessary
metabolites, cells attempt to save glucose for the synthesis of those that can solely be
produced from glucose – such as ribose for nucleotides. Other metabolites such as
lipids, are produced from alternative sources e.g. glutamine (Anastasiou and Cantley
2012).
In general, cancer cells benefit from their abnormal metabolism in several
ways. Firstly, their metabolism ensures that they have a ready supply of the building
blocks required for the synthesis of NADPH, acetyl-CoA, ATP and other
macromolecules. Secondly, by claiming more nutrients than healthy cells, tumour
cells contribute to the starvation of neighbouring cells, gaining more space for
expansion and growth (Kaelin and Thompson 2010). Thirdly, an excessive uptake of
nutrients may lead to the increased generation of reactive oxygen species (ROS), if
reactions in the TCA occur at a rate exceeding the capacity of electron capture within
the electron transport chain (Wellen and Thompson 2010). High ROS levels may
promote cancer-cell proliferation by inactivating growth-inhibiting phosphatase

Chapter One - Introduction
9
enzymes. Enhanced ROS may also lead to an enhanced mutation rate by inducing
DNA damage (Kaelin and Thompson 2010).
1.2.4 Role of ROS in cancer cells
Reactive oxygen species are a diverse class of radical species which retain a
more reactive state than molecular oxygen and are produced in all cells as a normal
metabolic by-product. ROS are heterogeneous in their properties and cause various
effects, depending on their levels. At low concentrations, ROS contribute to cell
proliferation and survival through the post-translational modification of
phosphatases and kinases (Lee, Yang et al. 2002; Giannoni, Buricchi et al. 2005). The
production of low ROS levels is also required for homeostatic signalling events, cell
differentiation and cell mediated immunity. Moderate levels of ROS induce the
expression of stress-responsive genes such as HIF-1α, triggering the expression of
pro-survival proteins (Gao, Zhang et al. 2007). On the other hand, high levels of ROS
may lead to damage to cellular macromolecules including lipids, proteins,
mitochondrial and nuclear DNA and cause the induction of senescence (Takahashi,
Ohtani et al. 2006). The permeabilisation of mitochondria, resulting in the release of
cytochrome c and apoptosis can also be caused by ROS (Garrido, Galluzzi et al.
2006). In order to neutralise the destructive effect of ROS, cells produce antioxidant
molecules, such as reduced glutathione (GSH) and thioredoxin (TRX) as well as a
range of antioxidant enzymes (Nathan and Ding 2010). These molecules reduce

Chapter One - Introduction
10
excessive levels of ROS, preventing irreversible cellular damage and restoring redox
homeostasis.
The first time a link between ROS and cellular transformation was identified
was in 1981, when it was shown that insulin elevated intracellular H2O2 levels and
increased the proliferation of tumour cells (Oberley 1988). Cancer cells have a high
demand for ATP due to their increased proliferation rate. However, the consequence
of this uncontrolled energy production is the accumulation of ROS. In order to
ensure their survival, transformed cells protect themselves by up-regulating
antioxidant systems, creating a paradox of high ROS production in the presence of
high antioxidant levels (Schafer, Grassian et al. 2009). Many studies have evaluated
ROS levels and production under various circumstances, with the goal of
characterising the stages at which ROS are oncogenic or tumour suppressive
(Trachootham, Alexandre et al. 2009).
At low to moderate levels, ROS have been shown to contribute to tumour
formation either by acting as signalling molecules or, by promoting DNA mutations.
For example, ROS can stimulate the phosphorylation of mitogen-activated protein
kinase (MAPK) and extracellular signal-regulated kinase (ERK), cyclin D1 expression
and JUN N-terminal kinase (JNK) activation, which promotes growth and survival of
cancer cells (Martindale and Holbrook 2002; Ranjan, Anathy et al. 2006). ROS have
also been shown to reversibly inactivate tumour suppressors such as phosphatase
Chapter One - Introduction
11
and tensin homolog (PTEN) and protein tyrosine phosphatases (PTPs) because of the
presence of the redox-sensitive cysteine residues in their catalytic centre (Leslie,
Bennett et al. 2003).
At high levels, ROS promote severe cellular damage and cell death. Cancer
cells need to fight high levels of ROS, especially at early stages of tumour
development. It has been shown that conditions inducing oxidative stress also
increase the selective pressure on pre-neoplastic cells to develop potent antioxidant
mechanisms. High ROS levels are also induced by detachment from the cell matrix.
This aspect represents a challenge for metastatic cancer cells that need to survive
during migration to distant organs (Schafer, Grassian et al. 2009; Gorrini, Harris et al.
2013). Therefore, cancer cells have a high antioxidant capacity that regulates ROS to
levels that are compatible with their cellular functions but still higher than in healthy
cells. Targeting these enhanced antioxidant defence mechanisms may represent a
strategy that can specifically kill cancer cells, including tumour-initiating cells, while
leaving healthy cells intact.
1.2.5 Glutamine metabolism
Although mitochondrial dysfunction was considered a feature of cancer cells
that contributes to the Warburg effect, more recently it has been shown that the
mitochondria of cancer cells are fully functional and required for cancer cell
metabolism (Wallace 2012). However since glucose is mainly used in aerobic
Chapter One - Introduction
12
glycolysis, glutamine becomes the major substrate required for the TCA cycle and
production of NADPH and fatty acids. In fact some cancer cell lines display
‘addiction’ to glutamine (Yuneva, Zamboni et al. 2007; Wise, DeBerardinis et al.
2008). This is particularly interesting due to the fact that glutamine is a nonessential
amino acid that can be synthesised from glucose. It has been observed that as an
artefact of in vitro culture, glutamine is switched from a nonessential to an essential
amino acid (Eagle 1955). These are aspects that may explain why some cancers seem
not to be able to survive in the absence of exogenous glutamine.
The role of glutamine in cell growth and signalling pathways has been widely
explored in recent years (DeBerardinis, Mancuso et al. 2007; Wise and Thompson
2010). The most obvious role for glutamine is in providing nitrogen for protein and
nucleotide synthesis. The growing cancer must synthesise nitrogenous compounds in
the form of nucleotides and non-essential amino acids. When glutamine donates its
amide group it is converted to glutamate. Glutamic acid is the primary nitrogen
donor for the synthesis of alanine, serine, aspartate and ornithine, as well as
contributing its carbon and nitrogen to proline synthesis. Serine is a precursor for
glycine and cysteine biosynthesis, ornithine is a precursor of arginine, and aspartate
is a precursor for asparagine biosynthesis (Newsholme, Procopio et al. 2003).
The contribution of glutamine in amino acid biosynthesis explains its key role
in the protein translation needs of cancer cells. Moreover, glutamine also plays an
Chapter One - Introduction
13
important regulatory role in protein translation (Hurtaud, Gelly et al. 2007). It has
been shown that glutamine starvation activates the general amino acid control
(GAAC) pathway, which results in the up-regulation of amino acid transporters,
leading to increased amino acid uptake. This elevates the intracellular amino acid
level, which results in an elevation of the mammalian target of rapamycin complex 1
(mTOR1) (Chen, Zou et al. 2014). This complex is an evolutionarily conserved master
regulator of cell growth that activates protein translation and inhibits the
macroautophagy pathway which is a vacuolar degradation process (Wullschleger,
Loewith et al. 2006). The essential glutamine requirements of proliferating cells were
described for the first time by Harry Eagle in 1955, when it was observed that cells
could not proliferate in the absence of glutamine and that many of them did not
maintain their viability (Eagle 1955). Later it was observed that carbons from
glutamine can be incorporated into carbon dioxide that is released by cells and that
the consumption of glutamine in certain cancer cells is substantially higher than any
other amino acid (Kovacevic 1971). Using NMR analysis with labelled glutamine, it
was shown that in a glioblastoma cell line, a significant fraction of carbon from
glutamine is converted into lactic acid (DeBerardinis, Mancuso et al. 2007).
Anaplerotic pathways (those that replenish TCA cycle intermediates) are dominant
in most cancer cells (DeBerardinis and Cheng 2010; Wise and Thompson 2010) and
they are often a consequence of pyruvate kinase M2 (PKM2) activity (Mazurek,
Boschek et al. 2005), resulting in a decoupling of glycolysis and the TCA cycle. It can

Chapter One - Introduction
14
also be caused by the deactivation of pyruvate dehydrogenase (PDH) by pyruvate
dehydrogenase kinases (PDK), thus preventing it from catalysing the acetylation of
coenzyme A (coA) and therefore blocking this entry point into the TCA cycle.
In cancer cells, glutamine catabolism is also regulated by multiple oncogenic
signals, including those transmitted by the Rho family of GTPases and by c-Myc.
Activation of c-Myc, makes cells glutamine-dependent for survival (Yuneva,
Zamboni et al. 2007). Myc induces glutaminase which transforms glutamine into
glutamate and also inhibits the expression of microRNA miR-23a and miR-23b which
are translational inhibitors of glutaminase. It has been shown that glutamate can be
converted to α-ketoglutarate which fuels the TCA cycle in order to produce
oxaloacetate (OAA), showing that glutamine is the major anaplerotic substrate for
proliferating glioblastoma cells (DeBerardinis, Mancuso et al. 2007; Wise,
DeBerardinis et al. 2008; Wise and Thompson 2010). This anaplerotic activity is
required to maintain the TCA cycle when rapidly proliferating cells are using citrate
as a precursor for lipid biosynthesis. Another product of glutaminolysis, ammonia,
has been shown to promote basal autophagy, limit proliferation under physiological
stress and prevent cells from TNFα- induced apoptosis (Sakiyama, Musch et al.
2009).
Intriguing recent research suggests that under hypoxic conditions, the Krebs
cycle may proceed in the reverse direction (Metallo, Gameiro et al. 2012). Glutamine
Chapter One - Introduction
15
derived α-KG produces citrate through reductive carboxylation to support de novo
synthesis of fatty acids. This phenomenon was shown in some cancer cell lines (such
as renal cell carcinoma (Mullen, Wheaton et al. 2012) or melanoma (Filipp, Scott et al.
2012)) but has not been reported for other cancers (including leukaemia) so far.
Flexibility of metabolism to use either of the anaplerotic pathways, as well as
possible altered pathways in various cancer cells must be taken into consideration
when thinking about therapies targeting metabolism of specific cancer types.
Distinct inhibitors of glutaminase have been identified, these are glutamine
mimetics such as 6-diazo-5-oxo-l-norleucine (Ahluwalia, Grem et al. 1990; Griffiths,
Keast et al. 1993) or selective inhibitors such as 968 and BPTES [bis-2-(5-
phenylacetamido-1,2,4-thiadiazoyl-2-yl)ethyl sulfide] (Robinson, McBryant et al.
2007; Wang, Erickson et al. 2010). The potential to selectively block cellular
transformation, may contribute to successfully targeting glutamine metabolism in
cancer therapy (Lukey, Wilson et al. 2013).
1.3 THE HYPOXIC TUMOUR ENVIRONMENT
A fundamental problem for solid tumours is that they consume all their
oxygen supplies from blood and so must survive in hypoxia – usually defined as the
condition when the level of O2 < 1% (compared to 2 to 9% O2 in the adjacent tissue)
(Favaro, Lord et al. 2011). Existence of tumour hypoxia has been validated using
biochemical markers of hypoxia, such as EF5 and pimonidazole, or endogenous
Chapter One - Introduction
16
molecular markers, such as hypoxia inducible factor (HIF) and carbonic anhydrase 9
(CAIX). As shown in a series of studies, hypoxia induces a wide range of biological
changes, such as decreased cell proliferation (Evans, Hahn et al. 2001), increased
expression of genes responsible for drug-resistance (Wartenberg, Ling et al. 2003),
selection of clones resistant to apoptosis (Graeber, Osmanian et al. 1996), enhanced
tumour invasion and metastasis (Subarsky and Hill 2003) and elevated mutagenesis
(Subarsky and Hill 2003). These mechanisms undoubtedly contribute to the evolution
of malignant tumour cells. However, it remains to be fully understood why hypoxic
tumour cells tend to be more aggressive in nature and more resistant to treatment
than non-hypoxic tumour cells within the same tumour, despite their similar genetic
background (Kim, Lin et al. 2009).
1.3.1 HIF-1α
Hypoxia-induced signalling is primarily mediated by HIF, which accumulates
and promotes the transcription of over 200 genes. Many of these genes support cell
survival, promote glycolysis and supress oxidative phosphorylation. HIFs are
transcription factor complexes comprised of an α and β subunit and they function as
an integral part of the hypoxia response, allowing cell survival during periods of low
oxygen supply. Although HIF plays an important protective role during
development and oxygen stress, it has been shown to enhance tumourigenesis and
promote the development of a more malignant phenotype. HIF activity is high in
Chapter One - Introduction
17
most, if not all tumours, either owing to hypoxia or conditions leading to HIF
stabilization under normoxia (pseudohypoxia) (Gottlieb and Tomlinson 2005).
Accumulation of HIF is supressed by oxygen-dependent prolyl hydroxylase
domain (PHD) enzymes. On the other hand, changes in the levels of reactive oxygen
species or TCA cycle metabolites such as fumarate and succinate may promote HIF
accumulation (Kaelin and Thompson 2010). HIF-1α regulation is presented in Figure
1.2. Understanding of the role of HIF in hypoxic metabolism could lead to the
development of chemotherapies that specifically target the hypoxic regions of
tumours.
Chapter One - Introduction
18
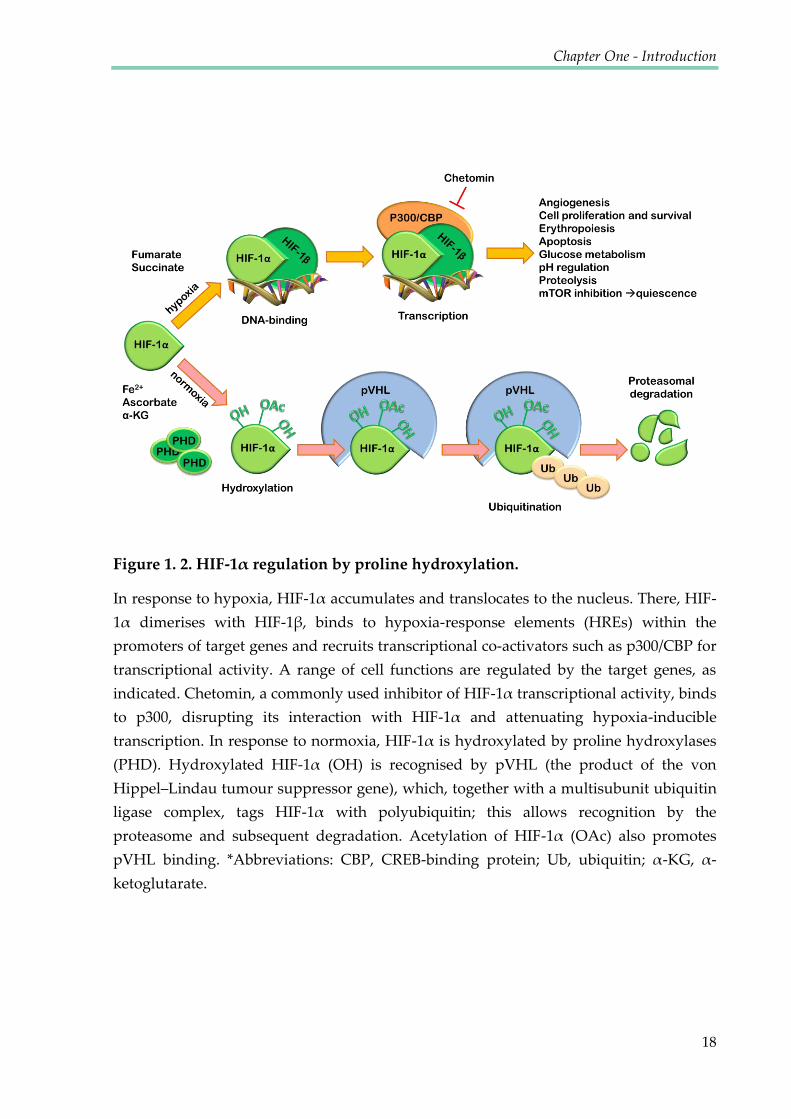
Figure 1. 2. HIF-1α regulation by proline hydroxylation.
In response to hypoxia, HIF-1α accumulates and translocates to the nucleus. There, HIF-
1α dimerises with HIF-1β, binds to hypoxia-response elements (HREs) within the
promoters of target genes and recruits transcriptional co-activators such as p300/CBP for
transcriptional activity. A range of cell functions are regulated by the target genes, as
indicated. Chetomin, a commonly used inhibitor of HIF-1α transcriptional activity, binds
to p300, disrupting its interaction with HIF-1α and attenuating hypoxia-inducible
transcription. In response to normoxia, HIF-1α is hydroxylated by proline hydroxylases
(PHD). Hydroxylated HIF-1α (OH) is recognised by pVHL (the product of the von
Hippel–Lindau tumour suppressor gene), which, together with a multisubunit ubiquitin
ligase complex, tags HIF-1α with polyubiquitin; this allows recognition by the
proteasome and subsequent degradation. Acetylation of HIF-1α (OAc) also promotes
pVHL binding. *Abbreviations: CBP, CREB-binding protein; Ub, ubiquitin; α-KG, α-
ketoglutarate.
Chapter One - Introduction
19
1.4. HAEMATOLOGICAL CANCERS
It is likely that haematological malignant transformation begins in the bone
marrow, where blood cells are produced, leading to their uncontrolled growth and
abnormal functions. Tumour cells interfering with normal haematopoiesis disrupt
blood functions such as protection from infection or prevention of bleeding. There
are three main types of blood cancer: lymphoma, myeloma and leukaemia.
The lymphomas are a complex group of tumours of lymphocytes and present
predominantly at localised sites in lymphoid tissues such as lymph nodes and
spleen. Myeloma is a cancer of plasma cells (antibody producing lymphocytes).
Myeloma invariably arises within the bone marrow. The leukaemias are a complex
group of cancers but are united by the presence of significant circulating leucocytes
in the blood. The term leukaemia is derived from the Greek for ‘white blood’.
Leukaemia can be of myeloid or lymphoid origin and either acute or chronic; giving
rise to the categories: acute myeloid (AML), acute lymphoid (ALL), chronic myeloid
(CML) and chronic lymphocytic (CLL). Some of the metabolic aspects are common
for all types of leukaemia, while others are entirely unique to a particular leukaemia
type (Jitschin, Hofmann et al. 2014; Wang, Israelsen et al. 2014). Moreover, metabolic
pathways may differ between cells of the same origin and are dependent on their
microenvironment (Bailey, Wojtkowiak et al. 2012).
Chapter One - Introduction
20
1.4.1 Inhibitors of glycolysis in leukaemic cells
During the last decade, there has been a strong focus on neoplastic related
metabolism in cancer research. Many solid tumours are known for their altered,
highly glycolytic metabolism described as the Warburg effect but the occurrence of
this phenomenon in blood cancers has only recently been reported. There is
significant evidence that targeting glycolytic pathways in leukaemic cells may re-
program cells and inhibit cancer proliferation. Compounds such as 3-bromopyruvate
(3BrPa), are known inhibitors of glycolytic pathway, however, are required in high
concentrations due to low solubility and biodistribution. Such concentrations often
result in toxicity (Ko, Smith et al. 2004; Xu, Pelicano et al. 2005). New inhibitors used
in combination with or without standard chemotherapy, may present a new
therapeutic strategy (Leni, Parakkal et al. 2013). In this respect, it is important to
identify the enzymes and metabolic processes that are crucial for haematological
cancer cell proliferation and survival.
So far, studies focused on AML and ALL have shown that they are dependent
on glycolysis in aerobic conditions (Boag, Beesley et al. 2006). Levels of HIF-1α and
the HIF-1α dependent proteins; GLUT1, GLUT3, CA9 and GAPDH, were
significantly higher in the blood of AML and ALL patients compared to cells derived
from the blood of healthy donors. Moreover, leukaemias with higher glycolytic rates
showed stronger resistance to chemotherapy. For example, it has been shown that

Chapter One - Introduction
21
inhibition of glycolysis using 2DG (2-deoxyglucose) rendered otherwise resistant
leukaemia cells, susceptible to glucocorticoid treatment (Hulleman, Kazemier et al.
2009). 2DG was also shown to affect the pentose phosphate pathway and alter
protein glycosylation. However decreased viability of cells also observed in
normoxia, may indicate that 2DG toxicity in aerobic conditions results from the
inhibition of glycosylation, rather than glycolysis (Kurtoglu, Maher et al. 2007).
Combinations of the glycolytic pathway inhibitor, 3BrPa, with antimycin A – an
inhibitor of electron transport in the mitochondrial complex III - showed a dramatic
decrease of ATP in cancer cells followed by increased cell death (Ko, Smith et al.
2004). This data shows that acute leukaemia depends on glycolysis but also that
oxidative respiration is important for survival. It is however still unclear how this
inhibitor combination affects healthy cells.
In order to potentiate the effects of inhibition of glycolysis, mTOR inhibitors
could be used as additional therapeutics. mTOR plays multiple roles in supporting
cancer cell survival directly, by affecting cell cycle regulators and indirectly, by
sustaining nutrient supply. mTOR is also responsible for the regulation of energy
metabolism and cellular survival of cancer cells (see Figure 1.3). Therefore, combined
inhibition of glycolysis and mTOR would induce severe metabolic deregulation and
cell death. It has been shown that in leukaemia and lymphoma cells, a combination
of 3BrPa with rapamycin effectively depleted ATP, limited the nutrient uptake, cell

Chapter One - Introduction
22
proliferation and cell survival. Importantly, this combination has been shown to have
low toxicity to healthy cells (Xu, Pelicano et al. 2005).
Chapter One - Introduction
23
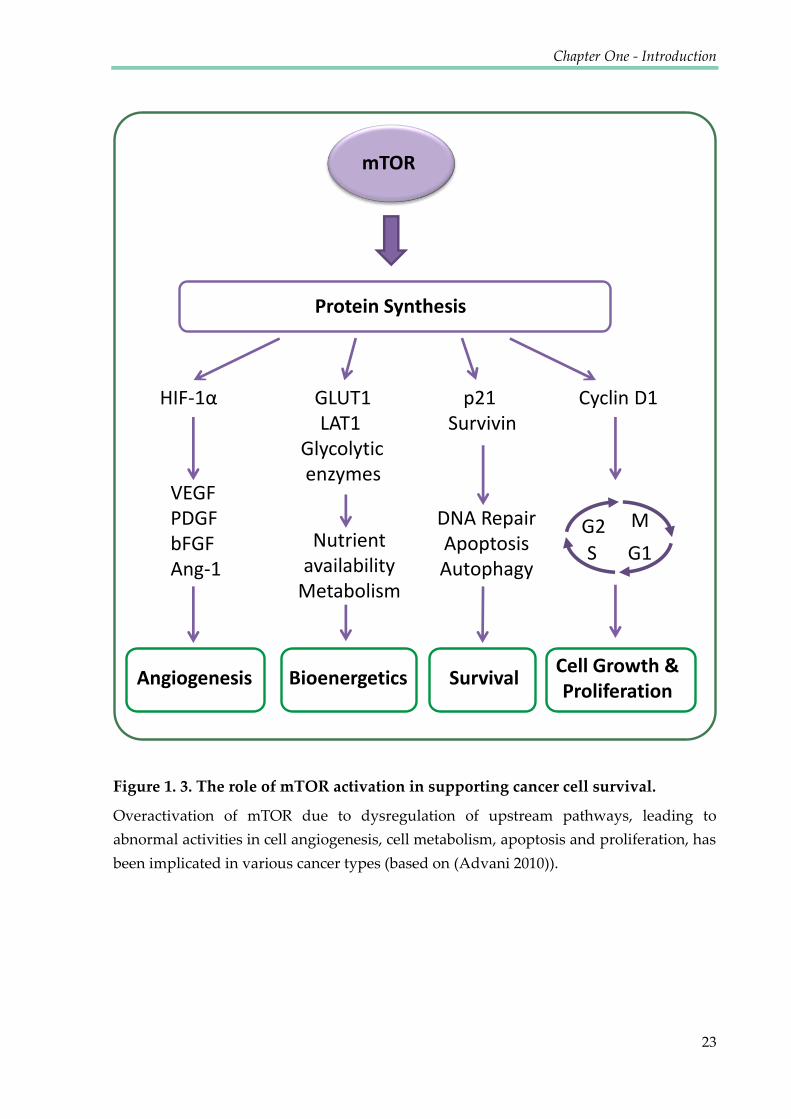
Figure 1. 3. The role of mTOR activation in supporting cancer cell survival.
Overactivation of mTOR due to dysregulation of upstream pathways, leading to
abnormal activities in cell angiogenesis, cell metabolism, apoptosis and proliferation, has
been implicated in various cancer types (based on (Advani 2010)).
mTOR
Protein Synthesis
HIF-1α GLUT1 p21 Cyclin D1 LAT1 Survivin Glycolytic enzymes VEGF
PDGF bFGF Ang-1
Nutrient availability
Metabolism
DNA Repair Apoptosis Autophagy
M
G1 S
G2
Cell Growth & Proliferation
Survival Angiogenesis Bioenergetics
Chapter One - Introduction
24
Studies with metabolic inhibitors have also shown promising results in the in
vivo model of multiple myeloma. Dichloroacetate (DCA) inhibits pyruvate
dehydrogenase kinase which limits Acetyl-coA production from pyruvate. As a
result more Acetyl-CoA is produced and more NADH electrons may be donated to
the electron transport chain. This may lead to increased ROS production,
contributing to the loss in generation of membrane potential and ultimately the
suppression of cell proliferation (Fujiwara, Kawano et al. 2013).
Targeting glycolysis in haematological malignancies has emerged as a
promising approach. However more studies are needed to investigate molecular
mechanisms and potential chemoresistance.
1.4.2 IDH1/2 mutations
Gene sequencing studies identified somatic mutations in isocitrate
dehydrogenase 1 (IDH1) in AML and glioma patients but not in those suffering from
other human malignances (Dang, White et al. 2009; Mardis, Ding et al. 2009; Zhao,
Lin et al. 2009). Mutated IDH1 transforms α-ketoglutarate to the oncometabolite 2-
hydroxyglutarate (2-HG). The ability of 2-HG to alter the epigenetic landscape
(through the inhibition of a family of αKG-dependent Jumonji-C domain histone
demethylases) has contributed to changing the way we think about metabolism and
its effects on other cellular processes. When the wild-type IDH1/2 converts isocitrate
to α-KG, NADPH is produced; this contributes significantly to the synthesis of
Chapter One - Introduction
25
glutathione, protecting cells from ROS. In IDH1 mutants however, during the
reaction in which 2-HG is produced, NADPH is consumed. Moreover, the level of α-
KG also decreases. α-KG is known to activate proline hydroxylases that inactivate
HIF-1α as a result of IDH (Xu, Yang et al. 2011). Therefore the overall effects are
increased levels of ROS and HIF-1α.
Inhibitors of IDH tested in different types of leukaemias were found to reduce
the amount of 2-HG and inhibit the growth of cancer cells (Popovici-Muller,
Saunders et al. 2012). IDH inhibition led to histone demethylation and to the
induction of haemopoietic/neural differentiation, suggesting that these agents might
induce differentiation in IDH-mutant cells through alterations in the epigenetic state
(Rohle, Popovici-Muller et al. 2013; Wang, Travins et al. 2013). Extensive in vivo
studies in IDH-mutant models are still being reported and the role of IDH in
malignant cells after oncogenic transformation requires additional, extensive
investigation.
1.4.3 Mitochondrial uncoupling
Leukaemia cells, like most cancers, are ’addicted’ to glucose in the generation
of energy, but recent research shows that they also have the ability to reduce
molecular oxygen, utilising electrons from carbon sources other than pyruvate to
grow and evade cell death (Samudio, Fiegl et al. 2008; Samudio, Fiegl et al. 2009).
Recent evidence suggests that fatty acid derived acetyl-CoA can fuel Krebs cycle

Chapter One - Introduction
26
activity and the molecular reduction of oxygen (Samudio, Harmancey et al. 2010). In
leukaemia cells mitochondrial uncoupling – the continuing reduction of oxygen
without the synthesis of ATP – can mimic the Warburg effect in the absence of
permanent alterations to the oxidative capacity of cells. However, the benefits of this
metabolic shift to cells are not fully understood.
The model proposed by Velez (Velez, Hail et al. 2013) presents reprogrammed
pathways of intermediary metabolism in leukaemic cells. In this model, pyruvate is
converted to lactate in order to regenerate NAD+. This results in the absence of OAA
production from pyruvate. In this situation, the only source of α-KG that can supply
the TCA cycle is glutamine, however OAA may also be produced through aspartate
anaplerosis. Regeneration of the citrate pool, on the other hand, would rely on acetyl-
CoA derived from fatty acids.
It has been shown that in several human solid tumours, DCA shifts pyruvate
metabolism from glycolysis and lactate production to glucose oxidation in the
mitochondria, which results in high ROS production, leading to cell death (Bonnet,
Archer et al. 2007). This shows that using an alternative source of carbon to pyruvate
for oxygen reduction may protect against cell death. Despite not yet being shown in
leukaemia cells, this possibility should be considered.
Chapter One - Introduction
27
1.5. CHRONIC LYMPHOCYTIC LEUKAEMIA (CLL)
Chronic lymphocytic leukaemia (CLL) is the most common form of leukaemia
in Western countries (D'Arena, Di Renzo et al. 2003; Chiorazzi, Rai et al. 2005).
Although there have been recent improvements in prolonging survival with
combination chemoimmunotherapy regimens, the disease remains incurable using
current therapies. Patients suffering from CLL present highly variable clinical
courses. Some patients die within two years of initial diagnosis, while others may
lead an almost normal life without the need for treatment (Chiorazzi, Rai et al. 2005).
There are two widely accepted staging methods of CLL: the Binet and the modified
Rai systems (presented in Table 1.1.). These staging systems are simple and
inexpensive, based only on standard laboratory tests and physical examination.
Staging is useful to predict prognosis and also to stratify patients to achieve
comparisons for interpreting specific treatment results.
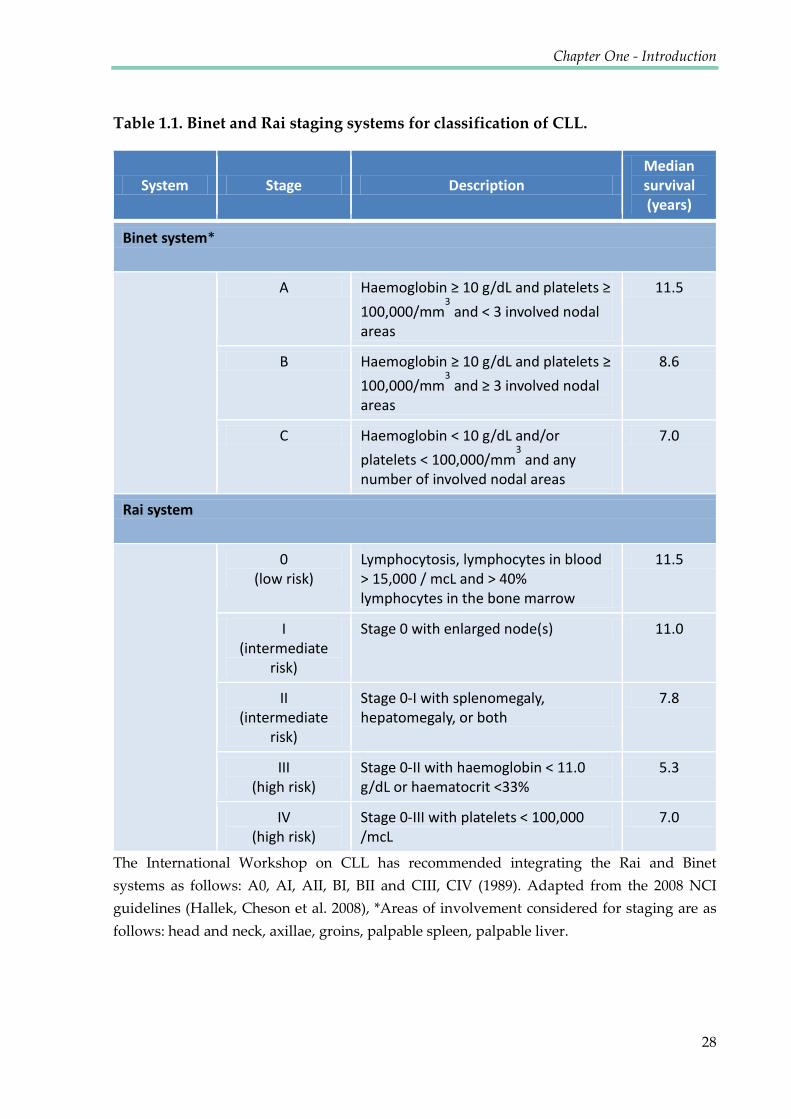
Chapter One - Introduction
28
Table 1.1. Binet and Rai staging systems for classification of CLL.
System Stage Description Median survival (years)
Binet system*
A Haemoglobin ≥ 10 g/dL and platelets ≥
100,000/mm3 and ˂ 3 involved nodal
areas
11.5
B Haemoglobin ≥ 10 g/dL and platelets ≥
100,000/mm3 and ≥ 3 involved nodal
areas
8.6
C Haemoglobin ˂ 10 g/dL and/or
platelets ˂ 100,000/mm3 and any
number of involved nodal areas
7.0
Rai system
0 (low risk)
Lymphocytosis, lymphocytes in blood > 15,000 / mcL and > 40% lymphocytes in the bone marrow
11.5
I (intermediate
risk) Stage 0 with enlarged node(s) 11.0
II (intermediate
risk) Stage 0-I with splenomegaly, hepatomegaly, or both
7.8
III (high risk)
Stage 0-II with haemoglobin < 11.0 g/dL or haematocrit <33%
5.3
IV (high risk)
Stage 0-III with platelets < 100,000 /mcL
7.0
The International Workshop on CLL has recommended integrating the Rai and Binet
systems as follows: A0, AI, AII, BI, BII and CIII, CIV (1989). Adapted from the 2008 NCI
guidelines (Hallek, Cheson et al. 2008), *Areas of involvement considered for staging are as
follows: head and neck, axillae, groins, palpable spleen, palpable liver.
Chapter One - Introduction
29
CLL is characterised by both circulating peripheral disease, as well as
accumulation of proliferating monoclonal B-lymphocytes in bone marrow and
lymphoid organs (Caligaris-Cappio 2000). Clinical data show that, although
therapies are often effective at killing CLL cells in the peripheral blood, residual
disease remains in the bone marrow and lymph nodes (Davids and Burger 2012). It is
likely that these malignant cells sequestered in the tissue, receive protection from a
wide variety of treatments through pro-survival signals and inhibition of apoptosis,
fostered by the stromal microenvironment (Ramsay and Rodriguez-Justo 2013). The
complex biology underlying how these CLL cells are recruited, maintained, and
released from the stroma is an area of active investigation (see Figure 1.4).
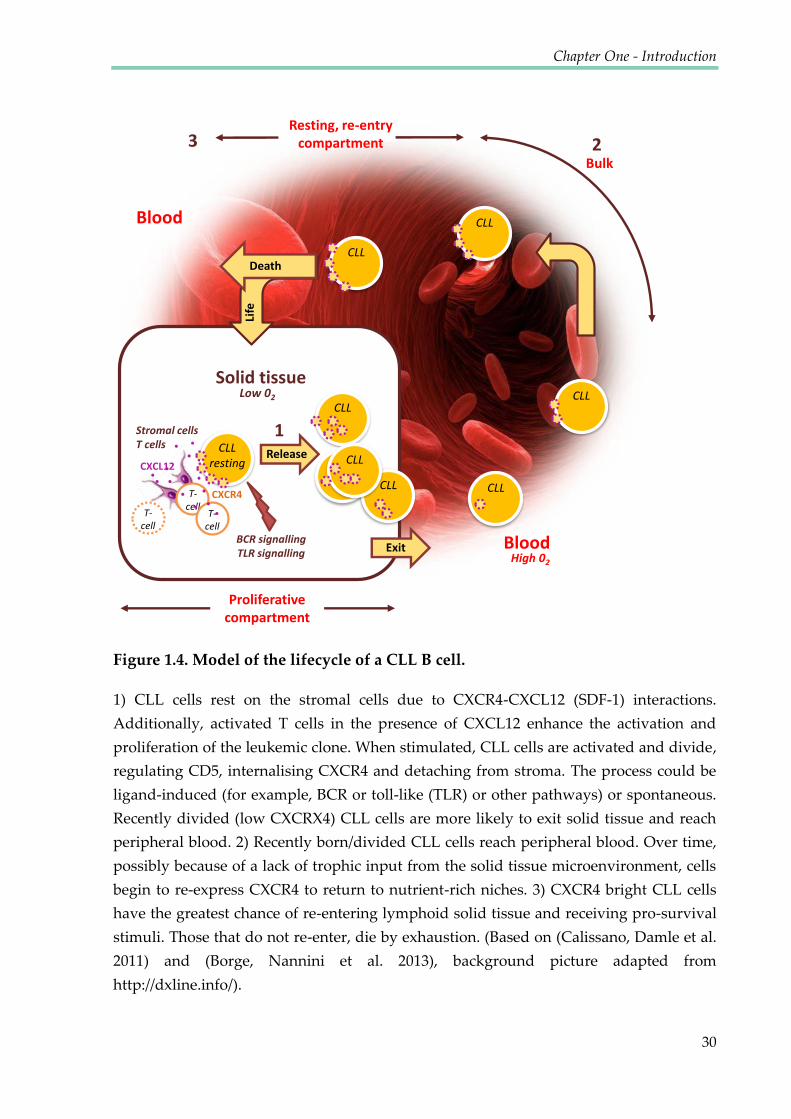
Chapter One - Introduction
30
1) CLL cells rest on the stromal cells due to CXCR4-CXCL12 (SDF-1) interactions.
Additionally, activated T cells in the presence of CXCL12 enhance the activation and
proliferation of the leukemic clone. When stimulated, CLL cells are activated and divide,
regulating CD5, internalising CXCR4 and detaching from stroma. The process could be
ligand-induced (for example, BCR or toll-like (TLR) or other pathways) or spontaneous.
Recently divided (low CXCRX4) CLL cells are more likely to exit solid tissue and reach
peripheral blood. 2) Recently born/divided CLL cells reach peripheral blood. Over time,
possibly because of a lack of trophic input from the solid tissue microenvironment, cells
begin to re-express CXCR4 to return to nutrient-rich niches. 3) CXCR4 bright CLL cells
have the greatest chance of re-entering lymphoid solid tissue and receiving pro-survival
stimuli. Those that do not re-enter, die by exhaustion. (Based on (Calissano, Damle et al.
2011) and (Borge, Nannini et al. 2013), background picture adapted from
http://dxline.info/).
Solid tissue
Blood
Blood
Stromal cells T cells CLL
resting Release
CLL
CLL
Exit
CLL
CLL
CLL
CLL
Proliferative compartment
Bulk
Resting, re-entry compartment
Death
Life
1
2 3
CLL
CLL
BCR signalling TLR signalling
Low 02
High 02
CXCL12
CXCR4
T- cell
T- cell
T- cell
Figure 1.4. Model of the lifecycle of a CLL B cell.

Chapter One - Introduction
31
In order to allow transit between different environments, the metabolism of
CLL cells must be able to quickly adapt to new conditions. Levels of oxygen and pH
differ between peripheral blood and between centres of proliferation in lymph nodes
and bone marrow, thus influencing metabolism (Star-Lack, Adalsteinsson et al. 2000;
Sison and Brown 2011). Understanding the changes in metabolism of CLL cells
linked to the transition between oxygen states, may lead to the development of new
therapeutic targets.
1.5.1 CLL microenvironment
Recent reports have emphasised the importance of the microenvironment in
the development and pathophysiology of malignancies. Although most of these
reports investigated interactions between stromal and neoplastic cells, hypoxia has
emerged as another component of the microenvironment. Although hypoxia in solid
tumours is well studied, it is unclear what role, if any, it has in the physiology of
haematological neoplasias. Lymphomas in this context may resemble solid tumours,
but the hypoxic sanctuary for leukaemias is thought to be bone marrow. There is an
additional interest in comparisons of the role of hypoxia within the bone marrow of
healthy individuals and cancer patients, as it may affect haematopoietic progenitors
and their differentiation as well as bone metastases (Fiegl, Samudio et al. 2010).
The cellular microenvironment of CLL cells in the bone marrow and
secondary lymphatic tissues, consists of stromal cells and matrix (Burger, Ghia et al.
Chapter One - Introduction
32
2009). Interactions of CLL cells with their cellular environment affect the survival of
CLL cells and proliferation and provide drug resistance that may be responsible for
residual disease after conventional therapy. Key cellular players were shown to be
mesenchymal stromal cells, monocyte-derived nurse-like cells (NLCs), and T cells
(Panayiotidis, Jones et al. 1996; Burger, Tsukada et al. 2000; Bagnara, Kaufman et al.
2011). The B-cell Receptor (BCR) expressed on CLL cells is responsible for the
maintenance and expansion of the CLL clone, through its downstream kinases such
as the spleen tyrosine kinase (Syk), Bruton’s tyrosine kinase (BTK), and
phosphatidylinositide 3-kinase (PI3K). Chemokine receptors such as CXCR4 and
CXCR5, together with adhesion molecules, regulate CLL cell trafficking and tissue
homing (Burger, Burger et al. 1999). Members of tumour necrosis factor (TNF) family
such as the CD40 ligand, B cell-activating factor of the tumour necrosis factor family
(BAFF), and a proliferation-inducing ligand (APRIL) activate CLL cells, and promote
immune recognition and survival which leads to the expansion of malignant cells
(Nishio, Endo et al. 2005). Moreover, as a consequence of BCR activation, CLL cells
secrete cytokines (such as CCL3), which influence the microenvironment by
attracting accessory cells such as monocytes and T cells (Burger, Quiroga et al. 2009).
Chapter One - Introduction
33
1.5.2 Current CLL therapies
At present, CLL remains incurable without allogeneic stem cell
transplantation, although treatment outcomes have improved considerably in the last
decade through the use of novel therapeutic agents, as well as risk stratification
(Bottcher, Ritgen et al. 2012).
The standard first-line treatment of fit CLL patients is the combination of the
monoclonal antibody rituximab, with the cytostatic drugs fludarabine and
cyclophosphamide (FCR) or with bendamustine (BR) (Keating, O'Brien et al. 2005;
Eichhorst, Busch et al. 2006). Rituximab is an antibody against the B-cell antigen
CD20, expressed on the CLL cell surface and has been shown to activate
complement-dependent cytotoxicity, opsonisation to macrophages causing antibody-
dependent cell-mediated cytotoxicity (ADCC) and apoptosis (Maloney, Smith et al.
2002). Another CD20 antibody, oftatumimab which targets a different epitope of
CD20, was shown to be efficient both in combination with chemotherapeutics, and as
a single agent; unlike rituximab which has limited efficacy as a monotherapy
(Wierda, Kipps et al. 2010). Obinutuzumab (GA101) is another antibody targeting
CD20 characterised by increased antibody-dependent cellular cytotoxicity and
inducing a direct, non-apoptotic lysosome mediated cell death (Alduaij, Ivanov et al.
2011). In cases of fludarabine-refractory CLL, alemtuzumab - the CD52 antibody -
has been confirmed to be effective (Faderl, Thomas et al. 2003). However,
Chapter One - Introduction
34
alemtuzumab was withdrawn from the market in Europe and the US for treatment of
CLL and is available only through named patient programmes (Tausch, Mertens et
al. 2014).
Another class of CLL treatments are immune modulatory drugs such as
Lenalidomide. This compound acts by inhibiting cytokines such as TNF-α,
interleukin-7, and VEGF and stimulating T and natural killer cells. In addition, it
resolves immunosuppressive mechanisms against healthy T cells induced by
lymphoma cells. Lenalidomide is a replacement of thalidomide with fewer side
effects and improved potency (Sharma, Steward et al. 2006).
The B-cell receptor signalling pathway has been shown to be essential for CLL
cell survival (Wiestner 2013) and inhibition of this pathway became a new
therapeutic target. The small-molecule ibrutinib is one of the new drugs in clinical
development that is effective in CLL through inhibition of this pathway. Ibrutinib
binds to the cysteine 481 of the Bruton’s tyrosine kinase and interrupts activation of
the BCR pathway, resulting in reduced migration and proliferation of the malignant
cells and induced apoptosis. Importantly, ibrutinib is a very well tolerated drug, with
few side effects (Byrd, Furman et al. 2013). Another agent targeting the BCR pathway
is the (PI3K) inhibitor, idelalisib. Activated PI3K is linked to the nuclear factor-
kappa-B (NFkB) activation and expression of B-cell lymphoma (BCL)-XL and Mcl-1,
mediating inhibition of pro-survival pathways (Longo, Laurenti et al. 2008).
Chapter One - Introduction
35
Moreover, PI3K inhibition has been shown to decrease chemotaxis of CLL cells into
protective tissue microenvironments, resulting in higher susceptibility to
chemotherapy (Hoellenriegel, Meadows et al. 2011).
Another promising drug, ABT-199 is an orally bioavailable antagonist of the
anti-apoptotic protein BCL-2. It induces apoptosis by mimicking the BH3 domain.
ABT-199 has been shown to dramatically reduce the number of CLL cells within 12
hours after administration. Currently ABT-199 is in clinical development as a
monotherapy as well as in combination with antibodies and chemotherapy (Souers,
Leverson et al. 2013).
As presented above, a broad range of novel agents with different mechanisms
of action have entered clinical trials in the last decade (See Figure 1.5). They have
already proven their efficacy as well as improved safety profile compared to
chemotherapy, showing a potential to change the treatment paradigm of CLL.
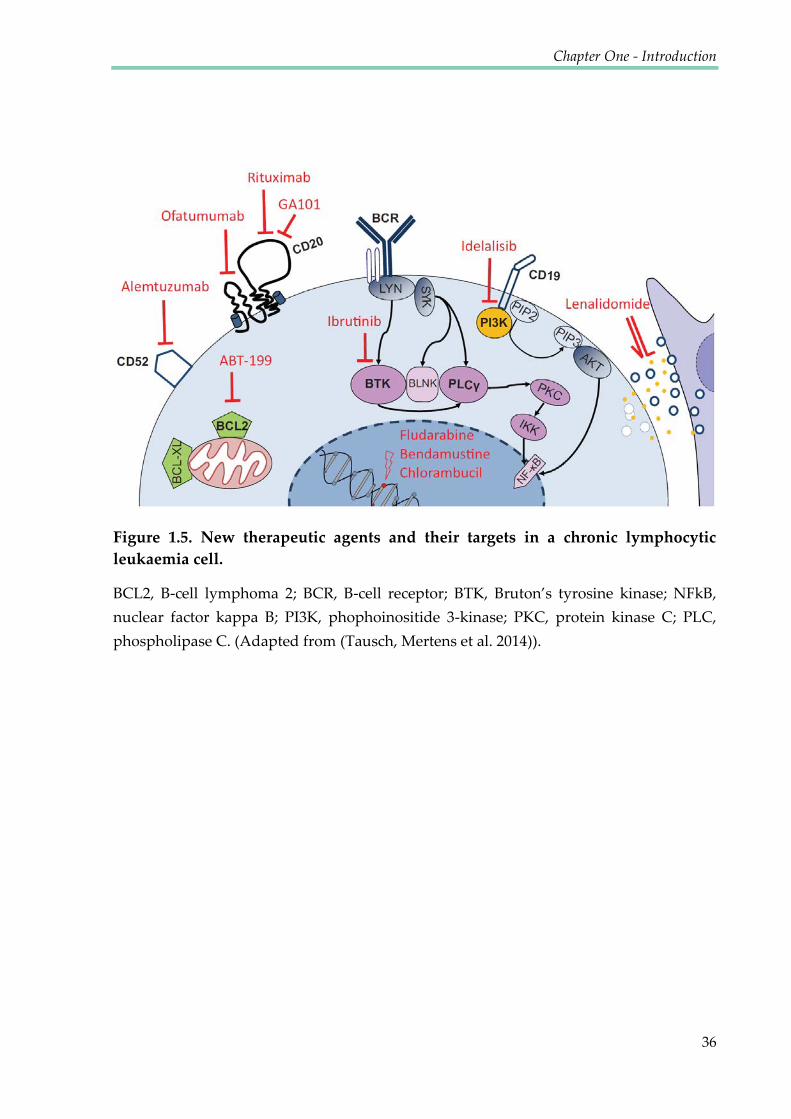
Chapter One - Introduction
36
Figure 1.5. New therapeutic agents and their targets in a chronic lymphocytic
leukaemia cell.
BCL2, B-cell lymphoma 2; BCR, B-cell receptor; BTK, Bruton’s tyrosine kinase; NFkB,
nuclear factor kappa B; PI3K, phophoinositide 3-kinase; PKC, protein kinase C; PLC,
phospholipase C. (Adapted from (Tausch, Mertens et al. 2014)).

Chapter One - Introduction
37
1.5.3 CLL cell metabolism
Recent technological developments have allowed global analyses of
biochemical alterations in cancer and enabled the discovery of potential molecules
involved in cancer cell survival and drug resistance. It was found that GSH is
particularly important for CLL cells, owing to the unique biological properties of this
leukaemia. CLL cells intrinsically have higher levels of reactive oxygen species (ROS)
when compared with normal lymphocytes, and are highly sensitive to agents that
induce further oxidative stress (Zhang, Trachootham et al. 2012). The elevated ROS
level renders CLL cells more dependent on cellular antioxidants such as GSH to
maintain the redox balance. However, CLL cells are unable to maintain GSH once
they are isolated from patients and cultured in vitro, exhibiting a high level of
spontaneous apoptosis (Collins, Verschuer et al. 1989; Silber, Farber et al. 1992).
Recently, it was shown that the bone marrow stromal cells promote GSH metabolism
in CLL cells and enhance leukaemia cell survival and drug resistance (Zhang,
Trachootham et al. 2012). This finding could lead to a novel therapeutic strategy.
Alongside this, the adaptations of CLL cells to ROS by up-regulating the stress-
responsive heme-oxygenase-1 (HO-1), may be a feasible metabolic alteration to target
therapeutically. However, due to the limited knowledge in the area of CLL cell
metabolism, further exploration is required (Jitschin, Hofmann et al. 2014).
Chapter One - Introduction
38
1.5.4 Metabolism of quiescent cells
Unlike CLL cells present in proliferation centres, CLL cells circulating in the
peripheral blood are in the reversible, cell-cycle arrest state, called quiescence. The
transition between proliferation and quiescence has been shown to be associated
with changes in gene expression, histone modification and the extension of
chromatin compaction; although it remains unclear if chromatin state changes are
responsible for cell cycle exit, initiating quiescence (Evertts, Manning et al. 2013).
Entry into the quiescent state is often correlated with dramatic changes in
metabolism, as the requirements of proliferating and quiescent cells are different.
Many, but not all quiescent cells down-regulate their protein synthesis. In some
cases, cellular quiescence is associated with lower metabolic activity, characterised by
low glucose consumption and glycolysis, decreased translation rates and activation
of autophagy in order to provide nutrients for survival (Valcourt, Lemons et al.
2012).
In different quiescence models including mammalian lymphocytes,
haematopoietic stem cells and Saccharomyces cerevisiae, the PI3Kinase/TOR signalling
pathway is involved in growth control. Quiescent fibroblasts are an example of cells
that exhibit metabolism where glucose uptake and flux are not reduced. They
maintain comparable metabolic rates to proliferating fibroblasts, however the
mechanism through which metabolites enter the TCA cycle is different. In quiescent
Chapter One - Introduction
39
fibroblasts, pyruvate is transformed into oxaloacetate by pyruvate carboxylase, while
in dividing fibroblasts, metabolic intermediates enter the TCA cycle from pyruvate
via transfer of the acetyl group of acetyl-CoA to oxaloacetate. A possible explanation
for the maintenance of high metabolic rates during quiescence of fibroblasts is that in
this state, they have an important biosynthetic function, the secretion of extracellular
matrix proteins (Lemons, Feng et al. 2010).
Different metabolic adaptations to quiescence are shown by adult
haematopoietic stem cells (HSCs). They maintain a quiescent state in order to avoid
cellular damage from ROS and to ensure life-long tissue renewal capacity (Jang and
Sharkis 2007). Slow cycling cells are more resistant to cytotoxic agents such as UV,
ionising radiation and chemicals affecting cells that are in the S or M phase of the cell
cycle. Quiescent HSCs depend more on glycolysis than on oxidative phosphorylation
for ATP production, although it is not clear if this metabolic program is intrinsically
required for stem cell self-renewal, or if it is an adaptive response to the hypoxic
environment (Shyh-Chang, Daley et al. 2013). This phenotype has been shown to be
programmed by the HSC transcription factor MEIS1, via its target HIF-1α which up-
regulates many glycolytic enzymes. Therefore HIF-1α plays an essential role in the
maintenance of HSC quiescence and stress resistance (Takubo, Goda et al. 2010;
Shyh-Chang, Daley et al. 2013).
Chapter One - Introduction
40
1.6 TOOLS USED FOR INVESTIGATING CANCER METABOLISM
Recently, there has been increasing interest in investigating metabolic flux in
cells. Technological advances in instrumentation have allowed for the quantification
and analysis of dynamic changes in metabolites under either biological or certain
culture conditions, or in response to treatment. This approach is described by the
term metabolic flux analysis (MFA), often using an experimental approach based on
isotopically labelled tracers. This is distinctly different from ‘metabolomics’ which
describes the analysis of complete sets of metabolites, simply based on profiles
arising from metabolite concentrations (Griffin and Shockcor 2004). MFA is a more
powerful tool for the study of metabolism as the distribution of isotopically labelled
metabolic precursors allows for the monitoring of metabolic fluxes and mapping of
metabolic pathways. By using different tracer molecules, MFA can detect fluxes even
for steady-state concentrations. This chapter will focus on the capabilities and recent
achievements in the field of nuclear magnetic resonance (NMR) spectroscopy for
investigating metabolic flux in cancer cells.
1.6.1 Spectroscopic methods used in metabolic analysis
Understanding the aetiology and progression of disease through metabolic
profiling is not a new concept — 31P, 1H and 13C NMR spectroscopy, along with gas
chromatography– mass spectrometry (GC–MS) and liquid chromatography – mass
spectrometry (LC-MS) are tools that have been widely used for metabolic analysis

Chapter One - Introduction
41
since the early 1970s (Hoult, Busby et al. 1974; Gates and Sweeley 1978). NMR
spectroscopy has also been used to differentiate between different cancer cell lines
(Florian, Preece et al. 1995; Florian, Preece et al. 1995; Lodi, Tiziani et al. 2013) and to
monitor metabolic processes that occur in cancer cells during events such as
apoptosis (Hakumaki, Poptani et al. 1998; Williams, Anthony et al. 1998). However,
due to technical challenges, current methods still face many limitations which
prevent them from reaching this ideal. Using NMR-based approaches, 20–40
metabolites can typically be detected in tissue extracts while 100–200 can be detected
in urine samples. Using the more sensitive approach of LC–MS, around 1,000
metabolites can be detected in these sample types. Various other analytical tools can
also be used for metabolomics, provided that the data sets are rich in molecular
information. Fourier-transform infrared (FT-IR) spectrometry, metabolite arrays
(Bochner, Gadzinski et al. 2001), Raman spectroscopy (Hanlon, Manoharan et al.
2000) and Thin-Layer Chromatography (TLC) (Tweeddale, Notley-McRobb et al.
1998) have been used in metabolomics analysis. However, these techniques do not
allow for the distinguishing of metabolites within the same class of compounds. As a
result, they may only be useful for initial screening. The advantages and
disadvantages of the most commonly used techniques are compared in Table 1.2.

Chapter One - Introduction
42
Table 1.2. Comparison of analytical methods used for metabolomics. Adapted from
(Vernocchi, Vannini et al. 2012).
Analytical method Advantages Disadvantages Comments
NMR • Rapid analysis • High resolution • No derivatisation • Non-destructive • Easy sample
preparation • Fully quantitative • Highly reproducible • Non-selective
(detects all metabolites simultaneously)
• Low sensitivity • Convoluted spectra • More than one peak
per component • Slow
• Chemical consideration: gives detailed structural information for individual metabolites, particularly using 2D NMR
• Chemical bias: NMR has no chemical bias and can be used directly on the sample
• Speed: few minutes to hours, depends on the concentration of samples and on the NMR instrument (strength of the magnet, type of probes)
GC-MS • Sensitive • Robust • Large linear range • Large commercial
and public libraries
• Slow • Often requires
derivatisation • Many analytes
thermally- unstable or too large for analysis
• Chemical consideration: on its own will not generally lead to metabolite identification. However coupled with MS is very powerful for analyte identification
• Chemical bias: solvent extraction bias: non-polar vs. polar analytes. Need for chemical derivatisation
• Speed: very useful separation, typically takes 10-30 min
LC-MS • No derivatisation required
• Many models of separation available
• Large sample capacity
• High sensitivity, can identify ~2000 compounds
• Slow • Limited commercial
libraries • Quantification
requires isotope labelled libraries
• Chemical consideration: on its own will not lead to metabolite identification. However coupled with MS is very powerful for analyte identification
• Chemical bias: solvent bias means it is usually more applicable to polar compounds; lipid analysis requires a second sample
• Speed: typically takes 10-30 min
FT-IR • Rapid analysis • Complete
fingerprint of sample chemical composition
• No derivatisation needed
• Extremely convoluted spectra
• Many peaks per component
• Difficult identification of metabolites in mixtures
• Requires samples drying
• Chemical consideration: provides limited structural information, but useful for identification of functional groups
• Chemical bias: these methods have little chemical bias and can be used directly on the sample
• Speed: 10-60 sec

Chapter One - Introduction
43
Among all of these techniques, the most powerful and commonly used are
NMR spectroscopy and Mass Spectrometry. They both provide structural and
quantitative information on multiple classes of compounds in a single analytical run.
1H-NMR is a universal detector that will give a spectrum for all homogeneous
samples, if the molecule containing protons (1H) is present above the detection limit.
NMR spectroscopy permits analysis of all metabolites present in a biofluid at the
same time, while MS usually requires samples to be fractioned prior to analysis.
Therefore, MS is coupled to a chromatography technique such as HPLC or UPLC.
Both techniques provide information on a wide range of metabolites, without the
need for selection of a particular analyte to focus on (Lindon, Holmes et al. 2006). The
remainder of this chapter presents NMR spectroscopy as a leading tool for metabolic
studies.
1.6.2 Metabolic Flux analysis
Isotope tracer-based metabolic flux analysis has developed over the past two
decades as the primary approach to quantifying the rates of turnover of metabolites
through metabolic pathways; that is, metabolic fluxes. MFA utilises isotopically
labelled metabolic precursors such as glucose and glutamine as tracers and observes
the flux of individual-labelled atoms across metabolic networks. This allows for the
monitoring of metabolic fluxes and the mapping of metabolic pathways and it is

Chapter One - Introduction
44
especially important for detecting the fate of metabolites which are part of many
different pathways.
Tracing metabolic profiles has the potential to reveal crucial enzymatic steps
that could be targeted in the drug discovery process. It is well known that tumours
are associated with substantial rewiring of metabolic networks. Many recent studies
show approaches for the analysis of metabolism that make it possible to
simultaneously assess metabolite concentrations and pathway fluxes for a large
number of the key components involved in the central metabolism of human cells.
Labelled cell extracts can be analysed by mass spectrometry or by NMR. There are
several reports where one-dimensional 13C-NMR spectra have been used, although
two-dimensional NMR analysis using HSQC spectra has been shown to have great
advantages (Szyperski 1995). Comprehensive isotopomer models, predicting the
tracer label distribution facilitate the quantitative analysis of fluxes through key
central metabolic pathways including glycolysis, pentose phosphate pathway,
tricarboxylic acid cycle, anaplerotic reactions, and biosynthetic pathways of fatty
acids and amino acids (Günther et al., 2014). The validity and strength of this
approach is illustrated by its application in a number of perturbations to cancer cells,
including exposure to hypoxia, drug treatment and tumour progression.
The term ‚Metabolic Flux Analysis‛ is also used in the context of
computational biology, using flux balance analysis (FBA) where metabolic pathways

Chapter One - Introduction
45
are modelled across a network of biochemical reactions on a genome scale (Wiechert
2001).
1.6.3 NMR as a tool for metabolomics studies
Spin ½ isotopes behave like small magnets when placed in a magnetic field.
The spins align with or against the magnetic field. Because of the energy difference
between parallel and anti-parallel aligned spins, the parallel state is populated more
than the anti-parallel state, causing magnetisation of the entire sample. By applying a
radiofrequency to the nuclei, one can cause the nuclei to switch to the opposing
magnetic state and this transfer is associated with the generation of transverse
magnetisation. When there is transverse magnetisation, the magnetisation starts to
precess around the axes of the external magnetic field, which can be detected as a
radio frequency. Nuclei in different molecules as well as in different chemical
environments exhibit distinct resonance frequencies resulting in a unique pattern of
chemical shifts visible in the NMR spectrum. This property makes NMR a useful tool
for chemical analysis as structure elucidation is possible based on these frequency
differences.
NMR analysis for metabolomics has centred on 1H and 13C NMR spectroscopy,
although 31P NMR spectroscopy has been used to measure high-energy phosphate
metabolites (such as ATP) and phosphorylated lipid intermediates. Other nuclei such
as 2H and 19F have also been used, the latter is found in a range of neuroleptic drugs,
Chapter One - Introduction
46
and has been introduced as a tracer for drug discovery approaches (Dalvit and
Vulpetti 2011).
NMR is a relatively insensitive technique but has the strong advantage that it
can be used in a non-invasive manner, allowing metabolic profiling of intact tissue.
This has formed the basis for MRI, the most common application of NMR. The non-
invasiveness of NMR has been exploited in this thesis where intact human cells were
studied. Various approaches have been used to study intact tissue by NMR, starting
from measuring structural and functional properties of proteins in whole cells (in-cell
NMR) (Selenko and Wagner 2007; Borcherds, Theillet et al. 2014), through to small
pieces of intact tissue measured by high-resolution magic angle spinning (MAS) 1H
NMR spectroscopy (Cheng, Lean et al. 1996; Griffin, Sang et al. 2002), or in vivo
spectroscopy of whole organs (Pfeuffer, Tkac et al. 1999). Alternatively, tissue
extracts can be used for the analysis of hydrophilic metabolites (Beckonert, Keun et
al. 2007).
The detection limit for 1H-NMR spectroscopy is typically in the order of 10 μM
in a tissue extract or biofluid, although lower concentrations can be measured using
excessively long acquisition times. Typical acquisition times for one-dimensional 1H-
NMR spectra are about 10 minutes. NMR-spectroscopy analysis of biofluids has been
shown to be highly reproducible, as samples analysed by this method have produced

Chapter One - Introduction
47
similar results to those measured on other types of spectrometers (Lindon, Nicholson
et al. 2003; Dona, Jimenez et al. 2014).
1.6.3.1 Metabolic profiles of cancer cells
Metabolomics in cancer has developed almost in parallel with a new era of
research in cancer metabolism. Although these two fields are closely related, they
represent the expertise of two different scientific communities: cancer biologists and
analytical chemists. Over the last decade, collaborations of scientists from these fields
have resulted in significant advancements in our knowledge.
NMR spectroscopy, including in vivo magnetic resonance spectroscopy (MRS)
and high-resolution solution-state analysis of tissue extracts, has been widely used
for several years. Although NMR spectroscopy detects only a relatively small
number of metabolites, it can be used to monitor the activity of many cellular
processes. As many metabolic pathways are connected, changes detected in the
metabolome can be used to follow seemingly unrelated pathways. Despite
limitations in sensitivity and the ability to measure a broad range of metabolites,
MRS has been used to analyse tumour types in humans and in animal models of
cancer (Tate, Crabb et al. 1996; Tate, Griffiths et al. 1998). In vitro NMR metabolomics
studies have also demonstrated differences between tumour types, in terms of
various biochemical pathways (Florian, Preece et al. 1995).

Chapter One - Introduction
48
1.6.4 Leading NMR techniques for cancer metabolomics
1.6.4.1 Magic Angle Spinning (MAS)
As mentioned previously, high-resolution magic angle spinning (HRMAS) 1H-
NMR spectroscopy, can produce high-resolution spectra from small pieces of intact
tissue (Denkert, Bucher et al. 2012). A biopsy or post-mortem sample of tissue is spun
at an angle of ca. 54.74° (the so-called magic angle) to the applied magnetic field. The
spinning results in a significant improvement in the resolution of the spectrum
obtained by eliminating dipolar interactions and magnetic susceptibility effects
which cause wide lines (Renault, Shintu et al. 2013). This approach has several
advantages over NMR spectroscopy of tissue extracts. Both aqueous and lipid-
soluble metabolites can be observed simultaneously in situ, whereas solution-state
NMR would require separate extraction procedures. One of the first applications of
this technique was to distinguish between healthy and malignant lymph nodes
(Cheng, Lean et al. 1996). Information about the metabolic environment of the
tumour can also be obtained using HRMAS 1H-NMR spectroscopy, which can be
used to identify metabolites with a range of physical properties. These approaches
have also been used to follow the effects of therapeutics on tumour cells in vitro and
in vivo (Griffin and Shockcor 2004).
Chapter One - Introduction
49
1.6.4.2 NMR measurements of cell extracts
Obtaining cell extracts requires concentrated samples in order to obtain a
sufficiently good signal-to-noise ration in NMR spectra. If the signal overlap is not
significant, parameters such as chemical shift and spin multiplicity can be obtained
using simple one-dimensional spectra (usually one-dimensional nuclear Overhauser
effect spectroscopy (NOESY) with solvent presaturation). When the spectral overlap
becomes too extensive, two dimensional NMR experiments can be used to overcome
this problem by significantly increasing the resolution and dispersing the peaks into
two-dimensions. 2D 1H-1H TOCSY (TOtal Correlation SpectroscopY), 2D 1H-13C
HSQC (Heteronuclear Single-Quantum Correlation) and 2D 1H-1H JRES (J-resolved
spectroscopy) are the three most commonly used 2D NMR methods in metabolomics
(Gebregiworgis and Powers 2012). These methods not only improve the resolution,
but also allow various spin correlations to be observed and recorded using the
natural abundance of isotopes, and may be sufficient to identify and quantify
metabolites to answer important questions about cell metabolism, tumour
progression and efficiency of treatment.
1.6.4.3 Dynamic Nuclear Polarization (DNP)
It has recently been shown that NMR of hyperpolarised precursors has the
potential to become a suitable modality for monitoring metabolism and for
measuring changes in metabolic fluxes (Golman, in 't Zandt et al. 2006; Schroeder,
Chapter One - Introduction
50
Atherton et al. 2009). In these studies, 13C-labeled metabolites are hyperpolarised
using stable radicals. 13C chemical shifts can be exploited to distinguish between the
original molecules and their metabolic products and gradient-based imaging
techniques can localise the spatial source of these spectral signatures.
To obtain a thorough understanding of the cellular processes, it was important
to develop in vitro cell systems in which conditions could be carefully controlled and
manipulated. So far, a number of studies have monitored the metabolism of
hyperpolarised molecules in concentrated cell suspensions (Chen, Albers et al. 2007;
Day, Kettunen et al. 2007). This method has also been used to measure breast cancer
cells cultivated on beads and maintained by continuous perfusion under
physiological conditions. This enabled a reliable characterisation of the kinetics and
mechanism of hyperpolarised pyruvate-to-lactate conversions in T47D cell line
(Harris, Eliyahu et al. 2009). DNP based approaches are however limited to the short
time frames in the order of the longitudinal relaxation time of the metabolites that
were polarised.
1.6.4.4 Measurement of living cells in NMR
NMR spectroscopy was developed in the 1960s, and by the early 1970s it had
already been used for in vivo measurements using intact red blood cell suspensions,
although in non-viable conditions (Morris 1988). Since then, multiple applications in
fields such as medicine, toxicology and environmental sciences have been reported

Chapter One - Introduction
51
and its usage continues to increase (Cohen, Motiei et al. 2004; Palomino-Schatzlein,
Escrig et al. 2011). The popularity of NMR arises from its non-invasive and non-
destructive nature, as well as its capacity to measure metabolite levels in complex
mixtures without the need for separation.
1.6.4.4.1 31P NMR as an indicator of pH in samples
Tumour pH has long been of interest because it can alter the therapeutic
efficiency of chemotherapeutic agents, radiation or hyperthermia. Tumour thermal
sensitivity depends primarily on intracellular pH (pHin) and its lowering has been
proposed as a target for tumour specific therapies. Therefore, particular methods are
required to accurately measure pHin in tumours. NMR spectroscopy provides a non-
invasive technique for measuring the pHin of tumour cells in situ by the observation
of the 31P signal from ionisable intracellular phosphates. Since the 31P chemical shift
of readily observable inorganic phosphate (Pi) is sensitive to pH changes in the
physiological range (i.e. pKa= 6.6), it has been used routinely in a wide range of
tissues as the NMR indicator of pHin measurements performed in vivo (Soto, Zhu et
al. 1996). This is also feasible in vivo in particular in MRS applications. With new
technology it is also possible to use dual receiver probes that allow recording spectra
of the same sample simultaneously, for example 1H and 31P. This may enable
monitoring changes in metabolic flux together with pH changes.
Chapter One - Introduction
52
1.6.4.4.2 Challenges of recording real-time metabolic changes
The development of effective therapies against malignant diseases and
monitoring their effect in a non-invasive manner is one of the most important
challenges for biomedical research in the area of personalised medicine. NMR is a
very useful experimental approach in this context as it enables continuous
monitoring of biochemical processes. The approach of measuring living, patient
derived cells and their metabolic changes in real-time is new and therefore
challenging. Firstly, to record real-time metabolic fluxes in cells, the problem of
cellular sedimentation needs to be solved, in order to obtain a homogenous sample in
the NMR tube. To avoid the disruption of metabolic process to be measured, cells
need to be kept in conditions mimicking their natural environment. Constant
perfusion can potentially be applied to keep cells in suspension during NMR
experiments and various flow-systems have been reported (Keshari, Kurhanewicz et
al. 2010; Khajeh, Bernstein et al. 2010).
Secondly, in order to record spectra within a short time period, proton spectra
need to be used as 1H is the most sensitive NMR nucleus. 1H-NMR is intrinsically 14
times more sensitive than 31P, thus allowing shorter acquisition times to be used.
Moreover, proton NMR offers the advantage that numerous natural biological
compounds, as well as drugs and their metabolites, can be detected. However, the
presence of signals originating from extracellular compounds and the immense water
Chapter One - Introduction
53
signal, as well as many overlapping proton signals, have limited the application of
proton NMR in studies of biological samples. Some proton NMR studies have been
reported in vivo (Garcia-Segura, Sanchez-Chapado et al. 1999); however, these have
not yet attained translation to routine clinical application. It was also shown that
Diffusion Weighted Proton Magnetic Resonance Spectroscopy can be used to
selectively observe only the intracellular metabolites of several cell lines in vitro
(Mardor, Kaplan et al. 2000). This method is based on differences in motional
properties of cellular components, as larger molecules (such as proteins) exhibit
slower rotational tumbling. Interaction with small molecules may also affect their
motional properties within cells. Owing to such interactions, intracellular
components have a lower apparent diffusion constant (ADC) than extracellular
components and free water. Diffusion Weighted Proton Magnetic Resonance
Spectroscopy can select small molecules that maintain fast rotational diffusion,
however this requires large concentrations of intracellular metabolites.
There has been progress in measuring living cells using NMR in recent years
and techniques are still being improved to obtain the full picture of cellular
metabolites which could be detected within short time frames. This will eventually
create the possibility of monitoring real-time metabolic fluxes in living cells, in
different conditions and responding to various treatments.

Chapter One - Introduction
54
1.6.4.4.3 Flow systems
In order to obtain accurate quantitative metabolic data, studies should be
performed on intact living cells - ex vivo or in vitro as opposed to metabolite
extraction from cells, which often exhibits low reproducibility. For measurements to
be conducted on living cells, combinations of small-scale bioreactors with NMR
spectrometers have been designed to reduce cellular sedimentation and to allow for
the acquisition of metabolic data, in a defined and controlled environment. However,
the high cell density required in the NMR tube causes many constraints, especially
for primary human cells where limited numbers are available.
For any bioreactor, the maintenance of oxygen levels is important. Low
solubility of oxygen in media entails that gas diffusion alone will not adequately
provide for the metabolic needs of cells. Furthermore, mammalian cells respond to
high oxygen concentrations by changes in their metabolism and it is generally
recommended that pO2 is maintained between 25 and 50%. Increasing perfusion
rates would be the simplest solution to ensure that the oxygen consumption rate of
cells can be satisfied. However, increasing flow rates to suitable levels will most
definitely cause cell wash-out from the bioreactor, due to the low cell density. In this
sense, the major challenge is to construct the appropriate configuration that will
allow for high flow rates, while maintaining freely suspended cells in the NMR
reading zone.
Chapter One - Introduction
55
As a part of the presented thesis, a novel approach for measuring the
metabolism of living primary human cells has been developed. The use of low
percentage agarose containing embedded suspension cells is an alternative method
providing both the homogeneity of the NMR sample as well as prevention of cellular
sedimentation.
1.7. FUTURE PROSPECTS
Most of today's anti-cancer drugs are far from specific in attacking tumours.
Rather, they represent poisons that tend to kill cancer cells more than normal cells.
As a consequence of this incomplete specificity, they can cause severe side effects.
Fortunately, cancer researchers are rapidly progressing to more targeted treatments,
and pioneering new approaches to diagnose and classify cancers more effectively.
The necessity for tests that can predict or at least monitor the response of an
individual patient to specific treatment is still increasing.
Metabolomics can be used in this context in several ways. The most important
approach is to detect changes on a metabolite level that can be used as a fundamental
component for new targeted therapeutic strategies. This is particularly promising in
the context of cancer as the disease involves significant metabolic reprogramming.
Metabolism is involved directly or indirectly in all functional activities of cells.
There is mounting evidence for cross-talk between signalling pathways and

Chapter One - Introduction
56
metabolic control in every multicellular organism studied (Vander Heiden, Cantley
et al. 2009). However, there is still much to learn about how proliferating cell
metabolism is regulated. Despite a long and rich history of research, the complex
connection between metabolism and proliferation is an increasingly exciting area of
investigation and it is possible that additional pathways have yet to be described.
Understanding this important aspect of biology is likely to have a major impact on
our understanding of cell proliferation control and cancer. Based on the findings
presented above, we can say that the developed metabolomics approach constitutes a
promising analytical tool for revealing specific metabolic phenotypes in a variety of
cell types and pathological conditions.
1.8. AIM OF THIS THESIS
The overall objective of this thesis was to demonstrate a method of monitoring
metabolism in living cells using NMR and to follow the kinetic changes of
metabolites, without disturbing cells.
The use of cell lines in metabolomics studies has significant limitations for
studying metabolic adaptations or changes in the rates of cell growth and
proliferation, as cell lines never represent the phenotype of an individual patient’s
cancer cells. Therefore, it is important to test patient derived primary cancer cells.
The choice of CLL cells arises from the realisation that these cells can be grown in
solution and they can be maintained alive for extended periods of time.

Chapter One - Introduction
57
Specifically, using primary CLL cells the aims of the study presented were:
To develop a method for measuring the metabolism of living CLL cells in real
time.
To compare the metabolism of CLL cells as they transit and cycle from
oxygenated to hypoxic environments and are subject to pH changes.
To investigate factors responsible for the metabolic plasticity of CLL cells.
To analyse metabolic mechanisms using metabolic flux analysis on CLL cell
extracts.

Chapter II
Materials and Methods

Chapter Two – Materials and Methods
59
All chemicals were purchased from Sigma-Aldrich (Poole, U.K.), unless stated
otherwise and all FC analyses were conducted using a FACSCalibur and Cell
QuestPro software (BD, Oxford, U.K.).
2.1 Cells from patients
Unselected patients with B-cell CLL attending the outpatient clinic at
Birmingham Heartlands Hospital and Queen Elizabeth Hospital were recruited for
this study. The patients had been diagnosed according to standard morphologic,
immunophenotypic and clinical criteria (Oscier, Dearden et al. 2012) and had
provided informed written consent for the study which had received local ethical
approval.
2.1.1 Purification of primary CLL cells
The mononuclear cells (MNCs) were isolated from blood using Leucosep
tubes (Greiner Bio-one, Gloucester) loaded with 15 ml Ficoll-Paque plus (G.E
Healthcare, Amersham). MNCs were cultured in RPMI 1640 (Invitrogen Gibco,
Paisley) with 1% ITS+ (culture supplement containing insulin, human transferrin and
selenous acid) (BD Biosciences), 100 U/ml penicillin and 100 μg/ml streptomycin
(Invitrogen Gibco). Cells were seeded at the concentration 5x10⁶ cells/ml and
incubated in a humidified chamber at 37°C and with 5% CO2. When cultured in these
conditions, CLL cells stay quiescent in the G0/G1 phase of the cell cycle.
Chapter Two – Materials and Methods
60
2.1.2 Isolation of CD19+ve cells
For experiments using CD19+ve cells isolated from the blood of healthy donors,
MNCs were isolated as above (section 2.1.1). In cases where the purity was < 70%,
negative selection was performed using the Dynabeads® Untouched™ human B Cells
kit (Invitrogen) to purify CD19+ve cells without affecting their metabolism.
2.2 Analysis of cell phenotype using flow cytometry
Following positive selection of CD19 cells, a cell purity check was carried out,
using CD19 marker. Staining was carried out on 3x10⁵ cells made up to a final
volume of 200 µl in phosphate buffered saline (PBS) (Invitrogen Gibco) and
incubated with 2 μl of the appropriate antibodies at room temperature (RT) in the
dark. Cells were subsequently washed in 2 ml PBS by centrifugation at 1500 rpm for
5 minutes, suspended in 300 μl of PBS and analysed. Data were analysed using BD
FACSCalibur™, and 10,000 events were collected after manually performed
compensation, using single colour controls. Flow cytometry analysis representative
for CLL preparation are shown in Figure 2.1 and purity of all CLL preparations is
demonstrated in Appendix A2.

Chapter Two – Materials and Methods
Chapter Two – Materials and Methods
62
2.3 Assessment of cell viability and proliferation
2.3.1 AV/PI staining
Single Annexin V (AV) and co-Annexin V/Propidium Iodide (PI) positivity
was assessed by flow cytometry (FC) following staining using an AV FITC kit (BD),
according to the manufacturer’s instructions. Briefly, 100 μl of cell suspension (5x10⁶
cells/ml) was transferred to a FACS tube and 1 ml of cold PBS was added. Cells were
centrifuged for 5 minutes at 1500 rpm. The supernatant was removed and cells were
resuspended in 100 μl of 1xAV binding buffer. Subsequently 5 μl of AV FITC
antibody and 5 μl of PI stain was added and mixed. Samples were incubated at RT in
the dark for 15 minutes. Staining was analysed using the flow cytometer within one
hour.
2.3.2 Cell cycle analysis.
An aliquot of 3x10⁵ cells was removed from the cell culture and filled with PBS
to obtain a final volume of 1 ml. Following the 5 minute centrifugation at 1500 rpm,
the supernatant was removed and 500 μl of cell cycle buffer (see buffers and recipes
in Appendix) was added. Cell suspension was vortexed and stored in the dark at 4°C
for 24 hours before the analysis.

Chapter Two – Materials and Methods
63
2.4 Cell morphology: Jenner-Giemsa staining
Aliquots of 100 µl cell suspension was loaded onto slides and spun down at
500 rpm for 3 minutes using a Cytospin 3 Centrifuge. Slides were air-dried and fixed
with ethanol for 5 minutes. Using a Coplin jar, slides were immersed in Jenner
staining solution (diluted 1 in 3 in 1 mM sodium phosphate buffer, pH 5.6) and left
for 5 minutes, after which they were washed with distilled water. Slides were then
placed in Giemsa Staining solution (diluted 1 in 20 in 1 mM sodium phosphate buffer
pH 5.6) and left for 10 minutes, after which they were washed with distilled water
again. Slides were left to dry followed by mounting onto coverslips using DePex
(VWR, UK). Cytospins were observed at 40x magnification.
2.5 Real time NMR experiments with living cells
2.5.1 Sample preparation
Cell populations characterised as healthy (> 80% Annexin V negative) were
selected for NMR experiments. Two concentrations of cells were used: 5x10⁷ cells/ml
or 1x10⁷ cells/ml. Directly before the start of each experiment, cells were washed
twice with warm RPMI medium and gently suspended in pre-warmed (37°C) 0.1%
low melting agarose (Sigma) in RPMI (supplemented with 100 U/ml penicillin, 100
μg/ml streptomycin (Invitrogen Gibco) and 1% ITS+ (BD Biosciences)) and 1 mM
sodium 3-(trimethylsilyl) propionate-2,2,3,3-d4 (TMSP, Cambridge Isotope
Chapter Two – Materials and Methods
64
Laboratories) in D2O (GOSS Scientific Instruments Ltd.). After suspending cells in the
agarose matrix, 550 µl of cell suspension was loaded into 5 mm NMR tubes using
long, glass NMR pipettes. The Oxygen Sensor connected to a Fiber Optic Oxygen
Meter (World Precision Instruments) was inserted into the NMR tube and sealed
together with Parafilm M®. The NMR tube with the immersed oxygen sensor was
transferred into the 500 MHz NMR magnet after pre-warming to 310 K.
Measurements were started within 15 minutes of sample injection into the magnet.
2.5.2 Set up of the NMR experiment
After injecting the sample into the magnet, the probe was tuned, the
spectrometer was locked for field frequency stabilisation (H2O + D2O), and finally the
sample was shimmed using automated shimming. This was facilitated by shimming
a 0.1% agarose in RPMI sample before the cell sample was prepared. A series of
automated 3D shims was performed until no changes were seen, followed by a series
of 1D shims and an adjustment of the Z-shim to compensate for temperature
gradients across the sample. This adjustment was previously optimised to minimise
the TMSP line width. When the cell sample was in the magnet, the series of 1D shims
was usually sufficient to obtain a good line width of TMSP (< 2 Hz). On occasions
when the line width was higher than 2.5 Hz, additional manual shimming was
performed. Following this, the pulse calibration was applied and the receiver gain
determined followed by the acquisition of series of 1D 1H NOESY spectra over 24

Chapter Two – Materials and Methods
65
hours. The oxygen measurement was started together with the acquisition. After the
measurement, cells can be recovered for further analysis. A scheme of the NMR time
course is presented in Figure 2.2.

Chapter Two – Materials and Methods
66
Figure 2. 2. Scheme of NMR time course experiment.
Peripheral blood CLL cells were suspended in RPMI 1640 medium with 1% ITS+, TMSP,
D2O and 0.1% agarose and transferred to the NMR tube. Spectra are acquired over 24
hours using a 500 MHz NMR spectrometer with the temperature set to 37°C.
ITS+, D2O, 0.1%
agarose
Peripheral blood CLL
cells 500 MHz NMR spectrometer
Series of 1H 1D NMR spectra
Chapter Two – Materials and Methods
67
2.5.3 Real time NMR measurement 1D 1H NOESY
1D 1H NOESY spectra were acquired at 37°C, using a 500 MHz Bruker
spectrometer equipped with a cryogenically cooled probe. The spectral width of the
acquired spectra was 12 ppm, with 16384 acquired complex data points. The
transmitter frequency offset was set to 4.696 ppm to suppress the water signal by
presaturation. For apodisation an exponential multiplication (EM) window function
with a line broadening of 0.3 Hz was used and the NMR data was zero filled to 32768
points. Measurements were carried out with deuterium frequency locking after
shimming. For time course experiments, a series of 144 1D spectra were acquired
over 24 hours. Each spectrum was acquired over 10 minutes (which included the
time of shimming between each sample), acquiring 64 transients and a recycle delay
of 4 s.
2.5.4 Proton-Carbon 1D spectra
In order to investigate carbon flux in real time, a set of two 1D-1H13C
decoupled NMR spectra were acquired. One spectrum contained NMR signals
originating from all protons in the sample, while the second acquired spectrum
contained only signals originating from protons bound to 13C (the pulse sequences
are presented in Figure 2.3). Quantitation of this spectral approach was ascertained
by scaling the first spectrum down to 1% and then comparing the signal intensity of
the TMSP signal in both spectra. Due to the 1% natural abundance of 13C, both signals
Chapter Two – Materials and Methods
68
had to have the same intensity after scaling down the first spectrum. Then by
comparing relative signal intensities in both spectra, the percentage of incorporation
of the 13C label could be determined from a single sample in real time (see Figure 2.4).
The time resolution achieved was 5 minutes per spectrum or 10 minutes per data
point.
As an alternative, in principle the first increment of an HSQC spectrum could
also be used, but due to non-adiabatic 90° pulses, magnetisation is not quantitatively
recovered at chemical shifts far away from the carrier frequencies. The sequence
presented here does not edit through 13C, but rather filters out 12C bound 1H signals
and only uses adiabatic 180° pulses on the carbon channel and therefore omits these
artefacts.

Chapter Two – Materials and Methods

Chapter Two – Materials and Methods

Chapter Two – Materials and Methods
71
2.5.5 NMR time course data processing
The NMR data was processed using the MATLAB based NMRLab/MetaboLab
software (Gunther, Ludwig et al. 2000; Ludwig and Gunther 2011). A script for
automated data processing of all the spectra was created using the ScriptBuilder
module of MetaboLab. To further suppress the residual solvent resonance, a
convolution filter using a gauss function was applied. Zero filling was set to 131072
data points and phase correction was performed using the automatic phase
correction of MetaboLab. Exponential like broadening of 0.3 Hz was applied prior to
Fourier transformation of the data. Subsequently a spline based baseline correction
(Gunther, Ludwig et al. 2000) was applied simultaneously to all acquired spectra.
The chemical shift of TMSP changes with pH, but in order to compare the linewidths
and ensure that they did not change throughout the timecourse, all spectra were
aligned to the TMSP signal which was set to 0 ppm. As the change in chemical shift
for TMSP was very small from spectrum to spectrum, the automatic peak picking
algorithm for shifting peaks for other metabolites was able to cope with
automatically determining the correct signal and therefore did not compromise any
results. Also, pH measurement (described in chapter 5.2.7) which only depends on
the difference between the two shifts of histidine, was not affected by the TMSP
alignment to 0 ppm.

Chapter Two – Materials and Methods
72
2.5.6 NMR time course data analysis
NMR resonances of metabolites were assigned using the Chenomx software
and HMBD (Human Metabolite Database). In cases of uncertain peaks, samples were
spiked with the known metabolite at the concentration similar to that predicted from
the obtained NMR spectrum. In order to distinguish peaks which changed their
intensity or chemical shift during the time course, spectra were coloured using a
rainbow gradient starting from red for the first spectrum, going through yellow and
green and finishing with blue for the final spectrum (see Figure 2.5).
For peaks exhibiting intensity changes over time, kinetic modelling was
performed using the time series analysis tool (TSATool) from the Metabolab
software. Peaks of interest were selected from the first or last spectrum, depending
on whether the associated metabolite concentration increased or decreased over time.
Selected peaks were then propagated automatically to the rest of the spectra in the
time course. For the analysis, the time axis was obtained automatically from the
Bruker acquisition data files. First order mono or bi-exponential kinetics were
assumed to compare metabolic turnover between cells from different patients or
from different treatments.

Chapter Two – Materials and Methods
73
Figure 2. 5. Colour time gradient of the 1D 1H noesy spectra.
Spectra were recorded every 10 minutes over the course of 24 hours. Then data was
processed in NMRLab, spectra were superimposed and coloured. The first spectrum is
coloured red, with the colour scheme proceeding through yellow and green to blue for
the final spectra of the series. This fragment of spectra shows peaks of lactate increasing
(quartet at 4.125; 4.111; 4.098; 4.084 ppm) and peaks of glucose decreasing (doublets at
3.877; 3.881; 3.897; 3.901 ppm*). Glucose peaks are shifting to the right as the pH becomes
more acidic.
* Peaks were assigned using the HMDB database (The Human Metabolome Database), due to the
different temperature and pH, the actual chemical shift values may differ.
4.15 4.1 4.05 4 3.95 3.9 1H [ppm]

Chapter Two – Materials and Methods
74
𝑝𝐻 = 𝑝𝐾𝑎 + 𝑙𝑜𝑔10𝛥𝛿 − 𝛿𝐵𝐻
𝛿𝐵 − 𝛥𝛿
2.5.7 Determination of the intracellular pH inside the NMR tube
The extracellular pH inside the NMR tube was determined using the pH
sensitivity of the chemical shift of the 2 side chain resonances from histidine (see
figure 2.6). In order to obtain the pH curve, 23 media samples with increasing pH
were measured (ranging from pH=3 to pH=8.5) in triplicate. Using the chemical shift
difference Δδ between the peaks corresponding to imidazole ring protons H2 and
H5, attached to C2 and C5 and C5-H peaks (Kintner, Anderson et al. 2000; Cohen,
Motiei et al. 2004), we were able to measure the pH of the NMR sample at each
particular time point. A calibration curve for the H2 and H5 histidine protons was
determined in a solution of RPMI medium adjusted to pH 3-8.5. Curve fitting was
carried out in MATLAB using a custom made script with the equation (Schechter,
Sachs et al. 1972):
where pKa is the acid dissociation constant reflecting the inflection point of the
titration curve, Δδ represents the difference between the chemical shift of the
histidine protons in solution, δBH is the limiting chemical shift value at acid pH and
δB is the limiting chemical shift value at basic pH.

Chapter Two – Materials and Methods
75
Figure 2. 6. Changes of pH in the NMR tube.
A) Picture of the NMR tube with CLL cells suspended in 0.1% agarose RPMI at 5x10⁷
cells/ml before and after the 24 h time course experiment. B) Chemical structure of
histidine with C2 and C5 marked and histidine region of 144 overlaid 24 h time course
1H spectra (sample contained 5x10⁷/ml CLL cells in 0.1% agarose RPMI with 1% ITS+).
Spectra are coloured starting from the first data point in red, and the last data point in
blue. Peaks of protons connected to C2 (H2) and connected to C5 (H5) of histidine are
shifting to the left. C) Histidine pH curve with the equation of fitted line. Samples of
RPMI medium with different pH (x axes) were measured and the difference in chemical
shift between frequency [ppm] of two histidine peaks was calculated (y axes). The pH
value was calculated using the equation: pH= 5,49 + log10 ((δ−1,272)/(0.7004−δ)).
A
Histidine B
8 7.8 7.6 7.4 7.2 7 1H [ppm]
C
3 4 5 6 7 8 9 pH
Histidine pH curve
del
ta [
pp
m]
1.4
1.3
1.2
1.1
1.0
0.9
0.8
0.7
Before After 24h
pH
H5
H2

Chapter Two – Materials and Methods
76
2.6 CLL cell extraction
2.6.1 Incubation with the 13C labelled precursor
For the extracts analysis ≥180x106 cells were required per sample. Media for
particular samples were prepared according to Table 2.1. Cells were washed once
with the appropriate medium, seeded at 5x10⁶/ml and incubated for 24 hours in an
incubator under normoxic (22% O2) or hypoxic (1% O2) conditions before quenching.
Table 2. 1. Media with the 13C labelled precursors
Sample RPMI 1640 medium (Invitrogen,
catalogue number) Added precursors
Control No glutamine (31870-082) 300 mg/l, 2 mM Glutamine (Sigma)
13C-1,2-
Glucose No glucose (11879-020)
2000 mg/l, 11.11 mM of 13C-1,2-Glucose
(Sigma Isotopes)
13C-3-
Glutamine No glutamine (31870-082)
300 mg/L, 2 mM 13C-3-Glutamine (Sigma
Isotopes)
2.6.2 Quenching
The centrifuge was pre-chilled to -9°C and the fixed angle centrifuge rotor was
pre-chilled in the -20°C freezer for 1 hour. The 2 ml Eppendorf tubes were labelled
and weighed (for the estimation of the cell pellet biomass). HPLC grade methanol
(1.6 ml, 60%, prepared using HPLC grade water) was added to each Eppendorf and
Chapter Two – Materials and Methods
77
put on dry ice for a minimum of 15 minutes to cool the quenching solution to -40°C.
The cell suspension from the sample to be quenched was poured into a 50 ml Falcon
tube and centrifuged at room temp (1500 rpm, 5 min). Supernatant (1 ml) was
transferred into an Eppendorf and snap frozen in liquid nitrogen. The remainder of
the supernatant was discarded. The cell pellet was resuspended in the residual media
in the Falcon tube and 200 μl of this suspension was ejected directly into the 2 ml
Eppendorf containing quenching solution, mixed and returned to dry ice. Next, all
samples were placed in the pre-chilled rotor and centrifuged at -9°C, 2500 g for 5
min. The quenching solution was removed with a glass Pasteur pipette. Tubes with
pellet were weighed to estimate the pellet mass. Pellets were frozen in -80°C until
extraction.
2.6.3 Extraction
Quenched cell pellets were kept on dry ice. Pre-chilled HPLC grade methanol
was added to each pellet 8 μl/mg (of pellet) and vortexed for 30 seconds. Then pre-
chilled HPLC grade chloroform was added (8 μl/mg) to each Eppendorf and pulse
vortexed. Following this, 7.2 μl/mg of HPLC grade water was added and samples
were vortexed for 30 seconds and left on ice for 10 min. Next, samples were
centrifuged at 1500 g (4000 rpm) for 10 min at 4°C. Subsequently, samples were left
on the bench for 5 min. After the centrifugation samples were bi-phasic: the upper
layer contained polar metabolites and the lower layer contained lipids. The same

Chapter Two – Materials and Methods
78
volume from the upper layer was transferred to the new Eppendorf vials and
aliquots were dried in the vacuum concentrator (SpeedVac) for 3-6 hours. Dry pellets
were stored at -80°C until required. The non-polar fraction was also collected (in
glass vials) and stored in -80°C for potential future lipid analysis.
2.7 NMR Metabolic Flux experiments using cell extracts
2.7.1 Sample preparation
The dried polar extracts were dissolved in 90% H2O/10% D2O (GOSS Scientific
Instruments Ltd, Essex UK) prepared as 100 mM phosphate buffer (pH 7.0),
containing 0.5 mM sodium 3-(trimethylsilyl)propionate-2,2,3,3-d4 (TMSP, Cambridge
Isotope Laboratories) as an internal reference.
2.7.2 HSQC acquisition
The 2D 1H 13C- HSQC spectra were acquired on a 600 MHz UltraShield plus
Bruker magnet with a 4-channel Bruker Avance III console using a low volume 1.7
mm CryoProbe™ with a 35 μl sample volume. This spectrometer was also equipped
with a SampleJet automated sample changer with sample cooling at 6°C. After the
sample was inserted into the magnet, it was temperature equilibrated for 30 s at 300
K (27°C). The probe was then automatically tuned and matched for each sample,
followed by sample locking to the D2O resonance, automatic shimming (shimming is

Chapter Two – Materials and Methods
79
a procedure which makes the magnetic field as homogenous as possible across the
sample) and automated pulse calibration (Wu and Otting 2005) which included:
spectral widths (13 ppm & 160 ppm), number of acquired data points (TD), interscan
relaxation delay (d1), acquisition time (aq), number of scans (NS) and quadrature
detection (Echo/Antiecho).
2.7.3 HSQC data processing
All data processing and analysis was performed using the MATLAB based
NMRLab/MetaboLab software package (Gunther, Ludwig et al. 2000; Ludwig and
Gunther 2011). Prior to Fourier transformation, the NMR data was apodized using a
90° phase shifted quadratic sine function, then zero filled to 1024 and 4096 data
points for 1H and 13C dimension respectively. The NMR spectra were manually phase
corrected to obtain pure absorption line shapes and referenced to the methyl signal
of alanine using the HMDB based library shifts of the MetaboLab software. To
further suppress the residual solvent resonance, a convolution filter using a gauss
function was applied to the fids in the 1H dimension (Marion, Ikura et al. 1989).
2.7.4 HSQC data analysis
Assignment and analysis were all carried out in MetaboLab using the HMDB
based chemical shift library. A combination of various analyses were used, including
an approach using an unlabelled reference sample, multiplet analysis (quantum
Chapter Two – Materials and Methods
80
mechanical reconstruction of the NMR spectrum using pygamma (Smith, Levante et
al. 1994)), as well as the absolute label incorporation into C3 of lactate via 1D spectra.
2.8 Quantitative real-time polymerase chain reaction (QRT-
PCR)
2.8.1 RNA extraction
RNA was extracted from a pellet of 1x10⁶ cells using a Qiagen RNeasy mini kit
(Qiagen, Crawley, U.K.) according to the manufacturer’s instructions. Briefly, cells
were resuspended in 350 μl buffer RLT (plus β-mercaptoethanol; Sigma). The sample
was then homogenised using a QIAshredder spin column. One volume of 70%
ethanol (Fischer Loughborough, U.K.) was added to the homogenised sample and
700 μl of this mixture added to an RNeasy mini column. The column was centrifuged
for 15 seconds at 14000 rpm in a microfuge. Further DNA removal was carried out
using the RNase-free DNase set. 350 μl buffer RW1 was added to the column and the
column centrifuged for 15 seconds at 14000 rpm in a microfuge. The DNase I stock
solution was added to buffer RDD according to manufacturer’s instructions and 80
μl of this mix was added to the column and incubated for 15 minutes at room
temperature. Buffer RW1 (350 μl) was added to the column and the column was
centrifuged for 15 seconds at 14000 rpm in a microfuge. Buffer RPE (500 μl) was
added to the column and centrifuged for 15 seconds at 14000 rpm in a microfuge.
Chapter Two – Materials and Methods
81
Another 500 μl RPE was applied to the column prior to centrifugation for 2 minutes
at 14000 rpm in a microfuge. The RNeasy column was transferred to a 1.5 ml
collection tube, RNA was eluted with the addition of 30 μl RNase-free water and was
isolated by centrifugation for 1 minute at 14000 rpm in a microfuge, and stored at –
20°C.
2.8.2 RNA quantification
RNA samples were diluted 1 in 50 with RNase-free water (Invitrogen Gibco)
in a total volume of 100 μl. The absorbance at 260 nm was measured at OD 260 and
the RNA concentration was calculated using the following equation:
RNA concentration (μg/μl) = (OD260 x 40 x dilution factor)/1000.
2.8.3 Reverse transcription
cDNA was produced from 100 ng RNA using reverse transcription. Unless
stated otherwise, all constituents were obtained from Invitrogen (Paisley, U.K.) and
the procedure carried out as follows: 1 μl of both random primers (Promega) and
deoxynucleotide triphosphates (dNTPs) (Bioline, London, U.K.) were added to 100
ng RNA, the volume made up to 12 μl with DNase RNase-free water (Invitrogen
Gibco), and the mix heated to 65°C for 5 minutes, transferred to ice and centrifuged
for 15 seconds at 14000 rpm in a microfuge. A solution comprising the following
components was prepared: 1x buffer, 0.1 M DTT, RNase Out (Promega) and

Chapter Two – Materials and Methods
82
Superscript. After centrifugation, 8 μl of this solution was added to the RNA, primer
and dNTPs. The mix was incubated at 25°C for 10 minutes, 42°C for 90 minutes and
70°C for 15 minutes in a thermocycler.
2.8.4 β-actin PCR
To confirm that the reverse transcriptase reaction had worked, PCR reactions
for β-actin were performed. The sequences of these primers were as follows:
Forward 5’ GTCACCAACTGGGACGACA 3'
Reverse 5’ TGGCCATCTCTTGCTCGAA 3'
The 1x reaction mix was prepared as follows: Taq buffer, primers (33 μM), dNTP's
(10 mM), MgCl2 (50 mM), Taq polymerase, cDNA and DNase RNase-free water to 50
μl. The PCR cycle included an initial denaturation step (95°C for 2 minutes), followed
by 38 cycles of 94°C for 20 seconds, 55°C for 30 seconds and 72°C for 60 seconds and
a final incubation at 72°C for 5 minutes. Subsequently, 6 μl of a product was mixed
with 2 μl 10x DNA gel loading buffer (Bioline), loaded onto a 1% agarose gel and
electrophoresed in 1x Tris-borate-EDTA buffer (TBE) (see Appendix) at 60 V, for 45
minutes.
Chapter Two – Materials and Methods
83
2.8.5 Agarose gel electrophoresis
Gel electrophoresis was used to analyse β-actin products. Powdered agarose
(Bioline, London, UK) was dissolved by heating in 50 ml 1x TBE buffer
supplemented with a fluorescent dye used for staining nucleic acids - ethidium
bromide (0.5 μg/ml). The gel was set in the tank at RT and submerged in 1x TBE
buffer containing ethidium bromide (0.5 μg/ml). Nucleic acid samples were
combined with 1 μl of 6x gel loading dye (New England Biolabs, UK) and loaded
into sample wells alongside the DNA molecular weight ladder (New England
Biolabs, UK). Samples were subjected to electrophoresis at 80 V for 40 minutes and
the gel visualised by UV illumination using bio imaging unit (Geneflow, UK).
2.8.6 Real-time PCR
2.8.6.1 Measurement of gene expression.
Reactions were performed using an ABI Prism 7700 sequence detector
(Applied Biosystems) using the SensiFast SYBR Hi-Rox kit (Bioline, UK).
Thermocycler conditions were 50°C for 2 minutes, 95°C for 10 minutes, followed by
44 cycles of 95°C for 15 seconds and 60°C for 1 minute. Each PCR reaction contained
900 nM gene specific 5’ and 3’ primers: VEGF (Hs_VEGFA_1_SG), GLUT1
(Hs_SLC2A1_1_SG), LDHA (Hs_LDHA_1_SG) (all from Qiagen), 1x SensiMixTM
SYBR Low-ROX MasterMix (Bioline) (containing pre-optimized dNTPs, MgCl2,
molecular probe and ROX dye), and cDNA (1 μl) in a total volume of 20 μl with

Chapter Two – Materials and Methods
84
dH2O. Three biological replicates were used for each of the target genes, with each
individual assessed in triplicate. Results were normalised to the internal reference
gene 18S rRNA. Control 18S reactions contained 50 nM 18S 5’ and 3’ primers (Sigma),
SensiMix™ (Biolone) and cDNA in a total volume of 20 μl.
2.8.6.2 Q-PCR data analysis.
Q-PCR data was first analysed using ABI Prism 7000 software (Applied
Biosystems) according to manufacturer’s guidelines. Briefly, cycle threshold (CT)
values were determined for both 18S internal control and genes of interest in each
sample by placing a threshold line over the exponential phase of the PCR cycle
profiles. The average CT values were calculated from the duplicates. The 18S internal
control value was then subtracted from the value for the gene of interest to give ΔCT
values. This value was converted to fold change in gene expression relative to control
using the equation:
Fold change = 2-ΔΔCT
and fold change was converted to percentage expression relative to control via
multiplication by 100. The average and standard error of the mean of samples were
calculated.
Chapter Two – Materials and Methods
85
2.9 Protein analysis: western blotting
2.9.1 Protein extraction and quantification.
For protein extraction, 2.5x10⁷ cells were resuspended in 150 μl RIPA buffer
(see Appendix), supplemented with 1x protease inhibitor (Sigma), and incubated for
30 minutes on ice prior to centrifugation at 14000 rpm at 4°C for 10 minutes in a
microfuge. The supernatant was transferred to a 1.5 ml centrifuge tube and frozen at
-20°C.
For protein quantification, the Dc protein assay protocol (Bio-Rad, Hemel
Hempstead, U.K.) was followed according to manufacturer’s instructions. Briefly, 5
μl BSA standards (0, 0.625, 1.25, 2.5, 5 and 10 mg/ml) were added to duplicate wells
of a 96 well plate and 2 μl of each protein sample were added to 3 μl distilled water
in replicate wells. 20 μl reagent S was added to each ml of reagent A required to
make solution ‘A’, and 25 μl A’ added to each well. Reagent B (200 μl) was then
added to each well, wells were mixed and the reaction allowed to develop for 15
minutes before the optical density was measured at 645 nm, using a plate reader.
2.9.2 Sample preparation and protein separation by sodium dodecyl
sulphate – polyacrylamide gel electrophoresis (SDS PAGE).
Protein samples (20-40 μg) were mixed in a 3:1 ratio with 4x SDS gel loading
buffer (see buffer and recipes in Appendix), heated to 100°C for 10 minutes in boiling

Chapter Two – Materials and Methods
86
water. A 10% resolving gel mix was prepared (see Appendix) and allowed to fully
polymerise at RT for 40 minutes prior to the addition of the stacking gel; prepared as
described in Appendix. Protein samples, and 5 μl pre-stained precision dual stained
markers (Bio-Rad) were loaded onto the gel and electrophoresed at 150 V with 1x
SDS gel running buffer for 90-100 minutes.
2.9.3 Protein transfer
The polyvinylidene difluoride (PVDF) membrane (Millipore, Watford, U.K.)
was soaked in methanol (Fischer) for 2 seconds, dH2O for 2 minutes and equilibrated
in transfer buffer (see Appendix) for 10 minutes. Semi-dry transfer was carried out
using four layers of pre-transfer buffer-soaked 3 mm paper (Fischer) on the cathode
and anode and the transfer was carried out using a Mini-Protean transfer tank (Bio-
Rad) at 25 V for 1 hour.
2.9.4 Immunodetection of proteins
The membrane was rinsed in TBS-T (see buffer and recipes in Appendix) and
then blocked for 45 minutes in 5% blocking solution (see Appendix). Primary
antibody was diluted (according to table 2.2) in 5% blocking solution and the
membrane was incubated overnight at 4°C with rocking. On the following day, the
membrane was washed three times for 5 minutes in TBS-T and incubated for 45
minutes at RT, with rocking in the 5% blocking solution with the secondary antibody

Chapter Two – Materials and Methods
87
(horseradish peroxidase (HRP)) diluted according to Table 2.2. Then the membrane
was washed as above and signal developed using Supersignal West Pico
Chemiluminescent substrate (Pierce, Northumberland, U.K.) and signal detected by
exposure to Xomat scientific imaging film (Kodak, Sigma) for 5 minutes. Films were
developed using an AGFA CURIX 60 (Agfa, Mortsel, Belgium). Equal loading was
checked using mouse anti-human β-actin antibody (Sigma) and secondary rabbit
anti-mouse following the same protocol (dilutions 1 in 10000 for each).
Table 2. 2. Antibodies used for the western blot analysis
Antibody Source Company Cat no. Dilution
Anti-HIF-1α mouse BD Biosciences 610959 1:500
Anti-VEGF rabbit Abcam ab46154 1:1000
Anti-GLUT1
(H-43) rabbit
SantaCruz
Biotechnology sc-7903
1:1000
Anti-β-actin mouse Sigma A2228-
100UL
1:10000
Anti-rabbit goat Sigma A6154-1ML 1:1000
Anti-mouse goat Sigma A2554-1ML 1:1000
Chapter Two – Materials and Methods
88
2.10 Investigation of oxidative stress
2.10.1 Assessment of accumulation of Reactive Oxygen Species (ROS)
Carboxy-H2DCFDA (H2DCFDA) (Invitrogen Molecular Probes, Paisley, U.K)
binds to all ROS and was dissolved in dimethyl sulfoxide (DMSO) to yield a 2000x
stock, of 10 μM. This was aliquoted into 10 μl volumes and was stored at -20°C.
Immediately prior to use, a 1 μM working dilution was made in warm RPMI
medium. 500 μl of cell suspension was placed in the FACS tube and 5 μl of medium
with H2DCFDA was added, mixed and incubated at 37°C, for 40 minutes.
Immediately after the incubation, FACS tubes were analysed.
2.10.2 Assessment of accumulation of Mitochondrial Superoxide
MitoSOX Red (Invitrogen Molecular Probes, Paisley, U.K) was used to assess
the presence of mitochondrial superoxide (mitosox) in cells, according to the
manufacturer’s instructions. Briefly, 1 ml of warm PBS was added to 200 μl of cell
suspension and centrifuged at 1500 rpm for 5 minutes. The supernatant was removed
and a vial of MitoSOX Red was diluted in 13 μl of DMSO to yield a 10 mM stock. A
working stock of 10 μl MitoSOX Red was prepared in warm PBS (Invitrogen Gibco)
and this was added to the cells, prior to incubation at 37°C for 10 minutes.

Chapter Two – Materials and Methods
89
2.11 Treatments of CLL cells with inhibitors
Stock solutions of inhibitors in DMSO were aliquoted and stored at −80°C
prior to use. For cell treatment, these stock solutions were diluted 1:1000 in medium
to a final DMSO concentration of 0.1%.
2.11.1 HIF-1α inhibition with Chetomin
Cells were pre-treated for 3 hours with 0.1 μM, 1 μM and 5 μM chetomin
(CTM) dissolved in DMSO. In order to obtain hypoxic conditions, cells were
incubated in the hypoxic incubator (Mini Galaxy A, O2 control) with 1% O2 and 5%
CO2 at 37°C for 24 hours.
2.11.2 Alanine aminotransferase inhibition with cycloserine and β-
chloro-l-alanine.
Cells were treated with two concentrations of cycloserine and β-chloro-l-
alanine: 10 μM and 250 μM for 24 hours in normoxia and hypoxia.
2.11.3 Pyruvate cellular transporter (MCT1) inhibition with CHC
Alpha-cyano-4-hydroxycinnamate (CHC) (Sigma) was dissolved in DMSO
and used at 2 mM and 5 mM concentrations. Cells were pre-treated for 3 hours
before transfefrring into hypoxic conditions.

Chapter Two – Materials and Methods
90
2.12 HRP chromogenic staining of cytospins
2.12.1 Staining
After spinning and drying, of the cytospins, they were fixed for 10 minutes in
cold acetone and air dried. Then the spot of cells was circled with a hydrophobic pen
to create a barrier and 80 μl of peroxidase block was added and incubated at RT
protected from light for 10 minutes. Following this, the cytospins were rinsed twice
in fresh wash buffer for 3 minutes each time followed by incubation with 80 μl of FcR
block at RT protected from light for 10 minutes. Next, cytospins were rinsed twice in
fresh wash buffer for 3 minutes each time.
Primary HIF-1α antibody (Sigma) was diluted 1:100 in Dako Antibody Diluent,
applied on the slides and incubated for 30 minutes at RT, protected from light. Then
cytospins were rinsed as previously. Secondary Antibody – Anti rabbit/mouse HRP
Dako premade solution, was applied on the slides, incubated for 30 minutes at RT
protected from light and rinsed as previously. Chromogenic developer was then
prepared using 20 μl of stock added to 1 ml of diluent and added to each slide
separately and incubated at RT for up to 10 minutes while monitoring under a
microscope. Once clear staining was seen or high background developed, the
solution was rinsed off by dropping slides into fresh buffer.

Chapter Two – Materials and Methods
91
2.12.2 Counterstain
Slides were immersed in haematoxylin for 15 seconds, then rinsed in Scotts
water, freshened and rinsed again. Subsequently, slides were dipped in acid alcohol
wash for less than 5 seconds and rinsed well in Scotts water, then rinsed with
running tap water for 30 seconds-1 min.
2.12.3 Dehydration and Mounting
Cytospins were immersed twice in 50% ethanol, twice in 70% ethanol, once in
96% ethanol for 3 minutes, once in 96% ethanol for 2 minutes, twice in 98% ethanol
for 2 minutes each and once in 100% ethanol for 2 minutes. Then cytospins were air
dried and mounted with the coverslip using mounting medium (Dako).
2.13 Fluorescent staining of cytospins
After spinning and drying, the cytospins were fixed for 10 minutes in cold
acetone and air dried. Then the cells spot was circled with a hydrophobic pen to
create a barrier and 80 μl of donkey serum (Jackson ImmunoResearch) was added
and incubated at RT protected from light for 10 minutes. Then the cytospins were
rinsed twice in fresh wash buffer for 3 minutes each time followed by 30 minute
incubation at RT protected from light with first primary antibodies: rabbit anti HIF-
1α (Sigma) diluted 1:100 (see table 2.3). Next, cytospins were rinsed twice in fresh
wash buffer for 3 minutes each time. Secondary antibody – donkey anti rabbit

Chapter Two – Materials and Methods
92
(Jackson ImmunoResearch) was applied on the slides, incubated for 30 minutes at RT
protected from light and rinsed as previously. Cytospins were then stained with
PAX-5 which is a B cell marker. The procedure was the same as previously, IgG
control was stained with anti-goat antibody. All the antibody dilutions are presented
in table 2.3. After the last wash, cytospins were mounted to the coverslips using the
ProLong® Gold anti fade reagent with DAPI dye, staining the nuclei of cells (Life
Technologies).
Table 2. 3. Antibodies used for cytospin staining
Antibody Source Company Cat no. Dilution
Anti-HIF-1α rabbit Sigma HPA001275 1:100
Human Pax5/BSAP goat R&D systems AF3487 1:10
Normal rabbit IgG rabbit R&D systems AB-105-C 1:100
Normal Goat IgG goat R&D systems AB-108-C 1:10
Anti-Rabbit HRP goat Dako P 0448 premade
solution
Anti-Rabbit donkey Jackson
ImmunoResearch
711-001-003-
JIR 1:100
Alexa Fluor® 568
Donkey Anti-Goat donkey Life Technologies P36930 1:100
Chapter Two – Materials and Methods
93
2.14 Statistical analysis of experiments
Normal distribution and homogeneity of variance of all data sets was assessed
by Shapiro-Wilk and Levene’s tests respectively using SPSS version 16 software. All
the data were normally distributed and displayed homogeneity of variance.
Statistical significance was assessed using the student’s t-test for paired data,
calculated using the statistics package within Microsoft Excel™. p values below 0.05
are indicated by * as described in the legends of figures.
2.15 MetaboLab routines used for data analysis
Together with the progress of the project, development of MetaboLab was
carried out. The HSQC library of chosen metabolites was built, based on the HMDB
data.
2.15.1 MATLAB scripts
In order to perform the analysis of the time course NMR spectra, specific
MATLAB scripts were created.
2.15.1.1 Scale TMSP
Scale TMSP height script has been used to scale all of the TMSP signal heights
from the time course experiment to 1. This enabled us to compare peak heights in the
different experiments as well as overcome the line width instability between spectra
of the same time course. TMSP is the reference point for 0 ppm.
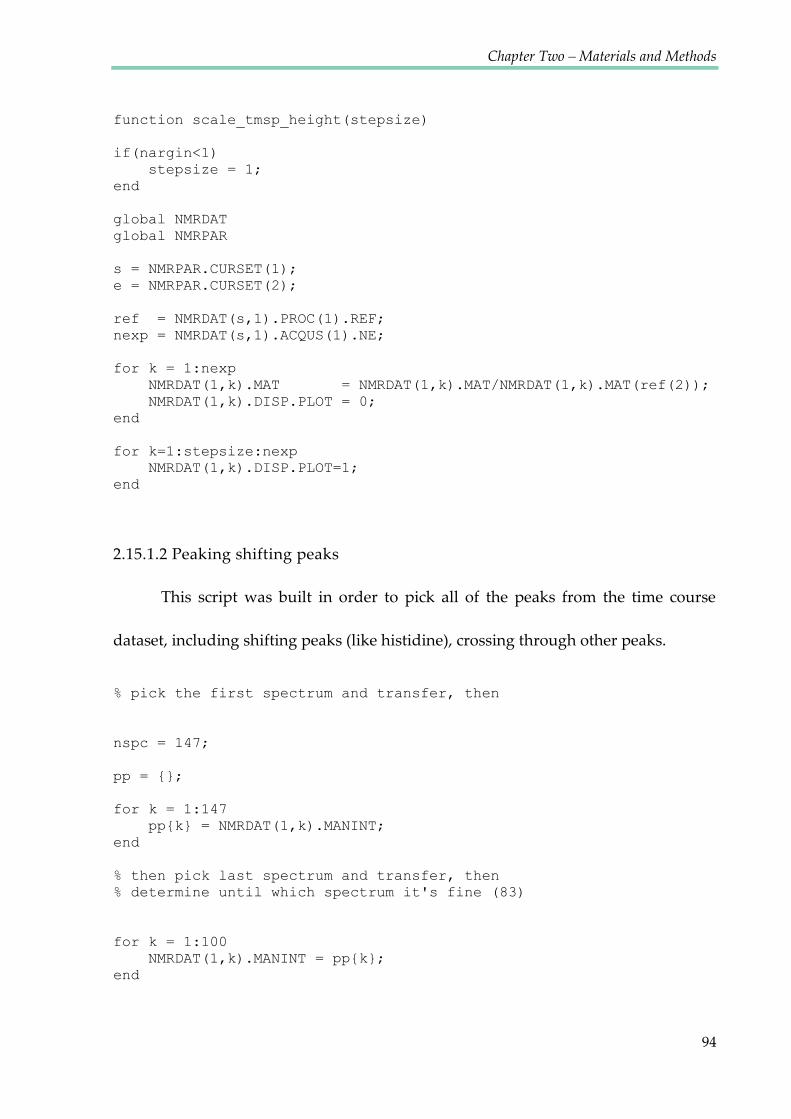
Chapter Two – Materials and Methods
94
function scale_tmsp_height(stepsize)
if(nargin<1)
stepsize = 1;
end
global NMRDAT
global NMRPAR
s = NMRPAR.CURSET(1);
e = NMRPAR.CURSET(2);
ref = NMRDAT(s,1).PROC(1).REF;
nexp = NMRDAT(s,1).ACQUS(1).NE;
for k = 1:nexp
NMRDAT(1,k).MAT = NMRDAT(1,k).MAT/NMRDAT(1,k).MAT(ref(2));
NMRDAT(1,k).DISP.PLOT = 0;
end
for k=1:stepsize:nexp
NMRDAT(1,k).DISP.PLOT=1;
end
2.15.1.2 Peaking shifting peaks
This script was built in order to pick all of the peaks from the time course
dataset, including shifting peaks (like histidine), crossing through other peaks.
% pick the first spectrum and transfer, then
nspc = 147;
pp = {};
for k = 1:147
pp{k} = NMRDAT(1,k).MANINT;
end
% then pick last spectrum and transfer, then
% determine until which spectrum it's fine (83)
for k = 1:100
NMRDAT(1,k).MANINT = pp{k};
end

Chapter Two – Materials and Methods
95
2.15.1.3 Fit pH curve
The ‚fit pH curve‛ script was built in order to create pH curves from the
differences of the chemical shifts of histidine peaks from 21 spectra, acquired on the
medium samples with differing pH (3.5-8.5).
nPeaks = 2;
nSpc = 21;
pH = [8.5, 8.25, 8, 7.75, 7.5, 7.25, 7, 6.75, 6.5, 6.25, 6,
5.75, 5.5, 5.25, 5, 4.75, 4.5, 4.25, 4, 3.75, 3.5];
fitfun = '(10.^(t-pk)*DB+DA))./(1+10.^(t-pk))';
%--------------------------------------------
ppm = zeros(nSpc,nPeaks);
for k = 1:nSpc
ppm(k,:) = NMRDAT(1,k).MANINT.peakMaxPPM;
end
diffData = abs(diff(ppm')');
pars = parse_command_string(fitfun,1);
fitpars = zeros(1,length(pars));
for k = 1:length(pars)
fitpars(k) = pars(k).value;
end
opts = optimset();
opts.MaxFunEvals = 1e7;
opts.MaxIter = 1e7;
opts.TolFun = 1e-7;
opts.TolX = 1e-7;
[par_eval, fval, status] =
fminsearch(@gen_fit,fitpars,opts,pH,diffData,fitfun,pars);
[chi2,simFct] = gen_fit(par_eval,t,data,fitfun,pars);
figure
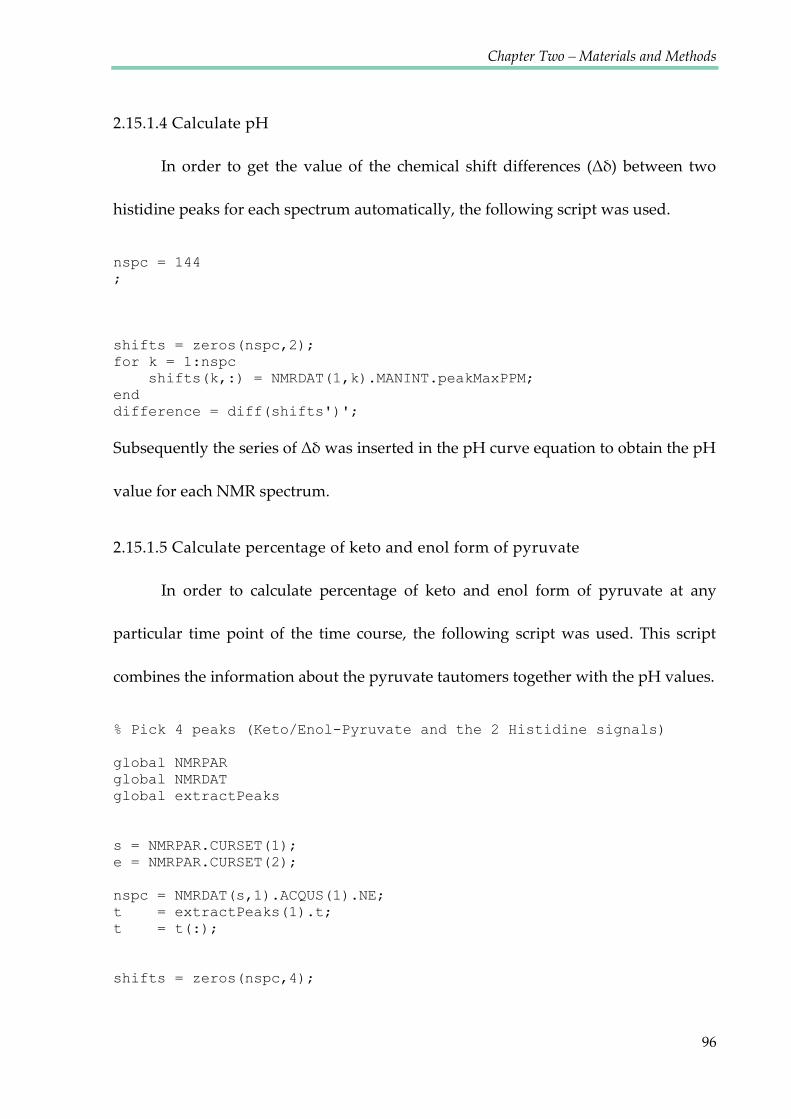
Chapter Two – Materials and Methods
96
2.15.1.4 Calculate pH
In order to get the value of the chemical shift differences (Δδ) between two
histidine peaks for each spectrum automatically, the following script was used.
nspc = 144
;
shifts = zeros(nspc,2);
for k = 1:nspc
shifts(k,:) = NMRDAT(1,k).MANINT.peakMaxPPM;
end
difference = diff(shifts')';
Subsequently the series of Δδ was inserted in the pH curve equation to obtain the pH
value for each NMR spectrum.
2.15.1.5 Calculate percentage of keto and enol form of pyruvate
In order to calculate percentage of keto and enol form of pyruvate at any
particular time point of the time course, the following script was used. This script
combines the information about the pyruvate tautomers together with the pH values.
% Pick 4 peaks (Keto/Enol-Pyruvate and the 2 Histidine signals)
global NMRPAR
global NMRDAT
global extractPeaks
s = NMRPAR.CURSET(1);
e = NMRPAR.CURSET(2);
nspc = NMRDAT(s,1).ACQUS(1).NE;
t = extractPeaks(1).t;
t = t(:);
shifts = zeros(nspc,4);
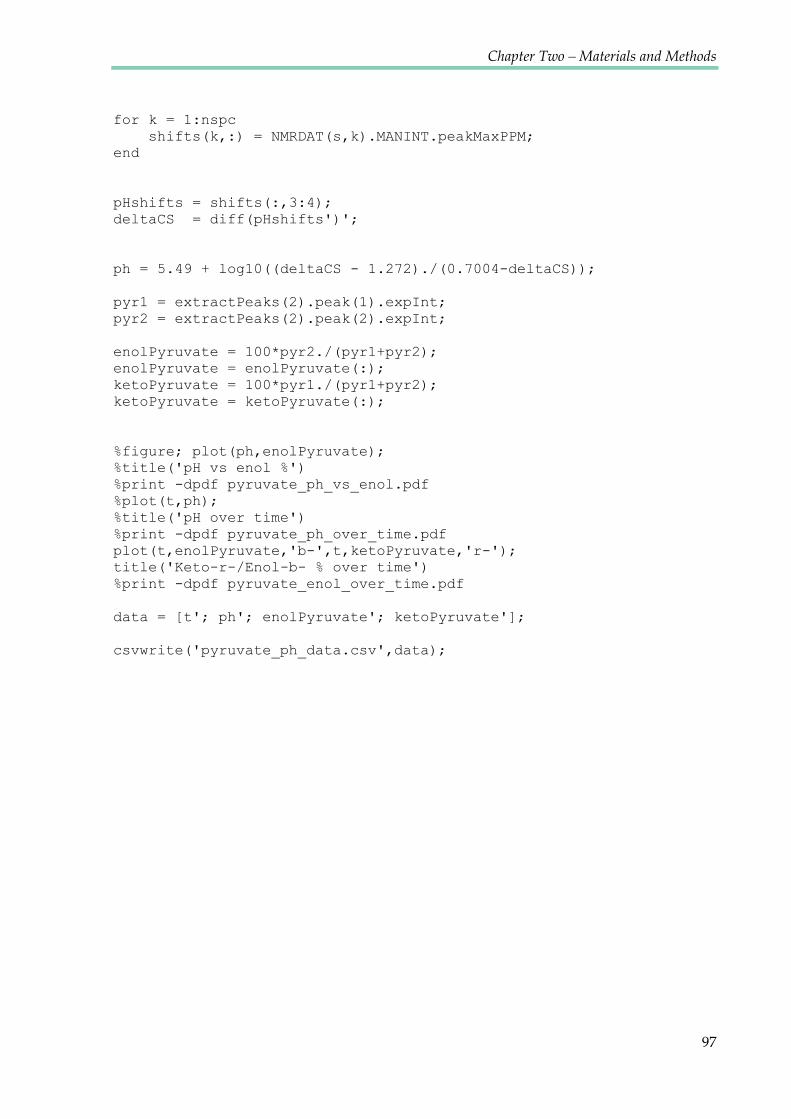
Chapter Two – Materials and Methods
97
for k = 1:nspc
shifts(k,:) = NMRDAT(s,k).MANINT.peakMaxPPM;
end
pHshifts = shifts(:,3:4);
deltaCS = diff(pHshifts')';
ph = 5.49 + log10((deltaCS - 1.272)./(0.7004-deltaCS));
pyr1 = extractPeaks(2).peak(1).expInt;
pyr2 = extractPeaks(2).peak(2).expInt;
enolPyruvate = 100*pyr2./(pyr1+pyr2);
enolPyruvate = enolPyruvate(:);
ketoPyruvate = 100*pyr1./(pyr1+pyr2);
ketoPyruvate = ketoPyruvate(:);
%figure; plot(ph,enolPyruvate);
%title('pH vs enol %')
%print -dpdf pyruvate_ph_vs_enol.pdf
%plot(t,ph);
%title('pH over time')
%print -dpdf pyruvate_ph_over_time.pdf
plot(t,enolPyruvate,'b-',t,ketoPyruvate,'r-');
title('Keto-r-/Enol-b- % over time')
%print -dpdf pyruvate_enol_over_time.pdf
data = [t'; ph'; enolPyruvate'; ketoPyruvate'];
csvwrite('pyruvate_ph_data.csv',data);
Chapter III
Establishing NMR method
to measure metabolic
changes in living CLL cells

Chapter Three – Establishing NMR method to measure metabolic changes in living CLL cells
99
3.1 INTRODUCTION
Metabolomics has been widely used to examine the metabolic phenotype of
cells, usually exploiting either hydrophilic or lipophilic extracts (Gromova and Roby
2010; Fernando, Bhopale et al. 2011). Performing time course analyses in this way
requires large amounts of biological material, which is a limiting factor for studies
using primary human cells. However, NMR represents a non-invasive analytical
method that is, in principle, able to analyse the metabolism of living cells, and
monitor its dynamics over extended periods of time in a single batch of cells.
NMR is a powerful tool that can be used to monitor labelling patterns in key
metabolic intermediates, which can be used to calculate fluxes in mammalian tissues
(Griffin and Corcoran 2005). While metabolomics measures static metabolite
concentrations, metabolic flux analysis observes the flux of individual atoms across
metabolic networks employing isotopically labelled metabolic precursors such as
glucose and glutamine as tracers. However, because of the limited sensitivity of 13C
NMR, it has not been widely applied to the study of isolated cells in culture. Such
studies require a very large number of cells to fill the sample volume of an NMR
tube. A number of different methods have been used to immobilise dense cultures of
cells inside an NMR tube. A key parameter that must be considered with any cell
immobilisation technique is the transport of metabolites and nutrients. Oxygen can
be particularly problematic, because it is poorly soluble in aqueous media. In dense
Chapter Three – Establishing NMR method to measure metabolic changes in living CLL cells
100
masses of cells, metabolic rates are often limited by the rate of oxygen diffusion. Such
limitations can hinder the determination of the true intrinsic metabolic characteristics
of a population of cells. To avoid such limitations either the diffusion distance in the
cell mass must be short, or the density of the cell mass must be relatively low. It has
previously been shown that the metabolism of human cancer cells can be monitored
using NMR perfusion systems with various adherent cell lines grown on
microcarrier beads. Methods involving microcarriers can be used with cell lines,
where the amount of biological material can easily be multiplied. In published
experiments, 3-8x10⁸ cells grown on beads were used, filling a 20 mm NMR tube
(Pianet, Canioni et al. 1992). Similar methods have been used for the metabolic flux
analyses in glioma cells after enriching the metabolic substrates with 13C labels.
Microbeads were mixed with SF188 cells at a ratio of 107 cells per gram
(DeBerardinis, Mancuso et al. 2007). As the cells usually need to grow in the
microcarriers for 8-9 days, this method can be effectively used solely with cells that
proliferate and adhere to microbeads (Mancuso, Beardsley et al. 2004; Mancuso, Zhu
et al. 2005).
As a result of the non-invasiveness of NMR, in-cell NMR is widely used for
protein investigation. This method allows for the determination of the conformation
and functional properties of proteins inside living cells (for example Xenopus laevis
oocytes) (Selenko and Wagner 2007).
Chapter Three – Establishing NMR method to measure metabolic changes in living CLL cells
101
Despite well-developed systems for measuring metabolites using
proliferating, adherent cells, little has been reported on NMR metabolomics using
quiescent, suspension cells. A ‚continuous cell cultivator‛ providing convective
oxygen and nutrient transport was constructed for 31P NMR experiments using
Saccharomyces cerevisiae where large amounts of cells can easily be grown (Meehan,
Eskey et al. 1992). More recently, a perfusion small-scale bioreactor for on-line
monitoring of the cell energetic state was developed for free-suspension mammalian
cells (Chinese hamster ovary cell line) (Ben-Tchavtchavadze, Chen et al. 2010),
however, no metabolomics work on human suspension cells has been published to
date.
In order to investigate the metabolism of primary CLL cells which are non-
dividing, an NMR system for cells in suspension that does not require microcarriers,
perfusion systems or large amounts of cells, was developed. In order to suspend cells
evenly in the NMR tube and for the duration of the experiment, cells were embedded
in a medium-agarose matrix. To monitor the oxygen concentration in the tube, an
oxygen sensor was used and the pH was calculated using the histidine resonances
(as described in materials and methods).
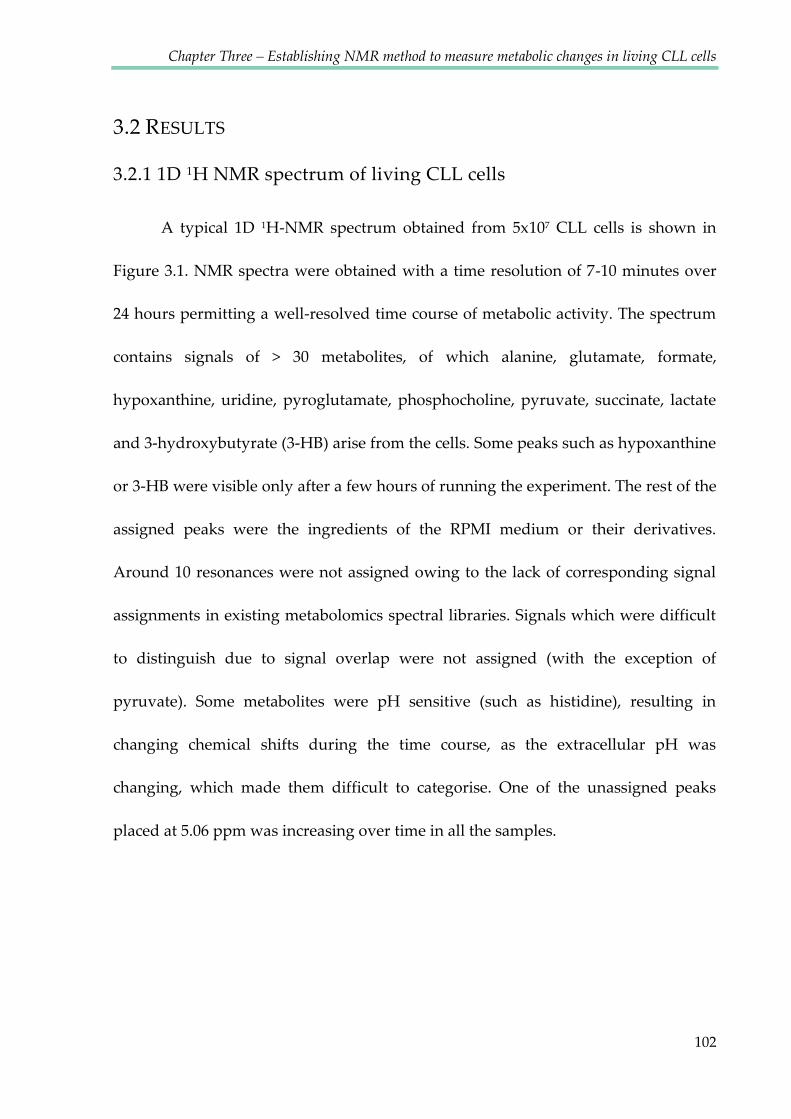
Chapter Three – Establishing NMR method to measure metabolic changes in living CLL cells
102
3.2 RESULTS
3.2.1 1D 1H NMR spectrum of living CLL cells
A typical 1D 1H-NMR spectrum obtained from 5x10⁷ CLL cells is shown in
Figure 3.1. NMR spectra were obtained with a time resolution of 7-10 minutes over
24 hours permitting a well-resolved time course of metabolic activity. The spectrum
contains signals of > 30 metabolites, of which alanine, glutamate, formate,
hypoxanthine, uridine, pyroglutamate, phosphocholine, pyruvate, succinate, lactate
and 3-hydroxybutyrate (3-HB) arise from the cells. Some peaks such as hypoxanthine
or 3-HB were visible only after a few hours of running the experiment. The rest of the
assigned peaks were the ingredients of the RPMI medium or their derivatives.
Around 10 resonances were not assigned owing to the lack of corresponding signal
assignments in existing metabolomics spectral libraries. Signals which were difficult
to distinguish due to signal overlap were not assigned (with the exception of
pyruvate). Some metabolites were pH sensitive (such as histidine), resulting in
changing chemical shifts during the time course, as the extracellular pH was
changing, which made them difficult to categorise. One of the unassigned peaks
placed at 5.06 ppm was increasing over time in all the samples.
Chapter Three – Establishing NMR method to measure metabolic changes in living CLL cells
103
Figure 3. 1. 1D 1H NMR spectrum of CLL cells.
Metabolites assigned: 1-formate, 2-hypoxanthine*, 3-histidine, 4-phenylalanine, 5-tyrosine,
6-glucose, 7-trans-4-hydroxyl-L-proline, 8-uridine, 9-pyroglutamate, 10-serine, 11-myo-
inositol, 12-glycine, 13-phosphocholine, 14-choline, 15-lysine, 16-asparagine, 17-aspartate,
18-methionine, 19-glutamine, 20-succinate, 21-pyruvate, 22-glutamate, 23-arginine, 24-
alanine, 25-lactate, 26-3-hydroxybutyrate, 27-ethanol, 28-valine, 29-isoleucine and 30-
leucine.
* hypoxanthine was detectable after a few hours of the time course.
Chapter Three – Establishing NMR method to measure metabolic changes in living CLL cells
104
In order to confirm the assignment of the most abundant peaks, the agarose
matrix and cells were removed by centrifugation, the pH of the medium was re-
adjusted to 7.0 and placed back in the NMR tube to acquire another 1D NOESY, 2D
1H1H J-resolved (J-res) and 2D 1H13C HSQC spectrum (Figure 3.2). J-res spectra were
analysed using automatic metabolic quantification – FIMA (Field Independent
Metabolic Analysis) through the online service at http://www.bml-nmr.org/. The
major advantage of using two-dimensional NMR spectra is the reduction of signals
overlap due to the introduction of a second independent chemical shift axis. In J-res
spectra reduction of overlap is achieved by the ability to create a proton decoupled
1D spectrum, which has less overlap compared to a normal 1D proton spectrum.

Chapter Three – Establishing NMR method to measure metabolic changes in living CLL cells
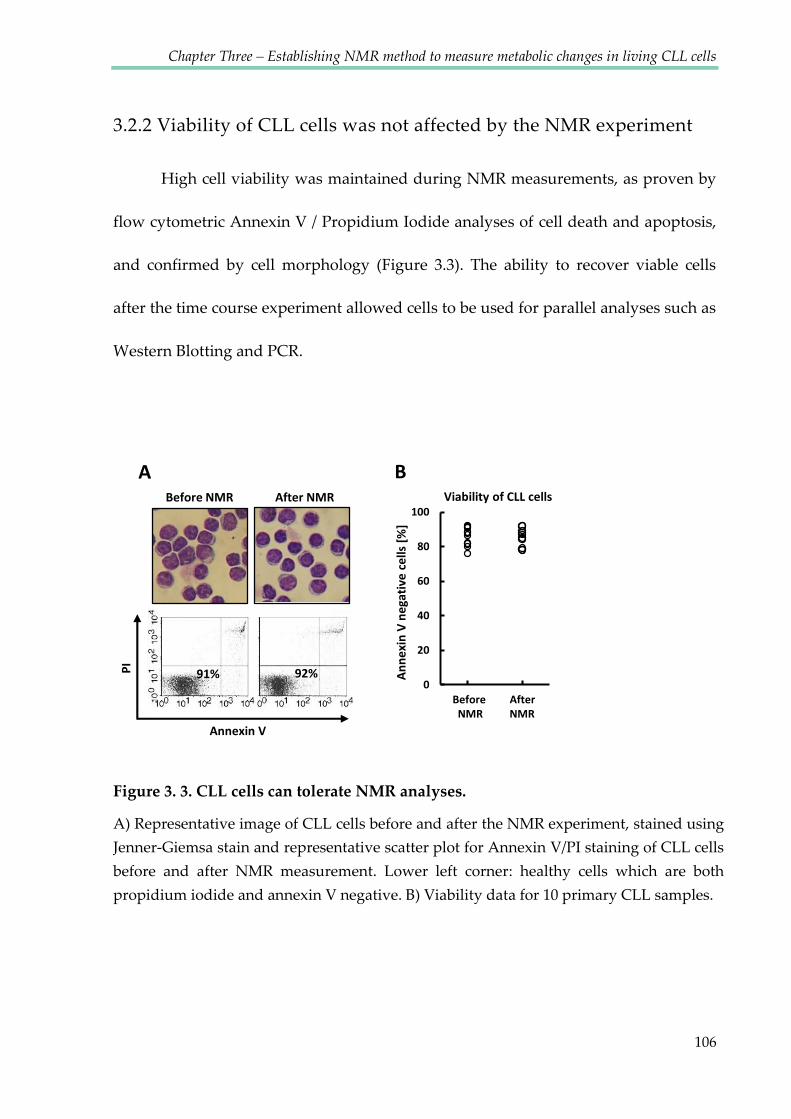
Chapter Three – Establishing NMR method to measure metabolic changes in living CLL cells
106
3.2.2 Viability of CLL cells was not affected by the NMR experiment
High cell viability was maintained during NMR measurements, as proven by
flow cytometric Annexin V / Propidium Iodide analyses of cell death and apoptosis,
and confirmed by cell morphology (Figure 3.3). The ability to recover viable cells
after the time course experiment allowed cells to be used for parallel analyses such as
Western Blotting and PCR.
PI
91% 92%
Before NMR After NMR
Annexin V
A B
0
20
40
60
80
100
0.5 1.5 2.5
An
ne
xin
V n
ega
tive
ce
lls [
%]
Viability of CLL cells
Before After NMR NMR
Figure 3. 3. CLL cells can tolerate NMR analyses.
A) Representative image of CLL cells before and after the NMR experiment, stained using
Jenner-Giemsa stain and representative scatter plot for Annexin V/PI staining of CLL cells
before and after NMR measurement. Lower left corner: healthy cells which are both
propidium iodide and annexin V negative. B) Viability data for 10 primary CLL samples.
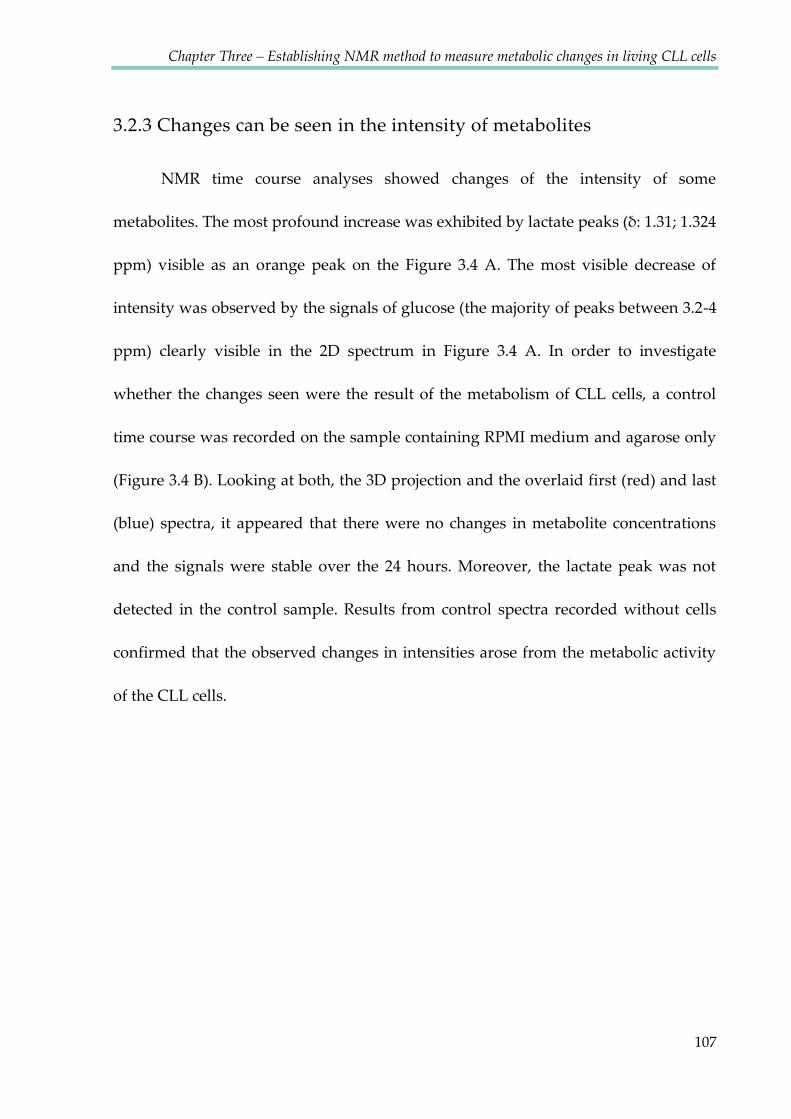
Chapter Three – Establishing NMR method to measure metabolic changes in living CLL cells
107
3.2.3 Changes can be seen in the intensity of metabolites
NMR time course analyses showed changes of the intensity of some
metabolites. The most profound increase was exhibited by lactate peaks (δ: 1.31; 1.324
ppm) visible as an orange peak on the Figure 3.4 A. The most visible decrease of
intensity was observed by the signals of glucose (the majority of peaks between 3.2-4
ppm) clearly visible in the 2D spectrum in Figure 3.4 A. In order to investigate
whether the changes seen were the result of the metabolism of CLL cells, a control
time course was recorded on the sample containing RPMI medium and agarose only
(Figure 3.4 B). Looking at both, the 3D projection and the overlaid first (red) and last
(blue) spectra, it appeared that there were no changes in metabolite concentrations
and the signals were stable over the 24 hours. Moreover, the lactate peak was not
detected in the control sample. Results from control spectra recorded without cells
confirmed that the observed changes in intensities arose from the metabolic activity
of the CLL cells.
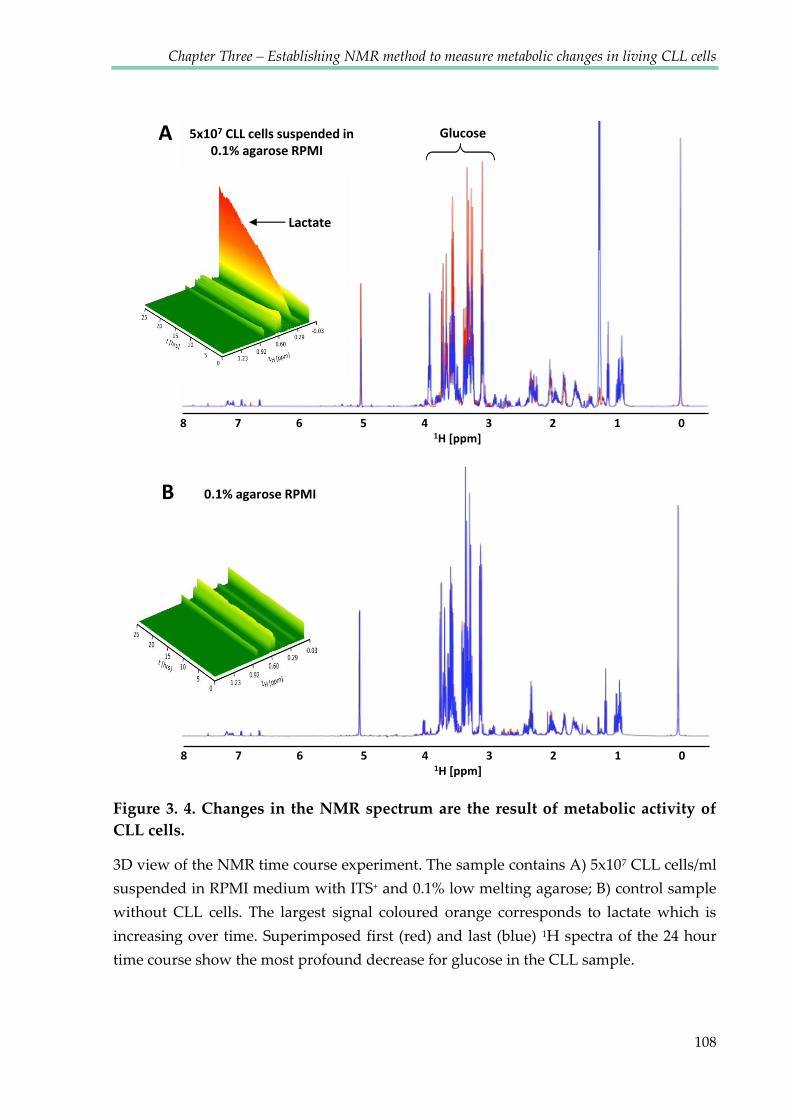
Chapter Three – Establishing NMR method to measure metabolic changes in living CLL cells
108
Figure 3. 4. Changes in the NMR spectrum are the result of metabolic activity of
CLL cells.
3D view of the NMR time course experiment. The sample contains A) 5x10⁷ CLL cells/ml
suspended in RPMI medium with ITS+ and 0.1% low melting agarose; B) control sample
without CLL cells. The largest signal coloured orange corresponds to lactate which is
increasing over time. Superimposed first (red) and last (blue) 1H spectra of the 24 hour
time course show the most profound decrease for glucose in the CLL sample.
A 5x10⁷ CLL cells suspended in 0.1% agarose RPMI
0.1% agarose RPMI
8 7 6 5 4 3 2 1 0 1H [ppm]
8 7 6 5 4 3 2 1 0 1H [ppm]
B
8 7 6 5 4 3 2 1 0 1H [ppm]
0.1% agarose RPMI
Lactate
Glucose
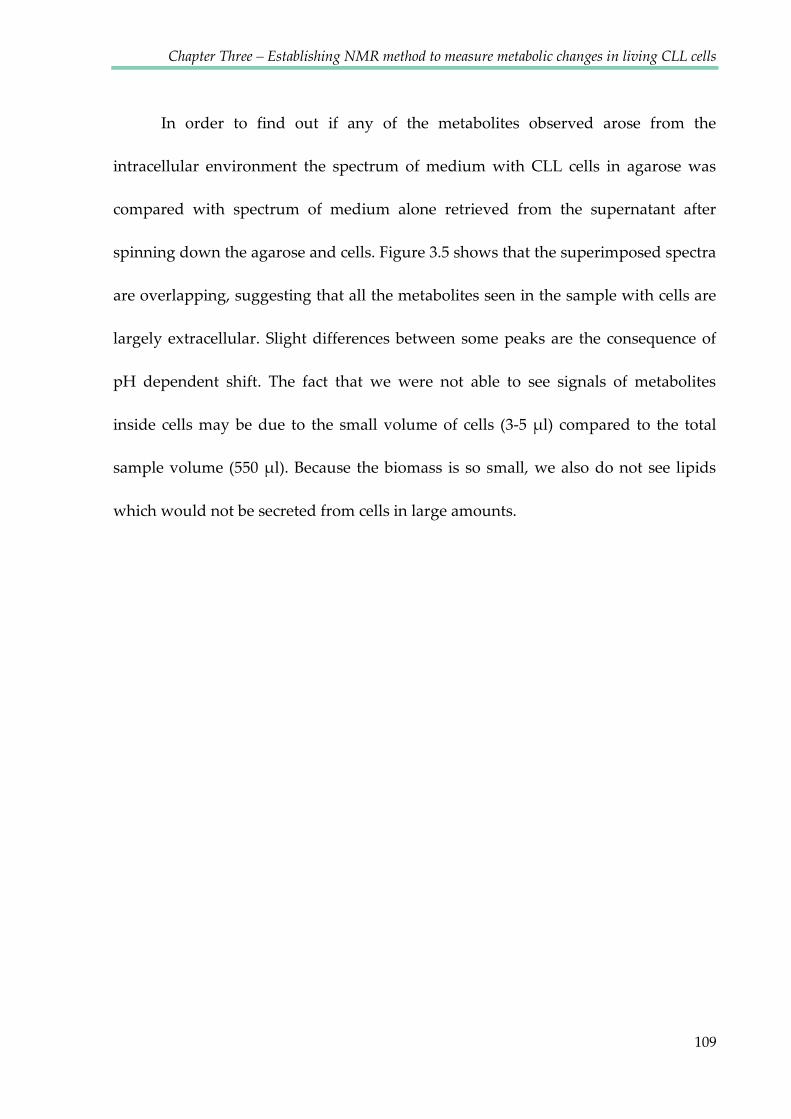
Chapter Three – Establishing NMR method to measure metabolic changes in living CLL cells
109
In order to find out if any of the metabolites observed arose from the
intracellular environment the spectrum of medium with CLL cells in agarose was
compared with spectrum of medium alone retrieved from the supernatant after
spinning down the agarose and cells. Figure 3.5 shows that the superimposed spectra
are overlapping, suggesting that all the metabolites seen in the sample with cells are
largely extracellular. Slight differences between some peaks are the consequence of
pH dependent shift. The fact that we were not able to see signals of metabolites
inside cells may be due to the small volume of cells (3-5 μl) compared to the total
sample volume (550 μl). Because the biomass is so small, we also do not see lipids
which would not be secreted from cells in large amounts.
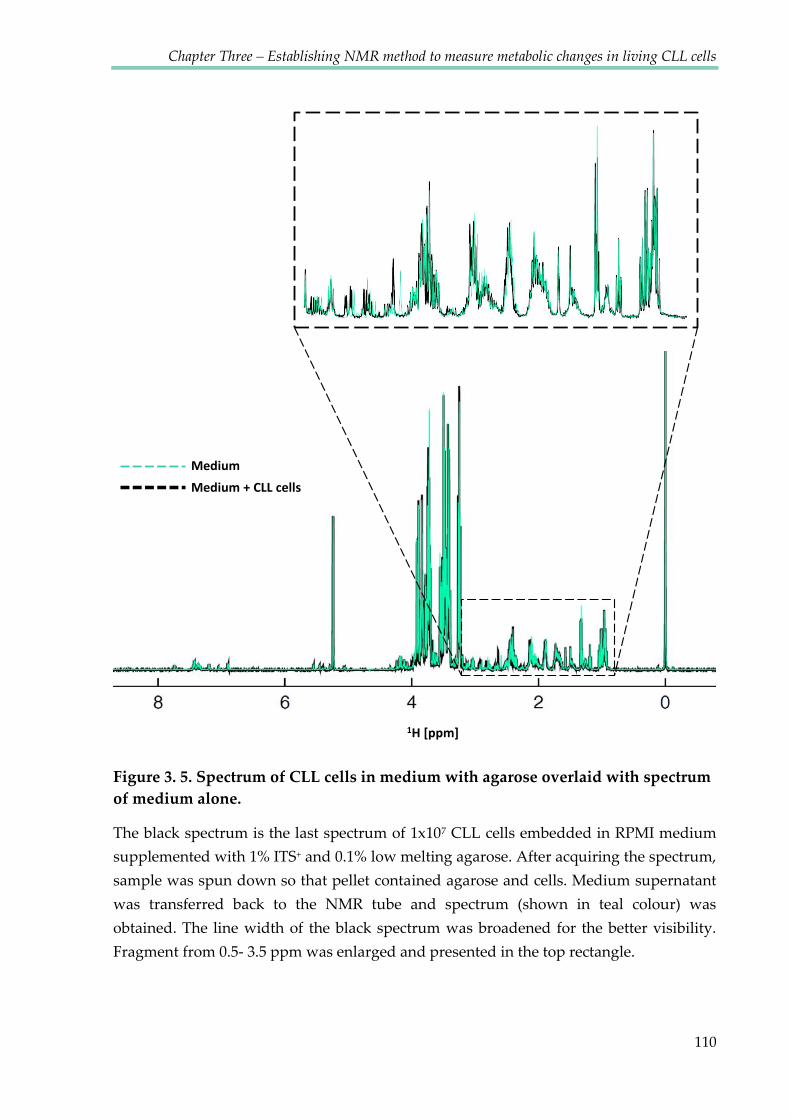
Chapter Three – Establishing NMR method to measure metabolic changes in living CLL cells
110
Figure 3. 5. Spectrum of CLL cells in medium with agarose overlaid with spectrum
of medium alone.
The black spectrum is the last spectrum of 1x10⁷ CLL cells embedded in RPMI medium
supplemented with 1% ITS+ and 0.1% low melting agarose. After acquiring the spectrum,
sample was spun down so that pellet contained agarose and cells. Medium supernatant
was transferred back to the NMR tube and spectrum (shown in teal colour) was
obtained. The line width of the black spectrum was broadened for the better visibility.
Fragment from 0.5- 3.5 ppm was enlarged and presented in the top rectangle.
1H [ppm]
Medium
Medium + CLL cells
Chapter Three – Establishing NMR method to measure metabolic changes in living CLL cells
111
3.2.4 Changes of intensities of metabolite signals
In order to distinguish between signals which changes intensity and those that
are stable over time course of 24 hours, sections from spectra representing several
metabolites were compared (Figure 3.6). Colours move from red to blue over the
time course. Signals of metabolites that were consumed by cells (such as glucose or
glutamine) decreased over time, while those of metabolites secreted by cells (such as
lactate, alanine, glutamate, hypoxanthine and 3-hydroxybutyrate) increased. Some
metabolites showed up or downfield changes in their chemical shift caused by pH
changes (such as histidine, glutamine and arginine). To allow for scaling of the
spectrum to its frequency as well as to its intensity, for the comparison of different
samples, it was crucial that the internal reference compound - TMSP, stayed stable
throughout time course experiments. The stability of TMSP peak was achieved by
shimming between the acquisition of subsequent spectra of the time course.
3.2.5 Apparently quiescent CLL cells show high metabolic activity
Peripheral blood CLL cells are out of cell cycle (Messmer, Messmer et al. 2005),
have relatively scant cytoplasms (see Fig 3.3.A), and are generally considered to be
quiescent (Calissano, Damle et al. 2011). Cell cycle analysis confirmed that all CLL
cells were in the G0 phase (Figure 3.7). Despite this, marked metabolic activity in
these cells was observed, notably evidenced by increases in signals for lactate,
Chapter Three – Establishing NMR method to measure metabolic changes in living CLL cells
112
glutamate, alanine, 3-hydroxybutyrate and histidine (Figure 3.6) as well as
consumption of glucose and glutamine.
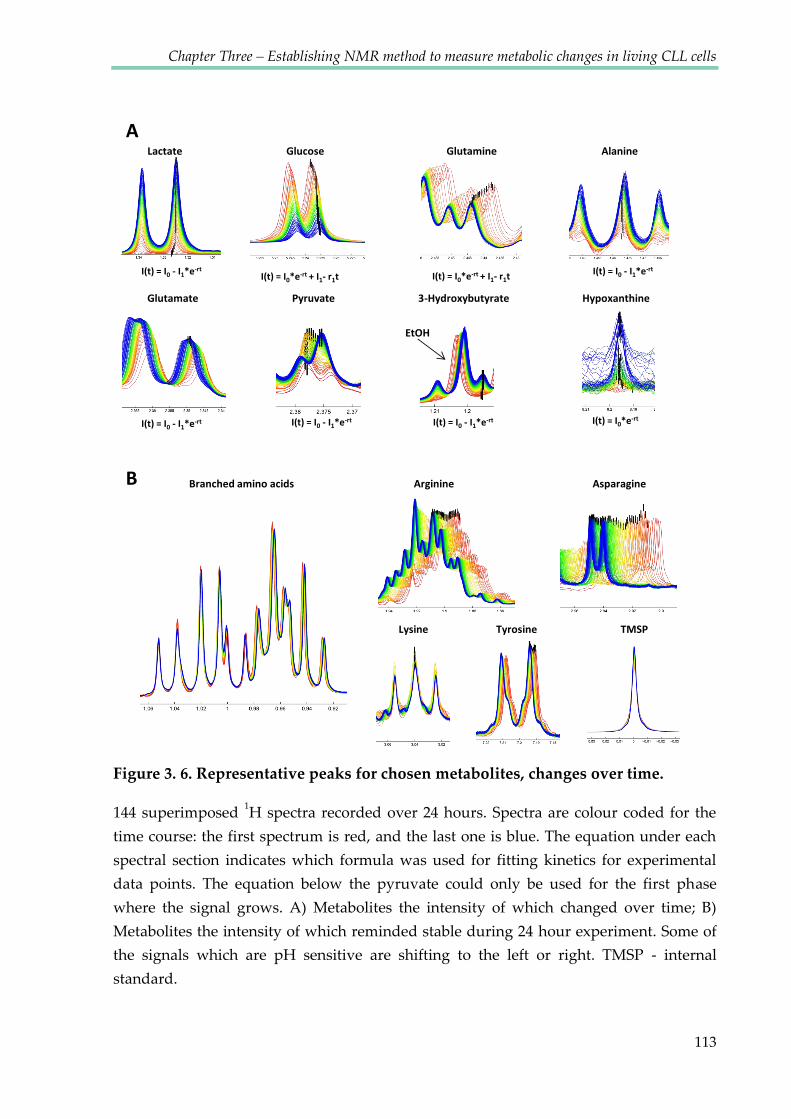
Chapter Three – Establishing NMR method to measure metabolic changes in living CLL cells
113
Figure 3. 6. Representative peaks for chosen metabolites, changes over time.
144 superimposed 1H spectra recorded over 24 hours. Spectra are colour coded for the
time course: the first spectrum is red, and the last one is blue. The equation under each
spectral section indicates which formula was used for fitting kinetics for experimental
data points. The equation below the pyruvate could only be used for the first phase
where the signal grows. A) Metabolites the intensity of which changed over time; B)
Metabolites the intensity of which reminded stable during 24 hour experiment. Some of
the signals which are pH sensitive are shifting to the left or right. TMSP - internal
standard.
I(t) = I0 - I1*e-rt
Lactate Glucose Glutamine Alanine
Glutamate Pyruvate 3-Hydroxybutyrate Hypoxanthine
A
B Branched amino acids Arginine Asparagine
Lysine Tyrosine TMSP
I(t) = I0 - I1*e-rt
I(t) = I0 - I1*e-rt I(t) = I0 - I1*e-rt I(t) = I0 - I1*e-rt I(t) = I0*e-rt
I(t) = I0*e-rt + I1- r1t I(t) = I0*e-rt + I1- r1t
EtOH

Chapter Three – Establishing NMR method to measure metabolic changes in living CLL cells
Chapter Three – Establishing NMR method to measure metabolic changes in living CLL cells
115
3.2.6 Metabolic changes were not affected by the stabilisation of
extracellular pH
As it would be expected, lactate production was associated with a progressive
acidification of the medium. We used the chemical shift of histidine signals (Cohen,
Motiei et al. 2004), which is a component of RPMI medium, to determine the in situ
changes in pH during each acquisition. As shown in Figure 3.8, pH changed from
~7.8 to 6.5 over a 24 h time course and displayed a pattern which correlated with the
accumulation of lactate (Figure 3.8 B). In order to stabilise the pH, medium with
additional HEPES buffer was used. Experiments performed using RPMI medium
with 25 mM HEPES demonstrated that lactate production was unaffected by the
stabilisation of the extracellular pH (Figure 3.8). RPMI medium with HEPES buffer
was not used routinely as HEPES signals obscured a large part of the spectrum
(Figure 3.9).

Chapter Three – Establishing NMR method to measure metabolic changes in living CLL cells
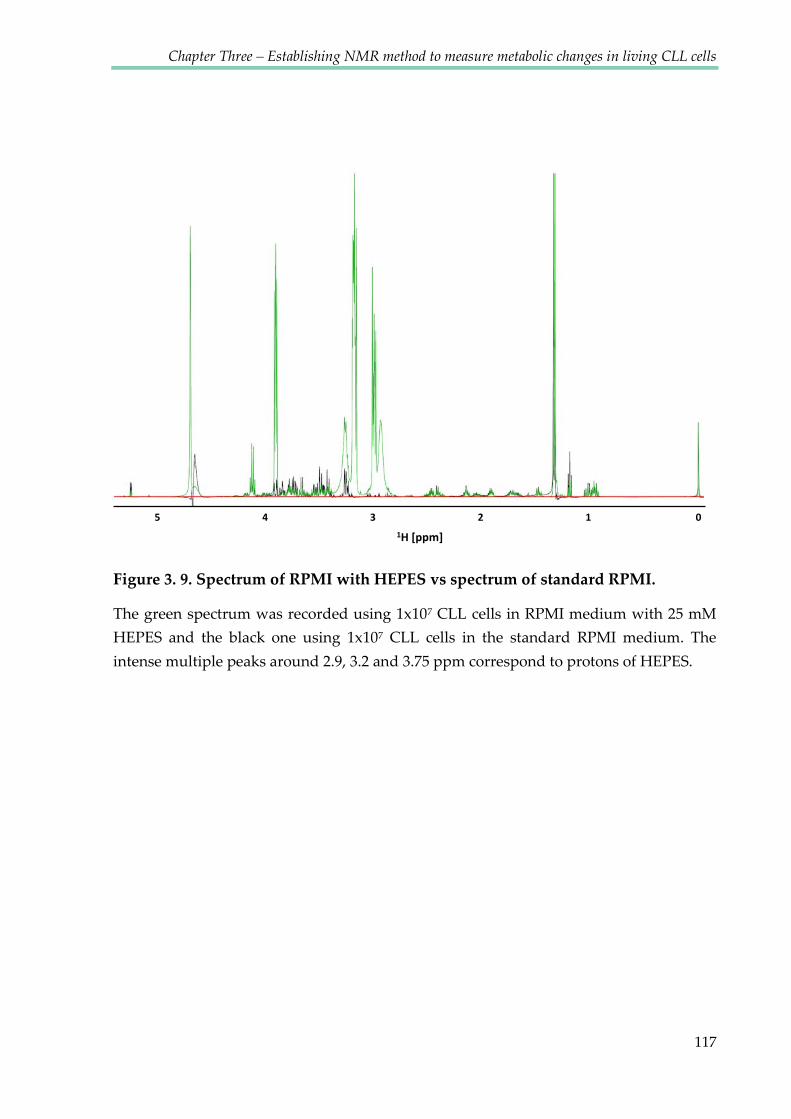
Chapter Three – Establishing NMR method to measure metabolic changes in living CLL cells
117
Figure 3. 9. Spectrum of RPMI with HEPES vs spectrum of standard RPMI.
The green spectrum was recorded using 1x10⁷ CLL cells in RPMI medium with 25 mM
HEPES and the black one using 1x10⁷ CLL cells in the standard RPMI medium. The
intense multiple peaks around 2.9, 3.2 and 3.75 ppm correspond to protons of HEPES.
5 4 3 2 1 0
1H [ppm]
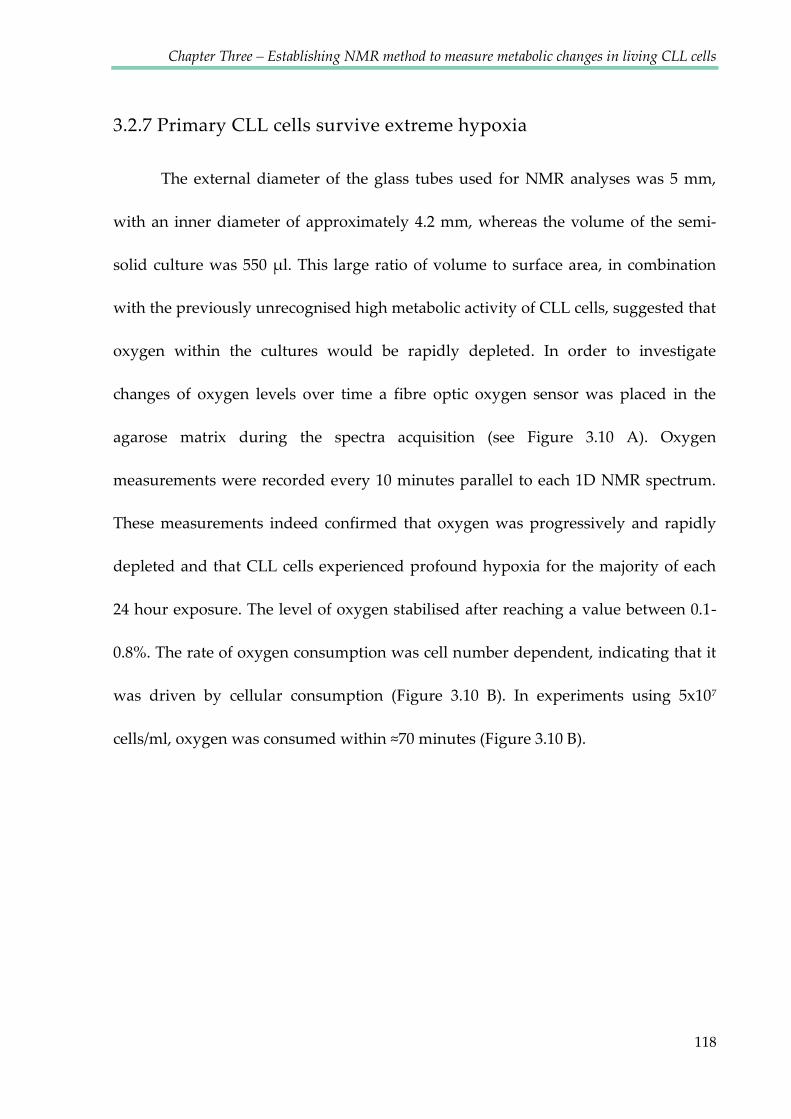
Chapter Three – Establishing NMR method to measure metabolic changes in living CLL cells
118
3.2.7 Primary CLL cells survive extreme hypoxia
The external diameter of the glass tubes used for NMR analyses was 5 mm,
with an inner diameter of approximately 4.2 mm, whereas the volume of the semi-
solid culture was 550 μl. This large ratio of volume to surface area, in combination
with the previously unrecognised high metabolic activity of CLL cells, suggested that
oxygen within the cultures would be rapidly depleted. In order to investigate
changes of oxygen levels over time a fibre optic oxygen sensor was placed in the
agarose matrix during the spectra acquisition (see Figure 3.10 A). Oxygen
measurements were recorded every 10 minutes parallel to each 1D NMR spectrum.
These measurements indeed confirmed that oxygen was progressively and rapidly
depleted and that CLL cells experienced profound hypoxia for the majority of each
24 hour exposure. The level of oxygen stabilised after reaching a value between 0.1-
0.8%. The rate of oxygen consumption was cell number dependent, indicating that it
was driven by cellular consumption (Figure 3.10 B). In experiments using 5x10⁷
cells/ml, oxygen was consumed within ≈70 minutes (Figure 3.10 B).
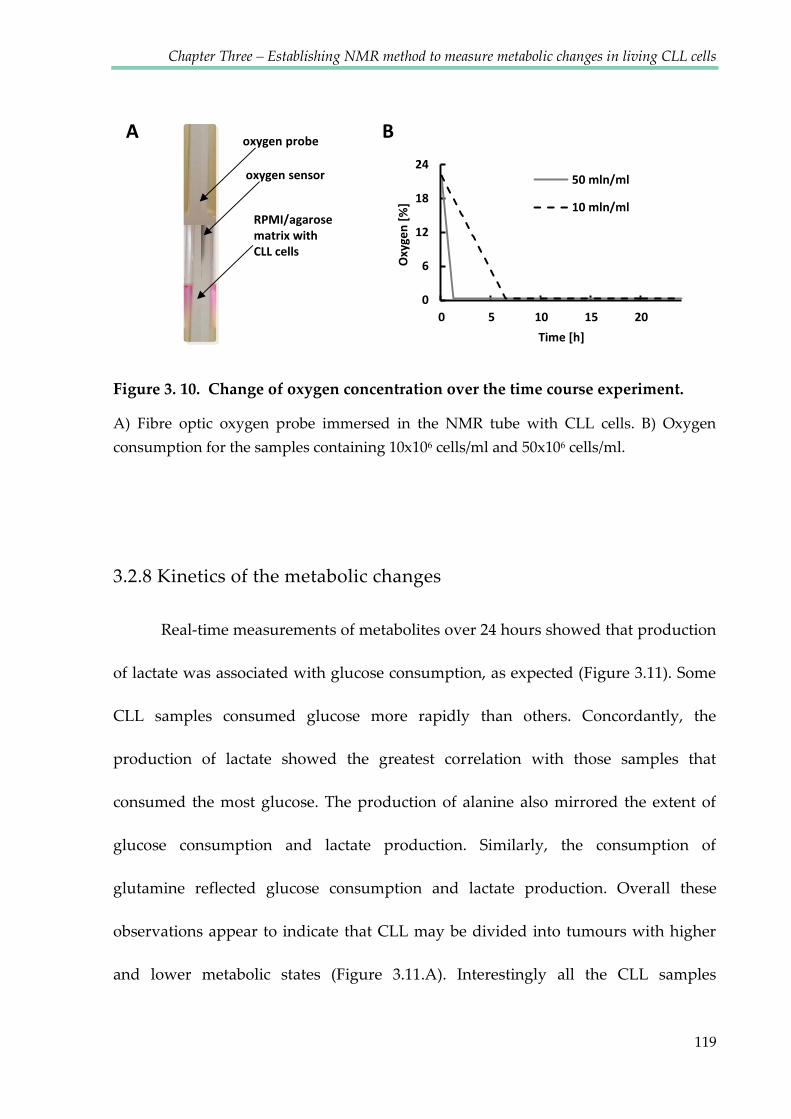
Chapter Three – Establishing NMR method to measure metabolic changes in living CLL cells
119
Figure 3. 10. Change of oxygen concentration over the time course experiment.
A) Fibre optic oxygen probe immersed in the NMR tube with CLL cells. B) Oxygen
consumption for the samples containing 10x106 cells/ml and 50x106 cells/ml.
3.2.8 Kinetics of the metabolic changes
Real-time measurements of metabolites over 24 hours showed that production
of lactate was associated with glucose consumption, as expected (Figure 3.11). Some
CLL samples consumed glucose more rapidly than others. Concordantly, the
production of lactate showed the greatest correlation with those samples that
consumed the most glucose. The production of alanine also mirrored the extent of
glucose consumption and lactate production. Similarly, the consumption of
glutamine reflected glucose consumption and lactate production. Overall these
observations appear to indicate that CLL may be divided into tumours with higher
and lower metabolic states (Figure 3.11.A). Interestingly all the CLL samples
B A oxygen probe
oxygen sensor
RPMI/agarose matrix with CLL cells
0
6
12
18
24
0 5 10 15 20
Oxy
gen
[%
]
Time [h]
50 mln/ml
10 mln/ml

Chapter Three – Establishing NMR method to measure metabolic changes in living CLL cells
120
exhibiting lower metabolic activity came from patients diagnosed with the A0 stage
of the disease whereas the rest of the patients were at more advanced stage at the
time of sampling (See Table 3.1). However, there were too few patients to draw any
statistically relevant conclusion about correlations between CLL cellular behaviour
and clinical or prognostic markers.
Glutamate variably accumulated across all the samples with one sample
displaying particularly marked accumulation. 3-Hydroxybutarate peaks were very
close to the ethanol peaks (see Figure 3.6). In order to obtain the intensity values
corresponding to 3-hydroxybutyrate only, the ethanol peak intensity values were
subtracted from the overlapping peaks. Hypoxanthine, another increasing
metabolite, was observed to be secreted only after a few hours of hypoxic conditions.
Although the peak intensity was not very high, the increase was consistent for all the
samples containing 5x10⁷ cells/ml and for some samples containing 1x10⁷ cells/ml.
Other metabolites including lysine, arginine and valine were remarkably stable
during the acquisition of spectra (Figure 3.11.B). Table 3.1 shows the patient
characteristics for all of the primary CLL cell donors, compared in Figure 3.11.
As some metabolites are represented by multiple peaks seen in different parts
of spectrum, it was crucial to show that individual peaks of the same metabolite
exhibit identical kinetics. Figure 3.12 presents an example of lactate and glucose
representative peaks, together with fitted kinetics.

Chapter Three – Establishing NMR method to measure metabolic changes in living CLL cells

Chapter Three – Establishing NMR method to measure metabolic changes in living CLL cells
Chapter Three – Establishing NMR method to measure metabolic changes in living CLL cells
123
Table 3. 1. Clinical characteristics of CLL patients.
CLL samples used to obtain data presented in Figure 3.11. Patients were attending the
outpatient clinic at Birmingham Heartlands Hospital or Queen Elizabeth Hospital in
Birmingham, UK.
Patient Sex Age
(Y) Stage Additional
clinical features
Leukocyte
count CD19+ at the
time of
sampling
[%]
Length of
time with
disease Treatment
when
sampled Previous treatment
1 M 85 C CD38 neg,
Zap70 pos,
Normal
cytogenetics. 150 91 14y 3m Observation
First treated with
chlorambucil in 1998
then in 2012. 2 M 71 A0 CD38 neg 150 90 2y 11m Observation none 3 M 58 A0 CD38 neg 58 74 1y 9m Observation None
4 F 92 C ATM, p53
WT. CD38
unknown 191 88 18y 2m Chlorambucil 24/9/02 then 04/07/08
and 2012
5 F 76 B ATM and p53
WT - 170 85 6y 1m Observation None. Progressive
on that date though
with sweats, LN and
high WCC. No
cytopenia 6 M 58 A CD38 neg 58 80 1y 9m Observation None
7 F 77 A nil 76 89 8y 9m Observation None. Had eyelid
swelling but RT
given locally after
this date. 8 M 82 A0 nil 132 75 7y 9m Observation none 9 M 65 A CD38 neg 147 59 2y 3m Observation none 10 F 92 A0 CD38 neg 60 76 18y 2m Chlorambucil none
11 M 83 A0 Additional 1q
on karyotype.
ATM, p53
WT 177 92.5 6y 11m Observation
Previous FC in 2009
x 2 courses, BaP
started week after
this sample LN; lymph node, RT; Rituximab, FC; Fludarabine and Cyclophosphamide, WCC; white cell count, BaP; The
redeployed drug combination of bezafibrate and medroxyprogesterone acetate (Murray, Khanim et al. 2010)
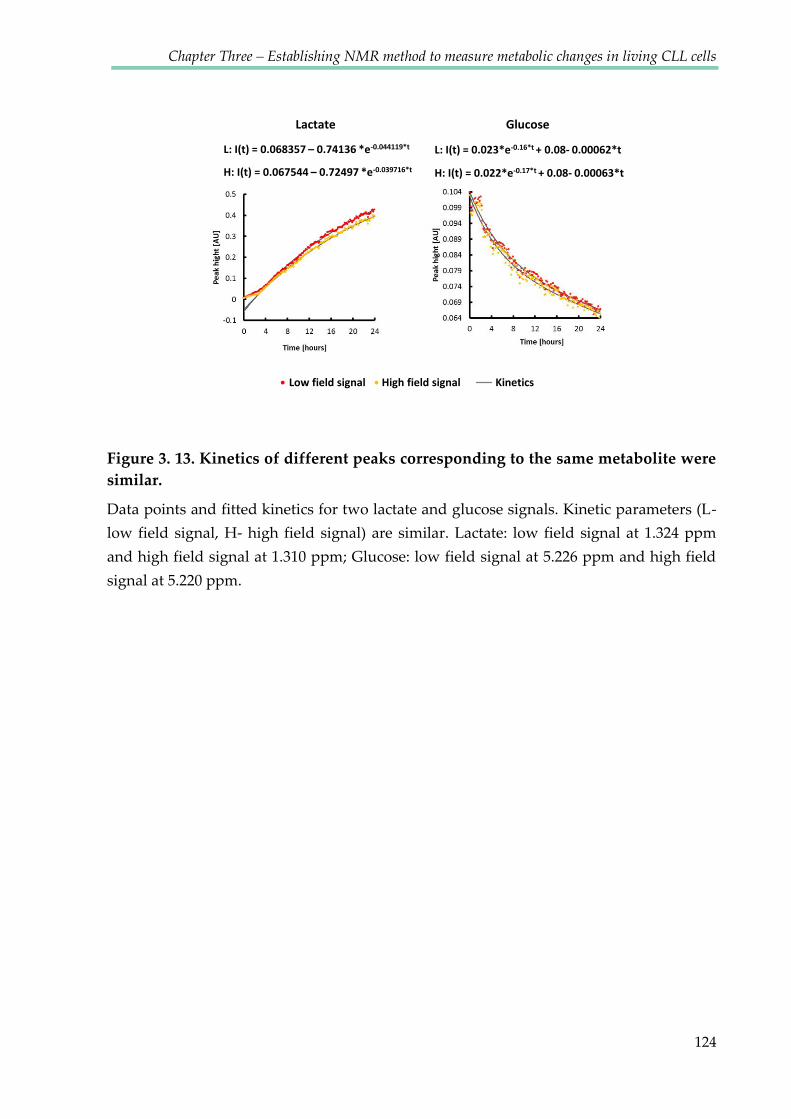
Chapter Three – Establishing NMR method to measure metabolic changes in living CLL cells
124
Figure 3. 13. Kinetics of different peaks corresponding to the same metabolite were
similar.
Data points and fitted kinetics for two lactate and glucose signals. Kinetic parameters (L-
low field signal, H- high field signal) are similar. Lactate: low field signal at 1.324 ppm
and high field signal at 1.310 ppm; Glucose: low field signal at 5.226 ppm and high field
signal at 5.220 ppm.
Lactate Glucose
L: I(t) = 0.068357 – 0.74136 *e-0.044119*t
H: I(t) = 0.067544 – 0.72497 *e-0.039716*t
L: I(t) = 0.023*e-0.16*t + 0.08- 0.00062*t
H: I(t) = 0.022*e-0.17*t + 0.08- 0.00063*t
Low field signal High field signal Kinetics
Chapter Three – Establishing NMR method to measure metabolic changes in living CLL cells
125
3.3 DISCUSSION
In order to measure changes in metabolism in living cells by NMR
spectroscopy required to overcome two challenges. First, the NMR experiment
needed to be designed in a way that does not affect the metabolism of cells. This is
challenging for an experimental procedure, which is carried out away from the
standard, sterile tissue culture conditions. Presented data confirm that CLL cells
remained viable throughout a 24 h time course, and showed comparable viability to
control cells incubated in the tissue culture incubator. Maintenance of cell viability
allows to use cells for further analyses (here they were used for gene and protein
expression assays). Secondly, to obtain good quality and informative NMR spectra
two key requirements had to be fulfilled: a sufficiently high concentration of
metabolites and good sample homogeneity. A lack of homogeneity causes broad
lines in NMR spectra and therefore low spectral resolution. Broad lines would also be
expected if the mobility was significantly reduced by embedding the sample in a gel
matrix that significantly affects rotational diffusion of small molecules. Optimal
spectra were obtained for 1-5x10⁷ CLL cells/ml. While the concentration of cells does
not directly affect metabolite concentrations, it does affect the rate of changes.
Moreover, using the 0.1% low melting agarose matrix, with carefully suspended CLL
cells yields good sample homogeneity over 24 h without causing any significant line
Chapter Three – Establishing NMR method to measure metabolic changes in living CLL cells
126
broadening. The low concentration of agarose gel does not disturb the free
movements of metabolites in the suspension.
Comparison of spectra obtained from samples containing cells and medium
without cells indicated that the observed metabolic changes were solely caused by
the metabolic activity of CLL cells. A high similarity between the last spectrum of a
time course and the spectrum of medium after removing cells indicates that the
observed signals represent metabolites present in the medium and not inside cells.
This may be a consequence of the small proportion of cell biomass in comparison to
the total sample volume. It is also possible that metabolite signals inside cells are too
broad to be observed. The sensitivity obtained from this method was sufficient to
investigate metabolic kinetics of 30 of the most abundant metabolites.
The assignment of 30 metabolites was confirmed using 2D 1H-1H J-resolved
(Ludwig and Viant 2010) and 13C-1H HSQC spectra. These spectra were recorded on
medium obtained from the sample with CLL cells after the time course experiment.
Because both J-res and HSQC libraries were acquired at 25°C and at pH=7.0, it is
difficult to assign the spectra recorded with living cells as the pH changes during the
experiment causing significant chemical shift changes.
The observed metabolic changes indicate that CLL cells consume both glucose
and glutamine and produce large amounts of lactate as well as alanine and
Chapter Three – Establishing NMR method to measure metabolic changes in living CLL cells
127
glutamate. The metabolism of these compounds will be investigated and discussed in
the next chapters.
Another metabolite secreted by CLL cells, 3-hydroxybutyrate represents a
ketone body (together with acetone and aceto-acetate), an end product of fatty acid
beta-oxidation. It allows the production of acetyl-CoA and provides a route whereby
fatty acids can be utilised to provide energy via the TCA cycle. Ketone bodies can
also be produced from excess acetyl-CoA which cannot be used by the citric acid
cycle. This state is referred to as the fasted state in humans. Ketone bodies can also be
produced from certain amino acids (leucine, isoleucine, lysine, phenylalanine,
tyrosine and tryptophan). Ketone bodies have previously been reported to be
implicated in carcinogenesis and can be seen as indicators of mitochondrial
dysfunction (Kennaway, Buist et al. 1984; Robinson, McKay et al. 1985). Increased
levels of 3-HB have been detected in the serum of patients with colorectal
malignancy (Ludwig, Ward et al. 2009; Ma, Liu et al. 2009) as well as in patients with
late stage head and neck cancer compared to early stage diseases (Tiziani, Lopes et al.
2009). On the other hand, lower levels of 3-hydroxybutyrate have been found in the
serum of patients with pancreatic cancer compared to healthy controls (OuYang, Xu
et al. 2011). It has recently been shown that administration of 3-HB in a xenograft
model of breast cancer increased tumour growth 2.5-fold, and has been suggested
that this finding may explain the increased incidence of cancer in diabetic patients,

Chapter Three – Establishing NMR method to measure metabolic changes in living CLL cells
128
due to increased ketone production (Bonuccelli, Tsirigos et al. 2010). Moreover 3-HB
has been shown to act as a chemo-attractant, stimulating the migration of epithelial
cancer cells (Bonuccelli, Tsirigos et al. 2010). It has been suggested that 3-HB detected
in patient serum/plasma, or homogenates of fresh tumour tissue, might be useful as a
marker to identify high-risk cancer patients at diagnosis, for treatment stratification
and/or for evaluating therapeutic efficacy during anticancer therapy (Pavlides,
Tsirigos et al. 2010). Elevated levels of ketone bodies in plasma can also be a result of
accelerated catabolism of fatty acids (Laffel 1999), therefore 3-HB may be seen in
samples of CLL cells, both as a product of starvation and as a fuel for the growth of
the cancer.
Another increasing metabolite detected during time course experiments was
the purine derivative hypoxanthine. Purine nucleotides are essential components of
any cell, not only as the raw material for the synthesis of DNA but also being vital
cofactors for many enzymatic reactions responsible for cell proliferation. Purine
biosynthesis proceeds along two known routes. These include de novo synthesis and
recycling of endogenous or exogenous purines through a salvage pathway.
The de novo pathway for purine nucleotide synthesis leads to the formation of
inosine 5’-monophosphate (IMP) in ten metabolic steps and requires hydrolysis of
ATP to drive several reactions along this pathway.
Chapter Three – Establishing NMR method to measure metabolic changes in living CLL cells
129
The salvage pathway involves the housekeeping protein hypoxanthine-
guanine phosphoribosyl transferase (Hx-PRTase) which catalyses the addition of
phosphoribosyl pyrophosphate to guanine or hypoxanthine to form guanosine
monophosphate and inosine monophate respectively. In the absence of this pathway,
hypoxanthine would proceed to form the waste product uric acid, through the
formation of xanthine (Harrison 2002).
The salvage pathways are used to recover bases and nucleosides that are
formed during degradation of RNA and DNA, offsetting the potential waste into a
vital resource. Purine salvage enables ingested purines or those synthesised in one
tissue to be available to other tissues (Murray 1971). Given its importance, it is not
surprising that the purine salvage pathway has been implicated in human cancer
development (Sanfilippo, Camici et al. 1994). In order to cope with rapid cell
replication, tumour cells use the more efficient purine salvage pathway for energy
production and nucleic acid synthesis (Ong, Zou et al. 2010).
An increased level of hypoxanthine in plasma and a reduced level in urine has
been previously demonstrated in patients with gastric and colonic carcinomas
(Vannoni, Porcelli et al. 1989). In plasma from children with acute lymphoblastic
leukaemia or non- Hodgkin lymphoma, hypoxanthine levels have been reported to
be higher than in healthy controls and these levels decreased after methotrexate
administration (Hashimoto, Kubota et al. 1992). An increased level of hypoxanthine

Chapter Three – Establishing NMR method to measure metabolic changes in living CLL cells
130
in the urine has been noticed in mesothelioma transplanted nude mice. Moreover,
the level of this metabolite was reduced in response to chemotherapy (Buhl,
Dragsholt et al. 1985). On the other hand, a reduced level of urinary hypoxanthine
was reported by Yoo et al. in patients with non-Hodgkin lymphoma. They reasoned
that the level of hypoxanthine might be decreased due to consumption by tumour
cells (Yoo, Kong et al. 2010). To my knowledge the hypoxanthine levels have never
been reported in Chronic Lymphocytic Leukaemia, however an indication of an
imbalance in purine metabolism in CLL has been published (Carlucci, Rosi et al.
1997). There it was shown that enzymes of the salvage pathway, including
hypoxanthine-guanine phosphoribosyltransferase-HGPRT were greatly reduced in
lymphocytes from leukaemia patients.
Beside the observation that primary CLL cells used in presented study
produced hypoxanthine, especially in hypoxia, this phenomenon was not further
investigated. Nevertheless, as there is not a lot of recent literature about
hypoxanthine in leukaemic cells, it would be interesting to further investigate this
abnormality, and to compare it with hypoxanthine levels in healthy B-cells.
All of the metabolites detected in samples containing primary CLL cells are
presented in Figure 3.13 in the form of a metabolic map.

Chapter Three – Establishing NMR method to measure metabolic changes in living CLL cells
131
Figure 3. 14. Metabolic map presenting all of the metabolites assigned in the 1H
NOESY spectra recorded on samples with primary CLL cells.
Metabolites presented on this map are part of the formulation of RPMI medium except
for: lactate, pyruvate, β-hydroxybutyrate, hypoxanthine, pyroglutamate, formate,
succinate, uridine, 2-oxobutanoate, choline and phosphocholine.
Chapter Three – Establishing NMR method to measure metabolic changes in living CLL cells
132
After the time course, it was observed that the medium changed colour to
yellow which indicates the acidification of pH. Histidine-based pH analysis, showed
that extracellular pH changed from ~7.8 to 6.5, with slight variations between
different CLL samples. As the pH changes strongly correlated with lactate
production, it indicates that lactate was the main contributor to the acidification of
pH. Time courses performed using RPMI with extra HEPES buffer, showed that
controlling the extracellular pH did not affect the metabolic changes of glucose
consumption and lactate production. It has been reported that the acidification of
intracellular pH may drive the metabolic switch from aerobic glycolysis to oxidative
phosphorylation, however evidence indicates that tumour cells prevent cytosolic
acidification by activating a number of transporters that export excess protons
produced during glycolysis (Huber, De Milito et al. 2010). This active proton
transport across the cellular membrane suggests that the intracellular pH is
controlled and not affected by the extracellular pH changes. It has been shown that
tumour cells have alkaline intracellular pH values (7.12–7.65 compared with 6.99–
7.20 in normal tissues) and acidic interstitial extracellular pH values (6.2–6.9
compared with 7.3–7.4) (Gillies, Raghunand et al. 2002; Cardone, Casavola et al.
2005). This indicates that the pH values in the NMR tube represent the natural
tumour microenvironment conditions. The crucial role of intracellular pH for cancer
cells is supported by the fact that the inhibition of H+ transporters has been proposed

Chapter Three – Establishing NMR method to measure metabolic changes in living CLL cells
133
as an attractive anticancer strategy that could potentially be used in a wide range of
cancer types (Harguindey, Arranz et al. 2009) .
Another important component of the microenvironment of cells is oxygen.
Using the NMR based method for monitoring metabolism, determination of the
oxygen level and regulation of its consumption rate was possible, however it was not
feasible to keep the percentage stable during data acquisition. The aim of our study
was to investigate metabolic changes during the transition of CLL cells from
normoxic to hypoxic conditions, therefore stabilisation of the oxygen on the set level
was not required. Use of the fibre optic oxygen sensor, which fitted inside the narrow
NMR tube allowed us to monitor oxygen consumption very precisely. In order to
slow down the rate of oxygen depletion and prolong the normoxic period, lower
concentrations of CLL cells (1x10⁷/ml) were used. This allowed very accurate
identification of the time of the transition to hypoxia and to correlate it with the
corresponding NMR spectra. The following chapters will present data obtained using
our method together with other biochemical methods, used to better understand the
adaptation of CLL cells to different oxygen environments.
Importantly, real-time NMR time-courses of glucose, lactate, alanine,
glutamate and glutamine (Figure 3.11.A) revealed potential metabolic subtypes
amongst the CLLs. In A0 CLL samples, the least aggressive subtype of CLL
associated with lymphocytosis but no lymphadenopathy, glucose consumption was

Chapter Three – Establishing NMR method to measure metabolic changes in living CLL cells
134
low, glutamine consumption was equally low, and lactate/alanine as well as
glutamate production showed also decreased metabolic activity. For one patient
sample we observed exceedingly high glutamate production. Although not the aim
of the study, these data suggest that metabolic subtypes exist which may correlate
with clinical phenotype and may provide information regarding biomarkers.
However patient numbers are still too small in this study to demonstrate this
unequivocally.
Another metabolomics study conducted with CLL patient-derived samples
was presented by MacIntyre et al. They compared metabolic profiles of serum from
untreated CLL patients (Binet stage A) and healthy controls (MacIntyre, Jimenez et
al. 2010). The main differences showed elevated levels of pyruvate and glutamate in
the CLL samples. MacIntyre et al. did not investigate more advanced stages of CLL
therefore it would be difficult to compare their results to data presented in this thesis,
however the common increase of glutamate production by CLL cells can be observed
for both studies. Additionally MacIntyre et al. have compared serum of patients with
or without Immunoglobulin variable region heavy chain (IgVH) mutation. They
observed decreased levels of cholesterol derived from VLDL, lactate, uridine as well
as increased glycerol, 3-hydroxybutyrate and methionine in serum from patients
with IgVH mutation, associated with poor prognosis.
In our study comparisons of the metabolic profiles of 11 primary CLL samples
allowed us to distinguish two groups of cells with higher or lower metabolic activity.

Chapter Three – Establishing NMR method to measure metabolic changes in living CLL cells
135
Interestingly, all of the patients exhibiting the slower rates were characterised in the
A0 stage of the disease (see Table 3.1). The stage A0 is often described as the ‚watch
and wait‛ stage, in which patients do not receive any treatment, however remain
under observation. More advanced stages, starting from A1 indicate progression of
the disease. Therefore although the number of compared CLL samples was only
small, the correlation between the stage of the disease and the metabolic activity was
observed, suggesting the potential of this method in diagnostics or investigations of
clinical and prognostic markers. A clinical test could involve short term kinetic
analysis, possibly taking a series of time points for 2 metabolites in the growth
medium, to characterise the ‘stage’ in which the cancer cells exist.
Chapter IV
Metabolic plasticity of CLL
cells

Chapter Four – Metabolic plasticity of CLL cells
137
4.1. INTRODUCTION
Metastatic cancer leads to the majority of cancer deaths, creates profound
economic burden and remains poorly understood (Bocker 2002; Weigelt, Peterse et
al. 2005; Mehlen and Puisieux 2006). It remains to be determined how metastatic
cancer cells, having become adapted to the hypoxic tumour environment, survive
transit in the peripheral normoxic circulation and then re-populate and survive in, de
novo hypoxic sites. A major challenge in the study of these processes in most cancers
is the rarity and transient nature of metastatic cells. In order to successfully analyse
their metabolism, it would be necessary to experimentally isolate the migratory cells.
Chronic lymphocytic leukaemia (CLL) is the most common form of leukaemia
in Western countries (D'Arena, Di Renzo et al. 2003; Chiorazzi, Rai et al. 2005; Parker
and Strout 2011) and despite recent improvements in prolonging survival, remains
incurable (Chiorazzi, Rai et al. 2005; Hayden, Pratt et al. 2012). CLL patients present
elevated lymphocyte counts in the peripheral blood. In most cases these lymphocyte
numbers increase progressively over months and years. However, these cancer cells
are out of the cell cycle and superficially highly quiescent (Dameshek 1967). Despite
this, isotopic labelling studies have determined that peripheral blood CLL cells
include those that have undergone a number of divisions and also that rates of cell
death within the tumour are high (Messmer, Messmer et al. 2005). The picture that
emerges is that circulating CLL cells represent a large pool of non-dividing cancer
Chapter Four – Metabolic plasticity of CLL cells
138
cells that are able to enter and exit tissue sites, predominantly lymph nodes, spleen
and bone marrow, wherein they proliferate and drive the progressive expansion of
the tumour (Messmer, Messmer et al. 2005; Calissano, Damle et al. 2011). The
microenvironments of the lymph nodes, spleen and bone marrow differ from that of
the blood, and entry into tissue sites provides important survival signals that protect
against chemotherapeutics and thus lead to relapsed disease (Burger 2011).
Moreover, tissues where CLL cells have their proliferation centres are often hypoxic
(Star-Lack, Adalsteinsson et al. 2000; Sison and Brown 2011) with a pH much less
controlled than in the blood. Accordingly, CLL cells must be able to quickly alter
their metabolism to adapt to these different conditions. Therefore, understanding
how peripheral blood CLL cells can survive transitions between normoxia and
hypoxia is likely to identify novel strategies to tackle this disease.
Figure 1.4 presents a model of the lifecycle of CLL B cells including their
migration between tissues and the factors regulating it. CLL is an unusual cancer
where a large proportion of cells within the tumour exhibit metastatic capacity,
therefore the study of its metabolic adaptations permits the potential discovery of
mechanisms applicable to cancers in general. Currently however, very few studies
have been conducted to investigate the potential of cell metabolism as a therapeutic
target in CLL (Tura, Cavo et al. 1984; Samudio, Fiegl et al. 2008; MacIntyre, Jimenez
et al. 2010). CLL cells were shown to survive considerably longer in circulation than
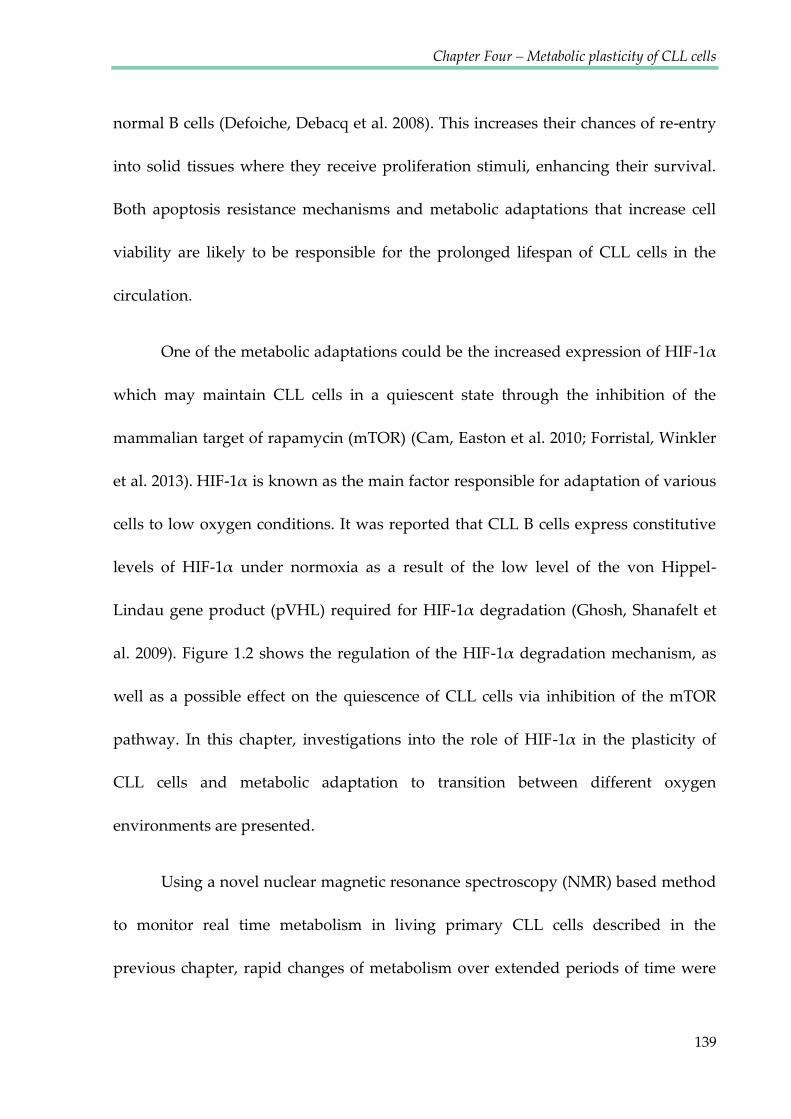
Chapter Four – Metabolic plasticity of CLL cells
139
normal B cells (Defoiche, Debacq et al. 2008). This increases their chances of re-entry
into solid tissues where they receive proliferation stimuli, enhancing their survival.
Both apoptosis resistance mechanisms and metabolic adaptations that increase cell
viability are likely to be responsible for the prolonged lifespan of CLL cells in the
circulation.
One of the metabolic adaptations could be the increased expression of HIF-1α
which may maintain CLL cells in a quiescent state through the inhibition of the
mammalian target of rapamycin (mTOR) (Cam, Easton et al. 2010; Forristal, Winkler
et al. 2013). HIF-1α is known as the main factor responsible for adaptation of various
cells to low oxygen conditions. It was reported that CLL B cells express constitutive
levels of HIF-1α under normoxia as a result of the low level of the von Hippel-
Lindau gene product (pVHL) required for HIF-1α degradation (Ghosh, Shanafelt et
al. 2009). Figure 1.2 shows the regulation of the HIF-1α degradation mechanism, as
well as a possible effect on the quiescence of CLL cells via inhibition of the mTOR
pathway. In this chapter, investigations into the role of HIF-1α in the plasticity of
CLL cells and metabolic adaptation to transition between different oxygen
environments are presented.
Using a novel nuclear magnetic resonance spectroscopy (NMR) based method
to monitor real time metabolism in living primary CLL cells described in the
previous chapter, rapid changes of metabolism over extended periods of time were
Chapter Four – Metabolic plasticity of CLL cells
140
detected. Using this system, changes in CLL cell metabolism in response to
oxygenation levels were studied. This chapter presents observations of a remarkable
plasticity of metabolic adaptations displayed by ‘quiescent’ CLL cells.
Chapter Four – Metabolic plasticity of CLL cells
141
4.2 RESULTS
4.2.1 Primary CLL cells adapt their metabolism to hypoxic conditions
Western blot analyses were performed in order to investigate changes in levels
of key proteins during the transition from normoxia to hypoxia. Consistent with the
oxygen consumption and depletion during the NMR time course experiment
(described in Chapter Three), western blot analysis of CLL cells incubated in the
agarose matrix in the NMR tube for different time periods, showed that levels of
stabilised HIF-1α rose after one hour (Figure 4.1) and increased further over the
following 4 hours. The time at which hypoxia was detected varied slightly between
samples but it consistently correlated with the HIF-1α increase.
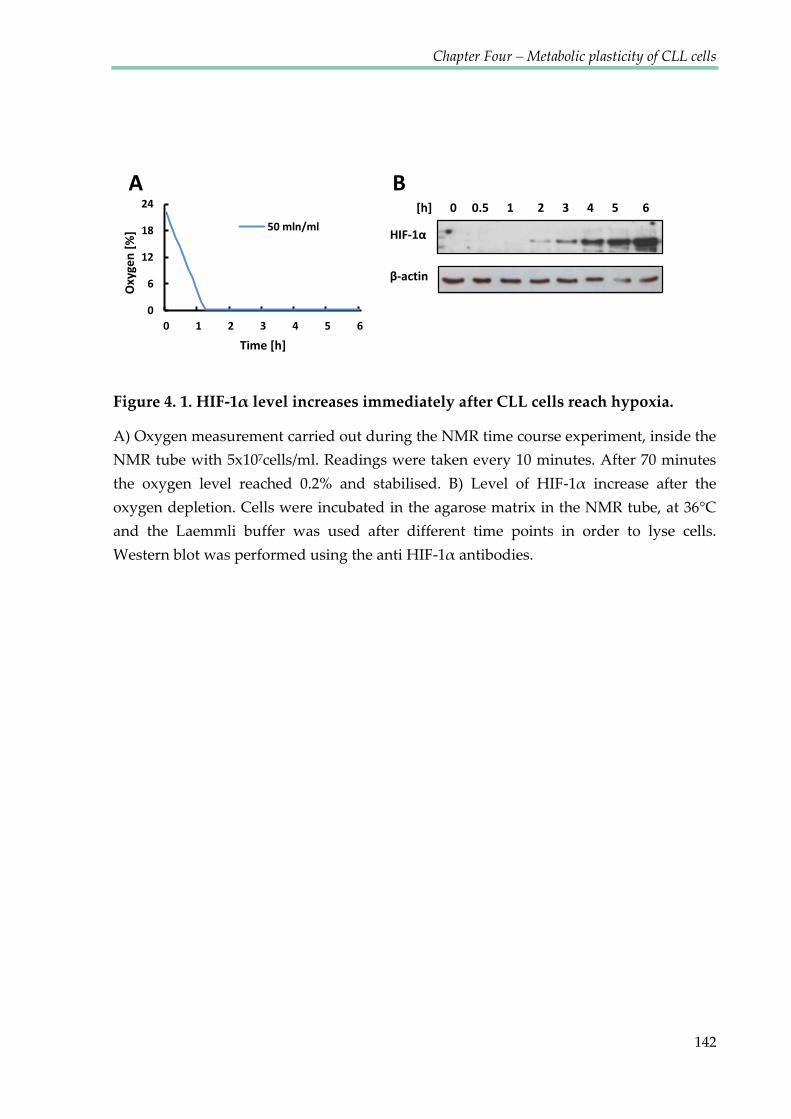
Chapter Four – Metabolic plasticity of CLL cells
142
Figure 4. 1. HIF-1α level increases immediately after CLL cells reach hypoxia.
A) Oxygen measurement carried out during the NMR time course experiment, inside the
NMR tube with 5x10⁷cells/ml. Readings were taken every 10 minutes. After 70 minutes
the oxygen level reached 0.2% and stabilised. B) Level of HIF-1α increase after the
oxygen depletion. Cells were incubated in the agarose matrix in the NMR tube, at 36°C
and the Laemmli buffer was used after different time points in order to lyse cells.
Western blot was performed using the anti HIF-1α antibodies.
B A [h] 0 0.5 1 2 3 4 5 6
HIF-1α
β-actin 0
6
12
18
24
0 1 2 3 4 5 6
Oxy
gen
[%
]
Time [h]
50 mln/ml
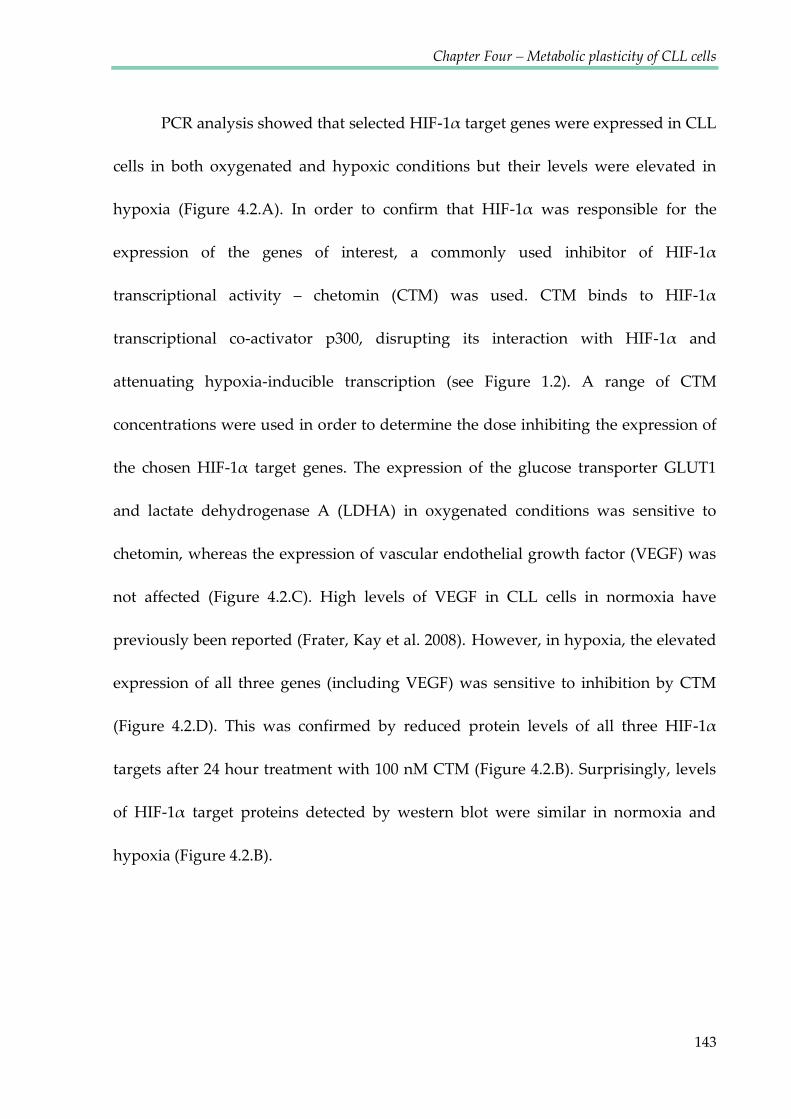
Chapter Four – Metabolic plasticity of CLL cells
143
PCR analysis showed that selected HIF-1α target genes were expressed in CLL
cells in both oxygenated and hypoxic conditions but their levels were elevated in
hypoxia (Figure 4.2.A). In order to confirm that HIF-1α was responsible for the
expression of the genes of interest, a commonly used inhibitor of HIF-1α
transcriptional activity – chetomin (CTM) was used. CTM binds to HIF-1α
transcriptional co-activator p300, disrupting its interaction with HIF-1α and
attenuating hypoxia-inducible transcription (see Figure 1.2). A range of CTM
concentrations were used in order to determine the dose inhibiting the expression of
the chosen HIF-1α target genes. The expression of the glucose transporter GLUT1
and lactate dehydrogenase A (LDHA) in oxygenated conditions was sensitive to
chetomin, whereas the expression of vascular endothelial growth factor (VEGF) was
not affected (Figure 4.2.C). High levels of VEGF in CLL cells in normoxia have
previously been reported (Frater, Kay et al. 2008). However, in hypoxia, the elevated
expression of all three genes (including VEGF) was sensitive to inhibition by CTM
(Figure 4.2.D). This was confirmed by reduced protein levels of all three HIF-1α
targets after 24 hour treatment with 100 nM CTM (Figure 4.2.B). Surprisingly, levels
of HIF-1α target proteins detected by western blot were similar in normoxia and
hypoxia (Figure 4.2.B).

Chapter Four – Metabolic plasticity of CLL cells
144
Figure 4. 2. Level of HIF-1α increases in hypoxia together with the expression of its
target genes, which can be blocked by chetomin.
A) Real-time PCR analysis of VEGF, GLUT1 and LDHA expression in CLL cells
incubated in normoxia or hypoxia (in the NMR tube) for 24 hours. Values are normalised
to the normoxia control =1. Data are mean ± SEM n=4; *p < 0.05 by student’s t-test for
paired data. B) Western blot analysis of levels of VEGF, GLUT1 and LDHA in cells
treated with CTM in normoxia or hypoxia. Cells were pre-treated with CTM 3 hours
before placing in hypoxia, images are representative of 3 experiments. C&D) Real-time
PCR analysis of VEGF, GLUT1 and LDHA expression in CLL cells incubated for 24
hours in normoxia (C) or hypoxia (D) with or without chetomin (CTM). Cells were pre-
treated with CTM 3 hours before placing in hypoxia. Values are normalised to the
normoxia control without CTM =1. Data are mean ± SEM n=3. Note that the scales of the
Y axis in C&D are dissimilar reflecting the induced expression of genes in hypoxia.
*
*
Normoxia Hypoxia
0
1
2
0 10 20 100
Rel
ativ
e ex
pre
ssio
n
CTM [nm]
VEGF GLUT1 LDHA
0
5
10
15
20
0 10 20 100
Rel
ativ
e ex
pre
ssio
n
CTM [nm]
0
5
10
15
20
VEGF GLUT1 LDHA
Rel
ativ
e ex
pre
ssio
n
Normoxia
Hypoxia *
Normoxia
0 0 20 50 100
Hypoxia
CTM [nM] VEGF
GLUT1
LDHA
β-actin
A B
C D
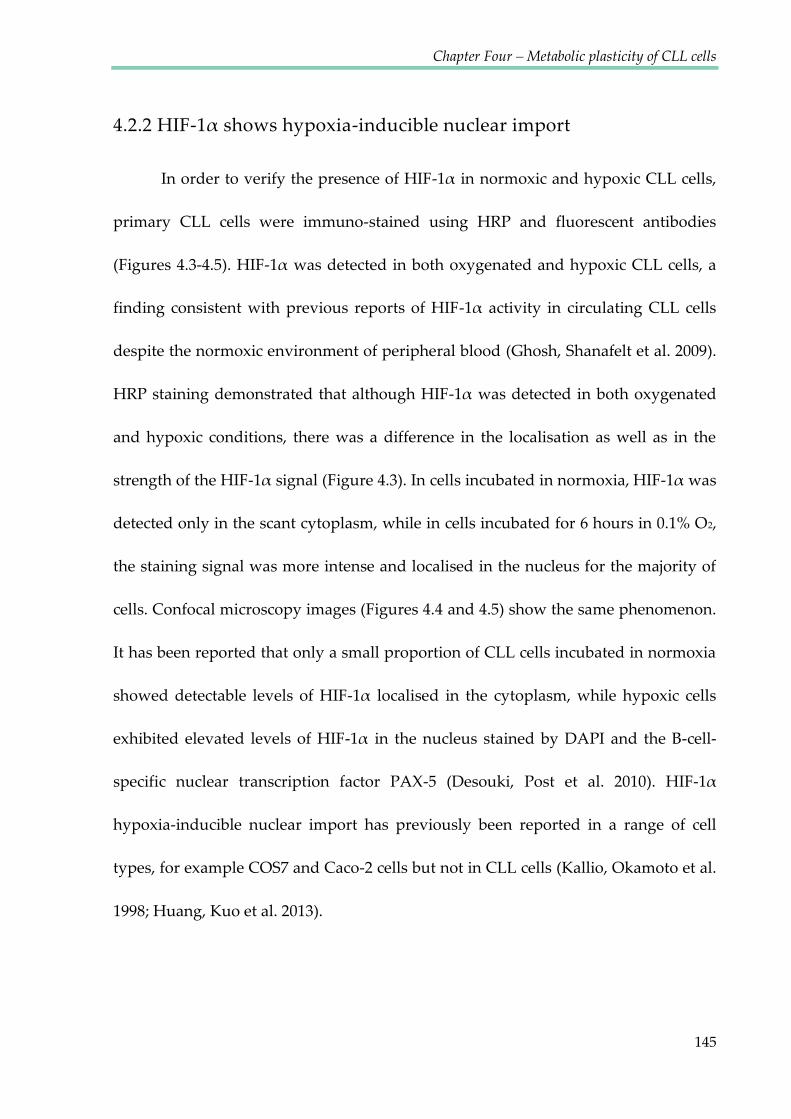
Chapter Four – Metabolic plasticity of CLL cells
145
4.2.2 HIF-1α shows hypoxia-inducible nuclear import
In order to verify the presence of HIF-1α in normoxic and hypoxic CLL cells,
primary CLL cells were immuno-stained using HRP and fluorescent antibodies
(Figures 4.3-4.5). HIF-1α was detected in both oxygenated and hypoxic CLL cells, a
finding consistent with previous reports of HIF-1α activity in circulating CLL cells
despite the normoxic environment of peripheral blood (Ghosh, Shanafelt et al. 2009).
HRP staining demonstrated that although HIF-1α was detected in both oxygenated
and hypoxic conditions, there was a difference in the localisation as well as in the
strength of the HIF-1α signal (Figure 4.3). In cells incubated in normoxia, HIF-1α was
detected only in the scant cytoplasm, while in cells incubated for 6 hours in 0.1% O2,
the staining signal was more intense and localised in the nucleus for the majority of
cells. Confocal microscopy images (Figures 4.4 and 4.5) show the same phenomenon.
It has been reported that only a small proportion of CLL cells incubated in normoxia
showed detectable levels of HIF-1α localised in the cytoplasm, while hypoxic cells
exhibited elevated levels of HIF-1α in the nucleus stained by DAPI and the B-cell-
specific nuclear transcription factor PAX-5 (Desouki, Post et al. 2010). HIF-1α
hypoxia-inducible nuclear import has previously been reported in a range of cell
types, for example COS7 and Caco-2 cells but not in CLL cells (Kallio, Okamoto et al.
1998; Huang, Kuo et al. 2013).

Chapter Four – Metabolic plasticity of CLL cells
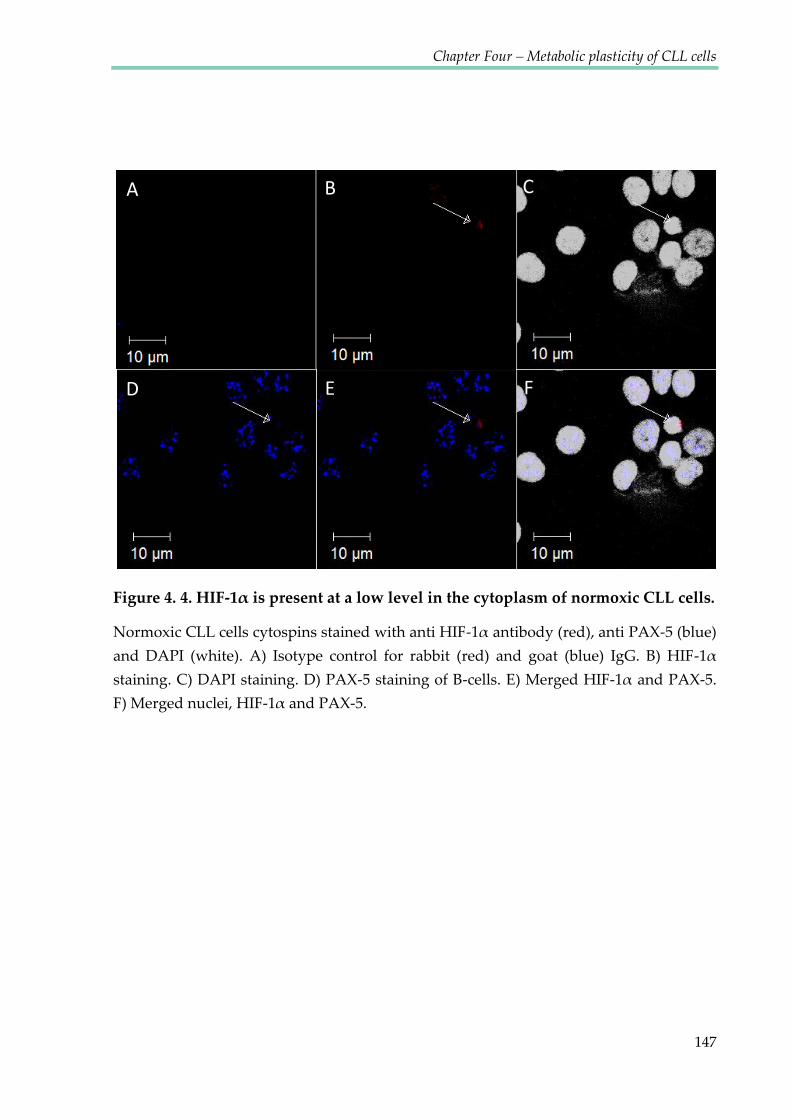
Chapter Four – Metabolic plasticity of CLL cells
147
Figure 4. 4. HIF-1α is present at a low level in the cytoplasm of normoxic CLL cells.
Normoxic CLL cells cytospins stained with anti HIF-1α antibody (red), anti PAX-5 (blue)
and DAPI (white). A) Isotype control for rabbit (red) and goat (blue) IgG. B) HIF-1α
staining. C) DAPI staining. D) PAX-5 staining of B-cells. E) Merged HIF-1α and PAX-5.
F) Merged nuclei, HIF-1α and PAX-5.
A B C
D E F
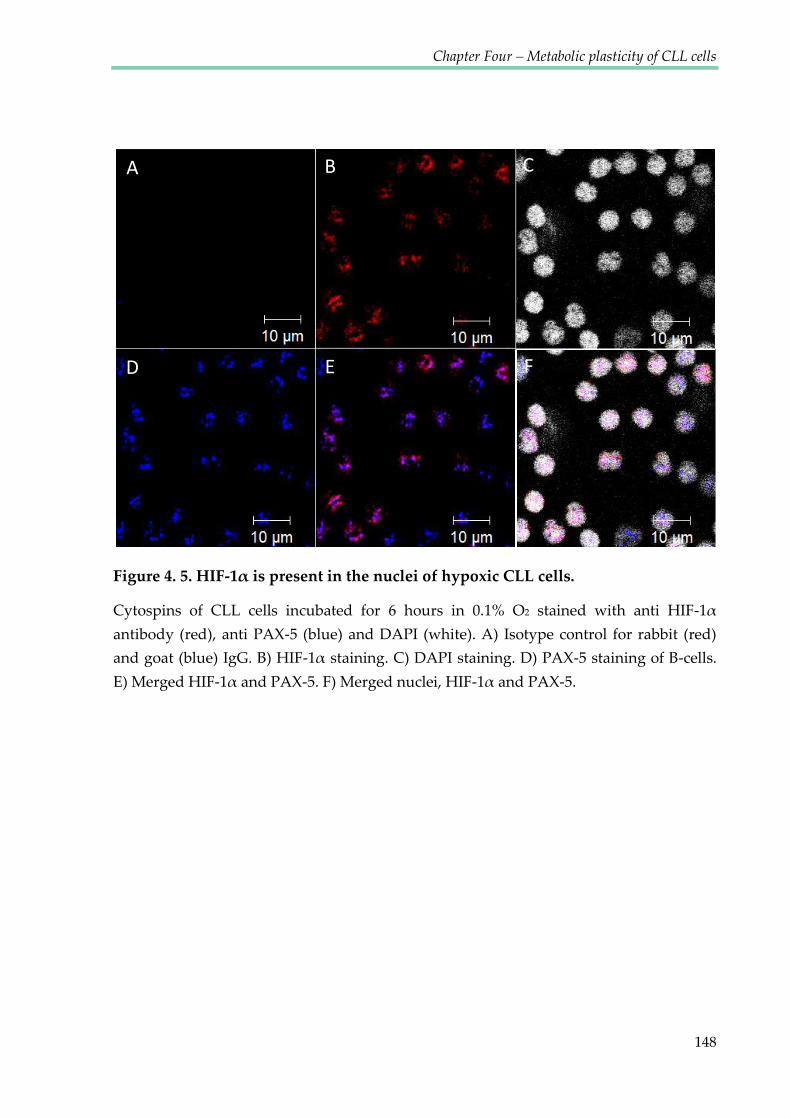
Chapter Four – Metabolic plasticity of CLL cells
148
Figure 4. 5. HIF-1α is present in the nuclei of hypoxic CLL cells.
Cytospins of CLL cells incubated for 6 hours in 0.1% O2 stained with anti HIF-1α
antibody (red), anti PAX-5 (blue) and DAPI (white). A) Isotype control for rabbit (red)
and goat (blue) IgG. B) HIF-1α staining. C) DAPI staining. D) PAX-5 staining of B-cells.
E) Merged HIF-1α and PAX-5. F) Merged nuclei, HIF-1α and PAX-5.
A B C
D E F
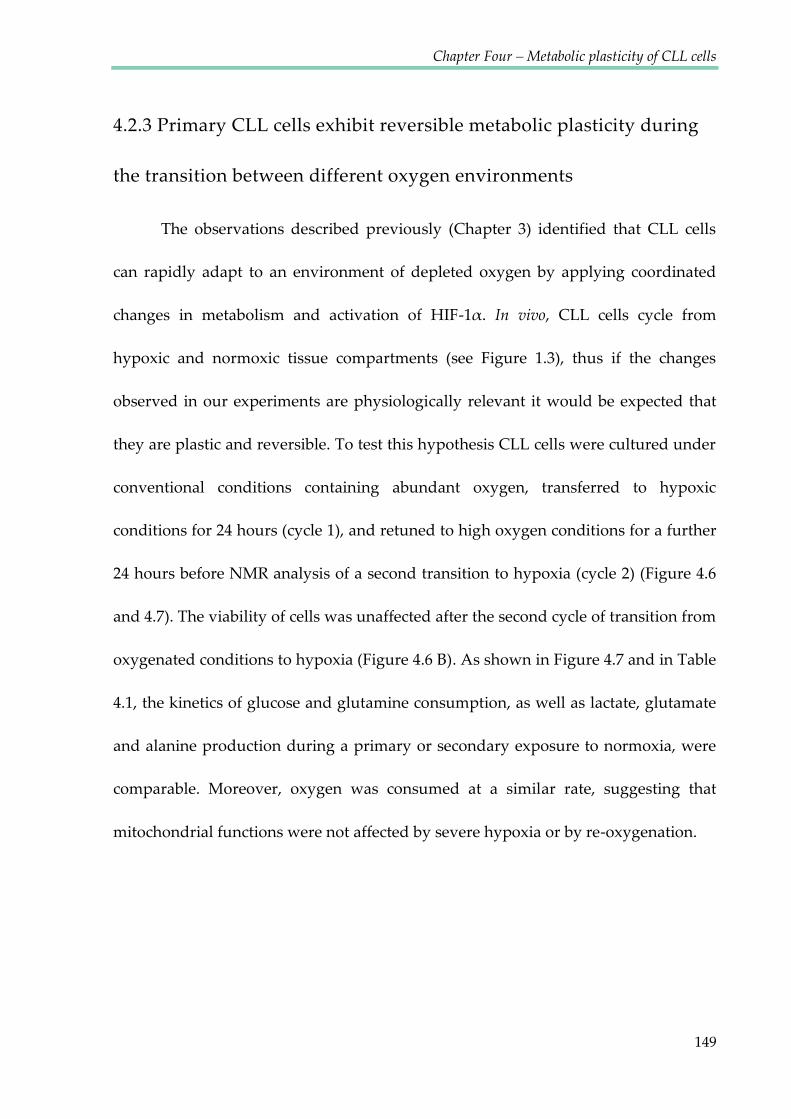
Chapter Four – Metabolic plasticity of CLL cells
149
4.2.3 Primary CLL cells exhibit reversible metabolic plasticity during
the transition between different oxygen environments
The observations described previously (Chapter 3) identified that CLL cells
can rapidly adapt to an environment of depleted oxygen by applying coordinated
changes in metabolism and activation of HIF-1α. In vivo, CLL cells cycle from
hypoxic and normoxic tissue compartments (see Figure 1.3), thus if the changes
observed in our experiments are physiologically relevant it would be expected that
they are plastic and reversible. To test this hypothesis CLL cells were cultured under
conventional conditions containing abundant oxygen, transferred to hypoxic
conditions for 24 hours (cycle 1), and retuned to high oxygen conditions for a further
24 hours before NMR analysis of a second transition to hypoxia (cycle 2) (Figure 4.6
and 4.7). The viability of cells was unaffected after the second cycle of transition from
oxygenated conditions to hypoxia (Figure 4.6 B). As shown in Figure 4.7 and in Table
4.1, the kinetics of glucose and glutamine consumption, as well as lactate, glutamate
and alanine production during a primary or secondary exposure to normoxia, were
comparable. Moreover, oxygen was consumed at a similar rate, suggesting that
mitochondrial functions were not affected by severe hypoxia or by re-oxygenation.
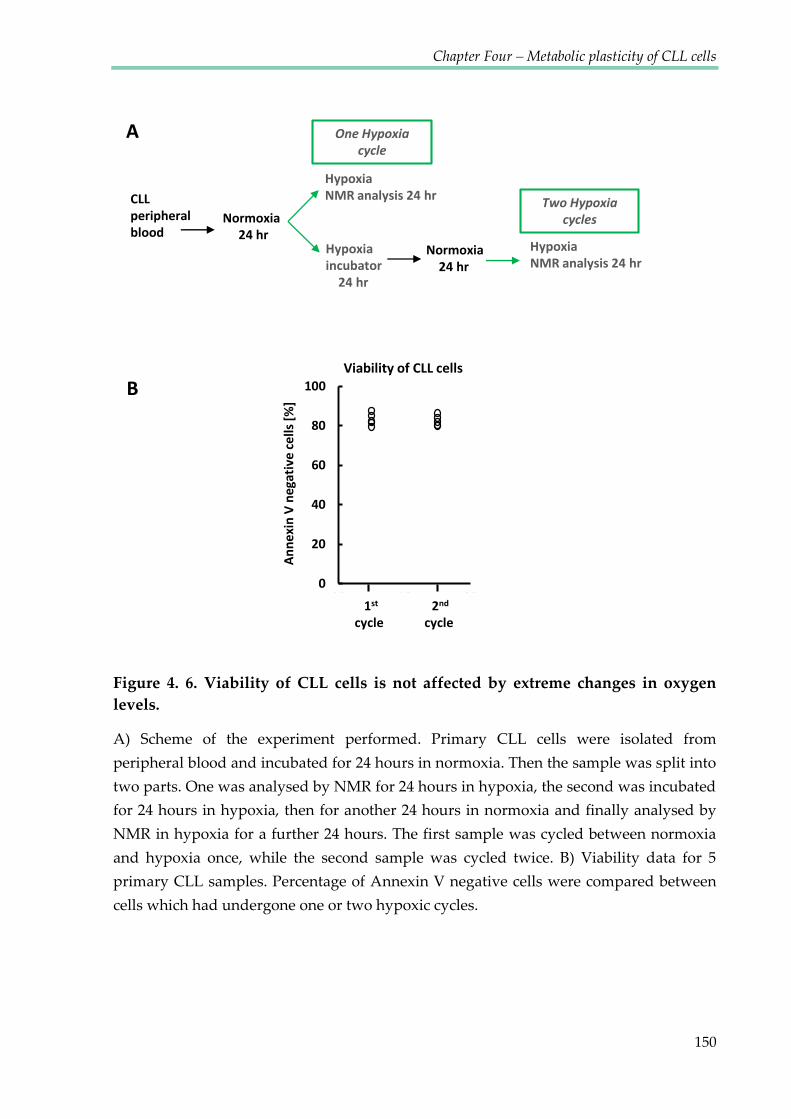
Chapter Four – Metabolic plasticity of CLL cells
150
Figure 4. 6. Viability of CLL cells is not affected by extreme changes in oxygen
levels.
A) Scheme of the experiment performed. Primary CLL cells were isolated from
peripheral blood and incubated for 24 hours in normoxia. Then the sample was split into
two parts. One was analysed by NMR for 24 hours in hypoxia, the second was incubated
for 24 hours in hypoxia, then for another 24 hours in normoxia and finally analysed by
NMR in hypoxia for a further 24 hours. The first sample was cycled between normoxia
and hypoxia once, while the second sample was cycled twice. B) Viability data for 5
primary CLL samples. Percentage of Annexin V negative cells were compared between
cells which had undergone one or two hypoxic cycles.
0
20
40
60
80
100
0.5 1.5 2.5
An
nex
in V
neg
ativ
e ce
lls [
%]
Viability of CLL cells
A
B
CLL peripheral blood
Hypoxia NMR analysis 24 hr
One Hypoxia cycle
Two Hypoxia cycles
1st 2nd
cycle cycle
Normoxia 24 hr
Hypoxia incubator 24 hr
Normoxia 24 hr
Hypoxia NMR analysis 24 hr

Chapter Four – Metabolic plasticity of CLL cells
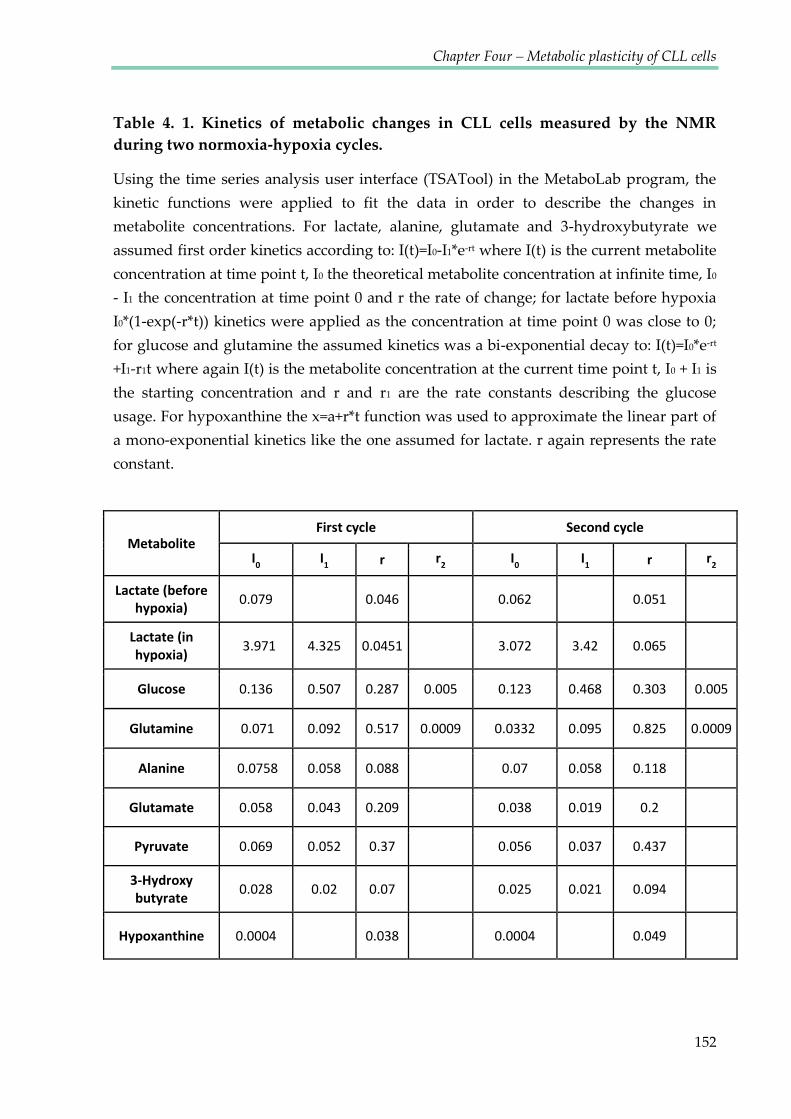
Chapter Four – Metabolic plasticity of CLL cells
152
Table 4. 1. Kinetics of metabolic changes in CLL cells measured by the NMR
during two normoxia-hypoxia cycles.
Using the time series analysis user interface (TSATool) in the MetaboLab program, the
kinetic functions were applied to fit the data in order to describe the changes in
metabolite concentrations. For lactate, alanine, glutamate and 3-hydroxybutyrate we
assumed first order kinetics according to: I(t)=I0-I1*e-rt where I(t) is the current metabolite
concentration at time point t, I0 the theoretical metabolite concentration at infinite time, I0
- I1 the concentration at time point 0 and r the rate of change; for lactate before hypoxia
I0*(1-exp(-r*t)) kinetics were applied as the concentration at time point 0 was close to 0;
for glucose and glutamine the assumed kinetics was a bi-exponential decay to: I(t)=I0*e-rt
+I1-r1t where again I(t) is the metabolite concentration at the current time point t, I0 + I1 is
the starting concentration and r and r1 are the rate constants describing the glucose
usage. For hypoxanthine the x=a+r*t function was used to approximate the linear part of
a mono-exponential kinetics like the one assumed for lactate. r again represents the rate
constant.
Metabolite First cycle Second cycle
I0 I
1 r r
2 I
0 I
1 r r
2
Lactate (before hypoxia) 0.079 0.046 0.062 0.051
Lactate (in hypoxia) 3.971 4.325 0.0451 3.072 3.42 0.065
Glucose 0.136 0.507 0.287 0.005 0.123 0.468 0.303 0.005
Glutamine 0.071 0.092 0.517 0.0009 0.0332 0.095 0.825 0.0009
Alanine 0.0758 0.058 0.088 0.07 0.058 0.118
Glutamate 0.058 0.043 0.209 0.038 0.019 0.2
Pyruvate 0.069 0.052 0.37 0.056 0.037 0.437
3-Hydroxy butyrate 0.028 0.02 0.07 0.025 0.021 0.094
Hypoxanthine 0.0004 0.038 0.0004 0.049
Chapter Four – Metabolic plasticity of CLL cells
153
4.2.4 HIF-1α inhibition reverses changes in metabolism associated
with hypoxia.
Key metabolites displayed bi-phasic kinetics as oxygen became depleted, with
rate changes being tightly associated with the transition to hypoxia (Figure 4.8).
These included increased accumulation of lactate and an accompanied accelerated
consumption of glucose consistent with a transition to elevated anaerobic glycolysis.
This indicates that CLL cells display adaptive metabolic alternations depending on
oxygen availability. There was also a marked onset of alanine synthesis upon entry
into hypoxia (Figure 4.8), suggesting hypoxia induced alanine aminotransferase
activity. These tight associations of coordinated metabolic-rate shifts with the onset
of severe hypoxia (0.8-0.1% O2) required investigation of their dependence on HIF-
1α. Two concentrations of chetomin 20 nM and 100 nM (which have been shown to
decrease the expression of the chosen HIF-1α target genes in hypoxia (Figure 4.2))
were tested showing a dose dependent effect of metabolic adaptations to hypoxia in
CLL cells. Enhanced glutamine consumption was detected following CTM treatment
and the consumption of glucose was attenuated as a result of HIF-1α inhibition.
Thus, although HIF-1α activity promoted anaerobic glycolysis in hypoxia and the
consumption of glucose, it acted to suppress overall utilisation of glutamine. After
CTM treatment, glutamine uptake may compensate for the blocked HIF-1α
dependent glycolysis pathway.

Chapter Four – Metabolic plasticity of CLL cells
154
Figure 4. 8. Metabolic adaptation of CLL cells to hypoxia involves HIF-1α.
NMR time course data for the control CLL experiment and cells treated with 20 nM and
100 nM chetomin (CTM). Cells were pre-treated with CTM for 3 hours before starting the
NMR experiment. Graphs present changes of chosen metabolites over time: Lactate,
Glucose, Glutamate, Glutamine and Alanine. The broken blue line on the lactate graph
shows the oxygen changes inside the NMR tube. The top left corner depicts an enlarged
representation of the first 6 hour portion with the visible shift of lactate kinetics after
oxygen depletion, which is inhibited by CTM.
0
5
10
15
20
25
0
10
20
30
40
50
60
0 5 10 15 20
Oxy
gen
[%
]
Lactate
0.02
0.03
0.04
0.05
0 5 10 15 20
Alanine
0.3
0.5
0.7
0.9
1.1
0 5 10 15 20
Glutamine
0
0.05
0.1
0.15
0.2
0 5 10 15 20
Glutamate
50
60
70
80
90
100
110
0 5 10 15 20
Glucose
0
7
14
21
0
5
10
15
0 2 4 6O
xyge
n [
%]
Time [hours]
Inte
nsi
ty [
AU
]
Control 20nM CTM 100nM CTM Oxygen %

Chapter Four – Metabolic plasticity of CLL cells
155
4.2.5 HIF-1α inhibition by chetomin is toxic to CLL cells regardless of
the oxygen level
The next goal was to determine whether CTM caused preferential killing of
CLL cells in hypoxia. However, exposure of CLL cells to CTM for 48 hours induced
cell death in the presence and absence of hypoxia (Figure 4.9.A). CTM inhibits the
formation of functional HIF-1α/HIF-1β/p300 (CBP) transcriptional complexes by
acting upon the p300 coactivator (Cook, Hilton et al. 2009). The actions of p300 as a
coactivator are not restricted to HIF signalling and other targets in CLL include the
NFκB pathway (Pekarsky, Palamarchuk et al. 2008). It is therefore likely that cell
death induced by CTM exposure relates to this or some other non-HIF function of
p300 that is constant between normoxia and hypoxia.
Nonetheless, the CTM data described, suggests that at least in the first 24
hours of exposure to hypoxia, activation of HIF signalling was not required for
survival. Although the reason for this is unclear, it is notable that at a protein level,
equivalent amounts of HIF-targets GLUT1, LDHA and VEGF were expressed in cells
prior to and after 24 hours exposure to hypoxia; perhaps indicating that circulating
CLL cells are primed to survive the immediate transition to hypoxia (Figure 4.2.B).

Chapter Four – Metabolic plasticity of CLL cells
156
Figure 4. 9. HIF-1α inhibition by chetomin is toxic to CLL cells in both normoxia
and hypoxia.
A) Viability of CLL cells after 48 hours of incubation with CTM in normoxia and
hypoxia. Cells were pre-treated with CTM for 3 hours before entering hypoxia. Data are
mean of n=4 ± SEM; *p < 0.05 by student’s t-test for paired data. The CTM killing curves
for both 24 and 48h are shown in Appendix 3. B) Effect of CTM on the metabolism of
CLL cells based on the NMR time course data. Lower glucose consumption, decreased
lactate and alanine secretion, increased glutamine uptake and increased glutamate
secretion, which may be a result of higher intracellular glutamate accumulation was
seen. Decreased alanine extraction and increased glutamate accumulation may indicate
the lower activity of alanine aminotransferase (ALAT).
CLL viability A B
0
20
40
60
80
100
0 20 50 100
An
ne
xin
V n
ega
tive
ce
lls [
%]
CTM [nM]
Normoxia
0
20
40
60
80
100
0 20 50 100
An
ne
xin
V n
ega
tive
ce
lls [
%]
CTM [nM]
Hypoxia
*
*
*
*

Chapter Four – Metabolic plasticity of CLL cells
157
4.2.6 Alanine aminotransferase is not involved in the mechanism of
hypoxic adaptation.
Time course NMR data, recorded on CLL cells treated with chetomin showed
decreased alanine secretion correlated with higher glutamate export. The only
enzyme using alanine and glutamate as its substrates is alanine aminotransferase –
ALAT (a diagram of these reactions is shown in Figure 4.10.A). A possible hypothesis
for the observed changes is the loss of ALAT activity. In order to test this, two ALAT
inhibitors, cycloserine and β-chloro-l-alanine, were used to investigate how they
affect the metabolism of CLL cells. NMR analysis of CLL cell culture media after 24
hour treatment with ALAT inhibitors showed that both compounds were able to
inhibit alanine production at concentrations as low as 10 μM (Figure 4.10.B).
Interestingly, the concentration of extracellular glutamate was unaffected by the
blocked ALAT transformation of glutamate to α-ketoglutarate. This may be
explained by the high complexity of glutamate metabolism compared to that of
alanine, as the latter has only one precursor - pyruvate. An example of the
complexity of glutamate metabolism is the alternative reaction that converts
glutamate to α-KG, catalysed by aspartate aminotransferase (AST). One possibility is
that the production of glutamate as an end product of the TCA cycle exceeds the
conversion of pyruvate to alanine, with concurrent conversion of glutamate to α-KG.
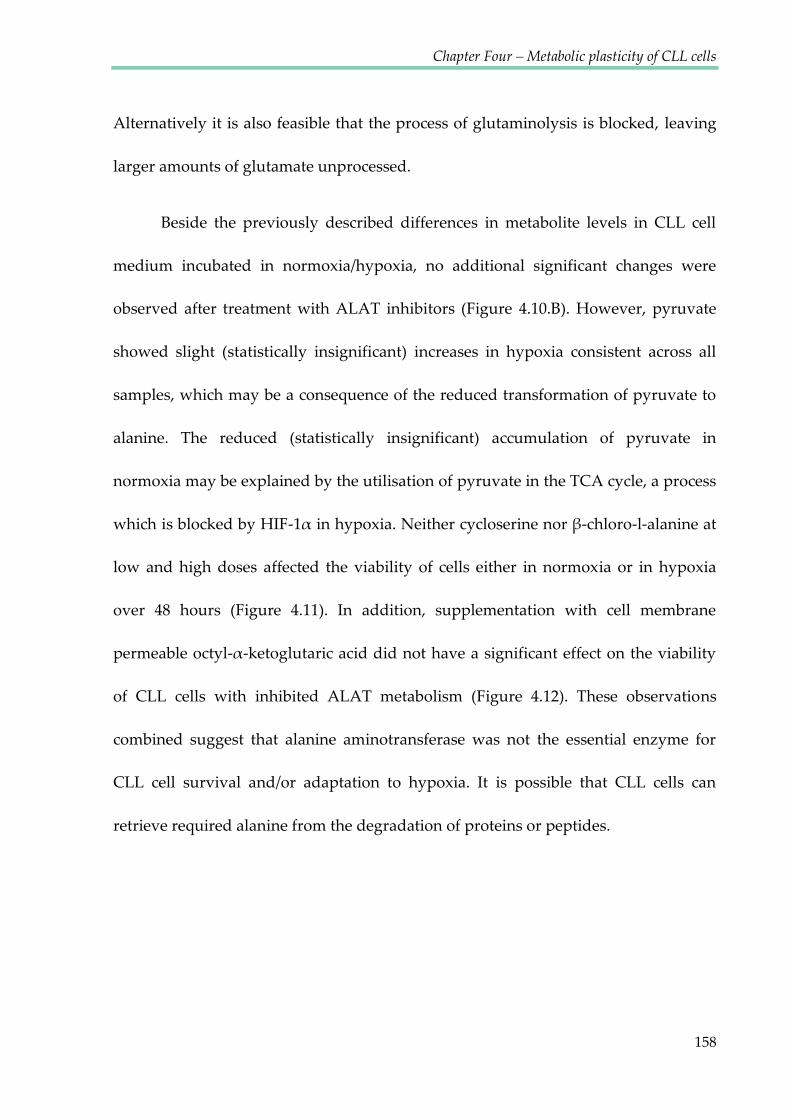
Chapter Four – Metabolic plasticity of CLL cells
158
Alternatively it is also feasible that the process of glutaminolysis is blocked, leaving
larger amounts of glutamate unprocessed.
Beside the previously described differences in metabolite levels in CLL cell
medium incubated in normoxia/hypoxia, no additional significant changes were
observed after treatment with ALAT inhibitors (Figure 4.10.B). However, pyruvate
showed slight (statistically insignificant) increases in hypoxia consistent across all
samples, which may be a consequence of the reduced transformation of pyruvate to
alanine. The reduced (statistically insignificant) accumulation of pyruvate in
normoxia may be explained by the utilisation of pyruvate in the TCA cycle, a process
which is blocked by HIF-1α in hypoxia. Neither cycloserine nor β-chloro-l-alanine at
low and high doses affected the viability of cells either in normoxia or in hypoxia
over 48 hours (Figure 4.11). In addition, supplementation with cell membrane
permeable octyl-α-ketoglutaric acid did not have a significant effect on the viability
of CLL cells with inhibited ALAT metabolism (Figure 4.12). These observations
combined suggest that alanine aminotransferase was not the essential enzyme for
CLL cell survival and/or adaptation to hypoxia. It is possible that CLL cells can
retrieve required alanine from the degradation of proteins or peptides.
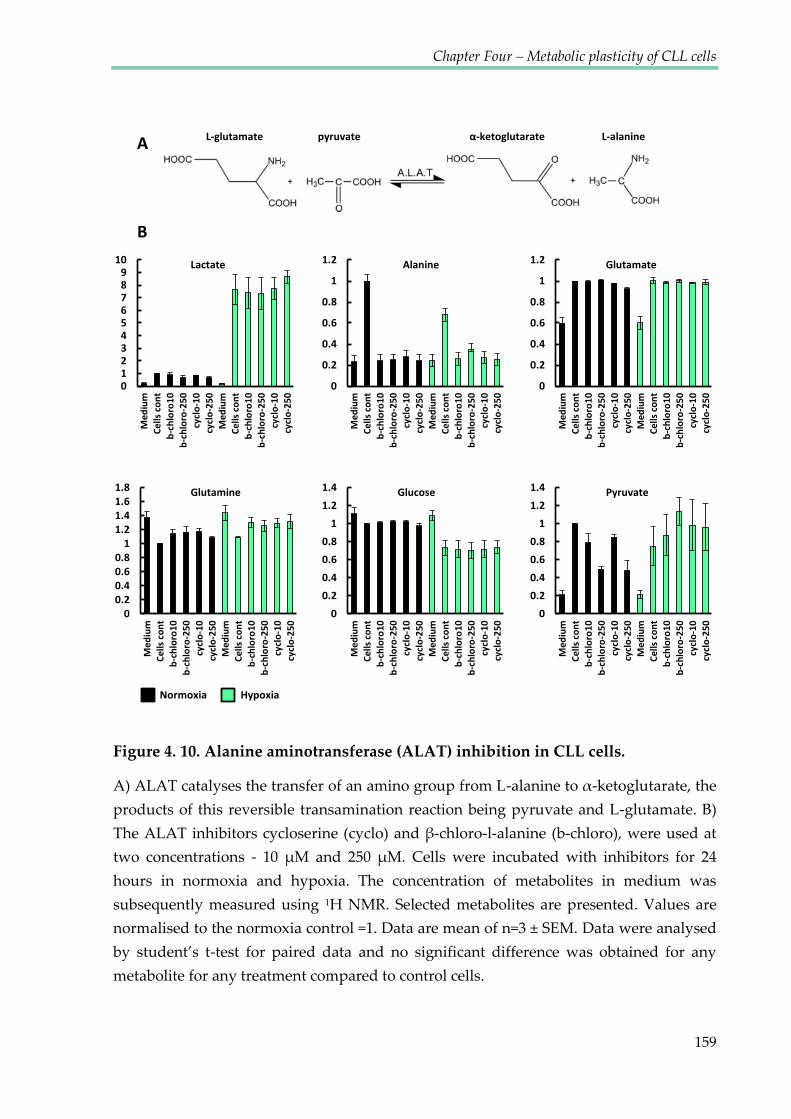
Chapter Four – Metabolic plasticity of CLL cells
159
Figure 4. 10. Alanine aminotransferase (ALAT) inhibition in CLL cells.
A) ALAT catalyses the transfer of an amino group from L-alanine to α-ketoglutarate, the
products of this reversible transamination reaction being pyruvate and L-glutamate. B)
The ALAT inhibitors cycloserine (cyclo) and β-chloro-l-alanine (b-chloro), were used at
two concentrations - 10 μM and 250 μM. Cells were incubated with inhibitors for 24
hours in normoxia and hypoxia. The concentration of metabolites in medium was
subsequently measured using 1H NMR. Selected metabolites are presented. Values are
normalised to the normoxia control =1. Data are mean of n=3 ± SEM. Data were analysed
by student’s t-test for paired data and no significant difference was obtained for any
metabolite for any treatment compared to control cells.
0123456789
10
Med
ium
Cel
ls c
on
t
b-c
hlo
ro1
0
b-c
hlo
ro-2
50
cycl
o-1
0
cycl
o-2
50
Med
ium
Cel
ls c
on
t
b-c
hlo
ro1
0
b-c
hlo
ro-2
50
cycl
o-1
0
cycl
o-2
50
Lactate
0
0.2
0.4
0.6
0.8
1
1.2
Med
ium
Cel
ls c
on
t
b-c
hlo
ro1
0
b-c
hlo
ro-2
50
cycl
o-1
0
cycl
o-2
50
Med
ium
Cel
ls c
on
t
b-c
hlo
ro1
0
b-c
hlo
ro-2
50
cycl
o-1
0
cycl
o-2
50
Alanine
0
0.2
0.4
0.6
0.8
1
1.2
Med
ium
Cel
ls c
on
t
b-c
hlo
ro1
0
b-c
hlo
ro-2
50
cycl
o-1
0
cycl
o-2
50
Med
ium
Cel
ls c
on
t
b-c
hlo
ro1
0
b-c
hlo
ro-2
50
cycl
o-1
0
cycl
o-2
50
Glutamate
00.20.40.60.8
11.21.41.61.8
Med
ium
Cel
ls c
on
t
b-c
hlo
ro1
0
b-c
hlo
ro-2
50
cycl
o-1
0
cycl
o-2
50
Med
ium
Cel
ls c
on
t
b-c
hlo
ro1
0
b-c
hlo
ro-2
50
cycl
o-1
0
cycl
o-2
50
Glutamine
0
0.2
0.4
0.6
0.8
1
1.2
1.4
Med
ium
Cel
ls c
on
t
b-c
hlo
ro1
0
b-c
hlo
ro-2
50
cycl
o-1
0
cycl
o-2
50
Med
ium
Cel
ls c
on
t
b-c
hlo
ro1
0
b-c
hlo
ro-2
50
cycl
o-1
0
cycl
o-2
50
Glucose
0
0.2
0.4
0.6
0.8
1
1.2
1.4
Med
ium
Cel
ls c
on
t
b-c
hlo
ro1
0
b-c
hlo
ro-2
50
cycl
o-1
0
cycl
o-2
50
Med
ium
Cel
ls c
on
t
b-c
hlo
ro1
0
b-c
hlo
ro-2
50
cycl
o-1
0
cycl
o-2
50
Pyruvate
A
B
L-glutamate pyruvate α-ketoglutarate L-alanine
Normoxia Hypoxia

Chapter Four – Metabolic plasticity of CLL cells
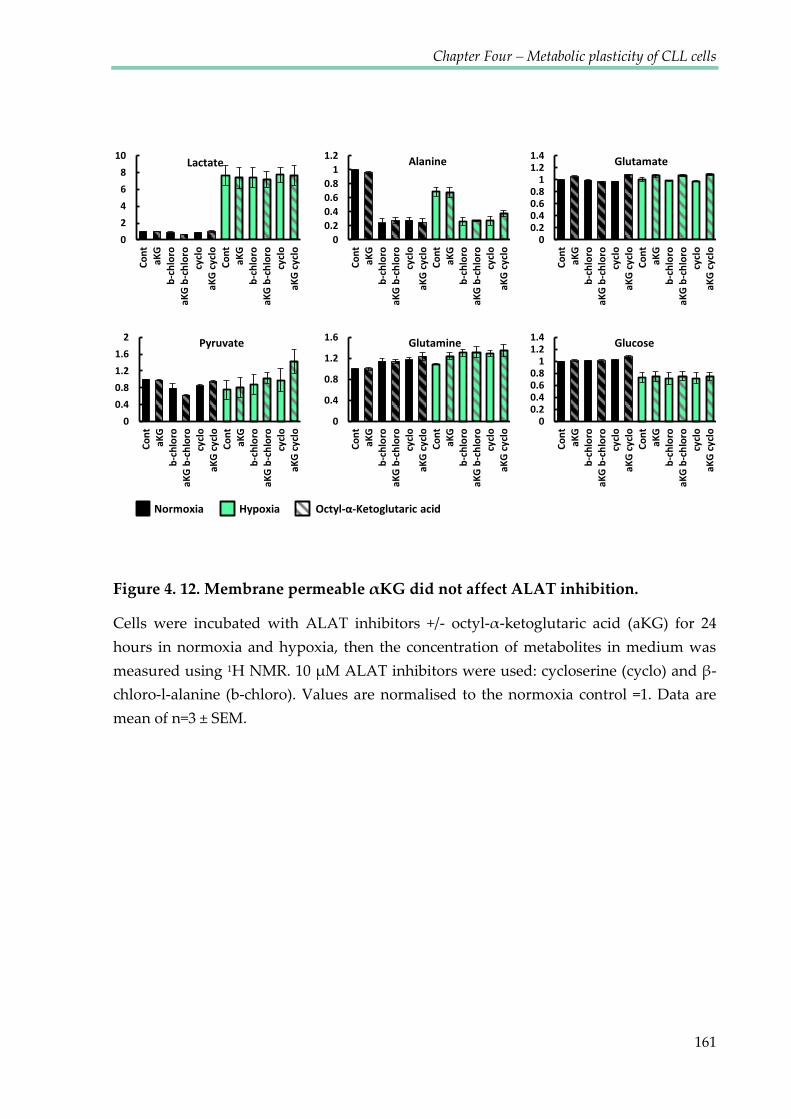
Chapter Four – Metabolic plasticity of CLL cells
161
Figure 4. 12. Membrane permeable αKG did not affect ALAT inhibition.
Cells were incubated with ALAT inhibitors +/- octyl-α-ketoglutaric acid (aKG) for 24
hours in normoxia and hypoxia, then the concentration of metabolites in medium was
measured using 1H NMR. 10 μM ALAT inhibitors were used: cycloserine (cyclo) and β-
chloro-l-alanine (b-chloro). Values are normalised to the normoxia control =1. Data are
mean of n=3 ± SEM.
0
2
4
6
8
10
Co
nt
aKG
b-c
hlo
ro
aKG
b-c
hlo
ro
cycl
o
aKG
cyc
lo
Co
nt
aKG
b-c
hlo
ro
aKG
b-c
hlo
ro
cycl
o
aKG
cyc
lo
Lactate
0
0.2
0.4
0.6
0.8
1
1.2
Co
nt
aKG
b-c
hlo
roaK
G b
-ch
loro
cycl
oaK
G c
yclo
Co
nt
aKG
b-c
hlo
roaK
G b
-ch
loro
cycl
oaK
G c
yclo
Alanine
00.20.40.60.8
11.21.4
Co
nt
aKG
b-c
hlo
roaK
G b
-ch
loro
cycl
oaK
G c
yclo
Co
nt
aKG
b-c
hlo
roaK
G b
-ch
loro
cycl
oaK
G c
yclo
Glutamate
0
0.4
0.8
1.2
1.6
2
Co
nt
aKG
b-c
hlo
roaK
G b
-ch
loro
cycl
oaK
G c
yclo
Co
nt
aKG
b-c
hlo
roaK
G b
-ch
loro
cycl
oaK
G c
yclo
Pyruvate
00.20.40.60.8
11.21.4
Co
nt
aKG
b-c
hlo
roaK
G b
-ch
loro
cycl
oaK
G c
yclo
Co
nt
aKG
b-c
hlo
roaK
G b
-ch
loro
cycl
oaK
G c
yclo
Glucose
0
0.4
0.8
1.2
1.6
Co
nt
aKG
b-c
hlo
roaK
G b
-ch
loro
cycl
oaK
G c
yclo
Co
nt
aKG
b-c
hlo
roaK
G b
-ch
loro
cycl
oaK
G c
yclo
Glutamine
Normoxia Hypoxia Octyl-α-Ketoglutaric acid
Chapter Four – Metabolic plasticity of CLL cells
162
4.3 DISCUSSION
The influence of the microenvironment on CLL cells is important, particularly
in the context of apoptotic resistance and induction of cell proliferation. Many recent
studies have been focused on the interactions of CLL cells with supportive cells such
as bone marrow stromal cells and endothelial cells, as well as transgenic fibroblasts
expressing CD40 ligand (CD40L) which in vivo, is delivered by T helper cells and
stimulates CLL cell proliferation. In order to replicate cytokines secreted by T cells,
soluble factors such as IL-21 and IL-4 have also been added to co-culture systems to
replicate the in vivo microenvironment of CLL cells (Ghia, Circosta et al. 2005;
Ahearne, Willimott et al. 2013). This allows for the induction of cell activation,
division and enhanced survival of cells. The present study on the other hand, focuses
on the physical cues of the cellular microenvironment - oxygen and extracellular pH-
which play roles just as important as biological factors in the regulation of cellular
responses and metabolism.
The effect of hypoxia in cancer cell metabolism has been widely investigated
in the last decade, however the vast majority of studies have been conducted on solid
tumours. Adaptations of cancer cells to low oxygen environments have been shown
to be responsible for anti-drug resistance as well as defence against ionising
radiation-induced DNA damage (Wachsberger, Burd et al. 2003; Adamski, Price et al.
2013). Moreover, hypoxic tumour cells promote tumour progression and metastasis
Chapter Four – Metabolic plasticity of CLL cells
163
through a variety of direct and indirect mechanisms. It has also been shown that
patients with primary tumours that contain high proportions of hypoxic cells have
decreased disease-free and overall survival rates after surgical resection of the
primary tumour (Fyles, Milosevic et al. 2002; Vergis, Corbishley et al. 2008). Until
recently there had been little interest in the investigation of the effect of hypoxia on
leukaemic cells. This study postulates that CLL can potentially constitute a model for
the metabolic studies of other metastatic cancers.
It has previously been reported that CLL cells express HIF-1α in normoxic
conditions (Ghosh, Shanafelt et al. 2009) and the importance of its target gene VEGF
has been investigated. An increase in microvessel density was observed in CLL bone
marrows and lymph nodes, suggesting the increased tissue site angiogenesis in CLL
(Chen, Treweeke et al. 2000; Kini, Kay et al. 2000) and VEGF has been shown to be
elevated in serum and urine of some CLL patients (Menzel, Rahman et al. 1996;
Molica, Vitelli et al. 1999; Aguayo, O'Brien et al. 2000). Moreover, upregulation of
mRNA encoding VEGF and its receptors (Kay, Jelinek et al. 2001) suggest that
angiogenic factors are important in the biology of the malignant B-cell clone. The
present study showed an almost immediate increase of HIF-1α protein in hypoxia,
correlated with increases of transcription of its target genes (Figures 4.1. and 4.2.A).
However, only low levels (not detectable by Western blot analysis) of HIF-1α
localised in the cytoplasm (Figures 4.3.-4.4.) were detected in CLL cells incubated in

Chapter Four – Metabolic plasticity of CLL cells
164
normoxic conditions. Similar to previous reports, the translocation of HIF-1α to the
nucleus in hypoxic cells was observed (Figure 4.5.) (Chilov, Camenisch et al. 1999).
Comparable levels of LDHA and GLUT1 proteins in normoxia and hypoxia (Figure
4.2.B) may be the consequence of the longevity of these proteins or the stability of
their mRNA. This data suggests that CLL cells are pre-programmed for quick oxygen
depletion, which enables them to immediately adapt their metabolism to hypoxic
conditions.
This pre-programming may be the key to the plasticity of CLL cells which
allows them to circulate between different oxygen environments. This study has
investigated how the transitions between normoxia and hypoxia influence the
metabolism of CLL cells and multiple adaptations. Metabolic plasticity- which could
be described as metabolic flexibility, enabling prioritisation of metabolic pathways to
match anabolic and catabolic demands of evolving phenotype during cell fate
determination- was widely described in stem cell research (Folmes, Dzeja et al. 2012)
but has not been extensively investigated in primary CLL cells.
The NMR time course analysis proved to be a useful method to investigate the
metabolism of primary cells using cycling experiments. Firstly, this proves that this
NMR technique is very reproducible and experiments performed on different days
can provide comparable metabolic data characterised by very similar kinetics.
Secondly, the viability and the oxygen consumption rates proved not only that CLL

Chapter Four – Metabolic plasticity of CLL cells
165
cells are metabolically plastic, but also that the NMR experiment does not affect their
metabolism. Cells were able to re-set their metabolic pathways during the re-
oxygenation without causing damage to mitochondria as observed in endothelial
cells (Dhar-Mascareno, Carcamo et al. 2005).
In order to distinguish which metabolic pathways are controlled by HIF-1α,
chetomin a well-known HIF-1α inhibitor was used (Kung, Zabludoff et al. 2004).
Beyond the well-described toxic effect of CTM on hypoxic cells, the kinetic changes
of CTM treated cells were monitored. The data presented in this chapter suggest that
alongside the well understood inhibition of lactate production and glucose
consumption (as a consequence of GLUT1 down regulation), HIF-1α upregulates
glutaminolysis as the alternative source of carbon when glucose metabolism is
blocked. Sun and Denko proposed an interesting model connecting HIF-1α with
glutamine metabolism (Sun and Denko 2014). They identified the mechanism by
which HIF-1 activation results in a dramatic reduction of the activity of
mitochondrial enzyme complex α-ketoglutarate dehydrogenase (αKGDH). HIF-1
activation promotes SIAH2 targeted ubiquitination and proteolysis of the subunit of
the αKGDH complex. Therefore inhibition of HIF-1 may reverse the hypoxic drop in
αKGDH activity and stimulate glutamine oxidation, inducing its uptake as a
consequence.
Chapter Four – Metabolic plasticity of CLL cells
166
Another interesting consequence of HIF-1α inhibition was the decreased
alanine production. The hypothesis that ALAT may have been deactivated by HIF-1α
blockage did not prove to be correct in CLL cells. Alanine is often described as a by-
product of the metabolism of pyruvate (DeBerardinis and Cheng 2010), which
concurs with the data from the present investigation showing that ALAT inhibitors
did not affect the viability of cells or have a significant effect on cell metabolism, even
though alanine production was profoundly inhibited (Figure 4.10. and 4.11.).
Knowing that ALAT inhibition does not increase glutamate secretion, the glutamate
accumulation after CTM treatment, remains unexplained. MacIntyre et al. reported
higher levels of glutamate and pyruvate in the serum of CLL patients compared to
that of healthy donors, suggesting decreased activity of ALAT as a possible
explanation (MacIntyre, Jimenez et al. 2010). The results presented in this chapter
however dispute the theory that ALAT inhibition causes such an effect.
While others studies have reported that ALAT inhibition in lung carcinoma
cells impaired glucose uptake (Beuster, Zarse et al. 2011), this relation in CLL cells
was not observed in this investigation. Moreover it has been shown that ALAT
inhibitors induced impaired growth of the cell line and reduced tumour mass in the
xenograft mouse model, while no cytotoxic effect was observed in the present study.
This may indicate the difference in alanine metabolism between quiescent and
proliferating cells. Alternatively, CLL cells may use proteolysis in order to fulfil their

Chapter Four – Metabolic plasticity of CLL cells
167
alanine demand. This is however not supported by our metabolic data showing no
increase of essential amino acids.
We have demonstrated that treatment with 100mM CTM for 48h resulted in
significant decrease of CLL cells viability (Figure 4.9 A) in both normoxia and
hypoxia with suggests strong HIF-1α independent toxicity of high CTM dose. This
suggests that the effect of 100nM CTM demonstrated on the figure 4.8 could result
from cell death rather than a specific metabolic change or the combination of both.
The first metabolic shift of the CLL cells treated with CTM can be observed after only
5 (when hypoxia is reached) therefore measurement of CLL cells viability after 5h of
treatment with 100nM CTM should help to distinguish if those changes were
triggered by cell death or only the Hif-1α inhibition.
Not only malignant B-cells, but all immune cells are exposed to low oxygen
tensions as they develop and migrate between blood and different tissues, and the
mechanisms by which lymphocytes adapt to hypoxia are poorly understood. A study
by Kojima et al. showed that B-cells but not T-cells were strongly dependent on HIF-
1α. The HIF-1α deficient T-cells showed unchanged phenotype (compared to the
wild-type), while dramatic distortions in phenotype of HIF-1α deficient B-cells were
observed (Kojima, Gu et al. 2002). Recent studies have shown that lymphocyte
activation has strong links with altered metabolism. Activation of T- lymphocytes,
combined with increased cell proliferation increases their bioenergetic and

Chapter Four – Metabolic plasticity of CLL cells
168
biosynthetic demands, forcing cells to adapt their metabolism. Changes in the
microenvironment resulting from limitations of nutrient and oxygen require further
metabolic reprogramming (Pearce, Poffenberger et al. 2013). It has been shown that
Naïve T cells are metabolically quiescent and use oxidative phosphorylation as the
main source of ATP. As they are activated, they consume more nutrients and
increase their glycolysis and gutaminolysis rates, but fully activated memory T cells
are characterised by quiescent metabolism with oxidative phosphorylation mainly
fuelled by fatty acid oxidation and increased mitochondrial mass which suggest they
are metabolically primed to respond during the next infection (van der Windt,
O'Sullivan et al. 2013).
The fact that other immune cells need to reprogram their metabolism
depending on the environment suggests that CLL cells may be a good model to
investigate the biology of B-cells in general. This study intended to compare
observations regarding both the plasticity of CLL cells and the effect of CTM on their
metabolism, with similar analysis conducted on healthy B-cells. The difficulty was
that NMR spectroscopy as a relatively insensitive method requires reasonably large
amounts of cells to obtain a good signal to noise ratio. Therefore primary CLL cells,
although quiescent and unable to increase the biomass by division, are a very good
model as CLL patient blood samples provide large amounts of B-cells which are
otherwise difficult to obtain.

Chapter V
Investigating the role of
pyruvate in adapting to
hypoxia
Chapter Five – Investigating the role of pyruvate in adapting to hypoxia
170
5.1 INTRODUCTION
Pyruvate is known to play an important role in protecting cancer cells from
hypoxic stress (Roudier and Perrin 2009; Huang, Kuo et al. 2013; Cipolleschi, Marzi
et al. 2014). Some of the signals from metabolites shown in the 1D 1H-NMR spectrum
(Figure 3.1) are represented by distinct separated peaks, while others are more
difficult to assign and analyse because of overlapping chemical shifts with
neighbouring peaks. One of the more difficult metabolites to identify in spectra
obtained in the previous chapter was pyruvate.
Many studies have linked pyruvate metabolism with hypoxia. The most direct
link between hypoxia and pyruvate metabolism is the fact that HIF-1α directly
activates the gene encoding pyruvate dehydrogenase kinase 1 (PDK1). PDK1
inactivates the TCA cycle enzyme, pyruvate dehydrogenase (PDH), which converts
pyruvate to acetyl-CoA (Kim, Tchernyshyov et al. 2006) (See Figure 6.17). Active
suppression of mitochondrial pyruvate catabolism resulting in decreased respiration
is partially compensated by increased anaerobic glycolysis promoted by HIF-1α
(Seagroves, Ryan et al. 2001). However, increased ATP production may not be
sufficient for hypoxic adaptations since hypoxia causes oxidative stress from
uncontrolled mitochondrial generation of reactive oxygen species (ROS), which may
affect cell survival. ROS which is a by-product of mitochondrial respiration arising
from electron transfer to O2, can be efficiently neutralized by catalase,
Chapter Five – Investigating the role of pyruvate in adapting to hypoxia
171
peroxiredoxins, and superoxide dismutase. In hypoxia however, perturbation in
electron transport is associated with leakage of electrons from the respiratory chain,
resulting in increased ROS that could be toxic to cells if ROS levels are not attenuated
(Kim, Tchernyshyov et al. 2006).
Pyruvate and its derivatives have been shown to be important endogenous
scavengers of certain reactive oxygen species (ROS), especially hydrogen peroxide
(H2O2). Pyruvate scavenges H2O2 by virtue of a non-enzymatic oxidative
decarboxylation reaction, which was first described by Holleman in 1904 (Holleman
1904):
CH3-CO-CO2-H + HO-OH CH3-CO-OH + CO2H-OH CH3-CO-OH + CO2+H2O
Scavenging of H2O2 by endogenously generated pyruvate has been shown to be the
key cellular defence against oxidative stress in proliferating cells (Brand and
Hermfisse 1997).
In addition to H2O2, other important cellular reactive oxygen species include
superoxide radical anion (O2•-), hydroxyl radical (OH•), and peroxynitrite (ONOO-)
(Fink 2002). Although O2•- is only moderately reactive, it can undergo a one-electron
reduction forming H2O2, or react with nitric oxide (NO) to form the potent oxidising
and nitrosating agent, ONOO- (Pacher, Beckman et al. 2007). Evidence has been
shown to support the hypothesis that pyruvate is not only capable of scavenging
H2O2, but also OH• (Ervens et al. 2003) and peroxynitrite (Varma and Hegde 2007).

Chapter Five – Investigating the role of pyruvate in adapting to hypoxia
172
It has been previously reported that pyruvate (together with glutamate) was
increased in the serum of CLL patients compared to the serum of healthy donors
(MacIntyre, Jimenez et al. 2010). Suggested causes of the elevated levels of pyruvate
included deficiencies in thiamine- of which the physiologically active form (thiamine
pyrophosphate) acts as a coenzyme in pyruvate decarboxylation (Seligmann, Levi et
al. 2001); decreased activity of alanine aminotransferase (discussed in the previous
chapter) and elevated serum levels of pyruvate kinase type M2 (Oremek,
Teigelkamp et al. 1999).
The aim of this part of the study was to compare pyruvate kinetics in
normoxic and hypoxic conditions in CLL cells, to investigate its importance for the
metabolic adaptations and to test the hypothesis of its role in ROS protection. The
analysis of pyruvate in 1H-NMR spectra is challenging as there is only a singlet
representing the methyl group in a crowded region of the spectrum, and its chemical
shift changes with pH. Despite this challenge, this work aimed to investigate its
kinetics in CLL cells.

Chapter Five – Investigating the role of pyruvate in adapting to hypoxia
173
5.2 RESULTS
5.2.1 Analysis of pyruvate changes during the NMR time course.
Figure 5.1 shows the pyruvate and glutamate resonances during the 1H-NMR
time course experiment with CLL cells. The glutamate multiplet H-C4 consists of 6
signals, two of which overlap with the pyruvate signal when it shifts upfield (to the
lower ppm values) as a consequence of a decreasing pH. In order to assess the
concentration of extracellular pyruvate in the NMR tube, Chenomx software was
used. Chenomx has a build-in library of pH dependent spectra for many metabolites
and can stimulate spectra of overlapping signals for deconvolution. First, glutamate
resonances were assigned in Chenomx, using intensities from the non-overlapping
glutamate signals to obtain correct intensities for overlapping resonances.
Subsequently the pyruvate signal was assigned and its intensity was estimated by
adjusting the sum of the glutamate and pyruvate signals until the overall signal was
reasonably well represented. In order to obtain the pyruvate concentration, the
glutamate concentration was subtracted from the sum (Figure 5.1.B). In order to
confirm the assignment of pyruvate, the same sample was spiked with additional
pyruvate (Figure 5.1.C,D). The pyruvate signals of the sample overlapped and spiked
pyruvate exhibited the same pH dependent signal shift, moving towards the
glutamate signals. Chenomx analysis showed that the additional spiked pyruvate
was also taken up by CLL cells in hypoxic conditions (Figure 5.1.C,D).

Chapter Five – Investigating the role of pyruvate in adapting to hypoxia
174
Figure 5. 1. Analysis of the pyruvate concentration during the time course with
CLL cells.
A) Superimposed time course spectra with the pyruvate peak. As the pH decreased the
pyruvate signal shifted upfield causing overlap with one of the glutamate resonances. B)
Pyruvate intensities (green signal 1) were derived using the Chenomx and glutamate
signal intensities (purple signals 2ab, 3ab, 4ab). The glutamate concentration
(corresponding to area under the curve) was estimated using glutamate signals 2b, 3ab
and 4ab. In order to estimate the pyruvate concentration, from the area under the overall
signal arising from the overlapping pyruvate-glutamate signals, the estimated area
under the signal 2b was subtracted. C) The sample with CLL cells was spiked with
pyruvate, the same pH dependent shift was observed. D) The concentration of glutamate
and pyruvate was estimated accordingly using Chenomx software.
Pyruvate
Glutamate
2.36 2.35 2.34 2.33
1 2a 2b
3a 3b
4a 4b
Pyruvate
Glutamate
A
B
C
1H [ppm]
D
2.36 2.35 2.34 2.33 1H [ppm]
1
2a 2b
3a 3b
4a 4b
[pH
]
[pH
]
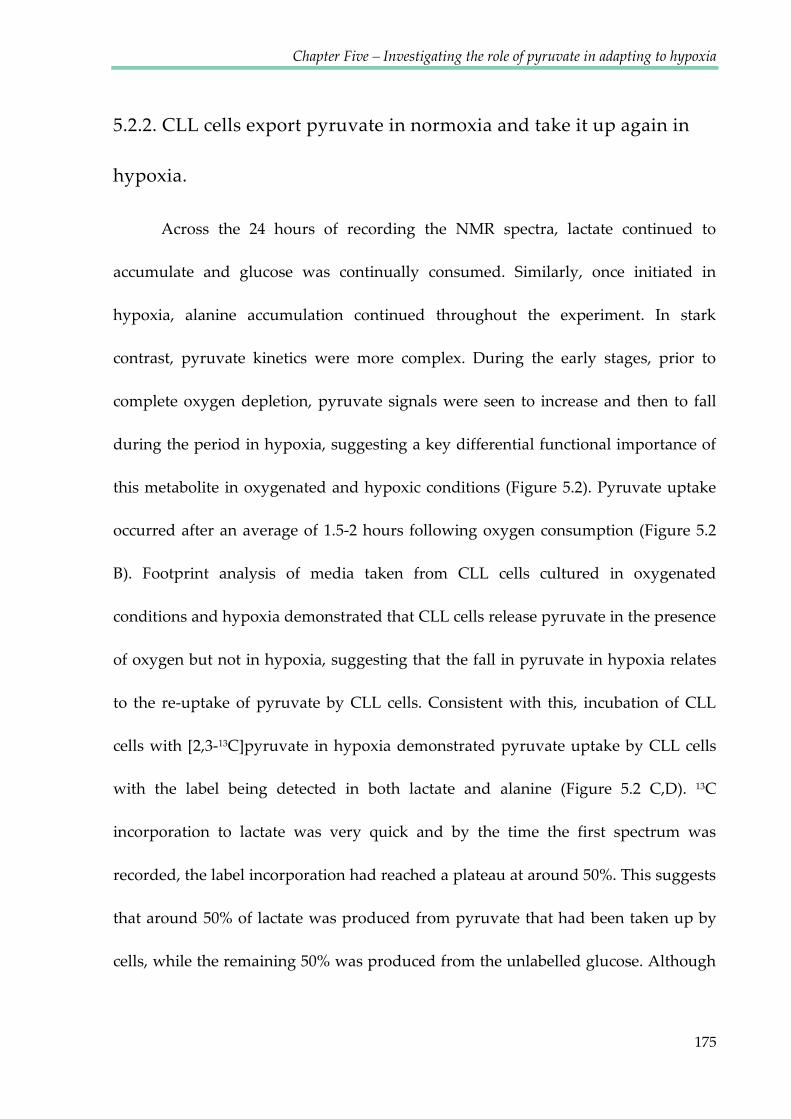
Chapter Five – Investigating the role of pyruvate in adapting to hypoxia
175
5.2.2. CLL cells export pyruvate in normoxia and take it up again in
hypoxia.
Across the 24 hours of recording the NMR spectra, lactate continued to
accumulate and glucose was continually consumed. Similarly, once initiated in
hypoxia, alanine accumulation continued throughout the experiment. In stark
contrast, pyruvate kinetics were more complex. During the early stages, prior to
complete oxygen depletion, pyruvate signals were seen to increase and then to fall
during the period in hypoxia, suggesting a key differential functional importance of
this metabolite in oxygenated and hypoxic conditions (Figure 5.2). Pyruvate uptake
occurred after an average of 1.5-2 hours following oxygen consumption (Figure 5.2
B). Footprint analysis of media taken from CLL cells cultured in oxygenated
conditions and hypoxia demonstrated that CLL cells release pyruvate in the presence
of oxygen but not in hypoxia, suggesting that the fall in pyruvate in hypoxia relates
to the re-uptake of pyruvate by CLL cells. Consistent with this, incubation of CLL
cells with [2,3-13C]pyruvate in hypoxia demonstrated pyruvate uptake by CLL cells
with the label being detected in both lactate and alanine (Figure 5.2 C,D). 13C
incorporation to lactate was very quick and by the time the first spectrum was
recorded, the label incorporation had reached a plateau at around 50%. This suggests
that around 50% of lactate was produced from pyruvate that had been taken up by
cells, while the remaining 50% was produced from the unlabelled glucose. Although
Chapter Five – Investigating the role of pyruvate in adapting to hypoxia
176
the incorporation of 13C into the alanine signal was visibly increasing in the spectrum
containing only signals originating from protons bound to 13C compared to the
spectrum containing NMR signals originating from all protons in the sample, it was
not possible to calculate the 13C incorporation due to the pyruvate keto tautomer
signal overlapping with alanine resonance (Muller, Baumberger 1939) (See 5.2.7 for
more information about the pH dependent pyruvate tautomerisation).
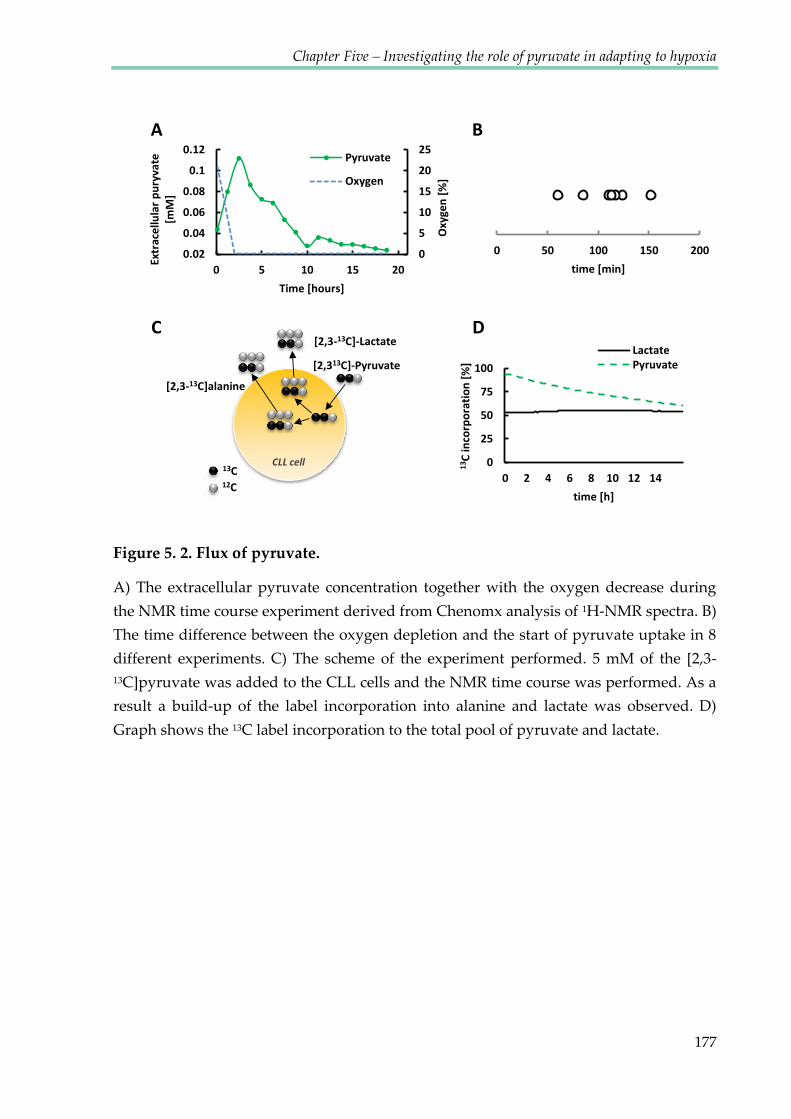
Chapter Five – Investigating the role of pyruvate in adapting to hypoxia
177
Figure 5. 2. Flux of pyruvate.
A) The extracellular pyruvate concentration together with the oxygen decrease during
the NMR time course experiment derived from Chenomx analysis of 1H-NMR spectra. B)
The time difference between the oxygen depletion and the start of pyruvate uptake in 8
different experiments. C) The scheme of the experiment performed. 5 mM of the [2,3-
13C]pyruvate was added to the CLL cells and the NMR time course was performed. As a
result a build-up of the label incorporation into alanine and lactate was observed. D)
Graph shows the 13C label incorporation to the total pool of pyruvate and lactate.
C
0
5
10
15
20
25
0.02
0.04
0.06
0.08
0.1
0.12
0 5 10 15 20
Oxy
gen
[%
]
Extr
ace
llula
r p
ury
vate
[m
M]
Time [hours]
Pyruvate
Oxygen
CLL cell
[2,313C]-Pyruvate
[2,3-13C]-Lactate
[2,3-13C]alanine
A
0
25
50
75
100
0 2 4 6 8 10 12 14
13C
inco
rpo
rati
on
[%
]
time [h]
LactatePyruvate
13C 12C
0 50 100 150 200
time [min]
B
D
Chapter Five – Investigating the role of pyruvate in adapting to hypoxia
178
5.2.3 Pyruvate dynamics were not HIF-1α dependent.
Exposure of CLL cells to CTM indicated the transition in pyruvate dynamics
was not tightly dependent on HIF-1α activation (Figure 5.3). The two chetomin
concentrations investigated, 50 nM and 100 nM, did not alter the pyruvate profile in
a concentration dependent manner. Secretion of pyruvate in normoxia declined
slightly, following HIF-1α inhibition, which may be a consequence of the increased
PDH activity, allowing pyruvate to enter the TCA cycle. However pyruvate uptake
in hypoxia was not affected by chetomin, suggesting its importance in the
metabolism of CLL cells independently from HIF-1α activation.

Chapter Five – Investigating the role of pyruvate in adapting to hypoxia
179
Figure 5. 3. The transition in pyruvate dynamics was independent of HIF-1α
activation.
The NMR timecourse data for the control CLL experiment and cells treated with 20 mM
and 100 nM CTM. Cells were pre-treated with CTM for 3 hours before starting the NMR
experiment. Graph presents changes of extracellular pyruvate concentration over time.
Concentration values were calculated using Chenomx software.
0
0.05
0.1
0.15
0.2
0.25
0 5 10 15 20
Co
nce
ntr
atio
n [
mM
]
Time [h]
Pyruvate
Control
50nM CTM
100nM CTM
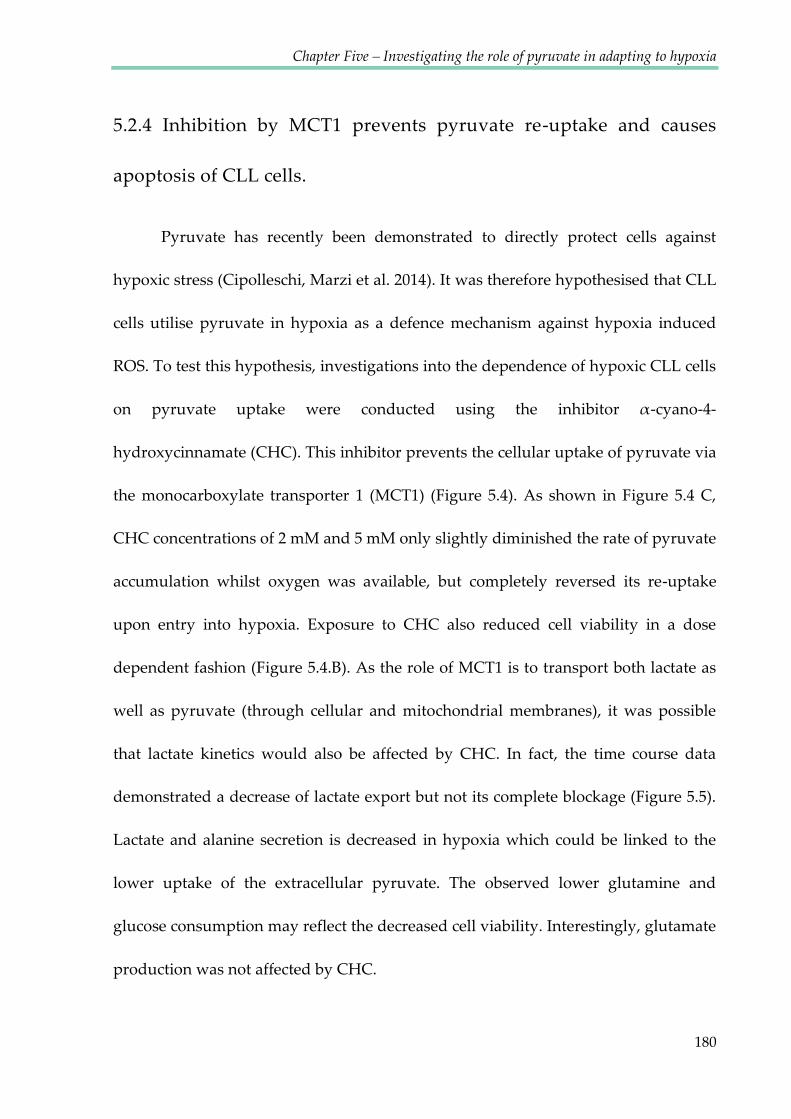
Chapter Five – Investigating the role of pyruvate in adapting to hypoxia
180
5.2.4 Inhibition by MCT1 prevents pyruvate re-uptake and causes
apoptosis of CLL cells.
Pyruvate has recently been demonstrated to directly protect cells against
hypoxic stress (Cipolleschi, Marzi et al. 2014). It was therefore hypothesised that CLL
cells utilise pyruvate in hypoxia as a defence mechanism against hypoxia induced
ROS. To test this hypothesis, investigations into the dependence of hypoxic CLL cells
on pyruvate uptake were conducted using the inhibitor α-cyano-4-
hydroxycinnamate (CHC). This inhibitor prevents the cellular uptake of pyruvate via
the monocarboxylate transporter 1 (MCT1) (Figure 5.4). As shown in Figure 5.4 C,
CHC concentrations of 2 mM and 5 mM only slightly diminished the rate of pyruvate
accumulation whilst oxygen was available, but completely reversed its re-uptake
upon entry into hypoxia. Exposure to CHC also reduced cell viability in a dose
dependent fashion (Figure 5.4.B). As the role of MCT1 is to transport both lactate as
well as pyruvate (through cellular and mitochondrial membranes), it was possible
that lactate kinetics would also be affected by CHC. In fact, the time course data
demonstrated a decrease of lactate export but not its complete blockage (Figure 5.5).
Lactate and alanine secretion is decreased in hypoxia which could be linked to the
lower uptake of the extracellular pyruvate. The observed lower glutamine and
glucose consumption may reflect the decreased cell viability. Interestingly, glutamate
production was not affected by CHC.

Chapter Five – Investigating the role of pyruvate in adapting to hypoxia
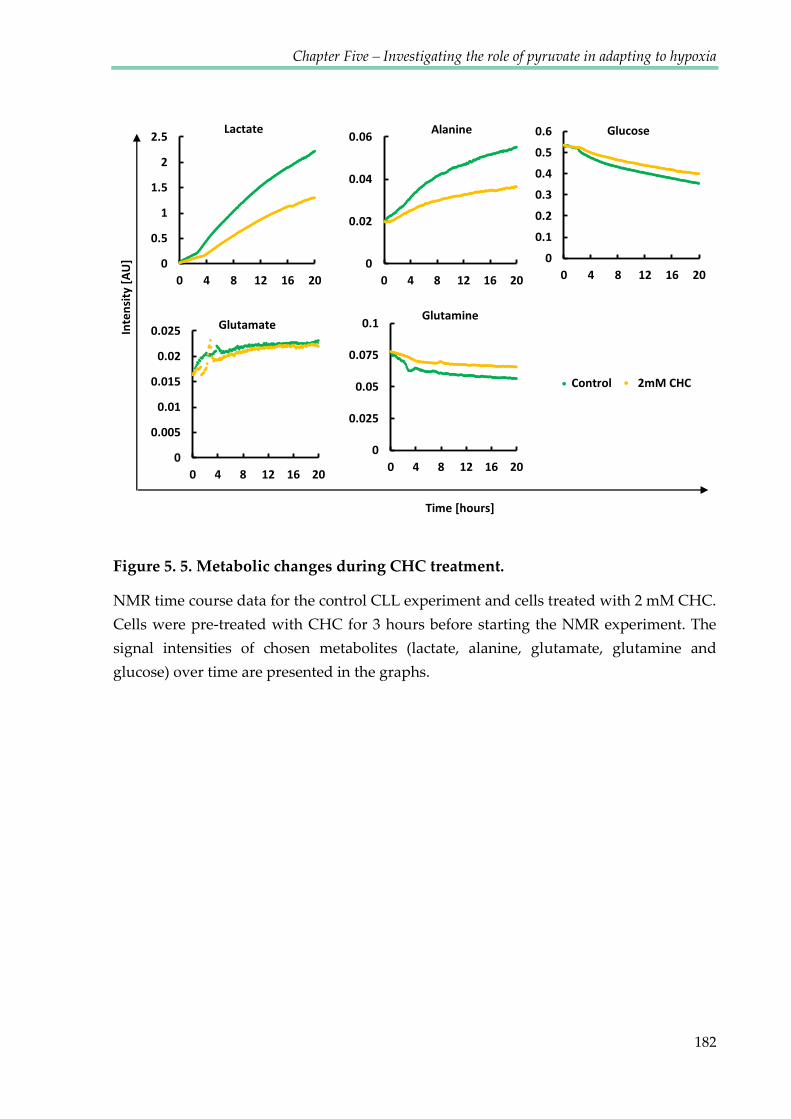
Chapter Five – Investigating the role of pyruvate in adapting to hypoxia
182
Figure 5. 5. Metabolic changes during CHC treatment.
NMR time course data for the control CLL experiment and cells treated with 2 mM CHC.
Cells were pre-treated with CHC for 3 hours before starting the NMR experiment. The
signal intensities of chosen metabolites (lactate, alanine, glutamate, glutamine and
glucose) over time are presented in the graphs.
0
0.5
1
1.5
2
2.5
0 4 8 12 16 20
Lactate
0
0.02
0.04
0.06
0 4 8 12 16 20
Alanine
0
0.005
0.01
0.015
0.02
0.025
0 4 8 12 16 20
Glutamate
0
0.025
0.05
0.075
0.1
0 4 8 12 16 20
Glutamine
0
0.1
0.2
0.3
0.4
0.5
0.6
0 4 8 12 16 20
Glucose
Time [hours]
Inte
nsi
ty [
AU
]
Control 2mM CHC
Chapter Five – Investigating the role of pyruvate in adapting to hypoxia
183
5.2.5 Methyl pyruvate does not rescue CLL cells from CHC.
It was observed that CHC also had an effect on the viability of CLL cells in
oxygenated conditions. As MCT1 is not a pyruvate-specific transporter, an
investigation was conducted to determine whether the toxicity of CHC was solely a
consequence of pyruvate transport inhibition. CLL cells were supplemented with 2
mM methyl pyruvate before CHC treatment. Methyl pyruvate is a permeable
derivative of pyruvate entering cells through the cell membrane without the need for
a specific transporter. In this experiment, if cell viability decreased as a result of
blocked extracellular pyruvate uptake through MCT1, a decrease of apoptosis after
supplementing cells with methyl pyruvate would be seen. However, addition of
methyl pyruvate did not rescue cells from apoptosis caused by CHC, suggesting that
blocked pyruvate transport was not the sole cause of cell death (see figure 5.6).
Interestingly, ROS levels were significantly decreased in cells supplemented with
methyl pyruvate, supporting the hypothesis that CLL cells take up the extracellular
pyruvate in order to use it as an anti-ROS defence. In contrast, levels of
mitochondrial ROS – mitochondrial superoxide (mitosox) – did not decrease when
membrane permeable methyl pyruvate was added. It is possible that methyl
pyruvate is able to cross both cellular and mitochondrial membranes, therefore the
absence of mitosox decreases suggest that methyl pyruvate must have been

Chapter Five – Investigating the role of pyruvate in adapting to hypoxia
184
demethylated or degraded in some other way, preventing its entrance into the
mitochondria.
The reduced viability of CLL cells after CHC treatment may also have been a
consequence of lactate build up inside cells, reducing the intracellular pH.
Chapter Five – Investigating the role of pyruvate in adapting to hypoxia
185
Figure 5. 6. Methyl pyruvate does not rescue cells from CHC induced apoptosis.
A) Methyl pyruvate did not rescue cells from CHC induced apoptosis. B) Methyl
pyruvate decreased ROS in CLL cells treated with CHC. C) Methyl pyruvate increased
mitosox in CLL cells treated with CHC. Data are mean of n=3 ± SEM, *p < 0.05 by
student’s t-test for paired data.
0
100
200
300
400
500
600
700
Control 2mMMethyl
Pyruvate
2mM CHC MetP+2mMCHC
5mM CHC MetP+5mMCHC
Ge
om
etr
ic m
ean
[A
U]
0%
20%
40%
60%
80%
100%
Control 2mMMethyl
Pyruvate
2mM CHC MetP+2mMCHC
5mM CHC MetP+5mMCHC
An
ne
xin
V -
0
2
4
6
8
10
12
Control 2mMMethyl
Pyruvate
2mM CHC MetP+2mMCHC
5mM CHC MetP+5mMCHC
Ge
om
etr
ic m
ean
[A
U]
A
B *
*
Viability
ROS
C Mitosox *
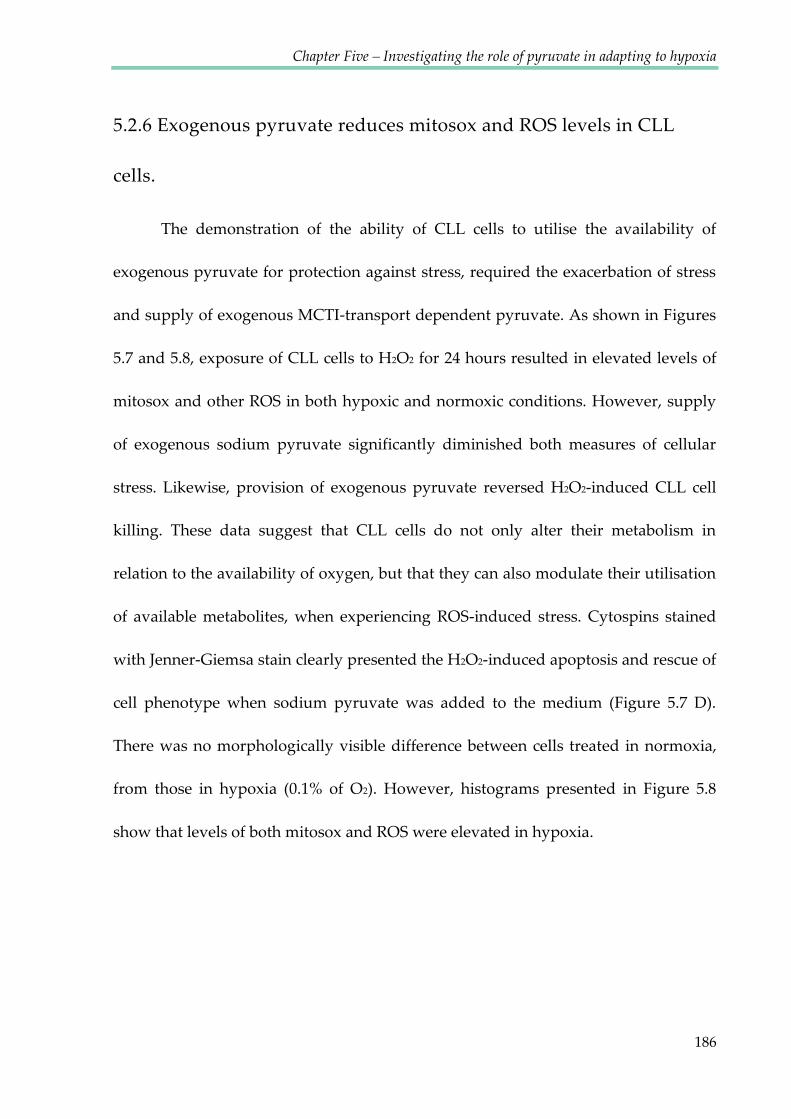
Chapter Five – Investigating the role of pyruvate in adapting to hypoxia
186
5.2.6 Exogenous pyruvate reduces mitosox and ROS levels in CLL
cells.
The demonstration of the ability of CLL cells to utilise the availability of
exogenous pyruvate for protection against stress, required the exacerbation of stress
and supply of exogenous MCTI-transport dependent pyruvate. As shown in Figures
5.7 and 5.8, exposure of CLL cells to H2O2 for 24 hours resulted in elevated levels of
mitosox and other ROS in both hypoxic and normoxic conditions. However, supply
of exogenous sodium pyruvate significantly diminished both measures of cellular
stress. Likewise, provision of exogenous pyruvate reversed H2O2-induced CLL cell
killing. These data suggest that CLL cells do not only alter their metabolism in
relation to the availability of oxygen, but that they can also modulate their utilisation
of available metabolites, when experiencing ROS-induced stress. Cytospins stained
with Jenner-Giemsa stain clearly presented the H2O2-induced apoptosis and rescue of
cell phenotype when sodium pyruvate was added to the medium (Figure 5.7 D).
There was no morphologically visible difference between cells treated in normoxia,
from those in hypoxia (0.1% of O2). However, histograms presented in Figure 5.8
show that levels of both mitosox and ROS were elevated in hypoxia.

Chapter Five – Investigating the role of pyruvate in adapting to hypoxia
187
Figure 5. 7. Exogenous pyruvate reduces mitosox and ROS levels in CLL cells.
CLL cells were incubated for 24 hours with H2O2 and Na pyruvate in normoxia or
hypoxia (0.1% O2) prior to harvesting, transferring to the FACS tube, washing and
incubating with A) MitoSOX for 10 minutes, B) H2DCFDA for 40 minutes or C)
AnnexinV/PI for 15 minutes and analysed by FC. Data are the mean ± SEM from n=5
patients; *p < 0.05 by student’s t-test for paired data. D) Cytospins of CLL cells from each
treatment stained with Jenner-Giemsa.
- + - + - + - +
- - + + - - + + H2O2
Na Pyruvate
0
20
40
60
80
100M
ito
SOX
po
siti
ve [
%]
Mitosox
0
10
20
30
40
DC
FDA
po
siti
ve [
%]
ROS
- + - + - + - +
- - + + - - + + H2O2
Na Pyruvate
0
20
40
60
80
100
An
ne
xin
V -
[%
]
Viability
- + - + - + - +
- - + + - - + + H2O2
Na Pyruvate
* *
A
B
C
*
D Normoxia
Hypoxia
Control H2O2
Na Pyruvate H2O2+ Na Pyruvate
Control H2O2
Na Pyruvate H2O2+ Na Pyruvate
Normoxia Hypoxia
* *
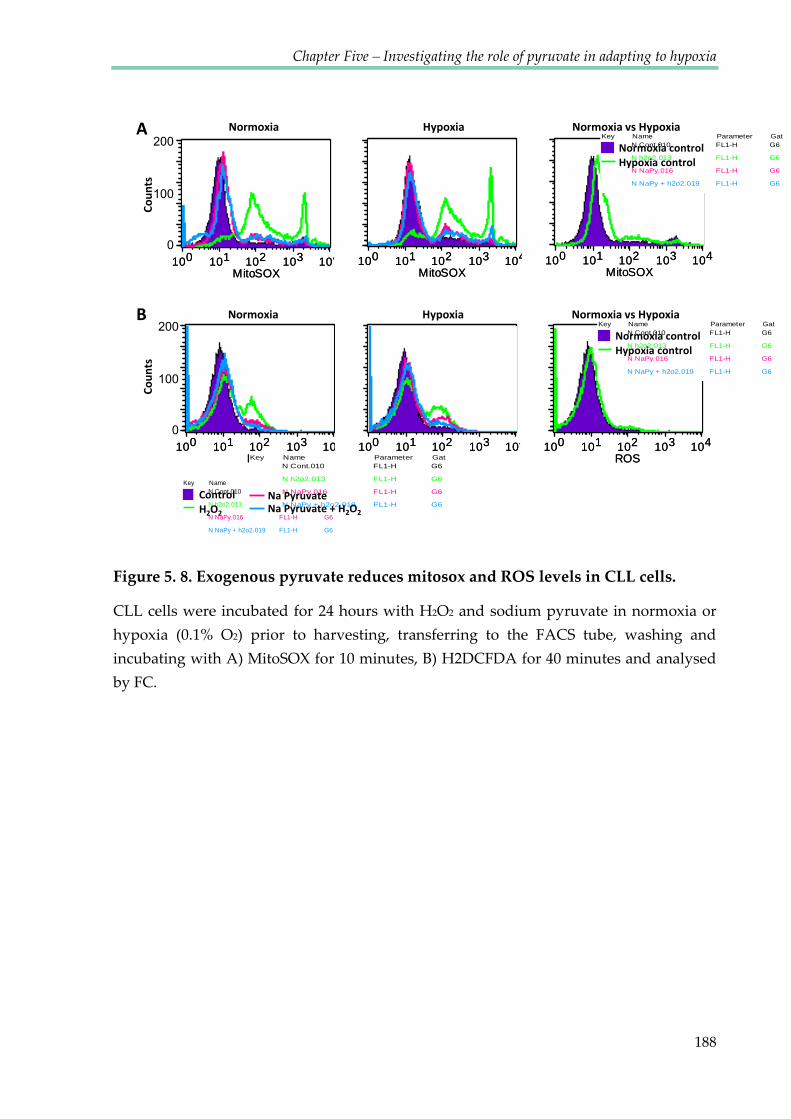
Chapter Five – Investigating the role of pyruvate in adapting to hypoxia
188
Figure 5. 8. Exogenous pyruvate reduces mitosox and ROS levels in CLL cells.
CLL cells were incubated for 24 hours with H2O2 and sodium pyruvate in normoxia or
hypoxia (0.1% O2) prior to harvesting, transferring to the FACS tube, washing and
incubating with A) MitoSOX for 10 minutes, B) H2DCFDA for 40 minutes and analysed
by FC.
100 101 102 103 104
ROS100 101 102 103 104
ROS100 101 102 103 104
ROS100 101 102 103 104
ROS100 101 102 103 104
ROS100 101 102 103 104
ROS
100 101 102 103 104
MitoSOX100 101 102 103 104
MitoSOX100 101 102 103 104
MitoSOX100 101 102 103 104
MitoSOX100 101 102 103 104
MitoSOX100 101 102 103 104
MitoSOX
200
100
0
200
100
0
Key Name Parameter Gat
N Cont.010 FL1-H G6
N h2o2.013 FL1-H G6
N NaPy.016 FL1-H G6
N NaPy + h2o2.019 FL1-H G6
Control H2O2
Key Name Parameter Gat
N Cont.010 FL1-H G6
N h2o2.013 FL1-H G6
N NaPy.016 FL1-H G6
N NaPy + h2o2.019 FL1-H G6
Normoxia control Hypoxia control
Key Name Parameter Gat
N Cont.010 FL1-H G6
N h2o2.013 FL1-H G6
N NaPy.016 FL1-H G6
N NaPy + h2o2.019 FL1-H G6
Normoxia control Hypoxia control
Co
un
ts
Co
un
ts
Normoxia Hypoxia Normoxia vs Hypoxia
Key Name Parameter Gat
N Cont.010 FL1-H G6
N h2o2.013 FL1-H G6
N NaPy.016 FL1-H G6
N NaPy + h2o2.019 FL1-H G6Na Pyruvate + H2O2
Na Pyruvate
A
B Normoxia Hypoxia Normoxia vs Hypoxia

Chapter Five – Investigating the role of pyruvate in adapting to hypoxia
189
5.2.7 Keto-enol tautomerism of pyruvate
Pyruvate can appear in one of two tautomer forms depending on the pH. The
pyruvate keto ion has two C=O double bonds which are conjugated (see figure 5.9
A). The enol form tautomer of the pyruvate ion has one C=C double bond and a C=O
group which is also conjugated. Unfortunately, metabolomics NMR databases such
as HMDB do not provide the information about the keto tautomer and present only
one peak in the pyruvate spectrum (at 2.46 ppm) corresponding to the enol form,
described as a keto form. Using the NMR time course setup as described previously,
a set of two 1D-1H 13C decoupled NMR spectra of CLL cells enriched with 5 mM [2,3-
13C]pyruvate was recorded. The acquired spectrum was edited in order to contain
only signals originating from protons bound to 13C, allowing for the observation of
clearly identifiable peaks corresponding to keto and enol forms, without the
background noise of other peaks (Figure 5.10). Using the intensities of pyruvate
peaks, it was possible to calculate changes in the ratio of keto : enol forms throughout
the time course. pH changes were calculated using the histidine peak (as shown in
chapter 3.2.7) from spectra containing NMR signals from all protons in the sample.
From these, the correlation between the tautomer changes and decreasing pH were
described. During 19 hours of the time course, pH changed from 7.79 to 6.33, while
the enol form of the protons decreased from 89.4% to 86.4% and the keto form
increased from 10.6% to 13.6% (Figure 5.9 and 5.10). Although there was a strong

Chapter Five – Investigating the role of pyruvate in adapting to hypoxia
190
correlation between pH changes and tautomerisation and pH changed substantially
for 1.46 units, the 3% change in the ratio of tautomers did not have an impact on the
metabolic interpretation of the pyruvate kinetic data shown previously.
Nevertheless, it is important to be aware of the possible tautomer balances while
interpreting NMR spectra.
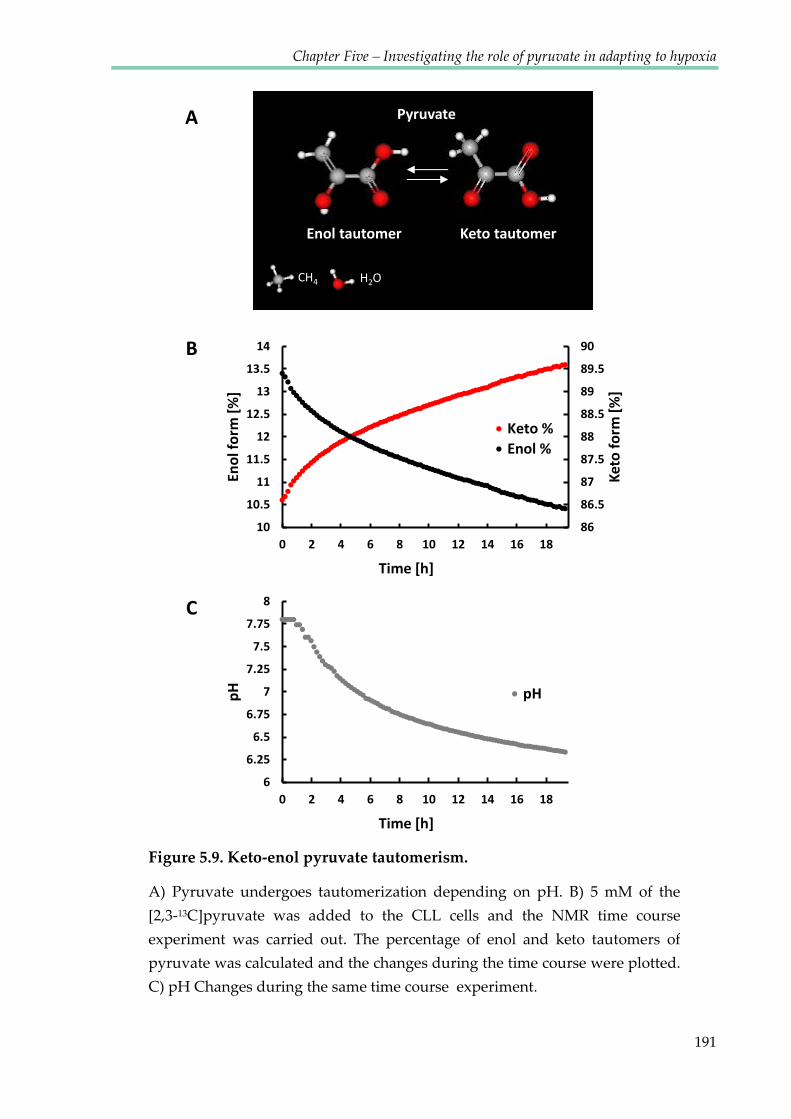
Chapter Five – Investigating the role of pyruvate in adapting to hypoxia
191
86
86.5
87
87.5
88
88.5
89
89.5
90
10
10.5
11
11.5
12
12.5
13
13.5
14
0 2 4 6 8 10 12 14 16 18
Ket
o f
orm
[%
]
Eno
l fo
rm [
%]
Time [h]
Keto %
Enol %
6
6.25
6.5
6.75
7
7.25
7.5
7.75
8
0 2 4 6 8 10 12 14 16 18
pH
Time [h]
pH
Enol tautomer Keto tautomer
Pyruvate
CH4 H2O
B
C
A
Figure 5.9. Keto-enol pyruvate tautomerism.
A) Pyruvate undergoes tautomerization depending on pH. B) 5 mM of the
[2,3-13C]pyruvate was added to the CLL cells and the NMR time course
experiment was carried out. The percentage of enol and keto tautomers of
pyruvate was calculated and the changes during the time course were plotted.
C) pH Changes during the same time course experiment.
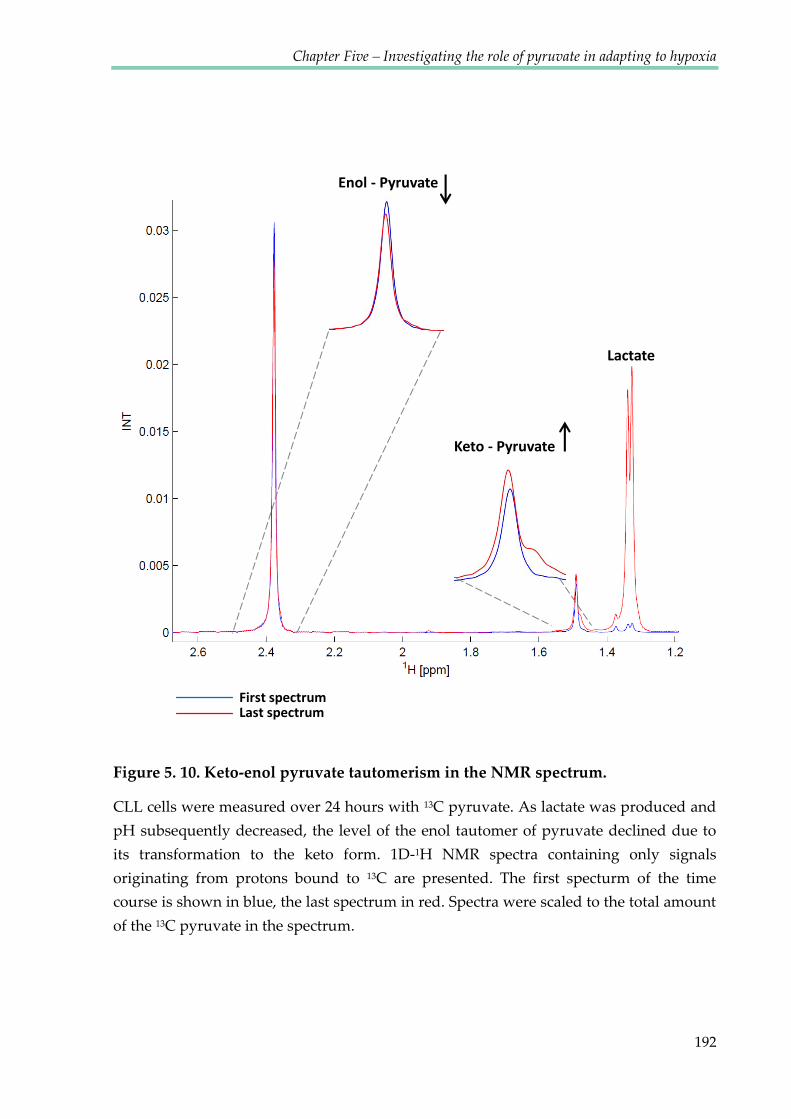
Chapter Five – Investigating the role of pyruvate in adapting to hypoxia
192
Figure 5. 10. Keto-enol pyruvate tautomerism in the NMR spectrum.
CLL cells were measured over 24 hours with 13C pyruvate. As lactate was produced and
pH subsequently decreased, the level of the enol tautomer of pyruvate declined due to
its transformation to the keto form. 1D-1H NMR spectra containing only signals
originating from protons bound to 13C are presented. The first specturm of the time
course is shown in blue, the last spectrum in red. Spectra were scaled to the total amount
of the 13C pyruvate in the spectrum.
Keto - Pyruvate
Enol - Pyruvate
Lactate
First spectrum Last spectrum
Chapter Five – Investigating the role of pyruvate in adapting to hypoxia
193
5.3 DISCUSSION
One of the difficulties of accurate assignment and quantification of metabolite
NMR spectra arises from the problem of chemical shift degeneracy of individual
metabolites. This chapter presents solutions to overcome this obstacle and to extract
the relevant data from overlapping signals. The focus of the investigation was the
methyl resonance of pyruvate at 2.46 ppm at pH 7. Keto-enol tautomerisation of
pyruvate at acidic pH, with a related increase in the proportion of the enol form, at
1.47 ppm in the 1H NMR spectrum, was observed. This has been taken into account
for the analysis of the real-time changes in the NMR spectra with changing pH.
Using the Chenomx software, the precise quantification of pyruvate
concentrations was possible from overlapping signals and signal multiplets, by
stimulating spectra and subtracting glutamate resonances. The data produced
showed that primary CLL cells secrete pyruvate while in normoxia and take it up
after approximately 2 hours of incubation in hypoxic conditions. Export of pyruvate
by CLL cells has previously been reported in studies detecting increased serum
pyruvate in CLL patients when compared to healthy donors (MacIntyre, Jimenez et
al. 2010). One of the proposed explanations for the elevated pyruvate level in
MacIntyre’s study (MacIntyre, Jimenez et al. 2010) is a deficiency in thiamine, which
in its physiologically active form - thiamine pyrophosphate- acts as a coenzyme in
pyruvate decarboxylation (Seligmann, Levi et al. 2001). Although thiamine deficiency
Chapter Five – Investigating the role of pyruvate in adapting to hypoxia
194
has been reported in CLL patients, it is unlikely that CLL cells used in the present in
vitro investigation suffered from lack of thiamine, as RPMI medium contains 1 mg/l
of thiamine hydrochloride and cells were suspended in fresh medium for each NMR
time course experiment.
It has also been shown that human fibroblasts, as well as breast
adenocarcinoma cell lines, secrete pyruvate when incubated in pyruvate-free
medium (O'Donnell-Tormey, Nathan et al. 1987). This pyruvate secretion was
attributed to protection from ROS. Although it is surprising that primary cancer cells
divert a substantial portion of their potential energy supply by export of pyruvate,
there is an obvious advantage for cells in scavenging exogenous H2O2 before it
reaches the cell. Under the experimental conditions of the present study, the oxygen
level decreased from the 0 time point, therefore the level of ROS may have been
gradually rising. After about 100 minutes of hypoxia, intracellular ROS must have
been substantially increased, inducing the uptake of pyruvate to scavenge ROS and
mitosox inside cells.
Considering that the pyruvate NMR signal observed in this experiment
reflected only the extracellular pyruvate, a subsequent investigation was conducted
to determine whether the metabolite was indeed taken up and used by cells (and not
degraded or used in some biochemical reaction outside cells). A 1H and proton
filtered 13C 1D spectra approach was used to detect 13C-incorporation from

Chapter Five – Investigating the role of pyruvate in adapting to hypoxia
195
extracellular pyruvate into lactate and alanine in real time. The pulse sequence was
recently developed in our NMR group and real time experiments with CLL cells
were the first time course spectra obtained using this method. During the
optimisation of the method keto-enol tautomerism of pyruvate was observed,
although it did not significantly influence the overall intensities within the pH range
observed for the samples used (max 3%).
Pyruvate uptake has been reported as an important factor that correlates with
cancer invasiveness. It has been shown that more invasive ovarian cancer cells
exhibit higher pyruvate uptake than their less invasive counterparts (Caneba,
Bellance et al. 2012). Moreover, pyruvate had an effect on the migration ability of
highly invasive ovarian cancer cells. Pyruvate uptake has therefore been suggested to
be potentially used in cancer diagnostics. The possible suggested explanation of this
phenomenon was that pyruvate may fuel the TCA cycle and may play a role in the
increased oxygen consumption rate. A possible mechanism is that pyruvate can be
converted into glycerate 2-phosphate in the glycolysis pathway. Pyruvate and serine
are taken up to create hydroxypyruvate (in the transamination reaction), which is
then converted to glycerate via NADPH and further into glycerate 2-phosphate
through conversion of ADP into ATP (Mazurek 2011). In this way, pyruvate may be
another metabolite consumed during glycolysis.
Chapter Five – Investigating the role of pyruvate in adapting to hypoxia
196
Although pyruvate uptake in CLL cells in the time course experiments
presented here was driven by hypoxia and considering that hypoxia induces MCT1
expression (De Saedeleer, Porporato et al. 2013), the data shown above demonstrates
that pyruvate uptake is independent of HIF-1α activation and is not affected by
chetomin treatment. In order to disrupt pyruvate import, the monocarboxylate
transporter 1 (MCT1) inhibitor CHC was used. Blockage of this transporter resulted
in the complete inhibition of pyruvate uptake and partial decrease of lactate export.
As both lactate and pyruvate are transported by MCT1, it is not possible to
specifically inhibit pyruvate transport. MCT1 treatment resulted in dose dependent
apoptosis which was not the sole cause of the blockage of pyruvate uptake, as the
addition of the membrane soluble pyruvate derivative - methyl pyruvate did not
rescue cells. Although methyl pyruvate did not increase cell viability, it decreased
the ROS levels significantly. Importantly, lactate export was not completely blocked
by CHC, therefore the mechanism of CLL cell apoptosis resulting from MCT1
inhibition may be more complex than just the inhibition of lactate and pyruvate
transport. Although the metabolic consequences of MCT1 inhibitors are not yet
completely clear and little is known about its regulation by typical parameters of the
tumour microenvironment (Asada, Miyamoto et al. 2003; Kennedy and Dewhirst
2010; Halestrap and Wilson 2012), the first MCT1 inhibitor is currently undergoing
clinical trials for treatment of various types of cancer (Porporato, Dhup et al. 2011;
Polanski, Hodgkinson et al. 2014).

Chapter Five – Investigating the role of pyruvate in adapting to hypoxia
197
Finally the current investigation revealed that the addition of extracellular
sodium pyruvate to CLL cells treated with H2O2 resulted in decreased ROS and
mitosox levels and helped to rescue cells from apoptotic death. Therefore we sustain
the hypothesis that CLL cells take up extracellular pyruvate in hypoxia for ROS
protection. Interestingly, it was shown that ROS is responsible for the re-oxygenation
damage of endothelial cells (Dhar-Mascareno, Carcamo et al. 2005) which also
suggests that CLL cells may protect themselves from apoptosis after entering the
oxygenated environment, by storing the ROS scavenging pyruvate.
Recently, additional studies have emphasised the importance of the ability of
Chronic Lymphocytic Leukaemia in fighting ROS. Another proposed adaptation of
CLL cells to intrinsic oxidative stress is the up-regulation of the stress-responsive
heme-oxygenase-1 (HO-1). New data indicates that HO-1 is also, involved in
promoting mitochondrial biogenesis beyond its function as an antioxidant. Thus
ROS, adaptation to ROS and mitochondrial biogenesis appear to form a self-
amplifying feedback loop in CLL-cells. Taking advantage of such altered metabolism,
it may be possible to selectively target CLL cells. Targeting the respiratory chain (by
blocking the mitochondrial F1F0-ATPase) and promoting mitochondrial ROS, the
benzodiazepine derivative PK11195 has recently been shown to induce cell death in
CLL cells (Jitschin, Hofmann et al. 2014). These findings, together with the work

Chapter Five – Investigating the role of pyruvate in adapting to hypoxia
198
presented in this chapter, suggest that bioenergetics and redox characteristics could
be therapeutically exploited for CLL treatment.

Chapter VI
Metabolic Flux Analysis of
CLL cells in different
oxygen environments
Chapter Six – Metabolic Flux Analysis of CLL cells in different oxygen environments
200
6.1. INTRODUCTION
Metabolic Flux Analysis (MFA) involving 13C-labelled tracers requires a large
number of cells, as the sensitivity of NMR to detect 12C carbon is 4 times lower than
that of protons due to the difference in the gyromagnetic ratio of 13C nuclei compared
to 1H. The signal intensity in NMR spectra is a product of metabolite concentration,
percentage of 13C incorporation and several physical properties including the
gyromagnetic ration and relaxation rates, and for proton observed HSQC spectra also
heteronuclear scalar coupling constants between 1H and 13C. For this reason, an
additional unlabelled cell sample is needed as a control for investigations of 13C
incorporation in tracer based analyses (13C natural abundance is 1.07%). Therefore in
standard procedures, the number of cells required is higher. Chronic lymphocytic
leukaemia is clinically extremely heterogeneous and some patients are characterised
by very high white blood cell counts, which indicate that their blood samples may
provide a lot of biological material. One purpose of this study was to investigate if B-
cells purified from 14 ml of peripheral blood from a CLL patient would provide
enough biological material to perform good quality MFA. To date, this is the first
such study performed on primary human CLL cells.
So far, investigation of the metabolism of CLL cells presented in this thesis has
mainly been based on the examination of extracellular metabolites being taken up
from or secreted into the media. This chapter describes in greater depth the analysis
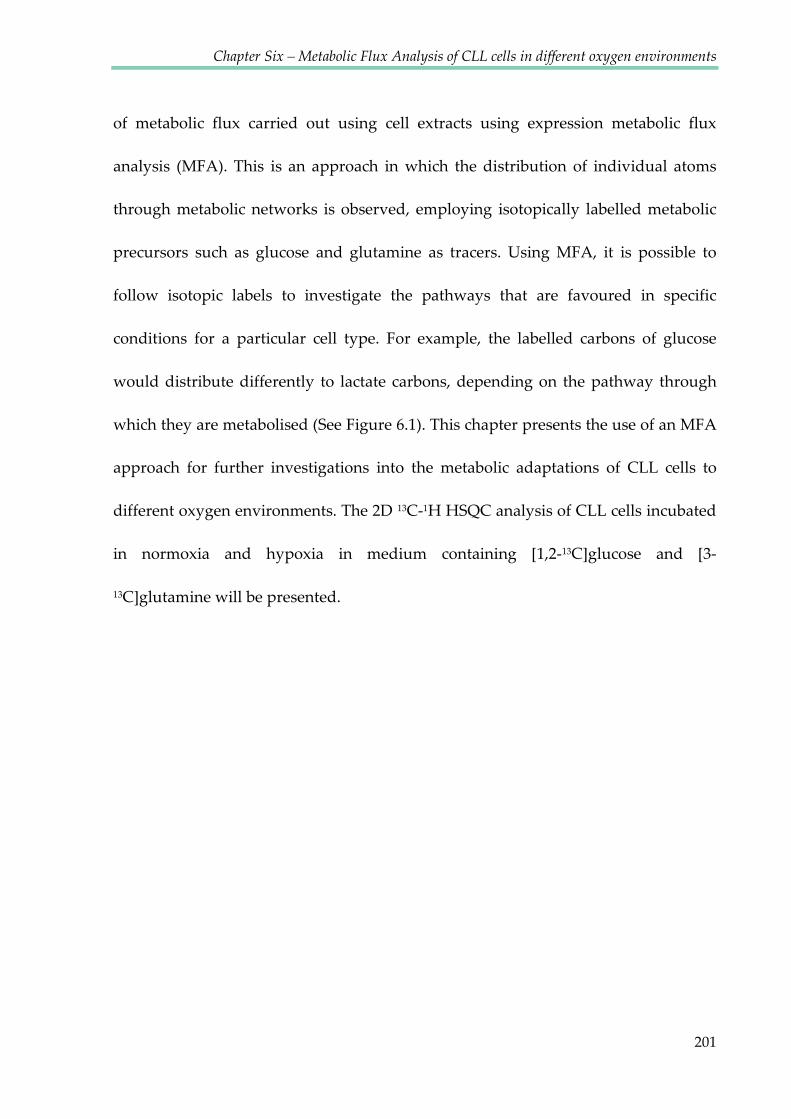
Chapter Six – Metabolic Flux Analysis of CLL cells in different oxygen environments
201
of metabolic flux carried out using cell extracts using expression metabolic flux
analysis (MFA). This is an approach in which the distribution of individual atoms
through metabolic networks is observed, employing isotopically labelled metabolic
precursors such as glucose and glutamine as tracers. Using MFA, it is possible to
follow isotopic labels to investigate the pathways that are favoured in specific
conditions for a particular cell type. For example, the labelled carbons of glucose
would distribute differently to lactate carbons, depending on the pathway through
which they are metabolised (See Figure 6.1). This chapter presents the use of an MFA
approach for further investigations into the metabolic adaptations of CLL cells to
different oxygen environments. The 2D 13C-1H HSQC analysis of CLL cells incubated
in normoxia and hypoxia in medium containing [1,2-13C]glucose and [3-
13C]glutamine will be presented.
Chapter Six – Metabolic Flux Analysis of CLL cells in different oxygen environments
202
Figure 6. 1. 13C labelled glucose flux to lactate through glycolysis and PPP.
The distribution of labelled carbons differs depending on whether glucose is metabolised
through glycolysis or through the pentose phosphate pathway.
[1,2-13C]Glucose
x3 2NADPH + CO2
Pyruvate
Pentose Phosphate Pathway
Glycolysis
Lactate 13C labelling from Glycolysis
Lactate 13C labelling from PPP
Lactate x3 x3
x1 x1 x3
x3
Chapter Six – Metabolic Flux Analysis of CLL cells in different oxygen environments
203
When multiple neighbouring carbon atoms are labelled, complex multiplet
patterns of NMR signals arise (Figure 6.2), and the degree of the label incorporation
into the adjacent carbons can be interpreted. In the case of one-dimensional 13C-
observed spectra, these multiplets are directly observed in the spectra. For this, the
1H-13C coupling must be removed using a decoupling sequence. The disadvantage of
directly observed 13C NMR spectra is lower sensitivity. Two-dimensional 1H-13C-
HSQC spectra, offer a significantly improved sensitivity over 13C-observed spectra by
starting and ending on 1H. The second dimension (ω1) in 1H-13C-HSQC spectra
matches that of 13C-observed spectra for 13C atoms bound to protons, whereas the
observed dimension (ω2) represents an 1H spectrum showing only resonances of
protons bound to 13C. HSQC spectra require large numbers of increments (at least
4096) in order to be able to observe the 13C-13C scalar couplings in the incremented
dimension, which prolongs the acquisition times to > 4 hours. This is however still
faster than acquiring 13C spectra, and provides additional spectral information
through the 1H resonances. 13C-13C scalar couplings provide valuable information
about adjacent label incorporation.

Chapter Six – Metabolic Flux Analysis of CLL cells in different oxygen environments

Chapter Six – Metabolic Flux Analysis of CLL cells in different oxygen environments

Chapter Six – Metabolic Flux Analysis of CLL cells in different oxygen environments
206
6.2 RESULTS
In order to obtain good quality spectra with a good signal-to-noise ratio,
~180x106 CLL cells had to be extracted for each sample. Cells were obtained from a
single patient (characterized by high white cell counts in blood) and individual
samples were used for a single experiment which consisted of the 6 following
conditions:
Cells incubated for 24h
in normoxia
Medium lacking
labelled tracers
Medium with
[1,2-13C]glucose
Medium with
[3-13C]glutamine
Cells incubated for 24h
in hypoxia (1% O2)
Medium lacking
labelled tracers
Medium with
[1,2-13C]glucose
Medium with
[3-13C]glutamine
Labelled tracers replaced unlabelled precursors present in the control medium at the
same concentrations.
6.2.1 [1,2-13C]glucose flux through Glycolysis and Pentose Phosphate
Pathway
Figure 6.4 presents the theoretical label distribution from glucose, when the
PPP is involved and when it is not active. Depending on the pathway, distinctly
labelled species of metabolites will be formed. After the multiple TCA cycle rounds,
the pattern combinations became very complex, as an example the label distribution
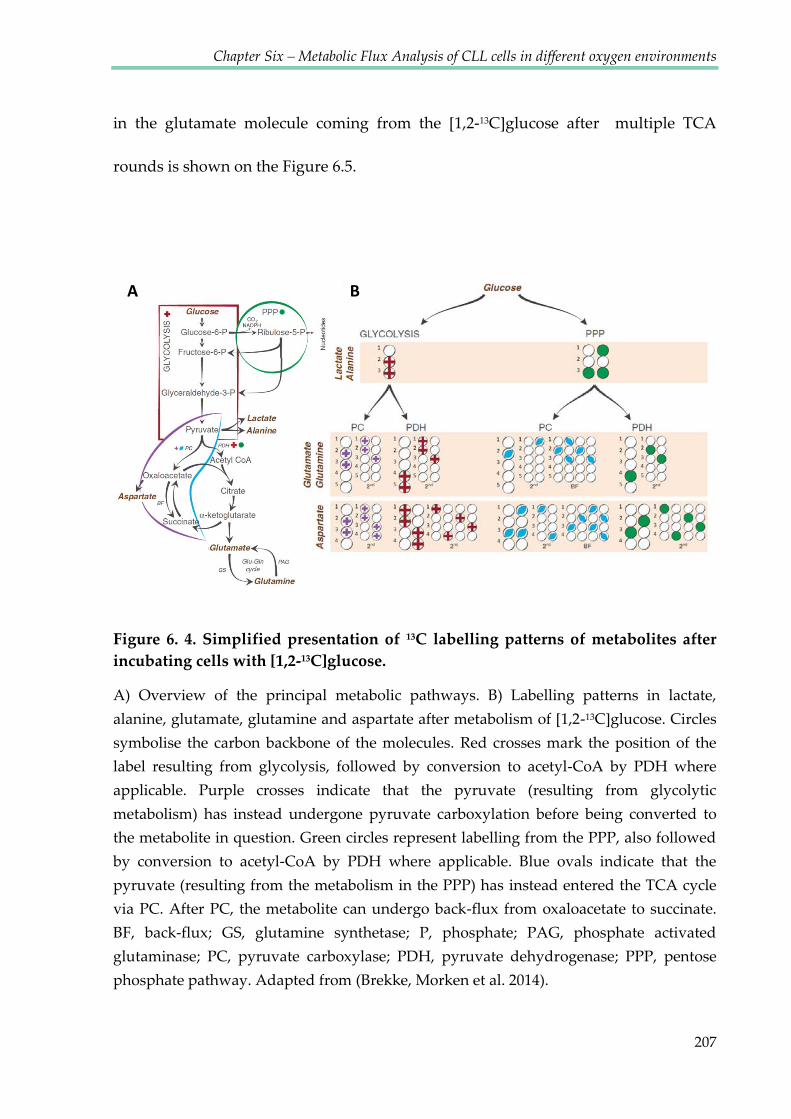
Chapter Six – Metabolic Flux Analysis of CLL cells in different oxygen environments
207
in the glutamate molecule coming from the [1,2-13C]glucose after multiple TCA
rounds is shown on the Figure 6.5.
Figure 6. 4. Simplified presentation of 13C labelling patterns of metabolites after
incubating cells with [1,2-13C]glucose.
A) Overview of the principal metabolic pathways. B) Labelling patterns in lactate,
alanine, glutamate, glutamine and aspartate after metabolism of [1,2-13C]glucose. Circles
symbolise the carbon backbone of the molecules. Red crosses mark the position of the
label resulting from glycolysis, followed by conversion to acetyl-CoA by PDH where
applicable. Purple crosses indicate that the pyruvate (resulting from glycolytic
metabolism) has instead undergone pyruvate carboxylation before being converted to
the metabolite in question. Green circles represent labelling from the PPP, also followed
by conversion to acetyl-CoA by PDH where applicable. Blue ovals indicate that the
pyruvate (resulting from the metabolism in the PPP) has instead entered the TCA cycle
via PC. After PC, the metabolite can undergo back-flux from oxaloacetate to succinate.
BF, back-flux; GS, glutamine synthetase; P, phosphate; PAG, phosphate activated
glutaminase; PC, pyruvate carboxylase; PDH, pyruvate dehydrogenase; PPP, pentose
phosphate pathway. Adapted from (Brekke, Morken et al. 2014).
BA B
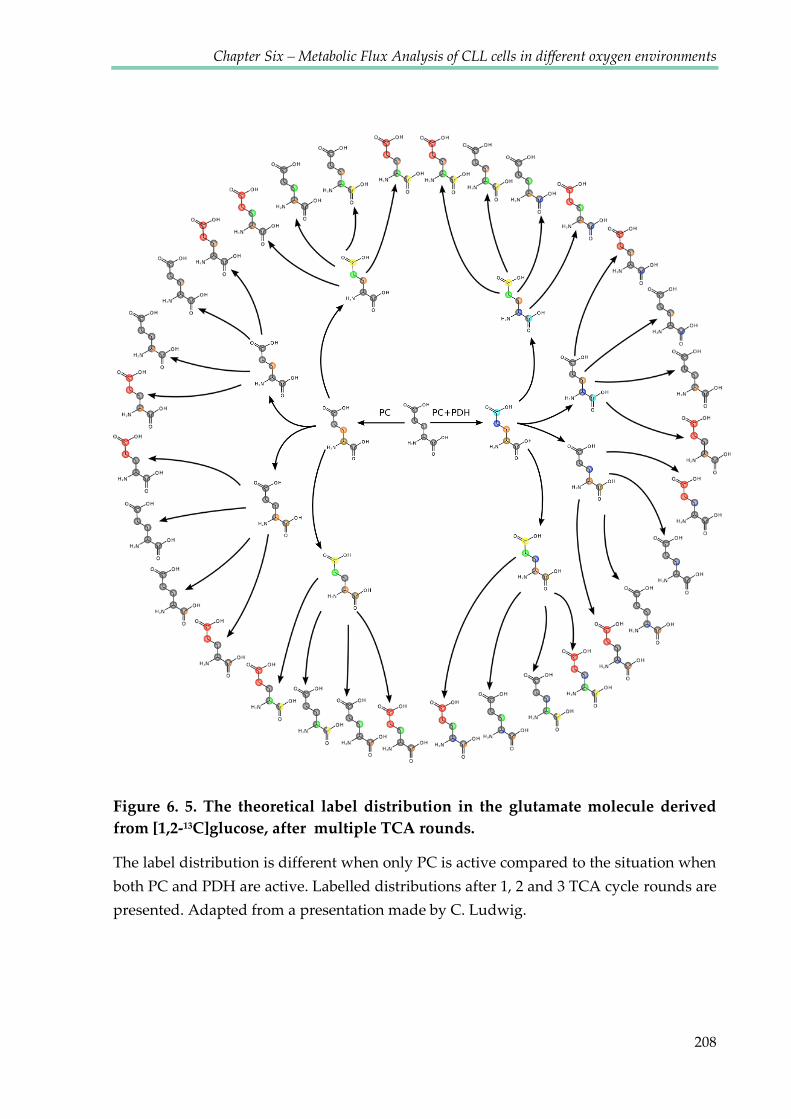
Chapter Six – Metabolic Flux Analysis of CLL cells in different oxygen environments
208
Figure 6. 5. The theoretical label distribution in the glutamate molecule derived
from [1,2-13C]glucose, after multiple TCA rounds.
The label distribution is different when only PC is active compared to the situation when
both PC and PDH are active. Labelled distributions after 1, 2 and 3 TCA cycle rounds are
presented. Adapted from a presentation made by C. Ludwig.
# TCA Cycles: 2
# TCA Cycles: 3

Chapter Six – Metabolic Flux Analysis of CLL cells in different oxygen environments
209
Figure 6.6 shows the analysis of the labelled glucose flux in normoxic
conditions in CLL cells. Carbons C-1 and C-2 were transferred from the glucose
molecule through the process of glycolysis, to pyruvate, then to lactate and finally to
alanine, with labelled carbons in positions C-2 and C-3. Moreover, in depth analysis
of the lactate and alanine line shapes revealed additional label in position C-3,
derived from glucose metabolised through the pentose phosphate pathway, leading
to lactate species labelled either in the C-3 position only, or simultaneously in
positions C-1 and C-3 (see Figures 6.1 and 6.4). 13C in position C-1 of both lactate and
alanine molecules could not be seen in proton edited HSQC NMR spectra, as they are
not protonated and both species (molecules with C-1 labelled and unlabelled) result
in the same NMR spectrum. Therefore only the visible C-3 labelled lactate and
alanine species were used as an indicator of PPP activity.
In common with the glucose flux in normoxia, in hypoxic conditions, carbon
nuclei in lactate and alanine were labelled in positions C-2 and C-3 (Figure 6.7). The
PPP activity, investigated by the multiplet analysis of C-3 in lactate and alanine, was
shown to be less pronounced in hypoxia than in normoxia (Figure 6.8). For
quantitative HSQC analysis 1D slices of HSQC spectra were evaluated using in
house built software by C. Ludwig based on the MetaboLab software (Gunther,
Ludwig et al. 2000; Ludwig and Gunther 2011) using a quantum mechanical spin
system simulation, using the pygamma library (Smith, Levante et al. 1994).
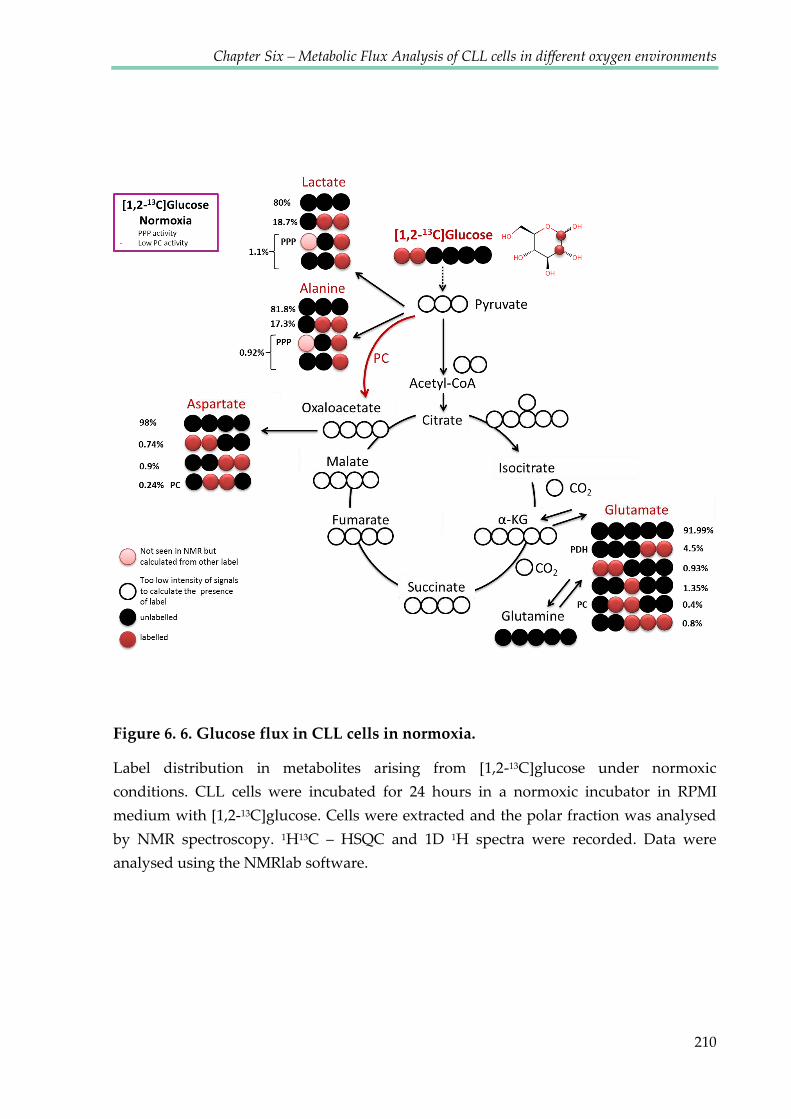
Chapter Six – Metabolic Flux Analysis of CLL cells in different oxygen environments
210
Figure 6. 6. Glucose flux in CLL cells in normoxia.
Label distribution in metabolites arising from [1,2-13C]glucose under normoxic
conditions. CLL cells were incubated for 24 hours in a normoxic incubator in RPMI
medium with [1,2-13C]glucose. Cells were extracted and the polar fraction was analysed
by NMR spectroscopy. 1H13C – HSQC and 1D 1H spectra were recorded. Data were
analysed using the NMRlab software.
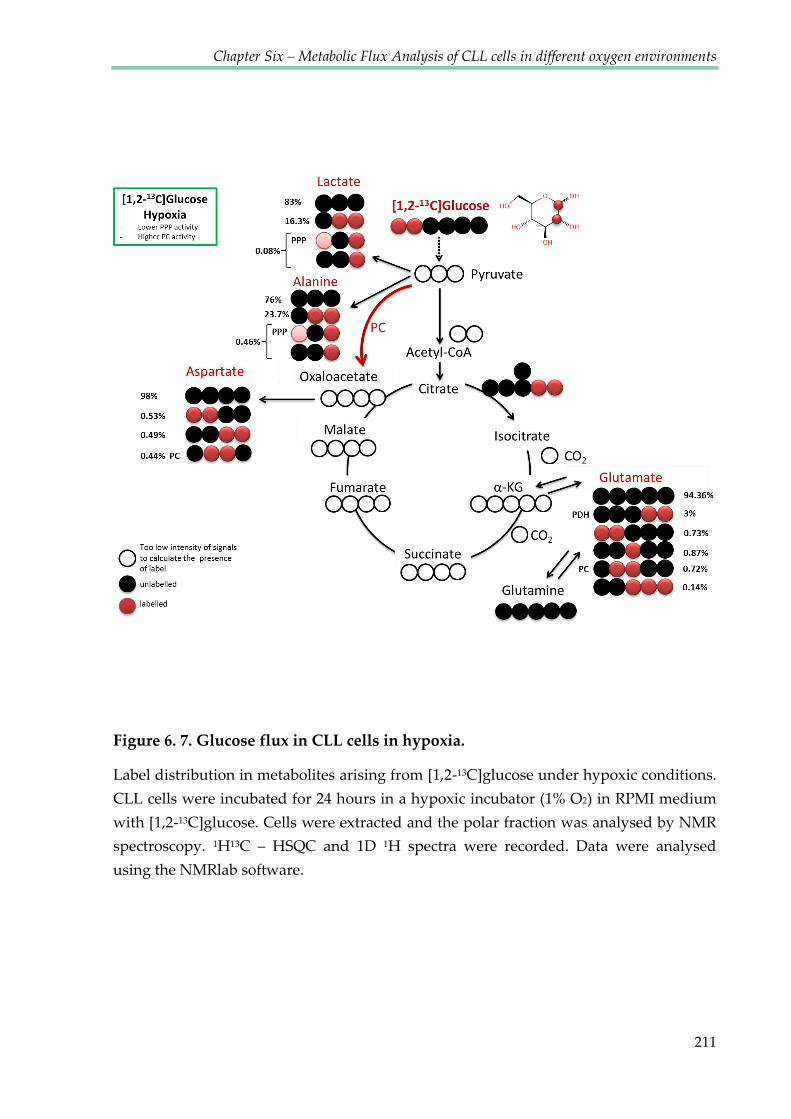
Chapter Six – Metabolic Flux Analysis of CLL cells in different oxygen environments
211
Figure 6. 7. Glucose flux in CLL cells in hypoxia.
Label distribution in metabolites arising from [1,2-13C]glucose under hypoxic conditions.
CLL cells were incubated for 24 hours in a hypoxic incubator (1% O2) in RPMI medium
with [1,2-13C]glucose. Cells were extracted and the polar fraction was analysed by NMR
spectroscopy. 1H13C – HSQC and 1D 1H spectra were recorded. Data were analysed
using the NMRlab software.
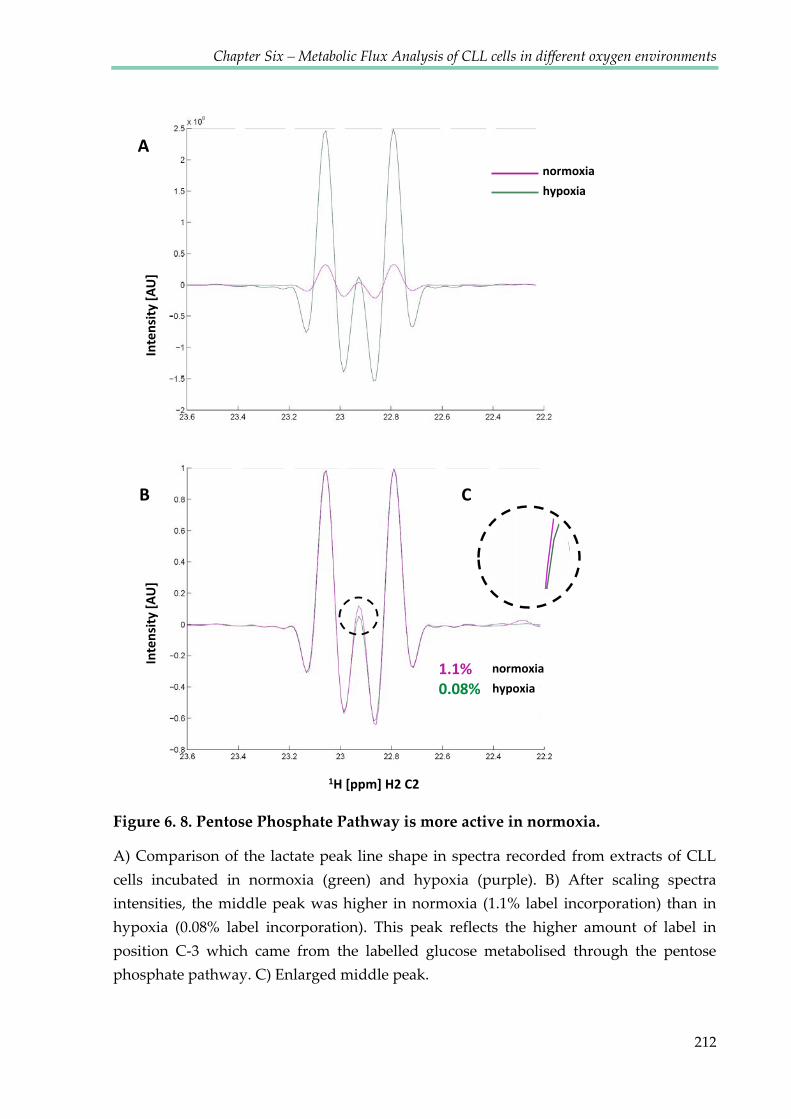
Chapter Six – Metabolic Flux Analysis of CLL cells in different oxygen environments
212
Figure 6. 8. Pentose Phosphate Pathway is more active in normoxia.
A) Comparison of the lactate peak line shape in spectra recorded from extracts of CLL
cells incubated in normoxia (green) and hypoxia (purple). B) After scaling spectra
intensities, the middle peak was higher in normoxia (1.1% label incorporation) than in
hypoxia (0.08% label incorporation). This peak reflects the higher amount of label in
position C-3 which came from the labelled glucose metabolised through the pentose
phosphate pathway. C) Enlarged middle peak.
B
Inte
nsi
ty [
AU
]
1H [ppm] H2 C2
C
normoxia
hypoxia
AIn
ten
sity
[A
U]
1.1%0.08%
normoxia
hypoxia

Chapter Six – Metabolic Flux Analysis of CLL cells in different oxygen environments
213
6.2.2 Pyruvate carboxylase is active only in hypoxic conditions
The labelling pattern of aspartate arising from [1,2-13C]glucose informs about
the entry of pyruvate into the TCA cycle. If the entry point is via pyruvate
dehydrogenase (PDH) and the TCA cycle turns entirely clockwise (Figure 6.4.), the
C-1,2 or C-3,4 positions should be labelled. For the anaplerotic pathway via pyruvate
carboxylase (anti-clockwise entry to the TCA cycle) oxaloacetate would be labelled in
position C-2,3, and consequently aspartate also in the position C-2,3 as it is directly
derived from OA. It is well-known that malate can be formed from OA with the TCA
cycle proceeding anti-clockwise, at least for these steps, in which case malate would
show the same labelling pattern as aspartate. Labelling gets more complex if the PC
product runs clockwise through the TCA cycle, but the product from PC activity and
anti-clockwise operation is always unique.
Aspartate signals were sufficiently strong to distinguish the label in positions
C-2 and C-3, but a lack of a 2JCC coupling in the 13C-dimension suggests that
neighbouring positions C-2 and C-3 were not labelled in the same molecule.
Therefore two species of labelled aspartate must have been present: [1,2-13C] and [3,4-
13C]aspartate. However, multiplet analysis of aspartate also revealed the presence of
a third species, [2,3-13C]aspartate (Figure 6.9). Comparison of J-coupling between C-2
aspartate peaks was used to distinguish labelling patterns. As the splitting value
depends on the properties of the neighbouring atom (aliphatic-aliphatic - lower
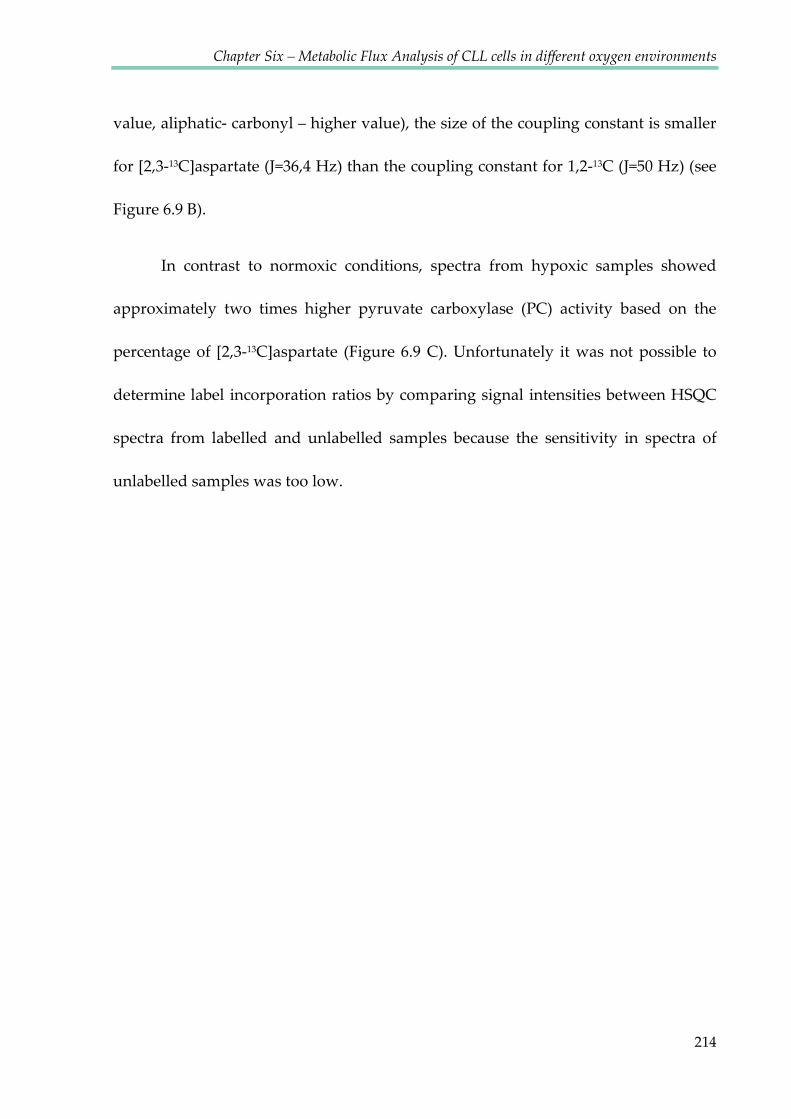
Chapter Six – Metabolic Flux Analysis of CLL cells in different oxygen environments
214
value, aliphatic- carbonyl – higher value), the size of the coupling constant is smaller
for [2,3-13C]aspartate (J=36,4 Hz) than the coupling constant for 1,2-13C (J=50 Hz) (see
Figure 6.9 B).
In contrast to normoxic conditions, spectra from hypoxic samples showed
approximately two times higher pyruvate carboxylase (PC) activity based on the
percentage of [2,3-13C]aspartate (Figure 6.9 C). Unfortunately it was not possible to
determine label incorporation ratios by comparing signal intensities between HSQC
spectra from labelled and unlabelled samples because the sensitivity in spectra of
unlabelled samples was too low.

Chapter Six – Metabolic Flux Analysis of CLL cells in different oxygen environments

Chapter Six – Metabolic Flux Analysis of CLL cells in different oxygen environments
216
Further proof of PC activity arose from the glutamate spectrum, which
suggested the presence of [2,3-13C]glutamate with approximately 0.15% label
incorporation in hypoxia but much lower incorporation under normoxic conditions.
Because the values were so low, it was difficult to quantify the label incorporation
under these circumstances. However, the line shape analysis shown in Figures 6.10
and 6.11 showed the differential line broadening due to the simultaneous presence of
[1,2-13C] and [2,3-13C]glutamate in hypoxia but not in normoxia, further confirming
higher PC activity in hypoxia. The formation of [2,3-13C]glutamate isotopomer is a
specific indicator for PC activity when [1,2-13C]glucose is used as a tracer (Brekke,
Morken et al. 2014).
Chapter Six – Metabolic Flux Analysis of CLL cells in different oxygen environments
217
Figure 6. 10. The glutamate HSQC signal proves pyruvate carboxylase activity in
CLL cells is higher in hypoxia than in normoxia.
CLL cells were incubated for 24 hours in a hypoxic incubator (1% O2) in RPMI medium
with [1,2-13C]glucose. Cells were extracted and the polar fraction was analysed by NMR
spectroscopy. 1H13C – HSQC and 1D 1H spectra were recorded. Data were analysed
using the NMRlab software. Red arrows indicate the differential line broadening due to
the simultaneous presence of [1,2-13C]glutamate and [2,3-13C]glutamate. [2,3-
13C]glutamate is derived from the pyruvate carboxylase pathway.
1H [ppm] H2 C2
13C
[pp
m]
H2
C2
normoxia
hypoxia

Chapter Six – Metabolic Flux Analysis of CLL cells in different oxygen environments
218
Figure 6. 11. A 1D 13C column from the HSQC experimental data proves pyruvate
carboxylase activity in CLL cells is higher in hypoxia than in normoxia.
CLL cells were incubated for 24 hours in a hypoxic incubator (1% O2) in RPMI medium
with [1,2-13C]glucose. Cells were extracted and the polar fraction was analysed by NMR
spectroscopy. 1H13C – HSQC and 1D 1H spectra were recorded. Data were analysed
using the NMRlab software. Red arrows indicate the differential line broadening due to
simultaneous presence of [1,2-13C]glutamate and [2,3-13C]glutamate. [2,3-13C]glutamate is
derived from the pyruvate carboxylase pathway.
normoxia
hypoxia

Chapter Six – Metabolic Flux Analysis of CLL cells in different oxygen environments
219
6.2.3 Glucose flux into the TCA cycle via PDH/PC
The majority of TCA cycle intermediates were identified with larger intensities
in the HSQC spectrum obtained from cells incubated with labelled glucose,
compared to those from the unlabelled sample, suggesting the incorporation of the
label into TCA cycle intermediates. This was the case under both, normoxic and
hypoxic conditions. However, the signal of unlabelled peaks was too low in both
cases, which meant it was not possible to accurately calculate the label incorporation
percentage.
Glutamate appeared highly abundant in HSQC spectra, therefore it was
possible to quantify its label incorporation by comparing intensities in spectra of
labelled and unlabelled cells. [4,5-13C]glutamate indicates one round of the TCA cycle
involving PDH, and 4.5% of this species was detected in normoxic samples, which
was higher than in hypoxia (3%) (Figures 6.6 and 6.7). The presence of [1,2-13C], [3-
13C] and the triple labelling [3,4,5-13C]glutamate suggests that the label from [1,2-
13C]glucose went through several rounds of TCA cycles (Figure 6.5), these species
were observed in both normoxic and hypoxic samples (data were analysed using the
spin system simulations). The higher percentages in normoxic samples, suggest
slower TCA rounds in hypoxia. On the other hand, the higher percentage of [2,3-
13C]glutamate indicates increased PC activity in hypoxia. Interestingly, higher
percentages of [1,2-13C]glutamate and [3-13C]glutamate detected in normoxic
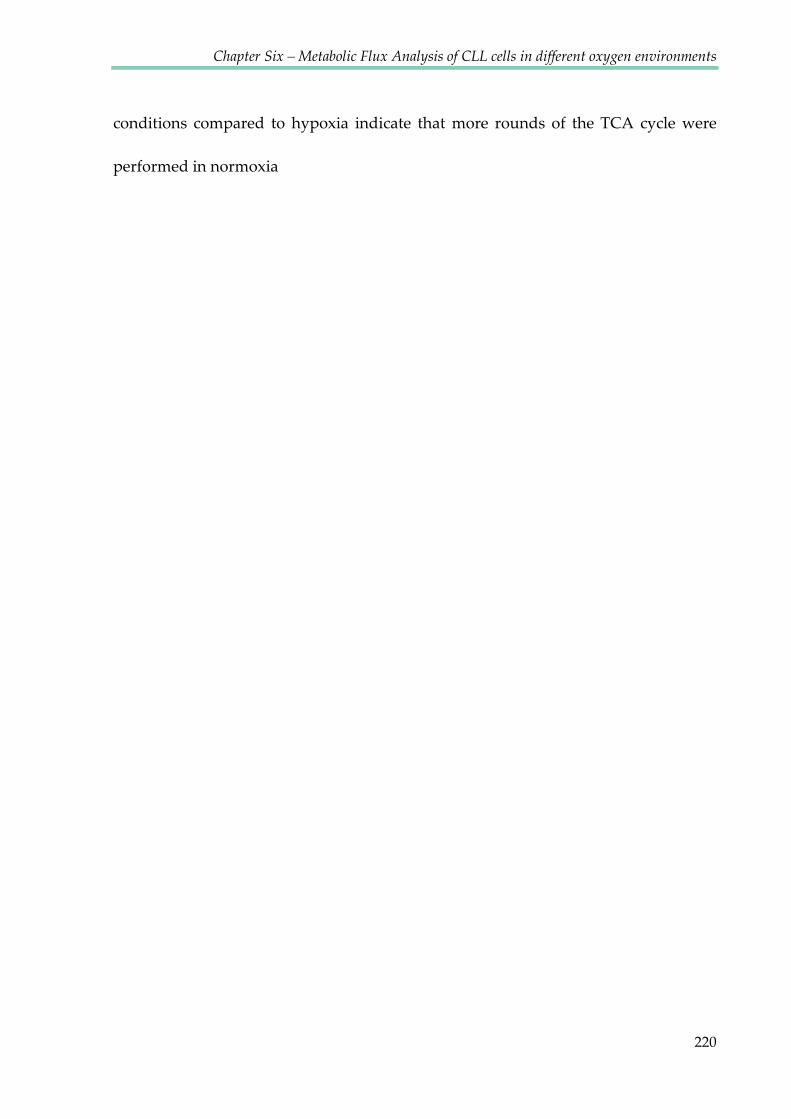
Chapter Six – Metabolic Flux Analysis of CLL cells in different oxygen environments
220
conditions compared to hypoxia indicate that more rounds of the TCA cycle were
performed in normoxia

Chapter Six – Metabolic Flux Analysis of CLL cells in different oxygen environments
221
6.2.4 13C-3-Glutamine flux
Analysis of label distributions arising from [3-13C]glutamine revealed
glutaminolysis in both normoxic and hypoxic conditions (Figures 6.12 and 6.13). The
label was detected in TCA cycle intermediates such as α-KG, succinate, fumarate,
malate, oxaloacetate and citrate as well as in aspartate (positions C-2 in some
compounds and C-3 in others). In the case of active reductive carboxylation of
glutamine, [3-13C]citrate would be labelled. However the only carbons it is possible to
detect using NMR are C-2 and C-4. Therefore the only indication of labelled C-3 can
be the splitting from C-3 to C-2. In the presented study, no splitting was observed
which may suggest that the reductive carboxylation of glutamine did not occur in
normoxia and hypoxia, or that the absolute level of label incorporation was not high
enough to detect it.
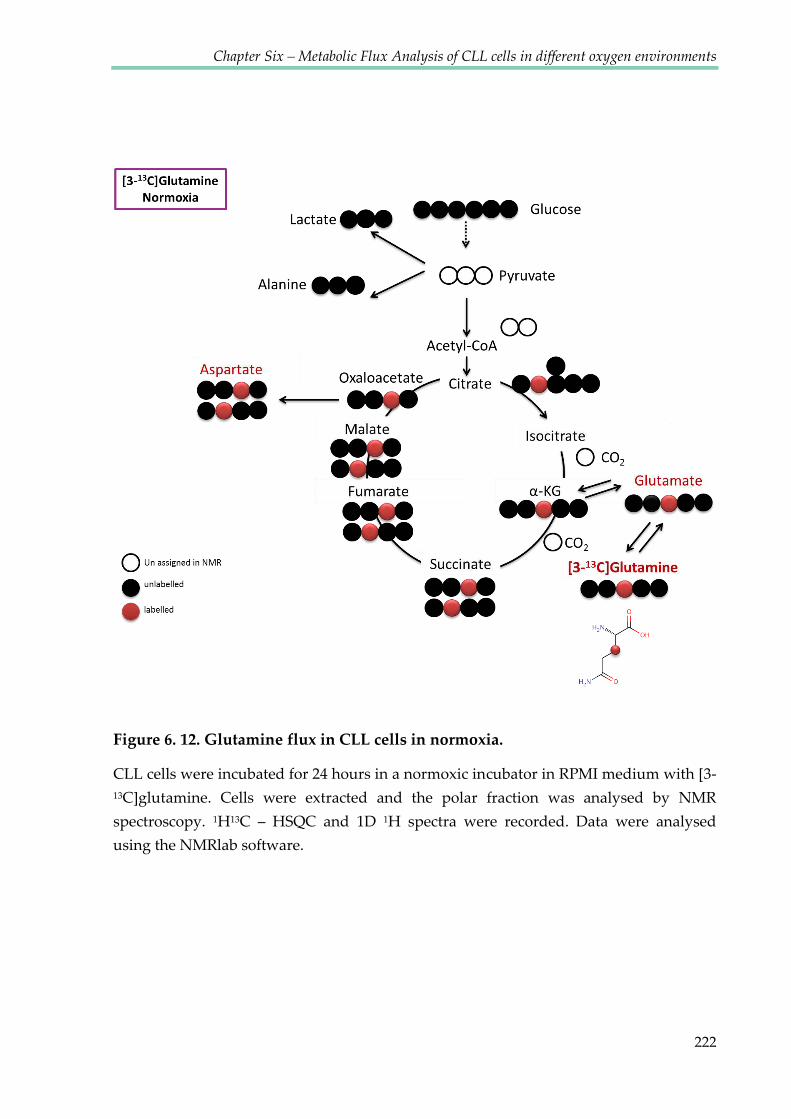
Chapter Six – Metabolic Flux Analysis of CLL cells in different oxygen environments
222
Figure 6. 12. Glutamine flux in CLL cells in normoxia.
CLL cells were incubated for 24 hours in a normoxic incubator in RPMI medium with [3-
13C]glutamine. Cells were extracted and the polar fraction was analysed by NMR
spectroscopy. 1H13C – HSQC and 1D 1H spectra were recorded. Data were analysed
using the NMRlab software.
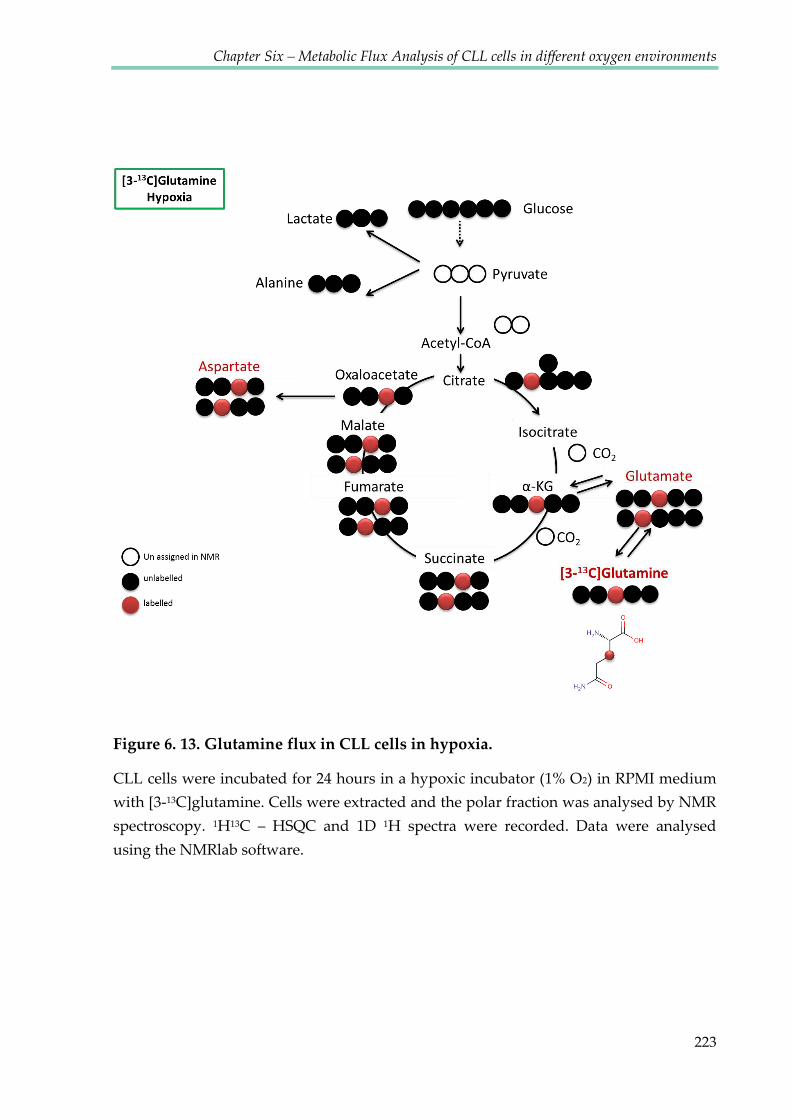
Chapter Six – Metabolic Flux Analysis of CLL cells in different oxygen environments
223
Figure 6. 13. Glutamine flux in CLL cells in hypoxia.
CLL cells were incubated for 24 hours in a hypoxic incubator (1% O2) in RPMI medium
with [3-13C]glutamine. Cells were extracted and the polar fraction was analysed by NMR
spectroscopy. 1H13C – HSQC and 1D 1H spectra were recorded. Data were analysed
using the NMRlab software.

Chapter Six – Metabolic Flux Analysis of CLL cells in different oxygen environments
224
Lack of the label in lactate and alanine identified by the absolute incorporation
of label into C-3 of lactate via 1D spectra, suggests the absence of the malic enzyme
activity which transforms malate into pyruvate (Figures 6.14 and 6.15). In addition
lactate labelled from glucose in normoxia and hypoxia is produced in a similar
percentage (Figure 6.16).
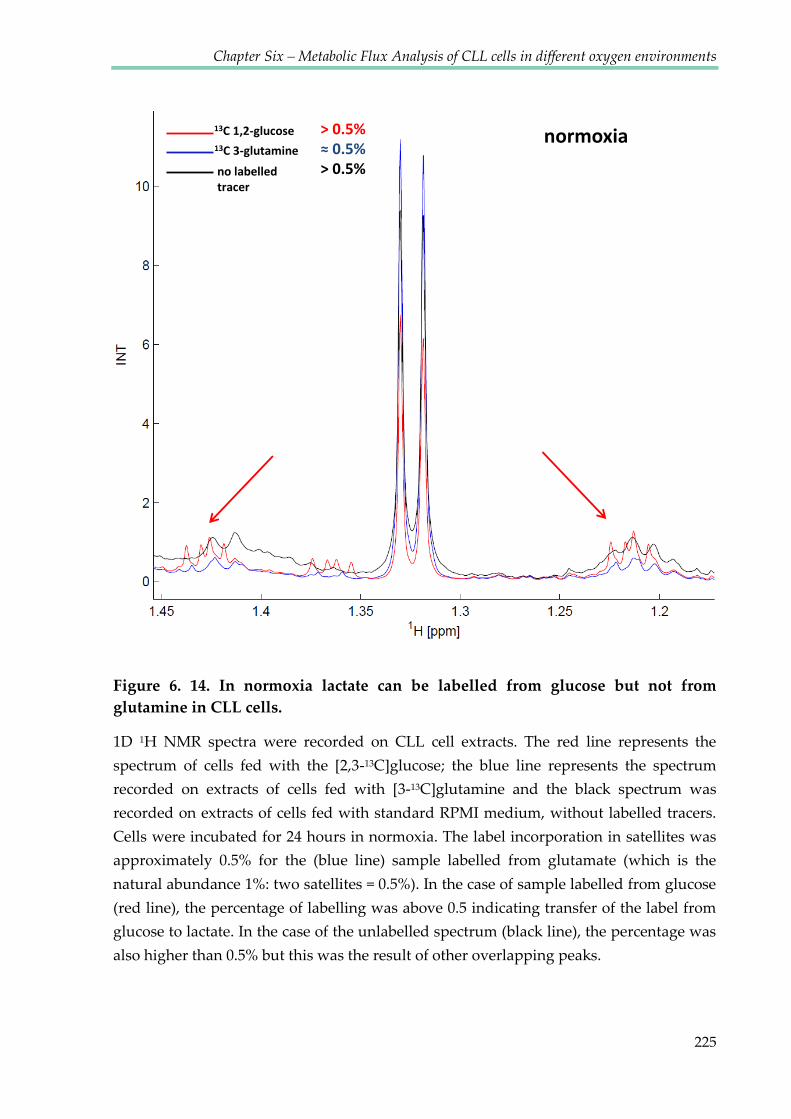
Chapter Six – Metabolic Flux Analysis of CLL cells in different oxygen environments
225
Figure 6. 14. In normoxia lactate can be labelled from glucose but not from
glutamine in CLL cells.
1D 1H NMR spectra were recorded on CLL cell extracts. The red line represents the
spectrum of cells fed with the [2,3-13C]glucose; the blue line represents the spectrum
recorded on extracts of cells fed with [3-13C]glutamine and the black spectrum was
recorded on extracts of cells fed with standard RPMI medium, without labelled tracers.
Cells were incubated for 24 hours in normoxia. The label incorporation in satellites was
approximately 0.5% for the (blue line) sample labelled from glutamate (which is the
natural abundance 1%: two satellites = 0.5%). In the case of sample labelled from glucose
(red line), the percentage of labelling was above 0.5 indicating transfer of the label from
glucose to lactate. In the case of the unlabelled spectrum (black line), the percentage was
also higher than 0.5% but this was the result of other overlapping peaks.
normoxia13C 1,2-glucose13C 3-glutamine
no labelled tracer
> 0.5%≈ 0.5%> 0.5%
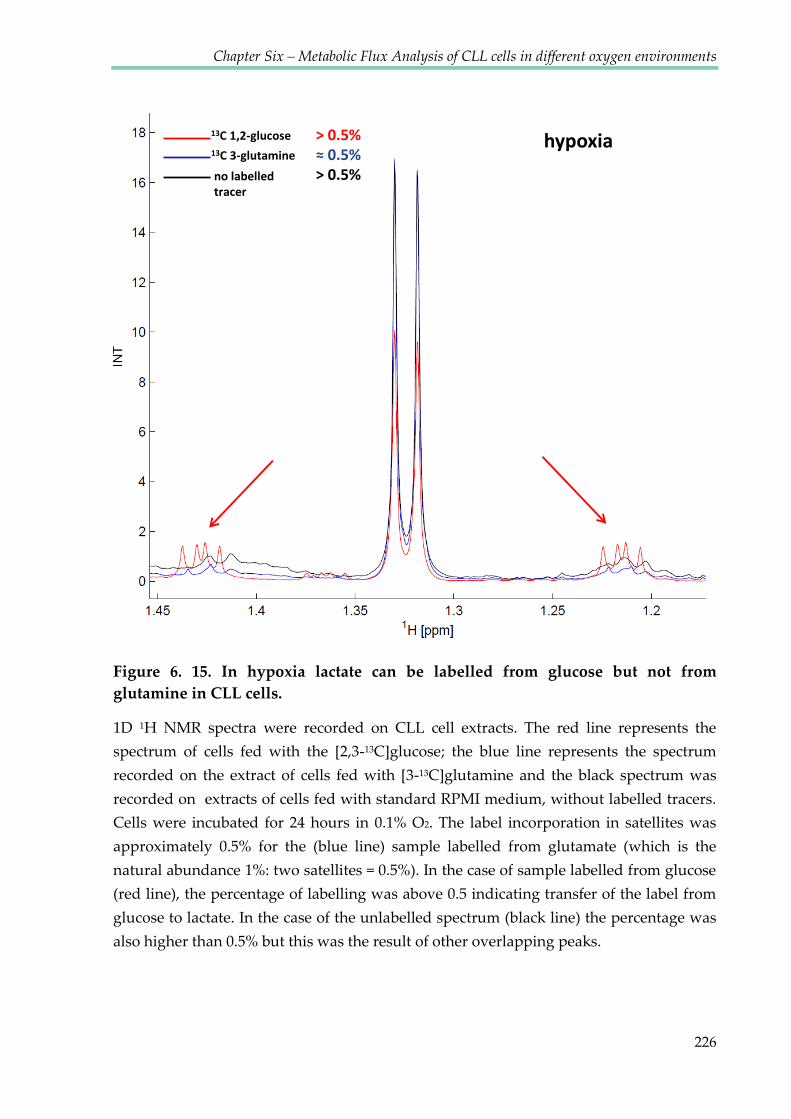
Chapter Six – Metabolic Flux Analysis of CLL cells in different oxygen environments
226
Figure 6. 15. In hypoxia lactate can be labelled from glucose but not from
glutamine in CLL cells.
1D 1H NMR spectra were recorded on CLL cell extracts. The red line represents the
spectrum of cells fed with the [2,3-13C]glucose; the blue line represents the spectrum
recorded on the extract of cells fed with [3-13C]glutamine and the black spectrum was
recorded on extracts of cells fed with standard RPMI medium, without labelled tracers.
Cells were incubated for 24 hours in 0.1% O2. The label incorporation in satellites was
approximately 0.5% for the (blue line) sample labelled from glutamate (which is the
natural abundance 1%: two satellites = 0.5%). In the case of sample labelled from glucose
(red line), the percentage of labelling was above 0.5 indicating transfer of the label from
glucose to lactate. In the case of the unlabelled spectrum (black line) the percentage was
also higher than 0.5% but this was the result of other overlapping peaks.
hypoxia13C 1,2-glucose13C 3-glutamine
no labelled tracer
> 0.5%≈ 0.5%> 0.5%
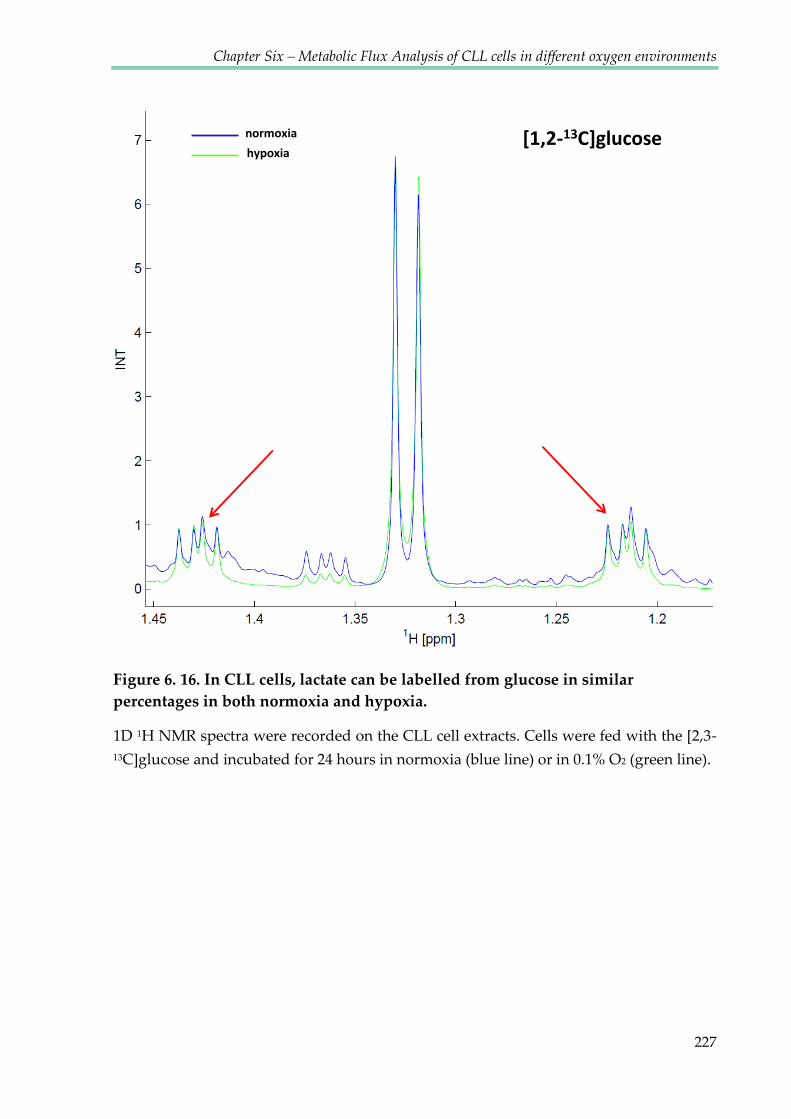
Chapter Six – Metabolic Flux Analysis of CLL cells in different oxygen environments
227
Figure 6. 16. In CLL cells, lactate can be labelled from glucose in similar
percentages in both normoxia and hypoxia.
1D 1H NMR spectra were recorded on the CLL cell extracts. Cells were fed with the [2,3-
13C]glucose and incubated for 24 hours in normoxia (blue line) or in 0.1% O2 (green line).
[1,2-13C]glucosenormoxia
hypoxia

Chapter Six – Metabolic Flux Analysis of CLL cells in different oxygen environments
228
6.3 DISCUSSION
Although it is difficult to obtain large amounts of primary cells, and the size of
CLL cells is relatively small due to their scant cytoplasm, HSQC analysis of CLL cell
extracts provided some information about their metabolic flux. Use of labelled
glucose and glutamine precursors revealed differences between normoxic and
hypoxic metabolism (see Figures 6.17 and 6.18).
CLL cells consumed glucose and glutamine in both normoxic and hypoxic
conditions and incorporated their carbons to newly produced metabolites.
Interestingly, early studies examining glucose uptake by CLL cells show that they
consume less glucose than normal B lymphocytes (Brody, Oski et al. 1969). Moreover,
studies using fluorodeoxyglucose positron emission tomography (FDG-PET) to
visualise CLL cells in vivo, have yielded poor results; the sensitivity of detection was
53% and the extent of disease was often underestimated (Karam, Novak et al. 2006).
This may be because CLL is composed of malignant cell fractions with different
proliferative activities, whereby recently divided cells and older/quiescent cells may
have different glucose requirements. This notion is supported by a report indicating
that CLL patients have two populations of circulating malignant cells with different
degrees of mitochondrial polarization and dependencies on glucose (Gardner, Devlin
et al. 2012). FDG-PET has been used effectively in CLL management with respect to
the detection of Richter’s transformation (Bruzzi, Macapinlac et al. 2006). Regarding
Chapter Six – Metabolic Flux Analysis of CLL cells in different oxygen environments
229
the methods used in the present study, as yet, it has not been possible to obtain
sufficient numbers of healthy B-cells after the purification of CD19 positive cells to
accurately perform metabolic analysis including measurements of glucose
consumption. It would be interesting to see if the kinetics of glucose and glutamine
consumption by CLL cells differs from the kinetics shown by healthy B-cells.
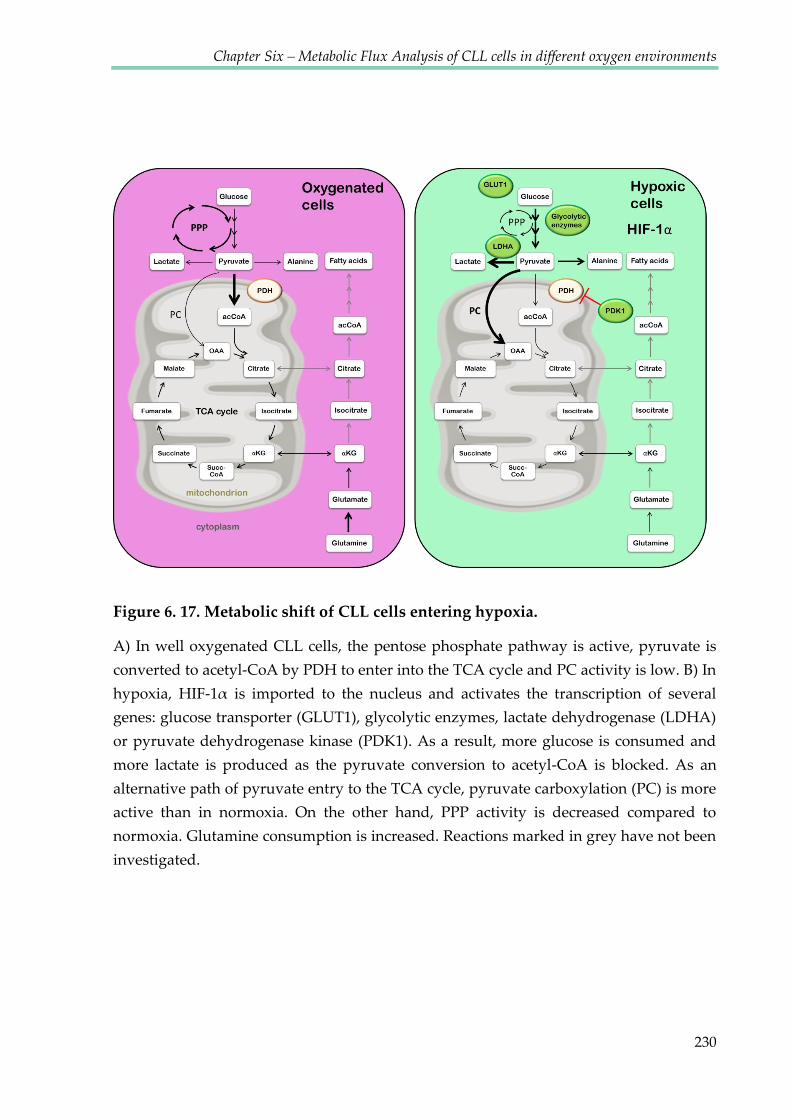
Chapter Six – Metabolic Flux Analysis of CLL cells in different oxygen environments
230
Figure 6. 17. Metabolic shift of CLL cells entering hypoxia.
A) In well oxygenated CLL cells, the pentose phosphate pathway is active, pyruvate is
converted to acetyl-CoA by PDH to enter into the TCA cycle and PC activity is low. B) In
hypoxia, HIF-1α is imported to the nucleus and activates the transcription of several
genes: glucose transporter (GLUT1), glycolytic enzymes, lactate dehydrogenase (LDHA)
or pyruvate dehydrogenase kinase (PDK1). As a result, more glucose is consumed and
more lactate is produced as the pyruvate conversion to acetyl-CoA is blocked. As an
alternative path of pyruvate entry to the TCA cycle, pyruvate carboxylation (PC) is more
active than in normoxia. On the other hand, PPP activity is decreased compared to
normoxia. Glutamine consumption is increased. Reactions marked in grey have not been
investigated.

Chapter Six – Metabolic Flux Analysis of CLL cells in different oxygen environments
231
Figure 6. 18. Glycolysis is interconnected with PPP in CLL cells.
In CLL cells, PPP is more active in normoxia compared to hypoxia, while glycolysis
increases in hypoxia. HK2: hexokinase 2, GPI: glucose-6-phosphate isomerase, PFKP: 6-
phosphofructokinase, ALDOC: aldolase C, TPI1: triosephosphate isomerase 1, GAPDH:
glyceraldehyde-3-phosphate dehydrogenase, PGK1: phosphoglycerate kinase 1, PGAM1:
phosphoglycerate mutase 1, ENO1: enolase 1, PKM2: pyruvate kinase M2, LDHA: lactate
dehydrogenase A, PDHA: pyruvate dehyrogenase, G6PD: glucose-6-phosphate
dehydrogenase, PGLS: 6-phosphogluconolactonase, PGD: 6-phosphogluconate
dehydrogenase, RPE: ribulose-5-phosphate 3-epimerase, RPIA: ribose-5-phosphate
isomerase, TKT: transketolase, TALDO1: transaldolase 1, NADPH: nicotinamide adenine
dinucleotide phosphate.
Chapter Six – Metabolic Flux Analysis of CLL cells in different oxygen environments
232
The observations presented in this study indicate that CLL cells use the
pentose phosphate pathway (PPP) in normoxia but it appeared to be down regulated
in hypoxia. A similar phenomenon has been reported in a study using glioblastoma
stem-like cells, where an upregulation of genes involved in PPP in normoxia,
combined with a downregulation of glycolytic enzymes and reciprocal adaptive
switch between induction of glycolysis and PPP in hypoxia was shown (Kathagen,
Schulte et al. 2013). Previous studies of the metabolism of CLL cells showed
decreased levels of glucose consumption as well as diminished levels of [1-
14C]glucose-derived 14CO2 compared with healthy cells (Brody, Oski et al. 1969). This
suggests lower activity of the PPP pathway in CLL lymphocytes. This may be a
consequence of the lower levels of PPP enzymes such as glucose-6-phosphate
dehydrogenase and 6-phosphogluconate dehydrogenase, which were shown to be
decreased in CLL (Beck 1958; Ghiotto, Perona et al. 1963; Brody, Oski et al. 1969).
Moreover, it has been shown that in CLL, certain oxidative and glycolytic enzymes
may not be correctly spatially oriented which would prevent substrate binding
(Koshland 1963). This abnormality may be analogous to the defective mechanism
responsible for the impaired assembly of new ribosomes in CLL (Rubin 1971).
The Pentose phosphate pathway synthesises precursors of nucleotides and
amino acids which are required for tumour cell growth and proliferation. When cells
do not require these precursors, intermediates of the pentose phosphate pathway
Chapter Six – Metabolic Flux Analysis of CLL cells in different oxygen environments
233
(fructose-6-phosphate and glyceraldehyde-3-phosphate) can be recycled back into
glycolysis to produce pyruvate and lactate. Based on observations described in the
previous chapter, it was hypothesised that CLL cells in hypoxia are exposed to high
levels of ROS and are in high demand for ROS scavenging pyruvate. Therefore,
rather than utilising the PPP, it would be more beneficial for CLL cells to use
fructose-6-phosphate and glyceraldehyde-3-phosphate in the glycolytic pathway to
produce more pyruvate. This is an interesting observation as other cancer cells use
PPP to reduce ROS (through the generation of NADPH) (Jiang, Du et al. 2014). It
seems to be a particular feature of CLL cells to reduce PPP in hypoxia.
Many of the macromolecular precursors for cell growth such as lipids,
nucleotides and nonessential amino acids are generated within the TCA cycle. The
TCA cycle uses pyruvate as its main fuel but can also use glutamine. The latter is
often referred to as an anaplerotic pathway. Another anaplerotic reaction is the usage
of pyruvate via pyruvate carboxylation (PC) providing oxaloacetate, the metabolite
which forms the cycle’s canonical entry point following condensation with acetyl-
CoA. The HSQC analysis showed that under hypoxic conditions, pyruvate
carboxylase activity increases in CLL cells. It was shown that in many tumours
pyruvate carboxylase is required for glutamine- independent growth (Cheng,
Sudderth et al. 2011). Glutamine is the preferred anaplerotic precursor in some
transformed cell lines, contributing up to 90% of the OAA pool (Portais, Voisin et al.
Chapter Six – Metabolic Flux Analysis of CLL cells in different oxygen environments
234
1996); DeBerardinis, Mancuso et al. 2007), therefore when the contribution of
glutamine is reduced, cells require an alternative source of OAA which may be
pyruvate. Consequently, cancer cells exhibiting high PC activity did not require
glutamine for survival and growth (Cheng, Sudderth et al. 2011). The data presented
in this chapter show that PC activity was more pronounced in hypoxia and
glutamine consumption was lower after oxygen depletion – supporting the
previously described relation.
[1,2-13C]glutamate and [3-13C]glutamate derived from [1,2-13C]glucose in
normoxia is evidence of the TCA cycle having passed multiple rounds during 24
hours of label exposure. In contrast, spectra recorded on hypoxic cell extracts showed
much lower intensions of these labelling patterns. This suggests that, compared to
normoxia, in hypoxic conditions CLL cells slow down their TCA cycle metabolism.
This observation is consistent with the common view that in hypoxia, cells switch
their metabolism from oxidative phosphorylation to glycolytic flux, leading to the
accumulation of lactate. Hypoxia promotes glycolytic flux, in part due to the
activation of HIF-1α and its downstream target genes, which include many glycolytic
enzymes (Tennant, Frezza et al. 2009). Both hypoxia and ROS decrease the flux of
glucose through pyruvate dehydrogenase into the TCA cycle, through activation of
pyruvate dehydrogenase kinase (PDK). In such cases, the TCA cycle can be fed by
alternative substrates such as glutamine. It has been shown that some cancer cells use
Chapter Six – Metabolic Flux Analysis of CLL cells in different oxygen environments
235
glutamine in conjunction with a reverse TCA cycle activity for acetyl-CoA
production which is the substrate for lipid synthesis (Metallo, Gameiro et al. 2012).
CLL cells fed with labelled glutamine did not contain citrate labelled in the C-3
position suggesting that neither in normoxia, nor in hypoxia, the reverse TCA cycle
occurs in CLL cells.
It would have been interesting to compare the metabolic characteristics of CLL
cells observed in the present study, with data from healthy human B-cells, but the
high number of cells required for the carbon NMR analysis proved to be an
insurmountable obstacle.

Chapter VII
General Discussion
Chapter Seven –General Discussion
237
7.1 General discussion
Until relatively recently, CLL was considered the ‚Cinderella‛ of leukaemia,
receiving less attention from biologists and clinicians than many other malignancies
and in particular other haematological malignancies (Caligaris-Cappio 2009).
However, in recent years this has changed dramatically. Studies of the genetics and
physiology of CLL has uncovered novel targets for clinical exploitation using
monoclonal antibodies (MoAbs), engineered T cells, or kinase inhibitors (Kharfan-
Dabaja, Wierda et al. 2014). Ibrutinib, an inhibitor of Bruton's tyrosine kinase which
signals downstream of the B-cell receptor (BCR) signalling pathway, is showing great
promise in high-risk patients, whether alone or as an adjunctive therapy with MoAbs
or chemotherapy. Similarly PI3K-δ, inhibitors are showing promise (Aalipour and
Advani 2013; Danilov 2013). Despite this, for the overwhelming majority of patients
the disease remains incurable. Furthermore, the hope that BTK and/or PI3K-δ
inhibitors will become the ‘imatinib’ (blockbuster therapeutic for the treatment of
CML) of CLL is perhaps as yet prematurely optimistic.
Unlike CML, which is defined by a single defining founding mutation that can
be targeted by imatinib (Breccia, Efficace et al. 2011), CLL is genetically
heterogeneous (Landau and Wu 2013). Previous knowledge of the successes in the
development of cancer medicine indicates that combination therapies provide the
most efficacious cures and remission rates and that having a pathway of treatments
Chapter Seven –General Discussion
238
available at first and subsequent relapses, prolongs both survival and with increasing
commonality quality of life (Hallek 2013). It is therefore likely that new agents and
new treatment strategies are still required for CLL.
From another point of view, there is a required urgency to study CLL as a
generic model of human B-cell malignancies and of human cancer in general. The
accessibility of CLL cells provides a unique opportunity to study primary human
cancer cells that is not afforded to such studies in any other setting. However, the
forecasted arrival of an arsenal of drugs and therapeutic approaches that may in the
near future achieve increased survival by driving down tumour burden and halting
disease progression means that this opportunity will thankfully be short lived
(Hallek 2013).
Many agents that are effective in CLL are also effective in B cell lymphomas,
for example the CD20 targeting antibody rituximab (Keating 2010). Therefore,
studies in CLL are likely to provide additional information for the development of
therapies in settings beyond this disease where outcomes remain poor. However, I
believe that CLL cells provide a wider model of human cancer with particular
advantages in the study and understanding of the processes of metastasis.
Although when circulating, CLL cells remain out of the cell cycle, the majority
of these cells have previously undergone cell divisions within malignant lymph
nodes (Chiorazzi 2007). This indicates that CLL cells can alternate between being ‘in’

Chapter Seven –General Discussion
239
and ‘out’ of the cell cycle. Cells that are ‘out’ of the cell cycle are often described as
‘quiescent’. However, in the age of metabolomics, the definition of quiescence is
likely to change. ‘Quiescence’ relates to the state of being ‘out’ of the cell cycle,
termed G0. However not all ‘out of cell cycle’ cells may be metabolically quiescent.
The transition to cell cycle quiescence in primary human fibroblasts has been shown
to be associated with changes in gene expression, histone modification and the
extension of chromatin compaction, although there is no evidence that these events
regulate the cell cycle in cells (Evertts, Manning et al. 2013). However, entry to the
quiescent state is almost certainly associated with dramatic changes in metabolism as
the requirements of proliferating and quiescent cells are vastly different. Evidence
that cell cycle quiescence may not be associated with metabolic quiescence has again
been shown in ‘out of cycle’ fibroblasts that maintain comparable metabolic rates to
proliferating cells (Lemons, Feng et al. 2010)
To date, little is known about quiescent haematological cancer cells.
Experiments presented here demonstrate that ‘out of cell cycle’ primary CLL cells
also maintain a high level of metabolic activity. Data presented here describe a
reversibly adaptive Warburg effect in these cancer cells where glucose consumption
and lactate production were present in oxygenated conditions but became elevated
upon transition to hypoxia as shown by increased lactate production. At the same
time, TCA cycle activity appeared to be supported by a shift towards glutaminolysis

Chapter Seven –General Discussion
240
in hypoxia as evidenced by consumption of glutamine associated with production of
glutamate, pyruvate, lactate and alanine. However, it is interesting to note that the
HIF-1α inhibitor CTM had an effect on hypoxia induced CLL cell glutaminolysis by
accelerating glutamine consumption and glutamate production in hypoxia. In
contrast, CTM diminished glucose consumption and lactate production. These
findings suggest that hypoxia induced HIF-1α activity acts to sustain glycolysis and
‘spare’ glutaminolysis, as CLL cells transit from oxygenated to hypoxic environments
and that lactate production is largely mediated by the consumption of glucose.
A key observation was the discontinuous kinetics of pyruvate; being
externalised early in the experiments and then reabsorbed in hypoxia. Pyruvate
reabsorbtion was halted by CHC, implicating the MCT1-transporter in this process.
Importantly, provision of exogenous pyruvate diminished the production of ROS
and mitosox in response to stress induced by reactive oxygen species (H2O2) and
reversed CLL cell killing by H2O2. These data are the first to demonstrate that CLL
cells not only display metabolic plasticity in response to environmental change but
also change their utilisation of metabolites under different conditions and can do so
to enhance their survival.
The study presented here is one of a growing number of studies that have
analysed metabolism in living cells. A recent study used 13C-pyruvate formulations
in a comparative flux study of pyruvate metabolism between a glioblastoma and a
Chapter Seven –General Discussion
241
hepatocarcinoma cell line (Yang, Harrison et al. 2014). Similarly, hyperpolarised 13C
NMR studies of glucose metabolism in living T47D breast cancer cell cultures have
also been recently described (Harris, Degani et al. 2013). However, the work
presented here provides a significant progression of this type of study.
To the author’s knowledge this is the first report of real-time NMR
measurements using primary patient cancer cells purified from the blood of patients
but not otherwise modified nor cultured. Using these cells, fast metabolic
adaptations to niche conditions using a simple model of oxygen depletion were
observed. By embedding cells in a dilute agarose matrix in an NMR tube, oxygen
access was restricted, while cells were preserved in a stable ‘out of cell cycle’ state.
The agarose matrix prevented the cells from sinking to the bottom of the NMR tube,
thus preserving the homogeneity of the NMR sample (in which the CLL cells account
for less than 10% of the overall volume), which is important to obtain high resolution
NMR spectra. Line widths of 1-1.5 Hz in 0.1% agarose were obtained, suggesting that
the matrix preserves the mobility of small molecules, probably arising from large
cavities in the polymer. Using 1H-NMR spectra, sufficient sensitivity to obtain one-
dimensional spectra in 7-10 minutes in a standard 5 mm NMR tube with a volume of
just 550 μl was achieved.
However, the integration in this study of advanced NMR technologies with
both cancer and cell biological expertise has been of equal importance. This
Chapter Seven –General Discussion
242
multidisciplinary approach allowed for the interrogation of previously unknown
aspects of the physiology of CLL cells that underpin this complex disease. Moreover,
it has provided insight to new therapeutic avenues in combating not only CLL but
more generally all metastatic cancers. Beyond this, potential evidence that the basal
metbolism of CLL cells displays heterogeneity from patient to patient has been
identified; an observation that would not be possible using established cell lines. A
future, larger scale study would permit correlation of kinetic metabolic activity with
disease parameters such as prior or ongoing treatment, as well as correlative studies
with disease progression and association with prognostic markers.
Finally, the methodology presented here has considerable potential for
applications in personalised medicine. Unlike most other analytical technologies,
NMR is completely non-invasive and preserves cells. This opens new avenues to test
the effect of treatment options ‘ex vivo’, using primary cells from patients which can
be further characterised afterwards.
7.2 Future work
1. Knowing that the presented real time metabolic analysis method can detect
differences in the metabolic profiles of CLL cells treated under a range of specific
conditions reproducibly, it would be interesting to select different "types" of CLL
patients. For example, stage A indolent vs relapsed refractory CLL patients, to
Chapter Seven –General Discussion
243
distinguish possible differences between the cells isolated from the groups. Larger
numbers of samples would be required to perform statistical analysis.
2. This study compared the metabolism of CLL cells in oxygenated and in hypoxic
conditions. Lymph nodes, (where CLL cells proliferate (Herishanu, Perez-Galan et
al. 2011)) are likely to be hypoxic, however, to fully prove that the metabolism of
CLL cells in lymph nodes corresponds to the metabolism of CLL cells in hypoxia
described in the present study, measurements of CLL cells derived directly from
the lymph nodes would be required. Such analyses are feasible and should be
performed after obtaining biopsy samples under appropriate ethical approval.
3. Assessment of the metabolism of heathy B-cells is also required to identify the
differences and commonalities with CLL cells. Crucially, the comparisons of the
metabolic plasticity and the adaptation to hypoxic environments must be made to
elucidate the specificity of the alternations presented here and whether they are
solely recorded in malignant B-cells.
4. It would be interesting to investigate whether the system of real time NMR
analysis can be applied to other cell types. Preliminary studies using the
proliferating KG1a cell line have been carried out and results suggest that these

Chapter Seven –General Discussion
244
cells are tolerant of NMR real time measurements and changes in metabolism
upon transition to hypoxia can be observed.
5. A considerable experimental improvement of the NMR probe could be the
addition of a flow cell, where cells can be kept temperature controlled, with a
defined oxygen status and would allow for the possibility of drug
supplementation in real time. This would remove the necessity of using agarose as
cells could be kept in suspension by carefully adjusting the flow of medium in the
NMR cell.
7.3 The future of NMR Metabolomics for beating cancer
Recently, there has been a shift in the way that cancers are being described
and treated. Currently, tumours are defined not only by where they exist (e.g. lung,
blood or breast), but also by their molecular characteristics. Mutations in oncogenes
or those coding for receptors such as K-RAS in colorectal tumours or HER-2 in breast
cancer, are an important factor to consider when choosing the treatment plan (Aiello,
Vella et al. 2011; Orphanos and Kountourakis 2012). However, for the majority of
tumour types, no markers have been identified so far. Patients who receive the same
diagnosis react very differently to the same treatment and as a consequence, have
Chapter Seven –General Discussion
245
different outcomes. Therefore, there is a need for targeted therapeutics, characterised
by higher specificity and efficiency, combined with fewer side effects.
In recent years, NMR spectroscopy has been successfully used to evaluate
existing and potential therapies, as well as to analyse toxicology, sensitivity, optimal
doses and biological mechanisms of therapeutic compounds (Coen, Holmes et al.
2008; Bayet-Robert, Morvan et al. 2010; Dewar, Keshari et al. 2010). NMR
metabolomics has also been used to assess the efficiency of both radiation and
chemotherapy treatments (Blankenberg, Katsikis et al. 1997; Lyng, Sitter et al. 2007).
Moreover, it can provide a metabolic insight into different tumour subtypes as well
as their responses to drugs, indicating for which groups of patients therapies are
likely to be the most effective, or in which groups substantial side-effects will
manifest. Identification of pre-treatment metabolic profiles correlating with the
aforementioned data can be very useful for tumour treatment, leading effectively to
more tailored medicine and giving rise to personalised treatments in the future.
One of the fields in which NMR metabolomics is rapidly expanding is the
identification of specific cancer biomarkers in blood. Simple blood testing providing
metabolic biomarker information, is considerably cheaper than genome sequencing
or complete proteome analysis, and is equally informative, providing indications for
early cancer detection and the information needed for selecting optimal treatments.
Moreover, because of its high sensitivity and quick response to environmental
Chapter Seven –General Discussion
246
changes, the metabolome often reflects the phenotype more accurately than
information derived from other –omics techniques such as genomics and proteomics
(Putri, Nakayama et al. 2013). At present there is still no FDA approved
metabolomics tests for cancer, however metabolomics is used by the FDA in
biomarker discovery (FDA, 2006).
The identification of cancer specific metabolic patterns or alterations can
accelerate the process by which new molecular targets are defined. Metabolomics
approaches can also be used to evaluate drugs that are already in use. Obtaining a
deeper understanding of the mechanism of action of drugs, will enhance the
identification of new combinations of drugs with higher potency and/or lower
toxicity, as well as identifying diseases that may respond to unconventional drug.
Such a strategy will lead to novel and better use of exisiting therapeutics.
To date, a limited number of approved anticancer drugs have been
investigated using metabolomics methods. However, recent improvements have
opened new avenues for NMR metabolomics approaches in the context of drug
discovery and patient stratification. Investigating unique molecular characteristics,
will provide sensitive indicators of how drugs are tolerated and how this in turn
influences the outcome of the patient. By using more specific molecular targeted
drugs and suitable stratification of patients, cancer treatments can become better
tailored towards the individuality of the tumor and patient. The ability to quickly

Chapter Seven –General Discussion
247
identify the best drug for a particular patient will lead to more efficient treatment,
reduced patient suffering and enhanced health-economical benefits. The complete
mechanisms of action of many drugs is still poorly understood, which leads to less
than optimal usage, but NMR (as well as MS) metabolomics can provide much better
insight. Moreover, metabolomics studies are constantly improving our
understanding of tumor biology, as shown by the recent identification of new
potential biomarkers. Ultimately, recognition of the specific drug targets will lead to
a new generation of rationally-designed drugs.
7.4 Concluding remarks
The metabolomics era has garnered a return of interest in cancer cell
metabolism. At the same time, the cancer field has become increasingly interested in
the tumour cell niche. It is believed that these areas will yield the next step change in
therapeutic benefits for cancer patients. The study presented here is among the first,
to address the interplay between the micro-environment and cancer cell metabolism
in living primary cancer cells.
Understanding the complexity of the cancer cell niche is challenging.
However, reductionist approaches can provide invaluable insights. The present
study addressed the important issue of oxygen supply as part of the cancer cell niche.
The unusual, perhaps unique, availability of CLL cells to work as a primary cancer
cell model has been exploited. However, whilst an important cancer in its own right,
Chapter Seven –General Discussion
248
CLL cells also provide the opportunity to study the more general cancer
characteristic of metastasis. This is because CLL cells continually recirculate between
the oxygenated blood stream and hypoxic tissues, a process that metastatic cells have
to recapitulate to populate new tumour sites. The demonstration of metabolic
plasticity and the differential utilisation of pyruvate presented in this study has a
potential to foster new research which may lead to new therapeutic approaches. The
observation that CLL cells appear to have heterogeneous basal metabolism that may
relate to disease state, may be further developed in the area of biomarker discovery,
prognostication and treatment stratification.

References
References
250
(1989). "Chronic lymphocytic leukemia: recommendations for diagnosis, staging, and
response criteria. International Workshop on Chronic Lymphocytic Leukemia." Ann
Intern Med 110(3): 236-238.
Aalipour, A. and R. H. Advani (2013). "Bruton tyrosine kinase inhibitors: a promising novel
targeted treatment for B cell lymphomas." Br J Haematol 163(4): 436-443.
Ackerman, D. and M. C. Simon (2014). "Hypoxia, lipids, and cancer: surviving the harsh
tumor microenvironment." Trends Cell Biol 24(8): 472-478.
Adamski, J., A. Price, et al. (2013). "Hypoxia-induced cytotoxic drug resistance in
osteosarcoma is independent of HIF-1Alpha." PLoS One 8(6): e65304.
Advani, S. H. (2010). "Targeting mTOR pathway: A new concept in cancer therapy." Indian J
Med Paediatr Oncol 31(4): 132-136.
Aguayo, A., S. O'Brien, et al. (2000). "Clinical relevance of intracellular vascular endothelial
growth factor levels in B-cell chronic lymphocytic leukemia." Blood 96(2): 768-770.
Ahearne, M. J., S. Willimott, et al. (2013). "Enhancement of CD154/IL4 proliferation by the T
follicular helper (Tfh) cytokine, IL21 and increased numbers of circulating cells
resembling Tfh cells in chronic lymphocytic leukaemia." Br J Haematol 162(3): 360-
370.
Ahluwalia, G. S., J. L. Grem, et al. (1990). "Metabolism and action of amino acid analog anti-
cancer agents." Pharmacol Ther 46(2): 243-271.
Aiello, M., N. Vella, et al. (2011). "Role of genetic polymorphisms and mutations in colorectal
cancer therapy (Review)." Mol Med Rep 4(2): 203-208.
Alduaij, W., A. Ivanov, et al. (2011). "Novel type II anti-CD20 monoclonal antibody (GA101)
evokes homotypic adhesion and actin-dependent, lysosome-mediated cell death in B-
cell malignancies." Blood 117(17): 4519-4529.
Anastasiou, D. and L. Cantley (2012). "Breathless cancer cells get fat on glutamine." Cell Res
22(3): 443-446.
Asada, K., K. Miyamoto, et al. (2003). "Reduced expression of GNA11 and silencing of MCT1
in human breast cancers." Oncology 64(4): 380-388.
Bagnara, D., M. S. Kaufman, et al. (2011). "A novel adoptive transfer model of chronic
lymphocytic leukemia suggests a key role for T lymphocytes in the disease." Blood
117(20): 5463-5472.
Bailey, K. M., J. W. Wojtkowiak, et al. (2012). "Targeting the metabolic microenvironment of
tumors." Adv Pharmacol 65: 63-107.
Bayet-Robert, M., D. Morvan, et al. (2010). "Pharmacometabolomics of docetaxel-treated
human MCF7 breast cancer cells provides evidence of varying cellular responses at
high and low doses." Breast Cancer Res Treat 120(3): 613-626.
Beck, W. S. (1958). "Occurrence and control of the phosphogluconate oxidation pathway in
normal and leukemic leukocytes." J Biol Chem 232(1): 271-283.
Beckonert, O., H. C. Keun, et al. (2007). "Metabolic profiling, metabolomic and metabonomic
procedures for NMR spectroscopy of urine, plasma, serum and tissue extracts." Nat
Protoc 2(11): 2692-2703.
Ben-Tchavtchavadze, M., J. Chen, et al. (2010). "A noninvasive technique for the
measurement of the energetic state of free-suspension mammalian cells." Biotechnol
Prog 26(2): 532-541.
References
251
Benjamin, D. I., B. F. Cravatt, et al. (2012). "Global profiling strategies for mapping
dysregulated metabolic pathways in cancer." Cell Metab 16(5): 565-577.
Beuster, G., K. Zarse, et al. (2011). "Inhibition of alanine aminotransferase in silico and in vivo
promotes mitochondrial metabolism to impair malignant growth." J Biol Chem
286(25): 22323-22330.
Blankenberg, F. G., P. D. Katsikis, et al. (1997). "Quantitative analysis of apoptotic cell death
using proton nuclear magnetic resonance spectroscopy." Blood 89(10): 3778-3786.
Boag, J. M., A. H. Beesley, et al. (2006). "Altered glucose metabolism in childhood pre-B acute
lymphoblastic leukaemia." Leukemia 20(10): 1731-1737.
Bochner, B. R., P. Gadzinski, et al. (2001). "Phenotype microarrays for high-throughput
phenotypic testing and assay of gene function." Genome Res 11(7): 1246-1255.
Bocker, W. (2002). "The WHO classification of breast tumours and tumours of the female
genital organs: Pathology and genetics." Pathology of the Kidneys and Urinary
Passages - Molecular Vascular Pathology and Angiogenesis 86: 116-119.
Bonnet, S., S. L. Archer, et al. (2007). "A mitochondria-K+ channel axis is suppressed in
cancer and its normalization promotes apoptosis and inhibits cancer growth." Cancer
cell 11(1): 37-51.
Bonuccelli, G., A. Tsirigos, et al. (2010). "Ketones and lactate "fuel" tumor growth and
metastasis: Evidence that epithelial cancer cells use oxidative mitochondrial
metabolism." Cell Cycle 9(17): 3506-3514.
Borcherds, W., F. X. Theillet, et al. (2014). "Disorder and residual helicity alter p53-Mdm2
binding affinity and signaling in cells." Nat Chem Biol 10(12): 1000-1002.
Borge, M., P. R. Nannini, et al. (2013). "CXCL12 is a costimulator for CD4+ T cell activation
and proliferation in chronic lymphocytic leukemia patients." Cancer Immunol
Immunother 62(1): 113-124.
Bottcher, S., M. Ritgen, et al. (2012). "Minimal residual disease quantification is an
independent predictor of progression-free and overall survival in chronic
lymphocytic leukemia: a multivariate analysis from the randomized GCLLSG CLL8
trial." J Clin Oncol 30(9): 980-988.
Brand, K. A. and U. Hermfisse (1997). "Aerobic glycolysis by proliferating cells: a protective
strategy against reactive oxygen species." FASEB J 11(5): 388-395.
Breccia, M., F. Efficace, et al. (2011). "Imatinib treatment in chronic myelogenous leukemia:
What have we learned so far?" Cancer Lett 300(2): 115-121.
Brekke, E. M., T. S. Morken, et al. (2014). "The pentose phosphate pathway and pyruvate
carboxylation after neonatal hypoxic-ischemic brain injury." J Cereb Blood Flow
Metab 34(4): 724-734.
Brody, J. I., F. A. Oski, et al. (1969). "Impaired pentose phosphate shunt and decreased
glycolytic activity in lymphocytes of chronic lymphocytic leukemia. Metabolic
pathway." Blood 34(4): 421-429.
Bruzzi, J. F., H. Macapinlac, et al. (2006). "Detection of Richter's transformation of chronic
lymphocytic leukemia by PET/CT." J Nucl Med 47(8): 1267-1273.
Buhl, L., C. Dragsholt, et al. (1985). "Urinary hypoxanthine and pseudouridine as indicators
of tumor development in mesothelioma-transplanted nude mice." Cancer Res 45(3):
1159-1162.

References
252
Burger, J. A. (2011). "Nurture versus nature: the microenvironment in chronic lymphocytic
leukemia." Hematology Am Soc Hematol Educ Program 2011: 96-103.
Burger, J. A., M. Burger, et al. (1999). "Chronic lymphocytic leukemia B cells express
functional CXCR4 chemokine receptors that mediate spontaneous migration beneath
bone marrow stromal cells." Blood 94(11): 3658-3667.
Burger, J. A., P. Ghia, et al. (2009). "The microenvironment in mature B-cell malignancies: a
target for new treatment strategies." Blood 114(16): 3367-3375.
Burger, J. A., M. P. Quiroga, et al. (2009). "High-level expression of the T-cell chemokines
CCL3 and CCL4 by chronic lymphocytic leukemia B cells in nurselike cell cocultures
and after BCR stimulation." Blood 113(13): 3050-3058.
Burger, J. A., N. Tsukada, et al. (2000). "Blood-derived nurse-like cells protect chronic
lymphocytic leukemia B cells from spontaneous apoptosis through stromal cell-
derived factor-1." Blood 96(8): 2655-2663.
Byrd, J. C., R. R. Furman, et al. (2013). "Targeting BTK with ibrutinib in relapsed chronic
lymphocytic leukemia." N Engl J Med 369(1): 32-42.
Caligaris-Cappio, F. (2000). "Biology of chronic lymphocytic leukemia." Rev Clin Exp
Hematol 4(1): 5-21.
Caligaris-Cappio, F. (2009). "Chronic lymphocytic leukemia: "Cinderella" is becoming a star."
Mol Med 15(3-4): 67-69.
Calissano, C., R. N. Damle, et al. (2011). "Intraclonal complexity in chronic lymphocytic
leukemia: fractions enriched in recently born/divided and older/quiescent cells." Mol
Med 17(11-12): 1374-1382.
Cam, H., J. B. Easton, et al. (2010). "mTORC1 signaling under hypoxic conditions is
controlled by ATM-dependent phosphorylation of HIF-1alpha." Mol Cell 40(4): 509-
520.
Caneba, C. A., N. Bellance, et al. (2012). "Pyruvate uptake is increased in highly invasive
ovarian cancer cells under anoikis conditions for anaplerosis, mitochondrial function,
and migration." Am J Physiol Endocrinol Metab 303(8): E1036-1052.
Cantor, J. R. and D. M. Sabatini (2012). "Cancer cell metabolism: one hallmark, many faces."
Cancer Discov 2(10): 881-898.
Cardone, R. A., V. Casavola, et al. (2005). "The role of disturbed pH dynamics and the
Na+/H+ exchanger in metastasis." Nat Rev Cancer 5(10): 786-795.
Carlucci, F., F. Rosi, et al. (1997). "Purine nucleotide metabolism: specific aspects in chronic
lymphocytic leukemia lymphocytes." Biochim Biophys Acta 1360(3): 203-210.
Chen, A. P., M. J. Albers, et al. (2007). "Hyperpolarized C-13 spectroscopic imaging of the
TRAMP mouse at 3T-initial experience." Magn Reson Med 58(6): 1099-1106.
Chen, E. I., J. Hewel, et al. (2007). "Adaptation of energy metabolism in breast cancer brain
metastases." Cancer Res 67(4): 1472-1486.
Chen, H., A. T. Treweeke, et al. (2000). "In vitro and in vivo production of vascular
endothelial growth factor by chronic lymphocytic leukemia cells." Blood 96(9): 3181-
3187.
Chen, R., Y. Zou, et al. (2014). "The general amino acid control pathway regulates mTOR and
autophagy during serum/glutamine starvation." J Cell Biol 206(2): 173-182.

References
253
Cheng, L. L., C. L. Lean, et al. (1996). "Enhanced resolution of proton NMR spectra of
malignant lymph nodes using magic-angle spinning." Magn Reson Med 36(5): 653-
658.
Cheng, T., J. Sudderth, et al. (2011). "Pyruvate carboxylase is required for glutamine-
independent growth of tumor cells." Proc Natl Acad Sci U S A 108(21): 8674-8679.
Chilov, D., G. Camenisch, et al. (1999). "Induction and nuclear translocation of hypoxia-
inducible factor-1 (HIF-1): heterodimerization with ARNT is not necessary for nuclear
accumulation of HIF-1alpha." J Cell Sci 112 ( Pt 8): 1203-1212.
Chiorazzi, N. (2007). "Cell proliferation and death: forgotten features of chronic lymphocytic
leukemia B cells." Best Pract Res Clin Haematol 20(3): 399-413.
Chiorazzi, N., K. R. Rai, et al. (2005). "Chronic lymphocytic leukemia." N Engl J Med 352(8):
804-815.
Cipolleschi, M. G., I. Marzi, et al. (2014). "Hypoxia-resistant profile implies vulnerability of
cancer stem cells to physiological agents, which suggests new therapeutic targets."
Cell Cycle 13(2): 268-278.
Coen, M., E. Holmes, et al. (2008). "NMR-based metabolic profiling and metabonomic
approaches to problems in molecular toxicology." Chem Res Toxicol 21(1): 9-27.
Cohen, J. S., M. Motiei, et al. (2004). "Determination of intracellular pH and
compartmentation using diffusion-weighted NMR spectroscopy with pH-sensitive
indicators." Magn Reson Med 51(5): 900-903.
Collins, R. J., L. A. Verschuer, et al. (1989). "Spontaneous programmed death (apoptosis) of
B-chronic lymphocytic leukaemia cells following their culture in vitro." Br J Haematol
71(3): 343-350.
Cook, K. M., S. T. Hilton, et al. (2009). "Epidithiodiketopiperazines block the interaction
between hypoxia-inducible factor-1alpha (HIF-1alpha) and p300 by a zinc ejection
mechanism." J Biol Chem 284(39): 26831-26838.
D'Arena, G., N. Di Renzo, et al. (2003). "Biological and clinical heterogeneity of B-cell chronic
lymphocytic leukemia." Leuk Lymphoma 44(2): 223-228.
Dalvit, C. and A. Vulpetti (2011). "Fluorine–Protein Interactions and 19F NMR Isotropic
Chemical Shifts: An Empirical Correlation with Implications for Drug Design."
ChemMedChem 6(1): 104-114.
Dameshek, W. (1967). "Chronic lymphocytic leukemia--an accumulative disease of
immunolgically incompetent lymphocytes." Blood 29(4): Suppl:566-584.
Dang, L., D. W. White, et al. (2009). "Cancer-associated IDH1 mutations produce 2-
hydroxyglutarate." Nature 462(7274): 739-744.
Danilov, A. V. (2013). "Targeted therapy in chronic lymphocytic leukemia: past, present, and
future." Clin Ther 35(9): 1258-1270.
Davids, M. S. and J. A. Burger (2012). "Cell Trafficking in Chronic Lymphocytic Leukemia."
Open J Hematol 3(S1).
Day, S. E., M. I. Kettunen, et al. (2007). "Detecting tumor response to treatment using
hyperpolarized 13C magnetic resonance imaging and spectroscopy." Nat Med 13(11):
1382-1387.
De Saedeleer, C. J., P. E. Porporato, et al. (2013). "Glucose deprivation increases
monocarboxylate transporter 1 (MCT1) expression and MCT1-dependent tumor cell
migration." Oncogene.
References
254
DeBerardinis, R. J. and T. Cheng (2010). "Q's next: the diverse functions of glutamine in
metabolism, cell biology and cancer." Oncogene 29(3): 313-324.
DeBerardinis, R. J., A. Mancuso, et al. (2007). "Beyond aerobic glycolysis: transformed cells
can engage in glutamine metabolism that exceeds the requirement for protein and
nucleotide synthesis." Proc Natl Acad Sci U S A 104(49): 19345-19350.
DeBerardinis, R. J. and C. B. Thompson (2012). "Cellular metabolism and disease: what do
metabolic outliers teach us?" Cell 148(6): 1132-1144.
Defoiche, J., C. Debacq, et al. (2008). "Reduction of B cell turnover in chronic lymphocytic
leukaemia." Br J Haematol 143(2): 240-247.
Denkert, C., E. Bucher, et al. (2012). "Metabolomics of human breast cancer: new approaches
for tumor typing and biomarker discovery." Genome Med 4(4): 37.
Desouki, M. M., G. R. Post, et al. (2010). "PAX-5: a valuable immunohistochemical marker in
the differential diagnosis of lymphoid neoplasms." Clin Med Res 8(2): 84-88.
Dewar, B. J., K. Keshari, et al. (2010). "Metabolic assessment of a novel chronic myelogenous
leukemic cell line and an imatinib resistant subline by H NMR spectroscopy."
Metabolomics 6(3): 439-450.
Dhar-Mascareno, M., J. M. Carcamo, et al. (2005). "Hypoxia-reoxygenation-induced
mitochondrial damage and apoptosis in human endothelial cells are inhibited by
vitamin C." Free Radic Biol Med 38(10): 1311-1322.
Dona, A. C., B. Jimenez, et al. (2014). "Precision high-throughput proton NMR spectroscopy
of human urine, serum, and plasma for large-scale metabolic phenotyping." Anal
Chem 86(19): 9887-9894.
Eagle, H. (1955). "Nutrition needs of mammalian cells in tissue culture." Science 122(3168):
501-514.
Eichhorst, B. F., R. Busch, et al. (2006). "Fludarabine plus cyclophosphamide versus
fludarabine alone in first-line therapy of younger patients with chronic lymphocytic
leukemia." Blood 107(3): 885-891.
Evans, S. M., S. M. Hahn, et al. (2001). "Hypoxic heterogeneity in human tumors: EF5
binding, vasculature, necrosis, and proliferation." Am J Clin Oncol 24(5): 467-472.
Evertts, A. G., A. L. Manning, et al. (2013). "H4k20 Methylation Regulates Quiescence and
Chromatin Compaction." Mol Biol Cell.
Faderl, S., D. A. Thomas, et al. (2003). "Experience with alemtuzumab plus rituximab in
patients with relapsed and refractory lymphoid malignancies." Blood 101(9): 3413-
3415.
Favaro, E., S. Lord, et al. (2011). "Gene expression and hypoxia in breast cancer." Genome
Med 3(8): 55.
Fernando, H., K. K. Bhopale, et al. (2011). "Lipidomic changes in rat liver after long-term
exposure to ethanol." Toxicol Appl Pharmacol 255(2): 127-137.
Fiegl, M., I. Samudio, et al. (2010). "Physiological hypoxia promotes lipid raft and PI3K-
dependent activation of MAPK 42/44 in leukemia cells." Leukemia 24(7): 1364-1367.
Filipp, F. V., D. A. Scott, et al. (2012). "Reverse TCA cycle flux through isocitrate
dehydrogenases 1 and 2 is required for lipogenesis in hypoxic melanoma cells."
Pigment Cell Melanoma Res 25(3): 375-383.
Fink, M. P. (2002). "Role of reactive oxygen and nitrogen species in acute respiratory distress
syndrome." Curr Opin Crit Care 8(1): 6-11.
References
255
Florian, C. L., N. E. Preece, et al. (1995). "Characteristic metabolic profiles revealed by 1H
NMR spectroscopy for three types of human brain and nervous system tumours."
NMR Biomed 8(6): 253-264.
Florian, C. L., N. E. Preece, et al. (1995). "Cell type-specific fingerprinting of meningioma and
meningeal cells by proton nuclear magnetic resonance spectroscopy." Cancer Res
55(2): 420-427.
Folmes, C. D., P. P. Dzeja, et al. (2012). "Metabolic plasticity in stem cell homeostasis and
differentiation." Cell Stem Cell 11(5): 596-606.
Forristal, C. E., I. G. Winkler, et al. (2013). "Pharmacologic stabilization of HIF-1alpha
increases hematopoietic stem cell quiescence in vivo and accelerates blood recovery
after severe irradiation." Blood 121(5): 759-769.
Frater, J. L., N. E. Kay, et al. (2008). "Dysregulated angiogenesis in B-chronic lymphocytic
leukemia: morphologic, immunohistochemical, and flow cytometric evidence." Diagn
Pathol 3: 16.
Fujiwara, S., Y. Kawano, et al. (2013). "PDK1 inhibition is a novel therapeutic target in
multiple myeloma." Br J Cancer 108(1): 170-178.
Fyles, A., M. Milosevic, et al. (2002). "Tumor hypoxia has independent predictor impact only
in patients with node-negative cervix cancer." J Clin Oncol 20(3): 680-687.
Gambhir, S. (2002). "Molecular imaging of cancer with positron emission tomography." Nat
Rev Cancer 2(9): 683-693.
Gao, P., H. Zhang, et al. (2007). "HIF-dependent antitumorigenic effect of antioxidants in
vivo." Cancer cell 12(3): 230-238.
Garcia-Segura, J. M., M. Sanchez-Chapado, et al. (1999). "In vivo proton magnetic resonance
spectroscopy of diseased prostate: spectroscopic features of malignant versus benign
pathology." Magn Reson Imaging 17(5): 755-765.
Garrido, C., L. Galluzzi, et al. (2006). "Mechanisms of cytochrome c release from
mitochondria." Cell Death Differ 13(9): 1423-1433.
Gates, S. C. and C. C. Sweeley (1978). "Quantitative metabolic profiling based on gas
chromatography." Clin Chem 24(10): 1663-1673.
Gebregiworgis, T. and R. Powers (2012). "Application of NMR metabolomics to search for
human disease biomarkers." Comb Chem High Throughput Screen 15(8): 595-610.
Ghia, P., P. Circosta, et al. (2005). "Differential effects on CLL cell survival exerted by
different microenvironmental elements." Curr Top Microbiol Immunol 294: 135-145.
Ghiotto, G., G. Perona, et al. (1963). "Hexokinase and TPN-dependent dehydrogenases of
leucocytes in leukaemia and other haematological disorders." Br J Haematol 9: 345-
350.
Ghosh, A. K., T. D. Shanafelt, et al. (2009). "Aberrant regulation of pVHL levels by
microRNA promotes the HIF/VEGF axis in CLL B cells." Blood 113(22): 5568-5574.
Giannoni, E., F. Buricchi, et al. (2005). "Intracellular reactive oxygen species activate Src
tyrosine kinase during cell adhesion and anchorage-dependent cell growth." Mol Cell
Biol 25(15): 6391-6403.
Gillies, R. J., N. Raghunand, et al. (2002). "MRI of the tumor microenvironment." J Magn
Reson Imaging 16(4): 430-450.
Golman, K., R. in 't Zandt, et al. (2006). "Real-time metabolic imaging." Proc Natl Acad Sci U
S A 103(30): 11270-11275.
References
256
Gorrini, C., I. S. Harris, et al. (2013). "Modulation of oxidative stress as an anticancer
strategy." Nat Rev Drug Discov 12(12): 931-947.
Gottlieb, E. and I. P. Tomlinson (2005). "Mitochondrial tumour suppressors: a genetic and
biochemical update." Nat Rev Cancer 5(11): 857-866.
Graeber, T. G., C. Osmanian, et al. (1996). "Hypoxia-mediated selection of cells with
diminished apoptotic potential in solid tumours." Nature 379(6560): 88-91.
Griffin, J. L. and O. Corcoran (2005). "High-resolution magic-angle spinning 13C NMR
spectroscopy of cerebral tissue." MAGMA 18(1): 51-56.
Griffin, J. L., E. Sang, et al. (2002). "Metabolic profiles of dystrophin and utrophin expression
in mouse models of Duchenne muscular dystrophy." FEBS Lett 530(1-3): 109-116.
Griffin, J. L. and J. P. Shockcor (2004). "Metabolic profiles of cancer cells." Nat Rev Cancer
4(7): 551-561.
Griffiths, M., D. Keast, et al. (1993). "The role of glutamine and glucose analogues in
metabolic inhibition of human myeloid leukaemia in vitro." Int J Biochem 25(12):
1749-1755.
Gromova, M. and C. Roby (2010). "Toward Arabidopsis thaliana hydrophilic metabolome:
assessment of extraction methods and quantitative 1H NMR." Physiol Plant 140(2):
111-127.
Gross, S., R. A. Cairns, et al. (2010). "Cancer-associated metabolite 2-hydroxyglutarate
accumulates in acute myelogenous leukemia with isocitrate dehydrogenase 1 and 2
mutations." J Exp Med 207(2): 339-344.
Gunther, U. L., C. Ludwig, et al. (2000). "NMRLAB-Advanced NMR data processing in
matlab." J Magn Reson 145(2): 201-208.
Hakumaki, J. M., H. Poptani, et al. (1998). "Quantitative 1H nuclear magnetic resonance
diffusion spectroscopy of BT4C rat glioma during thymidine kinase-mediated gene
therapy in vivo: identification of apoptotic response." Cancer Res 58(17): 3791-3799.
Halestrap, A. P. and M. C. Wilson (2012). "The monocarboxylate transporter family--role and
regulation." IUBMB Life 64(2): 109-119.
Hallek, M. (2013). "Signaling the end of chronic lymphocytic leukemia: new frontline
treatment strategies." Blood 122(23): 3723-3734.
Hallek, M., B. D. Cheson, et al. (2008). "Guidelines for the diagnosis and treatment of chronic
lymphocytic leukemia: a report from the International Workshop on Chronic
Lymphocytic Leukemia updating the National Cancer Institute-Working Group 1996
guidelines." Blood 111(12): 5446-5456.
Hamanaka, R. and N. Chandel (2012). "Targeting glucose metabolism for cancer therapy." J
Exp Med 209(2): 211-215.
Hanahan, D. and R. Weinberg (2011). "Hallmarks of cancer: the next generation." Cell 144(5):
646-674.
Hanahan, D. and R. A. Weinberg (2000). "The hallmarks of cancer." Cell 100(1): 57-70.
Hanlon, E. B., R. Manoharan, et al. (2000). "Prospects for in vivo Raman spectroscopy." Phys
Med Biol 45(2): R1-59.
Harguindey, S., J. L. Arranz, et al. (2009). "Proton transport inhibitors as potentially selective
anticancer drugs." Anticancer Res 29(6): 2127-2136.
Harris, T., H. Degani, et al. (2013). "Hyperpolarized 13C NMR studies of glucose metabolism
in living breast cancer cell cultures." NMR Biomed 26(12): 1831-1843.

References
257
Harris, T., G. Eliyahu, et al. (2009). "Kinetics of hyperpolarized 13C1-pyruvate transport and
metabolism in living human breast cancer cells." Proc Natl Acad Sci U S A 106(43):
18131-18136.
Harrison, R. (2002). "Structure and function of xanthine oxidoreductase: where are we now?"
Free Radic Biol Med 33(6): 774-797.
Hashimoto, H., M. Kubota, et al. (1992). "Effect of high-dose methotrexate on plasma
hypoxanthine and uridine levels in patients with acute leukemia or non-Hodgkin
lymphoma in childhood." Leukemia 6(11): 1199-1202.
Hayden, R. E., G. Pratt, et al. (2012). "Treatment of chronic lymphocytic leukemia requires
targeting of the protective lymph node environment with novel therapeutic
approaches." Leuk Lymphoma 53(4): 537-549.
Herishanu, Y., P. Perez-Galan, et al. (2011). "The lymph node microenvironment promotes B-
cell receptor signaling, NF-kappaB activation, and tumor proliferation in chronic
lymphocytic leukemia." Blood 117(2): 563-574.
Hirayama, A., K. Kami, et al. (2009). "Quantitative metabolome profiling of colon and
stomach cancer microenvironment by capillary electrophoresis time-of-flight mass
spectrometry." Cancer Res 69(11): 4918-4925.
Hoellenriegel, J., S. A. Meadows, et al. (2011). "The phosphoinositide 3'-kinase delta inhibitor,
CAL-101, inhibits B-cell receptor signaling and chemokine networks in chronic
lymphocytic leukemia." Blood 118(13): 3603-3612.
Hoult, D. I., S. J. Busby, et al. (1974). "Observation of tissue metabolites using 31P nuclear
magnetic resonance." Nature 252(5481): 285-287.
Huang, C. Y., W. T. Kuo, et al. (2013). "Resistance to hypoxia-induced necroptosis is
conferred by glycolytic pyruvate scavenging of mitochondrial superoxide in
colorectal cancer cells." Cell Death Dis 4: e622.
Huber, V., A. De Milito, et al. (2010). "Proton dynamics in cancer." J Transl Med 8: 57.
Hulleman, E., K. M. Kazemier, et al. (2009). "Inhibition of glycolysis modulates prednisolone
resistance in acute lymphoblastic leukemia cells." Blood 113(9): 2014-2021.
Hurtaud, C., C. Gelly, et al. (2007). "Glutamine stimulates translation of uncoupling protein
2mRNA." Cell Mol Life Sci 64(14): 1853-1860.
Jang, Y. Y. and S. J. Sharkis (2007). "A low level of reactive oxygen species selects for
primitive hematopoietic stem cells that may reside in the low-oxygenic niche." Blood
110(8): 3056-3063.
Jiang, P., W. Du, et al. (2014). "Regulation of the pentose phosphate pathway in cancer."
Protein Cell 5(8): 592-602.
Jitschin, R., A. D. Hofmann, et al. (2014). "Mitochondrial metabolism contributes to oxidative
stress and reveals therapeutic targets in chronic lymphocytic leukemia." Blood
123(17): 2663-2672.
Kaelin, W. G., Jr. and C. B. Thompson (2010). "Q&A: Cancer: clues from cell metabolism."
Nature 465(7298): 562-564.
Kallio, P. J., K. Okamoto, et al. (1998). "Signal transduction in hypoxic cells: inducible nuclear
translocation and recruitment of the CBP/p300 coactivator by the hypoxia-inducible
factor-1alpha." EMBO J 17(22): 6573-6586.
References
258
Kathagen, A., A. Schulte, et al. (2013). "Hypoxia and oxygenation induce a metabolic switch
between pentose phosphate pathway and glycolysis in glioma stem-like cells." Acta
Neuropathol 126(5): 763-780.
Kay, N. E., D. F. Jelinek, et al. (2001). "Angiogenesis in B-chronic lymphocytic leukemia."
Leuk Res 25(8): 709-710.
Keating, G. M. (2010). "Rituximab: a review of its use in chronic lymphocytic leukaemia, low-
grade or follicular lymphoma and diffuse large B-cell lymphoma." Drugs 70(11): 1445-
1476.
Keating, M. J., S. O'Brien, et al. (2005). "Early results of a chemoimmunotherapy regimen of
fludarabine, cyclophosphamide, and rituximab as initial therapy for chronic
lymphocytic leukemia." J Clin Oncol 23(18): 4079-4088.
Kennaway, N. G., N. R. Buist, et al. (1984). "Lactic acidosis and mitochondrial myopathy
associated with deficiency of several components of complex III of the respiratory
chain." Pediatr Res 18(10): 991-999.
Kennedy, K. M. and M. W. Dewhirst (2010). "Tumor metabolism of lactate: the influence and
therapeutic potential for MCT and CD147 regulation." Future Oncol 6(1): 127-148.
Keshari, K. R., J. Kurhanewicz, et al. (2010). "Hyperpolarized (13)C spectroscopy and an
NMR-compatible bioreactor system for the investigation of real-time cellular
metabolism." Magn Reson Med 63(2): 322-329.
Khajeh, M., M. A. Bernstein, et al. (2010). "A simple flowcell for reaction monitoring by
NMR." Magn Reson Chem 48(7): 516-522.
Kharfan-Dabaja, M. A., W. G. Wierda, et al. (2014). "Immunotherapy for chronic lymphocytic
leukemia in the era of BTK inhibitors." Leukemia 28(3): 507-517.
Kim, J. W., I. Tchernyshyov, et al. (2006). "HIF-1-mediated expression of pyruvate
dehydrogenase kinase: a metabolic switch required for cellular adaptation to
hypoxia." Cell Metab 3(3): 177-185.
Kim, Y., Q. Lin, et al. (2009). "Hypoxic tumor microenvironment and cancer cell
differentiation." Curr Mol Med 9(4): 425-434.
Kini, A. R., N. E. Kay, et al. (2000). "Increased bone marrow angiogenesis in B cell chronic
lymphocytic leukemia." Leukemia 14(8): 1414-1418.
Kintner, D. B., M. K. Anderson, et al. (2000). "31P-MRS-based determination of brain
intracellular and interstitial pH: its application to in vivo H+ compartmentation and
cellular regulation during hypoxic/ischemic conditions." Neurochem Res 25(9-10):
1385-1396.
Ko, Y. H., B. L. Smith, et al. (2004). "Advanced cancers: eradication in all cases using 3-
bromopyruvate therapy to deplete ATP." Biochem Biophys Res Commun 324(1): 269-
275.
Kojima, H., H. Gu, et al. (2002). "Abnormal B lymphocyte development and autoimmunity in
hypoxia-inducible factor 1alpha -deficient chimeric mice." Proc Natl Acad Sci U S A
99(4): 2170-2174.
Koppenol, W. H., P. L. Bounds, et al. (2011). "Otto Warburg's contributions to current
concepts of cancer metabolism." Nat Rev Cancer 11(5): 325-337.
Koshland, D. E., Jr. (1963). "Correlation of Structure and Function in Enzyme Action." Science
142(3599): 1533-1541.
References
259
Kovacevic, Z. (1971). "The pathway of glutamine and glutamate oxidation in isolated
mitochondria from mammalian cells." Biochem J 125(3): 757-763.
Kung, A. L., S. D. Zabludoff, et al. (2004). "Small molecule blockade of transcriptional
coactivation of the hypoxia-inducible factor pathway." Cancer cell 6(1): 33-43.
Kurtoglu, M., J. C. Maher, et al. (2007). "Differential toxic mechanisms of 2-deoxy-D-glucose
versus 2-fluorodeoxy-D-glucose in hypoxic and normoxic tumor cells." Antioxid
Redox Signal 9(9): 1383-1390.
Laffel, L. (1999). "Ketone bodies: a review of physiology, pathophysiology and application of
monitoring to diabetes." Diabetes Metab Res Rev 15(6): 412-426.
Landau, D. A. and C. J. Wu (2013). "Chronic lymphocytic leukemia: molecular heterogeneity
revealed by high-throughput genomics." Genome Med 5(5): 47.
Lee, S. R., K. S. Yang, et al. (2002). "Reversible inactivation of the tumor suppressor PTEN by
H2O2." J Biol Chem 277(23): 20336-20342.
Lemons, J. M., X. J. Feng, et al. (2010). "Quiescent fibroblasts exhibit high metabolic activity."
PLoS Biol 8(10): e1000514.
Leni, Z., G. Parakkal, et al. (2013). "Emerging metabolic targets in the therapy of
hematological malignancies." Biomed Res Int 2013: 946206.
Leslie, N. R., D. Bennett, et al. (2003). "Redox regulation of PI 3-kinase signalling via
inactivation of PTEN." EMBO J 22(20): 5501-5510.
Lindon, J. C., E. Holmes, et al. (2006). "Metabonomics techniques and applications to
pharmaceutical research & development." Pharm Res 23(6): 1075-1088.
Lindon, J. C., J. K. Nicholson, et al. (2003). "Contemporary issues in toxicology the role of
metabonomics in toxicology and its evaluation by the COMET project." Toxicol Appl
Pharmacol 187(3): 137-146.
Lodi, A., S. Tiziani, et al. (2013). "Proton NMR-based metabolite analyses of archived serial
paired serum and urine samples from myeloma patients at different stages of disease
activity identifies acetylcarnitine as a novel marker of active disease." PLoS One 8(2):
e56422.
Longo, P. G., L. Laurenti, et al. (2008). "The Akt/Mcl-1 pathway plays a prominent role in
mediating antiapoptotic signals downstream of the B-cell receptor in chronic
lymphocytic leukemia B cells." Blood 111(2): 846-855.
Ludwig, C. and U. L. Gunther (2011). "MetaboLab--advanced NMR data processing and
analysis for metabolomics." BMC Bioinformatics 12: 366.
Ludwig, C. and M. R. Viant (2010). "Two-dimensional J-resolved NMR spectroscopy: review
of a key methodology in the metabolomics toolbox." Phytochem Anal 21(1): 22-32.
Ludwig, C., D. G. Ward, et al. (2009). "Fast targeted multidimensional NMR metabolomics of
colorectal cancer." Magn Reson Chem 47 Suppl 1: S68-73.
Lukey, M. J., K. F. Wilson, et al. (2013). "Therapeutic strategies impacting cancer cell
glutamine metabolism." Future Med Chem 5(14): 1685-1700.
Lyng, H., B. Sitter, et al. (2007). "Metabolic mapping by use of high-resolution magic angle
spinning 1H MR spectroscopy for assessment of apoptosis in cervical carcinomas."
BMC cancer 7: 11.
Ma, Y. L., W. J. Liu, et al. (2009). "[Study on specific metabonomic profiling of serum from
colorectal cancer patients by gas chromatography-mass spectrometry]." Zhonghua
Wei Chang Wai Ke Za Zhi 12(4): 386-390.
References
260
MacIntyre, D. A., B. Jimenez, et al. (2010). "Serum metabolome analysis by 1H-NMR reveals
differences between chronic lymphocytic leukaemia molecular subgroups." Leukemia
24(4): 788-797.
Maloney, D. G., B. Smith, et al. (2002). "Rituximab: mechanism of action and resistance."
Semin Oncol 29(1 Suppl 2): 2-9.
Mancuso, A., N. J. Beardsley, et al. (2004). "Real-time detection of 13C NMR labeling kinetics
in perfused EMT6 mouse mammary tumor cells and betaHC9 mouse insulinomas."
Biotechnol Bioeng 87(7): 835-848.
Mancuso, A., A. Zhu, et al. (2005). "Artificial tumor model suitable for monitoring 31P and
13C NMR spectroscopic changes during chemotherapy-induced apoptosis in human
glioma cells." Magn Reson Med 54(1): 67-78.
Mardis, E. R., L. Ding, et al. (2009). "Recurring mutations found by sequencing an acute
myeloid leukemia genome." N Engl J Med 361(11): 1058-1066.
Mardor, Y., O. Kaplan, et al. (2000). "Noninvasive real-time monitoring of intracellular cancer
cell metabolism and response to lonidamine treatment using diffusion weighted
proton magnetic resonance spectroscopy." Cancer Res 60(18): 5179-5186.
Martindale, J. L. and N. J. Holbrook (2002). "Cellular response to oxidative stress: signaling
for suicide and survival." J Cell Physiol 192(1): 1-15.
Mazurek, S. (2011). "Pyruvate kinase type M2: a key regulator of the metabolic budget
system in tumor cells." Int J Biochem Cell Biol 43(7): 969-980.
Mazurek, S., C. B. Boschek, et al. (2005). "Pyruvate kinase type M2 and its role in tumor
growth and spreading." Semin Cancer Biol 15(4): 300-308.
McKnight, S. L. (2010). "On getting there from here." Science 330(6009): 1338-1339.
Meehan, A. J., C. J. Eskey, et al. (1992). "Cultivator for NMR studies of suspended cell
cultures." Biotechnol Bioeng 40(11): 1359-1366.
Mehlen, P. and A. Puisieux (2006). "Metastasis: a question of life or death." Nature Reviews
Cancer 6(6): 449-458.
Menzel, T., Z. Rahman, et al. (1996). "Elevated intracellular level of basic fibroblast growth
factor correlates with stage of chronic lymphocytic leukemia and is associated with
resistance to fludarabine." Blood 87(3): 1056-1063.
Messmer, B. T., D. Messmer, et al. (2005). "In vivo measurements document the dynamic
cellular kinetics of chronic lymphocytic leukemia B cells." J Clin Invest 115(3): 755-
764.
Metallo, C. M., P. A. Gameiro, et al. (2012). "Reductive glutamine metabolism by IDH1
mediates lipogenesis under hypoxia." Nature 481(7381): 380-384.
Molica, S., G. Vitelli, et al. (1999). "Increased serum levels of vascular endothelial growth
factor predict risk of progression in early B-cell chronic lymphocytic leukaemia." Br J
Haematol 107(3): 605-610.
Mullen, A. R., W. W. Wheaton, et al. (2012). "Reductive carboxylation supports growth in
tumour cells with defective mitochondria." Nature 481(7381): 385-388.
Murray, A. W. (1971). "The biological significance of purine salvage." Annu Rev Biochem 40:
811-826.
Murray, J. A., F. L. Khanim, et al. (2010). "Combined bezafibrate and medroxyprogesterone
acetate have efficacy without haematological toxicity in elderly and relapsed acute
myeloid leukaemia (AML)." Br J Haematol 149(1): 65-69.
References
261
Nathan, C. and A. Ding (2010). "SnapShot: Reactive Oxygen Intermediates (ROI)." Cell
140(6): 951-951 e952.
Newsholme, P., J. Procopio, et al. (2003). "Glutamine and glutamate--their central role in cell
metabolism and function." Cell Biochem Funct 21(1): 1-9.
Nishio, M., T. Endo, et al. (2005). "Nurselike cells express BAFF and APRIL, which can
promote survival of chronic lymphocytic leukemia cells via a paracrine pathway
distinct from that of SDF-1alpha." Blood 106(3): 1012-1020.
O'Donnell-Tormey, J., C. F. Nathan, et al. (1987). "Secretion of pyruvate. An antioxidant
defense of mammalian cells." J Exp Med 165(2): 500-514.
Oberley, L. W. (1988). "Free radicals and diabetes." Free Radic Biol Med 5(2): 113-124.
Ong, E. S., L. Zou, et al. (2010). "Metabolic profiling in colorectal cancer reveals signature
metabolic shifts during tumorigenesis." Mol Cell Proteomics.
Oremek, G. M., S. Teigelkamp, et al. (1999). "The pyruvate kinase isoenzyme tumor M2 (Tu
M2-PK) as a tumor marker for renal carcinoma." Anticancer Res 19(4A): 2599-2601.
Orphanos, G. and P. Kountourakis (2012). "Targeting the HER2 receptor in metastatic breast
cancer." Hematol Oncol Stem Cell Ther 5(3): 127-137.
Oscier, D., C. Dearden, et al. (2012). "Guidelines on the diagnosis, investigation and
management of chronic lymphocytic leukaemia." Br J Haematol 159(5): 541-564.
OuYang, D., J. Xu, et al. (2011). "Metabolomic profiling of serum from human pancreatic
cancer patients using 1H NMR spectroscopy and principal component analysis."
Appl Biochem Biotechnol 165(1): 148-154.
Pacher, P., J. S. Beckman, et al. (2007). "Nitric oxide and peroxynitrite in health and disease."
Physiol Rev 87(1): 315-424.
Palomino-Schatzlein, M., P. V. Escrig, et al. (2011). "Evaluation of nonpolar metabolites in
plant extracts by 13C NMR spectroscopy." J Agric Food Chem 59(21): 11407-11416.
Panayiotidis, P., D. Jones, et al. (1996). "Human bone marrow stromal cells prevent apoptosis
and support the survival of chronic lymphocytic leukaemia cells in vitro." Br J
Haematol 92(1): 97-103.
Parker, T. L. and M. P. Strout (2011). "Chronic lymphocytic leukemia: prognostic factors and
impact on treatment." Discov Med 11(57): 115-123.
Pavlides, S., A. Tsirigos, et al. (2010). "The autophagic tumor stroma model of cancer: Role of
oxidative stress and ketone production in fueling tumor cell metabolism." Cell Cycle
9(17): 3485-3505.
Pearce, E. L., M. C. Poffenberger, et al. (2013). "Fueling immunity: insights into metabolism
and lymphocyte function." Science 342(6155): 1242454.
Pekarsky, Y., A. Palamarchuk, et al. (2008). "Tcl1 functions as a transcriptional regulator and
is directly involved in the pathogenesis of CLL." Proc Natl Acad Sci U S A 105(50):
19643-19648.
Pfeuffer, J., I. Tkac, et al. (1999). "Toward an in vivo neurochemical profile: quantification of
18 metabolites in short-echo-time (1)H NMR spectra of the rat brain." J Magn Reson
141(1): 104-120.
Pianet, I., P. Canioni, et al. (1992). "Beta-adrenergic stimulation of C6 glioma cells: effects of
cAMP overproduction on cellular metabolites. A multinuclear NMR study." Eur J
Biochem 209(2): 707-715.

References
262
Polanski, R., C. L. Hodgkinson, et al. (2014). "Activity of the monocarboxylate transporter 1
inhibitor AZD3965 in small cell lung cancer." Clin Cancer Res 20(4): 926-937.
Popovici-Muller, J., J. O. Saunders, et al. (2012). "Discovery of the First Potent Inhibitors of
Mutant IDH1 That Lower Tumor 2-HG in Vivo." ACS Med Chem Lett 3(10): 850-855.
Porporato, P. E., S. Dhup, et al. (2011). "Anticancer targets in the glycolytic metabolism of
tumors: a comprehensive review." Front Pharmacol 2: 49.
Portais, J. C., P. Voisin, et al. (1996). "Glucose and glutamine metabolism in C6 glioma cells
studied by carbon 13 NMR." Biochimie 78(3): 155-164.
Putri, S. P., Y. Nakayama, et al. (2013). "Current metabolomics: practical applications." J
Biosci Bioeng 115(6): 579-589.
Ramsay, A. D. and M. Rodriguez-Justo (2013). "Chronic lymphocytic leukaemia--the role of
the microenvironment pathogenesis and therapy." Br J Haematol 162(1): 15-24.
Ranjan, P., V. Anathy, et al. (2006). "Redox-dependent expression of cyclin D1 and cell
proliferation by Nox1 in mouse lung epithelial cells." Antioxid Redox Signal 8(9-10):
1447-1459.
Renault, M., L. Shintu, et al. (2013). "Slow-spinning low-sideband HR-MAS NMR
spectroscopy: delicate analysis of biological samples." Sci Rep 3: 3349.
Robinson, B. H., N. McKay, et al. (1985). "Defective intramitochondrial NADH oxidation in
skin fibroblasts from an infant with fatal neonatal lacticacidemia." Am J Hum Genet
37(5): 938-946.
Robinson, M. M., S. J. McBryant, et al. (2007). "Novel mechanism of inhibition of rat kidney-
type glutaminase by bis-2-(5-phenylacetamido-1,2,4-thiadiazol-2-yl)ethyl sulfide
(BPTES)." Biochem J 406(3): 407-414.
Rohle, D., J. Popovici-Muller, et al. (2013). "An inhibitor of mutant IDH1 delays growth and
promotes differentiation of glioma cells." Science 340(6132): 626-630.
Roudier, E. and A. Perrin (2009). "Considering the role of pyruvate in tumor cells during
hypoxia." Biochim Biophys Acta 1796(2): 55-62.
Rubin, A. D. (1971). "Defective control of ribosomal RNA processing in stimulated leukemic
lymphocytes." J Clin Invest 50(12): 2485-2497.
Sakiyama, T., M. W. Musch, et al. (2009). "Glutamine increases autophagy under Basal and
stressed conditions in intestinal epithelial cells." Gastroenterology 136(3): 924-932.
Samudio, I., M. Fiegl, et al. (2009). "Mitochondrial uncoupling and the Warburg effect:
molecular basis for the reprogramming of cancer cell metabolism." Cancer Res 69(6):
2163-2166.
Samudio, I., M. Fiegl, et al. (2008). "The warburg effect in leukemia-stroma cocultures is
mediated by mitochondrial uncoupling associated with uncoupling protein 2
activation." Cancer Res 68(13): 5198-5205.
Samudio, I., R. Harmancey, et al. (2010). "Pharmacologic inhibition of fatty acid oxidation
sensitizes human leukemia cells to apoptosis induction." J Clin Invest 120(1): 142-156.
Sanfilippo, O., M. Camici, et al. (1994). "Relationship between the levels of purine salvage
pathway enzymes and clinical/biological aggressiveness of human colon carcinoma."
Cancer Biochem Biophys 14(1): 57-66.
Schafer, Z. T., A. R. Grassian, et al. (2009). "Antioxidant and oncogene rescue of metabolic
defects caused by loss of matrix attachment." Nature 461(7260): 109-113.
References
263
Schechter, A. N., D. H. Sachs, et al. (1972). "Nuclear magnetic resonance titration curves of
histidine ring protons. 3. Ribonuclease." J Mol Biol 71(1): 39-48.
Schroeder, M. A., H. J. Atherton, et al. (2009). "Real-time assessment of Krebs cycle
metabolism using hyperpolarized 13C magnetic resonance spectroscopy." FASEB J
23(8): 2529-2538.
Seagroves, T. N., H. E. Ryan, et al. (2001). "Transcription factor HIF-1 is a necessary mediator
of the pasteur effect in mammalian cells." Mol Cell Biol 21(10): 3436-3444.
Selenko, P. and G. Wagner (2007). "Looking into live cells with in-cell NMR spectroscopy." J
Struct Biol 158(2): 244-253.
Seligmann, H., R. Levi, et al. (2001). "Thiamine deficiency in patients with B-chronic
lymphocytic leukaemia: a pilot study." Postgrad Med J 77(911): 582-585.
Sharma, R. A., W. P. Steward, et al. (2006). "Toxicity profile of the immunomodulatory
thalidomide analogue, lenalidomide: phase I clinical trial of three dosing schedules in
patients with solid malignancies." Eur J Cancer 42(14): 2318-2325.
Shyh-Chang, N., G. Q. Daley, et al. (2013). "Stem cell metabolism in tissue development and
aging." Development 140(12): 2535-2547.
Silber, R., C. M. Farber, et al. (1992). "Glutathione depletion in chronic lymphocytic leukemia
B lymphocytes." Blood 80(8): 2038-2043.
Sison, E. A. and P. Brown (2011). "The bone marrow microenvironment and leukemia:
biology and therapeutic targeting." Expert Rev Hematol 4(3): 271-283.
Soto, G. E., Z. Zhu, et al. (1996). "Tumor 31P NMR pH measurements in vivo: a comparison
of inorganic phosphate and intracellular 2-deoxyglucose-6-phosphate as pHnmr
indicators in murine radiation-induced fibrosarcoma-1." Magn Reson Med 36(5): 698-
704.
Souers, A. J., J. D. Leverson, et al. (2013). "ABT-199, a potent and selective BCL-2 inhibitor,
achieves antitumor activity while sparing platelets." Nat Med 19(2): 202-208.
Star-Lack, J. M., E. Adalsteinsson, et al. (2000). "In vivo 1H MR spectroscopy of human head
and neck lymph node metastasis and comparison with oxygen tension
measurements." AJNR Am J Neuroradiol 21(1): 183-193.
Subarsky, P. and R. P. Hill (2003). "The hypoxic tumour microenvironment and metastatic
progression." Clin Exp Metastasis 20(3): 237-250.
Sun, R. C. and N. C. Denko (2014). "Hypoxic regulation of glutamine metabolism through
HIF1 and SIAH2 supports lipid synthesis that is necessary for tumor growth." Cell
Metab 19(2): 285-292.
Szyperski, T. (1995). "Biosynthetically directed fractional 13C-labeling of proteinogenic
amino acids. An efficient analytical tool to investigate intermediary metabolism." Eur
J Biochem 232(2): 433-448.
Takahashi, A., N. Ohtani, et al. (2006). "Mitogenic signalling and the p16INK4a-Rb pathway
cooperate to enforce irreversible cellular senescence." Nat Cell Biol 8(11): 1291-1297.
Takubo, K., N. Goda, et al. (2010). "Regulation of the HIF-1alpha level is essential for
hematopoietic stem cells." Cell Stem Cell 7(3): 391-402.
Tate, A. R., S. Crabb, et al. (1996). "Lipid metabolite peaks in pattern recognition analysis of
tumour in vivo MR spectra." Anticancer Res 16(3B): 1575-1579.
Tate, A. R., J. R. Griffiths, et al. (1998). "Towards a method for automated classification of 1H
MRS spectra from brain tumours." NMR Biomed 11(4-5): 177-191.
References
264
Tausch, E., D. Mertens, et al. (2014). "Advances in treating chronic lymphocytic leukemia."
F1000Prime Rep 6: 65.
Tennant, D. A., C. Frezza, et al. (2009). "Reactivating HIF prolyl hydroxylases under hypoxia
results in metabolic catastrophe and cell death." Oncogene 28(45): 4009-4021.
Tiziani, S., V. Lopes, et al. (2009). "Early stage diagnosis of oral cancer using 1H NMR-based
metabolomics." Neoplasia 11(3): 269-276, 264p following 269.
Trachootham, D., J. Alexandre, et al. (2009). "Targeting cancer cells by ROS-mediated
mechanisms: a radical therapeutic approach?" Nat Rev Drug Discov 8(7): 579-591.
Tura, S., M. Cavo, et al. (1984). "Lonidamine in the treatment of chronic lymphoid leukemia."
Oncology 41 Suppl 1: 90-93.
Tweeddale, H., L. Notley-McRobb, et al. (1998). "Effect of slow growth on metabolism of
Escherichia coli, as revealed by global metabolite pool ("metabolome") analysis." J
Bacteriol 180(19): 5109-5116.
Valcourt, J. R., J. M. Lemons, et al. (2012). "Staying alive: metabolic adaptations to
quiescence." Cell Cycle 11(9): 1680-1696.
van der Windt, G. J., D. O'Sullivan, et al. (2013). "CD8 memory T cells have a bioenergetic
advantage that underlies their rapid recall ability." Proc Natl Acad Sci U S A 110(35):
14336-14341.
Vander Heiden, M. G., L. C. Cantley, et al. (2009). "Understanding the Warburg effect: the
metabolic requirements of cell proliferation." Science 324(5930): 1029-1033.
Vannoni, D., B. Porcelli, et al. (1989). "[Purine metabolism in human tumors]." Medicina
(Firenze) 9(1): 51-54.
Varma, S. D. and K. R. Hegde (2007). "Lens thiol depletion by peroxynitrite. Protective effect
of pyruvate." Mol Cell Biochem 298(1-2): 199-204.
Velez, J., N. Hail, Jr., et al. (2013). "Mitochondrial uncoupling and the reprograming of
intermediary metabolism in leukemia cells." Front Oncol 3: 67.
Vergis, R., C. M. Corbishley, et al. (2008). "Intrinsic markers of tumour hypoxia and
angiogenesis in localised prostate cancer and outcome of radical treatment: a
retrospective analysis of two randomised radiotherapy trials and one surgical cohort
study." Lancet Oncol 9(4): 342-351.
Vernocchi, P., L. Vannini, et al. (2012). "Integration of datasets from different analytical
techniques to assess the impact of nutrition on human metabolome." Front Cell Infect
Microbiol 2: 156.
Wachsberger, P., R. Burd, et al. (2003). "Tumor response to ionizing radiation combined with
antiangiogenesis or vascular targeting agents: exploring mechanisms of interaction."
Clin Cancer Res 9(6): 1957-1971.
Wallace, D. C. (2012). "Mitochondria and cancer." Nat Rev Cancer 12(10): 685-698.
Wang, F., J. Travins, et al. (2013). "Targeted inhibition of mutant IDH2 in leukemia cells
induces cellular differentiation." Science 340(6132): 622-626.
Wang, J. B., J. W. Erickson, et al. (2010). "Targeting mitochondrial glutaminase activity
inhibits oncogenic transformation." Cancer cell 18(3): 207-219.
Wang, Y. H., W. J. Israelsen, et al. (2014). "Cell-state-specific metabolic dependency in
hematopoiesis and leukemogenesis." Cell 158(6): 1309-1323.
Warburg, O. (1956). "On the origin of cancer cells." Science 123(3191): 309-314.
References
265
Warburg, O., F. Wind, et al. (1927). "THE METABOLISM OF TUMORS IN THE BODY." The
Journal of general physiology 8(6): 519-530.
Ward, P. S. and C. B. Thompson (2012). "Metabolic reprogramming: a cancer hallmark even
warburg did not anticipate." Cancer cell 21(3): 297-308.
Wartenberg, M., F. C. Ling, et al. (2003). "Regulation of the multidrug resistance transporter
P-glycoprotein in multicellular tumor spheroids by hypoxia-inducible factor (HIF-1)
and reactive oxygen species." FASEB J 17(3): 503-505.
Weigelt, B., J. L. Peterse, et al. (2005). "Breast cancer metastasis: markers and models." Nat
Rev Cancer 5(8): 591-602.
Weinhouse, S. (1976). "The Warburg hypothesis fifty years later." Z Krebsforsch Klin Onkol
Cancer Res Clin Oncol 87(2): 115-126.
Wellen, K. E. and C. B. Thompson (2010). "Cellular metabolic stress: considering how cells
respond to nutrient excess." Mol Cell 40(2): 323-332.
Wiechert, W. (2001). "13C metabolic flux analysis." Metab Eng 3(3): 195-206.
Wierda, W. G., T. J. Kipps, et al. (2010). "Ofatumumab as single-agent CD20 immunotherapy
in fludarabine-refractory chronic lymphocytic leukemia." J Clin Oncol 28(10): 1749-
1755.
Wiestner, A. (2013). "Targeting B-Cell receptor signaling for anticancer therapy: the Bruton's
tyrosine kinase inhibitor ibrutinib induces impressive responses in B-cell
malignancies." J Clin Oncol 31(1): 128-130.
Williams, S. N., M. L. Anthony, et al. (1998). "Induction of apoptosis in two mammalian cell
lines results in increased levels of fructose-1,6-bisphosphate and CDP-choline as
determined by 31P MRS." Magn Reson Med 40(3): 411-420.
Wise, D. R., R. J. DeBerardinis, et al. (2008). "Myc regulates a transcriptional program that
stimulates mitochondrial glutaminolysis and leads to glutamine addiction." Proc Natl
Acad Sci U S A 105(48): 18782-18787.
Wise, D. R. and C. B. Thompson (2010). "Glutamine addiction: a new therapeutic target in
cancer." Trends Biochem Sci 35(8): 427-433.
Wu, P. S. and G. Otting (2005). "Rapid pulse length determination in high-resolution NMR." J
Magn Reson 176(1): 115-119.
Wullschleger, S., R. Loewith, et al. (2006). "TOR signaling in growth and metabolism." Cell
124(3): 471-484.
Xu, R. H., H. Pelicano, et al. (2005). "Synergistic effect of targeting mTOR by rapamycin and
depleting ATP by inhibition of glycolysis in lymphoma and leukemia cells."
Leukemia 19(12): 2153-2158.
Xu, W., H. Yang, et al. (2011). "Oncometabolite 2-hydroxyglutarate is a competitive inhibitor
of alpha-ketoglutarate-dependent dioxygenases." Cancer cell 19(1): 17-30.
Yang, C., C. Harrison, et al. (2014). "Simultaneous steady-state and dynamic 13C NMR can
differentiate alternative routes of pyruvate metabolism in living cancer cells." J Biol
Chem 289(9): 6212-6224.
Yoo, B. C., S. Y. Kong, et al. (2010). "Identification of hypoxanthine as a urine marker for non-
Hodgkin lymphoma by low-mass-ion profiling." BMC cancer 10: 55.
Yuneva, M., N. Zamboni, et al. (2007). "Deficiency in glutamine but not glucose induces
MYC-dependent apoptosis in human cells." J Cell Biol 178(1): 93-105.

References
266
Zhang, W., D. Trachootham, et al. (2012). "Stromal control of cystine metabolism promotes
cancer cell survival in chronic lymphocytic leukaemia." Nat Cell Biol 14(3): 276-286.
Zhao, S., Y. Lin, et al. (2009). "Glioma-derived mutations in IDH1 dominantly inhibit IDH1
catalytic activity and induce HIF-1alpha." Science 324(5924): 261-265.
Zhao, Y., E. Butler, et al. (2013). "Targeting cellular metabolism to improve cancer
therapeutics." Cell death & disease 4.
Zhao, Y., H. Liu, et al. (2011). "Overcoming trastuzumab resistance in breast cancer by
targeting dysregulated glucose metabolism." Cancer Res 71(13): 4585-4597.
Zhou, M., Y. Zhao, et al. (2010). "Warburg effect in chemosensitivity: targeting lactate
dehydrogenase-A re-sensitizes taxol-resistant cancer cells to taxol." Mol Cancer 9: 33.

Appendices

Appendix
268
Appendix A1: Buffers and Recipes
2.3.2 Cell Cycle Buffer
30µg PI, 0.1mM NaCl2, 1% (w/v) sodium citrate, 0.1% Triton X100 in ddH2O
2.8.4 10x TBE Buffer
108g Tris base, 55g Boric acid, 9.3g EDTA made up to 1L in ddH2O. Diluted to 1 x before
use.
2.9.1 RIPA buffer
1% (v/v) NP40, 0.5% (w/v) sodium deoxycholate, 0.1% (w/v) SDS in distilled water. Kept
at 4ºC. Protease inhibitor added prior to use.
2.9.2 Buffers and gels used for SDS PAGE and Western Blot
4x SDS gel loading buffer
62.5mM Tris HCl pH6.8, 25% ( v/v) glycerol, 2% (v/v) SDS, 5% (v/v) 2-β-ME, Bromophenol
Blue, in distilled water. Stored at RT.
10% Resolving gel
30% Bis/Acrylamide (Geneflow) 3.3ml
1.5M Tris HCl pH8.8 2.5ml
10% (v/v) SDS 0.1ml
Distilled water 4.1ml
10% Ammonium persulphate ((w/v)APS; Sigma) 60µl
TEMED (VWR international) 4.5µl
Stacking gel
30 % Bis/Acrylamide 440µl
0.5M Tris HCl pH6.8 830µl
10% (w/v)SDS 33µl
Appendix
269
distilled water 2.03ml
10% (w/v)APS 16.7µl
TEMED 1.7µl
1x SDS gel running buffer
25mM Tris, 192mM glycine, 3.5mM SDS in distilled water
2.9.3 Solutions used for the Protein Transfer
Transfer buffer
25mM Tris, 192mM glycine, 20% (v/v) methanol in distilled water
TBS-T
137mM NaCl, 20mM Tris HCl pH 7.6, 0.2% (v/v) Tween20 in distilled water
5% blocking solution
5% (w/v) milk powder (Marvel) in TBS-T

Appendix

Appendix
Related Documents


