Journal of Thermal Analysis, Vol. 48 (1997) 277-286 REAL TIME MASS SPECTROMETRIC STUDY OF TEMPERATURE PROGRAMMED DECOMI~SITION OF CuSO4-5H20 M. Kamruddin, P K. Ajikumar, S. Dash, R. Krishnan, A. K. Tyagi and K. Krishan Materials Science Division, Indira Gandhi Centre for Atomic Research, Kalpakkam 603 102, Tamil Nadu, India (Received October 10, 1995; in revised form March 20, 1996) Abstract A facility based on real time multiple ion detection trend analysis mass spectrometry has been set up in our laboratory for studying thermal decomposition behaviour of inorganic solids. The system has been used for studying decomposition of CuSO4.5H20. Non-isothermal kinetic rate expressions based on random nucleation and 3-d phase boundary migration (for dehydration stage), 3-d diffusion and 3-d phase boundary migration (for decomposition stage) were found to have significant correlations with Evolved Gas Analysis (EGA) data. Brief description of the ex- perimental facility along with physical explanations behind compliance of EGA data to above models are discussed. Keywords: activation energy, diffusion, evolved gas analysis, mass spectrometry, solid state ki- netics, thermal decomposition Introduction An experimental facility for studying non-isothermal solid state kinetics of ther- mal decomposition of inorganic salts through Evolved Gas Analysis (EGA) by quadrupole mass spectrometry has been set-up [1, 2]. The apparatus based on the EGA principle has a distinct edge over the other thermoanalytical techniques like thermogravimetry in terms of fast detection, high sensitivity, specificity and identi- fication of evolved species. Therefore, real time mass spectrometry can be used to trace reaction pathways besides yielding results on Arrhenius parameters [3-7]. The equipment developed by us was used to study Temperature Programmed Vacuum decomposition of CuSOa.5H20. The real time mass spectrometry data ob- tained in the temperature domain (300-1100 K) has been utilized for constructing decomposition profiles. The fractional decomposition parameter (et) has been used to assess various kinetic equation models through the integral functions g(a) ap- proach [8, 9]. 0368--4466/97/$ 5. O0 1997Akadgmiai Kiad6, Budapest John Wiley & Sons, Limited Chichester

Welcome message from author
This document is posted to help you gain knowledge. Please leave a comment to let me know what you think about it! Share it to your friends and learn new things together.
Transcript
Journal of Thermal Analysis, Vol. 48 (1997) 277-286
REAL TIME MASS SPECTROMETRIC STUDY OF TEMPERATURE PROGRAMMED DECOMI~SITION OF CuSO4-5H20
M. Kamruddin, P K. Ajikumar, S. Dash, R. Krishnan, A. K. Tyagi and K. Krishan Materials Science Division, Indira Gandhi Centre for Atomic Research, Kalpakkam 603 102, Tamil Nadu, India
(Received October 10, 1995; in revised form March 20, 1996)
Abstract
A facility based on real time multiple ion detection trend analysis mass spectrometry has been set up in our laboratory for studying thermal decomposition behaviour of inorganic solids. The system has been used for studying decomposition of CuSO4.5H20. Non-isothermal kinetic rate expressions based on random nucleation and 3-d phase boundary migration (for dehydration stage), 3-d diffusion and 3-d phase boundary migration (for decomposition stage) were found to have significant correlations with Evolved Gas Analysis (EGA) data. Brief description of the ex- perimental facility along with physical explanations behind compliance of EGA data to above models are discussed.
Keywords: activation energy, diffusion, evolved gas analysis, mass spectrometry, solid state ki- netics, thermal decomposition
Introduction
An experimental facility for studying non-isothermal solid state kinetics of ther- mal decomposition of inorganic salts through Evolved Gas Analysis (EGA) by quadrupole mass spectrometry has been set-up [1, 2]. The apparatus based on the EGA principle has a distinct edge over the other thermoanalytical techniques like thermogravimetry in terms of fast detection, high sensitivity, specificity and identi- fication of evolved species. Therefore, real time mass spectrometry can be used to trace reaction pathways besides yielding results on Arrhenius parameters [3-7].
The equipment developed by us was used to study Temperature Programmed Vacuum decomposition of CuSOa.5H20. The real time mass spectrometry data ob- tained in the temperature domain (300-1100 K) has been utilized for constructing decomposition profiles. The fractional decomposition parameter (et) has been used to assess various kinetic equation models through the integral functions g(a) ap- proach [8, 9].
0368--4466/97/$ 5. O0
�9 1997Akadgmiai Kiad6, Budapest John Wiley & Sons, Limited
Chichester
278 KAMRUDDIN et al.: THERMAL DECOMPOSITION
E x p e r i m e n t a l
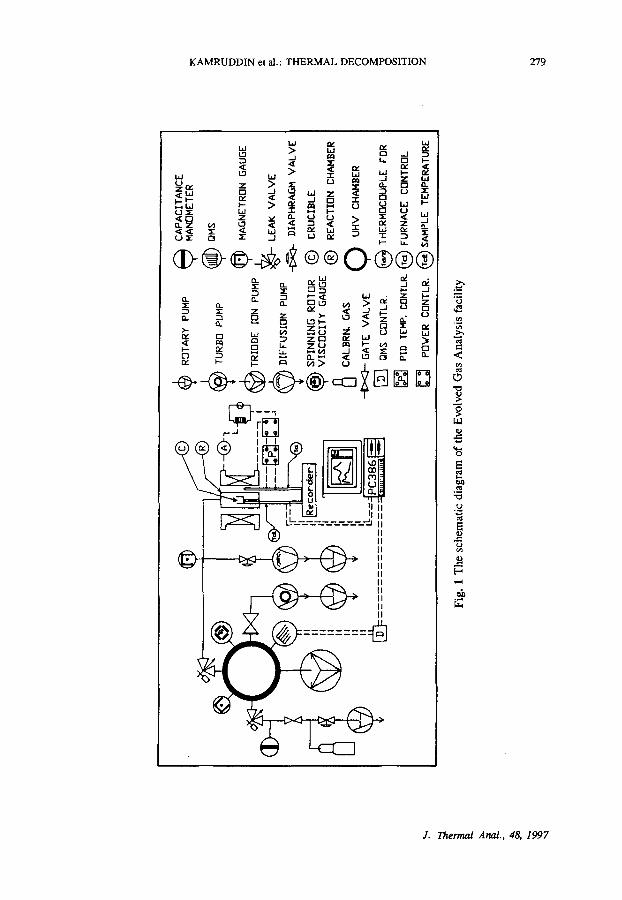
Figure 1 gives the schematic of the experimental facility developed by us for studying temperature programmed decomposition of inorganic solids under high vacuum conditions. The vacuum condition ensures integrity of the evolved species by avoiding gas phase recombination and reverse reactions which may lead to incor- rect signals. In our facility a high temperature high vacuum compatible quartz re- action chamber is appended to an ultrahigh vacuum mass spectrometer chamber through a variable conductance molecular leak valve. The high vacuum quartz re- action chamber is evacuable to a pressure of 1.0xl0 -7 mbar by a rotary-diffusion pump combination. The all metal ultrahigh vacuum chamber is pumped by turbo- molecular pump and triode sputter ion pump to a base pressure of 5x 10 -1~ mbar. Besides the quadrupole mass spectrometer (QMS), the UHV chamber is equipped with other vacuum metrological hardware like magnetron gauge, spinning rotor gauge and calibration has inlets.
The quartz reaction chamber is equipped with membrane manometer and leak valves for furnace atmosphere pressure control. Hot inert gas purging is used to eliminate chances of capillary condensation. A programmable temperature control- ler in conjunction with a thyristor controlled power supply enable the furnace to achieve a maximum temperature of 1400 K at typical ramp rates ranging between 3 to 15 K min -1. Two calibrated K-type chromel/alumel thermocouples procured from M/S. Degussa AG, Germany, one to control and record the furnace tempera- ture and the other to measure the sample temperature, are used (Fig. 1). A multi- pen strip chart recorder is used to track temperature besides other process parame- ters. In addition to this a PC based thermocouple add-on-card is used to read tem- perature through the data acquisition software.
Calibration of the EGA system is executed by leaking known quantities of gas through a molecular leak valve. Also there is facility to calibrate the mass spec- trometer against absolute pressure measurement through Spinning Rotor Viscosity Gauge.
For obtaining temperature programmed multiple ion detection real time trend analysis mass spectra over a wide dynamic pressure regime, a PC based software has been developed by us. The software is designed to track ion intensities of 8 dif- ferent masses (m/z) quasi-simultaneously through RS232C interface of the quadru- pole mass spectrometer. The temperature dependent multichannel trend analysis spectra are constructed by plotting ion intensities against the rising temperature sig- nal tracked by PC based thermocouple add-on-card.
Results
The EGA system is used to study programmed temperature decomposition of (~tiSO4.5H20 in vacuum at heating rates of 3-14 K rain -1 for sample weight of 100 rag. The powder sample was taken in a cylindrical alumina crucible and spread
J. Thermal AnaL, 48, 1997
",,,I
ROTARY PUMP
MANOMETER
MAGNETRON GAUGE
---I I
TRIODE II~N PUMP
..j,.
..,
iI L
. ~
V
ISC
I3C
ITY
GAU
GE
I 1
CALB
RN
. GAS
I
'
m
I I t
' "
"; ~
i_J
~
UH
V C
HAM
BER
L-
~p
![--
-J-c
38
~
%
G
AT
E V
AL
VE
:__-
~_:~
........... ,
6--
I []
Q
MS
CD
NTL
R,
~
THER
MBC
DUPL
E FD
R
[] P
ID T
EMP.
CBN
TLR. ~
FU
RN
ACE
CnN
TRrlL
[]
PFI
VER
CrlN
TLR
. ~
SAM
PLE
TEM
PERAT
URE
w
Fig.
1 T
he s
chem
atic
dia
gram
of
the
Evo
lved
Gas
Ana
lysi
s fa
cilit
y
7:
P-.
t'l'1
t'-'
o o
r~
t~
'.,I
~0
280 KAMRUDDIN et al.: THERMAL DECOMPOSITION
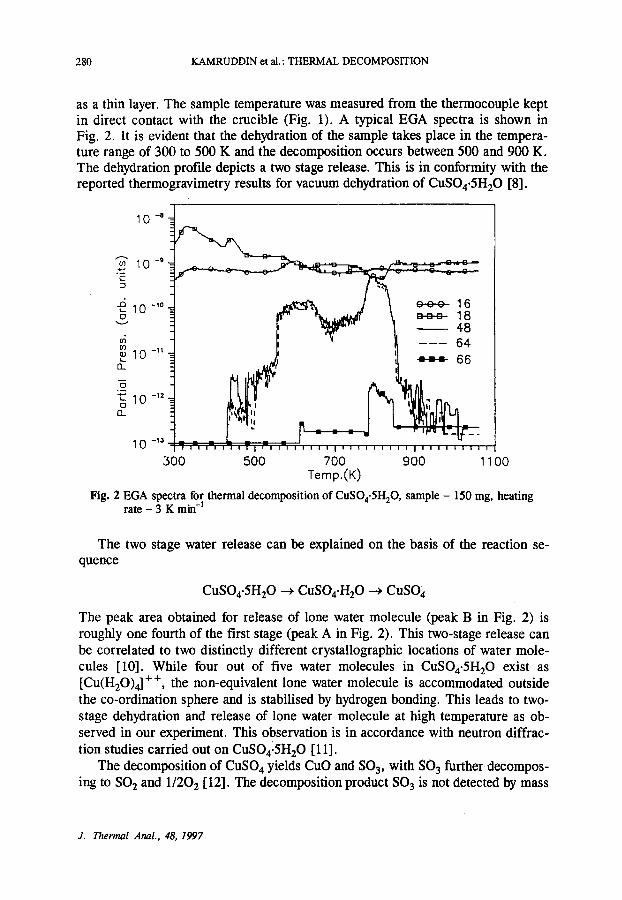
as a thin layer. The sample temperature was measured from the thermocouple kept in direct contact with the crucible (Fig. 1). A typical EGA spectra is shown in Fig. 2. It is evident that the dehydration of the sample takes place in the tempera- ture range of 300 to 500 K and the decomposition occurs between 500 and 900 K. The dehydration profile depicts a two stage release. This is in conformity wkh the reported thermogravimetry results for vacuum dehydration of CuSO4.5H20 [8].
I 0 -a
~ ~ N I ~ ~.
"~" 10 -~ "- "-' c =
1 0 - , o c c c 16 o = = = 18
" ~ - 4 8 ~A f ,D
10 -,1 ~ ~ 6 6
10 -12 13- I~ I II
_ - ,
1 0 -13 . i i i i i = ~ I T I i - - I i - - i i i , i i i i i z 1 . i i i i l i i t i i i i , i
3 0 0 5 0 0 7 0 0 9 0 0 11 O0 T e m p . ( K )
Fig. 2 EGA spectra for thermal decomposition of CuSO4.5H20, sample - 150 mg, heating rate - 3 K min -1
The two stage water release can be explained on the basis of the reaction se- quence
CuSO4"5H20 ~ CuSO4"H20 ~ CuSO 4
The peak area obtained for release of lone water molecule (peak B in Fig. 2) is roughly one fourth of the first stage (peak A in Fig. 2). This two-stage release can be correlated to two distinctly different crystallographic locations of water mole- cules [10]. While four out of five water molecules in CuSOn.5H20 exist as [Cu(H20)4] ++, the non-equivalent lone water molecule is accommodated outside the co-ordination sphere and is stabilised by hydrogen bonding. This leads to two- stage dehydration and release of lone water molecule at high temperature as ob- served in our experiment. This observation is in accordance with neutron diffrac- tion studies carried out on CuSOa.5H20 [11].
The decomposition of CuSO 4 yields CuO and SO 3, with SO 3 further decompos- ing to SO 2 and 1/202 [12]. The decomposition product SO 3 is not detected by mass
J. Thermal Anal., 48, 1997
KAMRUDDIN et al.: THERMAL DECOMPOSITION 281
spectrometer in our experiment perhaps due to its instability in oxygen deficient high temperature environment which is in agreement with the earlier work [8]. The ion SO~ along with its fragments formed by electron impact ionization in the ion source of the quadrupole mass spectrometer was detected. The ions O +, SO + and SO~ were observed and their intensities are depicted in the EGA spectra shown in Fig. 2. The oxide of higher isotope of sulphur 34SO2 have also been observed. The ratio of peak areas inscribed by these two oxides roughly corresponds to the natural abundance ratio i.e. 4%.
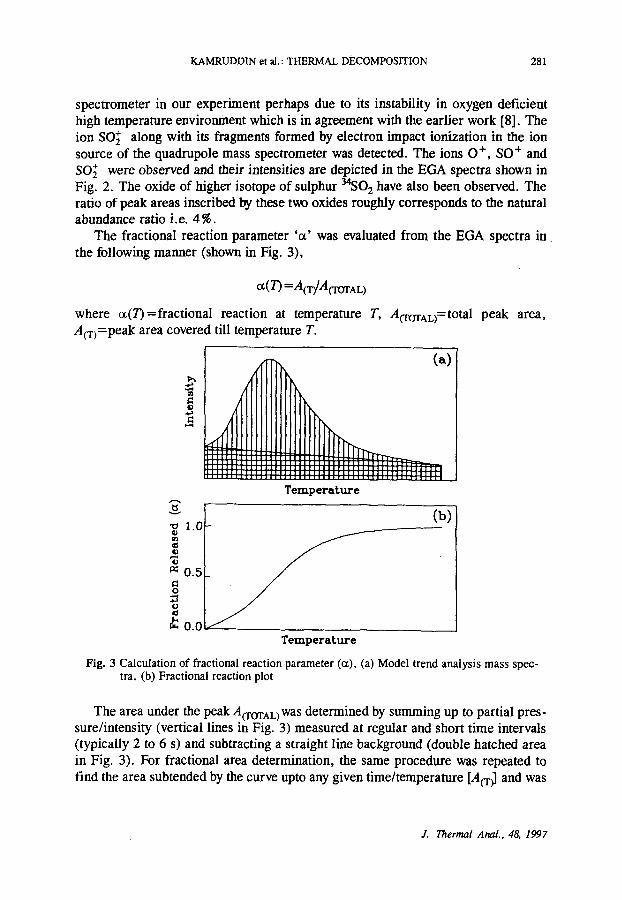
The fractional reaction parameter ' a ' was evaluated from the EGA spectra i n the following manner (shown in Fig. 3),
oc(T) =A(T/A (TOTAL)
where ~(T)=fractional reaction at temperature T, AfforAL)=total peak area, A(T)=peak area covered till temperature T.
(a)
I I I I I I ~ | l | | l l l i i | l l l l ~ l l l | l l l l l ] l l l l l l ! i i i i l 1 1 1 1 i i | 1 | | 1 ~ i l l 1 | . . . . . . . . .
Tempera tu re
1.0 g)
,.~
0.5
0
~-. 0.0
(b)
Tempera tu re
Fig. 3 Calculation of fractional reaction parameter (ct), (a) Model trend analysis mass spec- tra, (b) Fractional reaction plot
The area under the peak AOUFAL) was determined by summing up to partial pres- sure/intensity (vertical lines in Fig. 3) measured at regular and short time intervals (typically 2 to 6 s) and subtracting a straight line background (double hatched area in Fig. 3). For fractional area determination, the same procedure was repeated to find the area subtended by the curve upto any given time/temperature [A(T ~ and was
J. Thermal Anal., 48, 1997
282 KAMRUDDIN et al.: THERMAL DECOMPOSITION
1.0
~ ' 0 . 8 V
"%3 (D
0.6 {3
n- 0.4 r
o
*d E 0.2
b_
0.0 300
Decomposition
ydrotion
. , 11"/ I I I I I I I I I [ 1 I I I I / I I I | 1 I I I
500 700 Temp.(K)
1 I I I
900
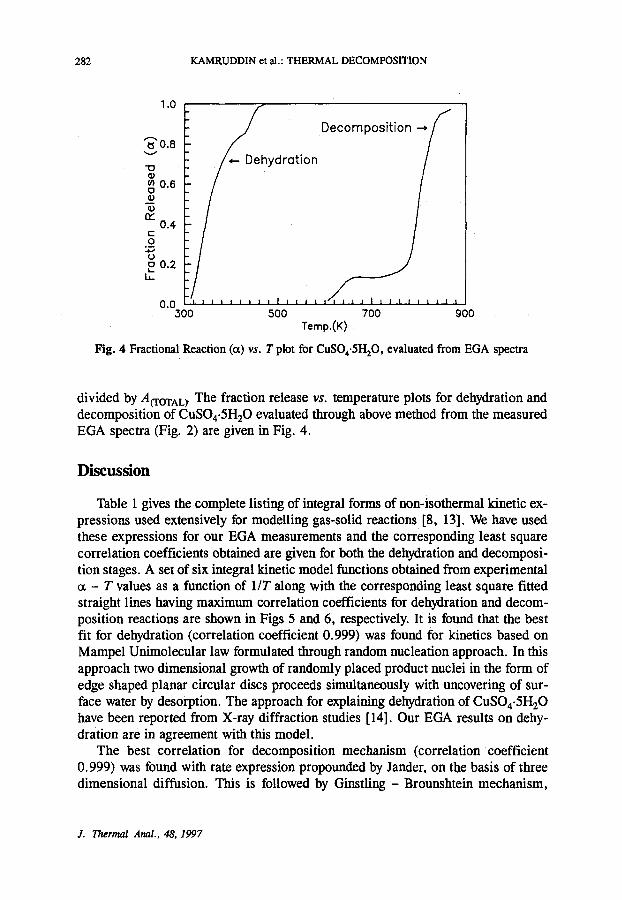
Fig. 4 Fractional Reaction (ct) vs. T plot for CuSO4.5H20, evaluated from EGA spectra
divided by AffOrAL~ The fraction release vs. temperature plots for dehydration and decomposition of CuSO4.5H20 evaluated through above method from the measured EGA spectra (Fig. 2) are given in Fig. 4.
Discuss ion
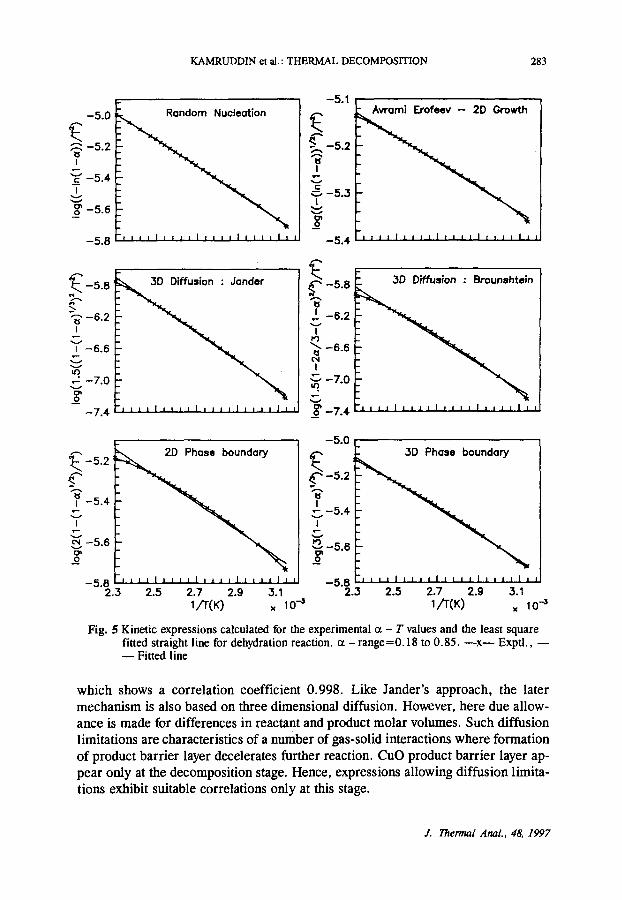
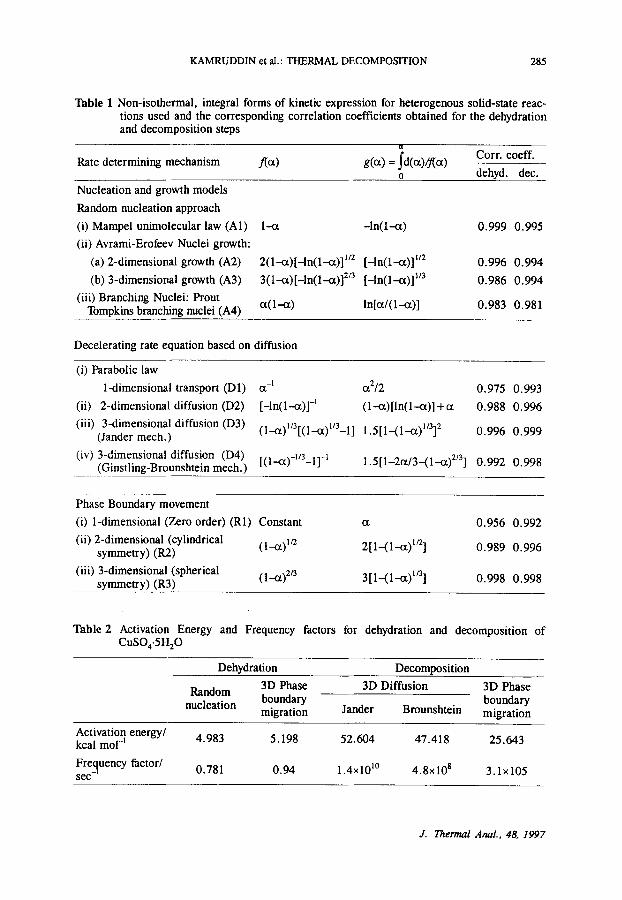
Table 1 gives the complete listing of integral forms of non-isothermal kinetic ex- pressions used extensively for modelling gas-solid reactions [8, 13]. We have used these expressions for our EGA measurements and the corresponding least square correlation coefficients obtained are given for both the dehydration and decomposi- tion stages. A set of six integral kinetic model functions obtained from experimental ot - T values as a function of 1 / T along with the corresponding least square fitted straight lines having maximum correlation coefficients for dehydration and decom- position reactions are shown in Figs 5 and 6, respectively. It is found that the best fit for dehydration (correlation coefficient 0.999) was found for kinetics based on Mampel Unimolecular law formulated through random nucleation approach. In this approach two dimensional growth of randomly placed product nuclei in the form of edge shaped planar circular discs proceeds simultaneously with uncovering of sur- face water by desorption. The approach for explaining dehydration of CuSO4.5H20 have been reported from X-ray diffraction studies [14]. Our EGA results on dehy- dration are in agreement with this model.
The best correlation for decomposition mechanism (correlation coefficient 0.999) was found with rate expression propounded by Jander, on the basis of three dimensional diffusion. This is followed by Ginstling - Brounshtein mechanism,
J. Thermal Anal., 48, 1997
KAMRUDDIN et al.: THERMAL DECOMPOSITION 283
-5 .1 .~ -5.0 : ~ a n d o m Nucleation ~
- 5 . 2 - ~ - 5 . 2 "
I C'c -5.4 S_. ~ - 5 . 3
- 5 . 6 -
5 8 ~ l * l l J t l t I l i J l l l l * J l l * _ _ 5 . J r I I I I I I J I I t J r J I t J I J I J
r" ~ = 3 " 0 Diffusion : dander ~ _5.5 ~ D "D~ffu;ion "= - Brou;shtei; ~-5.8
"-,.
_~': -7.0 I- ~- ~ -7.0 _ 7 4 1 - 1 i f J I * I t I 1 i J i i I i * J J I J o ~ _ 7 . 4 r J i J J I = J J J I I i J J I , r i J I J i
-5.2
-5.4 v
1
- 5 . 6
0
- 5 . 8 2.3
~ D Phase boundary
I 1 1 I I I I I I I I I I I I I I 1 1 I
2.5 2.7 2.9 3.1 1 / ' T ( K ) = 10 -3
-5.0
~'~-5.2
-5.4 I
,-~-5.6 o
- 5 . 8 2.3
~ D Phase boundary
i I I I I I I * i I i t I i I I I 1 * I I i
2.5 2.7 2.9 3.1 1/T(K) x 10 4
Fig. 5 Kinetic expressions calculated for the experimental ct - T values and the least square fitted straight line for dehydration reaction, ct - range=0.18 to 0.85. - - x - - Exptl,, - - - - Fitted line
which shows a correlation coefficient 0.998. Like Jander's approach, the later mechanism is also based on three dimensional diffusion. However, here due allow- ance is made for differences in reactant and product molar volumes. Such diffusion limitations are characteristics of a number of gas-solid interactions where formation of product barrier layer decelerates further reaction. CuO product barrier layer ap- pear only at the decomposition stage. Hence, expressions allowing diffusion limita- tions exhibit suitable correlations only at this stage.
J. Thern~l Anal., 48, 1997
,,.,, - 6 .0 v.. ~ -6 .4
~ - 6 . 8
1 ~ -7 .2
~ -7 .6 _o
-8 .0
Random Nucleotlon
i i o -6.2 I t l l l l l t l l l i = l = J J t l l = l l l l J J l l
~ 1 1 1 1 1 f I I I I I I l i i l l l | l I I I [ I I 1 !
g-
T -6 .8
I ~ -7 .2
! ~. -7 .6
.~ -8 .0
: - 5 . 7
~ -5 .9 I
~" - 6 . 1
"~ -6 .3
I I I I I I I 1 1 1 1 1 1 | 1 1 1 1 | 1 1 1 1 | 1 1 1 1
-5 .7
- 5 . 9
r
I -6 .1
I
04 "-" - 6 . 3 ~n o
~ l l I l l l : l l l l ~ [ t l l l l l l l I l t l l = - 6 . 5 - 6 , 5 t l t l t l r
284 KAMRUDDIN et al.: THERMAL DECOMPOSITION
1.12 1,1'5 1.17 1.20 1.22 1.25 1.27 1.12 1.15 1.17 1.20 1.22 1,25 1.27 1/T(K) x 10 -= 1/T(K) x 10 "a
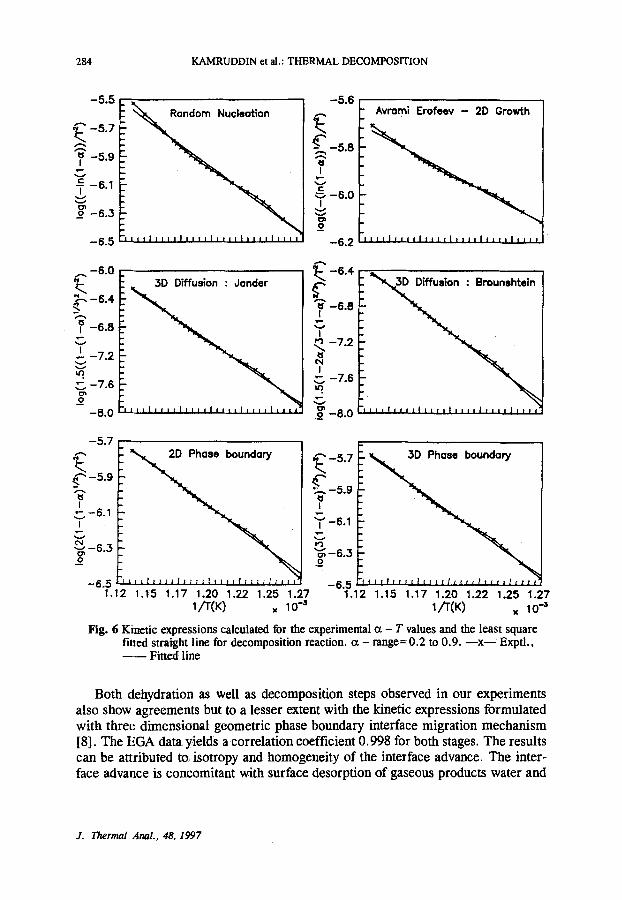
Fig. 6 Emetic expressions calculated for the experimental ct - T values and the least square fitted straight line for decomposition reaction, ct - range=0.2 to 0.9. - - x - - Exptl.,
Fitted line
Both dehydrat ion as well as decomposi t ion steps observed in our exper iments also show agreements but to a lesser extent with the kinetic expressions formula ted wi th three d imens iona l geometr ic phase boundary interface migrat ion m e c h a n i s m [8]. The EGA data yields a cor re la t ion coefficient 0.998 for both stages. The results can be at tr ibuted to~ isotropy and homogenei ty of the interface advance. The inter- face advance is concomitant with surface desorpt ion of gaseous products water and
J. Thermal Anal., 48, 1997
KAMRUDDIN et al.: THERMAL DECOMPOSITION 285
Table 1 Non-isothermal, integral forms of kinetic expression for heterogenous solid-state reac- tions used and the corresponding correlation coefficients obtained for the dehydration and decomposition steps
Rate determining mechanism f(ct)
Nucleation and growth models
Random nucleation approach
(i) Mampel unimolecular law (A1)
(ii) Avrami-Erofeev Nuclei growth:
(a) 2-dimensional growth (A2)
(b) 3-dimensional growth (A3)
(iii) Branching Nuclei: Prout Tompkins branching nuclei (A4)
Ix
g(ct) = j'd(ot)/J~ot) Corr. coeff. o dehyd, dec.
1-ct -ln(1--~)
2(1--r [-In(I--ix)] La [-In(I-t0] x/2
3(1--~)[-ln(1--c0] 2/3 [-ln(1--ct)] v3
ct(1--~) ln[tx/(1--tx)]
0.999 0.995
0.996 0.994
0.986 0.994
0.983 0.981
Decelerating rate equation based on diffusion
(i) Parabolic law
1-dimensional transport (D1)
(ii) 2-dimensional diffusion (D2)
(iii) 3-dimensional diffusion (D3) (Jander mech.)
(iv) 3-dimensional diffusion (D4) (Ginstling-Brounshtein mech.)
Ct -1 Ct2/2 0.975 0.993
[--ln(1--ct)] -1 (1--~x)[In(1--~)] + ct 0.988 0.996
(I--ct)1/3[(1--~)1/3-1] 1.5[1-(1-ct)1/3] 2 0.996 0.999
[(1--ct)-1:3-1] -1 1.5[1-2et/3-(1--ct) 2/3] 0.992 0.998
Phase Boundary movement
(i) 1-dimensional (Zero order) (R1) Constant
(ii) 2-dimensional (cylindrical (l..ct)V2 symmetry) (R2)
(iii) 3-dimensional (spherical (1..ct)2/3 symmetry) (R3)
cx 0.956 0.992
2[1-(1--ct) It2] 0.989 0.996
3[1-(1--r 1/3] 0.998 0.998
Table 2 Activation Energy and Frequency factors for dehydration and decomposition of CuSO4'5H20
Dehydration Decomposition
3D Phase 3D Diffusion 3D Phase Random nucleation boundary boundary
migration Jander Brounshtein migration
Activation energy/ 4.983 5.198 52.604 47.418 25.643 kcal mo1-1
Freguency factor/ 0.781 0.94 1.4•176 4.8• I0 s 3.1• s e c
J. Thermal Anal., 48, 1997
286 KAMRUDDIN et al.: THERMAL DECOMPOSITION
sulphur trioxide. The activation energy and frequency factors derived by making use of the above expressions are given in Table 2.
Conclusion
The EGA system developed by us has been used to study the thermal decompo- sition of CuSO4.5H20. Standard non-isothermal kinetic rate expressions were used to arrive at the reaction mechanism and reaction parameters. It is also our observa- tion that mass spectrometric data obtained through thermal decomposition can be used as a supplementary information for structural elucidation and material identi- fication.
The authors duly acknowledge K. Govindarajan for providing the high purity material. We also acknowledge B. Purniah for instrumentation support. We thank J. Janaki and G. V. N. Rao for useful discussions.
References
1 M. Kamruddin, P. K. Ajikumar, S. Dash, B. Purniah, A. K. Tyagi and K. Krishan, Instru- mentation Science and Technology, 23 (2) (1995) 123.
2 S. Dash, M. Kamruddin, P. K. Ajikumar, A. K. Tyagi and K. Krishan, Int. Conf. Vacuum Science & Technology and SRS Vacuum Systems, #46, 1995, Indore, India.
3 H. G. Langer, 'Evolved Gas Analysis', Treatise on Analytical Chemistry, Part I, Vol. 12, (2nd edn), E J. Elving (Ed), John Wiley & Sons, New York 1983, pp. 229-341.
4 P. K. Gallagher, Thermochim. Acta, 26 (1978) 175. 5 P. K. Gallagher, J. Thermal Anal., 25 (1982) 7. 6 D. Price, D. Dollimore, N. S. Fatemi and R. Whitehead, Thermoehim. Acta, 42 (1980) 323. 7 D. Price, N. Fatemi, D. Dollimore and R. Whitehead, Thermochim. Acta, 94 (1985) 313. 8 Reactions in the solid state: Comprehensive Chemical Kinetics, Vol. 22 C. H. Bamford and
C. E H. Tipper (Eds), Elsevier, Amsterdam 1980, pp. 41-114. 9 J. Sestak, V. Satava and W. W. Wendlandt, Thermoehim. Acta, 7 (1973) 447.
10 A. E Wells, Structural Inorganic Chemistry (5th edn) Clarendon Press, Oxford 1990. 11 T. C. W. Mak and G. Du Zhou, Crystallography in modern chemistry, John Wiley & Sons
Inc., 1992. 12 T. Leskela, M. Lippmaa, L. Niinisto and P. Soininen, Thermochim. Acta, 214 (1993) 9. 13 Ahmed M. Gadalla, Thermochim. Acta, 95 (1985) 179. 14 A. I. Zagray, V. V. Zyryanov, N. Z. Lyakhov, A. P. Chupakhin and V. V. Boldyrev, Thermo-
chim. Acta, 29 (1979) 115.
J. Thermal Anal., 48, 1997
Related Documents