Real-time estimation of surgical procedure duration Paalvast M 1 1 Delft University of Technology, Delft, the Netherlands Abstract— Each surgical procedure varies in length. There’s a need for dynamic planning to have an optimal patient flow from their beds to the operating room. This paper proposes an adaptive system that predicts the end of a gallbladder removal surgery 25 minutes in advance with the use of Support Vector Machines based on the activations of the electrosurgical device; To advise the staff on having the next patient prepared for surgery. The system was tested in the real environment, where it showed reliable results and outperformed the hospitals staff who usually had the next patient be prepared too early. With appropriate changes and given more time the system performance could be further improved. Keywords— surgical workflow; pattern recognition; machine learning; support vector machines; estimation of procedure duration; real-time I. INTRODUCTION As the population is aging and technology advances new innovations allow previously non-treatable diseases to be treated, healthcare expenses are increasing[1]. The operating room (OR) plays a significant role in the hospital being the largest cost and revenue center[2]. Therefore, it is important to run the OR as efficiently as possible[3]. Every surgical procedure varies in length, due to many factors (e.g. complications, the surgeon‟s experience, and patient anatomy). Hence efficiently scheduling the OR is a complex task requiring an adaptive system[4]. Figure 1 shows data gathered from laparoscopic cholecystectomy procedures held at Reinier de Graaf Gasthuis hospital (RdGG) 1 between 01/2013 and 10/2014. The x-axis shows the total surgical procedure length from the first incision till the last stitch. The y-axis shows the time between patient retrieval and starting of the surgery. Roughly 25 minutes of this time is planned for preparation, while the rest is time the patient waits for the start of his or her surgery. The large variation on the x-axis shows the need for an adaptive system, while y-axis shows that the majority of the patients have to wait an unnecessarily long amount of time. During the course of a surgical procedure the next patient is already prepared for surgery. Preparation time of a patient consists of the time it takes to retrieve the patient (15 min) and make necessary preparations (10 min) before entering the OR. RdGG aims to keep the preparation time below 25 minutes. Between the surgical procedures there‟s roughly 1 Reinier de Graaf Gasthuis hospital, Delft, The Netherlands (https://reinierdegraaf.nl/) another ten minutes where the OR is cleaned up for the next surgery. At RdGG the anesthesia nurse in the OR notifies the nursing department to start preparing the next patient, usually through a phone call. For an optimal flow between departments the OR the anesthesia nurse needs to notify the nursing department at the correct moment to leave enough time to prepare the patient and keep the waiting time till his or her operation to a minimum. Figure 1: Laparoscopic Cholecystectomy procedure data RdGG With the help of machine learning techniques it is possible to create an adaptive scheduling system, using data obtained from monitoring the workflow in the OR[5], which has seen increasing attention in the last few years[6]. Previous research has been focusing on using monitored data from the OR to estimate different phases during a procedure. Various methods to monitor the OR have been researched such as eye-gaze tracking[7], manual instrument usage tracking[5, 8-13], staff position tracking[14], 3D motion flow tracking[15], vital sign monitoring[16], 3D ultrasound instrument tracking[17], instrument tracking through radio frequency identification[18-22], instrument tracking through video recordings[23-25], and more. These systems have yet to be introduced in the real environment[26], because they are too complex, too intrusive, and rely on data of a full surgical procedure. A functional system in the OR will need to make a prediction in real-time, i.e. only having procedure data available up till that point during the procedure. A practical method will need

Welcome message from author
This document is posted to help you gain knowledge. Please leave a comment to let me know what you think about it! Share it to your friends and learn new things together.
Transcript
Real-time estimation of surgical procedure duration
Paalvast M1
1 Delft University of Technology, Delft, the Netherlands
Abstract— Each surgical procedure varies in length.
There’s a need for dynamic planning to have an optimal
patient flow from their beds to the operating room. This paper
proposes an adaptive system that predicts the end of a
gallbladder removal surgery 25 minutes in advance with the
use of Support Vector Machines based on the activations of the
electrosurgical device; To advise the staff on having the next
patient prepared for surgery. The system was tested in the real
environment, where it showed reliable results and
outperformed the hospitals staff who usually had the next
patient be prepared too early. With appropriate changes and
given more time the system performance could be further
improved.
Keywords— surgical workflow; pattern recognition; machine
learning; support vector machines; estimation of procedure
duration; real-time
I. INTRODUCTION
As the population is aging and technology advances new innovations allow previously non-treatable diseases to be treated, healthcare expenses are increasing[1]. The operating room (OR) plays a significant role in the hospital being the largest cost and revenue center[2]. Therefore, it is important to run the OR as efficiently as possible[3].
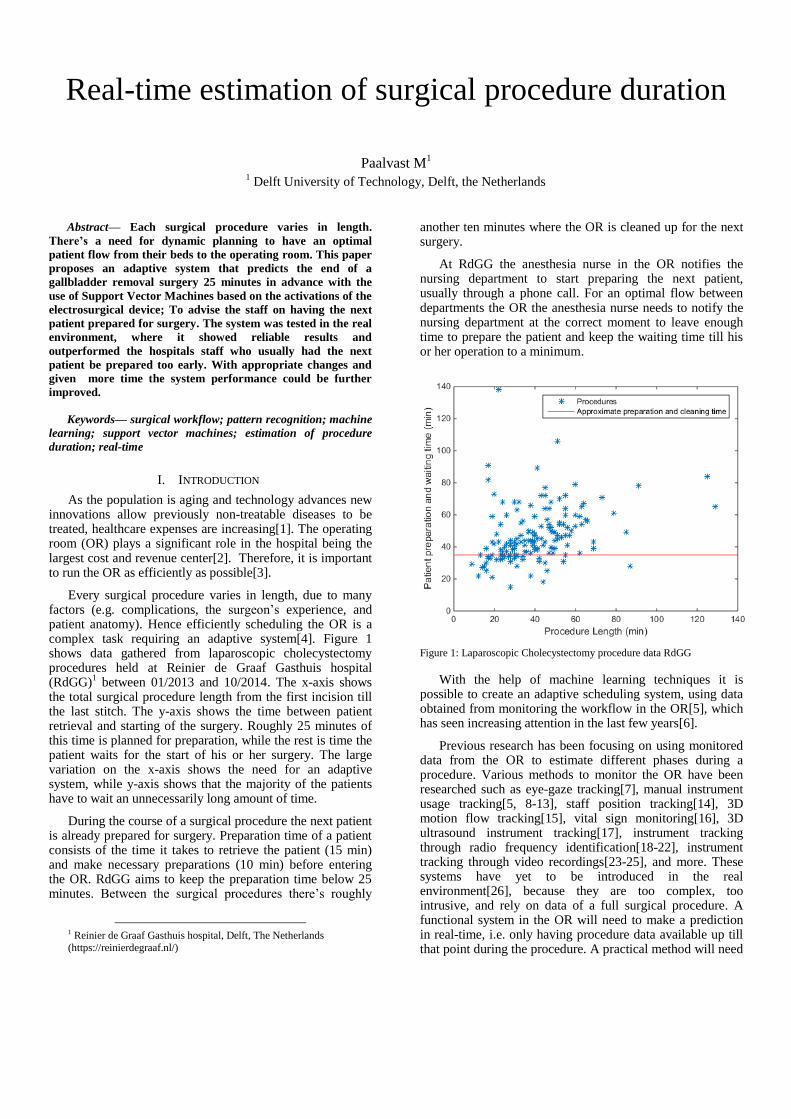
Every surgical procedure varies in length, due to many factors (e.g. complications, the surgeon‟s experience, and patient anatomy). Hence efficiently scheduling the OR is a complex task requiring an adaptive system[4]. Figure 1 shows data gathered from laparoscopic cholecystectomy procedures held at Reinier de Graaf Gasthuis hospital (RdGG)
1 between 01/2013 and 10/2014. The x-axis shows
the total surgical procedure length from the first incision till the last stitch. The y-axis shows the time between patient retrieval and starting of the surgery. Roughly 25 minutes of this time is planned for preparation, while the rest is time the patient waits for the start of his or her surgery. The large variation on the x-axis shows the need for an adaptive system, while y-axis shows that the majority of the patients have to wait an unnecessarily long amount of time.
During the course of a surgical procedure the next patient is already prepared for surgery. Preparation time of a patient consists of the time it takes to retrieve the patient (15 min) and make necessary preparations (10 min) before entering the OR. RdGG aims to keep the preparation time below 25 minutes. Between the surgical procedures there‟s roughly
1 Reinier de Graaf Gasthuis hospital, Delft, The Netherlands
(https://reinierdegraaf.nl/)
another ten minutes where the OR is cleaned up for the next surgery.
At RdGG the anesthesia nurse in the OR notifies the nursing department to start preparing the next patient, usually through a phone call. For an optimal flow between departments the OR the anesthesia nurse needs to notify the nursing department at the correct moment to leave enough time to prepare the patient and keep the waiting time till his or her operation to a minimum.
Figure 1: Laparoscopic Cholecystectomy procedure data RdGG
With the help of machine learning techniques it is possible to create an adaptive scheduling system, using data obtained from monitoring the workflow in the OR[5], which has seen increasing attention in the last few years[6].
Previous research has been focusing on using monitored data from the OR to estimate different phases during a procedure. Various methods to monitor the OR have been researched such as eye-gaze tracking[7], manual instrument usage tracking[5, 8-13], staff position tracking[14], 3D motion flow tracking[15], vital sign monitoring[16], 3D ultrasound instrument tracking[17], instrument tracking through radio frequency identification[18-22], instrument tracking through video recordings[23-25], and more. These systems have yet to be introduced in the real environment[26], because they are too complex, too intrusive, and rely on data of a full surgical procedure. A functional system in the OR will need to make a prediction in real-time, i.e. only having procedure data available up till that point during the procedure. A practical method will need
to remain simple and not intrusive. To create a functional system this will focus on predicting the end of the surgery 25 minutes in advance (the time needed to prepare the next patient) using monitored data available until that point in time. This results in a dynamic scheduling system that focuses on improving patient flow and thus reduces unnecessarily waiting time
Data about the procedure is collected by monitoring cues in the OR that yields information about the course of the operation. Previous research[5, 8-13, 17-25], has shown that instrument usage is capable of yielding this information. While this previous research often focused on tracking multiple instruments a single instrument may already yield enough information to make a reliable prediction. This data can be used in machine learning to train an algorithm using data from previous procedures (training samples) to create a „prediction model‟[27]. Electrical instrument usage is easy to track by measuring the current used by the device, making it the ideal instruments for the purpose of making a prediction.
The aim of this study was to create a prediction model capable of estimating remaining procedure duration during the course of a procedure through measuring device utilization applicable for a broad range of procedures and to test the usability of this prediction system in a real-environment.
II. METHOD
Laparoscopic cholecystectomy procedure was selected as the surgical procedure to monitor. In this surgical procedure the gallbladder of the patient is removed using minimal invasive surgery. The laparoscopic cholecystectomy procedure is a common procedure[10], which allows for easy data acquisition and testing of a system. It is also highly standardized [24], which makes predictions more accurate (, due to the samples used for training the system being more representative for future surgical procedures). The data was collected from the RdGG.
During laparoscopic cholecystectomy procedure tissue is cut to release the gallbladder for the liver and the ducts, and bleeding tissue is coagulated. This is done using an electrosurgical device where high-frequency electric current is used for both cutting and coagulation (Appendix VI.A). In the RdGG the devices used for this are the Covidien Force FX or Covidien Force Triad
2. By monitoring the current used
by the device it is possible to see when the device used by surgeon. This was done using the Digital Operating Room Assistant (DORA) current sensor developed by Arjan van Dijke at the TUDelft (Appendix VI.B). The DORA current sensor is placed between the power plug of the device and socket in the OR and logs the current used by the device in intervals of approximately 1/9
th of a second.
A. Prediction Model
Using pattern recognition an algorithm is trained to make a prediction based on the data extracted from the device
2 Electrosurgical devices, by Covidien (http://www.covidien.com)
(Appendix VI.C). Two classes were used to separate whether a next patient could be called for preparation. A class that tells that the surgery takes less than 25 minutes and a class that tells the surgery still lasts longer than 25 minutes. The 25 minute mark indicates the time required to prepare a patient for surgery and was based on past procedure data collected from RdGG (Figure 1) and interviews in the hospital. The additional 10 minutes used for cleaning up the OR will be used as a cushion as it is preferable to have the patient wait a small amount of time than having OR downtime.
Sample data was gathered from the RdGG where the current sensor was placed inside the OR to continuously log the current usage of the electrosurgical device. Operations were filtered out from this data by using the hospitals internal system ChipSoft EZIS
3. The time of the first incision
(„begin surgical procedure‟) and the last stitch („end surgical procedure‟) were used for this. A total of 55 samples (surgeries) were obtained through this.
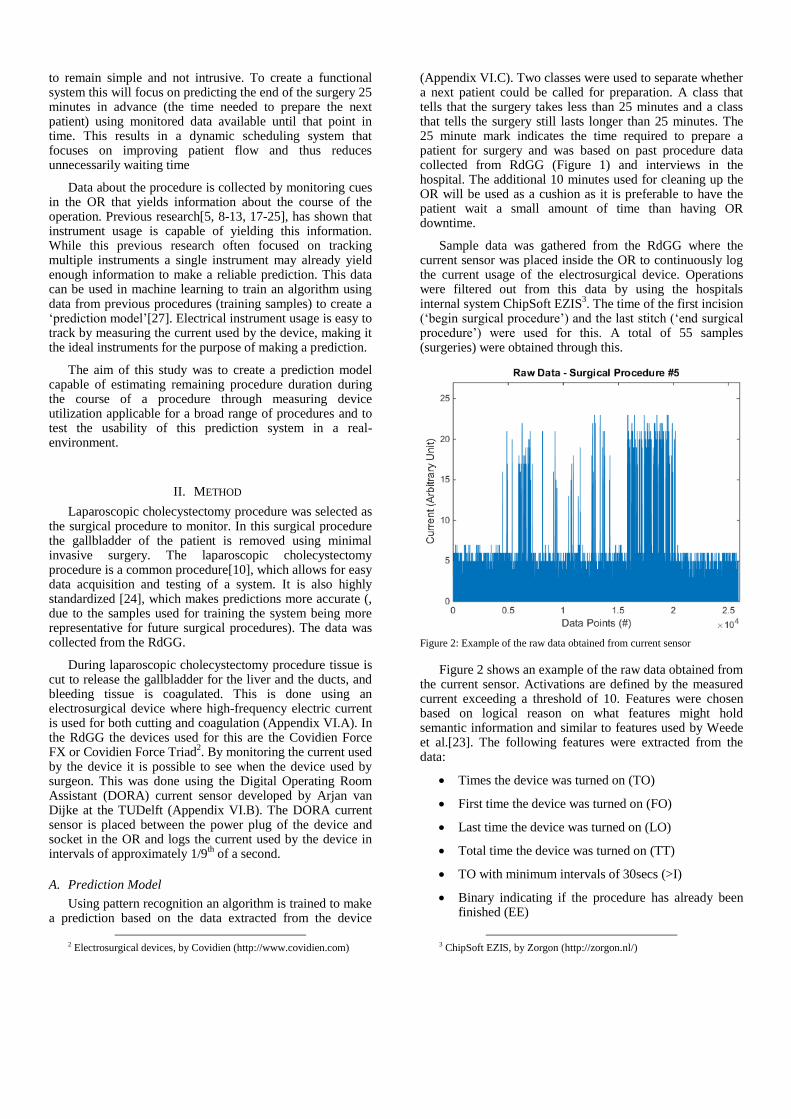
Figure 2: Example of the raw data obtained from current sensor
Figure 2 shows an example of the raw data obtained from the current sensor. Activations are defined by the measured current exceeding a threshold of 10. Features were chosen based on logical reason on what features might hold semantic information and similar to features used by Weede et al.[23]. The following features were extracted from the data:
Times the device was turned on (TO)
First time the device was turned on (FO)
Last time the device was turned on (LO)
Total time the device was turned on (TT)
TO with minimum intervals of 30secs (>I)
Binary indicating if the procedure has already been finished (EE)
3 ChipSoft EZIS, by Zorgon (http://zorgon.nl/)

The features were standardized to have the same mean and standard deviation to make each feature weight the same in classification (Appendix VI.C.3). Using forward feature selection it was determined what features negatively affected the performance and should be removed (Appendix VI.C.8). Additionally various features on patient and surgeon (patient age, BMI, surgeon ID, and assistant surgeon ID) were tested, but turned out to negatively influence the performance and where thus abandoned (Appendix VI.D). The main classifiers used in the research involving instrument tracking[5, 8-13, 17-25] were Dynamic Time Warping, Hidden Markov Models and Support Vector Machines. Dynamic Time Warping requires a fully recorded procedure before it can be used, so this method wasn‟t usable for the purpose of making a prediction during a procedure[9]. Constructing a Hidden Markov Model is difficult due to the many states modeling each surgical step. Therefore, focus was shifted towards Support Vector Machines[25]. Due to ease of switching classifiers within PRTools various other classifies were also tested, but Support Vector Machines was found to still yield the best performance (Appendix VI.E).
Starting at 15 minutes after the start of the surgery the classifier makes its first prediction on whether or not the next patient can be prepared. If it is determined that the next patient still has to wait the system will keep making prediction every five minutes until it is determined that the next patient can be prepared, or until 45 minutes have past. Therefore 6 classifiers had to be trained (one for 15, 20, 25, 30, 35 and 45 minutes). The 15 and 45 minute mark were decided based on the availability of data to train the system on. A prediction every five minutes deemed adequate, as start and end time weren‟t always filled in precisely by the staff, and kept the amount of classifier to train to a minimum (useful when a lot of computation time is needed, such as having a lot of training samples). The features were extracted from the current sensor logs using a custom script build in Matlab R2014b student suite
4. Classifiers were trained and
tested using PRTools5 (third-party statistical toolbox for
Matlab).
B. Prototype
The prediction model was built into a prototype to allow testing in a real environment and obtain feedback about its performance and functionality from the hospital staff involved.
1) DORA Server The central point in the prototype is the DORA server
6
and runs at the TUDelft. The main purpose of the server is preserving a database in Structured Query Language (SQL). The server is accessible by each separate entity in the system through the internet. The DORA Server stores all the data gathered from the different entities in the SQL-database, and can read and write data from and to the database. A separate table keeps track of the status of each entity, allowing them
4 Matlab R2014b student suite, by Mathworks
(http://www.mathworks.com/) 5 PRTools, by 37steps (http://www.37steps.com/) 6 DORA server (http://dora.tudelft.nl/)
to „communicate‟ with each other. A detailed flowchart of the communication between the entities is shown in Appendix VI.F.
The DORA Server also hosts a webpage in .html format, using third-party libraries provided by jQuery
7. The webpage
is accessible through the internet and is used for communication between the prototype and the user. The webpage can be accessed from the OR using a phone or tablet using an internet browser. It consists of four windows; a window that notifies the user that the prototype is waiting for Matlab to start up, a window that allows the user to start the application (Appendix VI.G Figure 11), a window that notifies the user the prototype is on hold, and lastly a dialog window when the prediction model determines it‟s time to prepare the next patient and asks for feedback on the accuracy of this prediction (Appendix VI.G Figure 12). Here the user gets three options (too early/on time/too late) to assess the prediction based on his or her thoughts on the current situation inside the OR. The feedback is stored in a table in the database together with the time between the start of the procedure and the prediction.
2) DORA Currentsensor The DORA current sensor as described previously is
used for monitoring the procedure. The Current sensor is connected with DORA server through the internet by a Wi-Fi connection or using the cellular network. It gathers information about the current used by the electrosurgical device and sends this data, together with the date and time to the DORA Server where it is stored.
3) Matlab Computer A computer at the TUDelft is used to extract the features
from the data and run the prediction model, done through a Matlab script. The script runs in a loop waiting for the DORA server to communicate through that the user started the application. After that the script waits for the next prediction, gathers the current sensor data, extracts the features, scales the features, and places them in the classifier to obtain a result. If it‟s still too early to prepare the next patient the script loops back and waits an additional five minutes. When it is time to prepare the next patient Matlab updates the status and places the results in the DORA server and loops back to the start of its script.
4) Phone or Tablet The webpage from the DORA server can be accessed
through any phone or tablet with internet browser and internet connection. It allows the user to start the prototype at the start of the procedure, to see when the prediction model determines when the next patient should be prepared and to give feedback on the prediction.
5) Questionnaire The anesthesia nurse present at the operation is informed
about the usage of the prototype. Feedback about the advice to call the next patient for preparation is collected through the webpages for each procedure. At the end of the day the anesthesia nurse will fill in a questionnaire about the
7 jQuery, by The jQuery Foundation (http://jquery.com/)
practicality, accuracy, and functionality of the prototype (Appendix VI.H).
III. RESULTS
A. Prediction Model Results
The prediction was tested on a set of 55 laparoscopic cholecystectomy procedures. Using forward feature selection it was determined that none of the features negatively affected the performance of the system and thus all features were further used (Appendix VI.C.8). 70% of the data was used to train the classifier and the remaining data was used for testing the performance (Appendix VI.C.4). Using 25-cross validation (Appendix VI.C.5) a mean error and standard deviation were obtained for each of the classifiers (see Table 1).
Table 1: Error rates of all classifiers
Mean Error Std Error
15 min Classifier 0.25176 0.096836
20 min Classifier 0.30824 0.113
25 min Classifier 0.22118 0.081932
30 min Classifier 0.20706 0.08165
35 min Classifier 0.16 0.073077
40 min Classifier 0.21412 0.091256
45 min Classifier 0.14353 0.08504
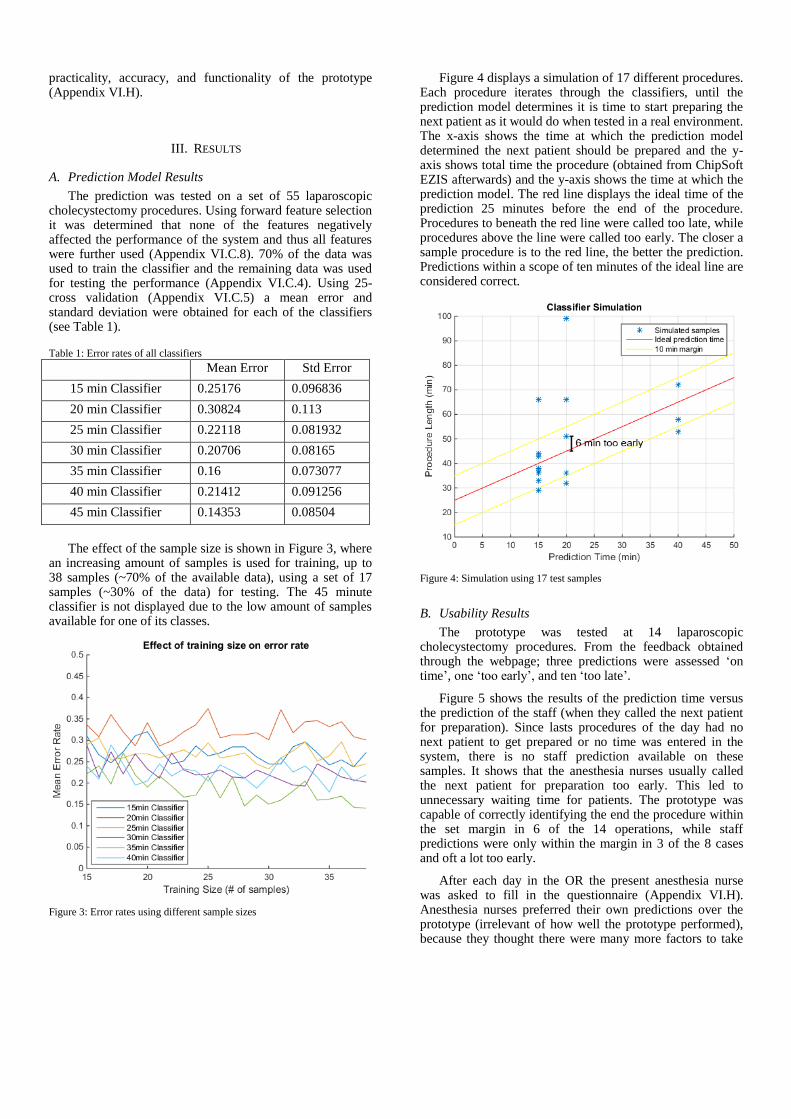
The effect of the sample size is shown in Figure 3, where an increasing amount of samples is used for training, up to 38 samples (~70% of the available data), using a set of 17 samples (~30% of the data) for testing. The 45 minute classifier is not displayed due to the low amount of samples available for one of its classes.
Figure 3: Error rates using different sample sizes
Figure 4 displays a simulation of 17 different procedures. Each procedure iterates through the classifiers, until the prediction model determines it is time to start preparing the next patient as it would do when tested in a real environment. The x-axis shows the time at which the prediction model determined the next patient should be prepared and the y-axis shows total time the procedure (obtained from ChipSoft EZIS afterwards) and the y-axis shows the time at which the prediction model. The red line displays the ideal time of the prediction 25 minutes before the end of the procedure. Procedures to beneath the red line were called too late, while procedures above the line were called too early. The closer a sample procedure is to the red line, the better the prediction. Predictions within a scope of ten minutes of the ideal line are considered correct.
Figure 4: Simulation using 17 test samples
B. Usability Results
The prototype was tested at 14 laparoscopic cholecystectomy procedures. From the feedback obtained through the webpage; three predictions were assessed „on time‟, one „too early‟, and ten „too late‟.
Figure 5 shows the results of the prediction time versus the prediction of the staff (when they called the next patient for preparation). Since lasts procedures of the day had no next patient to get prepared or no time was entered in the system, there is no staff prediction available on these samples. It shows that the anesthesia nurses usually called the next patient for preparation too early. This led to unnecessary waiting time for patients. The prototype was capable of correctly identifying the end the procedure within the set margin in 6 of the 14 operations, while staff predictions were only within the margin in 3 of the 8 cases and oft a lot too early.
After each day in the OR the present anesthesia nurse was asked to fill in the questionnaire (Appendix VI.H). Anesthesia nurses preferred their own predictions over the prototype (irrelevant of how well the prototype performed), because they thought there were many more factors to take

into account (e.g. kids were minimal waiting times are preferred, and avoiding lunchtime of the staff at the nurse department). When ask how they determined when to call the nurse department to prepare the next patient each of the nurses had a different method. One nurse would ask the next patient to be prepared while retrieving a patient. Another nurse would look at the course of the operation and try to determine the best moment. While another would call before the operation started knowing the surgeon usually perform his or her operation quite fast.
Figure 5: Usability test results
IV. DISCUSSION
In this paper a prototype was presented capable of advising the staff in the OR when the next patient should start getting prepared for his or her surgery. Using activations detected in the electrosurgical device an estimate could be made about the remaining duration of the surgery. Using 55 samples of procedures an estimated error rate of 20% was found by splitting the available data in a set of 70% training data and 30% testing data. As more samples were presented a noticeable downward trend in error rate can be observed (see Figure 3). If more samples would be present this error rate can be expected to lower and converge.
During the testing of the prototype we observed different surgeons using different methods. E.g., some surgeons activate the electrosurgical device before clipping the cystic duct (CD), while others clipped the CD first. This may negatively affect the performance of the classifiers as the prediction model may not be capable to determine what method was used based on the patterns of the usage of the electrosurgical device. Therefore it is advisable to train the prediction for each surgeon (assuming the same surgeon uses the same technique in his or her surgeries) to improve performance of the prediction model, if enough samples are present to properly train the classifiers.
Two of the surgeons observed performed their surgeries a lot faster than the rest during the usability test, with two operations being completed within 11 minutes as seen in Figure 5. Because the first activation of the device with these surgeons often happened within 25 minutes before the end of the surgery the prediction model wasn‟t suited for this particular surgeon and surgery combination.
The prediction model only made use of activations of a single device inside the OR. The same method can also be applied using activations of multiple devices by simply adding features from these devices to the existing list of features (assuming data of these devices is available). Having this extra data the performance of the model could be improved even further. Surgeries where certain instruments or devices are used during particular phases within the procedure would benefit from this.
While this paper focuses on laparoscopic cholecystectomy procedures the same prediction model could also be used for other procedures and other instruments. To do so the instruments followed in these procedures should yield similar information about the course of the surgery. The prediction model would then have to be trained using samples of this type of surgery. This allows the prediction model to be widely used for other surgical procedures where multiple operations are planned throughout the day.
To easily test the functionality and practicality of the prototype the system had to be started by hand and gave the user advice on calling the next patient for preparation, who still remained in charge on when to do so. Further development could create a fully automated system that determines when to start by extracting the start time from the hospitals internal system and automatically contacting the nursing department over the network and even adjust or make suggestions to the scheduling system before the end of the current procedure to improve surgical workflow.
Even though the prediction model had a better overall performance compared to the anesthesia nurses assessing the best time to call the next patient; The anesthesia nurses preferred their own methods. The main issue addressed were factors that were not accounted for in the prediction model. While performance already deemed adequate without these factors, they could be accounted for in a future prototype, assuming this information is available. The anesthesia nurses preferred calling a patient too early than too late, while the prototype focused on making a minimal error. To account for this the prediction model could be adjusted to leave more time between prediction and end of the procedure.
During the testing of the prototype it was observed that anesthesia nurses didn‟t have enough insight on the trajectory of the patient preparation and often assumed their predictions were accurate. Likewise the staff present at the nurse department didn‟t have any insight into the progress of the operation. Due to the limited amount of tests the staff couldn‟t get acquainted to the system to form a proper opinion about the reliability. Given more time to test the prediction and insight into the patient trajectory for the anesthesia nurse the system would likely be evaluated more

positively as results found in the usability showed the prediction model was both more accurate and reliable than the prediction of the anesthesia nurses.
V. CONCLUSION
The prediction model showed to have a decent amount of insight into the course of an operation solely based on the activations of a single device used in surgery and was capable to predict the end of the surgery within a 10 minute timeframe (Figure 4). The prediction model deemed adequate and was translated to a functional prototype used for testing in the real environment. The prototype was capable of making more accurate and reliable predictions compared to the predictions of the anesthesia nurses, although wasn‟t able to handle very short surgeries (where the electrosurgical device was often first used within 25 minutes of the end of the surgery). Given appropriate adjustment mentioned in the discussion (IV) the prediction model could be further improved to increase performance and allow it to be tested in other procedures.
ACKNOWLEDGMENT
Thanks to Reinier de Graaf Gasthuis, Delft, The Netherlands for data acquisition and test environment.
REFERENCES
1. Oxley, H., M. MacFarlan, and U.-G. Gerdtham, Health care reform:
controlling spending and increasing efficiency. Vol. 149. 1994: OECD Paris.
2. Cardoen, B., E. Demeulemeester, and J. Beliën, Operating room
planning and scheduling: A literature review. European Journal of Operational Research, 2010. 201(3): p. 921-932.
3. Denton, B.T., et al., Optimal allocation of surgery blocks to operating
rooms under uncertainty. Operations research, 2010. 58(4-part-1): p. 802-816.
4. Vermeulen, I.B., et al., Adaptive resource allocation for efficient
patient scheduling. Artificial intelligence in medicine, 2009. 46(1): p. 67-80.
5. Padoy, N., et al., A boosted segmentation method for surgical workflow
analysis, in Medical Image Computing and Computer-Assisted Intervention–MICCAI 2007. 2007, Springer. p. 102-109.
6. Herfarth, C., ‘Lean’surgery through changes in surgical work flow.
British Journal of Surgery, 2003. 90(5): p. 513-514. 7. James, A., et al., Eye-gaze driven surgical workflow segmentation, in
Medical Image Computing and Computer-Assisted Intervention–
MICCAI 2007. 2007, Springer. p. 110-117. 8. Blum, T., et al., Workflow mining for visualization and analysis of
surgeries. International journal of computer assisted radiology and
surgery, 2008. 3(5): p. 379-386.
9. Blum, T., et al., Modeling and online recognition of surgical phases
using hidden markov models, in Medical Image Computing and
Computer-Assisted Intervention–MICCAI 2008. 2008, Springer. p. 627-635.
10. Padoy, N., et al. On-line Recognition of Surgical Activity for Monitoring in the Operating Room. in AAAI. 2008.
11. Ahmadi, S.-A., et al., Recovery of surgical workflow without explicit
models, in Medical Image Computing and Computer-Assisted Intervention–MICCAI 2006. 2006, Springer. p. 420-428.
12. Padoy, N., et al., Statistical modeling and recognition of surgical
workflow. Medical Image Analysis, 2012. 16(3): p. 632-641.
13. Bouarfa, L., P.P. Jonker, and J. Dankelman, Discovery of high-level
tasks in the operating room. Journal of biomedical informatics, 2011. 44(3): p. 455-462.
14. Nara, A., et al. Surgical workflow analysis based on staff's trajectory
patterns. in M2CAI workshop, MICCAI, London. 2009. 15. Padoy, N., et al. Workflow monitoring based on 3d motion features. in
Computer Vision Workshops (ICCV Workshops), 2009 IEEE 12th
International Conference on. 2009. IEEE. 16. Xiao, Y., et al., An algorithm for processing vital sign monitoring data
to remotely identify operating room occupancy in real-time.
Anesthesia & Analgesia, 2005. 101(3): p. 823-829. 17. Novotny, P.M., et al., GPU based real-time instrument tracking with
three-dimensional ultrasound. Medical image analysis, 2007. 11(5): p.
458-464. 18. Agarwal, S., et al., A pervasive computing system for the operating
room of the future. Mobile Networks and Applications, 2007. 12(2-3):
p. 215-228. 19. Ting, S., et al., The study on using passive RFID tags for indoor
positioning. International Journal of Engineering Business
Management, 2011. 3(1.): p. 9-15. 20. Kranzfelder, M., et al., Real-time instrument detection in minimally
invasive surgery using radiofrequency identification technology.
Journal of Surgical Research, 2013. 185(2): p. 704-710. 21. Meißner, C., et al., Sensor-based surgical activity recognition in
unconstrained environments. Minimally Invasive Therapy & Allied
Technologies, 2014(0): p. 1-8. 22. Rogers, A., E. Jones, and D. Oleynikov, Radio frequency identification
(RFID) applied to surgical sponges. Surgical endoscopy, 2007. 21(7): p. 1235-1237.
23. Weede, O., et al. Workflow analysis and surgical phase recognition in
minimally invasive surgery. in Robotics and Biomimetics (ROBIO), 2012 IEEE International Conference on. 2012. IEEE.
24. Bouarfa, L., Recognizing surgical patterns. 2012, TU Delft, Delft
University of Technology. 25. Blum, T., H. Feußner, and N. Navab, Modeling and segmentation of
surgical workflow from laparoscopic video, in Medical Image
Computing and Computer-Assisted Intervention–MICCAI 2010. 2010, Springer. p. 400-407.
26. Ouyang, C., et al., Workflow support for scheduling in surgical care
processes. 2011.
27. Bishop, C.M., Pattern recognition and machine learning. Vol. 4. 2006:
springer New York.
28. Blum, A.L. and P. Langley, Selection of relevant features and examples in machine learning. Artificial intelligence, 1997. 97(1): p.
245-271.
29. Jain, A.K., R.P.W. Duin, and J. Mao, Statistical pattern recognition: A review. Pattern Analysis and Machine Intelligence, IEEE Transactions
on, 2000. 22(1): p. 4-37.
30. Stolcke, A., S. Kajarekar, and L. Ferrer. Nonparametric feature normalization for SVM-based speaker verification. in Acoustics,
Speech and Signal Processing, 2008. ICASSP 2008. IEEE
International Conference on. 2008. IEEE. 31. Guyon, I., A scaling law for the validation-set training-set size ratio.
AT&T Bell Laboratories, 1997.
32. Arlot, S. and A. Celisse, A survey of cross-validation procedures for model selection. Statistics surveys, 2010. 4: p. 40-79.
33. Fletcher, T., Support vector machines explained. Tutorial paper., Mar,
2009. 34. Aha, D.W. and R.L. Bankert, A comparative evaluation of sequential
feature selection algorithms, in Learning from Data. 1996, Springer. p.
199-206.

VI. APPENDIX
A. Electrosurgical Device
Using different high frequency electrical signals a current is applied to a small surface of tissue on the patient generating a large amount of heat using a medical instrument. To create a full power circle the patient also has a large pad attached to his upper leg and connected to the device. Due to the large surface area of the pad an insignificant amount of heat is generated here. The heat created at the instrument however allows for coagulation or cutting of tissue with minimal blood loss. The devices used at the RdGG are the Covidien Force EZ, Force FX and Force Triad
8. These devices also have a bipolar setting were instead of the pad a
second instrument is used, although this setting was never used in the observed surgeries.
In a laparoscopic cholecystectomy this device is commonly used to free up the gallbladder from surrounding tissue, close up any vessels leading to it or from it and coagulate bleeding tissue, thus holding a lot of information on the course of this type of surgery. Due to the ease of measuring its activations using a current sensor and the information it holds regarding the course of the surgery it is well suited to make a prediction about the remaining surgery duration.
B. Digital Operating Room Assistant (DORA) Current Sensor
To measure the usage of the electrosurgical device the DORA current sensor (Figure 6) was used created by Arjan van Dijke from the TUDelft. The DORA current sensor goes through a main loop at 9Hz, performing its primary task of logging the current and various maintenance tasks (such as controlling the screen and LED‟s and reading the status of its buttons). In this loop the DORA current sensor measures its sensor values, reads the date and time using its internal real-time clock, and logs both of these. Both these values are then written to a SD card inserted (see Example 1).
2014,12,2,4,10,27,115,0
2014,12,2,4,10,27,229,0
2014,12,2,4,10,27,343,0
2014,12,2,4,10,27,456,0
2014,12,2,4,10,27,570,0
2014,12,2,4,10,27,684,0
Example 1: Output of Currentsensor – Format: year,month,day,hour,minute,second,subsecond (1/1000th), sensorvalue
The software of the DORA currrent sensor is written in C, using additional libraries provided by Arduino and 3rd
party providers. The following main components are used in building the DORA current sensor:
Current Sensor: Allegro Microsystems ACS758LCB, max 50A
Operational Amplifier: Microchip MC6282 Opamp
Microcontroller: Arduino Mini board met ATmega328 controller
Real-time Clock: SparkFun Real Time Clock Module BOB-12708
SD-card module: SparkFun OpenLog DEV-09530
C. Pattern Recognition
In pattern recognition a model, called the classifier is created to assign a class to this data based on a set of features. To do so the model is trained using various samples where the features are and classes are known. A set of features forms a point in a multidimensional space equal to the amount of features used. During training the model attempts to create a boundary or boundaries that separates each class in this multidimensional space. There are various algorithms called classifiers that can be used to create these boundaries, each having their own advantages and disadvantages.
1) Classes and Features A feature is a measurable variable obtained through observation from a sample. A set of features belongs to a class. A set of
classes is pre-defined by the user. To make an accurate prediction these features should be informative, discriminating and independent of each other[28], thus holding valuable information to help determine to what class a feature belongs to.
8 Electrosurgical devices, Covidien (http://www.covidien.com/)
Figure 6: DORA Currentsensor

2) Classifiers There are numerous classifiers available. Overall it can be said that simpler classifiers allow for a better performance with small
amounts of data, while more complex classifiers have a better performance with larger amounts of data; This due to under-fitting and over-fitting. In over-fitting the classifier creates boundary conditions that are too specified on the training data. While at under-fitting the classifier creates boundary conditions that can‟t capture the complexity of the data available. Therefore there is no “best” classifier, as it all depends on the data available[29]. Thus to determine the best classifier the data will have to be tested.
3) Feature standardization In various machine learning techniques feature standardization is necessarily. When different features have different ranges of
values, these values can be weighted differently depending on the classifier. A feature with an extremely large range of values will overrule the other features, thus negating their effect. A common method to negate this effect is by scaling the feature set, such that each feature has the same mean and standard deviation[30].
4) Training and test data ratio In order to test the performance classifier a test set can be used consisting of different examples with a known outcome to give
an estimation of its performance. By increasing the training set the real error rate of the classifier can be minimized. By increasing the test set a better estimation of the validation error can be made. Therefore the ratio between training and test data needs to be balanced in order to get a reliable result[31].
5) Cross-Validation Due to the low amount of samples t-fold cross-validation was used, which is a machine learning strategy that can be applied to
any data to more effectively estimate the error rate while avoiding overfitting[32]. Overfitting occurs when the error rate gets biased. This can happen by the algorithm training on noise, instead of finding underlying relationships between the features and classes. A cause of this can be the usage of the same samples in both training and test data. Using t-fold cross-validation a test is repeated where at each iteration the data used for training and testing is selected at random. This reduces variability between each test and therefore results in a mean error rate which better resembles the systems true error rate.
6) Support Vector Machines Support Vector Machines (SVM) is a supervised learning model. Using a training dataset an algorithm attempts to linearly
separate the features in their distinct classes, using a hyperplane. The boundaries created can then be used for new sets of features to determine to which class they belong, thus making an estimation based on the training data used.
Figure 7: Support Vector Machine algorithm separating 2 classes with 2 features[33]
In Figure 7 an example can be seen where two classes containing two features (thus creating a two dimensional area) are separated using a linear boundary. The SVM algorithm attempts to orientate a hyperplane in a such way that it separates as many samples as possible to their distinct class and keeps a maximum-margin between the closest samples of each class (maximizing distance d1 and d2). In case not all samples can be separated using a hyperplane it creates a boundary that misclassifies as little samples as possible, while keeping the margin to a maximum for the rest.
7) Feature Selection Features that hold little to no information in helping determining the classes may only act as noise and negatively affect the
classifier. Too many features may also negatively affect the classifier as the number of features is equal to the number of dimensions in the model, thus adding to the complexity of the model and increasing the computing time exponentially. Therefore the important features can undergo feature selection or extraction that may help to further improve performance of the model.
8) Forward Feature Selection Forward Feature Selection is a method to estimate the ideal subset of features to use in the classifier. It creates a number of
subsets equal to the amount of features, each holding a single feature. Using training, test data and a classifier the error rate for each
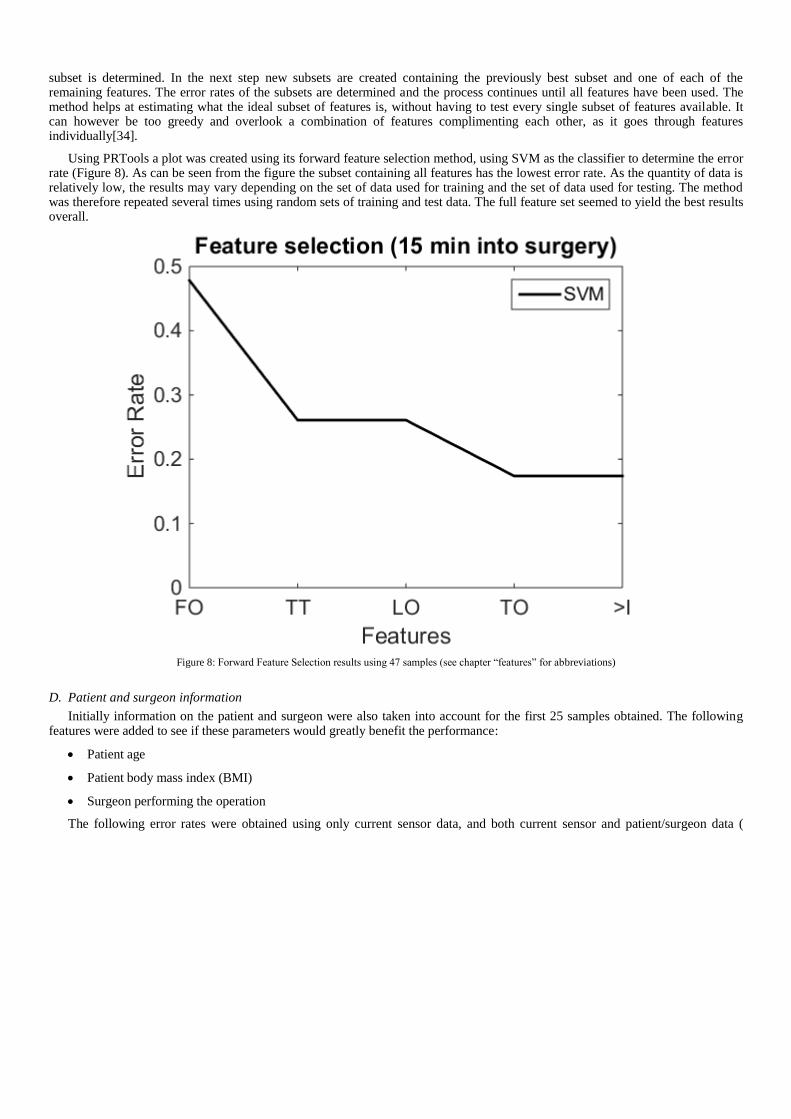
subset is determined. In the next step new subsets are created containing the previously best subset and one of each of the remaining features. The error rates of the subsets are determined and the process continues until all features have been used. The method helps at estimating what the ideal subset of features is, without having to test every single subset of features available. It can however be too greedy and overlook a combination of features complimenting each other, as it goes through features individually[34].
Using PRTools a plot was created using its forward feature selection method, using SVM as the classifier to determine the error rate (Figure 8). As can be seen from the figure the subset containing all features has the lowest error rate. As the quantity of data is relatively low, the results may vary depending on the set of data used for training and the set of data used for testing. The method was therefore repeated several times using random sets of training and test data. The full feature set seemed to yield the best results overall.
Figure 8: Forward Feature Selection results using 47 samples (see chapter “features” for abbreviations)
D. Patient and surgeon information
Initially information on the patient and surgeon were also taken into account for the first 25 samples obtained. The following features were added to see if these parameters would greatly benefit the performance:
Patient age
Patient body mass index (BMI)
Surgeon performing the operation
The following error rates were obtained using only current sensor data, and both current sensor and patient/surgeon data (

Table 2). From the table can be seen that the extra information lead to a higher error rate than without. This could be caused by the small sample size where these features weren‟t representative of each other by chance. Due to the inability to obtain patient/surgery information automatically and the higher error rate it wasn‟t further assessed.

Table 2: Error rate using 35min of data 35 min of data Mean error Std error
Only sensor 0.1925 0.092277
W/ patient/surgeon data 0.26333 0.10642
E. Testing of various classifiers
Due to the easy implementation of different classifiers in the statistical toolbox other classifiers besides the SVM algorithm were also tested on a set of 55 procedures using the same methods described above. The following classifiers were also tested, with a small description on their functioning (Table 2), with their respective errors rates (Table 3). As seen in Table 3, the best performance with the data gathered from the hospital was the SVM algorithm. Therefore this will be the algorithm used for all further testing. As explained previously (VI.C.2) the performance of the class depends on the data. Simple classifiers such as the Nearest Mean Classifier or Linear Discriminant Classifier work well with normally distributed data, while more complex classifiers such as Fisher‟s Least Square Linear Classifier works well for oddly distributed data.
Table 3: Short description of classifiers used
Classifier Name Description Nearest Mean Classifier Creates a linear boundary between the means of the classes. Linear Discriminant Classifier Creates a linear boundary assuming a Gaussian distribution, using the mean and
standard deviation to set the boundary. Quadratic Discriminant Classifier Similar to the linear discriminant classifier, although creates a quadric boundary. Fisher's Least Square Linear Classifier Minimizes the error in the least square sense. Optimization of the Parzen Classifier Minimizes te error using a non-parametric approach. 1-Nearest Neighbour Classifier Assigns a sample to the same class as the nearest sample. k-Nearest Neighbour Classifier Assigns a sample to the same class as the k nearest samples of the same class.
Table 4: Classifiers and error rates Classifiers Classifiers
Support Vector Machines Fisher's Least Square Linear Classifier
Mean error 0.1446 Mean error 0.2123
Standard deviation 0.0713 Standard deviation 0.1048
Nearest Mean Classifier Optimization of the Parzen Classifier
Mean error 0.2892 Mean error 0.2246
Standard deviation 0.1071 Standard deviation 0.0886
Linear Discriminant Classifier 1-Nearest Neighbour Classifier
Mean error 0.1969 Mean error 0.2554
Standard deviation 0.0918 Standard deviation 0.1081
Quadratic Distriminant Classifier 3-Nearest Neighbour Classifier
Mean error 0.4708 Mean error 0.2154
Standard deviation 0.1223 Standard deviation 0.1042
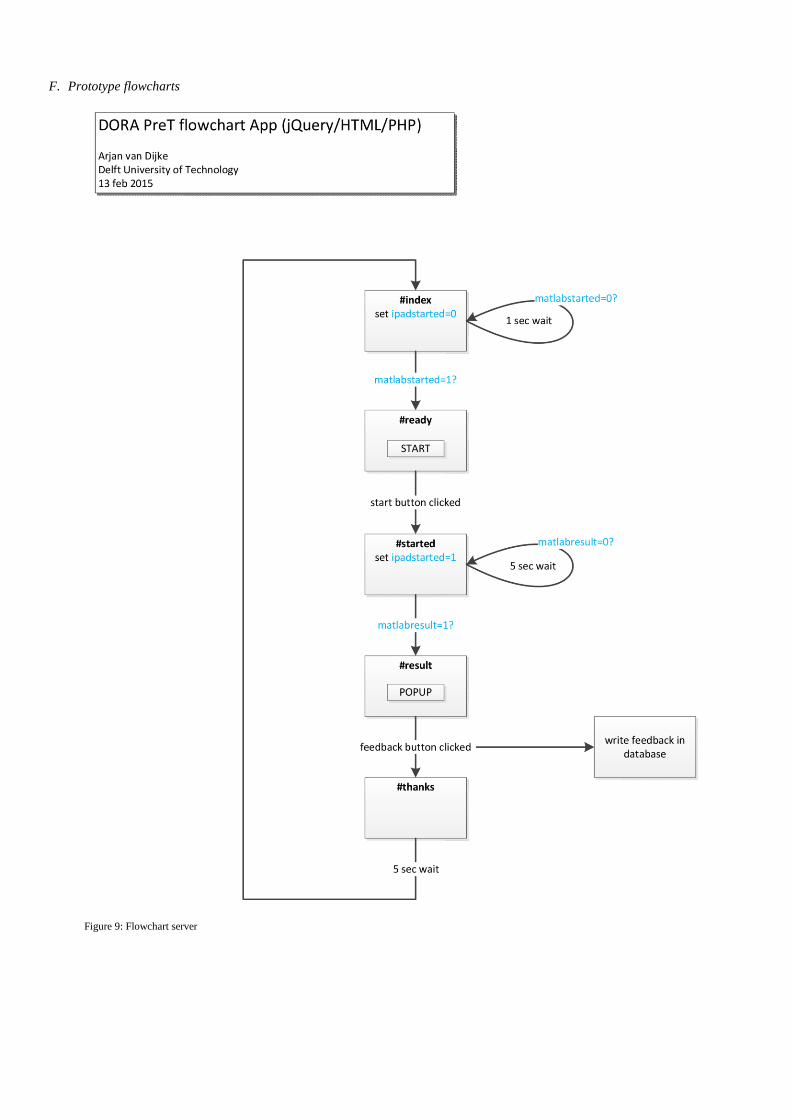
F. Prototype flowcharts
Figure 9: Flowchart server

Figure 10: Flowchart Matlab

G. Webpage screenshots
Figure 11: Start page
Figure 12: Advice page

H. Questionnaire
Questionnaire Beantwoord de volgende vragen met betrekking tot het DORA systeem uitgetest. Omcirkel het bijpassende antwoord.
Het gebruikte product Hoe accuraat was de voorspelling (1=helemaal niet / 10=heel accuraat) ? 1 2 3 4 5 6 7 8 9 10
Waarom ?
Waarop is uw voorspelling/tijdstip van bellen gebaseerd ?
Hinderde het product de voortgang van de procedure ? (1=geen / 10=veel hindering) 1 2 3 4 5 6 7 8 9 10
Waarom ?
Hoe nuttig/behulpzaam was het product ? (1=helemaal niet / 10=zeer nuttig) 1 2 3 4 5 6 7 8 9 10
Waarom ?
Stel het systeem door u getest wordt verbeterd en volledig geautomatiseerd (zodat het automatisch start en zelf doorgeeft
wanneer de volgende patiënt geprepareerd kan worden). Ziet u hier toekomst in ?
Ja en nee, en waarom?
Overige opmerkingen:
Related Documents


