ORIGINAL ARTICLE Real-time detection of grip length deviation during pull-type fastening: a Mahalanobis–Taguchi System (MTS)-based approach Deepak Mohan & Can Saygin & Jagannathan Sarangapani Received: 29 May 2007 / Accepted: 9 October 2007 / Published online: 7 November 2007 # Springer-Verlag London Limited 2007 Abstract In this study, a Mahalanobis–Taguchi system (MTS)-based diagnostic and root cause analysis scheme for monitoring grip length of pull-type fasteners in real-time is presented. The proposed approach is implemented on a fastening tool integrated with a strain gage, a linear variable differential transformer, a pressure sensor, and a mote for wireless communication. Experiments show that the pro- cess signature of strain-over-displacement ratio versus displacement has unique features that can be used to determine the grip length related deviations. The proposed approach takes as input various characteristics, such as peak strain, peak displacement, and depth and width of a bowl- shaped dip on the process signature in order to make real- time decisions. The experiments show that the proposed approach is effective in determining grip length deviations and in communicating the decision in real-time via a wireless network to a base station. Overall, the proposed architecture has merits to (1) detect quality problems in real-time during the fastening process and (2) reduce post- process inspection, thereby improving quality while reduc- ing cost. In addition, the approach facilitates 100% data collection on each fastener as opposed to traditional statistical process control (SPC) techniques, which rely on sampling. Keywords Automatic inspection . Fasteners . Automation . Mahalanobis–Taguchi system 1 Introduction Hand-held fastening tools are extensively used in manufacturing, especially in the aerospace industry. Such tools are prone to human error; typically the process is monitored by the operator and joints are visually inspected with very limited use of gages after the process is completed. Installation of fasteners may incur up to 80% of the total fastening costs, while the remaining 20% is for procurement of fasteners [1]. When complex products, such as an aircraft, are considered, the fastening process and its inspection can be a very time consuming task. In addition, no inspection data are typically collected during the process unless a major problem is encountered. Real-time monitoring of the fastening process and verification of joint quality are two important factors to reduce the manufacturing lead time while ensuring safety and quality. In this study, a pull-type fastening tool has been (1) integrated with sensors and (2) equipped with a mote for on-the-tool, real-time decision-making and wireless com- munication. The tool is capable of monitoring pull-type fastening processes and determining the grip length deviation for joints as normal grip, under grip, or over grip Int J Adv Manuf Technol (2008) 39:995–1008 DOI 10.1007/s00170-007-1280-9 D. Mohan : J. Sarangapani Electrical and Computer Engineering Department, NSF I/UCRC Center for Intelligent Maintenance Systems, University of Missouri - Rolla, 1870 Miner Circle, Rolla, MO 65409, USA D. Mohan e-mail: [email protected] J. Sarangapani e-mail: [email protected] C. Saygin (*) Manufacturing Systems and Automation Lab, Mechanical Engineering Department, The University of Texas - San Antonio, One UTSA Circle, San Antonio, TX 78249, USA e-mail: [email protected]

Welcome message from author
This document is posted to help you gain knowledge. Please leave a comment to let me know what you think about it! Share it to your friends and learn new things together.
Transcript
ORIGINAL ARTICLE
Real-time detection of grip length deviation during pull-typefastening: a Mahalanobis–Taguchi System(MTS)-based approach
Deepak Mohan & Can Saygin &
Jagannathan Sarangapani
Received: 29 May 2007 /Accepted: 9 October 2007 / Published online: 7 November 2007# Springer-Verlag London Limited 2007
Abstract In this study, a Mahalanobis–Taguchi system(MTS)-based diagnostic and root cause analysis scheme formonitoring grip length of pull-type fasteners in real-time ispresented. The proposed approach is implemented on afastening tool integrated with a strain gage, a linear variabledifferential transformer, a pressure sensor, and a mote forwireless communication. Experiments show that the pro-cess signature of strain-over-displacement ratio versusdisplacement has unique features that can be used todetermine the grip length related deviations. The proposedapproach takes as input various characteristics, such as peakstrain, peak displacement, and depth and width of a bowl-shaped dip on the process signature in order to make real-time decisions. The experiments show that the proposedapproach is effective in determining grip length deviationsand in communicating the decision in real-time via awireless network to a base station. Overall, the proposedarchitecture has merits to (1) detect quality problems in
real-time during the fastening process and (2) reduce post-process inspection, thereby improving quality while reduc-ing cost. In addition, the approach facilitates 100% datacollection on each fastener as opposed to traditionalstatistical process control (SPC) techniques, which rely onsampling.
Keywords Automatic inspection . Fasteners . Automation .
Mahalanobis–Taguchi system
1 Introduction
Hand-held fastening tools are extensively used inmanufacturing, especially in the aerospace industry. Suchtools are prone to human error; typically the process ismonitored by the operator and joints are visuallyinspected with very limited use of gages after theprocess is completed. Installation of fasteners may incurup to 80% of the total fastening costs, while theremaining 20% is for procurement of fasteners [1]. Whencomplex products, such as an aircraft, are considered, thefastening process and its inspection can be a very timeconsuming task. In addition, no inspection data aretypically collected during the process unless a majorproblem is encountered. Real-time monitoring of thefastening process and verification of joint quality are twoimportant factors to reduce the manufacturing lead timewhile ensuring safety and quality.
In this study, a pull-type fastening tool has been (1)integrated with sensors and (2) equipped with a mote foron-the-tool, real-time decision-making and wireless com-munication. The tool is capable of monitoring pull-typefastening processes and determining the grip lengthdeviation for joints as normal grip, under grip, or over grip
Int J Adv Manuf Technol (2008) 39:995–1008DOI 10.1007/s00170-007-1280-9
D. Mohan : J. SarangapaniElectrical and Computer Engineering Department, NSF I/UCRCCenter for Intelligent Maintenance Systems,University of Missouri - Rolla,1870 Miner Circle,Rolla, MO 65409, USA
D. Mohane-mail: [email protected]
J. Sarangapanie-mail: [email protected]
C. Saygin (*)Manufacturing Systems and Automation Lab, MechanicalEngineering Department, The University of Texas - San Antonio,One UTSA Circle,San Antonio, TX 78249, USAe-mail: [email protected]
employing the decision-making methodology that resideson the mote.
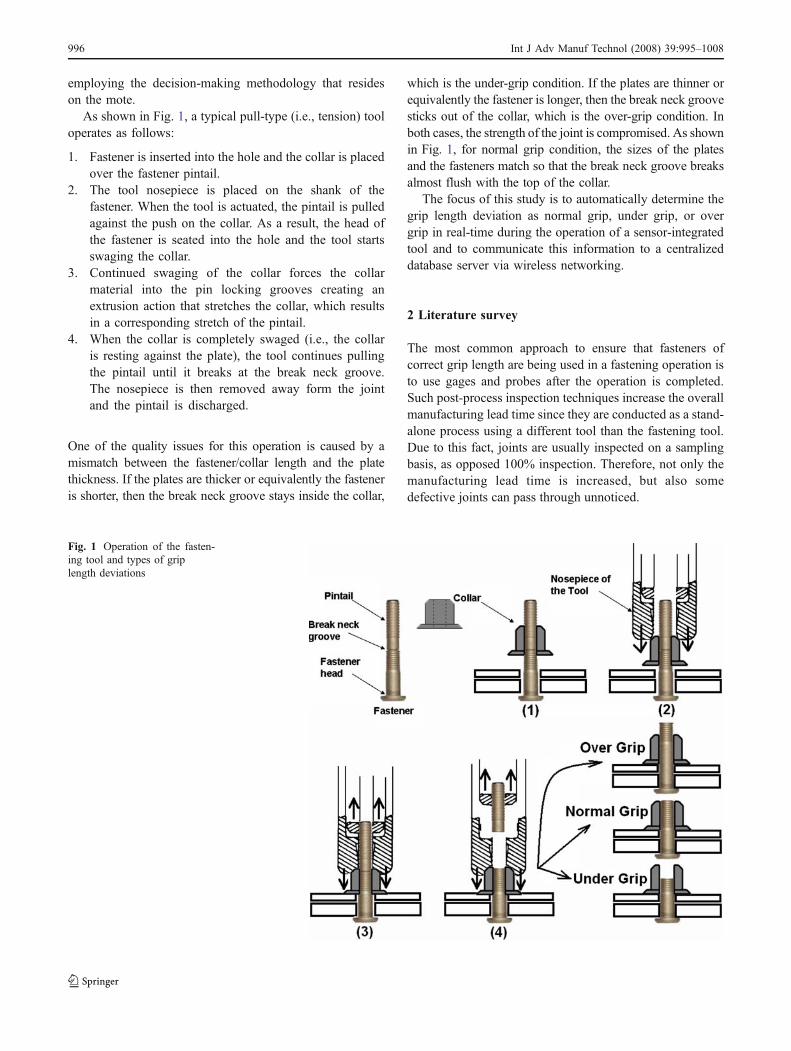
As shown in Fig. 1, a typical pull-type (i.e., tension) tooloperates as follows:
1. Fastener is inserted into the hole and the collar is placedover the fastener pintail.
2. The tool nosepiece is placed on the shank of thefastener. When the tool is actuated, the pintail is pulledagainst the push on the collar. As a result, the head ofthe fastener is seated into the hole and the tool startsswaging the collar.
3. Continued swaging of the collar forces the collarmaterial into the pin locking grooves creating anextrusion action that stretches the collar, which resultsin a corresponding stretch of the pintail.
4. When the collar is completely swaged (i.e., the collaris resting against the plate), the tool continues pullingthe pintail until it breaks at the break neck groove.The nosepiece is then removed away form the jointand the pintail is discharged.
One of the quality issues for this operation is caused by amismatch between the fastener/collar length and the platethickness. If the plates are thicker or equivalently the fasteneris shorter, then the break neck groove stays inside the collar,
which is the under-grip condition. If the plates are thinner orequivalently the fastener is longer, then the break neck groovesticks out of the collar, which is the over-grip condition. Inboth cases, the strength of the joint is compromised. As shownin Fig. 1, for normal grip condition, the sizes of the platesand the fasteners match so that the break neck groove breaksalmost flush with the top of the collar.
The focus of this study is to automatically determine thegrip length deviation as normal grip, under grip, or overgrip in real-time during the operation of a sensor-integratedtool and to communicate this information to a centralizeddatabase server via wireless networking.
2 Literature survey
The most common approach to ensure that fasteners ofcorrect grip length are being used in a fastening operation isto use gages and probes after the operation is completed.Such post-process inspection techniques increase the overallmanufacturing lead time since they are conducted as a stand-alone process using a different tool than the fastening tool.Due to this fact, joints are usually inspected on a samplingbasis, as opposed 100% inspection. Therefore, not only themanufacturing lead time is increased, but also somedefective joints can pass through unnoticed.
Fig. 1 Operation of the fasten-ing tool and types of griplength deviations
996 Int J Adv Manuf Technol (2008) 39:995–1008
Tab
le1
Sum
maryof
patents
Reference
Patent
number
Title
Autho
r(s)
Year
Scope
Qualityprob
lems
[2]
4,64
9,75
3Verificationprob
eD.Goo
dsmith
1987
Pre-process
verificatio
nprob
eforselectingtheprop
ergrip
leng
thforfastener
installatio
nIm
prop
erfastener
leng
th
[3]
4,87
6,80
0Portablegrip
leng
thindicator
G.Pekar
1989
Pre-process
fastener
grip
leng
thmeasuring
techniqu
eusingapo
rtable
prob
eforselectingtheprop
ergrip
leng
thforfastener
installatio
n
Improp
erfastener
leng
th
J.Mason
M.Blane
[4]
5,72
7,30
0Fastenerverificatio
nsystem
M.Ekd
ahi
1998
Autom
atic
fastener
selectionpriorto
installatio
n:Im
age-based-
determ
ines
thefastener
size
tobe
installedandthen
hasan
automationto
gettherigh
tfastener
tobe
installed
Selectio
nof
righ
tfastener
priorto
installatio
n
J.Hanks
B.Hiller
J.LaC
hapelle
K.Tho
mas
M.Turley
[5]
7,06
5,89
7FastenerGripLength
Selector
J.Lun
er20
06A
measuring
gage
todeterm
inethegrip
leng
thof
fastener
requ
ired
whenatempo
rary
fastener
isinstalledin
aho
leon
theassembly
Pre-process
detectionforselecting
therigh
tleng
thfastener
L.Hoeckelman
[6]
7,07
0,37
5FastenerGripLength
Indicator
L.Hoeckelman
2006
Gripleng
thdeterm
inationtechniqu
eusingamechanical
measuring
gage
Pre-process
detectionforselecting
therigh
tleng
thfastener
[7]
4,23
7,61
2Fastenergrip
leng
thmeasuring
system
E.Christian
1980
In-process
fastener
grip
leng
thmeasuring
techniqu
ebasedon
ahand
held
measuring
device
utilizing
aninsertableslidingprob
eIm
prop
ermaterialor
structural
partthickn
ess
R.Blunck
[8]
5,67
3,83
9Real-tim
efastener
measurementsystem
B.How
ard
1997
Measurementof
fastener
head
heightsin
real-tim
eusing3
embedd
edprox
imity
sensors-forflushhead
fastener
types
Improp
erfastener
head
heights
J.Avery
[9]
6,27
6,05
0Rivetingsystem
andprocess
forform
ingarivetedjoint
D.Mauer
2001
Sensors
andan
electron
iccontrolun
itto
determ
inetherivetin
g/actuator
characteristicsusingforcevs.distance
sign
atures
Improp
errivetin
g/actuator
characteristics
(incorrect
rivetleng
thandactuator
power
output)
H.Roeser
R.Opp
erA.Wojcik
C.Schoenig
[10]
6,85
1,16
7Metho
dforinstallin
gblindfasteners
G.Harlow
2005
Realtim
econtrolof
fasteningop
erations
forblindfasteners:
Usesforce-deform
ationcurveto
generate
astop
sign
alto
controlthefasteningop
eration
Improp
erfasteningjointsdu
eto
insufficient
forcedeform
ation
R.Dise
Int J Adv Manuf Technol (2008) 39:995–1008 997
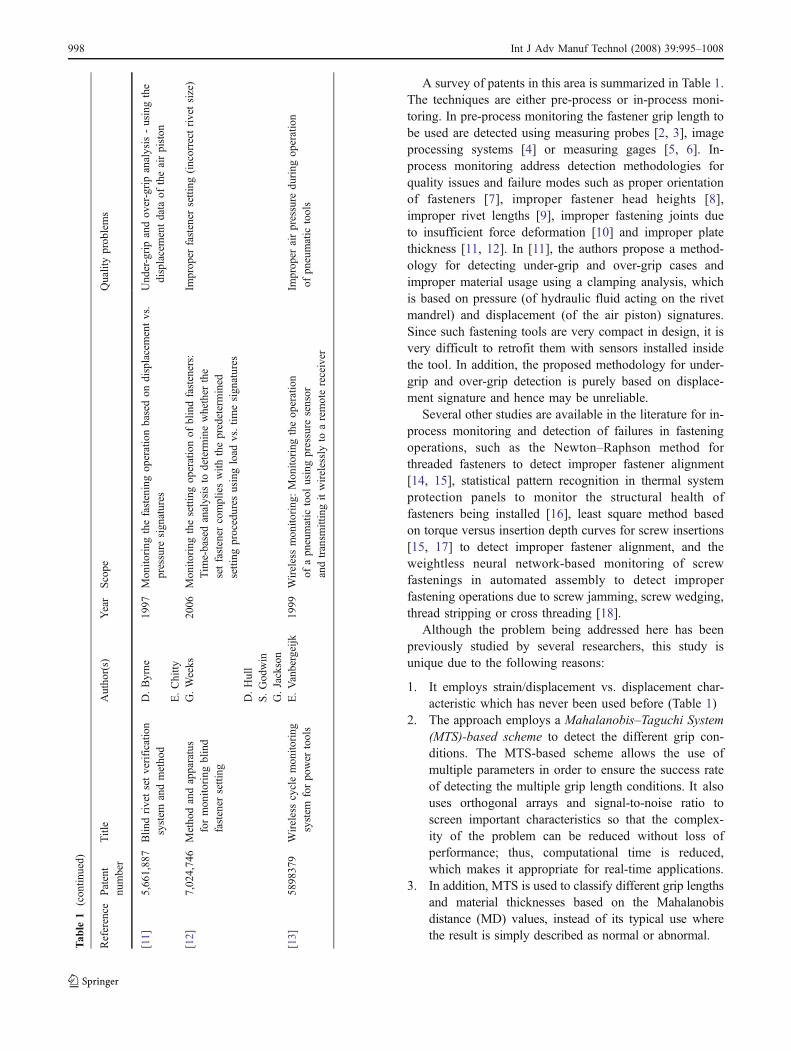
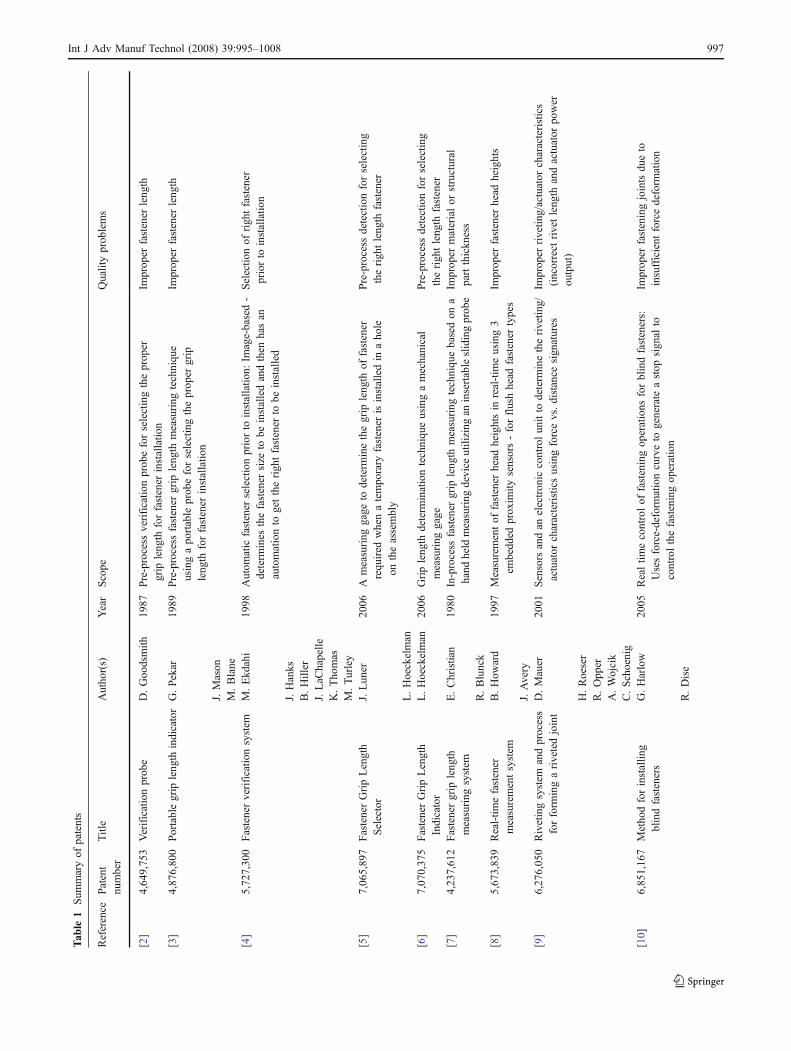
A survey of patents in this area is summarized in Table 1.The techniques are either pre-process or in-process moni-toring. In pre-process monitoring the fastener grip length tobe used are detected using measuring probes [2, 3], imageprocessing systems [4] or measuring gages [5, 6]. In-process monitoring address detection methodologies forquality issues and failure modes such as proper orientationof fasteners [7], improper fastener head heights [8],improper rivet lengths [9], improper fastening joints dueto insufficient force deformation [10] and improper platethickness [11, 12]. In [11], the authors propose a method-ology for detecting under-grip and over-grip cases andimproper material usage using a clamping analysis, whichis based on pressure (of hydraulic fluid acting on the rivetmandrel) and displacement (of the air piston) signatures.Since such fastening tools are very compact in design, it isvery difficult to retrofit them with sensors installed insidethe tool. In addition, the proposed methodology for under-grip and over-grip detection is purely based on displace-ment signature and hence may be unreliable.
Several other studies are available in the literature for in-process monitoring and detection of failures in fasteningoperations, such as the Newton–Raphson method forthreaded fasteners to detect improper fastener alignment[14, 15], statistical pattern recognition in thermal systemprotection panels to monitor the structural health offasteners being installed [16], least square method basedon torque versus insertion depth curves for screw insertions[15, 17] to detect improper fastener alignment, and theweightless neural network-based monitoring of screwfastenings in automated assembly to detect improperfastening operations due to screw jamming, screw wedging,thread stripping or cross threading [18].
Although the problem being addressed here has beenpreviously studied by several researchers, this study isunique due to the following reasons:
1. It employs strain/displacement vs. displacement char-acteristic which has never been used before (Table 1)
2. The approach employs a Mahalanobis–Taguchi System(MTS)-based scheme to detect the different grip con-ditions. The MTS-based scheme allows the use ofmultiple parameters in order to ensure the success rateof detecting the multiple grip length conditions. It alsouses orthogonal arrays and signal-to-noise ratio toscreen important characteristics so that the complex-ity of the problem can be reduced without loss ofperformance; thus, computational time is reduced,which makes it appropriate for real-time applications.
3. In addition, MTS is used to classify different grip lengthsand material thicknesses based on the Mahalanobisdistance (MD) values, instead of its typical use wherethe result is simply described as normal or abnormal.
Tab
le1
(con
tinued)
Reference
Patent
number
Title
Autho
r(s)
Year
Scope
Qualityprob
lems
[11]
5,66
1,88
7Blin
drivetsetverificatio
nsystem
andmetho
dD.Byrne
1997
Mon
itoring
thefasteningop
erationbasedon
displacementvs.
pressure
sign
atures
Und
er-gripandov
er-gripanalysis-usingthe
displacementdata
oftheairpiston
E.Chitty
[12]
7,02
4,74
6Metho
dandapparatus
formon
itoring
blind
fastener
setting
G.Weeks
2006
Mon
itoring
thesetting
operationof
blindfasteners:
Tim
e-basedanalysisto
determ
inewhether
the
setfastener
complieswith
thepredetermined
setting
procedures
usingload
vs.tim
esign
atures
Improp
erfastener
setting
(incorrect
rivetsize)
D.Hull
S.God
win
G.Jackson
[13]
5898
379
Wirelesscyclemon
itoring
system
forpo
wer
tools
E.Vanbergeijk
1999
Wirelessmon
itoring
:Mon
itoring
theop
eration
ofapn
eumatic
tool
usingpressure
sensor
andtransm
ittingitwirelesslyto
aremotereceiver
Improp
erairpressure
during
operation
ofpn
eumatic
tools
998 Int J Adv Manuf Technol (2008) 39:995–1008
4. The prototype fastening tool is equipped with not onlyprocess-related sensors, such as strain, displacement, andpressure sensors, but also wireless communication capa-bilities to communicate the result of the signature analysisin real-time to the operator, as well as a base-station.
This approach allows for 100% data collection on thefastened joints as opposed to sampling-based statisticalprocess control methods.
MTS is widely used as a pattern recognition tool forvarious applications that deal with data classification [19,20]. MTS is a combination of the Mahalanobis distance(MD) and the Taguchi method. MD method is used forconstructing a measurement scale while the Taguchimethod is used to optimize the system and make it robust[21]. Most applications based on MTS normally differen-tiate the normal group from the abnormal group, forexample, healthy people from unhealthy ones. The pro-posed methodology has the ability to classify different griplengths within the abnormal group. This is extremely usefulwhere there are multiple failure modes to be detected.
MD measures distances in multidimensional spaces bytaking into account the correlation among variables. Inother words, MD is a measure of the nearness of a data-point to the mean of a group. There are other multivariatemeasurement techniques, such as the Euclidean distance,that give the distance to the “unknown” point from themean point. On the other hand, the Euclidean distance doesnot give a statistical measurement of how well the unknownmatches the reference set, and it measures only a relativedistance from the mean point and does not take into accountthe distribution of the points in a group [22].
The main reason why Mahalanobis distance is used in thisresearch is because of its sensitivity towards inter-variablechanges in data. Mahalanobis distance is measured in termsof standard deviations from the mean of the samples whichprovides a statistical measure of how well the unknowndataset matches with the ideal one. Another reason whyMahalanobis distance is preferred over classical methods isits dependence on the variance and covariance of the datarather than its average, which makes the calculations robust.
3 Mahalanobis–Taguchi system
The first step in MTS is to define and sample “normal”observations to construct a reference space, which is calledthe Mahalanobis space (MS). MS consists of the meanvector, standard deviation vector, and correlation matrix ofthe normal group [22].
A pattern recognition problem starts with data collectionon normal observations. Next, Mahalanobis distance (MD)is calculated using certain characteristics to determine if
MD has the ability to differentiate the normal group froman abnormal group. If MD is not capable of detecting theabnormal group using those particular characteristics, thenother characteristics need to be explored. When the rightcharacteristics for calculating MD are determined, thenTaguchi methods are applied to evaluate the contribution ofeach characteristic and if possible to reduce the number ofcharacteristics. Taguchi method uses orthogonal arrays andsignal-to-noise ratios to choose such variables of importance.
MTS consists of four phases [20, 22]:
Phase 1: Construction of MS
1. Define the characteristics that determine the health-iness of a condition. In this paper, it involvesidentifying the characteristics from the signaturesthat are known to be from good fastening oper-ations (i.e., normal behavior).
2. Calculate the mean for each characteristic in theideal dataset:
xi ¼Pni¼1
Xij
nð1Þ
3. Calculate the standard deviation for each charac-teristic:
si ¼
ffiffiffiffiffiffiffiffiffiffiffiffiffiffiffiffiffiffiffiffiffiffiffiffiffiffiffiPni¼1
Xij � xi� �2n� 1
vuuut ð2Þ
4. Normalize each characteristic, form the normalizeddata matrix (Zij), and take its transpose (ZT
ij ):
Zij ¼Xij � xi� �
sið3Þ
5. Verify that the mean of the normalized data is zero:
zi ¼Pni¼1
Zij
n¼ 0 ð4Þ
6. Verify that the standard deviation is one:
sz ¼
ffiffiffiffiffiffiffiffiffiffiffiffiffiffiffiffiffiffiffiffiffiffiffiffiffiffiffiPni¼1
Zij � zi� �2n� 1
vuuut ¼ 1 ð5Þ
7. Form the correlation matrix (C) for the normalizeddata. The matrix elements (cij) are calculated asfollows:
cij ¼Pnm¼1
ZimZjm� �n� 1
ð6Þ
Int J Adv Manuf Technol (2008) 39:995–1008 999
8. Calculate the inverse of the correlation matrix(C−1).
9. Calculate MD:
MDj ¼ 1
kZTij C
�1Zij ð7Þ
where
xij is the ith characteristic of the jth observation,n is the number of observations,si is the standard deviation of the ith characteristic,Zij is the normalized value of the ith characteristic of the
jth observation,sz is the standard deviation of the normalized values,C is the correlation matrix,C−1 is the inverse of the correlation matrix,MDj is the Mahalanobis distance for the jth observation,
andk is the number of characteristics.
Phase 2: Validation of MSFor validation of MS, observations outside the normal
group are selected and respective MD values are calculated.The characteristics of the abnormal group are normalizedusing the mean and standard deviations of the correspondingcharacteristics in the normal group. The correlation matrixcorresponding to the healthy group is used to compute theMDs of the abnormal cases. If MS is suitable for theapplication domain with the appropriate characteristicsselected, then the MDs corresponding to the abnormal groupwill have higher value than that of the normal group.Phase 3: Identification of useful characteristics
The right set of characteristics is determined usingorthogonal arrays (OAs) and signal-to-noise ratios (S/N).The signal-to-noise ratio, obtained from the abnormal MDs,is used as the response for each combination of OA.Orthogonal array is a table listing all the combinations ofthe characteristics. Level-1 in the orthogonal array columnrepresents the presence of a characteristic and level-2represents the absence of that characteristic. The size ofthe orthogonal array depends on the number of character-istics and the levels it can take. By varying the number ofcharacteristics used, MD values are obtained for theabnormal cases and from these MD values, the larger thebetter signal-to-noise ratio is obtained [19, 20, 22] asfollows:
hq ¼ �10 log1
t
Xt
j¼1
1
MDj
" #ð8Þ
Where,
ηq is the signal-to-noise ratio for the qth run of theorthogonal array
t is the number of abnormalities under consideration
An average S/N ratio at level-1 and level-2 is obtainedfor each characteristic. Subsequently, the gain in S/N ratiovalues for each characteristic is calculated [19, 22] asfollows:
Gain ¼ Avg:S=N Ratioð ÞLevel�1
� Avg:S=N Ratioð ÞLevel�2 ð9ÞFinally, the characteristics with positive gain are identi-
fied as useful in the detection of anomalies and the rest ofthe characteristics are discarded.Phase 4: Decision-making
Using the MS constructed by the useful characteristics,one must monitor the application, collect data, calculateMD, and if MD >>1, then the application exhibits abnormalbehavior. In this case, determine under which MD range,the MD of the current application falls, and then take therespective corrective action. If MD ≤1, the conditions arenormal.
4 Pull-type fasteners and tools: the underlying concept
As shown in Fig. 1, the pintail breaks off at the end of theprocess and the remaining portion of the fastener with thecollar form a permanent joint. The underlying concept isvery similar to a tensile test in terms of stress-strainrelationship. During the fastening process, the outer sleeveof the nosepiece rests against the collar causing it to swage,while the inside jaws pull the pintail. The pintail goesthrough its yield point, passes from the elastic range to theplastic range, then reaches its ultimate tensile strength, andfinally at its fracture point it breaks and the process iscompleted. While the pintail of the fastener is goingthrough this sequence, the outer sleeve of the nosepiecestays under compression pushing the collar against theplates. Due to superior material properties of the nosepiececompared with the materials properties of the fastener, theouter sleeve of the nosepiece goes through a slight elasticdeformation (i.e., no plastic deformation occurs on thenosepiece) during the process and when the process iscompleted, it recovers back to its original state.
The preliminary studies that led to the approachproposed in this study have shown that there is arelationship between the elastic deformation occurring onthe nosepiece and the elastic-plastic deformation on thefastener. In order to use this relationship, the nosepiece ofthe tool has been integrated with a strain gage that showsthe elastic deformation, in the form of compression, of thenosepiece. This behavior has been plotted as strain versustime to generate a process signature. In order to investigatethe impact of grip length on the strain-time processsignature, different combinations of plates have been tested.
1000 Int J Adv Manuf Technol (2008) 39:995–1008
In addition, plates with rubber washers in between havealso been tested to investigate the impact of materialproperties on the process signature.
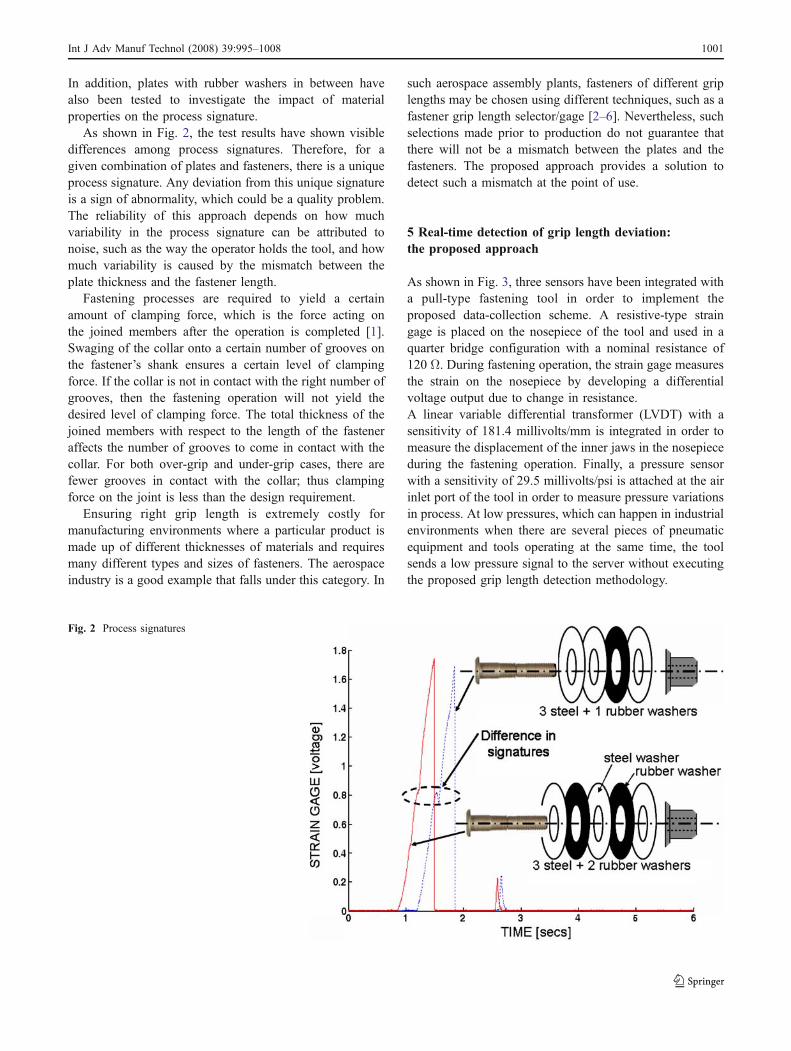
As shown in Fig. 2, the test results have shown visibledifferences among process signatures. Therefore, for agiven combination of plates and fasteners, there is a uniqueprocess signature. Any deviation from this unique signatureis a sign of abnormality, which could be a quality problem.The reliability of this approach depends on how muchvariability in the process signature can be attributed tonoise, such as the way the operator holds the tool, and howmuch variability is caused by the mismatch between theplate thickness and the fastener length.
Fastening processes are required to yield a certainamount of clamping force, which is the force acting onthe joined members after the operation is completed [1].Swaging of the collar onto a certain number of grooves onthe fastener’s shank ensures a certain level of clampingforce. If the collar is not in contact with the right number ofgrooves, then the fastening operation will not yield thedesired level of clamping force. The total thickness of thejoined members with respect to the length of the fasteneraffects the number of grooves to come in contact with thecollar. For both over-grip and under-grip cases, there arefewer grooves in contact with the collar; thus clampingforce on the joint is less than the design requirement.
Ensuring right grip length is extremely costly formanufacturing environments where a particular product ismade up of different thicknesses of materials and requiresmany different types and sizes of fasteners. The aerospaceindustry is a good example that falls under this category. In
such aerospace assembly plants, fasteners of different griplengths may be chosen using different techniques, such as afastener grip length selector/gage [2–6]. Nevertheless, suchselections made prior to production do not guarantee thatthere will not be a mismatch between the plates and thefasteners. The proposed approach provides a solution todetect such a mismatch at the point of use.
5 Real-time detection of grip length deviation:the proposed approach
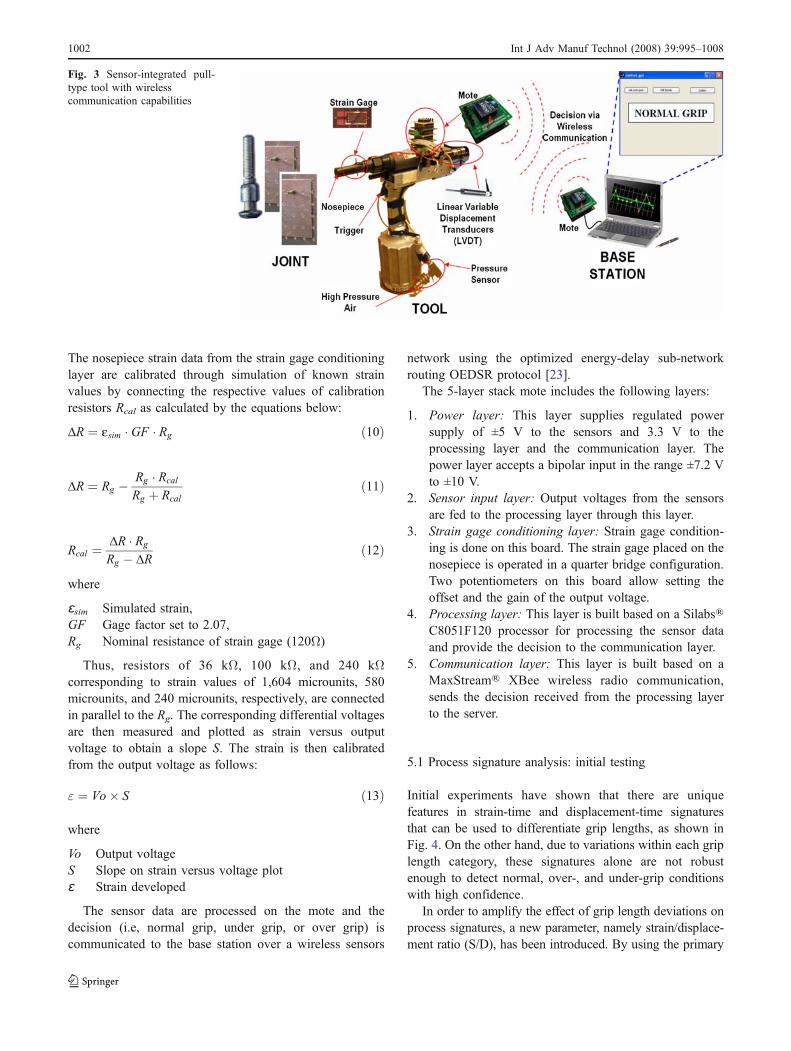
As shown in Fig. 3, three sensors have been integrated witha pull-type fastening tool in order to implement theproposed data-collection scheme. A resistive-type straingage is placed on the nosepiece of the tool and used in aquarter bridge configuration with a nominal resistance of120 Ω. During fastening operation, the strain gage measuresthe strain on the nosepiece by developing a differentialvoltage output due to change in resistance.A linear variable differential transformer (LVDT) with asensitivity of 181.4 millivolts/mm is integrated in order tomeasure the displacement of the inner jaws in the nosepieceduring the fastening operation. Finally, a pressure sensorwith a sensitivity of 29.5 millivolts/psi is attached at the airinlet port of the tool in order to measure pressure variationsin process. At low pressures, which can happen in industrialenvironments when there are several pieces of pneumaticequipment and tools operating at the same time, the toolsends a low pressure signal to the server without executingthe proposed grip length detection methodology.
Fig. 2 Process signatures
Int J Adv Manuf Technol (2008) 39:995–1008 1001
The nosepiece strain data from the strain gage conditioninglayer are calibrated through simulation of known strainvalues by connecting the respective values of calibrationresistors Rcal as calculated by the equations below:
$R ¼ esim � GF � Rg ð10Þ
$R ¼ Rg � Rg � Rcal
Rg þ Rcalð11Þ
Rcal ¼ $R � Rg
Rg � $Rð12Þ
where
ɛsim Simulated strain,GF Gage factor set to 2.07,Rg Nominal resistance of strain gage (120Ω)
Thus, resistors of 36 kΩ, 100 kΩ, and 240 kΩcorresponding to strain values of 1,604 microunits, 580microunits, and 240 microunits, respectively, are connectedin parallel to the Rg. The corresponding differential voltagesare then measured and plotted as strain versus outputvoltage to obtain a slope S. The strain is then calibratedfrom the output voltage as follows:
" ¼ Vo� S ð13Þ
where
Vo Output voltageS Slope on strain versus voltage plotɛ Strain developed
The sensor data are processed on the mote and thedecision (i.e, normal grip, under grip, or over grip) iscommunicated to the base station over a wireless sensors
network using the optimized energy-delay sub-networkrouting OEDSR protocol [23].
The 5-layer stack mote includes the following layers:
1. Power layer: This layer supplies regulated powersupply of ±5 V to the sensors and 3.3 V to theprocessing layer and the communication layer. Thepower layer accepts a bipolar input in the range ±7.2 Vto ±10 V.
2. Sensor input layer: Output voltages from the sensorsare fed to the processing layer through this layer.
3. Strain gage conditioning layer: Strain gage condition-ing is done on this board. The strain gage placed on thenosepiece is operated in a quarter bridge configuration.Two potentiometers on this board allow setting theoffset and the gain of the output voltage.
4. Processing layer: This layer is built based on a Silabs®C8051F120 processor for processing the sensor dataand provide the decision to the communication layer.
5. Communication layer: This layer is built based on aMaxStream® XBee wireless radio communication,sends the decision received from the processing layerto the server.
5.1 Process signature analysis: initial testing
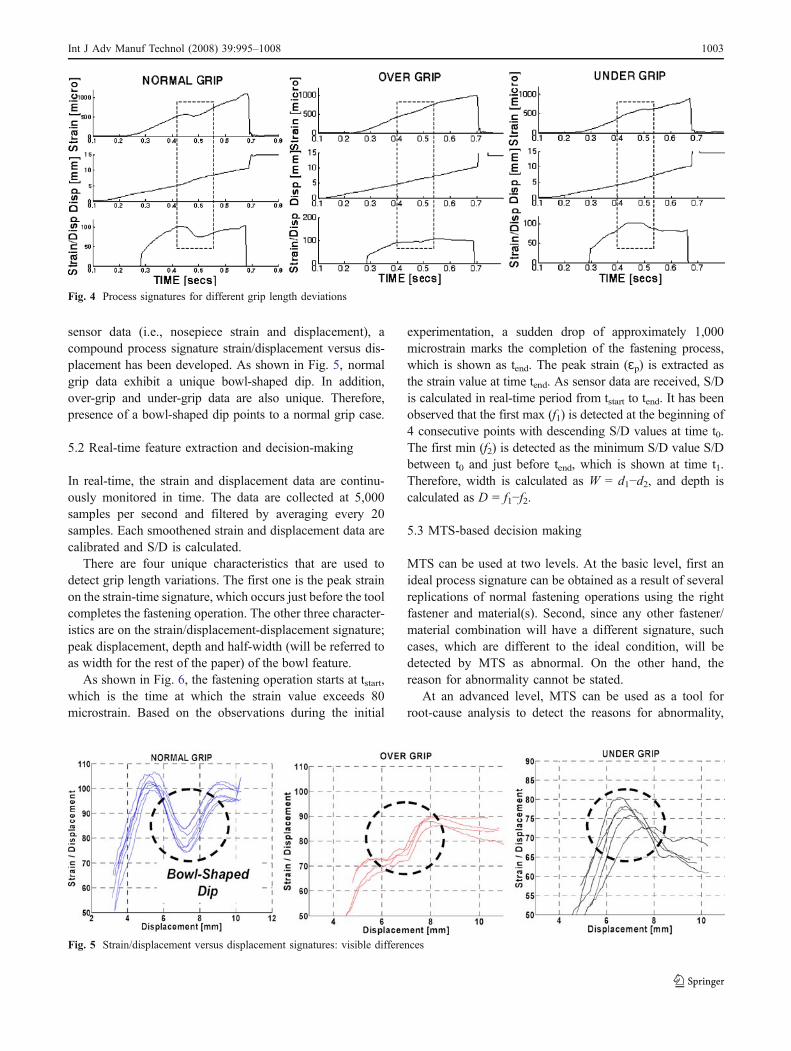
Initial experiments have shown that there are uniquefeatures in strain-time and displacement-time signaturesthat can be used to differentiate grip lengths, as shown inFig. 4. On the other hand, due to variations within each griplength category, these signatures alone are not robustenough to detect normal, over-, and under-grip conditionswith high confidence.
In order to amplify the effect of grip length deviations onprocess signatures, a new parameter, namely strain/displace-ment ratio (S/D), has been introduced. By using the primary
Fig. 3 Sensor-integrated pull-type tool with wirelesscommunication capabilities
1002 Int J Adv Manuf Technol (2008) 39:995–1008
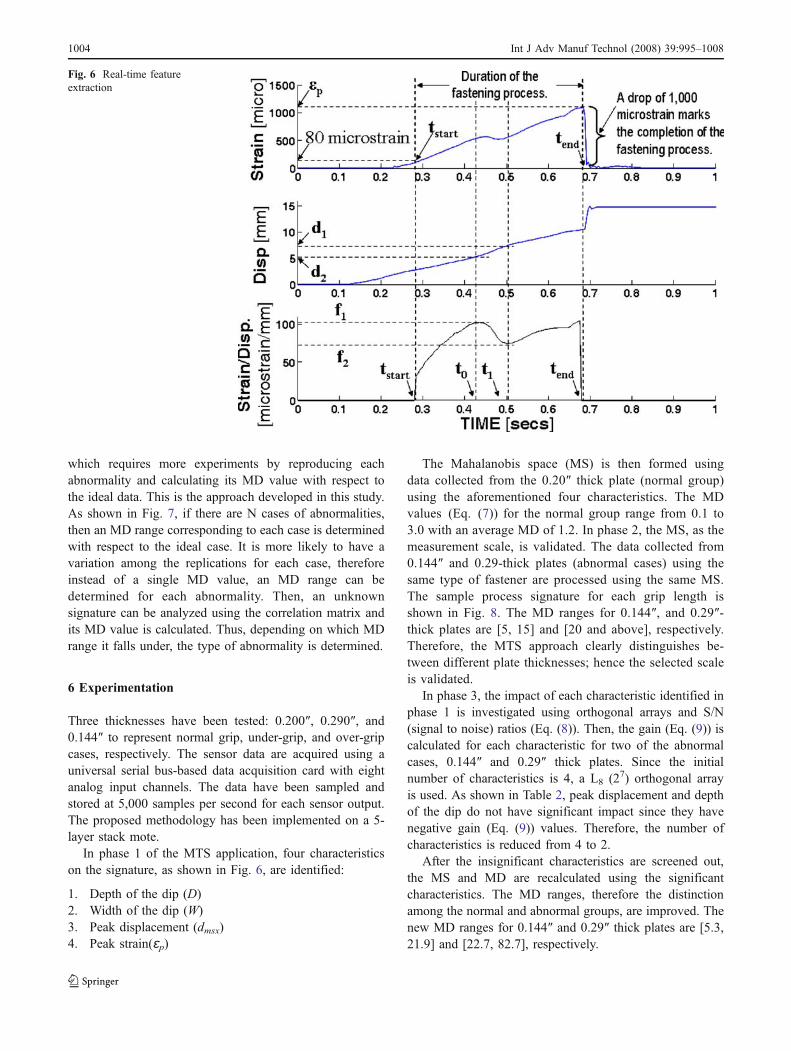
sensor data (i.e., nosepiece strain and displacement), acompound process signature strain/displacement versus dis-placement has been developed. As shown in Fig. 5, normalgrip data exhibit a unique bowl-shaped dip. In addition,over-grip and under-grip data are also unique. Therefore,presence of a bowl-shaped dip points to a normal grip case.
5.2 Real-time feature extraction and decision-making
In real-time, the strain and displacement data are continu-ously monitored in time. The data are collected at 5,000samples per second and filtered by averaging every 20samples. Each smoothened strain and displacement data arecalibrated and S/D is calculated.
There are four unique characteristics that are used todetect grip length variations. The first one is the peak strainon the strain-time signature, which occurs just before the toolcompletes the fastening operation. The other three character-istics are on the strain/displacement-displacement signature;peak displacement, depth and half-width (will be referred toas width for the rest of the paper) of the bowl feature.
As shown in Fig. 6, the fastening operation starts at tstart,which is the time at which the strain value exceeds 80microstrain. Based on the observations during the initial
experimentation, a sudden drop of approximately 1,000microstrain marks the completion of the fastening process,which is shown as tend. The peak strain (ɛp) is extracted asthe strain value at time tend. As sensor data are received, S/Dis calculated in real-time period from tstart to tend. It has beenobserved that the first max (f1) is detected at the beginning of4 consecutive points with descending S/D values at time t0.The first min (f2) is detected as the minimum S/D value S/Dbetween t0 and just before tend, which is shown at time t1.Therefore, width is calculated as W = d1−d2, and depth iscalculated as D = f1−f2.
5.3 MTS-based decision making
MTS can be used at two levels. At the basic level, first anideal process signature can be obtained as a result of severalreplications of normal fastening operations using the rightfastener and material(s). Second, since any other fastener/material combination will have a different signature, suchcases, which are different to the ideal condition, will bedetected by MTS as abnormal. On the other hand, thereason for abnormality cannot be stated.
At an advanced level, MTS can be used as a tool forroot-cause analysis to detect the reasons for abnormality,
Fig. 5 Strain/displacement versus displacement signatures: visible differences
Fig. 4 Process signatures for different grip length deviations
Int J Adv Manuf Technol (2008) 39:995–1008 1003
which requires more experiments by reproducing eachabnormality and calculating its MD value with respect tothe ideal data. This is the approach developed in this study.As shown in Fig. 7, if there are N cases of abnormalities,then an MD range corresponding to each case is determinedwith respect to the ideal case. It is more likely to have avariation among the replications for each case, thereforeinstead of a single MD value, an MD range can bedetermined for each abnormality. Then, an unknownsignature can be analyzed using the correlation matrix andits MD value is calculated. Thus, depending on which MDrange it falls under, the type of abnormality is determined.
6 Experimentation
Three thicknesses have been tested: 0.200″, 0.290″, and0.144″ to represent normal grip, under-grip, and over-gripcases, respectively. The sensor data are acquired using auniversal serial bus-based data acquisition card with eightanalog input channels. The data have been sampled andstored at 5,000 samples per second for each sensor output.The proposed methodology has been implemented on a 5-layer stack mote.
In phase 1 of the MTS application, four characteristicson the signature, as shown in Fig. 6, are identified:
1. Depth of the dip (D)2. Width of the dip (W)3. Peak displacement (dmsx)4. Peak strain(ɛp)
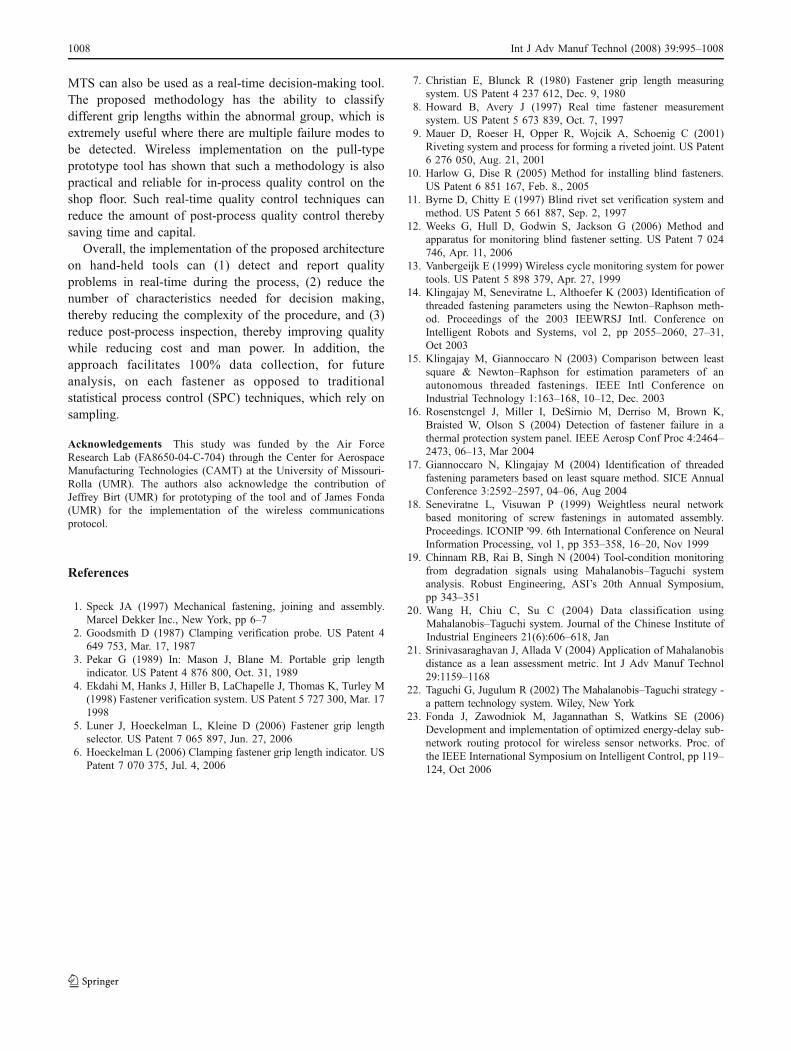
The Mahalanobis space (MS) is then formed usingdata collected from the 0.20″ thick plate (normal group)using the aforementioned four characteristics. The MDvalues (Eq. (7)) for the normal group range from 0.1 to3.0 with an average MD of 1.2. In phase 2, the MS, as themeasurement scale, is validated. The data collected from0.144″ and 0.29-thick plates (abnormal cases) using thesame type of fastener are processed using the same MS.The sample process signature for each grip length isshown in Fig. 8. The MD ranges for 0.144″, and 0.29″-thick plates are [5, 15] and [20 and above], respectively.Therefore, the MTS approach clearly distinguishes be-tween different plate thicknesses; hence the selected scaleis validated.
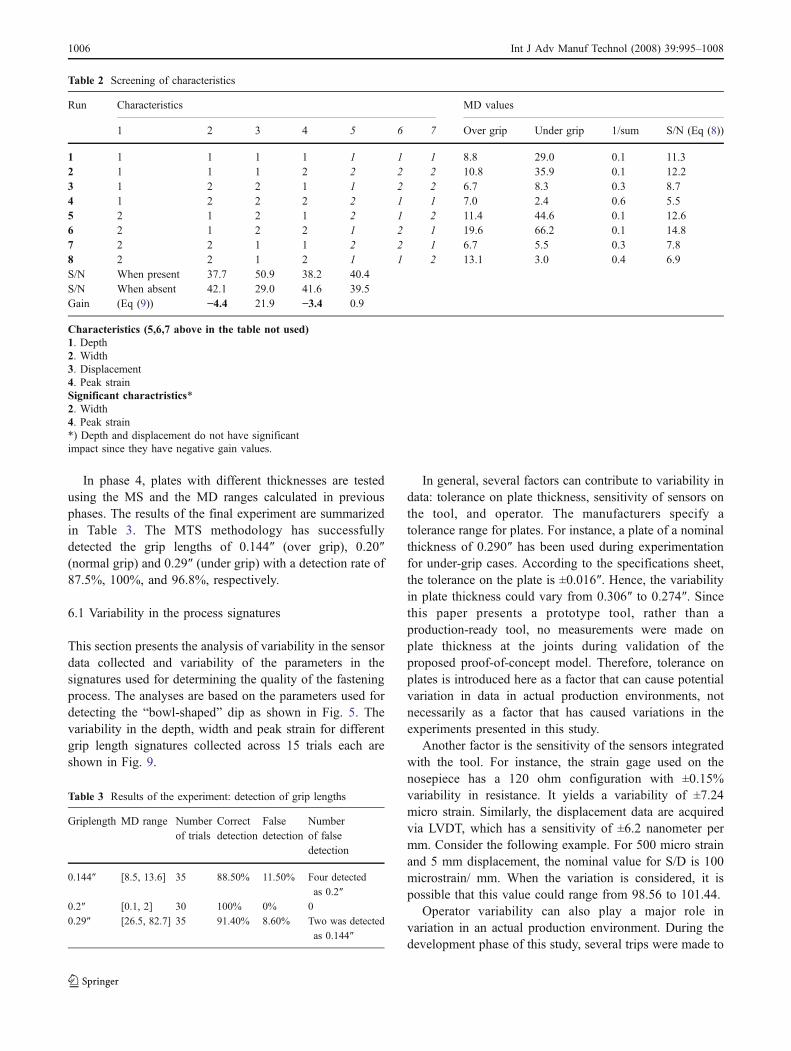
In phase 3, the impact of each characteristic identified inphase 1 is investigated using orthogonal arrays and S/N(signal to noise) ratios (Eq. (8)). Then, the gain (Eq. (9)) iscalculated for each characteristic for two of the abnormalcases, 0.144″ and 0.29″ thick plates. Since the initialnumber of characteristics is 4, a L8 (27) orthogonal arrayis used. As shown in Table 2, peak displacement and depthof the dip do not have significant impact since they havenegative gain (Eq. (9)) values. Therefore, the number ofcharacteristics is reduced from 4 to 2.
After the insignificant characteristics are screened out,the MS and MD are recalculated using the significantcharacteristics. The MD ranges, therefore the distinctionamong the normal and abnormal groups, are improved. Thenew MD ranges for 0.144″ and 0.29″ thick plates are [5.3,21.9] and [22.7, 82.7], respectively.
Fig. 6 Real-time featureextraction
1004 Int J Adv Manuf Technol (2008) 39:995–1008
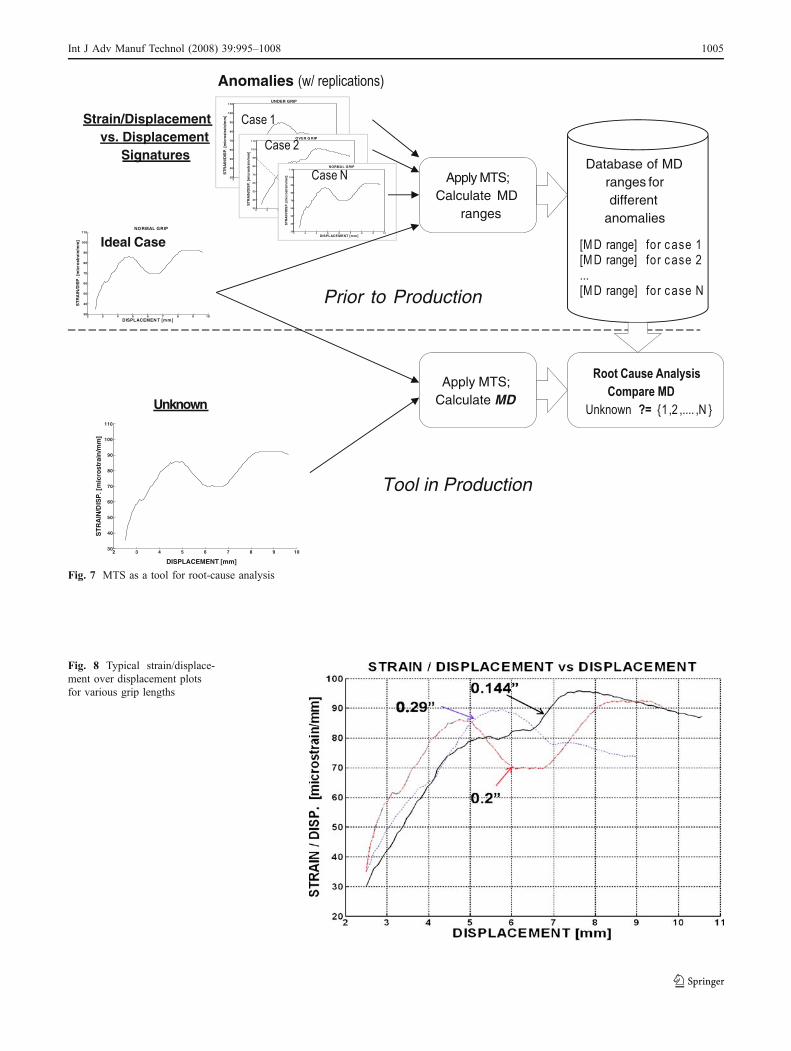
Fig. 8 Typical strain/displace-ment over displacement plotsfor various grip lengths
2 3 4 5 6 7 9 1030
40
50
60
70
80
90
100
110
DISPLACEMENT [
STR
AIN
/DIS
P. [
mic
rost
rain
/mm
]
UNDER GRIP
2 3 4 5 6 7 8 9 10 1130
40
50
60
70
80
90
100
110
DISPLACEMENT [mm]
ST
RA
IN/D
ISP
. [m
icro
stra
in/m
m]
OVER G RIP
2 3 4 5 6 7 8 9 1030
40
50
60
70
80
90
100
110
DISPLACEMEN T [mm]
STR
AIN
/DIS
P. [
mic
rost
rain
/mm
]
NORMAL GRIP
2 3 4 5 6 7 8 9 1030
40
50
60
70
80
90
100
110
DISPLACEMENT [mm]
ST
RA
IN/D
ISP
. [m
icro
stra
in/m
m]
Apply MTS; Calculate MD
Database of MD ranges for different
anomalies
Unknown
[M D range] for c ase 1[M D range] for c ase 2...[M D range] for c ase N
Strain/Displacement vs. Displacement
Signatures
Ideal Case
Anomalies (w/ replications)
Case 1
Apply MTS; Calculate MD
ranges
Root Cause Analysis
Compare MD
Unknown ?= {1,2 ,.... ,N }
Prior to Production
Tool in Production
2 3 4 5 6 7 8 9 1030
40
50
60
70
80
90
100
110
DISPLACEMENT [mm]
STR
AIN
/DIS
P. [
mic
rost
rain
/mm
]
NORMA L GRIP
Case N
Case 2
Fig. 7 MTS as a tool for root-cause analysis
Int J Adv Manuf Technol (2008) 39:995–1008 1005
In phase 4, plates with different thicknesses are testedusing the MS and the MD ranges calculated in previousphases. The results of the final experiment are summarizedin Table 3. The MTS methodology has successfullydetected the grip lengths of 0.144″ (over grip), 0.20″(normal grip) and 0.29″ (under grip) with a detection rate of87.5%, 100%, and 96.8%, respectively.
6.1 Variability in the process signatures
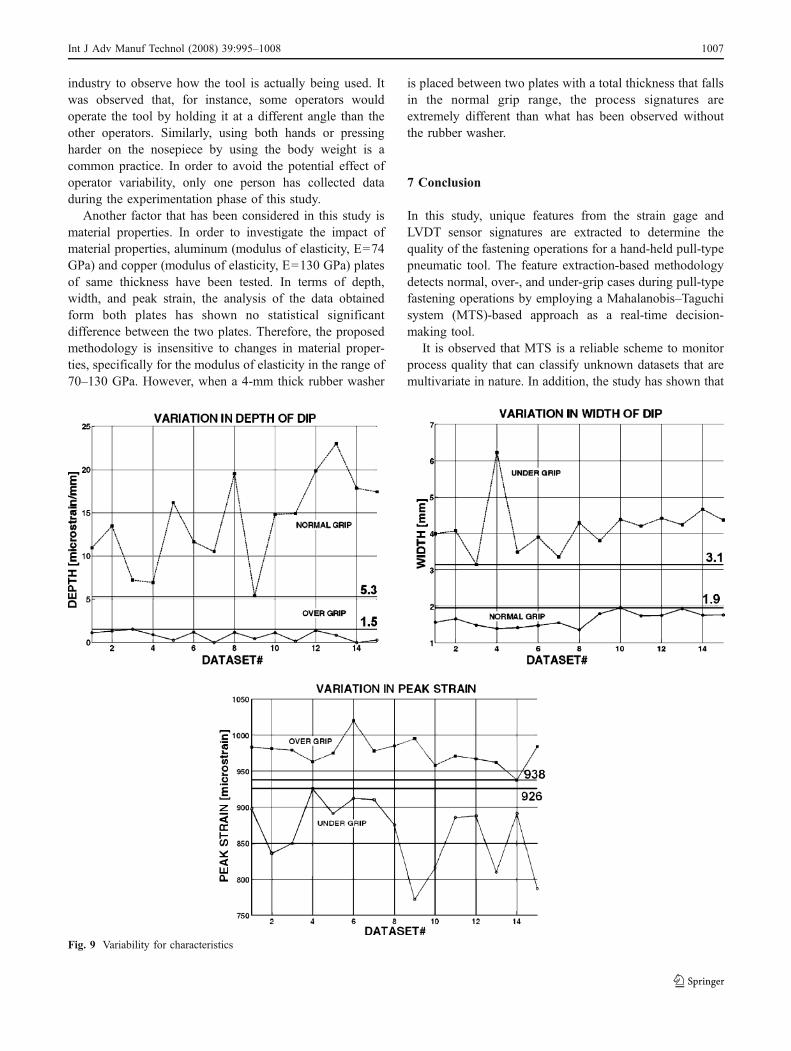
This section presents the analysis of variability in the sensordata collected and variability of the parameters in thesignatures used for determining the quality of the fasteningprocess. The analyses are based on the parameters used fordetecting the “bowl-shaped” dip as shown in Fig. 5. Thevariability in the depth, width and peak strain for differentgrip length signatures collected across 15 trials each areshown in Fig. 9.
In general, several factors can contribute to variability indata: tolerance on plate thickness, sensitivity of sensors onthe tool, and operator. The manufacturers specify atolerance range for plates. For instance, a plate of a nominalthickness of 0.290″ has been used during experimentationfor under-grip cases. According to the specifications sheet,the tolerance on the plate is ±0.016″. Hence, the variabilityin plate thickness could vary from 0.306″ to 0.274″. Sincethis paper presents a prototype tool, rather than aproduction-ready tool, no measurements were made onplate thickness at the joints during validation of theproposed proof-of-concept model. Therefore, tolerance onplates is introduced here as a factor that can cause potentialvariation in data in actual production environments, notnecessarily as a factor that has caused variations in theexperiments presented in this study.
Another factor is the sensitivity of the sensors integratedwith the tool. For instance, the strain gage used on thenosepiece has a 120 ohm configuration with ±0.15%variability in resistance. It yields a variability of ±7.24micro strain. Similarly, the displacement data are acquiredvia LVDT, which has a sensitivity of ±6.2 nanometer permm. Consider the following example. For 500 micro strainand 5 mm displacement, the nominal value for S/D is 100microstrain/ mm. When the variation is considered, it ispossible that this value could range from 98.56 to 101.44.
Operator variability can also play a major role invariation in an actual production environment. During thedevelopment phase of this study, several trips were made to
Table 3 Results of the experiment: detection of grip lengths
Griplength MD range Numberof trials
Correctdetection
Falsedetection
Numberof falsedetection
0.144″ [8.5, 13.6] 35 88.50% 11.50% Four detected
as 0.2″
0.2″ [0.1, 2] 30 100% 0% 0
0.29″ [26.5, 82.7] 35 91.40% 8.60% Two was detected
as 0.144″
Table 2 Screening of characteristics
Run Characteristics MD values
1 2 3 4 5 6 7 Over grip Under grip 1/sum S/N (Eq (8))
1 1 1 1 1 1 1 1 8.8 29.0 0.1 11.32 1 1 1 2 2 2 2 10.8 35.9 0.1 12.23 1 2 2 1 1 2 2 6.7 8.3 0.3 8.74 1 2 2 2 2 1 1 7.0 2.4 0.6 5.55 2 1 2 1 2 1 2 11.4 44.6 0.1 12.66 2 1 2 2 1 2 1 19.6 66.2 0.1 14.87 2 2 1 1 2 2 1 6.7 5.5 0.3 7.88 2 2 1 2 1 1 2 13.1 3.0 0.4 6.9S/N When present 37.7 50.9 38.2 40.4S/N When absent 42.1 29.0 41.6 39.5Gain (Eq (9)) −4.4 21.9 −3.4 0.9
Characteristics (5,6,7 above in the table not used)1. Depth2. Width3. Displacement4. Peak strainSignificant charactristics*2. Width4. Peak strain*) Depth and displacement do not have significantimpact since they have negative gain values.
1006 Int J Adv Manuf Technol (2008) 39:995–1008
industry to observe how the tool is actually being used. Itwas observed that, for instance, some operators wouldoperate the tool by holding it at a different angle than theother operators. Similarly, using both hands or pressingharder on the nosepiece by using the body weight is acommon practice. In order to avoid the potential effect ofoperator variability, only one person has collected dataduring the experimentation phase of this study.
Another factor that has been considered in this study ismaterial properties. In order to investigate the impact ofmaterial properties, aluminum (modulus of elasticity, E=74GPa) and copper (modulus of elasticity, E=130 GPa) platesof same thickness have been tested. In terms of depth,width, and peak strain, the analysis of the data obtainedform both plates has shown no statistical significantdifference between the two plates. Therefore, the proposedmethodology is insensitive to changes in material proper-ties, specifically for the modulus of elasticity in the range of70–130 GPa. However, when a 4-mm thick rubber washer
is placed between two plates with a total thickness that fallsin the normal grip range, the process signatures areextremely different than what has been observed withoutthe rubber washer.
7 Conclusion
In this study, unique features from the strain gage andLVDT sensor signatures are extracted to determine thequality of the fastening operations for a hand-held pull-typepneumatic tool. The feature extraction-based methodologydetects normal, over-, and under-grip cases during pull-typefastening operations by employing a Mahalanobis–Taguchisystem (MTS)-based approach as a real-time decision-making tool.
It is observed that MTS is a reliable scheme to monitorprocess quality that can classify unknown datasets that aremultivariate in nature. In addition, the study has shown that
Fig. 9 Variability for characteristics
Int J Adv Manuf Technol (2008) 39:995–1008 1007
MTS can also be used as a real-time decision-making tool.The proposed methodology has the ability to classifydifferent grip lengths within the abnormal group, which isextremely useful where there are multiple failure modes tobe detected. Wireless implementation on the pull-typeprototype tool has shown that such a methodology is alsopractical and reliable for in-process quality control on theshop floor. Such real-time quality control techniques canreduce the amount of post-process quality control therebysaving time and capital.
Overall, the implementation of the proposed architectureon hand-held tools can (1) detect and report qualityproblems in real-time during the process, (2) reduce thenumber of characteristics needed for decision making,thereby reducing the complexity of the procedure, and (3)reduce post-process inspection, thereby improving qualitywhile reducing cost and man power. In addition, theapproach facilitates 100% data collection, for futureanalysis, on each fastener as opposed to traditionalstatistical process control (SPC) techniques, which rely onsampling.
Acknowledgements This study was funded by the Air ForceResearch Lab (FA8650-04-C-704) through the Center for AerospaceManufacturing Technologies (CAMT) at the University of Missouri-Rolla (UMR). The authors also acknowledge the contribution ofJeffrey Birt (UMR) for prototyping of the tool and of James Fonda(UMR) for the implementation of the wireless communicationsprotocol.
References
1. Speck JA (1997) Mechanical fastening, joining and assembly.Marcel Dekker Inc., New York, pp 6–7
2. Goodsmith D (1987) Clamping verification probe. US Patent 4649 753, Mar. 17, 1987
3. Pekar G (1989) In: Mason J, Blane M. Portable grip lengthindicator. US Patent 4 876 800, Oct. 31, 1989
4. Ekdahi M, Hanks J, Hiller B, LaChapelle J, Thomas K, Turley M(1998) Fastener verification system. US Patent 5 727 300, Mar. 171998
5. Luner J, Hoeckelman L, Kleine D (2006) Fastener grip lengthselector. US Patent 7 065 897, Jun. 27, 2006
6. Hoeckelman L (2006) Clamping fastener grip length indicator. USPatent 7 070 375, Jul. 4, 2006
7. Christian E, Blunck R (1980) Fastener grip length measuringsystem. US Patent 4 237 612, Dec. 9, 1980
8. Howard B, Avery J (1997) Real time fastener measurementsystem. US Patent 5 673 839, Oct. 7, 1997
9. Mauer D, Roeser H, Opper R, Wojcik A, Schoenig C (2001)Riveting system and process for forming a riveted joint. US Patent6 276 050, Aug. 21, 2001
10. Harlow G, Dise R (2005) Method for installing blind fasteners.US Patent 6 851 167, Feb. 8., 2005
11. Byrne D, Chitty E (1997) Blind rivet set verification system andmethod. US Patent 5 661 887, Sep. 2, 1997
12. Weeks G, Hull D, Godwin S, Jackson G (2006) Method andapparatus for monitoring blind fastener setting. US Patent 7 024746, Apr. 11, 2006
13. Vanbergeijk E (1999) Wireless cycle monitoring system for powertools. US Patent 5 898 379, Apr. 27, 1999
14. Klingajay M, Seneviratne L, Althoefer K (2003) Identification ofthreaded fastening parameters using the Newton–Raphson meth-od. Proceedings of the 2003 IEEWRSJ Intl. Conference onIntelligent Robots and Systems, vol 2, pp 2055–2060, 27–31,Oct 2003
15. Klingajay M, Giannoccaro N (2003) Comparison between leastsquare & Newton–Raphson for estimation parameters of anautonomous threaded fastenings. IEEE Intl Conference onIndustrial Technology 1:163–168, 10–12, Dec. 2003
16. Rosenstcngel J, Miller I, DeSirnio M, Derriso M, Brown K,Braisted W, Olson S (2004) Detection of fastener failure in athermal protection system panel. IEEE Aerosp Conf Proc 4:2464–2473, 06–13, Mar 2004
17. Giannoccaro N, Klingajay M (2004) Identification of threadedfastening parameters based on least square method. SICE AnnualConference 3:2592–2597, 04–06, Aug 2004
18. Seneviratne L, Visuwan P (1999) Weightless neural networkbased monitoring of screw fastenings in automated assembly.Proceedings. ICONIP '99. 6th International Conference on NeuralInformation Processing, vol 1, pp 353–358, 16–20, Nov 1999
19. Chinnam RB, Rai B, Singh N (2004) Tool-condition monitoringfrom degradation signals using Mahalanobis–Taguchi systemanalysis. Robust Engineering, ASI’s 20th Annual Symposium,pp 343–351
20. Wang H, Chiu C, Su C (2004) Data classification usingMahalanobis–Taguchi system. Journal of the Chinese Institute ofIndustrial Engineers 21(6):606–618, Jan
21. Srinivasaraghavan J, Allada V (2004) Application of Mahalanobisdistance as a lean assessment metric. Int J Adv Manuf Technol29:1159–1168
22. Taguchi G, Jugulum R (2002) The Mahalanobis–Taguchi strategy -a pattern technology system. Wiley, New York
23. Fonda J, Zawodniok M, Jagannathan S, Watkins SE (2006)Development and implementation of optimized energy-delay sub-network routing protocol for wireless sensor networks. Proc. ofthe IEEE International Symposium on Intelligent Control, pp 119–124, Oct 2006
1008 Int J Adv Manuf Technol (2008) 39:995–1008
Related Documents