Real -Time Continuous Monitoring a nd Ada ptive Control (CMAC) Improving Stormwater Systems Performance April 18, 2016

Welcome message from author
This document is posted to help you gain knowledge. Please leave a comment to let me know what you think about it! Share it to your friends and learn new things together.
Transcript

Real-Time Continuous Monitoring a nd Ada ptive Control (CMAC)
Improving Stormwater Systems Performance
April 18, 2016

Speakers
Eric Strecker Judd Goodman
Chad Helmle
Owen Cadwalader
2

CA Stormwater Strategy
To lead the evolution of storm water management in California by
• advancing the perspective that storm water is a valuable resource
• supporting policies for collaborative watershed-level storm water management
• addressing obstacles, developing resources, and integrating regulatory and non-regulatory interests
Continuous Monitoring and Adaptive Control is a tool to help achieve these goals
3
Audience
Regulators
Stormwater Permittees
Other interested parties – research institutions, non-profit organizations, consultants
4

Outline 1. Background
2. Case Studies • Continuous Monitoring • Adaptive Control
3. CMAC in California
4. Challenges for Technology Adoption
5. Discussion
5

Background And what is CMAC?
6

How do we improve the performance of BMPs?
• Better, more timely information on maintenance and/or operational adjustment needs (adaptive management)
• More information on BMP performance to improve BMP selection and design for the future
• Improving the hydraulic operations and resulting performance of BMPs using active control
• Water quality • Hydromodification • Flood control, and/or
• Water supply augmentation 7

Stormwater Monitoring
Manual Measurements Manual Sample Collection
Continuous Flow Measurements Auto Sampling
On-site Data Logging
Continuous Monitoring with Telemetry
Ongoing Effort
Turn Around Time
Number of Observations
High
Slow
High
Low
Fast
Low
8

Stormwater Control Passive Adaptive Active + Adaptive
BMP is designed and set for modeled conditions
BMP can react to current conditions
BMP can be adapted over time
9

Stormwater In frastructure
Continuous Monitoring and Adaptive Control
Report Performance
Identify Maintenance Adapt Control
Panel
Valve
Level Sensor
10

Example BMP Types Where CMAC can be applied
Rainwater Harvesting
Detention and Infiltration Water Quality and Flow Control
Bioretention
11

Case Studies Continuous Monitoring
12

Orange County – Wa ter Qua lity Monitoring
13

Real-time Wa ter Qua lity Monitoring Pra do Wetla nds Da ta Aggrega tion
Provide understanding about wetland dynamics Inform operation
14

Camera Maintenance Monitoring
… outlet clogging
Overtopping
15

Bioretention cell piezometer
Bioretention cell soil moisture and rain gauge
Milwaukee, WI Green Infrastructure Performance Monitoring
*Project completed in partnership with MMSD and Veolia 16

Performance Reporting & Maintenance Alerts
Soil moisture at Mequon Bioretention Cell is >90% 6 hours after rain. Maintenance may be required.
17

Performance Reporting – Multi Site
Over 84 million data points collected Over 440 unique rain events Over 420,000 gallons captured 18

Case Studies Continuous Monitoring & Adaptive
Control
19

Controlling the Hydrograph – Wet System s
0
Rainfa ll
Uncontrolled Discharge
Typical Passive ly Controlled Discharge
Peak Flow Targe t
Time Active va lve is opened , to m ake capacity ava ilab le p rior to forecasted
even t
Active ly controlled
20

21
Controlling the Hydrograph – Dry Systems
Time 0
Rainfa ll
Active va lve is closed , no d ischarge
Uncontrolled Discharge
Peak Flow Targe t
Typical Passive ly Controlled Discharge
Active ly controlled

Designed for the Watershed Scale
Public API
22

Before Afte r
Hydromodification – Wet Pond Oregon
120 acres a t 50% im pervious
23

Return to target dry weather state within allowable timeframe
Release at minimum rate during event, if needed, to make capacity available
General Operation and Control Logic
Inspect and prepare in advance of forecasted event
Continually adapt to current conditions and forecast
24

Example Storm in Oregon
Butternut Creek Pond Retrofit - Beaverton, Oregon
25
Overflow
25

Hydromodification – Dry Pond Oregon
Based on continually updated precipitation forecasts, automated valve controls discharge to achieve hydrom odif icat ion goals
Cont rol Panel
Act uat ed Valve in Flow Cont rol Vault
Washingt on Count y, Oregon 6 ac-ft pond for flood and channe l e rosion protection
26

Oregon – Performa nce November 2015
27

Flow Duration Control Achieved
0.1
1
10
100
1000
0 5 10 15 20
Dur
atio
n w
ith fl
owra
te e
xcee
ding
flow
thre
shol
d,
hrs
Flowrate, cfs Estimated Inflow Passive Outflow (estimate, modeled)Active Outflow (monitored)
Highlight s
• 60% reduction in wet weather volume
• 70% reduction in volume within erosive flow range
• Increase in residence time from 1 to 19 hours
• 30% lower peak flow in large events
• Ability to adjust control parameters to target alternative goals
28

New Development Pond - Oregon
Highlight s • 50% reduction in
typical drawdown time
• 70% reduction in maximum inundation period
• Ability to adjust control parameters to target alternative goals
• 30 to 50% reduction in required pond size
29

Modeled Flow Duration Curve Comparison
high f lows dictate sizing for t his LID BMP with simple out let st ructure
for rest of t he f low range, t he pre-
development curve is above the post -
development curve
30

Modeled Flow Duration Curve Comparison
BMP Storage Comparison: Passive = 1.32 inches Act ive = 0.60 inches
No precipit at ion forecast necessary
31

Water Quality Control – Dry to Wet Pond Conversion Maryland
Frost Pond Prince Georges County, MD
60 Acre Dra inage Area 19 Acre Im pervious
Approx. 0.5 ac Peak Shaving Dry Pond
built in 1988
32

Frost Pond – Dry Pond Maryland
33

Conventional Retrofit Dig a Bigger Hole !
Excavate 3.2 ft to create 1.7 ac-ft of storage Or… 34

Opti Retrofit Ada ptive ly Control Flow
Add a valve and control logic
To create >2 ac-ft of extended detention volume
35

Preparing for Rain: Pre -Event Foreca st
Opt i int erpret s forecast
36

Example Storm: J a nua ry 9 to 11, 2016
ext ended det ent ion
37

Downstream benefits for range of events Small Event with 100% Infiltration
fall ing wat er level, valve closed
38

Wet Pond Chesa pea ke Ba y Region
April 6, 2016
Opti Control Panel 39
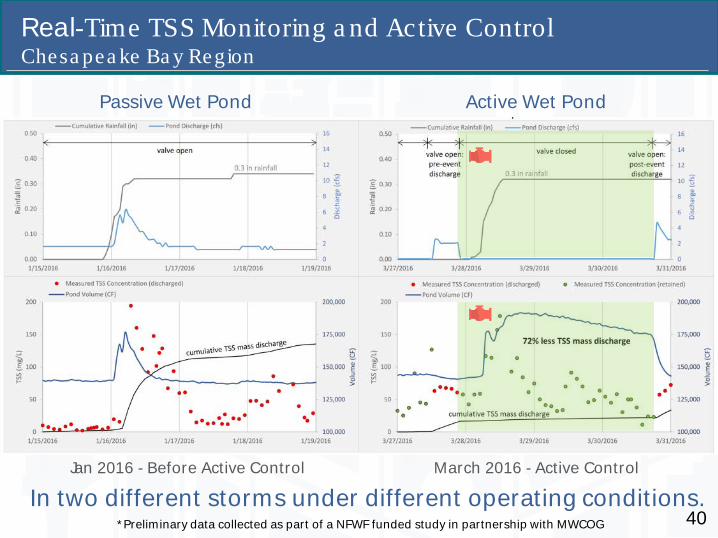
Real-Time TSS Monitoring a nd Active Control Chesa pea ke Ba y Region
Jan 2016 - Before Active Control March 2016 - Active Control
Active Wet Pond Passive Wet Pond
* Preliminary data collected as part of a NFWF funded study in partnership with MWCOG
In two different storms under different operating conditions. 40

Real-Time TSS Monitoring a nd Active Control Chesa pea ke Ba y Region
* Preliminary data collected as part of a NFWF funded study in partnership with MWCOG
TSS can be measured in real-time to show facility performance Active operation appears to discharge less TSS by enabling more settling
41

CMAC Advantages
• Track event and long-term performance to inform O&M needs and design/operational changes
• Retrofit existing infrastructure to enhance performance at a lower cost than traditional retrofits
• Decrease size of new facilit ies and/or enhance performance where available footprint is limited
• Adapt infrastructure operation with logic changes as site conditions and climate changes
• Provide site and watershed-scale data to stakeholders
42

CMAC in California Regulations and Applications
43

Regulatory and Programmatic Drivers
Considering…
• Water Quality Impairments
44

Regulatory and Programmatic Drivers
Considering…
• Water Quality Impairments
• Drought & Water Scarcity
45

Regulatory and Programmatic Drivers
Considering…
• Water Quality Impairments
• Drought & Water Scarcity
• El Niño & Increased Flooding
46

Regulatory and Programmatic Drivers
Considering…
• Water Quality Impairments
• Drought & Water Scarcity
• El Niño & Increased Flooding
• Integrated Water 47

Southern California MS4 Permit Compliance
EWMPs and WQIPs prescribe over $25 bil l ion of storm wate r con tro ls (16,000+ ac-ft of BMPs)
Green in frastructure length conside red = ha lf Earth ’s circum ference
48

Southern California MS4 Permit Compliance
EWMPs and WQIPs prescribe over $25 bil l ion of storm wate r con tro ls (16,000+ ac-ft of BMPs)
Green in frastructure length conside red = ha lf Earth ’s circum ference
Opera ting in bu ilt ou t environm ent with lim ited , expensive rea l e sta te
49

Greater LA Water Collaborative
50

Greater LA Water Collaborative
51

Project vets installation barriers; political obstacles; physical constra in ts; and public hea lth , sa fe ty, and accep tance
How can concepts be sca led regionally?
Taking it to Scale
52

Taking it to Scale
Project vets installation barriers; political obstacles; physical constraints; and public health, safety, and acceptance
How can concepts be scaled regionally?
53

Optimizing Multiple Objectives
Water Supply
Flood Control
Water Quality
54

Water Supply
Flood Control
Water Quality
Optimizing Multiple Objectives
55

Lakewood Stormwa ter Ca pture Project
3,200 ac
2,400 ac
56

Lakewood Stormwa ter Ca pture Project
57

Lakewood Stormwa ter Ca pture Project
58

Lakewood Stormwa ter Ca pture Project
59

Lakewood Stormwa ter Ca pture Project
60

Lakewood Stormwa ter Ca pture Project
61

CMAC installed to….
• Optim ize pe rform ance
• Reduce risk and provide ce rta in ty of pe rform ance
• Quantify p rogress
• Enable in te rju risd ictiona l coord ina tion /contro l
• Adapt to em erging da ta and pe rform ance needs
In Lakewood California,
62

Challenges for Technology Adoption
63

Challenges for Technology Adoption Adoption • Project Proponents are interested in CMAC, but project
approval is uncertain
• Evolution of the science vs. permit cycles
• Permits should continue to allow for performance based options (e.g., 85th percentile runoff storage vs. 80% capture or load reduction)
• Collection of performance data should be encouraged as part of adaptive management vs. creating potential liability
• Analyses need to consider forecast uncertainty 64

Questions for Wa te r Boa rds • How could the Water Boards encourage the application
of this technology?
• What are some of the regulatory hurdles that would need to be addressed to make the most of this technology?
• How can collection of performance data be encouraged in support of adaptive stormwater management while limiting potential liability of permittees?
65

Questions for Wa te r Boa rds • Are the Water Boards prepared to handle large
performance related data sets this technology would generate?
• What types of information, case studies or training would Water Board staff want to allow the use of CMAC technology to demonstrate compliance with NPDES Permit requirements?
66

Questions for Permittees • What resources do Permittees need to approve CMAC
technology to meet NPDES Permit requirements?
67

Discussion
68

Thank You!
69
Eric Strecker [email protected]
J udd Goodma n
jgoodma [email protected]
Owen Ca dwa la der oca dwa la der@optirtc .com
Cha d Helmle
Cha d.Helmle@te tra tech.com

Appendix
70

Modeling
71

Nationwide Modeling Study
72

Volume Discharged During Wet vs. Dry Weather
Passive Discharge
73
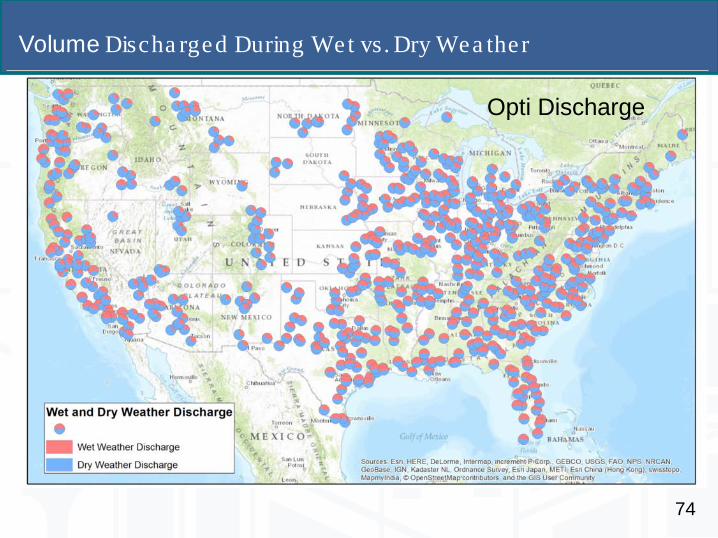
Volume Discha rged During Wet vs. Dry Wea ther
Opti Discharge
74

Summary Statistics for 1-in Storm
75

Sacramento Model Goal: Determine allowable reduction in stormwater detention facility size while maintaining capture and treatment performance.
50-year hourly simulation using Folsom rainfall record*
Both meet 85% capture of site runoff
Both provide adequate retention time
Opt i t ank is up t o 45% sm aller
per WEF Manual of Practice No. 23/ASCE Manual and Report on Engineering Practice No. 87
constant release = 12-hr drawdown
release only in advance of rainfall
MODEL RESULTS SNAPSHOT
*Rainfall-runoff modeled in SWMM V5.1. 11 acre drainage area, 15% impervious. Volume-discharge modeled in Excel spreadsheet. Perfect forecast assumed for Opti scenario.
76

Forecast Accuracy
77

One Year of Forecast and Precipitation Data Pennsylva nia
24hr Forecast and Precipitation Totals 78

Security
79

Opti Security Key Feat ures of t he Opt i Plat form • All access to Opti Platform services is provided to authorized users
over Hypertext Transfer Protocol (HTTP) and Websocket Protocol (WS) within al l connect ions encrypt ed by Transport Layer Security (TLS) via web browser or via application programing interfaces (APIs).
• Storage, monitoring, and alarm services check on sit e up t o every m inut e, 24/7/365, preserving a record.
• Redundant Platform instances across m ult iple dat a cent er fault zones.
• Independent Application Performance Monitoring solution provides real-t im e visibi l i t y int o service int er rupt ions.
• Internal Public Key Infrastructure (PKI) system with credential roles manages rotation and distribution of least -pr ivi lege credent ials to Opti Platform service hosts.

Opti Security Secur it y Pr inciples of Opt i Com m unicat ions Hardware for Cont rol Applicat ions • Modern , purpose -specific em bedded opera ting system (FreeRTOS) with secur it y updat es
over-the -a ir by Opt i .
• Strong encryption used in all exte rna l ne twork com m unica tions with ha rdware storage of re levant keys.
• All com m unica tions estab lished with out bound-only connections from fie ld devices.
• Device-specif ic credent ials and identifie r guarantees com prom ise of a single device does not equa te to com prom ise of othe rs.
• Assum ed obsolescence and p lanned pa th for sm ooth m igra tion . “Future Proof”.
• Com m ercia l off the she lf ha rdware for d irect sensor m easurem ent and control with physical ly separat e m icrocontrolle r/com m unica tions ha rdware .
• User access and experience is independent of ha rdware , and can be upgraded independent ly.

Lifetime Costs
82

OptiRTC.com
Op ti ROI Sum m ary
Opt i can save
up t o 90% on cap ita l expenses
25% t o 75% of t he 25 year l i fe-cycle cost re la tive to a passive facility with sim ilar pe rform ance
+

OptiRTC.com
Case Study 1 – Stream Protection Clean Wate r Se rvices, Oregon
Cust om er Challenges Lim ited existing storm water m anagem ent facilitie s – bu ilt to various h istorica l standards, constra ined floodpla ins, sensitive riparian a reas, soil conditions lim it in filtra tion .
CWS needed solu tions to m ee t MS4 wate r qua lity and flow con trol m anda tes under constra in ts.
Opt i Solut ion In partnersh ip with Clean Water Services (CWS), Opti and Geosyntec ran two pilot tests a t ponds in CWS service area during 2015. Extensive m odeling shows the poten tia l for long term perform ance ga ins a t add itiona l facilitie s iden tified th rough a regiona l eva lua tion and screen ing process. The partnersh ip de ta iled p lans to sca le up th is approach in a 2015 white paper.
Cont rol Panel
Act uat ed Valve in Flow Cont rol Vault
Washingt on Count y, Oregon 6 ac-ft pond for flood and channe l e rosion protection
*Project funded by CWS

OptiRTC.com
Case Study 1 – Stream Protection Pe rform ance High ligh ts
Existing Water Quality Facility (Butternut Creek, Lower Pond)
• 25% reduction in duration of channel forming discharges
• 20% reduction in wet weather discharge
• Performance increases despite very small facility size
Flow Control Facility (Bethany Creek Falls)
• 70% reduction in volume within critical flow range
• 60% reduction in wet weather volume
• 30% lower peak flow in largest events
• Increase in residence time from 1 to 19 hours
New Development Flow Duration Control Pond
• 30 to 50% reduction in required pond size
• 50% reduction in typical drawdown time
• 70% reduction in maximum inundation period
Modeled & Monitored Modeled
2,667 storm water m anagem ent facilitie s were eva lua ted as candidates for Opti.
62 were iden tified as h igh priority and hundreds m ore a s strong candidates.

OptiRTC.com
Case Study 1 – Stream Protection ROI Ca lcu la tion
86
On average , t he whole l i fecycle cost of Opt i was approxim at ely 3 t im es lower t han t he cost of a passive ret rof it tha t would ach ieve the sam e resu lts Opti had an estim ated whole lifecycle cost of approxim ate ly $4,400 per im pervious acre t reat ed com pared t o a passive alt ernat ive of $13,100
Reference: Poresky, A.; Boyle, R., Cadwalader, O. California Stormwater Quality Association. 2015 Proceedings “Taking Stormwater Real Time Controls to the Watershed Scale: Evaluating the Business Case and Developing an Implementation Roadmap for an Oregon MS4” *NPV uses a discount rate of 5%

OptiRTC.com
Pr ince George’s Count y, Maryland 2 ac-ft d ry to we t pond conversion trea ting 19 im pervious acres
Case Study 2 - Wate r Qua lity Prince George ’s County, MD
Cust om er Challenges Meeting Tota l Maxim um Daily Load in the Chesapeake Bay for n itrogen , phosphorus, and sed im ent. County needs an e fficien t way to increase residence tim e of d ry and wet ponds to p rom ote se ttling and b iologica l rem oval p rocesses.
The ob jective is to ob ta in pollu tan t reduction cred its (trea ted im pervious acres). Opt i Solut ion Opti converted a d ry pond to a wet pond in Prince George ’s County, MD in 2015. Th is 2 ac-ft pond can now trea t a to ta l of 60 acres includ ing 19 im pervious acres.
The passive re trofit a lte rna tive would have requ ired excava ting 3.2 ft deeper in to the pond to crea te a perm anent pool for wate r qua lity trea tm ent.
Solar Powered Cont rol Panel
Weir and Act uat ed
Valve Ret rof it
*Project funded by NFWF

OptiRTC.com
Case Study 2 - Wate r Qua lity ROI Ca lcu la tion
88
References: Construction and annual costs from Opti and from a comparison bid for passive retrofit and maintenance of the same pond. *NPV uses a discount rate of 5%

OptiRTC.com
Case Study 3 – CSO & RWH DDOE, Wash ington DC
Cust om er Challenge
Washington DC Departm ent of Energy and Environm ent need to reduce wet-wea ther d ischarge with lim ited space for tank insta lla tion and lim ited budge t.
Ultim ate goa l is to reduce Com bined Sewer Overflows
Opt i Solut ion
Insta lled two Opti-m anaged 4,000 ga llon ciste rns a t Engine House 3 and 25 in downtown Washington D.C.
Ach ieved wet-wea ther d ischarge reduction AND ra inwate r harvesting.
Per form ance Result s
Opt i – Achieved wet-wea ther d ischarge m anda te using a 4,000 ga llon ciste rn a t each site while keep ing wate r ava ilab le for reuse .
Passive Alt ernat ive – Would requ ire 23,500 ga l ciste rn a t each site for equ iva len t wet-wea ther perform ance withou t Opti.
Engine House 3
Engine House 3, Washingt on, D.C. 4,000 ga llon ciste rn to m in im ize we t-wea the r d ischarge
*Project funded by WERF

OptiRTC.com
Case Study 3 – CSO & RWH ROI Ca lcu la tion
90 Reference: Quigley, M., Brown, C. 2014. Transforming Our Cities: High Performance Green Infrastructure. Water Environment Research Foundation. INFR1R11. *NPV uses a discount rate of 5%
Related Documents