RESEARCH January – March 2021 REAL INSIGHT RESIDENTIAL

Welcome message from author
This document is posted to help you gain knowledge. Please leave a comment to let me know what you think about it! Share it to your friends and learn new things together.
Transcript

RESEARCH
January – March 2021
REALINSIGHTRESIDENTIAL
FOREWORD Dhruv AgarwalaCEO–Elara GroupHousing.com | PropTiger.com | Makaan.com
01
The year 2020 was marred due to the economic and social repercussions of the COVID-19 pandemic and the subsequent worldwide lockdowns. However, the beginning of 2021 was marked by a silver lining with the roll out of the much-awaited vaccine. The availability of vaccines has only reinforced confidence in the growth outlook providing stronger tailwinds for the recovery of the global economy. After all, the International Monetary Fund (IMF) has forecasted the world economy to expand by 6 percent in 2021, after a 3.5 percent contraction in the previous year. Countries such as the US, the UK, Canada, Australia, China, Japan and India, which were in a recession for most of the previous year, are estimated to show positive growth in 2021.
Among these major economies, India is expected to grow the fastest clocking a double-digit growth in 2021. The IMF has projected the Indian economy to expand by 12.5 percent in 2021, reflecting the expectations of the vaccine-powered strengthening of the economic ecosystem. High-frequency indicators such as the Goods and Service Tax (GST) collections, Manufacturing Purchasing Managers’ Index (PMI), Services PMI, power demand and fuel consumption are nearing and/or surpassing the pre-COVID levels. The Manufacturing and Services PMIs have continued to remain above the 50 mark.
The overall improving economic scenario and consumer sentiments also underpinned the residential demand that has nearly bounced back to the pre-COVID levels. A host of factors such as low home loan rates, stamp duty cuts in few states, such as Maharashtra and Karnataka, developer's schemes and pent-up demand have definitely improved the sentiments in the first quarter of 2021. Moreover, a slew of measures such as increasing the safe harbour limit, tax exemptions for investments in REITs, reduced interest for a�ordable housing and many more have been announced by the central government for FY 2022, to provide impetus to the real estate sector in India.
While the key indicators and availability of vaccines did set a stage for recovery of the real estate sector in the first quarter, it is important not to lose sight of the fact that the pandemic is not yet over, and the resurgence of cases continues to impact the economy. The fresh curbs introduced in some cities, importantly the metros of NCR and Mumbai, will have a significant bearing on consumption demand in the coming quarter.
Stay safe and stay well!
PROPTIGER RESEARCH
02
TABLE OFCONTENTS
05–08OVERVIEW
09–15All INDIA MARKET TRENDS
16–32CITY SNAPSHOT
17-18Ahmedabad
19-20Bengaluru
21-22Chennai
25-26Hyderabad
27-28Kolkata
29-30Mumbai
23-24Delhi NCR
31-32Pune
PROPTIGER RESEARCH
03
January – March 2021
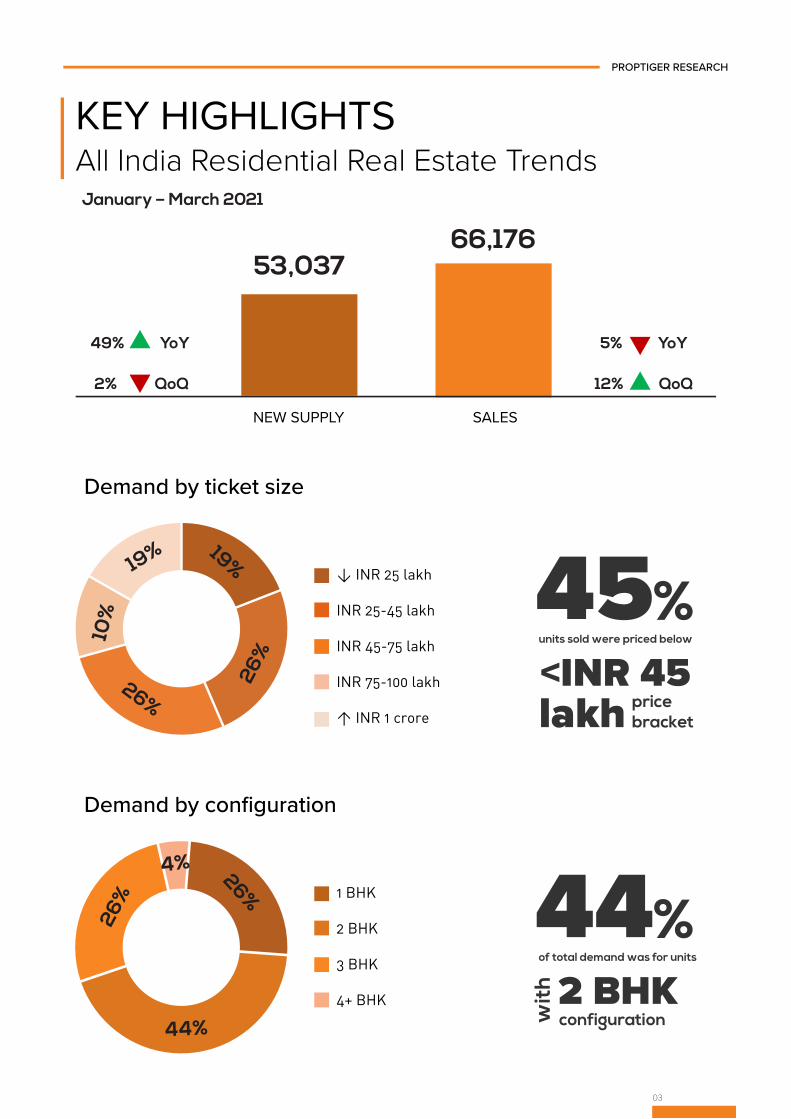
KEY HIGHLIGHTSAll India Residential Real Estate Trends
PROPTIGER RESEARCH
NEW SUPPLY
49% YoY
2% QoQ
5% YoY
12% QoQ
Demand by ticket size
53,037
SALES
66,176
19% 19%
26%
26%
10%
< INR 25 lakh
INR 25-45 lakh
INR 45-75 lakh
INR 75-100 lakh
> INR 1 crore
units sold were priced below
pricebracket
45<INR 45lakh
Demand by configuration
4% 26%
44%
26% 1 BHK
2 BHK
3 BHK
4+ BHK
of total demand was for units
configuration
442 BHK
wit
h
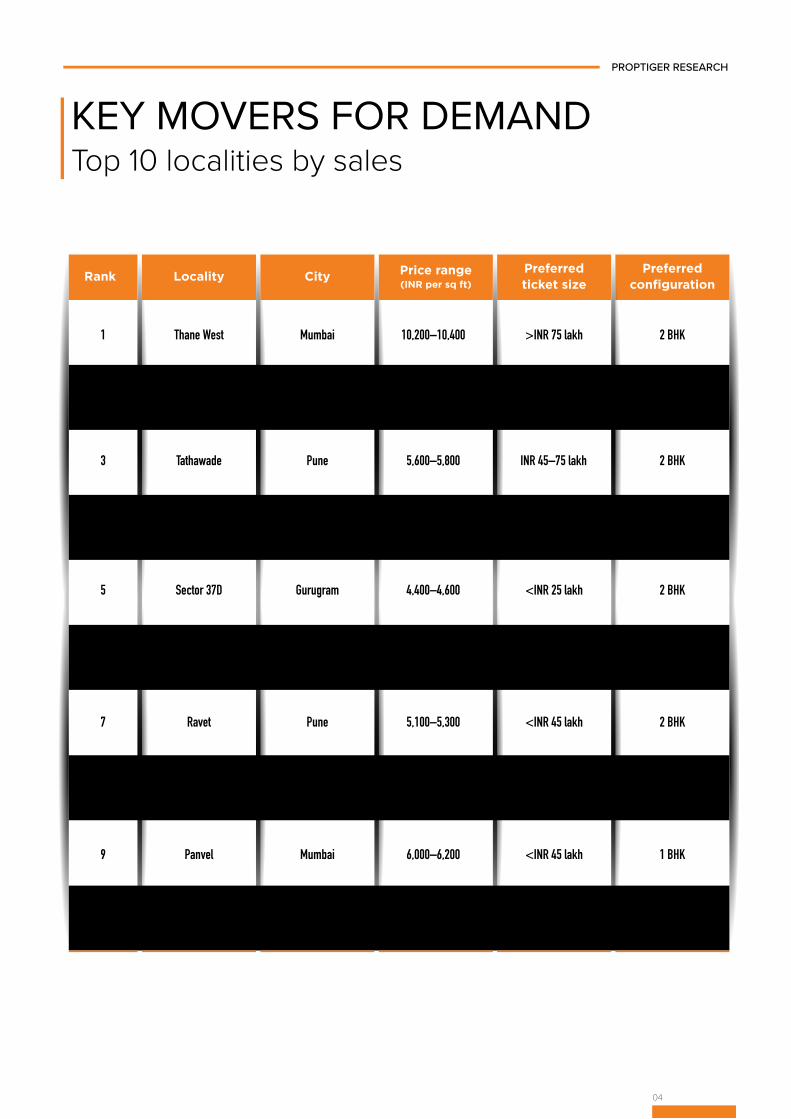
KEY MOVERS FOR DEMANDTop 10 localities by sales
04
PROPTIGER RESEARCH
Rank Locality City Price range(INR per sq ft)
Preferredticket size
Preferredconfiguration
1 Thane West Mumbai 10,200–10,400 >INR 75 lakh 2 BHK
2 Dombivli Mumbai 6,100–6,300 <INR 45 lakh 1 BHK
3 Tathawade Pune 5,600–5,800 INR 45–75 lakh 2 BHK
4 Hinjewadi Pune 5,600–5,800 INR 25–75 lakh 2 BHK
5 Sector 37D Gurugram 4,400–4,600 <INR 25 lakh 2 BHK
6 Sector 93 Gurugram 2,700–2,900 <INR 45 lakh 2 BHK
7 Ravet Pune 5,100–5,300 <INR 45 lakh 2 BHK
8 Wakad Pune 6,200–6,400 INR 45–75 lakh 2 BHK
9 Panvel Mumbai 6,000–6,200 <INR 45 lakh 1 BHK
10 Wagholi Pune 4,000–4,200 2 BHK<INR 45 lakh

OVERVIEW
05
06
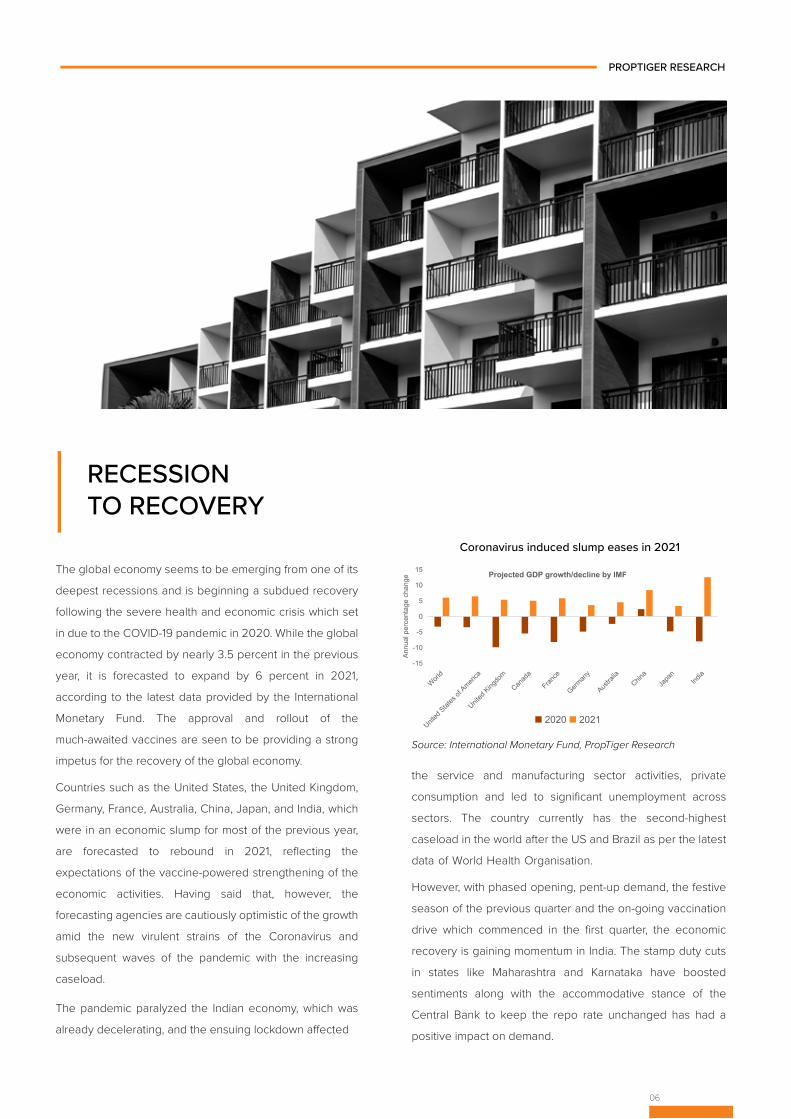
The global economy seems to be emerging from one of its
deepest recessions and is beginning a subdued recovery
following the severe health and economic crisis which set
in due to the COVID-19 pandemic in 2020. While the global
economy contracted by nearly 3.5 percent in the previous
year, it is forecasted to expand by 6 percent in 2021,
according to the latest data provided by the International
Monetary Fund. The approval and rollout of the
much-awaited vaccines are seen to be providing a strong
impetus for the recovery of the global economy.
Countries such as the United States, the United Kingdom,
Germany, France, Australia, China, Japan, and India, which
were in an economic slump for most of the previous year,
are forecasted to rebound in 2021, reflecting the
expectations of the vaccine-powered strengthening of the
economic activities. Having said that, however, the
forecasting agencies are cautiously optimistic of the growth
amid the new virulent strains of the Coronavirus and
subsequent waves of the pandemic with the increasing
caseload.
The pandemic paralyzed the Indian economy, which was
already decelerating, and the ensuing lockdown a�ected
RECESSIONTO RECOVERY
Coronavirus induced slump eases in 2021
Source: International Monetary Fund, PropTiger Research
the service and manufacturing sector activities, private
consumption and led to significant unemployment across
sectors. The country currently has the second-highest
caseload in the world after the US and Brazil as per the latest
data of World Health Organisation.
However, with phased opening, pent-up demand, the festive
season of the previous quarter and the on-going vaccination
drive which commenced in the first quarter, the economic
recovery is gaining momentum in India. The stamp duty cuts
in states like Maharashtra and Karnataka have boosted
sentiments along with the accommodative stance of the
Central Bank to keep the repo rate unchanged has had a
positive impact on demand.
PROPTIGER RESEARCH
-15
-10
-5
0
5
10
15
World
United
States
of Ameri
ca
United
Kingdo
m
Canad
a
France
German
y
Austra
liaChin
aJa
pan
India
Annu
al p
erce
ntag
e ch
ange
Projected GDP growth/decline by IMF
2020 2021
07
As indicated by the recent estimates of the National Statistical
O�ce (NSO), India has exited the ‘technical recession’ by
registering positive growth of 0.4 percent in Q3 FY 2021 after
negative growth for the two preceding quarters. Also, several
fiscal and monetary measures for the upcoming FY 2022
have been delineated with the shift in focus from short-term
disaster relief to long-term economic recovery. For instance,
the health expenditure in FY 2022 has been bumped up by
137 percent. For the vaccination drive in the country, INR
35,000 crore (USD 4.8 billion) has been allocated in the
upcoming financial year.
India started with inoculation against coronavirus at the
beginning of January 2021. It is also to be noted that India has
emerged as one of the key bulk manufacturers of the
vaccines globally. Apart from health, the government is also
focusing on revitalising the infrastructure in the country. It has
allocated INR 20,000 crore to set up a development finance
institute called the National Bank for Financing Infrastructure
and Development (NaBFID) to catalyse and boost
infrastructure sector investments.
VACCINE PUSH TOINDIAN ECONOMY
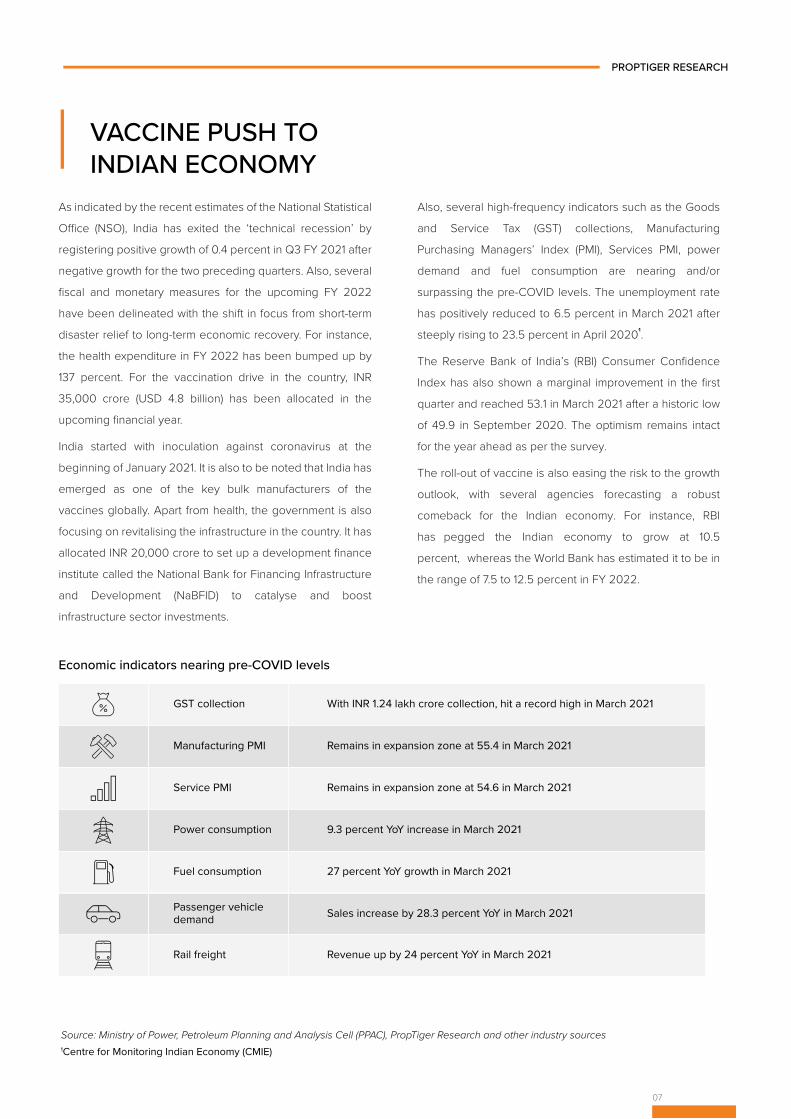
Source: Ministry of Power, Petroleum Planning and Analysis Cell (PPAC), PropTiger Research and other industry sources
PROPTIGER RESEARCH
Economic indicators nearing pre-COVID levels
1Centre for Monitoring Indian Economy (CMIE)
Also, several high-frequency indicators such as the Goods
and Service Tax (GST) collections, Manufacturing
Purchasing Managers’ Index (PMI), Services PMI, power
demand and fuel consumption are nearing and/or
surpassing the pre-COVID levels. The unemployment rate
has positively reduced to 6.5 percent in March 2021 after
steeply rising to 23.5 percent in April 20201.
The Reserve Bank of India’s (RBI) Consumer Confidence
Index has also shown a marginal improvement in the first
quarter and reached 53.1 in March 2021 after a historic low
of 49.9 in September 2020. The optimism remains intact
for the year ahead as per the survey.
The roll-out of vaccine is also easing the risk to the growth
outlook, with several agencies forecasting a robust
comeback for the Indian economy. For instance, RBI
has pegged the Indian economy to grow at 10.5
percent, whereas the World Bank has estimated it to be in
the range of 7.5 to 12.5 percent in FY 2022.
Remains in expansion zone at 55.4 in March 2021
Remains in expansion zone at 54.6 in March 2021
9.3 percent YoY increase in March 2021
With INR 1.24 lakh crore collection, hit a record high in March 2021
27 percent YoY growth in March 2021
Sales increase by 28.3 percent YoY in March 2021
Manufacturing PMI
Service PMI
Power consumption
GST collection
Fuel consumption
Passenger vehicledemand
Revenue up by 24 percent YoY in March 2021Rail freight

PROPTIGER RESEARCH
The overall improving economic scenario and consumer
sentiments also underpinned the residential demand that is
almost nearing the pre-COVID levels of the first quarter of
2020. A host of factors such as historic low home loan rates,
stamp duty cuts in few states, such as Maharashtra and
Karnataka, developer’s schemes and pent-up demand have
improved the demand in the first quarter of 2021.
On the supply side, the pandemic’s impact was cushioned by
several central and state government schemes such as the
INR 25,000 crore SWAMIH fund set up in November 2019,
and infusion of INR 30,000 crore liquidity facility and RERA
extensions provided during the pandemic.
Moreover, a slew of measures have been proposed by the
government in FY 2022 to buoy the real estate sector.
Some of which include increasing a safe harbour limit in
real estate transactions to 20 percent from 10 percent,
extending deduction of interest on purchase of a�ordable
housing, tax exemptions on REITs, Asset Reconstruction
Companies (AMCs) to deal with non-performing assets
(NPAs) and other provisions for the betterment of
construction labourers. The overall economic scenario in
the first quarter does lend itself to optimism on the back of
the vaccination drive, with residential demand and supply
being resuscitated from the pandemic’s lows.
08
RESIDENTIAL REAL ESTATE– RECOVERY IN SIGHT

ALL INDIAMARKET TRENDS
09
10
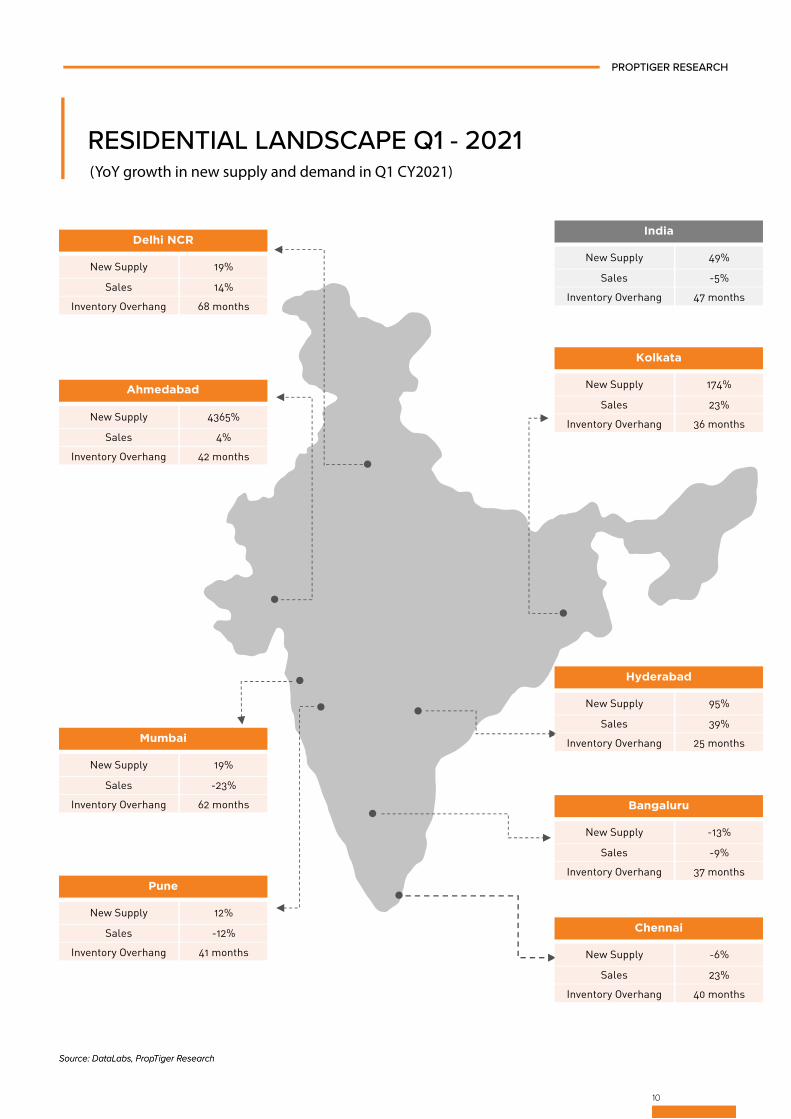
Source: DataLabs, PropTiger Research
Delhi NCR
New Supply 19%
Sales 14%
Inventory Overhang 68 months
New Supply 4365%
Sales 4%
Inventory Overhang 42 months
Ahmedabad
New Supply 19%
Sales -23%
Inventory Overhang 62 months
Mumbai
New Supply 12%
Sales -12%
Inventory Overhang 41 months
Pune
New Supply -13%
Sales -9%
Inventory Overhang 37 months
Bangaluru
New Supply 95%
Sales 39%
Inventory Overhang 25 months
Hyderabad
New Supply 174%
Sales 23%
Inventory Overhang 36 months
Kolkata
New Supply 49%
Sales -5%
Inventory Overhang 47 months
India
New Supply -6%
Sales 23%
Inventory Overhang 40 months
Chennai
10
PROPTIGER RESEARCH
Source: DataLabs, PropTiger Research
RESIDENTIAL LANDSCAPE Q1 - 2021(YoY growth in new supply and demand in Q1 CY2021)
NEW SUPPLYCity-wise breakup of new supply
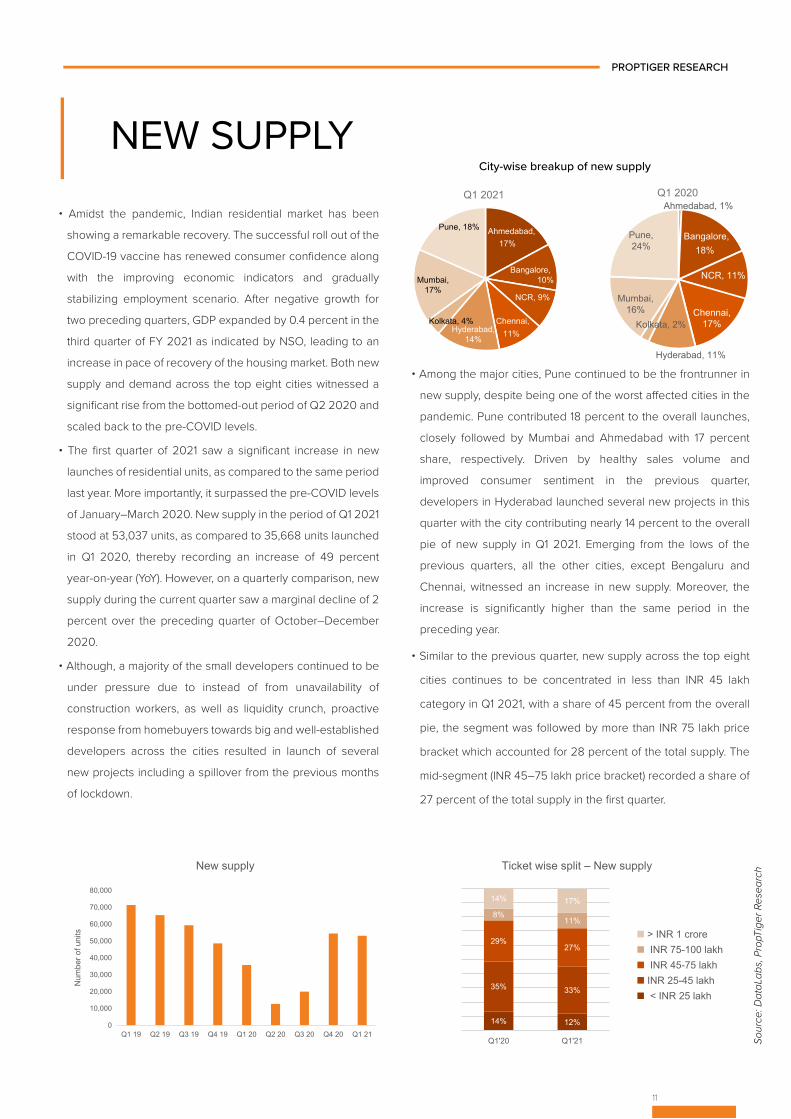
• Amidst the pandemic, Indian residential market has been
showing a remarkable recovery. The successful roll out of the
COVID-19 vaccine has renewed consumer confidence along
with the improving economic indicators and gradually
stabilizing employment scenario. After negative growth for
two preceding quarters, GDP expanded by 0.4 percent in the
third quarter of FY 2021 as indicated by NSO, leading to an
increase in pace of recovery of the housing market. Both new
supply and demand across the top eight cities witnessed a
significant rise from the bottomed-out period of Q2 2020 and
scaled back to the pre-COVID levels.
• The first quarter of 2021 saw a significant increase in new
launches of residential units, as compared to the same period
last year. More importantly, it surpassed the pre-COVID levels
of January–March 2020. New supply in the period of Q1 2021
stood at 53,037 units, as compared to 35,668 units launched
in Q1 2020, thereby recording an increase of 49 percent
year-on-year (YoY). However, on a quarterly comparison, new
supply during the current quarter saw a marginal decline of 2
percent over the preceding quarter of October–December
2020.
• Although, a majority of the small developers continued to be
under pressure due to instead of from unavailability of
construction workers, as well as liquidity crunch, proactive
response from homebuyers towards big and well-established
developers across the cities resulted in launch of several
new projects including a spillover from the previous months
of lockdown.
11
Sour
ce: D
ataL
abs,
Pro
pTig
er R
esea
rch
PROPTIGER RESEARCH
Ticket wise split – New supply
• Among the major cities, Pune continued to be the frontrunner in
new supply, despite being one of the worst a�ected cities in the
pandemic. Pune contributed 18 percent to the overall launches,
closely followed by Mumbai and Ahmedabad with 17 percent
share, respectively. Driven by healthy sales volume and
improved consumer sentiment in the previous quarter,
developers in Hyderabad launched several new projects in this
quarter with the city contributing nearly 14 percent to the overall
pie of new supply in Q1 2021. Emerging from the lows of the
previous quarters, all the other cities, except Bengaluru and
Chennai, witnessed an increase in new supply. Moreover, the
increase is significantly higher than the same period in the
preceding year.
• Similar to the previous quarter, new supply across the top eight
cities continues to be concentrated in less than INR 45 lakh
category in Q1 2021, with a share of 45 percent from the overall
pie, the segment was followed by more than INR 75 lakh price
bracket which accounted for 28 percent of the total supply. The
mid-segment (INR 45–75 lakh price bracket) recorded a share of
27 percent of the total supply in the first quarter.
0
10,000
20,000
30,000
40,000
50,000
60,000
70,000
80,000
Q1 19 Q2 19 Q3 19 Q4 19 Q1 20 Q2 20 Q3 20 Q4 20 Q1 21
Num
ber o
f uni
ts
New supply
Ahmedabad, 17%
Bangalore, 10%
NCR, 9%
Chennai, 11%Hyderabad,
14%
Kolkata, 4%
Mumbai, 17%
Pune, 18%
Q1 2021Ahmedabad, 1%
Bangalore, 18%
NCR, 11%
Chennai, 17%
Hyderabad, 11%
Kolkata, 2%
Mumbai, 16%
Pune, 24%
Q1 2020
14% 12%
35% 33%
29%27%
8%11%
14% 17%
Q1'20 Q1'21
> INR 1 crore INR 75-100 lakh INR 45-75 lakhINR 25-45 lakh < INR 25 lakh
SALESConstruction status-wise breakup of sales
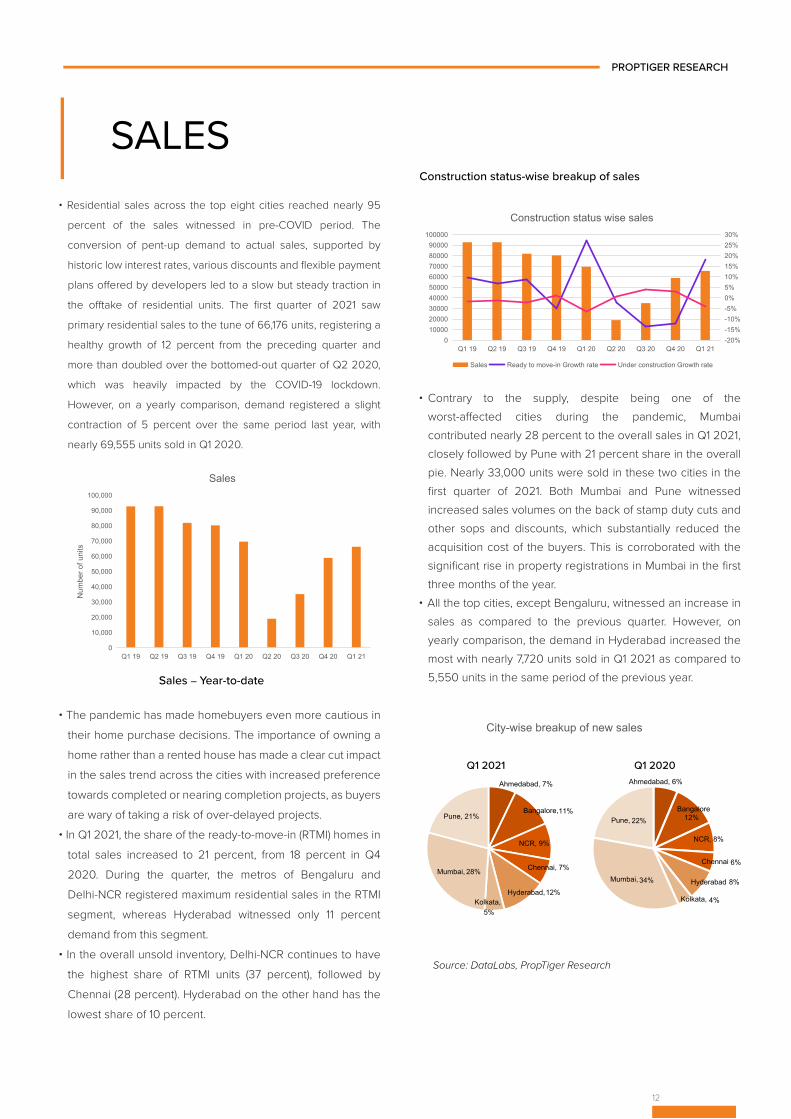
• Residential sales across the top eight cities reached nearly 95
percent of the sales witnessed in pre-COVID period. The
conversion of pent-up demand to actual sales, supported by
historic low interest rates, various discounts and flexible payment
plans offered by developers led to a slow but steady traction in
the offtake of residential units. The first quarter of 2021 saw
primary residential sales to the tune of 66,176 units, registering a
healthy growth of 12 percent from the preceding quarter and
more than doubled over the bottomed-out quarter of Q2 2020,
which was heavily impacted by the COVID-19 lockdown.
However, on a yearly comparison, demand registered a slight
contraction of 5 percent over the same period last year, with
nearly 69,555 units sold in Q1 2020.
12
• Contrary to the supply, despite being one of the worst-affected cities during the pandemic, Mumbai contributed nearly 28 percent to the overall sales in Q1 2021, closely followed by Pune with 21 percent share in the overall pie. Nearly 33,000 units were sold in these two cities in the first quarter of 2021. Both Mumbai and Pune witnessed increased sales volumes on the back of stamp duty cuts and other sops and discounts, which substantially reduced the acquisition cost of the buyers. This is corroborated with the significant rise in property registrations in Mumbai in the first three months of the year.
• All the top cities, except Bengaluru, witnessed an increase in sales as compared to the previous quarter. However, on yearly comparison, the demand in Hyderabad increased the most with nearly 7,720 units sold in Q1 2021 as compared to 5,550 units in the same period of the previous year.
• The pandemic has made homebuyers even more cautious in their home purchase decisions. The importance of owning a home rather than a rented house has made a clear cut impact in the sales trend across the cities with increased preference towards completed or nearing completion projects, as buyers are wary of taking a risk of over-delayed projects.
• In Q1 2021, the share of the ready-to-move-in (RTMI) homes in total sales increased to 21 percent, from 18 percent in Q4 2020. During the quarter, the metros of Bengaluru and Delhi-NCR registered maximum residential sales in the RTMI segment, whereas Hyderabad witnessed only 11 percent demand from this segment.
• In the overall unsold inventory, Delhi-NCR continues to have the highest share of RTMI units (37 percent), followed by Chennai (28 percent). Hyderabad on the other hand has the lowest share of 10 percent.
Source: DataLabs, PropTiger Research
PROPTIGER RESEARCH
Sales – Year-to-date
0
10,000
20,000
30,000
40,000
50,000
60,000
70,000
80,000
90,000
100,000
Q1 19 Q2 19 Q3 19 Q4 19 Q1 20 Q2 20 Q3 20 Q4 20 Q1 21
Num
ber o
f uni
ts
Sales
-20%-15%-10%-5%0%5%10%15%20%25%30%
0100002000030000400005000060000700008000090000
100000
Q1 19 Q2 19 Q3 19 Q4 19 Q1 20 Q2 20 Q3 20 Q4 20 Q1 21
Construction status wise sales
Sales Ready to move-in Growth rate Under construction Growth rate
Ahmedabad, 7%
Bangalore, 11%
NCR, 9%
Chennai, 7%
Hyderabad, 12%Kolkata,
5%
Mumbai, 28%
Pune, 21%
City-wise breakup of new sales
Q1 2021 Q1 2020Ahmedabad, 6%
Bangalore12%
NCR, 8%
Chennai
Hyderabad
Kolkata, 4%
6%
8%Mumbai, 34%
Pune, 22%
• Across the top eight cities, the first quarter saw maximum traction in the projects priced below INR 45 lakh, with sales in the price bracket contributing nearly 45 percent to the overall demand pie in Q1 2021, followed by 30 percent in projects priced above INR 75 lakh.
• With improving market sentiments, along with the favourable monetary and fiscal measures, we believe the coming quarters will see increased traction. Also, developer credibility in terms of quality and timely completion of the project will be a great motivating factor, especially for end users.
13
Source: DataLabs, PropTiger Research
PROPTIGER RESEARCH
22% 19%
26% 26%
24% 26%
9% 10%
19% 19%
Q1'20 Q1'21
Ticket wise split of sales
> INR 1 crore INR 75-100 lakh
INR 45-75 lakh INR 25-45 lakh
< INR 25 lakh
14
PRICE TRENDS
Source: DataLabs, PropTiger ResearchNote: Weighted average price is for new supply
PROPTIGER RESEARCH
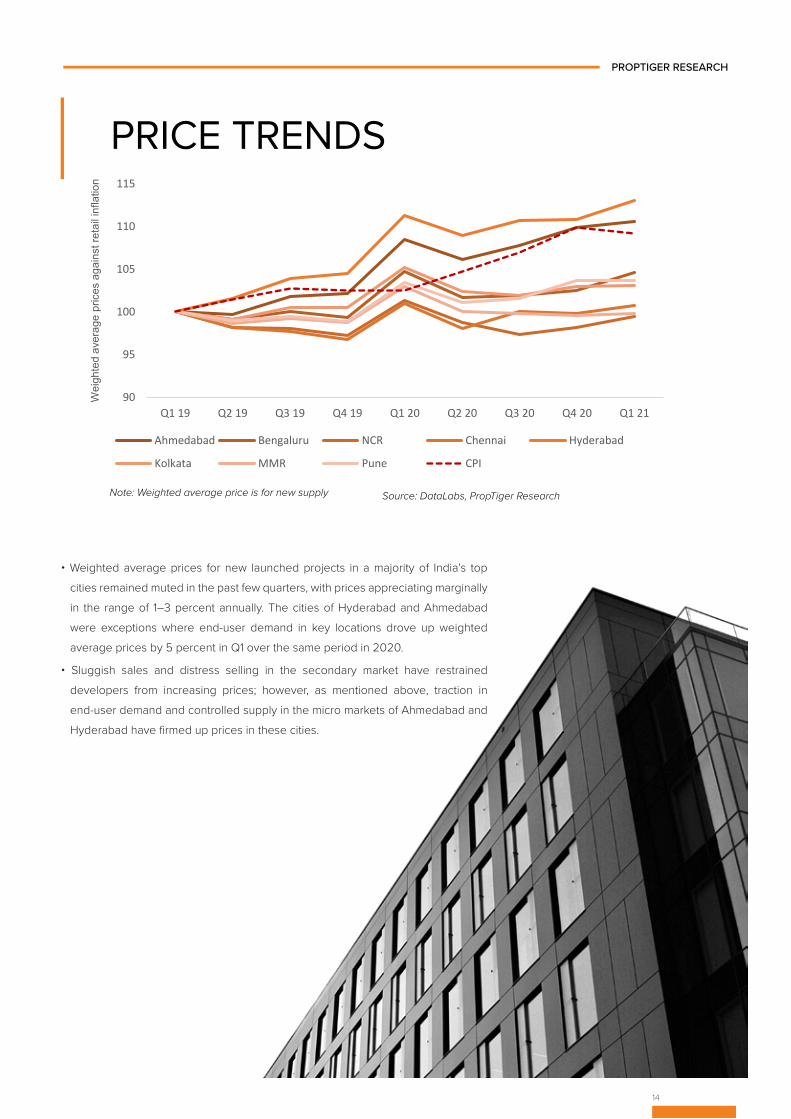
• Weighted average prices for new launched projects in a majority of India’s top cities remained muted in the past few quarters, with prices appreciating marginally in the range of 1–3 percent annually. The cities of Hyderabad and Ahmedabad were exceptions where end-user demand in key locations drove up weighted average prices by 5 percent in Q1 over the same period in 2020.
• Sluggish sales and distress selling in the secondary market have restrained developers from increasing prices; however, as mentioned above, traction in end-user demand and controlled supply in the micro markets of Ahmedabad and Hyderabad have firmed up prices in these cities.
noitalfni liater tsniaga secirp egareva dethgieW 90
95
100
105
110
115
Q1 19 Q2 19 Q3 19 Q4 19 Q1 20 Q2 20 Q3 20 Q4 20 Q1 21
Ahmedabad Bengaluru NCR Chennai Hyderabad
Kolkata MMR Pune CPI
UNSOLD INVENTORY
15
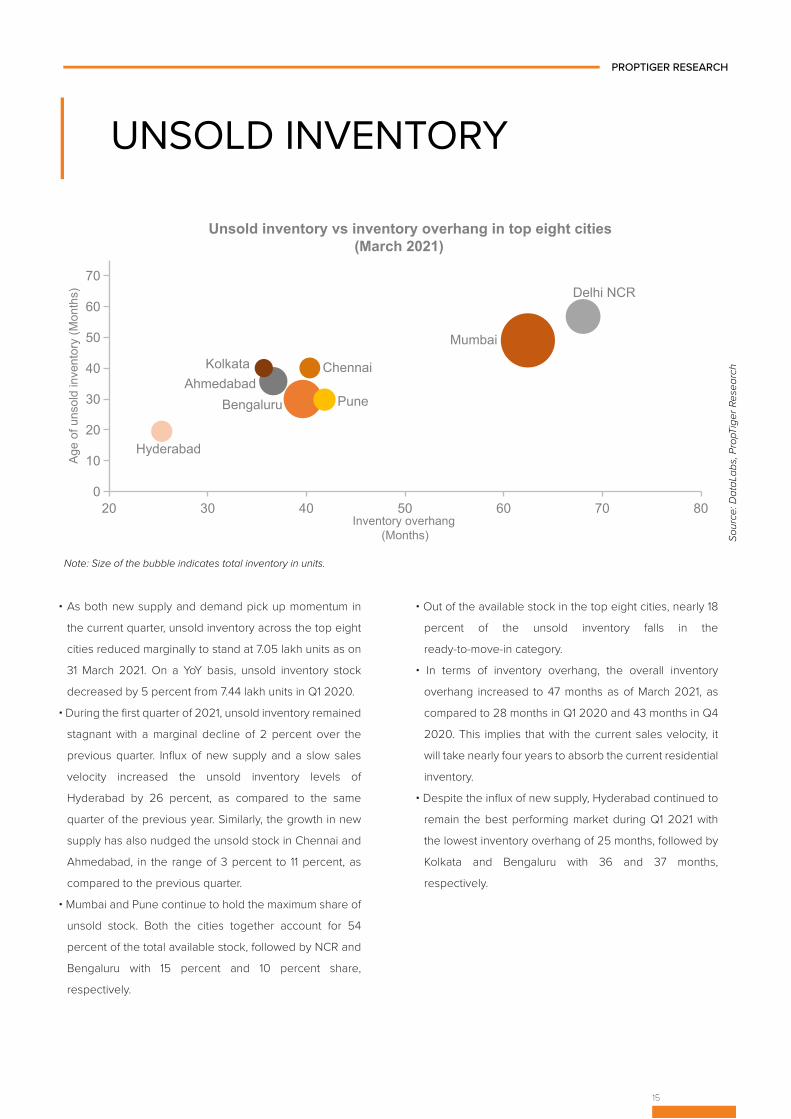
• As both new supply and demand pick up momentum in
the current quarter, unsold inventory across the top eight
cities reduced marginally to stand at 7.05 lakh units as on
31 March 2021. On a YoY basis, unsold inventory stock
decreased by 5 percent from 7.44 lakh units in Q1 2020.
• During the first quarter of 2021, unsold inventory remained
stagnant with a marginal decline of 2 percent over the
previous quarter. Influx of new supply and a slow sales
velocity increased the unsold inventory levels of
Hyderabad by 26 percent, as compared to the same
quarter of the previous year. Similarly, the growth in new
supply has also nudged the unsold stock in Chennai and
Ahmedabad, in the range of 3 percent to 11 percent, as
compared to the previous quarter.
• Mumbai and Pune continue to hold the maximum share of
unsold stock. Both the cities together account for 54
percent of the total available stock, followed by NCR and
Bengaluru with 15 percent and 10 percent share,
respectively.
• Out of the available stock in the top eight cities, nearly 18
percent of the unsold inventory falls in the
ready-to-move-in category.
• In terms of inventory overhang, the overall inventory
overhang increased to 47 months as of March 2021, as
compared to 28 months in Q1 2020 and 43 months in Q4
2020. This implies that with the current sales velocity, it
will take nearly four years to absorb the current residential
inventory.
• Despite the influx of new supply, Hyderabad continued to
remain the best performing market during Q1 2021 with
the lowest inventory overhang of 25 months, followed by
Kolkata and Bengaluru with 36 and 37 months,
respectively.
Sour
ce: D
ataL
abs,
Pro
pTig
er R
esea
rch
Note: Size of the bubble indicates total inventory in units.
PROPTIGER RESEARCH
AhmedabadBengaluru
Delhi NCR
Chennai
Hyderabad
Kolkata
Pune
0
10
20
30
40
50
60
70
20 30 40 50 60 70 80
Age
of u
nsol
d in
vent
ory
(Mon
ths)
Inventory overhang(Months)
Unsold inventory vs inventory overhang in top eight cities (March 2021)
Mumbai

16
CITY SNAPSHOTS
17
PROPTIGER RESEARCH
Source: DataLabs, PropTiger Research
AHMEDABAD
RESIDENTIAL MARKET SNAPSHOT - Q1 2021
KEY LOCALITIES BY DEMAND
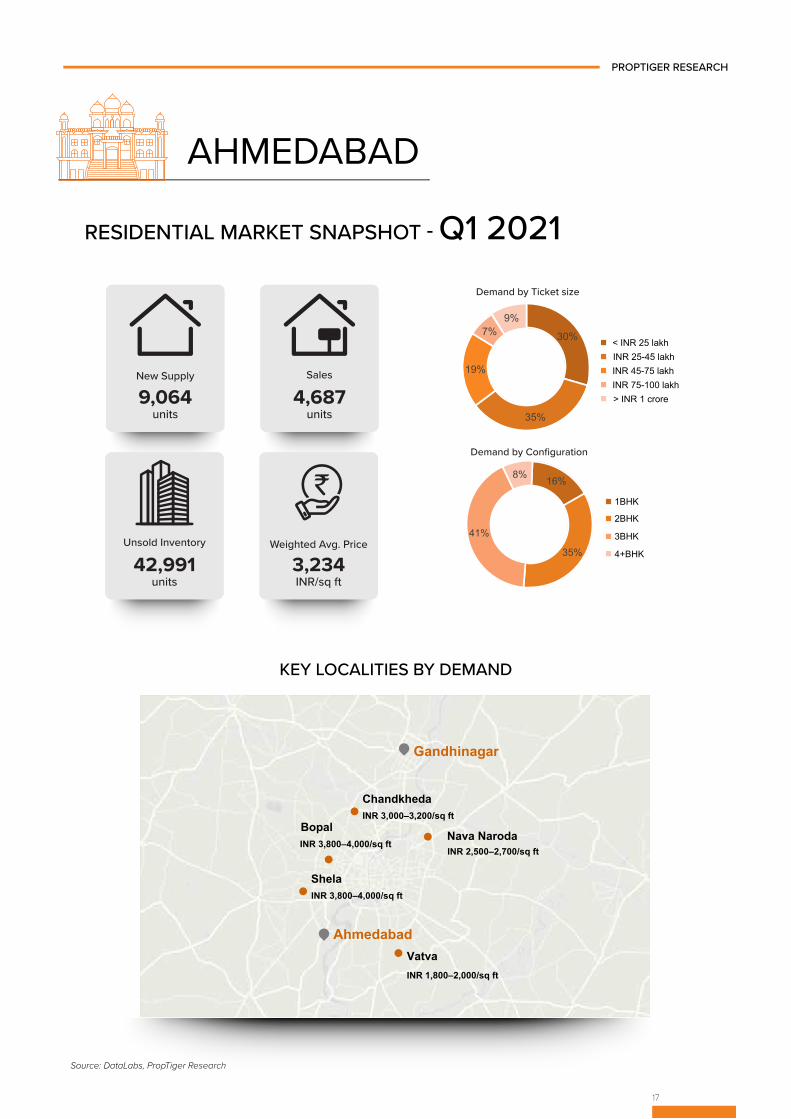
New Supply
9,064units
4,687units
Sales
42,991units
Unsold Inventory
3,234INR/sq ft
Weighted Avg. Price
30%
35%
19%
7%9%
Demand by Ticket size
< INR 25 lakhINR 25-45 lakh
INR 45-75 lakh INR 75-100 lakh> INR 1 crore
Demand by Configuration
16%
35%
41%
8%
1BHK
2BHK
3BHK
4+BHK
Gandhinagar
Ahmedabad
Shela INR 3,800–4,000/sq ft
Vatva INR 1,800–2,000/sq ft
Chandkheda INR 3,000–3,200/sq ft
Nava Naroda Bopal
INR 2,500–2,700/sq ft INR 3,800–4,000/sq ft
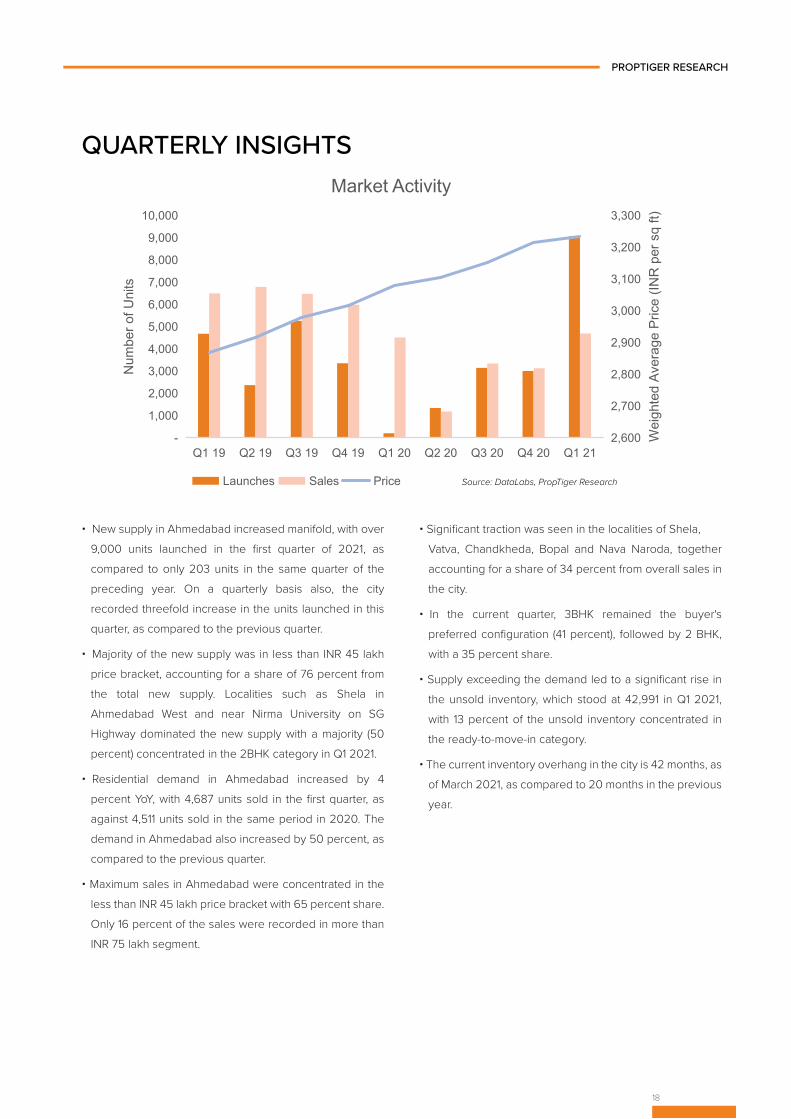
• New supply in Ahmedabad increased manifold, with over 9,000 units launched in the first quarter of 2021, as compared to only 203 units in the same quarter of the preceding year. On a quarterly basis also, the city recorded threefold increase in the units launched in this quarter, as compared to the previous quarter.
• Majority of the new supply was in less than INR 45 lakh price bracket, accounting for a share of 76 percent from the total new supply. Localities such as Shela in Ahmedabad West and near Nirma University on SG Highway dominated the new supply with a majority (50 percent) concentrated in the 2BHK category in Q1 2021.
• Residential demand in Ahmedabad increased by 4 percent YoY, with 4,687 units sold in the first quarter, as against 4,511 units sold in the same period in 2020. The demand in Ahmedabad also increased by 50 percent, as compared to the previous quarter.
• Maximum sales in Ahmedabad were concentrated in the less than INR 45 lakh price bracket with 65 percent share. Only 16 percent of the sales were recorded in more than INR 75 lakh segment.
• Significant traction was seen in the localities of Shela, Vatva, Chandkheda, Bopal and Nava Naroda, together accounting for a share of 34 percent from overall sales in the city.
• In the current quarter, 3BHK remained the buyer's preferred configuration (41 percent), followed by 2 BHK, with a 35 percent share.
• Supply exceeding the demand led to a significant rise in the unsold inventory, which stood at 42,991 in Q1 2021, with 13 percent of the unsold inventory concentrated in the ready-to-move-in category.
• The current inventory overhang in the city is 42 months, as of March 2021, as compared to 20 months in the previous year.
18
PROPTIGER RESEARCH
Source: DataLabs, PropTiger Research
QUARTERLY INSIGHTS
2,600
2,700
2,800
2,900
3,000
3,100
3,200
3,300
-
1,000
2,000
3,000
4,000
5,000
6,000
7,000
8,000
9,000
10,000
Q1 19 Q2 19 Q3 19 Q4 19 Q1 20 Q2 20 Q3 20 Q4 20 Q1 21
Wei
ghte
d Av
erag
e Pr
ice
(INR
per
sq
ft)
Num
ber o
f Uni
ts
Market Activity
Launches Sales Price
19
PROPTIGER RESEARCH
BENGALURU
Source: DataLabs, PropTiger Research
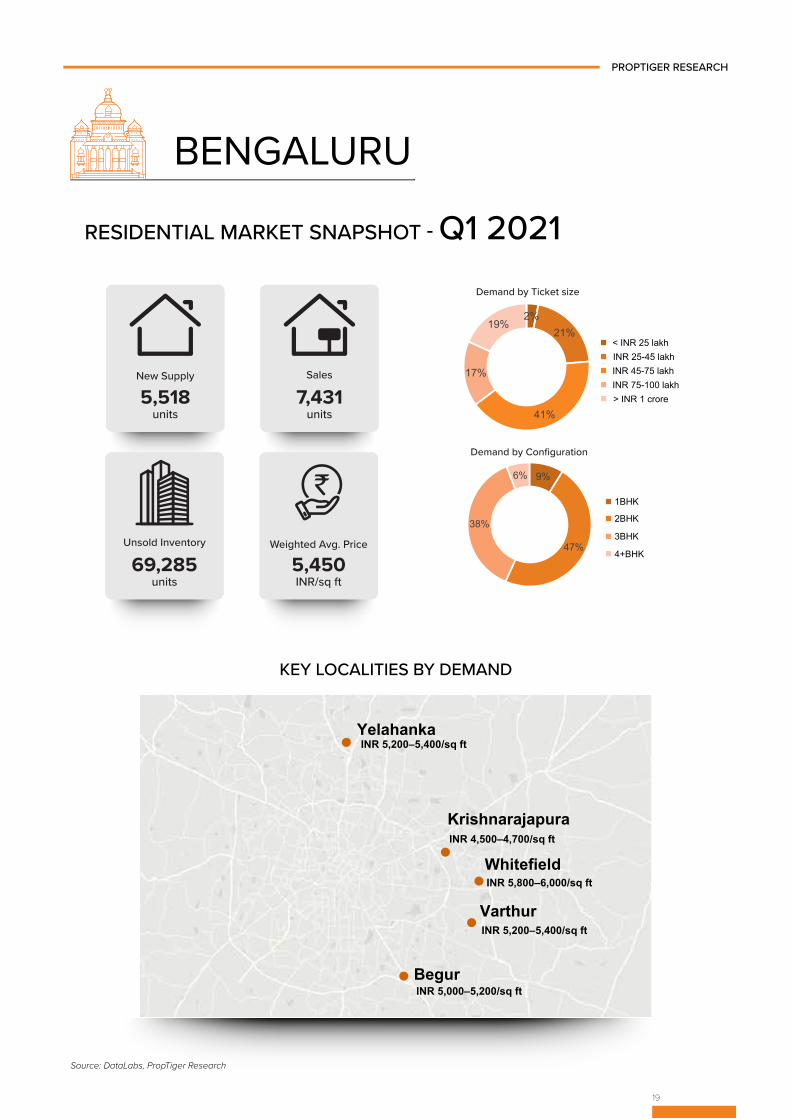
New Supply
5,518units
7,431units
Sales
69,285units
Unsold Inventory
5,450INR/sq ft
Weighted Avg. Price
Demand by Ticket size
< INR 25 lakhINR 25-45 lakh
INR 45-75 lakh INR 75-100 lakh> INR 1 crore
2%21%
41%
17%
19%
Demand by Configuration
1BHK
2BHK
3BHK
4+BHK
9%
47%
38%
6%
Whitefield INR 5,800–6,000/sq ft
Begur
INR 5,200–5,400/sq ft
Varthur
Krishnarajapura INR 4,500–4,700/sq ft
INR 5,200–5,400/sq ft
INR 5,000–5,200/sq ft
Yelahanka
KEY LOCALITIES BY DEMAND
RESIDENTIAL MARKET SNAPSHOT - Q1 2021
20
QUARTERLY INSIGHTS
PROPTIGER RESEARCH
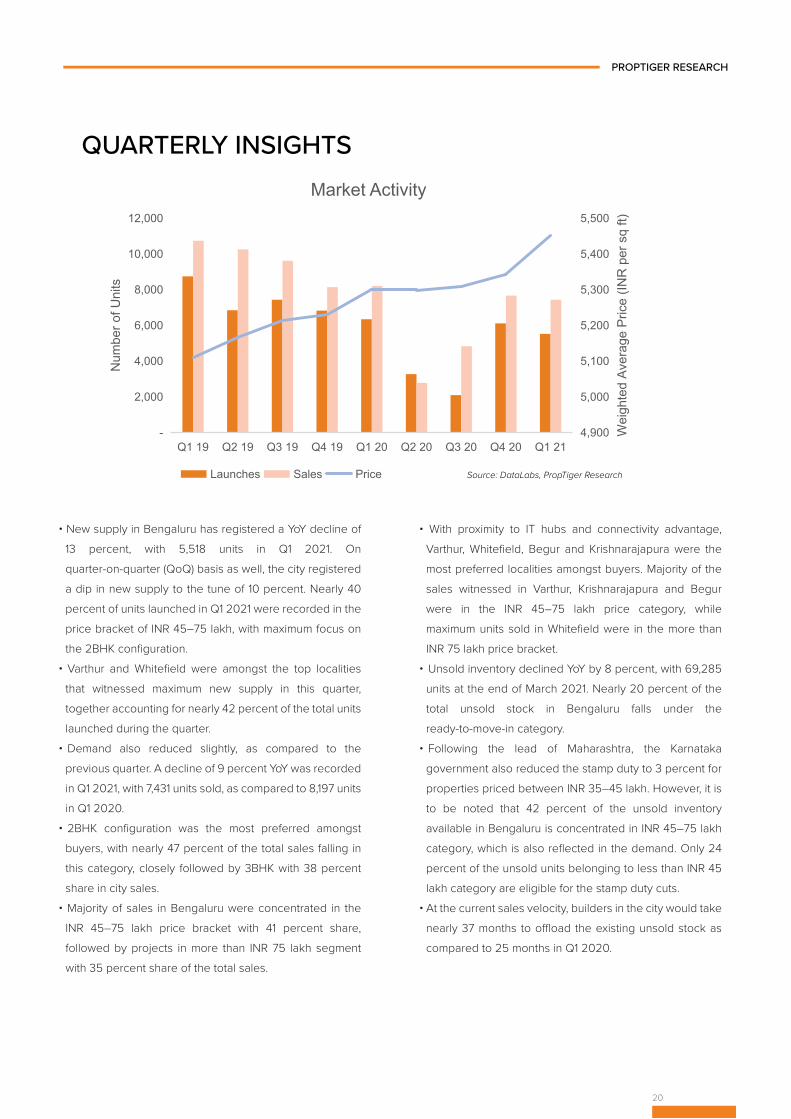
• New supply in Bengaluru has registered a YoY decline of 13 percent, with 5,518 units in Q1 2021. On quarter-on-quarter (QoQ) basis as well, the city registered a dip in new supply to the tune of 10 percent. Nearly 40 percent of units launched in Q1 2021 were recorded in the price bracket of INR 45–75 lakh, with maximum focus on the 2BHK configuration.
• Varthur and Whitefield were amongst the top localities that witnessed maximum new supply in this quarter, together accounting for nearly 42 percent of the total units launched during the quarter.
• Demand also reduced slightly, as compared to the previous quarter. A decline of 9 percent YoY was recorded in Q1 2021, with 7,431 units sold, as compared to 8,197 units in Q1 2020.
• 2BHK configuration was the most preferred amongst buyers, with nearly 47 percent of the total sales falling in this category, closely followed by 3BHK with 38 percent share in city sales.
• Majority of sales in Bengaluru were concentrated in the INR 45–75 lakh price bracket with 41 percent share, followed by projects in more than INR 75 lakh segment with 35 percent share of the total sales.
• With proximity to IT hubs and connectivity advantage, Varthur, Whitefield, Begur and Krishnarajapura were the most preferred localities amongst buyers. Majority of the sales witnessed in Varthur, Krishnarajapura and Begur were in the INR 45–75 lakh price category, while maximum units sold in Whitefield were in the more than INR 75 lakh price bracket.
• Unsold inventory declined YoY by 8 percent, with 69,285 units at the end of March 2021. Nearly 20 percent of the total unsold stock in Bengaluru falls under the ready-to-move-in category.
• Following the lead of Maharashtra, the Karnataka government also reduced the stamp duty to 3 percent for properties priced between INR 35–45 lakh. However, it is to be noted that 42 percent of the unsold inventory available in Bengaluru is concentrated in INR 45–75 lakh category, which is also reflected in the demand. Only 24 percent of the unsold units belonging to less than INR 45 lakh category are eligible for the stamp duty cuts.
• At the current sales velocity, builders in the city would take nearly 37 months to offload the existing unsold stock as compared to 25 months in Q1 2020.
4,900
5,000
5,100
5,200
5,300
5,400
5,500
-
2,000
4,000
6,000
8,000
10,000
12,000
Q1 19 Q2 19 Q3 19 Q4 19 Q1 20 Q2 20 Q3 20 Q4 20 Q1 21
Wei
ghte
d Av
erag
e Pr
ice
(INR
per
sq
ft)
Num
ber o
f Uni
ts
Market Activity
Launches Sales Price Source: DataLabs, PropTiger Research
21
PROPTIGER RESEARCH
CHENNAI
Koyambedu
INR 4,200–4,400/sq ft
Vanagaram
Mambakkam
Perumbakkam
INR 5,400–5,600/sq ft
INR 4,100–4,300/sq ft
INR 7,400–7,600/sq ft
Mogappair INR 5,700–5,900/sq ft
Source: DataLabs, PropTiger Research
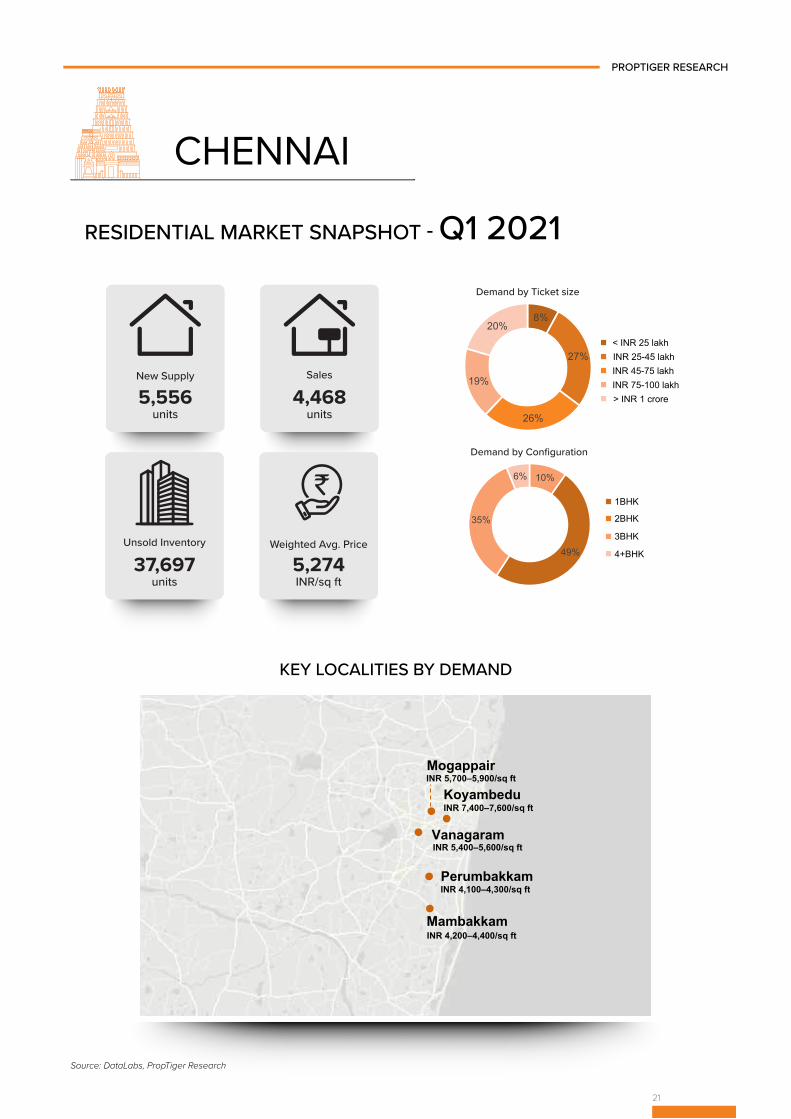
New Supply
5,556units
4,468units
Sales
37,697units
Unsold Inventory
5,274INR/sq ft
Weighted Avg. Price
Demand by Ticket size
< INR 25 lakhINR 25-45 lakh
INR 45-75 lakh INR 75-100 lakh> INR 1 crore
8%
27%
26%
19%
20%
Demand by Configuration
1BHK
2BHK
3BHK
4+BHK
10%
49%
35%
6%
KEY LOCALITIES BY DEMAND
RESIDENTIAL MARKET SNAPSHOT - Q1 2021
22
PROPTIGER RESEARCH
QUARTERLY INSIGHTS
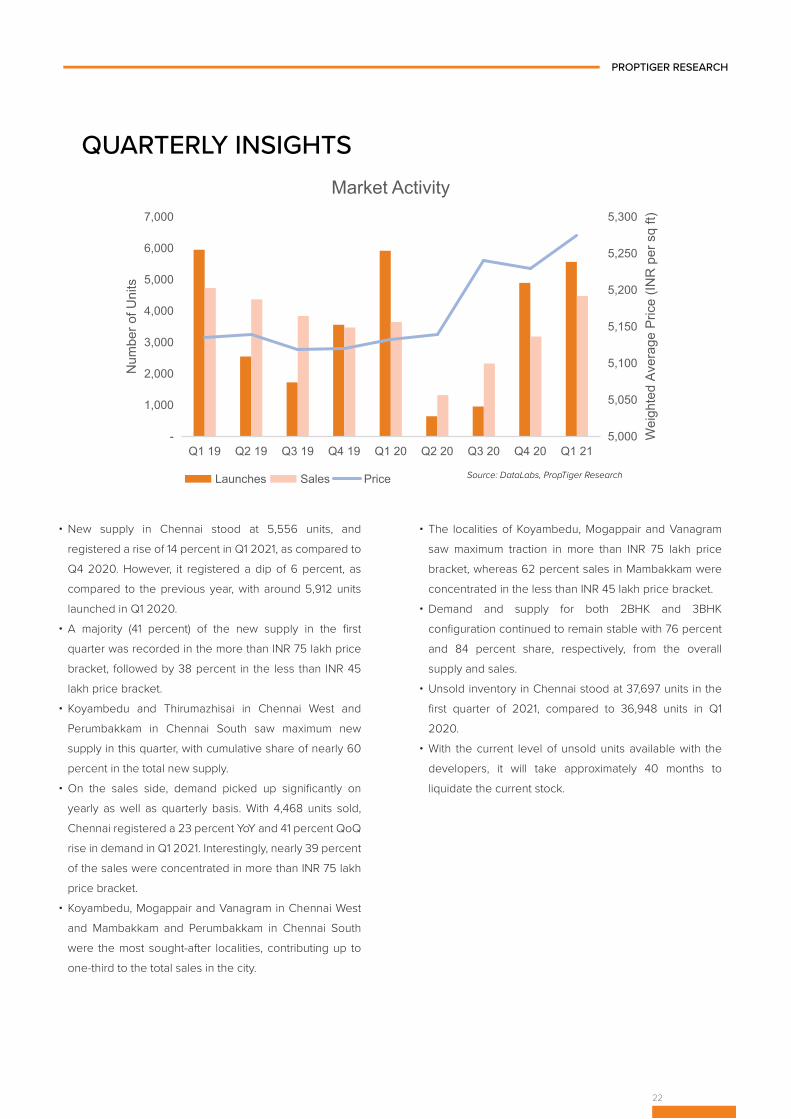
• New supply in Chennai stood at 5,556 units, and registered a rise of 14 percent in Q1 2021, as compared to Q4 2020. However, it registered a dip of 6 percent, as compared to the previous year, with around 5,912 units launched in Q1 2020.
• A majority (41 percent) of the new supply in the first quarter was recorded in the more than INR 75 lakh price bracket, followed by 38 percent in the less than INR 45 lakh price bracket.
• Koyambedu and Thirumazhisai in Chennai West and Perumbakkam in Chennai South saw maximum new supply in this quarter, with cumulative share of nearly 60 percent in the total new supply.
• On the sales side, demand picked up significantly on yearly as well as quarterly basis. With 4,468 units sold, Chennai registered a 23 percent YoY and 41 percent QoQ rise in demand in Q1 2021. Interestingly, nearly 39 percent of the sales were concentrated in more than INR 75 lakh price bracket.
• Koyambedu, Mogappair and Vanagram in Chennai West and Mambakkam and Perumbakkam in Chennai South were the most sought-after localities, contributing up to one-third to the total sales in the city.
• The localities of Koyambedu, Mogappair and Vanagram saw maximum traction in more than INR 75 lakh price bracket, whereas 62 percent sales in Mambakkam were concentrated in the less than INR 45 lakh price bracket.
• Demand and supply for both 2BHK and 3BHK configuration continued to remain stable with 76 percent and 84 percent share, respectively, from the overall supply and sales.
• Unsold inventory in Chennai stood at 37,697 units in the first quarter of 2021, compared to 36,948 units in Q1 2020.
• With the current level of unsold units available with the developers, it will take approximately 40 months to liquidate the current stock.
5,000
5,050
5,100
5,150
5,200
5,250
5,300
-
1,000
2,000
3,000
4,000
5,000
6,000
7,000
Q1 19 Q2 19 Q3 19 Q4 19 Q1 20 Q2 20 Q3 20 Q4 20 Q1 21
Wei
ghte
d Av
erag
e Pr
ice
(INR
per
sq
ft)
Num
ber o
f Uni
ts
Market Activity
Launches Sales Price Source: DataLabs, PropTiger Research
23
Sector 43 INR 7,800–8,000/sq ft
Sector 93 INR 2,700–2,900/sq ft
Sector 37D INR 4,400–4,600/sq ft
Sector 150 INR 5,000–5,200/sq ft
Delhi
Ghaziabad
Greater Noida
Noida
Faridabad Gurugram
Sector 1 (Noida Ext.) Extension)
INR 3,400–3,600/sq ft
PROPTIGER RESEARCH
DELHI NCR
Source: DataLabs, PropTiger Research
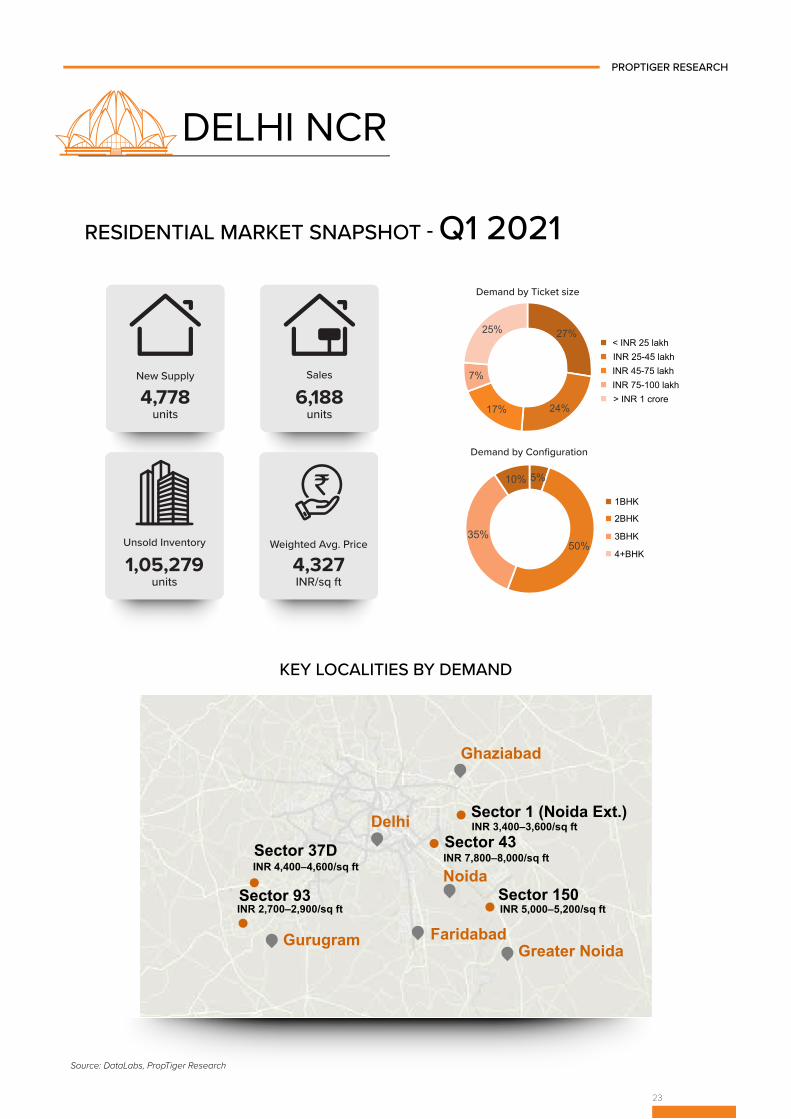
New Supply
4,778units
6,188units
Sales
1,05,279units
Unsold Inventory
4,327INR/sq ft
Weighted Avg. Price
Demand by Ticket size
< INR 25 lakhINR 25-45 lakh
INR 45-75 lakh INR 75-100 lakh> INR 1 crore
27%
24%17%
7%
25%
Demand by Configuration
1BHK
2BHK
3BHK
4+BHK
5%
50%35%
10%
KEY LOCALITIES BY DEMAND
RESIDENTIAL MARKET SNAPSHOT - Q1 2021
24
PROPTIGER RESEARCH
QUARTERLY INSIGHTS
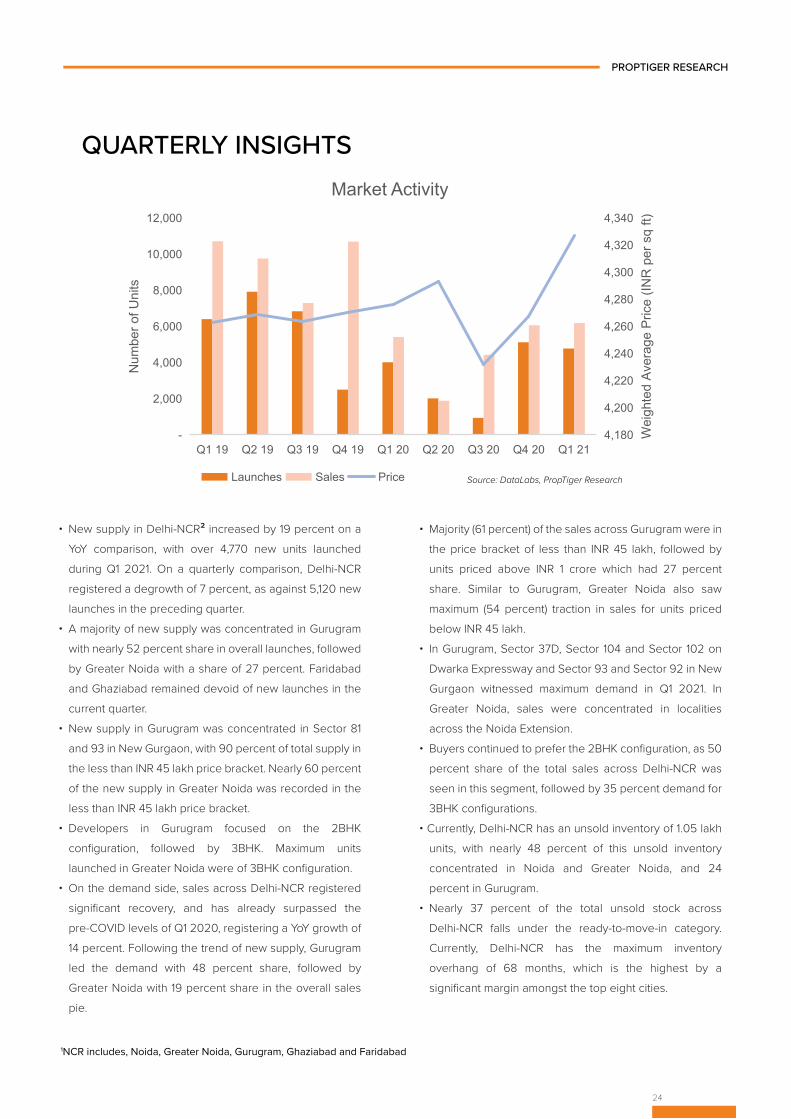
• New supply in Delhi-NCR² increased by 19 percent on a YoY comparison, with over 4,770 new units launched during Q1 2021. On a quarterly comparison, Delhi-NCR registered a degrowth of 7 percent, as against 5,120 new launches in the preceding quarter.
• A majority of new supply was concentrated in Gurugram with nearly 52 percent share in overall launches, followed by Greater Noida with a share of 27 percent. Faridabad and Ghaziabad remained devoid of new launches in the current quarter.
• New supply in Gurugram was concentrated in Sector 81 and 93 in New Gurgaon, with 90 percent of total supply in the less than INR 45 lakh price bracket. Nearly 60 percent of the new supply in Greater Noida was recorded in the less than INR 45 lakh price bracket.
• Developers in Gurugram focused on the 2BHK configuration, followed by 3BHK. Maximum units launched in Greater Noida were of 3BHK configuration.
• On the demand side, sales across Delhi-NCR registered significant recovery, and has already surpassed the pre-COVID levels of Q1 2020, registering a YoY growth of 14 percent. Following the trend of new supply, Gurugram led the demand with 48 percent share, followed by Greater Noida with 19 percent share in the overall sales pie.
• Majority (61 percent) of the sales across Gurugram were in the price bracket of less than INR 45 lakh, followed by units priced above INR 1 crore which had 27 percent share. Similar to Gurugram, Greater Noida also saw maximum (54 percent) traction in sales for units priced below INR 45 lakh.
• In Gurugram, Sector 37D, Sector 104 and Sector 102 on Dwarka Expressway and Sector 93 and Sector 92 in New Gurgaon witnessed maximum demand in Q1 2021. In Greater Noida, sales were concentrated in localities across the Noida Extension.
• Buyers continued to prefer the 2BHK configuration, as 50 percent share of the total sales across Delhi-NCR was seen in this segment, followed by 35 percent demand for 3BHK configurations.
• Currently, Delhi-NCR has an unsold inventory of 1.05 lakh units, with nearly 48 percent of this unsold inventory concentrated in Noida and Greater Noida, and 24 percent in Gurugram.
• Nearly 37 percent of the total unsold stock across Delhi-NCR falls under the ready-to-move-in category. Currently, Delhi-NCR has the maximum inventory overhang of 68 months, which is the highest by a significant margin amongst the top eight cities.
4,180
4,200
4,220
4,240
4,260
4,280
4,300
4,320
4,340
-
2,000
4,000
6,000
8,000
10,000
12,000
Q1 19 Q2 19 Q3 19 Q4 19 Q1 20 Q2 20 Q3 20 Q4 20 Q1 21
Wei
ghte
d Av
erag
e Pr
ice
(INR
per
sq
ft)
Num
ber o
f Uni
ts
Market Activity
Launches Sales Price Source: DataLabs, PropTiger Research
1NCR includes, Noida, Greater Noida, Gurugram, Ghaziabad and Faridabad
INR 4,400–4,600/sq ft Kondapur
Kompally
Nallagandla
Sangareddy INR 5,000–5,200/sq ft Bachupally
INR 4,300–4,500/sq ft
INR 7,000–7,200/sq ft
INR 6,300–6,500/sq ft
PROPTIGER RESEARCH
HYDERABAD
Source: DataLabs, PropTiger Research
KEY LOCALITIES BY DEMAND
25
New Supply
7,604units
7,721units
Sales
39,191units
Unsold Inventory
5,713INR/sq ft
Weighted Avg. Price
Demand by Ticket size
< INR 25 lakhINR 25-45 lakh
INR 45-75 lakh INR 75-100 lakh> INR 1 crore
1% 14%
31%
17%
37%
Demand by Configuration
1BHK
2BHK
3BHK
4+BHK
1%
44%
48%
7%
RESIDENTIAL MARKET SNAPSHOT - Q1 2021
26
QUARTERLY INSIGHTS
PROPTIGER RESEARCH
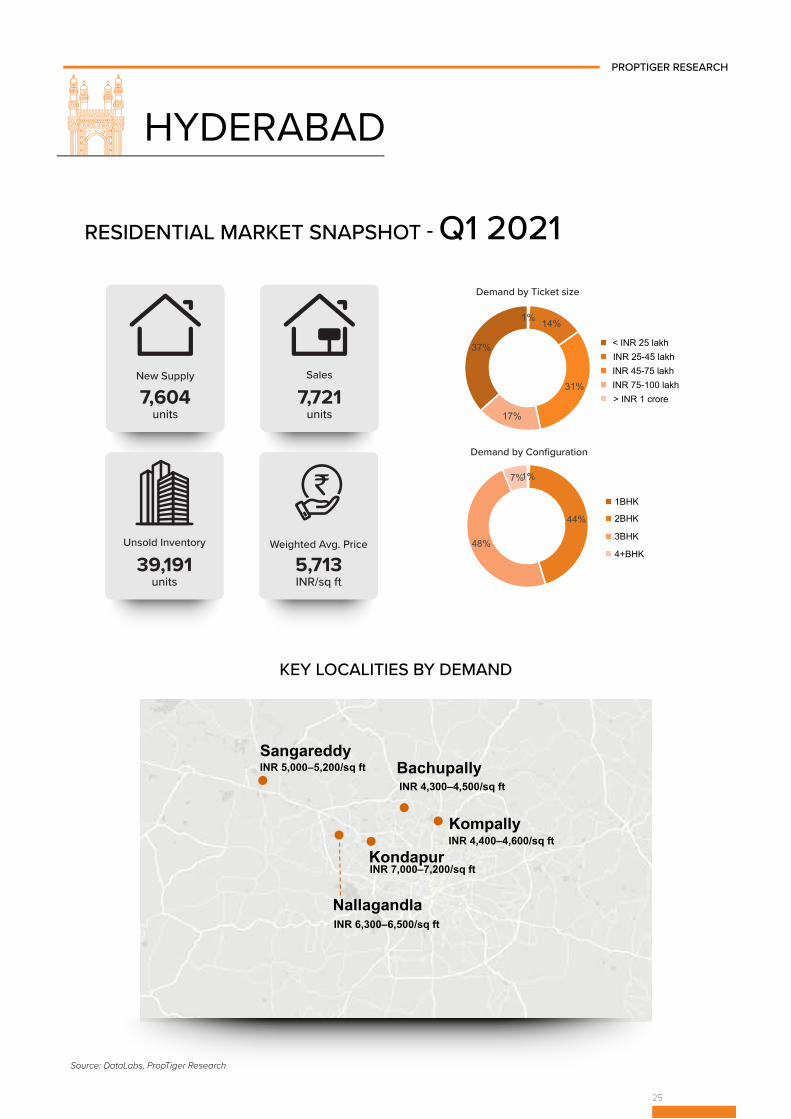
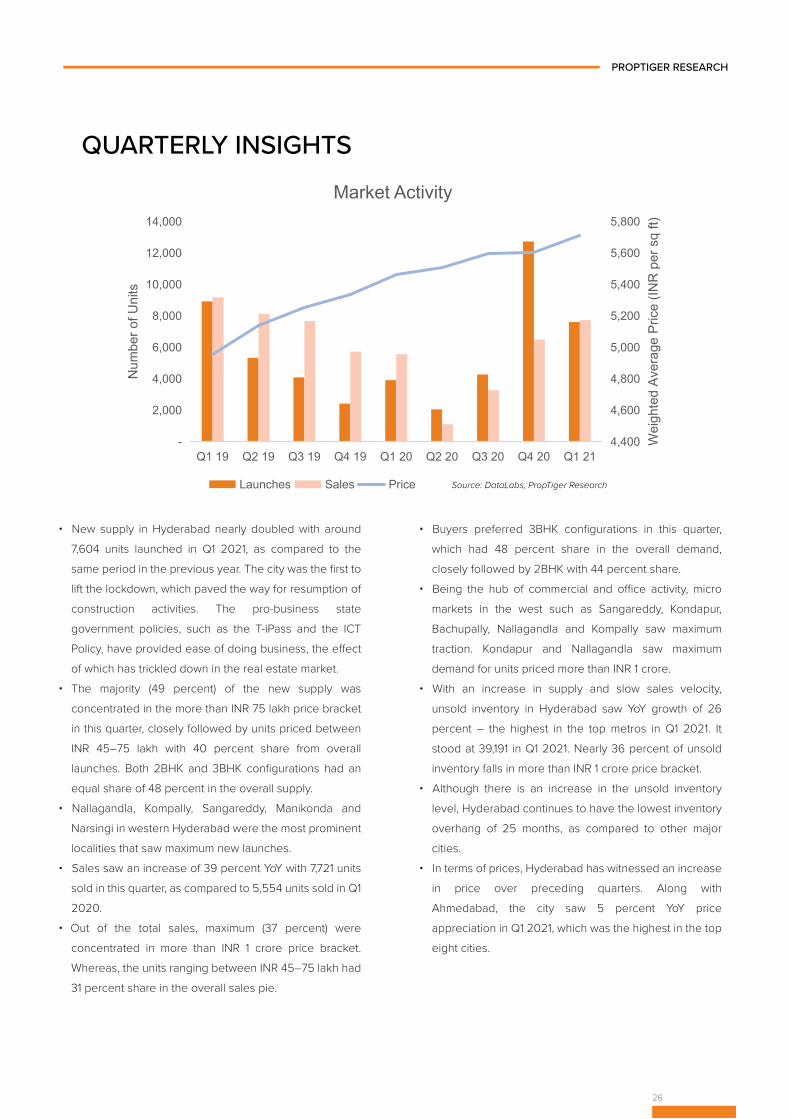
• New supply in Hyderabad nearly doubled with around 7,604 units launched in Q1 2021, as compared to the same period in the previous year. The city was the first to lift the lockdown, which paved the way for resumption of construction activities. The pro-business state government policies, such as the T-iPass and the ICT Policy, have provided ease of doing business, the effect of which has trickled down in the real estate market.
• The majority (49 percent) of the new supply was concentrated in the more than INR 75 lakh price bracket in this quarter, closely followed by units priced between INR 45–75 lakh with 40 percent share from overall launches. Both 2BHK and 3BHK configurations had an equal share of 48 percent in the overall supply.
• Nallagandla, Kompally, Sangareddy, Manikonda and Narsingi in western Hyderabad were the most prominent localities that saw maximum new launches.
• Sales saw an increase of 39 percent YoY with 7,721 units sold in this quarter, as compared to 5,554 units sold in Q1 2020.
• Out of the total sales, maximum (37 percent) were concentrated in more than INR 1 crore price bracket. Whereas, the units ranging between INR 45–75 lakh had 31 percent share in the overall sales pie.
• Buyers preferred 3BHK configurations in this quarter, which had 48 percent share in the overall demand, closely followed by 2BHK with 44 percent share.
• Being the hub of commercial and office activity, micro markets in the west such as Sangareddy, Kondapur, Bachupally, Nallagandla and Kompally saw maximum traction. Kondapur and Nallagandla saw maximum demand for units priced more than INR 1 crore.
• With an increase in supply and slow sales velocity, unsold inventory in Hyderabad saw YoY growth of 26 percent – the highest in the top metros in Q1 2021. It stood at 39,191 in Q1 2021. Nearly 36 percent of unsold inventory falls in more than INR 1 crore price bracket.
• Although there is an increase in the unsold inventory level, Hyderabad continues to have the lowest inventory overhang of 25 months, as compared to other major cities.
• In terms of prices, Hyderabad has witnessed an increase in price over preceding quarters. Along with Ahmedabad, the city saw 5 percent YoY price appreciation in Q1 2021, which was the highest in the top eight cities.
4,400
4,600
4,800
5,000
5,200
5,400
5,600
5,800
-
2,000
4,000
6,000
8,000
10,000
12,000
14,000
Q1 19 Q2 19 Q3 19 Q4 19 Q1 20 Q2 20 Q3 20 Q4 20 Q1 21
Wei
ghte
d Av
erag
e Pr
ice
(INR
per
sq
ft)
Num
ber o
f Uni
ts
Market Activity
Launches Sales Price Source: DataLabs, PropTiger Research
Narendrapur
New Town INR 4,600–4,800/sq ft
Rajarhat INR 3,500–3,700/sq ft
Joka INR 3,100–3,300/sq ft
Dum Dum INR 4,500–4,700/sq ft
INR 3,600–3,800/sq ft
27
PROPTIGER RESEARCH
KOLKATA
Source: DataLabs, PropTiger Research
New Supply
1,999units
3,382units
Sales
28,827units
Unsold Inventory
4,208INR/sq ft
Weighted Avg. Price
Demand by Ticket size
< INR 25 lakhINR 25-45 lakh
INR 45-75 lakh INR 75-100 lakh> INR 1 crore
15%
40%24%
9%
12%
Demand by Configuration
1BHK
2BHK
3BHK
4+BHK
6%
44%42%
8%
KEY LOCALITIES BY DEMAND
RESIDENTIAL MARKET SNAPSHOT - Q1 2021
28
QUARTERLY INSIGHTS
PROPTIGER RESEARCH
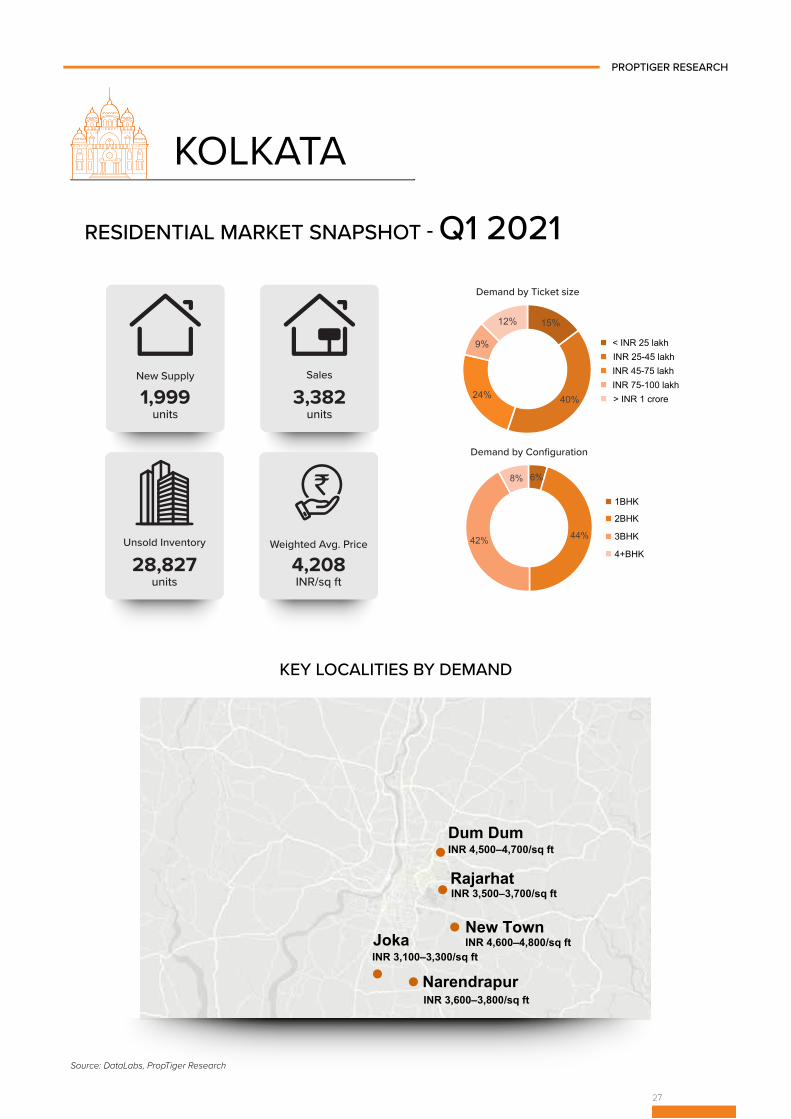
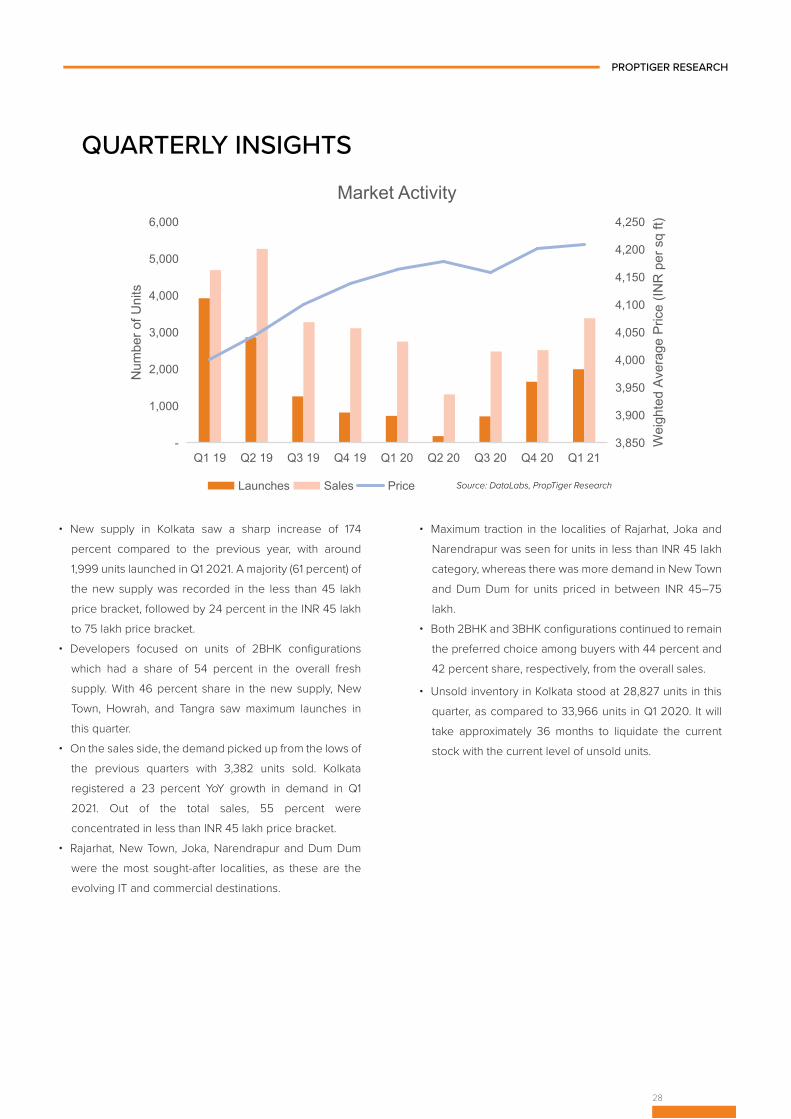
• New supply in Kolkata saw a sharp increase of 174 percent compared to the previous year, with around 1,999 units launched in Q1 2021. A majority (61 percent) of the new supply was recorded in the less than 45 lakh price bracket, followed by 24 percent in the INR 45 lakh to 75 lakh price bracket.
• Developers focused on units of 2BHK configurations which had a share of 54 percent in the overall fresh supply. With 46 percent share in the new supply, New Town, Howrah, and Tangra saw maximum launches in this quarter.
• On the sales side, the demand picked up from the lows of the previous quarters with 3,382 units sold. Kolkata registered a 23 percent YoY growth in demand in Q1 2021. Out of the total sales, 55 percent were concentrated in less than INR 45 lakh price bracket.
• Rajarhat, New Town, Joka, Narendrapur and Dum Dum were the most sought-after localities, as these are the evolving IT and commercial destinations.
• Maximum traction in the localities of Rajarhat, Joka and Narendrapur was seen for units in less than INR 45 lakh category, whereas there was more demand in New Town and Dum Dum for units priced in between INR 45–75 lakh.
• Both 2BHK and 3BHK configurations continued to remain the preferred choice among buyers with 44 percent and 42 percent share, respectively, from the overall sales.
• Unsold inventory in Kolkata stood at 28,827 units in this quarter, as compared to 33,966 units in Q1 2020. It will take approximately 36 months to liquidate the current stock with the current level of unsold units.
3,850
3,900
3,950
4,000
4,050
4,100
4,150
4,200
4,250
-
1,000
2,000
3,000
4,000
5,000
6,000
Q1 19 Q2 19 Q3 19 Q4 19 Q1 20 Q2 20 Q3 20 Q4 20 Q1 21
Wei
ghte
d Av
erag
e Pr
ice
(INR
per
sq
ft)
Num
ber o
f Uni
ts
Market Activity
Launches Sales Price Source: DataLabs, PropTiger Research
29
PROPTIGER RESEARCH
MUMBAI
Source: DataLabs, PropTiger Research
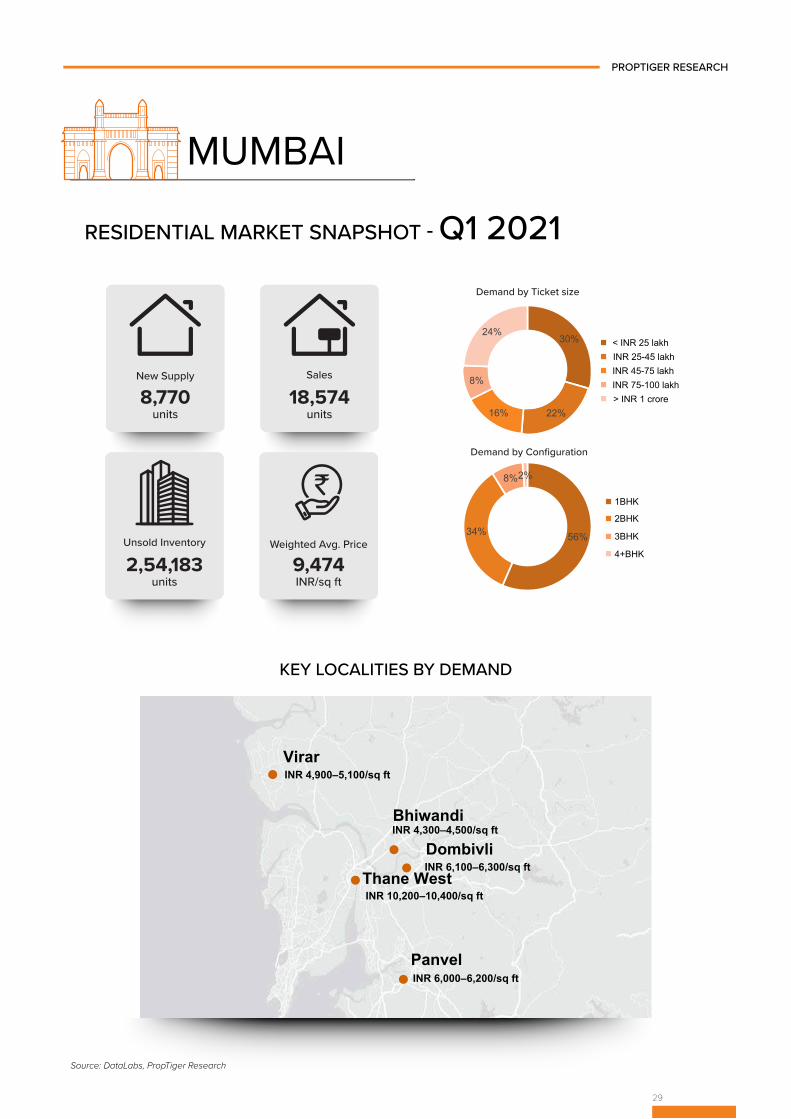
New Supply
8,770units
18,574units
Sales
2,54,183units
Unsold Inventory
9,474INR/sq ft
Weighted Avg. Price
Demand by Ticket size
< INR 25 lakhINR 25-45 lakh
INR 45-75 lakh INR 75-100 lakh> INR 1 crore
30%
22%16%
8%
24%
Demand by Configuration
1BHK
2BHK
3BHK
4+BHK
56%34%
8%2%
Thane West INR 10,200–10,400/sq ft
INR 6,100–6,300/sq ft Dombivli
Bhiwandi INR 4,300–4,500/sq ft
Virar
Panvel INR 6,000–6,200/sq ft
INR 4,900–5,100/sq ft
KEY LOCALITIES BY DEMAND
RESIDENTIAL MARKET SNAPSHOT - Q1 2021
v
30
QUARTERLY INSIGHTSPROPTIGER RESEARCH
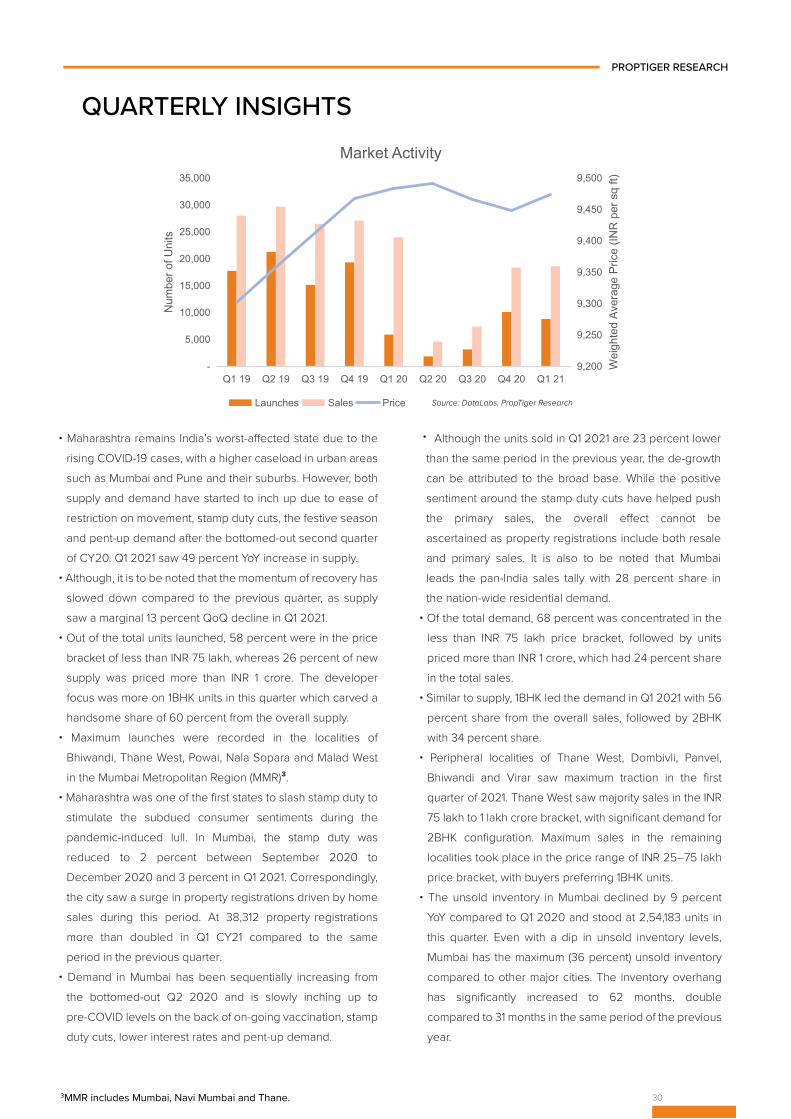
• Maharashtra remains India’s worst-affected state due to the rising COVID-19 cases, with a higher caseload in urban areas such as Mumbai and Pune and their suburbs. However, both supply and demand have started to inch up due to ease of restriction on movement, stamp duty cuts, the festive season and pent-up demand after the bottomed-out second quarter of CY20. Q1 2021 saw 49 percent YoY increase in supply.
• Although, it is to be noted that the momentum of recovery has slowed down compared to the previous quarter, as supply saw a marginal 13 percent QoQ decline in Q1 2021.
• Out of the total units launched, 58 percent were in the price bracket of less than INR 75 lakh, whereas 26 percent of new supply was priced more than INR 1 crore. The developer focus was more on 1BHK units in this quarter which carved a handsome share of 60 percent from the overall supply.
• Maximum launches were recorded in the localities of Bhiwandi, Thane West, Powai, Nala Sopara and Malad West in the Mumbai Metropolitan Region (MMR)³.
• Maharashtra was one of the first states to slash stamp duty to stimulate the subdued consumer sentiments during the pandemic-induced lull. In Mumbai, the stamp duty was reduced to 2 percent between September 2020 to December 2020 and 3 percent in Q1 2021. Correspondingly, the city saw a surge in property registrations driven by home sales during this period. At 38,312 property registrations more than doubled in Q1 CY21 compared to the same period in the previous quarter.
• Demand in Mumbai has been sequentially increasing from the bottomed-out Q2 2020 and is slowly inching up to pre-COVID levels on the back of on-going vaccination, stamp duty cuts, lower interest rates and pent-up demand.
Although the units sold in Q1 2021 are 23 percent lower than the same period in the previous year, the de-growth can be attributed to the broad base. While the positive sentiment around the stamp duty cuts have helped push the primary sales, the overall effect cannot be ascertained as property registrations include both resale and primary sales. It is also to be noted that Mumbai leads the pan-India sales tally with 28 percent share in the nation-wide residential demand.
• Of the total demand, 68 percent was concentrated in the less than INR 75 lakh price bracket, followed by units priced more than INR 1 crore, which had 24 percent share in the total sales.
• Similar to supply, 1BHK led the demand in Q1 2021 with 56 percent share from the overall sales, followed by 2BHK with 34 percent share.
• Peripheral localities of Thane West, Dombivli, Panvel, Bhiwandi and Virar saw maximum traction in the first quarter of 2021. Thane West saw majority sales in the INR 75 lakh to 1 lakh crore bracket, with significant demand for 2BHK configuration. Maximum sales in the remaining localities took place in the price range of INR 25–75 lakh price bracket, with buyers preferring 1BHK units.
• The unsold inventory in Mumbai declined by 9 percent YoY compared to Q1 2020 and stood at 2,54,183 units in this quarter. Even with a dip in unsold inventory levels, Mumbai has the maximum (36 percent) unsold inventory compared to other major cities. The inventory overhang has significantly increased to 62 months, double compared to 31 months in the same period of the previous year.
9,200
9,250
9,300
9,350
9,400
9,450
9,500
-
5,000
10,000
15,000
20,000
25,000
30,000
35,000
Q1 19 Q2 19 Q3 19 Q4 19 Q1 20 Q2 20 Q3 20 Q4 20 Q1 21
Wei
ghte
d Av
erag
e Pr
ice
(INR
per
sq
ft)
Num
ber o
f Uni
tsMarket Activity
Launches Sales Price
3MMR includes Mumbai, Navi Mumbai and Thane.
Source: DataLabs, PropTiger Research
•
31
PROPTIGER RESEARCH
PUNE
Source: DataLabs, PropTiger Research
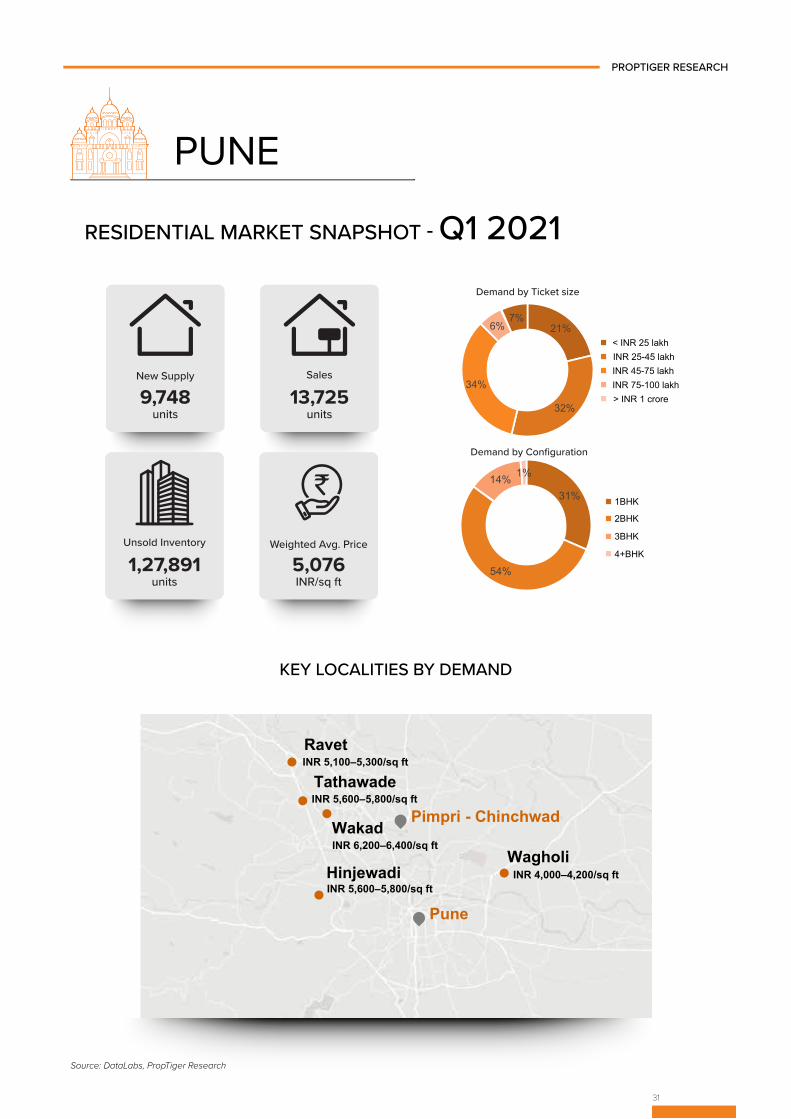
New Supply
9,748units
13,725units
Sales
1,27,891units
Unsold Inventory
5,076INR/sq ft
Weighted Avg. Price
Demand by Ticket size
< INR 25 lakhINR 25-45 lakh
INR 45-75 lakh INR 75-100 lakh> INR 1 crore
21%
32%
34%
6%7%
Demand by Configuration
1BHK
2BHK
3BHK
4+BHK
31%
54%
14% 1%
Tathawade
Hinjewadi INR 5,600–5,800/sq ft
Wagholi INR 4,000–4,200/sq ft
Wakad
Ravet
INR 6,200–6,400/sq ft
INR 5,600–5,800/sq ft
INR 5,100–5,300/sq ft
Pimpri - Chinchwad
Pune
KEY LOCALITIES BY DEMAND
RESIDENTIAL MARKET SNAPSHOT - Q1 2021
32
PROPTIGER RESEARCH
QUARTERLY INSIGHTS
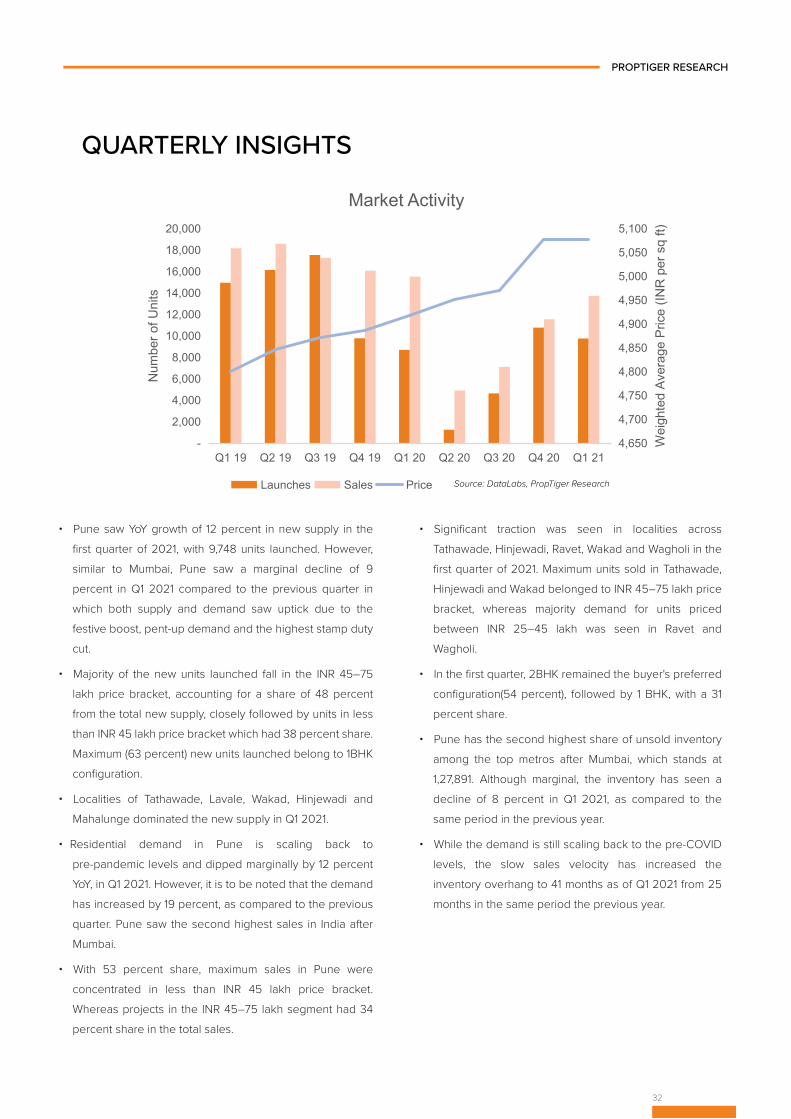
• Pune saw YoY growth of 12 percent in new supply in the first quarter of 2021, with 9,748 units launched. However, similar to Mumbai, Pune saw a marginal decline of 9 percent in Q1 2021 compared to the previous quarter in which both supply and demand saw uptick due to the festive boost, pent-up demand and the highest stamp duty cut.
• Majority of the new units launched fall in the INR 45–75 lakh price bracket, accounting for a share of 48 percent from the total new supply, closely followed by units in less than INR 45 lakh price bracket which had 38 percent share. Maximum (63 percent) new units launched belong to 1BHK configuration.
• Localities of Tathawade, Lavale, Wakad, Hinjewadi and Mahalunge dominated the new supply in Q1 2021.
• Residential demand in Pune is scaling back to pre-pandemic levels and dipped marginally by 12 percent YoY, in Q1 2021. However, it is to be noted that the demand has increased by 19 percent, as compared to the previous quarter. Pune saw the second highest sales in India after Mumbai.
• With 53 percent share, maximum sales in Pune were concentrated in less than INR 45 lakh price bracket. Whereas projects in the INR 45–75 lakh segment had 34 percent share in the total sales.
• Significant traction was seen in localities across Tathawade, Hinjewadi, Ravet, Wakad and Wagholi in the first quarter of 2021. Maximum units sold in Tathawade, Hinjewadi and Wakad belonged to INR 45–75 lakh price bracket, whereas majority demand for units priced between INR 25–45 lakh was seen in Ravet and Wagholi.
• In the first quarter, 2BHK remained the buyer's preferred configuration(54 percent), followed by 1 BHK, with a 31 percent share.
• Pune has the second highest share of unsold inventory among the top metros after Mumbai, which stands at 1,27,891. Although marginal, the inventory has seen a decline of 8 percent in Q1 2021, as compared to the same period in the previous year.
• While the demand is still scaling back to the pre-COVID levels, the slow sales velocity has increased the inventory overhang to 41 months as of Q1 2021 from 25 months in the same period the previous year.
4,650
4,700
4,750
4,800
4,850
4,900
4,950
5,000
5,050
5,100
-
2,000
4,000
6,000
8,000
10,000
12,000
14,000
16,000
18,000
20,000
Q1 19 Q2 19 Q3 19 Q4 19 Q1 20 Q2 20 Q3 20 Q4 20 Q1 21
Wei
ghte
d Av
erag
e Pr
ice
(INR
per
sq
ft)
Num
ber o
f Uni
ts
Market Activity
Launches Sales Price Source: DataLabs, PropTiger Research
ANNEXURE - I
New supply: It includes the new units launched in a new project or an already launched project during the quarter or the mentioned duration.
Sales: It includes the units sold in all the available projects (including newly launched projects) during the quarter or the mentioned duration.
Unsold inventory: It is the closing stock at the end of the quarter or the mentioned duration.
Inventory overhang: It represents the number of months required to offload the existing stock in the market.
Sales velocity: It is calculated as the ratio of monthly sales to the total supply.
Price: It is the weighted average price of the total supply.
Note: Analysis in the report includes apartments and villas only. RERA registration date is considered as day zero for recording new supply and sales.
PROPTIGER RESEARCH
Glossary
ANNEXURE - II
PROPTIGER RESEARCH
City Micro market Prominent localities
Ahmedabad Ahmedabad Central Ellisbridge, Paldi, Saraspur, Vasna
Ahmedabad East Bapu Nagar, Nava Naroda, New Maninagar, Nikol, Odhav, Vastral
Ahmedabad North Chandkhera, Gota, Motera, Nana Chiloda, Ranip, Vadsar
Ahmedabad South Vatva, Narol, Narolgam, Isanpur, Changodar
Ahmedabad West Bopal, Ghuma, Shela, Sarkhej, Shilaj, Sanand, Vastrapura
SG Highway Near Nirma University On SG Highway, Near Vaishno Devi circle on SG Highway, Thaltej, Chanakyapuri
Gandhinagar Urjanagar, Sargaasan, Gift City, Zundal, Rayson
Bengaluru Central Bengaluru Ashok Nagar, Richmond Town, Marathahalli, Bellandur, Frazer Town, Koramangala,
East Bengaluru Whitefield Hope Farm Junction, CV Raman Nagar, KR Puram, Mahadevapura, Harlur, Sarjapur, ITPL, Varthur, Budigere Cross
North Bengaluru Yelahanka, Doddaballapur, Hebbal, Thanisandra, Jakkur, Kodigehalli, Kannur
North East Bengaluru Horamavu, Devanahalli, Narayanapura, Hennur, Banaswadi, Kalyan Nagar
North West Bengaluru Jalahalli, Yeshwantpur, Nelamangala Town, Rajaji Nagar, Near Peenya Industrial Area
South Bengaluru Begur, JP Nagar, Bommanahalli, Gottigere, Hosa Road, Padmanabha Nagar, Hulimavu
South East Bengaluru Electronics City, Hosur, Anekal City, Jigani, Chandapura, Attibele, Bommasandra, Narayanaghatta, Avalahalli
West Bengaluru Kumbalgodu, Kengeri, Nagarbhavi
Chennai Chennai Central Anna Nagar, Alwarpet, Guindy, Raja Annamalai Puram, Vadapalani
Chennai North Perembur, Madhavaram, Kolathur, Ponneri
Chennai South Perrumbakkam, Mambakkam, Thiruporur
Chennai West Avadi, Koyembedu, Manapakkam, Mangadu, Mogappair, Vanagram, Thirumazhisai, Mevalurkuppam, Ambattur
ECR Injambakkam, Thiruvanmiyur, Kanathur Reddikuppam
GST Guduvencheri, Perungalathur, Singaperumal Koil, Orgadam, Maraimalai Nagar, Tambaram, Chromepet
OMR Padur, Perungudi, Sholinganallur, Siruseri, Thalambur, Medavakkam, Kelambakkam, Tiruporur Near Kelambakkam Vandalur Kelambakkam Road Moolacheri, Nallambakkam
Delhi-NCR Faridabad Ballabhgarh, Greater Faridabad, Hodal, NH2, Surajkund
Ghaziabad Ghaziabad Central, Indirapuram, Kaushambi, NH 24, NH57, NH58, Sahibabad, Vaishali, Vasundhara, Bhopura
Greater Noida Noida Extension, Yamuna Expressway (Chi 5, TechZone),Bodaki, Eta, Beta, Knowledge Park, Omnicron, Pi, Surajpur, Swarn nagari, Zeta
Gurugram Dwarka Expressway (Sector 35-37,84, 88, 89, 99,102-113), Golf Course Extension Road (Gwal pahari, sector 59 - 63, 65), Gold Course Road (Sector 28, 42, 54), Gurgaon Central, Manesar, New Gurgaon (Sector 76-82,85-93, 95), Old Gurgaon, Sohna & Sohna Road (Sector 48,67,68), Southern Peripheral Road (Sector 69 - 72)
Noida Noida Expressway (Sector 45, 94, 104, 108, 110, 128, 135, 143,144, 150 - 152, 168), Yamuna Expressway (Sector 17, 19, 22A 22D,25) , FNG Expressway (Sector 113, 118, 119, 121 ), Dadri Road (Sector 80, 107), Near City Center (Sector 32, 43, 50, 73 - 79)
Geographical spread of report
PROPTIGER RESEARCH
City Micro market Prominent localities
Hyderabad Hyderabad West Hitec City, Gachibowli, Manikonda, Narsingi, Serilingampally, Nallagandla Gachibowli, Kondapur, Chandanagar, Hafeezpet, Bachupally, Miyapur
Hyderabad North Kompally, Tellapur, Kukatpally, Nizampet, Bolarum, Bahadurpally, Shamirpet
Hyderabad South Saidabad, Kismatpur, Maheshwaram, Shadnagar, Rajendra Nagar
Hyderabad East LB Nagar, Nagole, Hayathnagar, Vanasthalipuram, Uppal Kalan, Saroor Nagar
ORR South Bongloor, Shamshabad, Adibatla, Pocharam
Secunderabad Mallapur, Yapral, Sainikpuri, Alwal, AS Rao Nagar
Hyderabad Central Somajiguda, Ameerpet, Himayat nagar, Jubilee Hills, Begumpet, Banjara Hills
Kolkata Kolkata East New Town, Rajarhat, Salt Lake city, Tangra, Beliaghata
Kolkata North Dum Dum, Madhyamgram, Barasat, Barrackpore, Lake Town, Rishra
Kolkata South Baruipur, Behala, Joka, Garia, Narendrapur, Sonarpur, Uttar Gauripur, Tollygunge, New Alipore, Mukundapur
Kolkata West Serampore, Howrah, Uttarpara Kotrung, konnagar
Kolkata Central Sealdah
Andheri to Dahisar Andheri, Borivali, Dahisar, Goregaon, Jogeshwari, Kandivali, Malad
MetrWorli to Andheri Bandra, Dharavi, Juhu, Khar, Mahim, Santacruz, Ville Parle
Central Mumbai Bandra Kurla Complex, Bhand up, Ghatkopar, Kanjurmarg, Kurla, Matunga, Mulund, Powai, Sion, Vikhroli
Mumbai South Colaba, Narimat Point, Dadar, Worli, Byculla, Mahalaxmi, Parel, Lower Parel, Girgaon, Prabhadevi
Mumbai Harbour Sewri, Wadala, Chembur, Mazegaon, Mira Road and Beyond Mira Road, Vasai, Virar, Nala Sopara, Bhayandar, Boisar, Naigaon East, Palghar
Navi Mumbai Airoli, Belapur, Kharghar, Taloja, Dronagiri, Ghansoli, Karanjade, Ulwe, Vashi, Warai
Thane Thane East & Thane West
Beyond Thane Ambernath, Badlapur, Bhiwandi, Dombivali, Kalyan, Karjat, Neral, Vangani, Ambivali, Anjurdive, Ulhas Nagar, Shil phata
Panvel and Beyond Panvel, Khopoli, Rasayani, Khalapur, Kewale, Umroli, Pen, Chowk
Pune PCMC Chikhali, Ravet, Wakad, Tathawade, Moshi, Mamurdi, Jambhul, Pimpri, Rahatani, Gahunje, Chinchwad
Pune South Dhayari, Kondhwa, Undri, Ambegaon Budruk, Phursungi, NIBM Annex Mohammadwadi, Handewadi, Shirwal, Shivapur, Baramati, Nasrapur, Katraj, Bibwewadi
Pune West Hinjewadi, Pirangut, Bavdhan, Mahalunge, Baner, Mugawade, Balewadi, Bhukum, Kothrud, Kamshet, Bhugaon
Pune North Talegaon Dabhade, Alandi, Chakan, Dhanori, Rajgurunagar, Dehu
Nagar Road Wagholi, Kharadi, Lohegaon, Lonikand, Sanaswadi
Pune Solapur Highway Hadapsar, Manjari, Uruli Kanchan, Loni Kalbhor
Mumbai Pune Bypass Vadgaon Budruk, Sus, Warje, Shivane, Karve Nagar
Pune East Mundhwa, Bakhori, Kedagaon, Daund
Pune Center Sopan Baug, Deccan Gymkhana, Parvati Darshan, Shivaji Nagar
MumbaiMetropolitanRegion

RESEARCH
HEAD OFFICE
Echelon Square, Plot No-25, Sector - 32,Gurugram-122001 (Haryana) India0124-4866700 | [email protected]
PropTiger Research is part of PropTiger.com which is owned by Singapore-based Elara Technologies, which also owns Housing.com
and Makaan.com. The Group advises clients ranging from individual owners and buyers to major developers. Backed by strong
research and analytics, our experts provide comprehensive real estate services that cover advertising, marketing, mandating
business solutions for real estate stakeholders, negotiations, home loans, consulting and post-sales service. Headquartered in
Gurugram, Haryana, we have 14 o�ces across India. For further details about the Company, please visit www.proptiger.com.
PROPTIGER RESEARCH
Ankita SoodDirector – Research | Growth & MarketingHousing.com | PropTiger.com | [email protected]
PROPTIGER RESEARCHSimmi [email protected] Manager
Renuka [email protected]
Biraj [email protected] Creative Producer
GRAPHICS
KolkataChetan JaiswalCity Head+91 [email protected]
BengaluruRitesh NegiCity Head+91 [email protected]
ChennaiSabari NathanCity Head+91 [email protected]
AhmedabadKamal ChandaniArea Head+91 [email protected]
All IndiaMani RangarajanChief Operating OfficerHousing.com | PropTiger.com | Makaan.com [email protected]
Rajan SoodBusiness Head - Transactions Business UnitHousing.com | PropTiger.com | Makaan.com [email protected]
BUSINESS ENQUIRIES
Delhi NCRVikram Singh GillRegional Business Head - North+91 [email protected]
HyderabadSanjay PanCity Head+91 [email protected]
MumbaiMazharali SiddiqueCity Head+91 [email protected]
PuneNitin GautamRegional Business Head - West+91 [email protected]

RESEARCH
The analysis presented on real estate trends in India are indicative of market trends. The data has been tracked and collected
across eight cities for nearly 20,000 projects. Utmost care has been taken to provide the complete market picture however
these trends present the best case scenario and should not be relied upon in anyway. The data for sales is collected through
primary survey carried out by our field agents and the data for new launches is as per the projects registered under the Real
Estate Regulatory Act (RERA). The report published is for general information only. Although high standards have been used
for analysis in this report, no responsibility or liability whatsoever can be accepted by PropTiger.com for any loss or damage
resulting from any use of, reliance on or reference to the content of this document. As a general report, this material does not
necessarily represent the views of PropTiger.com in relation to particular properties or projects. Reproduction of this report in
whole or in part is nor allowed without prior written approval of PropTiger.com to the form and content within which it appears.
Download our reports and presentationsat housing.com/research-reports
For more insights and trends reachout to [email protected]
OR
Follow us on
Recent Report Publications
PropTech: The future of real estate in India
Related Documents