INSTITUTE OF PHYSICS PUBLISHING JOURNAL OF PHYSICS: CONDENSED MATTER J. Phys.: Condens. Matter 14 (2002) 4075–4086 PII: S0953-8984(02)29377-7 Real examples of surface reconstructions determined by direct methods X Torrelles 1, 9 , J Rius 1 , A Hirnet 2 , W Moritz 2 , M Pedio 3 , R Felici 4 , P Rudolf 5 , M Capozi 6 , F Boscherini 7 , S Heun 3 , B H Mueller 3 and S Ferrer 8 1 Institut de Ci` encia de Materials de Barcelona (CSIC), 08193 Bellaterra, Barcelona, Spain 2 Institut f ¨ ur Kristallographie und Angewandte Mineralogie, Universit¨ at M ¨ unchen, Theresienstr. 41, D-80333 M¨ unchen, Germany 3 Laboratorio TASC-INFM, Area Science Park, SS 14, Km 163.5, 34012 Trieste, Italy 4 INFM, Op. Group in Grenoble, c/o ESRF, 6 rue Jules Horowitz, Bp 220, F-38043, Grenoble Cedex, France 5 LISE Facultes Universitaires Notre-Dame de la Paix, Namur, Belgium 6 ISM-CNR, Area della Ricerca Tor Vergata, V Fosso del Cavaliere 100, 00100 Roma, Italy 7 INFM, Dipartimento di Fisica, University of Bologna, viale C Berti Pichat 6/2, 40127 Bologna, Italy 8 ESRF, 6 rue Jules Horowitz, Bp 220, F-38043, Grenoble Cedex, France E-mail: [email protected] Received 2 October 2001, in final form 27 November 2001 Published 11 April 2002 Online at stacks.iop.org/JPhysCM/14/4075 Abstract In this work the modulus sum function is briefly introduced and its applicability to the automated interpretation of projections of reconstructed surfaces shown. The selected real examples have been arranged according to the interpretation complexity of the respective two-dimensional Patterson maps and correspond to the most common types of surface reconstructions represented by: (i) a shift of the surface atoms from their ideal positions. This type of reconstruction is often found on (001) semiconductor surfaces and its most characteristic structural feature is the pairing of neighbouring surface atoms forming dimers, e.g., the In 0.04 Ga 0.96 As(001)-p(4 × 2) reconstructed surface. (ii) Different atom types occupying the surface sites. This type of reconstruction can be induced by both the adsorption of deposited atoms onto the surface, e.g. Sb/Ge(113)-c(2 × 2), or a new structural arrangement of the substrate caused by the adsorption of external molecules onto the surface, e.g. C 60 /Au(110)-p(6 × 5) reconstructed surface. (Some figures in this article are in colour only in the electronic version) 9 Author to whom any correspondence should be addressed. 0953-8984/02/164075+12$30.00 © 2002 IOP Publishing Ltd Printed in the UK 4075

Welcome message from author
This document is posted to help you gain knowledge. Please leave a comment to let me know what you think about it! Share it to your friends and learn new things together.
Transcript

INSTITUTE OF PHYSICS PUBLISHING JOURNAL OF PHYSICS: CONDENSED MATTER
J. Phys.: Condens. Matter 14 (2002) 4075–4086 PII: S0953-8984(02)29377-7
Real examples of surface reconstructions determinedby direct methods
X Torrelles1,9, J Rius1, A Hirnet2, W Moritz2, M Pedio3, R Felici4,P Rudolf 5, M Capozi6, F Boscherini7, S Heun3, B H Mueller3 andS Ferrer8
1 Institut de Ciencia de Materials de Barcelona (CSIC), 08193 Bellaterra, Barcelona, Spain2 Institut fur Kristallographie und Angewandte Mineralogie, Universitat Munchen,Theresienstr. 41, D-80333 Munchen, Germany3 Laboratorio TASC-INFM, Area Science Park, SS 14, Km 163.5, 34012 Trieste, Italy4 INFM, Op. Group in Grenoble, c/o ESRF, 6 rue Jules Horowitz, Bp 220, F-38043,Grenoble Cedex, France5 LISE Facultes Universitaires Notre-Dame de la Paix, Namur, Belgium6 ISM-CNR, Area della Ricerca Tor Vergata, V Fosso del Cavaliere 100, 00100 Roma, Italy7 INFM, Dipartimento di Fisica, University of Bologna, viale C Berti Pichat 6/2, 40127 Bologna,Italy8 ESRF, 6 rue Jules Horowitz, Bp 220, F-38043, Grenoble Cedex, France
E-mail: [email protected]
Received 2 October 2001, in final form 27 November 2001Published 11 April 2002Online at stacks.iop.org/JPhysCM/14/4075
AbstractIn this work the modulus sum function is briefly introduced and its applicabilityto the automated interpretation of projections of reconstructed surfaces shown.The selected real examples have been arranged according to the interpretationcomplexity of the respective two-dimensional Patterson maps and correspond tothe most common types of surface reconstructions represented by: (i) a shift ofthe surface atoms from their ideal positions. This type of reconstruction is oftenfound on (001) semiconductor surfaces and its most characteristic structuralfeature is the pairing of neighbouring surface atoms forming dimers, e.g., theIn0.04Ga0.96As(001)-p(4 × 2) reconstructed surface. (ii) Different atom typesoccupying the surface sites. This type of reconstruction can be induced by boththe adsorption of deposited atoms onto the surface, e.g. Sb/Ge(113)-c(2 × 2),or a new structural arrangement of the substrate caused by the adsorption ofexternal molecules onto the surface, e.g. C60/Au(110)-p(6 × 5) reconstructedsurface.
(Some figures in this article are in colour only in the electronic version)
9 Author to whom any correspondence should be addressed.
0953-8984/02/164075+12$30.00 © 2002 IOP Publishing Ltd Printed in the UK 4075

4076 X Torrelles et al
1. Introduction
As is well known, the intensity in a surface diffraction experiment is distributed forminga periodic arrangement of so-called diffraction rods, the continuity of which in the directionnormal to the surface reflects the lack of periodicity in this direction. When the surface relaxes,the diffracted intensities always have contributions from the bulk crystal and from the outeratoms, giving rise to a particular sort of rods called crystal truncation rods (CTRs). In contrast,when the surface reconstructs the associated symmetry reduction produces an additional set ofrods called fractional-order rods (FORs) that just possess contributions of those atoms whichtake part in the reconstruction i.e. they contain no bulk information.
Traditionally, the first step in the structure solution of reconstructed surfaces has beenthe calculation of the projected difference Patterson function [δP (u, v)]. In the computationof this function only the intensities of the in-plane reflections are used, i.e. those points ofthe FORs with almost negligible perpendicular momentum transfer components. For simplereconstructions, interpretation of the δP (u, v)-function directly from the interatomic vectorsfound in the Patterson map provides projected models of the reconstruction that can be expandedalong the surface normal to adjust the total three-dimensional measured data set. However, thedifficulty for the direct interpretation of the partial Patterson maps increases as the number ofatoms involved in the reconstruction becomes larger, so that, frequently, the interpretation ismore like a trial-and-error comparison between diffracted intensities and intensities calculatedfrom multiple models. In such complicated cases, powerful procedures for the automatedδP (u, v)-function unravelling are required. Nowadays, two principal strategies exist to extractfrom the measured intensities the phase information lost during the diffraction experiment. Onestrategy takes advantage of the known bulk contribution to the CTRs to derive the unknownsurface contributions (amplitudes and phases for the CTRs and only phases for the FORs). Thesecond strategy is closer to conventional direct methods. Here, the phase information of thesurface structure is derived from the measured intensities of the FORs, exclusively, so that theCTRs are only used to place the surface structure with respect to the bulk. The direct methodsmodulus sum function (MSF), the application of which to real examples is shown in this work,follows this second strategy. Up to now, all applications of the MSF have been with in-planeintensity data. The principal reason for this has been the difficulty to measure full data setsowing to the limited measuring time available when using synchrotron radiation sources. Inthe following sections, a short description of the MSF will be given and its application to threereal examples of increasing difficulty will be analysed.
2. The direct methods MSF
The finality of the application of the MSF is the determination of the phases of the in-plane reflections. It is assumed that the set of refined phase values which maximizes MSFis correct. A Fourier summation including only these type of reflections will producea two-dimensional partial electron density map consisting of positive and negative peaks.This partial electron density distribution is called difference function (δ) and is defined asδ(x, y) = ρR(x, y)− 〈ρR(x, y)〉. ρR(x, y) is the projected electron density distribution of thereconstructed surface, while 〈ρR(x, y)〉 is obtained after averaging the electron density ρR ofthe reconstruction over all the (1 × 1) subcells. Knowledge of δ allows, in most cases, the fastidentification of the basic features of the surface structure. In addition to the availability ofthe in-plane structure factor moduli, one basic requirement for the success of the MSF is thatδ fulfils the peakness condition. As recently shown [1], then, and only then, maximization ofMSF which is defined by
Real examples of surface reconstructions determined by direct methods 4077
MSF(�) = �H [|E(H)| − 〈|E|〉] · |E(H,�)| = Max!. (1)
is essentially equivalent to minimization of the residual
R(�) = �H [|E(H)| − |E(H,�)|]2 = Min! (2)
between the observed and calculated |E| magnitudes. The symbol � denotes the collectivityof refined phases ϕ of the strongest in-plane reflections h. In (1) and (2), the summationextends over all measured in-plane reflections H . In addition, to eliminate the ‘form factor’and ‘thermal vibration’ fall-off, the structure factors F(H) have been replaced in (1) and (2)by the normalized ones E(H).
The critical point for the practical application of (2) is how to express E(H) as a functionof�. When, for example, the MSF is applied to single-crystal data, this is achieved via Sayre’sequation which assumes that the electron density distribution ρ is similar to ρ2 (and so theirrespective Fourier coefficients). Owing to the existence of positive and negative peaks in δ, δand δ2 are no longer alike, and consequently, the resemblance between δ and δ3 is used instead.As shown in [2], this forces the introduction of an additional summation in Sayre’s equation,so that |E(H,�)| is given by
|E(H,�)| ∝ �h′�h′′ |E(h′)||E(h′′)||E(H − h′ − h′′)|× cos[φ(−H) + ϕ(h′) + ϕ(h′′) + ϕ(H − h′ − h′′)] (3)
where ϕ and φ denote the phases of the structure factors of δ and δ3. Notice that the atomicityconstraint is introduced by making in (3) φ equal to ϕ for the strongest in-plane reflections.Equation (3) can be computed easily for projections but becomes lengthy for three-dimensionaldata.
3. Application of the MSF
In this work, the MSF has been applied to several in-plane data sets to determine the projectedstructure of three surface reconstructions:
(1) The pairing of neighbouring surface atoms forming dimers on (001) semiconductorreconstructed surfaces: In0.04Ga0.96As(001)−p(4 × 2).
(2) The atomic arrangement of adsorbed atoms onto a substrate: Sb/Ge(113)-c(2 × 2).(3) A new structural arrangement of the substrate surface induced by adsorbed molecules:
C60/Au(110)-p(6 × 5).
Each example contains a brief description of the preparation conditions and of the dataacquisition procedure using grazing incidence surface x-ray diffraction (GIXD) techniques,followed by a comparison between the traditional solution methods, based on the interpretationof the projected δP (u, v)-function, and MSF methods applied both to the in-plane data.The examples are ordered according to the difficulties for interpreting their respective two-dimensional Patterson maps.
3.1. In0.04Ga0.96As(001)-p(4 × 2)
3.1.1. Experimental. The samples were obtained by solid source molecular-beamepitaxy [3, 4]. GaAs buffer layers 500 nm thick were initially grown at 600 ◦C on semi-insulating GaAs(001) wafers. In0.04Ga0.96As epilayers 2 µm thick and forming a (2 × 4)surface reconstruction were subsequently grown at 500 ◦C with a III/V beam pressure ratio ofapproximately 1:40 [5]. For the transport, the samples were capped and cleaned by annealingup at 450 ◦C; during decapping the symmetry of the surface reconstruction evolved from

4078 X Torrelles et al
(2 × 4) to (4 × 2), at which point annealing was stopped. The In0.04Ga0.96As diffractionexperiment was carried out at the surface diffraction beamline ID3 of ESRF [6] at an energyof 16.0 keV.
The real-space basis is described by the lattice vectors a1 and a2 along [1,−1, 0] and[1, 1, 0], respectively, and with a3 taken perpendicular to the surface. Their magnitudes area1 = a2 = a (4.011 Å) and a3 = ao (bulk constant) = 5.672 Å. The symmetry of the diffractionpattern is mm. Inspection of diffraction data along a∗
1 showed well defined peaks at positionsthat were multiples of 1/4. However, along a∗
2, the half-order peaks were too diffuse to bemeasured, thus indicating the presence of a strong disorder in this direction [7]. Hence, themeasured in-plane superstructure intensity data only contain reflections of type (H = m/4,K = n) with m and n being integers, which can correspond either to a superstructure p(4 × 2)averaged in a2 (hereafter denoted by p(4 × 1)), or to a superstructure c(8 × 2) averaged alonga1 and a2 to give the same p(4×1) cell [8]. The total number of measured in-plane fractionalorder reflections is 151, which reduce to 35 non-equivalent reflections with resolution less than1 Å.
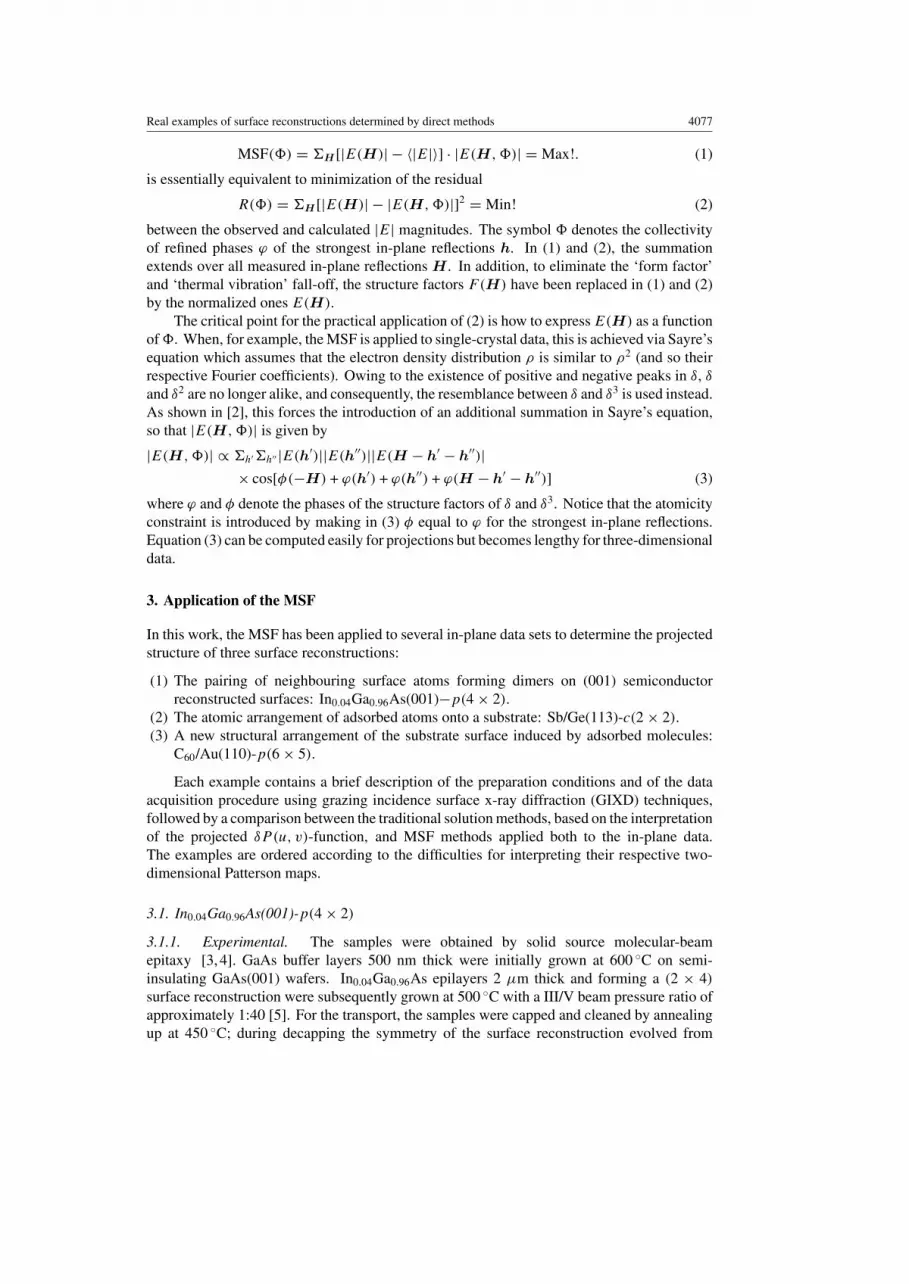
3.1.2. Discussion. The difference Patterson map computed with the in-plane superstructurereflections assumingpmm symmetry is given in figure 1(a). As mentioned earlier, the presenceof elongated and poorly defined peaks along a∗
2, makes the direct interpretation of the Pattersonmap difficult. One possibility is comparison with the known Patterson maps from relatedsystems [8,9]. From this comparison the peaks due to the As dimers can be clearly identified.However, the rest of the peaks are not satisfactorily explained by any of these models, as forexample the strong peak located at (0.425, 0) or the peaks located along a2 = 1/2 which areweaker than the expected ones derived from the previous models [8, 9]. To interpret theseadditional peaks, that is for solving the projected superstructure, the δ-MSF was applied.figure 1(b) shows the δ Fourier map of the superstructure projection (averaged along a2)computed with the best set of refined phases. From its inspection, it follows that:
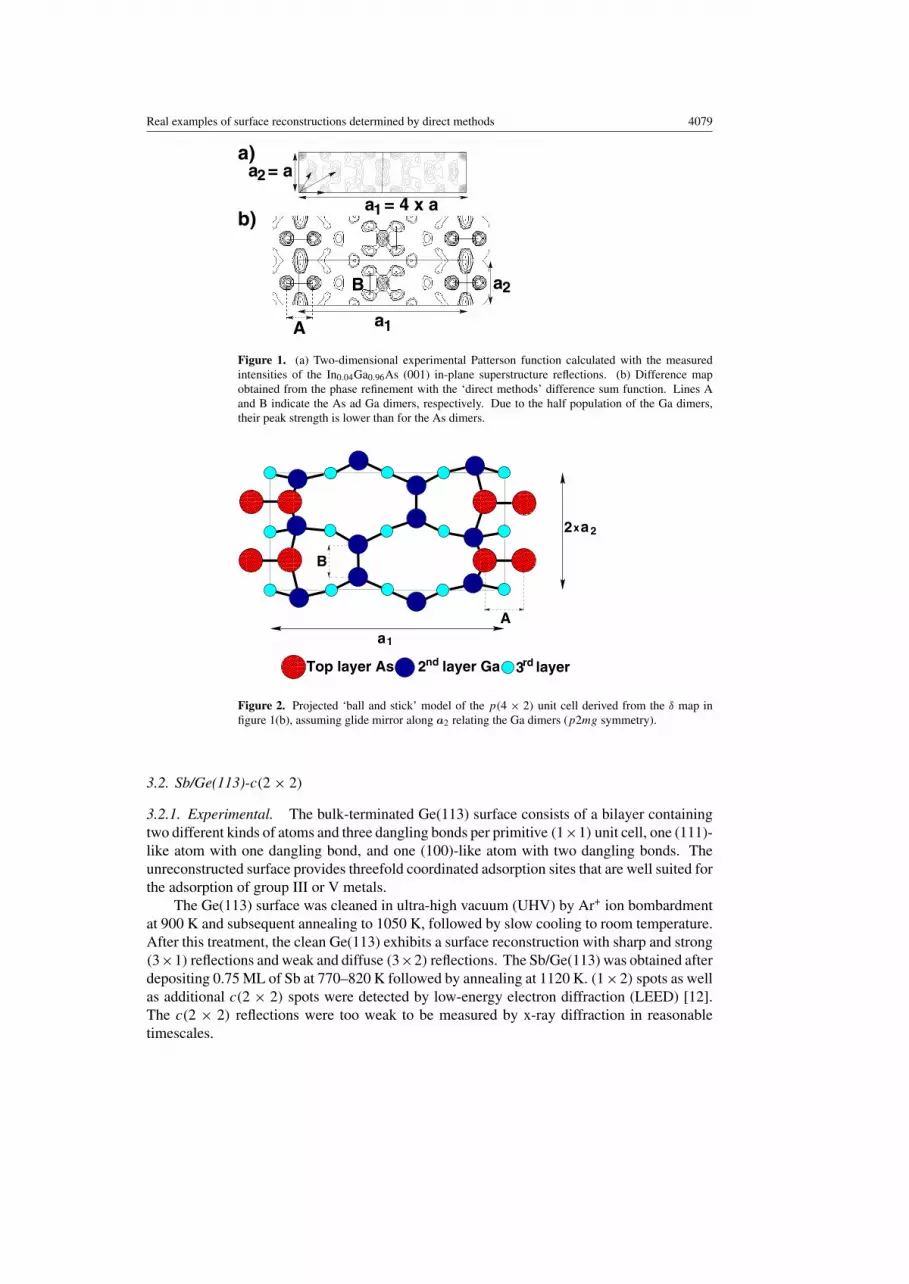
(a) the topmost layer is formed by As dimers (A in figure 2) [8].
(b) The Ga dimers are normal to the As dimers (B in figure 2). The two physically reasonableways of placing the Ga dimers in the superstructure are (i) for p(4 × 2): with glideplane along a2 relating the two Ga dimers in a zigzag manner, as depicted in figure 2(the existence of this plane requires the absence of half-order reflections along a∗
2 with Hbeing equal to 0); and (ii) for c(8 × 2): with a mirror plane relating the two neighbourGa dimers, as proposed in [8] on the basis of scanning tunnelling microscopy images (notrepresented in figure 2).
(c) The δ-peak at (1/2, 1/2), which corresponds to the (0.425, 0) peak in the Patterson map(figure 1(a)), is most probably due to an In enrichment at this site. The refinement of thesite occupancy indicates a 30–50% In enrichment.
This interpretation was confirmed by refining the model not only with the in-plane data butalso with the experimental (1, 0), (0, 1) and (1, 1) CTRs (155 additional observations) [10].The number of refined variables was kept to a minimum (one scale factor, seven (x, y)
parameters, nine (z) parameters and eight anisotropic thermal vibration coefficients). Figure 3shows the results of the fit. Recently, Erkoc and Kotken [11] have investigated systematicallythe energetics of As terminated GaAs(001) surfaces confirming that the co-existence of As andGa dimers at different atomic levels are energetically very probable.
Real examples of surface reconstructions determined by direct methods 4079
a = a2
a2
b)
a)
a = 4 x a1
1aA
B
Figure 1. (a) Two-dimensional experimental Patterson function calculated with the measuredintensities of the In0.04Ga0.96As (001) in-plane superstructure reflections. (b) Difference mapobtained from the phase refinement with the ‘direct methods’ difference sum function. Lines Aand B indicate the As ad Ga dimers, respectively. Due to the half population of the Ga dimers,their peak strength is lower than for the As dimers.
��������������������������������
��������������������������������
����������������������������������������
����������������������������������������
����������������������������������������
����������������������������������������
�����������������������������������
�����������������������������������
��������������������������������
��������������������������������
��������������������������������
��������������������������������
��������������������������������
��������������������������������
��������������������������������
��������������������������������
����������������������������������������
����������������������������������������
B
x2 a
A
Top layer As 2 layer Gand 3 layer rd
a1
2
Figure 2. Projected ‘ball and stick’ model of the p(4 × 2) unit cell derived from the δ map infigure 1(b), assuming glide mirror along a2 relating the Ga dimers (p2mg symmetry).
3.2. Sb/Ge(113)-c(2 × 2)
3.2.1. Experimental. The bulk-terminated Ge(113) surface consists of a bilayer containingtwo different kinds of atoms and three dangling bonds per primitive (1×1) unit cell, one (111)-like atom with one dangling bond, and one (100)-like atom with two dangling bonds. Theunreconstructed surface provides threefold coordinated adsorption sites that are well suited forthe adsorption of group III or V metals.
The Ge(113) surface was cleaned in ultra-high vacuum (UHV) by Ar+ ion bombardmentat 900 K and subsequent annealing to 1050 K, followed by slow cooling to room temperature.After this treatment, the clean Ge(113) exhibits a surface reconstruction with sharp and strong(3×1) reflections and weak and diffuse (3×2) reflections. The Sb/Ge(113) was obtained afterdepositing 0.75 ML of Sb at 770–820 K followed by annealing at 1120 K. (1×2) spots as wellas additional c(2 × 2) spots were detected by low-energy electron diffraction (LEED) [12].The c(2 × 2) reflections were too weak to be measured by x-ray diffraction in reasonabletimescales.

4080 X Torrelles et al
(a)
(b)
Figure 3. Observed (outer empty semicircles) and calculated (filled semicircles) structure factorsof the in-plane superstructure reflections of In0.04Ga0.96As (001)-p(4 × 1). The error bars of thedata are proportional to the area between outer and inner radii (a). Observed and calculated CTRs(b). The structural refinement of the model shown in figure 2 includes four surface atomic levels.
Data collection of Sb/Ge(113)-c(2 × 2) was performed on a home-made UHVdiffractometer [13] at the Wiggler beamline W1 at Hasylab using an energy of 10.3 keV.
The experimentally observed (1 × 2) unit cell of the Ge(113) surface was described in acentred orthogonal system by lattice vectors a1 and a2 parallel to [1,−1, 0] and [3, 3,−2],respectively, and with a3 perpendicular to the surface along [1, 1, 3]. Their magnitudes area1 = ao/
√2, a2 = 13.2683 Å and a3 = √
11ao (ao = bulk lattice constant: 5.658 Å).The total number of non-equivalent measured fractional order in-plane reflections from
the (1 × 2) superstructure is 59, figure 4 [12].
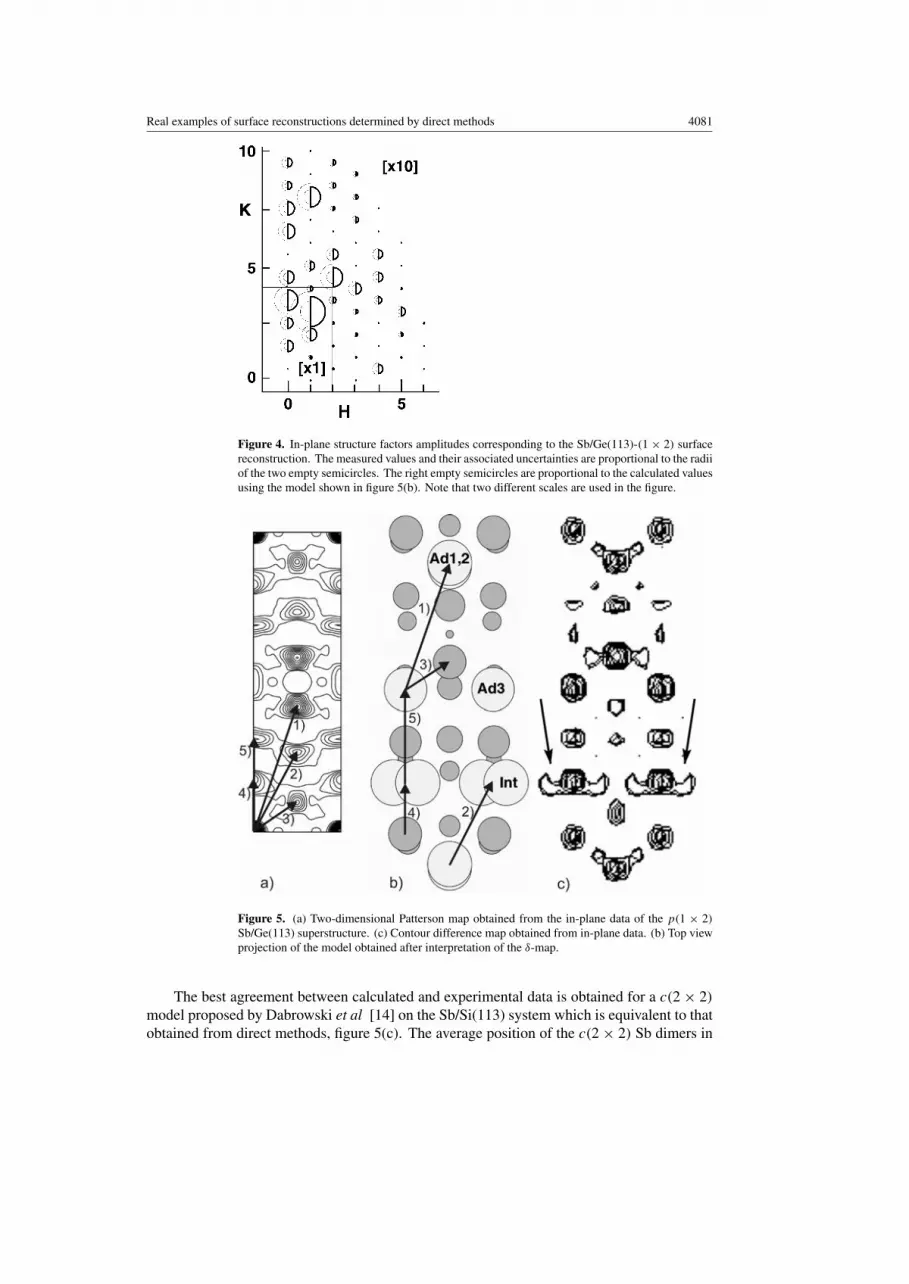
3.2.2. Discussion. The analysis of the in-plane dataset corresponding to the (1 × 2) unit cellwas initially performed by direct interpretation of its computed two-dimensional Pattersonmap. The difference Patterson map corresponding to the (1 × 2) unit cell calculated fromthe in-plane data is shown in the figure 5(a). The difficulty of interpretation lead to severalwrong models. For this reason the corresponding difference map was calculated with directmethods, figure 5(c). This map contains the average structural information of the c(2 × 2)superstructure projected into a (1 × 2) unit cell. The stronger peaks in the δ-map correspondto adsorbed Sb atoms and to topmost Ge atoms directly bonded to them showing maximumdisplacements from their ‘ideal’ bulk positions. From this interpretation a projected modelcontaining three adsorbed Sb atoms can be easily obtained, figure 5(b). The Ad1,2 and Ad3Sb atoms are threefold coordinated while the Int atoms are interstitial Sb dimers.
Real examples of surface reconstructions determined by direct methods 4081
Figure 4. In-plane structure factors amplitudes corresponding to the Sb/Ge(113)-(1 × 2) surfacereconstruction. The measured values and their associated uncertainties are proportional to the radiiof the two empty semicircles. The right empty semicircles are proportional to the calculated valuesusing the model shown in figure 5(b). Note that two different scales are used in the figure.
Figure 5. (a) Two-dimensional Patterson map obtained from the in-plane data of the p(1 × 2)Sb/Ge(113) superstructure. (c) Contour difference map obtained from in-plane data. (b) Top viewprojection of the model obtained after interpretation of the δ-map.
The best agreement between calculated and experimental data is obtained for a c(2 × 2)model proposed by Dabrowski et al [14] on the Sb/Si(113) system which is equivalent to thatobtained from direct methods, figure 5(c). The average position of the c(2 × 2) Sb dimers in
4082 X Torrelles et al
Ad2 Int Ad3Ad1
Int Int
Ad2 Ad3
Ad2
Ad3
Ad1Ad1Ad2
Ad3
Int
[1,-1,0]
[3,3,-2]
Ad1
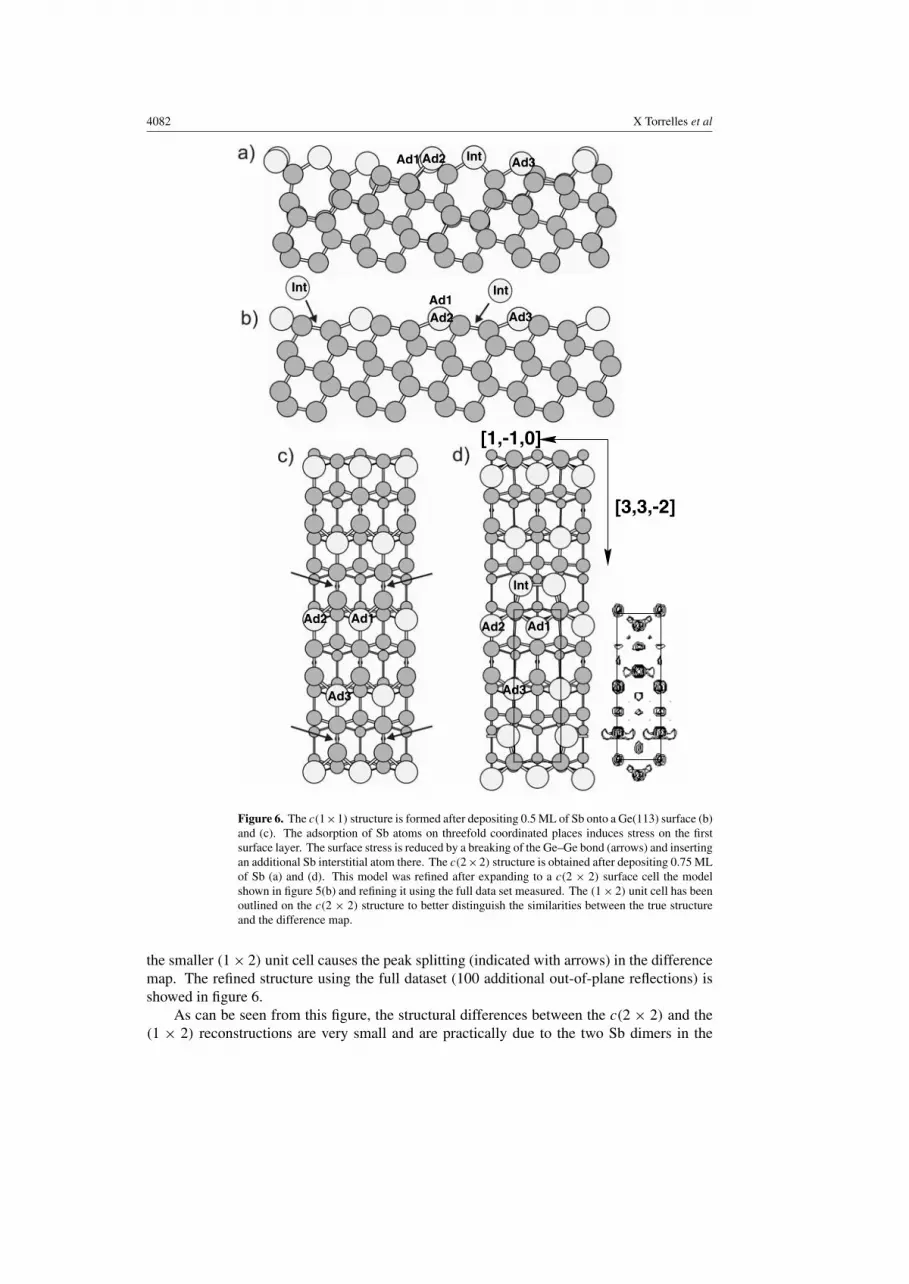
Figure 6. The c(1×1) structure is formed after depositing 0.5 ML of Sb onto a Ge(113) surface (b)and (c). The adsorption of Sb atoms on threefold coordinated places induces stress on the firstsurface layer. The surface stress is reduced by a breaking of the Ge–Ge bond (arrows) and insertingan additional Sb interstitial atom there. The c(2×2) structure is obtained after depositing 0.75 MLof Sb (a) and (d). This model was refined after expanding to a c(2 × 2) surface cell the modelshown in figure 5(b) and refining it using the full data set measured. The (1 × 2) unit cell has beenoutlined on the c(2 × 2) structure to better distinguish the similarities between the true structureand the difference map.
the smaller (1 × 2) unit cell causes the peak splitting (indicated with arrows) in the differencemap. The refined structure using the full dataset (100 additional out-of-plane reflections) isshowed in figure 6.
As can be seen from this figure, the structural differences between the c(2 × 2) and the(1 × 2) reconstructions are very small and are practically due to the two Sb dimers in the

Real examples of surface reconstructions determined by direct methods 4083
c(2 × 2) unit cell. Figures 6(b) and (c) show a lateral and top projections, respectively, ofthe c(1 × 1) surface reconstruction due to Sb adatoms on the Ge(113) surface after depositing0.5 ML of Sb. In this structure, the Sb atoms are located in threefold coordinated sites, whichinduce strong tensions in the first surface layer. The Sb–Ge and Ge–Ge bonds reveal a strongexpansion of 12% along [3, 3,−2] [15]. The adsorption of 0.25 ML of Sb (Int) suppressesthese tensions since these new Sb atoms occupy interstitial sites, thus breaking the high stressedGe–Ge bonds. These two adjacent Sb atoms form a Sb dimer. Figures 6(a) and (d) show lateraland top views, respectively, of the c(2 × 2) superstructure (obtained after depositing 0.75 MLof Sb). The diffuse streaks in the LEED pattern can be easily explained by the ordering of theinterstitial dimers. The dimer rows along [1,−1, 0] are internally well ordered, while differentdimer rows are only weak correlated. The weak interaction is caused by their long distance(6.63 Å) along [3, 3,−2].
3.3. C60/Au(110)-p(6 × 5)
3.3.1. Experimental. The clean Au(110) surface is very anisotropic since it exhibits a (1×2)missing row reconstruction [16] where one of every two closest-packed atomic rows along[1,−1, 0] is missing. The structure of C60 monolayers is usually hexagonal or quasihexagonalresulting in compressed or enlarged C60–C60 spacings compared to the C60 solid in order toachieve commensurate structures [17–19]. Moreover, C60 is also capable of inducing strongstructural modifications in a metal substrate as recently demonstrated by scanning tunnellingmicroscopy (STM) on C60/Ni(110) [20] which reveals that different adsorbate phases areformed within a general roughening and restructuring of the interface resulting in the formationof (100) microfacets.
In the thermodynamically stable adsorption of C60 on Au(110), the part of the Au sur-face covered with an hexagonal close-packed corrugated monolayer of C60 shows a (6 × 5)reconstruction while those areas of the substrate not covered by the adsorbate exhibit a (1 × 5)missing row reconstruction as previously determined by STM [21]. The fact that the corru-gation of the C60 monolayers is comparable to the difference in heights of the (1 × 2) and(1 × 3) missing row structures, which constitute the basis for the (1 × 5) reconstruction, leadsthe authors to conclude that the (1 × 5) Au reconstruction extends below the C60 layer.
The C60/Au(110)-p(6×5) diffraction experiment was carried out at the surface diffractionbeamline ID3 (ESRF) [6] using an energy of 13.4 keV. The Au(110) crystal was mounted ina UHV diffraction chamber (10−10 mbar range) where the Au(1 × 2) reconstructed surfacewas prepared. C60 was sublimated from a Ta-crucible kept at 750 K and its coverage wasdetermined by Auger spectroscopy [22–24]. After adsorption at room temperature of twolayers of C60 onto the Au substrate, the sample was annealed to 600 K until a well (6 × 5)structure was observable.
The real-space basis of the Au(110) surface is described by the lattice vectors a1 and a2
which are parallel to [1,−1, 0] and [0, 0, 1], respectively, and with a3 perpendicular to thesurface along [1, 1, 0]. Their magnitudes are a1 = a3 = ao/
√2, a2 = ao (ao = bulk lattice
constant). The total number of measured in-plane reflections of the (6 × 5) reconstructionis 300, which reduce to 130 independent reflections according to mm symmetry, figure 7(empty semicircles). Reflections of type (H, 0) with H = (2n + 1)/6 and n = integer aresystematically absent which indicates the presence of a glide line along a1, thus suggestingpmg as the most probable plane group for the reconstruction.
Analysis of the intensity statistics indicates that the reflections of type (1 × 5) are 35%stronger than the rest thus also suggesting the existence of (1×5) regions. Consequently, theywere excluded from the calculations.

4084 X Torrelles et al
Figure 7. In-plane structure factors amplitudes corresponding to the C60/Au(110)-p(6×5) surfacereconstruction. The measured values and their associated uncertainties are proportional to the radiiof the two empty semicircles. The filled semicircles are proportional to the calculated values usingthe model shown in figure 9(b). This model was not used to calculate the values of the integerH-reflections because these data were not used in the computation of the ‘direct methods’ differencesum function.
3.3.2. Discussion. The available model proposed by the STM analysis [21] (figure 9(a))was refined using pmg symmetry and with 28 positional parameters. The refinement resultedin unrealistic in-plane Au displacements with a poor agreement between the calculated andexperimental data.
Standard procedures routinely employed in surface crystallography such as directinterpretation of the experimental projected difference Patterson map (figure 8(a)), provedto be useless due to the complexity involved. This is becoming a common problem whensolving complex reconstructed surfaces of adsorbate–substrate systems. For this reason it wasdecided to derive the phases of the largest structure factors with the δ-MSF [2]. The projectedδ-map for the best solution (assuming p1g symmetry) is given in figure 8(b).
Comparison of figures 8(a) and (b) clearly illustrates the difficulty to interpret the Pattersonmap. Inspection of the stronger peaks in the δ-map indicates the presence of a mirror linenormal to a1 leading us to conclude that the true in-plane symmetry is most probably pmg.The simplest model that explains the most intense δ peaks, located along rings with a diameterof about 9.6 Å and marked as dashed lines in figure 8(b), is represented in figure 9(b). Thismodel implies the fullerene-induced reconstruction is accompanied by a very important massredistribution within the unit cell since all compact atomic rows along the a1 direction in thesecond layer have missing atoms. The Au atomic positions of the p(6 × 5) model proposedin figure 9 are in bulk crystal lattice positions. This model was refined using the 108 in-plane reflections to a reduced χ2 = 3.5 (eight structural fit parameters, one scale factorand one global temperature factor for the topmost atoms). The maximum rms deviationof the fitted coordinates from the ideal values is 0.2 Å. In spite of the limited number ofrefined variables, the agreement is rather remarkable as it can be seen from figure 7 wherethe filled semicircles are proportional to the structure factor amplitudes calculated with theproposed model. The calculation ignored the fullerenes since their scattering factor is veryweak compared to that of the Au atoms [25], especially at moderate and high resolutions.
The proposed structure [26] implies corrugation of the C60 overlayer in agreement withSTM results and reveals that the C60 adsorption is accompanied by important displacements

Real examples of surface reconstructions determined by direct methods 4085
(a)
0 a’1
a’2
1,-1,0[ [
[0,0,1
[
(b)
Figure 8. (a) Two-dimensional data Patterson map computed from the measured in-plane dataset.Arrows indicate the position of the fullerene molecules in the unit cell. (b) Contour difference map(positive regions) of C60/Au(100)-p(6×5)obtained by applying the ‘direct methods’ difference sumfunction to the partial set of in-plane reflections given in figure 8 (see text for details). Dashed linesindicate the locations of the C60 molecules. The rectangle outlines the 6×5 unit cell (17.3×20.4 Å2).
(a) (b)
Figure 9. (a) Top-view projection of the C60/Au(110)-p(6 × 5) surface reconstruction modelobtained from STM measurements [21]. The relative heights of the Au atoms are indicated bydifferent colours (darker shades represent deeper atoms). The fullerenes are indicated by thedashed circles. (b) Top-view projection of the C60/Au(110)-p(6×5) surface reconstruction modelobtained from the direct interpretation of the difference map, figure 8(b). Lines m and g indicatea mirror and a glide line, respectively.
of underlying Au atoms, leading to a calyx-shaped arrangement to accommodate better thefullerene molecules situated at (0, 0.6) and (1/2, 0.4) (blue dashed circles). The C60 moleculesat (0, 0.1) and (1/2, 0.9) (red dashed circles) have more space and rest directly on the low-level Au atoms. Accordingly, the adsorbate overlayer is composed of zigzag and buckled rowssince the fullerenes (0, 0.6) and (1/2, 0.4) are expected to be one atomic level higher than the(0, 0.1) and (1/2, 0.9) ones.

4086 X Torrelles et al
4. Conclusions
The δ-MSF has been successfully applied to the In0.04Ga0.96As(001)-p(4 × 2), Sb/Ge(113)-c(2 × 2) and C60/Au(110)-p(6 × 5) reconstructed surfaces. The corresponding differencemaps are easier to interpret than the respective Patterson maps which permits the finding ofnew models for adjusting the experimental data. The lower level of difficulty for a correctinterpretation of the δ-maps, since their peaks can be directly assigned to atomic positions inthe unit cell against interatomic vectors in the Patterson maps, permits the analysis of larger anddifficult reconstructed surfaces. The sensitivity of these new methods to incomplete datasets,mainly to the systematic omission of reflections, provides average information of the structurethat sometimes is insufficient for solving the structure, as it has been shown in the first exampleof this work.
Acknowledgment
XT and JR acknowledge the financial support of DGES (MEC), Project no PB98-0483.
References
[1] Rius J, Torrelles X, Miravitlles C, Amigo J M and Reventos N M 2002 Acta Crystallogr. A 58 21[2] Rius J, Miravitlles C and Allmann R 1996 Acta Crystallogr. A 52 634[3] Bonani A, Vanzetti L, Sorba L, Franciosi A, Lomascolo M, Prete P and Cingolani R 1995 Appl. Phys. Lett. 66
1092[4] Nicolani R et al 1994 Phys. Rev. Lett. 72 294[5] Paul S, Roy J B and Basu P K 1991 J. Appl. Phys. 69 827[6] Ferrer S and Comin F 1995 Rev. Sci. Instrum. 66 1674[7] Sauvage-Simkin M, Garreau Y, Pinchaux R, Veron M B, Landesman J P and Nagle J 1995 Phys. Rev. Lett. 75
3485[8] Skala L, Hubacek J S, Tucker J R, Lyding J W, Chou S T and Cheng K Y 1993 Phys. Rev. B 48 9138[9] Northrup J E and Froyen S 1994 Phys. Rev. B 50 2015
[10] Torrelles X, Rius J, Boscherini F, Heun S, Mueller B H, Ferrer S, Alvarez J and Miravitlles C 1998 Phys. Rev.B 57 R4281
[11] Erkoc S and Kokten H 2000 Int. J. Mod. Phys. C 11 1225[12] Hirnet A 2000 Dissertation Institut fur Kristallographie and Angewandte Mineralogie University of Munich,
Germany[13] Albrecht M, Antesberger H, Moritz W, Plockl H, Sieber M and Wolf D 1999 Rev. Sci. Instrum. V 70 3239[14] Dabrowski J, Mussig H-J, Wolf G and Hinrich S 1998 Surf. Sci. 411 54[15] Hirnet A, Gierer M, Albrecht M, Schroeder K, Blugel S, Torrelles X and Moritz W, to be published[16] Copel M and Gustafsson T 1986 Phys. Rev. Lett. 57 723[17] Rudolf P, Gensterblum G and Caudano R 1997 J. Phys. (Paris), Collq. 7 C6–136[18] Rudolf P 1996 Fullerenes and Fullerene Nanostructures ed H Kuzmany, J Fink, M Mehring and S Roth
(Singapore: World Scientific) p 263[19] Maxwell A J, Bruhwiler P A, Arvanitis D, Hasselstrom J, Johansson M K-J and Martensson N 1998 Phys. Rev.
B 57 7312[20] Murray P W, Pedersen M O, Laegsgaard E, Stensgaard I and Besenbacher F 1997 Phys. Rev. B 55 9360[21] Gimzewski J K, Modesti S and Schlittler R R 1994 Phys. Rev. Lett. 72 1036[22] Maxwell A J, Bruhwiler P A, Nilsson A, Martensson N and Rudolf P 1994 Phys. Rev. B 49 10 717[23] Modesti S, Cerasari S and Rudolf P 1993 Phys. Rev. Lett. 71 2469[24] Pedio M, Grilli M L, Ottaviani C, Capozi M, Quaresima C, Perfetti P, Thiry P A, Caudano R and Rudolf P 1995
J. Electron. Spectrosc. Relat. Phenom. 76 405[25] Torrelles X, Rius J, Pedio M, Felici R, Rudolf P, Alvarez J, Ferrer S and Miravitlles C 1999 Phys. Status Solidi
b 215 773[26] Pedio M, Felici R, Torrelles X, Rudolf P, Capozi M, Rius J and Ferrer S 2000 Phys. Rev. Lett. 85 1040
Related Documents