OVERVIEW Sublease Space Spills Back Over 9.0 Million SF The Houston office sector is off to a slow start in 2018 as the market continues to find its footing following the energy downturn and recent construction cycle. Direct vacancy and availability rates both saw increases over the quarter. Vacancy rate increases were due to a combination of downsizing tenants, subleases expiring and tenants vacating direct space for sublease alternatives. Availability was pushed upwards by new sublease offerings on the market. After dropping to 8.7 million SF, sublease space spilled back over 9.0 million SF in the first quarter as Technip put up 375,000 SF (Energy Corridor) and Hess Energy added 123,000 SF (CBD) as the year ended. Additional energy related sublease offerings are anticipated to come online as the year progresses. The first quarter saw several large renewals, led by Apache's extension of 524,000 SF in Post Oak Central, further postponing any potential for their long-discussed build-to-suit project. Also of note, Williams renewed for 353,944 SF in Williams Tower (Galleria/Uptown). Market fundamentals are likely to soften further through the first half of the year as additional fallout continues to avail itself. However, an uptick in the second half of the year is anticipated as sustained oil prices begin to translate into job growth. Furthermore, the long-term outlook on Houston remains bright, underscored by the heightened level of investor activity in the market. HOUSTON OFFICE MARKET FIRST QUARTER 2018 REAL ESTATE OUTLOOK Office Market Off to a Slow Start in 2018 Direct Vacancy and Sublease Supply Rise NET ABSORPTION AND VACANCY RATE TRENDS HOUSTON METRO AREA CONTIGUOUS BLOCKS OF AVAILABLE SPACE HOUSTON METRO SOURCE CoStar, Transwestern *Through Q1 2018 SOURCE CoStar, Transwestern *At Q1 2018 Note: Delivery of preleased space counts as positive net absorption Notable Q1 Leases TENANT SF LEASE TYPE BUILDING SUBMARKET Apache Corporation 524,342 Lease Extension 1990 & 2000 Post Oak Blvd Galleria/Uptown Williams 353,944 Renewal Williams Tower Galleria/Uptown Dashiell Corporation 79,308 Renewal/Expansion 12301 Kurland Dr Gulf Freeway/Pasadena Hunting Energy Services 62,137 Renewal 16825 Northchase Dr Greenspoint/N Belt West PFS Group 54,891 Renewal 2600 N Loop Fwy W North Loop West NextEra Energy 50,283 Renewal 601 Travis CBD -4000 -3000 -2000 -1000 0 1000 2000 3000 4000 5000 6000 7000 8000 Net Absorption 18* 17 16 15 14 13 12 11 10 09 08 07 5% 10% 15% 20% 25% Total Availability Direct Vacancy In Thousands 0 50 100 150 200 Class A Sublet Class A Direct 200,000 SF 100,000 SF 50,000 SF 25,000 SF Class B Sublet Class B Direct

Welcome message from author
This document is posted to help you gain knowledge. Please leave a comment to let me know what you think about it! Share it to your friends and learn new things together.
Transcript

OVERVIEW
Sublease Space Spills Back Over 9.0 Million SF The Houston office sector is off to a slow start in 2018 as the market continues to find its footing following the energy downturn and recent construction cycle. Direct vacancy and availability rates both saw increases over the quarter. Vacancy rate increases were due to a combination of downsizing tenants, subleases expiring and tenants vacating direct space for sublease alternatives. Availability was pushed upwards by new sublease offerings on the market. After dropping to 8.7 million SF, sublease space spilled back over 9.0 million SF in the first quarter as Technip put up 375,000 SF (Energy Corridor) and Hess Energy added 123,000 SF (CBD) as the year ended. Additional energy related sublease offerings are anticipated to come online as the year progresses.
The first quarter saw several large renewals, led by Apache's extension of 524,000 SF in Post Oak Central, further postponing any potential for their long-discussed build-to-suit project. Also of note, Williams renewed for 353,944 SF in Williams Tower (Galleria/Uptown). Market fundamentals are likely to soften further through the first half of the year as additional fallout continues to avail itself. However, an uptick in the second half of the year is anticipated as sustained oil prices begin to translate into job growth. Furthermore, the long-term outlook on Houston remains bright, underscored by the heightened level of investor activity in the market.
HOUSTON OFFICE MARKETFIRST QUARTER 2018
REAL ESTATE OUTLOOK
Office Market Off to a Slow Start in 2018Direct Vacancy and Sublease Supply Rise
NET ABSORPTION AND VACANCY RATE TRENDS HOUSTON METRO AREA
CONTIGUOUS BLOCKS OF AVAILABLE SPACE HOUSTON METRO
SOURCE CoStar, Transwestern *Through Q1 2018
SOURCE CoStar, Transwestern *At Q1 2018
Note: Delivery of preleased space counts as positive net absorption
Notable Q1 LeasesTENANT SF LEASE TYPE BUILDING SUBMARKET
Apache Corporation 524,342 Lease Extension 1990 & 2000 Post Oak Blvd Galleria/Uptown
Williams 353,944 Renewal Williams Tower Galleria/Uptown
Dashiell Corporation 79,308 Renewal/Expansion 12301 Kurland Dr Gulf Freeway/Pasadena
Hunting Energy Services 62,137 Renewal 16825 Northchase Dr Greenspoint/N Belt West
PFS Group 54,891 Renewal 2600 N Loop Fwy W North Loop West
NextEra Energy 50,283 Renewal 601 Travis CBD
-4000-3000-2000-1000
010002000300040005000600070008000
Net Absorption
18*17161514131211100908075%
10%
15%
20%
25%Total AvailabilityDirect Vacancy
In Th
ousa
nds
0
50
100
150
200Class A SubletClass A Direct
200,000 SF100,000 SF50,000 SF25,000 SF
Class B SubletClass B Direct

NET ABSORPTION
Absorption Stays in the RedThe office market continues to experience fallout from the energy downturn with negative absorption of 946,738 SF for all classes of space over the first quarter. Class A absorption was negative 343,853 SF and Class B space recorded negative 549,406 SF. There were several large move outs that occurred during the first quarter that drove negative absorption. United Airlines vacated 200,000 SF (1801 Smith, CBD) followed by NRG at 145,000 SF (1000 Main, CBD), Baker Hughes at 128,000 SF (America Tower, Midtown) and Cameron at 128,000 SF (Westway One, West Belt). The first half of 2018 is likely to experience additional negative absorption as 1.0 million SF of sublease space is set to expire over the balance of 2018. It is anticipated that absorption will start to see a rebound in the second half of the year as higher energy trading prices begin to result in office using job growth.
DIRECT VACANCY & TOTAL AVAIL ABILIT Y
Hess and Technip Push Availability UpwardsThe overall office availability rate (all space marketed as available for lease, both direct and sublet) increased 0.5% over the quarter, closing Q1 at 23.2%. After seeing a decrease in sublease space towards the end of the year, sublease space jumped back over 9.0 million SF at the close of the first quarter. This was driven by Technip listing 375,000 SF of space on the sublease market in Energy Tower II (Katy Freeway West, Class A) and Hess putting an additional 123,000 SF online in 1501 McKinney (CBD, Class A). Class A availability was 25.1%, up from 24.1% at the close of 2017 and Class B total availability was 21.7%, unchanged quarter-over-quarter.
Overall direct vacancy saw a 0.5% increase over the quarter ending at 15.9%. Class A direct vacancy closed the quarter at 15.8%, up 0.5% over the quarter. Class B direct vacancy increased by 0.6% over the same period, ending the first quarter at 16.9%. With 1.0 million SF of sublease space set to expire by the end of 2018, direct vacancy will continue to increase over the course of the year.
RENTAL R ATES
Rents Increase Over Q1Overall asking rates for the Houston metro area increased slightly over the quarter to $30.99 PSF full service as compared to $30.66 PSF full service at the end of 2017. Rental rates for both classes of space saw an increase in the first quarter. Class A rental rates increased 1.1% to $36.26 PSF full service and Class B rates increased 0.3% to $21.81 PSF full service. Despite the recent increases in rental rates, the market remains in the tenants favor as generous concession packages continue to be offered. The submarkets with the highest full service asking rents are the Central Business District (Class A - $44.64 PSF), Katy Fwy East (Class A, $40.77 PSF), and Greenway Plaza (Class A - $39.60 PSF). The most value friendly Class A submarkets include Northwest Far ($19.58 PSF), Southwest/Hillcroft ($19.89 PSF) and Southwest/Beltway 8 ($21.10 PSF).
Office Under ConstructionHouston Metro | Q1 2018
SUBMARKET NUMBER OF BLDGS SF % PRE-
LEASED
CBD 1 778,344 32%
Woodlands 3 704,800 97%
Total 4 1,483,144 63%
AVERAGE OFFICE RENTS HOUSTON METRO AREA
SOURCE CoStar, Transwestern *Through Q1 2018 Note: All classes of office space
Total Available SpaceHouston Metro | Q1 2018
SUBMARKETSUBLEASE SPACE (SF)
% OF SUPPLY
% OF TOTAL AVAILABLE
CBD 2,186,786 5.0% 18.0%Katy Fwy/Energy Corridor 2,584,916 7.1% 27.7%
Westchase 1,353,204 7.7% 26.4%
West Loop 885,406 2.6% 12.2%
N Houston District 687,027 6.8% 11.4%
All of Houston 9,059,105 3.8% 16.1%
$15
$20
$25
$30
$35
$40Class BClass AOverall
18*1716151413121110090807
2 REAL ESTATE OUTLOOK HOUSTON METRO Q1 2018
HOUSTON METRO MARKETFIRST QUARTER 2018

SUPPLY AND DEVELOPMENT
Build-to-Suit Projects Driving ActivityConstruction activity continues to dwindle in the Houston market following the close of the recent development cycle. High availability and increasing vacancy have developers hesitant to build without a significant prelease commitment. At the close of the first quarter, the construction pipeline totaled 1.5 M SF as 63% preleased. Currently, there are four developments under construction which include Capitol Tower (CBD, 778,000 SF - 32% leased to Bank of America and Quantum Energy), CityPlace 2 (The Woodlands, 326,000 SF - 100% Leased to ABS) and HP's Build-to-Suit Campus (The Woodlands, two-189,000 SF buildings).
Three deliveries occurred in the first quarter, the most notable of these was the Kirby Collection, a 246,989 SF mixed-use property in Greenway Plaza delivered at 44% preleased. Tillman Fertitta’s, The Post Oak a 104,579 SF mixed-use property in Galleria/Uptown delivered at 68% preleased. Also of note, Grandway West IV a 72,045 SF building in Katy Far West delivered at 93% preleased. Despite the vast amount of space on the market, potential exists for an additional 3-4 buildings to break ground over the year as tenants remain enamored with new construction given the efficiencies, amenities and ability to impact employee retention.
INVESTMENT MARKET
Investors Keep Eyes on Houston Sales were robust for the quarter totaling $715.7 million, driven largely by the closing of several notable portfolio sales. Brookhollow Central (3-building campus totaling 797,971 SF) was purchased by Hertz Investment Group for approximately $70.5 million. Other notable transactions include, Loop Central's acquisition by Griffin Partners (3-building portfolio totaling 575,000 SF, undisclosed price) and The Offices at Pin Oak Park's acquisition by Norvin Healthcare Properties (5-building portfolio totaling 504,721 SF, $110.0 million). These figures represent assets for which pricing information could be obtained.
COMPARATIVE OFFICE INVESTMENT SALES VOLUME SELECT METRO AREAS
SOURCE Real Capital Analytics, Transwestern ,*Through Q1 2018
AVERAGE OFFICE SALE PRICE HOUSTON METRO AREA
SOURCE Real Capital Analytics, Transwestern,*Through Q1 2018
Notable Q1 TransactionsBUILDING SUBMARKET SF SALE PRICE SELLER BUYER
Brookhollow Central(3-bldg Campus) North Loop West 797,971 $70,500,000 Parmenter Realty Partners Hertz Investment Group
Loop Central(3-bldg Campus) Bellaire 575,000 N/A TIER REIT Griffin Partners
The Offices at Pin Oak Park (5-bldg Campus) Bellaire 504,721 $110,000,000 Griffin Partners Norvin Healthcare Properties
One Northwest Centre Northwest Far 151,835 N/A Boxer Property ManhattanLife
SOURCE Real Capital Analytics, Costar, Transwestern
Sales
Volu
me i
n Billi
ons
$0
$1
$2
$3
$4
$5
$6
$7
$8HoustonDenverDallasAtlanta
18*1716151413121110090807
$0
$50
$100
$150
$200
$250 Average Sale Price Per SF
18*1716151413121110090807
REAL ESTATE OUTLOOK HOUSTON METRO Q1 2018 3
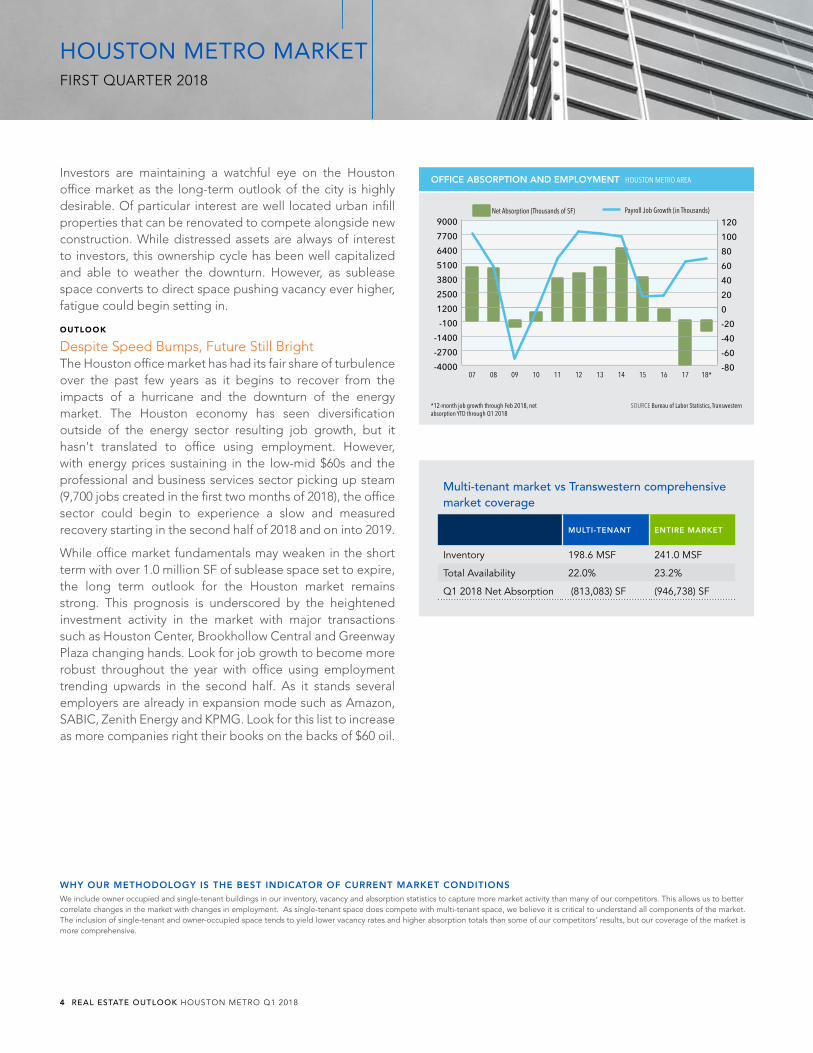
Investors are maintaining a watchful eye on the Houston office market as the long-term outlook of the city is highly desirable. Of particular interest are well located urban infill properties that can be renovated to compete alongside new construction. While distressed assets are always of interest to investors, this ownership cycle has been well capitalized and able to weather the downturn. However, as sublease space converts to direct space pushing vacancy ever higher, fatigue could begin setting in.
OUTLOOK
Despite Speed Bumps, Future Still BrightThe Houston office market has had its fair share of turbulence over the past few years as it begins to recover from the impacts of a hurricane and the downturn of the energy market. The Houston economy has seen diversification outside of the energy sector resulting job growth, but it hasn't translated to office using employment. However, with energy prices sustaining in the low-mid $60s and the professional and business services sector picking up steam (9,700 jobs created in the first two months of 2018), the office sector could begin to experience a slow and measured recovery starting in the second half of 2018 and on into 2019.
While office market fundamentals may weaken in the short term with over 1.0 million SF of sublease space set to expire, the long term outlook for the Houston market remains strong. This prognosis is underscored by the heightened investment activity in the market with major transactions such as Houston Center, Brookhollow Central and Greenway Plaza changing hands. Look for job growth to become more robust throughout the year with office using employment trending upwards in the second half. As it stands several employers are already in expansion mode such as Amazon, SABIC, Zenith Energy and KPMG. Look for this list to increase as more companies right their books on the backs of $60 oil.
Multi-tenant market vs Transwestern comprehensive market coverage
MULTI-TENANT ENTIRE MARKET
Inventory 198.6 MSF 241.0 MSF
Total Availability 22.0% 23.2%
Q1 2018 Net Absorption (813,083) SF (946,738) SF
WHY OUR METHODOLOGY IS THE BEST INDICATOR OF CURRENT MARKET CONDITIONSWe include owner occupied and single-tenant buildings in our inventory, vacancy and absorption statistics to capture more market activity than many of our competitors. This allows us to better correlate changes in the market with changes in employment. As single-tenant space does compete with multi-tenant space, we believe it is critical to understand all components of the market. The inclusion of single-tenant and owner-occupied space tends to yield lower vacancy rates and higher absorption totals than some of our competitors’ results, but our coverage of the market is more comprehensive.
OFFICE ABSORPTION AND EMPLOYMENT HOUSTON METRO AREA
SOURCE Bureau of Labor Statistics, Transwestern *12-month job growth through Feb 2018, net absorption YTD through Q1 2018
-4000
-2700
-1400
-100
1200
2500
3800
5100
6400
7700
9000Net Absorption (Thousands of SF)
18*1716151413121110090807-80
-60
-40
-20
0
20
40
60
80
100
120Payroll Job Growth (in Thousands)
4 REAL ESTATE OUTLOOK HOUSTON METRO Q1 2018
HOUSTON METRO MARKETFIRST QUARTER 2018
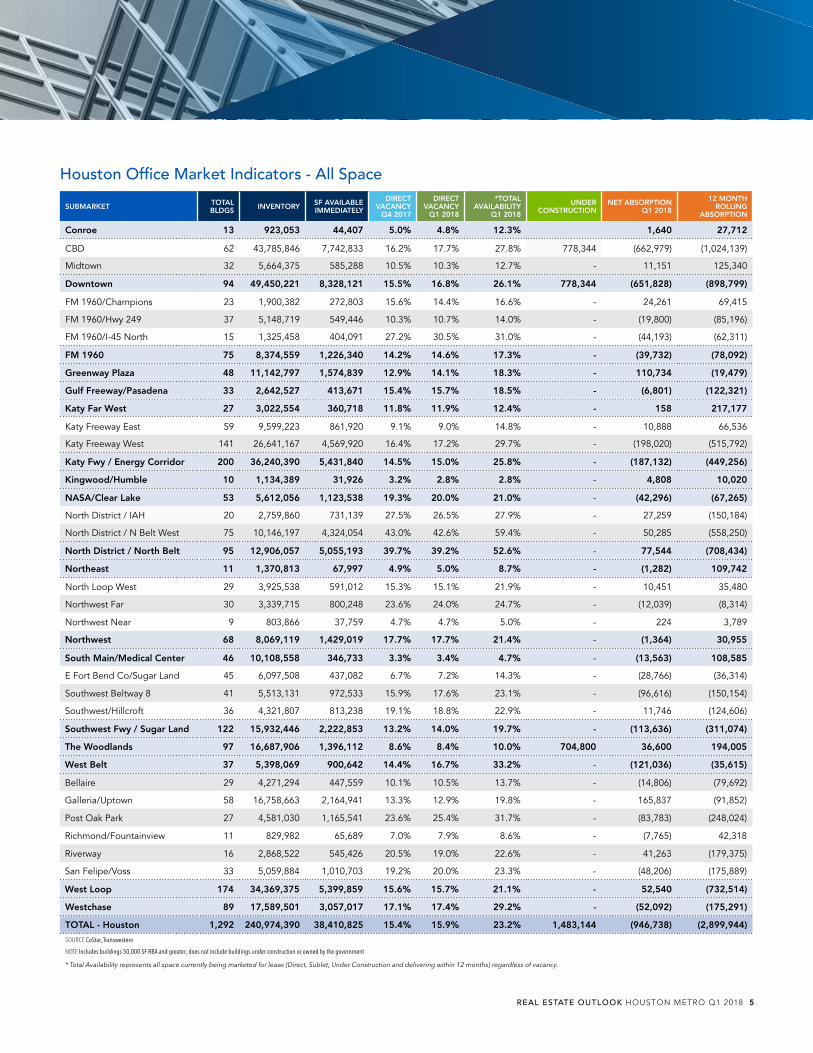
Houston Office Market Indicators - All Space
SUBMARKET TOTAL BLDGS INVENTORY SF AVAILABLE
IMMEDIATELY
DIRECT VACANCY
Q4 2017
DIRECT VACANCY
Q1 2018
*TOTAL AVAILABILITY
Q1 2018
UNDER CONSTRUCTION
NET ABSORPTION Q1 2018
12 MONTH ROLLING
ABSORPTION
Conroe 13 923,053 44,407 5.0% 4.8% 12.3% 1,640 27,712
CBD 62 43,785,846 7,742,833 16.2% 17.7% 27.8% 778,344 (662,979) (1,024,139)
Midtown 32 5,664,375 585,288 10.5% 10.3% 12.7% - 11,151 125,340
Downtown 94 49,450,221 8,328,121 15.5% 16.8% 26.1% 778,344 (651,828) (898,799)
FM 1960/Champions 23 1,900,382 272,803 15.6% 14.4% 16.6% - 24,261 69,415
FM 1960/Hwy 249 37 5,148,719 549,446 10.3% 10.7% 14.0% - (19,800) (85,196)
FM 1960/I-45 North 15 1,325,458 404,091 27.2% 30.5% 31.0% - (44,193) (62,311)
FM 1960 75 8,374,559 1,226,340 14.2% 14.6% 17.3% - (39,732) (78,092)
Greenway Plaza 48 11,142,797 1,574,839 12.9% 14.1% 18.3% - 110,734 (19,479)
Gulf Freeway/Pasadena 33 2,642,527 413,671 15.4% 15.7% 18.5% - (6,801) (122,321)
Katy Far West 27 3,022,554 360,718 11.8% 11.9% 12.4% - 158 217,177
Katy Freeway East 59 9,599,223 861,920 9.1% 9.0% 14.8% - 10,888 66,536
Katy Freeway West 141 26,641,167 4,569,920 16.4% 17.2% 29.7% - (198,020) (515,792)
Katy Fwy / Energy Corridor 200 36,240,390 5,431,840 14.5% 15.0% 25.8% - (187,132) (449,256)
Kingwood/Humble 10 1,134,389 31,926 3.2% 2.8% 2.8% - 4,808 10,020
NASA/Clear Lake 53 5,612,056 1,123,538 19.3% 20.0% 21.0% - (42,296) (67,265)
North District / IAH 20 2,759,860 731,139 27.5% 26.5% 27.9% - 27,259 (150,184)
North District / N Belt West 75 10,146,197 4,324,054 43.0% 42.6% 59.4% - 50,285 (558,250)
North District / North Belt 95 12,906,057 5,055,193 39.7% 39.2% 52.6% - 77,544 (708,434)
Northeast 11 1,370,813 67,997 4.9% 5.0% 8.7% - (1,282) 109,742
North Loop West 29 3,925,538 591,012 15.3% 15.1% 21.9% - 10,451 35,480
Northwest Far 30 3,339,715 800,248 23.6% 24.0% 24.7% - (12,039) (8,314)
Northwest Near 9 803,866 37,759 4.7% 4.7% 5.0% - 224 3,789
Northwest 68 8,069,119 1,429,019 17.7% 17.7% 21.4% - (1,364) 30,955
South Main/Medical Center 46 10,108,558 346,733 3.3% 3.4% 4.7% - (13,563) 108,585
E Fort Bend Co/Sugar Land 45 6,097,508 437,082 6.7% 7.2% 14.3% - (28,766) (36,314)
Southwest Beltway 8 41 5,513,131 972,533 15.9% 17.6% 23.1% - (96,616) (150,154)
Southwest/Hillcroft 36 4,321,807 813,238 19.1% 18.8% 22.9% - 11,746 (124,606)
Southwest Fwy / Sugar Land 122 15,932,446 2,222,853 13.2% 14.0% 19.7% - (113,636) (311,074)
The Woodlands 97 16,687,906 1,396,112 8.6% 8.4% 10.0% 704,800 36,600 194,005
West Belt 37 5,398,069 900,642 14.4% 16.7% 33.2% - (121,036) (35,615)
Bellaire 29 4,271,294 447,559 10.1% 10.5% 13.7% - (14,806) (79,692)
Galleria/Uptown 58 16,758,663 2,164,941 13.3% 12.9% 19.8% - 165,837 (91,852)
Post Oak Park 27 4,581,030 1,165,541 23.6% 25.4% 31.7% - (83,783) (248,024)
Richmond/Fountainview 11 829,982 65,689 7.0% 7.9% 8.6% - (7,765) 42,318
Riverway 16 2,868,522 545,426 20.5% 19.0% 22.6% - 41,263 (179,375)
San Felipe/Voss 33 5,059,884 1,010,703 19.2% 20.0% 23.3% - (48,206) (175,889)
West Loop 174 34,369,375 5,399,859 15.6% 15.7% 21.1% - 52,540 (732,514)
Westchase 89 17,589,501 3,057,017 17.1% 17.4% 29.2% - (52,092) (175,291)
TOTAL - Houston 1,292 240,974,390 38,410,825 15.4% 15.9% 23.2% 1,483,144 (946,738) (2,899,944)
SOURCE CoStar, Transwestern
NOTE Includes buildings 50,000 SF RBA and greater; does not include buildings under construction or owned by the government
* Total Availability represents all space currently being marketed for lease (Direct, Sublet, Under Construction and delivering within 12 months) regardless of vacancy.
REAL ESTATE OUTLOOK HOUSTON METRO Q1 2018 5
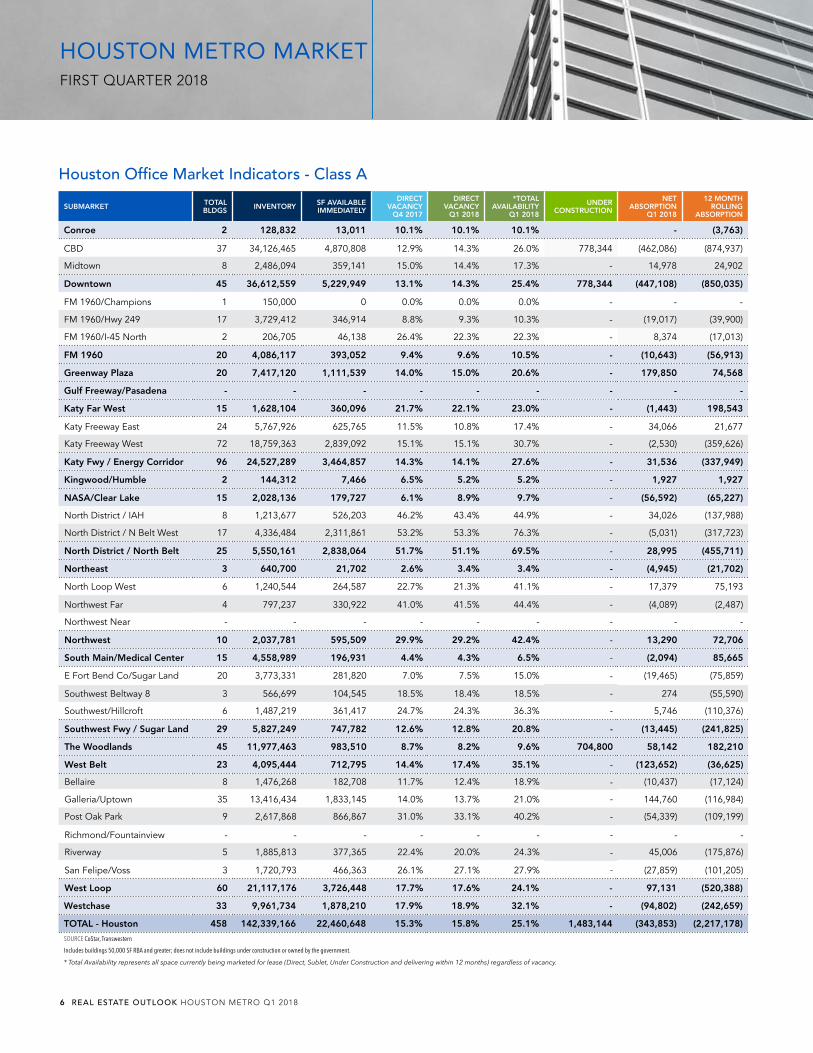
Houston Office Market Indicators - Class A
SUBMARKET TOTAL BLDGS INVENTORY SF AVAILABLE
IMMEDIATELY
DIRECT VACANCY
Q4 2017
DIRECT VACANCY
Q1 2018
*TOTAL AVAILABILITY
Q1 2018
UNDER CONSTRUCTION
NET ABSORPTION
Q1 2018
12 MONTH ROLLING
ABSORPTION
Conroe 2 128,832 13,011 10.1% 10.1% 10.1% - (3,763)
CBD 37 34,126,465 4,870,808 12.9% 14.3% 26.0% 778,344 (462,086) (874,937)
Midtown 8 2,486,094 359,141 15.0% 14.4% 17.3% - 14,978 24,902
Downtown 45 36,612,559 5,229,949 13.1% 14.3% 25.4% 778,344 (447,108) (850,035)
FM 1960/Champions 1 150,000 0 0.0% 0.0% 0.0% - - -
FM 1960/Hwy 249 17 3,729,412 346,914 8.8% 9.3% 10.3% - (19,017) (39,900)
FM 1960/I-45 North 2 206,705 46,138 26.4% 22.3% 22.3% - 8,374 (17,013)
FM 1960 20 4,086,117 393,052 9.4% 9.6% 10.5% - (10,643) (56,913)
Greenway Plaza 20 7,417,120 1,111,539 14.0% 15.0% 20.6% - 179,850 74,568
Gulf Freeway/Pasadena - - - - - - - - -
Katy Far West 15 1,628,104 360,096 21.7% 22.1% 23.0% - (1,443) 198,543
Katy Freeway East 24 5,767,926 625,765 11.5% 10.8% 17.4% - 34,066 21,677
Katy Freeway West 72 18,759,363 2,839,092 15.1% 15.1% 30.7% - (2,530) (359,626)
Katy Fwy / Energy Corridor 96 24,527,289 3,464,857 14.3% 14.1% 27.6% - 31,536 (337,949)
Kingwood/Humble 2 144,312 7,466 6.5% 5.2% 5.2% - 1,927 1,927
NASA/Clear Lake 15 2,028,136 179,727 6.1% 8.9% 9.7% - (56,592) (65,227)
North District / IAH 8 1,213,677 526,203 46.2% 43.4% 44.9% - 34,026 (137,988)
North District / N Belt West 17 4,336,484 2,311,861 53.2% 53.3% 76.3% - (5,031) (317,723)
North District / North Belt 25 5,550,161 2,838,064 51.7% 51.1% 69.5% - 28,995 (455,711)
Northeast 3 640,700 21,702 2.6% 3.4% 3.4% - (4,945) (21,702)
North Loop West 6 1,240,544 264,587 22.7% 21.3% 41.1% - 17,379 75,193
Northwest Far 4 797,237 330,922 41.0% 41.5% 44.4% - (4,089) (2,487)
Northwest Near - - - - - - - - -
Northwest 10 2,037,781 595,509 29.9% 29.2% 42.4% - 13,290 72,706
South Main/Medical Center 15 4,558,989 196,931 4.4% 4.3% 6.5% - (2,094) 85,665
E Fort Bend Co/Sugar Land 20 3,773,331 281,820 7.0% 7.5% 15.0% - (19,465) (75,859)
Southwest Beltway 8 3 566,699 104,545 18.5% 18.4% 18.5% - 274 (55,590)
Southwest/Hillcroft 6 1,487,219 361,417 24.7% 24.3% 36.3% - 5,746 (110,376)
Southwest Fwy / Sugar Land 29 5,827,249 747,782 12.6% 12.8% 20.8% - (13,445) (241,825)
The Woodlands 45 11,977,463 983,510 8.7% 8.2% 9.6% 704,800 58,142 182,210
West Belt 23 4,095,444 712,795 14.4% 17.4% 35.1% - (123,652) (36,625)
Bellaire 8 1,476,268 182,708 11.7% 12.4% 18.9% - (10,437) (17,124)
Galleria/Uptown 35 13,416,434 1,833,145 14.0% 13.7% 21.0% - 144,760 (116,984)
Post Oak Park 9 2,617,868 866,867 31.0% 33.1% 40.2% - (54,339) (109,199)
Richmond/Fountainview - - - - - - - - -
Riverway 5 1,885,813 377,365 22.4% 20.0% 24.3% - 45,006 (175,876)
San Felipe/Voss 3 1,720,793 466,363 26.1% 27.1% 27.9% - (27,859) (101,205)
West Loop 60 21,117,176 3,726,448 17.7% 17.6% 24.1% - 97,131 (520,388)
Westchase 33 9,961,734 1,878,210 17.9% 18.9% 32.1% - (94,802) (242,659)
TOTAL - Houston 458 142,339,166 22,460,648 15.3% 15.8% 25.1% 1,483,144 (343,853) (2,217,178)
SOURCE CoStar, Transwestern
Includes buildings 50,000 SF RBA and greater; does not include buildings under construction or owned by the government.
* Total Availability represents all space currently being marketed for lease (Direct, Sublet, Under Construction and delivering within 12 months) regardless of vacancy.
6 REAL ESTATE OUTLOOK HOUSTON METRO Q1 2018
HOUSTON METRO MARKETFIRST QUARTER 2018

SOURCE CoStar, Transwestern
NOTE Includes buildings 50,000 SF RBA and greater; does not include buildings under construction or owned by the government
Houston Office Market Indicators - Class B
SUBMARKET TOTAL BLDGS INVENTORY SF AVAILABLE
IMMEDIATELY
DIRECT VACANCY
Q4 2017
DIRECT VACANCY
Q1 2018
*TOTAL AVAILABILITY
Q1 2018
UNDER CONSTRUCTION
NET ABSORPTION
Q1 2018
12 MONTH ROLLING
ABSORPTION
Conroe 10 691,631 31,396 4.8% 4.5% 14.5% - 1,640 31,475
CBD 23 9,439,327 2,848,868 28.1% 30.2% 34.9% - (200,893) (140,691)
Midtown 20 2,955,580 171,730 5.6% 5.8% 7.9% - (5,723) 98,542
Downtown 43 12,394,907 3,020,598 22.7% 24.4% 28.5% - (206,616) (42,149)
FM 1960/Champions 20 1,630,186 261,022 17.6% 16.0% 18.6% - 26,102 74,856
FM 1960/Hwy 249 18 1,315,795 194,108 15.1% 14.8% 24.4% - 3,941 (49,924)
FM 1960/I-45 North 11 968,736 309,159 26.2% 31.9% 32.7% - (55,002) (50,569)
FM 1960 49 3,914,717 764,289 18.9% 19.5% 24.0% - (24,959) (25,637)
Greenway Plaza 26 3,585,380 414,933 9.6% 11.6% 12.9% - (68,150) (96,368)
Gulf Freeway/Pasadena 27 2,179,493 326,023 14.9% 15.0% 18.4% - (846) (123,694)
Katy Far West 11 1,275,188 622 0.2% 0.0% 0.0% - 1,601 18,634
Katy Freeway East 26 2,879,196 214,088 6.7% 7.4% 13.6% - (20,742) 44,940
Katy Freeway West 66 7,640,290 1,689,943 20.0% 22.1% 27.4% - (161,382) (122,058)
Katy Fwy / Energy Corridor 92 10,519,486 1,904,031 16.4% 18.1% 23.6% - (182,124) (77,118)
Kingwood/Humble 8 990,077 24,460 2.8% 2.5% 2.5% - 2,881 8,093
NASA/Clear Lake 37 3,530,902 943,811 27.1% 26.7% 27.8% - 14,296 (2,038)
North District / IAH 11 1,493,858 204,936 13.3% 13.7% 15.0% - (6,767) (12,196)
North District / N Belt West 46 4,792,893 1,777,572 37.9% 37.1% 51.6% - 48,001 (231,104)
North District / North Belt 57 6,286,751 1,982,508 32.1% 31.5% 42.9% - 41,234 (243,300)
Northeast 6 554,309 41,327 8.1% 7.5% 11.1% - 3,663 136,412
North Loop West 21 2,566,873 323,912 12.3% 12.6% 13.5% - (9,363) (52,640)
Northwest Far 23 2,295,051 469,326 20.1% 20.4% 20.6% - (7,950) (5,827)
Northwest Near 7 623,533 37,759 6.1% 6.1% 6.4% - 224 (16,107)
Northwest 51 5,485,457 830,997 14.8% 15.1% 15.7% - (17,089) (74,574)
South Main/Medical Center 19 4,020,231 111,644 2.6% 2.8% 3.6% - (8,861) 7,279
E Fort Bend Co/Sugar Land 24 2,250,177 155,262 6.5% 6.9% 13.7% - (9,301) 39,545
Southwest Beltway 8 33 4,588,548 829,896 16.0% 18.1% 24.6% - (97,831) (73,374)
Southwest/Hillcroft 19 1,794,770 346,554 20.8% 19.3% 18.5% - 26,763 18,436
Southwest Fwy / Sugar Land 76 8,633,495 1,331,712 14.5% 15.4% 20.5% - (80,369) (15,393)
The Woodlands 50 4,429,758 412,602 8.8% 9.3% 11.9% - (21,542) 11,795
West Belt 14 1,302,625 187,847 14.6% 14.4% 27.2% - 2,616 1,010
Bellaire 17 2,411,520 231,774 9.5% 9.6% 11.4% - (2,799) (68,757)
Galleria/Uptown 22 3,266,437 331,796 10.8% 10.2% 15.2% - 21,077 25,132
Post Oak Park 16 1,803,120 298,674 14.9% 16.6% 22.1% - (29,444) (138,825)
Richmond/Fountainview 7 570,270 61,715 9.3% 10.8% 11.8% - (8,647) 20,316
Riverway 9 870,153 168,061 18.8% 19.3% 22.0% - (4,543) (7,711)
San Felipe/Voss 30 3,339,091 544,340 15.7% 16.3% 21.0% - (20,347) (74,684)
West Loop 101 12,260,591 1,636,360 13.0% 13.3% 17.4% - (44,703) (244,529)
Westchase 52 7,133,914 1,152,271 16.7% 16.2% 26.6% - 37,922 68,342
TOTAL - Houston 729 89,188,912 15,117,431 16.3% 16.9% 21.7% - (549,406) (661,760)
* Total Availability represents all space currently being marketed for lease (Direct, Sublet, Under Construction and delivering within 12 months) regardless of vacancy.
REAL ESTATE OUTLOOK HOUSTON METRO Q1 2018 7

Copyright © 2018 Transwestern. All rights reserved. No part of this work may be reproduced or distributed to third parties without written permission of the copyright owner. The information contained in this report was gathered by Transwestern from various primary and secondary sources believed to be reliable. Transwestern, however, makes no representation concerning the accuracy or completeness of such information and expressly disclaims any responsibility for any inaccuracy contained herein.
METHODOLOGY
The information in this report is the result of a compilation of information on office, industrial, retail, multifamily and healthcare properties
located in the Houston metropolitan area. This report includes single-tenant, multi-tenant and owner-user properties and excludes properties
owned and occupied by a government agency.
CONTACT
Stuart ShowersDirector of [email protected]
Rachel HornbeakResearch [email protected]
Jennifer Woodruff Research [email protected]
SUBMARKET Q1 2017 CLASS B
% CHANGE Y-O-Y
CLASS B
Q4 2017 CLASS B
% CHANGE OVER
QUARTER CLASS B
Q1 2018 CLASS B
Q1 2017 CLASS A
% CHANGE Y-O-Y
CLASS A
Q4 2017 CLASS A
% CHANGE OVER
QUARTER CLASS A
Q1 2018 CLASS A
Conroe $24.33 -9.1% $21.92 0.9% $22.11 $31.05 0.1% $31.09 0.0% $31.09
CBD $30.53 -3.4% $30.25 -2.5% $29.50 $44.20 1.0% $44.72 -0.2% $44.64
Midtown $33.25 -3.9% $32.26 -0.9% $31.95 $34.79 -0.1% $34.49 0.8% $34.76
Downtown $30.97 -3.8% $30.46 -2.2% $29.80 $43.32 1.7% $43.90 0.4% $44.07
FM 1960/Champions $13.77 8.4% $14.95 -0.2% $14.92 - - - - -
FM 1960/Hwy 249 $20.24 -2.8% $19.74 -0.3% $19.68 $27.98 0.0% $27.77 0.7% $27.98
FM 1960/I-45 North $18.02 2.3% $18.36 0.4% $18.43 $23.69 5.2% $25.00 0.0% $25.00
FM 1960 $17.12 3.5% $17.66 0.3% $17.71 $27.34 0.9% $27.33 1.0% $27.59
Greenway Plaza $26.05 2.3% $26.76 -0.4% $26.65 $37.78 4.9% $37.42 5.8% $39.60
Gulf Freeway/Pasadena $21.91 3.4% $21.89 3.5% $22.66 - - - - -
Katy Far West - - - - - $29.27 -1.5% $28.82 0.0% $28.83
Katy Freeway East $27.32 -3.8% $26.26 0.1% $26.29 $41.01 -0.6% $41.42 -1.6% $40.77
Katy Freeway West $23.79 -4.7% $23.11 -1.8% $22.69 $38.01 -3.9% $36.68 -0.3% $36.56
Katy Fwy / Energy Corridor $24.28 -5.1% $23.44 -1.7% $23.04 $38.45 -3.0% $37.51 -0.5% $37.33
Kingwood/Humble $23.41 2.5% $23.25 3.2% $23.99 $31.94 -0.4% $31.82 0.0% $31.82
NASA/Clear Lake $17.86 4.4% $18.41 1.2% $18.64 $24.43 0.0% $24.49 -0.2% $24.44
North District / IAH $16.59 -10.5% $15.51 -4.3% $14.84 $21.34 5.5% $22.51 0.3% $22.58
North District / N Belt West $17.42 -9.7% $15.54 1.3% $15.74 $26.43 -7.2% $24.72 -0.3% $24.65
North District / North Belt $17.34 -9.8% $15.53 0.7% $15.64 $25.36 -4.4% $24.33 -0.2% $24.29
Northeast $22.71 0.0% $22.71 0.0% $22.71 - - - - -
North Loop West $23.16 -3.7% $21.94 1.6% $22.29 $26.48 0.2% $26.56 -0.1% $26.54
Northwest Far $15.90 -3.0% $15.19 1.6% $15.43 $18.89 3.5% $19.54 0.2% $19.58
Northwest Near $18.13 9.0% $19.72 0.2% $19.76 - - - - -
Northwest $18.81 -2.4% $17.98 2.1% $18.36 $22.84 3.2% $23.83 -1.0% $23.59
South Main/Medical Center $23.06 7.2% $23.50 5.2% $24.71 $34.28 -0.9% $33.59 1.1% $33.97
E Fort Bend Co/Sugar Land $22.37 8.6% $23.41 3.8% $24.30 $31.81 0.8% $31.88 0.6% $32.08
Southwest Beltway 8 $18.33 0.6% $18.54 -0.5% $18.44 $21.14 -0.2% $20.93 0.8% $21.10
Southwest/Hillcroft $17.66 -6.4% $16.72 -1.1% $16.54 $19.57 1.6% $19.73 0.8% $19.89
Southwest Fwy / Sugar Land $18.82 -0.6% $18.60 0.6% $18.70 $23.90 1.5% $24.01 1.0% $24.25
The Woodlands $25.55 1.6% $25.90 0.2% $25.96 $35.23 0.2% $35.27 0.1% $35.31
West Belt $21.62 13.7% $24.58 0.0% $24.57 $32.29 3.0% $33.38 -0.2% $33.29
Bellaire $23.41 2.9% $24.12 -0.1% $24.10 $27.61 1.6% $27.81 0.9% $28.04
Galleria/Uptown $28.81 0.0% $28.66 0.5% $28.82 $39.33 -0.4% $39.59 -1.0% $39.19
Post Oak Park $27.37 -9.3% $24.99 -0.7% $24.82 $40.11 -9.8% $36.64 -0.3% $36.52
Richmond/Fountainview $19.25 0.3% $19.51 -1.1% $19.30 - - - - -
Riverway $26.42 -3.0% $25.65 -0.1% $25.63 $33.10 0.4% $33.13 0.3% $33.25
San Felipe/Voss $24.96 4.2% $25.79 0.9% $26.02 $36.38 -0.7% $35.82 0.8% $36.11
West Loop $25.84 -0.1% $25.77 0.2% $25.82 $37.80 -1.8% $37.35 -0.6% $37.12
Westchase $18.45 9.6% $19.85 1.9% $20.23 $37.29 -3.2% $36.12 0.0% $36.12
TOTAL - Houston $22.03 -1.0% $21.74 0.3% $21.81 $36.05 0.6% $35.85 1.1% $36.26
Houston Office Market Indicators - Asking Rental Rates

OVERVIEW
Availability Continues to Decline as Co-Working Rises The Houston office market ended 2017 on a strong note, as total availability declined for the second straight quarter, the investment market remained hot, and WTI crude prices settled above $60 per barrel. Despite absorption remaining negative for the fourth quarter, citywide availability declined by 0.5%, ending the year at 22.8%. This change was largely attributable to the reduction in sublease supply (-900k square feet) as tenants Motiva (Saudi Aramco), Stewart Title, Empyrean Benefits Solutions, and several others opted for sublease alternatives. At the end of the year, sublease space totaled 8.9 M SF with 1.3 M SF set to expire over the next 12 months. Late year activity also saw the rise of co-working space throughout the market. Several providers such as WeWork, Spaces, The Cannon and The Work Lodge announced or opened locations, pushing co-working space totals past 500k SF with both urban and suburban alternatives. The quick expansion of co-working space has both providers and landlords taking notice. In December, Brookfield Properties and Onex made an indicative proposal on IGW, the holding company of Regus and Spaces, as Brookfield Asset Management looks to gain a foothold in the co-working market. Additionally, Servcorp, announced that they will pivot into a co-working strategy in order to capitalize on the trend.
NET ABSORPTION
Quarterly Absorption Flat After Down YearCumulative annual absorption totals of negative 3.9 million square feet highlight the delayed impacts of the energy downturn. However, the
HOUSTON OFFICE MARKETYEAR-END 2017
REAL ESTATE OUTLOOK
Office Market Signals RecoveryThe Rise of Co-Working in Houston
NET ABSORPTION AND VACANCY RATE TRENDS HOUSTON METRO AREA
CONTIGUOUS BLOCKS OF AVAILABLE SPACE HOUSTON METRO
SOURCE CoStar, Transwestern *Through Q4 2017
SOURCE CoStar, Transwestern *Through Q4 2017
Note: Delivery of preleased space counts as positive net absorption
Notable Q4 LeasesTENANT SF LEASE TYPE BUILDING SUBMARKET
Motiva (Saudi Aramco) 173,000 Sublease Two Allen Center CBD
Stewart Title 156,151 Sublease 1360 Post Oak Galleria/Uptown
Empyrean Benefits* 106,904 Sublease 3010 Briarpark Dr Westchase
Talos Energy 98,000 Relocation/Expansion Three Allen Center CBD
TransCanada 82,916 Expansion Bank of America Center CBD
-4000-3000-2000-1000
010002000300040005000600070008000
Net Absorption
171615141312111009080706 5%
10%
15%
20%
25%Total AvailabilityDirect Vacancy
0
50
100
150
200Class A SubletClass A Direct
200,000 SF100,000 SF50,000 SF25,000 SF
Class B SubletClass B Direct
* Empyrean leveraged sublease alternative with minimal remaining term to execute direct deal.

fourth quarter saw negative absorption of only 51,628 SF. This represents a marked improved over the recent quarter totals of -2.1M SF (1Q 2017), -1.1 M SF (2Q 2017), and -0.6 M SF (3Q 2017). Class A absorption for the fourth quarter totaled -86,067 SF, bringing the 2017 annual absorption for the property class to -3.1 M SF. Class B absorption for the fourth quarter was positive 82,959 SF with Class B annual absorption totaling negative 791,000 SF.
DIRECT VACANCY & TOTAL AVAIL ABILIT Y
Total Availability Declines, Vacancy IncreasesThe overall office availability rate (all space marketed as available for lease, both direct and sublet) decreased 0.5% over the quarter, ending the year at 22.8%. The fourth quarter saw several tenants (Stewart Title, Empyrean Benefits Solutions and Saudi Aramco) opt to leverage sublease alternatives. In total, sublease supply decreased by 894,000 SF over the quarter. Class A availability finished the year at 24.0%, down by 0.4% over the quarter. Class B availability decreased by 0.7% over the period, ending the year at 22.2%.
While decreases in sublease space triggered declines in availability, vacancy continued to rise over the quarter. Overall direct vacancy ended 2017 at 15.5%, increasing by 1.7% year-over-year. Class A direct vacancy ended the year at 15.2%, up 2.1% annually and 0.1% over the quarter. Class B direct vacancy increased by 1.1% year-over-year, ending 2017 at 16.7%. With 1.3 million SF of sublease space set to expire over the next 12 months, direct vacancy is anticipated to continue increasing through the first half of 2018. This is especially pronounced in the North Houston District where 868,845 SF is set to expire by end of year 2018.
RENTAL R ATES
Asking Rates Level OffOverall asking rates for the Houston metro area decreased marginally over the quarter, finishing 2017 at $30.59 PSF full service. Class A rates declined by 1.9% over the year, closing at $35.83 PSF full service, while Class B asking rates declined by 4.0%, ending at $21.78 PSF full service. Though there are signs of improvement, the market remains firmly in the tenants favor with credit grade tenants able to attain generous concession packages. The submarkets with the highest gross asking rents are the Central Business District (Class A - $45.17 PSF), the Katy Fwy East (Class A, $42.41 PSF), and Galleria/Uptown (Class A - $39.26 PSF).
SUPPLY AND DEVELOPMENT
Construction Pipeline After the delivery of 33.0M SF over the past seven years, construction activity has slowed greatly. Considering the number of large blocks and total space available for lease, developers are wary of additional speculative construction. Still, as tenants strive to retain talent and attain efficiency both in their space footprint as well as their operating expenses, the potential for additional construction tethered to a lead tenant or build-to-suit remains in play. At year end, the Houston area
Office Under ConstructionHouston Metro | Q4 2017
SUBMARKET NUMBER OF BLDGS SF % PRE-
LEASED
CBD 1 778,344 32%
Woodlands 3 704,800 97%
South 2 300,000 7%
West Loop 1 104,579 70%
Kingwood 1 100,000 0%
FM 1960 1 73,000 100%
Katy 1 72,045 51%
Total 7 2,032,768 67%
AVERAGE OFFICE RENTS HOUSTON METRO AREA
SOURCE CoStar, Transwestern *Through Q4 2017 Note: All classes of office space
Total Available SpaceHouston Metro | Q4 2017
SUBMARKETSUBLEASE SPACE (SF)
% OF SUPPLY
% TOTAL AVAILABLE
CBD 2,067,450 4.7% 18.4%
Katy Fwy West 1,924,169 7.2% 26.3%
Westchase 1,445,315 8.2% 28.0%
West Loop 932,700 2.7% 12.8%
N Houston District 905,617 7.0% 14.2%
All of Houston 8,935,719 3.7% 16.2%
$15
$20
$25
$30
$35
$40Class BClass AOverall
171615141312111009080706
2 REAL ESTATE OUTLOOK HOUSTON METRO Q4 2017
HOUSTON METRO MARKETYEAR-END 2017

construction pipeline totaled 2.1 M SF with 33.0% available for lease. Houston's largest office developments currently under construction are Capitol Tower (CBD, 778,000 SF - 27% leased to Bank of America), CityPlace 2 (The Woodlands, 326,000 SF - 100% Leased to ABS) and HP's Build-to-Suit Campus (The Woodlands, two-189,000 SF buildings). Notable fourth quarter deliveries include The Kirby Collection, a mixed-use project with a significant office component (Greenway Plaza, 188,547 SF, 21% leased) and Members Choice Credit Union (Katy Fwy West, 86,265 SF, 62% leased).
INVESTMENT MARKET
Investments Rebound Sharply Over 2017 Houston investment activity rebounded sharply in 2017, as annual sales totaled $3.8 billion, marking the highest total since registering $4.6 billion in 2013. Regardless of elevated vacancy figures, the strength in the underlying fundamentals of the market have investors buying into Houston's future. Of particular interest to investors are well located urban infill properties with upside available through renovation and lobby/service activation. Notable properties that traded over the course of 2017 include Greenway Plaza (4.9 M SF, $210 PSF), Houston Center (4.2 M SF, $218 PSF) and Greenspoint Place (2.0 M SF, undisclosed).
Sales for the quarter totaled $1.3 billion, bolstered by the closing of Houston Center, as Brookfield Properties officially acquired the 4.2 M SF Class A property portfolio for $875 million. The fourth quarter saw another iconic property trade hands, as M-M Properties and Baupost Group were reported as having acquired Marathon Oil Tower, a 41-story 1.2 M SF Class A office building for $175.0 M from CBRE Global Investors. These figures represent assets for which pricing information could be obtained.
COMPARATIVE OFFICE INVESTMENT SALES VOLUME SELECT METRO AREAS
SOURCE Real Capital Analytics, Transwestern ,*Through Q4 2017
AVERAGE OFFICE SALE PRICE HOUSTON METRO AREA
SOURCE Real Capital Analytics, Transwestern,*Through Q4 2017
Notable Q4 TransactionsBUILDING SUBMARKET SF SALE PRICE SELLER BUYER
Marathon Oil Tower Galleria/Uptown 1,197,300 $175.0 million CBRE Global Investors M-M Properties/Baupost Group
Westchase Park Plaza Westchase 232,108 $24.0 million Parmenter Realty Partners Hertz Group
Nitya Tower (FKA Norfolk Tower) Greenway Plaza 207,562 Undisclosed TA Realty Nitya
5757 Woodway San Felipe/Voss 162,888 Undisclosed Fuller Realty Braun Enterprises/ Harbert Mgmt
SOURCE Real Capital Analytics, HFF, Transwestern
Sales
Volu
me i
n Billi
ons
$0
$1
$2
$3
$4
$5
$6
$7
$8HoustonDenverDallasAtlanta
17*1615141312111009080706
$0
$50
$100
$150
$200
$250 Average Sale Price Per SF
171615141312111009080706
REAL ESTATE OUTLOOK HOUSTON METRO Q4 2017 3
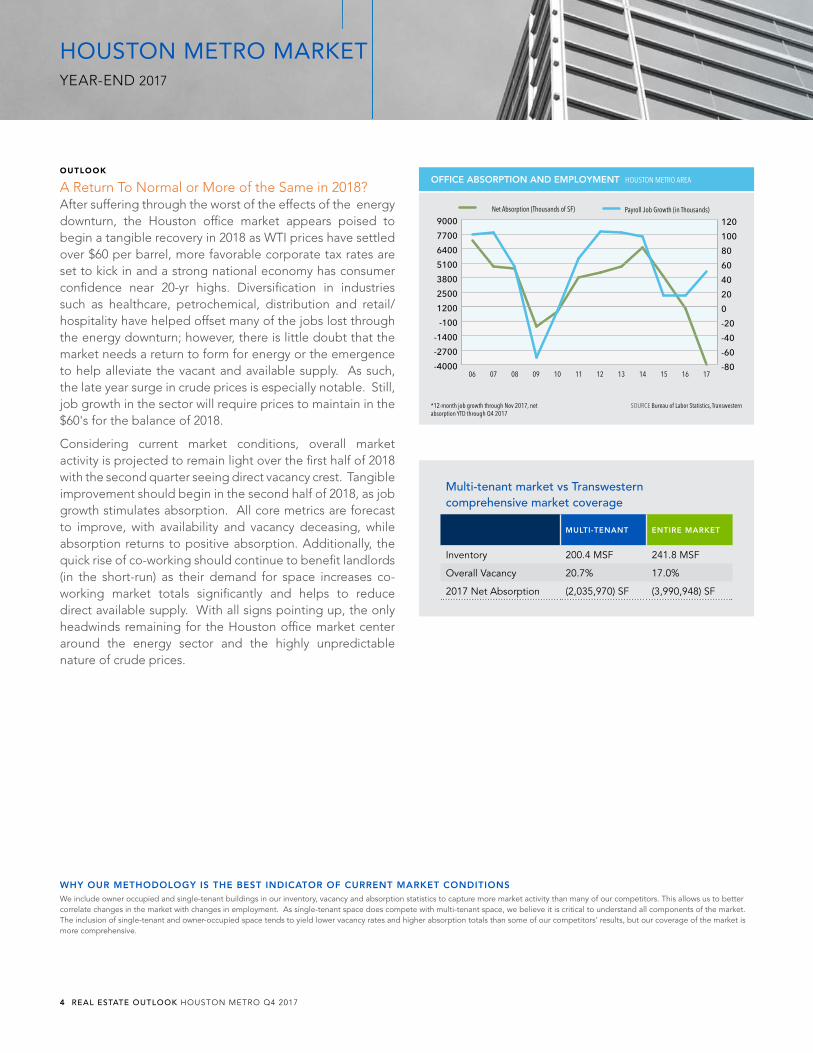
OUTLOOK
A Return To Normal or More of the Same in 2018?After suffering through the worst of the effects of the energy downturn, the Houston office market appears poised to begin a tangible recovery in 2018 as WTI prices have settled over $60 per barrel, more favorable corporate tax rates are set to kick in and a strong national economy has consumer confidence near 20-yr highs. Diversification in industries such as healthcare, petrochemical, distribution and retail/hospitality have helped offset many of the jobs lost through the energy downturn; however, there is little doubt that the market needs a return to form for energy or the emergence to help alleviate the vacant and available supply. As such, the late year surge in crude prices is especially notable. Still, job growth in the sector will require prices to maintain in the $60's for the balance of 2018.
Considering current market conditions, overall market activity is projected to remain light over the first half of 2018 with the second quarter seeing direct vacancy crest. Tangible improvement should begin in the second half of 2018, as job growth stimulates absorption. All core metrics are forecast to improve, with availability and vacancy deceasing, while absorption returns to positive absorption. Additionally, the quick rise of co-working should continue to benefit landlords (in the short-run) as their demand for space increases co-working market totals significantly and helps to reduce direct available supply. With all signs pointing up, the only headwinds remaining for the Houston office market center around the energy sector and the highly unpredictable nature of crude prices.
Multi-tenant market vs Transwestern comprehensive market coverage
MULTI-TENANT ENTIRE MARKET
Inventory 200.4 MSF 241.8 MSF
Overall Vacancy 20.7% 17.0%
2017 Net Absorption (2,035,970) SF (3,990,948) SF
WHY OUR METHODOLOGY IS THE BEST INDICATOR OF CURRENT MARKET CONDITIONSWe include owner occupied and single-tenant buildings in our inventory, vacancy and absorption statistics to capture more market activity than many of our competitors. This allows us to better correlate changes in the market with changes in employment. As single-tenant space does compete with multi-tenant space, we believe it is critical to understand all components of the market. The inclusion of single-tenant and owner-occupied space tends to yield lower vacancy rates and higher absorption totals than some of our competitors’ results, but our coverage of the market is more comprehensive.
OFFICE ABSORPTION AND EMPLOYMENT HOUSTON METRO AREA
SOURCE Bureau of Labor Statistics, Transwestern *12-month job growth through Nov 2017, net absorption YTD through Q4 2017
-4000
-2700
-1400
-100
1200
2500
3800
5100
6400
7700
9000Net Absorption (Thousands of SF)
171615141312111009080706-80
-60
-40
-20
0
20
40
60
80
100
120Payroll Job Growth (in Thousands)
4 REAL ESTATE OUTLOOK HOUSTON METRO Q4 2017
HOUSTON METRO MARKETYEAR-END 2017

Houston Office Market Indicators - All Space
SUBMARKET TOTAL BLDGS INVENTORY SF AVAILABLE
IMMEDIATELY
DIRECT VACANCY
Q4 2017
VACANCY W/ SUBLET
Q4 2017
TOTAL AVAILABILITY
Q4 2017
UNDER CONSTRUCTION
NET ABSORPTION Q4 2017
NET ABSORPTION YTD 2017
Conroe 13 920,281 46,047 5.0% 5.5% 10.9% 3,851 53,302
Central Business District 62 43,786,269 7,045,527 16.1% 18.2% 25.6% 778,344 (32,095) (1,497,427)
Midtown 32 5,664,375 596,439 10.5% 11.0% 15.2% - 43,141 95,984
Downtown 94 49,450,644 7,641,966 15.5% 17.3% 24.5% 778,344 11,046 (1,401,443)
FM 1960 / Champions 23 1,900,382 311,155 16.4% 16.4% 19.3% - 24,690 26,029
FM 1960 / Highway 249 37 5,148,719 506,126 9.8% 10.1% 14.8% - (22,272) (31,811)
FM 1960 / I-45 North 15 1,325,458 359,898 27.2% 27.4% 33.8% - 2,096 (33,870)
FM 1960 75 8,374,559 1,177,179 14.1% 14.3% 18.8% - 4,514 (39,652)
Greenway Plaza 48 11,095,766 1,435,116 12.9% 13.4% 19.2% 188,547 (21,878) (132,883)
Gulf Freeway/Pasadena 33 2,642,527 406,870 15.4% 15.4% 19.8% - 2,337 18,561
Katy Far West 27 3,022,554 355,537 11.8% 12.2% 16.3% 72,045 72,527 210,342
Katy Freeway East 59 9,593,191 835,819 8.7% 9.5% 15.1% - 108,144 (28,725)
Katy Freeway West 141 26,653,982 4,371,900 16.4% 18.9% 27.5% 86,255 68,590 (506,214)
Katy Frwy / Energy Corridor 200 36,247,173 5,207,719 14.4% 16.4% 24.2% 86,255 176,734 (534,939)
Kingwood / Humble* 11 1,234,389 36,734 3.0% 3.0% 11.1% - (6,544) (3,370)
NASA / Clear Lake 53 5,612,060 1,081,246 19.3% 19.6% 22.4% - (75,664) (105,105)
North District / IAH 20 2,759,860 758,398 27.5% 27.9% 29.7% - 8,687 (168,035)
North District / North Belt W 75 10,164,618 4,374,339 43.0% 45.8% 54.5% - (191,752) (539,042)
North District / North Belt 95 12,924,478 5,132,737 39.7% 41.9% 49.2% - (183,065) (707,077)
Northeast 11 1,370,813 66,715 4.9% 4.9% 8.7% 115,601 134,053 111,024
North Loop West 29 3,925,538 635,231 16.2% 16.2% 25.6% - 8,644 (30,745)
Northwest Near 10 1,041,250 37,983 3.6% 3.6% 3.9% - (9,024) (19,992)
Northwest Far 30 3,339,250 788,209 23.6% 23.9% 26.2% - (48,433) 7,734
Northwest 69 8,306,038 1,461,423 17.6% 17.7% 23.1% - (48,813) (43,003)
South Main / Medical Center 47 10,360,561 643,463 6.2% 6.3% 5.4% - (26,907) (20,467)
E Fort Bend Co / Sugar Land 45 6,097,508 408,316 6.7% 7.9% 11.9% 187,200 49,518 20,664
Southwest Beltway 8 41 5,513,131 875,917 15.9% 16.0% 22.0% 60,000 (61,484) (75,884)
Southwest / Hillcroft 36 4,321,807 781,234 18.1% 18.4% 21.8% - (97,368) (135,444)
Southwest Fwy / Sugar Land 122 15,932,446 2,065,467 13.0% 13.5% 18.1% 247,200 (109,334) (190,664)
The Woodlands 96 16,520,878 1,518,816 9.2% 9.6% 11.3% 515,800 90,461 45,806
West Belt 37 5,398,069 739,318 13.7% 19.5% 32.5% - 55,489 130,767
Bellaire 28 4,298,130 415,853 9.7% 10.0% 14.2% - 13,353 (40,033)
Galleria / Uptown 58 16,760,379 2,226,099 13.3% 15.9% 20.0% 104,579 (32,718) (474,135)
Post Oak Park 27 4,581,030 1,081,758 23.6% 26.0% 31.3% - (55,975) (345,980)
Richmond / Fountainview 11 829,982 140,424 16.9% 16.9% 9.2% - 16,778 45,748
Riverway 16 2,868,522 586,689 20.5% 21.4% 23.6% - 8,196 (248,593)
San Felipe / Voss 33 5,060,157 904,582 17.9% 18.3% 23.1% - 12,586 (79,132)
West Loop 173 34,398,200 5,355,405 15.6% 17.3% 21.3% 104,579 (37,780) (1,142,125)
Westchase 89 17,588,552 3,004,925 17.1% 20.4% 29.3% 187,011 (92,655) (240,022)
TOTAL - Houston 1,293 241,399,988 37,376,683 15.5% 17.0% 22.8% 2,295,382 (51,628) (3,990,948)
SOURCE CoStar, Transwestern
NOTE Includes buildings 50,000 SF RBA and greater; does not include buildings under construction or owned by the government
-
REAL ESTATE OUTLOOK HOUSTON METRO Q4 2017 5

Houston Office Market Indicators - Class A
SUBMARKET TOTAL BLDGS INVENTORY SF AVAILABLE
IMMEDIATELY
DIRECT VACANCY
Q4 2017
VACANCY W/ SUBLET
Q4 2017
TOTAL AVAILABILITY
Q4 2017
UNDER CONSTRUCTION
NET ABSORPTION
Q4 2017
NET ABSORPTION
YTD 2017
Conroe 2 128,832 13,011 10.1% 10.1% 14.3% - (3,763)
Central Business District 37 34,126,465 4,408,722 12.9% 15.3% 23.1% 778,344 (52,539) (1,204,462)
Midtown 8 2,486,094 374,119 15.0% 15.9% 22.7% - 20,663 (2,642)
Downtown 45 36,612,559 4,782,841 13.1% 15.4% 23.1% 778,344 (31,876) (1,207,104)
FM 1960 / Champions 1 150,000 0 0.0% 0.0% 0.0% -
FM 1960 / Highway 249 17 3,729,412 304,377 8.2% 8.3% 10.5% - (8,063) 4,642
FM 1960 / I-45 North 2 206,705 54,512 26.4% 26.4% 26.4% - (25,387)
FM 1960 20 4,086,117 358,889 8.8% 8.9% 10.9% - (8,063) (20,745)
Greenway Plaza 20 7,356,944 1,040,932 14.1% 14.7% 22.6% 188,547 (49,011) (71,427)
Gulf Freeway/Pasadena -
Katy Far West 15 1,628,104 353,314 21.7% 22.6% 29.7% 72,045 72,527 193,309
Katy Freeway East 24 5,761,894 622,842 10.8% 11.8% 17.7% - 34,175 (93,761)
Katy Freeway West 72 18,772,178 2,836,562 15.1% 18.5% 27.5% 86,255 18,490 (272,395)
Katy Frwy / Energy Corridor 96 24,534,072 3,459,404 14.1% 16.9% 25.2% 86,255 52,665 (366,156)
Kingwood / Humble 2 144,312 9,393 6.5% 6.5% 6.5% - (1,927)
NASA / Clear Lake 15 2,028,136 123,135 6.1% 6.9% 11.4% - (20,574) (37,640)
North District / IAH 8 1,213,677 560,229 46.2% 46.2% 47.7% - 3,144 (162,606)
North District / North Belt W 17 4,334,810 2,306,830 53.2% 58.8% 68.9% - (93,801) (241,865)
North District / North Belt 25 5,548,487 2,867,059 51.7% 56.0% 64.2% - (90,657) (404,471)
Northeast 3 640,700 16,757 2.6% 2.6% 2.6% - 15,708 (16,757)
North Loop West 6 1,240,544 281,966 22.7% 22.7% 45.1% - 73,260 44,624
Northwest Near 1 237,384 0 0.0% 0.0% 0.0% - 0
Northwest Far 4 797,237 326,833 41.0% 41.5% 45.2% - (587) 8,922
Northwest 11 2,275,165 608,799 26.8% 26.9% 40.4% - 72,673 53,546
South Main / Medical Center 16 4,810,992 199,524 4.1% 4.3% 7.0% - (19,979) (35,724)
E Fort Bend Co / Sugar Land 20 3,773,331 262,355 7.0% 7.9% 11.1% 94,200 15,402 (34,789)
Southwest Beltway 8 3 566,699 104,819 18.5% 18.5% 18.5% - (21,864) (56,219)
Southwest / Hillcroft 6 1,487,219 323,413 21.7% 22.5% 29.0% - (59,216) (94,964)
Southwest Fwy / Sugar Land 29 5,827,249 690,587 11.9% 12.6% 16.4% 94,200 (65,678) (185,972)
The Woodlands 44 11,788,463 1,127,756 9.6% 10.0% 11.2% 704,800 92,137 59,383
West Belt 23 4,095,444 589,143 14.4% 20.2% 31.5% - 54,361 84,360
Bellaire 8 1,470,637 172,271 11.7% 12.4% 19.8% - (4,637) 13,214
Galleria / Uptown 35 13,417,845 1,873,326 14.0% 17.1% 21.2% 104,579 (47,817) (481,631)
Post Oak Park 9 2,617,868 812,528 31.0% 35.2% 40.1% - (2,057) (261,131)
Richmond / Fountainview -
Riverway 5 1,885,813 422,371 22.4% 23.8% 25.3% - (13,397) (246,622)
San Felipe / Voss 3 1,720,793 380,589 22.1% 22.1% 28.6% - 16,710 8,580
West Loop 60 21,112,956 3,661,085 17.3% 20.0% 24.4% 104,579 (51,198) (967,590)
Westchase 33 9,961,734 1,783,408 17.9% 23.5% 32.4% 187,011 (107,175) (225,435)
TOTAL - Houston 459 142,580,266 21,685,037 15.2% 17.5% 24.0% 2,026,781 (86,067) (3,152,186)
SOURCE CoStar, Transwestern
NOTE Includes buildings 50,000 SF RBA and greater; does not include buildings under construction or owned by the government
6 REAL ESTATE OUTLOOK HOUSTON METRO Q4 2017
HOUSTON METRO MARKETYEAR-END 2017
SOURCE CoStar, Transwestern
NOTE Includes buildings 50,000 SF RBA and greater; does not include buildings under construction or owned by the government
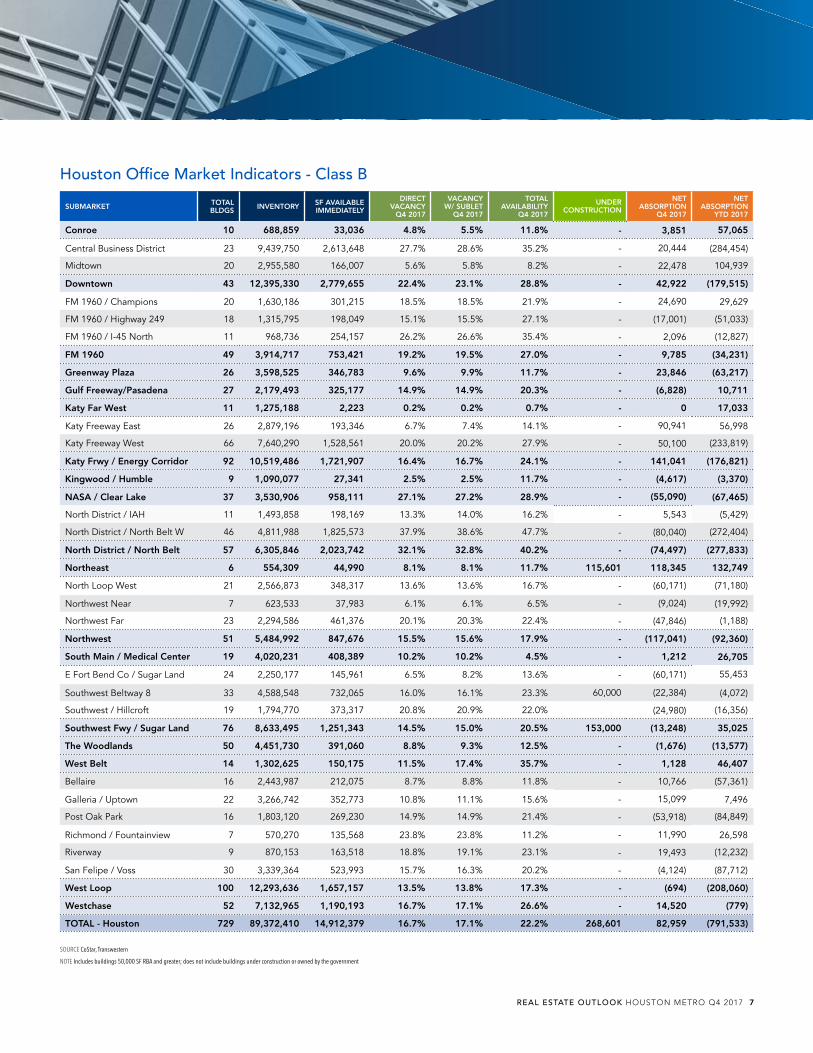
Houston Office Market Indicators - Class B
SUBMARKET TOTAL BLDGS INVENTORY SF AVAILABLE
IMMEDIATELY
DIRECT VACANCY
Q4 2017
VACANCY W/ SUBLET
Q4 2017
TOTAL AVAILABILITY
Q4 2017
UNDER CONSTRUCTION
NET ABSORPTION
Q4 2017
NET ABSORPTION
YTD 2017
Conroe 10 688,859 33,036 4.8% 5.5% 11.8% - 3,851 57,065
Central Business District 23 9,439,750 2,613,648 27.7% 28.6% 35.2% - 20,444 (284,454)
Midtown 20 2,955,580 166,007 5.6% 5.8% 8.2% - 22,478 104,939
Downtown 43 12,395,330 2,779,655 22.4% 23.1% 28.8% - 42,922 (179,515)
FM 1960 / Champions 20 1,630,186 301,215 18.5% 18.5% 21.9% - 24,690 29,629
FM 1960 / Highway 249 18 1,315,795 198,049 15.1% 15.5% 27.1% - (17,001) (51,033)
FM 1960 / I-45 North 11 968,736 254,157 26.2% 26.6% 35.4% - 2,096 (12,827)
FM 1960 49 3,914,717 753,421 19.2% 19.5% 27.0% - 9,785 (34,231)
Greenway Plaza 26 3,598,525 346,783 9.6% 9.9% 11.7% - 23,846 (63,217)
Gulf Freeway/Pasadena 27 2,179,493 325,177 14.9% 14.9% 20.3% - (6,828) 10,711
Katy Far West 11 1,275,188 2,223 0.2% 0.2% 0.7% - 0 17,033
Katy Freeway East 26 2,879,196 193,346 6.7% 7.4% 14.1% - 90,941 56,998
Katy Freeway West 66 7,640,290 1,528,561 20.0% 20.2% 27.9% - 50,100 (233,819)
Katy Frwy / Energy Corridor 92 10,519,486 1,721,907 16.4% 16.7% 24.1% - 141,041 (176,821)
Kingwood / Humble 9 1,090,077 27,341 2.5% 2.5% 11.7% - (4,617) (3,370)
NASA / Clear Lake 37 3,530,906 958,111 27.1% 27.2% 28.9% - (55,090) (67,465)
North District / IAH 11 1,493,858 198,169 13.3% 14.0% 16.2% - 5,543 (5,429)
North District / North Belt W 46 4,811,988 1,825,573 37.9% 38.6% 47.7% - (80,040) (272,404)
North District / North Belt 57 6,305,846 2,023,742 32.1% 32.8% 40.2% - (74,497) (277,833)
Northeast 6 554,309 44,990 8.1% 8.1% 11.7% 115,601 118,345 132,749
North Loop West 21 2,566,873 348,317 13.6% 13.6% 16.7% - (60,171) (71,180)
Northwest Near 7 623,533 37,983 6.1% 6.1% 6.5% - (9,024) (19,992)
Northwest Far 23 2,294,586 461,376 20.1% 20.3% 22.4% - (47,846) (1,188)
Northwest 51 5,484,992 847,676 15.5% 15.6% 17.9% - (117,041) (92,360)
South Main / Medical Center 19 4,020,231 408,389 10.2% 10.2% 4.5% - 1,212 26,705
E Fort Bend Co / Sugar Land 24 2,250,177 145,961 6.5% 8.2% 13.6% - (60,171) 55,453
Southwest Beltway 8 33 4,588,548 732,065 16.0% 16.1% 23.3% 60,000 (22,384) (4,072)
Southwest / Hillcroft 19 1,794,770 373,317 20.8% 20.9% 22.0% (24,980) (16,356)
Southwest Fwy / Sugar Land 76 8,633,495 1,251,343 14.5% 15.0% 20.5% 153,000 (13,248) 35,025
The Woodlands 50 4,451,730 391,060 8.8% 9.3% 12.5% - (1,676) (13,577)
West Belt 14 1,302,625 150,175 11.5% 17.4% 35.7% - 1,128 46,407
Bellaire 16 2,443,987 212,075 8.7% 8.8% 11.8% - 10,766 (57,361)
Galleria / Uptown 22 3,266,742 352,773 10.8% 11.1% 15.6% - 15,099 7,496
Post Oak Park 16 1,803,120 269,230 14.9% 14.9% 21.4% - (53,918) (84,849)
Richmond / Fountainview 7 570,270 135,568 23.8% 23.8% 11.2% - 11,990 26,598
Riverway 9 870,153 163,518 18.8% 19.1% 23.1% - 19,493 (12,232)
San Felipe / Voss 30 3,339,364 523,993 15.7% 16.3% 20.2% - (4,124) (87,712)
West Loop 100 12,293,636 1,657,157 13.5% 13.8% 17.3% - (694) (208,060)
Westchase 52 7,132,965 1,190,193 16.7% 17.1% 26.6% - 14,520 (779)
TOTAL - Houston 729 89,372,410 14,912,379 16.7% 17.1% 22.2% 268,601 82,959 (791,533)
REAL ESTATE OUTLOOK HOUSTON METRO Q4 2017 7
Copyright © 2017 Transwestern. All rights reserved. No part of this work may be reproduced or distributed to third parties without written permission of the copyright owner. The information contained in this report was gathered by Transwestern from various primary and secondary sources believed to be reliable. Transwestern, however, makes no representation concerning the accuracy or completeness of such information and expressly disclaims any responsibility for any inaccuracy contained herein.
METHODOLOGY
The information in this report is the result of a compilation of information on office, industrial, retail, multifamily and healthcare properties
located in the Houston metropolitan area. This report includes single-tenant, multi-tenant and owner-user properties and excludes properties
owned and occupied by a government agency.
CONTACT
Stuart ShowersDirector of [email protected]
Rachel HornbeakResearch [email protected]
Jennifer Woodruff Research [email protected]
SUBMARKET Q4 2016 CLASS A
Q4 2016 CLASS B
% CHANGEY-O-Y
CLASS A
% CHANGEY-O-Y
CLASS B
Q3 2017 CLASS A
Q3 2017 CLASS B
% CHANGE OVER
QUARTER CLASS A
% CHANGE OVER
QUARTER CLASS B
Q4 2017 CLASS A
Q4 2017 CLASS B
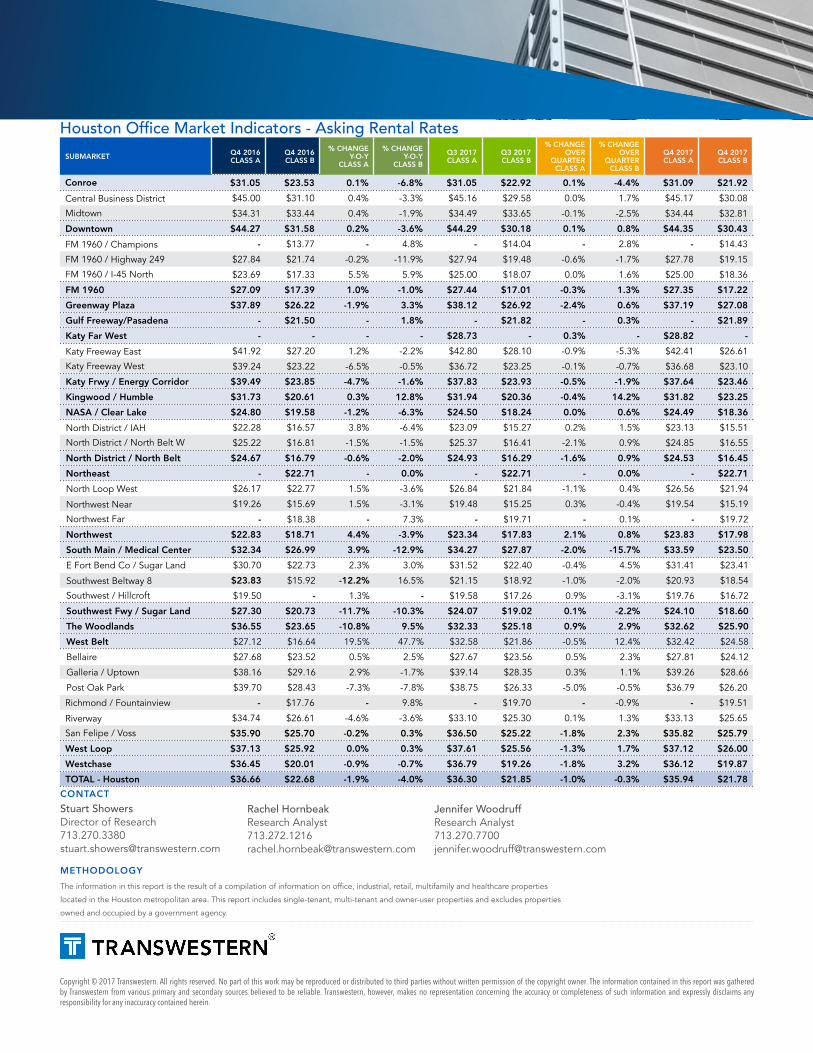
Conroe $31.05 $23.53 0.1% -6.8% $31.05 $22.92 0.1% -4.4% $31.09 $21.92
Central Business District $45.00 $31.10 0.4% -3.3% $45.16 $29.58 0.0% 1.7% $45.17 $30.08
Midtown $34.31 $33.44 0.4% -1.9% $34.49 $33.65 -0.1% -2.5% $34.44 $32.81
Downtown $44.27 $31.58 0.2% -3.6% $44.29 $30.18 0.1% 0.8% $44.35 $30.43
FM 1960 / Champions - $13.77 - 4.8% - $14.04 - 2.8% - $14.43
FM 1960 / Highway 249 $27.84 $21.74 -0.2% -11.9% $27.94 $19.48 -0.6% -1.7% $27.78 $19.15
FM 1960 / I-45 North $23.69 $17.33 5.5% 5.9% $25.00 $18.07 0.0% 1.6% $25.00 $18.36
FM 1960 $27.09 $17.39 1.0% -1.0% $27.44 $17.01 -0.3% 1.3% $27.35 $17.22
Greenway Plaza $37.89 $26.22 -1.9% 3.3% $38.12 $26.92 -2.4% 0.6% $37.19 $27.08
Gulf Freeway/Pasadena - $21.50 - 1.8% - $21.82 - 0.3% - $21.89
Katy Far West - - - - $28.73 - 0.3% - $28.82 -
Katy Freeway East $41.92 $27.20 1.2% -2.2% $42.80 $28.10 -0.9% -5.3% $42.41 $26.61
Katy Freeway West $39.24 $23.22 -6.5% -0.5% $36.72 $23.25 -0.1% -0.7% $36.68 $23.10
Katy Frwy / Energy Corridor $39.49 $23.85 -4.7% -1.6% $37.83 $23.93 -0.5% -1.9% $37.64 $23.46
Kingwood / Humble $31.73 $20.61 0.3% 12.8% $31.94 $20.36 -0.4% 14.2% $31.82 $23.25
NASA / Clear Lake $24.80 $19.58 -1.2% -6.3% $24.50 $18.24 0.0% 0.6% $24.49 $18.36
North District / IAH $22.28 $16.57 3.8% -6.4% $23.09 $15.27 0.2% 1.5% $23.13 $15.51
North District / North Belt W $25.22 $16.81 -1.5% -1.5% $25.37 $16.41 -2.1% 0.9% $24.85 $16.55
North District / North Belt $24.67 $16.79 -0.6% -2.0% $24.93 $16.29 -1.6% 0.9% $24.53 $16.45
Northeast - $22.71 - 0.0% - $22.71 - 0.0% - $22.71
North Loop West $26.17 $22.77 1.5% -3.6% $26.84 $21.84 -1.1% 0.4% $26.56 $21.94
Northwest Near $19.26 $15.69 1.5% -3.1% $19.48 $15.25 0.3% -0.4% $19.54 $15.19
Northwest Far - $18.38 - 7.3% - $19.71 - 0.1% - $19.72
Northwest $22.83 $18.71 4.4% -3.9% $23.34 $17.83 2.1% 0.8% $23.83 $17.98
South Main / Medical Center $32.34 $26.99 3.9% -12.9% $34.27 $27.87 -2.0% -15.7% $33.59 $23.50
E Fort Bend Co / Sugar Land $30.70 $22.73 2.3% 3.0% $31.52 $22.40 -0.4% 4.5% $31.41 $23.41
Southwest Beltway 8 $23.83 $15.92 -12.2% 16.5% $21.15 $18.92 -1.0% -2.0% $20.93 $18.54
Southwest / Hillcroft $19.50 - 1.3% - $19.58 $17.26 0.9% -3.1% $19.76 $16.72
Southwest Fwy / Sugar Land $27.30 $20.73 -11.7% -10.3% $24.07 $19.02 0.1% -2.2% $24.10 $18.60
The Woodlands $36.55 $23.65 -10.8% 9.5% $32.33 $25.18 0.9% 2.9% $32.62 $25.90
West Belt $27.12 $16.64 19.5% 47.7% $32.58 $21.86 -0.5% 12.4% $32.42 $24.58
Bellaire $27.68 $23.52 0.5% 2.5% $27.67 $23.56 0.5% 2.3% $27.81 $24.12
Galleria / Uptown $38.16 $29.16 2.9% -1.7% $39.14 $28.35 0.3% 1.1% $39.26 $28.66
Post Oak Park $39.70 $28.43 -7.3% -7.8% $38.75 $26.33 -5.0% -0.5% $36.79 $26.20
Richmond / Fountainview - $17.76 - 9.8% - $19.70 - -0.9% - $19.51
Riverway $34.74 $26.61 -4.6% -3.6% $33.10 $25.30 0.1% 1.3% $33.13 $25.65
San Felipe / Voss $35.90 $25.70 -0.2% 0.3% $36.50 $25.22 -1.8% 2.3% $35.82 $25.79
West Loop $37.13 $25.92 0.0% 0.3% $37.61 $25.56 -1.3% 1.7% $37.12 $26.00
Westchase $36.45 $20.01 -0.9% -0.7% $36.79 $19.26 -1.8% 3.2% $36.12 $19.87
TOTAL - Houston $36.66 $22.68 -1.9% -4.0% $36.30 $21.85 -1.0% -0.3% $35.94 $21.78
Houston Office Market Indicators - Asking Rental Rates

OVERVIEW
Harvey Delays Office Recovery Slightly While the office market has been under storm clouds for several quarters, the third quarter saw Hurricane Harvey eclipse the sun and pour over five feet of water on the Houston Metro area. Initial reports on the storm's capital impacts were significantly exaggerated as they were tethered to estimates based upon flood maps. However, a detailed review indicated that the storm damaged just under 70 office buildings with a net rentable area impact of 2.0 million square feet, or 0.8% of total supply, significantly less than initially anticipated. A lack of strong winds spared most office buildings from significant harm, leaving property damages mostly to parking garages, first and sub-floors as well as minor roof leaks. Of the properties damaged, over 75% were fully operational within two weeks of the event. The most tangible impact that Harvey had upon the Houston office market was essentially delaying the sectors recovery for an additional quarter.
NET ABSORPTION
2017 Year-to-Date Absorption Totals Negative 3.9M SFYear-to-date absorption totals of negative 3.9 million square feet continue to highlight the delayed impacts of the energy downturn as well as the trend of companies striving for efficiency and reducing their space footprint. Absorption for the quarter totaled negative 732,000 square feet and was equally distributed among classes. Class A properties totaled negative 360,000 square feet with the West Loop
HOUSTON OFFICE MARKETTHIRD QUARTER 2017
REAL ESTATE OUTLOOK
Hurricane Harvey Takes a Toll on HoustonSublease space decreases by 930K SF
NET ABSORPTION AND VACANCY RATE TRENDS HOUSTON METRO AREA
CONTIGUOUS BLOCKS OF AVAILABLE SPACE HOUSTON METRO
SOURCE CoStar, Transwestern *Through Q3 2017
SOURCE CoStar, Transwestern *Through Q3 2017
Note: Delivery of preleased space counts as positive net absorption
SF In
Thou
sand
s
Notable Q3 LeasesTENANT SF LEASE TYPE BUILDING SUBMARKET
NRG Energy 431,307 Sublease One Shell Plaza CBD
McDermott 186,000 Sublease Westway Plaza II West Belt
USCIS 100,020 Renewal Northpoint Plaza North District
EDF Trading 60,000 New Lease 601 Travis CBD
-4000-3000-2000-1000
010002000300040005000600070008000
Net Absorption
17*1615141312111009080706
Vacancy RateNet Absorption
0
50
100
150
200Class A SubletClass A Direct
200,000 SF100,000 SF50,000 SF25,000 SF
Class B SubletClass B Direct

and Central Business District primarily accounting for the negative absorption. Class B finished the third quarter with negative 398,000 square feet of absorption, due to space give backs in the Houston North District and the West Loop submarkets.
DIRECT VACANCY & TOTAL AVAIL ABILIT Y
Total Availability Declines While Vacancy RisesThe overall office availability rate (all space marketed as available for lease, both direct and sublet) decreased 0.3% over the quarter, ending at 23.3%. Class A properties drove the decrease, declining by 0.5% to finish the period at 24.4%. While Class B properties ticked up marginally, finishing at 23.0%.
Direct vacancy rose for the twelfth consecutive quarter, up 0.3% and closing at 15.4% overall. Class A properties saw vacancy increase by 0.2%, ending at 15.1%, while Class B properties were up 0.4% to 16.7%. Currently, over 1.5 million SF of sublease space is set to expire over the next 12 months, equating to roughly 20% of total sublease supply. This is especially pronounced in the North Houston District where 868,845 SF is set to expire by end of year 2018. As more sublease space expires city-wide, vacancy rates will continue to trend up.
RENTAL R ATES
Asking Rates Continue to AscendOverall asking rates for the Houston Metro area increased by 1.5% over the quarter and 2.0% over the year, finishing the period at $30.92 PSF full service. Despite the increase in asking rates, concessions remain elevated throughout the market with generous concession packages and tenant improvement allowances being offered in order to maintain the highest rent figures.
Class A rates closed the quarter up 0.6% (+$0.20), ending at $35.83 PSF full service, while Class B asking rates declined by 1.2%, ending at $21.97 PSF full service. The submarkets with the highest asking rents are the Katy Fwy East ($45.00 PSF), the Central Business District ($44.35 PSF) and Galleria/Uptown ($38.83 PSF).
SUPPLY AND DEVELOPMENT
Development Pipeline Remains in CheckHouston area construction activity has slowed greatly due to both the delivery of over 33.0M SF in the past seven years and the downturn in the energy sector. Given the ample amount of space currently on the market for lease, developers are wary of additional speculative construction. Still, as tenants strive to retain talent and attain efficiency both in their space footprint as well as their operating expenses, the potential for additional construction tethered to a lead tenant remains high. Specifically, in core office submarkets such as the CBD, the Woodlands and West Loop. At the close of the third quarter, the Houston construction pipeline totaled 2.3 million square feet and is currently 52.5% preleased.
Office Under ConstructionHouston Metro | Q3 2017
SUBMARKET NUMBER OF BLDGS SF % PRE-
LEASED
CBD 1 778,344 27.0%
Woodlands 2 515,800 100.0%E Fort Bend Co/Sugar Land 3 247,200 30.1%
Greenway Plaza 1 188,547 0.0%
Westchase 1 187,011 80.9%
Northeast 1 115,601 100.0%
West Loop 1 104,579 46.8%
Energy Corridor 1 86,255 61.5%
Katy 1 72,045 50.8%
Total 12 2,295,382 52.5%
AVERAGE OFFICE RENTS HOUSTON METRO AREA
SOURCE CoStar, Transwestern *Through Q3 2017 Note: All classes of office space
Total Available SpaceHouston Metro | Q3 2017
SUBMARKETSUBLEASE SPACE (SF)
% OF SUPPLY
SUBMARKET % TOTAL
AVAILABLE
Energy Corridor 2,386,277 6.6% 25.3%
CBD 2,178,987 5.0% 25.8%
Westchase 1,543,705 8.8% 29.0%
Galleria 842,634 5.0% 21.3%
North District 877,698 6.8% 48.8%
All of Houston 9,829,433 4.1% 23.3%
$15
$20
$25
$30
$35
$40Class BClass AOverall
17*1615141312111009080706
2 REAL ESTATE OUTLOOK HOUSTON METRO Q3 2017
HOUSTON METRO MARKETTHIRD QUARTER 2017

The largest projects currently under construction are Capitol Tower (CBD, 778,000 SF - 27% leased to Bank of America), CityPlace 3 (The Woodlands, 328,000 SF - 100% Leased to HP), CityPlace 2 (The Woodlands, 326,000 SF - 100% Leased to ABS) and The Kirby Collection, a mixed-use project with a significant office component (Greenway Plaza, 212,000 SF, 0% preleased).
INVESTMENT MARKET
Houston Investment Market is Red-HotHarvey had little impact on Houston's investment market as a flurry of activity took place throughout the quarter. The underlying fundamentals of the market are strong and stabilization in the energy sector should begin to avail itself over the next 9-12 months, keeping sentiment positive amongst the investor community. Sales for the quarter (including the under contract Houston Center), totaled $1.4 billion and were comprised of 15 transactions.
The most significant transaction of the third quarter was Brookfield Properties acquisition of Houston Center from JPMorgan Asset Management. The four building portfolio located in Houston's Central Business District totals over 4.0 million square feet and is under contract for approximately $875 million. Additionally, Bank of America corporation acquired Energy Center IV from Trammell Crow Company for $275 million or $461.00 PSF (6.0% cap rate). The 597,000 square foot Class A facility is located in the Katy Fwy West submarket and is under long-term lease to ConocoPhillips.
The market remains full of potential with a plethora of well located infill properties representing value add opportunities to investors. As such, investment activity should remain strong through the balance of 2017. These figures represent assets for which pricing information could be obtained.
COMPARATIVE OFFICE INVESTMENT SALES VOLUME SELECT METRO AREAS
SOURCE Real Capital Analytics, Transwestern ,*Through Q3 2017
AVERAGE OFFICE SALE PRICE HOUSTON METRO AREA
SOURCE Real Capital Analytics, Transwestern,*Through Q3 2017
Notable Q3 TransactionsBUILDING SUBMARKET SF SALE PRICE SELLER BUYER
Houston Center CBD 4,200,000 $875.0 million(under contract) JPMorgan Asset Management Brookfield Asset Management
Greenspoint Plaza North District 2,080,000 N/A Northwestern Mutual Lincoln Property Co & H.I.G. Realty Partners joint venture
Energy Center IV Katy Freeway West 597,000 $275.0 million Trammell Crow Company Bank of America Corporation
1700 W Loop S Galleria/Uptown 272,941 $52.0 million Bridge Investment Group Lingerfelt Commonwealth Partners
SOURCE Real Capital Analytics, HFF, Transwestern
Sales
Volu
me i
n Billi
ons
$0
$1
$2
$3
$4
$5
$6
$7
$8HoustonDenverDallasAtlanta
17*1615141312111009080706
$0
$50
$100
$150
$200
$250 Average Sale Price Per SF
17*1615141312111009080706
REAL ESTATE OUTLOOK HOUSTON METRO Q3 2017 3
OUTLOOK
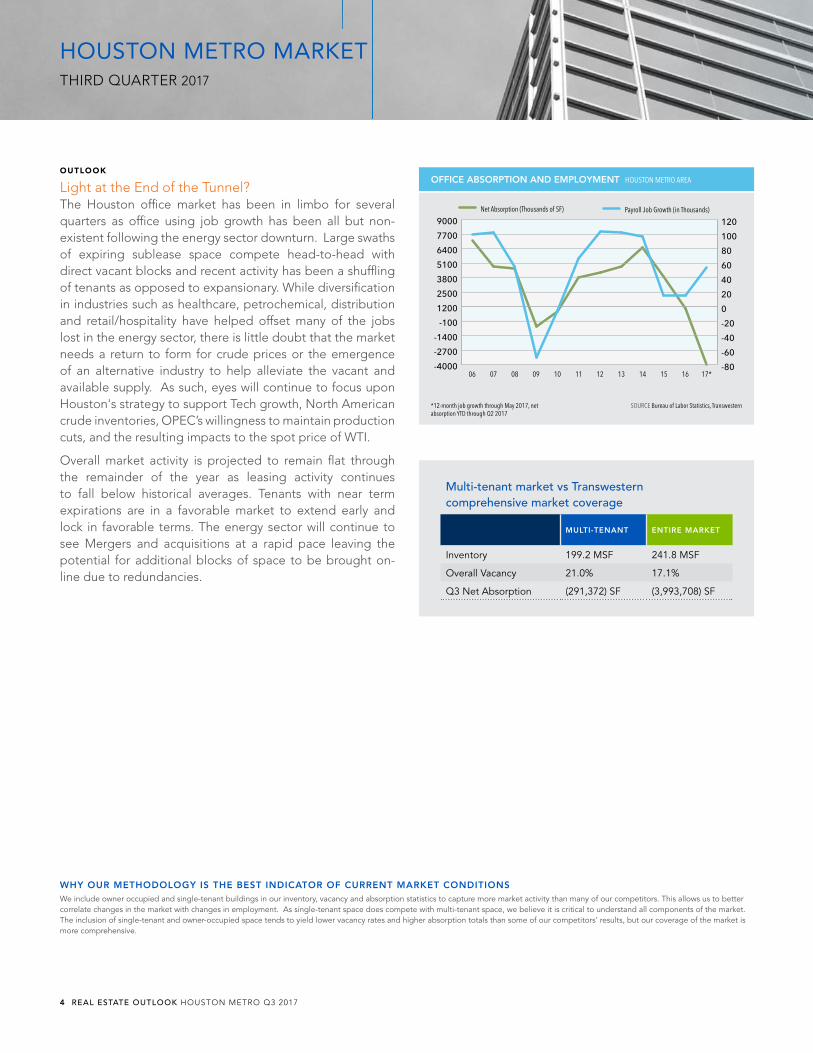
Light at the End of the Tunnel?The Houston office market has been in limbo for several quarters as office using job growth has been all but non-existent following the energy sector downturn. Large swaths of expiring sublease space compete head-to-head with direct vacant blocks and recent activity has been a shuffling of tenants as opposed to expansionary. While diversification in industries such as healthcare, petrochemical, distribution and retail/hospitality have helped offset many of the jobs lost in the energy sector, there is little doubt that the market needs a return to form for crude prices or the emergence of an alternative industry to help alleviate the vacant and available supply. As such, eyes will continue to focus upon Houston's strategy to support Tech growth, North American crude inventories, OPEC’s willingness to maintain production cuts, and the resulting impacts to the spot price of WTI.
Overall market activity is projected to remain flat through the remainder of the year as leasing activity continues to fall below historical averages. Tenants with near term expirations are in a favorable market to extend early and lock in favorable terms. The energy sector will continue to see Mergers and acquisitions at a rapid pace leaving the potential for additional blocks of space to be brought on-line due to redundancies.
Multi-tenant market vs Transwestern comprehensive market coverage
MULTI-TENANT ENTIRE MARKET
Inventory 199.2 MSF 241.8 MSF
Overall Vacancy 21.0% 17.1%
Q3 Net Absorption (291,372) SF (3,993,708) SF
WHY OUR METHODOLOGY IS THE BEST INDICATOR OF CURRENT MARKET CONDITIONSWe include owner occupied and single-tenant buildings in our inventory, vacancy and absorption statistics to capture more market activity than many of our competitors. This allows us to better correlate changes in the market with changes in employment. As single-tenant space does compete with multi-tenant space, we believe it is critical to understand all components of the market. The inclusion of single-tenant and owner-occupied space tends to yield lower vacancy rates and higher absorption totals than some of our competitors’ results, but our coverage of the market is more comprehensive.
OFFICE ABSORPTION AND EMPLOYMENT HOUSTON METRO AREA
SOURCE Bureau of Labor Statistics, Transwestern *12-month job growth through May 2017, net absorption YTD through Q2 2017
-4000
-2700
-1400
-100
1200
2500
3800
5100
6400
7700
9000Net Absorption (Thousands of SF)
17*1615141312111009080706-80
-60
-40
-20
0
20
40
60
80
100
120Payroll Job Growth (in Thousands)
4 REAL ESTATE OUTLOOK HOUSTON METRO Q3 2017
HOUSTON METRO MARKETTHIRD QUARTER 2017

Houston Office Market Indicators - All Space
SUBMARKET TOTAL BLDGS INVENTORY SF AVAILABLE
IMMEDIATELY
DIRECT VACANCY
Q3 2017
VACANCY W/ SUBLET
Q3 2017
TOTAL AVAILABILITY
Q3 2017
UNDER CONSTRUCTION
NET ABSORPTION Q3 2017
NET ABSORPTION YTD 2017
Conroe 13 920,281 49,898 5.4% 5.9% 9.8% 116 49,451
Central Business District 62 43,693,078 7,023,493 16.1% 17.9% 25.8% 778,344 (62,154) (1,473,646)
Midtown 32 5,664,375 639,580 11.3% 11.8% 17.3% - (32,479) 52,843
Downtown 94 49,357,453 7,663,073 15.5% 17.2% 24.8% 778,344 (94,633) (1,420,803)
FM 1960 / Champions 23 1,900,382 335,845 17.7% 17.7% 21.5% - (26,340) 1,339
FM 1960 / Highway 249 37 5,148,719 483,854 9.4% 11.1% 15.9% - (9,937) (9,539)
FM 1960 / I-45 North 15 1,325,458 361,994 27.3% 27.8% 34.2% - (48,238) (35,966)
FM 1960 75 8,374,559 1,181,693 14.1% 15.2% 20.0% - (84,515) (44,166)
Greenway Plaza 48 11,095,766 1,413,238 12.7% 13.2% 19.4% 188,547 4,920 (111,005)
Gulf Freeway/Pasadena 33 2,642,527 294,851 11.2% 11.2% 17.4% - 2,042 16,224
Katy Far West 27 2,954,733 360,241 12.2% 12.7% 16.7% 72,045 15,234 137,815
Katy Freeway East 60 9,674,691 935,320 9.7% 10.1% 16.4% - (81,816) (136,869)
Katy Freeway West 141 26,654,315 4,484,804 16.8% 20.5% 28.5% 86,255 (95,822) (540,187)
Katy Frwy / Energy Corridor 201 36,329,006 5,420,124 14.9% 17.7% 25.3% 86,255 (177,638) (677,056)
Kingwood / Humble* 11 1,234,389 30,190 2.4% 2.4% 2.6% - 6,497 3,174
NASA / Clear Lake 53 5,613,374 1,006,896 17.9% 18.8% 22.6% - 25,788 (30,925)
North District / IAH 20 2,759,860 767,085 27.8% 28.0% 30.6% - (16,346) (176,722)
North District / North Belt W 75 10,184,568 4,290,148 42.1% 44.8% 53.7% - (155,687) (434,901)
North District / North Belt 95 12,944,428 5,057,233 39.1% 41.2% 48.8% - (172,033) (611,623)
Northeast 11 1,370,813 85,167 6.2% 6.2% 10.0% 115,601 (32,465) (23,029)
North Loop West 29 3,955,285 673,622 17.0% 17.1% 20.9% - 3,436 (39,389)
Northwest Far 30 3,339,250 739,776 22.2% 22.3% 27.9% - 30,761 56,167
Northwest Near 12 1,290,803 28,959 2.2% 2.5% 3.4% - 1,153 (10,968)
Northwest 71 8,585,338 1,442,357 16.8% 16.9% 21.0% - 35,350 5,810
South Main / Medical Center 47 10,338,924 616,556 6.0% 6.1% 7.9% - 19,648 6,440
E Fort Bend Co / Sugar Land 47 6,284,708 457,834 7.3% 8.9% 15.9% 187,200 (46,534) (28,854)
Southwest Beltway 8 41 5,546,947 814,433 14.7% 14.8% 22.9% 60,000 16,526 (14,400)
Southwest / Hillcroft 36 4,321,807 612,462 14.2% 14.9% 23.7% - 5,889 (29,672)
Southwest Fwy / Sugar Land 124 16,153,462 1,884,729 11.7% 12.5% 20.4% 247,200 (24,119) (72,926)
The Woodlands 96 16,485,335 1,609,344 9.8% 10.1% 12.4% 515,800 23,886 (44,655)
West Belt 37 5,387,946 784,684 14.6% 19.3% 36.7% - 26,910 75,278
Bellaire 28 4,302,857 433,933 10.1% 10.3% 14.9% - (75,343) (53,386)
Galleria / Uptown 58 16,833,939 2,266,941 13.5% 16.6% 21.3% 104,579 (128,316) (441,417)
Post Oak Park 27 4,581,030 1,025,783 22.4% 23.8% 28.5% - (76,997) (290,005)
Richmond / Fountainview 11 829,982 157,202 18.9% 18.9% 10.7% - 12,883 28,970
Riverway 16 2,868,522 594,885 20.7% 22.1% 24.4% - (20,378) (256,789)
San Felipe / Voss 33 5,060,157 917,168 18.1% 18.0% 24.5% - (74,428) (91,718)
West Loop 173 34,476,487 5,395,912 15.7% 17.5% 21.9% 104,579 (362,579) (1,104,345)
Westchase 89 17,585,648 2,873,713 16.3% 20.5% 29.0% 187,011 55,368 (147,367)
TOTAL - Houston 1,298 241,850,469 37,169,899 15.4% 17.1% 23.3% 2,295,382 (732,223) (3,993,708)
SOURCE CoStar, Transwestern
NOTE Includes buildings 50,000 SF RBA and greater; does not include buildings under construction or owned by the government
-
REAL ESTATE OUTLOOK HOUSTON METRO Q3 2017 5
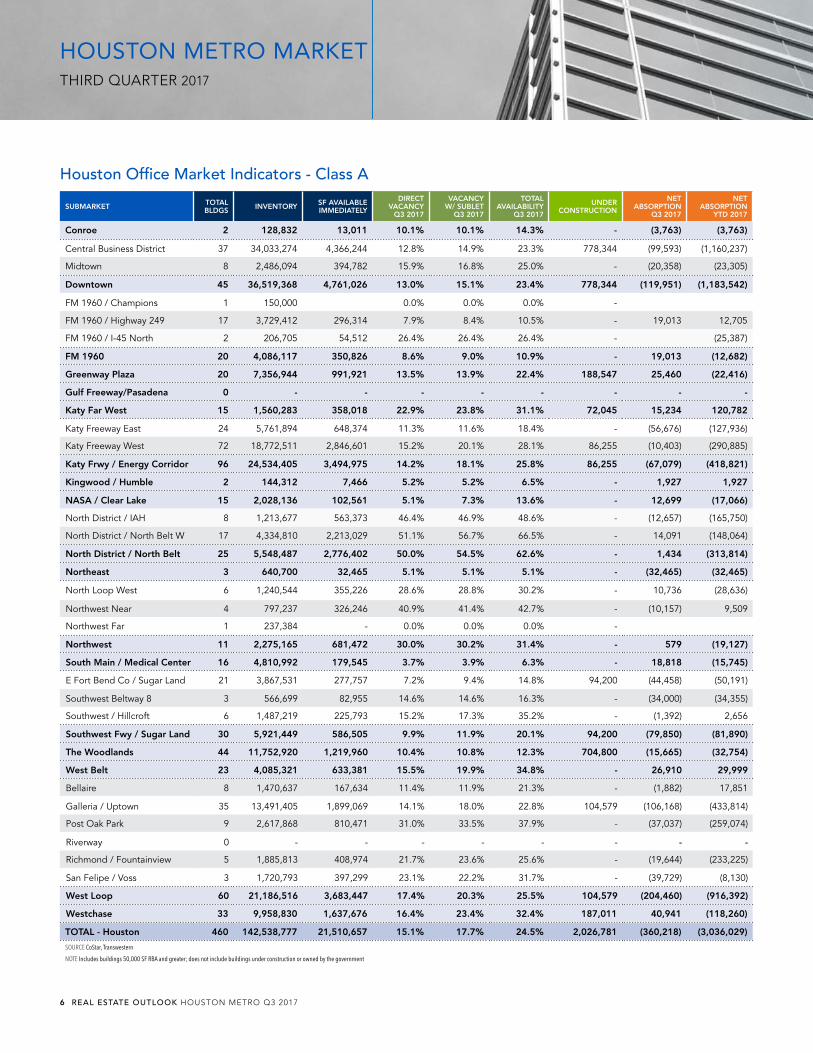
Houston Office Market Indicators - Class A
SUBMARKET TOTAL BLDGS INVENTORY SF AVAILABLE
IMMEDIATELY
DIRECT VACANCY
Q3 2017
VACANCY W/ SUBLET
Q3 2017
TOTAL AVAILABILITY
Q3 2017
UNDER CONSTRUCTION
NET ABSORPTION
Q3 2017
NET ABSORPTION
YTD 2017
Conroe 2 128,832 13,011 10.1% 10.1% 14.3% - (3,763) (3,763)
Central Business District 37 34,033,274 4,366,244 12.8% 14.9% 23.3% 778,344 (99,593) (1,160,237)
Midtown 8 2,486,094 394,782 15.9% 16.8% 25.0% - (20,358) (23,305)
Downtown 45 36,519,368 4,761,026 13.0% 15.1% 23.4% 778,344 (119,951) (1,183,542)
FM 1960 / Champions 1 150,000 0.0% 0.0% 0.0% -
FM 1960 / Highway 249 17 3,729,412 296,314 7.9% 8.4% 10.5% - 19,013 12,705
FM 1960 / I-45 North 2 206,705 54,512 26.4% 26.4% 26.4% - (25,387)
FM 1960 20 4,086,117 350,826 8.6% 9.0% 10.9% - 19,013 (12,682)
Greenway Plaza 20 7,356,944 991,921 13.5% 13.9% 22.4% 188,547 25,460 (22,416)
Gulf Freeway/Pasadena 0 - - - - - - - -
Katy Far West 15 1,560,283 358,018 22.9% 23.8% 31.1% 72,045 15,234 120,782
Katy Freeway East 24 5,761,894 648,374 11.3% 11.6% 18.4% - (56,676) (127,936)
Katy Freeway West 72 18,772,511 2,846,601 15.2% 20.1% 28.1% 86,255 (10,403) (290,885)
Katy Frwy / Energy Corridor 96 24,534,405 3,494,975 14.2% 18.1% 25.8% 86,255 (67,079) (418,821)
Kingwood / Humble 2 144,312 7,466 5.2% 5.2% 6.5% - 1,927 1,927
NASA / Clear Lake 15 2,028,136 102,561 5.1% 7.3% 13.6% - 12,699 (17,066)
North District / IAH 8 1,213,677 563,373 46.4% 46.9% 48.6% - (12,657) (165,750)
North District / North Belt W 17 4,334,810 2,213,029 51.1% 56.7% 66.5% - 14,091 (148,064)
North District / North Belt 25 5,548,487 2,776,402 50.0% 54.5% 62.6% - 1,434 (313,814)
Northeast 3 640,700 32,465 5.1% 5.1% 5.1% - (32,465) (32,465)
North Loop West 6 1,240,544 355,226 28.6% 28.8% 30.2% - 10,736 (28,636)
Northwest Near 4 797,237 326,246 40.9% 41.4% 42.7% - (10,157) 9,509
Northwest Far 1 237,384 - 0.0% 0.0% 0.0% -
Northwest 11 2,275,165 681,472 30.0% 30.2% 31.4% - 579 (19,127)
South Main / Medical Center 16 4,810,992 179,545 3.7% 3.9% 6.3% - 18,818 (15,745)
E Fort Bend Co / Sugar Land 21 3,867,531 277,757 7.2% 9.4% 14.8% 94,200 (44,458) (50,191)
Southwest Beltway 8 3 566,699 82,955 14.6% 14.6% 16.3% - (34,000) (34,355)
Southwest / Hillcroft 6 1,487,219 225,793 15.2% 17.3% 35.2% - (1,392) 2,656
Southwest Fwy / Sugar Land 30 5,921,449 586,505 9.9% 11.9% 20.1% 94,200 (79,850) (81,890)
The Woodlands 44 11,752,920 1,219,960 10.4% 10.8% 12.3% 704,800 (15,665) (32,754)
West Belt 23 4,085,321 633,381 15.5% 19.9% 34.8% - 26,910 29,999
Bellaire 8 1,470,637 167,634 11.4% 11.9% 21.3% - (1,882) 17,851
Galleria / Uptown 35 13,491,405 1,899,069 14.1% 18.0% 22.8% 104,579 (106,168) (433,814)
Post Oak Park 9 2,617,868 810,471 31.0% 33.5% 37.9% - (37,037) (259,074)
Riverway 0 - - - - - - - -
Richmond / Fountainview 5 1,885,813 408,974 21.7% 23.6% 25.6% - (19,644) (233,225)
San Felipe / Voss 3 1,720,793 397,299 23.1% 22.2% 31.7% - (39,729) (8,130)
West Loop 60 21,186,516 3,683,447 17.4% 20.3% 25.5% 104,579 (204,460) (916,392)
Westchase 33 9,958,830 1,637,676 16.4% 23.4% 32.4% 187,011 40,941 (118,260)
TOTAL - Houston 460 142,538,777 21,510,657 15.1% 17.7% 24.5% 2,026,781 (360,218) (3,036,029)
SOURCE CoStar, Transwestern
NOTE Includes buildings 50,000 SF RBA and greater; does not include buildings under construction or owned by the government
6 REAL ESTATE OUTLOOK HOUSTON METRO Q3 2017
HOUSTON METRO MARKETTHIRD QUARTER 2017

SOURCE CoStar, Transwestern
NOTE Includes buildings 50,000 SF RBA and greater; does not include buildings under construction or owned by the government
Houston Office Market Indicators - Class B
SUBMARKET TOTAL BLDGS INVENTORY SF AVAILABLE
IMMEDIATELY
DIRECT VACANCY
Q3 2017
VACANCY W/ SUBLET
Q3 2017
TOTAL AVAILABILITY
Q3 2017
UNDER CONSTRUCTION
NET ABSORPTION
Q3 2017
NET ABSORPTION
YTD 2017
Conroe 10 688,859 36,887 5.4% 6.0% 10.4% - 3,879 53,214
Central Business District 23 9,439,750 2,634,092 27.9% 28.7% 35.1% - 37,439 (304,898)
Midtown 20 2,955,580 188,485 6.4% 6.5% 10.3% - (12,121) 82,461
Downtown 43 12,395,330 2,822,577 22.8% 23.4% 29.2% - 25,318 (222,437)
FM 1960 / Champions 20 1,630,186 325,905 20.0% 20.1% 24.4% - (16,400) 4,939
FM 1960 / Highway 249 18 1,315,795 181,048 13.8% 19.0% 31.3% - (29,458) (34,032)
FM 1960 / I-45 North 11 968,736 256,253 26.5% 27.1% 35.9% - (48,238) (14,923)
FM 1960 49 3,914,717 763,206 19.5% 21.4% 29.6% - (94,096) (44,016)
Greenway Plaza 26 3,598,525 370,629 10.3% 10.8% 12.6% - (20,540) (87,063)
Gulf Freeway / Pasadena 27 2,179,493 203,993 9.4% 9.4% 16.9% - 3,951 17,539
Katy Far West 11 1,275,188 2,223 0.2% 0.2% 0.7% - 17,033
Katy Freeway East 26 2,879,196 284,287 9.9% 10.6% 17.4% - (26,811) (33,943)
Katy Freeway West 66 7,640,290 1,631,426 21.4% 21.8% 30.1% - (85,419) (249,302)
Katy Fwy / Energy Corridor 92 10,519,486 1,915,713 18.2% 18.7% 26.6% - (112,230) (283,245)
Kingwood / Humble 9 1,090,077 22,724 2.1% 2.1% 2.1% - 4,570 1,247
NASA / Clear Lake 37 3,532,220 904,335 25.6% 25.6% 28.1% - 13,089 (12,375)
North District / IAH 10 1,343,858 203,712 15.2% 15.2% 18.9% - (3,689) (10,972)
North District / North Belt W 46 4,831,938 1,853,094 38.4% 39.0% 47.4% - (193,747) (279,975)
North District / North Belt 56 6,175,796 2,056,806 33.3% 33.8% 41.2% - (197,436) (290,947)
Northeast* 6 554,309 47,734 8.6% 8.6% 12.2% 115,601 14,404
North Loop West 21 2,596,620 317,893 12.2% 12.3% 16.8% - (8,437) (11,009)
Northwest Near 23 2,294,586 413,530 18.0% 18.0% 25.8% - 40,918 46,658
Northwest Far 9 873,086 28,959 3.3% 3.6% 5.1% - 1,153 (10,968)
Northwest 53 5,764,292 760,382 13.2% 13.2% 18.6% - 33,634 24,681
South Main / Medical Center 19 4,025,606 409,601 10.2% 10.2% 11.5% - 830 25,493
E Fort Bend Co / Sugar Land 25 2,343,177 180,077 7.7% 8.3% 18.3% 93,000 (2,076) 21,337
Southwest Beltway 8 33 4,622,364 709,681 15.4% 15.5% 24.7% 60,000 53,262 18,312
Southwest / Hillcroft 19 1,794,770 315,337 17.6% 17.7% 20.9% 7,281 (21,376)
Southwest Fwy / Sugar Land 77 8,760,311 1,205,095 13.8% 14.0% 22.2% 153,000 58,467 18,273
The Woodlands 50 4,451,730 389,384 8.7% 9.0% 13.3% - 39,551 (11,901)
West Belt 14 1,302,625 151,303 11.6% 17.4% 42.4% - - 45,279
Bellaire 16 2,448,714 227,568 9.3% 9.4% 11.9% - (73,461) (68,127)
Galleria 22 3,266,742 367,872 11.3% 11.6% 15.7% - (22,148) (7,603)
Post Oak Park 16 1,803,120 215,312 11.9% 11.9% 17.3% - (39,960) (30,931)
Riverway 7 570,270 147,558 25.9% 25.9% 12.9% - (969) 14,608
Richmond / Fountainview 9 870,153 183,011 21.0% 21.3% 24.6% - (534) (31,725)
San Felipe / Voss 30 3,339,364 519,869 15.6% 15.8% 20.8% - (34,699) (83,588)
West Loop 100 12,298,363 1,661,190 13.5% 13.7% 17.0% - (171,771) (207,366)
Westchase 52 7,132,965 1,204,713 16.9% 17.5% 25.7% - 14,427 (15,299)
TOTAL - Houston 731 89,659,892 14,928,495 16.7% 17.1% 23.0% 268,601 (398,357) (957,486)
REAL ESTATE OUTLOOK HOUSTON METRO Q3 2017 7
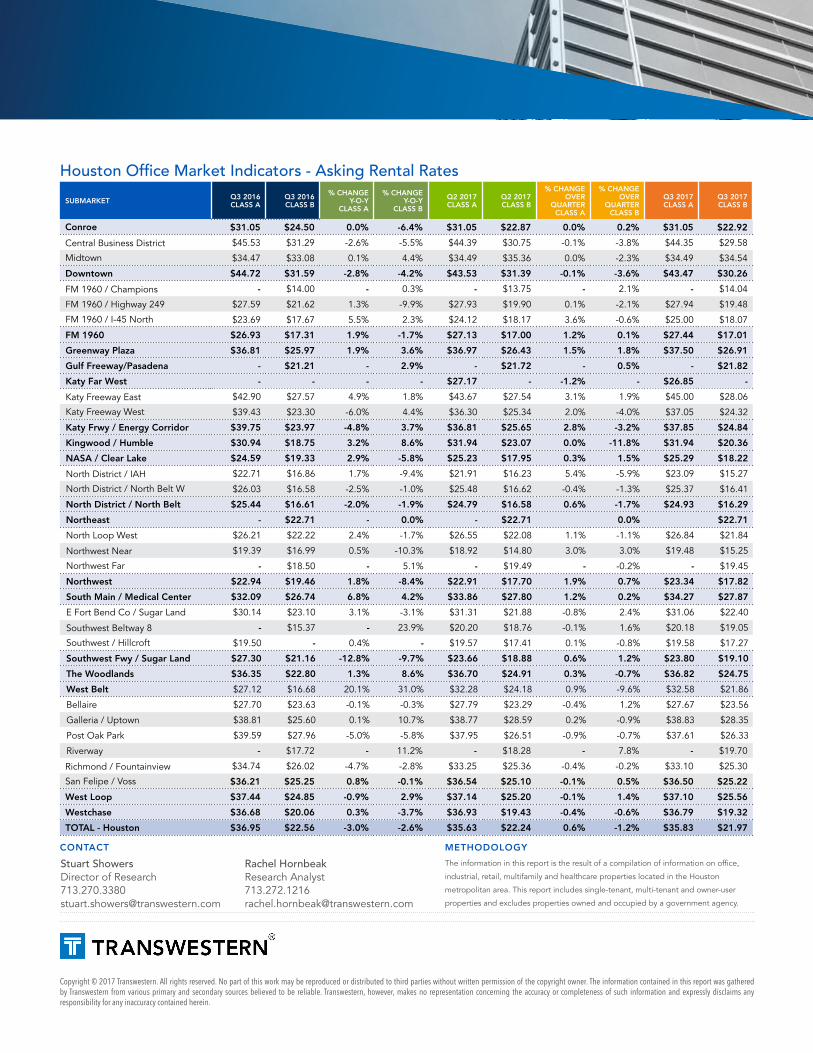
Copyright © 2017 Transwestern. All rights reserved. No part of this work may be reproduced or distributed to third parties without written permission of the copyright owner. The information contained in this report was gathered by Transwestern from various primary and secondary sources believed to be reliable. Transwestern, however, makes no representation concerning the accuracy or completeness of such information and expressly disclaims any responsibility for any inaccuracy contained herein.
METHODOLOGY
The information in this report is the result of a compilation of information on office,
industrial, retail, multifamily and healthcare properties located in the Houston
metropolitan area. This report includes single-tenant, multi-tenant and owner-user
properties and excludes properties owned and occupied by a government agency.
Rachel HornbeakResearch [email protected]
Stuart ShowersDirector of [email protected]
CONTACT
SUBMARKET Q3 2016 CLASS A
Q3 2016 CLASS B
% CHANGEY-O-Y
CLASS A
% CHANGEY-O-Y
CLASS B
Q2 2017 CLASS A
Q2 2017 CLASS B
% CHANGE OVER
QUARTER CLASS A
% CHANGE OVER
QUARTER CLASS B
Q3 2017 CLASS A
Q3 2017 CLASS B
Conroe $31.05 $24.50 0.0% -6.4% $31.05 $22.87 0.0% 0.2% $31.05 $22.92
Central Business District $45.53 $31.29 -2.6% -5.5% $44.39 $30.75 -0.1% -3.8% $44.35 $29.58
Midtown $34.47 $33.08 0.1% 4.4% $34.49 $35.36 0.0% -2.3% $34.49 $34.54
Downtown $44.72 $31.59 -2.8% -4.2% $43.53 $31.39 -0.1% -3.6% $43.47 $30.26
FM 1960 / Champions - $14.00 - 0.3% - $13.75 - 2.1% - $14.04
FM 1960 / Highway 249 $27.59 $21.62 1.3% -9.9% $27.93 $19.90 0.1% -2.1% $27.94 $19.48
FM 1960 / I-45 North $23.69 $17.67 5.5% 2.3% $24.12 $18.17 3.6% -0.6% $25.00 $18.07
FM 1960 $26.93 $17.31 1.9% -1.7% $27.13 $17.00 1.2% 0.1% $27.44 $17.01
Greenway Plaza $36.81 $25.97 1.9% 3.6% $36.97 $26.43 1.5% 1.8% $37.50 $26.91
Gulf Freeway/Pasadena - $21.21 - 2.9% - $21.72 - 0.5% - $21.82
Katy Far West - - - - $27.17 - -1.2% - $26.85 -
Katy Freeway East $42.90 $27.57 4.9% 1.8% $43.67 $27.54 3.1% 1.9% $45.00 $28.06
Katy Freeway West $39.43 $23.30 -6.0% 4.4% $36.30 $25.34 2.0% -4.0% $37.05 $24.32
Katy Frwy / Energy Corridor $39.75 $23.97 -4.8% 3.7% $36.81 $25.65 2.8% -3.2% $37.85 $24.84
Kingwood / Humble $30.94 $18.75 3.2% 8.6% $31.94 $23.07 0.0% -11.8% $31.94 $20.36
NASA / Clear Lake $24.59 $19.33 2.9% -5.8% $25.23 $17.95 0.3% 1.5% $25.29 $18.22
North District / IAH $22.71 $16.86 1.7% -9.4% $21.91 $16.23 5.4% -5.9% $23.09 $15.27
North District / North Belt W $26.03 $16.58 -2.5% -1.0% $25.48 $16.62 -0.4% -1.3% $25.37 $16.41
North District / North Belt $25.44 $16.61 -2.0% -1.9% $24.79 $16.58 0.6% -1.7% $24.93 $16.29
Northeast - $22.71 - 0.0% - $22.71 0.0% $22.71
North Loop West $26.21 $22.22 2.4% -1.7% $26.55 $22.08 1.1% -1.1% $26.84 $21.84
Northwest Near $19.39 $16.99 0.5% -10.3% $18.92 $14.80 3.0% 3.0% $19.48 $15.25
Northwest Far - $18.50 - 5.1% - $19.49 - -0.2% - $19.45
Northwest $22.94 $19.46 1.8% -8.4% $22.91 $17.70 1.9% 0.7% $23.34 $17.82
South Main / Medical Center $32.09 $26.74 6.8% 4.2% $33.86 $27.80 1.2% 0.2% $34.27 $27.87
E Fort Bend Co / Sugar Land $30.14 $23.10 3.1% -3.1% $31.31 $21.88 -0.8% 2.4% $31.06 $22.40
Southwest Beltway 8 - $15.37 - 23.9% $20.20 $18.76 -0.1% 1.6% $20.18 $19.05
Southwest / Hillcroft $19.50 - 0.4% - $19.57 $17.41 0.1% -0.8% $19.58 $17.27
Southwest Fwy / Sugar Land $27.30 $21.16 -12.8% -9.7% $23.66 $18.88 0.6% 1.2% $23.80 $19.10
The Woodlands $36.35 $22.80 1.3% 8.6% $36.70 $24.91 0.3% -0.7% $36.82 $24.75
West Belt $27.12 $16.68 20.1% 31.0% $32.28 $24.18 0.9% -9.6% $32.58 $21.86
Bellaire $27.70 $23.63 -0.1% -0.3% $27.79 $23.29 -0.4% 1.2% $27.67 $23.56
Galleria / Uptown $38.81 $25.60 0.1% 10.7% $38.77 $28.59 0.2% -0.9% $38.83 $28.35
Post Oak Park $39.59 $27.96 -5.0% -5.8% $37.95 $26.51 -0.9% -0.7% $37.61 $26.33
Riverway - $17.72 - 11.2% - $18.28 - 7.8% - $19.70
Richmond / Fountainview $34.74 $26.02 -4.7% -2.8% $33.25 $25.36 -0.4% -0.2% $33.10 $25.30
San Felipe / Voss $36.21 $25.25 0.8% -0.1% $36.54 $25.10 -0.1% 0.5% $36.50 $25.22
West Loop $37.44 $24.85 -0.9% 2.9% $37.14 $25.20 -0.1% 1.4% $37.10 $25.56
Westchase $36.68 $20.06 0.3% -3.7% $36.93 $19.43 -0.4% -0.6% $36.79 $19.32
TOTAL - Houston $36.95 $22.56 -3.0% -2.6% $35.63 $22.24 0.6% -1.2% $35.83 $21.97
Houston Office Market Indicators - Asking Rental Rates

OVERVIEW
Rising Crude Inventories Slow RecoveryAfter a promising start to the year, the Houston offi ce market encountered additional headwinds during the second quarter as the burgeoning oil recovery slowed due to rising North American crude inventories. For the second consecutive period, negative absorption surpassed one million square feet with overall year to date totals just under negative 2.5M SF. Direct vacancy rates and total availability increased by 0.4% over the period, ending at 15.1% and 23.6%, respectively. On a positive note, sublease supply continued to decline and now stands at 10.8M SF for the market area. Despite the temporary set back, investor sentiment for the Houston market remains positive as long term fundamentals including population growth, industry diversifi cation, pro-business environment and low cost of living remain in place. Driven by the delivery of over 33.0M SF since 2010, many well located second generation buildings are undergoing renovations in order to remain competitive with newer options and appealing to a changing workforce that contains fi ve generations.
NET ABSORPTION
Year-to-Date Absorption a Negative 2.5M SFThrough the second quarter, the offi ce sector continued to experience negative absorption due to slow leasing activity, expiring sublease listings, and companies continuing to reduce their space footprint. Class A properties drove negative absorption for the quarter, totaling a negative 1.5M SF. Class B properties seemed to fi nd their footing this quarter, after three consecutive periods in the red, absorption totaled
HOUSTONOFFICE MARKETMID-YEAR 2017
REAL ESTATE OUTLOOK
One Step Forward, Two Steps Back Offi ce market working to fi nd way back up
NET ABSORPTION AND VACANCY RATE TRENDS HOUSTON METRO AREA
CONTIGUOUS BLOCKS OF AVAILABLE SPACE HOUSTON METRO
SOURCE CoStar, Transwestern *Through Q2 2017
SOURCE CoStar, Transwestern *Through Q2 2017
Note: Delivery of preleased space counts as positive net absorption
SF In
Thou
sand
s
Notable Q2 LeasesTENANT SF LEASE TYPE BUILDING SUBMARKET
Apache 524,000 Renewal/Extension 2000 Post Oak Blvd Galleria/Uptown
Bank of America 209,000 Prelease Capitol Tower Central Business District
Motiva Enterprises 204,500 Renewal/Expansion One Allen Center Central Business District
Winstead PC 66,000 Renewal/Contraction JPMorgan Chase Tower Central Business District
-3000-2000-1000
010002000300040005000600070008000
Net Absorption
17*1615141312111009080706
Vacancy RateNet Absorption
0
50
100
150
200Class A SubletClass A Direct
200,000 SF100,000 SF50,000 SF25,000 SF
Class B SubletClass B Direct
OUTLOOKK
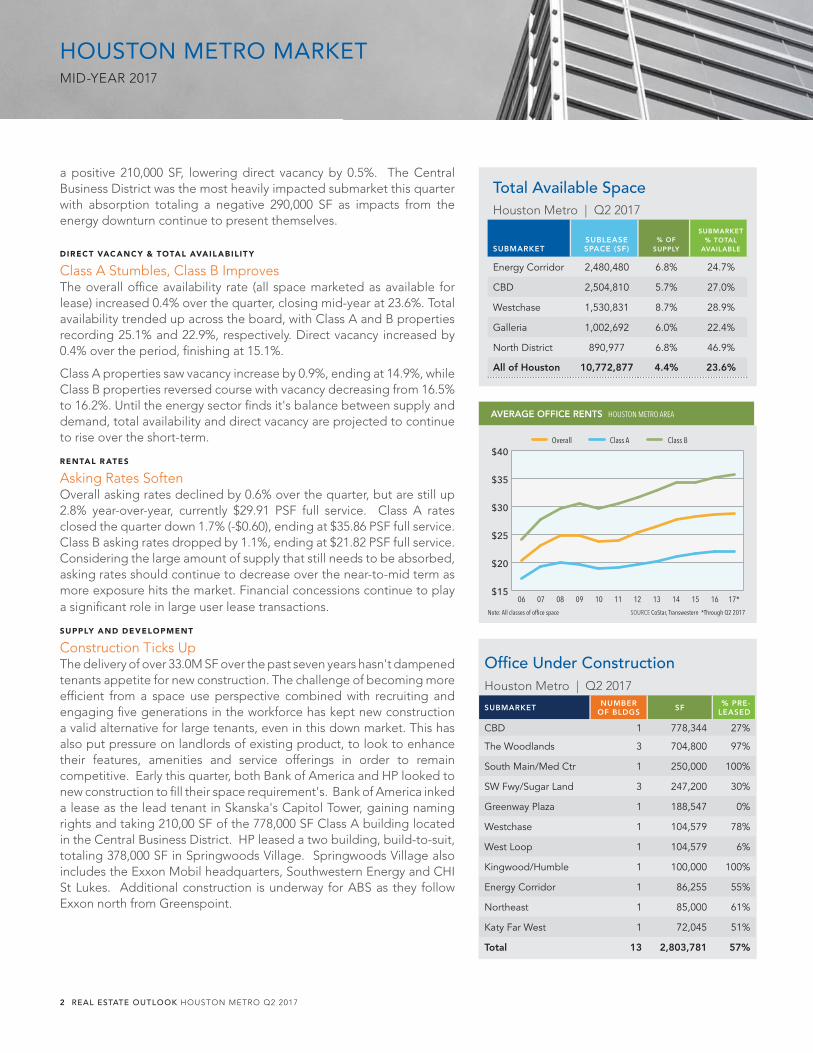
a positive 210,000 SF, lowering direct vacancy by 0.5%. The Central Business District was the most heavily impacted submarket this quarter with absorption totaling a negative 290,000 SF as impacts from the energy downturn continue to present themselves.
DIRECT VACANCY & TOTAL AVAIL ABILIT Y
Class A Stumbles, Class B ImprovesThe overall offi ce availability rate (all space marketed as available for lease) increased 0.4% over the quarter, closing mid-year at 23.6%. Total availability trended up across the board, with Class A and B properties recording 25.1% and 22.9%, respectively. Direct vacancy increased by 0.4% over the period, fi nishing at 15.1%.
Class A properties saw vacancy increase by 0.9%, ending at 14.9%, while Class B properties reversed course with vacancy decreasing from 16.5% to 16.2%. Until the energy sector fi nds it's balance between supply and demand, total availability and direct vacancy are projected to continue to rise over the short-term.
RENTAL R ATES
Asking Rates SoftenOverall asking rates declined by 0.6% over the quarter, but are still up 2.8% year-over-year, currently $29.91 PSF full service. Class A rates closed the quarter down 1.7% (-$0.60), ending at $35.86 PSF full service. Class B asking rates dropped by 1.1%, ending at $21.82 PSF full service. Considering the large amount of supply that still needs to be absorbed, asking rates should continue to decrease over the near-to-mid term as more exposure hits the market. Financial concessions continue to play a signifi cant role in large user lease transactions.
SUPPLY AND DEVELOPMENT
Construction Ticks UpThe delivery of over 33.0M SF over the past seven years hasn't dampened tenants appetite for new construction. The challenge of becoming more effi cient from a space use perspective combined with recruiting and engaging fi ve generations in the workforce has kept new construction a valid alternative for large tenants, even in this down market. This has also put pressure on landlords of existing product, to look to enhance their features, amenities and service offerings in order to remain competitive. Early this quarter, both Bank of America and HP looked to new construction to fi ll their space requirement's. Bank of America inked a lease as the lead tenant in Skanska's Capitol Tower, gaining naming rights and taking 210,00 SF of the 778,000 SF Class A building located in the Central Business District. HP leased a two building, build-to-suit, totaling 378,000 SF in Springwoods Village. Springwoods Village also includes the Exxon Mobil headquarters, Southwestern Energy and CHI St Lukes. Additional construction is underway for ABS as they follow Exxon north from Greenspoint.
Offi ce Under ConstructionHouston Metro | Q2 2017
SUBMARKET NUMBER OF BLDGS SF % PRE-
LEASED
CBD 1 778,344 27%
The Woodlands 3 704,800 97%
South Main/Med Ctr 1 250,000 100%
SW Fwy/Sugar Land 3 247,200 30%
Greenway Plaza 1 188,547 0%
Westchase 1 104,579 78%
West Loop 1 104,579 6%
Kingwood/Humble 1 100,000 100%
Energy Corridor 1 86,255 55%
Northeast 1 85,000 61%
Katy Far West 1 72,045 51%
Total 13 2,803,781 57%
AVERAGE OFFICE RENTS HOUSTON METRO AREA
SOURCE CoStar, Transwestern *Through Q2 2017 Note: All classes of offi ce space
Total Available SpaceHouston Metro | Q2 2017
SUBMARKETSUBLEASE SPACE (SF)
% OF SUPPLY
SUBMARKET % TOTAL
AVAILABLE
Energy Corridor 2,480,480 6.8% 24.7%
CBD 2,504,810 5.7% 27.0%
Westchase 1,530,831 8.7% 28.9%
Galleria 1,002,692 6.0% 22.4%
North District 890,977 6.8% 46.9%
All of Houston 10,772,877 4.4% 23.6%
$15
$20
$25
$30
$35
$40Class BClass AOverall
17*1615141312111009080706
2 REAL ESTATE OUTLOOK HOUSTON METRO Q2 2017
HOUSTON METRO MARKETMID-YEAR 2017
ET

The largest projects currently under construction are Capitol Tower (CBD, 778,000 SF - 27% leased to Bank of America), CityPlace 3 (The Woodlands, 328,000 SF - 100% leased to HP), CityPlace 2 (The Woodlands, 326,000 SF - 100% Leased to ABS) and The Kirby Collection, a new mixed-use project with a large offi ce component (Greenway Plaza, 212,000 SF). The current preleased percentage of properties currently under construction is 57%.
INVESTMENT MARKET
Interest in Houston continues to increaseInvestment activity continues to pick up throughout the Houston metro, regardless of the setback in the energy sector. The underlying fundamentals of the market are strong and stabilization in the energy sector should avail itself over the next 9-12 months, creating positive sentiment amongst investors. Sales for the quarter totaled $946 million, comprised of 20 transactions, up 408% year-over-year, when there was just $186.3 million in investment sales.
Early in the quarter, Canada Pension Plan Investment Board (CPPIB) and TH Real Estate/Silverpeak Real estate completed a transaction to acquire a 49.5% stake in Greenway Plaza & Phoenix Tower (5.0 MSF) from Parkway Inc. Shortly thereafter, CPPIB doubled down and acquired the remainder of Greenway Plaza along with Parkway's outright operations and remaining portfolio in Houston (8.7 MSF). The size and nature of these transactions underscore the belief in the long term viability of the Houston offi ce market.
As market activity continues to trend up, so to have price per square foot trade averages. Offi ce sales averaged $172/SF, an increase of 11% quarter-over-quarter. Cap rates also compressed slightly, down 0.1% and settling at 7.9% for the period. These fi gures represent assets for which pricing information could be obtained.
COMPARATIVE OFFICE INVESTMENT SALES VOLUME SELECT METRO AREAS
SOURCE Real Capital Analytics, Transwestern ,*Through Q2 2017
AVERAGE OFFICE SALE PRICE HOUSTON METRO AREA
SOURCE Real Capital Analytics, Transwestern,*Through Q2 2017
Notable Q2 TransactionsBUILDING SUBMARKET SF SELLER BUYER
Greenway Plaza Portfolio Greenway Plaza 5,013,052 Parkway TH Real Estate/CPPIB
Noble Energy Center II FM 1960 470,623 Trammel Crow CalSTRS
1700 West Loop South Galleria/Uptown 272,941 The ROC Fund Lingerfelt Commonwealth Partners
Bellaire Atrium I & II Bellaire 350,000 Braun Properties SLS Properties
SOURCE Real Capital Analytics, HFF, Transwestern
Sales
Volu
me i
n Billi
ons
$0
$1
$2
$3
$4
$5
$6
$7
$8HoustonDenverDallasAtlanta
17*1615141312111009080706
$0
$50
$100
$150
$200
$250 Average Sale Price Per SF
17*1615141312111009080706
REAL ESTATE OUTLOOK HOUSTON METRO Q2 2017 3

OUTLOOK
Patience and EnergyThe Houston metro area has been lauded for how diversifi cation has helped to mitigate the effects of the energy downturn. Growth in industries such as healthcare, petrochemical, distribution and retail/hospitality have helped offset many of the jobs lost in the energy sector. However, as those sectors wind down their growth cycles, it leaves little doubt that a true recovery for offi ce will be tethered to stabilization and return to form in the energy sector. As such, continued focus will be placed upon North American crude inventories, OPEC’s willingness to maintain production cuts, and the resulting impacts to the spot price of WTI.
Overall market activity is projected to remain muted through the third quarter with rising vacancy and falling asking rates. Insulated suburban submarkets such as Sugar Land and The Woodlands will continue to perform above market standards, while areas such as the Energy Corridor and Central Business District face the majority of the headwinds left to navigate.
Multi-tenant market vs Transwestern comprehensive market coverage
MULTI-TENANT ENTIRE MARKET
Inventory 198.8 MSF 242.4 MSF
Overall Vacancy 18.5% 15.1%
Q2 Net Absorption (1,749,399 SF) (2,471,884) SF
WHY OUR METHODOLOGY IS THE BEST INDICATOR OF CURRENT MARKET CONDITIONSWe include owner occupied and single-tenant buildings in our inventory, vacancy and absorption statistics to capture more market activity than many of our competitors. This allows us to better correlate changes in the market with changes in employment. As single-tenant space does compete with multi-tenant space, we believe it is critical to understand all components of the market. The inclusion of single-tenant and owner-occupied space tends to yield lower vacancy rates and higher absorption totals than some of our competitors’ results, but our coverage of the market is more comprehensive.
OFFICE ABSORPTION AND EMPLOYMENT HOUSTON METRO AREA
SOURCE Bureau of Labor Statistics, Transwestern *12-month job growth through May 2017, net absorption YTD through Q2 2017
-2500
-1125
250
1625
3000
4375
5750
7125
8500Net Absorption (Thousands of SF)
17*1615141312111009080706
Payroll Job Growth (in Thousands)
4 REAL ESTATE OUTLOOK HOUSTON METRO Q2 2017
HOUSTON METRO MARKETMID-YEAR 2017
ET
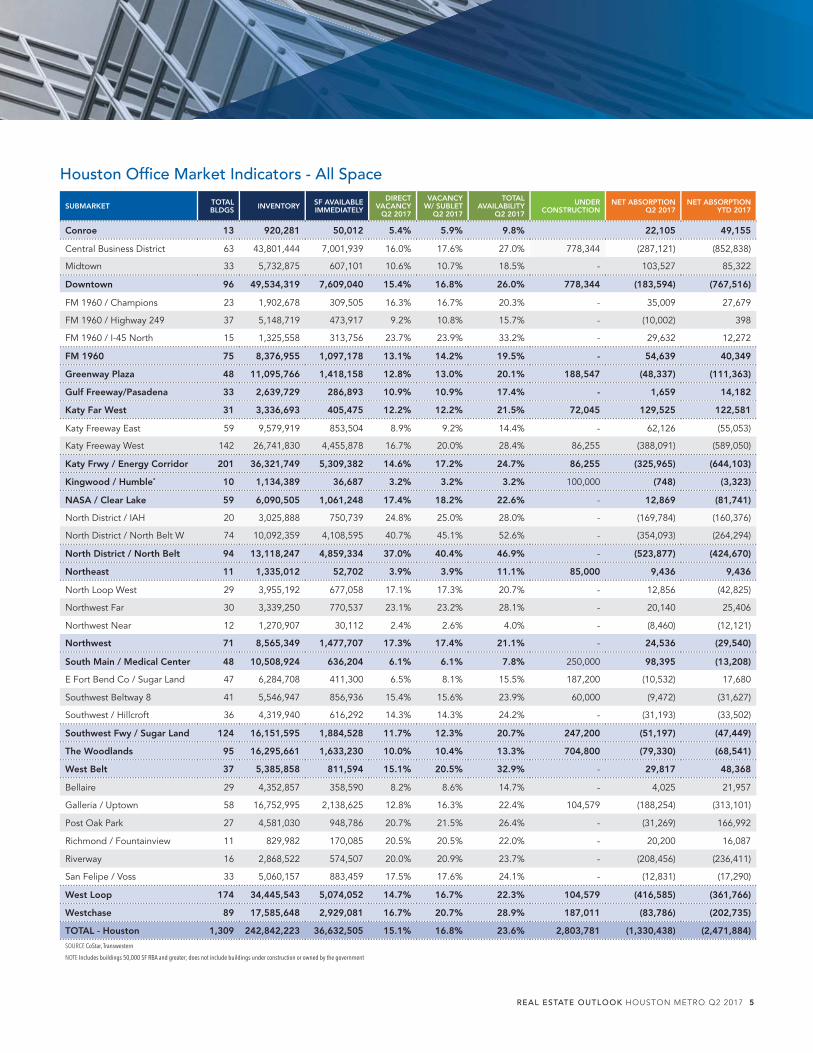
Houston Offi ce Market Indicators - All Space
SUBMARKET TOTAL BLDGS INVENTORY SF AVAILABLE
IMMEDIATELY
DIRECT VACANCY
Q2 2017
VACANCY W/ SUBLET
Q2 2017
TOTAL AVAILABILITY
Q2 2017
UNDER CONSTRUCTION
NET ABSORPTION Q2 2017
NET ABSORPTION YTD 2017
Conroe 13 920,281 50,012 5.4% 5.9% 9.8% 22,105 49,155
Central Business District 63 43,801,444 7,001,939 16.0% 17.6% 27.0% 778,344 (287,121) (852,838)
Midtown 33 5,732,875 607,101 10.6% 10.7% 18.5% - 103,527 85,322
Downtown 96 49,534,319 7,609,040 15.4% 16.8% 26.0% 778,344 (183,594) (767,516)
FM 1960 / Champions 23 1,902,678 309,505 16.3% 16.7% 20.3% - 35,009 27,679
FM 1960 / Highway 249 37 5,148,719 473,917 9.2% 10.8% 15.7% - (10,002) 398
FM 1960 / I-45 North 15 1,325,558 313,756 23.7% 23.9% 33.2% - 29,632 12,272
FM 1960 75 8,376,955 1,097,178 13.1% 14.2% 19.5% - 54,639 40,349
Greenway Plaza 48 11,095,766 1,418,158 12.8% 13.0% 20.1% 188,547 (48,337) (111,363)
Gulf Freeway/Pasadena 33 2,639,729 286,893 10.9% 10.9% 17.4% - 1,659 14,182
Katy Far West 31 3,336,693 405,475 12.2% 12.2% 21.5% 72,045 129,525 122,581
Katy Freeway East 59 9,579,919 853,504 8.9% 9.2% 14.4% - 62,126 (55,053)
Katy Freeway West 142 26,741,830 4,455,878 16.7% 20.0% 28.4% 86,255 (388,091) (589,050)
Katy Frwy / Energy Corridor 201 36,321,749 5,309,382 14.6% 17.2% 24.7% 86,255 (325,965) (644,103)
Kingwood / Humble* 10 1,134,389 36,687 3.2% 3.2% 3.2% 100,000 (748) (3,323)
NASA / Clear Lake 59 6,090,505 1,061,248 17.4% 18.2% 22.6% - 12,869 (81,741)
North District / IAH 20 3,025,888 750,739 24.8% 25.0% 28.0% - (169,784) (160,376)
North District / North Belt W 74 10,092,359 4,108,595 40.7% 45.1% 52.6% - (354,093) (264,294)
North District / North Belt 94 13,118,247 4,859,334 37.0% 40.4% 46.9% - (523,877) (424,670)
Northeast 11 1,335,012 52,702 3.9% 3.9% 11.1% 85,000 9,436 9,436
North Loop West 29 3,955,192 677,058 17.1% 17.3% 20.7% - 12,856 (42,825)
Northwest Far 30 3,339,250 770,537 23.1% 23.2% 28.1% - 20,140 25,406
Northwest Near 12 1,270,907 30,112 2.4% 2.6% 4.0% - (8,460) (12,121)
Northwest 71 8,565,349 1,477,707 17.3% 17.4% 21.1% - 24,536 (29,540)
South Main / Medical Center 48 10,508,924 636,204 6.1% 6.1% 7.8% 250,000 98,395 (13,208)
E Fort Bend Co / Sugar Land 47 6,284,708 411,300 6.5% 8.1% 15.5% 187,200 (10,532) 17,680
Southwest Beltway 8 41 5,546,947 856,936 15.4% 15.6% 23.9% 60,000 (9,472) (31,627)
Southwest / Hillcroft 36 4,319,940 616,292 14.3% 14.3% 24.2% - (31,193) (33,502)
Southwest Fwy / Sugar Land 124 16,151,595 1,884,528 11.7% 12.3% 20.7% 247,200 (51,197) (47,449)
The Woodlands 95 16,295,661 1,633,230 10.0% 10.4% 13.3% 704,800 (79,330) (68,541)
West Belt 37 5,385,858 811,594 15.1% 20.5% 32.9% - 29,817 48,368
Bellaire 29 4,352,857 358,590 8.2% 8.6% 14.7% - 4,025 21,957
Galleria / Uptown 58 16,752,995 2,138,625 12.8% 16.3% 22.4% 104,579 (188,254) (313,101)
Post Oak Park 27 4,581,030 948,786 20.7% 21.5% 26.4% - (31,269) 166,992
Richmond / Fountainview 11 829,982 170,085 20.5% 20.5% 22.0% - 20,200 16,087
Riverway 16 2,868,522 574,507 20.0% 20.9% 23.7% - (208,456) (236,411)
San Felipe / Voss 33 5,060,157 883,459 17.5% 17.6% 24.1% - (12,831) (17,290)
West Loop 174 34,445,543 5,074,052 14.7% 16.7% 22.3% 104,579 (416,585) (361,766)
Westchase 89 17,585,648 2,929,081 16.7% 20.7% 28.9% 187,011 (83,786) (202,735)
TOTAL - Houston 1,309 242,842,223 36,632,505 15.1% 16.8% 23.6% 2,803,781 (1,330,438) (2,471,884)
SOURCE CoStar, Transwestern
NOTE Includes buildings 50,000 SF RBA and greater; does not include buildings under construction or owned by the government
-
REAL ESTATE OUTLOOK HOUSTON METRO Q2 2017 5

Houston Offi ce Market Indicators - Class A
SUBMARKET TOTAL BLDGS INVENTORY SF AVAILABLE
IMMEDIATELY
DIRECT VACANCY
Q2 2017
VACANCY W/ SUBLET
Q2 2017
TOTAL AVAILABILITY
Q2 2017
UNDER CONSTRUCTION
NET ABSORPTION
Q2 2017
NET ABSORPTION
YTD 2017
Conroe 2 128,832 9,246 7.2% 7.2% 11.4% - 0 0
Central Business District 37 34,029,410 4,266,651 12.5% 14.3% 24.7% 778,344 (274,656) (504,925)
Midtown 8 2,486,094 374,424 15.1% 15.2% 28.7% - 9,619 (2,947)
Downtown 45 36,515,504 4,641,075 12.7% 14.4% 25.0% 778,344 (265,037) (507,872)
FM 1960 / Champions 1 150,000 - 0.0% 0.0% 0.0% - 0 0
FM 1960 / Highway 249 17 3,729,412 315,327 8.5% 8.9% 10.9% - (7,648) (6,308)
FM 1960 / I-45 North 2 206,705 54,512 26.4% 26.4% 37.2% - (25,387) (25,387)
FM 1960 20 4,086,117 369,839 9.1% 9.4% 11.8% - (33,035) (31,695)
Greenway Plaza 20 7,356,944 1,017,381 13.8% 14.0% 23.3% 188,547 (16,813) (47,876)
Gulf Freeway/Pasadena - - - - - - - - -
Katy Far West 16 1,647,243 403,252 24.5% 24.5% 32.6% 72,045 112,492 105,548
Katy Freeway East 24 5,761,894 591,698 10.3% 10.4% 14.8% - 55,744 (71,260)
Katy Freeway West 72 18,772,511 2,838,069 15.1% 19.7% 28.2% 86,255 (476,677) (439,525)
Katy Frwy / Energy Corridor 96 24,534,405 3,429,767 14.0% 17.5% 25.0% 86,255 (420,933) (510,785)
Kingwood / Humble 2 144,312 9,393 6.5% 6.5% 6.5% - 0 0
NASA / Clear Lake 15 2,026,658 115,260 5.7% 8.0% 13.8% - (2,238) (29,765)
North District / IAH 8 1,213,677 550,716 45.4% 45.9% 49.3% - (162,501) (153,093)
North District / North Belt W 17 4,334,810 2,227,120 51.4% 57.0% 66.8% - (229,525) (162,155)
North District / North Belt 25 5,548,487 2,777,836 50.1% 54.5% 63.0% - (392,026) (315,248)
Northeast 3 640,700 - 0.0% 0.0% 5.1% 85,000 0 0
North Loop West 6 1,240,544 365,962 29.5% 30.0% 31.2% - (26,182) (39,372)
Northwest Near 4 797,237 316,089 39.6% 40.1% 43.8% - 12,247 19,666
Northwest Far 1 237,384 - 0.0% 0.0% 0.0% - 0 0
Northwest 11 2,275,165 682,051 30.0% 30.4% 32.3% - (13,935) (19,706)
South Main / Medical Center 16 4,810,992 198,363 4.1% 4.1% 6.4% 250,000 88,920 (34,563)
E Fort Bend Co / Sugar Land 21 3,867,531 233,299 6.0% 8.3% 14.1% 94,200 (27,338) (5,733)
Southwest Beltway 8 3 566,699 48,955 8.6% 8.6% 16.3% - 0 (355)
Southwest / Hillcroft 6 1,485,352 222,342 15.0% 15.0% 34.4% - (11,572) 6,107
Southwest Fwy / Sugar Land 30 5,919,582 504,596 8.5% 10.0% 19.4% 94,200 (38,910) 19
The Woodlands 43 11,561,902 1,204,295 10.4% 10.8% 13.2% 704,800 (76,136) (17,089)
West Belt 23 4,085,321 660,291 16.2% 20.7% 34.1% - (8,385) 3,089
Bellaire 8 1,470,637 165,752 11.3% 12.1% 23.7% - (168) 19,733
Galleria / Uptown 35 13,410,461 1,792,901 13.4% 17.7% 24.2% 104,579 (199,358) (327,646)
Post Oak Park 9 2,617,868 773,434 29.5% 30.9% 35.5% - (15,766) 157,963
Riverway 5 1,885,813 389,330 20.6% 21.7% 24.7% - - -
Richmond / Fountainview - - - - - - - (187,841) (213,581)
San Felipe / Voss 3 1,720,793 398,289 23.1% 23.2% 31.0% - 2,683 31,599
West Loop 60 21,105,572 3,519,706 16.7% 19.8% 26.2% 104,579 (400,450) (331,932)
Westchase 33 9,958,830 1,678,617 16.9% 23.8% 32.4% 187,011 (81,353) (159,201)
TOTAL - Houston 460 142,346,566 21,220,968 14.9% 17.3% 25.1% 2,550,781 (1,547,839) (1,897,076)
SOURCE CoStar, Transwestern
NOTE Includes buildings 50,000 SF RBA and greater; does not include buildings under construction or owned by the government
6 REAL ESTATE OUTLOOK HOUSTON METRO Q2 2017
HOUSTON METRO MARKETMID-YEAR 2017
ET

SOURCE CoStar, Transwestern
NOTE Includes buildings 50,000 SF RBA and greater; does not include buildings under construction or owned by the government
Houston Offi ce Market Indicators - Class B
SUBMARKET TOTAL BLDGS INVENTORY SF AVAILABLE
IMMEDIATELY
DIRECT VACANCY
Q2 2017
VACANCY W/ SUBLET
Q2 2017
TOTAL AVAILABILITY
Q2 2017
UNDER CONSTRUCTION
NET ABSORPTION
Q2 2017
NET ABSORPTION
YTD 2017
Conroe 10 688,859 40,766 5.9% 6.6% 10.9% - 22,105 49,155
Central Business District 23 9,473,998 2,712,131 28.6% 29.4% 35.8% - (3,954) (339,402)
Midtown 21 3,024,080 176,364 5.8% 6.0% 9.6% - 93,908 94,582
Downtown 44 12,498,078 2,888,495 23.1% 23.7% 29.5% - 89,954 (244,820)
FM 1960 / Champions 20 1,632,482 309,505 19.0% 19.5% 23.7% - 28,669 21,339
FM 1960 / Highway 249 18 1,315,795 151,590 11.5% 16.7% 29.7% - (8,406) (4,574)
FM 1960 / I-45 North 11 968,836 208,015 21.5% 21.8% 32.2% - 50,675 33,315
FM 1960 49 3,917,113 669,110 17.1% 19.1% 27.8% - 70,938 50,080
Greenway Plaza 26 3,598,525 350,089 9.7% 10.0% 12.9% - (31,524) (61,961)
Gulf Freeway / Pasadena 27 2,186,695 207,944 9.5% 9.5% 17.3% - 1,587 13,588
Katy Far West 14 1,570,188 2,223 0.1% 0.1% 11.5% - 17,033 17,033
Katy Freeway East 26 2,865,924 257,476 9.0% 9.7% 17.8% - (11,720) (7,132)
Katy Freeway West 67 7,727,805 1,611,032 20.8% 21.3% 29.4% - 88,586 (149,525)
Katy Fwy / Energy Corridor 93 10,593,729 1,868,508 17.6% 18.2% 26.3% - 76,866 (156,657)
Kingwood / Humble 8 990,077 27,294 2.8% 2.8% 2.8% 100,000 (748) (3,323)
NASA / Clear Lake 42 3,912,140 942,452 24.1% 24.1% 27.9% - 18,643 (50,492)
North District / IAH 10 1,343,858 200,023 14.9% 14.9% 18.7% - (7,283) (7,283)
North District / North Belt W 45 4,739,729 1,633,481 34.5% 38.6% 44.0% - (102,653) (71,308)
North District / North Belt 55 6,083,587 1,833,504 30.1% 33.4% 38.4% - (109,936) (78,591)
Northeast* 5 438,708 47,734 10.9% 10.9% 17.8% - 14,404 14,404
North Loop West 21 2,596,527 309,456 11.9% 12.0% 15.8% - 25,238 (2,572)
Northwest Near 23 2,294,586 454,448 19.8% 19.8% 25.7% - 7,893 5,740
Northwest Far 9 873,086 30,112 3.4% 3.8% 5.9% - (8,460) (12,121)
Northwest 53 5,764,199 794,016 13.8% 13.8% 18.2% - 24,671 (8,953)
South Main / Medical Center 19 4,025,606 410,431 10.2% 10.2% 11.6% - 10,098 24,663
E Fort Bend Co / Sugar Land 25 2,343,177 178,001 7.6% 8.1% 18.4% 93,000 16,806 23,413
Southwest Beltway 8 33 4,622,364 788,920 17.1% 17.2% 25.9% 60,000 (7,313) (35,651)
Southwest / Hillcroft 19 1,794,770 322,618 18.0% 18.1% 22.8% (20,890) (28,657)
Southwest Fwy / Sugar Land 77 8,760,311 1,289,539 14.7% 14.9% 23.3% 153,000 (11,397) (40,895)
The Woodlands 50 4,453,074 428,935 9.6% 10.0% 14.4% - (3,194) (51,452)
West Belt 14 1,300,537 151,303 11.6% 19.8% 29.0% - 38,202 45,279
Bellaire 17 2,498,714 154,107 6.2% 6.3% 10.0% - 3,658 5,334
Galleria 22 3,266,742 345,724 10.6% 10.9% 15.7% - 11,104 14,545
Post Oak Park 16 1,803,120 175,352 9.7% 9.7% 15.6% - (15,503) 9,029
Riverway 7 570,270 146,589 25.7% 25.7% 27.6% - 17,720 15,577
Richmond / Fountainview 9 870,153 182,477 21.0% 21.7% 24.5% - (22,127) (31,191)
San Felipe / Voss 30 3,339,364 485,170 14.5% 14.7% 20.5% - (15,514) (48,889)
West Loop 101 12,348,363 1,489,419 12.1% 12.3% 17.0% - (20,662) (35,595)
Westchase 52 7,132,965 1,219,140 17.1% 17.3% 25.5% - 3,329 (29,726)
TOTAL - Houston 739 90,262,754 14,660,902 16.2% 16.9% 22.9% 253,000 210,369 (548,263)
REAL ESTATE OUTLOOK HOUSTON METRO Q2 2017 7
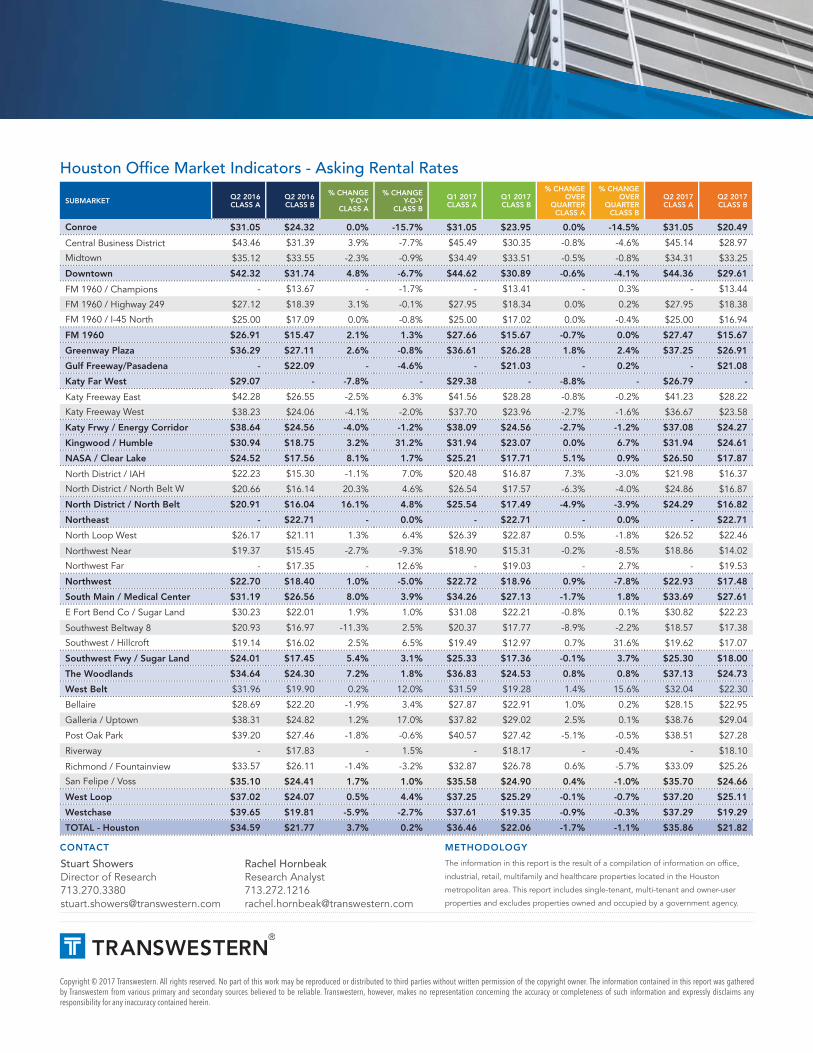
Copyright © 2017 Transwestern. All rights reserved. No part of this work may be reproduced or distributed to third parties without written permission of the copyright owner. The information contained in this report was gathered by Transwestern from various primary and secondary sources believed to be reliable. Transwestern, however, makes no representation concerning the accuracy or completeness of such information and expressly disclaims any responsibility for any inaccuracy contained herein.
METHODOLOGY
The information in this report is the result of a compilation of information on offi ce,
industrial, retail, multifamily and healthcare properties located in the Houston
metropolitan area. This report includes single-tenant, multi-tenant and owner-user
properties and excludes properties owned and occupied by a government agency.
Rachel HornbeakResearch [email protected]
Stuart ShowersDirector of [email protected]
CONTACT
SUBMARKET Q2 2016 CLASS A
Q2 2016 CLASS B
% CHANGEY-O-Y
CLASS A
% CHANGEY-O-Y
CLASS B
Q1 2017 CLASS A
Q1 2017 CLASS B
% CHANGE OVER
QUARTER CLASS A
% CHANGE OVER
QUARTER CLASS B
Q2 2017 CLASS A
Q2 2017 CLASS B
Conroe $31.05 $24.32 0.0% -15.7% $31.05 $23.95 0.0% -14.5% $31.05 $20.49
Central Business District $43.46 $31.39 3.9% -7.7% $45.49 $30.35 -0.8% -4.6% $45.14 $28.97
Midtown $35.12 $33.55 -2.3% -0.9% $34.49 $33.51 -0.5% -0.8% $34.31 $33.25
Downtown $42.32 $31.74 4.8% -6.7% $44.62 $30.89 -0.6% -4.1% $44.36 $29.61
FM 1960 / Champions - $13.67 - -1.7% - $13.41 - 0.3% - $13.44
FM 1960 / Highway 249 $27.12 $18.39 3.1% -0.1% $27.95 $18.34 0.0% 0.2% $27.95 $18.38
FM 1960 / I-45 North $25.00 $17.09 0.0% -0.8% $25.00 $17.02 0.0% -0.4% $25.00 $16.94
FM 1960 $26.91 $15.47 2.1% 1.3% $27.66 $15.67 -0.7% 0.0% $27.47 $15.67
Greenway Plaza $36.29 $27.11 2.6% -0.8% $36.61 $26.28 1.8% 2.4% $37.25 $26.91
Gulf Freeway/Pasadena - $22.09 - -4.6% - $21.03 - 0.2% - $21.08
Katy Far West $29.07 - -7.8% - $29.38 - -8.8% - $26.79 -
Katy Freeway East $42.28 $26.55 -2.5% 6.3% $41.56 $28.28 -0.8% -0.2% $41.23 $28.22
Katy Freeway West $38.23 $24.06 -4.1% -2.0% $37.70 $23.96 -2.7% -1.6% $36.67 $23.58
Katy Frwy / Energy Corridor $38.64 $24.56 -4.0% -1.2% $38.09 $24.56 -2.7% -1.2% $37.08 $24.27
Kingwood / Humble $30.94 $18.75 3.2% 31.2% $31.94 $23.07 0.0% 6.7% $31.94 $24.61
NASA / Clear Lake $24.52 $17.56 8.1% 1.7% $25.21 $17.71 5.1% 0.9% $26.50 $17.87
North District / IAH $22.23 $15.30 -1.1% 7.0% $20.48 $16.87 7.3% -3.0% $21.98 $16.37
North District / North Belt W $20.66 $16.14 20.3% 4.6% $26.54 $17.57 -6.3% -4.0% $24.86 $16.87
North District / North Belt $20.91 $16.04 16.1% 4.8% $25.54 $17.49 -4.9% -3.9% $24.29 $16.82
Northeast - $22.71 - 0.0% - $22.71 - 0.0% - $22.71
North Loop West $26.17 $21.11 1.3% 6.4% $26.39 $22.87 0.5% -1.8% $26.52 $22.46
Northwest Near $19.37 $15.45 -2.7% -9.3% $18.90 $15.31 -0.2% -8.5% $18.86 $14.02
Northwest Far - $17.35 - 12.6% - $19.03 - 2.7% - $19.53
Northwest $22.70 $18.40 1.0% -5.0% $22.72 $18.96 0.9% -7.8% $22.93 $17.48
South Main / Medical Center $31.19 $26.56 8.0% 3.9% $34.26 $27.13 -1.7% 1.8% $33.69 $27.61
E Fort Bend Co / Sugar Land $30.23 $22.01 1.9% 1.0% $31.08 $22.21 -0.8% 0.1% $30.82 $22.23
Southwest Beltway 8 $20.93 $16.97 -11.3% 2.5% $20.37 $17.77 -8.9% -2.2% $18.57 $17.38
Southwest / Hillcroft $19.14 $16.02 2.5% 6.5% $19.49 $12.97 0.7% 31.6% $19.62 $17.07
Southwest Fwy / Sugar Land $24.01 $17.45 5.4% 3.1% $25.33 $17.36 -0.1% 3.7% $25.30 $18.00
The Woodlands $34.64 $24.30 7.2% 1.8% $36.83 $24.53 0.8% 0.8% $37.13 $24.73
West Belt $31.96 $19.90 0.2% 12.0% $31.59 $19.28 1.4% 15.6% $32.04 $22.30
Bellaire $28.69 $22.20 -1.9% 3.4% $27.87 $22.91 1.0% 0.2% $28.15 $22.95
Galleria / Uptown $38.31 $24.82 1.2% 17.0% $37.82 $29.02 2.5% 0.1% $38.76 $29.04
Post Oak Park $39.20 $27.46 -1.8% -0.6% $40.57 $27.42 -5.1% -0.5% $38.51 $27.28
Riverway - $17.83 - 1.5% - $18.17 - -0.4% - $18.10
Richmond / Fountainview $33.57 $26.11 -1.4% -3.2% $32.87 $26.78 0.6% -5.7% $33.09 $25.26
San Felipe / Voss $35.10 $24.41 1.7% 1.0% $35.58 $24.90 0.4% -1.0% $35.70 $24.66
West Loop $37.02 $24.07 0.5% 4.4% $37.25 $25.29 -0.1% -0.7% $37.20 $25.11
Westchase $39.65 $19.81 -5.9% -2.7% $37.61 $19.35 -0.9% -0.3% $37.29 $19.29
TOTAL - Houston $34.59 $21.77 3.7% 0.2% $36.46 $22.06 -1.7% -1.1% $35.86 $21.82
Houston Offi ce Market Indicators - Asking Rental Rates

OVERVIEW
Sublease space on the decline for first time since 2012As the long and grinding year of 2016 came to a close, sentiment surrounding the Houston office sector took a positive turn as several indicators point to the beginnings of a market rebound. Unfortunately, these indicators occurred primarily on the economic side with factors such as oil, jobs and PMI gaining ground, whereas office metrics have generally continued to weaken following the recent downturn. One core metric that showed visible improvement was total available sublease space. The decline in the fourth quarter, marked the first decrease since 2012, and sublease space closed the year at 11.6M SF available after peaking with over 12.5M SF available in the third quarter. Sublease space reductions were triggered through various scenarios making it difficult to determine if the decline is the beginning of a trend or simply a short-term break from an endless supply of space. ConocoPhillips represented the largest reduction in sublease availability (597k SF) as they opted to retain their Energy Corridor listing in order to consolidate operations from an aging multi-building campus. Alternatively, tenants such as Thompson & Knight and Breitburn Energy looked to leverage sublease availability to lock in favorable terms at high-quality Class A locations. A trend that will continue given the extended term, credit worthy nature and desirable locations of many sublease offerings.
NET ABSORPTION
Absorption continues to fall shortIn the fourth quarter, impacts of the energy downturn are still being realized as quarterly net absorption for all classes of office was again negative, posting -737,000 SF, with Class A coming in at -230,000 SF.
HOUSTON OFFICE MARKETYEAR-END 2016
REAL ESTATE OUTLOOK
Office Market Beginning to Show Signs of Improvement Sublet Supply Decreases
NET ABSORPTION AND VACANCY RATE TRENDS HOUSTON METRO AREA
CONTIGUOUS BLOCKS OF AVAILABLE SPACE HOUSTON METRO
SOURCE CoStar, Transwestern *Through Q4 2016
SOURCE CoStar, Transwestern *Through Q4 2016
Note: Delivery of preleased space counts as positive net absorption
Notable Q4 LeasesTENANT SF LEASE TYPE BUILDING SUBMARKET
Breitburn Energy Partners 109,476 Sublease Heritage Plaza CBD
ABM Industries, Inc. 63,000 New 14141 Southwest Fwy East Fort Bend Co/Sugar Land
Thompson & Knight 60,628 Sublease 811 Main St CBD
Diamond McCarthy, LLP 46,840 New 2 Houston Center CBD
05 06 07 08 09 10 11 12 13 14 15 16
Net Absorption (Thousands of SF) Direct Vacancy Rate Total Availability
5%7%9%
11%13%15%17%19%21%23%
-1,00001,0002,0003,0004,0005,0006,0007,0008,000
25,000 SF 50,000 SF 100,000 SF 200,000 SF
Class A Direct Class A Sublet Class B Direct Class B Sublet
020406080100120140160180
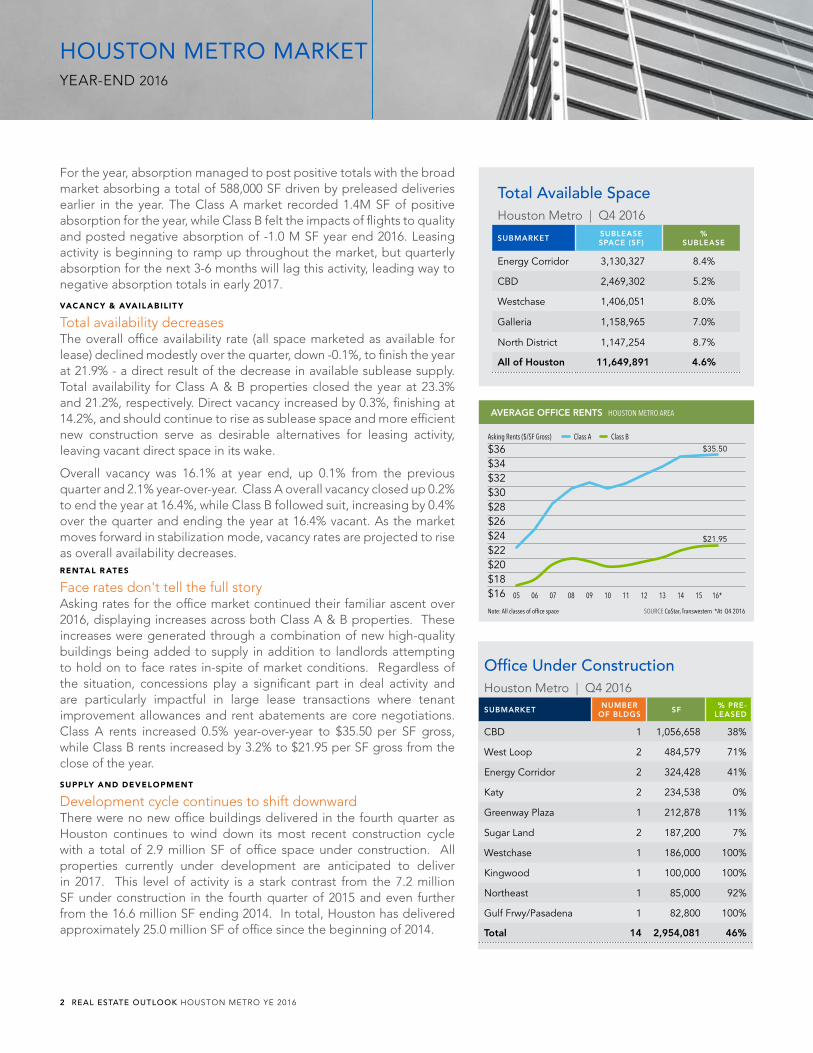
For the year, absorption managed to post positive totals with the broad market absorbing a total of 588,000 SF driven by preleased deliveries earlier in the year. The Class A market recorded 1.4M SF of positive absorption for the year, while Class B felt the impacts of flights to quality and posted negative absorption of -1.0 M SF year end 2016. Leasing activity is beginning to ramp up throughout the market, but quarterly absorption for the next 3-6 months will lag this activity, leading way to negative absorption totals in early 2017.
VACANCY & AVAIL ABILIT Y
Total availability decreases The overall office availability rate (all space marketed as available for lease) declined modestly over the quarter, down -0.1%, to finish the year at 21.9% - a direct result of the decrease in available sublease supply. Total availability for Class A & B properties closed the year at 23.3% and 21.2%, respectively. Direct vacancy increased by 0.3%, finishing at 14.2%, and should continue to rise as sublease space and more efficient new construction serve as desirable alternatives for leasing activity, leaving vacant direct space in its wake.
Overall vacancy was 16.1% at year end, up 0.1% from the previous quarter and 2.1% year-over-year. Class A overall vacancy closed up 0.2% to end the year at 16.4%, while Class B followed suit, increasing by 0.4% over the quarter and ending the year at 16.4% vacant. As the market moves forward in stabilization mode, vacancy rates are projected to rise as overall availability decreases. RENTAL R ATES
Face rates don't tell the full story Asking rates for the office market continued their familiar ascent over 2016, displaying increases across both Class A & B properties. These increases were generated through a combination of new high-quality buildings being added to supply in addition to landlords attempting to hold on to face rates in-spite of market conditions. Regardless of the situation, concessions play a significant part in deal activity and are particularly impactful in large lease transactions where tenant improvement allowances and rent abatements are core negotiations. Class A rents increased 0.5% year-over-year to $35.50 per SF gross, while Class B rents increased by 3.2% to $21.95 per SF gross from the close of the year.
SUPPLY AND DEVELOPMENT
Development cycle continues to shift downwardThere were no new office buildings delivered in the fourth quarter as Houston continues to wind down its most recent construction cycle with a total of 2.9 million SF of office space under construction. All properties currently under development are anticipated to deliver in 2017. This level of activity is a stark contrast from the 7.2 million SF under construction in the fourth quarter of 2015 and even further from the 16.6 million SF ending 2014. In total, Houston has delivered approximately 25.0 million SF of office since the beginning of 2014.
Office Under ConstructionHouston Metro | Q4 2016
SUBMARKET NUMBER OF BLDGS SF % PRE-
LEASED
CBD 1 1,056,658 38%
West Loop 2 484,579 71%
Energy Corridor 2 324,428 41%
Katy 2 234,538 0%
Greenway Plaza 1 212,878 11%
Sugar Land 2 187,200 7%
Westchase 1 186,000 100%
Kingwood 1 100,000 100%
Northeast 1 85,000 92%
Gulf Frwy/Pasadena 1 82,800 100%
Total 14 2,954,081 46%
AVERAGE OFFICE RENTS HOUSTON METRO AREA
SOURCE CoStar, Transwestern *At Q4 2016 Note: All classes of office space
Total Available SpaceHouston Metro | Q4 2016
SUBMARKET SUBLEASE SPACE (SF)
% SUBLEASE
Energy Corridor 3,130,327 8.4%
CBD 2,469,302 5.2%
Westchase 1,406,051 8.0%
Galleria 1,158,965 7.0%
North District 1,147,254 8.7%
All of Houston 11,649,891 4.6%
05 06 07 08 09 10 11 12 13 14 15 16*
Asking Rents ($/SF Gross) Class A Class B
$16$18$20$22$24$26$28$30$32$34$36 $35.50
$21.95
2 REAL ESTATE OUTLOOK HOUSTON METRO YE 2016
HOUSTON METRO MARKETYEAR-END 2016

While the construction rate is slowing precipitously, the demand for efficient new construction continues, but will require anchor tenants such as HP and Bank of America who are both looking at new facilities and more efficient space utilization.
The largest projects currently under construction are 609 Main (CBD, 1.1 million SF) and Amegy Bank’s new headquarters located at 1717 West Loop South (Post Oak Park, 380,000 SF). The preleased percentage of properties currently under construction is 45% and is anticipated to increase further prior to delivery through the 2017 calendar year.
INVESTMENT MARKET
Investment activity picks upInvestment activity turned up in the final quarter of 2016 as deal volume in the metro recorded $851.0 million in office sales, more than doubling the total from the third quarter, while down 48% on a year-over-year basis. In October, the previously announced Cousins merger/acquisition/spin-off of Parkway Properties and their Galleria, Greenway Plaza, and Westchase assets was made final (~8.7M RSF). While this was a portion of a larger 35 property portfolio trade, the Houston properties will be spun off into their own local REIT, HoustonCo, that is positioned for additional acquisitions. Additionally, the Columbia Portfolio traded over the quarter as Spear Street Capital acquired 5 Houston Center, 5 Post Oak Park and Energy Center I for approximately $272 million, or $232 per SF. These Class A assets are strategically located in core Houston submarkets and offer Spear Street a value add opportunity through enhancing building features and amenities, elevating the offerings. This strategy will continue to be emulated throughout the market. Pricing per square foot averages acted in line with deal activity as quarter over quarter averages were up (162%) while year-over-year averages declined (-61%), coming in at $221/SF. Cap rates were flat over the quarter, currently averaging 8.0%. These figures represent assets for which pricing information could be obtained.
COMPARATIVE OFFICE INVESTMENT SALES VOLUME SELECT METRO AREAS
SOURCE Real Capital Analytics, Transwestern ,*Through Q4 2016
AVERAGE OFFICE SALE PRICE HOUSTON METRO AREA
SOURCE Real Capital Analytics, Transwestern,*Through Q4 2016
Notable Q4 TransactionsBUILDING SUBMARKET SF SELLER BUYER
5 Houston Center CBD 580,875 Columbia Property Trust Spear Street Capital, LLC
5 Post Oak Park Post Oak Park 567,264 Columbia Property Trust Spear Street Capital, LLC
Energy Center I Katy Fwy /Energy Corridor 332,000 Columbia Property Trust Spear Street Capital, LLC
SOURCE Real Capital Analytics, HFF, Transwestern
Sales Volume in Billions Atl Dal Den Hou
05 06 07 08 09 10 11 12 13 14 15 16*$0.0
$1.0
$2.0
$3.0
$4.0
$5.0
$6.0
Average Sale Price Per SF
05 06 07 08 09 10 11 12 13 14 15 16*
$203
$0
$50
$100
$150
$200
$250
REAL ESTATE OUTLOOK HOUSTON METRO YE 2016 3

OUTLOOK
Steady as she goesSentiment in the Houston office market is becoming positively optimistic as more signs point to having reached the bottom of the energy downturn and beginning a recovery. Factors such as positive job creation through a challenging 2016, crude prices stabilizing as OPEC agreed to production limits, and a pro-energy/business friendly administration being elected to office have resulted in an upbeat market. That being said, enthusiasm should be tempered as recovery will be a slow process that won’t always move in an upward trajectory. There are still several areas limiting the speed of recovery; overall job growth for 2017 is projected to be well below healthy market norms (~20k in 2017), the Petrochemical boom on the east side is waning, and while stabilizing in the high $40’s to low $50’s - short term energy forecasts show limited potential for additional increases through 2017. Additionally, the market has a total of 54 million SF of space marketed as available with 32 million occurring in Class A properties – a 4 to 5 year supply with job creation at typical levels of 60k per year. Simply put, the recovery will be slow and measured until once again, the energy engine moves into high gear.
Multi-tenant market vs Transwestern comprehensive market coverage
MULTI-TENANT ENTIRE MARKET
Inventory 196.8 MSF 248.4 MSF
Overall Vacancy 18.9% 15.4%
Q4 Net Absorption 394,220 SF (383,000) SF
WHY OUR METHODOLOGY IS THE BEST INDICATOR OF CURRENT MARKET CONDITIONSWe include owner occupied and single-tenant buildings in our inventory, vacancy and absorption statistics to capture more market activity than many of our competitors. This allows us to better correlate changes in the market with changes in employment. As single-tenant space does compete with multi-tenant space, we believe it is critical to understand all components of the market. The inclusion of single-tenant and owner-occupied space tends to yield lower vacancy rates and higher absorption totals than some of our competitors’ results, but our coverage of the market is more comprehensive.
OFFICE ABSORPTION AND EMPLOYMENT HOUSTON METRO AREA
SOURCE Bureau of Labor Statistics, Transwestern *12-month job growth through November 2016, net absorption through Q4 2016
05 06 07 08 09 10 11 12 13 14 15 16
Net Absorption (Thousands of SF) Payroll Job Growth (in Thousands)
-100
-75
-50
-25
0
25
50
75
100
125
-1,000
0
1,000
2,000
3,000
4,000
5,000
6,000
7,000
8,000
4 REAL ESTATE OUTLOOK HOUSTON METRO YE 2016
HOUSTON METRO MARKETYEAR-END 2016
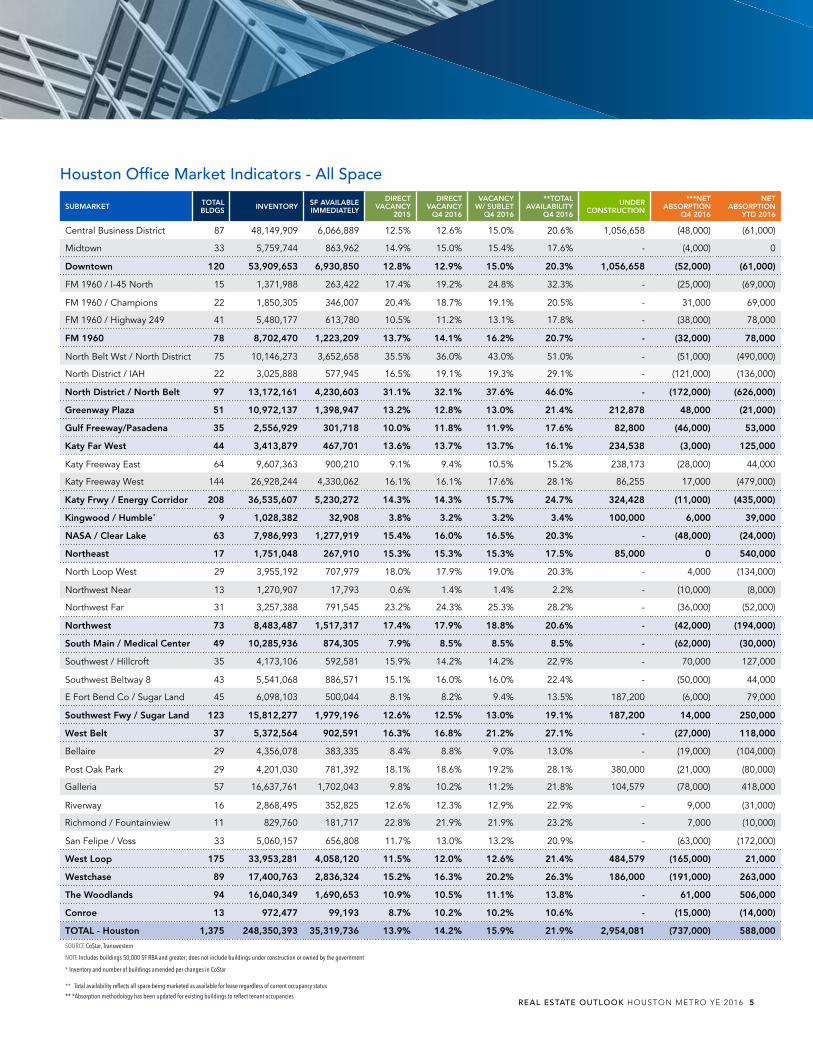
Houston Office Market Indicators - All Space
SUBMARKET TOTAL BLDGS INVENTORY SF AVAILABLE
IMMEDIATELY
DIRECT VACANCY
2015
DIRECT VACANCY
Q4 2016
VACANCY W/ SUBLET
Q4 2016
**TOTAL AVAILABILITY
Q4 2016
UNDER CONSTRUCTION
***NET ABSORPTION
Q4 2016
NET ABSORPTION
YTD 2016
Central Business District 87 48,149,909 6,066,889 12.5% 12.6% 15.0% 20.6% 1,056,658 (48,000) (61,000)
Midtown 33 5,759,744 863,962 14.9% 15.0% 15.4% 17.6% - (4,000) 0
Downtown 120 53,909,653 6,930,850 12.8% 12.9% 15.0% 20.3% 1,056,658 (52,000) (61,000)
FM 1960 / I-45 North 15 1,371,988 263,422 17.4% 19.2% 24.8% 32.3% - (25,000) (69,000)
FM 1960 / Champions 22 1,850,305 346,007 20.4% 18.7% 19.1% 20.5% - 31,000 69,000
FM 1960 / Highway 249 41 5,480,177 613,780 10.5% 11.2% 13.1% 17.8% - (38,000) 78,000
FM 1960 78 8,702,470 1,223,209 13.7% 14.1% 16.2% 20.7% - (32,000) 78,000
North Belt Wst / North District 75 10,146,273 3,652,658 35.5% 36.0% 43.0% 51.0% - (51,000) (490,000)
North District / IAH 22 3,025,888 577,945 16.5% 19.1% 19.3% 29.1% - (121,000) (136,000)
North District / North Belt 97 13,172,161 4,230,603 31.1% 32.1% 37.6% 46.0% - (172,000) (626,000)
Greenway Plaza 51 10,972,137 1,398,947 13.2% 12.8% 13.0% 21.4% 212,878 48,000 (21,000)
Gulf Freeway/Pasadena 35 2,556,929 301,718 10.0% 11.8% 11.9% 17.6% 82,800 (46,000) 53,000
Katy Far West 44 3,413,879 467,701 13.6% 13.7% 13.7% 16.1% 234,538 (3,000) 125,000
Katy Freeway East 64 9,607,363 900,210 9.1% 9.4% 10.5% 15.2% 238,173 (28,000) 44,000
Katy Freeway West 144 26,928,244 4,330,062 16.1% 16.1% 17.6% 28.1% 86,255 17,000 (479,000)
Katy Frwy / Energy Corridor 208 36,535,607 5,230,272 14.3% 14.3% 15.7% 24.7% 324,428 (11,000) (435,000)
Kingwood / Humble* 9 1,028,382 32,908 3.8% 3.2% 3.2% 3.4% 100,000 6,000 39,000
NASA / Clear Lake 63 7,986,993 1,277,919 15.4% 16.0% 16.5% 20.3% - (48,000) (24,000)
Northeast 17 1,751,048 267,910 15.3% 15.3% 15.3% 17.5% 85,000 0 540,000
North Loop West 29 3,955,192 707,979 18.0% 17.9% 19.0% 20.3% - 4,000 (134,000)
Northwest Near 13 1,270,907 17,793 0.6% 1.4% 1.4% 2.2% - (10,000) (8,000)
Northwest Far 31 3,257,388 791,545 23.2% 24.3% 25.3% 28.2% - (36,000) (52,000)
Northwest 73 8,483,487 1,517,317 17.4% 17.9% 18.8% 20.6% - (42,000) (194,000)
South Main / Medical Center 49 10,285,936 874,305 7.9% 8.5% 8.5% 8.5% - (62,000) (30,000)
Southwest / Hillcroft 35 4,173,106 592,581 15.9% 14.2% 14.2% 22.9% - 70,000 127,000
Southwest Beltway 8 43 5,541,068 886,571 15.1% 16.0% 16.0% 22.4% - (50,000) 44,000
E Fort Bend Co / Sugar Land 45 6,098,103 500,044 8.1% 8.2% 9.4% 13.5% 187,200 (6,000) 79,000
Southwest Fwy / Sugar Land 123 15,812,277 1,979,196 12.6% 12.5% 13.0% 19.1% 187,200 14,000 250,000
West Belt 37 5,372,564 902,591 16.3% 16.8% 21.2% 27.1% - (27,000) 118,000
Bellaire 29 4,356,078 383,335 8.4% 8.8% 9.0% 13.0% - (19,000) (104,000)
Post Oak Park 29 4,201,030 781,392 18.1% 18.6% 19.2% 28.1% 380,000 (21,000) (80,000)
Galleria 57 16,637,761 1,702,043 9.8% 10.2% 11.2% 21.8% 104,579 (78,000) 418,000
Riverway 16 2,868,495 352,825 12.6% 12.3% 12.9% 22.9% - 9,000 (31,000)
Richmond / Fountainview 11 829,760 181,717 22.8% 21.9% 21.9% 23.2% - 7,000 (10,000)
San Felipe / Voss 33 5,060,157 656,808 11.7% 13.0% 13.2% 20.9% - (63,000) (172,000)
West Loop 175 33,953,281 4,058,120 11.5% 12.0% 12.6% 21.4% 484,579 (165,000) 21,000
Westchase 89 17,400,763 2,836,324 15.2% 16.3% 20.2% 26.3% 186,000 (191,000) 263,000
The Woodlands 94 16,040,349 1,690,653 10.9% 10.5% 11.1% 13.8% - 61,000 506,000
Conroe 13 972,477 99,193 8.7% 10.2% 10.2% 10.6% - (15,000) (14,000)
TOTAL - Houston 1,375 248,350,393 35,319,736 13.9% 14.2% 15.9% 21.9% 2,954,081 (737,000) 588,000
SOURCE CoStar, Transwestern
NOTE Includes buildings 50,000 SF RBA and greater; does not include buildings under construction or owned by the government
* Inventory and number of buildings amended per changes in CoStar
** Total availability reflects all space being marketed as available for lease regardless of current occupancy status
** *Absorption methodology has been updated for existing buildings to reflect tenant occupancies REAL ESTATE OUTLOOK HOUSTON METRO YE 2016 5
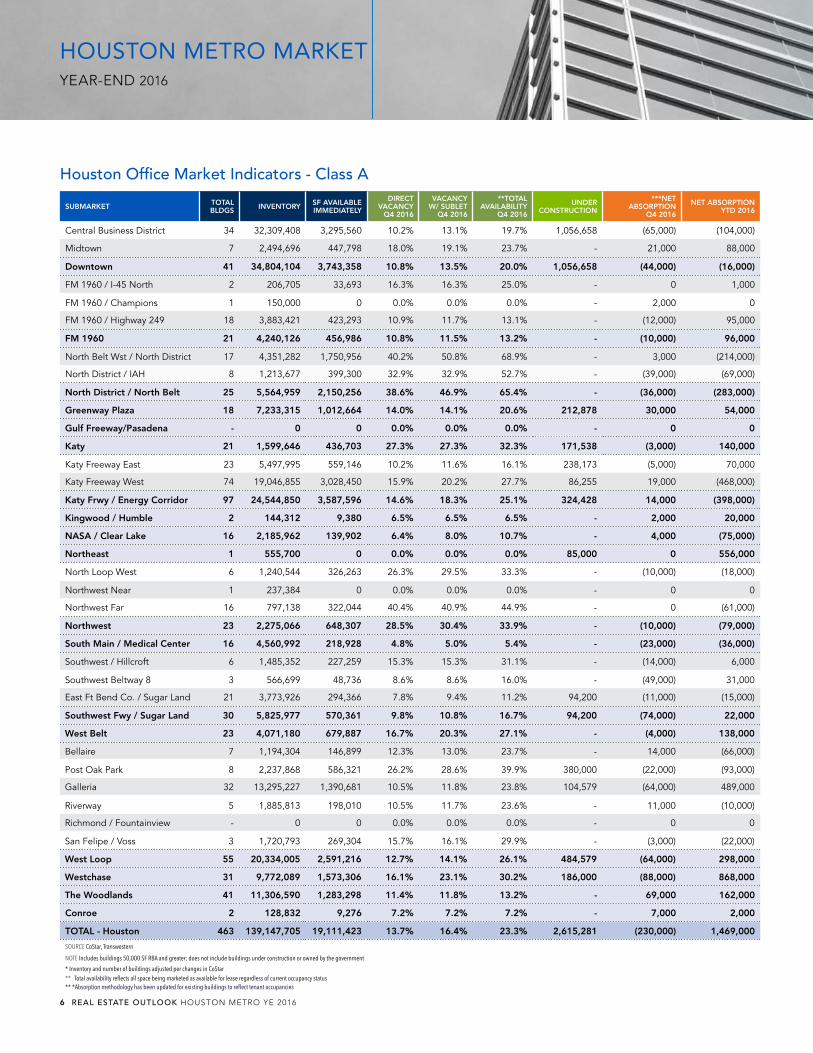
Houston Office Market Indicators - Class A
SUBMARKET TOTAL BLDGS INVENTORY SF AVAILABLE
IMMEDIATELY
DIRECT VACANCY
Q4 2016
VACANCY W/ SUBLET
Q4 2016
**TOTAL AVAILABILITY
Q4 2016
UNDER CONSTRUCTION
***NET ABSORPTION
Q4 2016
NET ABSORPTION YTD 2016
Central Business District 34 32,309,408 3,295,560 10.2% 13.1% 19.7% 1,056,658 (65,000) (104,000)
Midtown 7 2,494,696 447,798 18.0% 19.1% 23.7% - 21,000 88,000
Downtown 41 34,804,104 3,743,358 10.8% 13.5% 20.0% 1,056,658 (44,000) (16,000)
FM 1960 / I-45 North 2 206,705 33,693 16.3% 16.3% 25.0% - 0 1,000
FM 1960 / Champions 1 150,000 0 0.0% 0.0% 0.0% - 2,000 0
FM 1960 / Highway 249 18 3,883,421 423,293 10.9% 11.7% 13.1% - (12,000) 95,000
FM 1960 21 4,240,126 456,986 10.8% 11.5% 13.2% - (10,000) 96,000
North Belt Wst / North District 17 4,351,282 1,750,956 40.2% 50.8% 68.9% - 3,000 (214,000)
North District / IAH 8 1,213,677 399,300 32.9% 32.9% 52.7% - (39,000) (69,000)
North District / North Belt 25 5,564,959 2,150,256 38.6% 46.9% 65.4% - (36,000) (283,000)
Greenway Plaza 18 7,233,315 1,012,664 14.0% 14.1% 20.6% 212,878 30,000 54,000
Gulf Freeway/Pasadena - 0 0 0.0% 0.0% 0.0% - 0 0
Katy 21 1,599,646 436,703 27.3% 27.3% 32.3% 171,538 (3,000) 140,000
Katy Freeway East 23 5,497,995 559,146 10.2% 11.6% 16.1% 238,173 (5,000) 70,000
Katy Freeway West 74 19,046,855 3,028,450 15.9% 20.2% 27.7% 86,255 19,000 (468,000)
Katy Frwy / Energy Corridor 97 24,544,850 3,587,596 14.6% 18.3% 25.1% 324,428 14,000 (398,000)
Kingwood / Humble 2 144,312 9,380 6.5% 6.5% 6.5% - 2,000 20,000
NASA / Clear Lake 16 2,185,962 139,902 6.4% 8.0% 10.7% - 4,000 (75,000)
Northeast 1 555,700 0 0.0% 0.0% 0.0% 85,000 0 556,000
North Loop West 6 1,240,544 326,263 26.3% 29.5% 33.3% - (10,000) (18,000)
Northwest Near 1 237,384 0 0.0% 0.0% 0.0% - 0 0
Northwest Far 16 797,138 322,044 40.4% 40.9% 44.9% - 0 (61,000)
Northwest 23 2,275,066 648,307 28.5% 30.4% 33.9% - (10,000) (79,000)
South Main / Medical Center 16 4,560,992 218,928 4.8% 5.0% 5.4% - (23,000) (36,000)
Southwest / Hillcroft 6 1,485,352 227,259 15.3% 15.3% 31.1% - (14,000) 6,000
Southwest Beltway 8 3 566,699 48,736 8.6% 8.6% 16.0% - (49,000) 31,000
East Ft Bend Co. / Sugar Land 21 3,773,926 294,366 7.8% 9.4% 11.2% 94,200 (11,000) (15,000)
Southwest Fwy / Sugar Land 30 5,825,977 570,361 9.8% 10.8% 16.7% 94,200 (74,000) 22,000
West Belt 23 4,071,180 679,887 16.7% 20.3% 27.1% - (4,000) 138,000
Bellaire 7 1,194,304 146,899 12.3% 13.0% 23.7% - 14,000 (66,000)
Post Oak Park 8 2,237,868 586,321 26.2% 28.6% 39.9% 380,000 (22,000) (93,000)
Galleria 32 13,295,227 1,390,681 10.5% 11.8% 23.8% 104,579 (64,000) 489,000
Riverway 5 1,885,813 198,010 10.5% 11.7% 23.6% - 11,000 (10,000)
Richmond / Fountainview - 0 0 0.0% 0.0% 0.0% - 0 0
San Felipe / Voss 3 1,720,793 269,304 15.7% 16.1% 29.9% - (3,000) (22,000)
West Loop 55 20,334,005 2,591,216 12.7% 14.1% 26.1% 484,579 (64,000) 298,000
Westchase 31 9,772,089 1,573,306 16.1% 23.1% 30.2% 186,000 (88,000) 868,000
The Woodlands 41 11,306,590 1,283,298 11.4% 11.8% 13.2% - 69,000 162,000
Conroe 2 128,832 9,276 7.2% 7.2% 7.2% - 7,000 2,000
TOTAL - Houston 463 139,147,705 19,111,423 13.7% 16.4% 23.3% 2,615,281 (230,000) 1,469,000
SOURCE CoStar, Transwestern
NOTE Includes buildings 50,000 SF RBA and greater; does not include buildings under construction or owned by the government
* Inventory and number of buildings adjusted per changes in CoStar** Total availability reflects all space being marketed as available for lease regardless of current occupancy status** *Absorption methodology has been updated for existing buildings to reflect tenant occupancies
6 REAL ESTATE OUTLOOK HOUSTON METRO YE 2016
HOUSTON METRO MARKETYEAR-END 2016
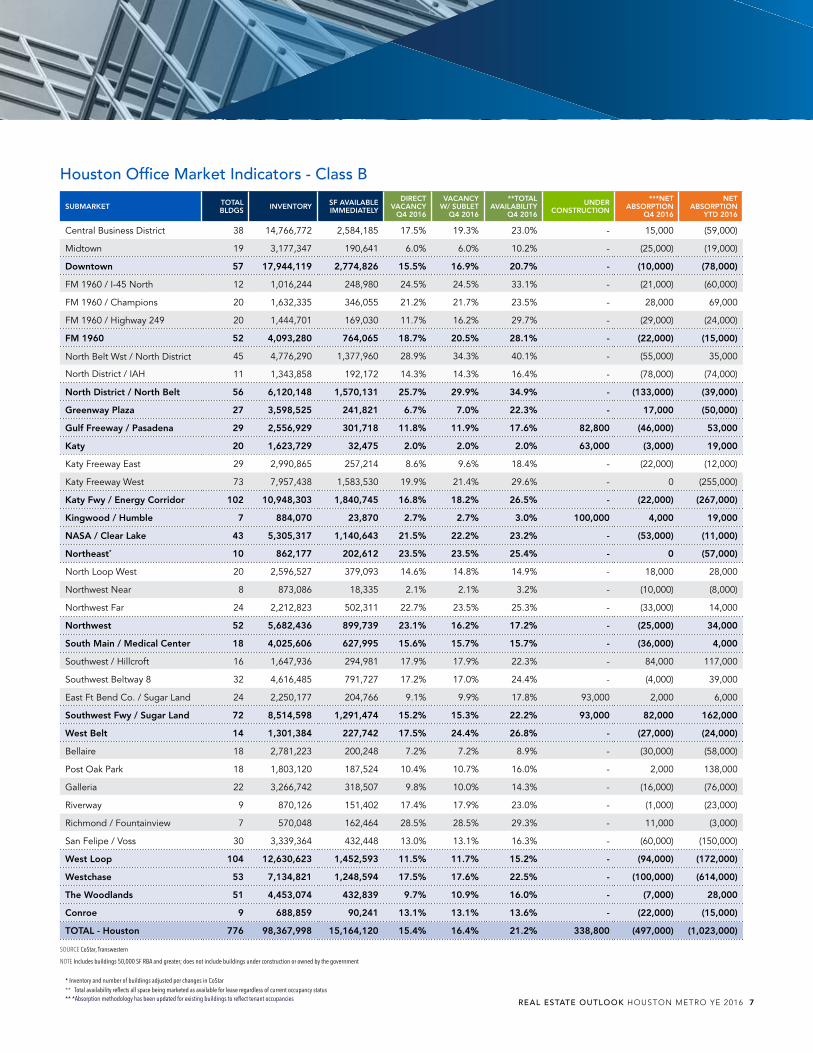
Houston Office Market Indicators - Class B
SUBMARKET TOTAL BLDGS INVENTORY SF AVAILABLE
IMMEDIATELY
DIRECT VACANCY
Q4 2016
VACANCY W/ SUBLET
Q4 2016
**TOTAL AVAILABILITY
Q4 2016
UNDER CONSTRUCTION
***NET ABSORPTION
Q4 2016
NET ABSORPTION
YTD 2016
Central Business District 38 14,766,772 2,584,185 17.5% 19.3% 23.0% - 15,000 (59,000)
Midtown 19 3,177,347 190,641 6.0% 6.0% 10.2% - (25,000) (19,000)
Downtown 57 17,944,119 2,774,826 15.5% 16.9% 20.7% - (10,000) (78,000)
FM 1960 / I-45 North 12 1,016,244 248,980 24.5% 24.5% 33.1% - (21,000) (60,000)
FM 1960 / Champions 20 1,632,335 346,055 21.2% 21.7% 23.5% - 28,000 69,000
FM 1960 / Highway 249 20 1,444,701 169,030 11.7% 16.2% 29.7% - (29,000) (24,000)
FM 1960 52 4,093,280 764,065 18.7% 20.5% 28.1% - (22,000) (15,000)
North Belt Wst / North District 45 4,776,290 1,377,960 28.9% 34.3% 40.1% - (55,000) 35,000
North District / IAH 11 1,343,858 192,172 14.3% 14.3% 16.4% - (78,000) (74,000)
North District / North Belt 56 6,120,148 1,570,131 25.7% 29.9% 34.9% - (133,000) (39,000)
Greenway Plaza 27 3,598,525 241,821 6.7% 7.0% 22.3% - 17,000 (50,000)
Gulf Freeway / Pasadena 29 2,556,929 301,718 11.8% 11.9% 17.6% 82,800 (46,000) 53,000
Katy 20 1,623,729 32,475 2.0% 2.0% 2.0% 63,000 (3,000) 19,000
Katy Freeway East 29 2,990,865 257,214 8.6% 9.6% 18.4% - (22,000) (12,000)
Katy Freeway West 73 7,957,438 1,583,530 19.9% 21.4% 29.6% - 0 (255,000)
Katy Fwy / Energy Corridor 102 10,948,303 1,840,745 16.8% 18.2% 26.5% - (22,000) (267,000)
Kingwood / Humble 7 884,070 23,870 2.7% 2.7% 3.0% 100,000 4,000 19,000
NASA / Clear Lake 43 5,305,317 1,140,643 21.5% 22.2% 23.2% - (53,000) (11,000)
Northeast* 10 862,177 202,612 23.5% 23.5% 25.4% - 0 (57,000)
North Loop West 20 2,596,527 379,093 14.6% 14.8% 14.9% - 18,000 28,000
Northwest Near 8 873,086 18,335 2.1% 2.1% 3.2% - (10,000) (8,000)
Northwest Far 24 2,212,823 502,311 22.7% 23.5% 25.3% - (33,000) 14,000
Northwest 52 5,682,436 899,739 23.1% 16.2% 17.2% - (25,000) 34,000
South Main / Medical Center 18 4,025,606 627,995 15.6% 15.7% 15.7% - (36,000) 4,000
Southwest / Hillcroft 16 1,647,936 294,981 17.9% 17.9% 22.3% - 84,000 117,000
Southwest Beltway 8 32 4,616,485 791,727 17.2% 17.0% 24.4% - (4,000) 39,000
East Ft Bend Co. / Sugar Land 24 2,250,177 204,766 9.1% 9.9% 17.8% 93,000 2,000 6,000
Southwest Fwy / Sugar Land 72 8,514,598 1,291,474 15.2% 15.3% 22.2% 93,000 82,000 162,000
West Belt 14 1,301,384 227,742 17.5% 24.4% 26.8% - (27,000) (24,000)
Bellaire 18 2,781,223 200,248 7.2% 7.2% 8.9% - (30,000) (58,000)
Post Oak Park 18 1,803,120 187,524 10.4% 10.7% 16.0% - 2,000 138,000
Galleria 22 3,266,742 318,507 9.8% 10.0% 14.3% - (16,000) (76,000)
Riverway 9 870,126 151,402 17.4% 17.9% 23.0% - (1,000) (23,000)
Richmond / Fountainview 7 570,048 162,464 28.5% 28.5% 29.3% - 11,000 (3,000)
San Felipe / Voss 30 3,339,364 432,448 13.0% 13.1% 16.3% - (60,000) (150,000)
West Loop 104 12,630,623 1,452,593 11.5% 11.7% 15.2% - (94,000) (172,000)
Westchase 53 7,134,821 1,248,594 17.5% 17.6% 22.5% - (100,000) (614,000)
The Woodlands 51 4,453,074 432,839 9.7% 10.9% 16.0% - (7,000) 28,000
Conroe 9 688,859 90,241 13.1% 13.1% 13.6% - (22,000) (15,000)
TOTAL - Houston 776 98,367,998 15,164,120 15.4% 16.4% 21.2% 338,800 (497,000) (1,023,000)
SOURCE CoStar, Transwestern
NOTE Includes buildings 50,000 SF RBA and greater; does not include buildings under construction or owned by the government
* Inventory and number of buildings adjusted per changes in CoStar** Total availability reflects all space being marketed as available for lease regardless of current occupancy status** *Absorption methodology has been updated for existing buildings to reflect tenant occupancies REAL ESTATE OUTLOOK HOUSTON METRO YE 2016 7

Copyright © 2016 Transwestern. All rights reserved. No part of this work may be reproduced or distributed to third parties without written permission of the copyright owner. The information contained in this report was gathered by Transwestern from various primary and secondary sources believed to be reliable. Transwestern, however, makes no representation concerning the accuracy or completeness of such information and expressly disclaims any responsibility for any inaccuracy contained herein.
METHODOLOGY
The information in this report is the result of a compilation of information on office,
industrial, retail, multifamily and healthcare properties located in the Houston
metropolitan area. This report includes single-tenant, multi-tenant and owner-user
properties and excludes properties owned and occupied by a government agency.
Rachel AndraeResearch [email protected]
Stuart ShowersDirector of [email protected]
CONTACT
SUBMARKET 2013 CLASS A
2013 CLASS B
2014 CLASS A
2014 CLASS B
2015 CLASS A
2015 CLASS B
2016 CLASS A
2016 CLASS B
% CHANGE 12/15-12/16
CLASS A
% CHANGE 12/15-12/16
CLASS B
Central Business District $39.32 $25.99 $42.71 $28.13 $43.87 $28.66 $43.47 $29.36 -0.9% 2.4%
Midtown $30.32 $26.03 $34.36 $27.17 $34.73 $27.39 $34.09 $27.59 -1.8% 0.7%
Downtown $38.47 $25.99 $41.26 $28.03 $42.28 $28.57 $42.35 $29.24 0.1% 2.3%
FM 1960 / I-45 North - $18.06 - $18.20 $25.00 $17.65 $23.69 $17.70 -5.2% 0.3%
FM 1960 / Champions - $13.19 - $13.55 - $13.80 $0.00 $13.76 - -0.3%
FM 1960 / Highway 249 $25.67 $20.80 $26.56 $20.62 $26.87 $20.73 $27.09 $20.75 0.8% 0.1%
FM 1960 $25.71 $15.52 $26.56 $15.74 $26.73 $15.99 $26.84 $16.59 0.4% 3.7%
North Belt West / Greenspoint $29.51 $15.63 $30.26 $15.59 $28.29 $14.92 $28.38 $14.49 0.3% -2.9%
Greenspoint / IAH $21.36 $16.34 $21.65 $15.80 $21.77 $15.97 $21.75 $15.78 -0.1% -1.2%
Greenspoint / North Belt $28.27 $15.73 $28.85 $15.62 $27.22 $15.03 $27.15 $14.65 -0.3% -2.6%
Greenway Plaza $32.11 $23.72 $35.04 $25.34 $35.92 $25.89 $35.44 $26.07 -1.3% 0.7%
Gulf Freeway / Pasadena - $21.61 - $22.35 - $22.35 $0.00 $22.74 - 1.7%
Katy $31.58 $23.20 $32.26 $23.71 $32.94 $24.01 $32.89 $23.94 -0.2% -0.3%
Katy Freeway East $35.52 $21.79 $36.65 $23.26 $38.02 $23.89 $37.78 $22.81 -0.6% -4.5%
Katy Freeway West $33.69 $20.52 $35.98 $22.73 $37.19 $23.13 $36.66 $22.98 -1.4% -0.6%
Katy Fwy / Energy Corridor $33.92 $21.12 $36.15 $22.90 $37.40 $23.25 $36.83 $22.96 -1.5% -1.3%
Kingwood / Humble $32.13 $19.00 $32.13 $19.54 $32.55 $18.75 $32.09 $18.88 -1.4% 0.7%
NASA / Clear Lake $23.58 $18.33 $25.01 $18.62 $25.01 $18.82 $24.58 $18.32 -1.7% -2.7%
Northeast - $16.57 - $17.32 - $17.29 $0.00 $17.18 - -0.6%
North Loop West $23.81 $18.25 $26.76 $20.50 $26.97 $20.81 $26.90 $21.31 -0.3% 2.4%
Northwest Near - $15.60 - $16.40 - $16.63 $0.00 $17.11 - 2.9%
Northwest Far $19.04 $15.31 $19.29 $16.66 $19.38 $16.70 $19.14 $16.61 -1.2% -0.5%
Northwest $21.83 $16.72 $22.30 $18.50 $22.44 $18.32 $23.05 $18.60 2.7% 1.5%
South Main / Medical Center $28.54 $24.00 $29.09 $25.09 $29.19 $25.26 $29.40 $25.23 0.7% -0.1%
Southwest / Hillcroft $21.75 $14.18 $21.98 $13.81 $22.04 $14.10 $21.62 $14.39 -1.9% 2.1%
Southwest Beltway 8 $23.24 $16.68 $22.45 $16.43 $22.45 $16.23 $22.60 $16.62 0.7% 2.4%
East Ft Bend Co. / Sugar Land $28.53 $21.32 $28.34 $21.60 $29.13 $21.49 $29.50 $21.68 1.3% 0.9%
Southwest Fwy / Sugar Land $24.95 $16.67 $24.57 $16.56 $25.05 $16.12 $25.77 $16.91 2.9% 4.9%
West Belt $30.35 $23.21 $31.42 $23.83 $32.02 $23.89 $31.86 $23.86 -0.5% -0.1%
Bellaire $25.86 $21.08 $26.80 $22.09 $26.96 $22.14 $26.91 $22.39 -0.2% 1.1%
Post Oak Park $35.43 $26.36 $35.94 $27.43 $36.51 $27.76 $37.11 $28.08 1.6% 1.2%
Galleria $35.70 $26.70 $37.04 $27.49 $38.00 $27.40 $37.52 $27.40 -1.3% 0.0%
Riverway $30.82 $23.72 $32.10 $25.12 $33.14 $25.66 $33.14 $25.68 0.0% 0.1%
Richmond / Fountainview - $16.64 - $17.54 - $17.83 - $17.75 - -0.4%
San Felipe / Voss $32.44 $22.40 $34.54 $23.41 $35.19 $23.50 $34.92 $23.76 -0.8% 1.1%
West Loop $34.14 $23.68 $35.63 $24.43 $36.44 $24.46 $36.22 $24.45 -0.6% 0.0%
Westchase $35.38 $19.75 $38.70 $21.51 $38.98 $21.23 $38.08 $21.23 -2.3% 0.0%
The Woodlands $35.95 $23.38 $39.56 $25.63 $40.56 $25.39 $39.98 $25.48 -1.4% 0.4%
Conroe $28.42 $25.73 $28.40 $25.08 $29.35 $24.77 $29.12 $23.86 -0.8% -3.7%
TOTAL - Houston $32.71 $19.96 $34.49 $20.88 $35.31 $21.28 $35.50 $21.95 0.5% 3.2%
SOURCE CoStar, TranswesternNOTE Rents for properties using triple net terms have been grossed up to full service with operating expense data, rents reflect full service equivalent
Houston Office Market Indicators - Asking Rental Rates

OVERVIEW
Office sector scuffles to find footing after downturnThe Houston office market continues to struggle as the local economy remains uncertain, pinned to the turmoil in the energy sector and ambiguity surrounding the pending election cycle. Currently, tenants are hesitant to make long-term leasing decisions until clarity avails itself in both the energy markets and governmental policy. Vacancy is on an upward trajectory as sublease space continues to be added to the market, particularly in submarkets traditionally occupied by the energy tenants. The significant decline in leasing activity paired with the increasing supply of available sublease space pushed net absorption into the red during the third quarter. Market conditions currently favor the tenant as landlords must leverage significant concession packages to compete in a sea of available space alternatives, especially for large users 20,000 SF and up.
NET ABSORPTION
Absorption pushes red in the ledgerNet absorption for all classes of office ran red for the third quarter totaling a net negative 397,000 SF. Year-to-date totals were more favorable coming in at 1.3 million SF, but are still well below historical averages. The Class A market recorded 429,000 SF of positive absorption for the quarter, while Class B recorded a sixth consecutive quarter of negative absorption at 795,000 SF. Following several quarters of positive absorption driven by preleased deliveries, the office market experienced its first quarter of overall negative absorption since mid-year 2015. Absorption over the final quarter of 2016 is anticipated to be minimal to slightly negative as true recovery appears most likely to begin in mid-2017 at the earliest.
HOUSTON OFFICE MARKETTHIRD QUARTER 2016
REAL ESTATE OUTLOOK
Office Market Struggling to Gain Traction in Down Economy Sublease space continues to impact vacancy
NET ABSORPTION AND VACANCY RATE TRENDS HOUSTON METRO AREA
CONTIGUOUS BLOCKS OF AVAILABLE SPACE HOUSTON METRO
SOURCE CoStar, Transwestern *Through Q3 2016
SOURCE CoStar, Transwestern *Through Q3 2016
Note: Delivery of preleased space counts as positive net absorption
Notable Q3 LeasesTENANT SF LEASE TYPE BUILDING SUBMARKET
Lloyd's Register 86,892 Renewal 1330 Enclave Parkway Katy Freeway West
Orrick, Herrington & Sutcliffe 56,731 Prelease 609 Main at Texas CBD
Hogan Lovells 43,000 Prelease 609 Main at Texas CBD
Lockheed Martin Corporation 40,742 Renewal Two Corporate Plaza NASA/Clear Lake
05 06 07 08 09 10 11 12 13 14 15 16*
Net Absorption (Thousands of SF) Direct Vacancy Rate
6%7%8%9%
10%11%12%13%14%15%
-1,00001,0002,0003,0004,0005,0006,0007,0008,000
020406080100120140160
25,000 SF 50,000 SF 100,000 SF 200,000 SF
Class A Direct Class A Sublet Class B Direct Class B Sublet

VACANCY
Sublease space nearly reaches 12.0 million SF The overall office vacancy rate (including sublet) was 15.6% at third quarter, up from 14.7% at second quarter. Direct vacancy was 13.8%, up from 13.1% last quarter. Total available sublease space grew by 1.2 million SF this quarter to 11.9 million SF on the market. Also, in the third quarter, Shell announced they were vacating their entire space in One Shell Plaza, which totals approximately 800,000 SF, after initially only marketing 350,000 SF of space. FMC Technologies, WorleyParsons, NOV, and Freeport-McMoRan also put over 900,000 SF of combined sublease space on the market. With the continuation of space reductions through a slow market, sublease space will likely exceed 12.0 million SF by year-end. The submarkets that will continue to be affected by large amounts of sublease space are the Energy Corridor, CBD, Westchase, and the Galleria due to the strong oil and gas presence in those markets.
Class A overall vacancy was 15.5% at third quarter, up from 14.6% at second quarter, and Class A direct was 13.0%, up from 12.4% over the same period. Class B overall vacancy was 16.1%, a jump from 15.2% at mid-year, and Class B direct vacancy rose to 15.0%, from 14.2% over the same period. Looking ahead, vacancies are anticipated to increase further as leasing velocity remains low and companies continue to put sublease space on the market.
RENTAL R ATES
Concession packages increasing While overall face rents increased modestly year-over-year, the underlying value of concession packages being offered foretells a different story. Class A rents declined 0.2% year-over-year to $35.24 per SF gross, and Class B rents carried the increase in face rents, rising by 1.2% to $21.53 per SF gross from the close of the year. In the current, tenant-favored market, landlords are offering significant concession packages with generous tenant improvement packages and free rent in order to entice prospective tenants. Rental rates have not seen a sharp decline, as rate decreases typically lag behind other indicators due to landlords maintaining face rents for as long as possible. As competitive spaces grow in number throughout the market, the value of the concessions in nearing its ceiling and declines in rates will begin to show through most areas.
SUPPLY AND DEVELOPMENT
Development cycle comes to a closeHouston is nearing the completion of its most recent development phase as there was a total of 2.6 million SF of office space under construction in the third quarter, as compared to 3.7 million SF just three months earlier. This space was 48% preleased, a metric that remains unchanged from the second quarter. There are no other buildings anticipated to deliver in 2016, with all 2.6 million SF anticipated to deliver by the end of 2017. The CBD is the only remaining submarket with over 1.0 million SF in the pipeline.
Office Under ConstructionHouston Metro | Q3 2016
SUBMARKET NUMBER OF BLDGS SF % PRE-
LEASED
CBD 1 1,056,658 38%
West Loop 2 520,000 75%
Energy Corridor 2 324,428 40%
Katy 2 285,465 18%
Greenway Plaza 1 191,802 48%
Westchase 1 186,000 100%
Total 9 2,564,356 48%
AVERAGE OFFICE RENTS HOUSTON METRO AREA
SOURCE CoStar, Transwestern *At Q3 2016 Note: All classes of office space
Total Available SpaceHouston Metro | Q3 2016
SUBMARKET SUBLEASE SPACE (SF)
% SUBLEASE
Energy Corridor 3,575,660 9.6%
CBD 2,757,005 5.8%
Westchase 1,485,336 8.5%
Galleria 1,092,267 8.3%
Greenspoint 982,267 5.9%
All of Houston 11,868,908 4.8%
05 06 07 08 09 10 11 12 13 14 15 16*
Asking Rents ($/SF Gross)
$16
$18
$20
$22
$24
$26
$28
$30 $28.60
2 REAL ESTATE OUTLOOK HOUSTON METRO Q3 2016
HOUSTON METRO MARKETTHIRD QUARTER 2016

The largest projects under construction are 609 Main (CBD, 1.1 million SF) and Amegy Bank’s new headquarters located at 1717 West Loop South (Post Oak Park, 380,000 SF).
There were 1.4 million SF of deliveries at 62% preleased in the third quarter. The preleased percentage is significantly lower than the first quarter’s 92% due to only one owner-occupied project delivering. The largest project deliveries include BHP’s new headquarters (Galleria, 600,000 SF) and West Memorial Place II (Katy Freeway West, 385,532 SF).
INVESTMENT MARKET
Investment opportunities feeling the burnThe investment landscape is changing quickly as the metro recorded $122.4 million in office sales during the third quarter, a decline of 27% over the previous quarter. Small or mid-size assets accounted for most of the sales activity, as large transaction sales have declined dramatically over the past year. Pricing per square foot averages took a major hit for the period, averaging $56 per SF as compared to $158 per SF at second quarter due mainly to the quality and size of assets traded. The majority of single-property sales were smaller, Class B and C assets. The average cap rate was 7.8%, up from the second quarter average of 7.6%. These figures represent assets for which pricing information could be obtained.
Owners are still hesitant to market their properties through the changing scope of the office market and the disparity in pricing expectations. The number of listings in 2016 has been lower than historical averages as owners are sourcing deals off market to keep lower pricing from being advertised. Additionally, investors are exercising more conservative underwriting projections throughout the office sector in order to maintain financial viability. However, the long-term outlook for Houston remains bright as it still remains one of the nation’s largest economies.
COMPARATIVE OFFICE INVESTMENT SALES VOLUME SELECT METRO AREAS
SOURCE Real Capital Analytics, Transwestern ,*Through Q3 2016
AVERAGE OFFICE SALE PRICE HOUSTON METRO AREA
SOURCE Real Capital Analytics, Transwestern,*Through Q3 2016
Notable Q3 TransactionsBUILDING SUBMARKET SF SELLER BUYER
9720 Cypresswood FM 1960/Hwy 249 83,077 Torchlight Loan Services, LLC Vista Equities Group, Inc.
6464 Savoy Southwest/Hillcroft 182,658 Younan Properties Ridgepoint Jr LLC
SOURCE Real Capital Analytics, HFF, Transwestern
Sales Volume in Billions Atl Dal Den Hou
05 06 07 08 09 10 11 12 13 14 15 16*$0.0
$1.0
$2.0
$3.0
$4.0
$5.0
$6.0
Average Sale Price Per SF
05 06 07 08 09 10 11 12 13 14 15 16*$0
$50
$100
$150
$200
$250
$56
REAL ESTATE OUTLOOK HOUSTON METRO Q3 2016 3

OUTLOOK
Baby steps on a soft floorThe combination of the downturn in the energy sector and the over-zealous nature of our most recent development cycle, the Houston office market is in a transition state as signs begin to point that we may have hit our floor. Availability from the new deliveries along with blocks of space being added via the sublease market present lingering reminders as their impact on market fundamentals displays itself. The current energy market has reached the bottom with job cuts and even found a floor in price per barrel; however, it may still take the office market an additional 12 to 18 months to see the return of office demand. Job growth for Houston is anticipated to remain flat or slightly positive for the year with impacts from the Super Bowl having little impact on office leasing.
The metro’s current development is 48% preleased and these projects are all anticipated to deliver by the end of 2017. Looking ahead, tenants will continue to adopt a wait-and-see approach as they debate the impacts of the upcoming Presidential election and policies that follow the winning candidate coupled with the continued volatility in the oil markets. Rental rates will likely remain flat or decline as a large abundance of space needs to be absorbed. Development activity will taper off as developers hold off on new projects and wait for the next development upcy-cle to break ground. With more sublease space hitting the market, vacancy rates will continue to impacted and trend upward.
Multi-tenant market vs Transwestern comprehensive market coverage
MULTI-TENANT ENTIRE MARKET
Inventory 209.5 MSF 248.4 MSF
Overall Vacancy 17.6% 15.6%
Q3 Net Absorption 13,723,349 SF (397,000) SF
WHY OUR METHODOLOGY IS THE BEST INDICATOR OF CURRENT MARKET CONDITIONSWe include owner occupied and single-tenant buildings in our inventory, vacancy and absorption statistics to capture more market activity than many of our competitors. This allows us to better correlate changes in the market with changes in employment. As single-tenant space does compete with multi-tenant space, we believe it is critical to understand all components of the market. The inclusion of single-tenant and owner-occupied space tends to yield lower vacancy rates and higher absorption totals than some of our competitors’ results, but our coverage of the market is more comprehensive.
OFFICE ABSORPTION AND EMPLOYMENT HOUSTON METRO AREA
SOURCE Bureau of Labor Statistics, Transwestern *12-month job growth through August 2016, net absorption through Q3 2016
05 06 07 08 09 10 11 12 13 14 15 16*
Net Absorption (Thousands of SF) Payroll Job Growth (in Thousands)
-100
-75
-50
-25
0
25
50
75
100
125
-1,000
0
1,000
2,000
3,000
4,000
5,000
6,000
7,000
8,000
4 REAL ESTATE OUTLOOK HOUSTON METRO Q3 2016
HOUSTON METRO MARKETTHIRD QUARTER 2016

Houston Office Market Indicators - All Space
SUBMARKET TOTAL BLDGS INVENTORY SF AVAILABLE
IMMEDIATELY
DIRECT VACANCY
2015
DIRECT VACANCY
Q3 2016
VACANCY WITH SUBLET
Q3 2016
UNDER CONSTRUCTION
NET ABSORPTION
Q3 2016
NET ABSORPTION
YTD 2016
Central Business District 87 47,919,574 5,804,977 11.3% 12.1% 14.6% 1,056,658 (112,000) (43,000)
Midtown 33 5,759,744 859,930 15.0% 14.9% 15.3% - 44,000 4,000
Downtown 120 53,679,318 6,664,907 11.7% 12.4% 14.7% 1,056,658 (68,000) (39,000)
FM 1960 / I-45 North 15 1,371,988 238,726 14.2% 17.4% 17.7% - (16,000) (44,000)
FM 1960 / Champions 22 1,850,305 427,420 24.0% 23.1% 23.1% - 30,000 17,000
FM 1960 / Highway 249 41 5,470,993 708,494 11.8% 13.0% 15.4% - (3,000) 83,000
FM 1960 78 8,693,286 1,374,640 14.8% 15.8% 17.4% - 11,000 56,000
North Belt West / Greenspoint 75 10,105,399 3,242,823 30.6% 32.1% 36.7% - 33,000 (156,000)
Greenspoint / IAH 22 3,076,008 502,005 16.1% 16.3% 16.3% - 6,000 (7,000)
Greenspoint / North Belt 97 13,181,407 3,744,827 27.2% 28.4% 31.9% - 39,000 (163,000)
Greenway Plaza 51 11,246,288 1,483,385 11.3% 13.2% 13.4% 191,805 126,000 170,000
Gulf Freeway/Pasadena 35 2,699,502 460,535 14.0% 17.1% 17.1% - (7,000) 5,000
Katy 44 3,383,389 613,070 15.9% 18.1% 18.1% 285,465 6,000 29,000
Katy Freeway East 64 9,681,026 879,037 9.1% 9.1% 10.0% 238,173 (76,000) 71,000
Katy Freeway West 144 27,416,975 4,425,648 11.3% 16.1% 19.9% 86,255 (102,000) (521,000)
Katy Frwy / Energy Corridor 208 37,098,001 5,304,685 10.7% 14.3% 17.3% 324,428 (178,000) (450,000)
Kingwood / Humble* 9 1,025,047 70,728 9.3% 6.9% 6.9% - 9,000 24,000
NASA / Clear Lake 63 7,051,599 892,027 13.4% 12.7% 13.2% - (50,000) 53,000
Northeast 17 1,711,262 261,823 17.9% 15.3% 15.3% - (51,000) 501,000
North Loop West 29 4,133,495 563,395 13.9% 13.6% 14.5% - (22,000) 12,000
Northwest Near 13 1,319,023 7,914 0.8% 0.6% 0.6% - 7,000 3,000
Northwest Far 31 3,430,620 829,181 23.8% 24.2% 24.7% - 48,000 (11,000)
Northwest 73 8,883,138 1,400,490 15.8% 15.8% 16.4% - 33,000 4,000
South Main / Medical Center 49 10,469,072 944,310 9.2% 9.0% 9.1% - (2,000) 19,000
Southwest / Hillcroft 35 4,269,911 677,635 17.2% 15.9% 15.9% - 14,000 58,000
Southwest Beltway 8 43 5,620,512 864,435 16.8% 15.4% 15.4% - (21,000) 80,000
E Fort Bend Co / Sugar Land 45 6,376,248 492,246 7.1% 7.7% 8.9% - (64,000) (43,000)
Southwest Fwy / Sugar Land 123 16,266,671 2,034,316 13.1% 12.5% 13.0% - (71,000) 95,000
West Belt 37 4,902,573 779,509 16.5% 15.9% 21.5% - (5,000) 29,000
Bellaire 29 4,374,993 365,749 6.4% 8.4% 8.6% - (66,000) (86,000)
Post Oak Park 29 4,294,059 807,283 16.7% 18.8% 19.7% 380,000 (33,000) (91,000)
Galleria 57 16,569,024 1,617,137 8.6% 9.8% 11.0% 140,000 565,000 502,000
Riverway 16 2,868,495 361,430 11.2% 12.6% 13.0% - 11,000 (40,000)
Richmond / Fountainview 11 819,689 197,545 22.9% 24.1% 24.1% - (10,000) (10,000)
San Felipe / Voss 33 5,041,885 591,917 9.6% 11.7% 12.0% - (47,000) (108,000)
West Loop 175 33,968,145 3,941,062 10.1% 11.6% 12.4% 520,000 420,000 167,000
Westchase 89 17,467,349 2,391,280 9.2% 13.7% 17.6% 186,000 (645,000) 621,000
The Woodlands 94 15,790,858 1,724,362 8.0% 10.9% 11.8% - 36,000 222,000
Conroe 13 903,345 78,591 8.8% 8.7% 8.7% - 0 1,000
TOTAL - Houston 1,375 248,420,250 34,164,549 12.2% 13.8% 15.6% 2,564,356 (397,000) 1,344,000
SOURCE CoStar, Transwestern
NOTE Includes buildings 50,000 SF RBA and greater; does not include buildings under construction or owned by the government
* Inventory and number of buildings amended per changes in CoStar
REAL ESTATE OUTLOOK HOUSTON METRO Q3 2016 5

Houston Office Market Indicators - Class A
SUBMARKET TOTAL BLDGS INVENTORY SF AVAILABLE
IMMEDIATELY
DIRECT VACANCY
Q3 2016
VACANCY WITH SUBLET
Q3 2016
UNDER CONSTRUCTION
NET ABSORPTION
Q3 2016
NET ABSORPTION YTD 2016
Central Business District 34 31,851,191 2,857,052 9.0% 12.2% 1,056,658 (96,000) 106,000
Midtown 7 2,494,696 469,003 18.8% 19.9% - 45,000 67,000
Downtown 41 34,345,887 3,326,055 9.7% 12.8% 1,056,658 (51,000) 173,000
FM 1960 / I-45 North 2 206,705 33,693 16.3% 16.3% - 0 1,000
FM 1960 / Champions 1 150,000 2,100 1.4% 1.4% - 0 (2,000)
FM 1960 / Highway 249 18 3,883,421 510,282 13.1% 14.1% - (3,000) 102,000
FM 1960 21 4,240,126 546,074 12.9% 13.8% - (3,000) 101,000
North Belt West / Greenspoint 17 4,343,919 1,750,599 40.3% 45.3% - (2,000) (217,000)
Greenspoint / IAH* 8 1,213,677 336,189 27.7% 27.7% - (1,000) (4,000)
Greenspoint / North Belt 25 5,557,596 2,086,788 37.5% 41.5% - (3,000) (221,000)
Greenway Plaza 18 7,020,681 1,012,382 14.4% 14.5% 191,805 134,000 245,000
Gulf Freeway/Pasadena - 0 0 0.0% 0.0% - 0 0
Katy 21 1,581,714 506,148 32.0% 32.0% 222,465 8,000 32,000
Katy Freeway East 23 5,496,806 554,078 10.1% 11.1% 238,173 (87,000) 75,000
Katy Freeway West 74 18,980,730 2,820,536 14.9% 19.4% 86,255 57,000 (246,000)
Katy Frwy / Energy Corridor 97 24,477,536 3,374,615 13.8% 17.5% 324,428 (30,000) (171,000)
Kingwood / Humble 2 140,977 28,195 20.0% 20.0% - 0 2,000
NASA / Clear Lake 16 2,182,855 38,855 1.8% 3.4% - 5,000 16,000
Northeast 1 555,700 0 0.0% 0.0% - 0 556,000
North Loop West 6 1,252,947 166,642 13.3% 15.4% - 0 12,000
Northwest Near 1 237,384 0 0.0% 0.0% - 0 0
Northwest Far 16 801,764 323,913 40.4% 41.6% - 0 (61,000)
Northwest 23 2,292,095 490,555 21.4% 23.0% - 0 (49,000)
South Main / Medical Center 16 4,618,943 191,224 4.1% 4.3% - 7,000 18,000
Southwest / Hillcroft 6 1,485,352 213,594 14.4% 14.4% - 11,000 20,000
Southwest Beltway 8 3 573,500 49,321 8.6% 8.6% - 0 30,000
East Ft Bend Co. / Sugar Land 21 4,122,722 345,896 8.4% 10.1% - (61,000) (42,000)
Southwest Fwy / Sugar Land 30 6,181,574 608,811 9.8% 11.0% - (50,000) 8,000
West Belt 23 4,066,013 674,958 16.6% 19.9% - (8,000) 27,000
Bellaire 7 1,203,314 162,447 13.5% 14.3% - (72,000) (80,000)
Post Oak Park 8 2,213,527 557,809 25.2% 26.5% 380,000 (42,000) (71,000)
Galleria 32 12,747,940 1,272,244 10.0% 11.3% 140,000 572,000 565,000
Riverway 5 1,885,813 203,668 10.8% 11.3% - 8,000 (14,000)
Richmond / Fountainview - 0 0 0.0% 0.0% - 0 0
San Felipe / Voss 3 1,714,929 265,814 15.5% 15.9% - 14,000 (19,000)
West Loop 55 19,765,523 2,461,982 12.5% 13.6% 1,120,000 480,000 381,000
Westchase 31 9,604,638 1,234,196 12.9% 19.8% - (91,000) 1,101,000
The Woodlands 41 11,018,964 1,317,868 12.0% 12.8% 201,933 31,000 243,000
Conroe 2 128,832 16,362 12.7% 12.7% - 0 (5,000)
TOTAL - Houston 463 137,779,654 17,915,069 13.0% 15.5% 2,315,356 429,000 2,457,000
SOURCE CoStar, Transwestern
NOTE Includes buildings 50,000 SF RBA and greater; does not include buildings under construction or owned by the government
* Inventory and number of buildings adjusted per changes in CoStar
6 REAL ESTATE OUTLOOK HOUSTON METRO Q3 2016
HOUSTON METRO MARKETTHIRD QUARTER 2016

Houston Office Market Indicators - Class B
SUBMARKET TOTAL BLDGS INVENTORY SF AVAILABLE
IMMEDIATELY
DIRECT VACANCY
Q3 2016
VACANCY WITH SUBLET
Q3 2016
UNDER CONSTRUCTION
NET ABSORPTION
Q3 2016
NET ABSORPTION
YTD 2016
Central Business District 38 14,511,526 2,519,201 17.4% 18.8% - (17,000) (149,000)
Midtown 19 3,177,347 165,222 5.2% 5.2% - 22,000 6,000
Downtown 57 17,688,873 2,684,423 15.2% 16.4% - 5,000 (143,000)
FM 1960 / I-45 North 12 1,016,244 227,639 22.4% 22.7% - (11,000) (39,000)
FM 1960 / Champions 20 1,632,335 423,591 26.0% 26.0% - 30,000 18,000
FM 1960 / Highway 249 20 1,444,701 156,028 10.8% 16.8% - 0 (17,000)
FM 1960 52 4,093,280 807,257 19.7% 21.9% - 19,000 (38,000)
North Belt West / Greenspoint 45 4,664,503 1,292,067 27.7% 33.0% - 35,000 89,000
Greenspoint / IAH 11 1,693,378 148,171 8.8% 8.8% - 6,000 (3,000)
Greenspoint / North Belt 56 6,357,881 1,440,238 22.7% 26.6% - 41,000 86,000
Greenway Plaza 27 3,764,733 271,061 7.2% 7.5% - 0 (70,000)
Gulf Freeway / Pasadena 29 2,248,468 406,973 18.1% 18.1% - (7,000) 24,000
Katy 20 1,611,171 29,001 1.8% 1.8% 63,000 (2,000) (5,000)
Katy Freeway East 29 3,064,396 240,555 7.9% 8.8% - 11,000 11,000
Katy Freeway West 73 8,194,731 1,600,431 19.5% 21.5% - (158,000) (278,000)
Katy Fwy / Energy Corridor 102 11,259,127 1,840,986 16.4% 18.0% - (147,000) (267,000)
Kingwood / Humble 7 884,070 35,363 4.0% 4.0% - 9,000 20,000
NASA / Clear Lake 43 4,511,246 924,805 20.5% 20.5% - (54,000) 36,000
Northeast* 10 861,956 202,560 23.5% 23.5% - (53,000) (57,000)
North Loop West 20 2,536,907 366,583 14.5% 14.7% - (22,000) 1,000
Northwest Near 8 802,294 7,221 0.9% 0.9% - 6,000 3,000
Northwest Far 24 2,381,429 504,863 21.2% 21.5% - 48,000 51,000
Northwest 52 5,720,630 878,667 15.4% 15.6% - 32,000 55,000
South Main / Medical Center 18 3,991,862 690,592 17.3% 17.3% - (8,000) 4,000
Southwest / Hillcroft 16 1,598,169 367,579 23.0% 23.0% - 1,000 32,000
Southwest Beltway 8 32 4,413,473 752,938 17.1% 17.2% - (25,000) 45,000
East Ft Bend Co. / Sugar Land 24 2,247,136 148,760 6.6% 7.3% - (3,000) (1,000)
Southwest Fwy / Sugar Land 72 8,258,778 1,269,278 15.4% 15.6% - (27,000) 76,000
West Belt 14 1,261,839 194,323 15.4% 27.2% - 3,000 3,000
Bellaire 18 2,781,223 170,211 6.1% 6.1% - 5,000 (28,000)
Post Oak Park 18 1,891,123 228,826 12.1% 12.6% - 10,000 (21,000)
Galleria 22 3,307,175 305,914 9.3% 10.6% - (5,000) (61,000)
Riverway 9 870,126 155,753 17.9% 17.9% - 3,000 (24,000)
Richmond / Fountainview 7 559,977 148,954 26.6% 26.6% - (10,000) (3,000)
San Felipe / Voss 30 3,326,956 370,956 11.2% 11.3% - (62,000) (90,000)
West Loop 104 12,736,580 1,380,612 10.8% 11.3% - (59,000) (227,000)
Westchase 53 7,301,615 1,137,592 15.6% 15.9% 186,000 (553,000) (480,000)
The Woodlands 51 4,566,209 436,530 9.6% 10.9% - 6,000 (29,000)
Conroe 9 689,737 68,284 9.9% 9.9% - 0 7,000
TOTAL - Houston 776 97,808,055 14,698,544 15.0% 16.1% 249,000 (795,000) (1,005,000)
SOURCE CoStar, Transwestern
NOTE Includes buildings 50,000 SF RBA and greater; does not include buildings under construction or owned by the government
REAL ESTATE OUTLOOK HOUSTON METRO Q3 2016 7

Copyright © 2016 Transwestern. All rights reserved. No part of this work may be reproduced or distributed to third parties without written permission of the copyright owner. The information contained in this report was gathered by Transwestern from various primary and secondary sources believed to be reliable. Transwestern, however, makes no representation concerning the accuracy or completeness of such information and expressly disclaims any responsibility for any inaccuracy contained herein.
METHODOLOGY
The information in this report is the result of a compilation of information on office,
industrial, retail, multifamily and healthcare properties located in the Houston
metropolitan area. This report includes single-tenant, multi-tenant and owner-user
properties and excludes properties owned and occupied by a government agency.
Rachel AndraeResearch [email protected]
Kevin RobertsPresident, [email protected]
CONTACT
SUBMARKET 2013 CLASS A
2013 CLASS B
2014 CLASS A
2014 CLASS B
2015 CLASS A
2015 CLASS B
Q3 2016 CLASS A
Q3 2016 CLASS B
% CHANGE 12/15-09/16
CLASS A
% CHANGE 12/15-09/16
CLASS B
Central Business District $39.32 $25.99 $42.71 $28.13 $43.87 $28.66 $43.05 $28.36 -1.9% -1.0%
Midtown $30.32 $26.03 $34.36 $27.17 $34.73 $27.39 $34.15 $27.39 -1.7% 0.0%
Downtown $38.10 $25.99 $41.93 $28.03 $42.28 $28.57 $41.80 $28.30 -1.2% -1.0%
FM 1960 / I-45 North - $18.06 - $18.20 $25.00 $17.65 $25.00 $17.22 0.0% -2.4%
FM 1960 / Champions - $13.19 - $13.55 - $13.80 - $13.86 - 0.4%
FM 1960 / Highway 249 $25.67 $20.80 $26.56 $20.62 $26.87 $20.73 $27.28 $20.41 1.5% -1.5%
FM 1960 $25.71 $15.52 $26.56 $15.74 $26.73 $15.99 $27.03 $16.07 1.1% 0.5%
North Belt West / Greenspoint $29.51 $15.63 $30.26 $15.59 $28.29 $14.92 $27.90 $13.97 -1.4% -6.4%
Greenspoint / IAH $21.36 $16.34 $21.65 $15.80 $21.77 $15.97 $21.87 $15.43 0.5% -3.4%
Greenspoint / North Belt $27.24 $15.73 $28.95 $15.62 $27.22 $15.03 $26.93 $14.12 -1.1% -6.1%
Greenway Plaza $32.11 $23.72 $35.04 $25.34 $35.92 $25.89 $35.95 $25.63 0.1% -1.0%
Gulf Freeway / Pasadena - $21.61 - $22.35 - $22.35 - $21.65 - -3.1%
Katy $30.56 $23.20 $32.26 $23.71 $32.94 $24.01 $32.71 $24.03 -0.7% 0.1%
Katy Freeway East $35.52 $21.79 $36.65 $23.26 $38.02 $23.89 $38.08 $24.07 0.2% 0.8%
Katy Freeway West $33.69 $20.52 $35.98 $22.73 $37.19 $23.13 $36.21 $22.27 -2.6% -3.7%
Katy Fwy / Energy Corridor $34.08 $21.12 $36.06 $22.90 $37.40 $23.25 $36.52 $22.51 -2.4% -3.2%
Kingwood / Humble $32.13 $19.00 $32.13 $19.54 $32.55 $18.75 $32.01 $18.89 -1.7% 0.7%
NASA / Clear Lake $23.58 $18.33 $25.01 $18.62 $25.01 $18.82 $24.86 $18.01 -0.6% -4.3%
Northeast - $16.57 - $17.32 - $17.29 - $17.38 - 0.5%
North Loop West $23.81 $18.25 $26.76 $20.50 $26.97 $20.81 $26.90 $20.79 -0.3% -0.1%
Northwest Near - $15.60 - $16.40 - $16.63 - $16.63 - 0.0%
Northwest Far $19.04 $15.31 $19.29 $16.66 $19.38 $16.70 $19.16 $16.04 -1.1% -4.0%
Northwest $21.83 $16.72 $23.67 $18.50 $22.44 $18.32 $21.79 $18.03 -2.9% -1.6%
South Main / Medical Center $28.54 $24.00 $29.09 $25.09 $29.19 $25.26 $29.20 $25.14 0.0% -0.5%
Southwest / Hillcroft $21.75 $14.18 $21.98 $13.81 $22.04 $14.10 $22.12 $14.11 0.4% 0.1%
Southwest Beltway 8 $23.24 $16.68 $22.45 $16.43 $22.45 $16.23 $22.51 $16.07 0.3% -1.0%
East Ft Bend Co. / Sugar Land $26.68 $21.32 $27.09 $21.60 $28.02 $21.49 $28.46 $21.29 1.6% -0.9%
Southwest Fwy / Sugar Land $24.95 $16.67 $25.17 $16.56 $25.05 $16.12 $25.75 $16.11 2.8% -0.1%
West Belt $30.35 $23.21 $31.42 $23.83 $32.02 $23.89 $32.27 $23.69 0.8% -0.8%
Bellaire $25.86 $21.08 $26.80 $22.09 $26.96 $22.14 $26.97 $22.12 0.0% -0.1%
Post Oak Park $35.43 $26.36 $35.94 $27.43 $36.51 $27.76 $36.28 $27.74 -0.6% -0.1%
Galleria $35.70 $26.70 $37.04 $27.49 $38.00 $27.40 $37.60 $27.09 -1.1% -1.1%
Riverway $30.82 $23.72 $32.10 $25.12 $33.14 $25.66 $32.99 $25.30 -0.5% -1.4%
Richmond / Fountainview - $16.64 - $17.54 - $17.83 - $17.78 - -0.3%
San Felipe / Voss $32.44 $22.40 $34.54 $23.41 $35.19 $23.50 $34.93 $23.46 -0.7% -0.2%
West Loop $34.25 $23.68 $35.40 $24.43 $36.44 $24.46 $35.93 $24.40 -1.4% -0.2%
Westchase $35.38 $19.75 $38.70 $21.51 $38.98 $21.23 $38.41 $20.97 -1.5% -1.2%
The Woodlands $35.95 $23.38 $39.56 $25.63 $40.56 $25.39 $40.35 $25.01 -0.5% -1.5%
Conroe $28.42 $25.73 $28.40 $25.08 $29.35 $24.77 $29.22 $24.58 -0.4% -0.8%
TOTAL - Houston $32.71 $19.96 $34.49 $20.88 $35.31 $21.28 $35.24 $21.53 -0.2% 1.2%
SOURCE CoStar, TranswesternNOTE Rents for properties using triple net terms have been grossed up to full service with operating expense data, rents reflect full service equivalent
Houston Office Market Indicators - Asking Rental Rates

OVERVIEW
Leasing velocity remains downWhile the overall Houston economy is adding jobs, major office demand drivers like upstream energy and engineering are accruing further losses. This is in stark contrast to downstream energy which is booming on the east side of the metro with over $53 billion in construction either underway or planned. Vacancy is on the rise as upstream companies continue to reduce workforces, downsize and cut costs across the board. Net absorption stayed in the black through first quarter as deliveries were largely preleased, but rent growth finally tapered off, and concession packages remain high. Houston has firmly become a tenant's market, and conditions will become even more tenant-favorable as the year progresses.
NET ABSORPTION
Deliveries still driving positive absorptionNet absorption for all classes of space totaled 996,000 SF at first quarter, fueled largely by preleased deliveries. Class A recorded 1.2 million SF of positive absorption for the quarter, and Class B recorded a fourth quarter in a row of negative absorption at 191,000 SF. Though Class AA demand has given way to a more value office trend recently, Class B space is still suffering the effects of the previous flight-to-quality trend. Absent the volume of new deliveries, overall and Class A net absorption would have been negative 758,000 SF and negative 539,000 SF, respectively. The largest move-out by far this quarter was BMC in Westchase, while most others were in the small to mid-range.
HOUSTON OFFICE MARKETFIRST QUARTER 2016
REAL ESTATE OUTLOOK
Energy Downturn Hits Office Market Hard Fundamentals weakening as expected
NET ABSORPTION AND VACANCY RATE TRENDS HOUSTON METRO AREA
CONTIGUOUS BLOCKS OF AVAILABLE SPACE HOUSTON METRO
SOURCE CoStar, Transwestern *Through Q1 2016
SOURCE CoStar, Transwestern *Through Q1 2016
Note: Delivery of preleased space counts as positive net absorption
Notable Q1 LeasesTENANT SF LEASE TYPE BUILDING SUBMARKET
United Airlines 225,000 Prelease 609 Main at Texas CBD
Linde Processing Plants 50,380 New Linde Plaza Katy Freeway West
Citigroup 49,730 New Galleria Tower I Galleria
USI Insurance 46,902 New Air Liquide Center Katy Freeway East
Bureau Veritas 43,602 New Greenspoint Park North Belt West/Greenspoint
5%6%7%8%9%
10%11%12%13%14%
-1,00001,0002,0003,0004,0005,0006,0007,0008,000
05 06 07 08 09 10 11 12 13 14 15 16*
Net Absorption (Thousands of SF) Direct Vacancy Rate
020406080100120140160
25,000 SF 50,000 SF 100,000 SF 200,000 SF
Class A Direct Class A Sublet Class B Direct Class B Sublet

VACANCY
Vacancy rises with low demandThe overall office vacancy rate (including sublet) was 13.8% at first quarter, unchanged from year-end. Direct vacancy was 12.5%, up from 12.2% last quarter. Total available sublease space continues to grow, adding more than 940,000 SF this quarter to hit 8.7 million SF on the market. Sublease space is expected to continue rising over the course of 2016 and hit the 10 million SF range by the end of the year. Energy companies comprise the majority of sublease space on the market, accounting for 78% of the total. Total available space for lease in several submarkets is markedly higher than what is reported as vacant in statistics. Submarkets like the Energy Corridor and Galleria will continue to experience increasing downside pressure and rising availability rates as the energy downturn cuts deep into fundamentals.
Class A overall vacancy was 12.9% at first quarter, down just slightly from 13.0% at year-end, and Class A direct was 11.5%, up from 11.1% over the same period. Vacant available space declined over this period as deliveries were 92% preleased, adding 1.8 million SF of occupied Class A space to the existing inventory. Vacancy rates will continue trending upward in the period ahead as demand remains low and space still under construction delivers.
RENTAL R ATES
Rents begin to slip in 2016Asking rental rates for all classes of office space have increased 0.7% from year-end to $28.39 per SF gross. Class A rents were down 0.6% to $35.09 per SF gross, and Class B rents rose 0.1% to $21.30 per SF gross from the close of the year. Asking rents reached a tipping point at the end of 2015 and should trend downward in the period ahead. Rent declines lagged behind other indicators as landlords worked to maintain face rents as long as possible. Concessions are prevalent, especially in Class A, with free rent and improvement packages dramatically increasing.
SUPPLY AND DEVELOPMENT
Pipeline continues to coolThere was 5.9 million SF of office space under construction at first quarter, as compared to 7.2 million SF at year-end. This space was 49% preleased, as compared to 61% at the end of 2015. The majority of the construction pipeline, 4.8 million SF, is currently scheduled to deliver in the remaining three quarters of 2016.
There is no longer a standout submarket for construction activity, as the Energy Corridor, Westchase, CBD and Galleria all have around one million SF under construction. The Energy Corridor is the most vulnerable for negative performance given the current state of the oil and gas market and a construction pipeline only 23% preleased. The biggest projects under construction are Phillips 66's campus in Westchase at 1.1 million SF and 609 Main at Texas in the CBD at 1.0 million SF.
Office Under ConstructionHouston Metro | Q1 2016
SUBMARKET SF % PRE-LEASED
West Loop 1,285,000 71%
Energy Corridor 1,179,475 23%
Westchase 1,100,000 100%
CBD 1,056,658 27%
The Woodlands 511,913 10%
Greenway Plaza 398,696 27%
FM 1960/Hwy 249 165,754 27%
Katy 124,017 18%
Gulf Freeway/Pasadena 102,000 83%
Total 5,923,513 49%
AVERAGE OFFICE RENTS HOUSTON METRO AREA
SOURCE CoStar, Transwestern *Through Q1 2016 Note: All classes of office space
Total Available SpaceHouston Metro | Q1 2016
SUBMARKET SUBLEASE SPACE (SF)
% SUBLEASE
% TOTAL AVAILABLE
Energy Corridor 2,289,000 6.3% 21.1%
CBD 1,803,000 3.8% 20.1%
Westchase 1,107,000 6.8% 20.0%
Greenspoint 684,000 5.2% 41.8%
Galleria 888,000 5.6% 18.5%
All of Houston 8,688,000 3.6% 20.4%
$16
$18
$20
$22
$24
$26
$28
$30
05 06 07 08 09 10 11 12 13 14 15 16*
$28.39
Asking Rents ($/SF Gross)
2 REAL ESTATE OUTLOOK HOUSTON METRO Q1 2016
HOUSTON METRO MARKETFIRST QUARTER 2016

Deliveries dropped off significantly in the first quarter with the metro recording just 1.9 million SF added to the market at 92% preleased. Of the six buildings delivered this quarter, three were owner-occupied and one was single-tenant, which was reflected in the high preleased percentage. The largest projects delivered include FMC Technologies' campus at 510,000 SF in the Northeast submarket and Millennium Tower II at 445,000 SF in Westchase.
INVESTMENT MARKET
Volume falls off in Q1The metro recorded just $214.6 million in office sales transactions during the first quarter, further evidence that large asset transactions have tapered off. Sales for 2015 totaled a revised $3.2 billion. Pricing averaged $113 per SF this quarter, as compared to $330 per SF at fourth quarter and $239 per SF for all of 2015. Average prices were down sizably as sales this quarter were largely comprised of smaller Class B and C assets. The average cap rate was 7.3%, down from a revised fourth quarter average of 7.6%. Cap rates for all of 2015 averaged 7.2% These figures represent assets for which pricing information could be obtained.
The energy downturn and corresponding economic uncertainty have caused a disparity in pricing expectations, leaving some owners hesitant to list. There is a significant bid-ask spread as buyers and sellers of office assets work to adjust expectations in a down economy. Marathon Oil Tower was taken off the market in the first quarter as offers came in lower than expected. As the office sector in Houston is expected to get worse before seeing a recovery, fewer buildings are being listed for sale. Deals in 2016 are more likely to be sourced off market as owners try to keep lower pricing from being advertised.
COMPARATIVE OFFICE INVESTMENT SALES VOLUME SELECT METRO AREAS
SOURCE Real Capital Analytics, Transwestern ,*Through Q1 2016
AVERAGE OFFICE SALE PRICE HOUSTON METRO AREA
SOURCE Real Capital Analytics, Transwestern,*Through Q1 2016
Notable Q1 TransactionsBUILDING SUBMARKET SALE PRICE CAP RATE SELLER BUYER
5300 Memorial Midtown $31.5 million ($205/SF) 7.6% Parkway Properties Equus Capital Partners
Town & Country Central I Katy Freeway East $26.0 million ($175/SF) 7.7% Parkway Properties Equus Capital Partners
5433 Westheimer Galleria $15.2 million ($123/SF) 6.4% Songy Highroads & EDENS joint venture Urban Meridian
SOURCE Real Capital Analytics, HFF, Transwestern
Sales Volume in Billions
$0.0
$1.0
$2.0
$3.0
$4.0
$5.0
$6.0
Atl Dal Den Hou
05 06 07 08 09 10 11 12 13 14 15 16*
Average Sale Price Per SF
$113
$0
$50
$100
$150
$200
$250
05 06 07 08 09 10 11 12 13 14 15 16*
REAL ESTATE OUTLOOK HOUSTON METRO Q1 2016 3

OUTLOOK
Market in for rough road aheadThe office sector is experiencing the most fallout by far in the current economic conditions as workforce reductions, M&A activity, cost cutting and downsizing by energy companies further weakens fundamentals. Tenants and landlords must frequently adjust to changing market conditions as bankruptcy filings and sublease space steadily grows. Some of these market realities have not yet caught up with statistics as office metrics lag behind companies' real estate decisions. The office market will likely be extremely challenging for several years, and the full impact will not be realized until oil prices stabilize, and energy companies hit bottom and begin to recover.
The metro’s current development pipeline is 49% preleased, and a slower economy will limit further leasing activity in this space. Additionally, many of these tenants will vacate large blocks of space when they move to occupy new buildings. With tepid demand expected in the period ahead, we anticipate the overall vacancy rate for all classes of space to increase over the next two years, climbing to the high-17% range. As development activity drops off, Houston's strong net absorption will go with it allowing a different picture of the market to emerge. Asking rents will fall with better deals coming for tenants in the market. This is not the 1980s, but it is arguably the toughest office market since that time.
Multi-tenant market vs Transwestern comprehensive market coverage
MULTI-TENANT ENTIRE MARKET
Inventory 190.1 MSF 244.5 MSF
Overall Vacancy 16.4% 13.8%
Q1 Net Absorption 1.4 MSF 996,000 SF
WHY OUR METHODOLOGY IS THE BEST INDICATOR OF CURRENT MARKET CONDITIONSWe include owner occupied and single-tenant buildings in our inventory, vacancy and absorption statistics to capture more market activity than many of our competitors. This allows us to better correlate changes in the market with changes in employment. As single-tenant space does compete with multi-tenant space, we believe it is critical to understand all components of the market. The inclusion of single-tenant and owner-occupied space tends to yield lower vacancy rates and higher absorption totals than some of our competitors’ results, but our coverage of the market is more comprehensive.
OFFICE ABSORPTION AND EMPLOYMENT HOUSTON METRO AREA
SOURCE Bureau of Labor Statistics, Transwestern *12-month job growth through February 2016, net absorption through Q1 2016
-100
-75
-50
-25
0
25
50
75
100
125
-1,000
0
1,000
2,000
3,000
4,000
5,000
6,000
7,000
8,000
05 06 07 08 09 10 11 12 13 14 15 16*
Net Absorption (Thousands of SF) Payroll Job Growth (in Thousands)
4 REAL ESTATE OUTLOOK HOUSTON METRO Q1 2016
HOUSTON METRO MARKETFIRST QUARTER 2016

Houston Office Market Indicators - All Space
SUBMARKET TOTAL BLDGS INVENTORY SF AVAILABLE
IMMEDIATELY
DIRECT VACANCY
2015
DIRECT VACANCY
Q1 2016
VACANCY WITH SUBLET
Q1 2016
UNDER CONSTRUCTION
NET ABSORPTION
Q1 2016
Central Business District 87 47,919,574 5,625,758 11.3% 11.7% 13.6% 1,056,658 136,000
Midtown 33 5,759,744 851,290 15.0% 14.8% 15.0% - 13,000
Downtown 120 53,679,318 6,477,048 11.7% 12.1% 13.8% 1,056,658 149,000
FM 1960 / I-45 North 15 1,371,988 215,402 14.2% 15.7% 15.9% - (21,000)
FM 1960 / Champions 22 1,850,305 453,325 24.0% 24.5% 24.5% - (9,000)
FM 1960 / Highway 249 40 5,305,239 606,919 11.8% 11.4% 14.0% 165,754 19,000
FM 1960 77 8,527,532 1,275,646 14.8% 15.0% 16.6% 165,754 (11,000)
North Belt West / Greenspoint 75 10,105,399 3,096,294 30.6% 30.6% 34.0% - (9,000)
Greenspoint / IAH 22 3,076,008 519,845 16.1% 16.9% 17.2% - (25,000)
Greenspoint / North Belt 97 13,181,407 3,616,140 27.2% 27.4% 30.1% - (34,000)
Greenway Plaza 50 11,064,288 1,349,843 11.3% 12.2% 12.3% 398,696 121,000
Gulf Freeway/Pasadena 34 2,597,502 400,015 14.0% 15.4% 15.4% 102,000 (36,000)
Katy 43 3,259,094 514,937 15.9% 15.8% 15.9% 124,017 3,000
Katy Freeway East 63 9,604,261 835,571 9.1% 8.7% 9.5% 226,511 38,000
Katy Freeway West 142 26,506,699 3,127,790 11.3% 11.8% 14.5% 952,964 (133,000)
Katy Frwy / Energy Corridor 205 36,110,960 3,963,361 10.7% 11.0% 13.2% 1,179,475 (95,000)
Kingwood / Humble* 9 1,025,047 84,054 9.3% 8.2% 8.2% - 11,000
NASA / Clear Lake 63 7,051,599 849,013 13.4% 12.0% 12.4% - 96,000
Northeast 16 1,665,562 206,530 17.9% 12.4% 12.4% - 510,000
North Loop West 29 4,133,495 565,049 13.9% 13.7% 14.4% - 10,000
Northwest Near 13 1,319,023 6,595 0.8% 0.5% 0.8% - 4,000
Northwest Far 31 3,430,620 864,516 23.8% 25.2% 25.6% - (47,000)
Northwest 73 8,883,138 1,436,160 15.8% 16.2% 16.7% - (33,000)
South Main / Medical Center 49 10,469,072 975,718 9.2% 9.3% 9.3% - (13,000)
Southwest / Hillcroft 35 4,269,911 713,075 17.2% 16.7% 16.9% - 23,000
Southwest Beltway 8 43 5,620,512 883,544 16.8% 15.7% 15.8% - 61,000
E Fort Bend Co / Sugar Land 45 6,376,248 418,919 7.1% 6.6% 7.1% - 31,000
Southwest Fwy / Sugar Land 123 16,266,671 2,015,539 13.1% 12.4% 12.7% - 115,000
West Belt 37 4,902,573 808,925 16.5% 16.5% 17.8% - -
Bellaire 29 4,374,993 320,249 6.4% 7.3% 7.7% - (40,000)
Post Oak Park 29 4,294,059 760,048 16.7% 17.7% 18.6% 380,000 (43,000)
Galleria 55 15,804,024 1,408,139 8.6% 8.9% 9.9% 905,000 (54,000)
Riverway 16 2,868,495 332,745 11.2% 11.6% 12.3% - (11,000)
Richmond / Fountainview 11 819,689 193,447 22.9% 23.6% 23.6% - (6,000)
San Felipe / Voss 33 5,041,885 463,853 9.6% 9.2% 9.4% - 20,000
West Loop 173 33,203,145 3,478,482 10.1% 10.5% 11.2% 1,285,000 (134,000)
Westchase 88 16,367,349 1,734,939 9.2% 10.6% 13.0% 1,100,000 178,000
The Woodlands 92 15,348,455 1,335,316 8.0% 8.7% 9.3% 511,913 169,000
Conroe 13 903,345 79,494 8.8% 8.8% 8.8% - -
TOTAL - Houston 1,362 244,506,057 30,601,159 12.2% 12.5% 13.8% 5,923,513 996,000
SOURCE CoStar, Transwestern
NOTE Includes buildings 50,000 SF RBA and greater; does not include buildings under construction or owned by the government
* Inventory and number of buildings amended per changes in CoStar
REAL ESTATE OUTLOOK HOUSTON METRO Q1 2016 5
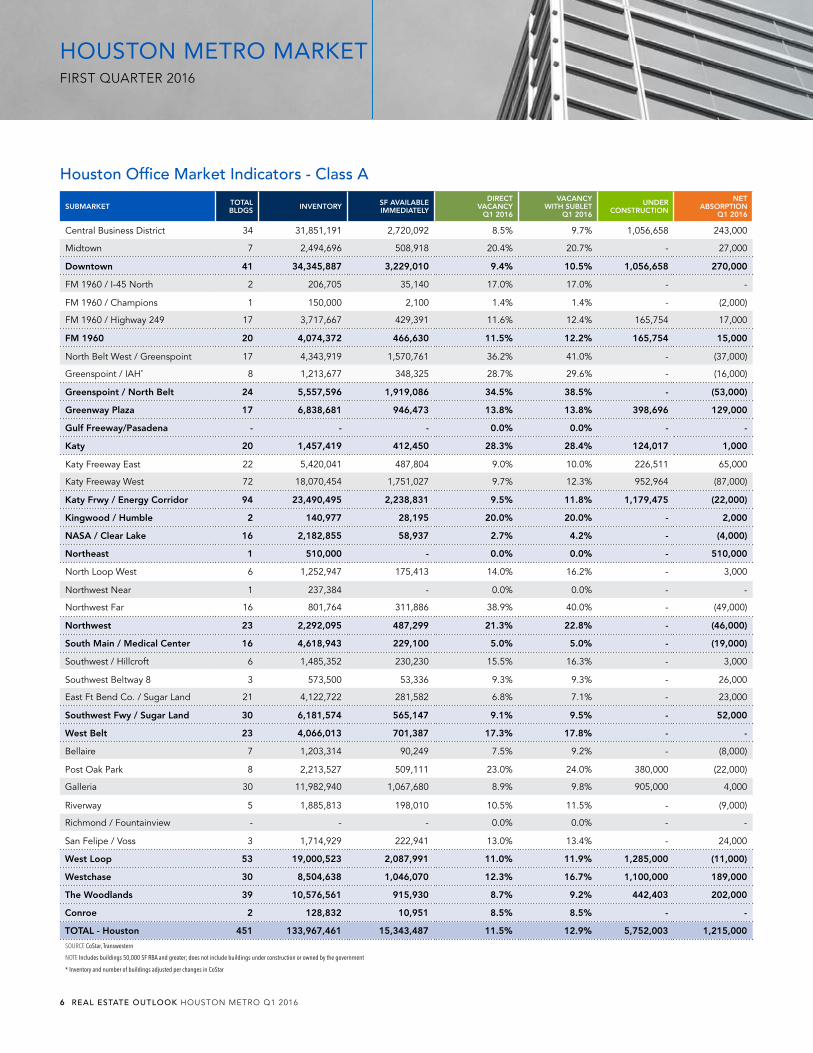
Houston Office Market Indicators - Class A
SUBMARKET TOTAL BLDGS INVENTORY SF AVAILABLE
IMMEDIATELY
DIRECT VACANCY
Q1 2016
VACANCY WITH SUBLET
Q1 2016
UNDER CONSTRUCTION
NET ABSORPTION
Q1 2016
Central Business District 34 31,851,191 2,720,092 8.5% 9.7% 1,056,658 243,000
Midtown 7 2,494,696 508,918 20.4% 20.7% - 27,000
Downtown 41 34,345,887 3,229,010 9.4% 10.5% 1,056,658 270,000
FM 1960 / I-45 North 2 206,705 35,140 17.0% 17.0% - -
FM 1960 / Champions 1 150,000 2,100 1.4% 1.4% - (2,000)
FM 1960 / Highway 249 17 3,717,667 429,391 11.6% 12.4% 165,754 17,000
FM 1960 20 4,074,372 466,630 11.5% 12.2% 165,754 15,000
North Belt West / Greenspoint 17 4,343,919 1,570,761 36.2% 41.0% - (37,000)
Greenspoint / IAH* 8 1,213,677 348,325 28.7% 29.6% - (16,000)
Greenspoint / North Belt 24 5,557,596 1,919,086 34.5% 38.5% - (53,000)
Greenway Plaza 17 6,838,681 946,473 13.8% 13.8% 398,696 129,000
Gulf Freeway/Pasadena - - - 0.0% 0.0% - -
Katy 20 1,457,419 412,450 28.3% 28.4% 124,017 1,000
Katy Freeway East 22 5,420,041 487,804 9.0% 10.0% 226,511 65,000
Katy Freeway West 72 18,070,454 1,751,027 9.7% 12.3% 952,964 (87,000)
Katy Frwy / Energy Corridor 94 23,490,495 2,238,831 9.5% 11.8% 1,179,475 (22,000)
Kingwood / Humble 2 140,977 28,195 20.0% 20.0% - 2,000
NASA / Clear Lake 16 2,182,855 58,937 2.7% 4.2% - (4,000)
Northeast 1 510,000 - 0.0% 0.0% - 510,000
North Loop West 6 1,252,947 175,413 14.0% 16.2% - 3,000
Northwest Near 1 237,384 - 0.0% 0.0% - -
Northwest Far 16 801,764 311,886 38.9% 40.0% - (49,000)
Northwest 23 2,292,095 487,299 21.3% 22.8% - (46,000)
South Main / Medical Center 16 4,618,943 229,100 5.0% 5.0% - (19,000)
Southwest / Hillcroft 6 1,485,352 230,230 15.5% 16.3% - 3,000
Southwest Beltway 8 3 573,500 53,336 9.3% 9.3% - 26,000
East Ft Bend Co. / Sugar Land 21 4,122,722 281,582 6.8% 7.1% - 23,000
Southwest Fwy / Sugar Land 30 6,181,574 565,147 9.1% 9.5% - 52,000
West Belt 23 4,066,013 701,387 17.3% 17.8% - -
Bellaire 7 1,203,314 90,249 7.5% 9.2% - (8,000)
Post Oak Park 8 2,213,527 509,111 23.0% 24.0% 380,000 (22,000)
Galleria 30 11,982,940 1,067,680 8.9% 9.8% 905,000 4,000
Riverway 5 1,885,813 198,010 10.5% 11.5% - (9,000)
Richmond / Fountainview - - - 0.0% 0.0% - -
San Felipe / Voss 3 1,714,929 222,941 13.0% 13.4% - 24,000
West Loop 53 19,000,523 2,087,991 11.0% 11.9% 1,285,000 (11,000)
Westchase 30 8,504,638 1,046,070 12.3% 16.7% 1,100,000 189,000
The Woodlands 39 10,576,561 915,930 8.7% 9.2% 442,403 202,000
Conroe 2 128,832 10,951 8.5% 8.5% - -
TOTAL - Houston 451 133,967,461 15,343,487 11.5% 12.9% 5,752,003 1,215,000
SOURCE CoStar, Transwestern
NOTE Includes buildings 50,000 SF RBA and greater; does not include buildings under construction or owned by the government
* Inventory and number of buildings adjusted per changes in CoStar
6 REAL ESTATE OUTLOOK HOUSTON METRO Q1 2016
HOUSTON METRO MARKETFIRST QUARTER 2016
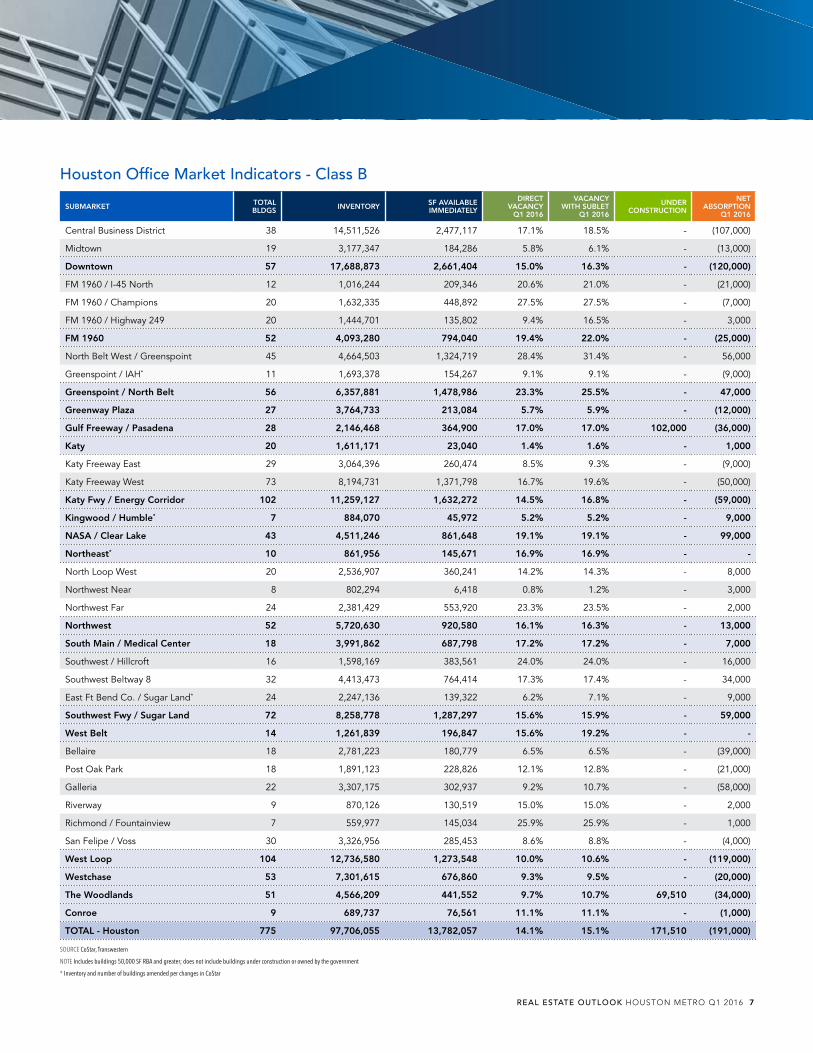
Houston Office Market Indicators - Class B
SUBMARKET TOTAL BLDGS INVENTORY SF AVAILABLE
IMMEDIATELY
DIRECT VACANCY
Q1 2016
VACANCY WITH SUBLET
Q1 2016
UNDER CONSTRUCTION
NET ABSORPTION
Q1 2016
Central Business District 38 14,511,526 2,477,117 17.1% 18.5% - (107,000)
Midtown 19 3,177,347 184,286 5.8% 6.1% - (13,000)
Downtown 57 17,688,873 2,661,404 15.0% 16.3% - (120,000)
FM 1960 / I-45 North 12 1,016,244 209,346 20.6% 21.0% - (21,000)
FM 1960 / Champions 20 1,632,335 448,892 27.5% 27.5% - (7,000)
FM 1960 / Highway 249 20 1,444,701 135,802 9.4% 16.5% - 3,000
FM 1960 52 4,093,280 794,040 19.4% 22.0% - (25,000)
North Belt West / Greenspoint 45 4,664,503 1,324,719 28.4% 31.4% - 56,000
Greenspoint / IAH* 11 1,693,378 154,267 9.1% 9.1% - (9,000)
Greenspoint / North Belt 56 6,357,881 1,478,986 23.3% 25.5% - 47,000
Greenway Plaza 27 3,764,733 213,084 5.7% 5.9% - (12,000)
Gulf Freeway / Pasadena 28 2,146,468 364,900 17.0% 17.0% 102,000 (36,000)
Katy 20 1,611,171 23,040 1.4% 1.6% - 1,000
Katy Freeway East 29 3,064,396 260,474 8.5% 9.3% - (9,000)
Katy Freeway West 73 8,194,731 1,371,798 16.7% 19.6% - (50,000)
Katy Fwy / Energy Corridor 102 11,259,127 1,632,272 14.5% 16.8% - (59,000)
Kingwood / Humble* 7 884,070 45,972 5.2% 5.2% - 9,000
NASA / Clear Lake 43 4,511,246 861,648 19.1% 19.1% - 99,000
Northeast* 10 861,956 145,671 16.9% 16.9% - -
North Loop West 20 2,536,907 360,241 14.2% 14.3% - 8,000
Northwest Near 8 802,294 6,418 0.8% 1.2% - 3,000
Northwest Far 24 2,381,429 553,920 23.3% 23.5% - 2,000
Northwest 52 5,720,630 920,580 16.1% 16.3% - 13,000
South Main / Medical Center 18 3,991,862 687,798 17.2% 17.2% - 7,000
Southwest / Hillcroft 16 1,598,169 383,561 24.0% 24.0% - 16,000
Southwest Beltway 8 32 4,413,473 764,414 17.3% 17.4% - 34,000
East Ft Bend Co. / Sugar Land* 24 2,247,136 139,322 6.2% 7.1% - 9,000
Southwest Fwy / Sugar Land 72 8,258,778 1,287,297 15.6% 15.9% - 59,000
West Belt 14 1,261,839 196,847 15.6% 19.2% - -
Bellaire 18 2,781,223 180,779 6.5% 6.5% - (39,000)
Post Oak Park 18 1,891,123 228,826 12.1% 12.8% - (21,000)
Galleria 22 3,307,175 302,937 9.2% 10.7% - (58,000)
Riverway 9 870,126 130,519 15.0% 15.0% - 2,000
Richmond / Fountainview 7 559,977 145,034 25.9% 25.9% - 1,000
San Felipe / Voss 30 3,326,956 285,453 8.6% 8.8% - (4,000)
West Loop 104 12,736,580 1,273,548 10.0% 10.6% - (119,000)
Westchase 53 7,301,615 676,860 9.3% 9.5% - (20,000)
The Woodlands 51 4,566,209 441,552 9.7% 10.7% 69,510 (34,000)
Conroe 9 689,737 76,561 11.1% 11.1% - (1,000)
TOTAL - Houston 775 97,706,055 13,782,057 14.1% 15.1% 171,510 (191,000)
SOURCE CoStar, Transwestern
NOTE Includes buildings 50,000 SF RBA and greater; does not include buildings under construction or owned by the government
* Inventory and number of buildings amended per changes in CoStar
REAL ESTATE OUTLOOK HOUSTON METRO Q1 2016 7

Houston Office Market Indicators - Asking Rental Rates
SUBMARKET 2013 CLASS A
2013 CLASS B
2014 CLASS A
2014 CLASS B
2015 CLASS A
2015 CLASS B
Q1 2016 CLASS A
Q1 2016 CLASS B
% CHANGE 12/15-03/16
CLASS A
% CHANGE 12/15-03/16
CLASS B
Central Business District $39.32 $25.99 $42.71 $28.13 $43.87 $28.66 $43.39 $28.66 -1.1% 0.0%
Midtown $30.32 $26.03 $34.36 $27.17 $34.73 $27.39 $34.32 $27.64 -1.2% 0.9%
Downtown $38.10 $25.99 $41.93 $28.03 $42.28 $28.57 $41.82 $28.59 -1.1% 0.1%
FM 1960 / I-45 North - $18.06 - $18.20 $25.00 $17.65 $25.00 $17.52 0.0% -0.7%
FM 1960 / Champions - $13.19 - $13.55 - $13.80 - $13.91 - 0.8%
FM 1960 / Highway 249 $25.67 $20.80 $26.56 $20.62 $26.87 $20.73 $27.07 $20.50 0.7% -1.1%
FM 1960 $25.71 $15.52 $26.56 $15.74 $26.73 $15.99 $26.92 $15.98 0.7% -0.1%
North Belt West / Greenspoint $29.51 $15.63 $30.26 $15.59 $28.29 $14.92 $28.00 $14.15 -1.0% -5.2%
Greenspoint / IAH $21.36 $16.34 $21.65 $15.80 $21.77 $15.97 $22.18 $15.67 1.9% -1.9%
Greenspoint / North Belt $27.24 $15.73 $28.95 $15.62 $27.22 $15.03 $27.05 $14.31 -0.6% -4.8%
Greenway Plaza $32.11 $23.72 $35.04 $25.34 $35.92 $25.89 $35.90 $25.83 -0.1% -0.2%
Gulf Freeway / Pasadena - $21.61 - $22.35 - $22.35 - $21.49 - -3.8%
Katy $30.56 $23.20 $32.26 $23.71 $32.94 $24.01 $32.65 $24.28 -0.9% 1.1%
Katy Freeway East $35.52 $21.79 $36.65 $23.26 $38.02 $23.89 $38.16 $24.10 0.4% 0.9%
Katy Freeway West $33.69 $20.52 $35.98 $22.73 $37.19 $23.13 $36.62 $22.76 -1.5% -1.6%
Katy Fwy / Energy Corridor $34.08 $21.12 $36.06 $22.90 $37.40 $23.25 $37.00 $22.97 -1.1% -1.2%
Kingwood / Humble $32.13 $19.00 $32.13 $19.54 $32.55 $18.75 $32.00 $18.75 -1.7% 0.0%
NASA / Clear Lake $23.58 $18.33 $25.01 $18.62 $25.01 $18.82 $25.04 $18.03 0.1% -4.2%
Northeast - $16.57 - $17.32 - $17.29 - $17.46 - 1.0%
North Loop West $23.81 $18.25 $26.76 $20.50 $26.97 $20.81 $26.84 $20.81 -0.5% 0.0%
Northwest Near - $15.60 - $16.40 - $16.63 - $16.63 - 0.0%
Northwest Far $19.04 $15.31 $19.29 $16.66 $19.38 $16.70 $19.35 $15.96 -0.2% -4.4%
Northwest $21.83 $16.72 $23.67 $18.50 $22.44 $18.32 $22.37 $17.88 -0.3% -2.4%
South Main / Medical Center $28.54 $24.00 $29.09 $25.09 $29.19 $25.26 $29.38 $25.21 0.7% -0.2%
Southwest / Hillcroft $21.75 $14.18 $21.98 $13.81 $22.04 $14.10 $22.00 $14.10 -0.2% 0.0%
Southwest Beltway 8 $23.24 $16.68 $22.45 $16.43 $22.45 $16.23 $22.70 $16.34 1.1% 0.7%
East Ft Bend Co. / Sugar Land $26.68 $21.32 $27.09 $21.60 $28.02 $21.49 $28.29 $21.19 1.0% -1.4%
Southwest Fwy / Sugar Land $24.95 $16.67 $25.17 $16.56 $25.05 $16.12 $25.20 $16.16 0.6% 0.2%
West Belt $30.35 $23.21 $31.42 $23.83 $32.02 $23.89 $32.02 $23.89 0.0% 0.0%
Bellaire $25.86 $21.08 $26.80 $22.09 $26.96 $22.14 $26.98 $22.02 0.1% -0.5%
Post Oak Park $35.43 $26.36 $35.94 $27.43 $36.51 $27.76 $36.06 $27.73 -1.2% -0.1%
Galleria $35.70 $26.70 $37.04 $27.49 $38.00 $27.40 $37.65 $27.40 -0.9% 0.0%
Riverway $30.82 $23.72 $32.10 $25.12 $33.14 $25.66 $33.00 $25.51 -0.4% -0.6%
Richmond / Fountainview - $16.64 - $17.54 - $17.83 - $17.82 - -0.1%
San Felipe / Voss $32.44 $22.40 $34.54 $23.41 $35.19 $23.50 $35.03 $23.40 -0.5% -0.4%
West Loop $34.25 $23.68 $35.40 $24.43 $36.44 $24.46 $36.12 $24.40 -0.9% -0.3%
Westchase $35.38 $19.75 $38.70 $21.51 $38.98 $21.23 $38.86 $21.35 -0.3% 0.6%
The Woodlands $35.95 $23.38 $39.56 $25.63 $40.56 $25.39 $40.80 $25.44 0.6% 0.2%
Conroe $28.42 $25.73 $28.40 $25.08 $29.35 $24.77 $29.40 $24.77 0.2% 0.0%
TOTAL - Houston $32.71 $19.96 $34.49 $20.88 $35.31 $21.28 $35.09 $21.30 -0.6% 0.1%
SOURCE CoStar, Transwestern
NOTE Rents for properties using triple net terms have been grossed up to full service with operating expense data, rents reflect full service equivalent
8 REAL ESTATE OUTLOOK HOUSTON METRO Q1 2016
HOUSTON METRO MARKETFIRST QUARTER 2016

Copyright © 2016 Transwestern. All rights reserved. No part of this work may be reproduced or distributed to third parties without written permission of the copyright owner. The information contained in this report was gathered by Transwestern from various primary and secondary sources believed to be reliable. Transwestern, however, makes no representation concerning the accuracy or completeness of such information and expressly disclaims any responsibility for any inaccuracy contained herein.
METHODOLOGY
The information in this report is the result of a compilation of information on office,
industrial, retail, multifamily and healthcare properties located in the Houston
metropolitan area. This report includes single-tenant, multi-tenant and owner-user
properties and excludes properties owned and occupied by a government agency.
CONTACT
Rachel AlexanderDirector of Market [email protected]
Kevin RobertsPresident, [email protected]
Houston Office Market Indicators - Asking Rental Rates
SUBMARKET 2013CLASS AA
2014 CLASS AA
2015CLASS AA
2016CLASS AA
% CHANGE 12/15-03/16 CLASS AA
Central Business District $50.04 $52.75 $54.29 $53.50 -1.5%
Galleria $46.95 $48.76 $49.44 $48.20 -2.5%
SOURCE CoStar, Transwestern
NOTE Class AA asking rents have been further broken out for two submarkets due to the large differential in rental rates for Class A. assets

HOUSTON OfficefebrUary 2016
Recent office leases
North Belt West/Greenspoint :: Bureau Veritas43,602 SF new lease at Greenspoint Park
Galleria :: NGKF38,582 SF new lease at 2 BLVD Place
North Belt West/ Greenspoint :: White Oak Operating22,378 SF new lease at 4 Greenspoint Place
Recent office sales
Midtown :: 5300 Memorial155,179 SF, Class BBuyer: Equus Investment Partnership X Fund Seller: Parkway Properties
Katy Freeway East :: Town & Country Central I148,434 SF, Class BBuyer: Equus Investment Partnership X Fund Seller: Parkway Properties
OFFICE LEASE STATISTICS
Source: Transwestern analysis of CoStar data, includes buildings 50,000 SF RBA and greater, excluding government owned buildings
Office Market indicators - all Space
SubmArkETTOTAL bLdgS
INVENTOrYSF AVAILAbLE ImmEdIATELY
dIrECT VACANCY
rATE
OVErALL VACANCY
rATE
SF uNdEr CONSTruCTION
q4 2015 NET AbSOrpTION
ASkINg rENTAL rATES (FSg)
CLASS A CLASS b
Downtown (CBD & Midtown) 119 53,272,718 6,218,674 11.7% 13.5% 1,463,258 (1,853,000) $42.28 $28.57
FM 1960 (FM 1960/I-45 N, FM 1960/Champions & FM 1960/Hwy 249)
77 8,527,532 1,264,383 14.8% 16.0% - 448,000 $26.73 $15.99
Greenspoint/North Belt (North Belt West/Greenspoint & Greenspoint/IAH)
97 13,181,407 3,582,437 27.2% 30.4% - (1,209,000) $27.22 $15.03
Greenway Plaza 49 10,816,013 1,222,209 11.3% 11.5% 458,275 (51,000) $35.92 $25.89
Gulf Freeway/Pasadena 34 2,597,502 363,650 14.0% 14.0% - 65,000 - $22.35
Katy 43 3,259,094 518,196 15.9% 16.1% 124,017 461,000 $32.94 $24.01
Katy Frwy/Energy Corridor (Katy Freeway East & Katy Freeway West)
205 36,110,960 3,869,245 10.7% 13.2% 914,037 2,572,000 $37.40 $23.25
Kingwood/Humble 8 789,674 73,440 9.3% 9.3% - (16,000) $32.55 $18.75
NASA/Clear Lake 63 7,051,599 944,914 13.4% 13.8% - - $25.01 $18.82
Northeast 15 1,155,562 206,846 17.9% 17.9% 1,000,000 (23,000) - $17.29
Northwest (North Loop West, Northwest Near & Northwest Far)
73 8,883,138 1,402,282 15.8% 16.5% - (43,000) $22.44 $18.32
South Main/Medical Center 49 10,469,072 963,155 9.2% 9.2% - (105,000) $29.19 $25.26
Southwest Frwy/Sugar Land (SW/Hillcroft, SW Beltway 8 & E Ft Bend Co/Sugar Land)
123 16,266,671 2,129,477 13.1% 13.4% - 595,000 $25.05 $16.12
West Belt 37 4,902,573 808,925 16.5% 17.6% - 690,000 $32.02 $23.89
West Loop (Bellaire, Post Oak Park, Galleria, Riverway, Richmond/Fountainview & San Felipe/Voss)
173 33,203,145 3,344,513 10.1% 11.6% 1,285,000 (296,000) $36.44 $24.46
Westchase 87 15,922,349 1,468,041 9.2% 12.5% 1,545,000 76,000 $38.98 $21.23
The Woodlands 90 15,048,455 1,203,876 8.0% 8.7% 442,503 2,470,000 $40.56 $25.39
Conroe 13 903,345 79,494 8.8% 8.8% - 73,000 $29.35 $24.77
Total - Houston 1,355 242,360,809 29,663,756 12.2% 13.8% 7,231,990 3,854,000 $35.31 $21.28
Source: Transwestern analysis of CoStar data, includes buildings 50,000 SF RBA and greater, excluding government owned buildings
Office Sales StatisticsHOuSTON mSA uNITEd STATES
quArTEr TO dATE
LAST quArTEr (q4 2015)
TrAILINg 12 mONTHS
LAST quArTEr (q4 2015)
TrAILINg 12 mONTHS
Volume ($ Mil)
$78.2 $811.7 $3,010.7 $40,801.4 $147,581.9
No. of Properties
5 25 140 1,531 5,914
Total SF 515,328 3,144,932 16,345,163 176,994,635 645,941,847
Average Price/SF
N/A $320 $259 $239 $249
Average Cap Rate (Yield)
N/A 7.6% 7.2% 6.6% 6.7%
Source: Real Capital Analytics
mArkET WATCH
Overall Vacancy Rates Asking Rental Rates (FSG)
Q412
Q113
Q213
Q313
Q413
Q114
Q214
Q314
Q414
Q115
Q215
Q315
Q415
$24.00
$25.00
$26.00
$27.00
$28.00
$29.00
9%
10%
11%
12%
13%
14%
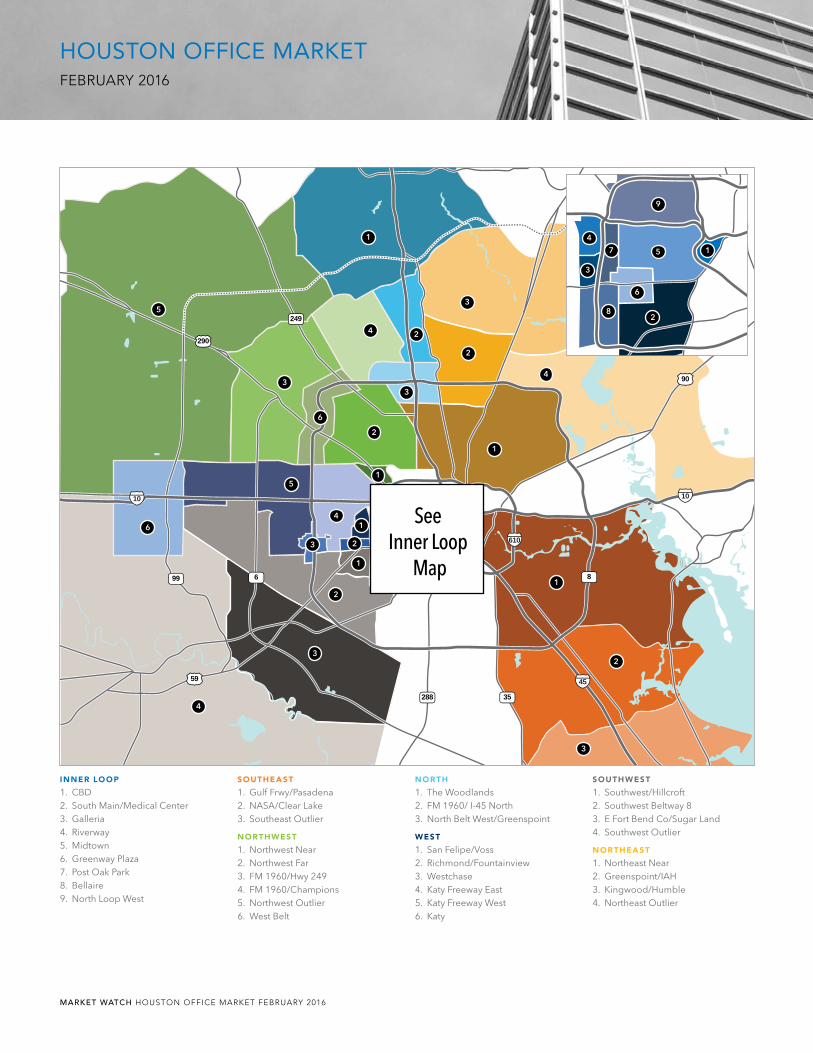
MARKET WATCH HOUSTON Office MARKeT febRUARy 2016
HOUSTON Office MarkeTfebRUARy 2016
610
45
1010
290
59
90
288
99
249
8
35
6
See Inner Loop
Map
4
3
3
2
2
1
1
1
1
1
1
1
4
5
5
5
6
2
2
2
2
2
3
33
3
3
4
4
4
6
6
7
8
9
inneR looP
1. CBD2. South Main/Medical Center3. Galleria4. Riverway5. Midtown6. Greenway Plaza7. Post Oak Park8. Bellaire9. North Loop West
southeast
1. Gulf Frwy/Pasadena2. NASA/Clear Lake3. Southeast Outlier
noRthWest
1. Northwest Near2. Northwest Far3. FM 1960/Hwy 2494. FM 1960/Champions5. Northwest Outlier6. West Belt
noRth
1. The Woodlands2. FM 1960/ I-45 North3. North Belt West/Greenspoint
West
1. San Felipe/Voss2. Richmond/Fountainview3. Westchase4. Katy Freeway East5. Katy Freeway West6. Katy
southWest
1. Southwest/Hillcroft2. Southwest Beltway 83. E Fort Bend Co/Sugar Land4. Southwest Outlier
noRtheast
1. Northeast Near2. Greenspoint/IAH3. Kingwood/Humble4. Northeast Outlier
Copyright © 2016 Transwestern. All rights reserved. No part of this work may be reproduced or distributed to third parties without written permission of the copyright owner. The information contained in this report was gathered by Transwestern from CoStar and other primary and secondary sources believed to be reliable. Transwestern, however, makes no representation concerning the accuracy or completeness of such information and expressly disclaims any responsibility for any inaccuracy contained herein.
HOUSTON Office MarkeTFebruary 2016
houston contacts
Eric AndersonExecutive Vice President - [email protected]
Doug LittleSenior Managing Director - [email protected]
David BakerExecutive Vice President - [email protected]
Michelle WoganExecutive Vice President - [email protected]
David LeeSenior Vice President - [email protected]
Paul WittorfSenior Vice President - [email protected]
Monte CalvertSenior Vice President - [email protected]
Greg TiltonVice President - [email protected]
Louann PereiraVice President - [email protected]
Justin LeightonManaging Director - Tenant [email protected]
Ken PageManaging Director - Tenant [email protected]
Bobbie BozarthSenior Vice President - Tenant [email protected]
Margaret Ann Cook Vice President - Tenant [email protected]
Michael SnodgrassManaging Director - Structured [email protected]
Jan SparksManaging Director - Structured [email protected]
mETHOdOLOgY
The information in this report is the result of a compilation of publicly available data from a variety of commercial and government sources.
CONTACT
Rachel AlexanderDirector of Market [email protected]
t 713.270.7700 f 713.270.6285www.transwestern.net/houston
1900 West Loop South, Suite 1300Houston, Texas 77027
SEATTLE
WALNUT CREEK
LOS ANGELES
SALT LAKECITY
DENVER
MINNEAPOLIS
MILWAUKEE
ST. LOUIS
CHICAGO
DETROIT GREENWICHNEW YORK
NEW JERSEY
BALTIMORENORTHERNVIRGINIA
BETHESDAWASHINGTON DC
DALLASFORTWORTH
HOUSTONAUSTIN
SAN ANTONIO
OKLAHOMACITY
NEW ORLEANS
ATLANTA
FORT LAUDERDALEORLANDO
MIAMI-DADE
SANFRANCISCO
PHOENIXORANGE COUNTY
SAN DIEGO
BOSTON
SILICONVALLEY
TRANSWESTERNLOCATIONS
aBout tR ansWesteRn
Transwestern is a privately held real estate firm specializing in agency leasing, property and facilities management, tenant advisory, capital markets, research and sustainability. The fully integrated global enterprise leverages competencies in office, industrial, retail, multifamily and healthcare properties to add value for investors, owners and occupiers of real estate. As a member of the Transwestern family of companies, the firm capitalizes on market insights and operational expertise of independent affiliates specializing in development, real estate investment management and research. Transwestern has 34 U.S. offices and assists clients through more than 180 offices in 37 countries as part of a strategic alliance with Paris-based BNP Paribas Real Estate.
Transwestern was founded in Houston, Texas in 1978, and Houston remains the corporate headquarters today. As one of the preeminent commercial real estate firms in Houston, we offer a comprehensive menu of real estate services designed to provide owners, tenants and investors with the optimum solutions for their unique requirements. Transwestern has seasoned veterans in every area of expertise with the integrity, experience and creativity to be the best partner for its clients. Transwestern’s Houston office currently employs over 400 team members and has been an innovator in the Houston market for 38 years.
Kevin RobertsPresident, [email protected]

HOUSTON OfficeDecember 2015
Recent office leases
Galleria :: Apache524,000 SF lease extension through 12/2019 at Post Oak Central
CBD :: Bracewell & Giuliani189,061 SF renewal at Pennzoil Place
Katy Freeway West :: G&A Partners 30,065 SF new lease at Westgate I
Recent office sales
Katy Freeway West :: Energy Center Three549,000 SF, Class ABuyer: ConocoPhillipsSeller: Trammell Crow Co & Principal Real Estate Investors joint venture
Galleria :: 2200 Post Oak 326,200 SF, Class ABuyer: Corporación MasaveuSeller: Stream, TRC Capital Partners & L&B Realty Advisors joint venture
OFFICE LEASE STATISTICS
Source: Transwestern analysis of CoStar data, includes buildings 50,000 SF RBA and greater, excluding government owned buildings
Office market indicators - All Space
SubmArkETTOTAL bLdgS
INVENTOrYSF AVAILAbLE ImmEdIATELY
dIrECT VACANCY
rATE
OVErALL VACANCY
rATE
SF uNdEr CONSTruCTION
q3 2015 NET AbSOrpTION
ASkINg rENTAL rATES (FSg)
CLASS A CLASS b
Downtown (CBD & Midtown) 119 53,272,718 6,255,676 11.7% 13.3% 1,463,258 (33,000) $42.97 $28.65
FM 1960 (FM 1960/I-45 N, FM 1960/Champions & FM 1960/Hwy 249)
74 7,834,745 1,131,743 14.4% 15.0% - 512,000 $26.92 $15.85
Greenspoint/North Belt (North Belt West/Greenspoint & Greenspoint/IAH)
96 13,112,457 3,282,294 25.0% 28.1% 68,950 (423,000) $28.07 $15.65
Greenway Plaza 48 10,416,013 946,816 9.1% 9.3% 858,275 74,000 $35.77 $25.94
Gulf Freeway/Pasadena 34 2,597,502 368,845 14.2% 14.2% - 26,000 - $22.75
Katy 22 1,379,013 224,779 16.3% 16.5% 124,017 123,000 $33.09 $24.01
Katy Frwy/Energy Corridor (Katy Freeway East & Katy Freeway West)
207 34,736,090 3,663,164 10.5% 13.6% 2,288,929 (70,000) $37.49 $23.53
Kingwood/Humble 8 789,674 73,440 9.3% 9.3% - (4,000) $32.13 $18.75
NASA/Clear Lake 63 7,051,599 944,914 13.4% 13.9% - (7,000) $24.84 $18.75
Northeast 15 1,155,562 190,668 16.5% 16.5% 1,000,000 (1,000) - $17.34
Northwest (North Loop West, Northwest Near & Northwest Far)
73 8,883,138 1,420,636 16.0% 16.7% - (49,000) $22.57 $18.34
South Main/Medical Center 49 10,469,072 984,093 9.4% 9.5% - 42,000 $29.11 $25.59
Southwest Frwy/Sugar Land (SW/Hillcroft, SW Beltway 8 & E Ft Bend Co/Sugar Land)
122 16,266,671 2,145,487 13.2% 13.5% - 227,000 $25.23 $16.14
West Belt 36 4,702,573 564,309 12.0% 13.5% 200,000 127,000 $32.22 $23.94
West Loop (Bellaire, Post Oak Park, Galleria, Riverway, Richmond/Fountainview & San Felipe/Voss)
172 33,203,145 3,119,154 9.4% 10.2% 1,145,000 148,000 $36.34 $24.34
Westchase 87 15,922,349 1,370,914 8.6% 11.4% 1,545,000 (18,000) $39.14 $21.03
The Woodlands 87 14,077,716 709,517 5.0% 5.5% 1,411,795 51,000 $40.56 $25.30
Conroe 13 903,345 89,431 9.9% 9.9% - - $29.55 $24.17
Total - Houston 1,327 236,773,382 27,485,878 11.6% 13.0% 10,105,224 725,000 $35.35 $21.27
Source: Transwestern analysis of CoStar data, includes buildings 50,000 SF RBA and greater, excluding government owned buildings
Office Sales StatisticsHOuSTON mSA uNITEd STATES
quArTEr TO dATE
LAST quArTEr (q3 2015)
TrAILINg 12 mONTHS
LAST quArTEr (q3 2015)
TrAILINg 12 mONTHS
Volume ($ Mil)
$566.6 $466.5 $3,016.4 $36,202.0 $148,221.5
No. of Properties
11 34 141 1,515 5,940
Total SF 2,054,058 3,233,416 16,057,528 161,242,546 631,572,481
Average Price/SF
$247 $122 $223 $245 $245
Average Cap Rate (Yield)
N/A 7.6% 7.0% 6.7% 6.8%
Source: Real Capital Analytics
mArkET WATCH
Overall Vacancy Rates Asking Rental Rates (FSG)
Q3 12 Q4 12 Q1 13 Q2 13 Q3 13 Q4 13 Q1 14 Q2 14 Q3 14 Q4 14 Q1 15 Q2 15 Q3 15 $25.00
$26.00
$27.00
$28.00
$29.00
9%
10%
11%
12%
13%

MARKET WATCH HOUSTON Office MARKeT DeceMbeR 2015
HOUSTON Office MarkeTDeceMbeR 2015
610
45
1010
290
59
90
288
99
249
8
35
6
11
11
11
11
22
11
11
11
22
22
22
22
22
22
55
55
66
55
66
66
88
77
33
33
33
33
33
33
33
44
44
44
44
44
99
See Inner Loop
Map
inneR looP
1. CBD2. South Main/Medical Center3. Galleria4. Riverway5. Midtown6. Greenway Plaza7. Post Oak Park8. Bellaire9. North Loop West
southeast
1. Gulf Frwy/Pasadena2. NASA/Clear Lake3. Southeast Outlier
noRthWest
1. Northwest Near2. Northwest Far3. FM 1960/Hwy 2494. FM 1960/Champions5. Northwest Outlier6. West Belt
noRth
1. The Woodlands2. FM 1960/ I-45 North3. North Belt West/Greenspoint
West
1. San Felipe/Voss2. Richmond/Fountainview3. Westchase4. Katy Freeway East5. Katy Freeway West6. Katy
southWest
1. Southwest/Hillcroft2. Southwest Beltway 83. E Fort Bend Co/Sugar Land4. Southwest Outlier
noRtheast
1. Northeast Near2. Greenspoint/IAH3. Kingwood/Humble4. Northeast Outlier

Copyright © 2015 Transwestern. All rights reserved. No part of this work may be reproduced or distributed to third parties without written permission of the copyright owner. The information contained in this report was gathered by Transwestern from CoStar and other primary and secondary sources believed to be reliable. Transwestern, however, makes no representation concerning the accuracy or completeness of such information and expressly disclaims any responsibility for any inaccuracy contained herein.
HOUSTON Office MarkeTDecember 2015
houston contacts
Eric AndersonExecutive Vice President - [email protected]
Doug LittleSenior Managing Director - [email protected]
David BakerExecutive Vice President - [email protected]
Michelle WoganExecutive Vice President - [email protected]
David LeeSenior Vice President - [email protected]
Paul WittorfSenior Vice President - [email protected]
Monte CalvertSenior Vice President - [email protected]
Greg TiltonVice President - [email protected]
Louann PereiraVice President - [email protected]
Justin LeightonManaging Director - Tenant [email protected]
Ken PageManaging Director - Tenant [email protected]
Bobbie BozarthSenior Vice President - Tenant [email protected]
Margaret Ann Cook Vice President - Tenant [email protected]
Michael SnodgrassManaging Director - Structured [email protected]
Jan SparksManaging Director - Structured [email protected]
mETHOdOLOgY
The information in this report is the result of a compilation of publicly available data from a variety of commercial and government sources.
CONTACT
Rachel AlexanderDirector of Market [email protected]
t 713.270.7700 f 713.270.6285www.transwestern.net/houston
1900 West Loop South, Suite 1300Houston, Texas 77027
SEATTLE
WALNUT CREEK
LOS ANGELES
SALT LAKECITY
DENVER
MINNEAPOLIS
MILWAUKEE
ST. LOUIS
CHICAGO
DETROIT GREENWICHNEW YORK
NEW JERSEY
BALTIMORENORTHERNVIRGINIA
BETHESDAWASHINGTON DC
DALLASFORTWORTH
HOUSTONAUSTIN
SAN ANTONIO
OKLAHOMACITY
NEW ORLEANS
ATLANTA
FORT LAUDERDALEORLANDO
MIAMI-DADE
SANFRANCISCO
PHOENIXORANGE COUNTY
SAN DIEGO
BOSTON
SILICONVALLEY
TRANSWESTERNLOCATIONS
aBout tR ansWesteRn
Transwestern is a privately held real estate firm specializing in agency leasing, property and facilities management, tenant advisory, capital markets, research and sustainability. The fully integrated global enterprise leverages competencies in office, industrial, retail, multifamily and healthcare properties to add value for investors, owners and occupiers of real estate. As a member of the Transwestern family of companies, the firm capitalizes on market insights and operational expertise of independent affiliates specializing in development, real estate investment management and research. Transwestern has 34 U.S. offices and assists clients through more than 180 offices in 38 countries as part of a strategic alliance with Paris-based BNP Paribas Real Estate.
Transwestern was founded in Houston, Texas in 1978, and Houston remains the corporate headquarters today. As one of the preeminent commercial real estate firms in Houston, we offer a comprehensive menu of real estate services designed to provide owners, tenants and investors with the optimum solutions for their unique requirements. Transwestern has seasoned veterans in every area of expertise with the integrity, experience and creativity to be the best partner for its clients. Transwestern’s Houston office currently employs over 400 team members and has been an innovator in the Houston market for 37 years.
Kevin RobertsPresident, [email protected]

HOUSTON OfficeSepTember 2015
recent office leases
Westchase :: EMAS93,614 SF sublease at 10500 Richmond Ave
CBD :: MRC Global50,237 SF sublease at Fulbright Tower
Post Oak Park :: Rockwater Energy32,000 SF new lease at 515 Post Oak Blvd
recent office sales
Galleria :: Galleria Place I & II396,445 SF total, two building portfolioBuyer: Lincoln Property CoSeller: Songy Highroads & Carlyle Group joint venture
E Fort Bend Co/Sugar Land :: Comerica Bank Building193,988 SF, Class ABuyer: Equus Capital PartnersSeller: Parkway Properties
OFFICE LEASE STATISTICS
Source: Transwestern analysis of CoStar data, includes buildings 50,000 SF RBA and greater, excluding government owned buildings
Office market indicators - All Space
SubmArkETTOTAL bLdgS
INVENTOrYSF AVAILAbLE ImmEdIATELY
dIrECT VACANCY
rATE
OVErALL VACANCY
rATE
SF uNdEr CONSTruCTION
q2 2015 NET AbSOrpTION
ASkINg rENTAL rATES (FSg)
CLASS A CLASS b
Downtown (CBD & Midtown) 118 53,105,156 6,055,164 11.4% 12.8% 1,630,820 (1,393,000) $42.31 $27.97
FM 1960 (FM 1960/I-45 N, FM 1960/Champions & FM 1960/Hwy 249)
73 7,378,745 1,187,411 16.1% 16.6% 456,000 25,000 $26.75 $15.96
Greenspoint/North Belt (North Belt West/Greenspoint & Greenspoint/IAH)
96 13,112,457 2,859,304 21.8% 23.3% 68,950 (104,000) $28.41 $15.73
Greenway Plaza 48 10,416,013 1,020,769 9.8% 10.0% 858,275 (31,000) $35.35 $25.61
Gulf Freeway/Pasadena 34 2,597,502 394,820 15.2% 15.5% - 53,000 N/A $22.49
Katy 19 993,616 56,636 5.7% 6.0% 238,147 2,000 $33.06 $23.89
Katy Frwy/Energy Corridor (Katy Freeway East & Katy Freeway West)
206 34,435,183 3,291,654 9.6% 11.4% 2,589,956 547,000 $36.98 $23.12
Kingwood/Humble 8 789,674 69,491 8.8% 8.8% - (11,000) $31.96 $19.70
NASA/Clear Lake 63 7,051,599 937,863 13.3% 13.4% - 7,000 $25.22 $18.79
Northeast 15 1,155,562 189,512 16.4% 16.4% 1,000,000 (5,000) N/A $16.89
Northwest (North Loop West, Northwest Near & Northwest Far)
73 8,883,138 1,371,240 15.4% 15.8% - (6,000) $22.26 $18.41
South Main/Medical Center 49 10,469,072 1,025,969 9.8% 9.8% - 10,000 $29.31 $25.07
Southwest Frwy/Sugar Land (SW/Hillcroft, SW Beltway 8 & E Ft Bend Co/Sugar Land)
122 16,133,671 2,240,240 13.9% 14.1% 133,000 85,000 $25.49 $16.25
West Belt 36 4,702,573 691,278 14.7% 15.8% 200,000 411,000 $32.11 $23.95
West Loop (Bellaire, Post Oak Park, Galleria, Riverway, Richmond/Fountainview & San Felipe/Voss)
172 33,135,145 3,198,149 9.7% 10.5% 1,213,000 (204,000) $35.95 $24.23
Westchase 87 15,922,349 1,353,400 8.5% 11.5% 1,545,000 32,000 $39.05 $21.93
The Woodlands 87 14,077,716 760,197 5.4% 5.9% 1,411,795 378,000 $40.34 $25.93
Conroe 13 903,345 89,432 9.9% 9.9% - 49,000 $28.40 $25.00
Total - Houston 1,319 235,262,516 26,792,529 11.4% 12.5% 11,344,943 (155,000) $34.95 $21.04
Source: Transwestern analysis of CoStar data, includes buildings 50,000 SF RBA and greater, excluding government owned buildings
Office Sales StatisticsHOuSTON mSA uNITEd STATES
quArTEr TO dATE
LAST quArTEr (q2 2015)
TrAILINg 12 mONTHS
LAST quArTEr (q2 2015)
TrAILINg 12 mONTHS
Volume ($ Mil)
$342.2 $687.1 $3,286.6 $36,207.5 $144,335.0
No. of Properties
25 36 142 1,466 5,726
Total SF 2,231,175 3,564,730 17,693,588 157,252,312 612,912,653
Average Price/SF
N/A $208 $229 $239 $245
Average Cap Rate (Yield)
N/A 7.0% 6.9% 6.8% 6.8%
Source: Real Capital Analytics
mArkET WATCH
Overall Vacancy Rates Asking Rental Rates (FSG)
Q2 12 Q3 12 Q4 12 Q1 13 Q2 13 Q3 13 Q4 13 Q1 14 Q2 14 Q3 14 Q4 14 Q1 15 Q2 15 $25.00
$26.00
$27.00
$28.00
$29.00
9%
10%
11%
12%
13%
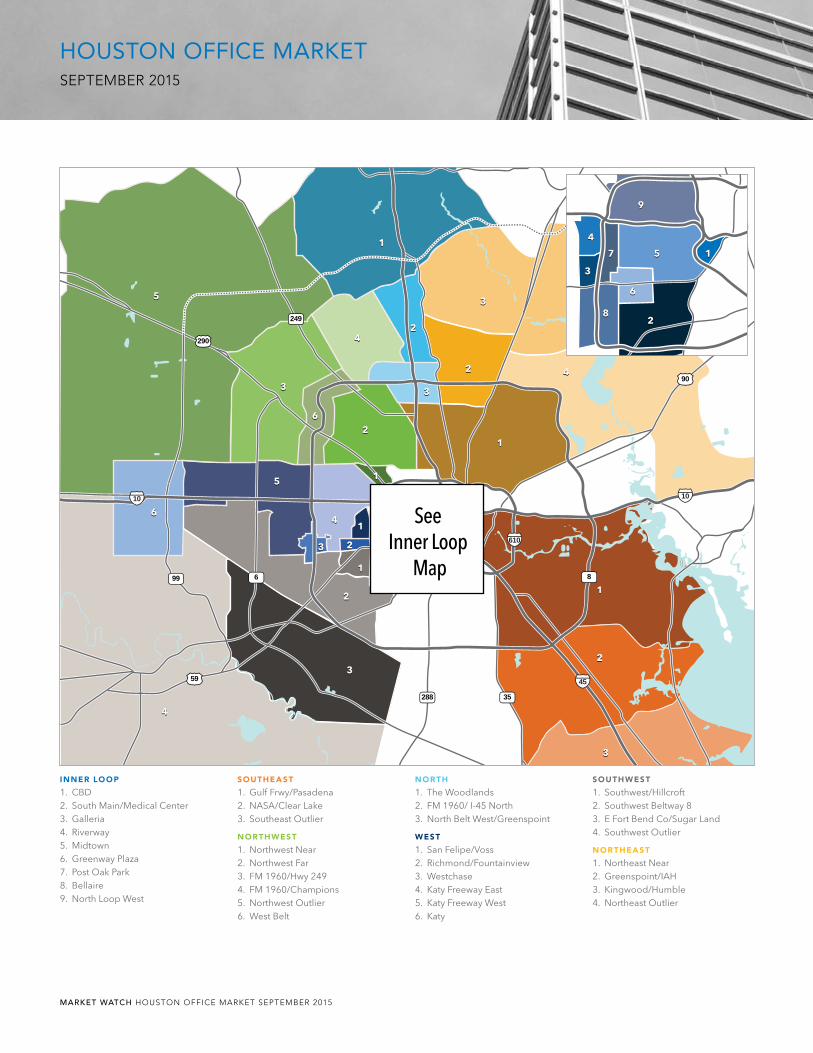
MARKET WATCH HOUSTON Office MARKeT SepTeMbeR 2015
HOUSTON Office MarkeTSepTeMbeR 2015
610
45
1010
290
59
90
288
99
249
8
35
6
11
11
11
11
22
11
11
11
22
22
22
22
22
22
55
55
66
55
66
66
88
77
33
33
33
33
33
33
33
44
44
44
44
44
99
See Inner Loop
Map
inner looP
1. CBD2. South Main/Medical Center3. Galleria4. Riverway5. Midtown6. Greenway Plaza7. Post Oak Park8. Bellaire9. North Loop West
southeast
1. Gulf Frwy/Pasadena2. NASA/Clear Lake3. Southeast Outlier
northWest
1. Northwest Near2. Northwest Far3. FM 1960/Hwy 2494. FM 1960/Champions5. Northwest Outlier6. West Belt
north
1. The Woodlands2. FM 1960/ I-45 North3. North Belt West/Greenspoint
West
1. San Felipe/Voss2. Richmond/Fountainview3. Westchase4. Katy Freeway East5. Katy Freeway West6. Katy
southWest
1. Southwest/Hillcroft2. Southwest Beltway 83. E Fort Bend Co/Sugar Land4. Southwest Outlier
northeast
1. Northeast Near2. Greenspoint/IAH3. Kingwood/Humble4. Northeast Outlier
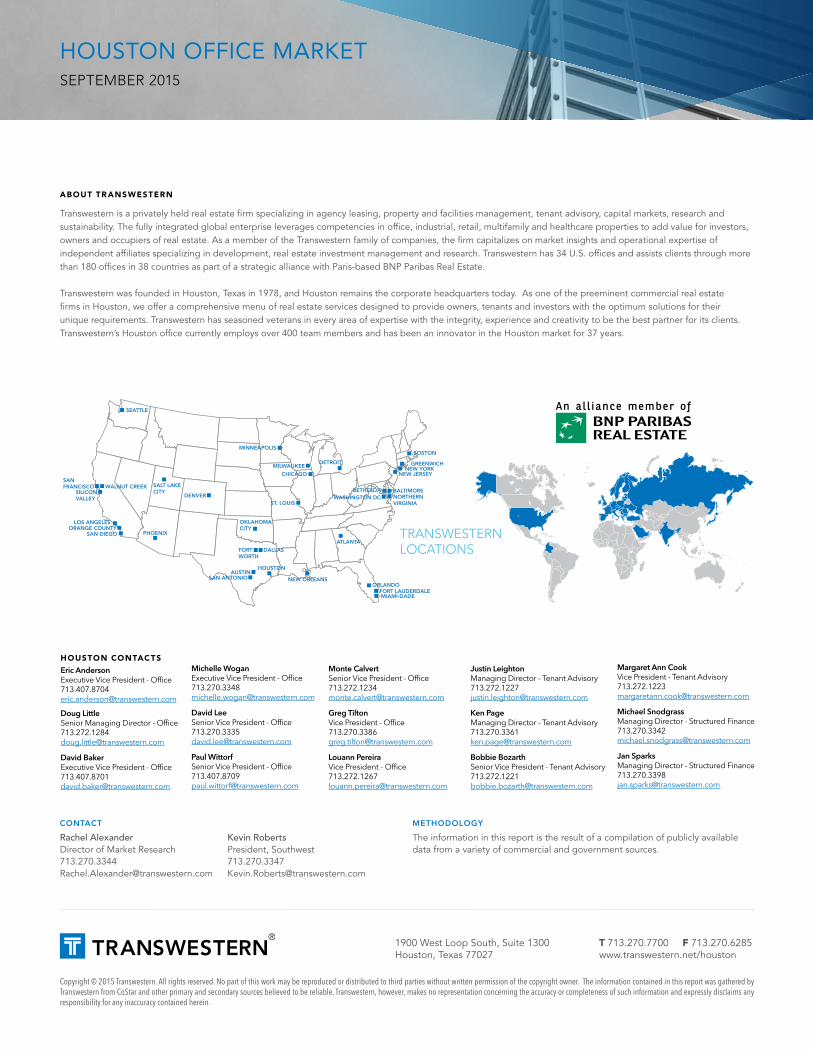
Copyright © 2015 Transwestern. All rights reserved. No part of this work may be reproduced or distributed to third parties without written permission of the copyright owner. The information contained in this report was gathered by Transwestern from CoStar and other primary and secondary sources believed to be reliable. Transwestern, however, makes no representation concerning the accuracy or completeness of such information and expressly disclaims any responsibility for any inaccuracy contained herein.
HOUSTON Office MarkeTSeptember 2015
houston contacts
Eric AndersonExecutive Vice President - [email protected]
Doug LittleSenior Managing Director - [email protected]
David BakerExecutive Vice President - [email protected]
Michelle WoganExecutive Vice President - [email protected]
David LeeSenior Vice President - [email protected]
Paul WittorfSenior Vice President - [email protected]
Monte CalvertSenior Vice President - [email protected]
Greg TiltonVice President - [email protected]
Louann PereiraVice President - [email protected]
Justin LeightonManaging Director - Tenant [email protected]
Ken PageManaging Director - Tenant [email protected]
Bobbie BozarthSenior Vice President - Tenant [email protected]
Margaret Ann Cook Vice President - Tenant [email protected]
Michael SnodgrassManaging Director - Structured [email protected]
Jan SparksManaging Director - Structured [email protected]
mETHOdOLOgY
The information in this report is the result of a compilation of publicly available data from a variety of commercial and government sources.
CONTACT
Rachel AlexanderDirector of Market [email protected]
t 713.270.7700 f 713.270.6285www.transwestern.net/houston
1900 West Loop South, Suite 1300Houston, Texas 77027
SEATTLE
WALNUT CREEK
LOS ANGELES
SALT LAKECITY
DENVER
MINNEAPOLIS
MILWAUKEE
ST. LOUIS
CHICAGO
DETROIT GREENWICHNEW YORK
NEW JERSEY
BALTIMORENORTHERNVIRGINIA
BETHESDAWASHINGTON DC
DALLASFORTWORTH
HOUSTONAUSTIN
SAN ANTONIO
OKLAHOMACITY
NEW ORLEANS
ATLANTA
FORT LAUDERDALEORLANDO
MIAMI-DADE
SANFRANCISCO
PHOENIXORANGE COUNTY
SAN DIEGO
BOSTON
SILICONVALLEY
TRANSWESTERNLOCATIONS
aBout tr ansWestern
Transwestern is a privately held real estate firm specializing in agency leasing, property and facilities management, tenant advisory, capital markets, research and sustainability. The fully integrated global enterprise leverages competencies in office, industrial, retail, multifamily and healthcare properties to add value for investors, owners and occupiers of real estate. As a member of the Transwestern family of companies, the firm capitalizes on market insights and operational expertise of independent affiliates specializing in development, real estate investment management and research. Transwestern has 34 U.S. offices and assists clients through more than 180 offices in 38 countries as part of a strategic alliance with Paris-based BNP Paribas Real Estate.
Transwestern was founded in Houston, Texas in 1978, and Houston remains the corporate headquarters today. As one of the preeminent commercial real estate firms in Houston, we offer a comprehensive menu of real estate services designed to provide owners, tenants and investors with the optimum solutions for their unique requirements. Transwestern has seasoned veterans in every area of expertise with the integrity, experience and creativity to be the best partner for its clients. Transwestern’s Houston office currently employs over 400 team members and has been an innovator in the Houston market for 37 years.
Kevin RobertsPresident, [email protected]

HOUSTON OfficeJUNe 2015
recent office leases
Greenway Plaza :: Transocean255,413 SF lease renewal at 4 Greenway Plaza
Post Oak Park :: Stage Stores168,901 SF new lease at 2425 West Loop South
CBD :: Virtus26,198 SF new lease at 1301 Fannin
Galleria :: Behavioral Recognition Software20,761 SF new lease at 1900 West Loop South
recent office sales
North Belt West/Greenspoint :: 400 North Belt231,000 SF, Class ABuyer: Hartman ManagementSeller: Parkway Properties
Katy Freeway West :: Mason Creek I135,716 SF, Class ABuyer: Nicola CrosbySeller: TA Realty
OFFICE LEASE STATISTICS
Source: Transwestern analysis of CoStar data, includes buildings 50,000 SF RBA and greater, excluding government owned buildings
Office Market indicators - All Space
SubmArkETTOTAL bLdgS
INVENTOrYSF AVAILAbLE ImmEdIATELY
dIrECT VACANCY
rATE
OVErALL VACANCY
rATE
SF uNdEr CONSTruCTION
1Q2015 NET AbSOrpTION
ASkINg rENTAL rATES (FSg)
CLASS A CLASS b
Downtown (CBD & Midtown) 117 52,811,156 4,367,602 8.3% 9.3% 1,630,820 (464,000) $42.61 $28.20
FM 1960 (FM 1960/I-45 N, FM 1960/Champions & FM 1960/Hwy 249)
73 7,378,745 1,212,565 16.4% 16.9% 456,000 (37,000) $26.65 $15.87
Greenspoint/North Belt (North Belt West/Greenspoint & Greenspoint/IAH)
96 13,112,457 2,755,213 21.0% 21.6% 68,950 (451,000) $28.47 $15.69
Greenway Plaza 48 10,416,013 989,521 9.5% 9.7% 833,275 (219,000) $35.37 $25.51
Gulf Freeway/Pasadena 33 2,538,307 388,361 15.3% 15.6% - (19,000) N/A $22.50
Katy 18 993,616 58,623 5.9% 5.9% 238,147 69,000 $32.90 $23.85
Katy Frwy/Energy Corridor (Katy Freeway East & Katy Freeway West)
202 33,445,319 2,848,944 8.5% 9.3% 4,065,758 926,000 $36.83 $23.14
Kingwood/Humble 8 789,674 58,436 7.4% 7.4% - (1,000) $32.13 $19.65
NASA/Clear Lake 63 7,051,599 1,001,327 14.2% 14.3% - 0 $25.16 $18.81
Northeast 15 1,155,562 184,890 16.0% 16.0% 1,000,000 (1,000) N/A $17.17
Northwest (North Loop West, Northwest Near & Northwest Far)
73 8,883,138 1,375,622 15.5% 16.3% - (6,000) $23.43 $18.35
South Main/Medical Center 49 10,469,072 1,036,438 9.9% 9.9% - (178,000) $29.24 $25.04
Southwest Frwy/Sugar Land (SW/Hillcroft, SW Beltway 8 & E Ft Bend Co/Sugar Land)
122 16,133,671 2,325,454 14.4% 15.2% 133,000 267,000 $25.51 $16.59
West Belt 33 4,073,132 472,483 11.6% 13.4% 829,387 197,000 $32.06 $23.89
West Loop (Bellaire, Post Oak Park, Galleria, Riverway, Richmond/Fountainview & San Felipe/Voss)
172 33,135,145 2,993,959 9.0% 10.0% 1,243,938 (14,000) $35.59 $24.51
Westchase 87 15,922,349 1,385,244 8.7% 12.5% 1,545,000 159,000 $38.91 $21.35
The Woodlands 86 13,577,716 665,308 4.9% 5.3% 1,710,177 1,565,000 $40.22 $25.84
Conroe 13 903,345 138,212 15.3% 15.3% - 14,000 $28.42 $25.20
Total - Houston 1,308 232,790,016 24,258,202 10.4% 11.4% 13,754,452 1,807,000 $35.00 $21.08
Source: Transwestern analysis of CoStar data, includes buildings 50,000 SF RBA and greater, excluding government owned buildings
Office Sales StatisticsHOuSTON mSA uNITEd STATES
QuArTEr TO dATE
LAST QuArTEr
(1Q15)
TrAILINg 12 mONTHS
LAST QuArTEr
(1Q15)
TrAILINg 12 mONTHS
Volume ($ Mil)
$341.6 $1,001.4 $3,173.8 $34,305.3 $130,480.1
No. of Properties
16 26 133 1,173 4,792
Total SF 1,853,972 3,709,496 17,268,906 125,477,786 543,484,596
Average Price/SF
$268 $393 $231 $285 $250
Average Cap Rate (Yield)
7.1% 6.1% 7.1% 6.6% 6.8%
Source: Real Capital Analytics
mArkET WATCH
1Q12 2Q12 3Q12 4Q12 1Q13 2Q13 3Q13 4Q13 1Q14 2Q14 3Q14 4Q14 1Q15
Overall Vacancy Rates Asking Rental Rates (NNN)
$24.00
$26.00
$28.00
$30.00
9%
10%
11%
12%
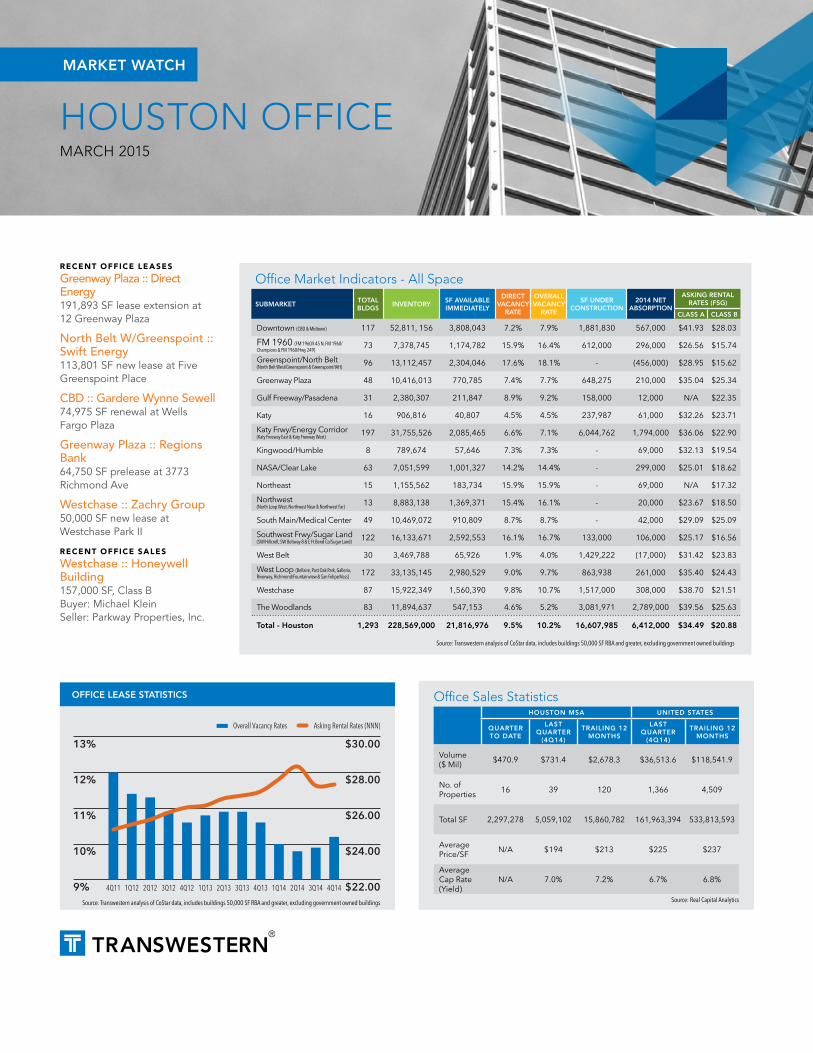
HOUSTON OfficeMarcH 2015
recent office leases
Greenway Plaza :: Direct Energy191,893 SF lease extension at 12 Greenway Plaza
North Belt W/Greenspoint :: Swift Energy113,801 SF new lease at Five Greenspoint Place
CBD :: Gardere Wynne Sewell74,975 SF renewal at Wells Fargo Plaza
Greenway Plaza :: Regions Bank64,750 SF prelease at 3773 Richmond Ave
Westchase :: Zachry Group50,000 SF new lease at Westchase Park II
recent office sales
Westchase :: Honeywell Building157,000 SF, Class BBuyer: Michael KleinSeller: Parkway Properties, Inc.
OFFICE LEASE STATISTICS
Source: Transwestern analysis of CoStar data, includes buildings 50,000 SF RBA and greater, excluding government owned buildings
Office Market indicators - all Space
SubmArkETTOTAL bLdgS
INVENTOrYSF AVAILAbLE ImmEdIATELY
dIrECT VACANCY
rATE
OVErALL VACANCY
rATE
SF uNdEr CONSTruCTION
2014 NET AbSOrpTION
ASkINg rENTAL rATES (FSg)
CLASS A CLASS b
Downtown (CBD & Midtown) 117 52,811, 156 3,808,043 7.2% 7.9% 1,881,830 567,000 $41.93 $28.03
FM 1960 (FM 1960/I-45 N, FM 1960/Champions & FM 1960/Hwy 249)
73 7,378,745 1,174,782 15.9% 16.4% 612,000 296,000 $26.56 $15.74
Greenspoint/North Belt (North Belt West/Greenspoint & Greenspoint/IAH)
96 13,112,457 2,304,046 17.6% 18.1% - (456,000) $28.95 $15.62
Greenway Plaza 48 10,416,013 770,785 7.4% 7.7% 648,275 210,000 $35.04 $25.34
Gulf Freeway/Pasadena 31 2,380,307 211,847 8.9% 9.2% 158,000 12,000 N/A $22.35
Katy 16 906,816 40,807 4.5% 4.5% 237,987 61,000 $32.26 $23.71
Katy Frwy/Energy Corridor (Katy Freeway East & Katy Freeway West)
197 31,755,526 2,085,465 6.6% 7.1% 6,044,762 1,794,000 $36.06 $22.90
Kingwood/Humble 8 789,674 57,646 7.3% 7.3% - 69,000 $32.13 $19.54
NASA/Clear Lake 63 7,051,599 1,001,327 14.2% 14.4% - 299,000 $25.01 $18.62
Northeast 15 1,155,562 183,734 15.9% 15.9% - 69,000 N/A $17.32
Northwest (North Loop West, Northwest Near & Northwest Far)
13 8,883,138 1,369,371 15.4% 16.1% - 20,000 $23.67 $18.50
South Main/Medical Center 49 10,469,072 910,809 8.7% 8.7% - 42,000 $29.09 $25.09
Southwest Frwy/Sugar Land (SW/Hillcroft, SW Beltway 8 & E Ft Bend Co/Sugar Land)
122 16,133,671 2,592,553 16.1% 16.7% 133,000 106,000 $25.17 $16.56
West Belt 30 3,469,788 65,926 1.9% 4.0% 1,429,222 (17,000) $31.42 $23.83
West Loop (Bellaire, Post Oak Park, Galleria, Riverway, Richmond/Fountainview & San Felipe/Voss)
172 33,135,145 2,980,529 9.0% 9.7% 863,938 261,000 $35.40 $24.43
Westchase 87 15,922,349 1,560,390 9.8% 10.7% 1,517,000 308,000 $38.70 $21.51
The Woodlands 83 11,894,637 547,153 4.6% 5.2% 3,081,971 2,789,000 $39.56 $25.63
Total - Houston 1,293 228,569,000 21,816,976 9.5% 10.2% 16,607,985 6,412,000 $34.49 $20.88
Source: Transwestern analysis of CoStar data, includes buildings 50,000 SF RBA and greater, excluding government owned buildings
Office Sales StatisticsHOuSTON mSA uNITEd STATES
QuArTEr TO dATE
LAST QuArTEr
(4Q14)
TrAILINg 12 mONTHS
LAST QuArTEr
(4Q14)
TrAILINg 12 mONTHS
Volume ($ Mil)
$470.9 $731.4 $2,678.3 $36,513.6 $118,541.9
No. of Properties
16 39 120 1,366 4,509
Total SF 2,297,278 5,059,102 15,860,782 161,963,394 533,813,593
Average Price/SF
N/A $194 $213 $225 $237
Average Cap Rate (Yield)
N/A 7.0% 7.2% 6.7% 6.8%
Source: Real Capital Analytics
4Q11 1Q12 2Q12 3Q12 4Q12 1Q13 2Q13 3Q13 4Q13 1Q14 2Q14 3Q14 4Q14
Overall Vacancy Rates Asking Rental Rates (NNN)
$22.00
$24.00
$26.00
$28.00
$30.00
9%
10%
11%
12%
13%
mArkET WATCH

MARKET WATCH HOUSTON Office MARKeT MARcH 2015
HOUSTON Office MarkeTMARcH 2015
610
45
1010
290
59
90
288
99
249
8
35
6
11
11
11
11
22
11
11
11
22
22
22
22
22
22
55
55
66
55
66
66
88
77
33
33
33
33
33
33
33
44
44
44
44
44
99
See Inner Loop
Map
inner looP
1. CBD2. South Main/Medical Center3. Galleria4. Riverway5. Midtown6. Greenway Plaza7. Post Oak Park8. Bellaire9. North Loop West
southeast
1. Gulf Frwy/Pasadena2. NASA/Clear Lake3. Southeast Outlier
northWest
1. Northwest Near2. Northwest Far3. FM 1960/Hwy 2494. FM 1960/Champions5. Northwest Outlier6. West Belt
north
1. The Woodlands2. FM 1960/ I-45 North3. North Belt West/Greenspoint
West
1. San Felipe/Voss2. Richmond/Fountainview3. Westchase4. Katy Freeway East5. Katy Freeway West6. Katy
southWest
1. Southwest/Hillcroft2. Southwest Beltway 83. E Fort Bend Co/Sugar Land4. Southwest Outlier
northeast
1. Northeast Near2. Greenspoint/IAH3. Kingwood/Humble4. Northeast Outlier

Copyright © 2015 Transwestern. All rights reserved. No part of this work may be reproduced or distributed to third parties without written permission of the copyright owner. The information contained in this report was gathered by Transwestern from CoStar and other primary and secondary sources believed to be reliable. Transwestern, however, makes no representation concerning the accuracy or completeness of such information and expressly disclaims any responsibility for any inaccuracy contained herein.
HOUSTON Office MarkeTMarch 2015
houston contacts
Eric AndersonExecutive Vice President - [email protected]
Doug LittleSenior Managing Director - [email protected]
David BakerExecutive Vice President - [email protected]
Michelle WoganExecutive Vice President - [email protected]
David LeeSenior Vice President - [email protected]
Paul WittorfSenior Vice President - [email protected]
Monte CalvertSenior Vice President - [email protected]
Greg TiltonVice President - [email protected]
Louann PereiraVice President - [email protected]
Ken PageManaging Director - Investment [email protected]
Scott MyersVice President - Investment [email protected]
Justin LeightonManaging Director - Tenant [email protected]
Bobbie BozarthSenior Vice President - Tenant [email protected]
Michael SnodgrassManaging Director - Structured [email protected]
Jan SparksManaging Director - Structured [email protected]
mETHOdOLOgY
The information in this report is the result of a compilation of publicly available data from a variety of commercial and government sources.
CONTACT
Rachel AlexanderDirector of Market [email protected]
t 713.270.7700 f 713.270.6285www.transwestern.net/houston
1900 West Loop South, Suite 1300Houston, Texas 77027
SEATTLE
WALNUT CREEK
LOS ANGELES
SALT LAKECITY
DENVER
MINNEAPOLIS
MILWAUKEE
ST. LOUIS
CHICAGO
DETROIT GREENWICHNEW YORK
NEW JERSEY
BALTIMORENORTHERNVIRGINIA
BETHESDAWASHINGTON DC
DALLASFORTWORTH
HOUSTONAUSTIN
SAN ANTONIO
OKLAHOMACITY
NEW ORLEANS
ATLANTA
FORT LAUDERDALEORLANDO
MIAMI-DADE
SANFRANCISCO
PHOENIXORANGE COUNTY
SAN DIEGO
BOSTON
SILICONVALLEY
TRANSWESTERNLOCATIONS
aBout tr ansWestern
Transwestern is a privately held real estate firm specializing in agency leasing, property and facilities management, tenant advisory, capital markets, research and sustainability. The fully integrated global enterprise leverages competencies in office, industrial, retail, multifamily and healthcare properties to add value for investors, owners and occupiers of real estate. As a member of the Transwestern family of companies, the firm capitalizes on market insights and operational expertise of independent affiliates specializing in development, real estate investment management and research. Transwestern has 34 U.S. offices and assists clients through more than 180 offices in 38 countries as part of a strategic alliance with Paris-based BNP Paribas Real Estate.
Transwestern was founded in Houston, Texas in 1978, and Houston remains the corporate headquarters today. As one of the preeminent commercial real estate firms in Houston, we offer a comprehensive menu of real estate services designed to provide owners, tenants and investors with the optimum solutions for their unique requirements. Transwestern has seasoned veterans in every area of expertise with the integrity, experience and creativity to be the best partner for its clients. Transwestern’s Houston office currently employs over 400 team members and has been an innovator in the Houston market for 37 years.
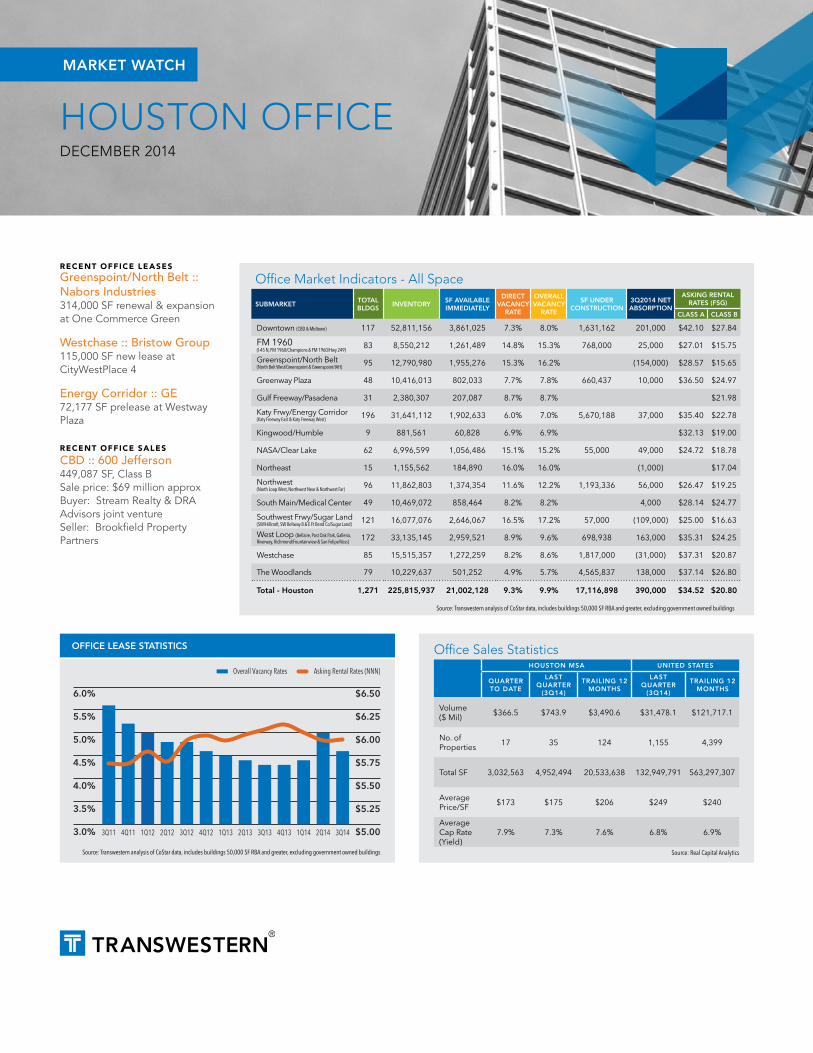
HOUSTON OfficeDecember 2014
recent office leasesGreenspoint/North Belt :: Nabors Industries314,000 SF renewal & expansion at One Commerce Green
Westchase :: Bristow Group115,000 SF new lease at CityWestPlace 4
Energy Corridor :: GE72,177 SF prelease at Westway Plaza
recent office sales
CBD :: 600 Jefferson449,087 SF, Class BSale price: $69 million approxBuyer: Stream Realty & DRA Advisors joint venture Seller: Brookfield Property Partners
OFFICE LEASE STATISTICS
Source: Transwestern analysis of CoStar data, includes buildings 50,000 SF RBA and greater, excluding government owned buildings
Office market indicators - All Space
SubmArkETTOTAL bLdgS
INVENTOrYSF AVAILAbLE ImmEdIATELY
dIrECT VACANCY
rATE
OVErALL VACANCY
rATE
SF uNdEr CONSTruCTION
3Q2014 NET AbSOrpTION
ASkINg rENTAL rATES (FSg)
CLASS A CLASS b
Downtown (CBD & Midtown) 117 52,811,156 3,861,025 7.3% 8.0% 1,631,162 201,000 $42.10 $27.84
FM 1960 (I-45 N, FM 1960/Champions & FM 1960/Hwy 249)
83 8,550,212 1,261,489 14.8% 15.3% 768,000 25,000 $27.01 $15.75
Greenspoint/North Belt (North Belt West/Greenspoint & Greenspoint/IAH)
95 12,790,980 1,955,276 15.3% 16.2% (154,000) $28.57 $15.65
Greenway Plaza 48 10,416,013 802,033 7.7% 7.8% 660,437 10,000 $36.50 $24.97
Gulf Freeway/Pasadena 31 2,380,307 207,087 8.7% 8.7% $21.98
Katy Frwy/Energy Corridor (Katy Freeway East & Katy Freeway West)
196 31,641,112 1,902,633 6.0% 7.0% 5,670,188 37,000 $35.40 $22.78
Kingwood/Humble 9 881,561 60,828 6.9% 6.9% $32.13 $19.00
NASA/Clear Lake 62 6,996,599 1,056,486 15.1% 15.2% 55,000 49,000 $24.72 $18.78
Northeast 15 1,155,562 184,890 16.0% 16.0% (1,000) $17.04
Northwest (North Loop West, Northwest Near & Northwest Far)
96 11,862,803 1,374,354 11.6% 12.2% 1,193,336 56,000 $26.47 $19.25
South Main/Medical Center 49 10,469,072 858,464 8.2% 8.2% 4,000 $28.14 $24.77
Southwest Frwy/Sugar Land (SW/Hillcroft, SW Beltway 8 & E Ft Bend Co/Sugar Land)
121 16,077,076 2,646,067 16.5% 17.2% 57,000 (109,000) $25.00 $16.63
West Loop (Bellaire, Post Oak Park, Galleria, Riverway, Richmond/Fountainview & San Felipe/Voss)
172 33,135,145 2,959,521 8.9% 9.6% 698,938 163,000 $35.31 $24.25
Westchase 85 15,515,357 1,272,259 8.2% 8.6% 1,817,000 (31,000) $37.31 $20.87
The Woodlands 79 10,229,637 501,252 4.9% 5.7% 4,565,837 138,000 $37.14 $26.80
Total - Houston 1,271 225,815,937 21,002,128 9.3% 9.9% 17,116,898 390,000 $34.52 $20.80
Source: Transwestern analysis of CoStar data, includes buildings 50,000 SF RBA and greater, excluding government owned buildings
Office Sales StatisticsHOuSTON mSA uNITEd STATES
QuArTEr TO dATE
LAST QuArTEr
(3Q14)
TrAILINg 12 mONTHS
LAST QuArTEr
(3Q14)
TrAILINg 12 mONTHS
Volume ($ Mil)
$366.5 $743.9 $3,490.6 $31,478.1 $121,717.1
No. of Properties
17 35 124 1,155 4,399
Total SF 3,032,563 4,952,494 20,533,638 132,949,791 563,297,307
Average Price/SF
$173 $175 $206 $249 $240
Average Cap Rate (Yield)
7.9% 7.3% 7.6% 6.8% 6.9%
Source: Real Capital Analytics
3Q11 4Q11 1Q12 2Q12 3Q12 4Q12 1Q13 2Q13 3Q13 4Q13 1Q14 2Q14 3Q14 $5.00
$5.25
$5.50
$5.75
$6.00
$6.25
$6.50
3.0%
3.5%
4.0%
4.5%
5.0%
5.5%
6.0%
Overall Vacancy Rates Asking Rental Rates (NNN)
mArkET WATCH
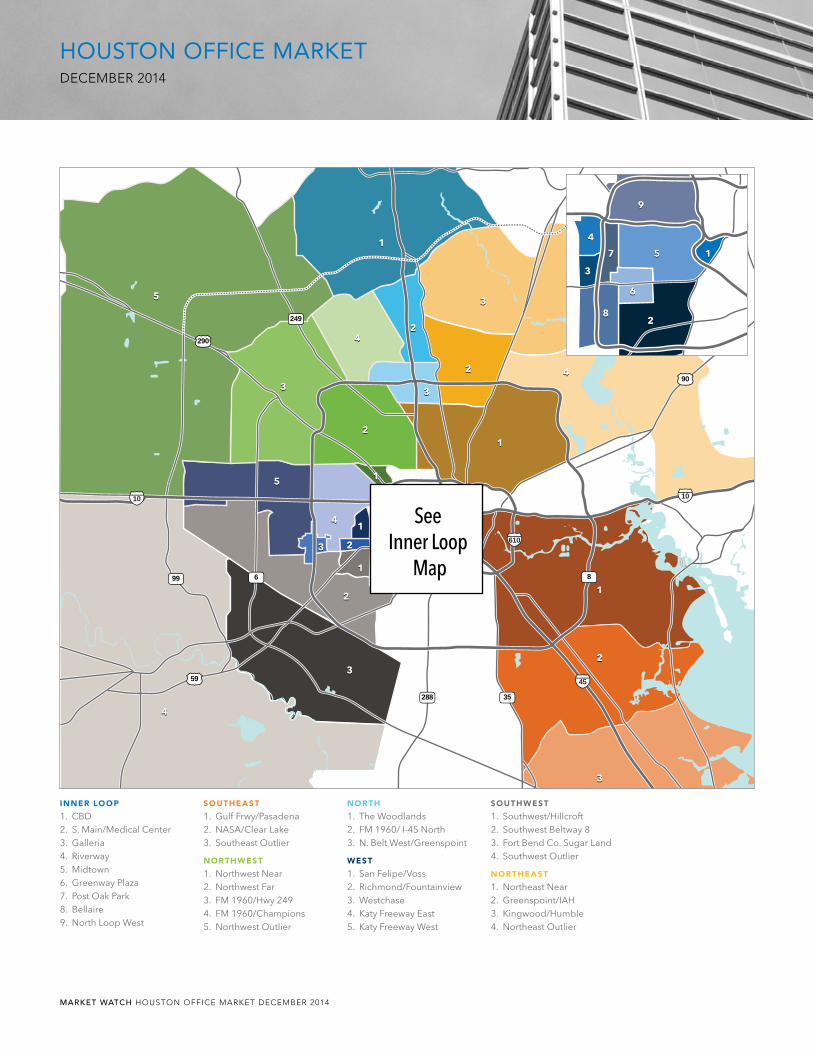
MARKET WATCH HOUSTON Office MARKeT deceMbeR 2014
HOUSTON Office MarkeTdeceMbeR 2014
610
45
1010
290
59
90
288
99
249
8
35
6
11
11
11
11
22
11
11
11
22
22
22
22
22
22
55
55
55 66
88
77
33
33
33
33
33
33
33
44
44
44
44
44
99
See Inner Loop
Map
inner looP
1. CBD2. S. Main/Medical Center3. Galleria4. Riverway5. Midtown6. Greenway Plaza7. Post Oak Park8. Bellaire9. North Loop West
southeast
1. Gulf Frwy/Pasadena2. NASA/Clear Lake3. Southeast Outlier
northWest
1. Northwest Near2. Northwest Far3. FM 1960/Hwy 2494. FM 1960/Champions5. Northwest Outlier
north
1. The Woodlands2. FM 1960/ I-45 North3. N. Belt West/Greenspoint
West
1. San Felipe/Voss2. Richmond/Fountainview3. Westchase4. Katy Freeway East5. Katy Freeway West
southWest
1. Southwest/Hillcroft2. Southwest Beltway 83. Fort Bend Co. Sugar Land4. Southwest Outlier
northeast
1. Northeast Near2. Greenspoint/IAH3. Kingwood/Humble4. Northeast Outlier

Copyright © 2014 Transwestern. All rights reserved. No part of this work may be reproduced or distributed to third parties without written permission of the copyright owner. The information contained in this report was gathered by Transwestern from CoStar and other primary and secondary sources believed to be reliable. Transwestern, however, makes no representation concerning the accuracy or completeness of such information and expressly disclaims any responsibility for any inaccuracy contained herein.
HOUSTON Office MarkeTDecember 2014
houston contacts
Eric AndersonExecutive Vice President - [email protected]
Doug LittleSenior Managing Director - [email protected]
David BakerExecutive Vice President - [email protected]
Michelle WoganExecutive Vice President - [email protected]
David LeeSenior Vice President - [email protected]
Paul WittorfSenior Vice President - [email protected]
Monte CalvertSenior Vice President - [email protected]
Greg TiltonVice President - [email protected]
Louann PereiraVice President - [email protected]
Ken PageManaging Director - Investment [email protected]
Scott MyersVice President - Investment [email protected]
Justin LeightonManaging Director - Tenant [email protected]
Bobbie BozarthSenior Vice President - Tenant [email protected]
Michael SnodgrassManaging Director - Structured [email protected]
Jan SparksManaging Director - Structured [email protected]
mETHOdOLOgY
The information in this report is the result of a compilation of publicly available data from a variety of commercial and government sources.
CONTACT
Rachel AlexanderDirector of Market [email protected]
t 713.270.7700 f 713.270.6285www.transwestern.net/houston
1900 West Loop South, Suite 1300Houston, Texas 77027
SEATTLE
WALNUT CREEK
LOS ANGELES
SALT LAKECITY
DENVER
MINNEAPOLIS
MILWAUKEE
ST. LOUIS
CHICAGO
DETROIT GREENWICHNEW YORK
NEW JERSEY
BALTIMORENORTHERNVIRGINIA
BETHESDAWASHINGTON DC
DALLASFORTWORTH
HOUSTONAUSTIN
SAN ANTONIO
OKLAHOMACITY
NEW ORLEANS
ATLANTA
FORT LAUDERDALEORLANDO
MIAMI-DADE
SANFRANCISCO
PHOENIXORANGE COUNTY
SAN DIEGO
BOSTON
SILICONVALLEY
TRANSWESTERNLOCATIONS
aBout tr ansWestern
Transwestern is a privately held real estate firm specializing in agency leasing, property and facilities management, tenant advisory, capital markets, research and sustainability. The fully integrated global enterprise leverages competencies in office, industrial, retail, multifamily and healthcare properties to add value for investors, owners and occupiers of real estate. As a member of the Transwestern family of companies, the firm capitalizes on market insights and operational expertise of independent affiliates specializing in development, real estate investment management and research. Transwestern has 34 U.S. offices and assists clients through more than 180 offices in 38 countries as part of a strategic alliance with Paris-based BNP Paribas Real Estate.
Transwestern was founded in Houston, Texas in 1978, and Houston remains the corporate headquarters today. As one of the preeminent commercial real estate firms in Houston, we offer a comprehensive menu of real estate services designed to provide owners, tenants and investors with the optimum solutions for their unique requirements. Transwestern has seasoned veterans in every area of expertise with the integrity, experience and creativity to be the best partner for its clients. Transwestern’s Houston office currently employs over 385 team members and has been an innovator in the Houston market for 36 years.

HOUSTON OfficeSepTember 2014
recent office leases
Katy :: Det Norske Veritas 47,250 SF prelease at 22535 Colonial Pkwy
Energy Corridor :: Venari Resources28,655 SF new lease at West Memorial Place
Energy Corridor :: Tesco Corporation26,510 SF prelease at Westway Plaza
recent office sales
Energy Corridor :: Two Westlake Park454,843 SF, Class ASale price: $120 millionBuyer: PIMCO & Hicks Ventures Seller: KBS REIT II
OFFICE LEASE STATISTICS
Source: Transwestern analysis of CoStar data- Houston office buildings 15,000 SF and greater, excluding government owned buildings
Office market indicators - All Space
SubmArkETTOTAL bLdgS
INVENTOrYSF AVAILAbLE ImmEdIATELY
dIrECT VACANCY
rATE
OVErALL VACANCY
rATE
SF uNdEr CONSTruCTION
2Q2014 NET AbSOrpTION
ASkINg rENTAL rATES (FSg)
CLASS A CLASS b
Downtown (CBD & Midtown) 117 52,811,156 4,204,382 8.0% 8.8% 1,626,638 219,000 $41.62 $27.66
FM 1960 (I-45 N, FM 1960/Champions & FM 1960/Hwy 249)
83 8,550,212 1,287,043 15.1% 15.2% 770,000 65,000 $27.41 $15.32
Greenspoint/North Belt (North Belt West/Greenspoint & Greenspoint/IAH)
95 12,790,980 1,801,184 14.1% 14.8% 50,000 $29.72 $15.91
Greenway Plaza 48 10,416,013 812,449 7.8% 7.9% 660,437 (10,000) $36.58 $24.31
Gulf Freeway/Pasadena 31 2,380,307 207,087 8.7% 8.8% (2,000) $21.02
Katy Frwy/Energy Corridor (Katy Freeway East & Katy Freeway West)
193 31,114,355 1,412,594 4.5% 5.0% 5,355,552 621,000 $35.49 $22.81
Kingwood/Humble 9 881,561 60,828 6.9% 6.9% 104,223 87,000 $32.13 $19.00
NASA/Clear Lake 62 6,996,599 1,105,463 15.8% 15.9% 55,000 $24.47 $18.57
Northeast 15 1,155,562 183,734 15.9% 15.9% 31,000 $17.22
Northwest (North Loop West, Northwest Near & Northwest Far)
96 11,862,803 1,429,703 12.1% 12.5% 1,079,973 $27.10 $20.24
South Main/Medical Center 48 10,419,072 812,688 7.8% 7.8% 52,362 (10,000) $28.41 $24.63
Southwest Frwy/Sugar Land (SW/Hillcroft, SW Beltway 8 & E Ft Bend Co/Sugar Land)
121 16,077,076 2,751,158 17.1% 17.1% 57,000 233,000 $25.02 $16.78
West Loop (Bellaire, Post Oak Park, Galleria, Riverway, Richmond/Fountainview & San Felipe/Voss)
171 33,093,069 3,081,093 9.3% 10.0% 741,014 92,000 $35.12 $24.04
Westchase 85 15,515,357 1,241,229 8.0% 8.7% 1,923,992 185,000 $37.07 $20.85
Woodlands/Conroe (The Woodlands & Conroe)
90 10,914,637 520,745 7.7% 8.2% 4,639,102 290,000 $32.48 $25.97
Total - Houston 1,264 224,978,759 20,911,380 9.3% 9.8% 17,065,293 1,851,000 $34.65 $20.77
Source: Transwestern analysis of Costar data - Houston office buildings 15,000 SF and greater, excluding government owned buildings
Office Sales StatisticsHOuSTON mSA uNITEd STATES
QuArTEr TO dATE
LAST QuArTEr
(2Q14)
TrAILINg 12 mONTHS
LAST QuArTEr
(2Q14)
TrAILINg 12 mONTHS
Volume ($ Mil)
$507.0 $631.8 $4,460.0 $27,688.5 $115,720.0
No. of Properties
21 31 117 992 4,148
Total SF 3,161,606 3,539,705 24,372.927 118,247,868 547,450,507
Average Price/SF
$162 $200 $212 $244 $236
Average Cap Rate (Yield)
6.5% 8.8% 7.7% 6.9% 6.9%
Source: Real Capital Analytics
2Q11 3Q11 4Q11 1Q12 2Q12 3Q12 4Q12 1Q13 2Q13 3Q13 4Q13 1Q14 2Q14$22.00
$24.00
$26.00
$28.00
$30.00
9%
10%
11%
12%
13%
Overall Vacancy Rates Asking Rental Rates (fsg)
mArkET WATCH

MARKET WATCH HOUSTON Office MARKeT SepTeMbeR 2014
HOUSTON Office MarkeTSepTeMbeR 2014
610
45
1010
290
59
90
288
99
249
8
35
6
11
11
11
11
22
11
11
11
22
22
22
22
22
22
55
55
55 66
88
77
33
33
33
33
33
33
33
44
44
44
44
44
99
See Inner Loop
Map
inner looP
1. CBD2. S. Main/Medical Center3. Galleria4. Riverway5. Midtown6. Greenway Plaza7. Post Oak Park8. Bellaire9. North Loop West
southeast
1. Gulf Frwy/Pasadena2. NASA/Clear Lake3. Southeast Outlier
northWest
1. Northwest Near2. Northwest Far3. FM 1960/Hwy 2494. FM 1960/Champions5. Northwest Outlier
north
1. The Woodlands2. FM 1960/ I-45 North3. N. Belt West/Greenspoint
West
1. San Felipe/Voss2. Richmond/Fountainview3. Westchase4. Katy Freeway East5. Katy Freeway West
southWest
1. Southwest/Hillcroft2. Southwest Beltway 83. Fort Bend Co. Sugar Land4. Southwest Outlier
northeast
1. Northeast Near2. Greenspoint/IAH3. Kingwood/Humble4. Northeast Outlier

Copyright © 2014 Transwestern. All rights reserved. No part of this work may be reproduced or distributed to third parties without written permission of the copyright owner. The information contained in this report was gathered by Transwestern from CoStar and other primary and secondary sources believed to be reliable. Transwestern, however, makes no representation concerning the accuracy or completeness of such information and expressly disclaims any responsibility for any inaccuracy contained herein.
HOUSTON Office MarkeTseptember 2014
houston contacts
Eric AndersonExecutive Vice President - [email protected]
Doug LittleSenior Managing Director - [email protected]
David BakerExecutive Vice President - [email protected]
Michelle WoganExecutive Vice President - [email protected]
David LeeSenior Vice President - [email protected]
Paul WittorfSenior Vice President - [email protected]
Monte CalvertSenior Vice President - [email protected]
Greg TiltonVice President - [email protected]
Louann PereiraVice President - [email protected]
Ken PageManaging Director - Investment [email protected]
Scott MyersVice President - Investment [email protected]
Justin LeightonManaging Director - Tenant [email protected]
Bobbie BozarthSenior Vice President - Tenant [email protected]
Michael SnodgrassManaging Director - Structured [email protected]
Jan SparksManaging Director - Structured [email protected]
mETHOdOLOgY
The information in this report is the result of a compilation of publicly available data from a variety of commercial and government sources.
CONTACT
Rachel AlexanderDirector of Market [email protected]
t 713.270.7700 f 713.270.6285www.transwestern.net/houston
1900 West Loop South, Suite 1300Houston, Texas 77027
SEATTLE
WALNUT CREEK
LOS ANGELES
SALT LAKECITY
DENVER
MINNEAPOLIS
MILWAUKEE
ST. LOUIS
CHICAGO
DETROIT GREENWICHNEW YORK
NEW JERSEY
BALTIMORENORTHERNVIRGINIA
BETHESDAWASHINGTON DC
DALLASFORTWORTH
HOUSTONAUSTIN
SAN ANTONIO
OKLAHOMACITY
NEW ORLEANS
ATLANTA
FORT LAUDERDALEORLANDO
MIAMI-DADE
SANFRANCISCO
PHOENIXORANGE COUNTY
SAN DIEGO
BOSTON
SILICONVALLEY
TRANSWESTERNLOCATIONS
aBout tr ansWestern
Transwestern is a privately held real estate firm specializing in agency leasing, property and facilities management, tenant advisory, capital markets, research and sustainability. The fully integrated global enterprise leverages competencies in office, industrial, retail, multifamily and healthcare properties to add value for investors, owners and occupiers of real estate. As a member of the Transwestern family of companies, the firm capitalizes on market insights and operational expertise of independent affiliates specializing in development, real estate investment management and research. Transwestern has 34 U.S. offices and assists clients through more than 181 offices in 40 countries as part of a strategic alliance with Paris-based BNP Paribas Real Estate.
Transwestern was founded in Houston, Texas in 1978, and Houston remains the corporate headquarters today. As one of the preeminent commercial real estate firms in Houston, we offer a comprehensive menu of real estate services designed to provide owners, tenants and investors with the optimum solutions for their unique requirements. Transwestern has seasoned veterans in every area of expertise with the integrity, experience and creativity to be the best partner for its clients. Transwestern’s Houston office currently employs over 385 team members and has been an innovator in the Houston market for 36 years.

HOUSTON OfficeJULY 2014
Recent Office Leases
CBD :: Key Energy (renewal)89,000 SF in Fulbright tower
Energy Corridor :: IHI E&C International Corporation61,455 SF in One Eldridge Place
San Felipe/Voss :: Texas American Title50,000 SF at 2000 Bering
Recent Office saLes
Greenspoint/North Belt West :: Eight Greenspoint Plaza198,257 SF, Class ASale price undisclosedBuyer: Stream Realty & AllianceBernstein US RE Seller: ExxonMobil Corporation
OFFICE LEASE STATISTICS
Source: Transwestern analysis of CoStar data- Houston office buildings 15,000 SF and greater, excluding government owned buildings
Office Market indicators - All Space
SubmArkETTOTAL bLdgS
INVENTOrYSF AVAILAbLE ImmEdIATELY
dIrECT VACANCY
rATE
OVErALL VACANCY
rATE
SF uNdEr CONSTruCTION
1Q2014 NET AbSOrpTION
ASkINg rENTAL rATES (FSg)
CLASS A CLASS b
Downtown (CBD & Midtown) 218 55,285,545 4,956,476 9.0% 9.8% 2,347,138 94,000 $32.84 $26.34
FM 1960 (I-45 N, FM 1960/Champions & FM 1960/Hwy 249)
241 12,192,643 1,885,105 15.5% 15.8% 511,500 146,000 $25.55 $17.76
Greenspoint/North Belt (North Belt West/Greenspoint & Greenspoint/IAH)
126 13,842,997 2,026,125 14.6% 16.3% 43,000 $28.71 $18.44
Greenway Plaza 99 12,166,960 936,856 7.7% 7.7% 660,437 170,000 $29.52 $21.54
Gulf Freeway/Pasadena 110 4,637,000 468,337 10.1% 10.2% 47,700 19,000 $27.84 $21.24
Katy Frwy/Energy Corridor (Katy Freeway East & Katy Freeway West)
299 34,197,744 1,627,045 4.8% 5.2% 3,825,722 1,135,000 $26.25 $20.98
Kingwood/Humble 46 1,822,176 151,241 8.3% 8.9% 196,110 (15,000) $30.10 $17.51
NASA/Clear Lake 172 9,763,387 1,474,271 15.1% 15.3% 87,772 140,000 $23.82 $19.43
Northeast 47 2,097,508 241,213 11.5% 11.5% 36,400 38,000 $14.61
Northwest (North Loop West, Northwest Near & Northwest Far)
182 15,315,476 1,997,198 13.2% 13.5% 1,019,000 (3,000) $25.07 $18.45
South Main/Medical Center 88 11,135,712 812,907 7.3% 7.3% 52,362 100,000 $26.44 $26.30
Southwest Frwy/Sugar Land (SW/Hillcroft, SW Beltway 8 & E Ft Bend Co/Sugar Land)
312 21,171,123 3,480,431 16.4% 17.1% 342,000 (128,000) $20.93 $16.53
West Loop (Bellaire, Post Oak Park, Galleria, Riverway, Richmond/Fountainview & San Felipe/Voss)
242 35,754,835 3,354,376 9.4% 10.1% 956,094 27,000 $31.88 $21.58
Westchase 112 16,063,203 1,268,993 7.9% 8.6% 2,261,880 35,000 $32.62 $19.52
Woodlands/Conroe (The Woodlands & Conroe)
200 14,052,916 613,479 4.4% 5.2% 4,411,323 784,000 $25.90 $24.48
Total - Houston 2,494 259,499,225 25,294,053 9.7% 10.3% 16,755,438 2,585,000 $29.34 $20.17
Source: Transwestern analysis of Costar data - Houston office buildings 15,000 SF and greater, excluding government owned buildings
Office Sales StatisticsHOuSTON mSA uNITEd STATES
QuArTEr TO dATE
LAST QuArTEr
(1Q14)
TrAILINg 12 mONTHS
LAST QuArTEr
(1Q14)
TrAILINg 12 mONTHS
Volume ($ Mil)
$378.8 $726.7 $5,025.8 $23,463.6 $109,548.5
No. of Properties
26 16 114 950 3,948
Total SF 2,921,761 2,966,083 26,038,184 118,028,587 529,788,492
Average Price/SF
N/A $278 $234 $230 $229
Average Cap Rate (Yield)
N/A 6.8% 7.4% 6.8% 6.9%
Source: Real Capital Analytics
$21.00
$22.00
$23.00
$24.00
$25.00
$26.00
9%
10%
11%
12%
13%
14%
Overall Vacancy Rates Asking Rental Rates (fsg)
1Q11 2Q11 3Q11 4Q11 1Q12 2Q12 3Q12 4Q12 1Q13 2Q13 3Q13 4Q13 1Q14
mArkET WATCH
Related Documents