Real Estate Market Review Orange County Office 1 st Quarter 2018 The Orange County office market started the year strong as underlying demand drivers continue to remain robust. Buoyed by a well-educated workforce and strong employment outlook sustained by tech, financial and business services, overall market stability should remain healthy. The delivery of The Boardwalk, 400 Spectrum Center, and Sand Canyon Business Center last quarter provided over 1.2 million square feet of new office space with an additional 1.0 million square feet under construction. This influx of new office space within this tight time frame could apply upward pressure on vacancy as additional projects come on line in the following quarters. With strong fundamentals in place, we can expect the Orange County office market to remain vigorous in 2018. 1st Quarter 2018 | 1 Net absorption, a measure of market strength, was positive 395,911 square feet in the first quarter, slightly declining from fourth quarter 2017’s 401,571 square feet. Class A Office space continued to receive the most positive net absorption with 362,528 square feet, as Broadcom helped contribute 287,726 square feet of positive absorption when they moved into their space in South County. As a result, the Airport area had 113,674 square feet of negative absorption this quarter. Construction activity in the office sector continues to increase in the first quarter. The much anticipated Quad at Discovery Business Center and Tustin Legacy are scheduled to be completed in the coming quarters, adding over 782,200 square feet of new office space. With creative office conversions becoming the norm in the market, the redevelopment of 2722 Michelson in Irvine is expected to be completed later this year, adding another 155,000 square feet. A new proposal, which was filed in 2017 would require developers to seek voter approval for any sizeable project requiring zoning or general plan changes. If passed, we can assume a decrease in construction activity occurring. Leasing activity was down in the first quarter with over 1.7 million square feet coming off the market, representing a decrease of 44.06% year-over- year. Class A transactions saw a decrease from the 1,190,589 square feet in 4Q17 to 734,651 square feet coming off the market this quarter. Class B space accumulated the most activity this quarter, recording over 1.0 million square feet as a push for creative office space is taking place. Accordingly, the largest transaction this quarter resulted in GSA acquiring 66,818 square feet of creative office space in the Tustin submarket. Airport Area and South County continue to receive the most activity with 921,035 and 367,438 square feet in activity as an abundance of new office space is located in these markets. With an increase in availabilities, stemming from the new construction deliveries, and steady employment growth, we can expect leasing activity to remain robust. GSA 14101 Myford Road, Tustin 66,818 s.f. leased BJ’s Restaurants 7755 Center Avenue, Huntington Beach 57,100 s.f. leased Compass Group USA 12640 Knott Street, Garden Grove 47,662 s.f. leased Ghost Management 43 Discovery, Irvine 31,407 s.f. leased Notable Lease Transactions Notable Construction Tustin Legacy Tustin (4 buildings) 417,284 s.f. | Delivering 07/2018 The Quad at Discovery Business Center Irvine Spectrum (4 buildings) 364,955 s.f. | Delivering 06/2018 2722 Michelson Drive Irvine 155,000 s.f. | Delivering 12/2018 Market Forecast Trends ABSORPTION RENTAL RATE CONSTRUCTION DELIVERIES VACANCY

Welcome message from author
This document is posted to help you gain knowledge. Please leave a comment to let me know what you think about it! Share it to your friends and learn new things together.
Transcript
Real Estate Market Review
Orange County Office
1st Quarter
2018
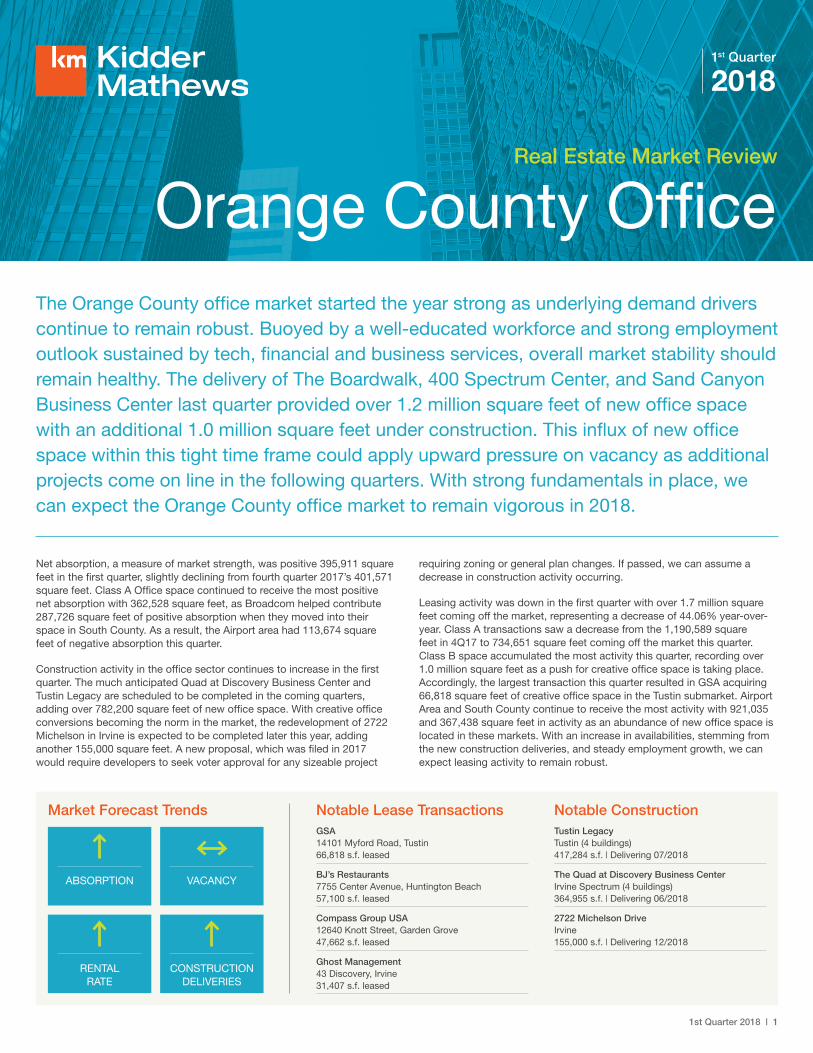
The Orange County office market started the year strong as underlying demand drivers continue to remain robust. Buoyed by a well-educated workforce and strong employment outlook sustained by tech, financial and business services, overall market stability should remain healthy. The delivery of The Boardwalk, 400 Spectrum Center, and Sand Canyon Business Center last quarter provided over 1.2 million square feet of new office space with an additional 1.0 million square feet under construction. This influx of new office space within this tight time frame could apply upward pressure on vacancy as additional projects come on line in the following quarters. With strong fundamentals in place, we can expect the Orange County office market to remain vigorous in 2018.
1st Quarter 2018 | 1
Net absorption, a measure of market strength, was positive 395,911 square feet in the first quarter, slightly declining from fourth quarter 2017’s 401,571 square feet. Class A Office space continued to receive the most positive net absorption with 362,528 square feet, as Broadcom helped contribute 287,726 square feet of positive absorption when they moved into their space in South County. As a result, the Airport area had 113,674 square feet of negative absorption this quarter.
Construction activity in the office sector continues to increase in the first quarter. The much anticipated Quad at Discovery Business Center and Tustin Legacy are scheduled to be completed in the coming quarters, adding over 782,200 square feet of new office space. With creative office conversions becoming the norm in the market, the redevelopment of 2722 Michelson in Irvine is expected to be completed later this year, adding another 155,000 square feet. A new proposal, which was filed in 2017 would require developers to seek voter approval for any sizeable project
requiring zoning or general plan changes. If passed, we can assume a decrease in construction activity occurring.
Leasing activity was down in the first quarter with over 1.7 million square feet coming off the market, representing a decrease of 44.06% year-over-year. Class A transactions saw a decrease from the 1,190,589 square feet in 4Q17 to 734,651 square feet coming off the market this quarter. Class B space accumulated the most activity this quarter, recording over 1.0 million square feet as a push for creative office space is taking place. Accordingly, the largest transaction this quarter resulted in GSA acquiring 66,818 square feet of creative office space in the Tustin submarket. Airport Area and South County continue to receive the most activity with 921,035 and 367,438 square feet in activity as an abundance of new office space is located in these markets. With an increase in availabilities, stemming from the new construction deliveries, and steady employment growth, we can expect leasing activity to remain robust.
GSA 14101 Myford Road, Tustin 66,818 s.f. leased
BJ’s Restaurants 7755 Center Avenue, Huntington Beach 57,100 s.f. leased
Compass Group USA 12640 Knott Street, Garden Grove 47,662 s.f. leased
Ghost Management 43 Discovery, Irvine 31,407 s.f. leased
Notable Lease Transactions Notable ConstructionTustin Legacy Tustin (4 buildings) 417,284 s.f. | Delivering 07/2018
The Quad at Discovery Business Center Irvine Spectrum (4 buildings) 364,955 s.f. | Delivering 06/2018
2722 Michelson Drive Irvine 155,000 s.f. | Delivering 12/2018
Market Forecast Trends
ABSORPTION
RENTAL RATE
CONSTRUCTION DELIVERIES
VACANCY
2 | Orange County Office Real Estate Market Review
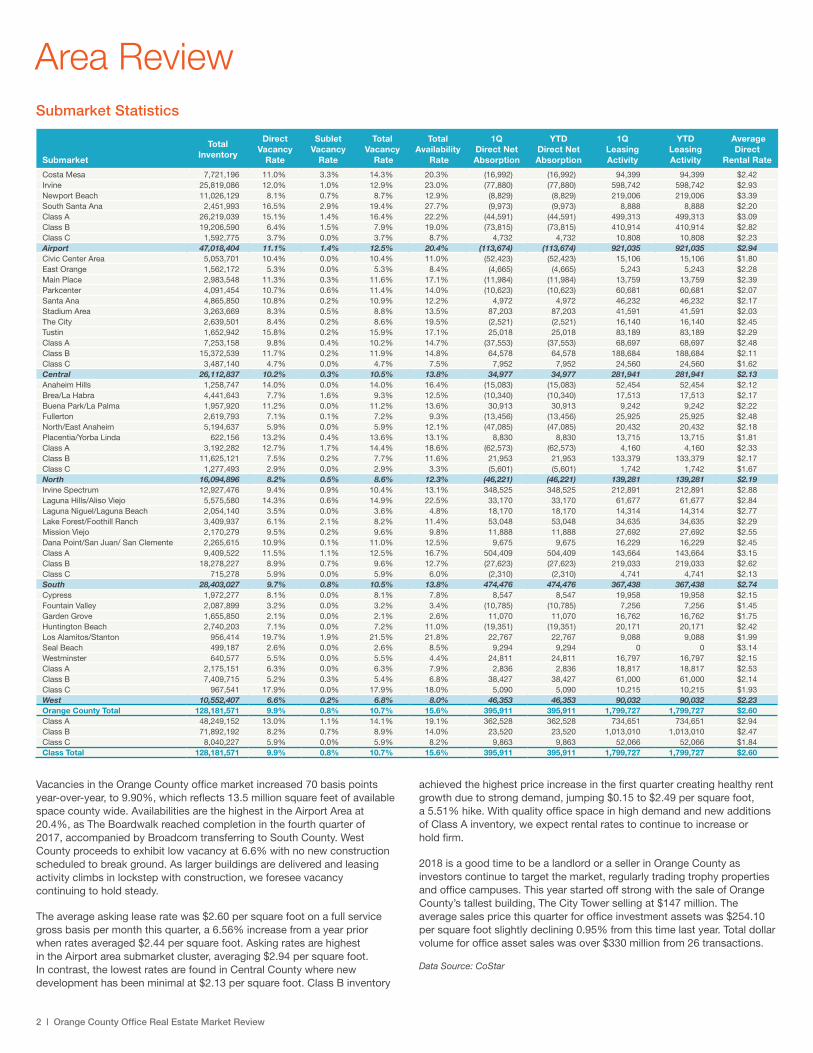
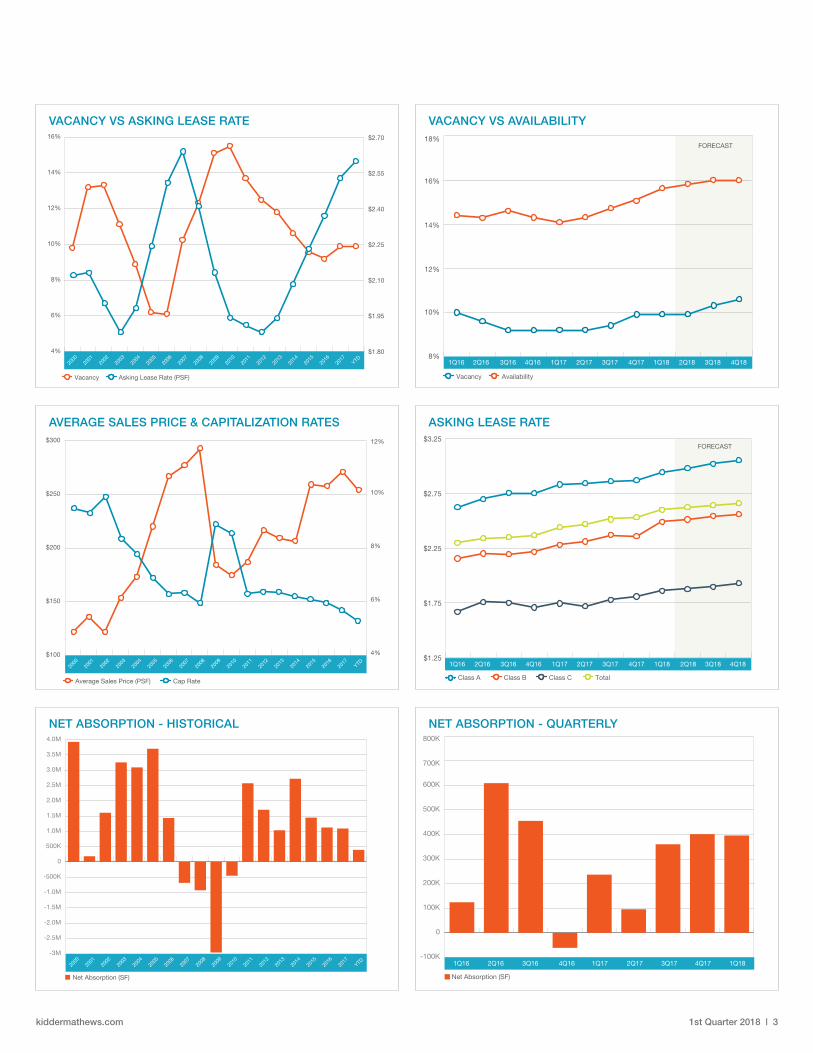
Vacancies in the Orange County office market increased 70 basis points year-over-year, to 9.90%, which reflects 13.5 million square feet of available space county wide. Availabilities are the highest in the Airport Area at 20.4%, as The Boardwalk reached completion in the fourth quarter of 2017, accompanied by Broadcom transferring to South County. West County proceeds to exhibit low vacancy at 6.6% with no new construction scheduled to break ground. As larger buildings are delivered and leasing activity climbs in lockstep with construction, we foresee vacancy continuing to hold steady.
The average asking lease rate was $2.60 per square foot on a full service gross basis per month this quarter, a 6.56% increase from a year prior when rates averaged $2.44 per square foot. Asking rates are highest in the Airport area submarket cluster, averaging $2.94 per square foot. In contrast, the lowest rates are found in Central County where new development has been minimal at $2.13 per square foot. Class B inventory
achieved the highest price increase in the first quarter creating healthy rent growth due to strong demand, jumping $0.15 to $2.49 per square foot, a 5.51% hike. With quality office space in high demand and new additions of Class A inventory, we expect rental rates to continue to increase or hold firm.
2018 is a good time to be a landlord or a seller in Orange County as investors continue to target the market, regularly trading trophy properties and office campuses. This year started off strong with the sale of Orange County’s tallest building, The City Tower selling at $147 million. The average sales price this quarter for office investment assets was $254.10 per square foot slightly declining 0.95% from this time last year. Total dollar volume for office asset sales was over $330 million from 26 transactions.
Data Source: CoStar
Area ReviewSubmarket Statistics
Submarket
Total Inventory
Direct Vacancy
Rate
Sublet Vacancy
Rate
Total Vacancy
Rate
Total Availability
Rate
1Q Direct Net Absorption
YTD Direct Net Absorption
1Q Leasing Activity
YTD Leasing Activity
Average Direct
Rental Rate
Costa Mesa 7,721,196 11.0% 3.3% 14.3% 20.3% (16,992) (16,992) 94,399 94,399 $2.42Irvine 25,819,086 12.0% 1.0% 12.9% 23.0% (77,880) (77,880) 598,742 598,742 $2.93Newport Beach 11,026,129 8.1% 0.7% 8.7% 12.9% (8,829) (8,829) 219,006 219,006 $3.39South Santa Ana 2,451,993 16.5% 2.9% 19.4% 27.7% (9,973) (9,973) 8,888 8,888 $2.20Class A 26,219,039 15.1% 1.4% 16.4% 22.2% (44,591) (44,591) 499,313 499,313 $3.09Class B 19,206,590 6.4% 1.5% 7.9% 19.0% (73,815) (73,815) 410,914 410,914 $2.82Class C 1,592,775 3.7% 0.0% 3.7% 8.7% 4,732 4,732 10,808 10,808 $2.23Airport 47,018,404 11.1% 1.4% 12.5% 20.4% (113,674) (113,674) 921,035 921,035 $2.94Civic Center Area 5,053,701 10.4% 0.0% 10.4% 11.0% (52,423) (52,423) 15,106 15,106 $1.80East Orange 1,562,172 5.3% 0.0% 5.3% 8.4% (4,665) (4,665) 5,243 5,243 $2.28Main Place 2,983,548 11.3% 0.3% 11.6% 17.1% (11,984) (11,984) 13,759 13,759 $2.39Parkcenter 4,091,454 10.7% 0.6% 11.4% 14.0% (10,623) (10,623) 60,681 60,681 $2.07Santa Ana 4,865,850 10.8% 0.2% 10.9% 12.2% 4,972 4,972 46,232 46,232 $2.17Stadium Area 3,263,669 8.3% 0.5% 8.8% 13.5% 87,203 87,203 41,591 41,591 $2.03The City 2,639,501 8.4% 0.2% 8.6% 19.5% (2,521) (2,521) 16,140 16,140 $2.45Tustin 1,652,942 15.8% 0.2% 15.9% 17.1% 25,018 25,018 83,189 83,189 $2.29Class A 7,253,158 9.8% 0.4% 10.2% 14.7% (37,553) (37,553) 68,697 68,697 $2.48Class B 15,372,539 11.7% 0.2% 11.9% 14.8% 64,578 64,578 188,684 188,684 $2.11Class C 3,487,140 4.7% 0.0% 4.7% 7.5% 7,952 7,952 24,560 24,560 $1.62Central 26,112,837 10.2% 0.3% 10.5% 13.8% 34,977 34,977 281,941 281,941 $2.13Anaheim Hills 1,258,747 14.0% 0.0% 14.0% 16.4% (15,083) (15,083) 52,454 52,454 $2.12Brea/La Habra 4,441,643 7.7% 1.6% 9.3% 12.5% (10,340) (10,340) 17,513 17,513 $2.17Buena Park/La Palma 1,957,920 11.2% 0.0% 11.2% 13.6% 30,913 30,913 9,242 9,242 $2.22Fullerton 2,619,793 7.1% 0.1% 7.2% 9.3% (13,456) (13,456) 25,925 25,925 $2.48North/East Anaheim 5,194,637 5.9% 0.0% 5.9% 12.1% (47,085) (47,085) 20,432 20,432 $2.18Placentia/Yorba Linda 622,156 13.2% 0.4% 13.6% 13.1% 8,830 8,830 13,715 13,715 $1.81Class A 3,192,282 12.7% 1.7% 14.4% 18.6% (62,573) (62,573) 4,160 4,160 $2.33Class B 11,625,121 7.5% 0.2% 7.7% 11.6% 21,953 21,953 133,379 133,379 $2.17Class C 1,277,493 2.9% 0.0% 2.9% 3.3% (5,601) (5,601) 1,742 1,742 $1.67North 16,094,896 8.2% 0.5% 8.6% 12.3% (46,221) (46,221) 139,281 139,281 $2.19Irvine Spectrum 12,927,476 9.4% 0.9% 10.4% 13.1% 348,525 348,525 212,891 212,891 $2.88Laguna Hills/Aliso Viejo 5,575,580 14.3% 0.6% 14.9% 22.5% 33,170 33,170 61,677 61,677 $2.84Laguna Niguel/Laguna Beach 2,054,140 3.5% 0.0% 3.6% 4.8% 18,170 18,170 14,314 14,314 $2.77Lake Forest/Foothill Ranch 3,409,937 6.1% 2.1% 8.2% 11.4% 53,048 53,048 34,635 34,635 $2.29Mission Viejo 2,170,279 9.5% 0.2% 9.6% 9.8% 11,888 11,888 27,692 27,692 $2.55Dana Point/San Juan/ San Clemente 2,265,615 10.9% 0.1% 11.0% 12.5% 9,675 9,675 16,229 16,229 $2.45Class A 9,409,522 11.5% 1.1% 12.5% 16.7% 504,409 504,409 143,664 143,664 $3.15Class B 18,278,227 8.9% 0.7% 9.6% 12.7% (27,623) (27,623) 219,033 219,033 $2.62Class C 715,278 5.9% 0.0% 5.9% 6.0% (2,310) (2,310) 4,741 4,741 $2.13South 28,403,027 9.7% 0.8% 10.5% 13.8% 474,476 474,476 367,438 367,438 $2.74Cypress 1,972,277 8.1% 0.0% 8.1% 7.8% 8,547 8,547 19,958 19,958 $2.15Fountain Valley 2,087,899 3.2% 0.0% 3.2% 3.4% (10,785) (10,785) 7,256 7,256 $1.45Garden Grove 1,655,850 2.1% 0.0% 2.1% 2.6% 11,070 11,070 16,762 16,762 $1.75Huntington Beach 2,740,203 7.1% 0.0% 7.2% 11.0% (19,351) (19,351) 20,171 20,171 $2.42Los Alamitos/Stanton 956,414 19.7% 1.9% 21.5% 21.8% 22,767 22,767 9,088 9,088 $1.99Seal Beach 499,187 2.6% 0.0% 2.6% 8.5% 9,294 9,294 0 0 $3.14Westminster 640,577 5.5% 0.0% 5.5% 4.4% 24,811 24,811 16,797 16,797 $2.15Class A 2,175,151 6.3% 0.0% 6.3% 7.9% 2,836 2,836 18,817 18,817 $2.53Class B 7,409,715 5.2% 0.3% 5.4% 6.8% 38,427 38,427 61,000 61,000 $2.14Class C 967,541 17.9% 0.0% 17.9% 18.0% 5,090 5,090 10,215 10,215 $1.93West 10,552,407 6.6% 0.2% 6.8% 8.0% 46,353 46,353 90,032 90,032 $2.23Orange County Total 128,181,571 9.9% 0.8% 10.7% 15.6% 395,911 395,911 1,799,727 1,799,727 $2.60Class A 48,249,152 13.0% 1.1% 14.1% 19.1% 362,528 362,528 734,651 734,651 $2.94Class B 71,892,192 8.2% 0.7% 8.9% 14.0% 23,520 23,520 1,013,010 1,013,010 $2.47Class C 8,040,227 5.9% 0.0% 5.9% 8.2% 9,863 9,863 52,066 52,066 $1.84Class Total 128,181,571 9.9% 0.8% 10.7% 15.6% 395,911 395,911 1,799,727 1,799,727 $2.60
1st Quarter 2018 | 3kiddermathews.com
FORECAST
3Q172Q171Q174Q163Q162Q161Q16
Availability
1Q18 3Q18 4Q182Q184Q17
Vacancy
8%
10%
12%
14%
16%
18%
VACANCY VS AVAILABILITY
Average Sales Price (PSF)
2014
2015
2016
2013
2012
2011
2010
2009
2008
2007
2006
2005
2004
2003
2002
2001
2000
YTD2017
Cap Rate
$100
$150
$200
$250
$300
4%
6%
8%
10%
12%
AVERAGE SALES PRICE & CAPITALIZATION RATES
2Q17 3Q171Q174Q163Q162Q161Q16
Class B Class C
FORECAST
Class A
4Q17 1Q18 3Q18 4Q182Q18
Total
$1.25
$1.75
$2.25
$2.75
$3.25
ASKING LEASE RATE
Vacancy
2014
2015
2017
2016
2013
2012
2011
2010
2009
2008
2007
2006
2005
2004
2003
2002
2001
2000
YTD
Asking Lease Rate (PSF)
4%
6%
8%
10%
12%
14%
16%
$1.80
$1.95
$2.10
$2.25
$2.40
$2.55
$2.70
VACANCY VS ASKING LEASE RATE
Net Absorption (SF)
2014
2015
2016
2013
2012
2011
2010
2009
2008
2007
2006
2005
2004
2003
2002
2001
2000
YTD2017
-3M
-2.5M
-2.0M
-1.5M
-1.0M
-500K
0
500K
1.0M
1.5M
2.0M
2.5M
3.0M
3.5M
4.0M
NET ABSORPTION - HISTORICAL
Net Absorption (SF)
3Q16 4Q162Q161Q16 1Q17 2Q17 3Q17 4Q17 1Q18-100K
0
100K
200K
300K
400K
500K
600K
700K
800K
NET ABSORPTION - QUARTERLY
4 | Orange County Office Real Estate Market Review
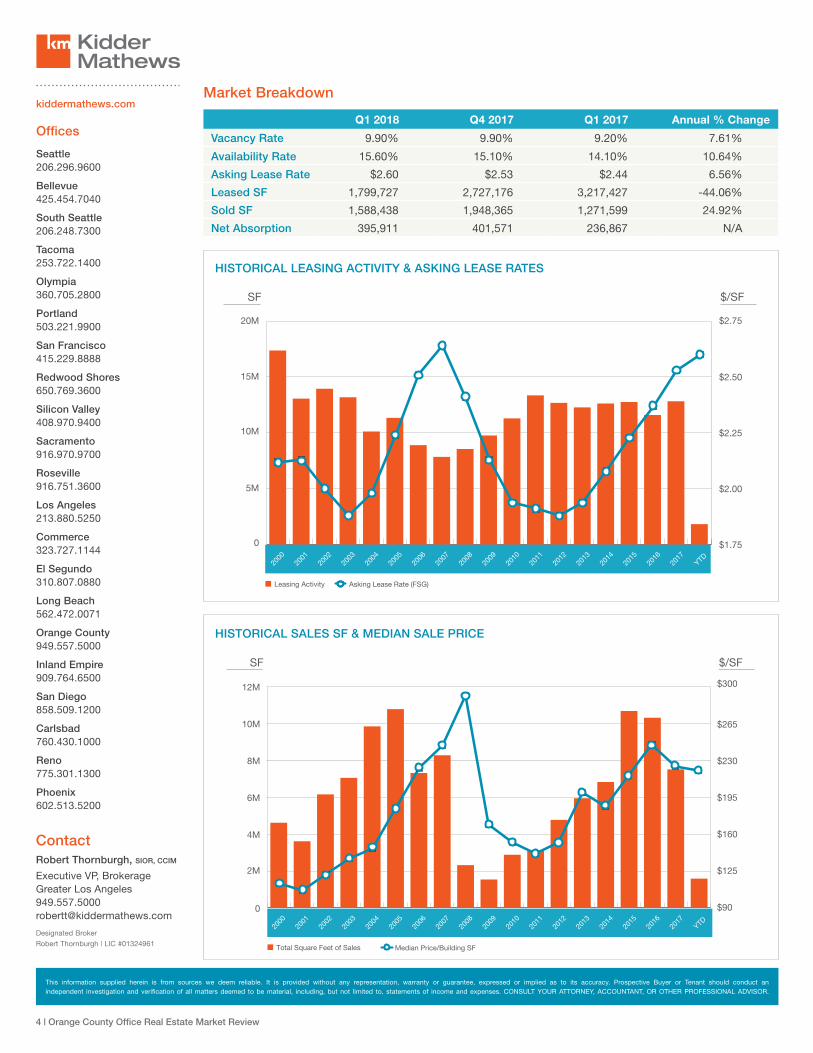
Market Breakdown
Q1 2018 Q4 2017 Q1 2017 Annual % Change
Vacancy Rate 9.90% 9.90% 9.20% 7.61%
Availability Rate 15.60% 15.10% 14.10% 10.64%
Asking Lease Rate $2.60 $2.53 $2.44 6.56%
Leased SF 1,799,727 2,727,176 3,217,427 -44.06%
Sold SF 1,588,438 1,948,365 1,271,599 24.92%
Net Absorption 395,911 401,571 236,867 N/A
SF
Median Price/Building SFTotal Square Feet of Sales
2014
2015
2016
2013
2012
2011
2010
2009
2008
2007
2006
2005
2004
2003
2002
2001
2000
2017
YTD
$/SF
0
2M
4M
6M
8M
10M
12M
$90
$125
$160
$195
$230
$265
$300
HISTORICAL SALES SF & MEDIAN SALE PRICE
SF
Asking Lease Rate (FSG)Leasing Activity
2014
2015
2016
2013
2012
2011
2010
2009
2008
2007
2006
2005
2004
2003
2002
2001
2000
YTD2017
$/SF
0
5M
10M
15M
20M
$1.75
$2.00
$2.25
$2.50
$2.75
HISTORICAL LEASING ACTIVITY & ASKING LEASE RATES
ContactRobert Thornburgh, SIOR, CCIM
Executive VP, BrokerageGreater Los [email protected]
Designated Broker
Robert Thornburgh | LIC #01324961
kiddermathews.com
This information supplied herein is from sources we deem reliable. It is provided without any representation, warranty or guarantee, expressed or implied as to its accuracy. Prospective Buyer or Tenant should conduct an independent investigation and verification of all matters deemed to be material, including, but not limited to, statements of income and expenses. CONSULT YOUR ATTORNEY, ACCOUNTANT, OR OTHER PROFESSIONAL ADVISOR.
Offices
Seattle206.296.9600
Bellevue425.454.7040
South Seattle206.248.7300
Tacoma253.722.1400
Olympia360.705.2800
Portland503.221.9900
San Francisco415.229.8888
Redwood Shores650.769.3600
Silicon Valley408.970.9400
Sacramento916.970.9700
Roseville916.751.3600
Los Angeles213.880.5250
Commerce323.727.1144
El Segundo310.807.0880
Long Beach562.472.0071
Orange County949.557.5000
Inland Empire909.764.6500
San Diego858.509.1200
Carlsbad760.430.1000
Reno775.301.1300
Phoenix602.513.5200
Related Documents