REAL ESTATE MARKET INSIGHTS November 2017

Welcome message from author
This document is posted to help you gain knowledge. Please leave a comment to let me know what you think about it! Share it to your friends and learn new things together.
Transcript

REAL ESTATE MARKET INSIGHTSNovember 2017

THE PHILIPPINES

The Philippines
103million
POPULATION
LITERACY RATE
96.5%
* CREDITRATINGS
BBBS & P
MOODY’S Baa2
FITCH BBB-
6.9%GROWTHGDP
INFLATION RATE
2.7%LABOR FORCE
69.6 Mn
FOREIGN RESERVES
$81.51B
24 years oldAverage age of Filipinos
PHILIPPINEGDP
$304.91B
3
PHILIPPINEGNI per Capita
$3,580
* BBB : Exhibits adequate protection parameters, ability to meet financial commitments* Baa2 :Medium grade, subject to moderate credit risk, strong ability to repay short term obligations* BBB- : Capacity to meet payments on a timely basis
D E B T
E X T E R N A L
23.8% of GDP(June 2017)
42.1% of GDP(Jan 2017)
P U B L I C
Source: Trading Economics, BSP, World Bank, PSA, S&P, Moody’s

Foreign Investment in the Philippines
Source: Trading Economics, BSP
40%FOREIGN EQUITY LIMIT
30%CORPORATE INCOME TAX
LEASE TERM
25 yearsRenewable for another 25 years
50 yearsRenewable for another 25 years
In some cases,
PERSONAL INCOME TAX
32% If annual net taxable income is at least P500,000 annual income (USD10,000)
4

In USD Billions
5
Philippine Foreign Direct Investments (FDI)Performance (2005 to 1H 2017)
Source : World Bank, Bangko Sentral ng Pilipinas

Government’s Socioeconomic Agenda
PRES. DUTERTE’S 10-POINT SOCIOECONOMIC AGENDA
Source: DOH
2. Current macroeconomic policies
3. Ease of Doing Business
4. Social protection programs
5. Rural and value chain development
6. Security and land tenure
7. Human Capital Development
8. Science, technology, and creative arts
9. Tax Reform
10. Responsible Parenthood & Reproductive Health
Infrastructure Spending
“Golden Age of Infrastructure” in the Philippines-Budget Secretary Benjamin Diokno
1
DUTERTENOMICS:“Build, build, build program”
• Manila Subway (P227 billion)• Mindanao Railway (P31.5 billion)• NLEX-SLEX Connector Road (P23.30 billion)• BGC to Ortigas Road Link Project (P4 billion)• Philippine National Railways North 1 (P105.3 billion)• Philippine National Railways North 2 (P150 billion)• Philippine National Railways South Commuter (P134 billion)• PNR South Long Haul (P151 billion)• Subic-Clark Cargo Railway Project (P32.5 billion)• Unified common station (P2.8 billion)
6
Underemployment Rate -
Unemployment Rate -
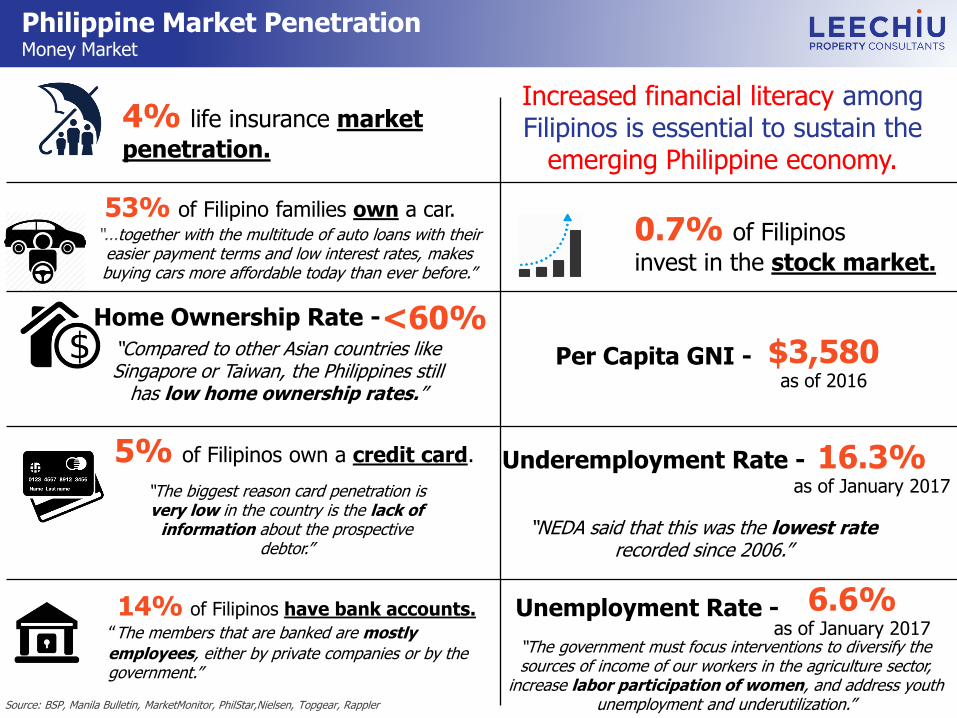
4% life insurance market
penetration.
14% of Filipinos have bank accounts.
“The members that are banked are mostly
employees, either by private companies or by the government.”
Source: BSP, Manila Bulletin, MarketMonitor, PhilStar,Nielsen, Topgear, Rappler
5% of Filipinos own a credit card.
“The biggest reason card penetration is very low in the country is the lack of
information about the prospective debtor.”
6.6% as of January 2017
“The government must focus interventions to diversify the sources of income of our workers in the agriculture sector,
increase labor participation of women, and address youth unemployment and underutilization.”
16.3% as of January 2017
“NEDA said that this was the lowest rate recorded since 2006.”
“Compared to other Asian countries like Singapore or Taiwan, the Philippines still
has low home ownership rates.”
53% of Filipino families own a car.
Philippine Market PenetrationMoney Market
Increased financial literacy among Filipinos is essential to sustain the
emerging Philippine economy.
Home Ownership Rate -<60%
0.7% of Filipinos
invest in the stock market.
Per Capita GNI - $3,580as of 2016
“...together with the multitude of auto loans with their easier payment terms and low interest rates, makes buying cars more affordable today than ever before.”

Demand Drivers
Urban Population Growth
It is projected to rise to 56.3% by 2030 and 66% by 2050.
BPO Employee’sHousing Need
Growing number of BPO workers
Need to liveneartheir
workplace.
Overseas FilipinoRemittances
10 millionOFW’s can invest in Real
Estate
More than 50%
of remittances are real estate related
Source: Keynote speech of Sec. Arsenio M. Balisacan Director General of NEDA“The Philippine Economic Growth and the Growth in the Property Sector” 2015* 2010
Housing backlog needs to be addressed and
demand for dormitories will rise.
48.6%of Filipinoslive in Urban Areas*
8

OFFICE MARKET
Quezon City
Ortigas/Pasig
Makati
BGC / Taguig
Bay/Pasay
Alabang
Parañaque
Las Pinas
Manila
Mandaluyong
San Juan
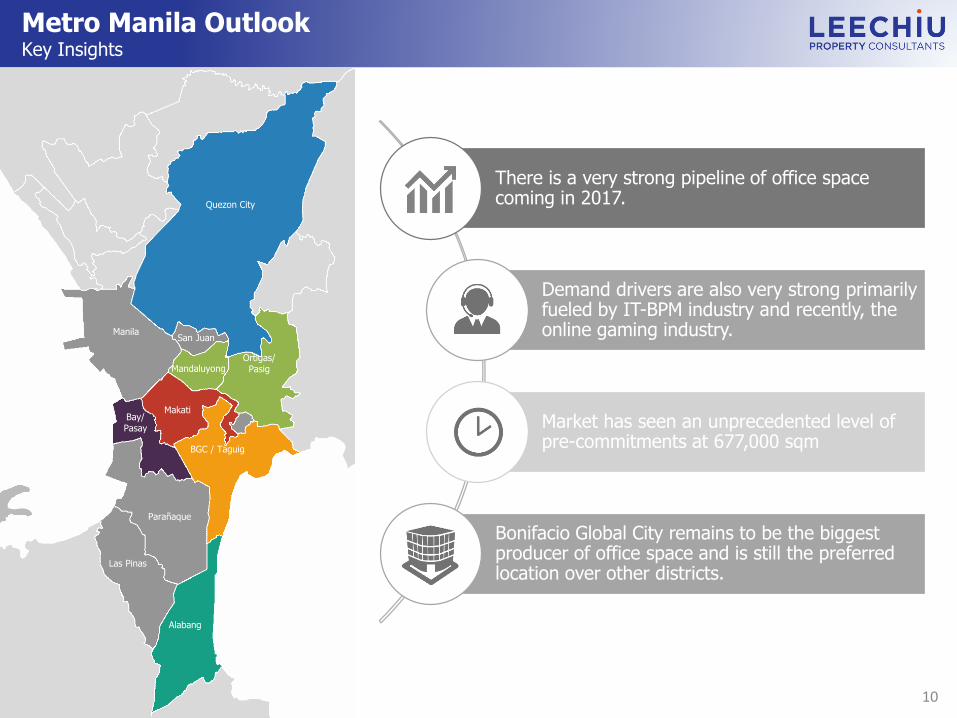
Metro Manila Outlook Key Insights
There is a very strong pipeline of office space coming in 2017.
Demand drivers are also very strong primarily fueled by IT-BPM industry and recently, the online gaming industry.
Market has seen an unprecedented level of pre-commitments at 677,000 sqm
Bonifacio Global City remains to be the biggest producer of office space and is still the preferred location over other districts.
10

LAOAG
CAGAYAN
BAGUIO
TARLAC
PAMPANGA
BULACAN
QUEZON
CAVITE /BATANGAS / LAGUNA
CAPIZ
PALAWAN ILOILO
BACOLOD
DUMAGUETE
DAVAO
ZAMBOANGA
Provincial Outlook Key Insights
Companies will continue to look for new and untapped labor markets.
National Government promotes new developments in the provinces.
Preferred areas for expansion are Luzon and Visayas.
BPOs in the provinces will continue to offer relocation incentives to interested applicants.
11

Provincial Outlook IT-BPAP Roadmap 2022
Whilst 70% of the total projected IT-BPM workforce will still remain in Metro Manila, National Government’s all inclusive-plan will positively impact expansion in the provinces.
IT-BPM labor workforce in the provinces is estimated to grow by 60% in 2022.
Provincial full time employees will grow from 1.2 million to 1.8 million in the next 5 years, which translates to 3 million sqm of office requirement.
Source: IT-BPAP Roadmap 202212

Quezon City
Ortigas/Pasig
Makati
BGC / Taguig
Bay/Pasay
Alabang
Parañaque
Las Pinas
Manila
Manda-luyong
San Juan
Metro Manila Cityscapes
3 MAJOR CBDs
46 BUSINESS PARKS
QUEZON CITY. UP TECHNOHUB. EASTWOOD CITY. ETON CENTRIS.
ARANETA, CYBERARK. ROBINSONS BRIDGETOWNE IT PARK. VERTIS NORTH. UP TOWN
CENTER. FAIRVIEW TERRACES. ALI CLOVERLEAF BALINTAWAK. NUVO. MANDALUYONG. GREENFIELD DISTRICT. ROBINSONS CYBERGATE. ROCKWELL SHERIDAN. SAN JUAN. SANTOLAN TOWN PLAZA. MUNTINLUPA. FILINVEST CORPORATE CITY. LA FUERZA.
NORTHGATE CYBERZONE. MADRIGAL BUSINESS PARK. ALABANG WEST. TAGUIG. ARCA
SOUTH. LAS PINAS. PORTOFINO. EVIA. PASAY. NEWPORT CITY. SM MALL OF ASIA
COMPLEX. METROPOLITAN BUSINESS PARK. DOUBLE DRAGON CYBERCAMPUS. FILINVEST
CYBERZONE PASAY. PARANAQUE. ASIAWORLD CITY. ASEANA BUSINESS PARK. AYALA
ASEANA. MANILA. CITYPLACE. SAN LAZARO.
• Most of these districts will be fully developed by 2018.• There will be little land left for development.• The most important districts moving forward will be
Bonifacio Global City, Bay Area, Filinvest City, Evia and Arca South.
ORTIGAS CBD. ROCKWELL BUSINESS CENTER. ARCOVIA CITY. SILVER CITY. CAPITOL COMMONS.
MAKATI MAKATI CBD. CENTURY CITY. ROCKWELL CENTER. CIRCUIT MAKATI.
ORTIGAS
BGC BONIFACIO GLOBAL CITY. MCKINLEY WEST. MCKINLEY HILL.UPTOWN. VERITOWN.
13
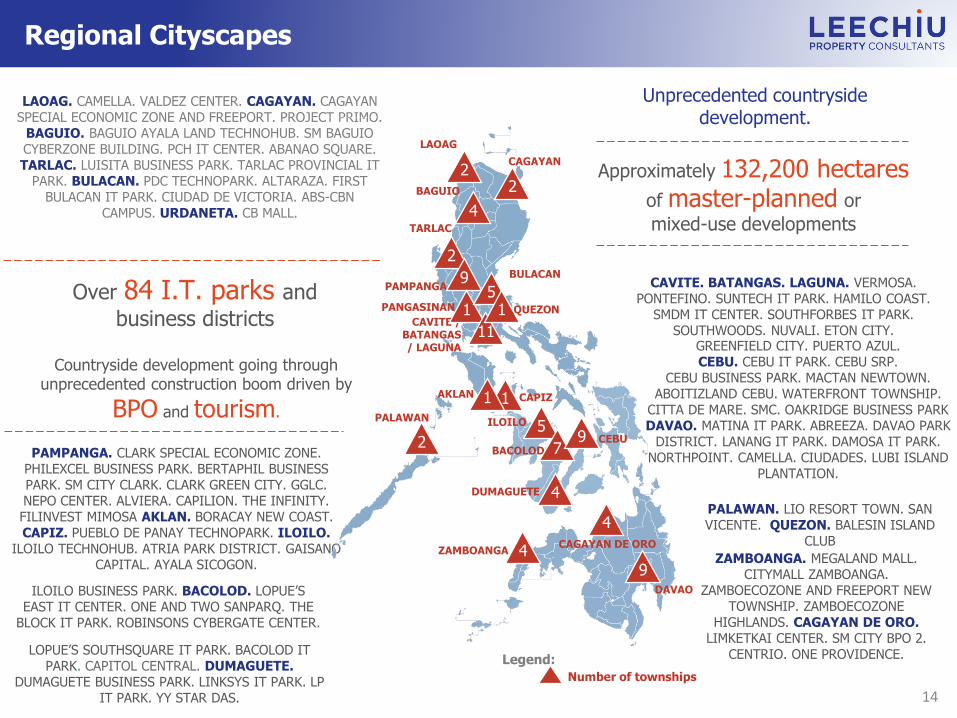
Regional Cityscapes
LAOAG. CAMELLA. VALDEZ CENTER. CAGAYAN. CAGAYAN SPECIAL ECONOMIC ZONE AND FREEPORT. PROJECT PRIMO.
BAGUIO. BAGUIO AYALA LAND TECHNOHUB. SM BAGUIO CYBERZONE BUILDING. PCH IT CENTER. ABANAO SQUARE. TARLAC. LUISITA BUSINESS PARK. TARLAC PROVINCIAL IT
PARK. BULACAN. PDC TECHNOPARK. ALTARAZA. FIRST BULACAN IT PARK. CIUDAD DE VICTORIA. ABS-CBN
CAMPUS. URDANETA. CB MALL.
Over 84 I.T. parks and
business districts
Countryside development going throughunprecedented construction boom driven by
BPO and tourism.
PAMPANGA. CLARK SPECIAL ECONOMIC ZONE. PHILEXCEL BUSINESS PARK. BERTAPHIL BUSINESS PARK. SM CITY CLARK. CLARK GREEN CITY. GGLC. NEPO CENTER. ALVIERA. CAPILION. THE INFINITY. FILINVEST MIMOSA AKLAN. BORACAY NEW COAST.CAPIZ. PUEBLO DE PANAY TECHNOPARK. ILOILO.
ILOILO TECHNOHUB. ATRIA PARK DISTRICT. GAISANO CAPITAL. AYALA SICOGON.
ILOILO BUSINESS PARK. BACOLOD. LOPUE’S EAST IT CENTER. ONE AND TWO SANPARQ. THE
BLOCK IT PARK. ROBINSONS CYBERGATE CENTER.
LOPUE’S SOUTHSQUARE IT PARK. BACOLOD IT PARK. CAPITOL CENTRAL. DUMAGUETE.
DUMAGUETE BUSINESS PARK. LINKSYS IT PARK. LP IT PARK. YY STAR DAS.
CAVITE. BATANGAS. LAGUNA. VERMOSA.PONTEFINO. SUNTECH IT PARK. HAMILO COAST.
SMDM IT CENTER. SOUTHFORBES IT PARK. SOUTHWOODS. NUVALI. ETON CITY.
GREENFIELD CITY. PUERTO AZUL. CEBU. CEBU IT PARK. CEBU SRP.
CEBU BUSINESS PARK. MACTAN NEWTOWN. ABOITIZLAND CEBU. WATERFRONT TOWNSHIP.
CITTA DE MARE. SMC. OAKRIDGE BUSINESS PARKDAVAO. MATINA IT PARK. ABREEZA. DAVAO PARK
DISTRICT. LANANG IT PARK. DAMOSA IT PARK. NORTHPOINT. CAMELLA. CIUDADES. LUBI ISLAND
PLANTATION.
Approximately 132,200 hectares of master-planned or
mixed-use developments
PALAWAN. LIO RESORT TOWN. SAN VICENTE. QUEZON. BALESIN ISLAND
CLUB
ZAMBOANGA. MEGALAND MALL. CITYMALL ZAMBOANGA.
ZAMBOECOZONE AND FREEPORT NEW TOWNSHIP. ZAMBOECOZONE
HIGHLANDS. CAGAYAN DE ORO.LIMKETKAI CENTER. SM CITY BPO 2.
CENTRIO. ONE PROVIDENCE.
LAOAG
CAGAYAN
BAGUIO
TARLAC
PAMPANGABULACAN
QUEZONCAVITE /
BATANGAS / LAGUNA
CAPIZ
PALAWAN ILOILO
BACOLOD
DUMAGUETE
DAVAO
ZAMBOANGACAGAYAN DE ORO
PANGASINAN
22
4
2
9
1
11
1
25
79 CEBU
4
4
4
9
Number of townships
Legend:
51
Unprecedented countrysidedevelopment.
1AKLAN
14
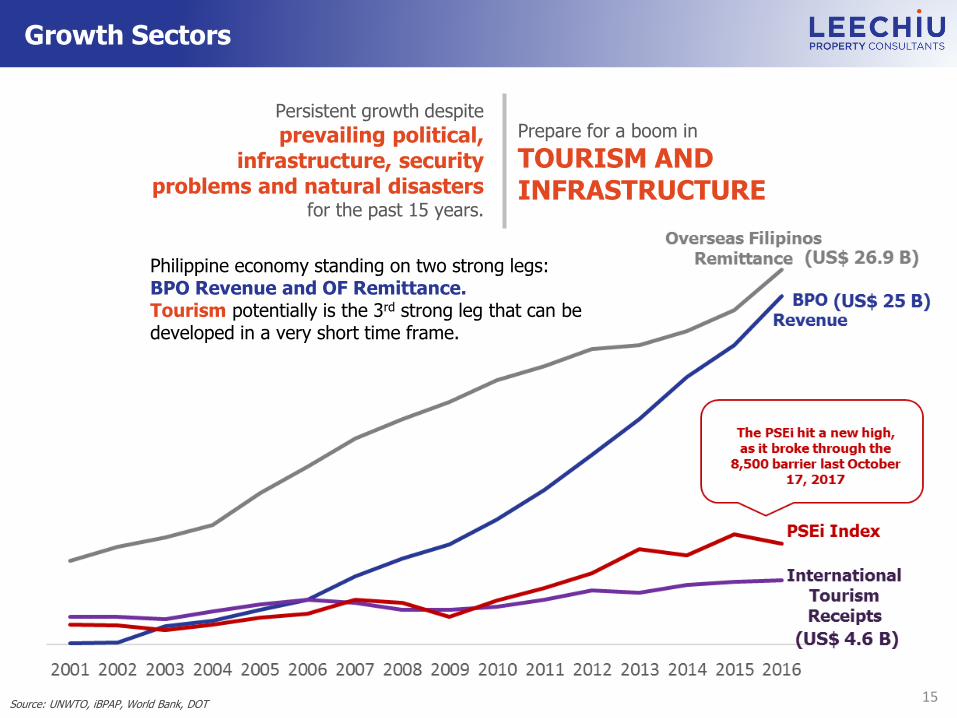
Growth Sectors
Persistent growth despite
prevailing political, infrastructure, security
problems and natural disastersfor the past 15 years.
Prepare for a boom in
TOURISM AND INFRASTRUCTURE
Source: UNWTO, iBPAP, World Bank, DOT
Philippine economy standing on two strong legs: BPO Revenue and OF Remittance.Tourism potentially is the 3rd strong leg that can be developed in a very short time frame.
15
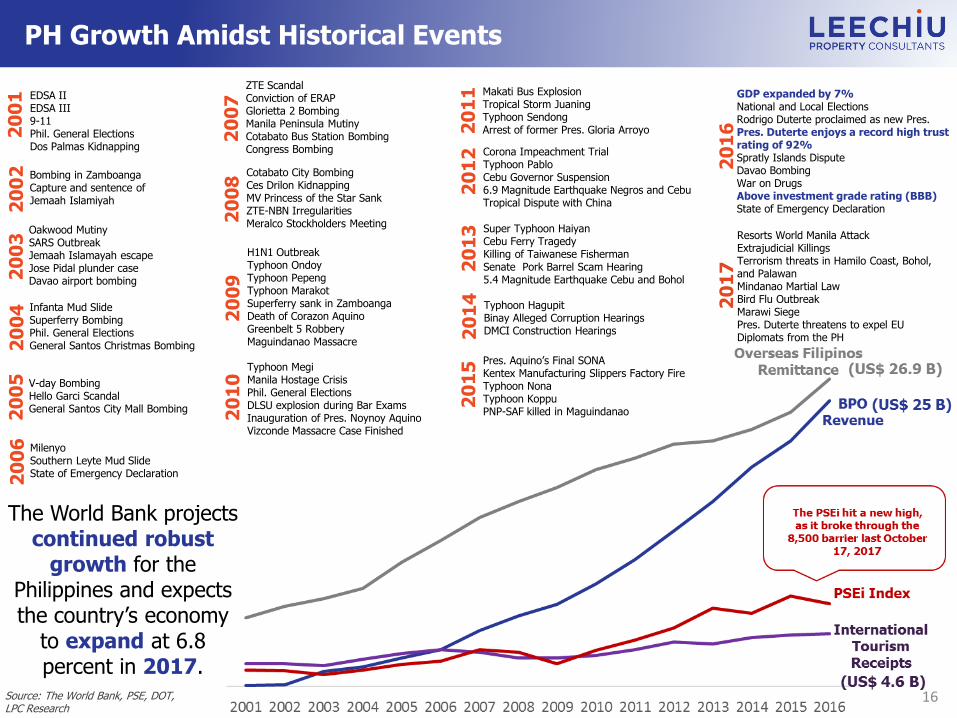
PH Growth Amidst Historical Events
Bombing in ZamboangaCapture and sentence ofJemaah Islamiyah2
00
2
EDSA IIEDSA III9-11Phil. General ElectionsDos Palmas Kidnapping
Oakwood MutinySARS OutbreakJemaah Islamayah escapeJose Pidal plunder caseDavao airport bombing2
00
3
Infanta Mud SlideSuperferry BombingPhil. General ElectionsGeneral Santos Christmas Bombing2
00
4
V-day BombingHello Garci ScandalGeneral Santos City Mall Bombing2
00
5
MilenyoSouthern Leyte Mud SlideState of Emergency Declaration2
00
6
ZTE ScandalConviction of ERAPGlorietta 2 BombingManila Peninsula MutinyCotabato Bus Station BombingCongress Bombing
20
07
Cotabato City BombingCes Drilon KidnappingMV Princess of the Star SankZTE-NBN IrregularitiesMeralco Stockholders Meeting2
00
8H1N1 OutbreakTyphoon OndoyTyphoon PepengTyphoon MarakotSuperferry sank in ZamboangaDeath of Corazon AquinoGreenbelt 5 RobberyMaguindanao Massacre
20
09
Typhoon MegiManila Hostage CrisisPhil. General ElectionsDLSU explosion during Bar ExamsInauguration of Pres. Noynoy AquinoVizconde Massacre Case Finished
20
10
Makati Bus ExplosionTropical Storm JuaningTyphoon SendongArrest of former Pres. Gloria Arroyo2
01
1
Corona Impeachment TrialTyphoon PabloCebu Governor Suspension6.9 Magnitude Earthquake Negros and CebuTropical Dispute with China
20
12
Super Typhoon HaiyanCebu Ferry TragedyKilling of Taiwanese FishermanSenate Pork Barrel Scam Hearing5.4 Magnitude Earthquake Cebu and Bohol
20
13
Typhoon HagupitBinay Alleged Corruption HearingsDMCI Construction Hearings2
01
4
Pres. Aquino’s Final SONAKentex Manufacturing Slippers Factory FireTyphoon NonaTyphoon KoppuPNP-SAF killed in Maguindanao
20
15
GDP expanded by 7%National and Local ElectionsRodrigo Duterte proclaimed as new Pres.Pres. Duterte enjoys a record high trust rating of 92%Spratly Islands DisputeDavao BombingWar on DrugsAbove investment grade rating (BBB)State of Emergency Declaration
20
1620
01
20
17
Resorts World Manila AttackExtrajudicial Killings Terrorism threats in Hamilo Coast, Bohol, and PalawanMindanao Martial LawBird Flu OutbreakMarawi SiegePres. Duterte threatens to expel EU Diplomats from the PH
Source: The World Bank, PSE, DOT, LPC Research
The World Bank projects continued robust
growth for the Philippines and expects the country’s economy
to expand at 6.8 percent in 2017.
16
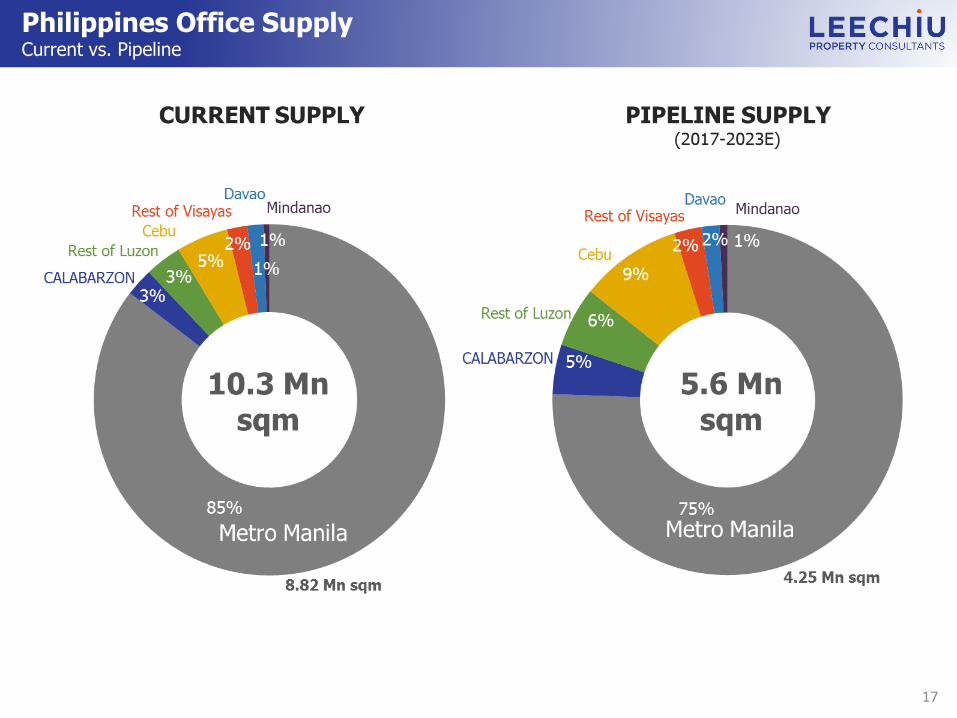
Philippines Office Supply Current vs. Pipeline
17

METRO MANILA OFFICE MARKET
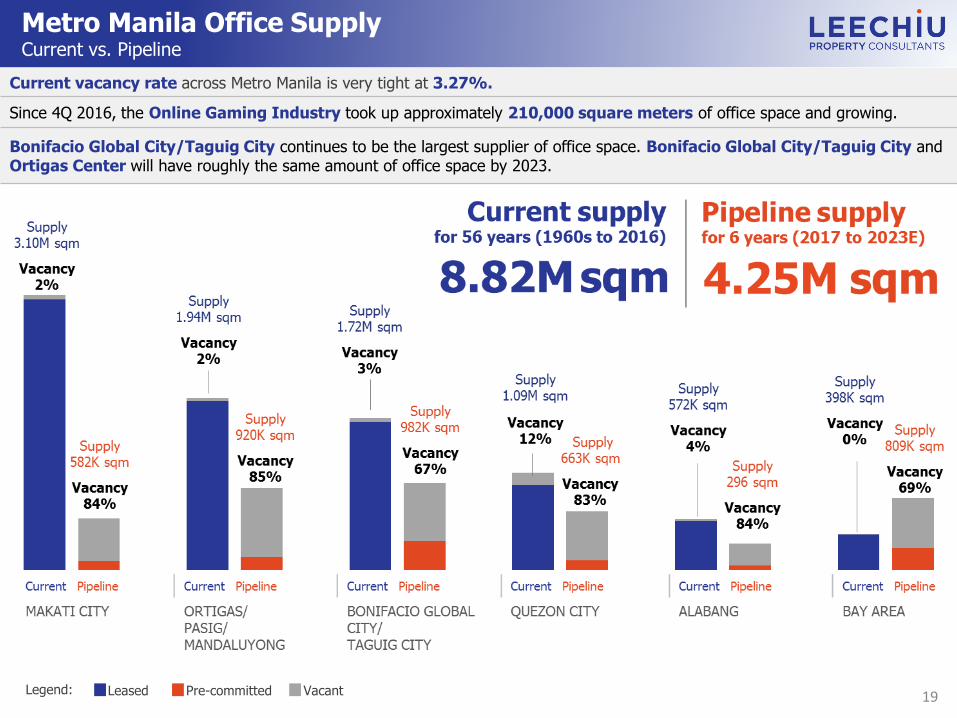
Metro Manila Office SupplyCurrent vs. Pipeline
Current vacancy rate across Metro Manila is very tight at 3.27%.
Since 4Q 2016, the Online Gaming Industry took up approximately 210,000 square meters of office space and growing.
Bonifacio Global City/Taguig City continues to be the largest supplier of office space. Bonifacio Global City/Taguig City and Ortigas Center will have roughly the same amount of office space by 2023.
Legend: Leased Pre-committed Vacant 19
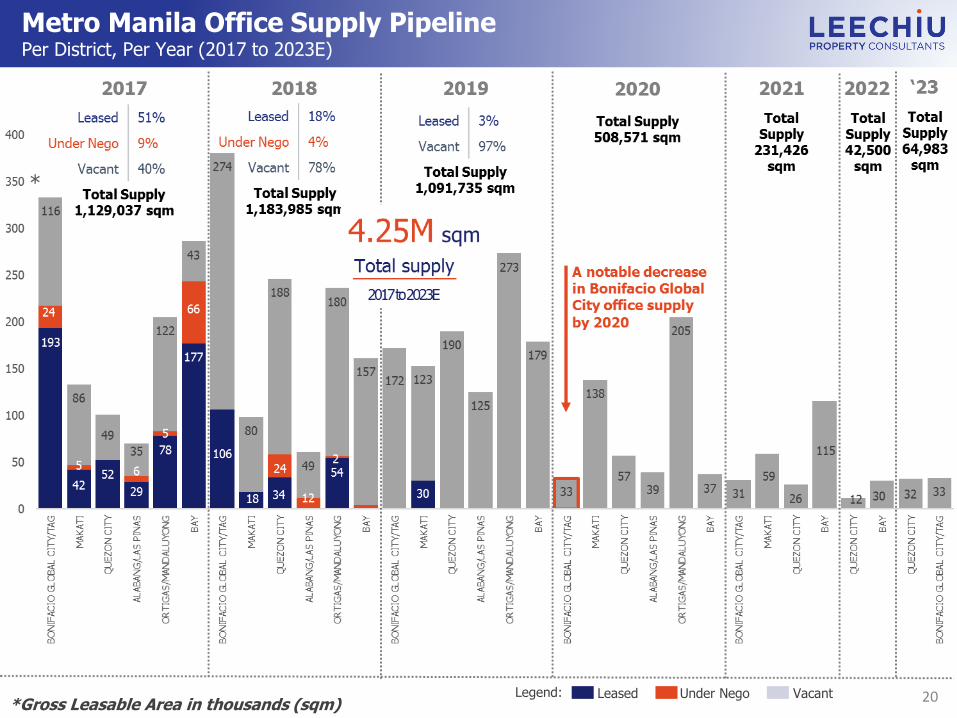
Metro Manila Office Supply PipelinePer District, Per Year (2017 to 2023E)
Legend: Leased Under Nego Vacant 20*Gross Leasable Area in thousands (sqm)

FY 2016 Supply and Demand
21*Gross Leasable Area in thousands (sqm)*Gross Leasable Area in thousands (sqm)
Legend: Leased Pre-committed Vacant
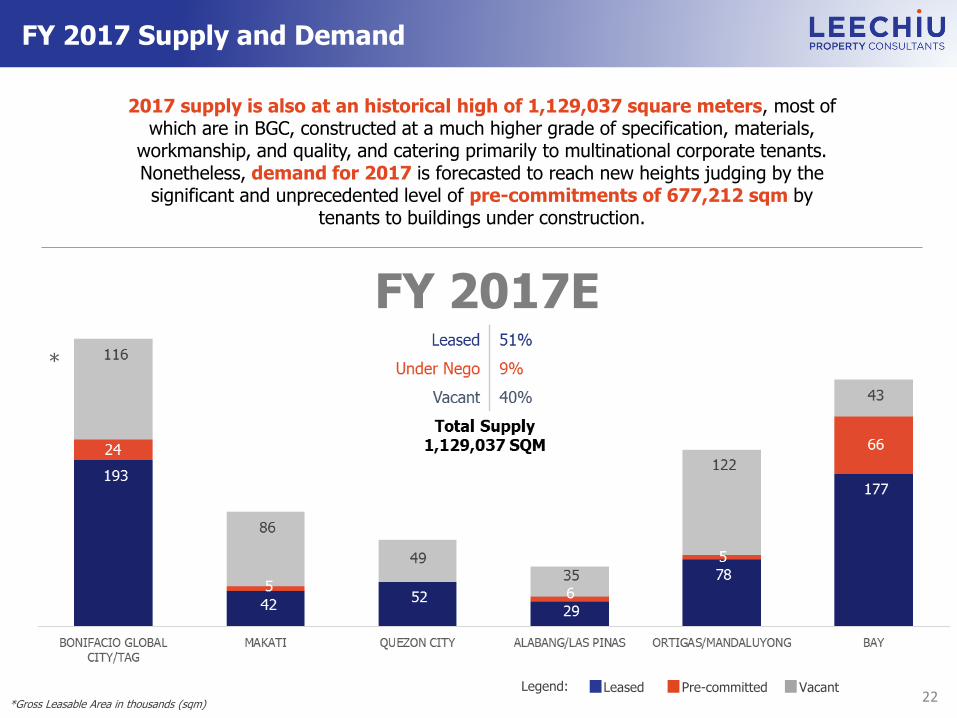
FY 2017 Supply and Demand
22*Gross Leasable Area in thousands (sqm)
FY 2017E
2017 supply is also at an historical high of 1,129,037 square meters, most of which are in BGC, constructed at a much higher grade of specification, materials,
workmanship, and quality, and catering primarily to multinational corporate tenants. Nonetheless, demand for 2017 is forecasted to reach new heights judging by the significant and unprecedented level of pre-commitments of 677,212 sqm by
tenants to buildings under construction.
Legend: Leased Pre-committed Vacant

Metro Manila - Demand ActivityFull Year 2016 and 2017
There is strong office take-up in 2017 despite softening of IT-BPM demand.
The Online Gaming Industry’s demand is rapidly growing to reflect half of the IT-BPM Industry’s demand for 2017.
Demand for Serviced Offices/Co-working Spaces increased significantly as some multinational companies seek to manage capital expenditure, increase work mobility, and take advantage of flexible lease terms.
23
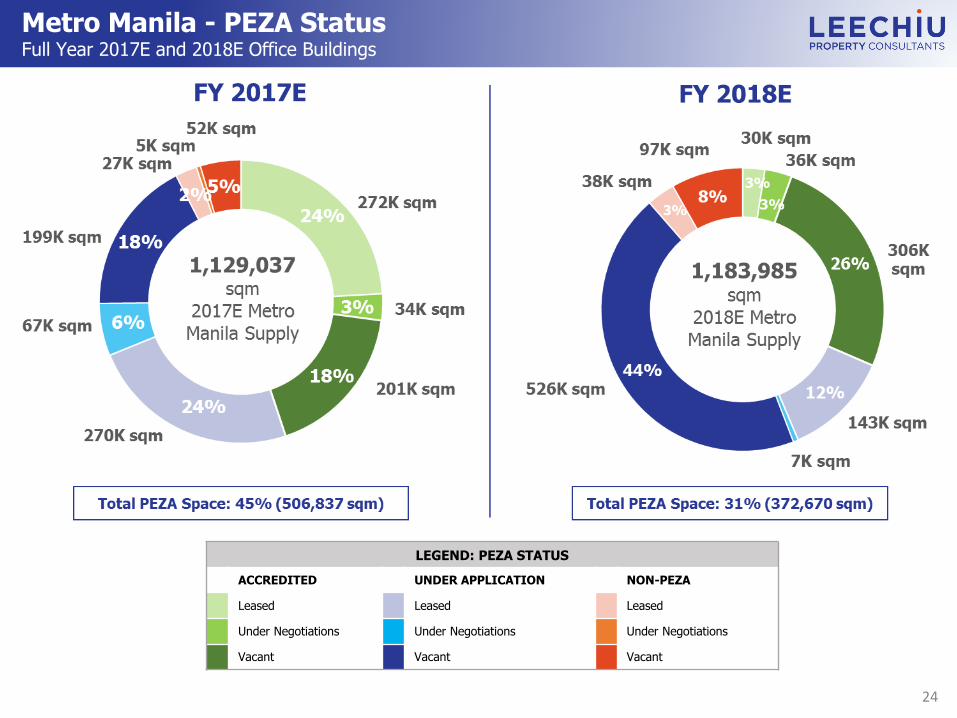
Metro Manila - PEZA StatusFull Year 2017E and 2018E Office Buildings
LEGEND: PEZA STATUS
ACCREDITED UNDER APPLICATION NON-PEZA
Leased Leased Leased
Under Negotiations Under Negotiations Under Negotiations
Vacant Vacant Vacant
24
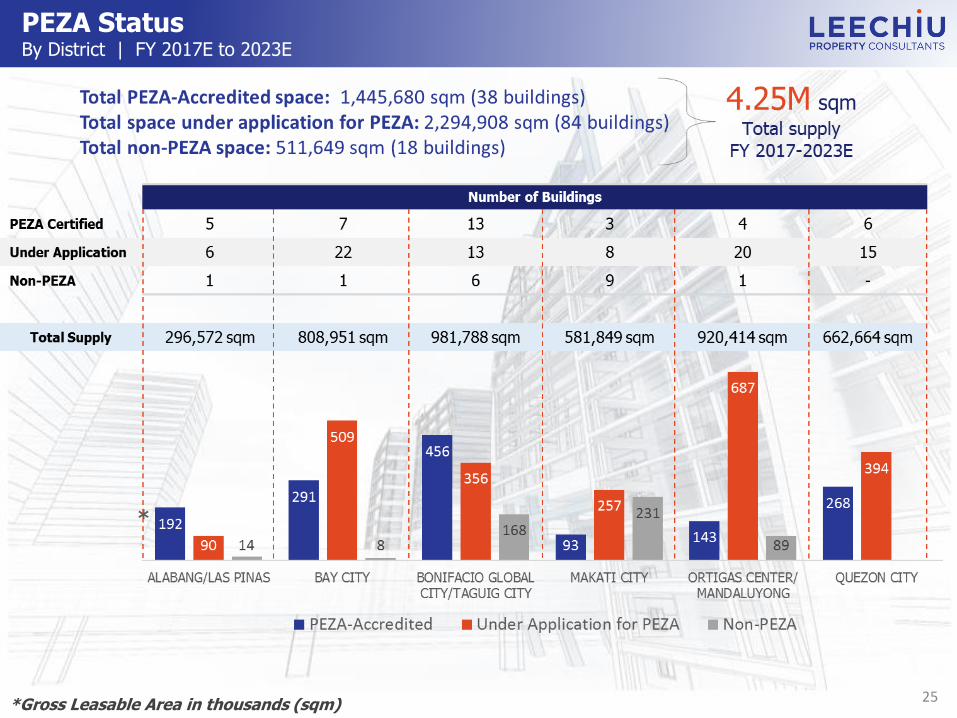
PEZA StatusBy District | FY 2017E to 2023E
25*Gross Leasable Area in thousands (sqm)

Metro Manila Current SupplyDeveloper Market Share (1960’s to 2016)
26

Metro Manila Supply PipelineDeveloper Market Share (2017 to 2023)
27

28
Metro Manila Rental RangePhP / sqm / month
29
Business District
*FAR Range
Land Values PhP/sqm
2016
Accommodation Value
GFA/sqm2016
Land ValuesPhP/sqm2017 YTD
Accommodation Value GFA/sqm
2017 YTD
Y-o-Y Increase
%(2016 vs.
2017 YTD)
Filinvest City
6 – 14 120K – 280K 20,000 144K – 365K 27,000 35%
Arca South 6 – 8 210K – 280K 35,000 250K – 280K 35,000 -
Bay City 6 198K 33,000 250K 41,666 26.26%
Bonifacio Global City
6 – 15 360K – 900K 60,000 * 480K – 1.2M * 80,000 33.33%
Makati City 6 - 16 300K – 800K 50,000 400K – 1M 62,500 25%
Ortigas N/A 200K – 350K N/A 250K – 400K N/A 15%
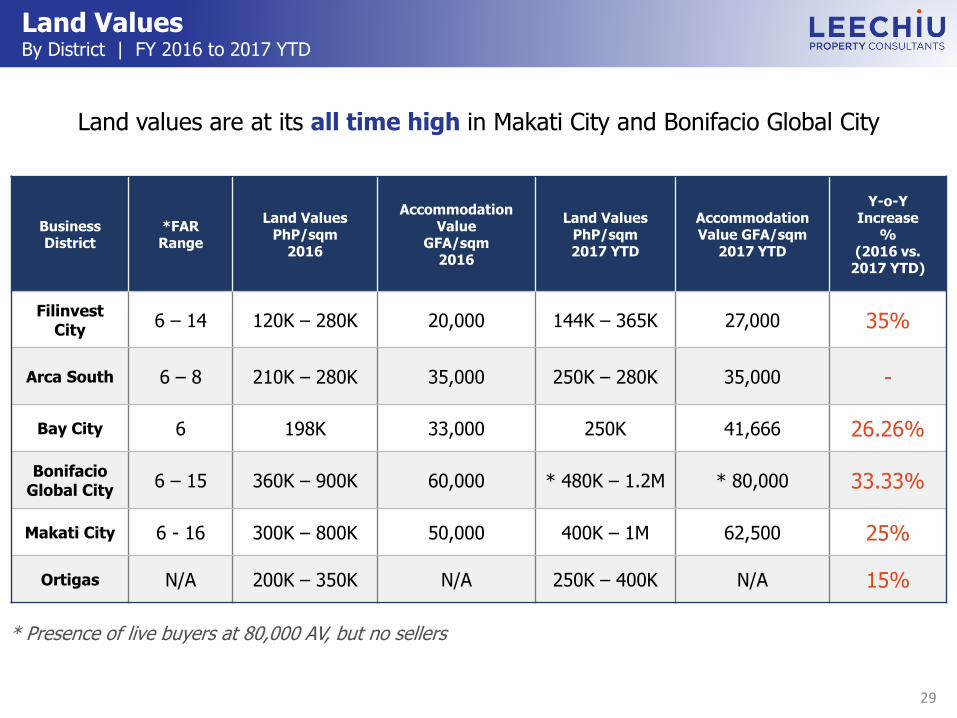
Land ValuesBy District | FY 2016 to 2017 YTD
* Presence of live buyers at 80,000 AV, but no sellers
Land values are at its all time high in Makati City and Bonifacio Global City

PROVINCIALOFFICE MARKET

Provincial Office Supply (2017-2021E)Luzon, Visayas, and Mindanao (excluding Metro Manila & Cebu)
The ever-growing IT-BPM industry significantly impacts acceleration of developments not just in Metro Manila, but all over the Philippines.
The efforts of the National Government to fund infrastructure projects positively impact cities nearby Metro Manila such as Cavite, Laguna, and Pampanga as these cities become more accessible.
Major developers are expanding nationwide such as Ayala, DoubleDragon, Megaworld, Profriends, Robinsons and SM.
Legend: Leased Under Nego Vacant
*Gross Leasable Area in thousands (sqm)31
32
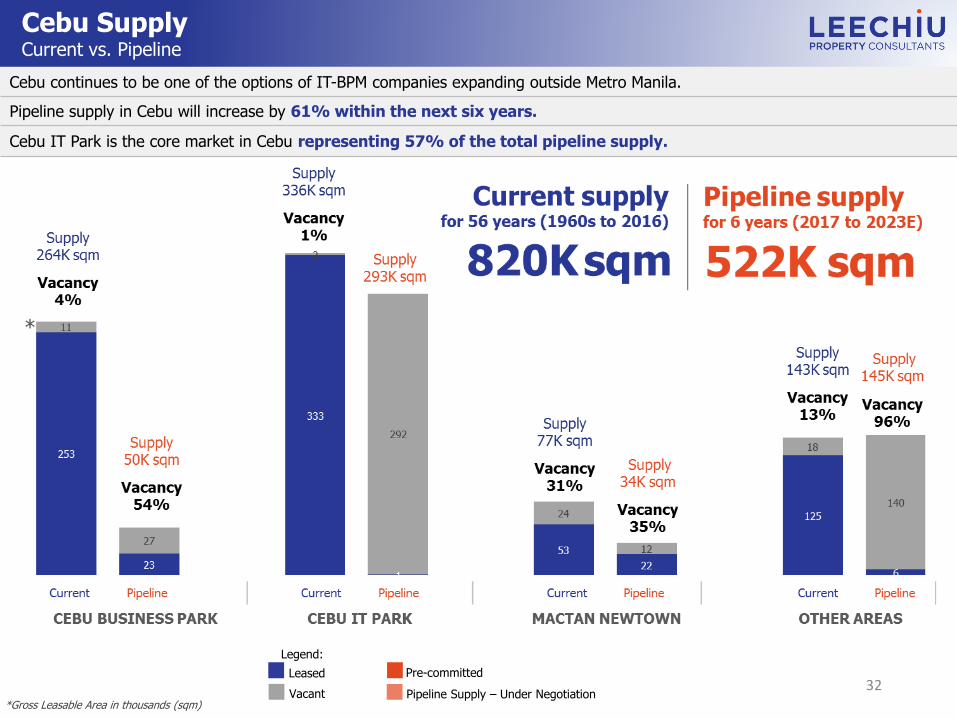
Cebu SupplyCurrent vs. Pipeline
Cebu continues to be one of the options of IT-BPM companies expanding outside Metro Manila.
Pipeline supply in Cebu will increase by 61% within the next six years.
Cebu IT Park is the core market in Cebu representing 57% of the total pipeline supply.
Legend:
Leased
Vacant
Pre-committed
Pipeline Supply – Under Negotiation*Gross Leasable Area in thousands (sqm)

Number of Buildings
PEZA Certified 24 43 10
Under Application 35 28 5
Total Supply 681,719 sqm 796,546 sqm 154,509 sqm
PEZA StatusProvincial (By Region)
170
282
81
681
786
154
Luzon Visayas Mindanao
PEZA-Accredited Under Application for PEZA
*PEZA Certified with Available Spaces **Count includes both dormant and active applicationsSource: PEZA (As of May 31, 2017)
Total PEZA-Accredited space: Approx. 533K sqm (78 buildings)Total space under application for PEZA: Approx. 1.64M sqm (67 buildings)
2.15M sqm
Total supply
33
*
*Gross Leasable Area in thousands (sqm)
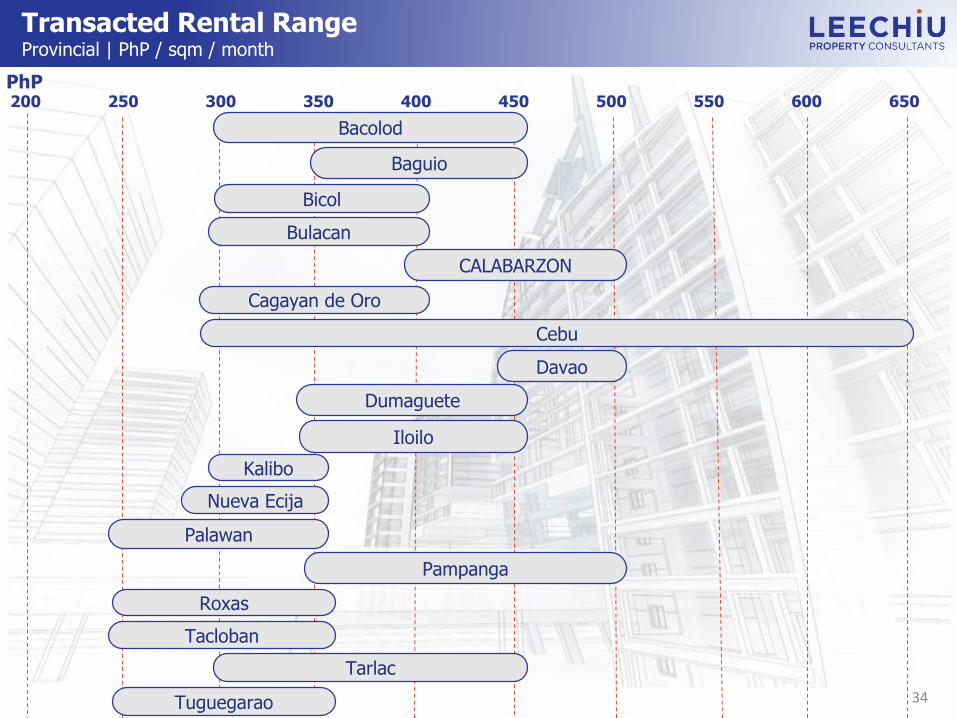
Transacted Rental RangeProvincial | PhP / sqm / month
200 250 300 350 400 450 500 550 600 650
Cebu
Pampanga
CALABARZON
Iloilo
Davao
Cagayan de Oro
Bulacan
Bicol
Bacolod
Baguio
Dumaguete
Tarlac
Kalibo
Nueva Ecija
34
PhP
Palawan
Tuguegarao
Tacloban
Roxas

Provincial Real Estate Top Picks for BPOsCurrent, 2017 and 2018
Source: Commission on Higher Education
LEGEND
Provincial options with none, one, or two BPO locators
Provincial options with exclusivity
Presence of 3+ BPO locators
*Calamba and Batangas City offers exclusivity
RE Options PEZA Graduates Population
Batangas1
(5,000 sqm)0
13,111(AY 2014-2015)
2,694,335
Bohol1
(5,000 sqm)0
7,586(AY 2014-2015)
1,313,560
Bulacan4
(31,039 sqm)2
(17,167 sqm)15,188
(AY 2014-2015)3,292,071
Cagayan3
(23,280 sqm)0
6.527(AY 2014-2015)
1,199,320
Cavite8
(73,074 sqm)6
(49,174 sqm)10,630
(AY 2014-2015)3,678,301
Cagayan De Oro7
(64,865 sqm)4
(23,300 sqm)7,799
(AY 2014-2015)1,564,459
Davao8
(89,289 sqm)6
(26,730 sqm)14,128
(AY 2014-2015)2,537,909
Kalibo/Aklan1
(5,000 sqm)0
3,707(AY 2014-2015)
574,823
Laguna6
(81,540 sqm)0
15,679(AY 2014-2015)
3,035,081
Leyte2
(10,000 sqm)0
10,094(AY 2014-2015)
1,966,768
Palawan3
(14,860 sqm)0
2,718(AY 2014-2015)
1,104,585
Rizal5
(15,300 sqm)1
(5,300 sqm)5.824
(AY 2014-2015)2,884,227
CAGAYAN
BULACAN
RIZAL
BATANGAS
CAVITELAGUNA
KALIBO/AKLAN
LEYTE
BOHOL
CAGAYAN DE ORO
PALAWAN
DAVAO
35
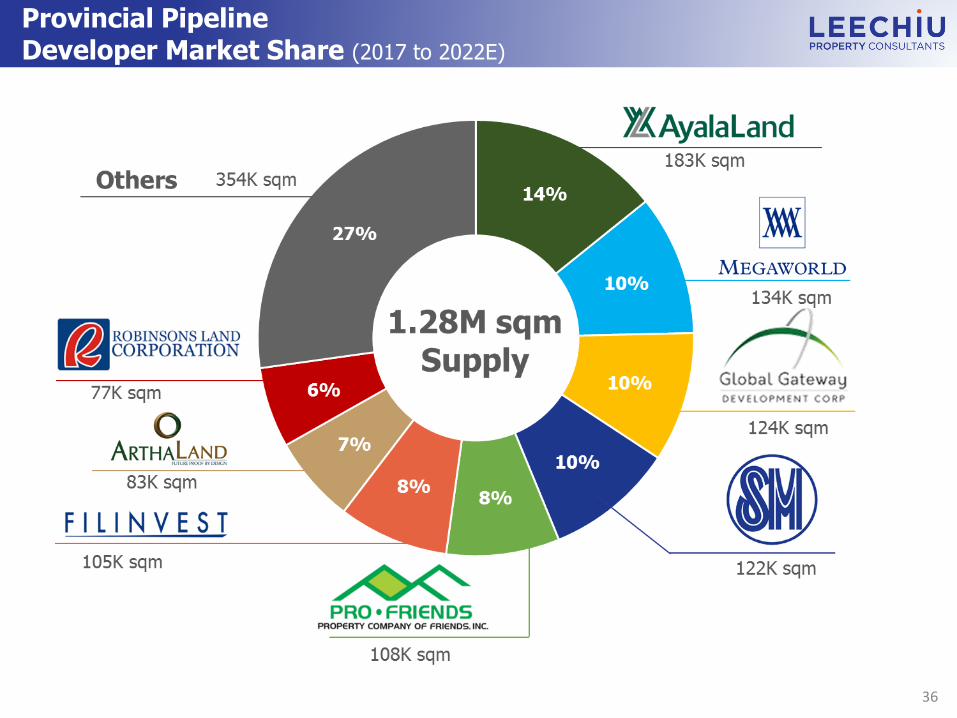
Provincial Pipeline Developer Market Share (2017 to 2022E)
36

RESIDENTIAL MARKET
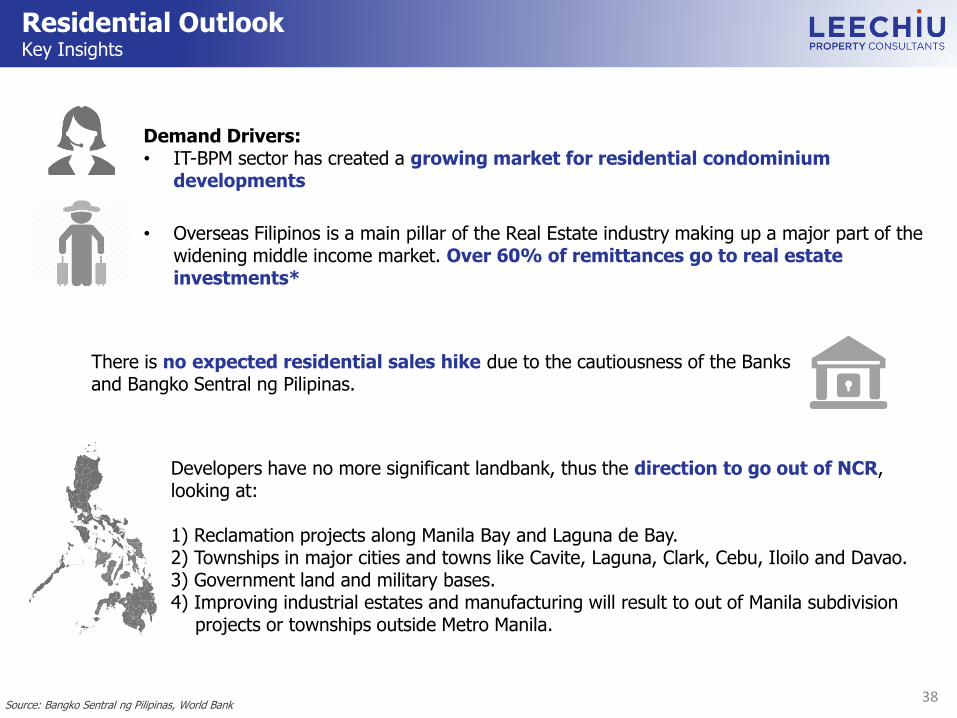
Residential OutlookKey Insights
Developers have no more significant landbank, thus the direction to go out of NCR, looking at:
1) Reclamation projects along Manila Bay and Laguna de Bay.2) Townships in major cities and towns like Cavite, Laguna, Clark, Cebu, Iloilo and Davao.3) Government land and military bases.4) Improving industrial estates and manufacturing will result to out of Manila subdivision
projects or townships outside Metro Manila.
Demand Drivers:• IT-BPM sector has created a growing market for residential condominium
developments
• Overseas Filipinos is a main pillar of the Real Estate industry making up a major part of the widening middle income market. Over 60% of remittances go to real estate investments*
There is no expected residential sales hike due to the cautiousness of the Banks and Bangko Sentral ng Pilipinas.
Source: Bangko Sentral ng Pilipinas, World Bank38

Residential Demand Driver
2016 OF Remittances has seen a growth of 5% y-o-y or US$26.8Bn from 2015’s US$25.6Bn.60% of remittances is being invested into the real estate sector
As interest rates collapse, more residential condominium units are being introduced to the market and more money from OF remittances are channeled into real estate.
Source: Bangko Sentral ng Pilipinas, LPC Research39
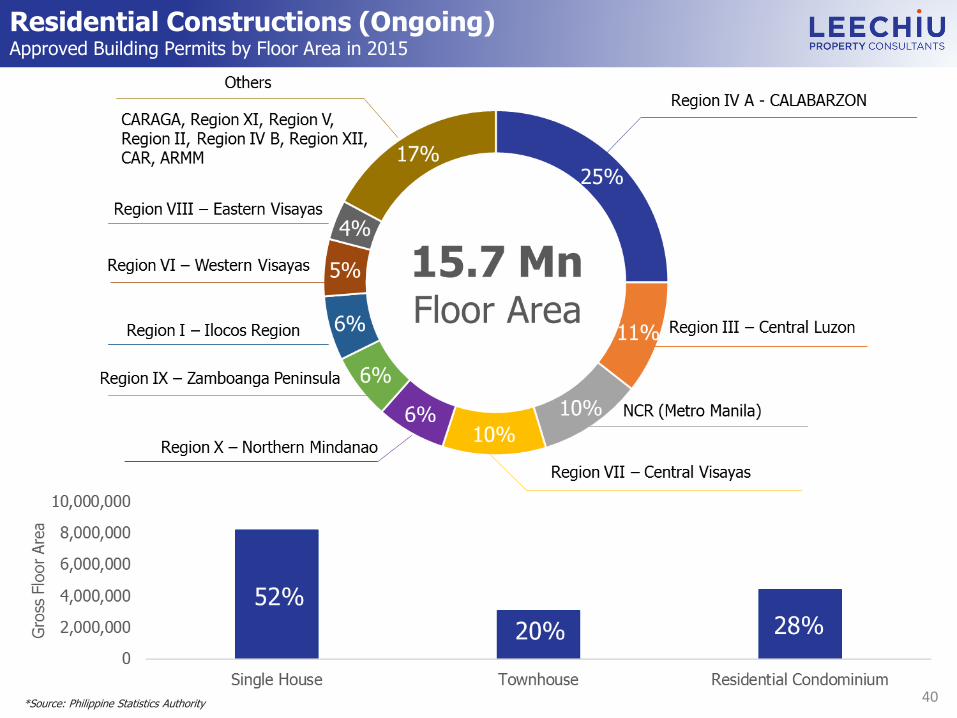
Residential Constructions (Ongoing)Approved Building Permits by Floor Area in 2015
*Source: Philippine Statistics Authority40

Residential Constructions vs OFW DeploymentApproved Building Permits by Floor Area in 2015
41

Residential Supply2016 NCR Approved Licenses to Sell
Source: Housing and Land Use Regulatory Board42

Residential Condominium SupplyCombined Preselling and RFO units in Metro Manila (1992 to 1Q 2017)

44
Residential Condominium SupplyBy Selected Major Developers (2010-2016)
*Package Price based on most saleable unit type per development (Mostly Studio -2BR with sizes ranging from 22-62 sqm)*VAT Inclusive
Source: LPC Research
45
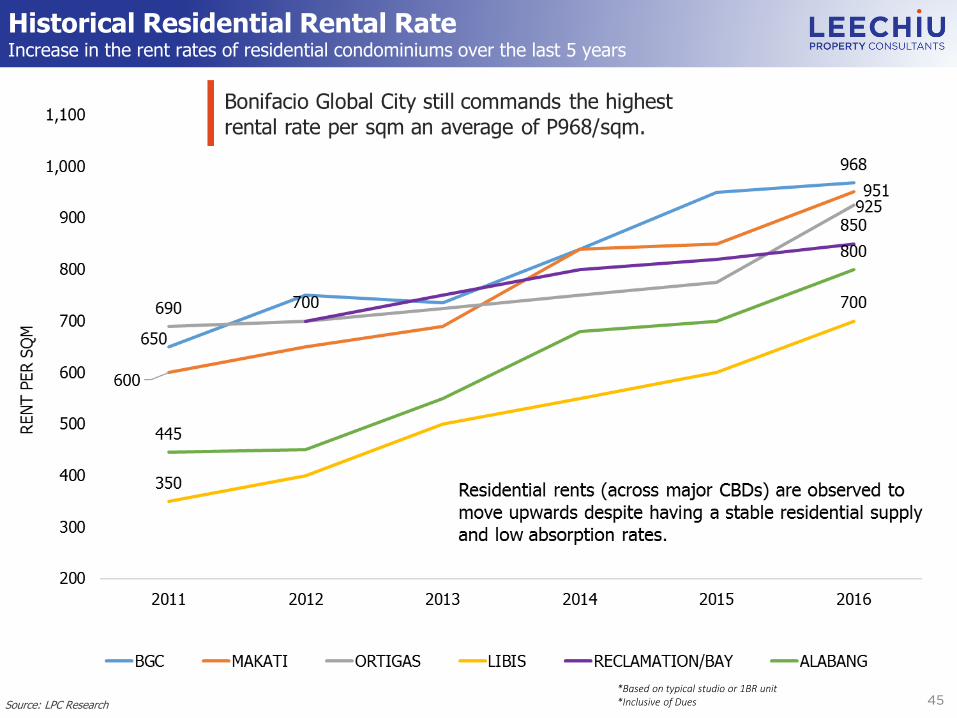
Historical Residential Rental RateIncrease in the rent rates of residential condominiums over the last 5 years
*Based on typical studio or 1BR unit*Inclusive of DuesSource: LPC Research

Residential Historical Land ValuesHigh-End Residential Villages (2010 to 2Q2017)
Source: LPC Research46

PHILIPPINE TOURISMAnd Other Global Trends

48
FY 2016 International Tourist ArrivalsAsia Pacific
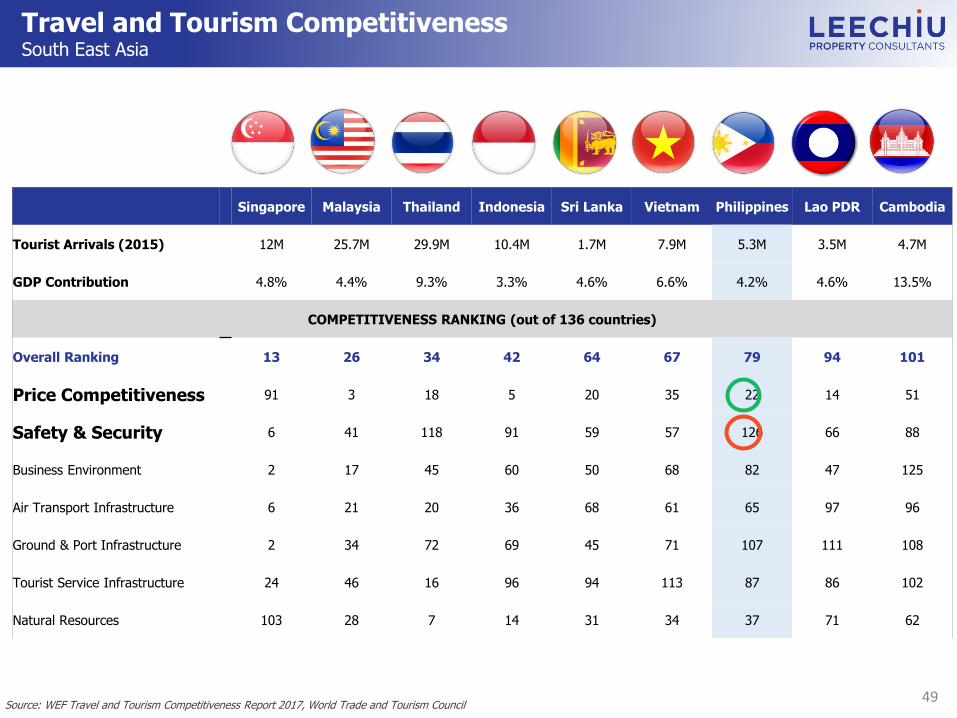
Travel and Tourism CompetitivenessSouth East Asia
Singapore Malaysia Thailand Indonesia Sri Lanka Vietnam Philippines Lao PDR Cambodia
Tourist Arrivals (2015) 12M 25.7M 29.9M 10.4M 1.7M 7.9M 5.3M 3.5M 4.7M
GDP Contribution 4.8% 4.4% 9.3% 3.3% 4.6% 6.6% 4.2% 4.6% 13.5%
COMPETITIVENESS RANKING (out of 136 countries)
Overall Ranking 13 26 34 42 64 67 79 94 101
Price Competitiveness 91 3 18 5 20 35 22 14 51
Safety & Security 6 41 118 91 59 57 126 66 88
Business Environment 2 17 45 60 50 68 82 47 125
Air Transport Infrastructure 6 21 20 36 68 61 65 97 96
Ground & Port Infrastructure 2 34 72 69 45 71 107 111 108
Tourist Service Infrastructure 24 46 16 96 94 113 87 86 102
Natural Resources 103 28 7 14 31 34 37 71 62
Source: WEF Travel and Tourism Competitiveness Report 2017, World Trade and Tourism Council49
50
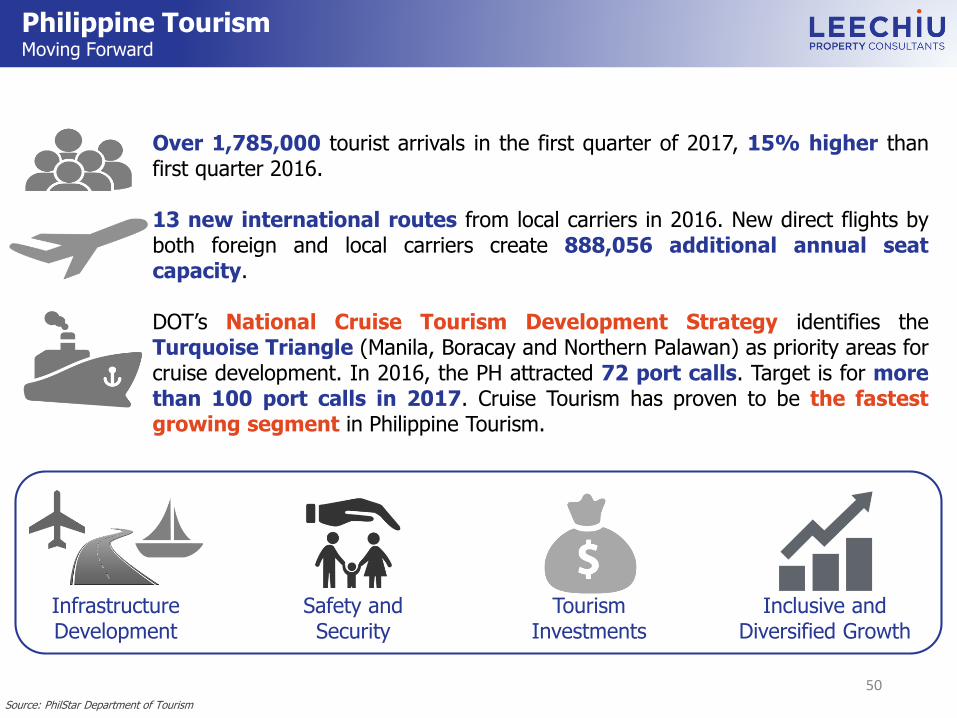
Over 1,785,000 tourist arrivals in the first quarter of 2017, 15% higher thanfirst quarter 2016.
13 new international routes from local carriers in 2016. New direct flights byboth foreign and local carriers create 888,056 additional annual seatcapacity.
DOT’s National Cruise Tourism Development Strategy identifies theTurquoise Triangle (Manila, Boracay and Northern Palawan) as priority areas forcruise development. In 2016, the PH attracted 72 port calls. Target is for morethan 100 port calls in 2017. Cruise Tourism has proven to be the fastestgrowing segment in Philippine Tourism.
Infrastructure Development
Safety and Security
Tourism Investments
Inclusive and Diversified Growth
Philippine TourismMoving Forward
Source: PhilStar Department of Tourism

Philippine AirportsPipeline
San Vicente Airport
Kalibo International Airport
El Nido Airport
Puerto Princesa International Airport
2017
San Fernando Airport (PLANNING)
Clark International Airport (BIDDING)
Ninoy Aquino International Airport (PLANNING)
Coron Airport (PLANNING)
Mactan – Cebu International Airport
Bicol International Airport
Caticlan International Airport
Sangley Point International Airport (BIDDING)
RECENTLY COMPLETED
EXPANSION/REDEVELOPMENT
AIRPORTS TO BE BUILT
EXPANSIONPassenger Capacity:
8.8 M – 24 MArea: 37, 000 sqm –
82,000 sqm
LEGEND :
Source: Department of Tourism
2018
2019
~ 2025
51
The boost in Philippine tourism necessitates more
runways and airport to meet the demand in different
destinations in the country.

Philippine Tourist ArrivalsTop 5 Markets

Airports in the Philippines2016 Passenger Count
Average Number ofDaily
Flight Arrivals (2011)
Average Number ofDaily
Flight Arrivals (2016)
Annual Passenger Footprint(Inbound
and Outbound)
Growth inPassengerFootprint
(2011 to 2016)
Metro Manila350 flights daily
(100 are Int’l flights)650 flights daily
(182 are Int’l flights) 39.5 Million (2016)31.5 Million (2011)
25%
Cebu City84 flights daily
(25 are Int’l flights)170 flights daily
(38 are Int’l flights)8.8 Million (2016)6.2 Million (2011)
42%
Davao City15 flights daily (1 is Int’l flight)
54 flights daily(5 are Int’l flights)
3.5 Million (2016)2.6 Million (2011)
35%
Kalibo11 flights daily
(5 are Int’l flights)43 flights daily
(8 are Int’l flights)2.7 Million (2016)1.3 Million (2011)
108%
Iloilo 14 flights daily33 flights daily(1 is Int’l flight)
1.9 Million (2016)1.7 Million (2011)
12%
Cagayan de Oro 9 flights daily 27 flights daily1.7 Million (2016)1.4 Million (2011)
21%
Puerto Princesa 6 flights daily 21 flights daily1.6 Million (2016)
988K (2011)62%
Bacolod 10 flights daily 24 flights daily1.4 Million (2016)1.3 Million (2011)
8%
Tacloban 10 flights daily 17 flights daily1.1 M (2016)
1 Million (2011)10%
Zamboanga 6 flights daily 16 flights daily980 K (2016)804K (2011)
22%
Clark5 flights daily
(2 are Int’l flights)23 flights daily
(16 are Int’l flights)950 K (2016)767K (2011)
24%
Source: Civil Aviation Authority of the Philippines, ourairports.com, NSCB statistics, Civil Aeronautics Board
Significant growthin passenger traffic from 2011 to 2016.
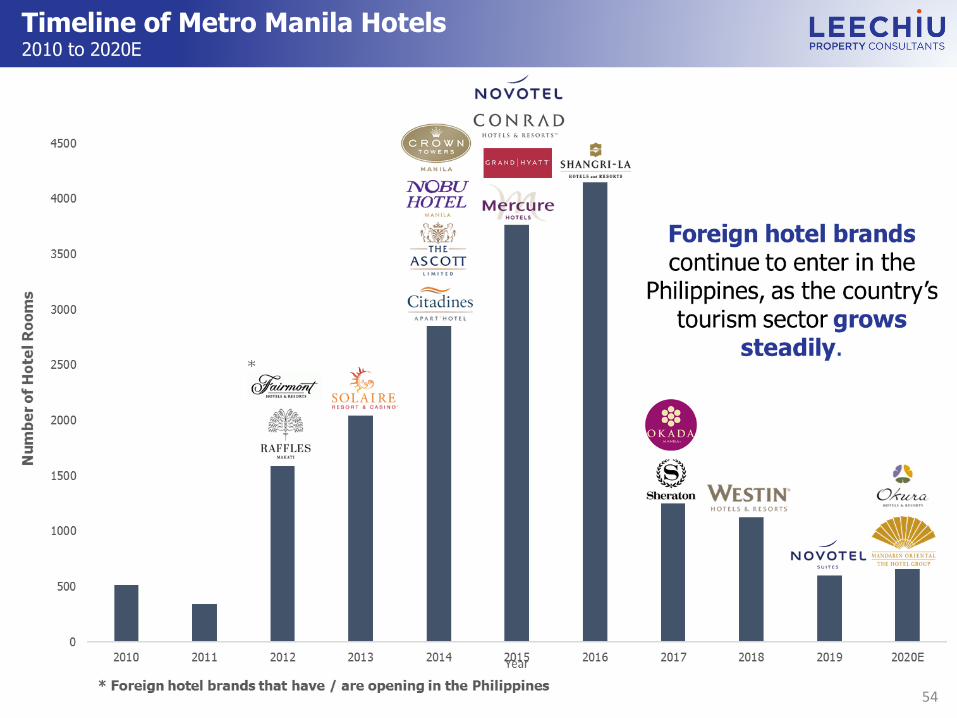
Timeline of Metro Manila Hotels2010 to 2020E
54

Artificial Intelligence
50% chance that
computers could reach human-level intelligence as soon
as 2050 - just 35
years away
Automation would erase
22.7 million US jobs by 2025
By 2018, global sales of industrial robots will grow an average y-o-y by 15% - units sold
will double to around 400,000
units
Global Robotics Market is expected to
reach USD 82.7 billion by 2020
Machine-human parity may reach a
1:1 ratio by
2040
Asia was the
biggest robot market (139,000
units) in 2014, 41% higher than in 2013
Tech Companies spent USD 8.5 billion last 2015 on artificial intelligence, four times more than in
2010
Worldwide market value for robot
systems in 2014 is
estimated to be USD 32 billion
55

AboutLEECHIU PROPERTY
CONSULTANTS

MISSIONTo deliver superior value and profitable real estate solutions for like-minded partners through local, dynamic & insightful property-related
expertise in corporate leasing and investments.
To be the advisor of choice who provides the most strategic and outstanding property-related advice, solutions and services to our
customers. Our company values unity, integrity and passion for excellence.
VISION
Together, our firm, redefines the real estate industry by being a catalyst of sustainable growth, through principled and expert property consulting
advice and action.

The Philippines’ deepest bench of
seasoned real estate advisors & brokers
ProjectLeasing
OccupierSolutions
IT-BPM SiteSelection
InvestmentSales
Our Services
Research &Consultancy

Occupier Solutions
Occupier Solutions transactions to date
Closed Deals Live Deals
525,000 SQM 400,000 SQM
Our Clients
IT-BPM SiteSelection Clients

Project Leasing
BGC. Citibank Plaza. Ecoprime. Menarco Tower. Net Park. Milestone at Fifth Avenue.
Orē Central. The Curve. Twenty-five Seven McKinley. W CityCenter. W Fifth Avenue. W Global Center. W Office at High Street. High Street South Corporate Plaza I. One Park Drive.
The Finance Centre Retail. G.S.C Corporate Tower. Asian Century Center
QUEZON CITY. Hexagon Corporate Center. One Luna Global Connections.
Panorama Technocenter. The SkySuites Towers. Jackman Plaza I.T. Center
ALABANG. Asian Star Building. One Griffinstone Building
MAKATI CITY. Frabelle Corporate Plaza. Liberty Plaza. M1 Tower. MJ Corporate Plaza. Nex Tower.
ORTIGAS. St. Francis Square. Ortigas Technopoint Two
BAY AREA. DoubleDragon Plaza. Nexgen Tower.
CAVITE. Suntech iPark.
CEBU. Latitude Corporate Center. Mabuhay Tower.
We also advise and support landlords, building owners and real estate developers. Our leasing experts
create and implement strategies for finding the right tenant mix and ensure maximum occupancy in a
timely manner. Our real estate brokers have managed to lease more than thirty office buildings in Metro
Manila on behalf of developers.
Currently marketing 39 projectsTotal of 842,300 sqm
Looking to exclusively handle more project leasing appointmentsacross the Philippines in 2017
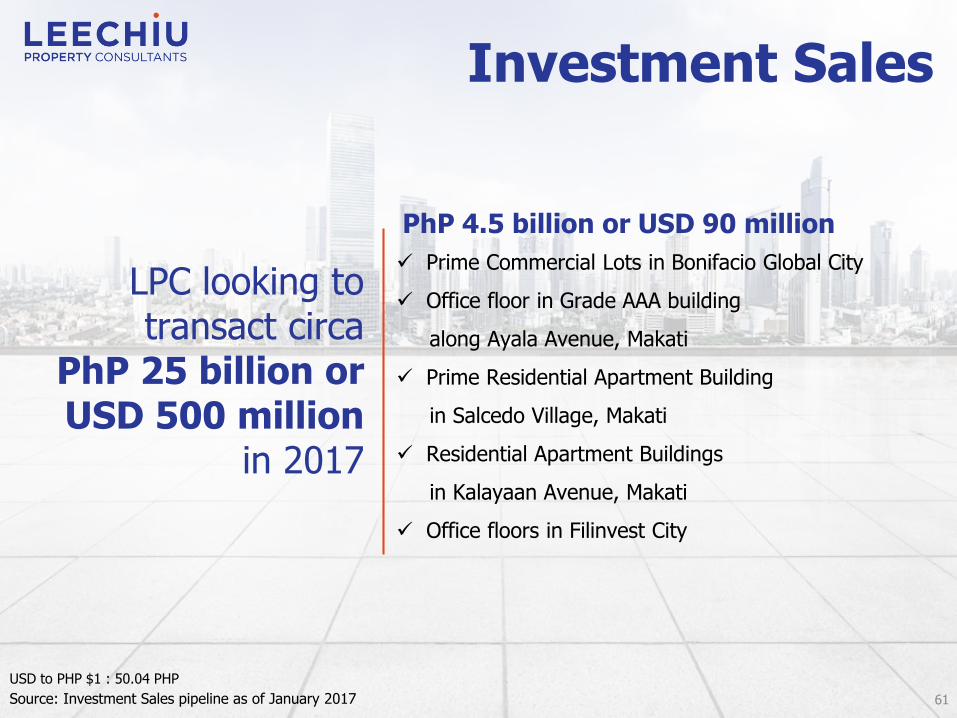
LPC looking to transact circa
PhP 25 billion or USD 500 million
in 2017
Investment Sales
PhP 4.5 billion or USD 90 million
✓ Prime Commercial Lots in Bonifacio Global City
✓ Office floor in Grade AAA building
along Ayala Avenue, Makati
✓ Prime Residential Apartment Building
in Salcedo Village, Makati
✓ Residential Apartment Buildings
in Kalayaan Avenue, Makati
✓ Office floors in Filinvest City
USD to PHP $1 : 50.04 PHP
61Source: Investment Sales pipeline as of January 2017

Research and Consultancy
Our research and consultancy arm allows us to offer to clients a full suite of consulting services
that include business planning, highest and best use studies, market research, project
conceptualization, and project feasibility.
Completed Projects – Highest and Best Use Study
Project Cost of PhP 75.1 billion
or USD 1.5 billion
USD to PHP $1 :50 PHP
Central Business District:
Taguig and Muntinlupa
Mixed Use developments:
Lakewood City Cabanatuan
Batulao, Woodlands Batangas
Hacienda Looc, Batangas
Pueblo de Panay, Roxas City
Dumaguete Business Park

CBRE Strategic Alliance with Leechiu Property Consultants
Source: CBRE Website

Real Estate Options
DISCLAIMER:1. This Leasing Material has been prepared in good faith and with due care by LPC solely for the information of potential lessees to assist them in deciding whether they are interested in the premises offered for lease.2. The information does not form part of any offer or contract and is intended as a guide only3. You should not rely on any material contained in this Leasing Material but should make independent investigations to satisfy yourselves as to the correctness and relevance of any statements or representations, and consult with legal, financial and tax advisers where appropriate.4. All calculations including, but not limited to dimensions, area and rent, contained in the Leasing Material are based on figures provided to the client by outside sources and have not been independently verified by LPC and therefore may not be correct, complete, or relevant5. No representation or warranty is made by LPC as to the accuracy or completeness of the Leasing Material, in whole or in part. No liability for negligence or otherwise is assumed by LPC or the lessor of this property for any information contained in the Leasing Material6. All Dollar ($) amounts quoted, if any, do not include any goods and services tax, value added tax, consumption tax or similar tax unless specifically stated in writing7. Except as expressly indicated herein, LPC does not undertake any obligation to advise you of any changes or updates with respect to the information contained herein
Our Insights. Your Success.
Related Documents