For updated information, please visit www.ibef.org April 2019 REAL ESTATE

Welcome message from author
This document is posted to help you gain knowledge. Please leave a comment to let me know what you think about it! Share it to your friends and learn new things together.
Transcript
For updated information, please visit www.ibef.org April 2019
REAL ESTATE

Table of Content
Executive Summary……………….….….….3
Advantage India…………………..….….......4
Market Overview and Trends ………..…….6
Strategies Adopted ………….……....…….15
Growth Drivers ..……………….…..............17
Opportunities ..….……….........………….…24
Key Industry Organizations ..…….…….….28
Useful Information ..…….......…………..….30
For updated information, please visit www.ibef.orgReal Estate3
EXECUTIVE SUMMARY
Source: Ministry of Tourism, KPMG, World Bank, Census 2011, EY – India’s Growth Paradigm 2017, Credai-JLL report, 1United Nations World Urbanization Prospects 2018, CBRE
Notes: E – estimated; 1includes construction development and construction activities , P – Projected
Urban Population in India1 (million)
429 461 483543
0
200
400
600
2015 2018E 2020F 2025F
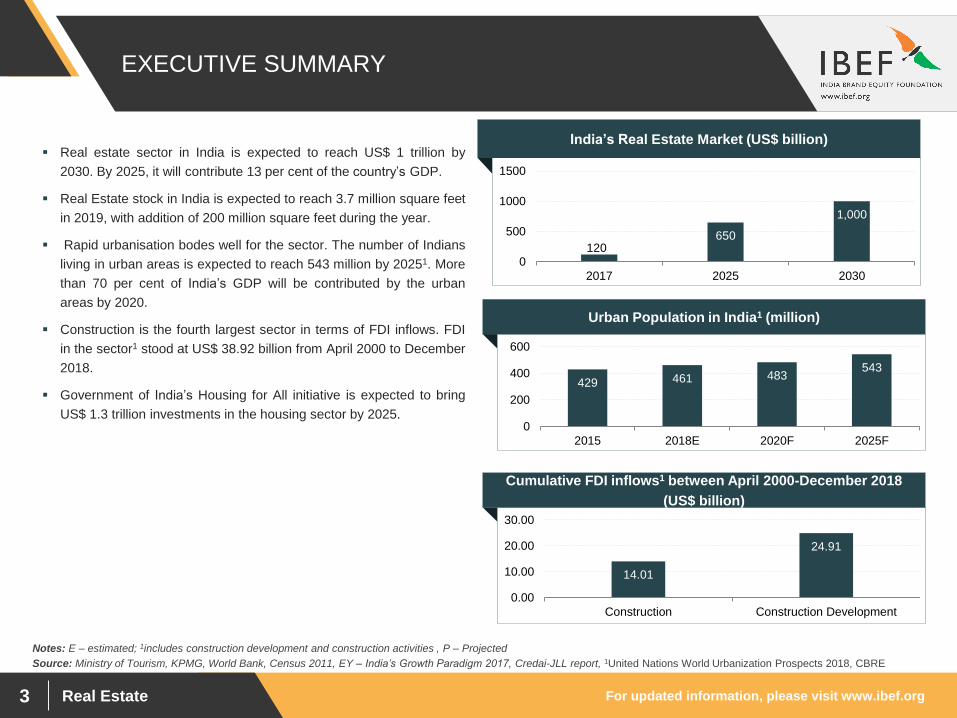
Real estate sector in India is expected to reach US$ 1 trillion by
2030. By 2025, it will contribute 13 per cent of the country’s GDP.
Real Estate stock in India is expected to reach 3.7 million square feet
in 2019, with addition of 200 million square feet during the year.
Rapid urbanisation bodes well for the sector. The number of Indians
living in urban areas is expected to reach 543 million by 20251. More
than 70 per cent of India’s GDP will be contributed by the urban
areas by 2020.
Construction is the fourth largest sector in terms of FDI inflows. FDI
in the sector1 stood at US$ 38.92 billion from April 2000 to December
2018.
Government of India’s Housing for All initiative is expected to bring
US$ 1.3 trillion investments in the housing sector by 2025.
Cumulative FDI inflows1 between April 2000-December 2018
(US$ billion)
14.01
24.91
0.00
10.00
20.00
30.00
Construction Construction Development
India’s Real Estate Market (US$ billion)
120650
1,000
0
500
1000
1500
2017 2025 2030

Real Estate
ADVANTAGE INDIA
For updated information, please visit www.ibef.orgReal Estate5
ADVANTAGE INDIA
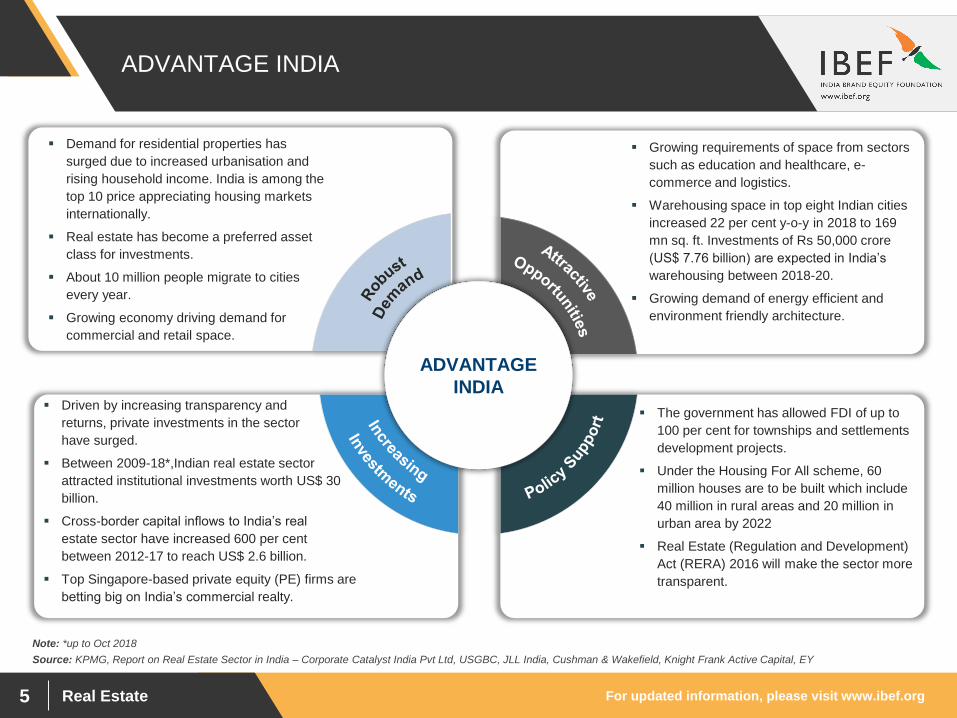
Demand for residential properties has
surged due to increased urbanisation and
rising household income. India is among the
top 10 price appreciating housing markets
internationally.
Real estate has become a preferred asset
class for investments.
About 10 million people migrate to cities
every year.
Growing economy driving demand for
commercial and retail space.
Growing requirements of space from sectors
such as education and healthcare, e-
commerce and logistics.
Warehousing space in top eight Indian cities
increased 22 per cent y-o-y in 2018 to 169
mn sq. ft. Investments of Rs 50,000 crore
(US$ 7.76 billion) are expected in India’s
warehousing between 2018-20.
Growing demand of energy efficient and
environment friendly architecture.
Driven by increasing transparency and
returns, private investments in the sector
have surged.
Between 2009-18*,Indian real estate sector
attracted institutional investments worth US$ 30
billion.
Cross-border capital inflows to India’s real
estate sector have increased 600 per cent
between 2012-17 to reach US$ 2.6 billion.
Top Singapore-based private equity (PE) firms are
betting big on India’s commercial realty.
The government has allowed FDI of up to
100 per cent for townships and settlements
development projects.
Under the Housing For All scheme, 60
million houses are to be built which include
40 million in rural areas and 20 million in
urban area by 2022
Real Estate (Regulation and Development)
Act (RERA) 2016 will make the sector more
transparent.
ADVANTAGE
INDIA
Source: KPMG, Report on Real Estate Sector in India – Corporate Catalyst India Pvt Ltd, USGBC, JLL India, Cushman & Wakefield, Knight Frank Active Capital, EY
Note: *up to Oct 2018

Real Estate
MARKET OVERVIEW
AND TRENDS
For updated information, please visit www.ibef.orgReal Estate7
… WITH SIGNIFICANT ROOM FOR FURTHER GROWTH
15
.1
18
.4
19
.3 20
.5 21
.7
18
.78
10
34
.134
30
.1
26
.7
26
19
.7
14
.8
NA NA0
5
10
15
20
25
30
35
40
2001 2005 2008 2010 2014 2015 2017* 2022E
Urban Rural
Urban-rural housing shortage (million)
Notes: : E – Estimates, * As of November 2017 , 1 till December 08, 2017
Source: : Ministry of Housing and Urban Poverty Alleviation, RBI, CRISIL
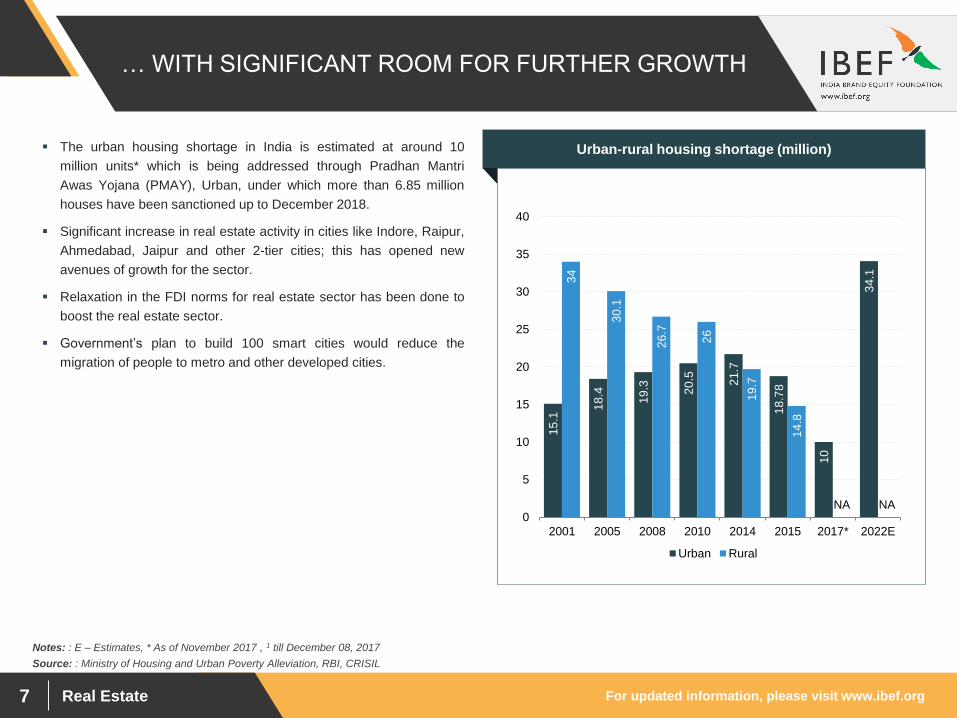
The urban housing shortage in India is estimated at around 10
million units* which is being addressed through Pradhan Mantri
Awas Yojana (PMAY), Urban, under which more than 6.85 million
houses have been sanctioned up to December 2018.
Significant increase in real estate activity in cities like Indore, Raipur,
Ahmedabad, Jaipur and other 2-tier cities; this has opened new
avenues of growth for the sector.
Relaxation in the FDI norms for real estate sector has been done to
boost the real estate sector.
Government’s plan to build 100 smart cities would reduce the
migration of people to metro and other developed cities.
For updated information, please visit www.ibef.orgReal Estate8
SEGMENTS IN THE INDIAN REAL ESTATE SECTOR
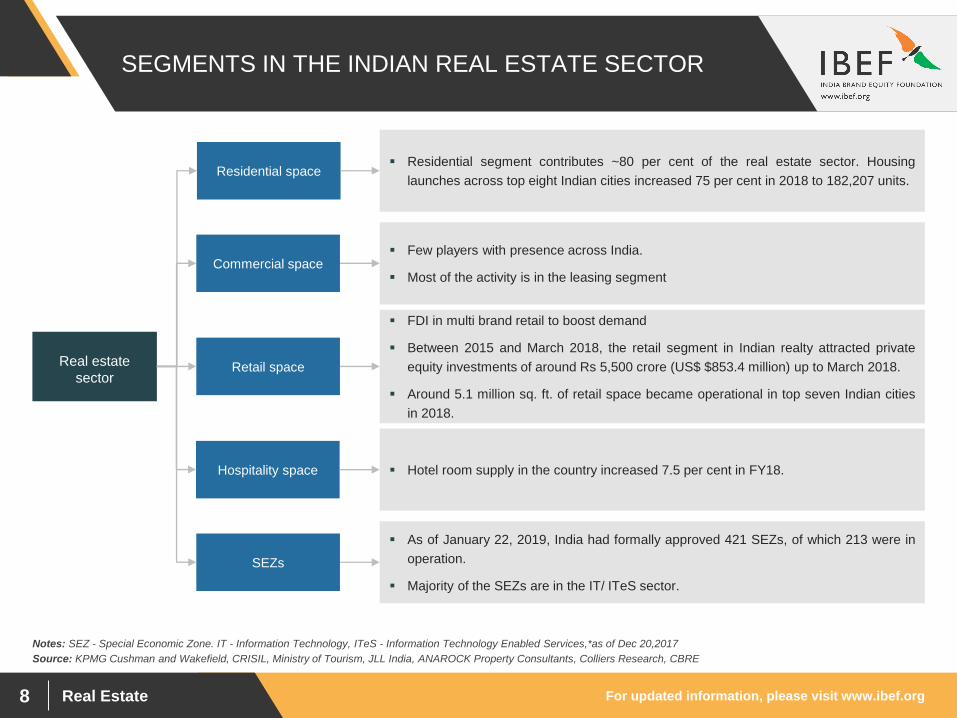
Residential segment contributes ~80 per cent of the real estate sector. Housing
launches across top eight Indian cities increased 75 per cent in 2018 to 182,207 units.
Real estate
sector
Few players with presence across India.
Most of the activity is in the leasing segment
FDI in multi brand retail to boost demand
Between 2015 and March 2018, the retail segment in Indian realty attracted private
equity investments of around Rs 5,500 crore (US$ $853.4 million) up to March 2018.
Around 5.1 million sq. ft. of retail space became operational in top seven Indian cities
in 2018.
Hotel room supply in the country increased 7.5 per cent in FY18.
Commercial space
Retail space
Hospitality space
SEZs
Residential space
As of January 22, 2019, India had formally approved 421 SEZs, of which 213 were in
operation.
Majority of the SEZs are in the IT/ ITeS sector.
Notes: SEZ - Special Economic Zone. IT - Information Technology, ITeS - Information Technology Enabled Services,*as of Dec 20,2017
Source: KPMG Cushman and Wakefield, CRISIL, Ministry of Tourism, JLL India, ANAROCK Property Consultants, Colliers Research, CBRE
For updated information, please visit www.ibef.orgReal Estate9
INDIAN REAL ESTATE IS A LARGE, GROWING
MARKET…
Notes: CAGR - Compounded Annual Growth Rate; F – Forecast, Information is as per latest data available, *average of indices of all cities, P – Projected
Source: KPMG, Report on Real Estate Sector in India – Corporate Catalyst India Pvt Ltd, CBRE, National Housing Bank
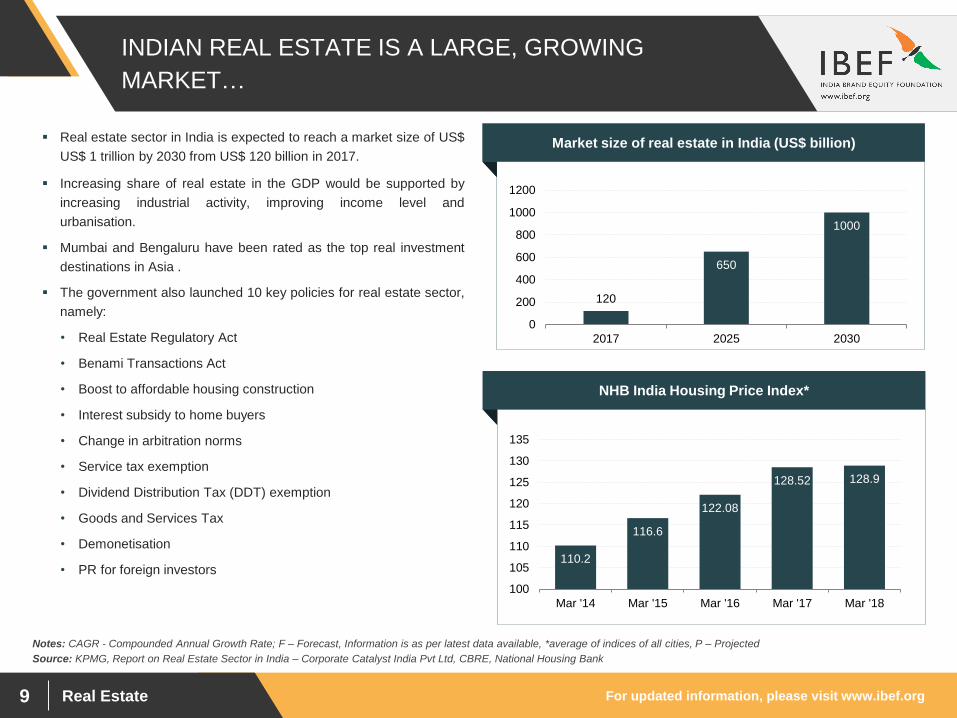
Real estate sector in India is expected to reach a market size of US$
US$ 1 trillion by 2030 from US$ 120 billion in 2017.
Increasing share of real estate in the GDP would be supported by
increasing industrial activity, improving income level and
urbanisation.
Mumbai and Bengaluru have been rated as the top real investment
destinations in Asia .
The government also launched 10 key policies for real estate sector,
namely:
• Real Estate Regulatory Act
• Benami Transactions Act
• Boost to affordable housing construction
• Interest subsidy to home buyers
• Change in arbitration norms
• Service tax exemption
• Dividend Distribution Tax (DDT) exemption
• Goods and Services Tax
• Demonetisation
• PR for foreign investors110.2
116.6
122.08
128.52 128.9
100
105
110
115
120
125
130
135
Mar '14 Mar '15 Mar '16 Mar '17 Mar '18
NHB India Housing Price Index*
120
650
1000
0
200
400
600
800
1000
1200
2017 2025 2030
Market size of real estate in India (US$ billion)
For updated information, please visit www.ibef.orgReal Estate10
DEMAND FOR RESIDENTIAL SPACE EXPECTED TO
GROW SHARPLY
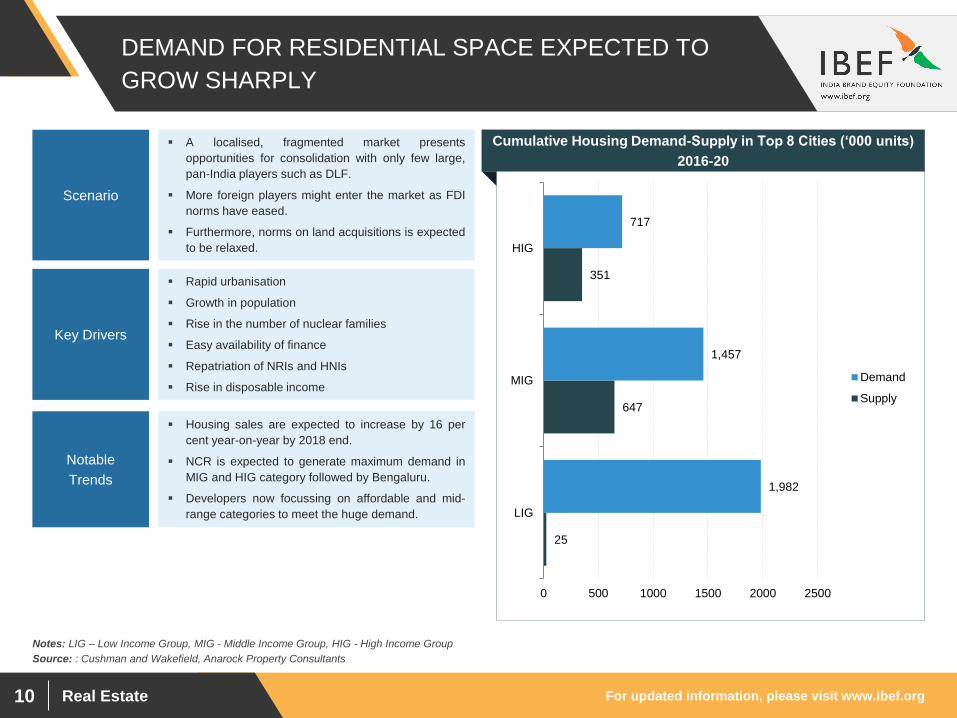
A localised, fragmented market presents
opportunities for consolidation with only few large,
pan-India players such as DLF.
More foreign players might enter the market as FDI
norms have eased.
Furthermore, norms on land acquisitions is expected
to be relaxed.
Scenario
Housing sales are expected to increase by 16 per
cent year-on-year by 2018 end.
NCR is expected to generate maximum demand in
MIG and HIG category followed by Bengaluru.
Developers now focussing on affordable and mid-
range categories to meet the huge demand.
Notable
Trends
25
647
351
1,982
1,457
717
0 500 1000 1500 2000 2500
LIG
MIG
HIG
Demand
Supply
Cumulative Housing Demand-Supply in Top 8 Cities (‘000 units)
2016-20
Source: : Cushman and Wakefield, Anarock Property Consultants
Notes: LIG – Low Income Group, MIG - Middle Income Group, HIG - High Income Group
Rapid urbanisation
Growth in population
Rise in the number of nuclear families
Easy availability of finance
Repatriation of NRIs and HNIs
Rise in disposable income
Key Drivers
For updated information, please visit www.ibef.orgReal Estate11
METROS DRIVING DEMAND FOR COMMERCIAL
SPACE
22 23
28 28 27
0
5
10
15
20
25
30
2013 2014 2015 2016 2017
Demand for Commercial Space in Top 8 cities (million sq ft)
16
25 26
8 1513
32
4
0
5
10
15
20
25
30
35
Pu
ne
NC
R
Mu
mbai
Ko
lkata
Hyd
era
ba
d
Chenna
i
Be
ngalu
ru
Ah
em
daba
d
City-Wise Commercial Space Demand (million sq ft) 2013-17
Source: Cushman and Wakefield
Notes: MNC - Multinational Corporation, BFSI - Banking, Financial and Insurance Services, CBD - Central Business District, SBD - Special Business District, NCR - National Capital Region
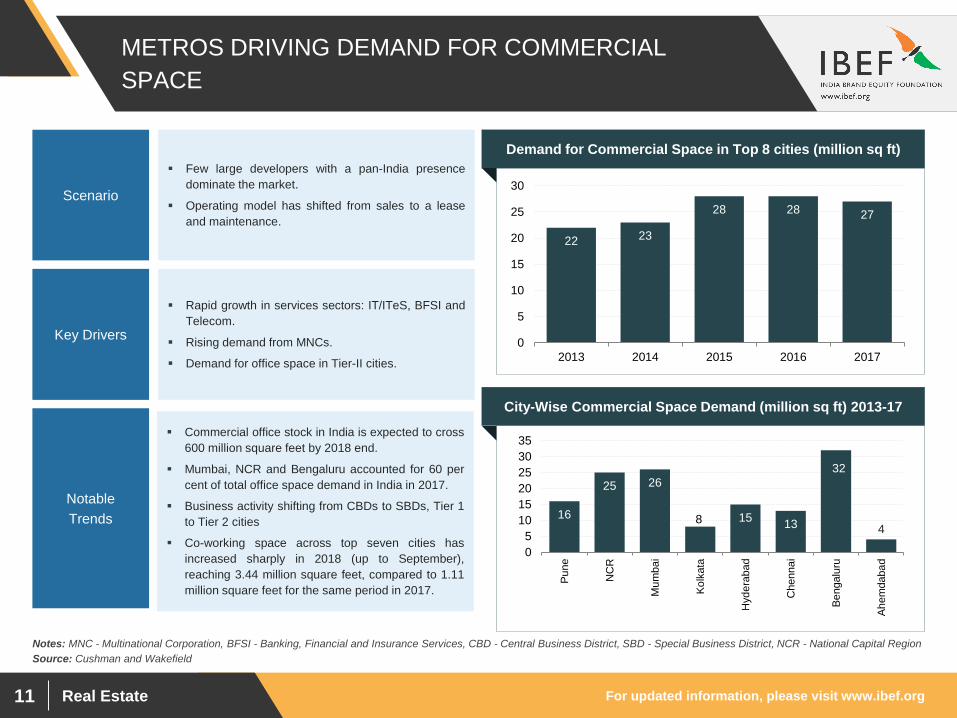
Few large developers with a pan-India presence
dominate the market.
Operating model has shifted from sales to a lease
and maintenance.
Scenario
Commercial office stock in India is expected to cross
600 million square feet by 2018 end.
Mumbai, NCR and Bengaluru accounted for 60 per
cent of total office space demand in India in 2017.
Business activity shifting from CBDs to SBDs, Tier 1
to Tier 2 cities
Co-working space across top seven cities has
increased sharply in 2018 (up to September),
reaching 3.44 million square feet, compared to 1.11
million square feet for the same period in 2017.
Notable
Trends
Rapid growth in services sectors: IT/ITeS, BFSI and
Telecom.
Rising demand from MNCs.
Demand for office space in Tier-II cities.
Key Drivers
For updated information, please visit www.ibef.orgReal Estate12
OFFICE MARKET OVERVIEW
10.9
5.615.28
3.3 3.3
2.64
1.65
0.0
2.0
4.0
6.0
8.0
10.0
12.0
Be
ng
alu
ru
Mu
mba
i
NC
R
Che
nn
ai
Pu
ne
Hyde
raba
d
Ko
lka
ta
Net Office Space Absorption in 2018 (million square feet)
Source: Cushman and Wakefield, JLL India, Livemint, Colliers International, CBRE, JLL
Notes: ITeS - Information Technology Enabled Service
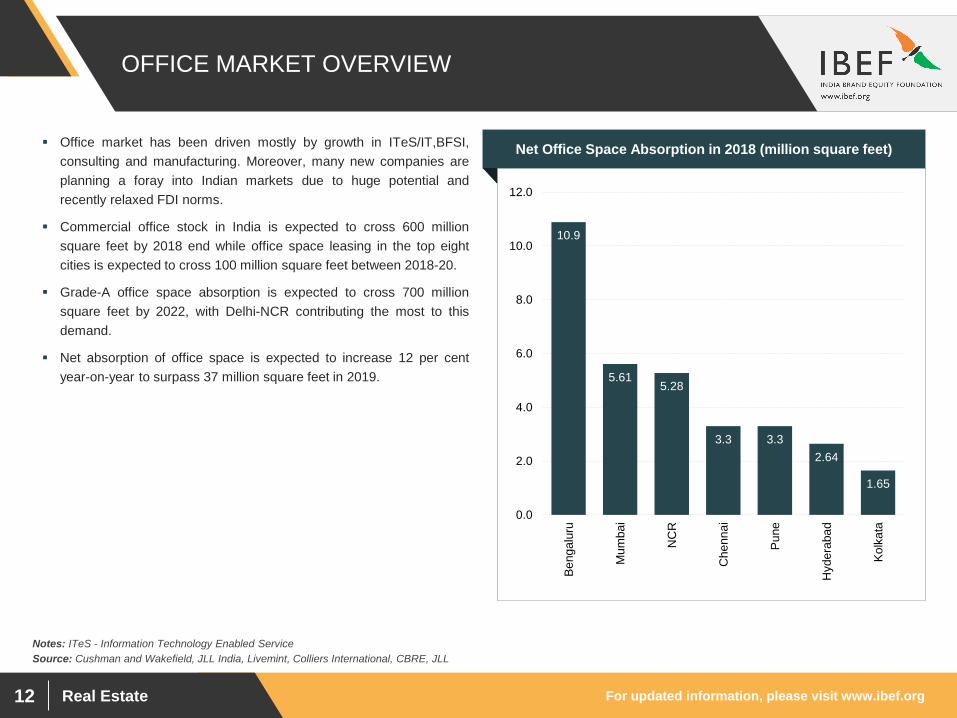
Office market has been driven mostly by growth in ITeS/IT,BFSI,
consulting and manufacturing. Moreover, many new companies are
planning a foray into Indian markets due to huge potential and
recently relaxed FDI norms.
Commercial office stock in India is expected to cross 600 million
square feet by 2018 end while office space leasing in the top eight
cities is expected to cross 100 million square feet between 2018-20.
Grade-A office space absorption is expected to cross 700 million
square feet by 2022, with Delhi-NCR contributing the most to this
demand.
Net absorption of office space is expected to increase 12 per cent
year-on-year to surpass 37 million square feet in 2019.
For updated information, please visit www.ibef.orgReal Estate13
RETAIL SPACE LIKELY TO SEE STRONG GROWTH
Number of Malls in India
Source: : Cushman and Wakefield, CBRE, JLL India, Real estate intelligence service (JLL), Anarock
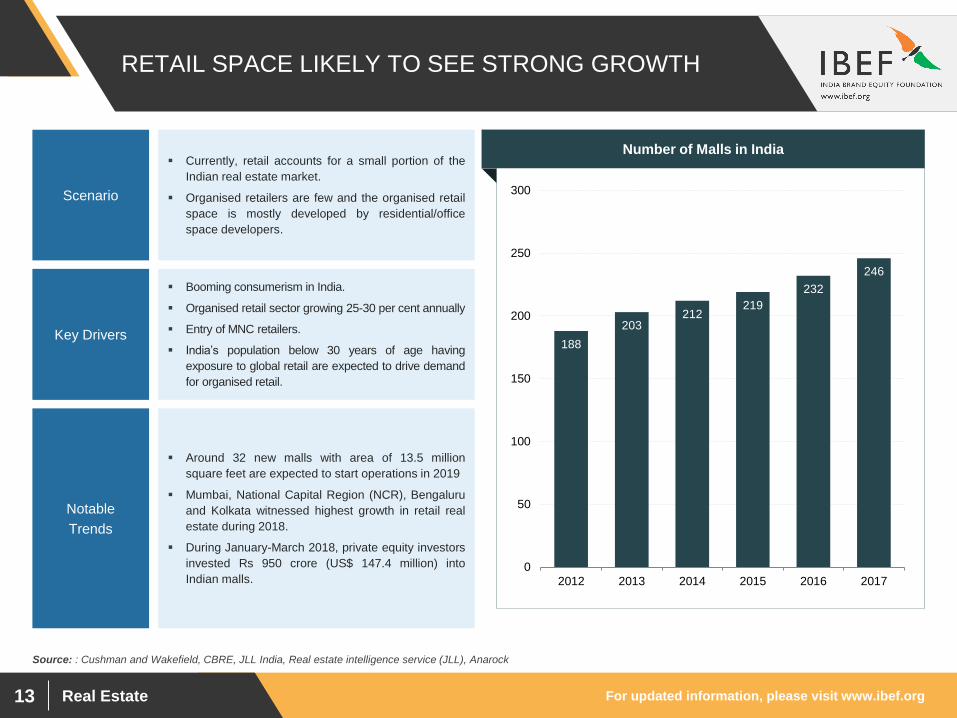
Currently, retail accounts for a small portion of the
Indian real estate market.
Organised retailers are few and the organised retail
space is mostly developed by residential/office
space developers.
Scenario
Around 32 new malls with area of 13.5 million
square feet are expected to start operations in 2019
Mumbai, National Capital Region (NCR), Bengaluru
and Kolkata witnessed highest growth in retail real
estate during 2018.
During January-March 2018, private equity investors
invested Rs 950 crore (US$ 147.4 million) into
Indian malls.
Notable
Trends
Booming consumerism in India.
Organised retail sector growing 25-30 per cent annually
Entry of MNC retailers.
India’s population below 30 years of age having
exposure to global retail are expected to drive demand
for organised retail.
Key Drivers188
203212
219
232
246
0
50
100
150
200
250
300
2012 2013 2014 2015 2016 2017
For updated information, please visit www.ibef.orgReal Estate14
HOSPITALITY MARKET TO WITNESS LARGE
INCREMENTAL CAPACITY
Source: : Cushman and Wakefield, Hotelivate
Notes: RevPar - Revenue per available room
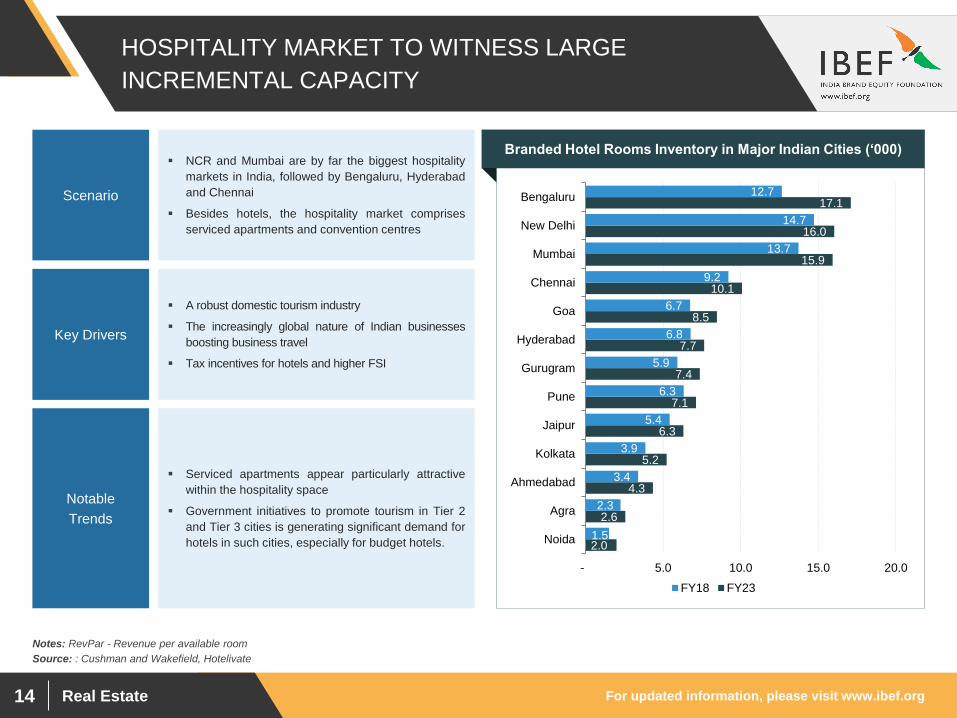
NCR and Mumbai are by far the biggest hospitality
markets in India, followed by Bengaluru, Hyderabad
and Chennai
Besides hotels, the hospitality market comprises
serviced apartments and convention centres
Scenario
Serviced apartments appear particularly attractive
within the hospitality space
Government initiatives to promote tourism in Tier 2
and Tier 3 cities is generating significant demand for
hotels in such cities, especially for budget hotels.
Notable
Trends
A robust domestic tourism industry
The increasingly global nature of Indian businesses
boosting business travel
Tax incentives for hotels and higher FSI
Key Drivers
2.0
2.6
4.3
5.2
6.3
7.1
7.4
7.7
8.5
10.1
15.9
16.0
17.1
1.5
2.3
3.4
3.9
5.4
6.3
5.9
6.8
6.7
9.2
13.7
14.7
12.7
- 5.0 10.0 15.0 20.0
Noida
Agra
Ahmedabad
Kolkata
Jaipur
Pune
Gurugram
Hyderabad
Goa
Chennai
Mumbai
New Delhi
Bengaluru
FY18 FY23
Branded Hotel Rooms Inventory in Major Indian Cities (‘000)

Real Estate
STRATEGIES
ADOPTED
For updated information, please visit www.ibef.orgReal Estate16
STRATEGIES ADOPTED
Source: Aranca Research, Livemint, Economic Times
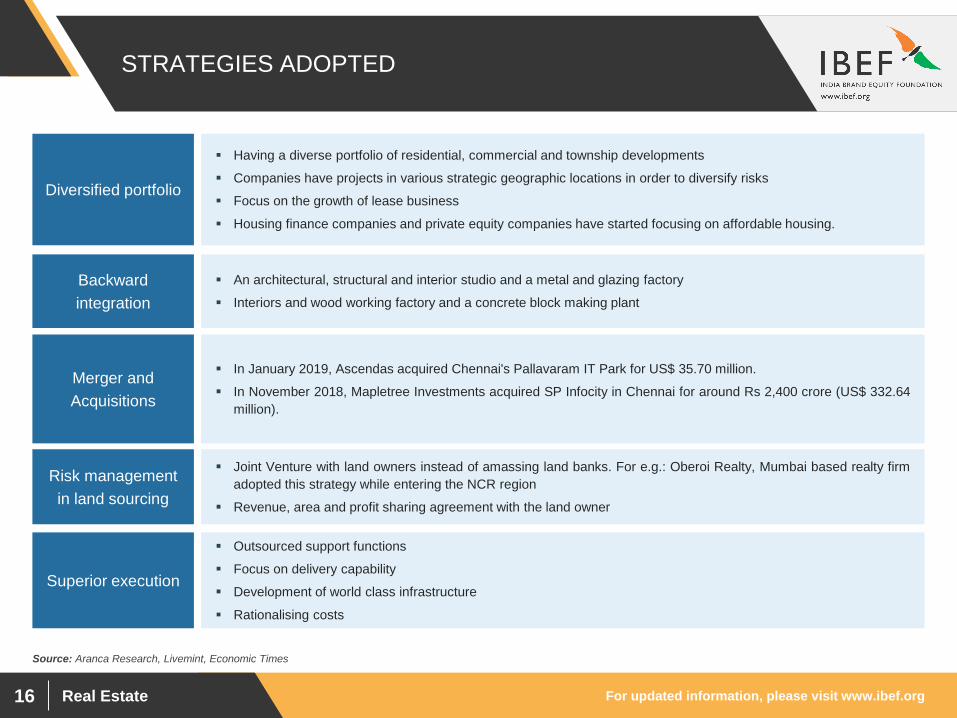
Having a diverse portfolio of residential, commercial and township developments
Companies have projects in various strategic geographic locations in order to diversify risks
Focus on the growth of lease business
Housing finance companies and private equity companies have started focusing on affordable housing.
Diversified portfolio
In January 2019, Ascendas acquired Chennai's Pallavaram IT Park for US$ 35.70 million.
In November 2018, Mapletree Investments acquired SP Infocity in Chennai for around Rs 2,400 crore (US$ 332.64
million).
Merger and
Acquisitions
Joint Venture with land owners instead of amassing land banks. For e.g.: Oberoi Realty, Mumbai based realty firm
adopted this strategy while entering the NCR region
Revenue, area and profit sharing agreement with the land owner
Risk management
in land sourcing
Outsourced support functions
Focus on delivery capability
Development of world class infrastructure
Rationalising costs
Superior execution
An architectural, structural and interior studio and a metal and glazing factory
Interiors and wood working factory and a concrete block making plant
Backward
integration

Real Estate
GROWTH DRIVERS
For updated information, please visit www.ibef.orgReal Estate18
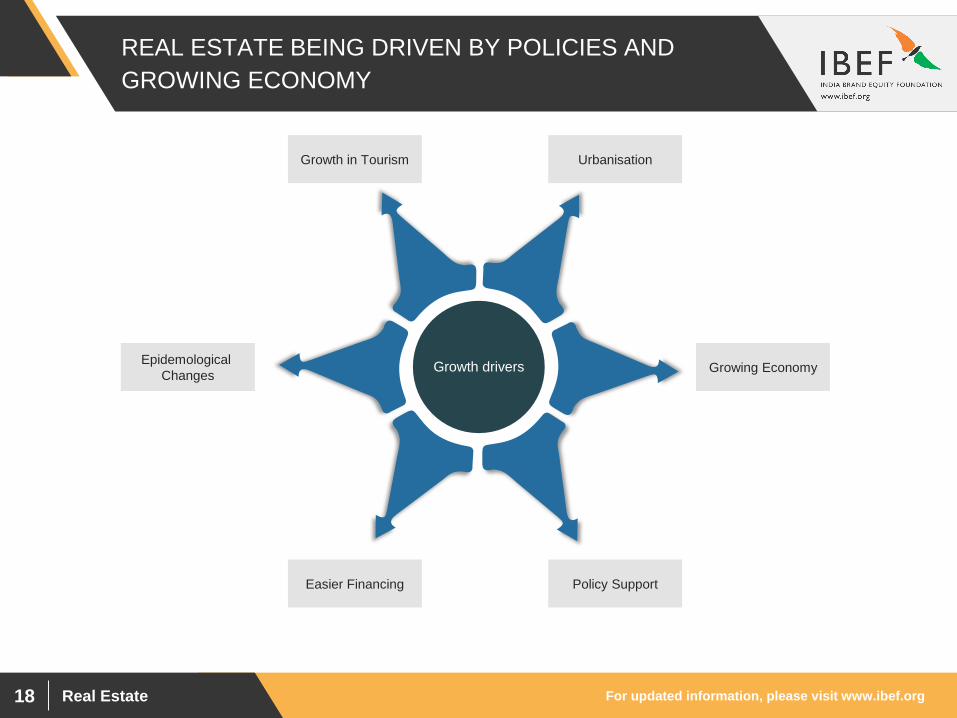
REAL ESTATE BEING DRIVEN BY POLICIES AND
GROWING ECONOMY
Growth in Tourism
Epidemological
Changes
Policy SupportEasier Financing
Growing Economy
Urbanisation
Growth drivers
For updated information, please visit www.ibef.orgReal Estate19
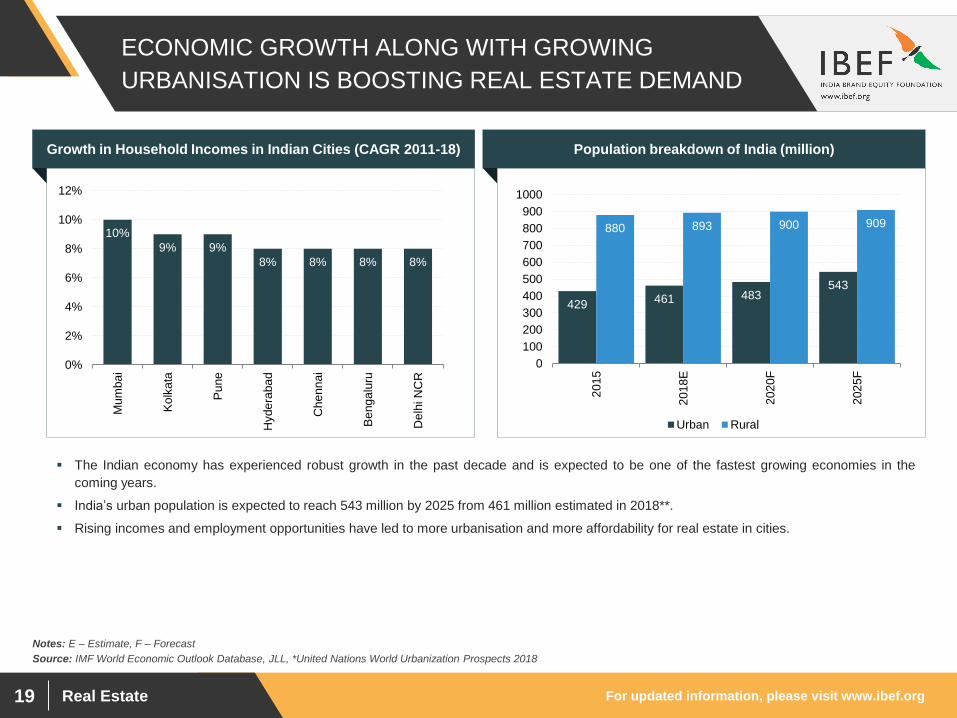
ECONOMIC GROWTH ALONG WITH GROWING
URBANISATION IS BOOSTING REAL ESTATE DEMAND
Growth in Household Incomes in Indian Cities (CAGR 2011-18)
Source: IMF World Economic Outlook Database, JLL, *United Nations World Urbanization Prospects 2018
Notes: E – Estimate, F – Forecast
429 461 483543
880 893 900 909
0
100
200
300
400
500
600
700
800
900
1000
201
5
201
8E
202
0F
202
5F
Urban Rural
Population breakdown of India (million)
The Indian economy has experienced robust growth in the past decade and is expected to be one of the fastest growing economies in the
coming years.
India’s urban population is expected to reach 543 million by 2025 from 461 million estimated in 2018**.
Rising incomes and employment opportunities have led to more urbanisation and more affordability for real estate in cities.
10%
9% 9%
8% 8% 8% 8%
0%
2%
4%
6%
8%
10%
12%
Mu
mba
i
Ko
lka
ta
Pu
ne
Hyde
raba
d
Che
nn
ai
Be
ng
alu
ru
Delh
i N
CR
For updated information, please visit www.ibef.orgReal Estate20
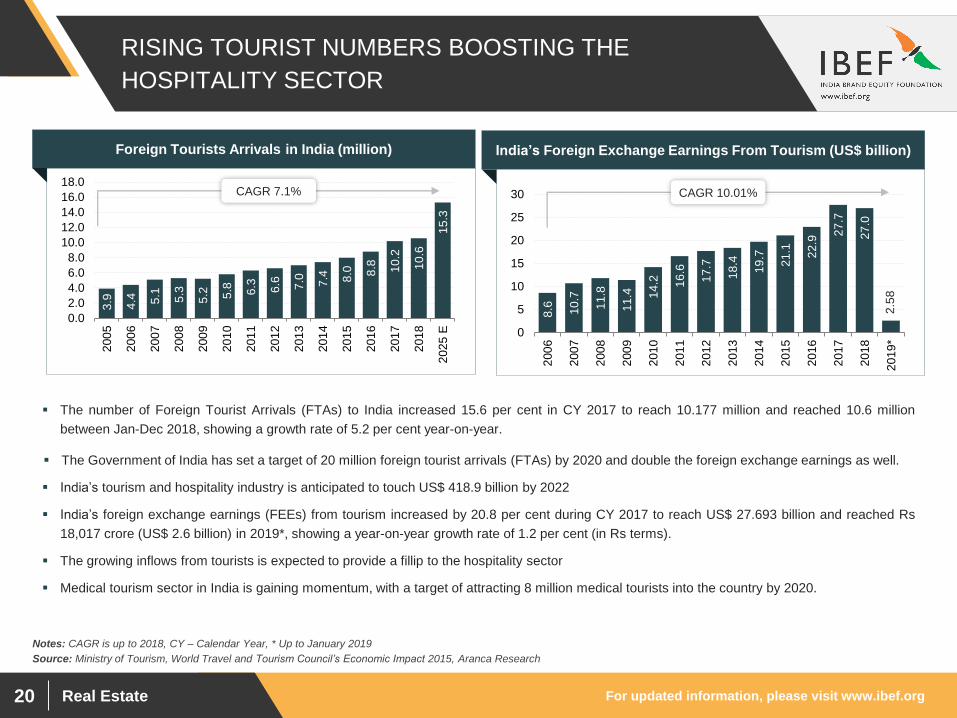
RISING TOURIST NUMBERS BOOSTING THE
HOSPITALITY SECTOR
Source: Ministry of Tourism, World Travel and Tourism Council’s Economic Impact 2015, Aranca Research
Notes: CAGR is up to 2018, CY – Calendar Year, * Up to January 2019
The number of Foreign Tourist Arrivals (FTAs) to India increased 15.6 per cent in CY 2017 to reach 10.177 million and reached 10.6 million
between Jan-Dec 2018, showing a growth rate of 5.2 per cent year-on-year.
The Government of India has set a target of 20 million foreign tourist arrivals (FTAs) by 2020 and double the foreign exchange earnings as well.
India’s tourism and hospitality industry is anticipated to touch US$ 418.9 billion by 2022
India’s foreign exchange earnings (FEEs) from tourism increased by 20.8 per cent during CY 2017 to reach US$ 27.693 billion and reached Rs
18,017 crore (US$ 2.6 billion) in 2019*, showing a year-on-year growth rate of 1.2 per cent (in Rs terms).
The growing inflows from tourists is expected to provide a fillip to the hospitality sector
Medical tourism sector in India is gaining momentum, with a target of attracting 8 million medical tourists into the country by 2020.
3.9
4.4 5.1 5.3
5.2 5.8 6.3 6.6 7.0 7.4 8.0 8.8 10
.2
10
.6
15
.3
0.0
2.0
4.0
6.0
8.0
10.0
12.0
14.0
16.0
18.0
200
5
200
6
200
7
200
8
200
9
201
0
201
1
201
2
201
3
201
4
201
5
201
6
201
7
201
8
202
5 E
Foreign Tourists Arrivals in India (million)
CAGR 7.1%
8.6 10
.7
11
.8
11
.4 14
.2 16
.6
17
.7
18
.4
19
.7
21
.1 22
.9
27
.7
27
.0
2.5
8
0
5
10
15
20
25
30
200
6
200
7
200
8
200
9
201
0
201
1
201
2
201
3
201
4
201
5
201
6
201
7
201
8
201
9*
India’s Foreign Exchange Earnings From Tourism (US$ billion)
CAGR 10.01%
For updated information, please visit www.ibef.orgReal Estate21
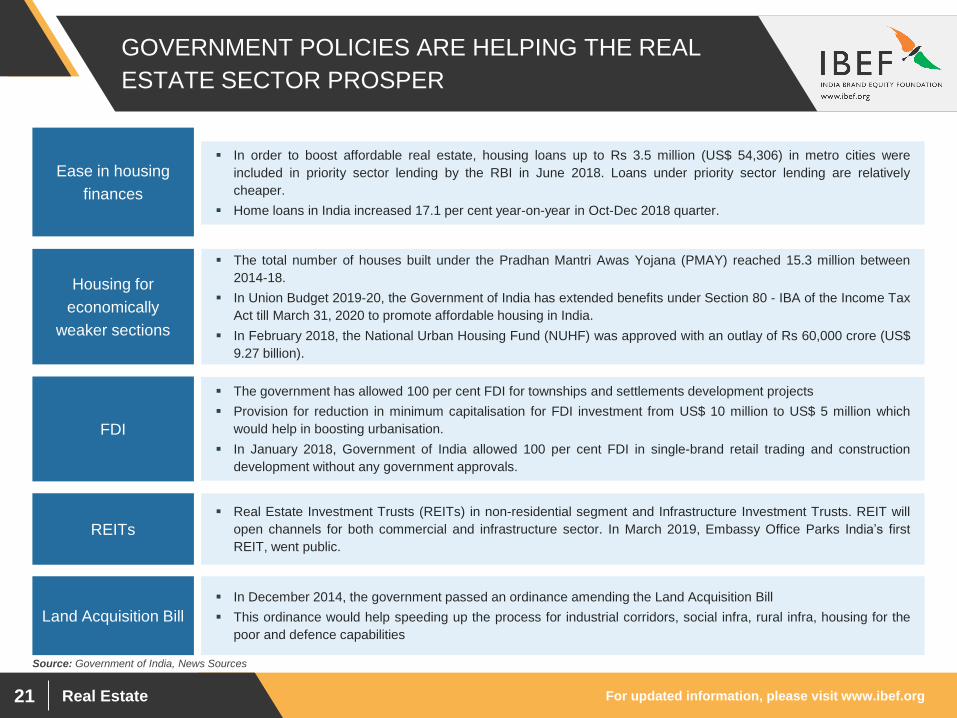
GOVERNMENT POLICIES ARE HELPING THE REAL
ESTATE SECTOR PROSPER
Source: Government of India, News Sources
In order to boost affordable real estate, housing loans up to Rs 3.5 million (US$ 54,306) in metro cities were
included in priority sector lending by the RBI in June 2018. Loans under priority sector lending are relatively
cheaper.
Home loans in India increased 17.1 per cent year-on-year in Oct-Dec 2018 quarter.
Ease in housing
finances
The government has allowed 100 per cent FDI for townships and settlements development projects
Provision for reduction in minimum capitalisation for FDI investment from US$ 10 million to US$ 5 million which
would help in boosting urbanisation.
In January 2018, Government of India allowed 100 per cent FDI in single-brand retail trading and construction
development without any government approvals.
FDI
Real Estate Investment Trusts (REITs) in non-residential segment and Infrastructure Investment Trusts. REIT will
open channels for both commercial and infrastructure sector. In March 2019, Embassy Office Parks India’s first
REIT, went public.
REITs
In December 2014, the government passed an ordinance amending the Land Acquisition Bill
This ordinance would help speeding up the process for industrial corridors, social infra, rural infra, housing for the
poor and defence capabilities
Land Acquisition Bill
The total number of houses built under the Pradhan Mantri Awas Yojana (PMAY) reached 15.3 million between
2014-18.
In Union Budget 2019-20, the Government of India has extended benefits under Section 80 - IBA of the Income Tax
Act till March 31, 2020 to promote affordable housing in India.
In February 2018, the National Urban Housing Fund (NUHF) was approved with an outlay of Rs 60,000 crore (US$
9.27 billion).
Housing for
economically
weaker sections
For updated information, please visit www.ibef.orgReal Estate22
PE INVESTMENTS ON THE RISE
Source: EY, JLL India
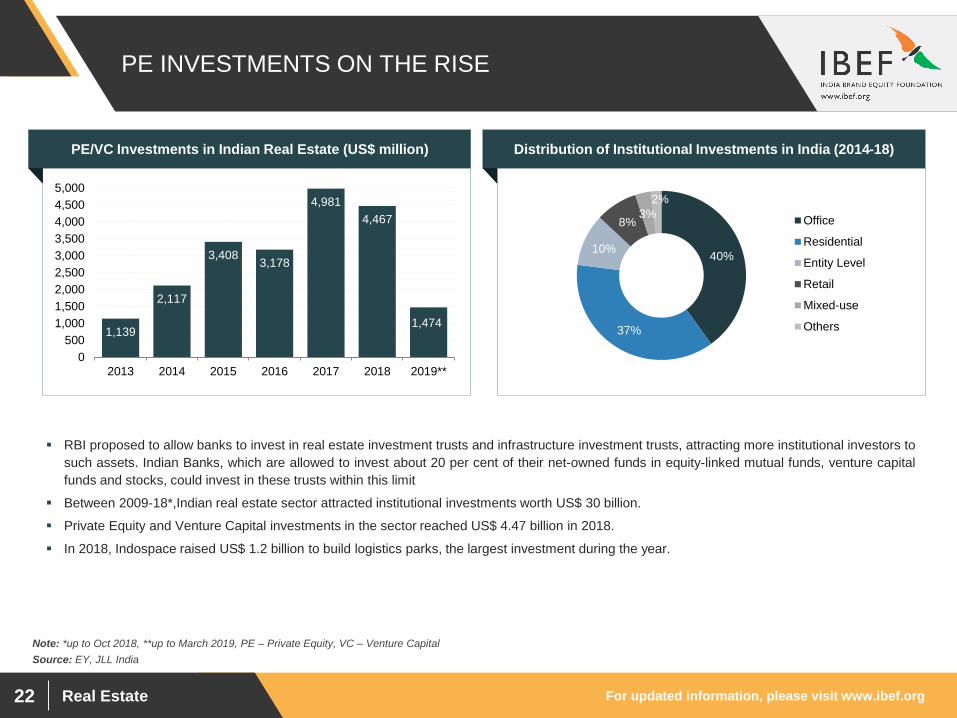
RBI proposed to allow banks to invest in real estate investment trusts and infrastructure investment trusts, attracting more institutional investors to
such assets. Indian Banks, which are allowed to invest about 20 per cent of their net-owned funds in equity-linked mutual funds, venture capital
funds and stocks, could invest in these trusts within this limit
Between 2009-18*,Indian real estate sector attracted institutional investments worth US$ 30 billion.
Private Equity and Venture Capital investments in the sector reached US$ 4.47 billion in 2018.
In 2018, Indospace raised US$ 1.2 billion to build logistics parks, the largest investment during the year.
40%
37%
10%
8%3%
2%
Office
Residential
Entity Level
Retail
Mixed-use
Others
Distribution of Institutional Investments in India (2014-18)
Note: *up to Oct 2018, **up to March 2019, PE – Private Equity, VC – Venture Capital
1,139
2,117
3,4083,178
4,981
4,467
1,474
0
500
1,000
1,500
2,000
2,500
3,000
3,500
4,000
4,500
5,000
2013 2014 2015 2016 2017 2018 2019**
PE/VC Investments in Indian Real Estate (US$ million)
For updated information, please visit www.ibef.orgReal Estate23
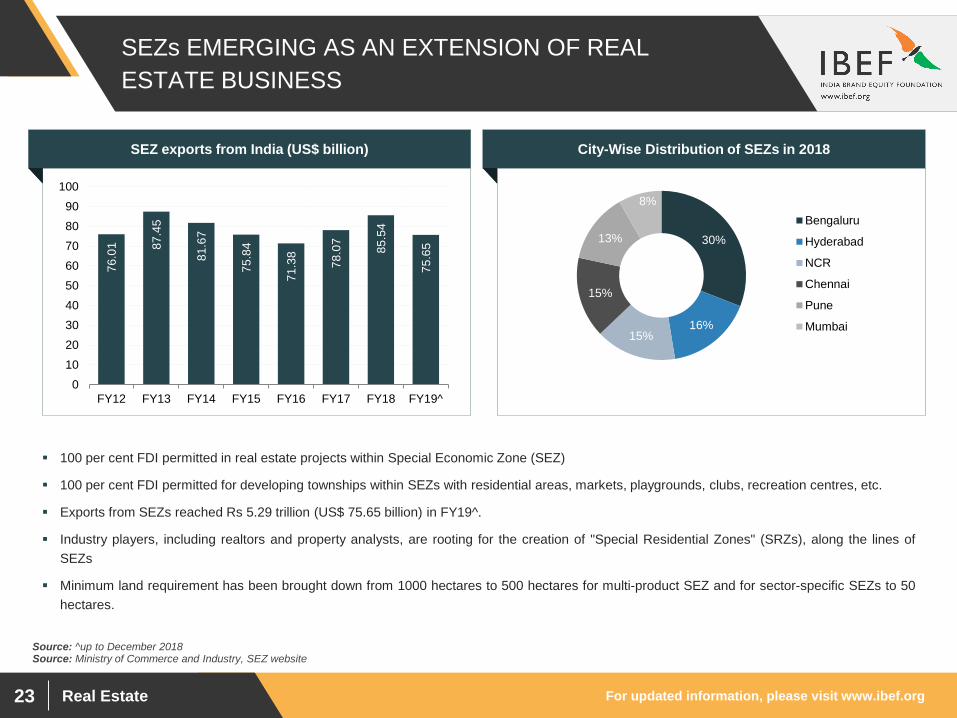
30%
16%15%
15%
13%
8%
Bengaluru
Hyderabad
NCR
Chennai
Pune
Mumbai
SEZs EMERGING AS AN EXTENSION OF REAL
ESTATE BUSINESS
City-Wise Distribution of SEZs in 2018
Source: Ministry of Commerce and Industry, SEZ website
100 per cent FDI permitted in real estate projects within Special Economic Zone (SEZ)
100 per cent FDI permitted for developing townships within SEZs with residential areas, markets, playgrounds, clubs, recreation centres, etc.
Exports from SEZs reached Rs 5.29 trillion (US$ 75.65 billion) in FY19^.
Industry players, including realtors and property analysts, are rooting for the creation of "Special Residential Zones" (SRZs), along the lines of
SEZs
Minimum land requirement has been brought down from 1000 hectares to 500 hectares for multi-product SEZ and for sector-specific SEZs to 50
hectares.
Source: ^up to December 2018
76
.01 87
.45
81
.67
75
.84
71
.38
78
.07
85
.54
75
.65
0
10
20
30
40
50
60
70
80
90
100
FY12 FY13 FY14 FY15 FY16 FY17 FY18 FY19^
SEZ exports from India (US$ billion)

Real Estate
OPPORTUNITIES
For updated information, please visit www.ibef.orgReal Estate25
NICHE SECTORS EXPECTED TO PROVIDE GROWTH
OPPORTUNITIES
Source: Cushman and Wakefield, Fitch Ratings, Report on Healthcare, Telemedicine and Medical Tourism In India – ASA and Associates LLP, Ministry of Tourism
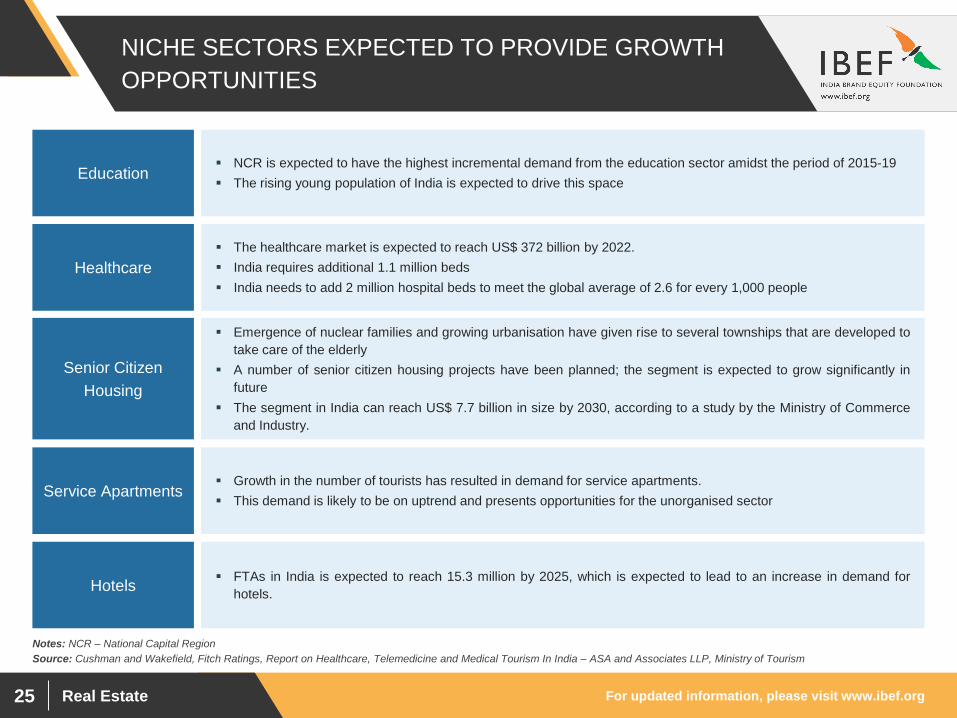
NCR is expected to have the highest incremental demand from the education sector amidst the period of 2015-19
The rising young population of India is expected to drive this spaceEducation
Emergence of nuclear families and growing urbanisation have given rise to several townships that are developed to
take care of the elderly
A number of senior citizen housing projects have been planned; the segment is expected to grow significantly in
future
The segment in India can reach US$ 7.7 billion in size by 2030, according to a study by the Ministry of Commerce
and Industry.
Senior Citizen
Housing
Growth in the number of tourists has resulted in demand for service apartments.
This demand is likely to be on uptrend and presents opportunities for the unorganised sectorService Apartments
FTAs in India is expected to reach 15.3 million by 2025, which is expected to lead to an increase in demand for
hotels.Hotels
The healthcare market is expected to reach US$ 372 billion by 2022.
India requires additional 1.1 million beds
India needs to add 2 million hospital beds to meet the global average of 2.6 for every 1,000 people
Healthcare
Notes: NCR – National Capital Region
For updated information, please visit www.ibef.orgReal Estate26
TOP CITIES TO CONTRIBUTE TO GROWTH
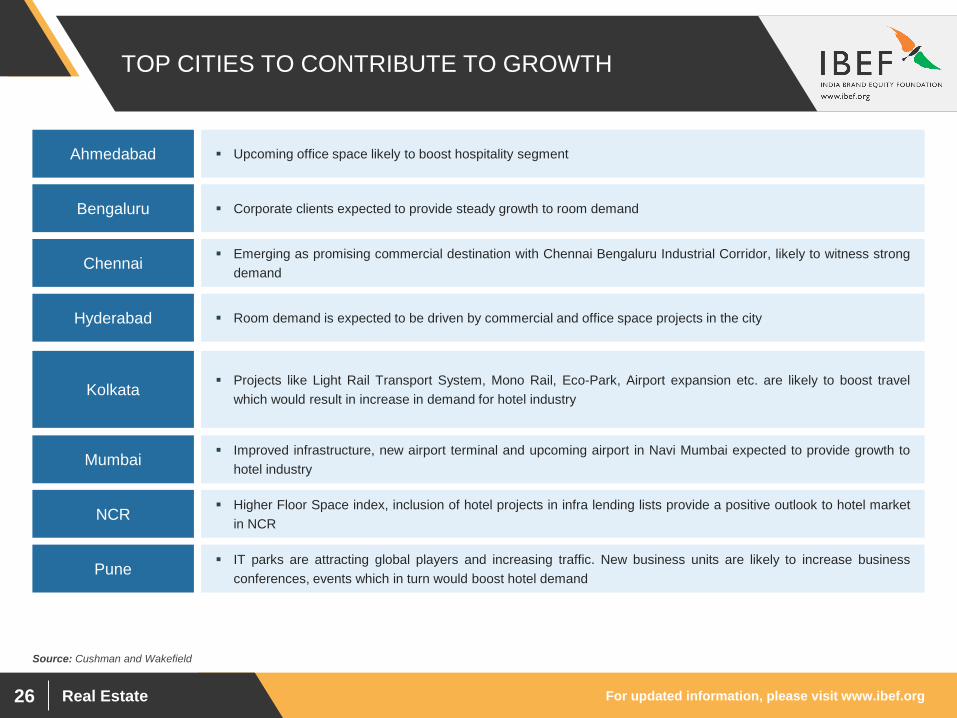
Kolkata Projects like Light Rail Transport System, Mono Rail, Eco-Park, Airport expansion etc. are likely to boost travel
which would result in increase in demand for hotel industry
Corporate clients expected to provide steady growth to room demandBengaluru
Emerging as promising commercial destination with Chennai Bengaluru Industrial Corridor, likely to witness strong
demandChennai
Room demand is expected to be driven by commercial and office space projects in the cityHyderabad
Higher Floor Space index, inclusion of hotel projects in infra lending lists provide a positive outlook to hotel market
in NCRNCR
Ahmedabad Upcoming office space likely to boost hospitality segment
Improved infrastructure, new airport terminal and upcoming airport in Navi Mumbai expected to provide growth to
hotel industryMumbai
IT parks are attracting global players and increasing traffic. New business units are likely to increase business
conferences, events which in turn would boost hotel demandPune
Source: Cushman and Wakefield

Real Estate
KEY INDUSTRY
ORGANISATIONS
For updated information, please visit www.ibef.orgReal Estate28
INDUSTRY ORGANISATIONS
National Secretariat, 703, Ansal Bhawan,
16, Kasturba Gandhi Marg, New Delhi – 110 001
Tel: (011) 43126262/43126200
Fax: 91 11 43126211
E-mail: [email protected]
Website: www.credai.org
The Confederation of Real Estate Developers’ Associations of
India (CREDAI
G-1/G-20, Commerce Centre, J. Dadajee Road,
Tardeo, Mumbai – 400034
Tel: 91 22 23514134, 23514802, 23520507
Fax: 91 22 23521328
E-mail: [email protected], [email protected]
Website: www.baionline.in
Builders' Association of India (BAI)

Real Estate
USEFUL
INFORMATION
For updated information, please visit www.ibef.orgReal Estate30
GLOSSARY
BFSI: Banking, Financial Services and Insurance
CAGR: Compound Annual Growth Rate
CBD: Central Business District
FDI: Foreign Direct Investment
FSI: Floor Space Index
HNI: High Net-worth Individual
GOI: Government of India
INR: Indian Rupee
IT/ITeS: Information Technology/Information Technology enabled Services
MNC: Multinational Corporation
NRI: Non Resident Indian
SBD: Special Business District
SEZ: Special Economic Zone
US$ : US Dollar
Wherever applicable, numbers have been rounded off to the nearest whole number
For updated information, please visit www.ibef.orgReal Estate31
EXCHANGE RATES
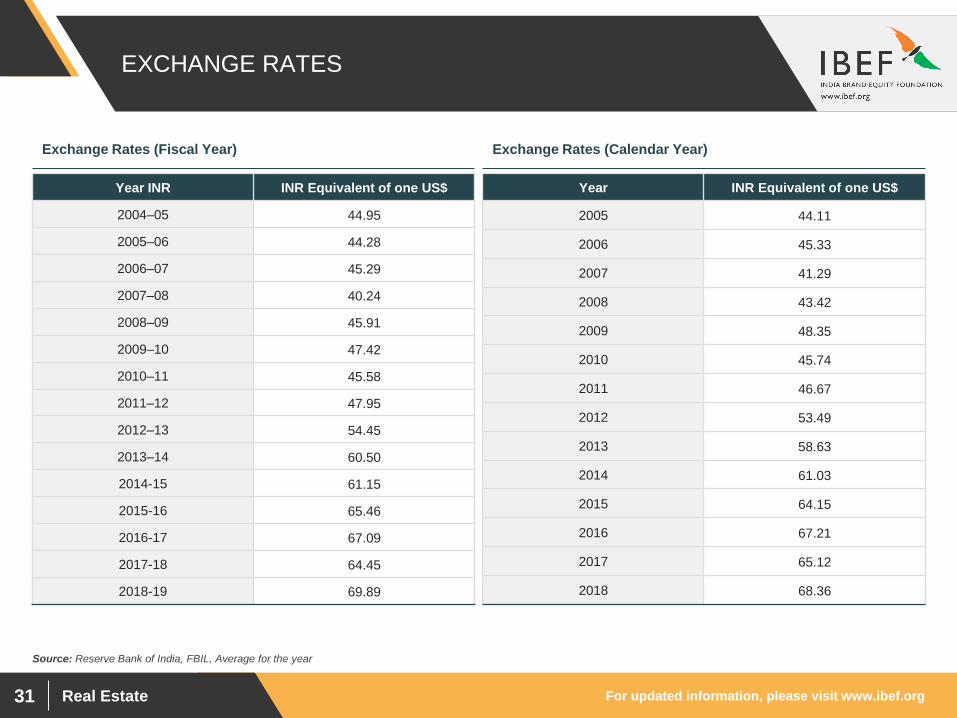
Exchange Rates (Fiscal Year) Exchange Rates (Calendar Year)
Year INR INR Equivalent of one US$
2004–05 44.95
2005–06 44.28
2006–07 45.29
2007–08 40.24
2008–09 45.91
2009–10 47.42
2010–11 45.58
2011–12 47.95
2012–13 54.45
2013–14 60.50
2014-15 61.15
2015-16 65.46
2016-17 67.09
2017-18 64.45
2018-19 69.89
Year INR Equivalent of one US$
2005 44.11
2006 45.33
2007 41.29
2008 43.42
2009 48.35
2010 45.74
2011 46.67
2012 53.49
2013 58.63
2014 61.03
2015 64.15
2016 67.21
2017 65.12
2018 68.36
Source: Reserve Bank of India, FBIL, Average for the year

For updated information, please visit www.ibef.orgReal Estate32
DISCLAIMER
India Brand Equity Foundation (IBEF) engaged Aranca to prepare this presentation and the same has been prepared by Aranca in consultation
with IBEF.
All rights reserved. All copyright in this presentation and related works is solely and exclusively owned by IBEF. The same may not be reproduced,
wholly or in part in any material form (including photocopying or storing it in any medium by electronic means and whether or not transiently or
incidentally to some other use of this presentation), modified or in any manner communicated to any third party except with the written approval
of IBEF.
This presentation is for information purposes only. While due care has been taken during the compilation of this presentation to ensure that the
information is accurate to the best of Aranca and IBEF’s knowledge and belief, the content is not to be construed in any manner whatsoever as a
substitute for professional advice.
Aranca and IBEF neither recommend nor endorse any specific products or services that may have been mentioned in this presentation and nor do
they assume any liability or responsibility for the outcome of decisions taken as a result of any reliance placed on this presentation.
Neither Aranca nor IBEF shall be liable for any direct or indirect damages that may arise due to any act or omission on the part of the user due to any
reliance placed or guidance taken from any portion of this presentation.
Related Documents


![GLOBAL GATEWAY CERTIFICATIONS MSPO-PART4... · 2020. 2. 15. · Estate, Gedong Estate, Sematan Estate, Sadong Estate, Lupar Estate, Bijat Estate & Sg. Tisak Estate] and from out-grower](https://static.cupdf.com/doc/110x72/60c520edde42aa3623738db8/global-gateway-certifications-mspo-part4-2020-2-15-estate-gedong-estate.jpg)