Ready by 21: Ready for college, work and life Changing the odds for youth on the national, state and local level New York Office of Children and Family Services September 28, 2009

Ready by 21: Ready for college, work and life Changing the odds for youth on the national, state and local level New York Office of Children and Family.
Dec 27, 2015
Welcome message from author
This document is posted to help you gain knowledge. Please leave a comment to let me know what you think about it! Share it to your friends and learn new things together.
Transcript

Ready by 21: Ready for college, work and lifeChanging the odds for youth on the
national, state and local level
New York Office of Children and Family ServicesSeptember 28, 2009

Why does Ready by 21 exist?Too few students are ready for college, work
or life. More high school diplomas are not the only answer.

New Employer Survey Finds Skills in Short Supply
Employers ranked 20 skill areas in order of importance. The top skills fell into five categories:
• 7 in 10 employers saw these skills as critical for entry-level high school graduates
• Employers reported that 4 in 10 high school graduates were deficient in these areas
Professionalism/Work Ethic Teamwork/Collaboration Oral Communications
Ethics/Social Responsibility Reading Comprehension

43% are doing well in two life areas and okay in one
- Productivity: Attend college, work steadily
- Health: Good health, positive health habits, healthy relationships
- Connectedness: Volunteer, politically active, active in religious institutions, active in community
22% are doing poorly in two life areas and not well in any
- Productivity: High school diploma or less plus unemployed or on welfare
- Health: Poor health, bad health habits, unsupportive relationships
- Connectedness: Commit illegal activity once a month
2 in 10 4 in 104 in 10
35% are doing okay – doing poorly in no more than one life area and doing well in at most one – and doing okay in the rest
Researchers Gambone, Connell & Klem (2002) estimate that only 4 in 10 young people are doing well in their early 20s.

What Research Tells Us
The National Research Council List
• Physical and Psychological Safety• Appropriate Structure• Supportive Relationships• Opportunities to Belong• Positive Social Norms• Support for Efficacy and Mattering
• Opportunities for Skill-Building• Integration of Family, School and
Community Efforts
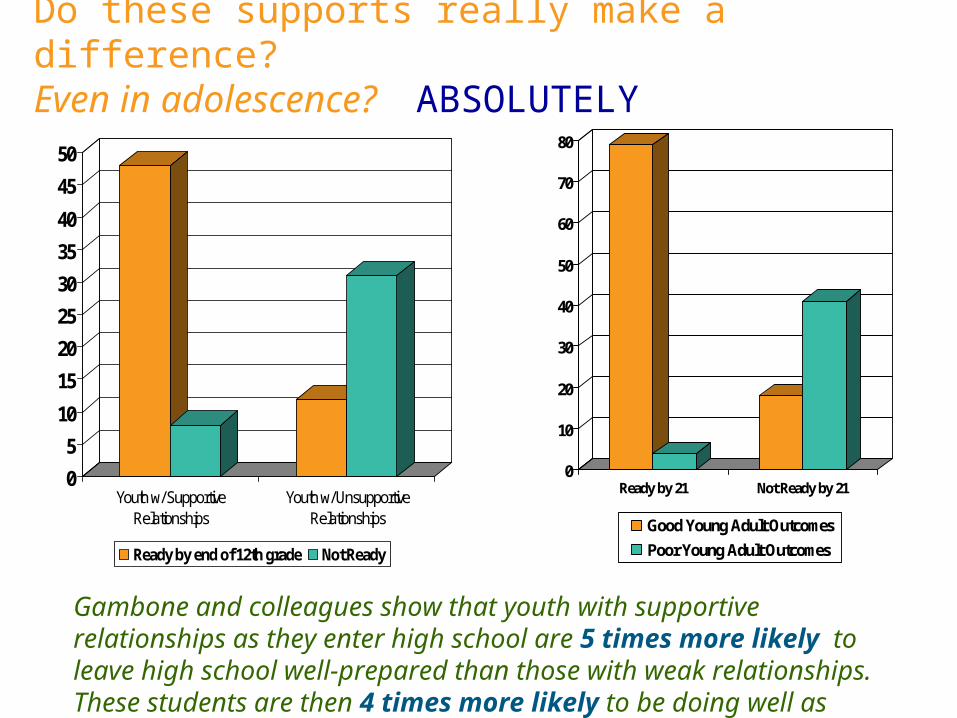
Do these supports really make a difference? Even in adolescence? ABSOLUTELY
0
5
10
15
20
25
30
35
40
45
50
Youth w/ SupportiveRelationships
Youth w/ UnsupportiveRelationships
Ready by end of 12th grade Not Ready
Gambone and colleagues show that youth with supportive relationships as they enter high school are 5 times more likely to leave high school well-prepared than those with weak relationships. These students are then 4 times more likely to be doing well as young adults.
0
10
20
30
40
50
60
70
80
Ready by 21 Not Ready by 21
Good Young Adult Outcomes
Poor Young Adult Outcomes
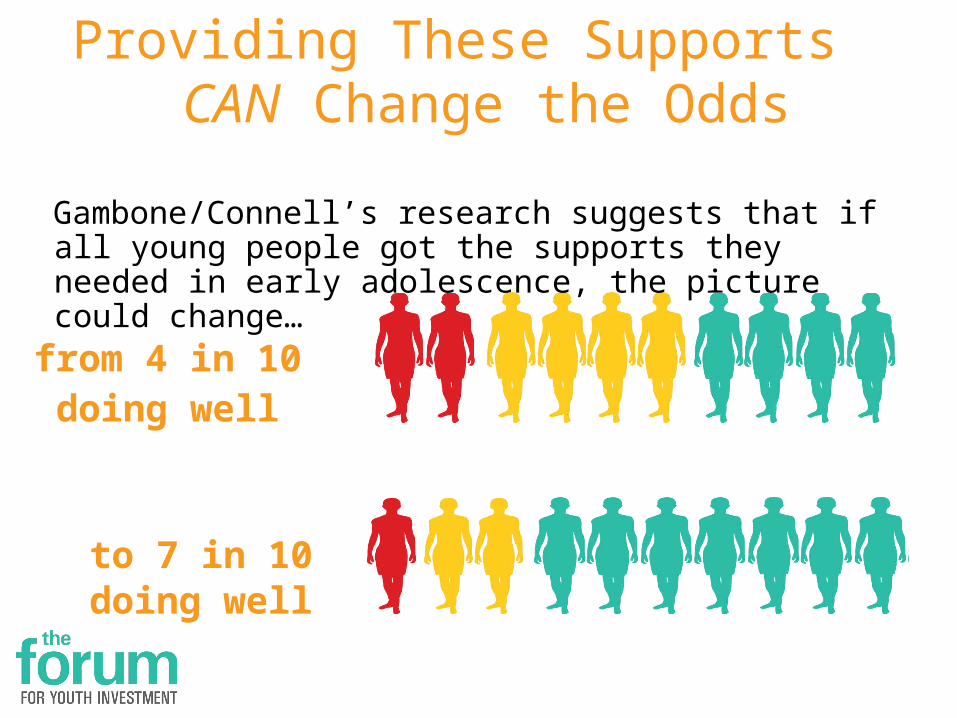
from 4 in 10doing well
to 7 in 10 doing well
Providing These Supports CAN Change the Odds
Gambone/Connell’s research suggests that if all young people got the supports they needed in early adolescence, the picture could change…

Help leaders improve what they do, how they do it and rethink why they do it…
Enabling increases in the availability and quality of family, school and community supports needed to help children and youth…
Leading to positive outcomes and raising the probability that young people are ready for college, work and life by 21
What’s needed?
8
CHILDREN& YOUTH
FAMILY COMMUNITY& SCHOOLLEADERS
Accountability Supports Outcomes
© The Forum for Youth Investment. Ready by 21 and the Ready by 21 Logo are registered trademarks of the Forum for Youth Investment.
Change the oddsfor youth
Change the waywe do business
Change the landscapeof communities

Ready by 21 National Partnership
• Mobilization Partners: Mobilize Leaders in Communities: United Way of America Corporate Voices for Working Families American Association of School Administrators National Conference of State Legislators National Collaboration for Youth America’s Promise
• Managing Partner: Forum for Youth Investment

Ready by 21 National Partnership
• National Technical Partners: David P. Weikart Center for Youth Program Quality Results Leadership Group Child Trends The Search Institute The Finance Project nFocus Community Services Group
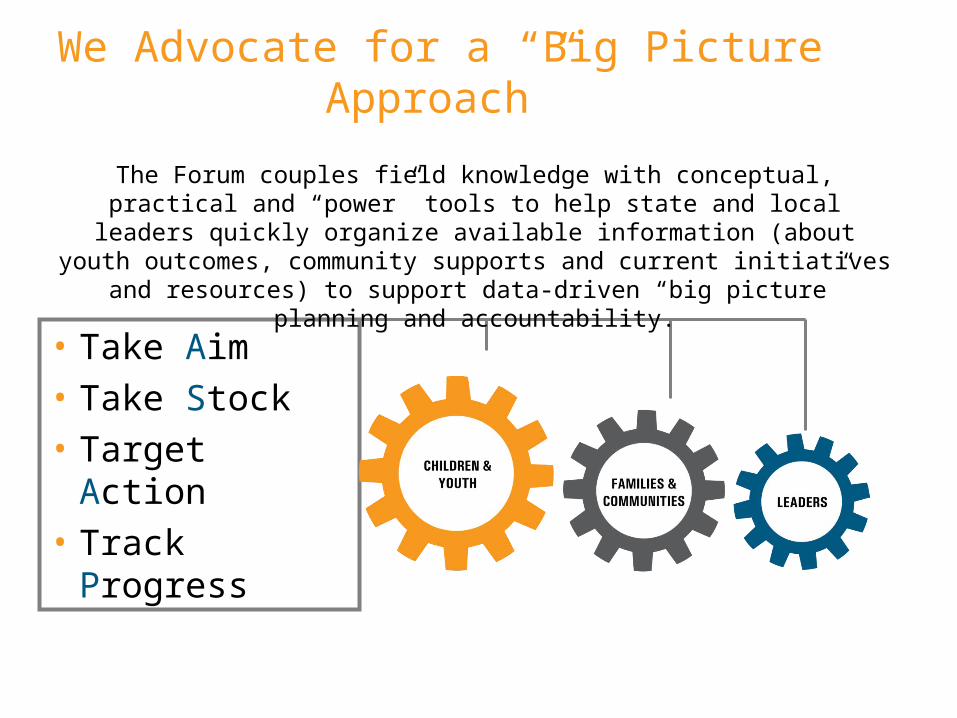
We Advocate for a “Big Picture Approach”
• Take Aim• Take Stock• Target Action• Track Progress
The Forum couples field knowledge with conceptual, practical and “power” tools to help state and local leaders quickly organize available information
(about youth outcomes, community supports and current initiatives and resources) to support data-driven “big picture” planning and accountability.

Mapping the Program LandscapeAssessing and Improving Quality
Mapping Delivery Workforce CapacityMapping Resources
We Provide Precision Tools: Through the Forum for Youth Investment and Our Technical Partners
Selecting Results and IndicatorsDeveloping Report Cards Mapping Initiatives &
Change Efforts

It is Marketable
It Matters
It is Malleable
It is Measureable
Research shows that improved youth outcomes requires program attendance and program quality.
The core elements of program quality are both measurable and consistent across a broad range of program types.
Decision-makers and providers will invest in improving quality if they believe that it matters, is measurable and is
malleable given available resources.
Most programs can improve quality by undertaking integrated assessment and improvement efforts.
The Quality of these Supports Counts

Weikart Center-Who We Serve
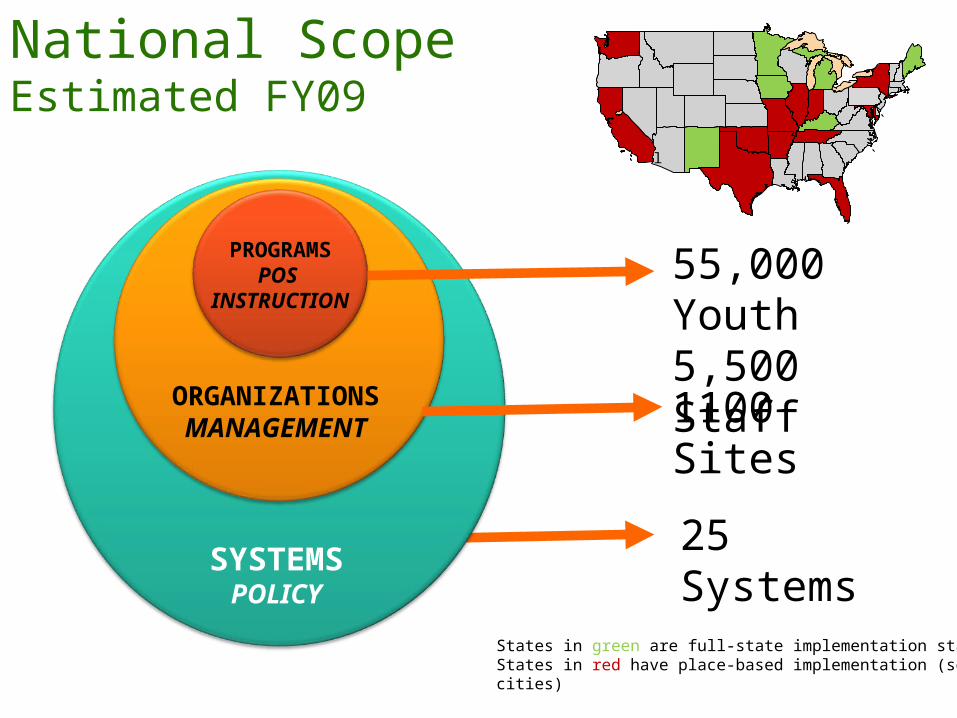
National ScopeEstimated FY09
55,000 Youth5,500 Staff1100 Sites
25 Systems
``
`
l
PROGRAMSPOS
INSTRUCTION
ORGANIZATIONS
MANAGEMENT
SYSTEMS
POLICYStates in green are full-state implementation statesStates in red have place-based implementation (select cities)
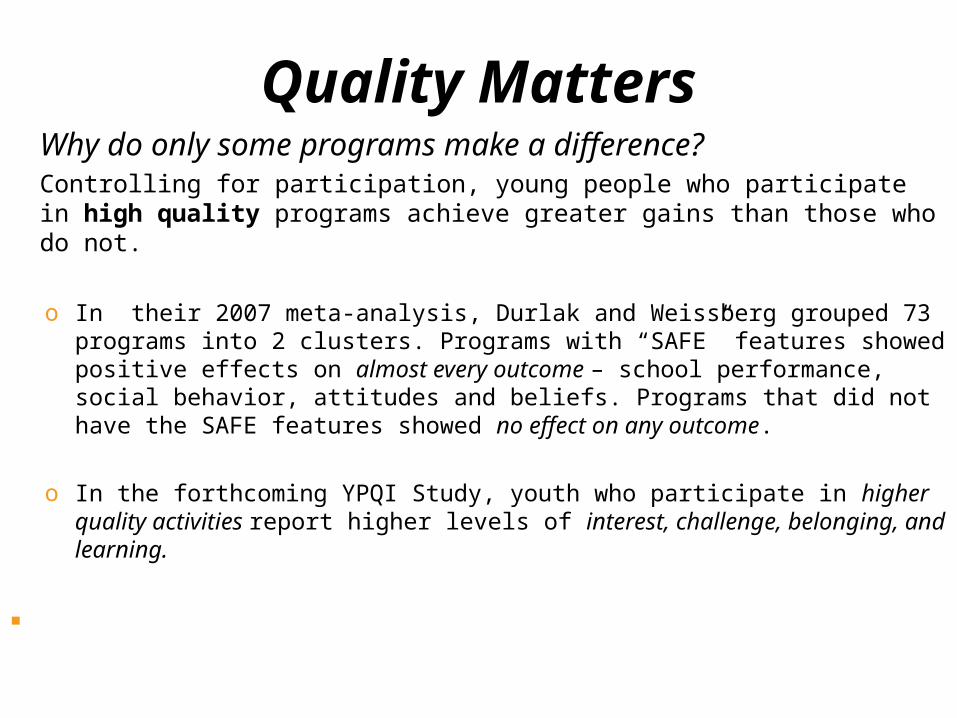
Quality MattersWhy do only some programs make a difference?Controlling for participation, young people who participate in high quality programs achieve greater gains than those who do not.
o In their 2007 meta-analysis, Durlak and Weissberg grouped 73 programs into 2 clusters. Programs with “SAFE” features showed positive effects on almost every outcome – school performance, social behavior, attitudes and beliefs. Programs that did not have the SAFE features showed no effect on any outcome.
o In the forthcoming YPQI Study, youth who participate in higher quality activities report higher levels of interest, challenge, belonging, and learning.

Quality & Child Development Durlak & Weissberg (2007)
Programs with SAFE features benefit youth in three areas
School Performance Positive Effects• Achievement Test Scores x• School Grades x
Feelings & Attitudes• Self-perception x• School Bonding x
Pro-social Behavior• Positive social behavior x• Antisocial behavior x• Drug use x
Programs can improve outcomes by focusing on the quality of service delivery

YPQA Measures POS Quality (counts of staff practice ina program offering)
Plan
Make choices
Reflect
Partner with adults
Lead and mentor
Be in small groups
Experience belonging
Engagement
Reframing conflictEncouragement
Skill building
Active engagement
Session flow
Welcoming atmosphereSupportive
Environment
Interaction
Safe Environment Healthy food and drinks
Program space and furniture Emergency procedures
Psychological and emotional safety
Physically safe environment

YPQA Domain ScoresN= 735 offerings (all unique staff) in 180 organizations
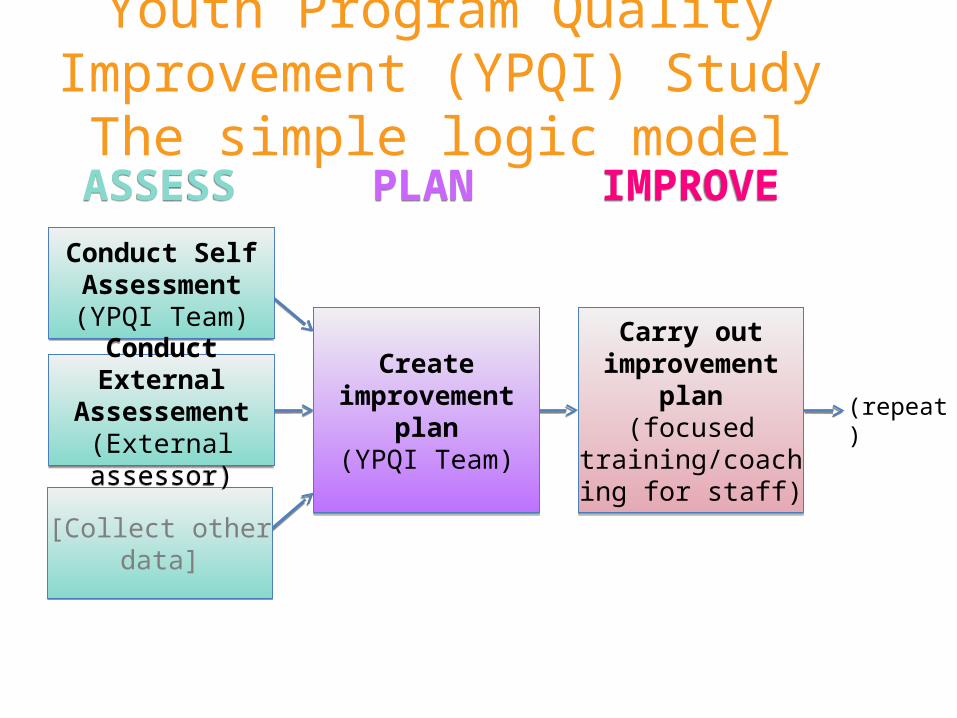
ASSESSASSESS PLANPLAN IMPROVEIMPROVE
Carry outimprovement plan
(focused training/coaching
for staff)
Carry outimprovement plan
(focused training/coaching
for staff)
Createimprovement plan
(YPQI Team)
Createimprovement plan
(YPQI Team)
Conduct Self Assessment(YPQI Team)
Conduct Self Assessment(YPQI Team)
[Collect other data][Collect other data]
Conduct External Assessement
(External assessor)
Conduct External Assessement
(External assessor)(repeat)
Youth Program Quality Improvement (YPQI) Study
The simple logic model

YPQI Logic Model
Managers enact CI practices
Staff engage CI practices
Staff enact instruction
Qual Assess(4-8 hrs online)
Planning w/ Data (1-day live)
Yth Work Mthds
(1-day live)
Instruct Coach
(1-day live)
On-site TA/coac
h(avg 4 hrs
per site)
OrganizationSetting
InstructionSetting
Ou
tco
mes
of
inte
rest
Youth engage instruction
Policy Context Managers engage in training
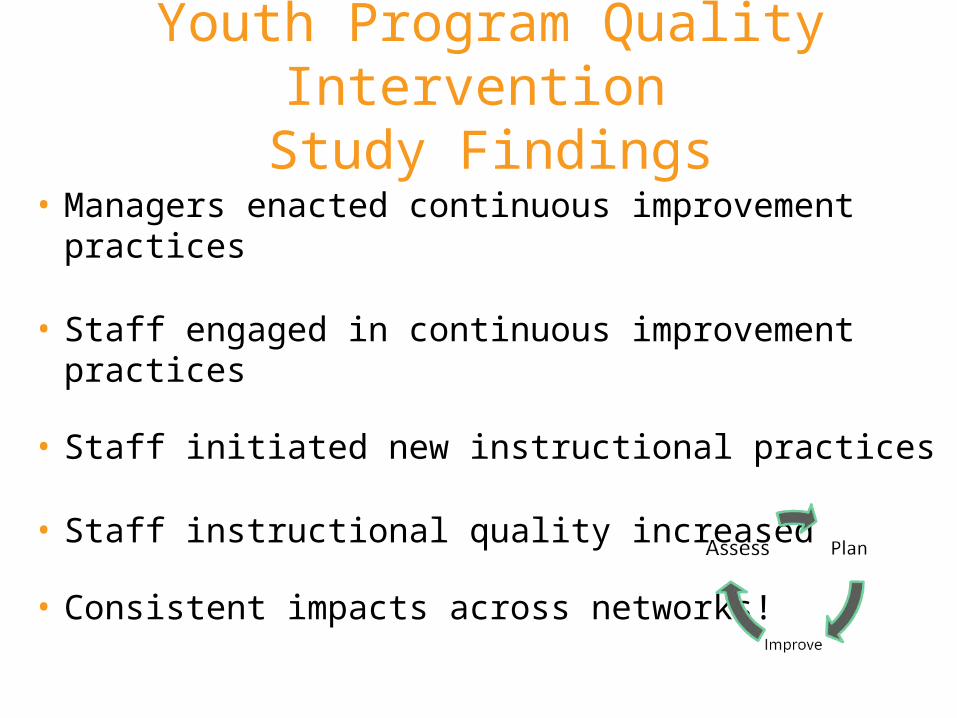
Youth Program Quality Intervention Study Findings
• Managers enacted continuous improvement practices
• Staff engaged in continuous improvement practices
• Staff initiated new instructional practices
• Staff instructional quality increased
• Consistent impacts across networks!

Learning from the YPQI Study
• Quality is malleable
• Quality can be influenced by the institutionalization of continuous improvement practices
• Quality can be influenced in a wide range of contexts (different locations, program types, demographics of staff and youth, etc.)
• Level of implementation matters

A big picture approach to Point of Service quality

Diversity of Sectors in 18 Quality Counts Locations
Sectors Number of locations engaging these sectors
Libraries/Museums 3
Faith-Based 14
Parks/Rec 13
After School 18
Education 7
Funding Streams
United Way Grantees 18
21stCLCC Grantee 4
Juvenile Justice/Child Welfare 12
Prevention/ Health Department, DC, SAMSHA 12

Learning from the Rb21 Quality Counts Pilot Sites (and others)
• Effectiveness: To maximize impact on professional skills, intensity (level of engagement) matters
• Scale: To achieve integration and ownership, build QIS into Big Picture Planning and mandates
• Sustainability: In places where Big Picture Planners are using data, stakeholders see potential for long term ownership

InterventionIntensity(Fidelity)
InterventionOwnership
(Time)
SustainableQIS Policy
PHASE I:CONVENE & DESIGN
PHASE II:FIELD PILOT &
BUILD CAPACITY
PHASE III:ADJUST DESIGN &
GO TO SCALE
Introduce:•Quality Matters•Common language•Research base•Metrics•PQA Basics (Live)
Intervene:•PQA Basics (online)•External Assessment•Planning with Data•Youth Work Methods•Training of Trainers
Customize:•Adjust intervention•Refine metrics•Build technical infrastructure (i.e., scores report; online training)
CHAMPION:Purpose & Design
RECRUIT & CONVENE:Decision makers,
program volunteers, intermediary org.
PILOT METRICS:Collect self- and external
assessment data
FOCUS ON CAPACITY:Intermediary T&TA
& Site mgmt skills
ENGAGE DMs:Make decisions based
on data
CREATE POLICY:Adjust design, mandate
metrics & T&TA planning
GO TO SCALE:Role out new design to
larger pool or sites
Higher Impact,Lower Scale
Higher Scale,Lower Impact
Lower Impact,Lower Scale
Higher Impact,Higher Scale

© The Forum for Youth Investment 2008
Quality Counts Initiative
• Strong policy/leadership horsepower
• Strong, stable program base
• Capacity to assess and improve programs
• Capacity to Recruit, Train, Retain Workforce

Capacity Building: Staff TrainingQYDS: Supports and Opportunities
Interdepartmental Exposure to YPQA:Annesville Residential
DJJOY
New York State’s Ready by 21
QYDS: Connected to TouchstonesSpecial Delinquency Prevention Program
Request
Coordination and support to Quality Counts Counties
Governor’s Summit on Student Engagement and Drop-out Prevention
Schulyer Center Report
Youth Development Policy Statement
Shared Rb21 Principles with Statewide Youth Development Team

Broome County-Ready by 21Quality Counts!
•YB Partnered with Binghamton University to aid in administering the YPQA for YB Funded Programs
• Children and Youth Services Council of Broome County adopted logo and mission of Ready by 21
•Brown Bag Series- Educational & Networking opportunity to youth workers on 5 domains of Ready by 21
• YB Partnered with Binghamton University to map youth program landscape/training needs
• 2 individuals trained in Youth Worker Methods
• YB Partnered with Binghamton University to evaluate monitoring tool and new OYD requirements
Accomplishments/Highlights:
• Forum for Youth Investment Conference hosted by CYSC- Sept. 2007 supported by UW Venture Grant
• Obtained grant from OCFS to continue Ready by 21 effort
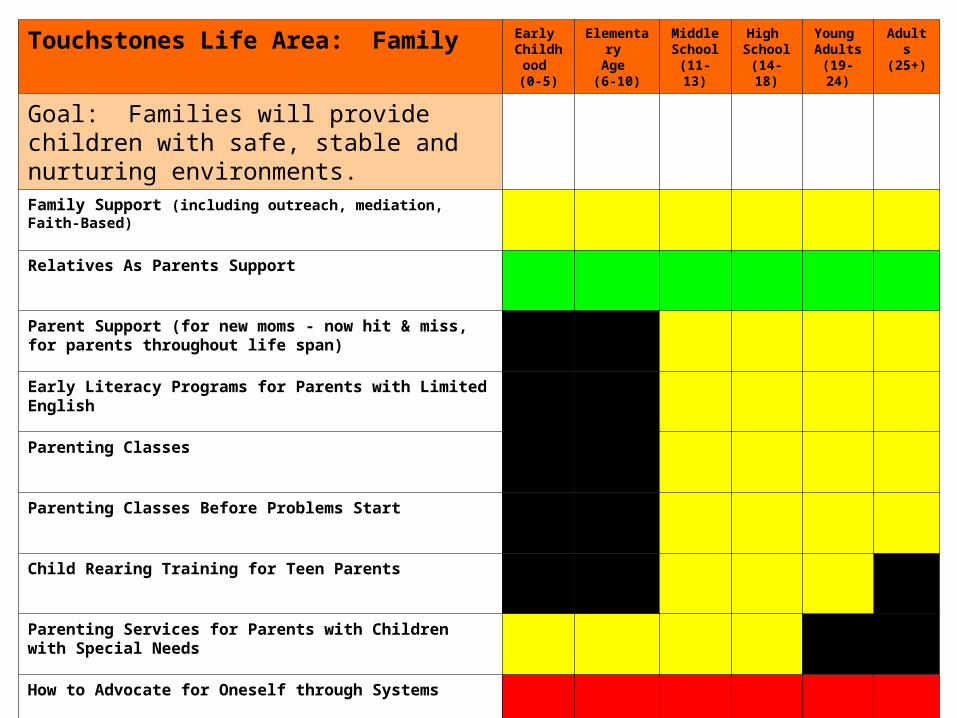
Touchstones Life Area: Family Early Childho
od (0-5)
Elementary
Age (6-10)
Middle School (11-13)
High School (14-18)
Young Adults (19-24)
Adults(25+)
Goal: Families will provide children with safe, stable and nurturing environments.Family Support (including outreach, mediation, Faith-Based)
Relatives As Parents Support
Parent Support (for new moms - now hit & miss, for parents throughout life span)
Early Literacy Programs for Parents with Limited English
Parenting Classes
Parenting Classes Before Problems Start
Child Rearing Training for Teen Parents
Parenting Services for Parents with Children with Special Needs
How to Advocate for Oneself through Systems

Orange County:Capacity to Assess and Improve Programs
• Utilized 18 Multi Disciplined Action Teams for ongoing planning– Children and Family Services Plan
• Development of Dashboards – Use of Touchstones Life Areas aligned with Office of Youth Developments QYDS
• Introduction of Youth Program Quality Improvement System– Aligned Untied Way and Youth Bureau Funding
• Professional Development Workshops– Trained 180 Youth Workers representing after school, residential facilities, homeless shelters,
schools, recreation and alcohol/substance abuse providers
• Taking Youth Engagement to the next level– Student Interns and youth participants “tweaked” YPQA and did assessments
Onondaga County:Capacity to Recruit, Train, Retain Workforce
• In 1994 Onondaga County one of the first counties in the state to offer AYD training
• Prevention Partners for Youth Development – a local collaboration who’s membership was made up of youth bureau, school,
mental health and prevention personnel created a youth development training for supervisors and administrators
• Members of the PPYD collaborative created a rubrics for the features of positive developmental settings
– Youth Bureau decided to infuse this into their allocation and monitoring process
• Youth Bureau further incorporated assessments utilizing the YPQA– In our monitoring, as well as the self and external assessments being conducted,
there are concrete areas we can identify areas to maintain at a quality level or as needing improvement
• Youth Work Methods training– helps to build youth worker skills using youth development principles and they
correspond to the areas identified on the YPQA

www.readyby21.orgwww.forumfyi.org

Background ResearchAmerica’s Promise (2008). A Report from America’s Promise Alliance: Every Child Every Promise. Washington,
DC: America’s Promise. Corporate Voices for Working Families (2008). Strengthening America’s Economic Competitiveness: Public
Policy Strategies to Improve Workforce Readiness. Washington, DC: Corporate Voices for Working Families.
Gambone, M.A., Klem, A.M. & Connell, J.P. (2002). Finding Out What Matters for Youth: Testing Key Links in a Community Action Framework for Youth Development. Philadelphia: Youth Development Strategies, Inc., and Institute for Research and Reform in Education.
HighScope Educational Research Foundation (unknown). The Youth Program Quality Assessment: A research-validated instrument and comprehensive system for: Accountability, Evaluation, Program Improvement. Ypsilanti, MI: HighScope Educational Research Foundation.
Larson, R.W., Hansen, D.M., & Moneta, G. (2006). Differing Profiles of Developmental Experiences Across Types of Organized Youth Activities. Developmental Psychology 42(5), 849-863.
Lopez, S.J. (2009). Gallup Student Poll National Report. Omaha, NE: Gallup, Inc.
© 2008 The Forum for Youth Investment. Ready by 21 and the Ready by 21 Logo are registered trademarks of the Forum for Youth Investment.
35
Related Documents