Downloaded from UvA-DARE, the institutional repository of the University of Amsterdam (UvA) http://hdl.handle.net/11245/2.145387 File ID uvapub:145387 Filename 334628.pdf Version final SOURCE (OR PART OF THE FOLLOWING SOURCE): Type article Title Readiness of the ATLAS Tile Calorimeter for LHC collisions Author(s) G. Aad, . et al., S. Bentvelsen, G.J. Bobbink, K. Bos, A.P. Colijn, P. de Jong, A. Doxiadis, H. Garitaonandia, M. Gosselink, F. Hartjes, N.P. Hessey, et al. Faculty FNWI: Institute for High Energy Physics (IHEF) Year 2010 FULL BIBLIOGRAPHIC DETAILS: http://hdl.handle.net/11245/1.334628 Copyright It is not permitted to download or to forward/distribute the text or part of it without the consent of the author(s) and/or copyright holder(s), other than for strictly personal, individual use, unless the work is under an open content licence (like Creative Commons). UvA-DARE is a service provided by the library of the University of Amsterdam (http://dare.uva.nl) (pagedate: 2014-11-20)

Welcome message from author
This document is posted to help you gain knowledge. Please leave a comment to let me know what you think about it! Share it to your friends and learn new things together.
Transcript
Downloaded from UvA-DARE, the institutional repository of the University of Amsterdam (UvA)http://hdl.handle.net/11245/2.145387
File ID uvapub:145387Filename 334628.pdfVersion final
SOURCE (OR PART OF THE FOLLOWING SOURCE):Type articleTitle Readiness of the ATLAS Tile Calorimeter for LHC collisionsAuthor(s) G. Aad, . et al., S. Bentvelsen, G.J. Bobbink, K. Bos, A.P. Colijn, P. de Jong, A.
Doxiadis, H. Garitaonandia, M. Gosselink, F. Hartjes, N.P. Hessey, et al.Faculty FNWI: Institute for High Energy Physics (IHEF)Year 2010
FULL BIBLIOGRAPHIC DETAILS: http://hdl.handle.net/11245/1.334628
Copyright It is not permitted to download or to forward/distribute the text or part of it without the consent of the author(s) and/orcopyright holder(s), other than for strictly personal, individual use, unless the work is under an open content licence (likeCreative Commons). UvA-DARE is a service provided by the library of the University of Amsterdam (http://dare.uva.nl)(pagedate: 2014-11-20)
Eur. Phys. J. C (2010) 70: 1193–1236DOI 10.1140/epjc/s10052-010-1508-y
Special Article - Tools for Experiment and Theory
Readiness of the ATLAS Tile Calorimeter for LHC collisions
The ATLAS Collaboration�,��
G. Aad48, B. Abbott111, J. Abdallah11, A.A. Abdelalim49, A. Abdesselam118, O. Abdinov10, B. Abi112, M. Abolins88,H. Abramowicz153, H. Abreu115, B.S. Acharya164a,164b, D.L. Adams24, T.N. Addy56, J. Adelman175, C. Adorisio36a,36b,P. Adragna75, T. Adye129, S. Aefsky22, J.A. Aguilar-Saavedra124b,a, M. Aharrouche81, S.P. Ahlen21, F. Ahles48,A. Ahmad148, M. Ahsan40, G. Aielli133a,133b, T. Akdogan18a, T.P.A. Åkesson79, G. Akimoto155, A.V. Akimov94,A. Aktas48, M.S. Alam1, M.A. Alam76, S. Albrand55, M. Aleksa29, I.N. Aleksandrov65, C. Alexa25a, G. Alexander153,G. Alexandre49, T. Alexopoulos9, M. Alhroob20, M. Aliev15, G. Alimonti89a, J. Alison120, M. Aliyev10, P.P. Allport73,S.E. Allwood-Spiers53, J. Almond82, A. Aloisio102a,102b, R. Alon171, A. Alonso79, M.G. Alviggi102a,102b, K. Amako66,C. Amelung22, A. Amorim124a,b, G. Amorós167, N. Amram153, C. Anastopoulos139, T. Andeen29, C.F. Anders48,K.J. Anderson30, A. Andreazza89a,89b, V. Andrei58a, X.S. Anduaga70, A. Angerami34, F. Anghinolfi29, N. Anjos124a,A. Annovi47, A. Antonaki8, M. Antonelli47, S. Antonelli19a,19b, J. Antos144b, B. Antunovic41, F. Anulli132a, S. Aoun83,G. Arabidze8, I. Aracena143, Y. Arai66, A.T.H. Arce44, J.P. Archambault28, S. Arfaoui29,c, J.-F. Arguin14,T. Argyropoulos9, M. Arik18a, A.J. Armbruster87, O. Arnaez4, C. Arnault115, A. Artamonov95, D. Arutinov20,M. Asai143, S. Asai155, R. Asfandiyarov172, S. Ask82, B. Åsman146a,146b, D. Asner28, L. Asquith77, K. Assamagan24,A. Astvatsatourov52, G. Atoian175, B. Auerbach175, K. Augsten127, M. Aurousseau4, N. Austin73, G. Avolio163,R. Avramidou9, C. Ay54, G. Azuelos93,d, Y. Azuma155, M.A. Baak29, A.M. Bach14, H. Bachacou136, K. Bachas29,M. Backes49, E. Badescu25a, P. Bagnaia132a,132b, Y. Bai32a, T. Bain158, J.T. Baines129, O.K. Baker175, M.D. Baker24,S. Baker77, F. Baltasar Dos Santos Pedrosa29, E. Banas38, P. Banerjee93, S. Banerjee169, D. Banfi89a,89b,A. Bangert137, V. Bansal169, S.P. Baranov94, A. Barashkou65, T. Barber27, E.L. Barberio86, D. Barberis50a,50b,M. Barbero20, D.Y. Bardin65, T. Barillari99, M. Barisonzi174, T. Barklow143, N. Barlow27, B.M. Barnett129,R.M. Barnett14, A. Baroncelli134a, A.J. Barr118, F. Barreiro80, J. Barreiro Guimarães da Costa57, P. Barrillon115,R. Bartoldus143, D. Bartsch20, R.L. Bates53, L. Batkova144a, J.R. Batley27, A. Battaglia16, M. Battistin29, F. Bauer136,H.S. Bawa143, M. Bazalova125, B. Beare158, T. Beau78, P.H. Beauchemin118, R. Beccherle50a, P. Bechtle41,G.A. Beck75, H.P. Beck16, M. Beckingham48, K.H. Becks174, A.J. Beddall18c, A. Beddall18c, V.A. Bednyakov65,C. Bee83, M. Begel24, S. Behar Harpaz152, P.K. Behera63, M. Beimforde99, C. Belanger-Champagne166, P.J. Bell49,W.H. Bell49, G. Bella153, L. Bellagamba19a, F. Bellina29, M. Bellomo119a, A. Belloni57, K. Belotskiy96,O. Beltramello29, S. Ben Ami152, O. Benary153, D. Benchekroun135a, M. Bendel81, B.H. Benedict163, N. Benekos165,Y. Benhammou153, D.P. Benjamin44, M. Benoit115, J.R. Bensinger22, K. Benslama130, S. Bentvelsen105, M. Beretta47,D. Berge29, E. Bergeaas Kuutmann41, N. Berger4, F. Berghaus169, E. Berglund49, J. Beringer14, P. Bernat115,R. Bernhard48, C. Bernius77, T. Berry76, A. Bertin19a,19b, M.I. Besana89a,89b, N. Besson136, S. Bethke99,R.M. Bianchi48, M. Bianco72a,72b, O. Biebel98, J. Biesiada14, M. Biglietti132a,132b, H. Bilokon47, M. Bindi19a,19b,A. Bingul18c, C. Bini132a,132b, C. Biscarat180, U. Bitenc48, K.M. Black57, R.E. Blair5, J.-B. Blanchard115,G. Blanchot29, C. Blocker22, A. Blondel49, W. Blum81, U. Blumenschein54, G.J. Bobbink105, A. Bocci44,M. Boehler41, J. Boek174, N. Boelaert79, S. Böser77, J.A. Bogaerts29, A. Bogouch90,*, C. Bohm146a, J. Bohm125,V. Boisvert76, T. Bold163,e, V. Boldea25a, V.G. Bondarenko96, M. Bondioli163, M. Boonekamp136, S. Bordoni78,C. Borer16, A. Borisov128, G. Borissov71, I. Borjanovic12a, S. Borroni132a,132b, K. Bos105, D. Boscherini19a,M. Bosman11, H. Boterenbrood105, J. Bouchami93, J. Boudreau123, E.V. Bouhova-Thacker71, C. Boulahouache123,C. Bourdarios115, A. Boveia30, J. Boyd29, I.R. Boyko65, I. Bozovic-Jelisavcic12b, J. Bracinik17, A. Braem29,P. Branchini134a, A. Brandt7, G. Brandt41, O. Brandt54, U. Bratzler156, B. Brau84, J.E. Brau114, H.M. Braun174,B. Brelier158, J. Bremer29, R. Brenner166, S. Bressler152, D. Britton53, F.M. Brochu27, I. Brock20, R. Brock88,E. Brodet153, C. Bromberg88, G. Brooijmans34, W.K. Brooks31b, G. Brown82, P.A. Bruckman de Renstrom38,D. Bruncko144b, R. Bruneliere48, S. Brunet41, A. Bruni19a, G. Bruni19a, M. Bruschi19a, F. Bucci49, J. Buchanan118,P. Buchholz141, A.G. Buckley45, I.A. Budagov65, B. Budick108, V. Büscher81, L. Bugge117, O. Bulekov96, M. Bunse42,T. Buran117, H. Burckhart29, S. Burdin73, T. Burgess13, S. Burke129, E. Busato33, P. Bussey53, C.P. Buszello166,F. Butin29, B. Butler143, J.M. Butler21, C.M. Buttar53, J.M. Butterworth77, T. Byatt77, J. Caballero24, S. Cabrera
1194 Eur. Phys. J. C (2010) 70: 1193–1236
Urbán167, D. Caforio19a,19b, O. Cakir3a, P. Calafiura14, G. Calderini78, P. Calfayan98, R. Calkins106, L.P. Caloba23a,D. Calvet33, P. Camarri133a,133b, D. Cameron117, S. Campana29, M. Campanelli77, V. Canale102a,102b, F. Canelli30,A. Canepa159a, J. Cantero80, L. Capasso102a,102b, M.D.M. Capeans Garrido29, I. Caprini25a, M. Caprini25a,M. Capua36a,36b, R. Caputo148, C. Caramarcu25a, R. Cardarelli133a, T. Carli29, G. Carlino102a, L. Carminati89a,89b,B. Caron2,f, S. Caron48, G.D. Carrillo Montoya172, S. Carron Montero158, A.A. Carter75, J.R. Carter27,J. Carvalho124a,g, D. Casadei108, M.P. Casado11, M. Cascella122a,122b, A.M. Castaneda Hernandez172,E. Castaneda-Miranda172, V. Castillo Gimenez167, N.F. Castro124b,a, G. Cataldi72a, A. Catinaccio29, J.R. Catmore71,A. Cattai29, G. Cattani133a,133b, S. Caughron34, P. Cavalleri78, D. Cavalli89a, M. Cavalli-Sforza11,V. Cavasinni122a,122b, F. Ceradini134a,134b, A.S. Cerqueira23a, A. Cerri29, L. Cerrito75, F. Cerutti47, S.A. Cetin18b,A. Chafaq135a, D. Chakraborty106, K. Chan2, J.D. Chapman27, J.W. Chapman87, E. Chareyre78, D.G. Charlton17,V. Chavda82, S. Cheatham71, S. Chekanov5, S.V. Chekulaev159a, G.A. Chelkov65, H. Chen24, S. Chen32c, X. Chen172,A. Cheplakov65, V.F. Chepurnov65, R. Cherkaoui El Moursli135d, V. Tcherniatine24, D. Chesneanu25a, E. Cheu6,S.L. Cheung158, L. Chevalier136, F. Chevallier136, G. Chiefari102a,102b, L. Chikovani51, J.T. Childers58a,A. Chilingarov71, G. Chiodini72a, V. Chizhov65, G. Choudalakis30, S. Chouridou137, I.A. Christidi77, A. Christov48,D. Chromek-Burckhart29, M.L. Chu151, J. Chudoba125, G. Ciapetti132a,132b, A.K. Ciftci3a, R. Ciftci3a, D. Cinca33,V. Cindro74, M.D. Ciobotaru163, C. Ciocca19a,19b, A. Ciocio14, M. Cirilli87,h, A. Clark49, P.J. Clark45, W. Cleland123,J.C. Clemens83, B. Clement55, C. Clement146a,146b, Y. Coadou83, M. Cobal164a,164c, A. Coccaro50a,50b, J. Cochran64,J. Coggeshall165, E. Cogneras180, A.P. Colijn105, C. Collard115, N.J. Collins17, C. Collins-Tooth53, J. Collot55,G. Colon84, P. Conde Muiño124a, E. Coniavitis166, M.C. Conidi11, M. Consonni104, S. Constantinescu25a,C. Conta119a,119b, F. Conventi102a,i, M. Cooke34, B.D. Cooper75, A.M. Cooper-Sarkar118, N.J. Cooper-Smith76,K. Copic34, T. Cornelissen50a,50b, M. Corradi19a, F. Corriveau85,j, A. Corso-Radu163, A. Cortes-Gonzalez165,G. Cortiana99, G. Costa89a, M.J. Costa167, D. Costanzo139, T. Costin30, D. Côté29, R. Coura Torres23a,L. Courneyea169, G. Cowan76, C. Cowden27, B.E. Cox82, K. Cranmer108, J. Cranshaw5, M. Cristinziani20,G. Crosetti36a,36b, R. Crupi72a,72b, S. Crépé-Renaudin55, C. Cuenca Almenar175, T. Cuhadar Donszelmann139,M. Curatolo47, C.J. Curtis17, P. Cwetanski61, Z. Czyczula175, S. D’Auria53, M. D’Onofrio73, A. D’Orazio99,C. Da Via82, W. Dabrowski37, T. Dai87, C. Dallapiccola84, S.J. Dallison129,*, C.H. Daly138, M. Dam35,H.O. Danielsson29, D. Dannheim99, V. Dao49, G. Darbo50a, G.L. Darlea25b, W. Davey86, T. Davidek126, N. Davidson86,R. Davidson71, M. Davies93, A.R. Davison77, I. Dawson139, R.K. Daya39, K. De7, R. de Asmundis102a,S. De Castro19a,19b, P.E. De Castro Faria Salgado24, S. De Cecco78, J. de Graat98, N. De Groot104, P. de Jong105,L. De Mora71, M. De Oliveira Branco29, D. De Pedis132a, A. De Salvo132a, U. De Sanctis164a,164c, A. De Santo149,J.B. De Vivie De Regie115, S. Dean77, D.V. Dedovich65, J. Degenhardt120, M. Dehchar118, C. Del Papa164a,164c,J. Del Peso80, T. Del Prete122a,122b, A. Dell’Acqua29, L. Dell’Asta89a,89b, M. Della Pietra102a,k, D. della Volpe102a,102b,M. Delmastro29, P.A. Delsart55, C. Deluca148, S. Demers175, M. Demichev65, B. Demirkoz11, J. Deng163, W. Deng24,S.P. Denisov128, J.E. Derkaoui135c, F. Derue78, P. Dervan73, K. Desch20, P.O. Deviveiros158, A. Dewhurst129,B. DeWilde148, S. Dhaliwal158, R. Dhullipudi24,l, A. Di Ciaccio133a,133b, L. Di Ciaccio4, A. Di Girolamo29,B. Di Girolamo29, S. Di Luise134a,134b, A. Di Mattia88, R. Di Nardo133a,133b, A. Di Simone133a,133b, R. Di Sipio19a,19b,M.A. Diaz31a, F. Diblen18c, E.B. Diehl87, J. Dietrich48, T.A. Dietzsch58a, S. Diglio115, K. Dindar Yagci39,J. Dingfelder48, C. Dionisi132a,132b, P. Dita25a, S. Dita25a, F. Dittus29, F. Djama83, R. Djilkibaev108, T. Djobava51,M.A.B. do Vale23a, A. Do Valle Wemans124a, T.K.O. Doan4, D. Dobos29, E. Dobson29, M. Dobson163, C. Doglioni118,T. Doherty53, J. Dolejsi126, I. Dolenc74, Z. Dolezal126, B.A. Dolgoshein96, T. Dohmae155, M. Donega120, J. Donini55,J. Dopke174, A. Doria102a, A. Dos Anjos172, A. Dotti122a,122b, M.T. Dova70, A. Doxiadis105, A.T. Doyle53, Z. Drasal126,M. Dris9, J. Dubbert99, E. Duchovni171, G. Duckeck98, A. Dudarev29, F. Dudziak115, M. Dührssen29, L. Duflot115,M.-A. Dufour85, M. Dunford30, H. Duran Yildiz3b, R. Duxfield139, M. Dwuznik37, M. Düren52, W.L. Ebenstein44,J. Ebke98, S. Eckweiler81, K. Edmonds81, C.A. Edwards76, K. Egorov61, W. Ehrenfeld41, T. Ehrich99, T. Eifert29,G. Eigen13, K. Einsweiler14, E. Eisenhandler75, T. Ekelof166, M. El Kacimi4, M. Ellert166, S. Elles4, F. Ellinghaus81,K. Ellis75, N. Ellis29, J. Elmsheuser98, M. Elsing29, D. Emeliyanov129, R. Engelmann148, A. Engl98, B. Epp62,A. Eppig87, J. Erdmann54, A. Ereditato16, D. Eriksson146a, I. Ermoline88, J. Ernst1, M. Ernst24, J. Ernwein136,D. Errede165, S. Errede165, E. Ertel81, M. Escalier115, C. Escobar167, X. Espinal Curull11, B. Esposito47,A.I. Etienvre136, E. Etzion153, H. Evans61, L. Fabbri19a,19b, C. Fabre29, K. Facius35, R.M. Fakhrutdinov128,S. Falciano132a, Y. Fang172, M. Fanti89a,89b, A. Farbin7, A. Farilla134a, J. Farley148, T. Farooque158,S.M. Farrington118, P. Farthouat29, P. Fassnacht29, D. Fassouliotis8, B. Fatholahzadeh158, L. Fayard115, F. Fayette54,R. Febbraro33, P. Federic144a, O.L. Fedin121, W. Fedorko29, L. Feligioni83, C.U. Felzmann86, C. Feng32d, E.J. Feng30,
Eur. Phys. J. C (2010) 70: 1193–1236 1195
A.B. Fenyuk128, J. Ferencei144b, J. Ferland93, B. Fernandes124a,m, W. Fernando109, S. Ferrag53, J. Ferrando118,V. Ferrara41, A. Ferrari166, P. Ferrari105, R. Ferrari119a, A. Ferrer167, M.L. Ferrer47, D. Ferrere49, C. Ferretti87,M. Fiascaris118, F. Fiedler81, A. Filipcic74, A. Filippas9, F. Filthaut104, M. Fincke-Keeler169, M.C.N. Fiolhais124a,g,L. Fiorini11, A. Firan39, G. Fischer41, M.J. Fisher109, M. Flechl48, I. Fleck141, J. Fleckner81, P. Fleischmann173,S. Fleischmann20, T. Flick174, L.R. Flores Castillo172, M.J. Flowerdew99, T.Fonseca Martin76, J. Fopma118,A. Formica136, A. Forti82, D. Fortin159a, D. Fournier115, A.J. Fowler44, K. Fowler137, H. Fox71, P. Francavilla122a,122b,S. Franchino119a,119b, D. Francis29, M. Franklin57, S. Franz29, M. Fraternali119a,119b, S. Fratina120, J. Freestone82,S.T. French27, R. Froeschl29, D. Froidevaux29, J.A. Frost27, C. Fukunaga156, E. Fullana Torregrosa5, J. Fuster167,C. Gabaldon80, O. Gabizon171, T. Gadfort24, S. Gadomski49, G. Gagliardi50a,50b, P. Gagnon61, C. Galea98,E.J. Gallas118, V. Gallo16, B.J. Gallop129, P. Gallus125, E. Galyaev40, K.K. Gan109, Y.S. Gao143,n, A. Gaponenko14,M. Garcia-Sciveres14, C. García167, J.E. García Navarro49, R.W. Gardner30, N. Garelli29, H. Garitaonandia105,V. Garonne29, C. Gatti47, G. Gaudio119a, V. Gautard136, P. Gauzzi132a,132b, I.L. Gavrilenko94, C. Gay168,G. Gaycken20, E.N. Gazis9, P. Ge32d, C.N.P. Gee129, Ch. Geich-Gimbel20, K. Gellerstedt146a,146b, C. Gemme50a,M.H. Genest98, S. Gentile132a,132b, F. Georgatos9, S. George76, A. Gershon153, H. Ghazlane135d, N. Ghodbane33,B. Giacobbe19a, S. Giagu132a,132b, V. Giakoumopoulou8, V. Giangiobbe122a,122b, F. Gianotti29, B. Gibbard24,A. Gibson158, S.M. Gibson118, L.M. Gilbert118, M. Gilchriese14, V. Gilewsky91, D.M. Gingrich2,o, J. Ginzburg153,N. Giokaris8, M.P. Giordani164a,164c, R. Giordano102a,102b, F.M. Giorgi15, P. Giovannini99, P.F. Giraud136,P. Girtler62, D. Giugni89a, P. Giusti19a, B.K. Gjelsten117, L.K. Gladilin97, C. Glasman80, A. Glazov41, K.W. Glitza174,G.L. Glonti65, J. Godfrey142, J. Godlewski29, M. Goebel41, T. Göpfert43, C. Goeringer81, C. Gössling42, T. Göttfert99,V. Goggi119a,119b,p, S. Goldfarb87, D. Goldin39, T. Golling175, A. Gomes124a,q, L.S. Gomez Fajardo41, R. Gonçalo76,L. Gonella20, C. Gong32b, S. González de la Hoz167, M.L. Gonzalez Silva26, S. Gonzalez-Sevilla49, J.J. Goodson148,L. Goossens29, H.A. Gordon24, I. Gorelov103, G. Gorfine174, B. Gorini29, E. Gorini72a,72b, A. Gorišek74,E. Gornicki38, B. Gosdzik41, M. Gosselink105, M.I. Gostkin65, I. Gough Eschrich163, M. Gouighri135a,D. Goujdami135a, M.P. Goulette49, A.G. Goussiou138, C. Goy4, I. Grabowska-Bold163,r, P. Grafström29,K.-J. Grahn147, S. Grancagnolo15, V. Grassi148, V. Gratchev121, N. Grau34, H.M. Gray34,s, J.A. Gray148,E. Graziani134a, B. Green76, T. Greenshaw73, Z.D. Greenwood24,t, I.M. Gregor41, P. Grenier143, E. Griesmayer46,J. Griffiths138, N. Grigalashvili65, A.A. Grillo137, K. Grimm148, S. Grinstein11, Y.V. Grishkevich97, M. Groh99,M. Groll81, E. Gross171, J. Grosse-Knetter54, J. Groth-Jensen79, K. Grybel141, C. Guicheney33, A. Guida72a,72b,T. Guillemin4, H. Guler85,u, J. Gunther125, B. Guo158, L. Gurriana124a, Y. Gusakov65, A. Gutierrez93,P. Gutierrez111, N. Guttman153, O. Gutzwiller172, C. Guyot136, C. Gwenlan118, C.B. Gwilliam73, A. Haas143,S. Haas29, C. Haber14, H.K. Hadavand39, D.R. Hadley17, P. Haefner99, S. Haider29, Z. Hajduk38, H. Hakobyan176,J. Haller41,v, K. Hamacher174, A. Hamilton49, S. Hamilton161, L. Han32b, K. Hanagaki116, M. Hance120, C. Handel81,P. Hanke58a, J.R. Hansen35, J.B. Hansen35, J.D. Hansen35, P.H. Hansen35, T. Hansl-Kozanecka137, P. Hansson143,K. Hara160, G.A. Hare137, T. Harenberg174, R.D. Harrington21, O.M. Harris138, K. Harrison17, J. Hartert48,F. Hartjes105, A. Harvey56, S. Hasegawa101, Y. Hasegawa140, S. Hassani136, S. Haug16, M. Hauschild29, R. Hauser88,M. Havranek125, C.M. Hawkes17, R.J. Hawkings29, T. Hayakawa67, H.S. Hayward73, S.J. Haywood129, S.J. Head82,V. Hedberg79, L. Heelan28, S. Heim88, B. Heinemann14, S. Heisterkamp35, L. Helary4, M. Heller115,S. Hellman146a,146b, C. Helsens11, T. Hemperek20, R.C.W. Henderson71, M. Henke58a, A. Henrichs54,A.M. Henriques Correia29, S. Henrot-Versille115, C. Hensel54, T. Henß174, Y. Hernández Jiménez167,A.D. Hershenhorn152, G. Herten48, R. Hertenberger98, L. Hervas29, N.P. Hessey105, E. Higón-Rodriguez167,J.C. Hill27, K.H. Hiller41, S. Hillert146a,146b, S.J. Hillier17, I. Hinchliffe14, E. Hines120, M. Hirose116, F. Hirsch42,D. Hirschbuehl174, J. Hobbs148, N. Hod153, M.C. Hodgkinson139, P. Hodgson139, A. Hoecker29, M.R. Hoeferkamp103,J. Hoffman39, D. Hoffmann83, M. Hohlfeld81, D. Hollander30, T. Holy127, J.L. Holzbauer88, Y. Homma67,T. Horazdovsky127, T. Hori67, C. Horn143, S. Horner48, S. Horvat99, J.-Y. Hostachy55, S. Hou151, A. Hoummada135a,T. Howe39, J. Hrivnac115, T. Hryn’ova4, P.J. Hsu175, S.-C. Hsu14, G.S. Huang111, Z. Hubacek127, F. Hubaut83,F. Huegging20, T.B. Huffman118, E.W. Hughes34, G. Hughes71, M. Hurwitz30, U. Husemann41, N. Huseynov10,J. Huston88, J. Huth57, G. Iacobucci102a, G. Iakovidis9, I. Ibragimov141, L. Iconomidou-Fayard115, J. Idarraga159b,P. Iengo4, O. Igonkina105, Y. Ikegami66, M. Ikeno66, Y. Ilchenko39, D. Iliadis154, T. Ince20, P. Ioannou8, M. Iodice134a,A. Irles Quiles167, A. Ishikawa67, M. Ishino66, R. Ishmukhametov39, T. Isobe155, C. Issever118, S. Istin18a, Y. Itoh101,A.V. Ivashin128, W. Iwanski38, H. Iwasaki66, J.M. Izen40, V. Izzo102a, B. Jackson120, J.N. Jackson73, P. Jackson143,M.R. Jaekel29, V. Jain61, K. Jakobs48, S. Jakobsen35, J. Jakubek127, D.K. Jana111, E. Jankowski158, E. Jansen77,A. Jantsch99, M. Janus48, G. Jarlskog79, L. Jeanty57, I. Jen-La Plante30, P. Jenni29, P. Jež35, S. Jézéquel4, W. Ji79,
1196 Eur. Phys. J. C (2010) 70: 1193–1236
J. Jia148, Y. Jiang32b, M. Jimenez Belenguer29, S. Jin32a, O. Jinnouchi157, D. Joffe39, M. Johansen146a,146b,K.E. Johansson146a, P. Johansson139, S. Johnert41, K.A. Johns6, K. Jon-And146a,146b, G. Jones82, R.W.L. Jones71,T.J. Jones73, P.M. Jorge124a,b, J. Joseph14, V. Juranek125, P. Jussel62, V.V. Kabachenko128, M. Kaci167,A. Kaczmarska38, M. Kado115, H. Kagan109, M. Kagan57, S. Kaiser99, E. Kajomovitz152, S. Kalinin174,L.V. Kalinovskaya65, S. Kama41, N. Kanaya155, M. Kaneda155, V.A. Kantserov96, J. Kanzaki66, B. Kaplan175,A. Kapliy30, J. Kaplon29, D. Kar43, M. Karagounis20, M. Karagoz Unel118, M. Karnevskiy41, V. Kartvelishvili71,A.N. Karyukhin128, L. Kashif57, A. Kasmi39, R.D. Kass109, A. Kastanas13, M. Kastoryano175, M. Kataoka4,Y. Kataoka155, E. Katsoufis9, J. Katzy41, V. Kaushik6, K. Kawagoe67, T. Kawamoto155, G. Kawamura81,M.S. Kayl105, F. Kayumov94, V.A. Kazanin107, M.Y. Kazarinov65, J.R. Keates82, R. Keeler169, P.T. Keener120,R. Kehoe39, M. Keil54, G.D. Kekelidze65, M. Kelly82, M. Kenyon53, O. Kepka125, N. Kerschen29, B.P. Kerševan74,S. Kersten174, K. Kessoku155, M. Khakzad28, F. Khalil-zada10, H. Khandanyan165, A. Khanov112, D. Kharchenko65,A. Khodinov148, A. Khomich58a, G. Khoriauli20, N. Khovanskiy65, V. Khovanskiy95, E. Khramov65, J. Khubua51,H. Kim7, M.S. Kim2, P.C. Kim143, S.H. Kim160, O. Kind15, P. Kind174, B.T. King73, J. Kirk129, G.P. Kirsch118,L.E. Kirsch22, A.E. Kiryunin99, D. Kisielewska37, T. Kittelmann123, H. Kiyamura67, E. Kladiva144b, M. Klein73,U. Klein73, K. Kleinknecht81, M. Klemetti85, A. Klier171, A. Klimentov24, R. Klingenberg42, E.B. Klinkby44,T. Klioutchnikova29, P.F. Klok104, S. Klous105, E.-E. Kluge58a, T. Kluge73, P. Kluit105, M. Klute54, S. Kluth99,N.S. Knecht158, E. Kneringer62, B.R. Ko44, T. Kobayashi155, M. Kobel43, B. Koblitz29, M. Kocian143, A. Kocnar113,P. Kodys126, K. Köneke41, A.C. König104, S. Koenig81, L. Köpke81, F. Koetsveld104, P. Koevesarki20, T. Koffas29,E. Koffeman105, F. Kohn54, Z. Kohout127, T. Kohriki66, H. Kolanoski15, V. Kolesnikov65, I. Koletsou4, J. Koll88,D. Kollar29, S. Kolos163,w, S.D. Kolya82, A.A. Komar94, J.R. Komaragiri142, T. Kondo66, T. Kono41,x,R. Konoplich108, S.P. Konovalov94, N. Konstantinidis77, S. Koperny37, K. Korcyl38, K. Kordas154, A. Korn14,I. Korolkov11, E.V. Korolkova139, V.A. Korotkov128, O. Kortner99, P. Kostka41, V.V. Kostyukhin20, S. Kotov99,V.M. Kotov65, K.Y. Kotov107, C. Kourkoumelis8, A. Koutsman105, R. Kowalewski169, H. Kowalski41,T.Z. Kowalski37, W. Kozanecki136, A.S. Kozhin128, V. Kral127, V.A. Kramarenko97, G. Kramberger74,M.W. Krasny78, A. Krasznahorkay108, J. Kraus88, A. Kreisel153, F. Krejci127, J. Kretzschmar73, N. Krieger54,P. Krieger158, K. Kroeninger54, H. Kroha99, J. Kroll120, J. Kroseberg20, J. Krstic12a, U. Kruchonak65, H. Krüger20,Z.V. Krumshteyn65, T. Kubota155, S. Kuehn48, A. Kugel58c, T. Kuhl174, D. Kuhn62, V. Kukhtin65, Y. Kulchitsky90,S. Kuleshov31b, C. Kummer98, M. Kuna83, J. Kunkle120, A. Kupco125, H. Kurashige67, M. Kurata160,Y.A. Kurochkin90, V. Kus125, R. Kwee15, A. La Rosa29, L. La Rotonda36a,36b, J. Labbe4, C. Lacasta167,F. Lacava132a,132b, H. Lacker15, D. Lacour78, V.R. Lacuesta167, E. Ladygin65, R. Lafaye4, B. Laforge78, T. Lagouri80,S. Lai48, M. Lamanna29, C.L. Lampen6, W. Lampl6, E. Lancon136, U. Landgraf48, M.P.J. Landon75, J.L. Lane82,A.J. Lankford163, F. Lanni24, K. Lantzsch29, A. Lanza119a, S. Laplace4, C. Lapoire83, J.F. Laporte136, T. Lari89a,A. Larner118, M. Lassnig29, P. Laurelli47, W. Lavrijsen14, P. Laycock73, A.B. Lazarev65, A. Lazzaro89a,89b,O. Le Dortz78, E. Le Guirriec83, E. Le Menedeu136, A. Lebedev64, C. Lebel93, T. LeCompte5, F. Ledroit-Guillon55,H. Lee105, J.S.H. Lee150, S.C. Lee151, M. Lefebvre169, M. Legendre136, B.C. LeGeyt120, F. Legger98, C. Leggett14,M. Lehmacher20, G. Lehmann Miotto29, X. Lei6, R. Leitner126, D. Lellouch171, J. Lellouch78, V. Lendermann58a,K.J.C. Leney73, T. Lenz174, G. Lenzen174, B. Lenzi136, K. Leonhardt43, C. Leroy93, J.-R. Lessard169, C.G. Lester27,A. Leung Fook Cheong172, J. Levêque83, D. Levin87, L.J. Levinson171, M. Leyton15, H. Li172, X. Li87, Z. Liang39,Z. Liang151,y, B. Liberti133a, P. Lichard29, M. Lichtnecker98, K. Lie165, W. Liebig105, J.N. Lilley17, A. Limosani86,M. Limper63, S.C. Lin151, J.T. Linnemann88, E. Lipeles120, L. Lipinsky125, A. Lipniacka13, T.M. Liss165,D. Lissauer24, A. Lister49, A.M. Litke137, C. Liu28, D. Liu151,z, H. Liu87, J.B. Liu87, M. Liu32b, T. Liu39, Y. Liu32b,M. Livan119a,119b, A. Lleres55, S.L. Lloyd75, E. Lobodzinska41, P. Loch6, W.S. Lockman137, S. Lockwitz175,T. Loddenkoetter20, F.K. Loebinger82, A. Loginov175, C.W. Loh168, T. Lohse15, K. Lohwasser48, M. Lokajicek125,R.E. Long71, L. Lopes124a,b, D. Lopez Mateos34,aa, M. Losada162, P. Loscutoff14, X. Lou40, A. Lounis115,K.F. Loureiro109, L. Lovas144a, J. Love21, P.A. Love71, A.J. Lowe61, F. Lu32a, H.J. Lubatti138, C. Luci132a,132b,A. Lucotte55, A. Ludwig43, D. Ludwig41, I. Ludwig48, F. Luehring61, D. Lumb48, L. Luminari132a, E. Lund117,B. Lund-Jensen147, B. Lundberg79, J. Lundberg29, J. Lundquist35, D. Lynn24, J. Lys14, E. Lytken79, H. Ma24,L.L. Ma172, J.A. Macana Goia93, G. Maccarrone47, A. Macchiolo99, B. Macek74, J. Machado Miguens124a,b,R. Mackeprang35, R.J. Madaras14, W.F. Mader43, R. Maenner58c, T. Maeno24, P. Mättig174, S. Mättig41,P.J. Magalhaes Martins124a,g, E. Magradze51, Y. Mahalalel153, K. Mahboubi48, A. Mahmood1, C. Maiani132a,132b,C. Maidantchik23a, A. Maio124a,q, S. Majewski24, Y. Makida66, M. Makouski128, N. Makovec115, Pa. Malecki38,P. Malecki38, V.P. Maleev121, F. Malek55, U. Mallik63, D. Malon5, S. Maltezos9, V. Malyshev107, S. Malyukov65,
Eur. Phys. J. C (2010) 70: 1193–1236 1197
M. Mambelli30, R. Mameghani98, J. Mamuzic41, L. Mandelli89a, I. Mandic74, R. Mandrysch15, J. Maneira124a,P.S. Mangeard88, L. Manhaes de Andrade Filho23a, I.D. Manjavidze65, P.M. Manning137,A. Manousakis-Katsikakis8, B. Mansoulie136, A. Mapelli29, L. Mapelli29, L. March80, J.F. Marchand4,F. Marchese133a,133b, G. Marchiori78, M. Marcisovsky125, C.P. Marino61, F. Marroquim23a, Z. Marshall34,aa,S. Marti-Garcia167, A.J. Martin75, A.J. Martin175, B. Martin29, B. Martin88, F.F. Martin120, J.P. Martin93,T.A. Martin17, B. Martin dit Latour49, M. Martinez11, V. Martinez Outschoorn57, A.C. Martyniuk82,F. Marzano132a, A. Marzin136, L. Masetti20, T. Mashimo155, R. Mashinistov96, J. Masik82, A.L. Maslennikov107,I. Massa19a,19b, N. Massol4, A. Mastroberardino36a,36b, T. Masubuchi155, P. Matricon115, H. Matsunaga155,T. Matsushita67, C. Mattravers118,ab, S.J. Maxfield73, A. Mayne139, R. Mazini151, M. Mazur48, J. Mc Donald85,S.P. Mc Kee87, A. McCarn165, R.L. McCarthy148, N.A. McCubbin129, K.W. McFarlane56, H. McGlone53,G. Mchedlidze51, S.J. McMahon129, R.A. McPherson169,j, A. Meade84, J. Mechnich105, M. Mechtel174,M. Medinnis41, R. Meera-Lebbai111, T.M. Meguro116, S. Mehlhase41, A. Mehta73, K. Meier58a, B. Meirose48,C. Melachrinos30, B.R. Mellado Garcia172, L. Mendoza Navas162, Z. Meng151,ac, S. Menke99, E. Meoni11,P. Mermod118, L. Merola102a,102b, C. Meroni89a, F.S. Merritt30, A.M. Messina29, J. Metcalfe103, A.S. Mete64,J.-P. Meyer136, J. Meyer173, J. Meyer54, T.C. Meyer29, W.T. Meyer64, J. Miao32d, S. Michal29, L. Micu25a,R.P. Middleton129, S. Migas73, L. Mijovic74, G. Mikenberg171, M. Mikestikova125, M. Mikuž74, D.W. Miller143,M. Miller30, W.J. Mills168, C.M. Mills57, A. Milov171, D.A. Milstead146a,146b, D. Milstein171, A.A. Minaenko128,M. Miñano167, I.A. Minashvili65, A.I. Mincer108, B. Mindur37, M. Mineev65, Y. Ming130, L.M. Mir11,G. Mirabelli132a, S. Misawa24, A. Misiejuk76, J. Mitrevski137, V.A. Mitsou167, P.S. Miyagawa82, J.U. Mjörnmark79,T. Moa146a,146b, S. Moed57, V. Moeller27, K. Mönig41, N. Möser20, W. Mohr48, S. Mohrdieck-Möck99,R. Moles-Valls167, J. Molina-Perez29, J. Monk77, E. Monnier83, S. Montesano89a,89b, F. Monticelli70, R.W. Moore2,C. Mora Herrera49, A. Moraes53, A. Morais124a,b, J. Morel54, G. Morello36a,36b, D. Moreno162, M. Moreno Llácer167,P. Morettini50a, M. Morii57, A.K. Morley86, G. Mornacchi29, S.V. Morozov96, J.D. Morris75, H.G. Moser99,M. Mosidze51, J. Moss109, R. Mount143, E. Mountricha136, S.V. Mouraviev94, E.J.W. Moyse84, M. Mudrinic12b,F. Mueller58a, J. Mueller123, K. Mueller20, T.A. Müller98, D. Muenstermann42, A. Muir168, Y. Munwes153,R. Murillo Garcia163, W.J. Murray129, I. Mussche105, E. Musto102a,102b, A.G. Myagkov128, M. Myska125, J. Nadal11,K. Nagai160, K. Nagano66, Y. Nagasaka60, A.M. Nairz29, K. Nakamura155, I. Nakano110, H. Nakatsuka67,G. Nanava20, A. Napier161, M. Nash77,ad, N.R. Nation21, T. Nattermann20, T. Naumann41, G. Navarro162,S.K. Nderitu20, H.A. Neal87, E. Nebot80, P. Nechaeva94, A. Negri119a,119b, G. Negri29, A. Nelson64, T.K. Nelson143,S. Nemecek125, P. Nemethy108, A.A. Nepomuceno23a, M. Nessi29, M.S. Neubauer165, A. Neusiedl81, R.M. Neves108,P. Nevski24, F.M. Newcomer120, R.B. Nickerson118, R. Nicolaidou136, L. Nicolas139, G. Nicoletti47, B. Nicquevert29,F. Niedercorn115, J. Nielsen137, A. Nikiforov15, K. Nikolaev65, I. Nikolic-Audit78, K. Nikolopoulos8, H. Nilsen48,P. Nilsson7, A. Nisati132a, T. Nishiyama67, R. Nisius99, L. Nodulman5, M. Nomachi116, I. Nomidis154, M. Nordberg29,B. Nordkvist146a,146b, D. Notz41, J. Novakova126, M. Nozaki66, M. Nožicka41, I.M. Nugent159a,A.-E. Nuncio-Quiroz20, G. Nunes Hanninger20, T. Nunnemann98, E. Nurse77, D.C. O’Neil142, V. O’Shea53,F.G. Oakham28,f, H. Oberlack99, A. Ochi67, S. Oda155, S. Odaka66, J. Odier83, H. Ogren61, A. Oh82, S.H. Oh44,C.C. Ohm146a,146b, T. Ohshima101, H. Ohshita140, T. Ohsugi59, S. Okada67, H. Okawa163, Y. Okumura101,T. Okuyama155, A.G. Olchevski65, M. Oliveira124a,g, D. Oliveira Damazio24, E. Oliveira Garcia167, D. Olivito120,A. Olszewski38, J. Olszowska38, C. Omachi67,ae, A. Onofre124a,af, P.U.E. Onyisi30, C.J. Oram159a, M.J. Oreglia30,Y. Oren153, D. Orestano134a,134b, I. Orlov107, C. Oropeza Barrera53, R.S. Orr158, E.O. Ortega130, B. Osculati50a,50b,R. Ospanov120, C. Osuna11, J.P Ottersbach105, F. Ould-Saada117, A. Ouraou136, Q. Ouyang32a, M. Owen82,S. Owen139, A. Oyarzun31b, V.E. Ozcan77, K. Ozone66, N. Ozturk7, A. Pacheco Pages11, C. Padilla Aranda11,E. Paganis139, C. Pahl63, F. Paige24, K. Pajchel117, S. Palestini29, D. Pallin33, A. Palma124a,b, J.D. Palmer17,Y.B. Pan172, E. Panagiotopoulou9, B. Panes31a, N. Panikashvili87, S. Panitkin24, D. Pantea25a, M. Panuskova125,V. Paolone123, Th.D. Papadopoulou9, S.J. Park54, W. Park24,ag, M.A. Parker27, F. Parodi50a,50b, J.A. Parsons34,U. Parzefall48, E. Pasqualucci132a, A. Passeri134a, F. Pastore134a,134b, Fr. Pastore29, G. Pásztor49,ah, S. Pataraia99,J.R. Pater82, S. Patricelli102a,102b, T. Pauly29, L.S. Peak150, M. Pecsy144a, M.I. Pedraza Morales172,S.V. Peleganchuk107, H. Peng172, A. Penson34, J. Penwell61, M. Perantoni23a, K. Perez34,aa, E. Perez Codina11,M.T. Pérez García-Estañ167, V. Perez Reale34, L. Perini89a,89b, H. Pernegger29, R. Perrino72a, S. Persembe3a,P. Perus115, V.D. Peshekhonov65, B.A. Petersen29, T.C. Petersen35, E. Petit83, C. Petridou154, E. Petrolo132a,F. Petrucci134a,134b, D. Petschull41, M. Petteni142, R. Pezoa31b, A. Phan86, A.W. Phillips27, G. Piacquadio29,M. Piccinini19a,19b, R. Piegaia26, J.E. Pilcher30, A.D. Pilkington82, J. Pina124a,q, M. Pinamonti164a,164c, J.L. Pinfold2,
1198 Eur. Phys. J. C (2010) 70: 1193–1236
B. Pinto124a,b, C. Pizio89a,89b, R. Placakyte41, M. Plamondon169, M.-A. Pleier24, A. Poblaguev175, S. Poddar58a,F. Podlyski33, L. Poggioli115, M. Pohl49, F. Polci55, G. Polesello119a, A. Policicchio138, A. Polini19a, J. Poll75,V. Polychronakos24, D. Pomeroy22, K. Pommès29, P. Ponsot136, L. Pontecorvo132a, B.G. Pope88, G.A. Popeneciu25a,D.S. Popovic12a, A. Poppleton29, J. Popule125, X. Portell Bueso48, R. Porter163, G.E. Pospelov99, S. Pospisil127,M. Potekhin24, I.N. Potrap99, C.J. Potter149, C.T. Potter85, K.P. Potter82, G. Poulard29, J. Poveda172, R. Prabhu20,P. Pralavorio83, S. Prasad57, R. Pravahan7, L. Pribyl29, D. Price61, L.E. Price5, P.M. Prichard73, D. Prieur123,M. Primavera72a, K. Prokofiev29, F. Prokoshin31b, S. Protopopescu24, J. Proudfoot5, X. Prudent43, H. Przysiezniak4,S. Psoroulas20, E. Ptacek114, J. Purdham87, M. Purohit24,ai, P. Puzo115, Y. Pylypchenko117, M. Qi32c, J. Qian87,W. Qian129, Z. Qin41, A. Quadt54, D.R. Quarrie14, W.B. Quayle172, F. Quinonez31a, M. Raas104, V. Radeka24,V. Radescu58b, B. Radics20, T. Rador18a, F. Ragusa89a,89b, G. Rahal180, A.M. Rahimi109, S. Rajagopalan24,M. Rammensee48, M. Rammes141, F. Rauscher98, E. Rauter99, M. Raymond29, A.L. Read117, D.M. Rebuzzi119a,119b,A. Redelbach173, G. Redlinger24, R. Reece120, K. Reeves40, E. Reinherz-Aronis153, A. Reinsch114, I. Reisinger42,D. Reljic12a, C. Rembser29, Z.L. Ren151, P. Renkel39, S. Rescia24, M. Rescigno132a, S. Resconi89a, B. Resende136,P. Reznicek126, R. Rezvani158, N. Ribeiro124a, A. Richards77, R. Richter99, E. Richter-Was38,aj, M. Ridel78,M. Rijpstra105, M. Rijssenbeek148, A. Rimoldi119a,119b, L. Rinaldi19a, R.R. Rios39, I. Riu11, F. Rizatdinova112,E. Rizvi75, D.A. Roa Romero162, S.H. Robertson85,j, A. Robichaud-Veronneau49, D. Robinson27, J.E.M. Robinson77,M. Robinson114, A. Robson53, J.G. Rocha de Lima106, C. Roda122a,122b, D. Roda Dos Santos29, D. Rodriguez162,Y. Rodriguez Garcia15, S. Roe29, O. Røhne117, V. Rojo1, S. Rolli161, A. Romaniouk96, V.M. Romanov65, G. Romeo26,D. Romero Maltrana31a, L. Roos78, E. Ros167, S. Rosati138, G.A. Rosenbaum158, L. Rosselet49, V. Rossetti11,L.P. Rossi50a, M. Rotaru25a, J. Rothberg138, D. Rousseau115, C.R. Royon136, A. Rozanov83, Y. Rozen152, X. Ruan115,B. Ruckert98, N. Ruckstuhl105, V.I. Rud97, G. Rudolph62, F. Rühr58a, F. Ruggieri134a, A. Ruiz-Martinez64,L. Rumyantsev65, Z. Rurikova48, N.A. Rusakovich65, J.P. Rutherfoord6, C. Ruwiedel20, P. Ruzicka125,Y.F. Ryabov121, P. Ryan88, G. Rybkin115, S. Rzaeva10, A.F. Saavedra150, H.F.-W. Sadrozinski137, R. Sadykov65,F. Safai Tehrani132a,132b, H. Sakamoto155, G. Salamanna105, A. Salamon133a, M.S. Saleem111, D. Salihagic99,A. Salnikov143, J. Salt167, B.M. Salvachua Ferrando5, D. Salvatore36a,36b, F. Salvatore149, A. Salvucci47,A. Salzburger29, D. Sampsonidis154, B.H. Samset117, H. Sandaker13, H.G. Sander81, M.P. Sanders98, M. Sandhoff174,P. Sandhu158, R. Sandstroem105, S. Sandvoss174, D.P.C. Sankey129, B. Sanny174, A. Sansoni47, C. SantamarinaRios85, C. Santoni33, R. Santonico133a,133b, J.G. Saraiva124a,q, T. Sarangi172, E. Sarkisyan-Grinbaum7,F. Sarri122a,122b, O. Sasaki66, N. Sasao68, I. Satsounkevitch90, G. Sauvage4, P. Savard158,f, A.Y. Savine6, V. Savinov123,L. Sawyer24,ak, D.H. Saxon53, L.P. Says33, C. Sbarra19a,19b, A. Sbrizzi19a,19b, D.A. Scannicchio29, J. Schaarschmidt43,P. Schacht99, U. Schäfer81, S. Schaetzel58b, A.C. Schaffer115, D. Schaile98, R.D. Schamberger148, A.G. Schamov107,V. Scharf58a, V.A. Schegelsky121, D. Scheirich87, M. Schernau163, M.I. Scherzer14, C. Schiavi50a,50b, J. Schieck99,M. Schioppa36a,36b, S. Schlenker29, E. Schmidt48, K. Schmieden20, C. Schmitt81, M. Schmitz20, A. Schönig58b,M. Schott29, D. Schouten142, J. Schovancova125, M. Schram85, A. Schreiner63, C. Schroeder81, N. Schroer58c,M. Schroers174, J. Schultes174, H.-C. Schultz-Coulon58a, J.W. Schumacher43, M. Schumacher48, B.A. Schumm137,Ph. Schune136, C. Schwanenberger82, A. Schwartzman143, Ph. Schwemling78, R. Schwienhorst88, R. Schwierz43,J. Schwindling136, W.G. Scott129, J. Searcy114, E. Sedykh121, E. Segura11, S.C. Seidel103, A. Seiden137, F. Seifert43,J.M. Seixas23a, G. Sekhniaidze102a, D.M. Seliverstov121, B. Sellden146a, N. Semprini-Cesari19a,19b, C. Serfon98,L. Serin115, R. Seuster99, H. Severini111, M.E. Sevior86, A. Sfyrla165, E. Shabalina54, M. Shamim114, L.Y. Shan32a,J.T. Shank21, Q.T. Shao86, M. Shapiro14, P.B. Shatalov95, K. Shaw139, D. Sherman29, P. Sherwood77, A. Shibata108,M. Shimojima100, T. Shin56, A. Shmeleva94, M.J. Shochet30, M.A. Shupe6, P. Sicho125, A. Sidoti15, F. Siegert77,J. Siegrist14, Dj. Sijacki12a, O. Silbert171, J. Silva124a,al, Y. Silver153, D. Silverstein143, S.B. Silverstein146a,V. Simak127, Lj. Simic12a, S. Simion115, B. Simmons77, M. Simonyan35, P. Sinervo158, N.B. Sinev114, V. Sipica141,G. Siragusa81, A.N. Sisakyan65, S.Yu. Sivoklokov97, J. Sjoelin146a,146b, T.B. Sjursen13, K. Skovpen107, P. Skubic111,M. Slater17, T. Slavicek127, K. Sliwa161, J. Sloper29, V. Smakhtin171, S.Yu. Smirnov96, Y. Smirnov24,L.N. Smirnova97, O. Smirnova79, B.C. Smith57, D. Smith143, K.M. Smith53, M. Smizanska71, K. Smolek127,A.A. Snesarev94, S.W. Snow82, J. Snow111, J. Snuverink105, S. Snyder24, M. Soares124a, R. Sobie169,j, J. Sodomka127,A. Soffer153, C.A. Solans167, M. Solar127, J. Solc127, E. Solfaroli Camillocci132a,132b, A.A. Solodkov128,O.V. Solovyanov128, J. Sondericker24, V. Sopko127, B. Sopko127, M. Sosebee7, A. Soukharev107, S. Spagnolo72a,72b,F. Spanò34, R. Spighi19a, G. Spigo29, F. Spila132a,132b, R. Spiwoks29, M. Spousta126, T. Spreitzer142, B. Spurlock7,R.D. St. Denis53, T. Stahl141, J. Stahlman120, R. Stamen58a, S.N. Stancu163, E. Stanecka29, R.W. Stanek5,C. Stanescu134a, S. Stapnes117, E.A. Starchenko128, J. Stark55, P. Staroba125, P. Starovoitov91, J. Stastny125,
Eur. Phys. J. C (2010) 70: 1193–1236 1199
P. Stavina144a, G. Steele53, P. Steinbach43, P. Steinberg24, I. Stekl127, B. Stelzer142, H.J. Stelzer41,O. Stelzer-Chilton159a, H. Stenzel52, K. Stevenson75, G.A. Stewart53, M.C. Stockton29, K. Stoerig48, G. Stoicea25a,S. Stonjek99, P. Strachota126, A.R. Stradling7, A. Straessner43, J. Strandberg87, S. Strandberg14, A. Strandlie117,M. Strauss111, P. Strizenec144b, R. Ströhmer173, D.M. Strom114, R. Stroynowski39, J. Strube129, B. Stugu13,P. Sturm174, D.A. Soh151,am, D. Su143, Y. Sugaya116, T. Sugimoto101, C. Suhr106, M. Suk126, V.V. Sulin94,S. Sultansoy3d, T. Sumida29, X.H. Sun32d, J.E. Sundermann48, K. Suruliz164a,164b, S. Sushkov11, G. Susinno36a,36b,M.R. Sutton139, T. Suzuki155, Y. Suzuki66, I. Sykora144a, T. Sykora126, T. Szymocha38, J. Sánchez167, D. Ta20,K. Tackmann29, A. Taffard163, R. Tafirout159a, A. Taga117, Y. Takahashi101, H. Takai24, R. Takashima69,H. Takeda67, T. Takeshita140, M. Talby83, A. Talyshev107, M.C. Tamsett76, J. Tanaka155, R. Tanaka115, S. Tanaka131,S. Tanaka66, S. Tapprogge81, D. Tardif158, S. Tarem152, F. Tarrade24, G.F. Tartarelli89a, P. Tas126, M. Tasevsky125,E. Tassi36a,36b, M. Tatarkhanov14, C. Taylor77, F.E. Taylor92, G.N. Taylor86, R.P. Taylor169, W. Taylor159b,P. Teixeira-Dias76, H. Ten Kate29, P.K. Teng151, Y.D. Tennenbaum-Katan152, S. Terada66, K. Terashi155, J. Terron80,M. Terwort41,v, M. Testa47, R.J. Teuscher158,j, J. Therhaag20, M. Thioye175, S. Thoma48, J.P. Thomas17,E.N. Thompson84, P.D. Thompson17, P.D. Thompson158, R.J. Thompson82, A.S. Thompson53, E. Thomson120,R.P. Thun87, T. Tic125, V.O. Tikhomirov94, Y.A. Tikhonov107, P. Tipton175, F.J. Tique Aires Viegas29, S. Tisserant83,B. Toczek37, T. Todorov4, S. Todorova-Nova161, B. Toggerson163, J. Tojo66, S. Tokár144a, K. Tokushuku66,K. Tollefson88, L. Tomasek125, M. Tomasek125, M. Tomoto101, L. Tompkins14, K. Toms103, A. Tonoyan13, C. Topfel16,N.D. Topilin65, I. Torchiani29, E. Torrence114, E. Torró Pastor167, J. Toth83,ah, F. Touchard83, D.R. Tovey139,T. Trefzger173, L. Tremblet29, A. Tricoli29, I.M. Trigger159a, S. Trincaz-Duvoid78, T.N. Trinh78, M.F. Tripiana70,N. Triplett64, W. Trischuk158, A. Trivedi24,an, B. Trocmé55, C. Troncon89a, A. Trzupek38, C. Tsarouchas9,J.C.-L. Tseng118, M. Tsiakiris105, P.V. Tsiareshka90, D. Tsionou139, G. Tsipolitis9, V. Tsiskaridze51,E.G. Tskhadadze51, I.I. Tsukerman95, V. Tsulaia123, J.-W. Tsung20, S. Tsuno66, D. Tsybychev148, J.M. Tuggle30,C.D. Tunnell30, D. Turecek127, I. Turk Cakir3e, E. Turlay105, P.M. Tuts34, M.S. Twomey138, M. Tylmad146a,146b,M. Tyndel129, K. Uchida116, I. Ueda155, R. Ueno28, M. Ugland13, M. Uhlenbrock20, M. Uhrmacher54, F. Ukegawa160,G. Unal29, A. Undrus24, G. Unel163, Y. Unno66, D. Urbaniec34, E. Urkovsky153, P. Urquijo49,ao, P. Urrejola31a,G. Usai7, M. Uslenghi119a,119b, L. Vacavant83, V. Vacek127, B. Vachon85, S. Vahsen14, P. Valente132a,S. Valentinetti19a,19b, A. Valero167, S. Valkar126, E. Valladolid Gallego167, S. Vallecorsa152, J.A. Valls Ferrer167,R. Van Berg120, H. van der Graaf105, E. van der Kraaij105, E. van der Poel105, D. van der Ster29, N. van Eldik84,P. van Gemmeren5, Z. van Kesteren105, I. van Vulpen105, W. Vandelli29, A. Vaniachine5, P. Vankov73, F. Vannucci78,R. Vari132a, E.W. Varnes6, D. Varouchas14, A. Vartapetian7, K.E. Varvell150, L. Vasilyeva94, V.I. Vassilakopoulos56,F. Vazeille33, C. Vellidis8, F. Veloso124a, S. Veneziano132a, A. Ventura72a,72b, D. Ventura138, M. Venturi48, N. Venturi16,V. Vercesi119a, M. Verducci173, W. Verkerke105, J.C. Vermeulen105, M.C. Vetterli142,f, I. Vichou165, T. Vickey145b,ap,G.H.A. Viehhauser118, M. Villa19a,19b, E.G. Villani129, M. Villaplana Perez167, E. Vilucchi47, M.G. Vincter28,E. Vinek29, V.B. Vinogradov65, S. Viret33, J. Virzi14, A. Vitale19a,19b, O. Vitells171, I. Vivarelli48, F. Vives Vaque11,S. Vlachos9, M. Vlasak127, N. Vlasov20, A. Vogel20, P. Vokac127, M. Volpi11, H. von der Schmitt99, J. von Loeben99,H. von Radziewski48, E. von Toerne20, V. Vorobel126, V. Vorwerk11, M. Vos167, R. Voss29, T.T. Voss174,J.H. Vossebeld73, N. Vranjes12a, M. Vranjes Milosavljevic12a, V. Vrba125, M. Vreeswijk105, T. Vu Anh81,D. Vudragovic12a, R. Vuillermet29, I. Vukotic115, P. Wagner120, J. Walbersloh42, J. Walder71, R. Walker98,W. Walkowiak141, R. Wall175, C. Wang44, H. Wang172, J. Wang55, S.M. Wang151, A. Warburton85, C.P. Ward27,M. Warsinsky48, R. Wastie118, P.M. Watkins17, A.T. Watson17, M.F. Watson17, G. Watts138, S. Watts82,A.T. Waugh150, B.M. Waugh77, M.D. Weber16, M. Weber129, M.S. Weber16, P. Weber58a, A.R. Weidberg118,J. Weingarten54, C. Weiser48, H. Wellenstein22, P.S. Wells29, T. Wenaus24, S. Wendler123, Z. Weng151,aq,T. Wengler82, S. Wenig29, N. Wermes20, M. Werner48, P. Werner29, M. Werth163, U. Werthenbach141, M. Wessels58a,K. Whalen28, A. White7, M.J. White27, S. White24, S.R. Whitehead118, D. Whiteson163, D. Whittington61,F. Wicek115, D. Wicke81, F.J. Wickens129, W. Wiedenmann172, M. Wielers129, P. Wienemann20, C. Wiglesworth73,L.A.M. Wiik48, A. Wildauer167, M.A. Wildt41,v, H.G. Wilkens29, E. Williams34, H.H. Williams120, S. Willocq84,J.A. Wilson17, M.G. Wilson143, A. Wilson87, I. Wingerter-Seez4, F. Winklmeier29, M. Wittgen143, M.W. Wolter38,H. Wolters124a,g, B.K. Wosiek38, J. Wotschack29, M.J. Woudstra84, K. Wraight53, C. Wright53, D. Wright143,B. Wrona73, S.L. Wu172, X. Wu49, E. Wulf34, B.M. Wynne45, L. Xaplanteris9, S. Xella35, S. Xie48, D. Xu139, N. Xu172,M. Yamada160, A. Yamamoto66, K. Yamamoto64, S. Yamamoto155, T. Yamamura155, J. Yamaoka44, T. Yamazaki155,Y. Yamazaki67, Z. Yan21, H. Yang87, U.K. Yang82, Z. Yang146a,146b, W.-M. Yao14, Y. Yao14, Y. Yasu66, J. Ye39, S. Ye24,M. Yilmaz3c, R. Yoosoofmiya123, K. Yorita170, R. Yoshida5, C. Young143, S.P. Youssef21, D. Yu24, J. Yu7, L. Yuan78,
1200 Eur. Phys. J. C (2010) 70: 1193–1236
A. Yurkewicz148, R. Zaidan63, A.M. Zaitsev128, Z. Zajacova29, V. Zambrano47, L. Zanello132a,132b, A. Zaytsev107,C. Zeitnitz174, M. Zeller175, A. Zemla38, C. Zendler20, O. Zenin128, T. Zenis144a, Z. Zenonos122a,122b, S. Zenz14,D. Zerwas115, G. Zevi della Porta57, Z. Zhan32d, H. Zhang83, J. Zhang5, Q. Zhang5, X. Zhang32d, L. Zhao108,T. Zhao138, Z. Zhao32b, A. Zhemchugov65, J. Zhong151,ar, B. Zhou87, N. Zhou34, Y. Zhou151, C.G. Zhu32d, H. Zhu41,Y. Zhu172, X. Zhuang98, V. Zhuravlov99, R. Zimmermann20, S. Zimmermann20, S. Zimmermann48,M. Ziolkowski141, L. Živkovic34, G. Zobernig172, A. Zoccoli19a,19b, M. zur Nedden15, V. Zutshi106
�CERN, 1211 Geneva 23, Switzerland1University at Albany, 1400 Washington Ave, Albany, NY 12222, United States of America2University of Alberta, Department of Physics, Centre for Particle Physics, Edmonton, AB T6G 2G7, Canada3Ankara University(a), Faculty of Sciences, Department of Physics, TR 061000 Tandogan, Ankara; Dumlupinar University(b), Faculty of Artsand Sciences, Department of Physics, Kutahya; Gazi University(c), Faculty of Arts and Sciences, Department of Physics, 06500,Teknikokullar, Ankara; TOBB University of Economics and Technology(d), Faculty of Arts and Sciences, Division of Physics, 06560,Sogutozu, Ankara; Turkish Atomic Energy Authority(e), 06530, Lodumlu, Ankara, Turkey
4LAPP, Université de Savoie, CNRS/IN2P3, Annecy-le-Vieux, France5Argonne National Laboratory, High Energy Physics Division, 9700 S. Cass Avenue, Argonne IL 60439, United States of America6University of Arizona, Department of Physics, Tucson, AZ 85721, United States of America7The University of Texas at Arlington, Department of Physics, Box 19059, Arlington, TX 76019, United States of America8University of Athens, Nuclear & Particle Physics, Department of Physics, Panepistimiopouli, Zografou, GR 15771 Athens, Greece9National Technical University of Athens, Physics Department, 9-Iroon Polytechniou, GR 15780 Zografou, Greece
10Institute of Physics, Azerbaijan Academy of Sciences, H. Javid Avenue 33, AZ 143 Baku, Azerbaijan11Institut de Física d’Altes Energies, IFAE, Edifici Cn, Universitat Autònoma de Barcelona, ES-08193 Bellaterra (Barcelona), Spain12University of Belgrade(a), Institute of Physics, P.O. Box 57, 11001 Belgrade; Vinca Institute of Nuclear Sciences(b) M. Petrovica Alasa 12-14,
11000 Belgrade, Serbia, Serbia13University of Bergen, Department for Physics and Technology, Allegaten 55, NO-5007 Bergen, Norway14Lawrence Berkeley National Laboratory and University of California, Physics Division, MS50B-6227, 1 Cyclotron Road, Berkeley, CA
94720, United States of America15Humboldt University, Institute of Physics, Berlin, Newtonstr. 15, D-12489 Berlin, Germany16University of Bern, instein Center for Fundamental Physics, ry for High Energy Physics, Sidlerstrasse 5, CH-3012 Bern, Switzerland17University of Birmingham, School of Physics and Astronomy, Edgbaston, Birmingham B15 2TT, United Kingdom18Bogazici University(a), Faculty of Sciences, Department of Physics, TR-80815 Bebek-Istanbul; Dogus University(b), Faculty of Arts and
Sciences, Department of Physics, 34722, Kadikoy, Istanbul; (c)Gaziantep University, Faculty of Engineering, Department of PhysicsEngineering, 27310, Sehitkamil, Gaziantep, Turkey; Istanbul Technical University(d), Faculty of Arts and Sciences, Department of Physics,34469, Maslak, Istanbul, Turkey
19INFN Sezione di Bologna(a); Università di Bologna, Dipartimento di Fisica(b), viale C. Berti Pichat, 6/2, IT-40127 Bologna, Italy20University of Bonn, Physikalisches Institut, Nussallee 12, D-53115 Bonn, Germany21Boston University, Department of Physics, 590 Commonwealth Avenue, Boston, MA 02215, United States of America22Brandeis University, Department of Physics, MS057, 415 South Street, Waltham, MA 02454, United States of America23Universidade Federal do Rio De Janeiro, COPPE/EE/IF (a), Caixa Postal 68528, Ilha do Fundao, BR-21945-970 Rio de Janeiro;
(b)Universidade de Sao Paulo, Instituto de Fisica, R.do Matao Trav. R.187, Sao Paulo-SP, 05508-900, Brazil24Brookhaven National Laboratory, Physics Department, Bldg. 510A, Upton, NY 11973, United States of America25National Institute of Physics and Nuclear Engineering(a), Bucharest-Magurele, Str. Atomistilor 407, P.O. Box MG-6, R-077125, Romania;
University Politehnica Bucharest(b), Rectorat-AN 001, 313 Splaiul Independentei, sector 6, 060042 Bucuresti; West University(c) in Timisoara,Bd. Vasile Parvan 4, Timisoara, Romania
26Universidad de Buenos Aires, FCEyN, Dto. Fisica, Pab I-C. Universitaria, 1428 Buenos Aires, Argentina27University of Cambridge, Cavendish Laboratory, J J Thomson Avenue, Cambridge CB3 0HE, United Kingdom28Carleton University, Department of Physics, 1125 Colonel By Drive, Ottawa ON K1S 5B6, Canada29CERN, CH-1211 Geneva 23, Switzerland30University of Chicago, Enrico Fermi Institute, 5640 S. Ellis Avenue, Chicago, IL 60637, United States of America31Pontificia Universidad Católica de Chile, Facultad de Fisica, Departamento de Fisica(a), Avda. Vicuna Mackenna 4860, San Joaquin, Santiago;
Universidad Técnica Federico Santa María, Departamento de Física(b), Avda. Espãna 1680, Casilla 110-V, Valparaíso, Chile32Institute of High Energy Physics, Chinese Academy of Sciences(a), P.O. Box 918, 19 Yuquan Road, Shijing Shan District, CN-Beijing 100049;
University of Science & Technology of China (USTC), Department of Modern Physics(b), Hefei, CN-Anhui 230026; Nanjing University,Department of Physics(c), 22 Hankou Road, Nanjing, 210093; Shandong University, High Energy Physics Group(d), Jinan, CN-Shandong250100, China
33Laboratoire de Physique Corpusculaire, Clermont Université, Université Blaise Pascal, CNRS/IN2P3, FR-63177 Aubiere Cedex, France34Columbia University, Nevis Laboratory, 136 So. Broadway, Irvington, NY 10533, United States of America35University of Copenhagen, Niels Bohr Institute, Blegdamsvej 17, DK-2100 Kobenhavn 0, Denmark36INFN Gruppo Collegato di Cosenza(a); Università della Calabria, Dipartimento di Fisica(b), IT-87036 Arcavacata di Rende, Italy37Faculty of Physics and Applied Computer Science of the AGH-University of Science and Technology, (FPACS, AGH-UST), al. Mickiewicza
30, PL-30059 Cracow, Poland38The Henryk Niewodniczanski Institute of Nuclear Physics, Polish Academy of Sciences, ul. Radzikowskiego 152, PL-31342 Krakow, Poland39Southern Methodist University, Physics Department, 106 Fondren Science Building, Dallas, TX 75275-0175, United States of America40University of Texas at Dallas, 800 West Campbell Road, Richardson, TX 75080-3021, United States of America41DESY, Notkestr. 85, D-22603 Hamburg and Platanenallee 6, D-15738 Zeuthen, Germany
Eur. Phys. J. C (2010) 70: 1193–1236 1201
42TU Dortmund, Experimentelle Physik IV, DE-44221 Dortmund, Germany43Technical University Dresden, Institut für Kern- und Teilchenphysik, Zellescher Weg 19, D-01069 Dresden, Germany44Duke University, Department of Physics, Durham, NC 27708, United States of America45University of Edinburgh, School of Physics & Astronomy, James Clerk Maxwell Building, The Kings Buildings, Mayfield Road, Edinburgh
EH9 3JZ, United Kingdom46Fachhochschule Wiener Neustadt; Johannes Gutenbergstrasse 3 AT-2700 Wiener Neustadt, Austria47INFN Laboratori Nazionali di Frascati, via Enrico Fermi 40, IT-00044 Frascati, Italy48Albert-Ludwigs-Universität, Fakultät für Mathematik und Physik, Hermann-Herder Str. 3, D-79104 Freiburg i.Br., Germany49Université de Genève, Section de Physique, 24 rue Ernest Ansermet, CH-1211 Geneve 4, Switzerland50INFN Sezione di Genova(a); Università di Genova, Dipartimento di Fisica(b), via Dodecaneso 33, IT-16146 Genova, Italy51Institute of Physics of the Georgian Academy of Sciences, 6 Tamarashvili St., GE-380077 Tbilisi; Tbilisi State University, HEP Institute,
University St. 9, GE-380086 Tbilisi, Georgia52Justus-Liebig-Universität Giessen, II Physikalisches Institut, Heinrich-Buff Ring 16, D-35392 Giessen, Germany53University of Glasgow, Department of Physics and Astronomy, Glasgow G12 8QQ, United Kingdom54Georg-August-Universität, II. Physikalisches Institut, Friedrich-Hund Platz 1, D-37077 Göttingen, Germany55Laboratoire de Physique Subatomique et de Cosmologie, CNRS/IN2P3, Université Joseph Fourier, INPG, 53 avenue des Martyrs, FR-38026
Grenoble Cedex, France56Hampton University, Department of Physics, Hampton, VA 23668, United States of America57Harvard University, Laboratory for Particle Physics and Cosmology, 18 Hammond Street, Cambridge, MA 02138, United States of America58Ruprecht-Karls-Universität Heidelberg: Kirchhoff-Institut für Physik(a), Im Neuenheimer Feld 227, D-69120 Heidelberg; Physikalisches
Institut(b), Philosophenweg 12, D-69120 Heidelberg; ZITI Ruprecht-Karls-University Heidelberg(c), Lehrstuhl für Informatik V, B6, 23-29,DE-68131 Mannheim, Germany
59Hiroshima University, Faculty of Science, 1-3-1 Kagamiyama, Higashihiroshima-shi, JP-Hiroshima 739-8526, Japan60Hiroshima Institute of Technology, Faculty of Applied Information Science, 2-1-1 Miyake Saeki-ku, Hiroshima-shi, JP-Hiroshima 731-5193,
Japan61Indiana University, Department of Physics, Swain Hall West 117, Bloomington, IN 47405-7105, United States of America62Institut für Astro- und Teilchenphysik, Technikerstrasse 25, A-6020 Innsbruck, Austria63University of Iowa, 203 Van Allen Hall, Iowa City, IA 52242-1479, United States of America64Iowa State University, Department of Physics and Astronomy, Ames High Energy Physics Group, Ames, IA 50011-3160, United States of
America65Joint Institute for Nuclear Research, JINR Dubna, RU-141 980 Moscow Region, Russia66KEK, High Energy Accelerator Research Organization, 1-1 Oho, Tsukuba-shi, Ibaraki-ken 305-0801, Japan67Kobe University, Graduate School of Science, 1-1 Rokkodai-cho, Nada-ku, JP Kobe 657-8501, Japan68Kyoto University, Faculty of Science, Oiwake-cho, Kitashirakawa, Sakyou-ku, Kyoto-shi, JP-Kyoto 606-8502, Japan69Kyoto University of Education, 1 Fukakusa, Fujimori, fushimi-ku, Kyoto-shi, JP-Kyoto 612-8522, Japan70Universidad Nacional de La Plata, FCE, Departamento de Física, IFLP (CONICET-UNLP), C.C. 67, 1900 La Plata, Argentina71Lancaster University, Physics Department, Lancaster LA1 4YB, United Kingdom72INFN Sezione di Lecce(a); Università del Salento, Dipartimento di Fisica(b)Via Arnesano IT-73100 Lecce, Italy73University of Liverpool, Oliver Lodge Laboratory, P.O. Box 147, Oxford Street, Liverpool L69 3BX, United Kingdom74Jožef Stefan Institute and University of Ljubljana, Department of Physics, SI-1000 Ljubljana, Slovenia75Queen Mary University of London, Department of Physics, Mile End Road, London E1 4NS, United Kingdom76Royal Holloway, University of London, Department of Physics, Egham Hill, Egham, Surrey TW20 0EX, United Kingdom77University College London, Department of Physics and Astronomy, Gower Street, London WC1E 6BT, United Kingdom78Laboratoire de Physique Nucléaire et de Hautes Energies, Université Pierre et Marie Curie (Paris 6), Université Denis Diderot (Paris-7),
CNRS/IN2P3, Tour 33, 4 place Jussieu, FR-75252 Paris Cedex 05, France79Lunds universitet, Naturvetenskapliga fakulteten, Fysiska institutionen, Box 118, SE-221 00 Lund, Sweden80Universidad Autonoma de Madrid, Facultad de Ciencias, Departamento de Fisica Teorica, ES-28049 Madrid, Spain81Universität Mainz, Institut für Physik, Staudinger Weg 7, DE-55099 Mainz, Germany82University of Manchester, School of Physics and Astronomy, Manchester M13 9PL, United Kingdom83CPPM, Aix-Marseille Université, CNRS/IN2P3, Marseille, France84University of Massachusetts, Department of Physics, 710 North Pleasant Street, Amherst, MA 01003, United States of America85McGill University, High Energy Physics Group, 3600 University Street, Montreal, Quebec H3A 2T8, Canada86University of Melbourne, School of Physics, AU-Parkville, Victoria 3010, Australia87The University of Michigan, Department of Physics, 2477 Randall Laboratory, 500 East University, Ann Arbor, MI 48109-1120, United States
of America88Michigan State University, Department of Physics and Astronomy, High Energy Physics Group, East Lansing, MI 48824-2320, United States
of America89INFN Sezione di Milano(a); Università di Milano, Dipartimento di Fisica(b), via Celoria 16, IT-20133 Milano, Italy90B.I. Stepanov Institute of Physics, National Academy of Sciences of Belarus, Independence Avenue 68, Minsk 220072, Republic of Belarus91National Scientific & Educational Centre for Particle & High Energy Physics, NC PHEP BSU, M. Bogdanovich St. 153, Minsk 220040,
Republic of Belarus92Massachusetts Institute of Technology, Department of Physics, Room 24-516, Cambridge, MA 02139, United States of America93University of Montreal, Group of Particle Physics, C.P. 6128, Succursale Centre-Ville, Montreal, Quebec, H3C 3J7, Canada94P.N. Lebedev Institute of Physics, Academy of Sciences, Leninsky pr. 53, RU-117 924 Moscow, Russia95Institute for Theoretical and Experimental Physics (ITEP), B. Cheremushkinskaya ul. 25, RU 117 218 Moscow, Russia
1202 Eur. Phys. J. C (2010) 70: 1193–1236
96Moscow Engineering & Physics Institute (MEPhI), Kashirskoe Shosse 31, RU-115409 Moscow, Russia97Lomonosov Moscow State University Skobeltsyn Institute of Nuclear Physics (MSU SINP), 1(2), Leninskie gory, GSP-1, Moscow 119991
Russian Federation, Russia98Ludwig-Maximilians-Universität München, Fakultät für Physik, Am Coulombwall 1, DE-85748 Garching, Germany99Max-Planck-Institut für Physik, (Werner-Heisenberg-Institut), Föhringer Ring 6, 80805 München, Germany
100Nagasaki Institute of Applied Science, 536 Aba-machi, JP Nagasaki 851-0193, Japan101Nagoya University, Graduate School of Science, Furo-Cho, Chikusa-ku, Nagoya, 464-8602, Japan102INFN Sezione di Napoli(a); Università di Napoli, Dipartimento di Scienze Fisiche(b), Complesso Universitario di Monte Sant’Angelo, via
Cinthia, IT-80126 Napoli, Italy103University of New Mexico, Department of Physics and Astronomy, MSC07 4220, Albuquerque, NM 87131 USA, United States of America104Radboud University Nijmegen/NIKHEF, Department of Experimental High Energy Physics, Heyendaalseweg 135, NL-6525 AJ, Nijmegen,
Netherlands105Nikhef National Institute for Subatomic Physics, and University of Amsterdam, Science Park 105, 1098 XG Amsterdam, Netherlands106Department of Physics, Northern Illinois University, LaTourette Hall ad, DeKalb, IL 60115, United States of America107Budker Institute of Nuclear Physics (BINP), RU-Novosibirsk 630 090, Russia108New York University, Department of Physics, 4 Washington Place, New York, NY 10003, USA109Ohio State University, 191 West Woodruff Ave, Columbus, OH 43210-1117, United States of America110Okayama University, Faculty of Science, Tsushimanaka 3-1-1, Okayama 700-8530, Japan111University of Oklahoma, Homer L. Dodge Department of Physics and Astronomy, 440 West Brooks, Room 100, Norman, OK 73019-0225,
United States of America112Oklahoma State University, Department of Physics, 145 Physical Sciences Building, Stillwater, OK 74078-3072, United States of America113Palacký University, 17.listopadu 50a, 772 07 Olomouc, Czech Republic114University of Oregon, Center for High Energy Physics, Eugene, OR 97403-1274, United States of America115LAL, Univ. Paris-Sud, IN2P3/CNRS, Orsay, France116Osaka University, Graduate School of Science, Machikaneyama-machi 1-1, Toyonaka, Osaka 560-0043, Japan117University of Oslo, Department of Physics, P.O. Box 1048, Blindern, NO-0316 Oslo 3, Norway118Oxford University, Department of Physics, Denys Wilkinson Building, Keble Road, Oxford OX1 3RH, United Kingdom119INFN Sezione di Pavia(a); Università di Pavia, Dipartimento di Fisica Nucleare e Teorica(b), Via Bassi 6, IT-27100 Pavia, Italy120University of Pennsylvania, Department of Physics, High Energy Physics Group, 209 S. 33rd Street, Philadelphia, PA 19104, United States of
America121Petersburg Nuclear Physics Institute, RU-188 300 Gatchina, Russia122INFN Sezione di Pisa(a); Università di Pisa, Dipartimento di Fisica E. Fermi(b), Largo B. Pontecorvo 3, IT-56127 Pisa, Italy123University of Pittsburgh, Department of Physics and Astronomy, 3941 O’Hara Street, Pittsburgh, PA 15260, United States of America124Laboratorio de Instrumentacao e Fisica Experimental de Particulas-LIP(a), Avenida Elias Garcia 14-1, PT-1000-149 Lisboa, Portugal;
Universidad de Granada, Departamento de Fisica Teorica y del Cosmos and CAFPE(b), E-18071 Granada, Spain125Institute of Physics, Academy of Sciences of the Czech Republic, Na Slovance 2, CZ-18221 Praha 8, Czech Republic126Charles University in Prague, Faculty of Mathematics and Physics, Institute of Particle and Nuclear Physics, V Holesovickach 2, CZ-18000
Praha 8, Czech Republic127Czech Technical University in Prague, Zikova 4, CZ-166 35 Praha 6, Czech Republic128State Research Center Institute for High Energy Physics, Moscow Region, 142281, Protvino, Pobeda street, 1, Russia129Rutherford Appleton Laboratory, Science and Technology Facilities Council, Harwell Science and Innovation Campus, Didcot OX11 0QX,
United Kingdom130University of Regina, Physics Department, Canada131Ritsumeikan University, Noji Higashi 1 chome 1-1, JP-Kusatsu, Shiga 525-8577, Japan132INFN Sezione di Roma I(a); Università La Sapienza, Dipartimento di Fisica(b), Piazzale A. Moro 2, IT- 00185 Roma, Italy133INFN Sezione di Roma Tor Vergata(a); Università di Roma Tor Vergata, Dipartimento di Fisica(b), via della Ricerca Scientifica, IT-00133
Roma, Italy134INFN Sezione di Roma Tre(a); Università Roma Tre, Dipartimento di Fisica(b), via della Vasca Navale 84, IT-00146 Roma, Italy135Réseau Universitaire de Physique des Hautes Energies (RUPHE): Université Hassan II, Faculté des Sciences Ain Chock(a), B.P. 5366,
MA-Casablanca; Centre National de l’Energie des Sciences Techniques Nucleaires (CNESTEN)(b), B.P. 1382 R.P. 10001 Rabat 10001;Université Mohamed Premier(c), LPTPM, Faculté des Sciences, B.P.717. Bd. Mohamed VI, 60000, Oujda; Université Mohammed V, Facultédes Sciences(d)4 Avenue Ibn Battouta, BP 1014 RP, 10000 Rabat, Morocco
136CEA, DSM/IRFU, Centre d’Etudes de Saclay, FR-91191 Gif-sur-Yvette, France137University of California Santa Cruz, Santa Cruz Institute for Particle Physics (SCIPP), Santa Cruz, CA 95064, United States of America138University of Washington, Seattle, Department of Physics, Box 351560, Seattle, WA 98195-1560, United States of America139University of Sheffield, Department of Physics & Astronomy, Hounsfield Road, Sheffield S3 7RH, United Kingdom140Shinshu University, Department of Physics, Faculty of Science, 3-1-1 Asahi, Matsumoto-shi, JP-Nagano 390-8621, Japan141Universität Siegen, Fachbereich Physik, D 57068 Siegen, Germany142Simon Fraser University, Department of Physics, 8888 University Drive, CA-Burnaby, BC V5A 1S6, Canada143SLAC National Accelerator Laboratory, Stanford, California 94309, United States of America144Comenius University, Faculty of Mathematics, Physics & Informatics(a), Mlynska dolina F2, SK-84248 Bratislava; Institute of Experimental
Physics of the Slovak Academy of Sciences, Dept. of Subnuclear Physics(b), Watsonova 47, SK-04353 Kosice, Slovak Republic145(a)University of Johannesburg, Department of Physics, PO Box 524, Auckland Park, Johannesburg 2006; (b)School of Physics, University of
the Witwatersrand, Private Bag 3, Wits 2050, Johannesburg, South Africa, South Africa146Stockholm University: Department of Physics(a); The Oskar Klein Centre(b), AlbaNova, SE-106 91 Stockholm, Sweden
Eur. Phys. J. C (2010) 70: 1193–1236 1203
147Royal Institute of Technology (KTH), Physics Department, SE-106 91 Stockholm, Sweden148Stony Brook University, Department of Physics and Astronomy, Nicolls Road, Stony Brook, NY 11794-3800, United States of America149University of Sussex, Department of Physics and Astronomy 2 Building, Falmer, Brighton BN1 9QH, United Kingdom150University of Sydney, School of Physics, AU-Sydney NSW 2006, Australia151Insitute of Physics, Academia Sinica, TW-Taipei 11529, Taiwan152Technion, Israel Inst. of Technology, Department of Physics, Technion City, IL-Haifa 32000, Israel153Tel Aviv University, Raymond and Beverly Sackler School of Physics and Astronomy, Ramat Aviv, IL-Tel Aviv 69978, Israel154Aristotle University of Thessaloniki, Faculty of Science, Department of Physics, Division of Nuclear & Particle Physics, University Campus,
GR-54124, Thessaloniki, Greece155The University of Tokyo, International Center for Elementary Particle Physics and Department of Physics, 7-3-1 Hongo, Bunkyo-ku, JP-Tokyo
113-0033, Japan156Tokyo Metropolitan University, Graduate School of Science and Technology, 1-1 Minami-Osawa, Hachioji, Tokyo 192-0397, Japan157Tokyo Institute of Technology, 2-12-1-H-34 O-Okayama, Meguro, Tokyo 152-8551, Japan158University of Toronto, Department of Physics, 60 Saint George Street, Toronto M5S 1A7, Ontario, Canada159TRIUMF(a), 4004 Wesbrook Mall, Vancouver, B.C. V6T 2A3; (b)York University, Department of Physics and Astronomy, 4700 Keele St.,
Toronto, Ontario, M3J 1P3, Canada160University of Tsukuba, Institute of Pure and Applied Sciences, 1-1-1 Tennoudai, Tsukuba-shi, JP-Ibaraki 305-8571, Japan161Tufts University, Science & Technology Center, 4 Colby Street, Medford, MA 02155, United States of America162Universidad Antonio Narino, Centro de Investigaciones, Cra 3 Este No. 47A-15, Bogota, Colombia163University of California, Irvine, Department of Physics & Astronomy, CA 92697-4575, United States of America164INFN Gruppo Collegato di Udine(a); ICTP(b), Strada Costiera 11, IT-34014, Trieste; Università di Udine, Dipartimento di Fisica(c), via delle
Scienze 208, IT-33100 Udine, Italy165University of Illinois, Department of Physics, 1110 West Green Street, Urbana, Illinois 61801, United States of America166University of Uppsala, Department of Physics and Astronomy, P.O. Box 516, SE-751 20 Uppsala, Sweden167Instituto de Física Corpuscular (IFIC) Centro Mixto UVEG-CSIC, Apdo. 22085 ES-46071 Valencia, Dept. Física At. Mol. y Nuclear; Dept.
Ing. Electrónica; Univ. of Valencia, and Inst. de Microelectrónica de Barcelona (IMB-CNM-CSIC) 08193 Bellaterra, Spain168University of British Columbia, Department of Physics, 6224 Agricultural Road, CA-Vancouver, B.C. V6T 1Z1, Canada169University of Victoria, Department of Physics and Astronomy, P.O. Box 3055, Victoria B.C., V8W 3P6, Canada170Waseda University, WISE, 3-4-1 Okubo, Shinjuku-ku, Tokyo, 169-8555, Japan171The Weizmann Institute of Science, Department of Particle Physics, P.O. Box 26, IL-76100 Rehovot, Israel172University of Wisconsin, Department of Physics, 1150 University Avenue, WI 53706 Madison, Wisconsin, United States of America173Julius-Maximilians-University of Würzburg, Physikalisches Institute, Am Hubland, 97074 Würzburg, Germany174Bergische Universität, Fachbereich C, Physik, Postfach 100127, Gauss-Strasse 20, D-42097 Wuppertal, Germany175Yale University, Department of Physics, PO Box 208121, New Haven CT, 06520-8121, United States of America176Yerevan Physics Institute, Alikhanian Brothers Street 2, AM-375036 Yerevan, Armenia177ATLAS-Canada Tier-1 Data Centre, TRIUMF, 4004 Wesbrook Mall, Vancouver, BC, V6T 2A3, Canada178GridKA Tier-1 FZK, Forschungszentrum Karlsruhe GmbH, Steinbuch Centre for Computing (SCC), Hermann-von-Helmholtz-Platz 1, 76344
Eggenstein-Leopoldshafen, Germany179Port d’Informacio Cientifica (PIC), Universitat Autonoma de Barcelona (UAB), Edifici D, E-08193 Bellaterra, Spain180Centre de Calcul CNRS/IN2P3, Domaine scientifique de la Doua, 27 bd du 11 Novembre 1918, 69622 Villeurbanne Cedex, France181INFN-CNAF, Viale Berti Pichat 6/2, 40127 Bologna, Italy182Nordic Data Grid Facility, NORDUnet A/S, Kastruplundgade 22, 1, DK-2770 Kastrup, Denmark183SARA Reken- en Netwerkdiensten, Science Park 121, 1098 XG Amsterdam, Netherlands184Academia Sinica Grid Computing, Institute of Physics, Academia Sinica, No. 128, Sec. 2, Academia Rd., Nankang, Taipei, Taiwan 11529,
Taiwan185UK-T1-RAL Tier-1, Rutherford Appleton Laboratory, Science and Technology Facilities Council, Harwell Science and Innovation Campus,
Didcot OX11 0QX, United Kingdom186RHIC and ATLAS Computing Facility, Physics Department, Building 510, Brookhaven National Laboratory, Upton, New York 11973, United
States of AmericaaAlso at LIP, Portugal.bAlso at Faculdade de Ciencias, Universidade de Lisboa, Portugal.cAlso at CPPM, Marseille, France.dAlso at TRIUMF, Vancouver, Canada.eAlso at FPACS, AGH-UST, Cracow, Poland.fAlso at TRIUMF, Vancouver, Canada.gAlso at Department of Physics, University of Coimbra, Portugal.hNow at CERN.iAlso at Università di Napoli Parthenope, Napoli, Italy.jAlso at Institute of Particle Physics (IPP), Canada.kAlso at Università di Napoli Parthenope, via A. Acton 38, IT-80133 Napoli, Italy.lLouisiana Tech University, 305 Wisteria Street, P.O. Box 3178, Ruston, LA 71272, United States of America.
mAlso at Universidade de Lisboa, Portugal.nAt California State University, Fresno, USA.oAlso at TRIUMF, 4004 Wesbrook Mall, Vancouver, B.C. V6T 2A3, Canada.pCurrently at Istituto Universitario di Studi Superiori IUSS, Pavia, Italy.
1204 Eur. Phys. J. C (2010) 70: 1193–1236
qAlso at Faculdade de Ciencias, Universidade de Lisboa, Portugal and at Centro de Fisica Nuclear da Universidade de Lisboa, Portugal.rAlso at FPACS, AGH-UST, Cracow, Poland.sAlso at California Institute of Technology, Pasadena, USA.tLouisiana Tech University, Ruston, USA.uAlso at University of Montreal, Montreal, Canada.vAlso at Institut für Experimentalphysik, Universität Hamburg, Hamburg, Germany.wAlso at Petersburg Nuclear Physics Institute, Gatchina, Russia.xAlso at Institut für Experimentalphysik, Universität Hamburg, Luruper Chaussee 149, 22761 Hamburg, Germany.yAlso at School of Physics and Engineering, Sun Yat-sen University, China.zAlso at School of Physics, Shandong University, Jinan, China.
aaAlso at California Institute of Technology, Pasadena, USA.abAlso at Rutherford Appleton Laboratory, Didcot, UK.acAlso at school of physics, Shandong University, Jinan.adAlso at Rutherford Appleton Laboratory, Didcot, UK.aeNow at KEK.afAlso at Departamento de Fisica, Universidade de Minho, Portugal.agUniversity of South Carolina, Columbia, USA.ahAlso at KFKI Research Institute for Particle and Nuclear Physics, Budapest, Hungary.aiUniversity of South Carolina, Dept. of Physics and Astronomy, 700 S. Main St, Columbia, SC 29208, United States of America.ajAlso at Institute of Physics, Jagiellonian University, Cracow, Poland.akLouisiana Tech University, Ruston, USA.alAlso at Centro de Fisica Nuclear da Universidade de Lisboa, Portugal.
amAlso at School of Physics and Engineering, Sun Yat-sen University, Taiwan.anUniversity of South Carolina, Columbia, USA.aoTransfer to LHCb 31.01.2010.apAlso at Department of Physics, Oxford University, Oxford, United Kingdom.aqAlso at Sun Yat-sen University, Guangzhou, PR China.arAlso at Nanjing University, China.*Deceased
Received: 30 July 2010 / Revised: 18 October 2010 / Published online: 8 December 2010© CERN for the benefit of the ATLAS collaboration 2010. This article is published with open access at Springerlink.com
Abstract The Tile hadronic calorimeter of the ATLAS de-tector has undergone extensive testing in the experimentalhall since its installation in late 2005. The readout, controland calibration systems have been fully operational since2007 and the detector has successfully collected data fromthe LHC single beams in 2008 and first collisions in 2009.This paper gives an overview of the Tile Calorimeter per-formance as measured using random triggers, calibrationdata, data from cosmic ray muons and single beam data.The detector operation status, noise characteristics and per-formance of the calibration systems are presented, as wellas the validation of the timing and energy calibration carriedout with minimum ionising cosmic ray muons data. The cal-ibration systems’ precision is well below the design value of1%. The determination of the global energy scale was per-formed with an uncertainty of 4%.
1 Introduction
The ATLAS Tile Calorimeter (TileCal) [1] is the barrelhadronic calorimeter of the ATLAS experiment [2] at the
�� e-mail: [email protected]
CERN Large Hadron Collider [3]. Calorimeters have a pri-mary role in a general-purpose hadron collider detector.The ATLAS calorimeter system provides accurate energyand position measurements of electrons, photons, isolatedhadrons, taus and jets. It also contributes in particle identi-fication and in muon momentum reconstruction. In the bar-rel part of ATLAS, together with the electromagnetic bar-rel calorimeter, TileCal focuses on precise measurements ofhadrons, jets, taus and the missing transverse energy (Emiss
T ).The performance requirements are driven by the ATLASphysics programme:
– The energy resolution for jets of σ/E = 50%/√
E(GeV)
⊕3% guarantees good sensitivity for measurements ofphysics processes at the TeV scale, e.g. quark composite-ness and heavy bosons decaying to jets. While one cannotseparate the individual calorimeter performance issues,studies have shown that a random 10% non-uniformityon the TileCal cells energy response would add no morethan 1% to the jet energy resolution constant term [4].
– For precision measurements such as the top quark mass, itwill be desirable to reach a systematic uncertainty on thejet energy scale of 1%. Since about a third of the jet trans-verse energy is deposited in TileCal [5], its energy scaleuncertainty should ultimately be below a 3% requirement.
Eur. Phys. J. C (2010) 70: 1193–1236 1205
– The response linearity within 2% up to about 4 TeV iscrucial for observing new physics phenomena (e.g. quarkcompositeness).
– A good measurement of EmissT is important for many
physics signatures, in particular for SUSY particle search-es and new physics. In addition to sufficient total calorime-ter thickness and a large coverage in pseudorapidity, thisvery sensitive measurement requires also a small fractionof dead detector regions which create fake Emiss
T . The re-quirement depends on the signal to background ratio ofthe search.
The Tile Calorimeter has been installed in the experimen-tal hall since 2005 and since then has undergone throughseveral phases of commissioning and integration in the AT-LAS detector system. The main goal of this paper is topresent the outcome of this commissioning phase, at the startof the LHC collisions data-taking. The paper is organisedas follows: Section 2 gives a brief description of the TileCalorimeter and discusses the overall detector status and thedata-taking conditions after the commissioning was carriedout. Section 3 presents the method for the channel signalreconstruction, the overall quality of the detector in cover-age, noise characteristics and conditions stability. Section 4shows the details on the three calibration systems used toset and maintain the cell energy scale and set the timingoffsets, as well as results on the precision and stability ofeach system. The related energy scale uncertainties and theinter-calibration issues are also discussed. The last section(Sect. 5) is devoted to the validation of the performance us-ing data from cosmic muons produced in cosmic ray show-ers in the atmosphere, referred to in short form throughoutthis paper as “cosmic muons” or “cosmic ray muons”. Re-sults are presented on energy and time reconstruction, uni-formity across the calorimeter and comparison with MonteCarlo simulations. A subsection is devoted to the intercali-bration of the scintillators that are located in the gap betweenbarrel and extended barrels.
2 Detector and data taking setup
2.1 Overview of the Tile Calorimeter
TileCal is a large hadronic sampling calorimeter using plas-tic scintillator as the active material and low-carbon steel(iron) as the absorber. Spanning the pseudorapidity1 region−1.7 < η < 1.7, the calorimeter is sub-divided into thebarrel, also called long barrel (LB), in the central region
1The pseudorapidity η is defined as η = − ln(tan θ2 ), where θ is the
polar angle measured from the beam axis. The azimuthal angle φ ismeasured around the beam axis, with positive (negative) values corre-sponding to the top (bottom) part of the detector.
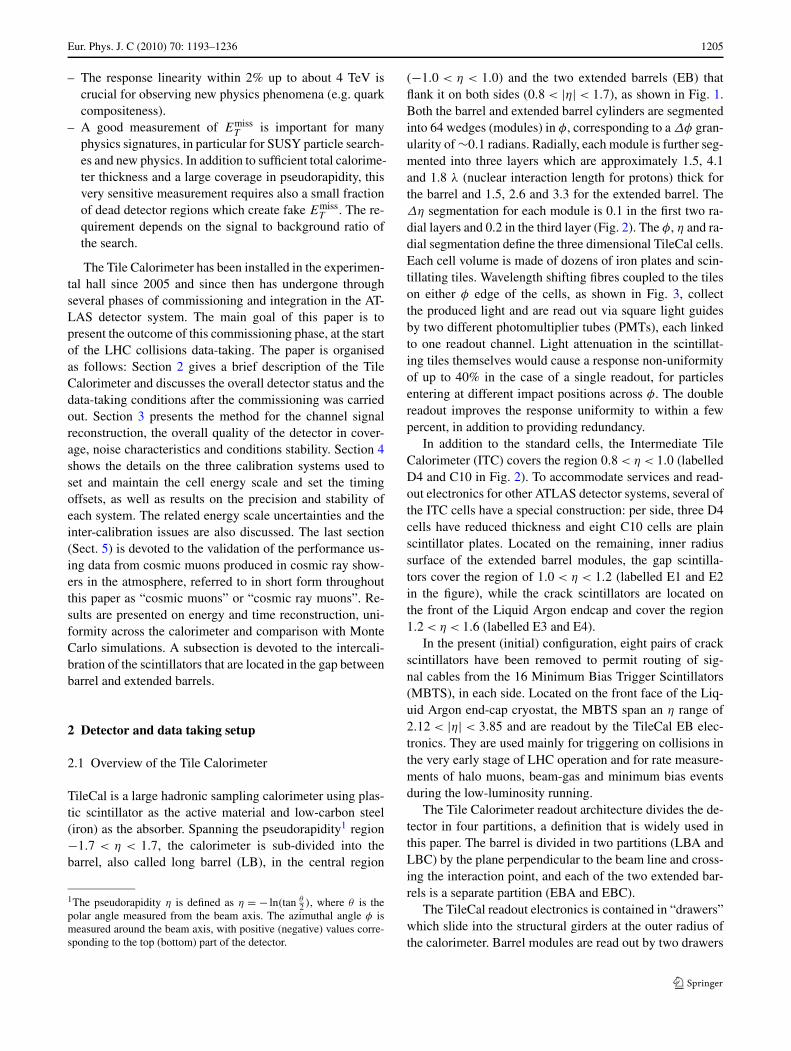
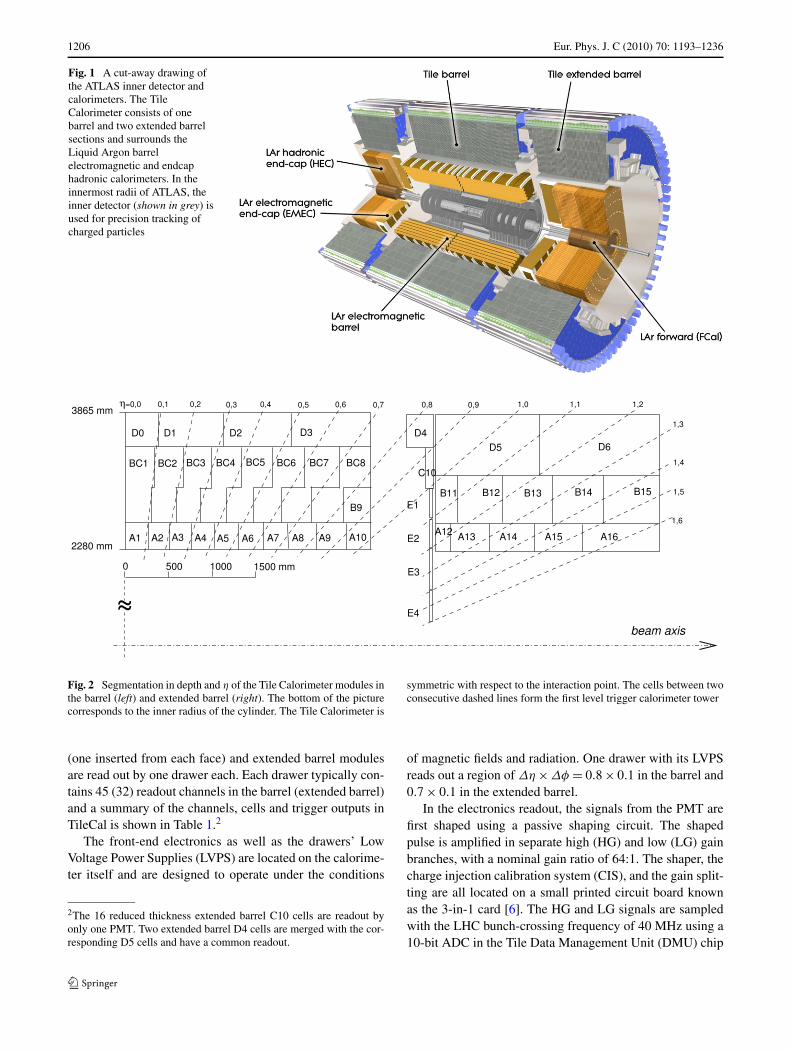
(−1.0 < η < 1.0) and the two extended barrels (EB) thatflank it on both sides (0.8 < |η| < 1.7), as shown in Fig. 1.Both the barrel and extended barrel cylinders are segmentedinto 64 wedges (modules) in φ, corresponding to a Δφ gran-ularity of ∼0.1 radians. Radially, each module is further seg-mented into three layers which are approximately 1.5, 4.1and 1.8 λ (nuclear interaction length for protons) thick forthe barrel and 1.5, 2.6 and 3.3 for the extended barrel. TheΔη segmentation for each module is 0.1 in the first two ra-dial layers and 0.2 in the third layer (Fig. 2). The φ, η and ra-dial segmentation define the three dimensional TileCal cells.Each cell volume is made of dozens of iron plates and scin-tillating tiles. Wavelength shifting fibres coupled to the tileson either φ edge of the cells, as shown in Fig. 3, collectthe produced light and are read out via square light guidesby two different photomultiplier tubes (PMTs), each linkedto one readout channel. Light attenuation in the scintillat-ing tiles themselves would cause a response non-uniformityof up to 40% in the case of a single readout, for particlesentering at different impact positions across φ. The doublereadout improves the response uniformity to within a fewpercent, in addition to providing redundancy.
In addition to the standard cells, the Intermediate TileCalorimeter (ITC) covers the region 0.8 < η < 1.0 (labelledD4 and C10 in Fig. 2). To accommodate services and read-out electronics for other ATLAS detector systems, several ofthe ITC cells have a special construction: per side, three D4cells have reduced thickness and eight C10 cells are plainscintillator plates. Located on the remaining, inner radiussurface of the extended barrel modules, the gap scintilla-tors cover the region of 1.0 < η < 1.2 (labelled E1 and E2in the figure), while the crack scintillators are located onthe front of the Liquid Argon endcap and cover the region1.2 < η < 1.6 (labelled E3 and E4).
In the present (initial) configuration, eight pairs of crackscintillators have been removed to permit routing of sig-nal cables from the 16 Minimum Bias Trigger Scintillators(MBTS), in each side. Located on the front face of the Liq-uid Argon end-cap cryostat, the MBTS span an η range of2.12 < |η| < 3.85 and are readout by the TileCal EB elec-tronics. They are used mainly for triggering on collisions inthe very early stage of LHC operation and for rate measure-ments of halo muons, beam-gas and minimum bias eventsduring the low-luminosity running.
The Tile Calorimeter readout architecture divides the de-tector in four partitions, a definition that is widely used inthis paper. The barrel is divided in two partitions (LBA andLBC) by the plane perpendicular to the beam line and cross-ing the interaction point, and each of the two extended bar-rels is a separate partition (EBA and EBC).
The TileCal readout electronics is contained in “drawers”which slide into the structural girders at the outer radius ofthe calorimeter. Barrel modules are read out by two drawers
1206 Eur. Phys. J. C (2010) 70: 1193–1236
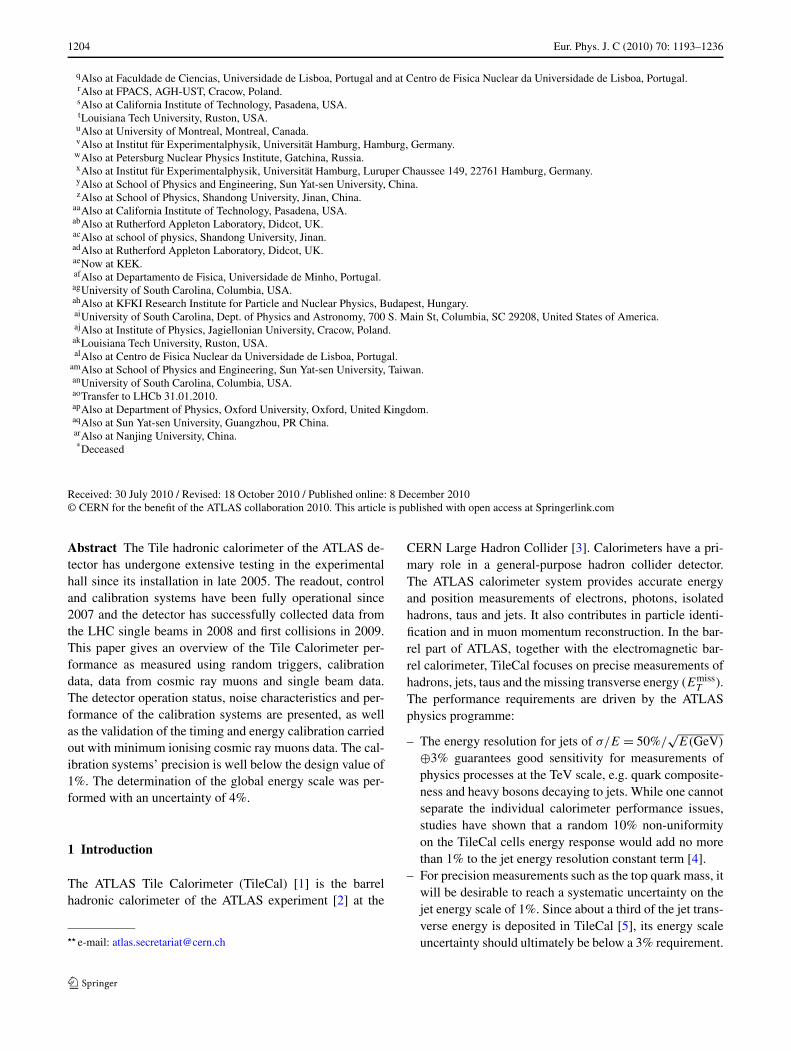
Fig. 1 A cut-away drawing ofthe ATLAS inner detector andcalorimeters. The TileCalorimeter consists of onebarrel and two extended barrelsections and surrounds theLiquid Argon barrelelectromagnetic and endcaphadronic calorimeters. In theinnermost radii of ATLAS, theinner detector (shown in grey) isused for precision tracking ofcharged particles
Fig. 2 Segmentation in depth and η of the Tile Calorimeter modules inthe barrel (left) and extended barrel (right). The bottom of the picturecorresponds to the inner radius of the cylinder. The Tile Calorimeter is
symmetric with respect to the interaction point. The cells between twoconsecutive dashed lines form the first level trigger calorimeter tower
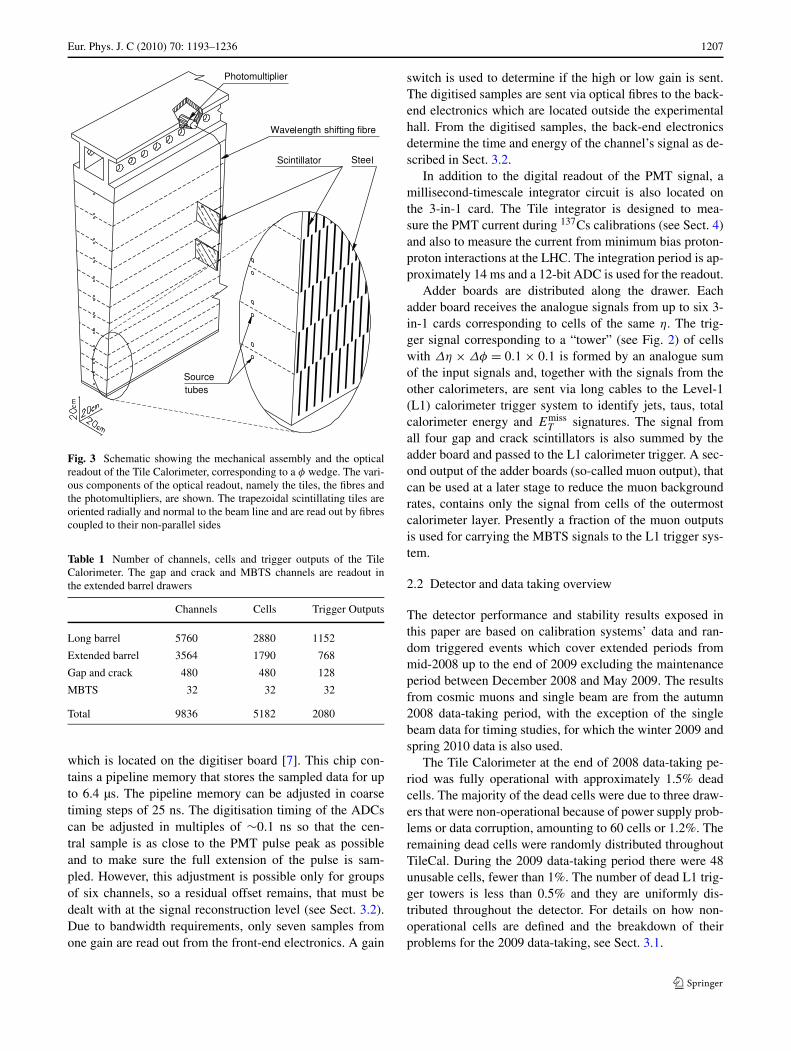
(one inserted from each face) and extended barrel modulesare read out by one drawer each. Each drawer typically con-tains 45 (32) readout channels in the barrel (extended barrel)and a summary of the channels, cells and trigger outputs inTileCal is shown in Table 1.2
The front-end electronics as well as the drawers’ LowVoltage Power Supplies (LVPS) are located on the calorime-ter itself and are designed to operate under the conditions
2The 16 reduced thickness extended barrel C10 cells are readout byonly one PMT. Two extended barrel D4 cells are merged with the cor-responding D5 cells and have a common readout.
of magnetic fields and radiation. One drawer with its LVPSreads out a region of Δη × Δφ = 0.8 × 0.1 in the barrel and0.7 × 0.1 in the extended barrel.
In the electronics readout, the signals from the PMT arefirst shaped using a passive shaping circuit. The shapedpulse is amplified in separate high (HG) and low (LG) gainbranches, with a nominal gain ratio of 64:1. The shaper, thecharge injection calibration system (CIS), and the gain split-ting are all located on a small printed circuit board knownas the 3-in-1 card [6]. The HG and LG signals are sampledwith the LHC bunch-crossing frequency of 40 MHz using a10-bit ADC in the Tile Data Management Unit (DMU) chip
Eur. Phys. J. C (2010) 70: 1193–1236 1207
Fig. 3 Schematic showing the mechanical assembly and the opticalreadout of the Tile Calorimeter, corresponding to a φ wedge. The vari-ous components of the optical readout, namely the tiles, the fibres andthe photomultipliers, are shown. The trapezoidal scintillating tiles areoriented radially and normal to the beam line and are read out by fibrescoupled to their non-parallel sides
Table 1 Number of channels, cells and trigger outputs of the TileCalorimeter. The gap and crack and MBTS channels are readout inthe extended barrel drawers
Channels Cells Trigger Outputs
Long barrel 5760 2880 1152
Extended barrel 3564 1790 768
Gap and crack 480 480 128
MBTS 32 32 32
Total 9836 5182 2080
which is located on the digitiser board [7]. This chip con-tains a pipeline memory that stores the sampled data for upto 6.4 µs. The pipeline memory can be adjusted in coarsetiming steps of 25 ns. The digitisation timing of the ADCscan be adjusted in multiples of ∼0.1 ns so that the cen-tral sample is as close to the PMT pulse peak as possibleand to make sure the full extension of the pulse is sam-pled. However, this adjustment is possible only for groupsof six channels, so a residual offset remains, that must bedealt with at the signal reconstruction level (see Sect. 3.2).Due to bandwidth requirements, only seven samples fromone gain are read out from the front-end electronics. A gain
switch is used to determine if the high or low gain is sent.The digitised samples are sent via optical fibres to the back-end electronics which are located outside the experimentalhall. From the digitised samples, the back-end electronicsdetermine the time and energy of the channel’s signal as de-scribed in Sect. 3.2.
In addition to the digital readout of the PMT signal, amillisecond-timescale integrator circuit is also located onthe 3-in-1 card. The Tile integrator is designed to mea-sure the PMT current during 137Cs calibrations (see Sect. 4)and also to measure the current from minimum bias proton-proton interactions at the LHC. The integration period is ap-proximately 14 ms and a 12-bit ADC is used for the readout.
Adder boards are distributed along the drawer. Eachadder board receives the analogue signals from up to six 3-in-1 cards corresponding to cells of the same η. The trig-ger signal corresponding to a “tower” (see Fig. 2) of cellswith Δη × Δφ = 0.1 × 0.1 is formed by an analogue sumof the input signals and, together with the signals from theother calorimeters, are sent via long cables to the Level-1(L1) calorimeter trigger system to identify jets, taus, totalcalorimeter energy and Emiss
T signatures. The signal fromall four gap and crack scintillators is also summed by theadder board and passed to the L1 calorimeter trigger. A sec-ond output of the adder boards (so-called muon output), thatcan be used at a later stage to reduce the muon backgroundrates, contains only the signal from cells of the outermostcalorimeter layer. Presently a fraction of the muon outputsis used for carrying the MBTS signals to the L1 trigger sys-tem.
2.2 Detector and data taking overview
The detector performance and stability results exposed inthis paper are based on calibration systems’ data and ran-dom triggered events which cover extended periods frommid-2008 up to the end of 2009 excluding the maintenanceperiod between December 2008 and May 2009. The resultsfrom cosmic muons and single beam are from the autumn2008 data-taking period, with the exception of the singlebeam data for timing studies, for which the winter 2009 andspring 2010 data is also used.
The Tile Calorimeter at the end of 2008 data-taking pe-riod was fully operational with approximately 1.5% deadcells. The majority of the dead cells were due to three draw-ers that were non-operational because of power supply prob-lems or data corruption, amounting to 60 cells or 1.2%. Theremaining dead cells were randomly distributed throughoutTileCal. During the 2009 data-taking period there were 48unusable cells, fewer than 1%. The number of dead L1 trig-ger towers is less than 0.5% and they are uniformly dis-tributed throughout the detector. For details on how non-operational cells are defined and the breakdown of theirproblems for the 2009 data-taking, see Sect. 3.1.
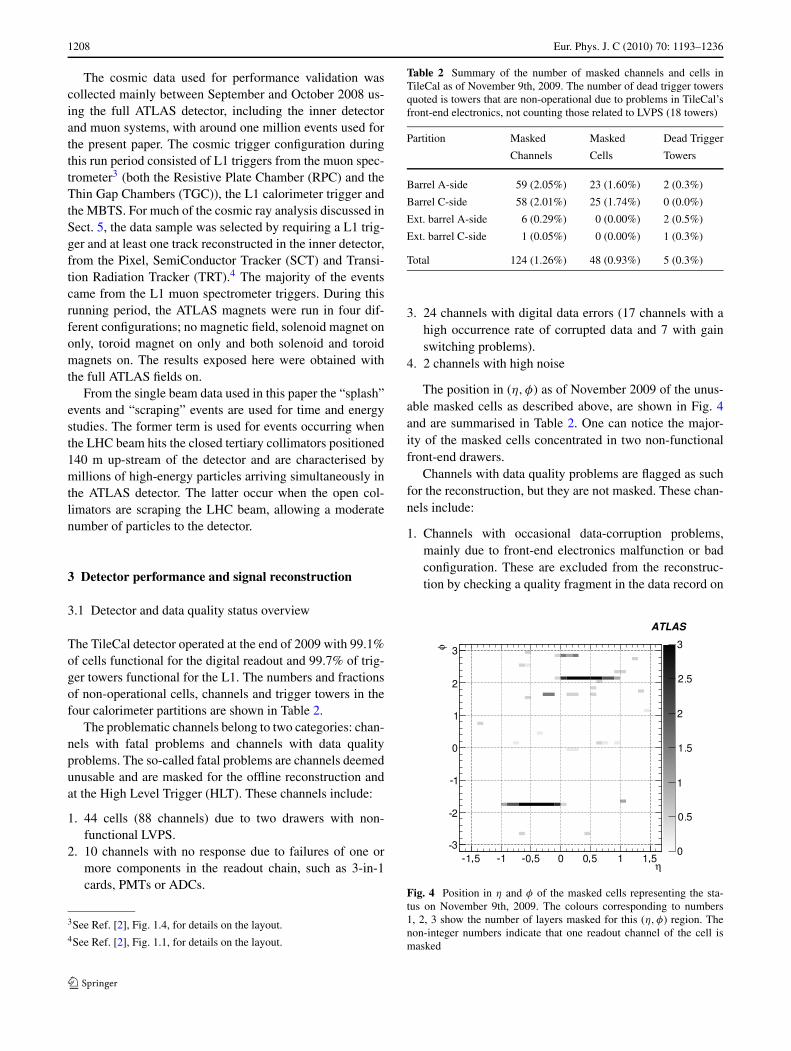
1208 Eur. Phys. J. C (2010) 70: 1193–1236
The cosmic data used for performance validation wascollected mainly between September and October 2008 us-ing the full ATLAS detector, including the inner detectorand muon systems, with around one million events used forthe present paper. The cosmic trigger configuration duringthis run period consisted of L1 triggers from the muon spec-trometer3 (both the Resistive Plate Chamber (RPC) and theThin Gap Chambers (TGC)), the L1 calorimeter trigger andthe MBTS. For much of the cosmic ray analysis discussed inSect. 5, the data sample was selected by requiring a L1 trig-ger and at least one track reconstructed in the inner detector,from the Pixel, SemiConductor Tracker (SCT) and Transi-tion Radiation Tracker (TRT).4 The majority of the eventscame from the L1 muon spectrometer triggers. During thisrunning period, the ATLAS magnets were run in four dif-ferent configurations; no magnetic field, solenoid magnet ononly, toroid magnet on only and both solenoid and toroidmagnets on. The results exposed here were obtained withthe full ATLAS fields on.
From the single beam data used in this paper the “splash”events and “scraping” events are used for time and energystudies. The former term is used for events occurring whenthe LHC beam hits the closed tertiary collimators positioned140 m up-stream of the detector and are characterised bymillions of high-energy particles arriving simultaneously inthe ATLAS detector. The latter occur when the open col-limators are scraping the LHC beam, allowing a moderatenumber of particles to the detector.
3 Detector performance and signal reconstruction
3.1 Detector and data quality status overview
The TileCal detector operated at the end of 2009 with 99.1%of cells functional for the digital readout and 99.7% of trig-ger towers functional for the L1. The numbers and fractionsof non-operational cells, channels and trigger towers in thefour calorimeter partitions are shown in Table 2.
The problematic channels belong to two categories: chan-nels with fatal problems and channels with data qualityproblems. The so-called fatal problems are channels deemedunusable and are masked for the offline reconstruction andat the High Level Trigger (HLT). These channels include:
1. 44 cells (88 channels) due to two drawers with non-functional LVPS.
2. 10 channels with no response due to failures of one ormore components in the readout chain, such as 3-in-1cards, PMTs or ADCs.
3See Ref. [2], Fig. 1.4, for details on the layout.4See Ref. [2], Fig. 1.1, for details on the layout.
Table 2 Summary of the number of masked channels and cells inTileCal as of November 9th, 2009. The number of dead trigger towersquoted is towers that are non-operational due to problems in TileCal’sfront-end electronics, not counting those related to LVPS (18 towers)
Partition Masked Masked Dead Trigger
Channels Cells Towers
Barrel A-side 59 (2.05%) 23 (1.60%) 2 (0.3%)
Barrel C-side 58 (2.01%) 25 (1.74%) 0 (0.0%)
Ext. barrel A-side 6 (0.29%) 0 (0.00%) 2 (0.5%)
Ext. barrel C-side 1 (0.05%) 0 (0.00%) 1 (0.3%)
Total 124 (1.26%) 48 (0.93%) 5 (0.3%)
3. 24 channels with digital data errors (17 channels with ahigh occurrence rate of corrupted data and 7 with gainswitching problems).
4. 2 channels with high noise
The position in (η,φ) as of November 2009 of the unus-able masked cells as described above, are shown in Fig. 4and are summarised in Table 2. One can notice the major-ity of the masked cells concentrated in two non-functionalfront-end drawers.
Channels with data quality problems are flagged as suchfor the reconstruction, but they are not masked. These chan-nels include:
1. Channels with occasional data-corruption problems,mainly due to front-end electronics malfunction or badconfiguration. These are excluded from the reconstruc-tion by checking a quality fragment in the data record on
Fig. 4 Position in η and φ of the masked cells representing the sta-tus on November 9th, 2009. The colours corresponding to numbers1, 2, 3 show the number of layers masked for this (η,φ) region. Thenon-integer numbers indicate that one readout channel of the cell ismasked
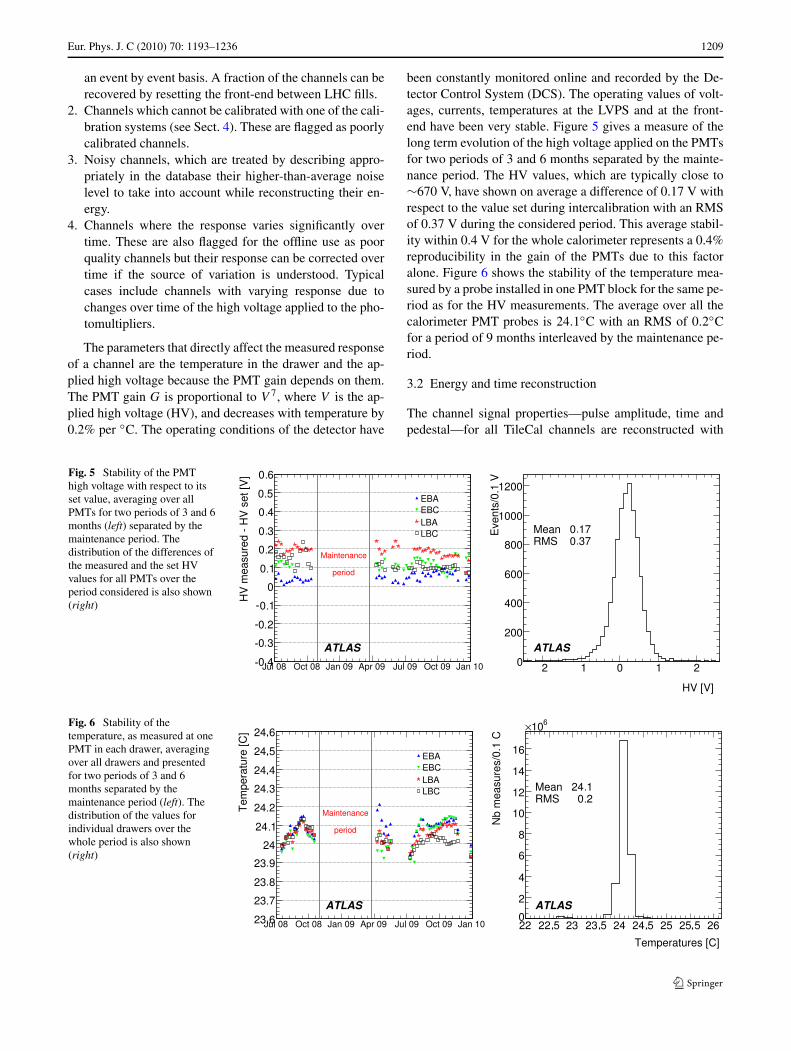
Eur. Phys. J. C (2010) 70: 1193–1236 1209
an event by event basis. A fraction of the channels can berecovered by resetting the front-end between LHC fills.
2. Channels which cannot be calibrated with one of the cali-bration systems (see Sect. 4). These are flagged as poorlycalibrated channels.
3. Noisy channels, which are treated by describing appro-priately in the database their higher-than-average noiselevel to take into account while reconstructing their en-ergy.
4. Channels where the response varies significantly overtime. These are also flagged for the offline use as poorquality channels but their response can be corrected overtime if the source of variation is understood. Typicalcases include channels with varying response due tochanges over time of the high voltage applied to the pho-tomultipliers.
The parameters that directly affect the measured responseof a channel are the temperature in the drawer and the ap-plied high voltage because the PMT gain depends on them.The PMT gain G is proportional to V 7, where V is the ap-plied high voltage (HV), and decreases with temperature by0.2% per ◦C. The operating conditions of the detector have
been constantly monitored online and recorded by the De-tector Control System (DCS). The operating values of volt-ages, currents, temperatures at the LVPS and at the front-end have been very stable. Figure 5 gives a measure of thelong term evolution of the high voltage applied on the PMTsfor two periods of 3 and 6 months separated by the mainte-nance period. The HV values, which are typically close to∼670 V, have shown on average a difference of 0.17 V withrespect to the value set during intercalibration with an RMSof 0.37 V during the considered period. This average stabil-ity within 0.4 V for the whole calorimeter represents a 0.4%reproducibility in the gain of the PMTs due to this factoralone. Figure 6 shows the stability of the temperature mea-sured by a probe installed in one PMT block for the same pe-riod as for the HV measurements. The average over all thecalorimeter PMT probes is 24.1◦C with an RMS of 0.2◦Cfor a period of 9 months interleaved by the maintenance pe-riod.
3.2 Energy and time reconstruction
The channel signal properties—pulse amplitude, time andpedestal—for all TileCal channels are reconstructed with
Fig. 5 Stability of the PMThigh voltage with respect to itsset value, averaging over allPMTs for two periods of 3 and 6months (left) separated by themaintenance period. Thedistribution of the differences ofthe measured and the set HVvalues for all PMTs over theperiod considered is also shown(right)
Fig. 6 Stability of thetemperature, as measured at onePMT in each drawer, averagingover all drawers and presentedfor two periods of 3 and 6months separated by themaintenance period (left). Thedistribution of the values forindividual drawers over thewhole period is also shown(right)
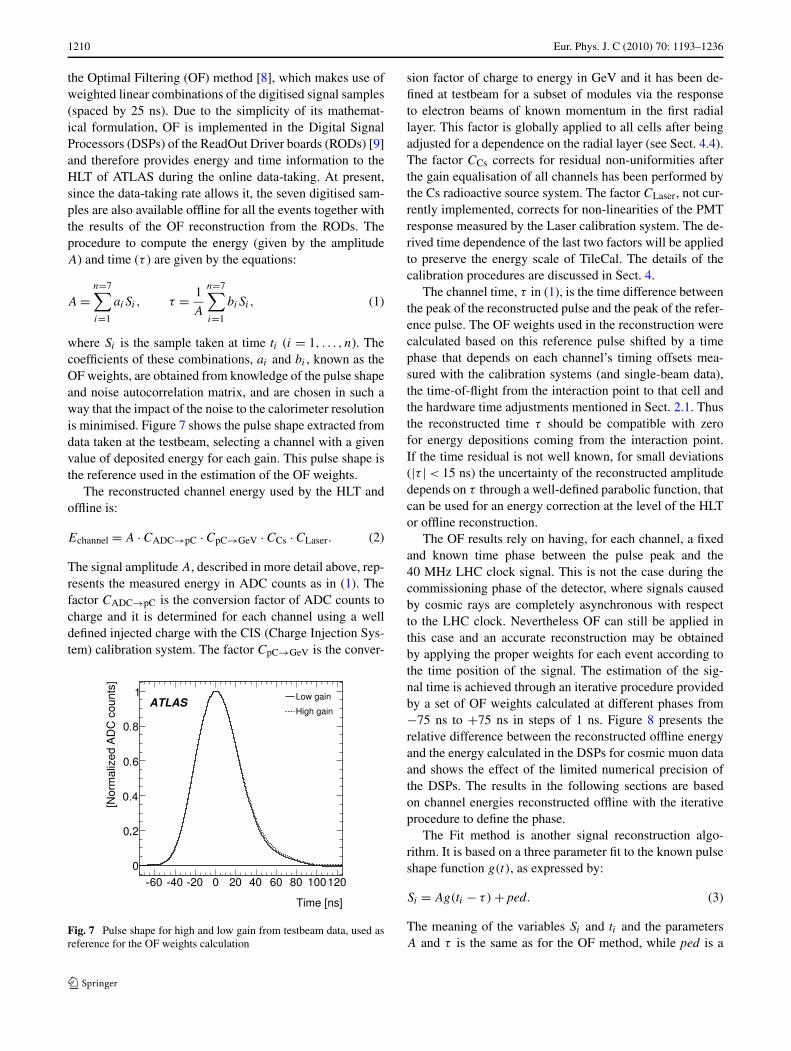
1210 Eur. Phys. J. C (2010) 70: 1193–1236
the Optimal Filtering (OF) method [8], which makes use ofweighted linear combinations of the digitised signal samples(spaced by 25 ns). Due to the simplicity of its mathemat-ical formulation, OF is implemented in the Digital SignalProcessors (DSPs) of the ReadOut Driver boards (RODs) [9]and therefore provides energy and time information to theHLT of ATLAS during the online data-taking. At present,since the data-taking rate allows it, the seven digitised sam-ples are also available offline for all the events together withthe results of the OF reconstruction from the RODs. Theprocedure to compute the energy (given by the amplitudeA) and time (τ ) are given by the equations:
A =n=7∑
i=1
aiSi, τ = 1
A
n=7∑
i=1
biSi, (1)
where Si is the sample taken at time ti (i = 1, . . . , n). Thecoefficients of these combinations, ai and bi , known as theOF weights, are obtained from knowledge of the pulse shapeand noise autocorrelation matrix, and are chosen in such away that the impact of the noise to the calorimeter resolutionis minimised. Figure 7 shows the pulse shape extracted fromdata taken at the testbeam, selecting a channel with a givenvalue of deposited energy for each gain. This pulse shape isthe reference used in the estimation of the OF weights.
The reconstructed channel energy used by the HLT andoffline is:
Echannel = A · CADC→pC · CpC→GeV · CCs · CLaser. (2)
The signal amplitude A, described in more detail above, rep-resents the measured energy in ADC counts as in (1). Thefactor CADC→pC is the conversion factor of ADC counts tocharge and it is determined for each channel using a welldefined injected charge with the CIS (Charge Injection Sys-tem) calibration system. The factor CpC→GeV is the conver-
Fig. 7 Pulse shape for high and low gain from testbeam data, used asreference for the OF weights calculation
sion factor of charge to energy in GeV and it has been de-fined at testbeam for a subset of modules via the responseto electron beams of known momentum in the first radiallayer. This factor is globally applied to all cells after beingadjusted for a dependence on the radial layer (see Sect. 4.4).The factor CCs corrects for residual non-uniformities afterthe gain equalisation of all channels has been performed bythe Cs radioactive source system. The factor CLaser, not cur-rently implemented, corrects for non-linearities of the PMTresponse measured by the Laser calibration system. The de-rived time dependence of the last two factors will be appliedto preserve the energy scale of TileCal. The details of thecalibration procedures are discussed in Sect. 4.
The channel time, τ in (1), is the time difference betweenthe peak of the reconstructed pulse and the peak of the refer-ence pulse. The OF weights used in the reconstruction werecalculated based on this reference pulse shifted by a timephase that depends on each channel’s timing offsets mea-sured with the calibration systems (and single-beam data),the time-of-flight from the interaction point to that cell andthe hardware time adjustments mentioned in Sect. 2.1. Thusthe reconstructed time τ should be compatible with zerofor energy depositions coming from the interaction point.If the time residual is not well known, for small deviations(|τ | < 15 ns) the uncertainty of the reconstructed amplitudedepends on τ through a well-defined parabolic function, thatcan be used for an energy correction at the level of the HLTor offline reconstruction.
The OF results rely on having, for each channel, a fixedand known time phase between the pulse peak and the40 MHz LHC clock signal. This is not the case during thecommissioning phase of the detector, where signals causedby cosmic rays are completely asynchronous with respectto the LHC clock. Nevertheless OF can still be applied inthis case and an accurate reconstruction may be obtainedby applying the proper weights for each event according tothe time position of the signal. The estimation of the sig-nal time is achieved through an iterative procedure providedby a set of OF weights calculated at different phases from−75 ns to +75 ns in steps of 1 ns. Figure 8 presents therelative difference between the reconstructed offline energyand the energy calculated in the DSPs for cosmic muon dataand shows the effect of the limited numerical precision ofthe DSPs. The results in the following sections are basedon channel energies reconstructed offline with the iterativeprocedure to define the phase.
The Fit method is another signal reconstruction algo-rithm. It is based on a three parameter fit to the known pulseshape function g(t), as expressed by:
Si = Ag(ti − τ) + ped. (3)
The meaning of the variables Si and ti and the parametersA and τ is the same as for the OF method, while ped is a
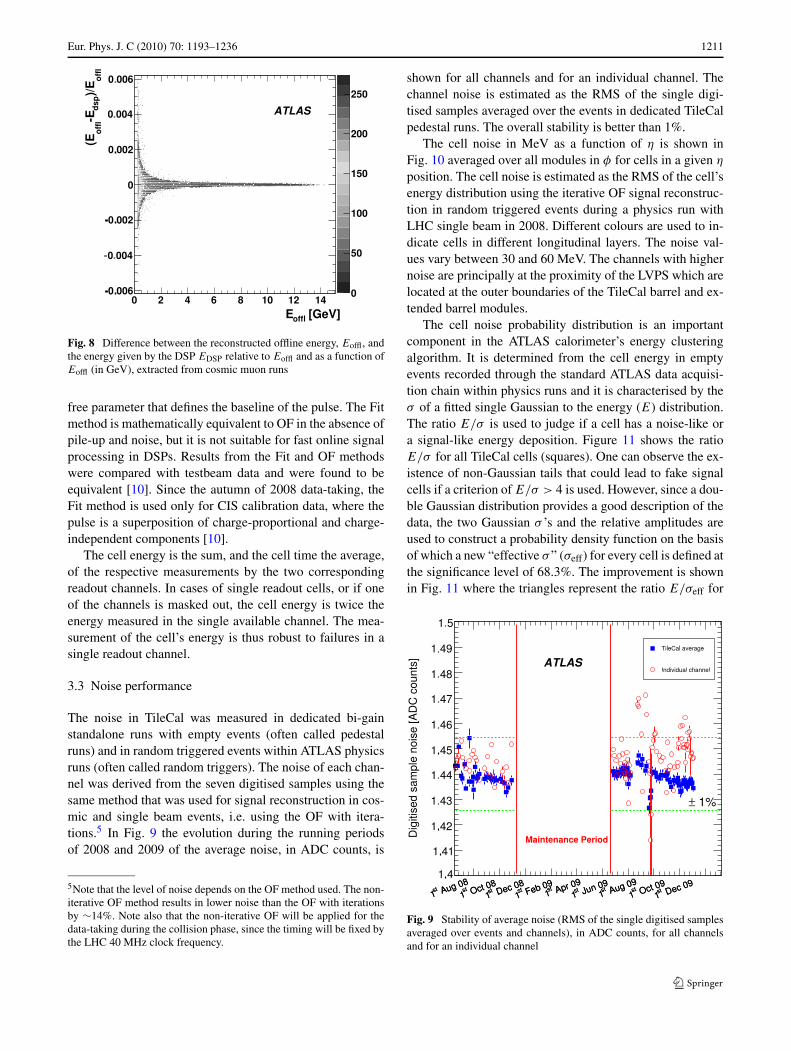
Eur. Phys. J. C (2010) 70: 1193–1236 1211
Fig. 8 Difference between the reconstructed offline energy, Eoffl, andthe energy given by the DSP EDSP relative to Eoffl and as a function ofEoffl (in GeV), extracted from cosmic muon runs
free parameter that defines the baseline of the pulse. The Fitmethod is mathematically equivalent to OF in the absence ofpile-up and noise, but it is not suitable for fast online signalprocessing in DSPs. Results from the Fit and OF methodswere compared with testbeam data and were found to beequivalent [10]. Since the autumn of 2008 data-taking, theFit method is used only for CIS calibration data, where thepulse is a superposition of charge-proportional and charge-independent components [10].
The cell energy is the sum, and the cell time the average,of the respective measurements by the two correspondingreadout channels. In cases of single readout cells, or if oneof the channels is masked out, the cell energy is twice theenergy measured in the single available channel. The mea-surement of the cell’s energy is thus robust to failures in asingle readout channel.
3.3 Noise performance
The noise in TileCal was measured in dedicated bi-gainstandalone runs with empty events (often called pedestalruns) and in random triggered events within ATLAS physicsruns (often called random triggers). The noise of each chan-nel was derived from the seven digitised samples using thesame method that was used for signal reconstruction in cos-mic and single beam events, i.e. using the OF with itera-tions.5 In Fig. 9 the evolution during the running periodsof 2008 and 2009 of the average noise, in ADC counts, is
5Note that the level of noise depends on the OF method used. The non-iterative OF method results in lower noise than the OF with iterationsby ∼14%. Note also that the non-iterative OF will be applied for thedata-taking during the collision phase, since the timing will be fixed bythe LHC 40 MHz clock frequency.
shown for all channels and for an individual channel. Thechannel noise is estimated as the RMS of the single digi-tised samples averaged over the events in dedicated TileCalpedestal runs. The overall stability is better than 1%.
The cell noise in MeV as a function of η is shown inFig. 10 averaged over all modules in φ for cells in a given η
position. The cell noise is estimated as the RMS of the cell’senergy distribution using the iterative OF signal reconstruc-tion in random triggered events during a physics run withLHC single beam in 2008. Different colours are used to in-dicate cells in different longitudinal layers. The noise val-ues vary between 30 and 60 MeV. The channels with highernoise are principally at the proximity of the LVPS which arelocated at the outer boundaries of the TileCal barrel and ex-tended barrel modules.
The cell noise probability distribution is an importantcomponent in the ATLAS calorimeter’s energy clusteringalgorithm. It is determined from the cell energy in emptyevents recorded through the standard ATLAS data acquisi-tion chain within physics runs and it is characterised by theσ of a fitted single Gaussian to the energy (E) distribution.The ratio E/σ is used to judge if a cell has a noise-like ora signal-like energy deposition. Figure 11 shows the ratioE/σ for all TileCal cells (squares). One can observe the ex-istence of non-Gaussian tails that could lead to fake signalcells if a criterion of E/σ > 4 is used. However, since a dou-ble Gaussian distribution provides a good description of thedata, the two Gaussian σ ’s and the relative amplitudes areused to construct a probability density function on the basisof which a new “effective σ ” (σeff) for every cell is defined atthe significance level of 68.3%. The improvement is shownin Fig. 11 where the triangles represent the ratio E/σeff for
Fig. 9 Stability of average noise (RMS of the single digitised samplesaveraged over events and channels), in ADC counts, for all channelsand for an individual channel
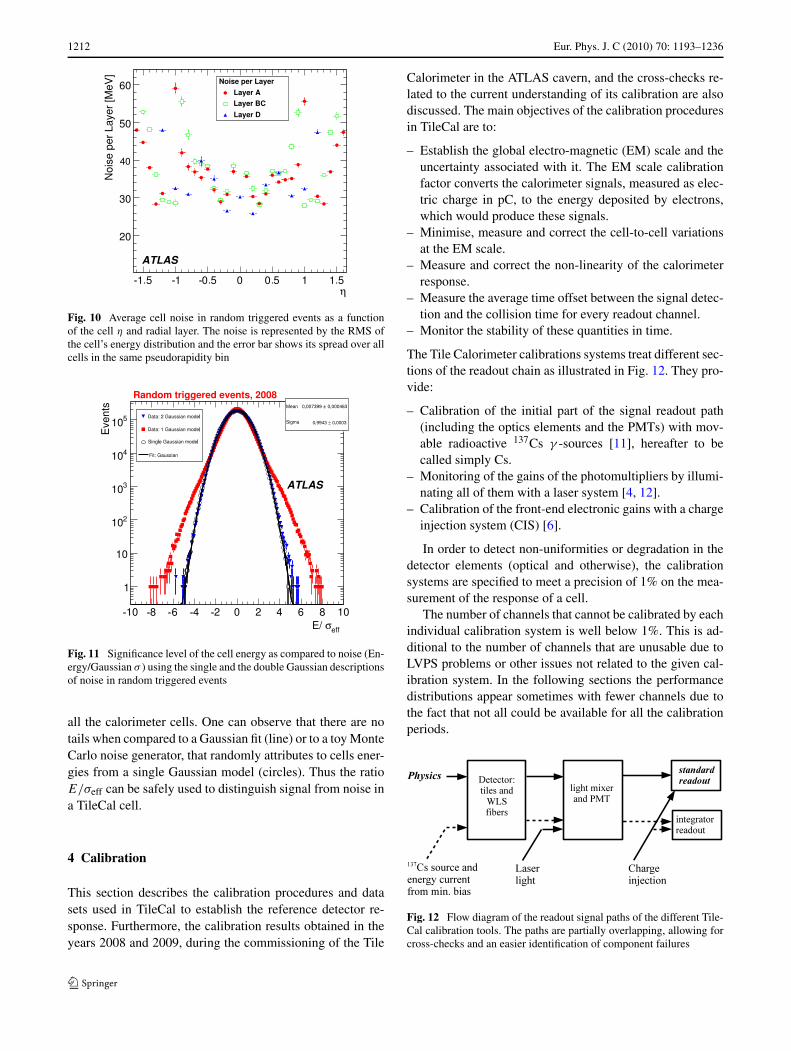
1212 Eur. Phys. J. C (2010) 70: 1193–1236
Fig. 10 Average cell noise in random triggered events as a functionof the cell η and radial layer. The noise is represented by the RMS ofthe cell’s energy distribution and the error bar shows its spread over allcells in the same pseudorapidity bin
Fig. 11 Significance level of the cell energy as compared to noise (En-ergy/Gaussian σ ) using the single and the double Gaussian descriptionsof noise in random triggered events
all the calorimeter cells. One can observe that there are notails when compared to a Gaussian fit (line) or to a toy MonteCarlo noise generator, that randomly attributes to cells ener-gies from a single Gaussian model (circles). Thus the ratioE/σeff can be safely used to distinguish signal from noise ina TileCal cell.
4 Calibration
This section describes the calibration procedures and datasets used in TileCal to establish the reference detector re-sponse. Furthermore, the calibration results obtained in theyears 2008 and 2009, during the commissioning of the Tile
Calorimeter in the ATLAS cavern, and the cross-checks re-lated to the current understanding of its calibration are alsodiscussed. The main objectives of the calibration proceduresin TileCal are to:
– Establish the global electro-magnetic (EM) scale and theuncertainty associated with it. The EM scale calibrationfactor converts the calorimeter signals, measured as elec-tric charge in pC, to the energy deposited by electrons,which would produce these signals.
– Minimise, measure and correct the cell-to-cell variationsat the EM scale.
– Measure and correct the non-linearity of the calorimeterresponse.
– Measure the average time offset between the signal detec-tion and the collision time for every readout channel.
– Monitor the stability of these quantities in time.
The Tile Calorimeter calibrations systems treat different sec-tions of the readout chain as illustrated in Fig. 12. They pro-vide:
– Calibration of the initial part of the signal readout path(including the optics elements and the PMTs) with mov-able radioactive 137Cs γ -sources [11], hereafter to becalled simply Cs.
– Monitoring of the gains of the photomultipliers by illumi-nating all of them with a laser system [4, 12].
– Calibration of the front-end electronic gains with a chargeinjection system (CIS) [6].
In order to detect non-uniformities or degradation in thedetector elements (optical and otherwise), the calibrationsystems are specified to meet a precision of 1% on the mea-surement of the response of a cell.
The number of channels that cannot be calibrated by eachindividual calibration system is well below 1%. This is ad-ditional to the number of channels that are unusable due toLVPS problems or other issues not related to the given cal-ibration system. In the following sections the performancedistributions appear sometimes with fewer channels due tothe fact that not all could be available for all the calibrationperiods.
Fig. 12 Flow diagram of the readout signal paths of the different Tile-Cal calibration tools. The paths are partially overlapping, allowing forcross-checks and an easier identification of component failures
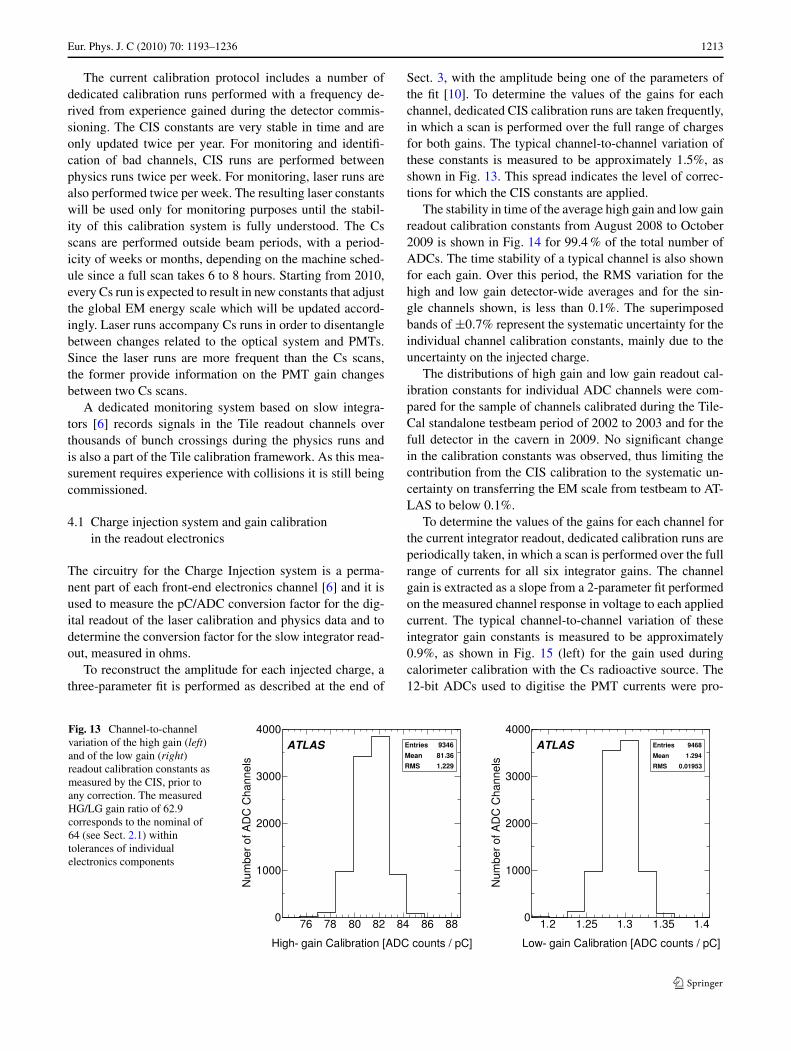
Eur. Phys. J. C (2010) 70: 1193–1236 1213
The current calibration protocol includes a number ofdedicated calibration runs performed with a frequency de-rived from experience gained during the detector commis-sioning. The CIS constants are very stable in time and areonly updated twice per year. For monitoring and identifi-cation of bad channels, CIS runs are performed betweenphysics runs twice per week. For monitoring, laser runs arealso performed twice per week. The resulting laser constantswill be used only for monitoring purposes until the stabil-ity of this calibration system is fully understood. The Csscans are performed outside beam periods, with a period-icity of weeks or months, depending on the machine sched-ule since a full scan takes 6 to 8 hours. Starting from 2010,every Cs run is expected to result in new constants that adjustthe global EM energy scale which will be updated accord-ingly. Laser runs accompany Cs runs in order to disentanglebetween changes related to the optical system and PMTs.Since the laser runs are more frequent than the Cs scans,the former provide information on the PMT gain changesbetween two Cs scans.
A dedicated monitoring system based on slow integra-tors [6] records signals in the Tile readout channels overthousands of bunch crossings during the physics runs andis also a part of the Tile calibration framework. As this mea-surement requires experience with collisions it is still beingcommissioned.
4.1 Charge injection system and gain calibrationin the readout electronics
The circuitry for the Charge Injection system is a perma-nent part of each front-end electronics channel [6] and it isused to measure the pC/ADC conversion factor for the dig-ital readout of the laser calibration and physics data and todetermine the conversion factor for the slow integrator read-out, measured in ohms.
To reconstruct the amplitude for each injected charge, athree-parameter fit is performed as described at the end of
Sect. 3, with the amplitude being one of the parameters ofthe fit [10]. To determine the values of the gains for eachchannel, dedicated CIS calibration runs are taken frequently,in which a scan is performed over the full range of chargesfor both gains. The typical channel-to-channel variation ofthese constants is measured to be approximately 1.5%, asshown in Fig. 13. This spread indicates the level of correc-tions for which the CIS constants are applied.
The stability in time of the average high gain and low gainreadout calibration constants from August 2008 to October2009 is shown in Fig. 14 for 99.4 % of the total number ofADCs. The time stability of a typical channel is also shownfor each gain. Over this period, the RMS variation for thehigh and low gain detector-wide averages and for the sin-gle channels shown, is less than 0.1%. The superimposedbands of ±0.7% represent the systematic uncertainty for theindividual channel calibration constants, mainly due to theuncertainty on the injected charge.
The distributions of high gain and low gain readout cal-ibration constants for individual ADC channels were com-pared for the sample of channels calibrated during the Tile-Cal standalone testbeam period of 2002 to 2003 and for thefull detector in the cavern in 2009. No significant changein the calibration constants was observed, thus limiting thecontribution from the CIS calibration to the systematic un-certainty on transferring the EM scale from testbeam to AT-LAS to below 0.1%.
To determine the values of the gains for each channel forthe current integrator readout, dedicated calibration runs areperiodically taken, in which a scan is performed over the fullrange of currents for all six integrator gains. The channelgain is extracted as a slope from a 2-parameter fit performedon the measured channel response in voltage to each appliedcurrent. The typical channel-to-channel variation of theseintegrator gain constants is measured to be approximately0.9%, as shown in Fig. 15 (left) for the gain used duringcalorimeter calibration with the Cs radioactive source. The12-bit ADCs used to digitise the PMT currents were pro-
Fig. 13 Channel-to-channelvariation of the high gain (left)and of the low gain (right)readout calibration constants asmeasured by the CIS, prior toany correction. The measuredHG/LG gain ratio of 62.9corresponds to the nominal of64 (see Sect. 2.1) withintolerances of individualelectronics components
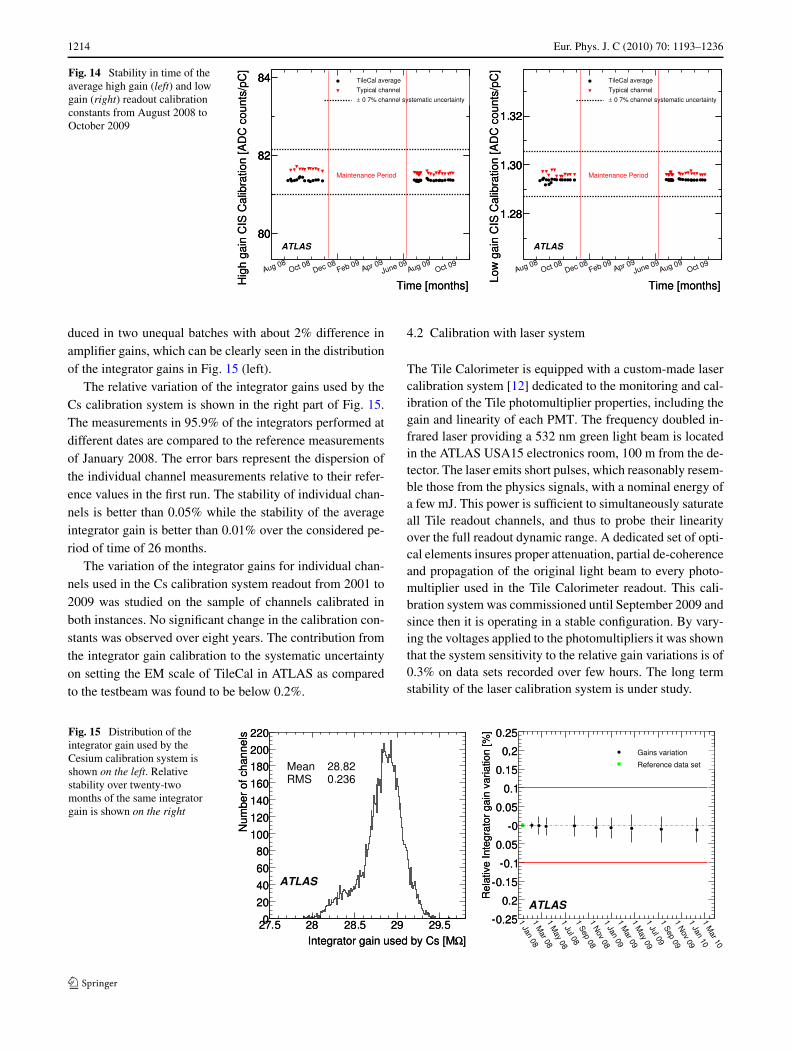
1214 Eur. Phys. J. C (2010) 70: 1193–1236
Fig. 14 Stability in time of theaverage high gain (left) and lowgain (right) readout calibrationconstants from August 2008 toOctober 2009
duced in two unequal batches with about 2% difference inamplifier gains, which can be clearly seen in the distributionof the integrator gains in Fig. 15 (left).
The relative variation of the integrator gains used by theCs calibration system is shown in the right part of Fig. 15.The measurements in 95.9% of the integrators performed atdifferent dates are compared to the reference measurementsof January 2008. The error bars represent the dispersion ofthe individual channel measurements relative to their refer-ence values in the first run. The stability of individual chan-nels is better than 0.05% while the stability of the averageintegrator gain is better than 0.01% over the considered pe-riod of time of 26 months.
The variation of the integrator gains for individual chan-nels used in the Cs calibration system readout from 2001 to2009 was studied on the sample of channels calibrated inboth instances. No significant change in the calibration con-stants was observed over eight years. The contribution fromthe integrator gain calibration to the systematic uncertaintyon setting the EM scale of TileCal in ATLAS as comparedto the testbeam was found to be below 0.2%.
4.2 Calibration with laser system
The Tile Calorimeter is equipped with a custom-made lasercalibration system [12] dedicated to the monitoring and cal-ibration of the Tile photomultiplier properties, including thegain and linearity of each PMT. The frequency doubled in-frared laser providing a 532 nm green light beam is locatedin the ATLAS USA15 electronics room, 100 m from the de-tector. The laser emits short pulses, which reasonably resem-ble those from the physics signals, with a nominal energy ofa few mJ. This power is sufficient to simultaneously saturateall Tile readout channels, and thus to probe their linearityover the full readout dynamic range. A dedicated set of opti-cal elements insures proper attenuation, partial de-coherenceand propagation of the original light beam to every photo-multiplier used in the Tile Calorimeter readout. This cali-bration system was commissioned until September 2009 andsince then it is operating in a stable configuration. By vary-ing the voltages applied to the photomultipliers it was shownthat the system sensitivity to the relative gain variations is of0.3% on data sets recorded over few hours. The long termstability of the laser calibration system is under study.
Fig. 15 Distribution of theintegrator gain used by theCesium calibration system isshown on the left. Relativestability over twenty-twomonths of the same integratorgain is shown on the right
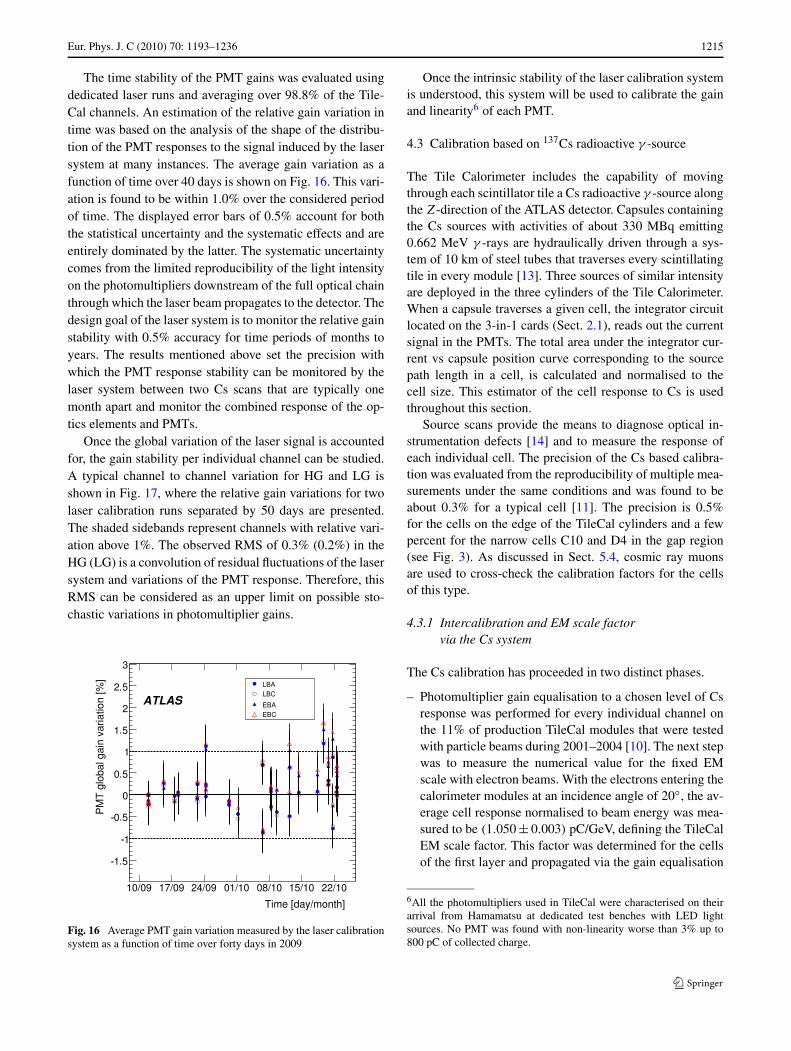
Eur. Phys. J. C (2010) 70: 1193–1236 1215
The time stability of the PMT gains was evaluated usingdedicated laser runs and averaging over 98.8% of the Tile-Cal channels. An estimation of the relative gain variation intime was based on the analysis of the shape of the distribu-tion of the PMT responses to the signal induced by the lasersystem at many instances. The average gain variation as afunction of time over 40 days is shown on Fig. 16. This vari-ation is found to be within 1.0% over the considered periodof time. The displayed error bars of 0.5% account for boththe statistical uncertainty and the systematic effects and areentirely dominated by the latter. The systematic uncertaintycomes from the limited reproducibility of the light intensityon the photomultipliers downstream of the full optical chainthrough which the laser beam propagates to the detector. Thedesign goal of the laser system is to monitor the relative gainstability with 0.5% accuracy for time periods of months toyears. The results mentioned above set the precision withwhich the PMT response stability can be monitored by thelaser system between two Cs scans that are typically onemonth apart and monitor the combined response of the op-tics elements and PMTs.
Once the global variation of the laser signal is accountedfor, the gain stability per individual channel can be studied.A typical channel to channel variation for HG and LG isshown in Fig. 17, where the relative gain variations for twolaser calibration runs separated by 50 days are presented.The shaded sidebands represent channels with relative vari-ation above 1%. The observed RMS of 0.3% (0.2%) in theHG (LG) is a convolution of residual fluctuations of the lasersystem and variations of the PMT response. Therefore, thisRMS can be considered as an upper limit on possible sto-chastic variations in photomultiplier gains.
Fig. 16 Average PMT gain variation measured by the laser calibrationsystem as a function of time over forty days in 2009
Once the intrinsic stability of the laser calibration systemis understood, this system will be used to calibrate the gainand linearity6 of each PMT.
4.3 Calibration based on 137Cs radioactive γ -source
The Tile Calorimeter includes the capability of movingthrough each scintillator tile a Cs radioactive γ -source alongthe Z-direction of the ATLAS detector. Capsules containingthe Cs sources with activities of about 330 MBq emitting0.662 MeV γ -rays are hydraulically driven through a sys-tem of 10 km of steel tubes that traverses every scintillatingtile in every module [13]. Three sources of similar intensityare deployed in the three cylinders of the Tile Calorimeter.When a capsule traverses a given cell, the integrator circuitlocated on the 3-in-1 cards (Sect. 2.1), reads out the currentsignal in the PMTs. The total area under the integrator cur-rent vs capsule position curve corresponding to the sourcepath length in a cell, is calculated and normalised to thecell size. This estimator of the cell response to Cs is usedthroughout this section.
Source scans provide the means to diagnose optical in-strumentation defects [14] and to measure the response ofeach individual cell. The precision of the Cs based calibra-tion was evaluated from the reproducibility of multiple mea-surements under the same conditions and was found to beabout 0.3% for a typical cell [11]. The precision is 0.5%for the cells on the edge of the TileCal cylinders and a fewpercent for the narrow cells C10 and D4 in the gap region(see Fig. 3). As discussed in Sect. 5.4, cosmic ray muonsare used to cross-check the calibration factors for the cellsof this type.
4.3.1 Intercalibration and EM scale factorvia the Cs system
The Cs calibration has proceeded in two distinct phases.
– Photomultiplier gain equalisation to a chosen level of Csresponse was performed for every individual channel onthe 11% of production TileCal modules that were testedwith particle beams during 2001–2004 [10]. The next stepwas to measure the numerical value for the fixed EMscale with electron beams. With the electrons entering thecalorimeter modules at an incidence angle of 20◦, the av-erage cell response normalised to beam energy was mea-sured to be (1.050 ± 0.003) pC/GeV, defining the TileCalEM scale factor. This factor was determined for the cellsof the first layer and propagated via the gain equalisation
6All the photomultipliers used in TileCal were characterised on theirarrival from Hamamatsu at dedicated test benches with LED lightsources. No PMT was found with non-linearity worse than 3% up to800 pC of collected charge.
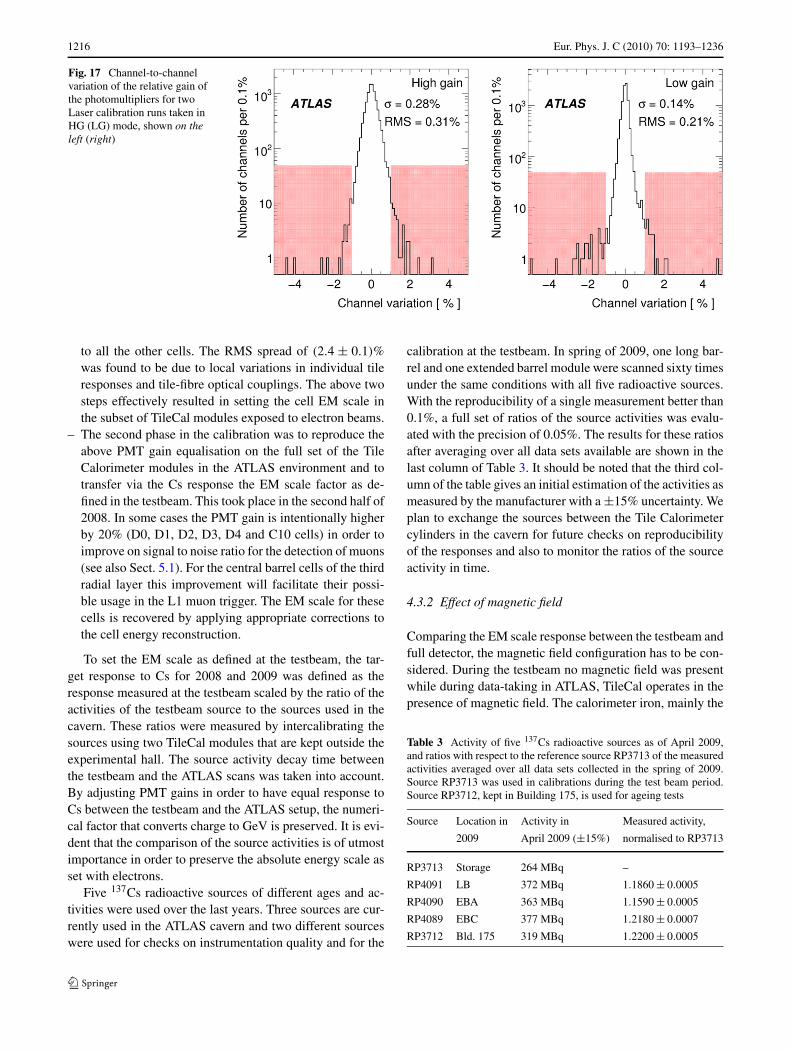
1216 Eur. Phys. J. C (2010) 70: 1193–1236
Fig. 17 Channel-to-channelvariation of the relative gain ofthe photomultipliers for twoLaser calibration runs taken inHG (LG) mode, shown on theleft (right)
to all the other cells. The RMS spread of (2.4 ± 0.1)%was found to be due to local variations in individual tileresponses and tile-fibre optical couplings. The above twosteps effectively resulted in setting the cell EM scale inthe subset of TileCal modules exposed to electron beams.
– The second phase in the calibration was to reproduce theabove PMT gain equalisation on the full set of the TileCalorimeter modules in the ATLAS environment and totransfer via the Cs response the EM scale factor as de-fined in the testbeam. This took place in the second half of2008. In some cases the PMT gain is intentionally higherby 20% (D0, D1, D2, D3, D4 and C10 cells) in order toimprove on signal to noise ratio for the detection of muons(see also Sect. 5.1). For the central barrel cells of the thirdradial layer this improvement will facilitate their possi-ble usage in the L1 muon trigger. The EM scale for thesecells is recovered by applying appropriate corrections tothe cell energy reconstruction.
To set the EM scale as defined at the testbeam, the tar-get response to Cs for 2008 and 2009 was defined as theresponse measured at the testbeam scaled by the ratio of theactivities of the testbeam source to the sources used in thecavern. These ratios were measured by intercalibrating thesources using two TileCal modules that are kept outside theexperimental hall. The source activity decay time betweenthe testbeam and the ATLAS scans was taken into account.By adjusting PMT gains in order to have equal response toCs between the testbeam and the ATLAS setup, the numeri-cal factor that converts charge to GeV is preserved. It is evi-dent that the comparison of the source activities is of utmostimportance in order to preserve the absolute energy scale asset with electrons.
Five 137Cs radioactive sources of different ages and ac-tivities were used over the last years. Three sources are cur-rently used in the ATLAS cavern and two different sourceswere used for checks on instrumentation quality and for the
calibration at the testbeam. In spring of 2009, one long bar-rel and one extended barrel module were scanned sixty timesunder the same conditions with all five radioactive sources.With the reproducibility of a single measurement better than0.1%, a full set of ratios of the source activities was evalu-ated with the precision of 0.05%. The results for these ratiosafter averaging over all data sets available are shown in thelast column of Table 3. It should be noted that the third col-umn of the table gives an initial estimation of the activities asmeasured by the manufacturer with a ±15% uncertainty. Weplan to exchange the sources between the Tile Calorimetercylinders in the cavern for future checks on reproducibilityof the responses and also to monitor the ratios of the sourceactivity in time.
4.3.2 Effect of magnetic field
Comparing the EM scale response between the testbeam andfull detector, the magnetic field configuration has to be con-sidered. During the testbeam no magnetic field was presentwhile during data-taking in ATLAS, TileCal operates in thepresence of magnetic field. The calorimeter iron, mainly the
Table 3 Activity of five 137Cs radioactive sources as of April 2009,and ratios with respect to the reference source RP3713 of the measuredactivities averaged over all data sets collected in the spring of 2009.Source RP3713 was used in calibrations during the test beam period.Source RP3712, kept in Building 175, is used for ageing tests
Source Location in Activity in Measured activity,
2009 April 2009 (±15%) normalised to RP3713
RP3713 Storage 264 MBq –
RP4091 LB 372 MBq 1.1860 ± 0.0005
RP4090 EBA 363 MBq 1.1590 ± 0.0005
RP4089 EBC 377 MBq 1.2180 ± 0.0007
RP3712 Bld. 175 319 MBq 1.2200 ± 0.0005
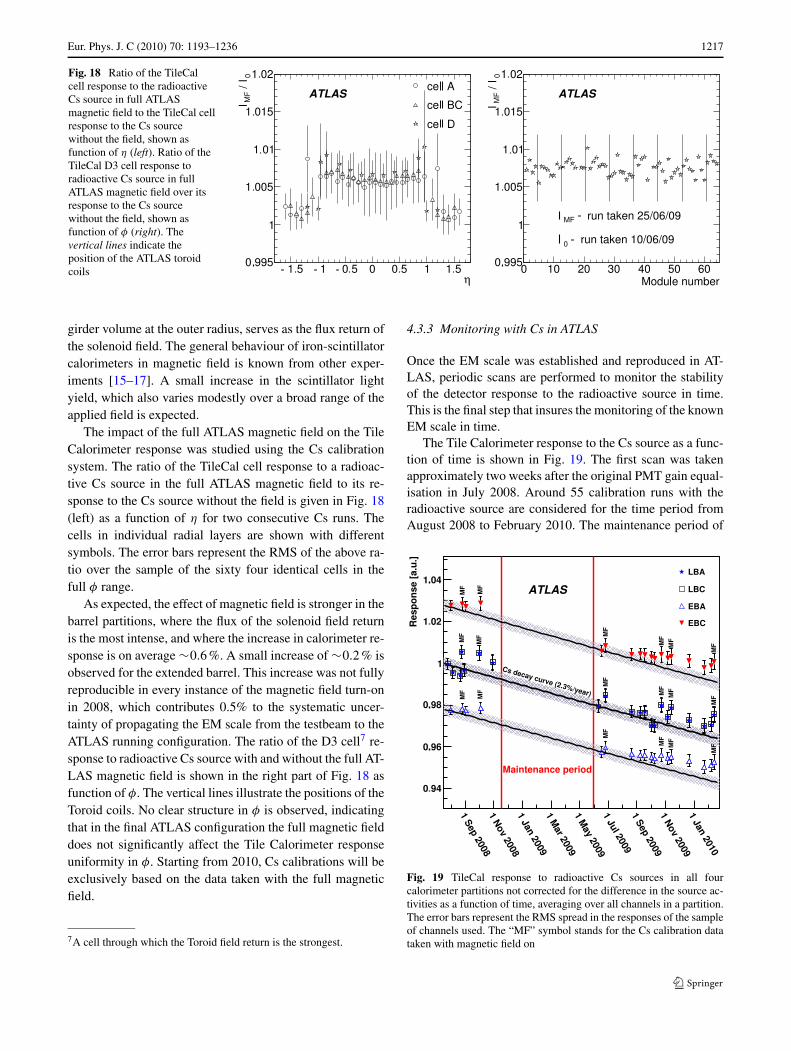
Eur. Phys. J. C (2010) 70: 1193–1236 1217
Fig. 18 Ratio of the TileCalcell response to the radioactiveCs source in full ATLASmagnetic field to the TileCal cellresponse to the Cs sourcewithout the field, shown asfunction of η (left). Ratio of theTileCal D3 cell response toradioactive Cs source in fullATLAS magnetic field over itsresponse to the Cs sourcewithout the field, shown asfunction of φ (right). Thevertical lines indicate theposition of the ATLAS toroidcoils
girder volume at the outer radius, serves as the flux return ofthe solenoid field. The general behaviour of iron-scintillatorcalorimeters in magnetic field is known from other exper-iments [15–17]. A small increase in the scintillator lightyield, which also varies modestly over a broad range of theapplied field is expected.
The impact of the full ATLAS magnetic field on the TileCalorimeter response was studied using the Cs calibrationsystem. The ratio of the TileCal cell response to a radioac-tive Cs source in the full ATLAS magnetic field to its re-sponse to the Cs source without the field is given in Fig. 18(left) as a function of η for two consecutive Cs runs. Thecells in individual radial layers are shown with differentsymbols. The error bars represent the RMS of the above ra-tio over the sample of the sixty four identical cells in thefull φ range.
As expected, the effect of magnetic field is stronger in thebarrel partitions, where the flux of the solenoid field returnis the most intense, and where the increase in calorimeter re-sponse is on average ∼0.6 %. A small increase of ∼0.2 % isobserved for the extended barrel. This increase was not fullyreproducible in every instance of the magnetic field turn-onin 2008, which contributes 0.5% to the systematic uncer-tainty of propagating the EM scale from the testbeam to theATLAS running configuration. The ratio of the D3 cell7 re-sponse to radioactive Cs source with and without the full AT-LAS magnetic field is shown in the right part of Fig. 18 asfunction of φ. The vertical lines illustrate the positions of theToroid coils. No clear structure in φ is observed, indicatingthat in the final ATLAS configuration the full magnetic fielddoes not significantly affect the Tile Calorimeter responseuniformity in φ. Starting from 2010, Cs calibrations will beexclusively based on the data taken with the full magneticfield.
7A cell through which the Toroid field return is the strongest.
4.3.3 Monitoring with Cs in ATLAS
Once the EM scale was established and reproduced in AT-LAS, periodic scans are performed to monitor the stabilityof the detector response to the radioactive source in time.This is the final step that insures the monitoring of the knownEM scale in time.
The Tile Calorimeter response to the Cs source as a func-tion of time is shown in Fig. 19. The first scan was takenapproximately two weeks after the original PMT gain equal-isation in July 2008. Around 55 calibration runs with theradioactive source are considered for the time period fromAugust 2008 to February 2010. The maintenance period of
Fig. 19 TileCal response to radioactive Cs sources in all fourcalorimeter partitions not corrected for the difference in the source ac-tivities as a function of time, averaging over all channels in a partition.The error bars represent the RMS spread in the responses of the sampleof channels used. The “MF” symbol stands for the Cs calibration datataken with magnetic field on
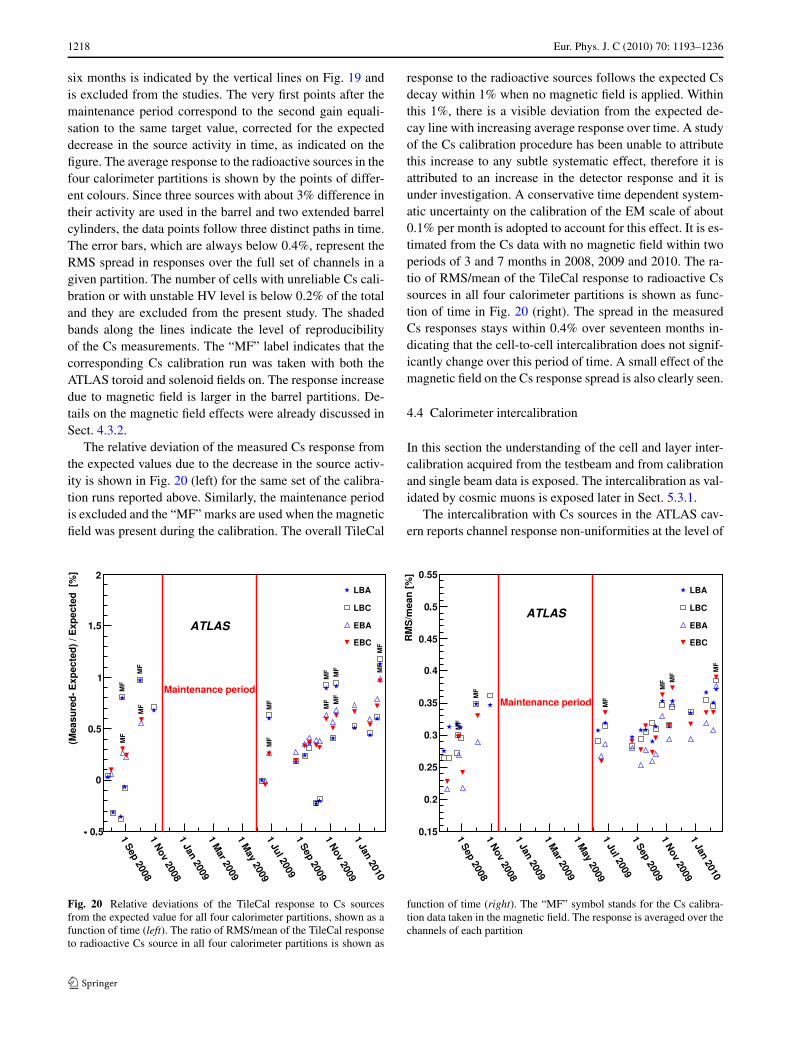
1218 Eur. Phys. J. C (2010) 70: 1193–1236
six months is indicated by the vertical lines on Fig. 19 andis excluded from the studies. The very first points after themaintenance period correspond to the second gain equali-sation to the same target value, corrected for the expecteddecrease in the source activity in time, as indicated on thefigure. The average response to the radioactive sources in thefour calorimeter partitions is shown by the points of differ-ent colours. Since three sources with about 3% difference intheir activity are used in the barrel and two extended barrelcylinders, the data points follow three distinct paths in time.The error bars, which are always below 0.4%, represent theRMS spread in responses over the full set of channels in agiven partition. The number of cells with unreliable Cs cali-bration or with unstable HV level is below 0.2% of the totaland they are excluded from the present study. The shadedbands along the lines indicate the level of reproducibilityof the Cs measurements. The “MF” label indicates that thecorresponding Cs calibration run was taken with both theATLAS toroid and solenoid fields on. The response increasedue to magnetic field is larger in the barrel partitions. De-tails on the magnetic field effects were already discussed inSect. 4.3.2.
The relative deviation of the measured Cs response fromthe expected values due to the decrease in the source activ-ity is shown in Fig. 20 (left) for the same set of the calibra-tion runs reported above. Similarly, the maintenance periodis excluded and the “MF” marks are used when the magneticfield was present during the calibration. The overall TileCal
response to the radioactive sources follows the expected Csdecay within 1% when no magnetic field is applied. Withinthis 1%, there is a visible deviation from the expected de-cay line with increasing average response over time. A studyof the Cs calibration procedure has been unable to attributethis increase to any subtle systematic effect, therefore it isattributed to an increase in the detector response and it isunder investigation. A conservative time dependent system-atic uncertainty on the calibration of the EM scale of about0.1% per month is adopted to account for this effect. It is es-timated from the Cs data with no magnetic field within twoperiods of 3 and 7 months in 2008, 2009 and 2010. The ra-tio of RMS/mean of the TileCal response to radioactive Cssources in all four calorimeter partitions is shown as func-tion of time in Fig. 20 (right). The spread in the measuredCs responses stays within 0.4% over seventeen months in-dicating that the cell-to-cell intercalibration does not signif-icantly change over this period of time. A small effect of themagnetic field on the Cs response spread is also clearly seen.
4.4 Calorimeter intercalibration
In this section the understanding of the cell and layer inter-calibration acquired from the testbeam and from calibrationand single beam data is exposed. The intercalibration as val-idated by cosmic muons is exposed later in Sect. 5.3.1.
The intercalibration with Cs sources in the ATLAS cav-ern reports channel response non-uniformities at the level of
Fig. 20 Relative deviations of the TileCal response to Cs sourcesfrom the expected value for all four calorimeter partitions, shown as afunction of time (left). The ratio of RMS/mean of the TileCal responseto radioactive Cs source in all four calorimeter partitions is shown as
function of time (right). The “MF” symbol stands for the Cs calibra-tion data taken in the magnetic field. The response is averaged over thechannels of each partition
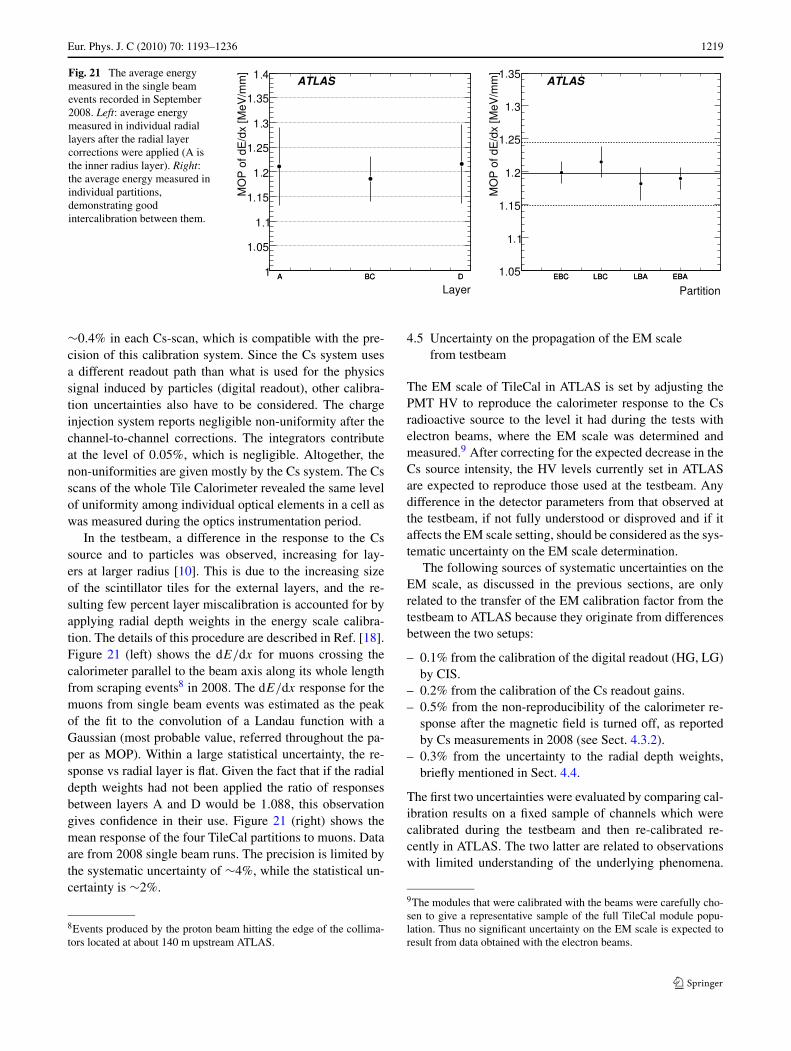
Eur. Phys. J. C (2010) 70: 1193–1236 1219
Fig. 21 The average energymeasured in the single beamevents recorded in September2008. Left: average energymeasured in individual radiallayers after the radial layercorrections were applied (A isthe inner radius layer). Right:the average energy measured inindividual partitions,demonstrating goodintercalibration between them.
∼0.4% in each Cs-scan, which is compatible with the pre-cision of this calibration system. Since the Cs system usesa different readout path than what is used for the physicssignal induced by particles (digital readout), other calibra-tion uncertainties also have to be considered. The chargeinjection system reports negligible non-uniformity after thechannel-to-channel corrections. The integrators contributeat the level of 0.05%, which is negligible. Altogether, thenon-uniformities are given mostly by the Cs system. The Csscans of the whole Tile Calorimeter revealed the same levelof uniformity among individual optical elements in a cell aswas measured during the optics instrumentation period.
In the testbeam, a difference in the response to the Cssource and to particles was observed, increasing for lay-ers at larger radius [10]. This is due to the increasing sizeof the scintillator tiles for the external layers, and the re-sulting few percent layer miscalibration is accounted for byapplying radial depth weights in the energy scale calibra-tion. The details of this procedure are described in Ref. [18].Figure 21 (left) shows the dE/dx for muons crossing thecalorimeter parallel to the beam axis along its whole lengthfrom scraping events8 in 2008. The dE/dx response for themuons from single beam events was estimated as the peakof the fit to the convolution of a Landau function with aGaussian (most probable value, referred throughout the pa-per as MOP). Within a large statistical uncertainty, the re-sponse vs radial layer is flat. Given the fact that if the radialdepth weights had not been applied the ratio of responsesbetween layers A and D would be 1.088, this observationgives confidence in their use. Figure 21 (right) shows themean response of the four TileCal partitions to muons. Dataare from 2008 single beam runs. The precision is limited bythe systematic uncertainty of ∼4%, while the statistical un-certainty is ∼2%.
8Events produced by the proton beam hitting the edge of the collima-tors located at about 140 m upstream ATLAS.
4.5 Uncertainty on the propagation of the EM scalefrom testbeam
The EM scale of TileCal in ATLAS is set by adjusting thePMT HV to reproduce the calorimeter response to the Csradioactive source to the level it had during the tests withelectron beams, where the EM scale was determined andmeasured.9 After correcting for the expected decrease in theCs source intensity, the HV levels currently set in ATLASare expected to reproduce those used at the testbeam. Anydifference in the detector parameters from that observed atthe testbeam, if not fully understood or disproved and if itaffects the EM scale setting, should be considered as the sys-tematic uncertainty on the EM scale determination.
The following sources of systematic uncertainties on theEM scale, as discussed in the previous sections, are onlyrelated to the transfer of the EM calibration factor from thetestbeam to ATLAS because they originate from differencesbetween the two setups:
– 0.1% from the calibration of the digital readout (HG, LG)by CIS.
– 0.2% from the calibration of the Cs readout gains.– 0.5% from the non-reproducibility of the calorimeter re-
sponse after the magnetic field is turned off, as reportedby Cs measurements in 2008 (see Sect. 4.3.2).
– 0.3% from the uncertainty to the radial depth weights,briefly mentioned in Sect. 4.4.
The first two uncertainties were evaluated by comparing cal-ibration results on a fixed sample of channels which werecalibrated during the testbeam and then re-calibrated re-cently in ATLAS. The two latter are related to observationswith limited understanding of the underlying phenomena.
9The modules that were calibrated with the beams were carefully cho-sen to give a representative sample of the full TileCal module popu-lation. Thus no significant uncertainty on the EM scale is expected toresult from data obtained with the electron beams.
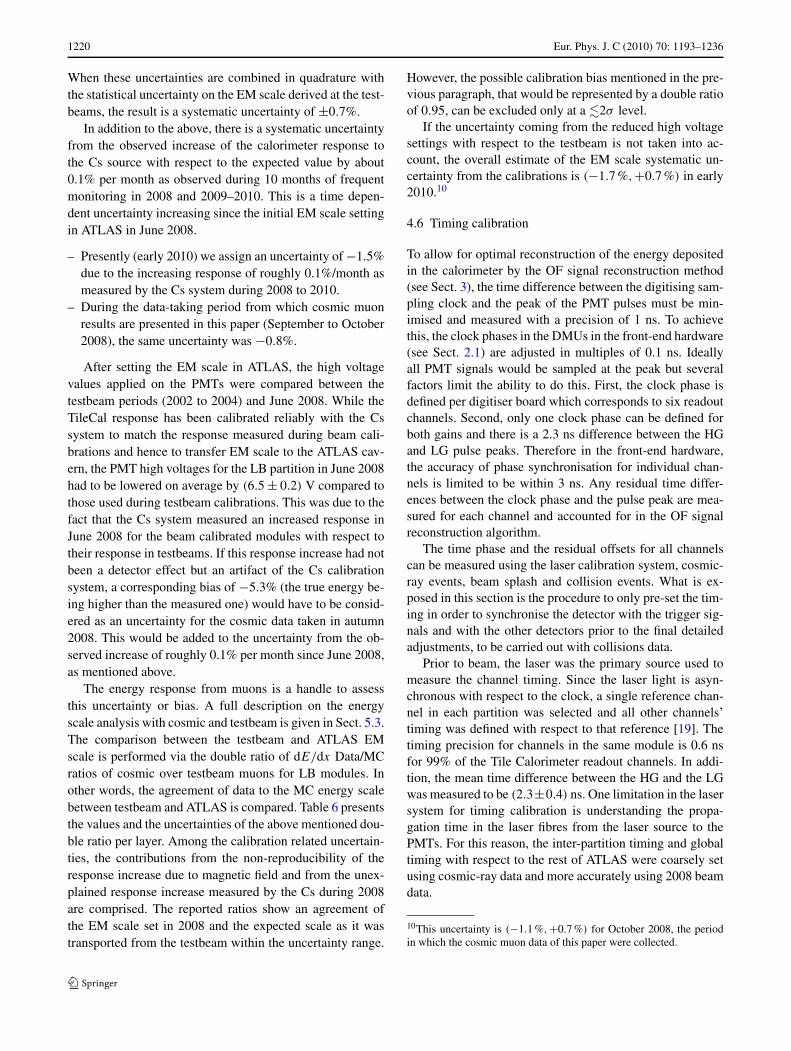
1220 Eur. Phys. J. C (2010) 70: 1193–1236
When these uncertainties are combined in quadrature withthe statistical uncertainty on the EM scale derived at the test-beams, the result is a systematic uncertainty of ±0.7%.
In addition to the above, there is a systematic uncertaintyfrom the observed increase of the calorimeter response tothe Cs source with respect to the expected value by about0.1% per month as observed during 10 months of frequentmonitoring in 2008 and 2009–2010. This is a time depen-dent uncertainty increasing since the initial EM scale settingin ATLAS in June 2008.
– Presently (early 2010) we assign an uncertainty of −1.5%due to the increasing response of roughly 0.1%/month asmeasured by the Cs system during 2008 to 2010.
– During the data-taking period from which cosmic muonresults are presented in this paper (September to October2008), the same uncertainty was −0.8%.
After setting the EM scale in ATLAS, the high voltagevalues applied on the PMTs were compared between thetestbeam periods (2002 to 2004) and June 2008. While theTileCal response has been calibrated reliably with the Cssystem to match the response measured during beam cali-brations and hence to transfer EM scale to the ATLAS cav-ern, the PMT high voltages for the LB partition in June 2008had to be lowered on average by (6.5 ± 0.2) V compared tothose used during testbeam calibrations. This was due to thefact that the Cs system measured an increased response inJune 2008 for the beam calibrated modules with respect totheir response in testbeams. If this response increase had notbeen a detector effect but an artifact of the Cs calibrationsystem, a corresponding bias of −5.3% (the true energy be-ing higher than the measured one) would have to be consid-ered as an uncertainty for the cosmic data taken in autumn2008. This would be added to the uncertainty from the ob-served increase of roughly 0.1% per month since June 2008,as mentioned above.
The energy response from muons is a handle to assessthis uncertainty or bias. A full description on the energyscale analysis with cosmic and testbeam is given in Sect. 5.3.The comparison between the testbeam and ATLAS EMscale is performed via the double ratio of dE/dx Data/MCratios of cosmic over testbeam muons for LB modules. Inother words, the agreement of data to the MC energy scalebetween testbeam and ATLAS is compared. Table 6 presentsthe values and the uncertainties of the above mentioned dou-ble ratio per layer. Among the calibration related uncertain-ties, the contributions from the non-reproducibility of theresponse increase due to magnetic field and from the unex-plained response increase measured by the Cs during 2008are comprised. The reported ratios show an agreement ofthe EM scale set in 2008 and the expected scale as it wastransported from the testbeam within the uncertainty range.
However, the possible calibration bias mentioned in the pre-vious paragraph, that would be represented by a double ratioof 0.95, can be excluded only at a �2σ level.
If the uncertainty coming from the reduced high voltagesettings with respect to the testbeam is not taken into ac-count, the overall estimate of the EM scale systematic un-certainty from the calibrations is (−1.7 %,+0.7 %) in early2010.10
4.6 Timing calibration
To allow for optimal reconstruction of the energy depositedin the calorimeter by the OF signal reconstruction method(see Sect. 3), the time difference between the digitising sam-pling clock and the peak of the PMT pulses must be min-imised and measured with a precision of 1 ns. To achievethis, the clock phases in the DMUs in the front-end hardware(see Sect. 2.1) are adjusted in multiples of 0.1 ns. Ideallyall PMT signals would be sampled at the peak but severalfactors limit the ability to do this. First, the clock phase isdefined per digitiser board which corresponds to six readoutchannels. Second, only one clock phase can be defined forboth gains and there is a 2.3 ns difference between the HGand LG pulse peaks. Therefore in the front-end hardware,the accuracy of phase synchronisation for individual chan-nels is limited to be within 3 ns. Any residual time differ-ences between the clock phase and the pulse peak are mea-sured for each channel and accounted for in the OF signalreconstruction algorithm.
The time phase and the residual offsets for all channelscan be measured using the laser calibration system, cosmic-ray events, beam splash and collision events. What is ex-posed in this section is the procedure to only pre-set the tim-ing in order to synchronise the detector with the trigger sig-nals and with the other detectors prior to the final detailedadjustments, to be carried out with collisions data.
Prior to beam, the laser was the primary source used tomeasure the channel timing. Since the laser light is asyn-chronous with respect to the clock, a single reference chan-nel in each partition was selected and all other channels’timing was defined with respect to that reference [19]. Thetiming precision for channels in the same module is 0.6 nsfor 99% of the Tile Calorimeter readout channels. In addi-tion, the mean time difference between the HG and the LGwas measured to be (2.3±0.4) ns. One limitation in the lasersystem for timing calibration is understanding the propa-gation time in the laser fibres from the laser source to thePMTs. For this reason, the inter-partition timing and globaltiming with respect to the rest of ATLAS were coarsely setusing cosmic-ray data and more accurately using 2008 beamdata.
10This uncertainty is (−1.1 %,+0.7 %) for October 2008, the periodin which the cosmic muon data of this paper were collected.
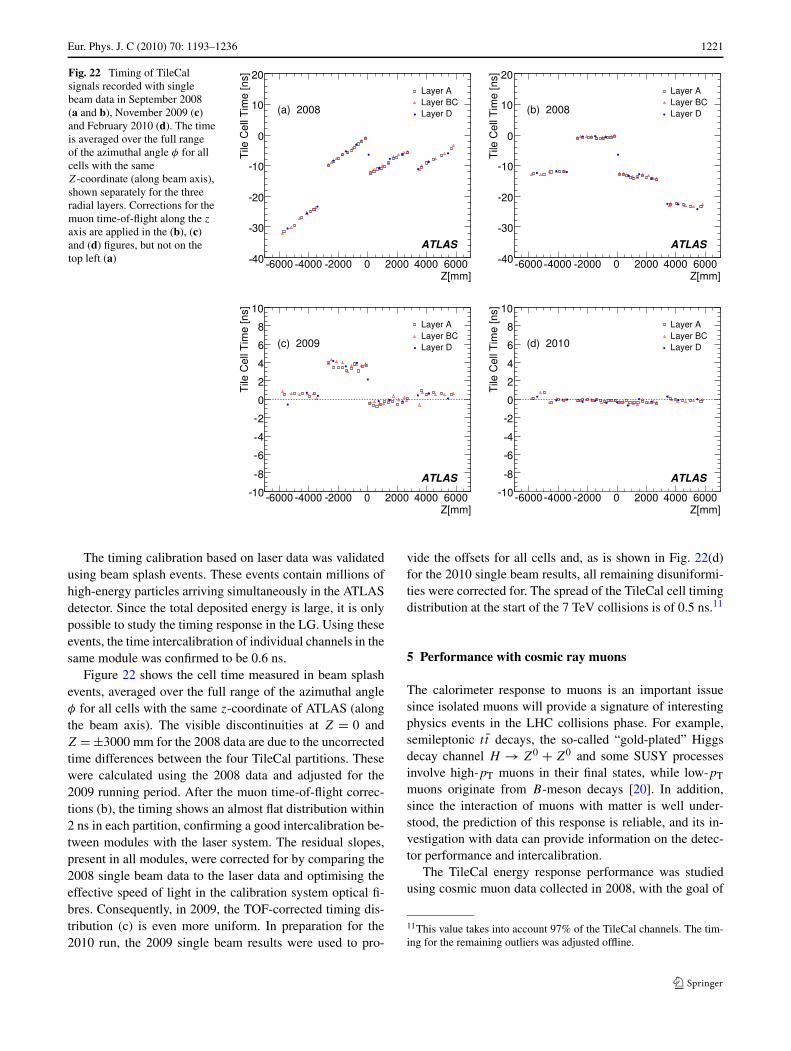
Eur. Phys. J. C (2010) 70: 1193–1236 1221
Fig. 22 Timing of TileCalsignals recorded with singlebeam data in September 2008(a and b), November 2009 (c)and February 2010 (d). The timeis averaged over the full rangeof the azimuthal angle φ for allcells with the sameZ-coordinate (along beam axis),shown separately for the threeradial layers. Corrections for themuon time-of-flight along the z
axis are applied in the (b), (c)and (d) figures, but not on thetop left (a)
The timing calibration based on laser data was validatedusing beam splash events. These events contain millions ofhigh-energy particles arriving simultaneously in the ATLASdetector. Since the total deposited energy is large, it is onlypossible to study the timing response in the LG. Using theseevents, the time intercalibration of individual channels in thesame module was confirmed to be 0.6 ns.
Figure 22 shows the cell time measured in beam splashevents, averaged over the full range of the azimuthal angleφ for all cells with the same z-coordinate of ATLAS (alongthe beam axis). The visible discontinuities at Z = 0 andZ = ±3000 mm for the 2008 data are due to the uncorrectedtime differences between the four TileCal partitions. Thesewere calculated using the 2008 data and adjusted for the2009 running period. After the muon time-of-flight correc-tions (b), the timing shows an almost flat distribution within2 ns in each partition, confirming a good intercalibration be-tween modules with the laser system. The residual slopes,present in all modules, were corrected for by comparing the2008 single beam data to the laser data and optimising theeffective speed of light in the calibration system optical fi-bres. Consequently, in 2009, the TOF-corrected timing dis-tribution (c) is even more uniform. In preparation for the2010 run, the 2009 single beam results were used to pro-
vide the offsets for all cells and, as is shown in Fig. 22(d)for the 2010 single beam results, all remaining disuniformi-ties were corrected for. The spread of the TileCal cell timingdistribution at the start of the 7 TeV collisions is of 0.5 ns.11
5 Performance with cosmic ray muons
The calorimeter response to muons is an important issuesince isolated muons will provide a signature of interestingphysics events in the LHC collisions phase. For example,semileptonic t t decays, the so-called “gold-plated” Higgsdecay channel H → Z0 + Z0 and some SUSY processesinvolve high-pT muons in their final states, while low-pT
muons originate from B-meson decays [20]. In addition,since the interaction of muons with matter is well under-stood, the prediction of this response is reliable, and its in-vestigation with data can provide information on the detec-tor performance and intercalibration.
The TileCal energy response performance was studiedusing cosmic muon data collected in 2008, with the goal of
11This value takes into account 97% of the TileCal channels. The tim-ing for the remaining outliers was adjusted offline.
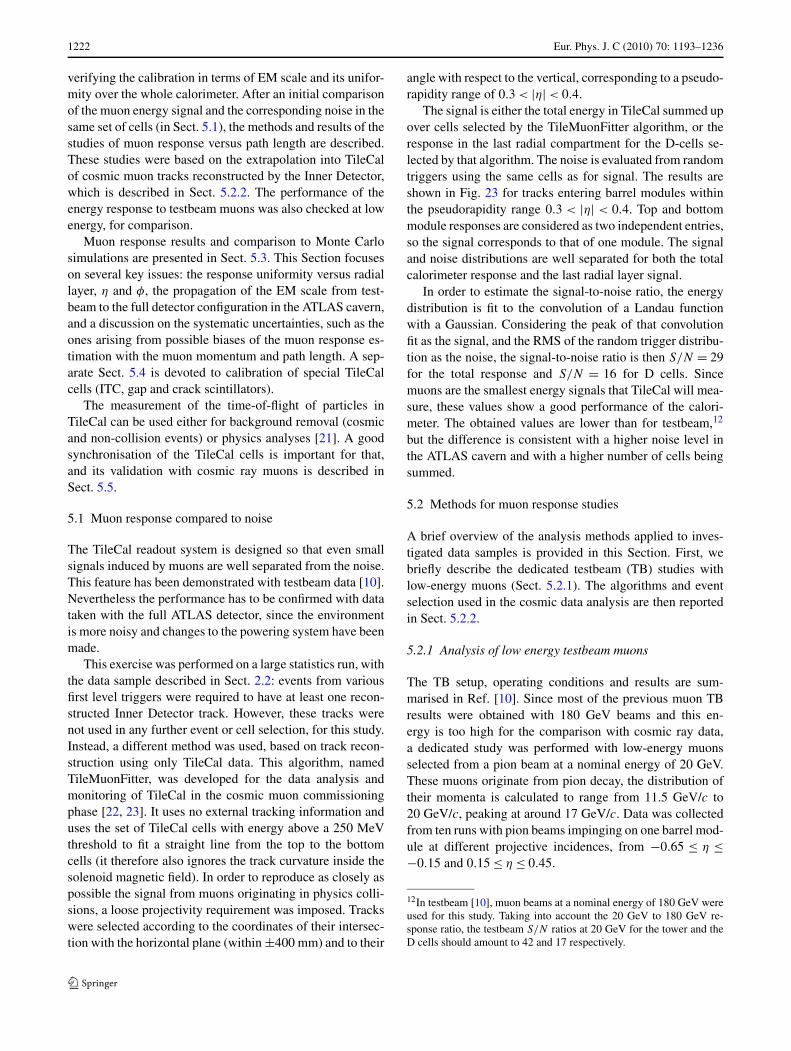
1222 Eur. Phys. J. C (2010) 70: 1193–1236
verifying the calibration in terms of EM scale and its unifor-mity over the whole calorimeter. After an initial comparisonof the muon energy signal and the corresponding noise in thesame set of cells (in Sect. 5.1), the methods and results of thestudies of muon response versus path length are described.These studies were based on the extrapolation into TileCalof cosmic muon tracks reconstructed by the Inner Detector,which is described in Sect. 5.2.2. The performance of theenergy response to testbeam muons was also checked at lowenergy, for comparison.
Muon response results and comparison to Monte Carlosimulations are presented in Sect. 5.3. This Section focuseson several key issues: the response uniformity versus radiallayer, η and φ, the propagation of the EM scale from test-beam to the full detector configuration in the ATLAS cavern,and a discussion on the systematic uncertainties, such as theones arising from possible biases of the muon response es-timation with the muon momentum and path length. A sep-arate Sect. 5.4 is devoted to calibration of special TileCalcells (ITC, gap and crack scintillators).
The measurement of the time-of-flight of particles inTileCal can be used either for background removal (cosmicand non-collision events) or physics analyses [21]. A goodsynchronisation of the TileCal cells is important for that,and its validation with cosmic ray muons is described inSect. 5.5.
5.1 Muon response compared to noise
The TileCal readout system is designed so that even smallsignals induced by muons are well separated from the noise.This feature has been demonstrated with testbeam data [10].Nevertheless the performance has to be confirmed with datataken with the full ATLAS detector, since the environmentis more noisy and changes to the powering system have beenmade.
This exercise was performed on a large statistics run, withthe data sample described in Sect. 2.2: events from variousfirst level triggers were required to have at least one recon-structed Inner Detector track. However, these tracks werenot used in any further event or cell selection, for this study.Instead, a different method was used, based on track recon-struction using only TileCal data. This algorithm, namedTileMuonFitter, was developed for the data analysis andmonitoring of TileCal in the cosmic muon commissioningphase [22, 23]. It uses no external tracking information anduses the set of TileCal cells with energy above a 250 MeVthreshold to fit a straight line from the top to the bottomcells (it therefore also ignores the track curvature inside thesolenoid magnetic field). In order to reproduce as closely aspossible the signal from muons originating in physics colli-sions, a loose projectivity requirement was imposed. Trackswere selected according to the coordinates of their intersec-tion with the horizontal plane (within ±400 mm) and to their
angle with respect to the vertical, corresponding to a pseudo-rapidity range of 0.3 < |η| < 0.4.
The signal is either the total energy in TileCal summed upover cells selected by the TileMuonFitter algorithm, or theresponse in the last radial compartment for the D-cells se-lected by that algorithm. The noise is evaluated from randomtriggers using the same cells as for signal. The results areshown in Fig. 23 for tracks entering barrel modules withinthe pseudorapidity range 0.3 < |η| < 0.4. Top and bottommodule responses are considered as two independent entries,so the signal corresponds to that of one module. The signaland noise distributions are well separated for both the totalcalorimeter response and the last radial layer signal.
In order to estimate the signal-to-noise ratio, the energydistribution is fit to the convolution of a Landau functionwith a Gaussian. Considering the peak of that convolutionfit as the signal, and the RMS of the random trigger distribu-tion as the noise, the signal-to-noise ratio is then S/N = 29for the total response and S/N = 16 for D cells. Sincemuons are the smallest energy signals that TileCal will mea-sure, these values show a good performance of the calori-meter. The obtained values are lower than for testbeam,12
but the difference is consistent with a higher noise level inthe ATLAS cavern and with a higher number of cells beingsummed.
5.2 Methods for muon response studies
A brief overview of the analysis methods applied to inves-tigated data samples is provided in this Section. First, webriefly describe the dedicated testbeam (TB) studies withlow-energy muons (Sect. 5.2.1). The algorithms and eventselection used in the cosmic data analysis are then reportedin Sect. 5.2.2.
5.2.1 Analysis of low energy testbeam muons
The TB setup, operating conditions and results are sum-marised in Ref. [10]. Since most of the previous muon TBresults were obtained with 180 GeV beams and this en-ergy is too high for the comparison with cosmic ray data,a dedicated study was performed with low-energy muonsselected from a pion beam at a nominal energy of 20 GeV.These muons originate from pion decay, the distribution oftheir momenta is calculated to range from 11.5 GeV/c to20 GeV/c, peaking at around 17 GeV/c. Data was collectedfrom ten runs with pion beams impinging on one barrel mod-ule at different projective incidences, from −0.65 ≤ η ≤−0.15 and 0.15 ≤ η ≤ 0.45.
12In testbeam [10], muon beams at a nominal energy of 180 GeV wereused for this study. Taking into account the 20 GeV to 180 GeV re-sponse ratio, the testbeam S/N ratios at 20 GeV for the tower and theD cells should amount to 42 and 17 respectively.
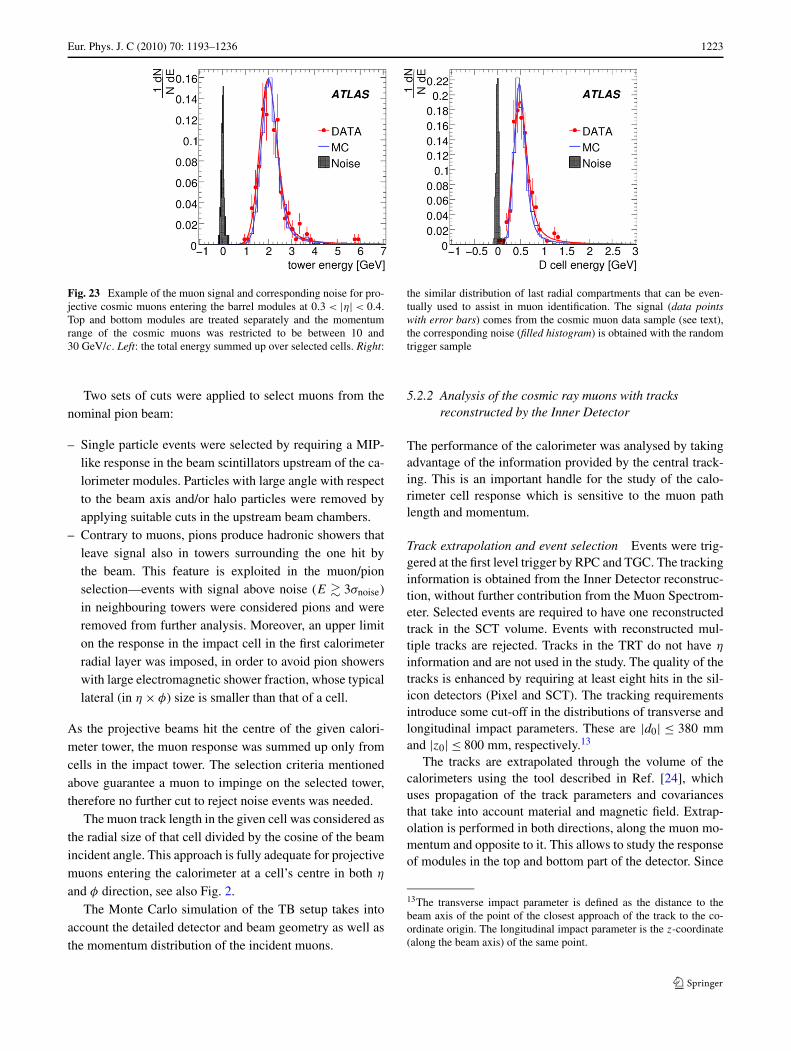
Eur. Phys. J. C (2010) 70: 1193–1236 1223
Fig. 23 Example of the muon signal and corresponding noise for pro-jective cosmic muons entering the barrel modules at 0.3 < |η| < 0.4.Top and bottom modules are treated separately and the momentumrange of the cosmic muons was restricted to be between 10 and30 GeV/c. Left: the total energy summed up over selected cells. Right:
the similar distribution of last radial compartments that can be even-tually used to assist in muon identification. The signal (data pointswith error bars) comes from the cosmic muon data sample (see text),the corresponding noise (filled histogram) is obtained with the randomtrigger sample
Two sets of cuts were applied to select muons from thenominal pion beam:
– Single particle events were selected by requiring a MIP-like response in the beam scintillators upstream of the ca-lorimeter modules. Particles with large angle with respectto the beam axis and/or halo particles were removed byapplying suitable cuts in the upstream beam chambers.
– Contrary to muons, pions produce hadronic showers thatleave signal also in towers surrounding the one hit bythe beam. This feature is exploited in the muon/pionselection—events with signal above noise (E � 3σnoise)in neighbouring towers were considered pions and wereremoved from further analysis. Moreover, an upper limiton the response in the impact cell in the first calorimeterradial layer was imposed, in order to avoid pion showerswith large electromagnetic shower fraction, whose typicallateral (in η × φ) size is smaller than that of a cell.
As the projective beams hit the centre of the given calori-meter tower, the muon response was summed up only fromcells in the impact tower. The selection criteria mentionedabove guarantee a muon to impinge on the selected tower,therefore no further cut to reject noise events was needed.
The muon track length in the given cell was considered asthe radial size of that cell divided by the cosine of the beamincident angle. This approach is fully adequate for projectivemuons entering the calorimeter at a cell’s centre in both η
and φ direction, see also Fig. 2.The Monte Carlo simulation of the TB setup takes into
account the detailed detector and beam geometry as well asthe momentum distribution of the incident muons.
5.2.2 Analysis of the cosmic ray muons with tracksreconstructed by the Inner Detector
The performance of the calorimeter was analysed by takingadvantage of the information provided by the central track-ing. This is an important handle for the study of the calo-rimeter cell response which is sensitive to the muon pathlength and momentum.
Track extrapolation and event selection Events were trig-gered at the first level trigger by RPC and TGC. The trackinginformation is obtained from the Inner Detector reconstruc-tion, without further contribution from the Muon Spectrom-eter. Selected events are required to have one reconstructedtrack in the SCT volume. Events with reconstructed mul-tiple tracks are rejected. Tracks in the TRT do not have η
information and are not used in the study. The quality of thetracks is enhanced by requiring at least eight hits in the sil-icon detectors (Pixel and SCT). The tracking requirementsintroduce some cut-off in the distributions of transverse andlongitudinal impact parameters. These are |d0| ≤ 380 mmand |z0| ≤ 800 mm, respectively.13
The tracks are extrapolated through the volume of thecalorimeters using the tool described in Ref. [24], whichuses propagation of the track parameters and covariancesthat take into account material and magnetic field. Extrap-olation is performed in both directions, along the muon mo-mentum and opposite to it. This allows to study the responseof modules in the top and bottom part of the detector. Since
13The transverse impact parameter is defined as the distance to thebeam axis of the point of the closest approach of the track to the co-ordinate origin. The longitudinal impact parameter is the z-coordinate(along the beam axis) of the same point.
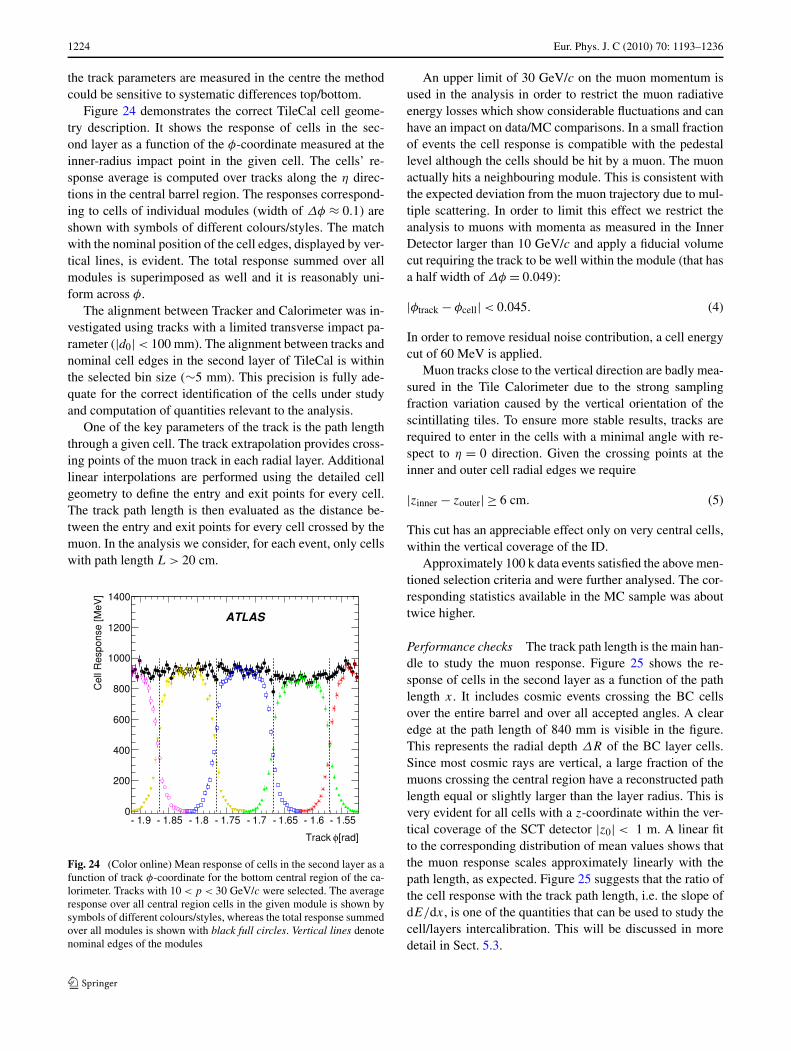
1224 Eur. Phys. J. C (2010) 70: 1193–1236
the track parameters are measured in the centre the methodcould be sensitive to systematic differences top/bottom.
Figure 24 demonstrates the correct TileCal cell geome-try description. It shows the response of cells in the sec-ond layer as a function of the φ-coordinate measured at theinner-radius impact point in the given cell. The cells’ re-sponse average is computed over tracks along the η direc-tions in the central barrel region. The responses correspond-ing to cells of individual modules (width of Δφ ≈ 0.1) areshown with symbols of different colours/styles. The matchwith the nominal position of the cell edges, displayed by ver-tical lines, is evident. The total response summed over allmodules is superimposed as well and it is reasonably uni-form across φ.
The alignment between Tracker and Calorimeter was in-vestigated using tracks with a limited transverse impact pa-rameter (|d0| < 100 mm). The alignment between tracks andnominal cell edges in the second layer of TileCal is withinthe selected bin size (∼5 mm). This precision is fully ade-quate for the correct identification of the cells under studyand computation of quantities relevant to the analysis.
One of the key parameters of the track is the path lengththrough a given cell. The track extrapolation provides cross-ing points of the muon track in each radial layer. Additionallinear interpolations are performed using the detailed cellgeometry to define the entry and exit points for every cell.The track path length is then evaluated as the distance be-tween the entry and exit points for every cell crossed by themuon. In the analysis we consider, for each event, only cellswith path length L > 20 cm.
Fig. 24 (Color online) Mean response of cells in the second layer as afunction of track φ-coordinate for the bottom central region of the ca-lorimeter. Tracks with 10 < p < 30 GeV/c were selected. The averageresponse over all central region cells in the given module is shown bysymbols of different colours/styles, whereas the total response summedover all modules is shown with black full circles. Vertical lines denotenominal edges of the modules
An upper limit of 30 GeV/c on the muon momentum isused in the analysis in order to restrict the muon radiativeenergy losses which show considerable fluctuations and canhave an impact on data/MC comparisons. In a small fractionof events the cell response is compatible with the pedestallevel although the cells should be hit by a muon. The muonactually hits a neighbouring module. This is consistent withthe expected deviation from the muon trajectory due to mul-tiple scattering. In order to limit this effect we restrict theanalysis to muons with momenta as measured in the InnerDetector larger than 10 GeV/c and apply a fiducial volumecut requiring the track to be well within the module (that hasa half width of Δφ = 0.049):
|φtrack − φcell| < 0.045. (4)
In order to remove residual noise contribution, a cell energycut of 60 MeV is applied.
Muon tracks close to the vertical direction are badly mea-sured in the Tile Calorimeter due to the strong samplingfraction variation caused by the vertical orientation of thescintillating tiles. To ensure more stable results, tracks arerequired to enter in the cells with a minimal angle with re-spect to η = 0 direction. Given the crossing points at theinner and outer cell radial edges we require
|zinner − zouter| ≥ 6 cm. (5)
This cut has an appreciable effect only on very central cells,within the vertical coverage of the ID.
Approximately 100 k data events satisfied the above men-tioned selection criteria and were further analysed. The cor-responding statistics available in the MC sample was abouttwice higher.
Performance checks The track path length is the main han-dle to study the muon response. Figure 25 shows the re-sponse of cells in the second layer as a function of the pathlength x. It includes cosmic events crossing the BC cellsover the entire barrel and over all accepted angles. A clearedge at the path length of 840 mm is visible in the figure.This represents the radial depth ΔR of the BC layer cells.Since most cosmic rays are vertical, a large fraction of themuons crossing the central region have a reconstructed pathlength equal or slightly larger than the layer radius. This isvery evident for all cells with a z-coordinate within the ver-tical coverage of the SCT detector |z0| < 1 m. A linear fitto the corresponding distribution of mean values shows thatthe muon response scales approximately linearly with thepath length, as expected. Figure 25 suggests that the ratio ofthe cell response with the track path length, i.e. the slope ofdE/dx, is one of the quantities that can be used to study thecell/layers intercalibration. This will be discussed in moredetail in Sect. 5.3.
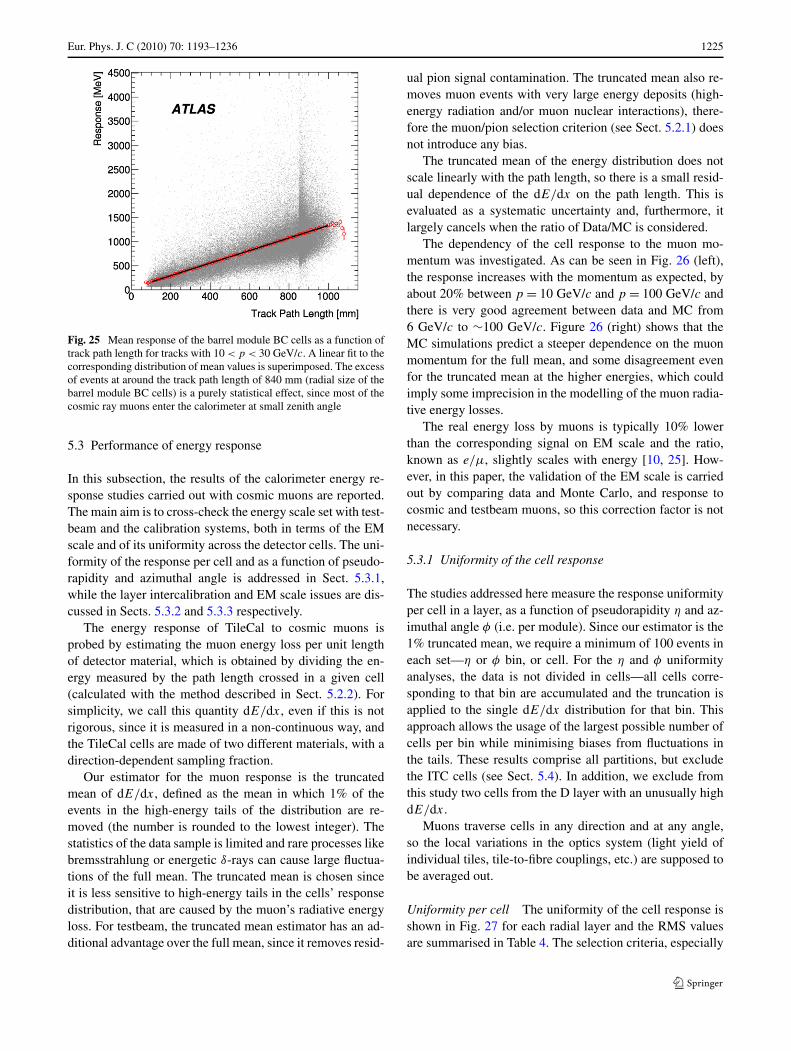
Eur. Phys. J. C (2010) 70: 1193–1236 1225
Fig. 25 Mean response of the barrel module BC cells as a function oftrack path length for tracks with 10 < p < 30 GeV/c. A linear fit to thecorresponding distribution of mean values is superimposed. The excessof events at around the track path length of 840 mm (radial size of thebarrel module BC cells) is a purely statistical effect, since most of thecosmic ray muons enter the calorimeter at small zenith angle
5.3 Performance of energy response
In this subsection, the results of the calorimeter energy re-sponse studies carried out with cosmic muons are reported.The main aim is to cross-check the energy scale set with test-beam and the calibration systems, both in terms of the EMscale and of its uniformity across the detector cells. The uni-formity of the response per cell and as a function of pseudo-rapidity and azimuthal angle is addressed in Sect. 5.3.1,while the layer intercalibration and EM scale issues are dis-cussed in Sects. 5.3.2 and 5.3.3 respectively.
The energy response of TileCal to cosmic muons isprobed by estimating the muon energy loss per unit lengthof detector material, which is obtained by dividing the en-ergy measured by the path length crossed in a given cell(calculated with the method described in Sect. 5.2.2). Forsimplicity, we call this quantity dE/dx, even if this is notrigorous, since it is measured in a non-continuous way, andthe TileCal cells are made of two different materials, with adirection-dependent sampling fraction.
Our estimator for the muon response is the truncatedmean of dE/dx, defined as the mean in which 1% of theevents in the high-energy tails of the distribution are re-moved (the number is rounded to the lowest integer). Thestatistics of the data sample is limited and rare processes likebremsstrahlung or energetic δ-rays can cause large fluctua-tions of the full mean. The truncated mean is chosen sinceit is less sensitive to high-energy tails in the cells’ responsedistribution, that are caused by the muon’s radiative energyloss. For testbeam, the truncated mean estimator has an ad-ditional advantage over the full mean, since it removes resid-
ual pion signal contamination. The truncated mean also re-moves muon events with very large energy deposits (high-energy radiation and/or muon nuclear interactions), there-fore the muon/pion selection criterion (see Sect. 5.2.1) doesnot introduce any bias.
The truncated mean of the energy distribution does notscale linearly with the path length, so there is a small resid-ual dependence of the dE/dx on the path length. This isevaluated as a systematic uncertainty and, furthermore, itlargely cancels when the ratio of Data/MC is considered.
The dependency of the cell response to the muon mo-mentum was investigated. As can be seen in Fig. 26 (left),the response increases with the momentum as expected, byabout 20% between p = 10 GeV/c and p = 100 GeV/c andthere is very good agreement between data and MC from6 GeV/c to ∼100 GeV/c. Figure 26 (right) shows that theMC simulations predict a steeper dependence on the muonmomentum for the full mean, and some disagreement evenfor the truncated mean at the higher energies, which couldimply some imprecision in the modelling of the muon radia-tive energy losses.
The real energy loss by muons is typically 10% lowerthan the corresponding signal on EM scale and the ratio,known as e/μ, slightly scales with energy [10, 25]. How-ever, in this paper, the validation of the EM scale is carriedout by comparing data and Monte Carlo, and response tocosmic and testbeam muons, so this correction factor is notnecessary.
5.3.1 Uniformity of the cell response
The studies addressed here measure the response uniformityper cell in a layer, as a function of pseudorapidity η and az-imuthal angle φ (i.e. per module). Since our estimator is the1% truncated mean, we require a minimum of 100 events ineach set—η or φ bin, or cell. For the η and φ uniformityanalyses, the data is not divided in cells—all cells corre-sponding to that bin are accumulated and the truncation isapplied to the single dE/dx distribution for that bin. Thisapproach allows the usage of the largest possible number ofcells per bin while minimising biases from fluctuations inthe tails. These results comprise all partitions, but excludethe ITC cells (see Sect. 5.4). In addition, we exclude fromthis study two cells from the D layer with an unusually highdE/dx.
Muons traverse cells in any direction and at any angle,so the local variations in the optics system (light yield ofindividual tiles, tile-to-fibre couplings, etc.) are supposed tobe averaged out.
Uniformity per cell The uniformity of the cell response isshown in Fig. 27 for each radial layer and the RMS valuesare summarised in Table 4. The selection criteria, especially
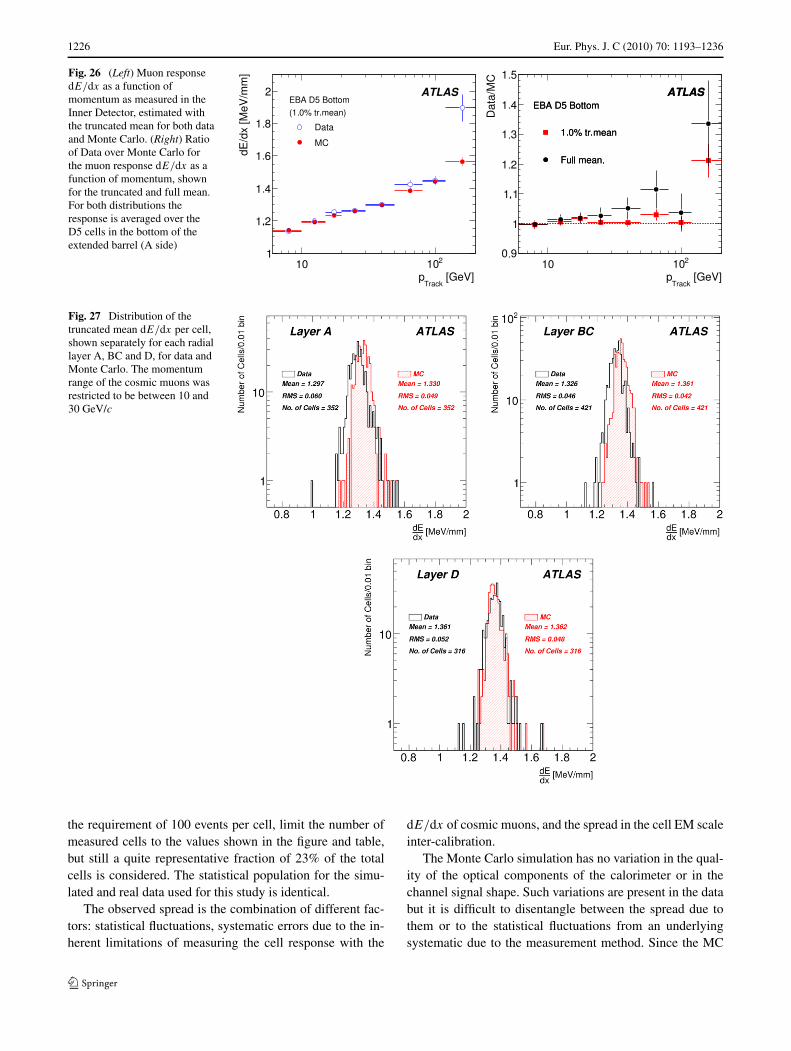
1226 Eur. Phys. J. C (2010) 70: 1193–1236
Fig. 26 (Left) Muon responsedE/dx as a function ofmomentum as measured in theInner Detector, estimated withthe truncated mean for both dataand Monte Carlo. (Right) Ratioof Data over Monte Carlo forthe muon response dE/dx as afunction of momentum, shownfor the truncated and full mean.For both distributions theresponse is averaged over theD5 cells in the bottom of theextended barrel (A side)
Fig. 27 Distribution of thetruncated mean dE/dx per cell,shown separately for each radiallayer A, BC and D, for data andMonte Carlo. The momentumrange of the cosmic muons wasrestricted to be between 10 and30 GeV/c
the requirement of 100 events per cell, limit the number ofmeasured cells to the values shown in the figure and table,but still a quite representative fraction of 23% of the totalcells is considered. The statistical population for the simu-lated and real data used for this study is identical.
The observed spread is the combination of different fac-tors: statistical fluctuations, systematic errors due to the in-herent limitations of measuring the cell response with the
dE/dx of cosmic muons, and the spread in the cell EM scaleinter-calibration.
The Monte Carlo simulation has no variation in the qual-ity of the optical components of the calorimeter or in thechannel signal shape. Such variations are present in the databut it is difficult to disentangle between the spread due tothem or to the statistical fluctuations from an underlyingsystematic due to the measurement method. Since the MC
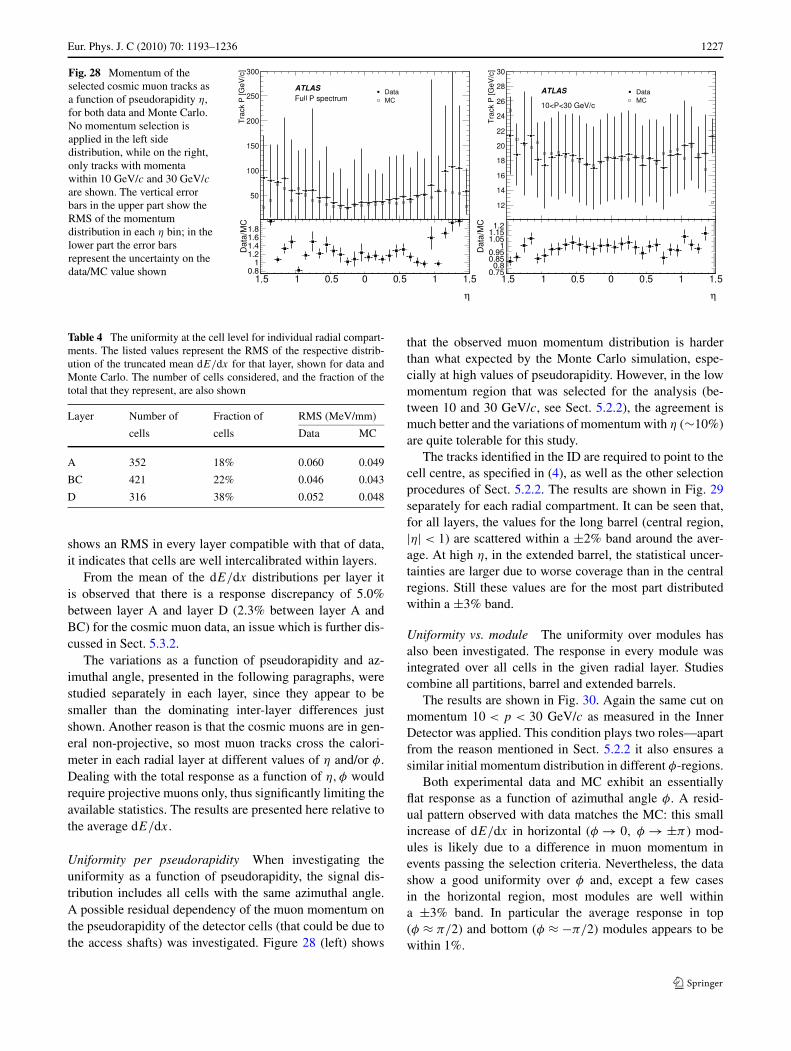
Eur. Phys. J. C (2010) 70: 1193–1236 1227
Fig. 28 Momentum of theselected cosmic muon tracks asa function of pseudorapidity η,for both data and Monte Carlo.No momentum selection isapplied in the left sidedistribution, while on the right,only tracks with momentawithin 10 GeV/c and 30 GeV/care shown. The vertical errorbars in the upper part show theRMS of the momentumdistribution in each η bin; in thelower part the error barsrepresent the uncertainty on thedata/MC value shown
Table 4 The uniformity at the cell level for individual radial compart-ments. The listed values represent the RMS of the respective distrib-ution of the truncated mean dE/dx for that layer, shown for data andMonte Carlo. The number of cells considered, and the fraction of thetotal that they represent, are also shown
Layer Number of Fraction of RMS (MeV/mm)
cells cells Data MC
A 352 18% 0.060 0.049
BC 421 22% 0.046 0.043
D 316 38% 0.052 0.048
shows an RMS in every layer compatible with that of data,it indicates that cells are well intercalibrated within layers.
From the mean of the dE/dx distributions per layer itis observed that there is a response discrepancy of 5.0%between layer A and layer D (2.3% between layer A andBC) for the cosmic muon data, an issue which is further dis-cussed in Sect. 5.3.2.
The variations as a function of pseudorapidity and az-imuthal angle, presented in the following paragraphs, werestudied separately in each layer, since they appear to besmaller than the dominating inter-layer differences justshown. Another reason is that the cosmic muons are in gen-eral non-projective, so most muon tracks cross the calori-meter in each radial layer at different values of η and/or φ.Dealing with the total response as a function of η,φ wouldrequire projective muons only, thus significantly limiting theavailable statistics. The results are presented here relative tothe average dE/dx.
Uniformity per pseudorapidity When investigating theuniformity as a function of pseudorapidity, the signal dis-tribution includes all cells with the same azimuthal angle.A possible residual dependency of the muon momentum onthe pseudorapidity of the detector cells (that could be due tothe access shafts) was investigated. Figure 28 (left) shows
that the observed muon momentum distribution is harderthan what expected by the Monte Carlo simulation, espe-cially at high values of pseudorapidity. However, in the lowmomentum region that was selected for the analysis (be-tween 10 and 30 GeV/c, see Sect. 5.2.2), the agreement ismuch better and the variations of momentum with η (∼10%)are quite tolerable for this study.
The tracks identified in the ID are required to point to thecell centre, as specified in (4), as well as the other selectionprocedures of Sect. 5.2.2. The results are shown in Fig. 29separately for each radial compartment. It can be seen that,for all layers, the values for the long barrel (central region,|η| < 1) are scattered within a ±2% band around the aver-age. At high η, in the extended barrel, the statistical uncer-tainties are larger due to worse coverage than in the centralregions. Still these values are for the most part distributedwithin a ±3% band.
Uniformity vs. module The uniformity over modules hasalso been investigated. The response in every module wasintegrated over all cells in the given radial layer. Studiescombine all partitions, barrel and extended barrels.
The results are shown in Fig. 30. Again the same cut onmomentum 10 < p < 30 GeV/c as measured in the InnerDetector was applied. This condition plays two roles—apartfrom the reason mentioned in Sect. 5.2.2 it also ensures asimilar initial momentum distribution in different φ-regions.
Both experimental data and MC exhibit an essentiallyflat response as a function of azimuthal angle φ. A resid-ual pattern observed with data matches the MC: this smallincrease of dE/dx in horizontal (φ → 0, φ → ±π ) mod-ules is likely due to a difference in muon momentum inevents passing the selection criteria. Nevertheless, the datashow a good uniformity over φ and, except a few casesin the horizontal region, most modules are well withina ±3% band. In particular the average response in top(φ ≈ π/2) and bottom (φ ≈ −π/2) modules appears to bewithin 1%.
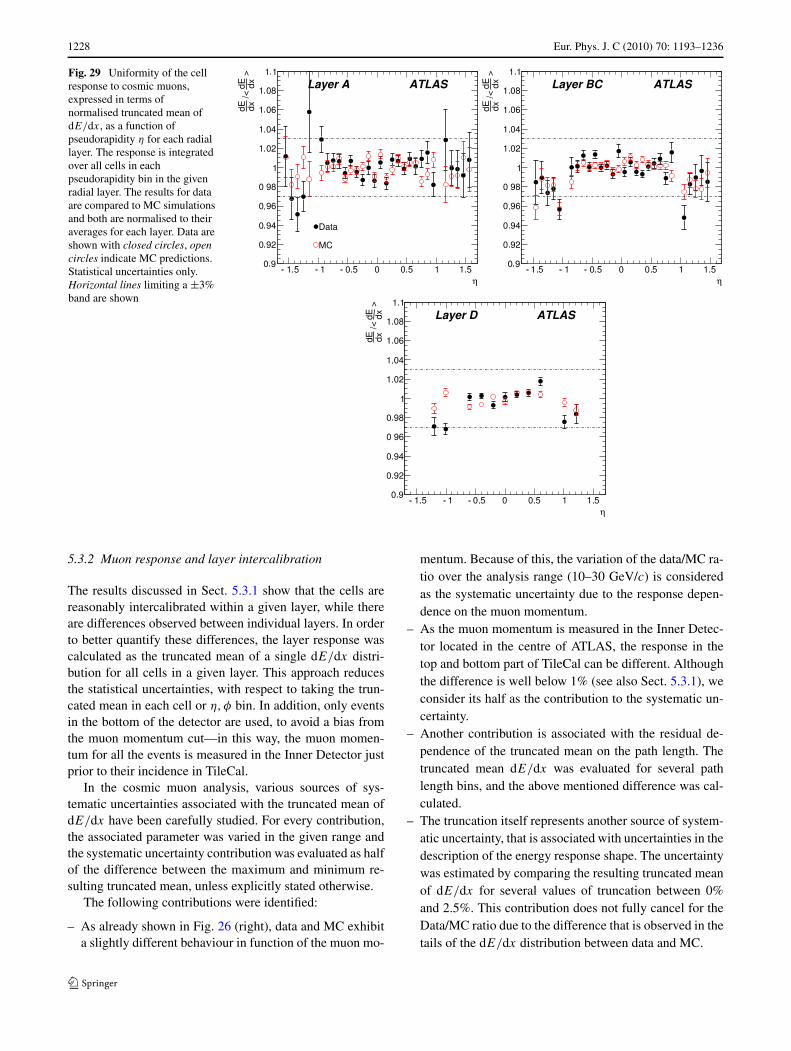
1228 Eur. Phys. J. C (2010) 70: 1193–1236
Fig. 29 Uniformity of the cellresponse to cosmic muons,expressed in terms ofnormalised truncated mean ofdE/dx, as a function ofpseudorapidity η for each radiallayer. The response is integratedover all cells in eachpseudorapidity bin in the givenradial layer. The results for dataare compared to MC simulationsand both are normalised to theiraverages for each layer. Data areshown with closed circles, opencircles indicate MC predictions.Statistical uncertainties only.Horizontal lines limiting a ±3%band are shown
5.3.2 Muon response and layer intercalibration
The results discussed in Sect. 5.3.1 show that the cells arereasonably intercalibrated within a given layer, while thereare differences observed between individual layers. In orderto better quantify these differences, the layer response wascalculated as the truncated mean of a single dE/dx distri-bution for all cells in a given layer. This approach reducesthe statistical uncertainties, with respect to taking the trun-cated mean in each cell or η,φ bin. In addition, only eventsin the bottom of the detector are used, to avoid a bias fromthe muon momentum cut—in this way, the muon momen-tum for all the events is measured in the Inner Detector justprior to their incidence in TileCal.
In the cosmic muon analysis, various sources of sys-tematic uncertainties associated with the truncated mean ofdE/dx have been carefully studied. For every contribution,the associated parameter was varied in the given range andthe systematic uncertainty contribution was evaluated as halfof the difference between the maximum and minimum re-sulting truncated mean, unless explicitly stated otherwise.
The following contributions were identified:
– As already shown in Fig. 26 (right), data and MC exhibita slightly different behaviour in function of the muon mo-
mentum. Because of this, the variation of the data/MC ra-tio over the analysis range (10–30 GeV/c) is consideredas the systematic uncertainty due to the response depen-dence on the muon momentum.
– As the muon momentum is measured in the Inner Detec-tor located in the centre of ATLAS, the response in thetop and bottom part of TileCal can be different. Althoughthe difference is well below 1% (see also Sect. 5.3.1), weconsider its half as the contribution to the systematic un-certainty.
– Another contribution is associated with the residual de-pendence of the truncated mean on the path length. Thetruncated mean dE/dx was evaluated for several pathlength bins, and the above mentioned difference was cal-culated.
– The truncation itself represents another source of system-atic uncertainty, that is associated with uncertainties in thedescription of the energy response shape. The uncertaintywas estimated by comparing the resulting truncated meanof dE/dx for several values of truncation between 0%and 2.5%. This contribution does not fully cancel for theData/MC ratio due to the difference that is observed in thetails of the dE/dx distribution between data and MC.
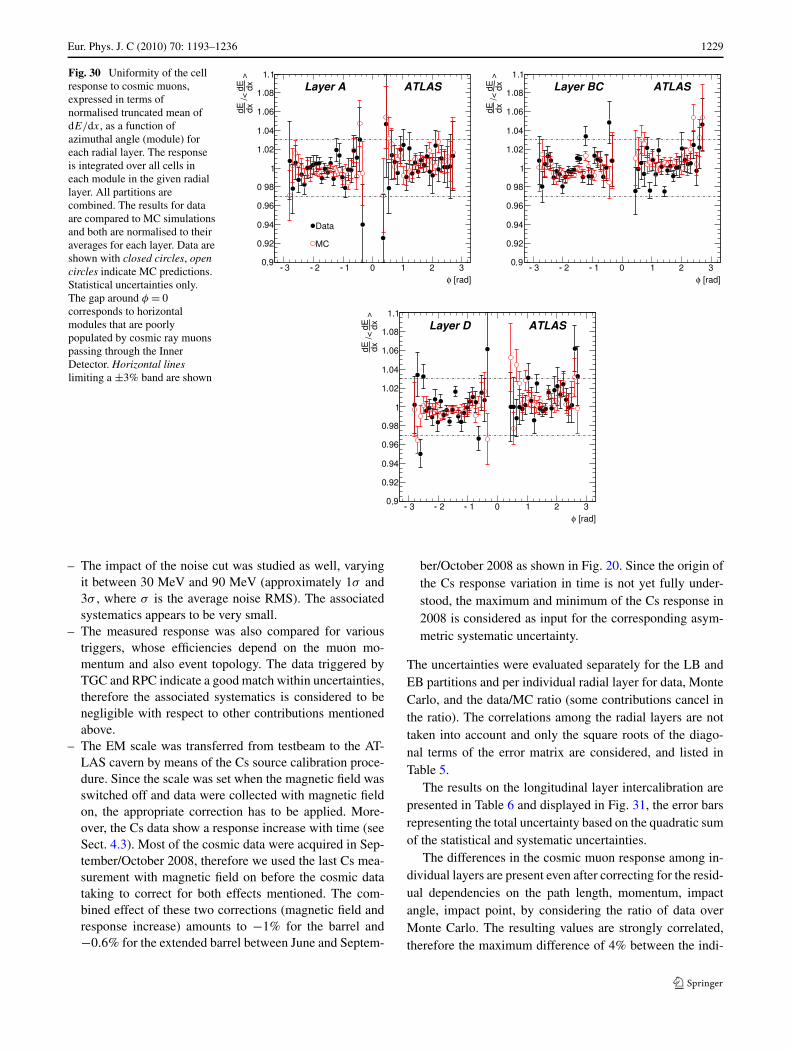
Eur. Phys. J. C (2010) 70: 1193–1236 1229
Fig. 30 Uniformity of the cellresponse to cosmic muons,expressed in terms ofnormalised truncated mean ofdE/dx, as a function ofazimuthal angle (module) foreach radial layer. The responseis integrated over all cells ineach module in the given radiallayer. All partitions arecombined. The results for dataare compared to MC simulationsand both are normalised to theiraverages for each layer. Data areshown with closed circles, opencircles indicate MC predictions.Statistical uncertainties only.The gap around φ = 0corresponds to horizontalmodules that are poorlypopulated by cosmic ray muonspassing through the InnerDetector. Horizontal lineslimiting a ±3% band are shown
– The impact of the noise cut was studied as well, varyingit between 30 MeV and 90 MeV (approximately 1σ and3σ , where σ is the average noise RMS). The associatedsystematics appears to be very small.
– The measured response was also compared for varioustriggers, whose efficiencies depend on the muon mo-mentum and also event topology. The data triggered byTGC and RPC indicate a good match within uncertainties,therefore the associated systematics is considered to benegligible with respect to other contributions mentionedabove.
– The EM scale was transferred from testbeam to the AT-LAS cavern by means of the Cs source calibration proce-dure. Since the scale was set when the magnetic field wasswitched off and data were collected with magnetic fieldon, the appropriate correction has to be applied. More-over, the Cs data show a response increase with time (seeSect. 4.3). Most of the cosmic data were acquired in Sep-tember/October 2008, therefore we used the last Cs mea-surement with magnetic field on before the cosmic datataking to correct for both effects mentioned. The com-bined effect of these two corrections (magnetic field andresponse increase) amounts to −1% for the barrel and−0.6% for the extended barrel between June and Septem-
ber/October 2008 as shown in Fig. 20. Since the origin ofthe Cs response variation in time is not yet fully under-stood, the maximum and minimum of the Cs response in2008 is considered as input for the corresponding asym-metric systematic uncertainty.
The uncertainties were evaluated separately for the LB andEB partitions and per individual radial layer for data, MonteCarlo, and the data/MC ratio (some contributions cancel inthe ratio). The correlations among the radial layers are nottaken into account and only the square roots of the diago-nal terms of the error matrix are considered, and listed inTable 5.
The results on the longitudinal layer intercalibration arepresented in Table 6 and displayed in Fig. 31, the error barsrepresenting the total uncertainty based on the quadratic sumof the statistical and systematic uncertainties.
The differences in the cosmic muon response among in-dividual layers are present even after correcting for the resid-ual dependencies on the path length, momentum, impactangle, impact point, by considering the ratio of data overMonte Carlo. The resulting values are strongly correlated,therefore the maximum difference of 4% between the indi-
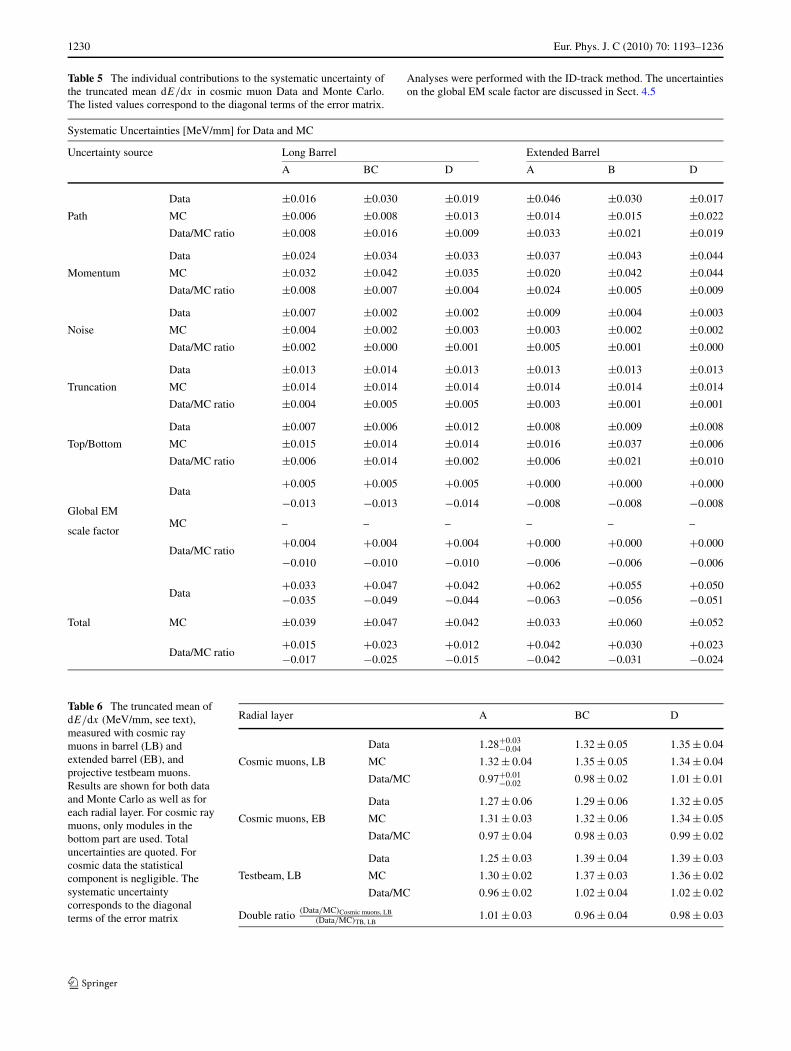
1230 Eur. Phys. J. C (2010) 70: 1193–1236
Table 5 The individual contributions to the systematic uncertainty ofthe truncated mean dE/dx in cosmic muon Data and Monte Carlo.The listed values correspond to the diagonal terms of the error matrix.
Analyses were performed with the ID-track method. The uncertaintieson the global EM scale factor are discussed in Sect. 4.5
Systematic Uncertainties [MeV/mm] for Data and MC
Uncertainty source Long Barrel Extended Barrel
A BC D A B D
Data ±0.016 ±0.030 ±0.019 ±0.046 ±0.030 ±0.017
Path MC ±0.006 ±0.008 ±0.013 ±0.014 ±0.015 ±0.022
Data/MC ratio ±0.008 ±0.016 ±0.009 ±0.033 ±0.021 ±0.019
Data ±0.024 ±0.034 ±0.033 ±0.037 ±0.043 ±0.044
Momentum MC ±0.032 ±0.042 ±0.035 ±0.020 ±0.042 ±0.044
Data/MC ratio ±0.008 ±0.007 ±0.004 ±0.024 ±0.005 ±0.009
Data ±0.007 ±0.002 ±0.002 ±0.009 ±0.004 ±0.003
Noise MC ±0.004 ±0.002 ±0.003 ±0.003 ±0.002 ±0.002
Data/MC ratio ±0.002 ±0.000 ±0.001 ±0.005 ±0.001 ±0.000
Data ±0.013 ±0.014 ±0.013 ±0.013 ±0.013 ±0.013
Truncation MC ±0.014 ±0.014 ±0.014 ±0.014 ±0.014 ±0.014
Data/MC ratio ±0.004 ±0.005 ±0.005 ±0.003 ±0.001 ±0.001
Data ±0.007 ±0.006 ±0.012 ±0.008 ±0.009 ±0.008
Top/Bottom MC ±0.015 ±0.014 ±0.014 ±0.016 ±0.037 ±0.006
Data/MC ratio ±0.006 ±0.014 ±0.002 ±0.006 ±0.021 ±0.010
Data+0.005 +0.005 +0.005 +0.000 +0.000 +0.000
Global EM−0.013 −0.013 −0.014 −0.008 −0.008 −0.008
scale factorMC – – – – – –
Data/MC ratio+0.004 +0.004 +0.004 +0.000 +0.000 +0.000
−0.010 −0.010 −0.010 −0.006 −0.006 −0.006
Data+0.033 +0.047 +0.042 +0.062 +0.055 +0.050−0.035 −0.049 −0.044 −0.063 −0.056 −0.051
Total MC ±0.039 ±0.047 ±0.042 ±0.033 ±0.060 ±0.052
Data/MC ratio+0.015 +0.023 +0.012 +0.042 +0.030 +0.023−0.017 −0.025 −0.015 −0.042 −0.031 −0.024
Table 6 The truncated mean ofdE/dx (MeV/mm, see text),measured with cosmic raymuons in barrel (LB) andextended barrel (EB), andprojective testbeam muons.Results are shown for both dataand Monte Carlo as well as foreach radial layer. For cosmic raymuons, only modules in thebottom part are used. Totaluncertainties are quoted. Forcosmic data the statisticalcomponent is negligible. Thesystematic uncertaintycorresponds to the diagonalterms of the error matrix
Radial layer A BC D
Data 1.28+0.03−0.04 1.32 ± 0.05 1.35 ± 0.04
Cosmic muons, LB MC 1.32 ± 0.04 1.35 ± 0.05 1.34 ± 0.04
Data/MC 0.97+0.01−0.02 0.98 ± 0.02 1.01 ± 0.01
Data 1.27 ± 0.06 1.29 ± 0.06 1.32 ± 0.05
Cosmic muons, EB MC 1.31 ± 0.03 1.32 ± 0.06 1.34 ± 0.05
Data/MC 0.97 ± 0.04 0.98 ± 0.03 0.99 ± 0.02
Data 1.25 ± 0.03 1.39 ± 0.04 1.39 ± 0.03
Testbeam, LB MC 1.30 ± 0.02 1.37 ± 0.03 1.36 ± 0.02
Data/MC 0.96 ± 0.02 1.02 ± 0.04 1.02 ± 0.02
Double ratio (Data/MC)Cosmic muons, LB(Data/MC)TB, LB
1.01 ± 0.03 0.96 ± 0.04 0.98 ± 0.03
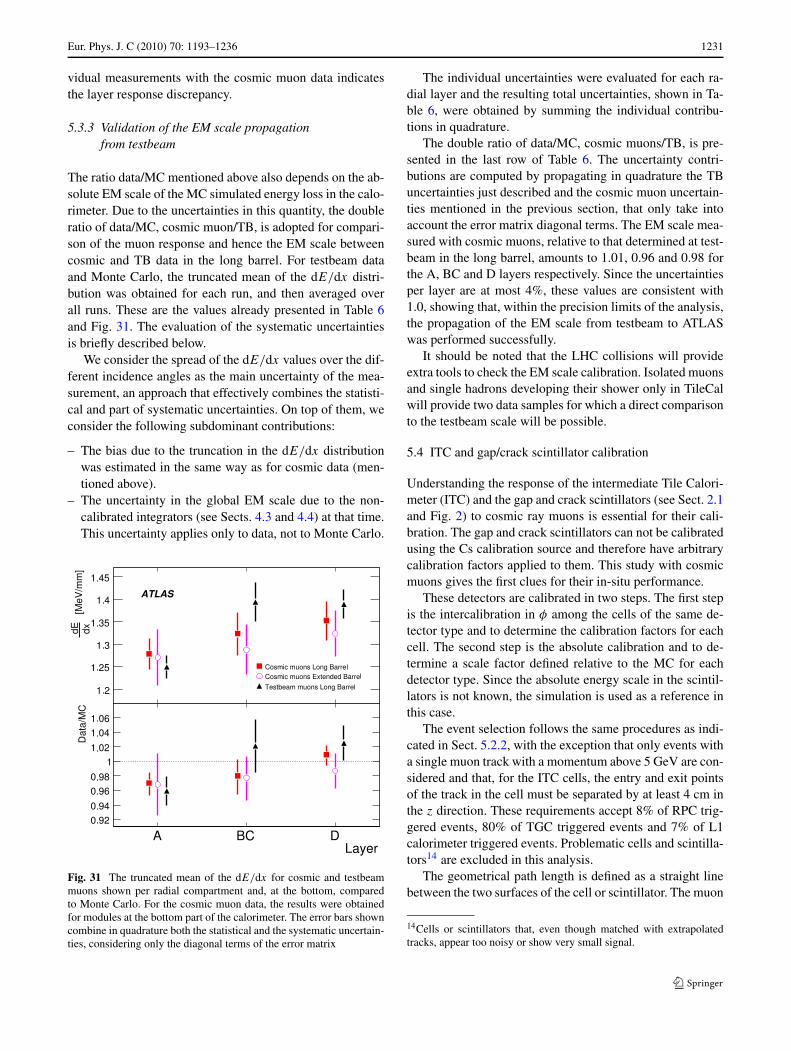
Eur. Phys. J. C (2010) 70: 1193–1236 1231
vidual measurements with the cosmic muon data indicatesthe layer response discrepancy.
5.3.3 Validation of the EM scale propagationfrom testbeam
The ratio data/MC mentioned above also depends on the ab-solute EM scale of the MC simulated energy loss in the calo-rimeter. Due to the uncertainties in this quantity, the doubleratio of data/MC, cosmic muon/TB, is adopted for compari-son of the muon response and hence the EM scale betweencosmic and TB data in the long barrel. For testbeam dataand Monte Carlo, the truncated mean of the dE/dx distri-bution was obtained for each run, and then averaged overall runs. These are the values already presented in Table 6and Fig. 31. The evaluation of the systematic uncertaintiesis briefly described below.
We consider the spread of the dE/dx values over the dif-ferent incidence angles as the main uncertainty of the mea-surement, an approach that effectively combines the statisti-cal and part of systematic uncertainties. On top of them, weconsider the following subdominant contributions:
– The bias due to the truncation in the dE/dx distributionwas estimated in the same way as for cosmic data (men-tioned above).
– The uncertainty in the global EM scale due to the non-calibrated integrators (see Sects. 4.3 and 4.4) at that time.This uncertainty applies only to data, not to Monte Carlo.
Fig. 31 The truncated mean of the dE/dx for cosmic and testbeammuons shown per radial compartment and, at the bottom, comparedto Monte Carlo. For the cosmic muon data, the results were obtainedfor modules at the bottom part of the calorimeter. The error bars showncombine in quadrature both the statistical and the systematic uncertain-ties, considering only the diagonal terms of the error matrix
The individual uncertainties were evaluated for each ra-dial layer and the resulting total uncertainties, shown in Ta-ble 6, were obtained by summing the individual contribu-tions in quadrature.
The double ratio of data/MC, cosmic muons/TB, is pre-sented in the last row of Table 6. The uncertainty contri-butions are computed by propagating in quadrature the TBuncertainties just described and the cosmic muon uncertain-ties mentioned in the previous section, that only take intoaccount the error matrix diagonal terms. The EM scale mea-sured with cosmic muons, relative to that determined at test-beam in the long barrel, amounts to 1.01, 0.96 and 0.98 forthe A, BC and D layers respectively. Since the uncertaintiesper layer are at most 4%, these values are consistent with1.0, showing that, within the precision limits of the analysis,the propagation of the EM scale from testbeam to ATLASwas performed successfully.
It should be noted that the LHC collisions will provideextra tools to check the EM scale calibration. Isolated muonsand single hadrons developing their shower only in TileCalwill provide two data samples for which a direct comparisonto the testbeam scale will be possible.
5.4 ITC and gap/crack scintillator calibration
Understanding the response of the intermediate Tile Calori-meter (ITC) and the gap and crack scintillators (see Sect. 2.1and Fig. 2) to cosmic ray muons is essential for their cali-bration. The gap and crack scintillators can not be calibratedusing the Cs calibration source and therefore have arbitrarycalibration factors applied to them. This study with cosmicmuons gives the first clues for their in-situ performance.
These detectors are calibrated in two steps. The first stepis the intercalibration in φ among the cells of the same de-tector type and to determine the calibration factors for eachcell. The second step is the absolute calibration and to de-termine a scale factor defined relative to the MC for eachdetector type. Since the absolute energy scale in the scintil-lators is not known, the simulation is used as a reference inthis case.
The event selection follows the same procedures as indi-cated in Sect. 5.2.2, with the exception that only events witha single muon track with a momentum above 5 GeV are con-sidered and that, for the ITC cells, the entry and exit pointsof the track in the cell must be separated by at least 4 cm inthe z direction. These requirements accept 8% of RPC trig-gered events, 80% of TGC triggered events and 7% of L1calorimeter triggered events. Problematic cells and scintilla-tors14 are excluded in this analysis.
The geometrical path length is defined as a straight linebetween the two surfaces of the cell or scintillator. The muon
14Cells or scintillators that, even though matched with extrapolatedtracks, appear too noisy or show very small signal.
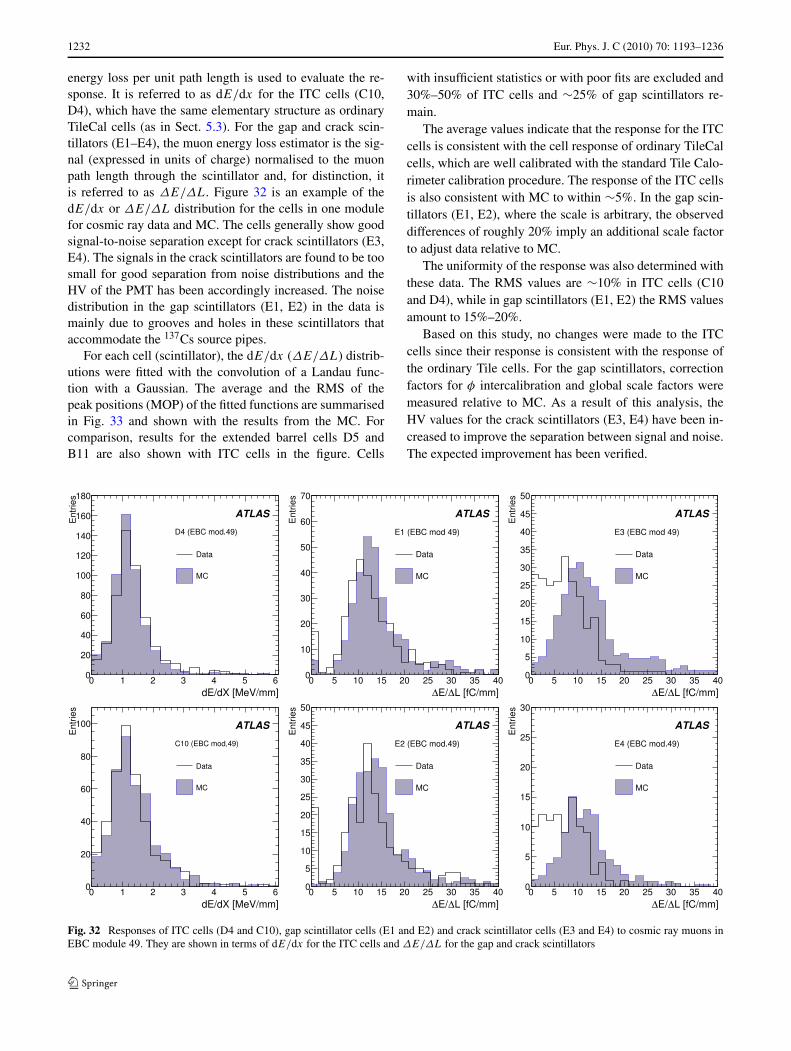
1232 Eur. Phys. J. C (2010) 70: 1193–1236
energy loss per unit path length is used to evaluate the re-sponse. It is referred to as dE/dx for the ITC cells (C10,D4), which have the same elementary structure as ordinaryTileCal cells (as in Sect. 5.3). For the gap and crack scin-tillators (E1–E4), the muon energy loss estimator is the sig-nal (expressed in units of charge) normalised to the muonpath length through the scintillator and, for distinction, itis referred to as ΔE/ΔL. Figure 32 is an example of thedE/dx or ΔE/ΔL distribution for the cells in one modulefor cosmic ray data and MC. The cells generally show goodsignal-to-noise separation except for crack scintillators (E3,E4). The signals in the crack scintillators are found to be toosmall for good separation from noise distributions and theHV of the PMT has been accordingly increased. The noisedistribution in the gap scintillators (E1, E2) in the data ismainly due to grooves and holes in these scintillators thataccommodate the 137Cs source pipes.
For each cell (scintillator), the dE/dx (ΔE/ΔL) distrib-utions were fitted with the convolution of a Landau func-tion with a Gaussian. The average and the RMS of thepeak positions (MOP) of the fitted functions are summarisedin Fig. 33 and shown with the results from the MC. Forcomparison, results for the extended barrel cells D5 andB11 are also shown with ITC cells in the figure. Cells
with insufficient statistics or with poor fits are excluded and30%–50% of ITC cells and ∼25% of gap scintillators re-main.
The average values indicate that the response for the ITCcells is consistent with the cell response of ordinary TileCalcells, which are well calibrated with the standard Tile Calo-rimeter calibration procedure. The response of the ITC cellsis also consistent with MC to within ∼5%. In the gap scin-tillators (E1, E2), where the scale is arbitrary, the observeddifferences of roughly 20% imply an additional scale factorto adjust data relative to MC.
The uniformity of the response was also determined withthese data. The RMS values are ∼10% in ITC cells (C10and D4), while in gap scintillators (E1, E2) the RMS valuesamount to 15%–20%.
Based on this study, no changes were made to the ITCcells since their response is consistent with the response ofthe ordinary Tile cells. For the gap scintillators, correctionfactors for φ intercalibration and global scale factors weremeasured relative to MC. As a result of this analysis, theHV values for the crack scintillators (E3, E4) have been in-creased to improve the separation between signal and noise.The expected improvement has been verified.
Fig. 32 Responses of ITC cells (D4 and C10), gap scintillator cells (E1 and E2) and crack scintillator cells (E3 and E4) to cosmic ray muons inEBC module 49. They are shown in terms of dE/dx for the ITC cells and ΔE/ΔL for the gap and crack scintillators
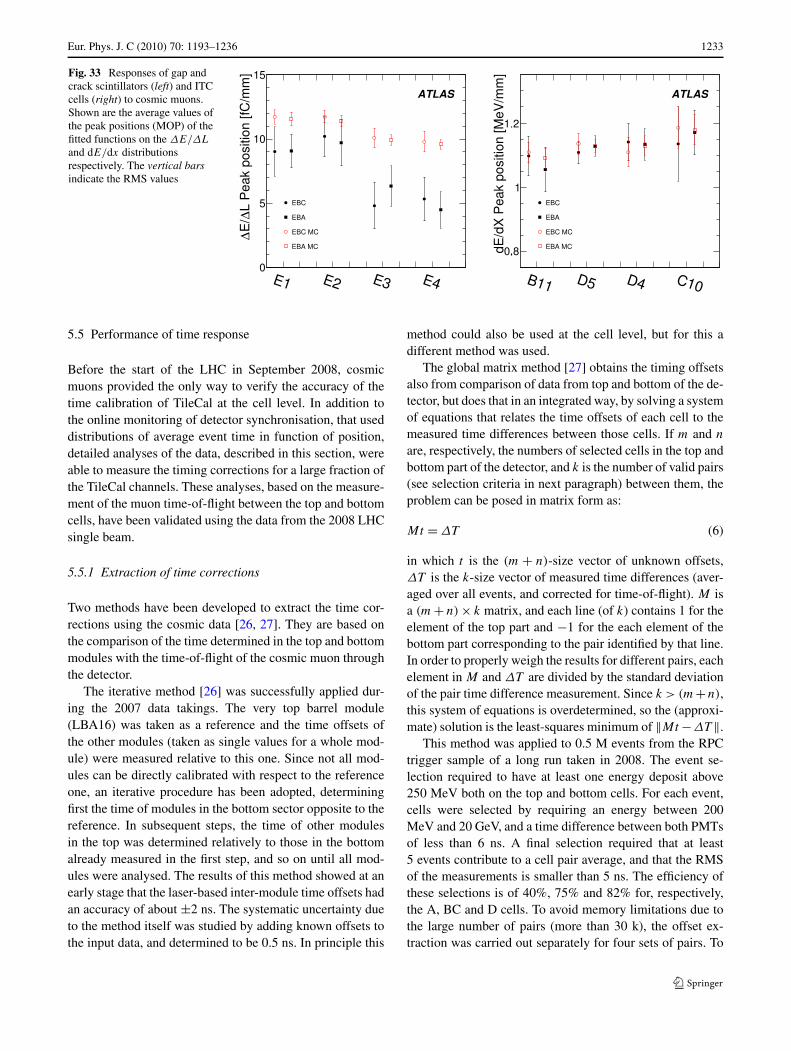
Eur. Phys. J. C (2010) 70: 1193–1236 1233
Fig. 33 Responses of gap andcrack scintillators (left) and ITCcells (right) to cosmic muons.Shown are the average values ofthe peak positions (MOP) of thefitted functions on the ΔE/ΔL
and dE/dx distributionsrespectively. The vertical barsindicate the RMS values
5.5 Performance of time response
Before the start of the LHC in September 2008, cosmicmuons provided the only way to verify the accuracy of thetime calibration of TileCal at the cell level. In addition tothe online monitoring of detector synchronisation, that useddistributions of average event time in function of position,detailed analyses of the data, described in this section, wereable to measure the timing corrections for a large fraction ofthe TileCal channels. These analyses, based on the measure-ment of the muon time-of-flight between the top and bottomcells, have been validated using the data from the 2008 LHCsingle beam.
5.5.1 Extraction of time corrections
Two methods have been developed to extract the time cor-rections using the cosmic data [26, 27]. They are based onthe comparison of the time determined in the top and bottommodules with the time-of-flight of the cosmic muon throughthe detector.
The iterative method [26] was successfully applied dur-ing the 2007 data takings. The very top barrel module(LBA16) was taken as a reference and the time offsets ofthe other modules (taken as single values for a whole mod-ule) were measured relative to this one. Since not all mod-ules can be directly calibrated with respect to the referenceone, an iterative procedure has been adopted, determiningfirst the time of modules in the bottom sector opposite to thereference. In subsequent steps, the time of other modulesin the top was determined relatively to those in the bottomalready measured in the first step, and so on until all mod-ules were analysed. The results of this method showed at anearly stage that the laser-based inter-module time offsets hadan accuracy of about ±2 ns. The systematic uncertainty dueto the method itself was studied by adding known offsets tothe input data, and determined to be 0.5 ns. In principle this
method could also be used at the cell level, but for this adifferent method was used.
The global matrix method [27] obtains the timing offsetsalso from comparison of data from top and bottom of the de-tector, but does that in an integrated way, by solving a systemof equations that relates the time offsets of each cell to themeasured time differences between those cells. If m and n
are, respectively, the numbers of selected cells in the top andbottom part of the detector, and k is the number of valid pairs(see selection criteria in next paragraph) between them, theproblem can be posed in matrix form as:
Mt = ΔT (6)
in which t is the (m + n)-size vector of unknown offsets,ΔT is the k-size vector of measured time differences (aver-aged over all events, and corrected for time-of-flight). M isa (m + n) × k matrix, and each line (of k) contains 1 for theelement of the top part and −1 for the each element of thebottom part corresponding to the pair identified by that line.In order to properly weigh the results for different pairs, eachelement in M and ΔT are divided by the standard deviationof the pair time difference measurement. Since k > (m+n),this system of equations is overdetermined, so the (approxi-mate) solution is the least-squares minimum of ‖Mt −ΔT ‖.
This method was applied to 0.5 M events from the RPCtrigger sample of a long run taken in 2008. The event se-lection required to have at least one energy deposit above250 MeV both on the top and bottom cells. For each event,cells were selected by requiring an energy between 200MeV and 20 GeV, and a time difference between both PMTsof less than 6 ns. A final selection required that at least5 events contribute to a cell pair average, and that the RMSof the measurements is smaller than 5 ns. The efficiency ofthese selections is of 40%, 75% and 82% for, respectively,the A, BC and D cells. To avoid memory limitations due tothe large number of pairs (more than 30 k), the offset ex-traction was carried out separately for four sets of pairs. To
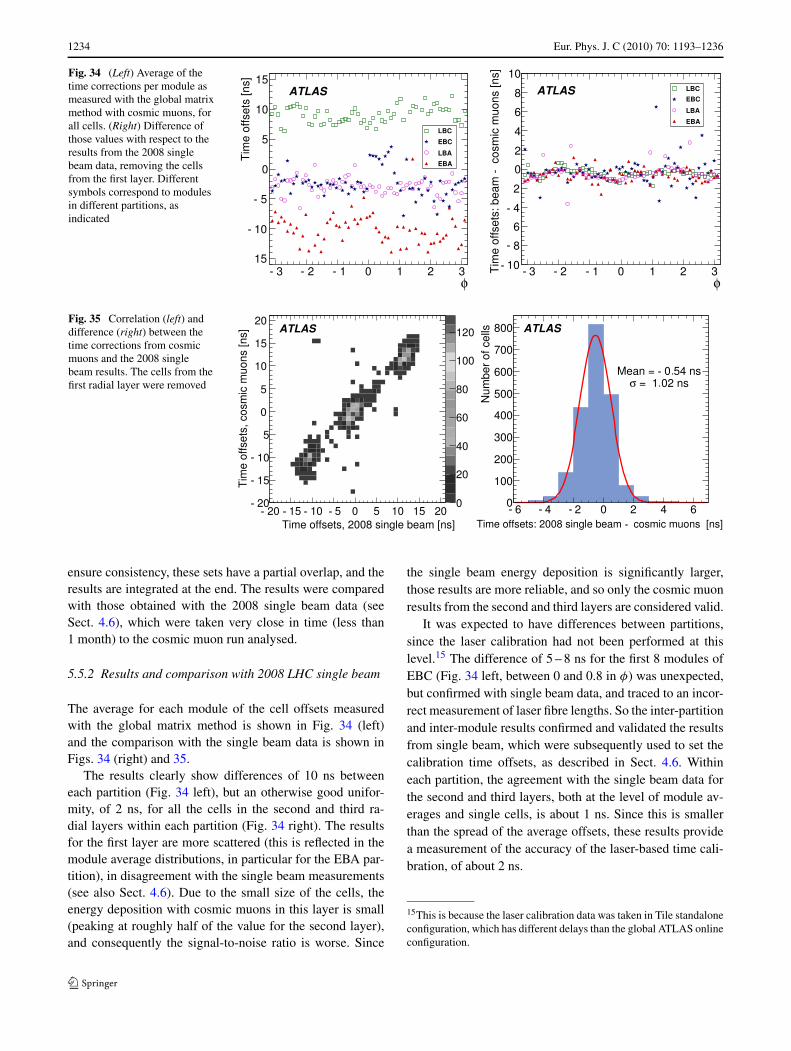
1234 Eur. Phys. J. C (2010) 70: 1193–1236
Fig. 34 (Left) Average of thetime corrections per module asmeasured with the global matrixmethod with cosmic muons, forall cells. (Right) Difference ofthose values with respect to theresults from the 2008 singlebeam data, removing the cellsfrom the first layer. Differentsymbols correspond to modulesin different partitions, asindicated
Fig. 35 Correlation (left) anddifference (right) between thetime corrections from cosmicmuons and the 2008 singlebeam results. The cells from thefirst radial layer were removed
ensure consistency, these sets have a partial overlap, and theresults are integrated at the end. The results were comparedwith those obtained with the 2008 single beam data (seeSect. 4.6), which were taken very close in time (less than1 month) to the cosmic muon run analysed.
5.5.2 Results and comparison with 2008 LHC single beam
The average for each module of the cell offsets measuredwith the global matrix method is shown in Fig. 34 (left)and the comparison with the single beam data is shown inFigs. 34 (right) and 35.
The results clearly show differences of 10 ns betweeneach partition (Fig. 34 left), but an otherwise good unifor-mity, of 2 ns, for all the cells in the second and third ra-dial layers within each partition (Fig. 34 right). The resultsfor the first layer are more scattered (this is reflected in themodule average distributions, in particular for the EBA par-tition), in disagreement with the single beam measurements(see also Sect. 4.6). Due to the small size of the cells, theenergy deposition with cosmic muons in this layer is small(peaking at roughly half of the value for the second layer),and consequently the signal-to-noise ratio is worse. Since
the single beam energy deposition is significantly larger,those results are more reliable, and so only the cosmic muonresults from the second and third layers are considered valid.
It was expected to have differences between partitions,since the laser calibration had not been performed at thislevel.15 The difference of 5 – 8 ns for the first 8 modules ofEBC (Fig. 34 left, between 0 and 0.8 in φ) was unexpected,but confirmed with single beam data, and traced to an incor-rect measurement of laser fibre lengths. So the inter-partitionand inter-module results confirmed and validated the resultsfrom single beam, which were subsequently used to set thecalibration time offsets, as described in Sect. 4.6. Withineach partition, the agreement with the single beam data forthe second and third layers, both at the level of module av-erages and single cells, is about 1 ns. Since this is smallerthan the spread of the average offsets, these results providea measurement of the accuracy of the laser-based time cali-bration, of about 2 ns.
15This is because the laser calibration data was taken in Tile standaloneconfiguration, which has different delays than the global ATLAS onlineconfiguration.
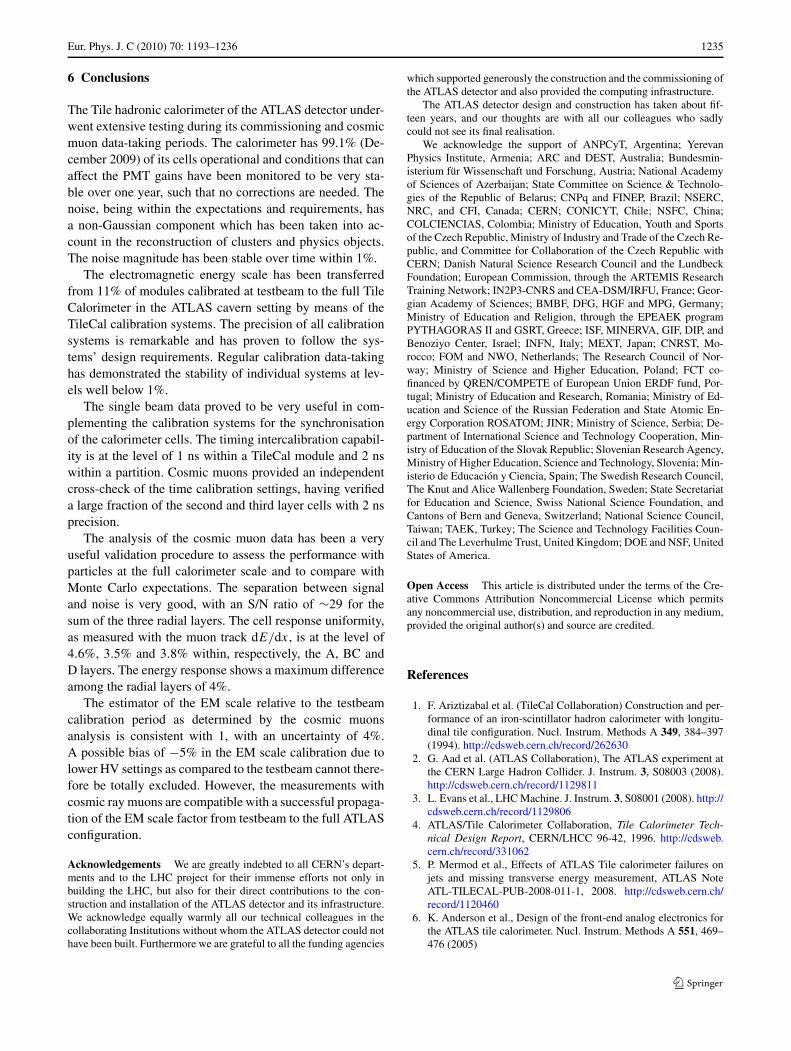
Eur. Phys. J. C (2010) 70: 1193–1236 1235
6 Conclusions
The Tile hadronic calorimeter of the ATLAS detector under-went extensive testing during its commissioning and cosmicmuon data-taking periods. The calorimeter has 99.1% (De-cember 2009) of its cells operational and conditions that canaffect the PMT gains have been monitored to be very sta-ble over one year, such that no corrections are needed. Thenoise, being within the expectations and requirements, hasa non-Gaussian component which has been taken into ac-count in the reconstruction of clusters and physics objects.The noise magnitude has been stable over time within 1%.
The electromagnetic energy scale has been transferredfrom 11% of modules calibrated at testbeam to the full TileCalorimeter in the ATLAS cavern setting by means of theTileCal calibration systems. The precision of all calibrationsystems is remarkable and has proven to follow the sys-tems’ design requirements. Regular calibration data-takinghas demonstrated the stability of individual systems at lev-els well below 1%.
The single beam data proved to be very useful in com-plementing the calibration systems for the synchronisationof the calorimeter cells. The timing intercalibration capabil-ity is at the level of 1 ns within a TileCal module and 2 nswithin a partition. Cosmic muons provided an independentcross-check of the time calibration settings, having verifieda large fraction of the second and third layer cells with 2 nsprecision.
The analysis of the cosmic muon data has been a veryuseful validation procedure to assess the performance withparticles at the full calorimeter scale and to compare withMonte Carlo expectations. The separation between signaland noise is very good, with an S/N ratio of ∼29 for thesum of the three radial layers. The cell response uniformity,as measured with the muon track dE/dx, is at the level of4.6%, 3.5% and 3.8% within, respectively, the A, BC andD layers. The energy response shows a maximum differenceamong the radial layers of 4%.
The estimator of the EM scale relative to the testbeamcalibration period as determined by the cosmic muonsanalysis is consistent with 1, with an uncertainty of 4%.A possible bias of −5% in the EM scale calibration due tolower HV settings as compared to the testbeam cannot there-fore be totally excluded. However, the measurements withcosmic ray muons are compatible with a successful propaga-tion of the EM scale factor from testbeam to the full ATLASconfiguration.
Acknowledgements We are greatly indebted to all CERN’s depart-ments and to the LHC project for their immense efforts not only inbuilding the LHC, but also for their direct contributions to the con-struction and installation of the ATLAS detector and its infrastructure.We acknowledge equally warmly all our technical colleagues in thecollaborating Institutions without whom the ATLAS detector could nothave been built. Furthermore we are grateful to all the funding agencies
which supported generously the construction and the commissioning ofthe ATLAS detector and also provided the computing infrastructure.
The ATLAS detector design and construction has taken about fif-teen years, and our thoughts are with all our colleagues who sadlycould not see its final realisation.
We acknowledge the support of ANPCyT, Argentina; YerevanPhysics Institute, Armenia; ARC and DEST, Australia; Bundesmin-isterium für Wissenschaft und Forschung, Austria; National Academyof Sciences of Azerbaijan; State Committee on Science & Technolo-gies of the Republic of Belarus; CNPq and FINEP, Brazil; NSERC,NRC, and CFI, Canada; CERN; CONICYT, Chile; NSFC, China;COLCIENCIAS, Colombia; Ministry of Education, Youth and Sportsof the Czech Republic, Ministry of Industry and Trade of the Czech Re-public, and Committee for Collaboration of the Czech Republic withCERN; Danish Natural Science Research Council and the LundbeckFoundation; European Commission, through the ARTEMIS ResearchTraining Network; IN2P3-CNRS and CEA-DSM/IRFU, France; Geor-gian Academy of Sciences; BMBF, DFG, HGF and MPG, Germany;Ministry of Education and Religion, through the EPEAEK programPYTHAGORAS II and GSRT, Greece; ISF, MINERVA, GIF, DIP, andBenoziyo Center, Israel; INFN, Italy; MEXT, Japan; CNRST, Mo-rocco; FOM and NWO, Netherlands; The Research Council of Nor-way; Ministry of Science and Higher Education, Poland; FCT co-financed by QREN/COMPETE of European Union ERDF fund, Por-tugal; Ministry of Education and Research, Romania; Ministry of Ed-ucation and Science of the Russian Federation and State Atomic En-ergy Corporation ROSATOM; JINR; Ministry of Science, Serbia; De-partment of International Science and Technology Cooperation, Min-istry of Education of the Slovak Republic; Slovenian Research Agency,Ministry of Higher Education, Science and Technology, Slovenia; Min-isterio de Educación y Ciencia, Spain; The Swedish Research Council,The Knut and Alice Wallenberg Foundation, Sweden; State Secretariatfor Education and Science, Swiss National Science Foundation, andCantons of Bern and Geneva, Switzerland; National Science Council,Taiwan; TAEK, Turkey; The Science and Technology Facilities Coun-cil and The Leverhulme Trust, United Kingdom; DOE and NSF, UnitedStates of America.
Open Access This article is distributed under the terms of the Cre-ative Commons Attribution Noncommercial License which permitsany noncommercial use, distribution, and reproduction in any medium,provided the original author(s) and source are credited.
References
1. F. Ariztizabal et al. (TileCal Collaboration) Construction and per-formance of an iron-scintillator hadron calorimeter with longitu-dinal tile configuration. Nucl. Instrum. Methods A 349, 384–397(1994). http://cdsweb.cern.ch/record/262630
2. G. Aad et al. (ATLAS Collaboration), The ATLAS experiment atthe CERN Large Hadron Collider. J. Instrum. 3, S08003 (2008).http://cdsweb.cern.ch/record/1129811
3. L. Evans et al., LHC Machine. J. Instrum. 3, S08001 (2008). http://cdsweb.cern.ch/record/1129806
4. ATLAS/Tile Calorimeter Collaboration, Tile Calorimeter Tech-nical Design Report, CERN/LHCC 96-42, 1996. http://cdsweb.cern.ch/record/331062
5. P. Mermod et al., Effects of ATLAS Tile calorimeter failures onjets and missing transverse energy measurement, ATLAS NoteATL-TILECAL-PUB-2008-011-1, 2008. http://cdsweb.cern.ch/record/1120460
6. K. Anderson et al., Design of the front-end analog electronics forthe ATLAS tile calorimeter. Nucl. Instrum. Methods A 551, 469–476 (2005)
1236 Eur. Phys. J. C (2010) 70: 1193–1236
7. S. Berglund et al., The ATLAS Tile Calorimeter digitizer. J. In-strum. 3, P01004 (2008). http://cdsweb.cern.ch/record/1071920
8. A. Valero, on behalf of the ATLAS Tile Calorimeter System,The ATLAS TileCal read-out drivers signal reconstruction, inIEEE Nucl. Sci. Symp. Conference Record, 2009. http://cdsweb.cern.ch/record/1223960
9. J. Poveda et al., Atlas TileCal read-out driver system productionand initial performance results. IEEE Trans. Nucl. Sci. 54, 2629–2636 (2007)
10. P. Adragna et al. (TileCal Collaboration), Testbeam studies of pro-duction modules of the ATLAS Tile Calorimeter. Nucl. Instrum.Methods A 606, 362–394 (2009). http://cdsweb.cern.ch/record/1161354
11. E. Starchenko et al., Cesium monitoring system for ATLAS TileHadron Calorimeter. Nucl. Instrum. Methods A 494, 281–284(2002). http://cdsweb.cern.ch/record/685349
12. S. Viret, for the LPC ATLAS group, LASER monitoring systemfor the ATLAS Tile Calorimeter. Nucl. Instrum. Methods A 617,120–122 (2010). Proceedings of the 11th Pisa Meeting on Ad-vanced Detectors
13. N. Shalanda et al., Radioactive source control and electronics forthe ATLAS tile calorimeter cesium calibration system. Nucl. In-strum. Methods A 508, 276–286 (2003)
14. J. Abdallah et al. (TileCal Collaboration), The optical Instru-mentation of the ATLAS Tile Calorimeter, ATLAS Note ATL-TILECAL-PUB-2008-005, 2007. http://cdsweb.cern.ch/record/1073936
15. S. Bertolucci et al., Influence of magnetic fields on the responseof acrylic scintillators. Nucl. Instrum. Methods A 254, 561–562(1987)
16. J. Cumalat et al., Effects of magnetic fields on the light yield ofscintilators. Nucl. Instrum. Methods A 293, 606–614 (1990)
17. J.-M. Chapuis, M. Nessi, The measurements of magnetic field ef-fects on scintillating tiles, ATLAS Note ATL-TILECAL-94-040,1994. http://cdsweb.cern.ch/record/683495
18. K. Anderson et al., Calibration of ATLAS Tile Calorimeter at elec-tromagnetic scale, ATLAS Note ATL-TILECAL-PUB-2009-001,2009. http://cdsweb.cern.ch/record/1139228
19. C. Clement, B. Nordkvist, O. Solovyanov, I. Vivarelli, Timecalibration of the ATLAS Hadronic Tile Calorimeter using thelaser system, ATLAS Note ATL-TILECAL-PUB-2009-003, 2009.http://cdsweb.cern.ch/record/1143376
20. G. Aad et al. (ATLAS Collaboration), Expected performance ofthe ATLAS experiment—detector, trigger and physics, CERN Re-port CERN-OPEN-2008-020, 2009. http://cdsweb.cern.ch/record/1125884
21. R. Leitner, V. Shmakova, P. Tas, Time resolution of the AT-LAS Tile calorimeter and its performance for a measurement ofheavy stable particles, ATLAS Note ATL-TILECAL-PUB-2007-002, 2007. http://cdsweb.cern.ch/record/1024672
22. L. de Andrade Filho, J. de Seixas, Combining Hough transformand optimal filtering for efficient cosmic ray detection with ahadronic calorimeter, in XII International Workshop on AdvancedComputing Analysis Techniques in Physics Research (Science,2008)
23. J. Illingworth, A survey of the Hough transform. Comput. Vis.Graph. Image Process. 44, 87–116 (1988)
24. A. Salzburger, The ATLAS Track Extrapolation Package, ATLASNote ATL-SOFT-PUB-2007-005, 2007. http://cdsweb.cern.ch/record/1038100
25. Z. Ajaltouni et al., Response of the ATLAS Tile calorimeter pro-totype to muons. Nucl. Instrum. Methods A 388, 64–78 (1997)
26. L. Fiorini, I. Korolkov, F. Vives, Tile Calibration of TileCal Mod-ules with Cosmic Muons, ATLAS Note ATL-TILECAL-PUB-2008-010, 2008. http://cdsweb.cern.ch/record/1109974
27. J. Saraiva, on behalf of the ATLAS Tile Calorimeter System,Commissioning of the ATLAS Tile calorimeter with Single Beamand First collisions, in Proceedings of the 12th Topical Seminaron Innovative Particle and Radiation Detectors, Siena (2010), inNuclear Physics B (Proceedings Supplement), 2010, to appear.http://cdsweb.cern.ch/record/1281689
Related Documents


