International Journal of Chemical Reactor Engineering Volume Article A Reactive Hydrogen Content: A Tool to Predict FCC Yields Ernesto Mariaca-Dominguez * Silvano Rodr´ ıguez-Salom´ on † Rafael Maya Yescas ‡ * Instituto Mexicano del Petroleo, [email protected] † Instituto Mexicano del Petroleo, [email protected] ‡ Instituto Mexicano del Petroleo, [email protected] ISSN 1542-6580 Copyright c 2003 by the authors. All rights reserved. No part of this publication may be reproduced, stored in a retrieval system, or transmitted, in any form or by any means, electronic, mechanical, photocopying, recording, or otherwise, without the prior written permission of the publisher, bepress, which has been given certain exclusive rights by the author.

Welcome message from author
This document is posted to help you gain knowledge. Please leave a comment to let me know what you think about it! Share it to your friends and learn new things together.
Transcript
International Journal of
Chemical Reactor EngineeringVolume Article A
Reactive Hydrogen Content: A
Tool to Predict FCC Yields
Ernesto Mariaca-Dominguez∗ Silvano Rodrıguez-Salomon†
Rafael Maya Yescas‡
∗Instituto Mexicano del Petroleo, [email protected]†Instituto Mexicano del Petroleo, [email protected]‡Instituto Mexicano del Petroleo, [email protected]
ISSN 1542-6580Copyright c©2003 by the authors.
All rights reserved. No part of this publication may be reproduced, stored in a retrievalsystem, or transmitted, in any form or by any means, electronic, mechanical, photocopying,recording, or otherwise, without the prior written permission of the publisher, bepress, whichhas been given certain exclusive rights by the author.
Reactive Hydrogen Content: A Tool to PredictFCC Yields
Ernesto Mariaca-Dominguez, Silvano Rodrıguez-Salomon, andRafael Maya Yescas
Abstract
Fluid Catalytic Cracking is a process conceived to produce gasoline as themain product. Feed stocks to the process are vacuum gas oils (VGO) showingboiling point ranges typically between 343◦C and 538◦C. Since these boilingrange cut points are usually fixed, the carbon number range of encounteredhydrocarbons is approximately constant and this is also true for the relativeamounts of paraffins, naphthenes and aromatics, regardless of changes fromfeed to feed. Under FCC reaction conditions, each of the above hydrocarbongroups exhibit different crackability. In order to explain the existing relation-ship between feed composition and yields and quality of end products, it isnecessary to establish the effect of composition and operational conditions oncracking behavior of feedstocks, expressed in terms of a relation between somespecific properties, or as in our case, by its Reactive Hydrogen Content (RHC).Therefore, yields should then be dependent on three factors, RHC value, as ameasure of feed quality, catalysts and applied operational conditions. In thiswork, a RHC for a series of feeds of known composition is determined and corre-lated to conversion and yields obtained under different operational conditions,using the same catalyst. The resulting correlations are then applied to unknownfeeds with the RHC being calculated from physical properties, and yields.
KEYWORDS: catalytic cracking, kinetics, physical properties, reactive hy-drogen
1. INTRODUCTION
By far, fluid catalytic cracking (FCC) is the main process in gasoline production oriented refineries. Its main function is to transform high molecular weight hydrocarbons into lighter and more valuable ones by cracking carbon-carbon bonds. Feedstock to the process, usually vacuum gas oil (VGO), consists of a mixture of several hydrocarbon types, mainly paraffins, naphthenes, aromatics and poly-aromatics. Consequently, there is a distribution of the same groups of hydrocarbons plus olefins in FCC products.
The ability to crack each of these hydrocarbon types is quite different and depends on the feasibility to form carbonium and/or carbenium ions under FCC operational conditions in presence of a solid acid catalyst, commonly a zeolite entrapped in an amorphous alumino-silicate support. This cracking ability is related to structural features such as the relative amount of secondary and tertiary hydrogens in the molecule, as well as to molecular compactness (di- , tri-, four-cyclic compounds), which is an important consideration since there is restricted access to active sites located inside the pores of the catalyst. Long chain paraffinic structures react very well and, once the reaction is initiated, they may be converted to low molecular weight paraffins and olefins up to C3 and C4.
In the technical literature, there is a great amount of reports and data related to reactions of model hydrocarbons as well as hydrocarbon mixtures and industrial feedstocks to FCC process; there is also agreement on which hydrocarbon structures are the most crackable and which the more refractory ones.
Al-Enezi et al. (1999) report regression models for predicting product yields and selected properties, and claim their model can be easily integrated within LP refinery software for scheduling and planning. Feed properties collected from various sources are employed as primary correlation parameters, and predictions from the models are compared to previous similar models and to real data. Authors are not concerned with process kinetics and are solely interested in deriving mathematical expressions capable of integration into computational software. Therefore, their correlations are of a statistical nature and its value is related to its practical application as an alternative to charts and graphs commonly in a refinery environment.
Therefore, feedstock composition analysis is a reasonable support for predicting product yields and quality parameters from the chemistry involved in FCC processing (Qian et al., 1998). Information thus developed, can be used with advantage to correlate also physical and thermodynamic properties in kinetic models.
Prevailing molecular shapes and types of carbon bonds present, give rise to particular physical properties and chemical behavior of a specific hydrocarbon mixture. There is a direct relation between physical properties, overall hydrogen content in VGO, and specifically, between its chemical behavior and relative content of paraffins and paraffinic constituents in the structure of more complex molecular types. Hydrogen content can go as low as 11% for aromatic feedstocks, to over 14% for paraffinic feedstocks. LPG and gasoline yields will show an increasing trend for a series of compared feeds having increasing overall hydrogen content; at the same time, yields to C1 - C2 hydrocarbons and coke should decrease. As it was stated above, cracking of paraffins takes over readily while cracking of aromatic rings to valuable products does not occur at all, and are good prospective to coke production.
Hydrogen content and its distribution by hydrocarbon type in feedstock is a good indicator of cracking performance. This observation was used to classify feedstocks as proposed by Mariaca et al. (2003). They defined two types of hydrogen, refractory (non-reactive) and reactive, the latter being that attached to crackable functional groups i.e. specific for that part of the molecule that is able to crack under FCC reaction conditions. Consequently, these authors introduced a reactivity factor defined as the ratio of reactive hydrogen content in saturates, and reactive hydrogen content in aromatics.
Pekediz et al. (1997), report that relative reactivity of paraffinic components will depend on carbon number, as reviewed by Venuto and Habib (1978). Reported data is in agreement with to date accepted carbenium ion chemistry. Since kinetic rate constants are directly related to feedstock composition, attempts to predict yields on the basis of group analysis give superior results, as compared with those obtained by solely considering physical properties. Abbot and Dunstan (1997) contributed to this task by studying the effect of chain length on cracking of linear paraffins solely. They correlate MAT data for several linear paraffins and introduce some rules of reaction, such as the low probability of formation of dry gas (H2, CH4, C2H4 and C2H6) from paraffins with less than 6
1Mariaca-Dominguez et al.: Reactive Hydrogen Content: A Tool to Predict FCC Yields
Produced by The Berkeley Electronic Press, 2003
carbons. Their data corroborate that reaction rate constants are related to the number of carbon atoms in the molecule, and seems to be in thermodynamic agreement because changes in catalyst formulation do not have influence on these results. However, studies with model compounds and simple mixtures do not give much information regarding eventual synergies between different carbon groups.
As pointed out by the Mobil’s group (Christensen et al., 1999), development of kinetic schemes and FCC simulators should account for product quality. To do so, these authors developed a model which uses more than 3,000 kinetic entities (some of them lumped compounds) and about 60 rules of reaction, in order to obtain more than 30,000 possible chemical reactions. Implementation of this kind of kinetic schemes to industrial practice is highly complicated, especially because of the need of detailed feedstock and product analysis.
Froment and col. developed a different approach known as Single-Event Kinetic Model (Dewachtere et al., 1999). This model is based on conventional carbocation rules and intrinsic molecular reactivity. The fundament of their approach is based on nearly 650 chemical entities and about 50 rules of reaction complemented by thermodynamic analyses to predict product yields from industrial FCC risers. Although this model is simpler than Mobil’s, it is still demanding a great deal of sophisticated analytical support.
Quann & Jaffe (1996) lumping approach of chemical entities by their structure is closely related to that of Christensen et al. (1999), and also requires extensive analytical information of feedstock and products.
The predictive capability of a model based on the average structure concept is a function of the used number of model structures (Liguras & Allen, 1989; Pitault et al., 1994). Then, the use of a single molecule to represent the kinetics of a complex mixture will not work. On the other hand, the detailed assessment of the reacting mixture composition as a function of time, requires an impressive effort in resources. Mobil’s group, Quann & Jaffe and Froment’s group are in the way to implement this approach.
Pitault et al. (1994) propose a lumping strategy that takes into account physical and chemical properties of grouped hydrocarbon types. They consider that typical chemical reactions take over in each lump and chose to model explicitly the coke deposition on the catalyst. Even though it is possible to predict yields of dry gas and heavier products, the authors concluded that their strategy is still not adequate enough to predict products properties.
Lappas et al. (1997) studied cracking of aromatic fractions from an FCC feedstock using a modified Jacob’s (1976) kinetic scheme. They achieve identification of those aromatic groups which form gasoline and heavier products and segregate gas lump into dry gas and LPG. According to the authors, LPG and dry gas are formed by primary and secondary cracking reactions, respectively, and suggest that alkyl sustituents react different as compared to the attached aromatic nuclei.
Structural oriented studies were developed by Sungungun et al. (1998) by using observable lumps. Theauthors calculated the probability of reaction as a combination of adsorption and reaction rate constants, and predict product distribution at reactor outlet in an industrial FCC unit. The problem with this scheme is that, due to the fact that lumped entities are defined as observables, kinetic rates depend on the definition of the lumping criteria. This situation limits the applicability of the model to a single lumped kinetic scheme.
Lappas et al. (1999), proposed simple models for the prediction of conversion and gasoline composition as a function of selected feedstock properties; gasoline composition is segregated and predicted from models based on olefins and aromatics content, as well as overall conversion.
Since the number of possible components in FCC feedstock is high, lumping is always necessary. Nevertheless, the lumping strategy is of paramount importance to obtain results of industrial interest.
As it is well known, achieved conversion in the FCC process depend on catalyst type, reaction conditions and feedstock properties. It is nevertheless frequent that operators are faced with the need to process different feedstocks with same catalyst and achieve best possible results by moving operational conditions. It is then necessary to have in hand tools which might give a suitable reference to the expected processing results from the knowledge of feedstock quality. Refiners often do not have fast access to analytical tools such as HPLC-MS, and also do not have the time to wait for the results of this type of analysis. Therefore, the development before hand of
2 International Journal of Chemical Reactor Engineering Vol. 1 [2003], Article A46
http://www.bepress.com/ijcre/vol1/A46
correlations based on this source of information with more common physical properties and conversion data becomes relevant.
Our approach to a systematic study of the effect of feedstock quality on the conversion and yields of individual products is based on a detailed characterization of feedstocks and on the development of tools to classify (Mariaca-Domínguez et al., 2003) and predict yields. Further research also includes the development of a kinetic model able to predict products quality. Hydrogen content is a measure of the quality of feedstocks, since it is a measure of the relative amount of crackable material, but also, when enough detailed information is available, it might be used to calculate conversion and yields of individual products. From the analysis and processing of mass spectrometric data, a parameter related to the amount of hydrogen in molecules able to be cracked into gasoline and lower molecular weight products is derived. This parameter is called the Reactive Hydrogen Content (RHC) and can be used to predict the behavior of FCC feedstocks under different severity levels, with only constraint that can be applied to same catalyst formulation the RHC parameter was originally derived.
In this work, total hydrogen content and defined reactive hydrogen content is used to predict conversion as well as yields of individual reaction products. Total Reactive Hydrogen Content (RHC) is evaluated from HPLC-MS analysis and correlated to physical properties commonly measured during industrial operation.
2. EXPERIMENTAL
A typical FCC feedstock from a domestic refinery was analyzed and fractionated into six distillation cuts (DC). Selected properties of feedstock, distillation cuts, and the industrial catalyst are reported in Tables 1, 2 and 6.
Table 1. Feedstock PropertiesProperty Value
Specific Gravity, 20/4°C 0.9201°API 21.82VABP, °C 459.3Saturated HC, wt% 48.4Aromatic HC, wt% 51.6Refractive Index (RI), n20 1.5045Watson Characterization Factor, KW 11.61
Table 2. Catalyst Properties.Surface Area, m2/g 153 Pore Volume, cm3/g 0.125MAT Activity, wt% 68.8 Micropore Volume, cm3/g 0.0466
Accordingly, obtained DCs were analyzed by HPLC-MS and resulting chemical composition ranked in 14 hydrocarbon classes (Table 3) are reported in Table 4.
Table 3. Hydrocarbon Types by Classes.
Class Saturated AromaticI Paraffins Alkyl benzenes II Single-ring Naphthenes Alkylnaphthenobenzenes + AlkylindanesIII Double-ring Naphthenes Alkyldinaphthenobenzenes IV 3-rings Naphthenes AlkylnaphthalenesV 4-rings Naphthenes Alkylmononaphthenonaphthalenes + AlkylbiphenylsVI 5-rings Naphthenes Alkylfluorenes + AlkylacenaphthalenesVII 6-rings Naphthenes Alkylanthracenes + Alkyldihydropyrenes + Alkyl fluoranthenes +
Alkylpyrenes + Alkylchrysenes
3Mariaca-Dominguez et al.: Reactive Hydrogen Content: A Tool to Predict FCC Yields
Produced by The Berkeley Electronic Press, 2003
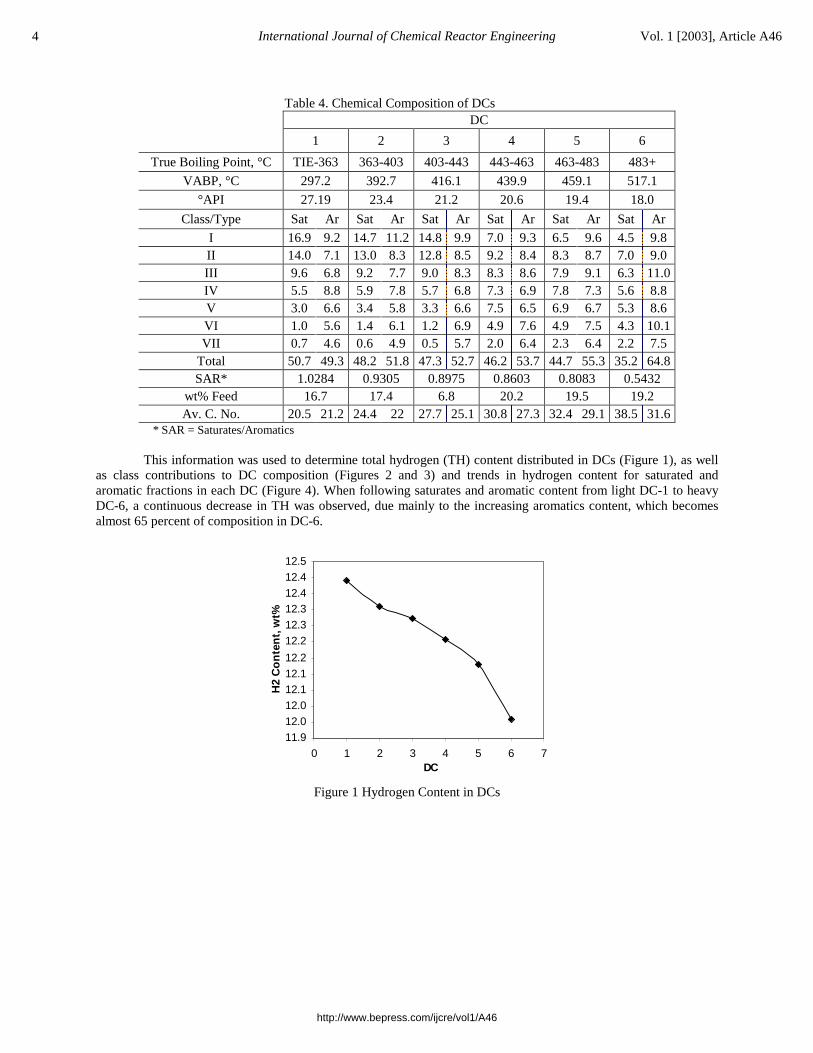
Table 4. Chemical Composition of DCsDC
1 2 3 4 5 6
True Boiling Point, °C TIE-363 363-403 403-443 443-463 463-483 483+
VABP, °C 297.2 392.7 416.1 439.9 459.1 517.1
°API 27.19 23.4 21.2 20.6 19.4 18.0
Class/Type Sat Ar Sat Ar Sat Ar Sat Ar Sat Ar Sat Ar
I 16.9 9.2 14.7 11.2 14.8 9.9 7.0 9.3 6.5 9.6 4.5 9.8II 14.0 7.1 13.0 8.3 12.8 8.5 9.2 8.4 8.3 8.7 7.0 9.0III 9.6 6.8 9.2 7.7 9.0 8.3 8.3 8.6 7.9 9.1 6.3 11.0IV 5.5 8.8 5.9 7.8 5.7 6.8 7.3 6.9 7.8 7.3 5.6 8.8V 3.0 6.6 3.4 5.8 3.3 6.6 7.5 6.5 6.9 6.7 5.3 8.6VI 1.0 5.6 1.4 6.1 1.2 6.9 4.9 7.6 4.9 7.5 4.3 10.1VII 0.7 4.6 0.6 4.9 0.5 5.7 2.0 6.4 2.3 6.4 2.2 7.5
Total 50.7 49.3 48.2 51.8 47.3 52.7 46.2 53.7 44.7 55.3 35.2 64.8SAR* 1.0284 0.9305 0.8975 0.8603 0.8083 0.5432
wt% Feed 16.7 17.4 6.8 20.2 19.5 19.2Av. C. No. 20.5 21.2 24.4 22 27.7 25.1 30.8 27.3 32.4 29.1 38.5 31.6
* SAR = Saturates/Aromatics
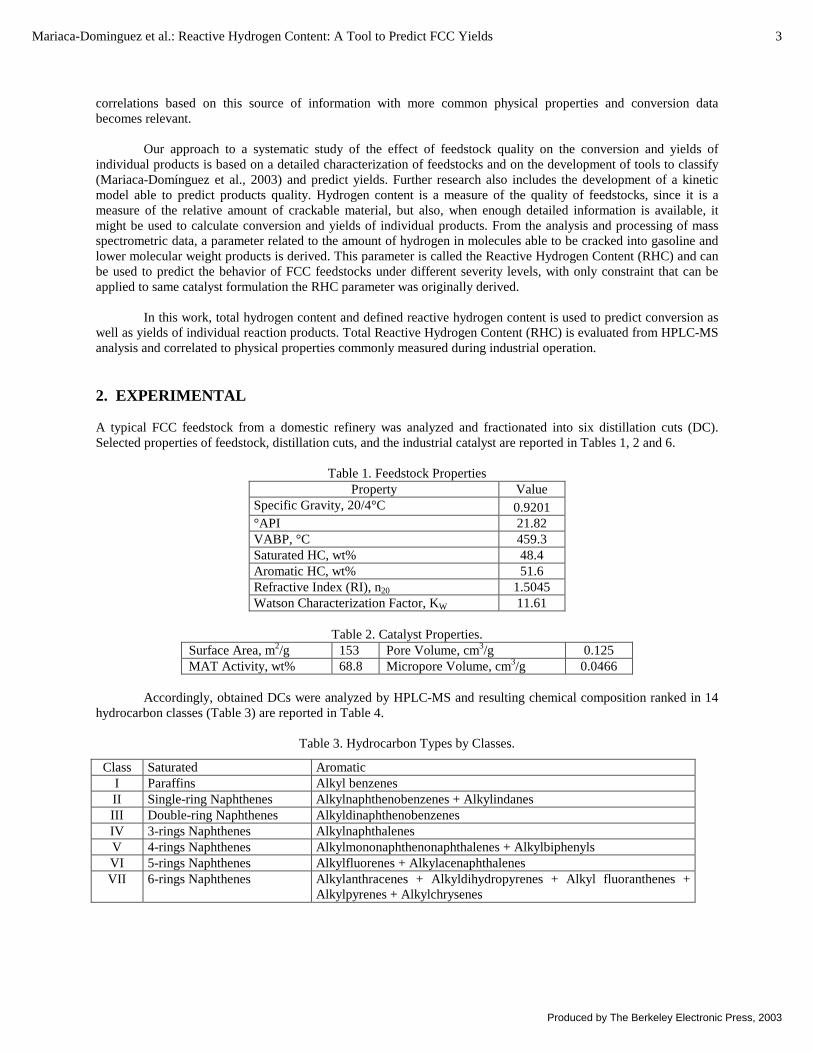
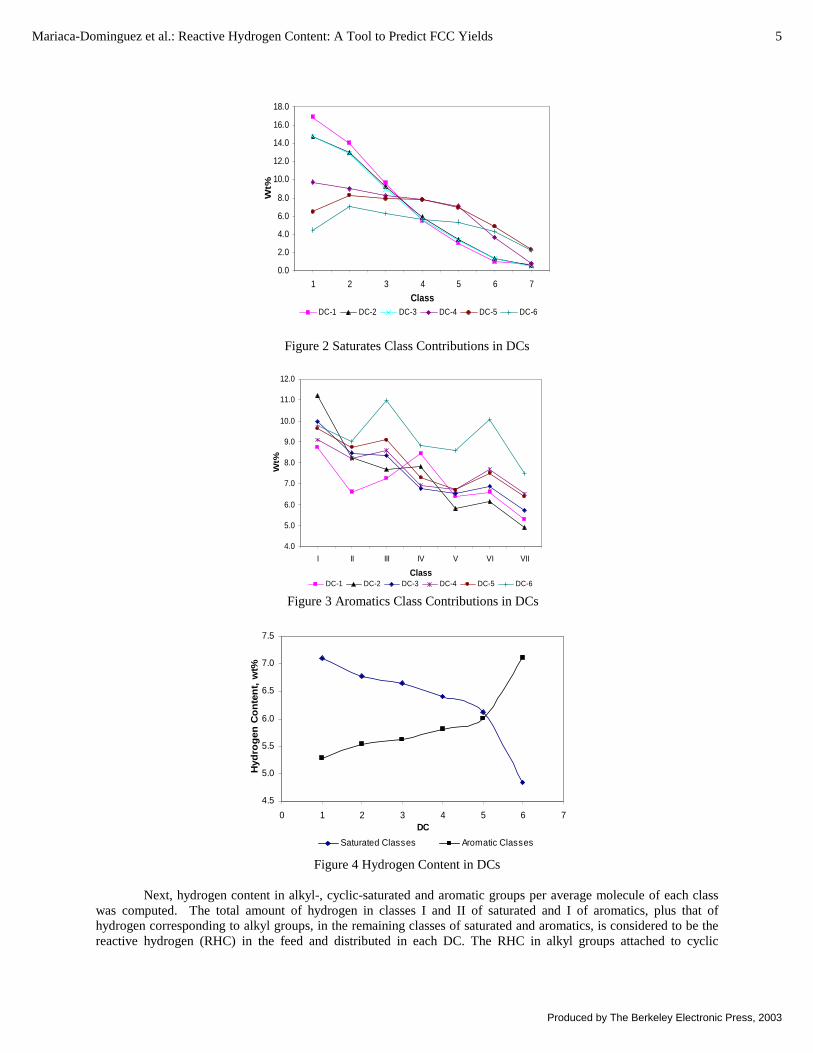
This information was used to determine total hydrogen (TH) content distributed in DCs (Figure 1), as well as class contributions to DC composition (Figures 2 and 3) and trends in hydrogen content for saturated and aromatic fractions in each DC (Figure 4). When following saturates and aromatic content from light DC-1 to heavy DC-6, a continuous decrease in TH was observed, due mainly to the increasing aromatics content, which becomes almost 65 percent of composition in DC-6.
11.9
12.0
12.0
12.112.1
12.2
12.2
12.3
12.312.4
12.4
12.5
0 1 2 3 4 5 6 7DC
H2
Co
nte
nt,
wt%
Figure 1 Hydrogen Content in DCs
4 International Journal of Chemical Reactor Engineering Vol. 1 [2003], Article A46
http://www.bepress.com/ijcre/vol1/A46
0.0
2.0
4.0
6.0
8.0
10.0
12.0
14.0
16.0
18.0
1 2 3 4 5 6 7
Class
Wt%
DC-1 DC-2 DC-3 DC-4 DC-5 DC-6
Figure 2 Saturates Class Contributions in DCs
4.0
5.0
6.0
7.0
8.0
9.0
10.0
11.0
12.0
I II III IV V VI VII
Class
Wt%
DC-1 DC-2 DC-3 DC-4 DC-5 DC-6
Figure 3 Aromatics Class Contributions in DCs
4.5
5.0
5.5
6.0
6.5
7.0
7.5
0 1 2 3 4 5 6 7DC
Hyd
rog
en C
on
ten
t, w
t%
Saturated Classes Aromatic Classes
Figure 4 Hydrogen Content in DCs
Next, hydrogen content in alkyl-, cyclic-saturated and aromatic groups per average molecule of each class was computed. The total amount of hydrogen in classes I and II of saturated and I of aromatics, plus that of hydrogen corresponding to alkyl groups, in the remaining classes of saturated and aromatics, is considered to be the reactive hydrogen (RHC) in the feed and distributed in each DC. The RHC in alkyl groups attached to cyclic
5Mariaca-Dominguez et al.: Reactive Hydrogen Content: A Tool to Predict FCC Yields
Produced by The Berkeley Electronic Press, 2003
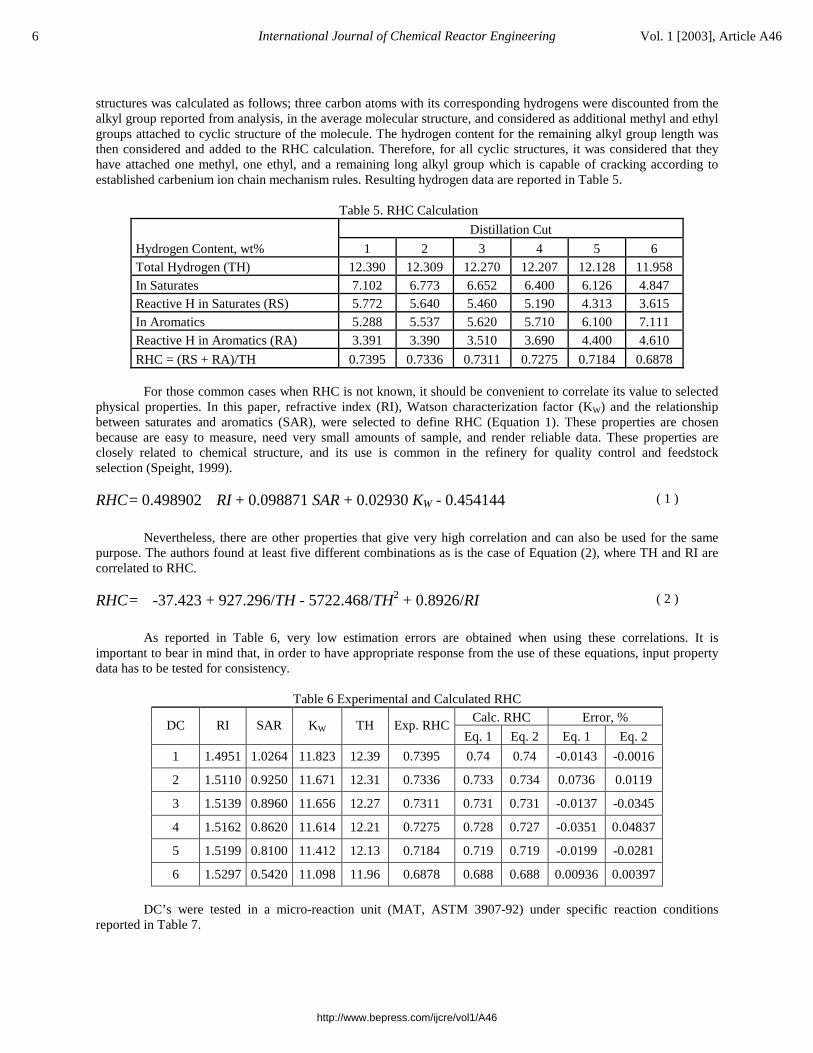
structures was calculated as follows; three carbon atoms with its corresponding hydrogens were discounted from the alkyl group reported from analysis, in the average molecular structure, and considered as additional methyl and ethyl groups attached to cyclic structure of the molecule. The hydrogen content for the remaining alkyl group length was then considered and added to the RHC calculation. Therefore, for all cyclic structures, it was considered that they have attached one methyl, one ethyl, and a remaining long alkyl group which is capable of cracking according to established carbenium ion chain mechanism rules. Resulting hydrogen data are reported in Table 5.
Table 5. RHC Calculation
Distillation Cut
Hydrogen Content, wt% 1 2 3 4 5 6Total Hydrogen (TH) 12.390 12.309 12.270 12.207 12.128 11.958In Saturates 7.102 6.773 6.652 6.400 6.126 4.847Reactive H in Saturates (RS) 5.772 5.640 5.460 5.190 4.313 3.615In Aromatics 5.288 5.537 5.620 5.710 6.100 7.111Reactive H in Aromatics (RA) 3.391 3.390 3.510 3.690 4.400 4.610
RHC = (RS + RA)/TH 0.7395 0.7336 0.7311 0.7275 0.7184 0.6878
For those common cases when RHC is not known, it should be convenient to correlate its value to selected physical properties. In this paper, refractive index (RI), Watson characterization factor (KW) and the relationship between saturates and aromatics (SAR), were selected to define RHC (Equation 1). These properties are chosen because are easy to measure, need very small amounts of sample, and render reliable data. These properties are closely related to chemical structure, and its use is common in the refinery for quality control and feedstock selection (Speight, 1999).
RHC = 0.498902 RI + 0.098871 SAR + 0.02930 KW - 0.454144 ( 1 )
Nevertheless, there are other properties that give very high correlation and can also be used for the same purpose. The authors found at least five different combinations as is the case of Equation (2), where TH and RI are correlated to RHC.
RHC = -37.423 + 927.296/TH - 5722.468/TH2 + 0.8926/RI ( 2 )
As reported in Table 6, very low estimation errors are obtained when using these correlations. It is important to bear in mind that, in order to have appropriate response from the use of these equations, input property data has to be tested for consistency.
Table 6 Experimental and Calculated RHCCalc. RHC Error, %
DC RI SAR KW TH Exp. RHCEq. 1 Eq. 2 Eq. 1 Eq. 2
1 1.4951 1.0264 11.823 12.39 0.7395 0.74 0.74 -0.0143 -0.0016
2 1.5110 0.9250 11.671 12.31 0.7336 0.733 0.734 0.0736 0.0119
3 1.5139 0.8960 11.656 12.27 0.7311 0.731 0.731 -0.0137 -0.0345
4 1.5162 0.8620 11.614 12.21 0.7275 0.728 0.727 -0.0351 0.04837
5 1.5199 0.8100 11.412 12.13 0.7184 0.719 0.719 -0.0199 -0.0281
6 1.5297 0.5420 11.098 11.96 0.6878 0.688 0.688 0.00936 0.00397
DC’s were tested in a micro-reaction unit (MAT, ASTM 3907-92) under specific reaction conditions reported in Table 7.
6 International Journal of Chemical Reactor Engineering Vol. 1 [2003], Article A46
http://www.bepress.com/ijcre/vol1/A46
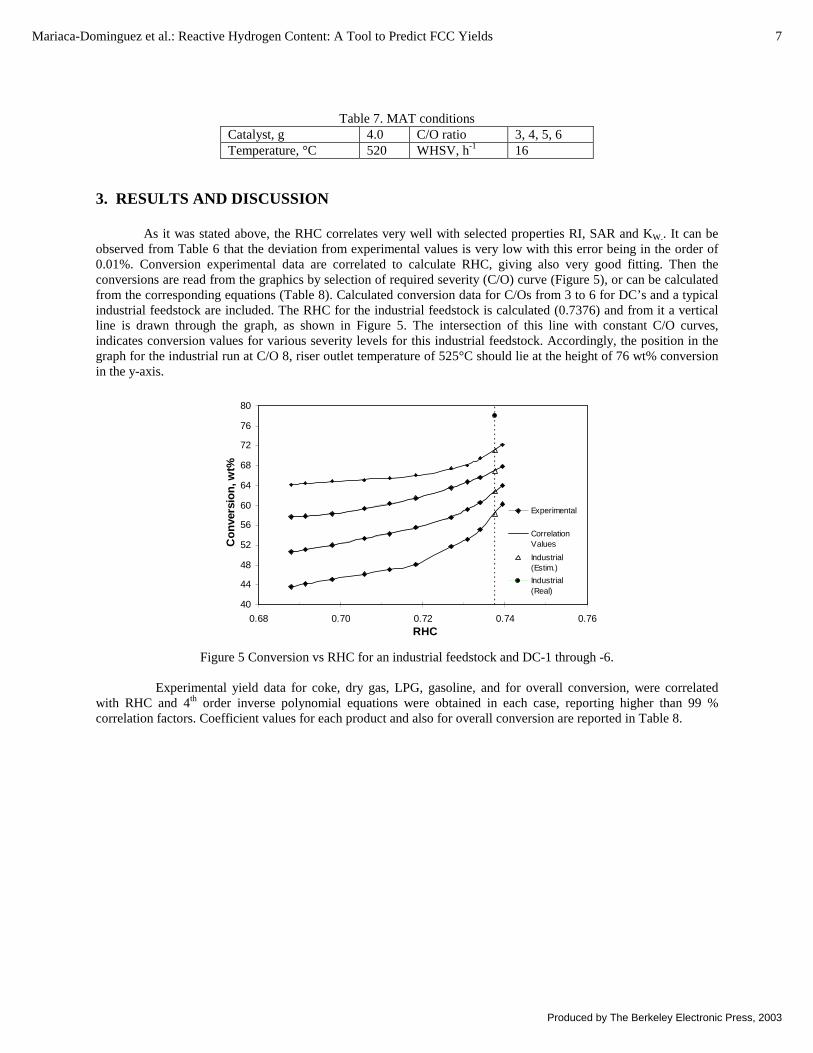
Table 7. MAT conditionsCatalyst, g 4.0 C/O ratio 3, 4, 5, 6Temperature, °C 520 WHSV, h-1 16
3. RESULTS AND DISCUSSION
As it was stated above, the RHC correlates very well with selected properties RI, SAR and KW.. It can be observed from Table 6 that the deviation from experimental values is very low with this error being in the order of 0.01%. Conversion experimental data are correlated to calculate RHC, giving also very good fitting. Then the conversions are read from the graphics by selection of required severity (C/O) curve (Figure 5), or can be calculated from the corresponding equations (Table 8). Calculated conversion data for C/Os from 3 to 6 for DC’s and a typical industrial feedstock are included. The RHC for the industrial feedstock is calculated (0.7376) and from it a vertical line is drawn through the graph, as shown in Figure 5. The intersection of this line with constant C/O curves, indicates conversion values for various severity levels for this industrial feedstock. Accordingly, the position in the graph for the industrial run at C/O 8, riser outlet temperature of 525°C should lie at the height of 76 wt% conversion in the y-axis.
40
44
48
52
56
60
64
68
72
76
80
0.68 0.70 0.72 0.74 0.76RHC
Co
nve
rsio
n, w
t%
Experimental
CorrelationValues
Industrial(Estim.)
Industrial(Real)
Figure 5 Conversion vs RHC for an industrial feedstock and DC-1 through -6.
Experimental yield data for coke, dry gas, LPG, gasoline, and for overall conversion, were correlated with RHC and 4th order inverse polynomial equations were obtained in each case, reporting higher than 99 % correlation factors. Coefficient values for each product and also for overall conversion are reported in Table 8.
7Mariaca-Dominguez et al.: Reactive Hydrogen Content: A Tool to Predict FCC Yields
Produced by The Berkeley Electronic Press, 2003
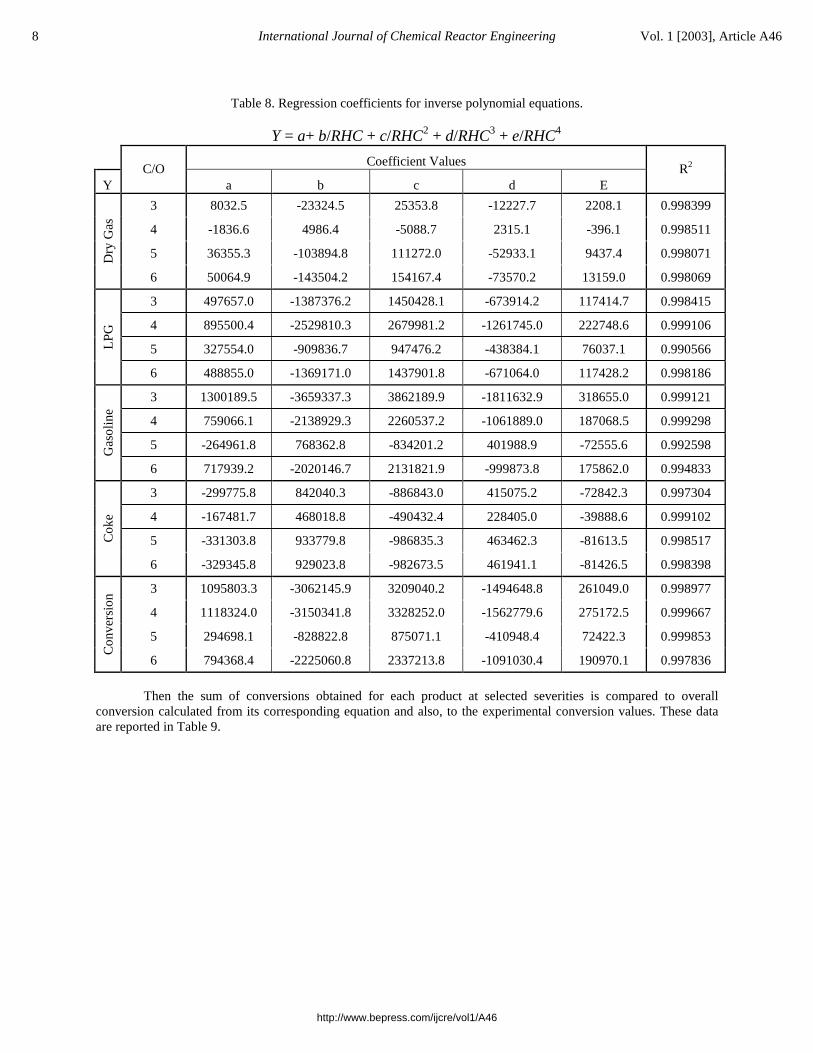
Table 8. Regression coefficients for inverse polynomial equations.
Y = a+ b/RHC + c/RHC2 + d/RHC3 + e/RHC4
Coefficient Values
YC/O
a b c d ER2
3 8032.5 -23324.5 25353.8 -12227.7 2208.1 0.998399
4 -1836.6 4986.4 -5088.7 2315.1 -396.1 0.998511
5 36355.3 -103894.8 111272.0 -52933.1 9437.4 0.998071Dry
Gas
6 50064.9 -143504.2 154167.4 -73570.2 13159.0 0.998069
3 497657.0 -1387376.2 1450428.1 -673914.2 117414.7 0.998415
4 895500.4 -2529810.3 2679981.2 -1261745.0 222748.6 0.999106
5 327554.0 -909836.7 947476.2 -438384.1 76037.1 0.990566LPG
6 488855.0 -1369171.0 1437901.8 -671064.0 117428.2 0.998186
3 1300189.5 -3659337.3 3862189.9 -1811632.9 318655.0 0.999121
4 759066.1 -2138929.3 2260537.2 -1061889.0 187068.5 0.999298
5 -264961.8 768362.8 -834201.2 401988.9 -72555.6 0.992598Gas
olin
e
6 717939.2 -2020146.7 2131821.9 -999873.8 175862.0 0.994833
3 -299775.8 842040.3 -886843.0 415075.2 -72842.3 0.997304
4 -167481.7 468018.8 -490432.4 228405.0 -39888.6 0.999102
5 -331303.8 933779.8 -986835.3 463462.3 -81613.5 0.998517Cok
e
6 -329345.8 929023.8 -982673.5 461941.1 -81426.5 0.998398
3 1095803.3 -3062145.9 3209040.2 -1494648.8 261049.0 0.998977
4 1118324.0 -3150341.8 3328252.0 -1562779.6 275172.5 0.999667
5 294698.1 -828822.8 875071.1 -410948.4 72422.3 0.999853
Con
vers
ion
6 794368.4 -2225060.8 2337213.8 -1091030.4 190970.1 0.997836
Then the sum of conversions obtained for each product at selected severities is compared to overall conversion calculated from its corresponding equation and also, to the experimental conversion values. These data are reported in Table 9.
8 International Journal of Chemical Reactor Engineering Vol. 1 [2003], Article A46
http://www.bepress.com/ijcre/vol1/A46
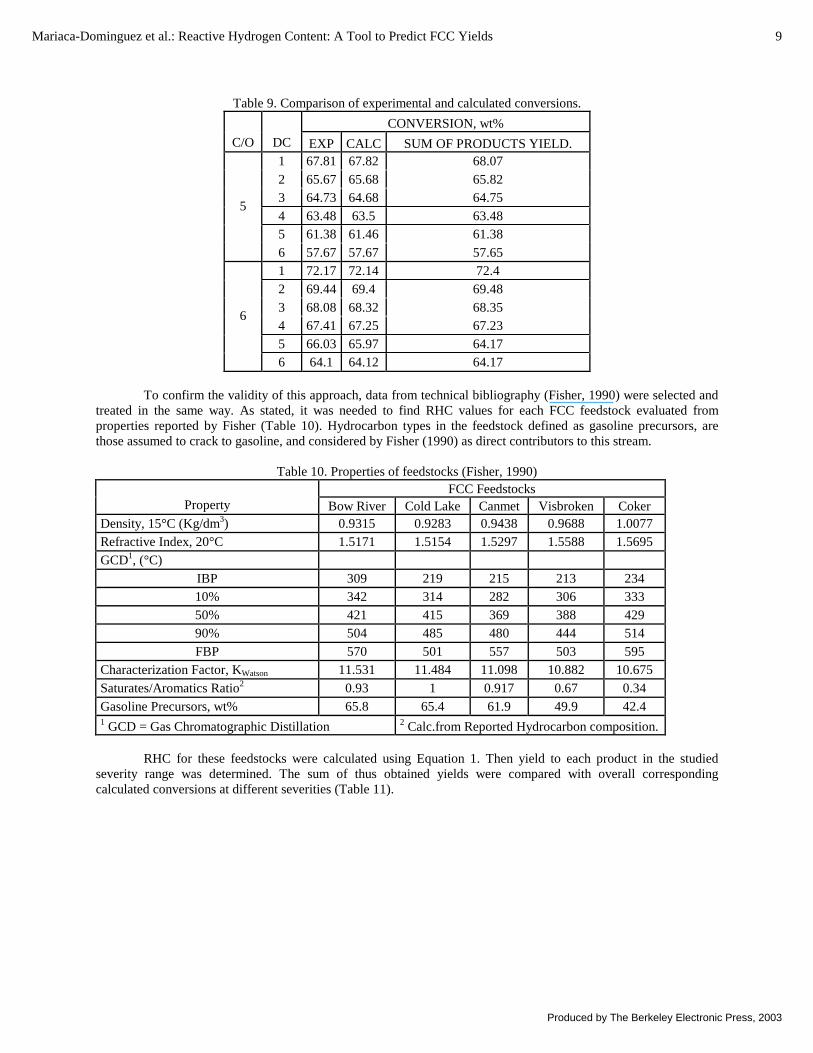
Table 9. Comparison of experimental and calculated conversions.
CONVERSION, wt%
C/O DC EXP CALC SUM OF PRODUCTS YIELD. 1 67.81 67.82 68.072 65.67 65.68 65.823 64.73 64.68 64.754 63.48 63.5 63.485 61.38 61.46 61.38
5
6 57.67 57.67 57.651 72.17 72.14 72.42 69.44 69.4 69.483 68.08 68.32 68.354 67.41 67.25 67.235 66.03 65.97 64.17
6
6 64.1 64.12 64.17
To confirm the validity of this approach, data from technical bibliography (Fisher, 1990) were selected and treated in the same way. As stated, it was needed to find RHC values for each FCC feedstock evaluated from properties reported by Fisher (Table 10). Hydrocarbon types in the feedstock defined as gasoline precursors, are those assumed to crack to gasoline, and considered by Fisher (1990) as direct contributors to this stream.
Table 10. Properties of feedstocks (Fisher, 1990)FCC Feedstocks
Property Bow River Cold Lake Canmet Visbroken CokerDensity, 15°C (Kg/dm3) 0.9315 0.9283 0.9438 0.9688 1.0077Refractive Index, 20°C 1.5171 1.5154 1.5297 1.5588 1.5695GCD1, (°C)
IBP 309 219 215 213 23410% 342 314 282 306 33350% 421 415 369 388 42990% 504 485 480 444 514FBP 570 501 557 503 595
Characterization Factor, KWatson 11.531 11.484 11.098 10.882 10.675Saturates/Aromatics Ratio2 0.93 1 0.917 0.67 0.34Gasoline Precursors, wt% 65.8 65.4 61.9 49.9 42.41 GCD = Gas Chromatographic Distillation 2 Calc.from Reported Hydrocarbon composition.
RHC for these feedstocks were calculated using Equation 1. Then yield to each product in the studied severity range was determined. The sum of thus obtained yields were compared with overall corresponding calculated conversions at different severities (Table 11).
9Mariaca-Dominguez et al.: Reactive Hydrogen Content: A Tool to Predict FCC Yields
Produced by The Berkeley Electronic Press, 2003
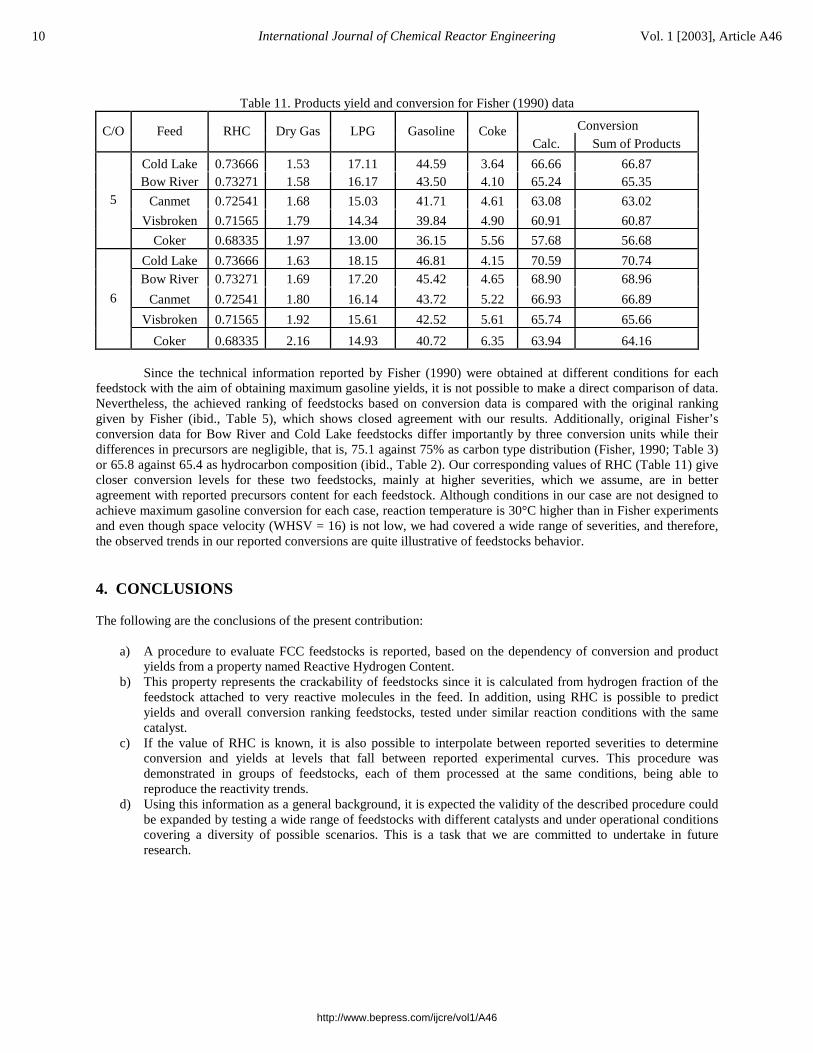
Table 11. Products yield and conversion for Fisher (1990) data
ConversionC/O Feed RHC Dry Gas LPG Gasoline CokeCalc. Sum of Products
Cold Lake 0.73666 1.53 17.11 44.59 3.64 66.66 66.87Bow River 0.73271 1.58 16.17 43.50 4.10 65.24 65.35
Canmet 0.72541 1.68 15.03 41.71 4.61 63.08 63.02
Visbroken 0.71565 1.79 14.34 39.84 4.90 60.91 60.87
5
Coker 0.68335 1.97 13.00 36.15 5.56 57.68 56.68
Cold Lake 0.73666 1.63 18.15 46.81 4.15 70.59 70.74Bow River 0.73271 1.69 17.20 45.42 4.65 68.90 68.96
Canmet 0.72541 1.80 16.14 43.72 5.22 66.93 66.89
Visbroken 0.71565 1.92 15.61 42.52 5.61 65.74 65.66
6
Coker 0.68335 2.16 14.93 40.72 6.35 63.94 64.16
Since the technical information reported by Fisher (1990) were obtained at different conditions for each feedstock with the aim of obtaining maximum gasoline yields, it is not possible to make a direct comparison of data. Nevertheless, the achieved ranking of feedstocks based on conversion data is compared with the original ranking given by Fisher (ibid., Table 5), which shows closed agreement with our results. Additionally, original Fisher’s conversion data for Bow River and Cold Lake feedstocks differ importantly by three conversion units while their differences in precursors are negligible, that is, 75.1 against 75% as carbon type distribution (Fisher, 1990; Table 3) or 65.8 against 65.4 as hydrocarbon composition (ibid., Table 2). Our corresponding values of RHC (Table 11) give closer conversion levels for these two feedstocks, mainly at higher severities, which we assume, are in better agreement with reported precursors content for each feedstock. Although conditions in our case are not designed to achieve maximum gasoline conversion for each case, reaction temperature is 30°C higher than in Fisher experiments and even though space velocity (WHSV = 16) is not low, we had covered a wide range of severities, and therefore, the observed trends in our reported conversions are quite illustrative of feedstocks behavior.
4. CONCLUSIONS
The following are the conclusions of the present contribution:
a) A procedure to evaluate FCC feedstocks is reported, based on the dependency of conversion and product yields from a property named Reactive Hydrogen Content.
b) This property represents the crackability of feedstocks since it is calculated from hydrogen fraction of the feedstock attached to very reactive molecules in the feed. In addition, using RHC is possible to predict yields and overall conversion ranking feedstocks, tested under similar reaction conditions with the same catalyst.
c) If the value of RHC is known, it is also possible to interpolate between reported severities to determine conversion and yields at levels that fall between reported experimental curves. This procedure was demonstrated in groups of feedstocks, each of them processed at the same conditions, being able to reproduce the reactivity trends.
d) Using this information as a general background, it is expected the validity of the described procedure could be expanded by testing a wide range of feedstocks with different catalysts and under operational conditions covering a diversity of possible scenarios. This is a task that we are committed to undertake in future research.
10 International Journal of Chemical Reactor Engineering Vol. 1 [2003], Article A46
http://www.bepress.com/ijcre/vol1/A46
ACKNOWLEDGEMENTS
Authors greatly appreciate the financial support given by Project TCM-4 from Research Program “Tratamiento de Crudo Maya” of the Instituto Mexicano del Petróleo.
REFERENCES
Abbot, J., Dunstan, P. R., “Catalytic Cracking of Linear Paraffins. Effects of Chain Length”, Ind. Eng. Chem. Res.,Vol. 36, 76-82 (1997).
Al-Enezi, G., Fawzi, N., Elkamel, A., “Development of Regression Models to Control Product Yields and Properties of the Fluid Catalytic Cracking Process”, Pet.. Sci. Tech., Vol. 17, 535-552 (1999).
Christensen, G., Apelian, M. R., Hickey, K. J., Jaffe, S. B., “Future Directions in Modelling of the FCC Process: An Emphasis on Product Quality”, Chem. Eng. Sci., Vol. 54, 2753-2764 (1999).
Dewachtere, N. V., Santaella, F., Froment, G. F., “Application of a Single-Event Kinetic Model in the Simulation of an Industrial Riser Reactor for the Catalytic Cracking of Vacuum Gas Oil”, Chem. Eng. Sci., Vol. 54, 3653-3660 (1999).
Fisher, I. P., “Effect of Feedstock Variability on Catalytic Cracking Yields”, Appl. Catal., Vol. 65, 189-210 (1990).
Jacob, S. M., Gross, B., Voltz, S. E., Weekman, V. W., “A Lumping and Reaction Scheme for Catalytic Cracking”, AIChE J., Vol. 22, 701-703 (1976).
Lappas, A. A., Patiaka, D. T., Dimitriadis, B. D., Vasalos, I. A., “Separation, Characterization and Catalytic Cracking Kinetics of Aromatic Fractions Obtained from FCC Feedstocks”, Appl. Catal. A, Vol. 152, 7-26 (1997).
Lappas, A. A., Iatriadis, D. K., Vasalos, I. A., “Product of Reformulated Gasolina in the FCC Unit. Effect of Feedstock Type on Gasoline Composition”, Catal. Today, Vol. 50, 73-85 (1999).
Liguras, D. K., Allen, D. T., “Structural Models for Catalytic Cracking. 2. Reactions of Simulated Oil Mixtures”, Ind. Eng. Chem. Res., Vol. 28, 674-683 (1989).
Mariaca, D. E., Maya, Y. R., Rodríguez, S. S., González, O. A., Martínez, T. G., Álvarez, R. R., López, F. C., “Reactivity of Fluid Catalytic Cracking Feedstocks as a Function of Reactive Hydrogen Content”. Pet. Sci. and Tech., 2003 (in press).
Pekediz, A., Kraemer, D., Blasetti, A., De Lasa, H., “Heats of Catalytic Cracking. Determination in a Riser Simulator”, Ind. Eng. Chem. Res., Vol. 39, 4516-4522 (1997).
Pitault, I., Nevicato, D., Frossier, M., Bernard, J. R., “Kinetic Model Based on a Molecular Description for Catalytic Cracking of Vacuum Gas Oil”, Chem. Eng. Sci., Vol. 49, 4249-4262 (1994).
Qian, K., Peru, D. A., Petti, T. F., Zhao, X., Yaluris, G., Harding, R. H., Cheng, W., Rajagopalan, K., “Characterization and Classification of Gas oil by Mass Spectrometry/ Chemometrics for Application in Fluid Catalytic Cracking”, 215th National Meeting of the American Chemical Society, Dallas, TX, March 29-April 3(1998).
Quann, R. J., Jaffe, S. B., “Building Useful Models of Complex Reaction Systems in Petroleum Refining”, Chem. Eng. Sci., Vol. 51, 1615-1635 (1996).
Sungungun, M. M., Kolesnikov, I. M., Vinogradov, V. M., Kolesnikov, S. I., “Kinetic Modeling of FCC Process”, Catal. Today, Vol. 3, 315-325 (1984).
11Mariaca-Dominguez et al.: Reactive Hydrogen Content: A Tool to Predict FCC Yields
Produced by The Berkeley Electronic Press, 2003

Venuto, P., Habib, E., “Catalyst-Feedstock-Engineering Interactions in Fluid Catalytic Cracking”, Cat. Rev. Sci. Eng., Vol. 18, 1-50 (1978).
Speight, J. G., “The Chemistry and Technology of Petroleum”, Marcel Dekker, New York, (1999).
12 International Journal of Chemical Reactor Engineering Vol. 1 [2003], Article A46
http://www.bepress.com/ijcre/vol1/A46
Related Documents