SARAS S.p.A. Platts 5th Annual Refining Conference 1 Platts 5 th Annual European Refining Markets Conference – 27 th Sep 2011 Dario Scaffardi – General Manager, Saras S.p.A. Reacting to structural changes in the EU refining industry

Welcome message from author
This document is posted to help you gain knowledge. Please leave a comment to let me know what you think about it! Share it to your friends and learn new things together.
Transcript
SARAS S.p.A. Platts 5th Annual Refining Conference 1
Platts 5th Annual European Refining Markets Conference – 27th Sep 2011Dario Scaffardi – General Manager, Saras S.p.A.
Reacting to structural changes in
the EU refining industry
SARAS S.p.A. Platts 5th Annual Refining Conference 2
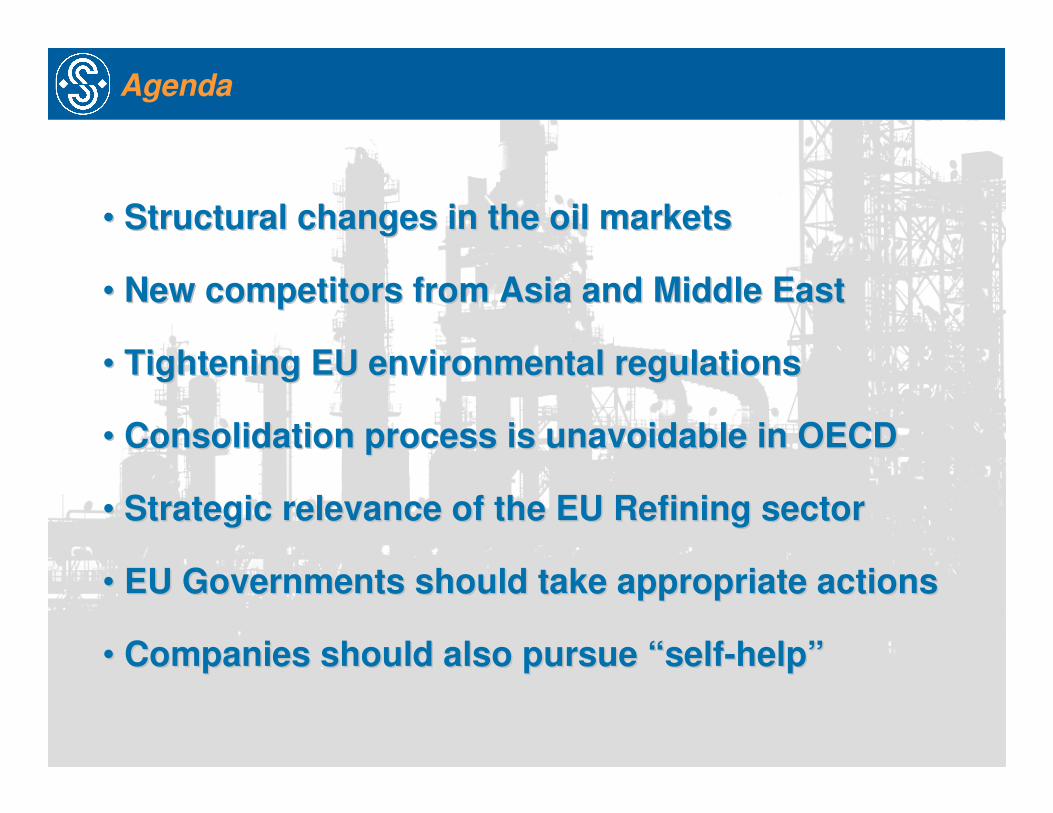
•• Structural changes in the oil marketsStructural changes in the oil markets
•• New competitors from Asia and Middle EastNew competitors from Asia and Middle East
•• Tightening EU environmental regulations Tightening EU environmental regulations
•• Consolidation process is unavoidable in OECDConsolidation process is unavoidable in OECD
•• Strategic relevanceStrategic relevance of the EU Refining sectorof the EU Refining sector
•• EU Governments should take appropriate actionsEU Governments should take appropriate actions
•• Companies should also pursue Companies should also pursue ““selfself--helphelp””
Agenda
SARAS S.p.A. Platts 5th Annual Refining Conference 3
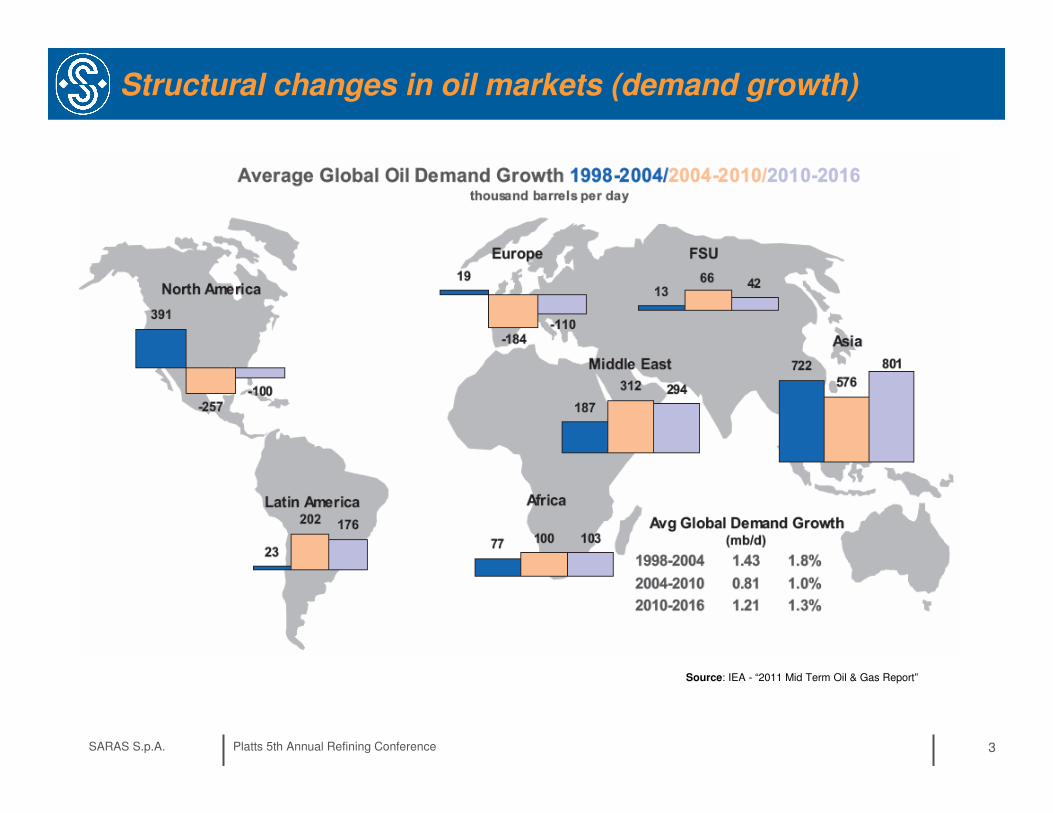
Structural changes in oil markets (demand growth)
Source: IEA - “2011 Mid Term Oil & Gas Report”

SARAS S.p.A. Platts 5th Annual Refining Conference 4
Incentives for new refineries in Asia & Middle East
-0.5
0.0
0.5
1.0
1.5
2.0
2.5
3.0
3.5
4.0
Asia Pacific Middle East North America Latin America Greater Europe FSU Sub-Saharan
Africa
Ad
dit
ion
al
CD
U C
ap
ac
ity
, M
bd
.
.
New Expansion
Additional Refinery
Capacity ('11-'15), kbd
New Expansion Total
Asia Pacific 2,572 1,028 3,600
Middle East 1,120 256 1,376
North America - 422 422
Latin America 651 252 903
Greater Europe - -163 -163
FSU 140 472 612
Sub-Saharan Africa 46 24 70
Total 4,529 2,290 6,819
Source: Wood Mackenzie
SARAS S.p.A. Platts 5th Annual Refining Conference 5
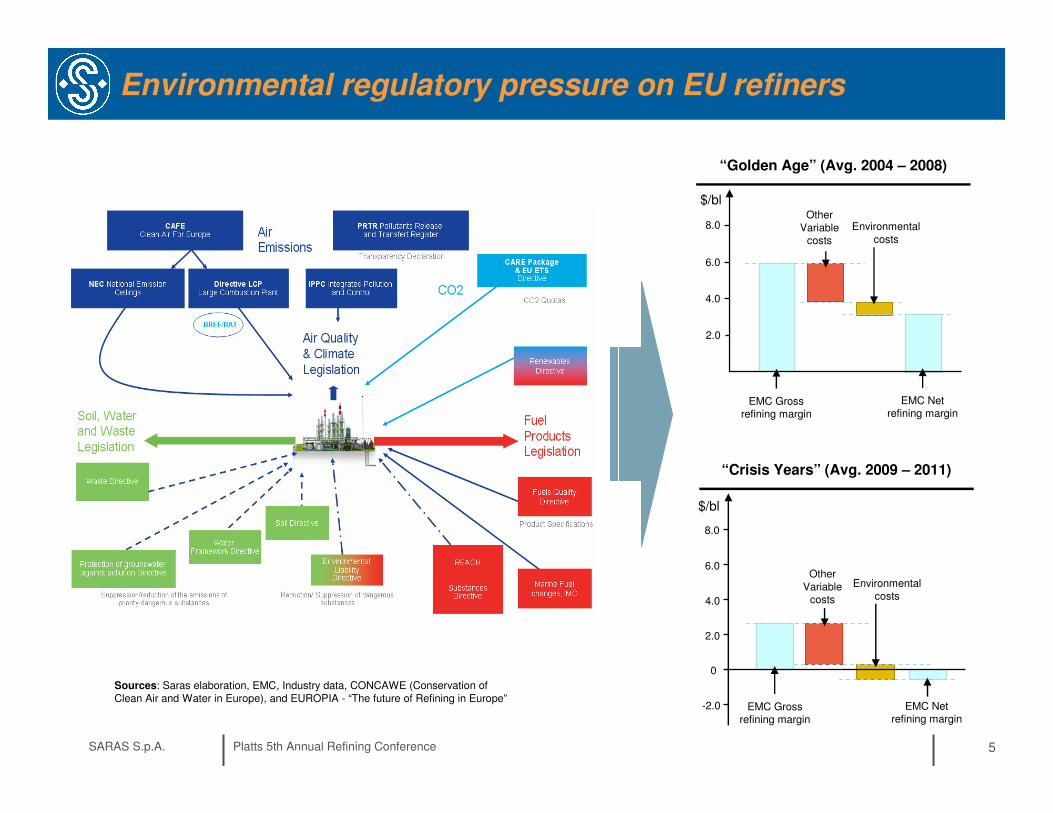
Environmental regulatory pressure on EU refiners
Sources: Saras elaboration, EMC, Industry data, CONCAWE (Conservation of Clean Air and Water in Europe), and EUROPIA - “The future of Refining in Europe”
$/bl
2.0
6.0
4.0
8.0
EMC Gross refining margin
Other Variable
costs
EMC Net refining margin
Environmental costs
“Golden Age” (Avg. 2004 – 2008)
$/bl
0
-2.0
2.0
6.0
4.0
8.0
EMC Gross refining margin
EMC Net refining margin
Other Variable
costs
Environmental costs
“Crisis Years” (Avg. 2009 – 2011)
SARAS S.p.A. Platts 5th Annual Refining Conference 6
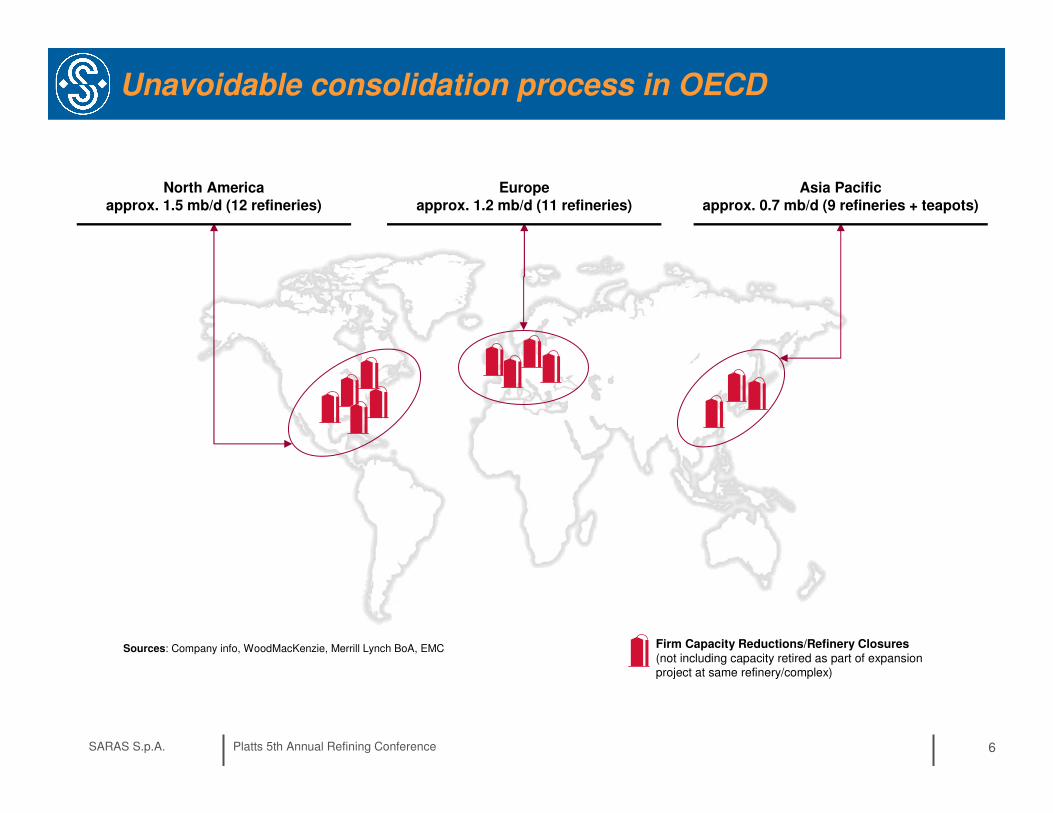
Unavoidable consolidation process in OECD
Sources: Company info, WoodMacKenzie, Merrill Lynch BoA, EMC
North America
approx. 1.5 mb/d (12 refineries)
Europe
approx. 1.2 mb/d (11 refineries)
Asia Pacific
approx. 0.7 mb/d (9 refineries + teapots)
Firm Capacity Reductions/Refinery Closures(not including capacity retired as part of expansion project at same refinery/complex)
SARAS S.p.A. Platts 5th Annual Refining Conference 7
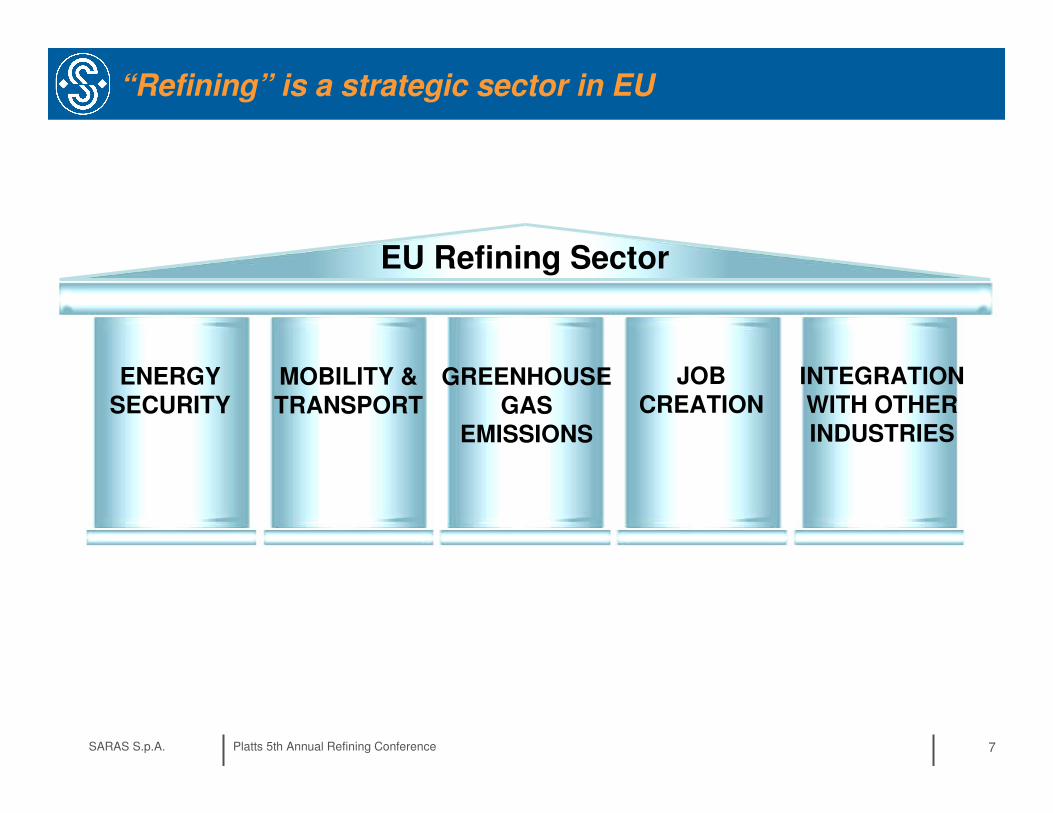
“Refining” is a strategic sector in EU
ENERGY
SECURITY
EU Refining Sector
MOBILITY &
TRANSPORTGREENHOUSE
GAS EMISSIONS
JOB
CREATIONINTEGRATION
WITH OTHER INDUSTRIES
SARAS S.p.A. Platts 5th Annual Refining Conference 8
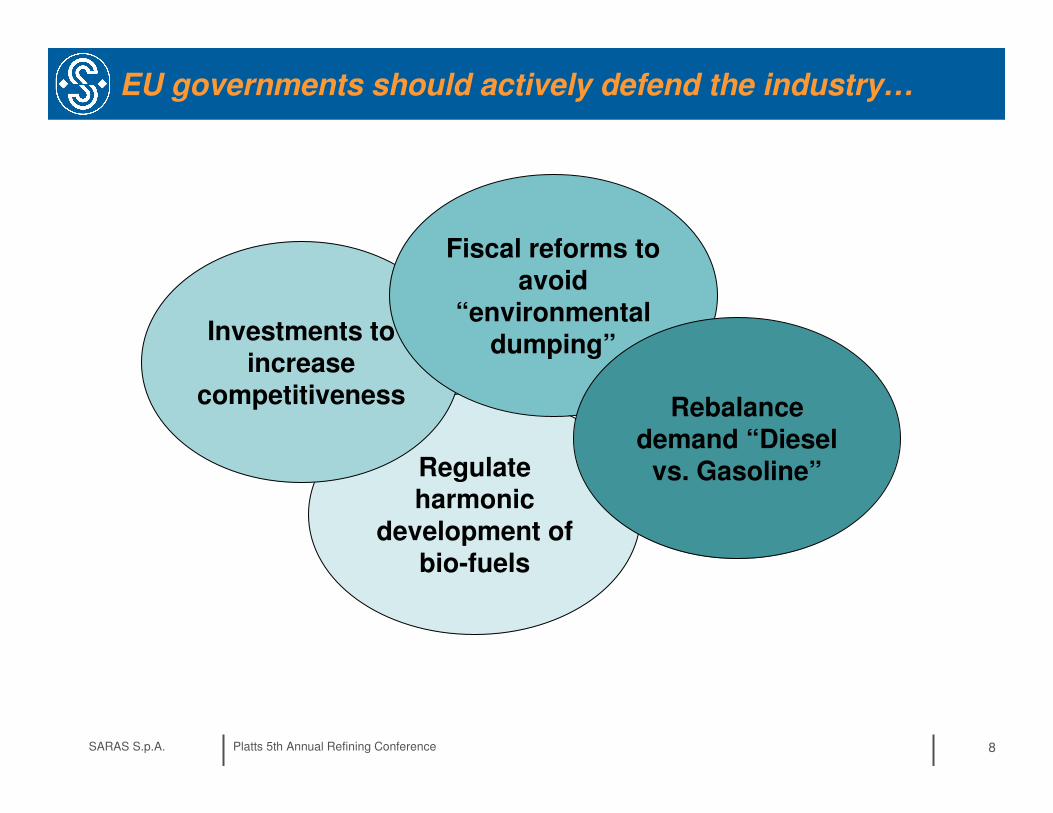
EU governments should actively defend the industry…
Regulate harmonic
development of bio-fuels
Investments to increase
competitiveness
Fiscal reforms to avoid
“environmental dumping”
Rebalance demand “Diesel
vs. Gasoline”
SARAS S.p.A. Platts 5th Annual Refining Conference 9SARAS S.p.A. 9
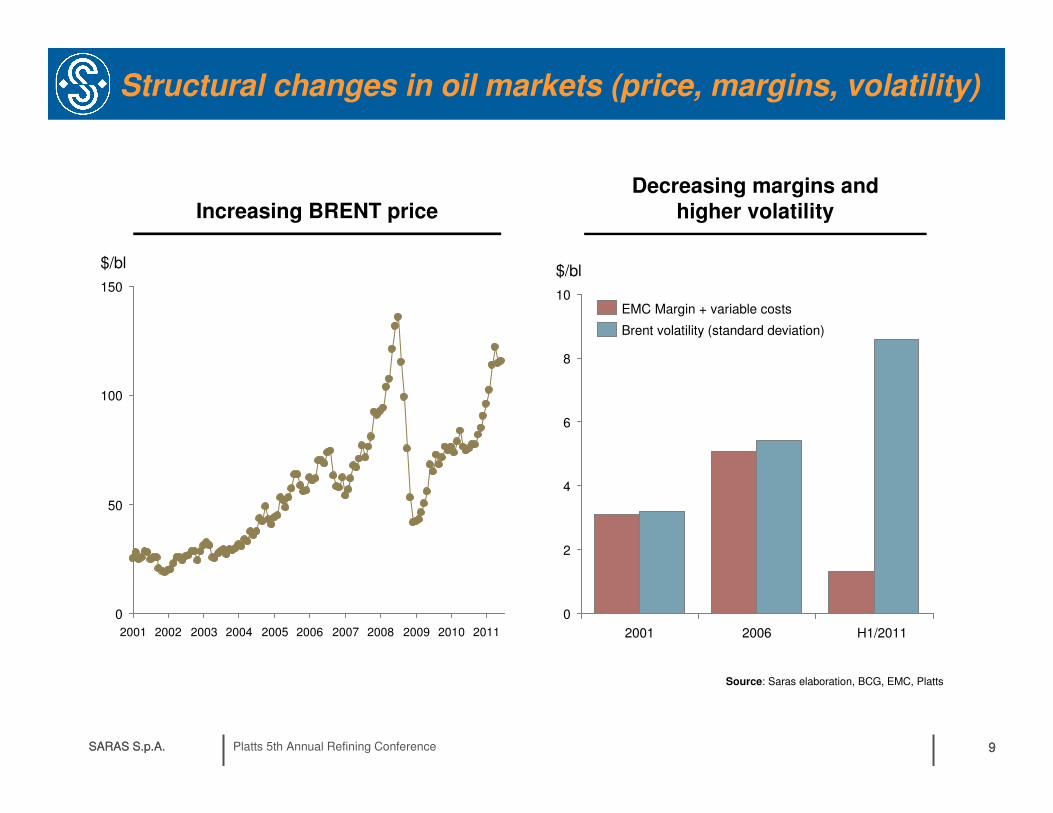
Structural changes in oil markets (price, margins, volatility)
Source: Saras elaboration, BCG, EMC, Platts
20052004200320022001
50
0
2006 20112010200920082007
$/bl
150
100
10
8
6
4
2
0
H1/201120062001
$/bl
Brent volatility (standard deviation)
EMC Margin + variable costs
Increasing BRENT priceDecreasing margins and
higher volatility
SARAS S.p.A. Platts 5th Annual Refining Conference 10
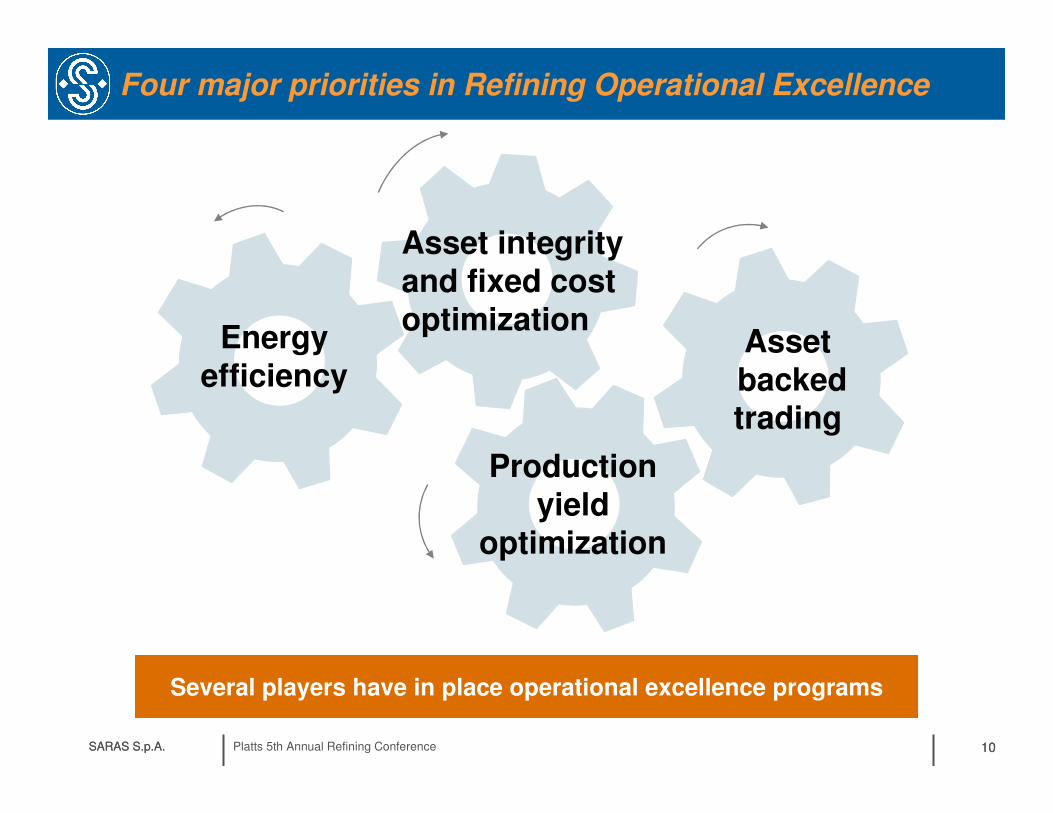
Four major priorities in Refining Operational Excellence
SARAS S.p.A. 10
Asset integrity and fixed cost optimization
Energy efficiency
Assetbacked trading
Production yield
optimization
Several players have in place operational excellence programs
SARAS S.p.A. Platts 5th Annual Refining Conference 11
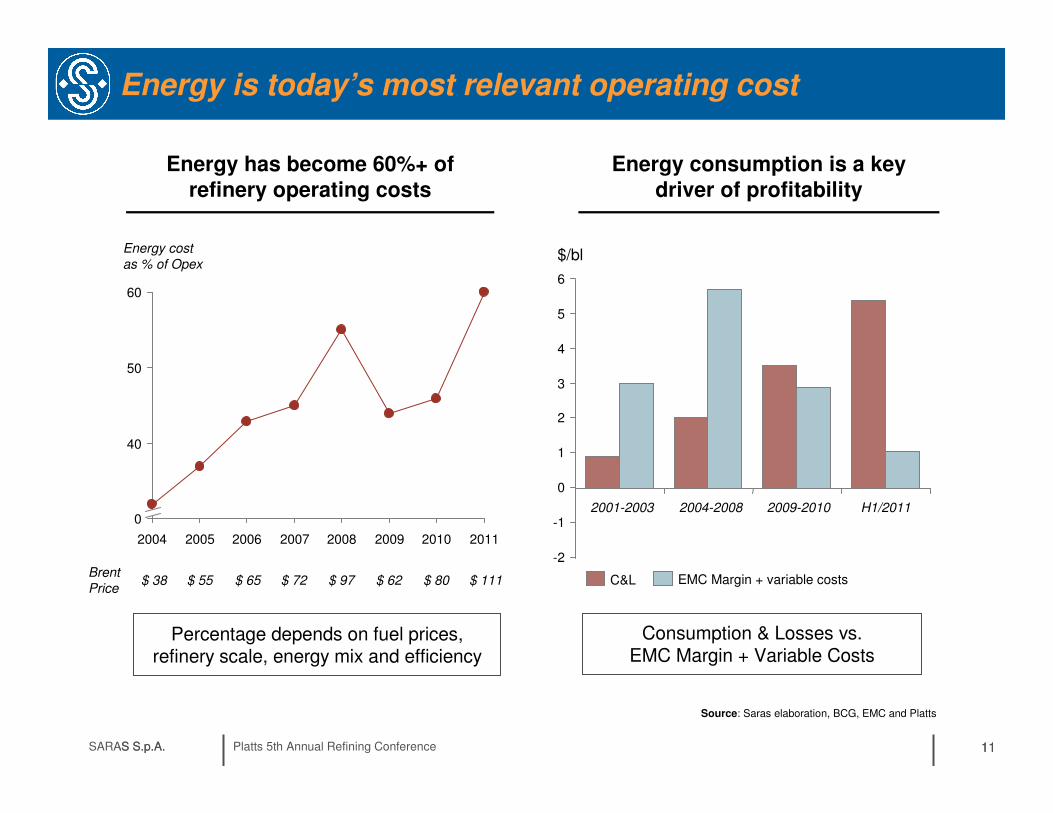
Energy is today’s most relevant operating cost
11
Energy has become 60%+ of
refinery operating costs
Percentage depends on fuel prices, refinery scale, energy mix and efficiency
60
50
40
0
2010200920082007200620052004
Energy costas % of Opex
$ 38 $ 55 $ 65 $ 72 $ 97 $ 62 $ 80BrentPrice
Energy consumption is a key
driver of profitability
11
Source: Saras elaboration, BCG, EMC and Platts
$ 111
$/bl
6
5
4
3
2
1
-2
EMC Margin + variable costsC&L
Consumption & Losses vs. EMC Margin + Variable Costs
SARAS S.p.A.
2011
0
-12001-2003 2004-2008 2009-2010 H1/2011
SARAS S.p.A. Platts 5th Annual Refining Conference 12
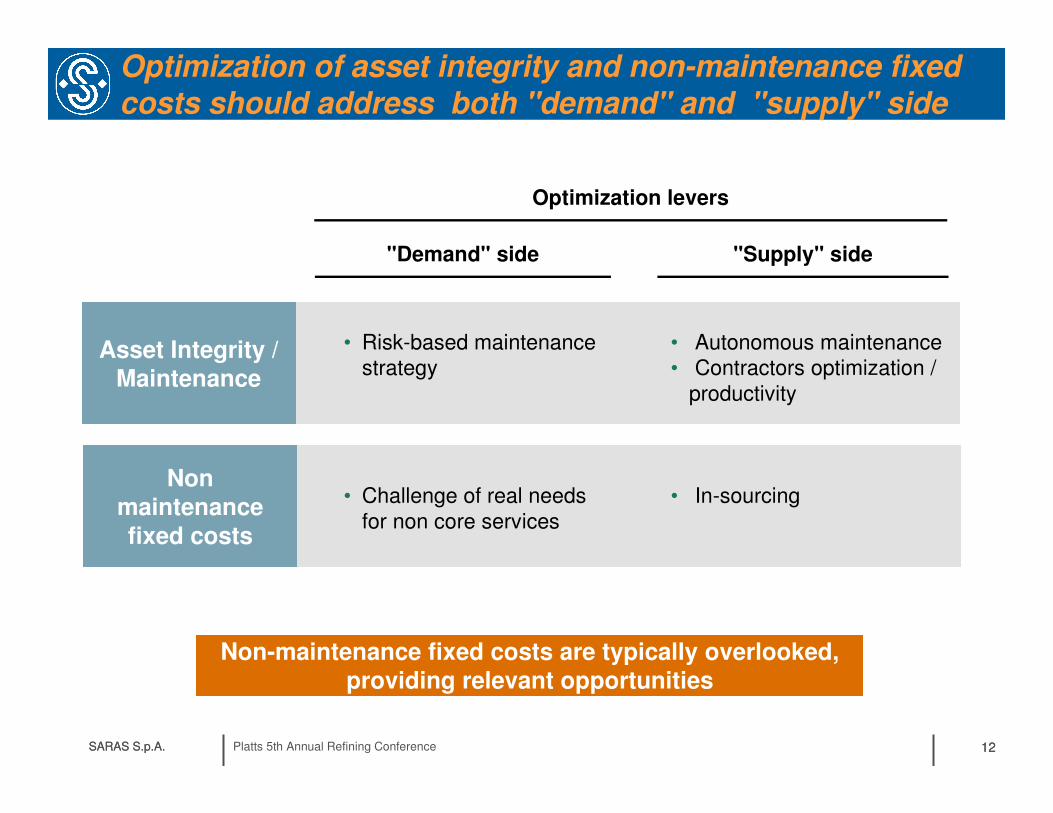
Optimization of asset integrity and non-maintenance fixed costs should address both "demand" and "supply" side
SARAS S.p.A. 12
Non-maintenance fixed costs are typically overlooked, providing relevant opportunities
"Demand" side "Supply" side
Optimization levers
• Autonomous maintenance• Contractors optimization /
productivity
• Risk-based maintenance strategy
• Challenge of real needs for non core services
• In-sourcing
Asset Integrity /
Maintenance
Non
maintenance
fixed costs

SARAS S.p.A. Platts 5th Annual Refining Conference 13
• Margin optimization of the whole supply chain
– Higher integration among Supply& Trading and Refinery Operations
• Exploit market volatility ...
• ... while hedging risk through refinery assets and flexibility
Asset backed trading to exploit volatility while hedging risk
SARAS S.p.A. 13
Leverage crude differentials
Proactive inventory management
• E.g. contango/ backwardation
Typical levers for asset backed trading
Dynamic forward trading
Complex refineries can fully enhance asset backed trading
Related Documents