CONESTOGA-ROVERS & ASSOCIATES 8615 W. Bryn Mawr Avenue, Chicago, Illinois 60631-3501 Telephone: 773-380-9933 Facsimile: 773-380-6421 www.CRAworld.com September 29, 2006 Reference No. 018925-10 401 SSI 38 Mr. Robert Weber Superfund Division U.S. Environmental Protection Agency 901 N. 5 lh Street Kansas City, Kansas U.S.A. 66101 SIIPFKKUM) UKC.OKDS RECEIVED OCT 0 ?. 2006 SUFERFUND DIVISION Dear Rob: Re: Response to U.S. EPA's July 2006 Comments Remedial Investigation Report Parkview Well Site Northern Study Area Grand Island, Nebraska The following discussion outlines Conestoga-Rovers & Associates' (CRA's) response, on behalf of CNH America LLC (CNH), to U.S. EPA's Conditional Approval Letter dated July 20, 2006. Specifically, this letter responds to U.S. EPA's detailed RI report review comments and provides further explanation of any amendments made to the revised report which is submitted to U.S. EPA Region VII and the Nebraska Department of Environmental Quality (NDEQ) with this letter. For ease of your review, we have reiterated herein each of the comments received and provided our response immediately thereafter. Further details on each response should be fully self-explanatory by the following. REMEDIAL INVESTIGATION REPORT, PARKVIEW WELL SITE - NORTHERN STUDY AREA General Comments 1. USEPA Comment ~~~f*fyir s-frr • ••-j-.- -.rr •. «. t * • »<- : , . ^Vw. .•».--_*L»t-' In general, CNH has adequately addressed our previous comments pertaining to the Remedial Investigation (RI) Report. However, there are still some remaining issues that we believe should be addressed, but should not affect the fundamental conclusions of the report that 1) the Northern Study Area Plume does not exceed MCLs east of the EOUAL EMF'LOYMENTl H'll'KTLN'ITV EMI'IX >YEK ISO 9001 Worldwide Engineering, Environmental, Construction, and IT Services

Welcome message from author
This document is posted to help you gain knowledge. Please leave a comment to let me know what you think about it! Share it to your friends and learn new things together.
Transcript
CONESTOGA-ROVERS& ASSOCIATES
8615 W. Bryn Mawr Avenue, Chicago, Illinois 60631-3501Telephone: 773-380-9933 Facsimile: 773-380-6421www.CRAworld.com
September 29, 2006 Reference No. 018925-10
401 SSI 38
Mr. Robert WeberSuperfund DivisionU.S. Environmental Protection Agency901 N. 5lh StreetKansas City, KansasU.S.A. 66101
S I I P F K K U M ) UKC.OKDS
RECEIVED
OCT 0 ?. 2006
SUFERFUND DIVISION
Dear Rob:
Re: Response to U.S. EPA's July 2006 CommentsRemedial Investigation ReportParkview Well SiteNorthern Study AreaGrand Island, Nebraska
The following discussion outlines Conestoga-Rovers & Associates' (CRA's) response, on behalfof CNH America LLC (CNH), to U.S. EPA's Conditional Approval Letter dated July 20, 2006.Specifically, this letter responds to U.S. EPA's detailed RI report review comments and providesfurther explanation of any amendments made to the revised report which is submitted toU.S. EPA Region VII and the Nebraska Department of Environmental Quality (NDEQ) with thisletter. For ease of your review, we have reiterated herein each of the comments received andprovided our response immediately thereafter. Further details on each response should be ful lyself-explanatory by the following.
REMEDIAL INVESTIGATION REPORT,PARKVIEW WELL SITE - NORTHERN STUDY AREA
General Comments
1. USEPA Comment ~~~f*fyir s-frr •••-j-.- - .rr •. «. t * • »<- : , . ^Vw. .•».--_*L»t-'
In general, CNH has adequately addressed our previous comments pertaining to theRemedial Investigation (RI) Report. However, there are still some remaining issues thatwe believe should be addressed, but should not affect the fundamental conclusions ofthe report that 1) the Northern Study Area Plume does not exceed MCLs east of the
EOUAL EMF'LOYMENTl H'll'KTLN'ITV EMI'IX >YEK
ISO 9001
Worldwide Engineering, Environmental, Construction, and IT Services

CONESTOGA-ROVERS& ASSOCIATES
September 29, 2006 Reference No. 018925-10- 2 -
CNH property and 2) that the Southern Plume and Parkview Area show MCLexceedances.
It is noted that several sections in the RJ Report and associated Risk Assessment textconclude that 1) the CNH/Northern Study Area Plume has not contributed to the MCLexceedances in the Parkview area, 2) nor has the CNH/Northem Study Area Plumecontributed to the impact of potable water wells in this area and, 3) that thecontamination in the Parkview area is solely and entirely related to the Southern Plume.However, uncertainty with the data was not mentioned in these sections.
Therefore, the discussion should reflect the uncertainty in the data rather thanextrapolating absolute conclusions. It is uncertain whether or not the contaminationfrom the CNH facility has historically contributed to any impacts observed in potablewater supply wells or contributed to any of the MCL exceedances in the Parkview area.Based on the most recently available data, the conclusion that can be currently drawn isthat the Northern Study Area Plume located east of the CNH facility extends toward theParkview Area and does not show MCL exceedances. EPA acknowledges that the datapoints east of Brenrwood Lake reach PQLs, which adds a level of uncertainty. TheSouthern Plume extends toward and into the Parkview subdivision and containscontaminants above the MCL. Groundwater data suggest that flow occurs from theCNH facility towards the Parkview area. Groundwater data also suggest that flowoccurs from the Southern Plume towards the Parkview area.
The data presented in the report are of sufficient quantity and quality to show that withrespect to the most current data, the Northern Plume does not exceed MCLs east of theCNH property. This area is not currently being considered for future remedial actions.However, uncertainties will need to be included in the discussion. Specific commentsare provided below.
CRA Response
Please see the responses to the Specific Comments, below, with regard to datauncertainties.
Worldwide Engineering, Environmental, Construction, and IT Services
CONESTOGA-ROVERS& ASSOCIATES
September 29, 2006 Reference No. 018925-10-3 -
Specific Comments
1. USEPA Comment - Page i. Executive Summary, First Paragraph.
Comment la)
It is stated that "The Northern Plume's Source, the former burn and burial areas, locatedon the CNH property, have been effectively eliminated (to less than U.S. EPA Region IXPRGs and the CVOCs in groundwater are at a steady state condition".
The above sentence should be revised as follows: "The Northern Plume's Source, theformer burn and burial areas, located on the CNH property, have been effectivelyreduced to less than EPA Region IX PRGs and the CVOCs in groundwater are at asteady state condition".
CRA Response
The report has been revised as requested.
Comment Ib)
It is stated that "On the basis of currently available data, the Northern Plume neitherreaches potable water wells in the Northern Study area above MCLs, nor does it appearto contribute to MCL exceedences observed in the Parkview Area."
The above sentence should be revised as follows: " On the basis of currently availabledata, the Northern Plume does not reach potable water wells in the Northern Study areaabove MCLs".
CRA Response
As indicated by the comment, the report puts forward the position that the NorthernPlume does not appear to contribute to MCL exceedances observed in the ParkviewArea. This is based on the following facts: 1) the differences in flow pathways for theNorthern and Southern plumes, and 2) simple principles of chemical mixing, i.e., themixing of two chemical solutions, one of a lower concentration and the other of a higherconcentration, can only result in an intermediate concentration; therefore, if the solutionof higher concentration is at the MCL, mixing with the other solution will always resultin a concentration below, not above, the MCL. Thus the existing statement that the
Worldwide Engineering, Environmental, Construction, and IT Services

CONESTOGA-ROVERS& ASSOCIATES
September 29, 2006 Reference No. 018925-10- 4 -
Northern Plume does not "appear to contribute to MCL exceedances observed in theParkview area" is based on these foregoing facts. However, the report has been revisedas requested.
2. USEPA Comment - Page i. Executive Summary, Second Paragraph.
The second paragraph should be revised as follows: "Based on the most recentU.S. EPA-generated data, the source of the Southern Plume appears to be in the vicinityof Husker Highway and Engleman Road to the southwest (up and cross-gradient) of theCNH property. The Southern Plume is declining at a much lower rate than theNorthern Plume; moreover it does not appear to have attained a steady state resulting inthe greatest current and potential future impact to the Parkview area. The excesslifetime "future" cancer risk to human health in the Parkview area is 1.7 x 10⁻⁴, of which95 percent of the risk is due to the presence of PCE. Ecological risks are negligiblewithin the Northern Study Area."
CRA Response
The report has been revised as requested.
3. USEPA Comment - Page 1 and 2, Section 1.0,Introduction, last sentence on page 1 continuing on to page 2
The sentence should be revised as follows: "The Supplemental Data Collection and thisRemedial Investigation were completed in accordance with the Remedial Action WorkPlan which was approved by the U.S. EPA on August 18, 2005."
CRA Response
The sentence has been revised as follows.
"The Supplemental Data Collection and this Remedial Investigation were completed inaccordance with the Remedial Investigation Work Plan which was approved by theU.S. EPA on August 18, 2005."
Worldwide Engineering, Environmental, Construction, and IT Services
CONESTOGA-ROVERS& ASSOCIATES
September 29, 2006 Reference No. 018925-10- 5 -
4. USEPA Comment - Page 24 and 25, Section 5.2.1,Background. Last sentence on page 24 continuing on to page 25.
The sentence should be revised as follows: "It is noted, however, that the Duck Pondwas eliminated as an AO1 on the basis of the characterization results produced by theOctober 2002 investigation under the NDEQ's RAPMA Program. "
CRA Response
The report has been revised as requested.
5. USEPA Comment - Page 35, Section 5.3.3.2, Summary of DemonstratedDeclines of CVOC Concentrations in the Northern Plume, Subsection (ii) .
Historical data do not exist to draw the conclusions that the source area has remained atthe same levels for decades. This subsection should be removed.
CRA Response
This statement was intended to point out the pattern of the concentrations versusdistance. The pattern of concentration versus distance provides an indication ofhistorical effects of source area releases since distance requires travel time (by thevelocity). Hence, in cases where concentration values demonstrate a continuingdecreasing pattern with distance, it is known that the source contributions togroundwater did not change appreciably over time. Therefore, examining the decliningtrend of concentrations is an important factual inference on historical concentrations.
The statement has been revised as follows.
"The absence of significant fluctuations in the plotted information for concentrationversus distance indicates there is rapid decline of CVOC concentrations in thegroundwater plume downgradient of the CNH property, and that the sourcecontributions to the groundwater which have caused the Northern Plume, have likelynot changed appreciably over rime."
Worldwide Engineering, Environmental, Construction, and IT Services
CONESTOGA-ROVERS& ASSOCIATES
September 29, 2006 Reference No. 018925-10- 6 -
6. USEPA Comment - Page 38 and 39, Section 5.3.3.5,Comparison of CVOC Degradation in the Northern and Southern Plumes.
Comment 6a)
Paragraph (ii) should be revised to also indicate that 1,1-DCA and 1,1-DCE were alsodetected at this location. The second sentence should be deleted.
CRA Response
As stated in the response to the comment which follows (U.S. EPA Comment #7), CRAmaintains that the data indicate that, while not on the centerline of the Southern Plume,the groundwater contamination at GP-02-(0803) is likely from the Southern Plume. Thereport has been revised to include your comments as follows.
(ii) GP-02-(0803), a monitoring location has parent products present (1,1,1-TCA from1 to 2 ug/L and PCE at 0.5 /.ig/L). Further, 1,1,1-TCA is present at four depthintervals at GP-02-(0803) indicating that parent products are widespread atGP-02-(0803). However no parent products are observed at GGW-556 andGGW-552. In addition 1,1-DCA was detected at a concentration of 0.5 ng/L and1,1-DCE was detected at a concentration of 1.7 j^g/L at this location, at the 57 to61 feet BGS interval.
Comment 6b)
The last two paragraphs of this section should be deleted.
CRA Response
The paragraphs referred to in the comment are reproduced below.
Since GP-02-(0803) has a ratio of 1.7/0.5 ug/L or 3.4, this is further evidence thatthe CVOCs present in the groundwater at GP-02-(0803) are occurring from lateraldispersion from the Southern Plume.
These findings indicate that the CVOCs at GP-02-(0803) came from the SouthernPlume, not the Northern Plume. These findings represent a further line of
Worldwide Engineering, Environmental, Construction, and IT Services
CONESTOGA-ROVERS& ASSOCIATES
September 29, 2006 Reference No. 018925-10- 7 -
evidence that the Northern Plume has not impacted the Stolley/Parkview area orthe Parkview No. 3 well.
CRA maintains that the ratio of chemical concentrations is a valuable tool which can beused to differentiate the Northern and Southern plumes. This methodology isreferenced in various technical papers and is widely used.
Examples of the use of ratios as part of forensic analyses are briefly described below:
(i) Feenstra (2006) stated "the examination of contaminant ratios is used commonlyin the investigation of subsurface environmental contamination to distinguishbetween different sources of contamination and to assess fate and transportprocesses." He also used as examples "two different sources of gasolinecontamination in groundwater may be distinguishable on the basis of theirdifferent ratios of oxygenates in the gasoline formulations" and "MTBE/TAMEratios in groundwater evaluation of sources".
(ii) Morrison and Murphy (2006) used ratios to age-date source releases and theyused ratio analyses for source identification.
(iii) An Environmental Forensics editorial (2005) used ratios between BTEXcompounds and looked to establish correlations and patterns of contamination.
Note that the tabular summary on page 39 has been revised to include the GP-02 (0803)data and the last two paragraphs of the section have been replaced with the following.
"As demonstrated by the tabular data, the ratio of 1,1-DCE to 1,1-DCA at GP-02 (0803) issignificantly greater than one, of a magnitude similar to the ratios for monitoringlocations in the Southern Plume, indicating that the CVOCs present in the groundwaterat GP-02 (0803) location may be related to lateral dispersion from the centerline of theSouthern Plume."
7. USEPA Comment - Page 41, Section 5.3.3.6,Lines of Evidence of Natural Attenuation in the Northern Plume.
The third sentence should be modified as follows: "One zone ends in the vicinity of theCNH eastern property boundary (to the east of the former burn and burial areas); thesecond zone continues into the vicinity of the Brentwood Gravel Pit Lake."
Worldwide Engineering, Environmental, Construction, and IT Services
CONESTOGA-ROVERS& ASSOCIATES
September 29, 2006 Reference No. 018925-10
CRA Response
As shown on Figures 5.3 through 5.14 of the Rl report, CVOC concentrations declinesignificantly Ln the direction of groundwater flow moving from the CNH propertytoward the Brentwood Lake Area. CRA maintains that the assessment regarding theterminus of the Northern Plume in the vicinity of the Brentwood Gravel Pit Lake iscorrect; however, the text has been revised as requested.
8. USEPA Comment - Page 42, Section 5.3.3.6,Lines of Evidence of Natural Attenuation in the Northern Plume.
The last paragraph on page 41 continuing on to page 42 (starting with "The reduction ofthe 1,1-DCA and 1,1-DCE...'), the second full paragraph on page 42 (starting with "Thereare no detections...'), and the second bulleted item on page 42 should be deleted.
CRA Response
The paragraphs referenced in the comment are reproduced below.
The reduction of the 1,1-DCA and 1,1-DCE concentrations versus distance aresimilar and consistent. Both 1,1-DCA and 1,1-DCE plumes demonstrate thetermination of the Northern Plume in the vicinity of Brentwood Lake. TheNorthern Plume of CVOCs, travels on the CNH property to the east and thencurves to the east-northeast, in relation to the groundwater contours (and as theSouthern Plume also does, as will be described below). The distal end of theNorthern Plume is reached in the vicinity of the Brentwood Gravel Pit Lakewhere very low and non-detect CVOC values have been recorded.
There are no detections of PCE in the downgradient region potentially associatedwith the Northern Plume east of the Brentwood Gravel Pit Lake (e.g., GGW-556).The absence of PCE in the Northern Plume is further evidence that the NorthernPlume did not cause the observed impact at the Parkview Well No. 3 productionwell or any residential wells in the Parkview/Stolley Park neighborhood.
• The Northern Plume is traveling to the east across the CNH property andeast-northeast beyond the CNH property and appears to reach its terminus inthe vicinity of the Brentwood Gravel Pit Lake.
Worldwide Engineering. Environmental, Construction, and IT Services
CONESTOGA-ROVERS& ASSOCIATES
September 29, 2006 Reference No. 018925-10- 9 -
CRA maintains that the above assessment is correct, however, the text has been revisedas requested.
9. USEPA Comment - Page 43 and 44, Section 5.3.5, Comparison of Plumes.
This section should be revised to reflect the uncertainties in the data, or the bulleteditems should be removed. 1,1,1-TCA, 1,1-DCA, 1,1-DCE, and PCE were each detected inGP-02(0803). The nearest sampling point, GGW-556, to the west of this location, shows adetection of 1,1-DCA and an estimated detection of 1,1-DCE. The nearest samplingpoint, CRA-VP-404, to the south of this location shows 1,1,1-TCA, 1,1-DCA, 1,1-DCE,and PCE. There is uncertainty associated with the conclusion that all CVOCs measuredat GP-02(0803) are the result of the Southern Plume. Regardless of this observation, theconcentrations observed east of the CNH facility are present at levels below the MCL. Itshould also be noted that the Southern Plume narrows as it approaches the Parkviewarea.
CRA Response
The comment points out the presence of 1,1,1-TCA, 1,1-DCA, 1,1-DCE, and PCE at bothGP-02 (0803) and CRA-VP-404, where the latter is south of GP-02 (0803). The textindicates the empirical data which link GP-02 (0803) to the Southern Plume. The typesand concentrations of CVOCs detected at GGW-556, to the west of GP-02 (0803)conversely indicate dissimilarities with both GP-02 (0803) and CRA-VP-404, as part ofthe Southern Plume. CRA maintains that the assessment presented in this section iscorrect; however, the text on page 44 has been revised as follows.
• "Parent species (1,1,1-TCA and PCE) are observed at GP-02(0803) whereas there areno parent species associated with the Northern Plume above PQL's withinapproximately 2,100 feet of GP-02(0803).
• The low levels of CVOCs at GP-02(0803) relative to the concentrations observed inthe central portion of the Southern Plume indicate that GP-02(0803) is located distalto the Southern Plume's core and is consistent with the east-northeast migrationpathway and by a classic concentration gradient of declining concentration trends,with increasing distance away from the centerline of the Southern Plume.
• There are significantly higher concentrations of CVOC daughter products atGP-02(0803) than at the eastern portion of the Northern Plume (near BrentwoodGravel Pit Lake).
Worldwide Engineering, Environmental, Construction, and IT Services

CONESTOGA-ROVERS& ASSOCIATES
September 29, 2006 Reference No. 018925-10-10-
• The ratios of 1,1-DCE to 1,1-DCA in the Northern Plume are considerably differentfrom those in the Southern Plume. The ratio of 1,1-DCE to 1,1-DCA at GP-02(0803) issimilar to observed ratios in the Southern Plume.
The data as outlined above indicate the groundwater conditions observed atGP-02(0803) are less consistent with the eastern portion of the Northern Plume, andmore consistent with the conditions observed in the Southern Plume."
10. USEPA Comment - Page 66, Section 8.0, Conclusions.Modifications to the conclusions section are presented below.
Comment 10 - Item 1
Item number 1 should be modified as follows: "The regional groundwater flowdirection is to the east and northeast."
CRA Response
This conclusion reads as follows.
"The regional groundwater flow direction within Grand Island is generally to theeast-northeast without any significant variations to the flow regime due to seasonalfluctuations or localized anthropogenic influences (e.g., irrigation, municipal, orresidential well pumping)."
The available data as presented in the RI report (COHYST studies, City of Grand Islandwater level data, RJ water level data) indicate that, on a regional basis within HallCounty, flow direction is to the east or northeast depending on location. Within the Cityof Grand Island the flow direction is generally toward the east-northeast. On this basis,the conclusion has been revised as follows.
"The regional groundwater flow direction within Hall County is to the east andnortheast depending on location. Within Grand Island the flow direction is generallyeast-northeast."
Worldwide Engineering, Environmental, Construction, and IT Services
CONESTOGA-ROVERS& ASSOCIATES
September 29, 2006 Reference No. 018925-10-11-
Comment 10 - Item 6
Item number 6 should be modified as follows: "The concentrations of CVOCs observedto the east of the Brentwood Gravel Pit Lake decline to levels less than 1.0 p.g/1 andapproach the analytical PQL of 0.5 ng/1 at which point the level of analytical uncertaintyis greatly increased. Specifically, the maximum observed CVOC concentration atGGW-556 is 1,1-DCA at 0.53 ug/1 which is marginally above the 0.5 (ig/1 PQL." The lastsentence of item number six should be deleted.
CRA Response
This conclusion reads as follows.
"The concentrations of CVOCs observed to the east of the Brentwood Gravel Pit Lakedecline to levels less than 1.0 |ig/L and approach the analytical PQL of 0.5 ng/L atwhich point the level of analytical uncertainty is greatly increased. Specifically, themaximum observed CVOC concentration at GGW-556 is 1,1-DCA at 0.53 ng/L which ismarginally above the 0.5 |ig/L PQL. On this basis and due to the marked difference in1,1-DCE to 1,1-DCA ratios at this location and GP-02 (0803) located further to the east ofGGW-556, it is the data indicates that the CNH property does not appear to contribute tothe Southern Plume."
The basis for request for deletion of the last sentence is not clear. The difference in theplume conditions is illustrated in Figures 5.28, 5.29, and 5.30 of the RJ report, and also inFigures 6, 7, and 8 of the Southern Plume Study Area RI report by Terra Tech. Based onthis information, the available data, and the difference in chemical concentration ratiosas stated in the response to Comment 6b, the last sentence has been revised as follows.
"On this basis and due to the marked difference in 1,1-DCE to 1,1-DCA ratios at thislocation and GP-02 (0803) located further to the east of GGW-556, the groundwaterconditions in the eastern portion of the Northern Plume near GGW-556 appear lessconsistent with the groundwater conditions in the Southern Plume."
Comment 10 - Item 7
Item number 7 should be modified as follows: "The source of groundwatercontamination in the Northern Plume has been reduced to less than EPA Region IXstandards and the residual groundwater contamination is actively being depleted bybioric and abiotic mechanisms."
Worldwide Engineering, Environmental, Construction, and IT Servic
CONESTOGA-ROVERS& ASSOCIATES
September 29, 2006 Reference No. 018925-10-12-
CRA Response
This conclusion reads as follows.
"The source of groundwater contamination in the Northern Plume has been eliminated(to less than Region IX PRGs) and the residual groundwater contamination is activelybeing depleted by biotic and abiotic mechanisms."
The reference to Region IX PRGs in the original text is correct. It is CRA's understandingthat the Region IX PRGs are used for assessment purposes, and are not enforceablestandards. The conclusion has been revised as follows.
"The source of groundwater contamination in the Northern Plume has been reduced toless than EPA Region IX PRGs and the residual groundwater contamination is activelybeing depleted by biotic and abiotic mechanisms."
Comment 10 - Item 12
Item number 12 should be modified as follows: "Risks for the Future Groundwater Wellin the Stolley Park/Parkview area (Area 3) are greater than one in ten thousand(1.0 x 10⁻⁴) excess cancer risk."
CRA Response
This conclusion reads as follows.
"Risks for the Future Groundwater Well in the Stolley Park/Parkview area of theSouthern Plume (Area 3) are greater than one in ten thousand (1.0 x 10⁻⁴) excess cancerrisk."
The report has been modified as requested. In addition a footnote has been added toprovide the definition of Area 3, as follows.
"As explained in Section 6 and Appendix L, Area 3 refers to a future groundwater wellscenario in the Southern Plume located in the Northern Study Area in the vicinity ofPioneer Blvd."
Worldwide Engineering, Environmental, Construction, and IT Services
CONESTOGA-ROVERS& ASSOCIATES
September 29, 2006 Reference No. 018925-10-13-
Comment 10 - Item 13
Item number 13 should be modified as follows: "The risks in the Stolley Park/ParkviewArea (Area 3) are driven by the ingestion of PCE from a future groundwater well. PCEcontributes 95 percent of the potential cancer risks for the Future Groundwater Well.
CRA Response
This conclusion reads as follows.
"The risks in the Stolley Park/Parkview area of the Southern Plume (Area 3) are drivenby the ingestion of PCE from a future groundwater well. PCE contributes 95 percent ofthe potential cancer risks for the Future Groundwater Well."
The report has been modified as requested. In addition a footnote has been added toprovide the definition of Area 3, as follows.
"As explained in Section 6 and Appendix L, Area 3 refers to a future groundwater wellscenario in the Southern Plume located in the Northern Study Area in the vicinity ofPioneer Blvd."
REVISED HUMAN HEALTH RISK ASSESSMENT(Memo from Mike Beringer to Robert Weber dated July 19, 2006)
CNH RESPONSE TO U.S. EPA REVIEW COMMENTS (FEBRUARY 2006 DRAFT)
General Comments
1. USEPA Comment (April 19, 2006)
Overall, the Draft Human Health Risk Assessment (HHRA) does not objectivelycharacterize the potential health threat from contaminated media. The documentcontains significant pejorative bias through overuse of the words "hypothetical,""theoretical," "unlikely," and "conservarive," which greatly reduces the credibility of thiseffort. The National Contingency Plan (NCP) (40 CFR Part 300.430(d)(4)) states "...thelead agency shall conduct a site-specific baseline risk assessment to characterize thecurrent and potential threats to human health and the environment." The NCP Preamble(55 FR 8710) also states "...the exposure assessment involves developing reasonablemaximum estimates of exposure for both current land use conditions and potential
Worldwide Engineering. Environmental. Construction, and IT Services
CONESTOGA-ROVERS& ASSOCIATES
September 29, 2006 Reference No. 018925-10-14-
future land use conditions at the site. The analysis for potential exposures under futureland use conditions is used to provide decision-makers with an understanding ofexposures that may potentially occur in the future." Region 7 strongly believes thatexposure to groundwater for future land-use scenarios is not "hypothetical" or"theoretical" because there are individuals who continue to use water contaminated withchlorinated volatile organic compounds (CVOCs) at the Parkview Well site. While CNHrepeatedly states this scenario is very unlikely, they do not have the ability to preventfuture groundwater use. Furthermore, the NCP Preamble (55 FR 8710-8711) states"...The role of the baseline risk assessment is to address the risk associated with a site inthe absence of any remedial action or control, including institutional controls." TheHHRA must be revised to objectively characterize the potential health threat to currentand future receptors who may use contaminated water for various purposes. Theserevisions must include replacing the words "hypothetical" and "theoretical" with theword "future."
CNH Response (Tune 16, 2006)
The term Hypothetical Groundwater Well was used in a manner consistent with U.S. EPA 'slanguage from U.S. EPA 2006, where no actual exposure data are available, namely:
"Risk characterization generally involves the integration of the data and analysis of the first threecomponents of the risk assessment process (hazard identification, dose-response assessment, andexposure assessment) to determine the likelihood that humans will experience any of the forms oftoxicity associated with a substance.
(In cases where exposure data are not available, hypothetical risk can be characterized by theintegration of hazard identification and dose-response evaluation data alone.) A framework todefine the significance of the risk is developed, and all of the. assumptions, uncertainties, andscientific judgments of the preceding three steps are presented" (U.S. EPA, 2006).
During discussions with EPA Region Vll on December 15, 2005, the term hypothetical was usedto distinguish future exposure from actual exposures, which are also characterized in the riskassessment. The nature and location of a groundwater well to represent a hypothetical exposurescenario was discussed and verbally agreed with Region VIl's risk assessor, the former RemedialProject Manager (RPM) and the current RPM. Moreover, it was agreed that the selectedlocation would not be a current drinking water well and the groundwater consumption wouldnot be expected since alternate water had been established previously. Moreover, the selected"hypothetical" well was used to represent locations at ivhich the highest CVOC concentrationswere found. The U.S. EPA did not object to the overall approach or the term hypothetical duringthe meeting.
Worldwide Engineering, Environmental, Construction, and IT Services
CONESTOGA-ROVERS& ASSOCIATES
September 29, 2006 Reference No. 018925-10-15-
Tlu' relative risks from a future groundwater well consumption were characterized, were,appropriately evaluated, and did not assume, that remedial controls were in place. The risks fromthe consumption ofgroundwaterfrom a future groundwater well were characterized inaccordance, with discussions with U.S. EPA Region VII and U.S. EPA guidance.
Nevertheless, CNH is sensitive to Region VU's concerns over language and has modified the riskassessment language supporting the risk assessment calculations. Terms such as "hypothetical"and "conservative " have either been removed or changed to 'future potential" as appropriate,throughout the risk assessment, even when U.S. EPA 's Guidance supports their use in theappropriate context.
USEPA Response (July 19, 2006)
Region 7 acknowledges CNH's efforts to significantly revise the risk assessmentlanguage to address our concerns and more objectively characterize the potential humanhealth risks. However, we would like to point out that the language CNH cites insupport of the word "hypothetical" is background information on the risk assessmentprocess from EPA's Integrated Risk Information System (IRIS) website. We do notnecessarily agree this citation represents "U.S. EPA Guidance," in part, because thislanguage has not undergone an Agency-wide peer review. Rather, risk assessmentsconducted for Superfund sites should follow the "Risk Assessment Guidance forSuperfund - Part A," (RAGS Part A) (EPA, 1989), which does not use the term"hypothetical risk" when characterizing future exposure scenarios. We also clarify thatRegion 7 was primarily concerned with the overuse of this term and several othersthroughout the risk assessment, which CNH has adequately addressed in the revisedHHRA.
CRA Response:
Comment noted.
Specific Comments
5. Section 1.2 (p. H-3) (April 19, 2006)
The HHRA only loosely follows the recommended outline in the "Risk AssessmentGuidance for Superfund - Part A," (RAGS Part A) (EPA, 1989). For example,identification of chemicals of potential concern (COPCs) is typically listed as a separate
Worldwide Engineering, Environmental, Construction, and IT Services
CONESTOGA-ROVERS& ASSOCIATES
September 29, 2006 Reference No. 018925-10-16-
section, which includes a very thorough discussion of data collection and dataevaluation procedures. The HHRA must be revised to ensure that all componentscontained in RAGS Part A (see Exhibit 9-1) are specifically addressed.
CNH Response (Tune 16, 2006)
The risk assessment has been revised and reorganized to be generally consistent with RAGS, PartA, Exhibit 9-1. However, tlie presentation is slightly different in some cases. This is consistentwith guidance provided by RAGS, Part A, Chapter 9, which allows for variations in thepresentation of the risk assessment when it is part of a Remedial Investigation report.
It should be noted, hoiuever, that during CNH's meeting with U.S. EPA Region 7, on December12, 2005, CNH requested direction from U.S. EPA on their requirements for the risk assessmentbut no specific direction concerning the report was provided. Also, U.S. EPA Region VII doesnot have written guidance regarding its preferences as it pertains to risk assessment.
USEPA Response duly 19, 2006)
We note for the record that specific guidance was not provided to CNH in December2005, nor does Region 7 have specific guidance addressing risk assessment report formatbecause EPA's RAGS Part A, Exhibit 9-1, provides a suggested outline and thus, separateRegional guidance is unnecessary.
CRA Response
Comment noted.
17. Section 2.4 (p. H-10) (April 19, 2006)
This section should briefly discuss why vinyl chloride, a known human carcinogen anddegradation product of tetrachloroethylene, was not included on the list of CVOCs. Thisdiscussion should include an evaluation of whether detection limits were abovehealth-based screening levels and the impact on the risk estimates.
CNH Response (Tune 16, 2006)
Vinyl chloride (VC) was not included in the AOC, because VC was detected very infrequently,had adequate detection limits and when detected, it was frequently below the PQL The locations
Worldwide Engineering, Environmental, Construction, and IT Services
CONESTOGA-ROVERS& ASSOCIATES
September 29, 2006 Reference No. 018925-10-17-
where VC ivas detected were not co-located, indicating Hint a "plume" of VC did not exist. Tliisinformation supports the exclusion of VC from the list ofCVOCs in the AOC.
USEPA Response (July 19, 2006)
Region 7 recommends that CNH's rationale for excluding vinyl chloride from the AOCbe inserted into the first paragraph of Section 2.0 of the revised HHRA because it is adegradation product of tetrachloroethene, the primary contaminant of concern for theParkview Well site.
CRA Response
The text has been revised by adding the following as a footnote in Section 2.0.
"As agreed by U.S. EPA, vinyl chloride (VC) was not included in the AOC, because VCwas detected very infrequently, had adequate detection limits and when detected, it wasfrequently below the PQL. The locations where VC was detected were not co-located,which indicates that a "plume" containing VC did not exist."
In support of the above it is noted that vinyl chloride was detected in approximately 25out of approximately 650 analyses. Most of the detections were from samples collectedin the Southern Plume, to the southwest of the CNH property. Eighteen of the detectedresults were estimated values below the reporting limit, and the highest detected valuewas 1 pg/L; below the MCL of 2 ug/L.
70. Table A.2.1 (April 19, 2006)
In reviewing the summary of analytical results for soil and groundwater, we noticed themethod detection limit is significantly greater than risk-based screening levels forseveral compounds. This is a significant issue that affects data useability and it occurs inall subsequent tables where analytical results are summarized. CNH must fully discussthe implications as part of the data evaluation process, including the fact that the risksmay have been underestimated.
CNH Response (lune 16, 2006)
A new table wns added to the table in each attachment, and a new paragrapli was added to theCOPC selection process for each area under consideration. This new paragraph evaluated therange of detection limits for each COPC in each area against the U.S. EPA Region IX PRG. To
Worldwide Engineering, Environmental, Construction, and IT Services

CONESTOGA-ROVERS& ASSOCIATES
September 29, 2006 Reference No. 018925-10-18-
that end, it was found that, with the exception ofTCE, nil but the data from Area 2 weregenerally adequate to meet the RBC. In Area 2, detection limits in groundwater were elevated insome cases, and TCE detection limits were elevated because of the low RBC.
While, we agree that it is an issue that should be discussed, it should not be characterized as"significant" because it does not occur that frequently, except for TCE, which is not a problem inthe Northern Study Area.
EPA Response duly 19, 2006)
Region 7 believes it is "significant" in the sense that the reporting limit for TCE wasabout 18-fold greater than the U.S. EPA Region 9 Tap Water PRG for the majority ofsamples used to evaluate Area 2, Area 3, past private well exposure, and past MunicipalWell exposure. In other words, the reporting limit for TCE approximates an excessindividual lifetime cancer risk of 2 x 1Q-5 or 2 in 100,000, based on a comparison to theRegion 9 Tap Water PRG. The HHRA should clearly acknowledge that the TCE cancerrisks may have been underestimated due to elevated analytical detection limits.
CRA Response
CRA notes that the reporting limit for TCE, i.e., 0.5 ug/L, is not elevated with respect toSW846-8260 standard analytical procedures developed and approved by U.S. EPA andincluded in the approved work plan. Concentrations between the MDL and thequantification limit can be determined and often are reported as estimated values.
In addition, the data do not indicate the presence of a plume containing TCE. Theinference that TCE could be generally present in groundwater and result in an exposurepoint concentration at around 0.5 pg/L is unfounded and inconsistent with the data.
The COPC selection process was conducted in accordance with risk assessmentguidance, which clearly allows that chemicals that are not detected, as in this case, canbe eliminated.
In accordance with discussions with U.S. EPA on September 26, 2006 the report(Appendix L - Section 5.6.1.2) has been revised as follows.
"This will increase the uncertainty that TCE is present in groundwater, but not includedin the HHRA. As a result, the human health risks may have been underestimated, butbelow levels of concern."
Worldwide Engineering, Environmental, Construction, and IT Services
CONESTOGA-ROVERS& ASSOCIATES
September 29, 2006 Reference No. 018925-10-19.
U.S. EPA COMMENTS ON THE REVISED HHRA (MAY 2006 DRAFT)
1. General Comment
There are numerous minor typographical errors throughout the document. Forexample, "COPC" and "PRG" should often actually be in the plural form as "COPCs" and"PRGs." These typographical errors should be corrected in the final risk assessment.
CRA Response
The text of the report has been revised to make the required corrections.
2. Section 2.0 (p. L-9)
1,2-Dichloroethane should be added to the list of chemicals of potential concern(COPCs).
CRA Response
The report has been revised as requested.
3. Section 2.4 (p. L-12)
This section should also state that it is consistent with U.S. EPA's RAGS Part A to usedata where the concentration is estimated (i.e., "J" code).
CRA Response
The report has been revised by adding the following sentence after the first sentence ofSection 2.4.
"This approach is consistent with U.S. EPA 1989 that allows for the use of estimated or"J" coded data in the risk assessment process."
Worldwide Engineering, Environmental. Construction, and IT Services
CONESTOGA-ROVERS& ASSOCIATES
September 29, 2006 Reference No. 018925-10-20-
4. Section 2.4.2 (p. L-13)
It would be more accurate to state that "...some of the groundwater data will beinfluenced by the detection limit..." or "...groundwater data arc likelyinfluenced..."
CRA Response
This section presents a discussion of CNH Property groundwater data, including acomparison to Region 9 PRGs for tap water. As stated in the text, there are a number ofcases where the detection limits were greater than Region 9 PRGs. This is primarilyattributable to the fact that the best available analytical methods approved by U.S. EPAcan not attain the Region 9 PRGs at the low part per trillion level.
The sentence has been revised as follows.
"This evaluation indicates uncertainty may exist in cases where the best availableanalytical methods approved by U.S. EPA cannot attain the Region 9 PRGs."
5. Section 3.2.3.2 (p. L-26)
The "U.S. EPA, Region VII, 2005" reference appears to incorrectly cite a personalcommunication in December 2005.
CRA Response
The sentence has been revised as follows.
"The trench was assumed to be in the direction of airflow and air mixing in the trenchwas assumed to occur based on the dimensions of the trench, a site-specific wind speed,and a mixing factor of 0.5 (U.S. EPA, Region VIII, 1999)."
6. Section 3.2.4.5 (p. L-32)
We do not understand the meaning of the sentence ending with "...even when this is notactually the case." CNH should revise this sentence to improve its clarity.
Worldwide Engineering, Environmental, Construction, and IT Services
CONESTOGA-ROVERS& ASSOCIATES
September 29, 2006 Reference No. 018925-10-21 -
CRA Response
The sentence has been revised as follows.
"Once it is assumed that a drinking water well has been constructed, it is furtherassumed that the water becomes available to a resident and exposure occurs. It wasfurther assumed that the exposure point concentration was based on the area of theplume with the highest chemical concentrations, as selected with U.S. EPA."
7. Section 3.3.1.3 (p. L-36)
The HHRA did not evaluate subsurface vapor intrusion on the CNH Property becauseCOPCs in soil are greater than 100 feet from any buildings, but the risk assessment mustalso account for construction of future buildings above contaminated soil andgroundwater. CNH should revise the risk assessment to either quantitatively evaluatethe potential human health risks from subsurface vapor intrusion in future buildings orprovide adequate justification for excluding this pathway.
CRA Response
Section 3.3.1.3 has been revised to include a screening assessment for vapor intrusion asfollows.
"COPC concentrations for indoor air were not estimated on the CNH Property becauseCOPCs in soil are considerably greater than 100 feet from any building on the CNH
Property, the distance required by EPA guidance for vapor intrusion into a building(U.S. EPA, 2002a). Although no building construction is planned for the CNH Property,
potential vapor intrusion for a future building that might be constructed was evaluated.The maximum groundwater concentration found on the CNH Property (shown in
Table 2.2 above) was compared to "Target Groundwater Concentrations Corresponding
to Indoor Air Concentrations" as shown in Table 2c of U.S. EPA's Vapor IntrusionGuidance (U.S. EPA, 2002a). These concentrations are groundwater levels that would
potentially lead to residential indoor air concentrations at the U.S. EPA cancer risk levelof 1 x 10'6, and would be higher for future commercial/industrial workers. The only
chemicals with a maximum groundwater concentration exceeding the screening levels
were 1,1-DCE and 1,2-DCA. All other COPCs were below the screening levels and so
Worldwide Engineering, Environmental, Construction, and IT Services

CONESTOGA-ROVERS& ASSOCIATES
September 29, 2006 Reference No. 018925-10-22-
not considered further. Both 1,1-DCE and 1,2-DCA exceeded the vapor intrusionscreening levels only 1 time out of 81 groundwater samples.
U.S. EPA's Target Groundwater Concentrations Corresponding to Indoor AirConcentrations were developed using a generic attenuation factor of 0.001 to estimatethe potential attenuation when vapors travel through the soil column to indoor air.Site-specific vapor intrusion modeling was conducted for the CNH Off-site Property andit was determined that the soil characteristics lead to a site-specific soil attenuation ofapproximately 1x10⁵ (Appendix G), some one hundred fold lower than that assumed byU.S. EPA. When this site-specific adjustment is made, the maximum detected 1,2-DCAgroundwater concentration only slightly exceeds U.S. EPA's screening level based on acancer risk level of 1 x 10~6 for a residential receptor. Therefore, this exposure pathwaywas not considered further."
8. Section 3.3.1.4 (p. L-37)
Rather than using all of the wells in Area 2 to estimate an exposure point concentration,it would be more appropriate to select those wells containing the highest concentrationsof CVOCs, similar to the approach used in Area 3. CNH should acknowledge thatgroundwater concentrations could be higher in some portions of Area 2 groundwater,and as a result, the risks may be underestimated if a future well were installed in thoseareas.
CRA Response
The report has been revised by adding the following to the second paragraph ofSection 3.3.1.4.
"U.S. EPA guidance recommends the use of the 95 percent UCL concentration, but theactual location of a future potential groundwater well is unknown. It could beconstructed in a location where groundwater concentrations are higher or lower than theaverage. If a well were constructed at a location where groundwater COPCconcentrations were other than the 95 percent UCLs the potential risks could be higheror lower than those calculated here."
Worldwide Engineering. Environmental, Construction, and IT Services
CONESTOGA-ROVERS& ASSOCIATES
September 29, 2006 Reference No. 018925-10-23-
9. Section 3.3.3.1 (p. L-44)
The HHRA states that the frequency of industrial/commercial worker exposure tocontaminated soil is likely low because the contamination is located distant from currentproduction areas. This statement is only relevant for current workers, while future usesof the property are unknown and it should be assumed that future workers willroutinely contact contaminated soil. CNH should revise the risk assessment to make thedistinction between current and future industrial/commercial workers.
CRA Response
The first paragraph of Section 3.3.3.1 has been revised as follows.
"Both a current and future industrial/commercial worker exposure to soil wereevaluated quantitatively in the HHRA. An industrial/commercial worker could comeinto contact with soil in the areas identified in Section 1.2.1.1, but under current siteconditions, the frequency of exposure is likely to be low because the COPCs in soil arelocated distant from industrial production areas. Plowever, no adjustment was made forthis fact, and it was assumed that a current and future industrial/commercial workercould contact soil based on the exposure assumptions summarized here and inTable A.4.1 of Attachment A:"
10. Section 3.3.3.1 (p. L-45)
Region 7 notes that RAGS Part E (EPA, 2004) does not advocate the use of dermalabsorption factors for VOCs (e.g., 1,1,1 -TCA and 1,1-DCA) in soil. The approach utilizedby CNH has a negligible impact on the risk estimates and does not need to be revised inthe final risk assessment.
CRA Response
Comment noted.
11. Section 3.3.3.2 (p. L-45)
As discussed above under Comment 9, CNH should revise the risk assessment todistinguish between current and future construction workers when discussing thefrequency of direct contact with contaminated soil.
Worldwide Engineering, Environmental, Construction, and IT Services
CONESTOGA-ROVERS& ASSOCIATES
September 29, 2006 Reference No. 018925-10-24-
CRA Response
The first paragraph of Section 3.3.3.2 has been revised as follows.
"Future construction worker exposure to soil was evaluated quantitatively in theHHRA. A construction worker could come into contact with soil in the areas identifiedin Section 1.2.1.1 during excavation activities on the CNH property, including utilitytrenching and building foundation excavation. It was assumed that a constructionworker could contact soil based on the exposure assumptions summarized here and inTable A.4.4 of Attachment A."
12. Section 4.1 (p. L-53)
The word "construction" should be inserted in front of "worker exposure only" in thefirst sentence of the third paragraph.
CRA Response
The report has been revised as requested.
13. Section 5.1 (p. L-57)
The first sentence on this page should be deleted because hazard indexes were notsummed by target organ.
CRA Response
The sentence has been deleted as requested since the hazard index was conductedwithout differentiating the target organs. Although this is allowed under riskassessment guidance, it was not necessary based on the calculated hazard index values.
The first sentence of the preceding paragraph has been revised as follows.
"COPCs may exert a toxic effect on different target organs, however, for the purposes ofthis risk assessment, non-carcinogenic effects were not differentiated for each targetorgan. This assumption implies that all chemicals act at the same target organ, whichmay not be the case, and is a default assumption."
Worldwide Engineering, Environmental, Construction, and IT Services

CONESTOGA-ROVERS& ASSOCIATES
September 29, 2006 Reference No. 018925-10- 2 5 -
14. Section 5.2 (p. L-57)
Cancer risk is defined in this section as "...additional risk of cancer over a lifetime in apopulation exposed...," which is technically inaccurate. Rather, the cancer risk estimatesrepresent the excess or additional risk to an individual. The population risk is thenumber of additional cancer cases, assuming all individuals have a similar intake. Thedefinition of "Cancer Risk" in this section and the discussion in Section 5.6.6 should berevised to distinguish between individual and population cancer risk.
CRA Response
The definition in Section 5.2 has been revised as follows.
"Cancer Risk = Estimated upper bound on additional risk of cancer over a lifetimein an individual exposed to the carcinogen for a specifiedexposure period (unitless)."
15. Section 5.6.1.2 (p. L-67)
CNH should delete the footnote on this page because the same language is contained inthe text of the second paragraph.
CRA Response
The footnote has been deleted as requested.
16. Table A.I.I
This table should be revised to address the following issues:
• The rationale for excluding the subsurface vapor intrusion exposure pathway shouldbe changed to reflect CNH's response to Comment 8.
• Direct contact with groundwater by construction/utility workers was "qualitatively1
evaluated because CNH determined workers would not contact groundwater at17 feet below ground surface.
Worldwide Engineering, Environmental, Construction, and IT Services

CONESTOGA-ROVERS& ASSOCIATES
September 29, 2006 Reference No. 018925-10-26-
CRA Response
Table A.1.1 has been revised to indicate that 1) a quantitative vapor intrusion assessmentfor future conditions on the CNH property is not required (see response to Comment 7),and 2) direct contact with groundwater by construction/utility workers wasqualitatively evaluated because workers would not contact groundwater at 17 feetbelow ground surface.
17. Table B.I.I
This table should be revised to address the following issues:
• Direct contact with surface water by residents while recreating was "qualitatively"evaluated because a comparison to Region 9 PRGs showed this exposure pathwaywas negligible.
• The rationale for selecting direct contact with groundwater via residential householduse refers to "...volatile emissions when showering in groundwater...." The approachused in the HHRA actually accounts for volatile emissions from all indoor domesticuses of groundwater, including showering, bathing, washing clothes, toilets, etc.The language in this table should be revised accordingly, as well as for all otherareas where household use of contaminated water was evaluated, which includesTables C.I.I, D.I.I, and E.I.I.
CRA Response
The tables have been revised in accordance with the comment.
18. Section 1.3 (p. D-l)
As a point of clarification, we note that the Removal Action Levels were developed bythe Nebraska Health and Human Services System (NHHSS), and not the NebraskaDepartment of Environmental Quality (NDEQ).
CRA Response
The sentence has been revised as follows.
Worldwide Engineering. Environmental, Construction, and IT Services
CONESTOGA-ROVERS& ASSOCIATES
September 29, 2006 Reference No. 018925-10-27-
"It is believed that all of the residences in the Northern Study Area with groundwaterconcentrations above the Nebraska Health and Human Services System (NHHSS) RALshave been provided an alternative water source, and the risk assessment prepared here,as Attachment D, is for past exposure to groundwater that is no longer beingconsumed."
19. Section 2.4 (p. D-6)
We suggest adding a sentence to the end of this section stating that because of theelevated detection limits for TCE, the actual risks may be up to approximately 3-foldhigher, which is the ratio of the analytical detection limit (0.0005 mg/L) to the detectedconcentration of TCE (0.00016 mg/L).
CRA Response
As stated in earlier responses, the detection limits for TCE are not elevated with respectto SW846-8260 standard analytical procedures developed and approved by U.S. EPAand included in the approved work plan. The inference that TCE could be generallypresent in groundwater and result in an exposure point concentration at around0.0005 mg/L is unfounded and is inconsistent with the data. The exposure pointconcentration in this case is based on the single detected estimated ("J") value(0.00016 mg/L), consistent with U.S. EPA guidance.
In accordance with discussions with U.S. EPA on September 26, 2006 the report(Appendix L - Attachment D - Section 2.4) has been revised by adding the following.
"As a result, the groundwater exposure and associated human health risk may beunderestimated for TCE, but below levels of concern."
20. Section 3.2.2 (p. D-9)
Region 7 agrees that it is reasonable to assume a 6-year exposure duration for thisscenario; however, we do not believe this is a "conservative" assumption because privatewells could have been contaminated with CVOCs before they were detected in ParkviewWell #3. The final HHRA should acknowledge that the actual exposure duration is notknown with certainty and could be greater than 6 years for some residential properties.
Worldwide Engineering, Environmental, Construction, and IT Services
CONESTOGA-ROVERS& ASSOCIATES
September 29, 2006 Reference No. 018925-10-28-
CRA Response
In accordance with discussions with U.S. EPA on September 26, 2006 the report(Appendix L - Attachment D - Section 3.2.2) has been revised by adding the following.
" The actual exposure duration is not precisely known and could be greater or less than6 years for some residential properties."
21. Section 3.3.1 (p. D-12)
Our review of Table D.3.1 shows that the maximum detected concentration exceeds the95 percent upper confidence limit by approximately 10-fold for tetrachloroethene,15-fold for 1,1,1-trichloroethane, 7-fold for 1,1-dichloroethane, and 12-fold for1,1-dichloroethene. Therefore, the final HHRA should acknowledge that the pastexposure and risk estimates for some individual private wells were likely greater thanthose calculated in the risk assessment. The final HHRA should also clearly indicatethat the exposure point concentration used in evaluating this scenario is an estimate ofthe average CVOC concentration of over 100 individual private wells (i.e., does notcapture the full range of past exposures).
CRA Response
The report has been revised by adding the following to the third paragraph.
"The 95 percent UCL represents an upper bound estimate of the average COPCconcentration of over 100 individual private well samples. Thus, it does not capture thefull range of past exposures that individuals may have experienced. The actualexposures and associated risks for individual private wells were likely higher and lowerthan those estimated in this risk assessment."
22. Section 2.3 (p. E-6)
Similar to Comment 20, we suggest adding a sentence to the end of this section statingthat because of the elevated detection limits for TCE, the actual risks may be greater byapproximately 18-fold, which is the ratio of the detection limit (0.0005 mg/L) to theRegion 9 Tap Water PRG for TCE (0.000028 mg/L).
Worldwide Engineering, Environmental, Construction, and IT Services

CONESTOGA-ROVERS& ASSOCIATES
September 29, 2006 Reference No. 018925-10-29-
CRA Response
CRA believes that this comment refers to Section 2.4 and Comment 19.
Section 2.4 presents the COPC selection for the Parkview/Stolley Park municipal wells,including a comparison to Region 9 PRGs for tap water. As stated in the text, there are anumber of cases where the detection limits were greater than Region 9 PRGs. This isprimarily attributable to the fact that the method detection limits, based on standardU.S. EPA methods, are higher than certain Region 9 PRGs. The inference that TCE couldbe generally present in groundwater and result in an exposure point concentration ataround 0.0005 mg/L is unfounded and is inconsistent with the data.
In accordance with discussions with U.S. EPA on September 26, 2006 the report(Appendix L - Attachment E - Section 2.4) has been revised by adding the following.
"As a result, the groundwater exposure and associated human health risk may beunderestimated for TCE, but below levels of concern."
23. Section 4.0 (p. G-8)
The word "acceptable" should be changed to "unacceptable" in the last sentence of thefirst paragraph.
CRA Response
The sentence has been revised as requested.
PARKVIEW WELL SITE SCREENING LEVEL ECOLOGICAL RISK ASSESSMENT(Memo from Catherine Wooster-Brown to Robert Weber dated Tune 30, 2006)
1. USEPA Comment: Appendix M, Section 3.4 (p. M-12)
Region 7 agrees that in general VOCs dissipate rapidly and because they do notbioaccumulate or persist in the environment, the potential impact on receptors isprobably minor. However, the alternative sampler and method chosen to collect CVOCsin lake sediment samples at Parkview Well site introduced uncertainty. Consequently,the uncertainty associated with sampling VOCs in sediment needs to be mentioned inSection 3.4, LIMITATIONS/UNCERTAINTIES.
Worldwide Engineering, Environmental, Construction, and IT Services
CONESTOGA-ROVERS& ASSOCIATES
September 29, 2006 Reference No. 018925-10-30-
CRA Response
The sediment sampling method used was an alternate that was included in theapproved work plan as discussed in Section 2.2.3 of the Rl report. Nevertheless, thefollowing sentence has been added to the end of Appendix M, Section 3.4.
"Potential uncertainty due to the sediment sampling method is discussed in Section 2.2.3of the RI report."
COMMENTS ON REVISED REMEDIAL INVESTIGATION REPORT FROM NDEQ(Memo from Mike Myers to Robert Weber dated Tuly 18, 2006)
1. NDEQ Comment - Page 37, Section 5.3.3.3. ( i i )
In regard to the southern contaminant plume the text states, "No TCE values areindicated higher than the detection limit."
Actually, TCE was detected at low levels in several domestic wells in the Mary Lane andCastle Estates subdivisions (Concentrations up to 2.5 ppb). TCE was also detected in afew direct push samples (up to 4.2 ppb) near the source area (late 2005/early 2006sample events). Please revise as needed.
CRA Response
Figure 5.17 does indicate detection of TCE in samples collected near Engleman Road.The figures are based on investigative results, i.e., not including residential well data.Thus the results from domestic wells are not represented graphically.
The second sentence has been revised to read as follows.
"TCE was detected in investigative samples collected near Engleman Road, but wasdetected sporadically at low levels in investigative samples collected furtherdowngradient in the Southern Plume. TCE was also detected at low levels in severaldomestic wells in the Mary Lane and Castle Estates subdivisions."
Worldwide Engineering, Environmental, Construction, and IT Services

CONESTOGA-ROVERS& ASSOCIATES
September 29, 2006 Reference No. 018925-10-31-
2. NDEQ Comment - Page 39 Section 5.3.2.6Lines of Evidence of Natural Attenuation Processes in the Northern Plume.
Bullet 1. The text states "steady state or receding conditions are prevalent over time anddistance."
While other references to steady state or receding conditions 'over time' were removed,one was left in the RI. The statement appears unsupported. This statement would beacceptable if time versus concentration graphs were provided (showing declines overtime in specific individual wells/sample points). Please revise.
CRA Response
The text has been revised as follows.
• "Steady-state (stable) or receding plume conditions are prevalent and the remainingCVOCs in the underlying aquifer are being actively depleted."
3. NDEQ Comment - Page 62 Section 7.3.1. Results of CPOC screening.
The text states "A summary of the COPC data . . . are presented in Tables 3.1 through3.5..."
The location of tables 3.1 through 3.5 is not indicated. It appears the tables referencedare tables 3.1 - 3.5 of Appendix L. Please revise to state the location of the referencedtables.
CRA Response
The first sentence has been revised as follows.
"Summaries of COPC data along with the risk screening are presented in Tables 3.1through 3.5 of Appendix M, for sediment, soil, surface water, and ground water."
Worldwide Engineering, Environmental, Construction, and IT Services

CONESTOGA-ROVERS& ASSOCIATES
September 29, 2006 Reference No. 018925-10-32-
Should you have any questions regarding the above, please do not hesitate to contact theundersigned.
Yours truly,
CONESTOGA-ROVERS & ASSOCIATES
Bruce Clegg
BCC/ev/2
c.c.: Mike Myers (NDEQ)Jim McBain (CNH)David Mueller (CNH)Frank Lyons (Bell Boyd & Lloyd)
Worldwide Engineering, Environmental, Construction, and IT Services
CONESTOGA-ROVERS& ASSOCIATES
September 29, 2006 Reference No. 018925-10-33-
References:
Editorial, Environmental Forensics, 6:101-102, 2005
Feenstra, S., "Use of Logarithmic-Scale Correlation Plots to Represent Contaminant Ratios forEvaluation of Subsurface Environmental Data", Environmental Forensics, 7:175-185,2006
Morrison, R., and Murphy, B., Environmental Forensics Contaminant Specific Guide, Chapter12, Elsevier Press, San Francisco, 2006
Tetra Tech EM Inc., July 2006. Parkview Well Groundwater Contamination Site, SouthernPlume Study Area, Grand Island, Nebraska, Final Remedial; Investigation Report,Prepared for U.S. EPA Region VII, Start 3 Contract No. EP-S7-06-01, July 2006.
COHYST, March 2005. Cannia, J.C., Woodward, D., Cast, L.D., 2005. "Cooperative HydrologyStudy COHYST Hydrostratigraphic Units and Aquifer Characterization Report",Cooperative Hydrology Study, March 2005.
Worldwide Engineering, Environmental, Construction, and IT Services

CONESTOGA-ROVERS& ASSOCIATES
8615 W. Bryn Mawr Avenue, Chicago, Illinois 60631-3501Telephone: 773-380-9933 Facsimile: 773-380-6421www.CRAworld.com
September 29, 2006 Reference No. 018925-10
Mr. Robert WeberSuperfund DivisionU.S. Environmental Protection Agency901 N. 5'h StreetKansas City, KansasU.S.A. 66101
Dear Rob:
Re: Amended Remedial Investigation ReportParkview Well Site, Northern Study AreaAdministrative Order on ConsentCERCLA Docket No. 07-2005-0264
VIA FEDEX
RECEIVED
GCT 0 2 2006SUPERFUND DIVISION
Pursuant to the above-referenced Administrative Order on Consent and U.S. EPA's commentletter dated July 20, 2006, please find enclosed our response to your comments and three copiesof the revised sections of the Rl report. Specifically this includes the following:
• Remedial Investigation Report Volume 1 of 2 (inside cover),
• Remedial Investigation Report Volume 2 of 2 (inside cover),
• Remedial Investigation report text,
• Appendix L (except Attachment F-2 disk), and
• Appendix M text.
Please replace the corresponding sections in your copies of the Rl report with the enclosedsections listed above, and retain the disk in Attachment F-2.
In addition, and by copy of this letter, we have provided two copies to the NebraskaDepartment of Environmental Quality (NDEQ).
EQUAL EMI'LOYMtST OI'IDKTLMTV EMF'LOYKK
l I G H T t R E 0 C O M P A N Y
ISO 9001
Worldwide Engineering, Environmental, Construction, and IT Services

CONESTOGA-ROVERS& ASSOCIATES
September 29, 2006 Reference No. 018925-10- 2 -
Please don't hesitate to contact Jim McBain or myself at (262) 636-6836 or (773) 380-9933,respectively if you have any questions.
Yours truly,
CONESTOGA-ROVERS & ASSOCIATES
V[
i 9Bruce Clegg
BCC/ev/3End.
c.c.: Mike Myers (w/Attachment x 2)David Mueller (w/Attachment x 1)Jim McBain (w/Attachment x 1)Frank Lyons (w/Attachment x 1)Julian Hayward (w/Attachment x 1)
Worldwide Engineering, Environmental, Construction, and IT Services

RECEIVED
OCT 0 2 2006SIJPERFUND DIViS iOK
REMEDIAL INVESTIGATION REPORT
PARKVIEW WELL SITE - NORTHERN STUDY AREAGRAND ISLAND, NEBRASKA
VOLUME 1 OF 2
PRINTED ON
2 9 2006
SEPTEMBER 2006REF. NO. 18925 (21)This report is printed on recycled paper.
Prepared by:Conestoga-Rovers& Associates
8615 West Bryn Mawr AvenueChicago, Illinois 60631
Office: (773)380-9933Fax: (773) 380-6421
W o r l d w i d e E n g i n e e r i n g , E n v i r o n m e n t a l , C o n s t r u c t i o n , a n d I T S e r v i c e s
RECEIVED
OCT 0 ,?
SUFERFUND
REMEDIAL INVESTIGATION REPORT
PARKVIEW WELL SITE - NORTHERN STUDY AREAGRAND ISLAND, NEBRASKA
VOLUME 2 OF 2
SEP 2 9 2006
SEPTEMBER 2006REF. NO. 18925 (21)This report is printed on recycled paper.
Prepared by:Conestoga-Rovers& Associates
8615 West Bryn Mawr AvenueChicago, Illinois 60631
Office: (773) 380-9933Fax: (773) 380-6421
W o r l d w i d e E n g i n e e r i n g , E n v i r o n m e n t a l . C o n s t r u c t i o n , a n d I T S e r v i c e s

TABLE OF CONTENTS
Pa|
1.0 INTRODUCTION 11.1 SITE DESCRIPTION 21.2 SITE HISTORY 21.3 SOURCE IDENTIFICATION 21.3.1 CNH 21.3.2 PARKVIEW/SOUTH£RN PLUMES 31.3.3 SEPTIC SYSTEMS 41.3.4 OTHER INDUSTRIES 4
2.0 REMEDIAL INVESTIGATION ACTIVITIES 62.1 SUMMARY OF PREVIOUS INVESTIGATIONS 62.2 SUMMARY OF SEDIMENT AND
SURFACE WATER SAMPLING ACTIVITIES 82.2.1 SAMPLE LOCATION AND ANALYSIS 92.2.2 SURFACE WATER SAMPLING PROCEDURES 92.2.3 SEDIMENT SAMPLING PROCEDURES 92.2.4 QUALITY ASSURANCE/QUALITY CONTROL (QA/QC) SAMPLES.. 102.2.5 SAMPLE NUMBERING SYSTEM 112.2.6 DOCUMENTATION ..112.2.7 SAMPLE DOCUMENTATION 122.2.8 SURFACE WATER SAMPLING
DECONTAMINATION PROCEDURES 122.2.9 SEDIMENT SAMPLING DECONTAMINATION PROCEDURES 132.2.10 INVESTIGATION DERIVED WASTE MANAGEMENT 132.2.11 SURVEYING 142.3 SUMMARY OF PIEZOMETER INSTALLATION
AND DEVELOPMENT 142.4 SUMMARY OF SUPPLEMENTAL STRATIGRAPHIC DEFINITION 15
3.0 SITE CHARACTERISTICS 163.1 METEOROLOGY 163.2 TOPOGRAPHY AND SURFACE HYDROLOGY 163.3 REGIONAL GEOLOGY AND HYDROGEOLOGY 163.3.1 REGIONAL GEOLOGY 163.3.1 REGIONAL HYDROGEOLOGY 173.4 SITE GEOLOGY AND HYDROGEOLOGY 183.4.1 SITE GEOLOGY 183.4.2 SITE HYDROGEOLOGY 19
018925(21) CONESTOGA-ROVERS & ASSOCIATES
TABLE OF CONTENTS
4.0 NATURE AND EXTENT OF CONTAMINATION 214.1 OVERVIEW 214.2 DATA USABILITY 214.3 GROUNDWATER 214.4 SOIL, SEDIMENT AND SURFACE WATER 224.4.1 SOIL AND SEDIMENT ON CNH PROPERTY 224.4.2 SURFACE WATER AND SEDIMENT
WITHIN THE GRAVEL PIT LAKES 224.5 PRIVATE AND MUNICIPAL POTABLE WATER WELLS 23
5.0 CONTAMINANT FATE AND TRANSPORT 245.1 OVERVIEW 245.2 NORTHERN STUDY AREA WASTE CHARACTERISTICS 245.2.1 BACKGROUND 245.2.2 SOIL CHARACTERIZATION 255.3 ASSESSMENT OF GROUNDWATER PLUME CHARACTERISTICS 265.3.1 BACKGROUND 265.3.2 BASICS OF DOWNGRADIENT RESPONSE 275.3.2.1 GROUNDWATER FLOW DIRECTION 275.3.2.2 IDENTIFICATION OF CVOCS PRESENT 275.3.2.3 FATE AND TRANSPORT OF CVOCS 285.3.2.4 NATURAL ATTENUATION PROCESSES 325.3.3 NORTHERN CVOC PLUME 335.3.3.1 DEMONSTRATED SEQUENCE OF CVOC CONCENTRATIONS
WITH DISTANCE FOR THE NORTHERN PLUME 335.3.3.2 SUMMARY OF DEMONSTRATED DECLINES OF CVOC
CONCENTRATIONS IN THE NORTHERN PLUME 355.3.3.3 DEMONSTRATED SEQUENCE OF CVOC CONCENTRATIONS
WITH DISTANCE IN THE SOUTHERN PLUME 365.3.3.4 SUMMARY OF DEMONSTRATED DECLINE OF CVOC
CONCENTRATIONS IN THE SOUTHERN PLUME 385.3.3.5 COMPARISON OF CVOC DEGRADATION IN THE
NORTHERN AND SOUTHERN PLUMES 385.3.3.6 LINES OF EVIDENCE OF NATURAL ATTENUATION
IN THE NORTHERN PLUME 405.3.4 SOUTHERN CVOC PLUME 425.3.5 COMPARISON OF PLUMES 43
018925 (21) CONESTOGA-ROVERS & ASSOCIATES
TABLE OF CONTENTS
6.0 HUMAN HEALTH RISK ASSESSMENT 456.1 GENERAL 456.2 SITE CHARACTERIZATION 466.2.1 EXPOSURE PATHWAYS 466.2.2 CHEMICALS OF POTENTIAL CONCERN 476.3 EXPOSURE ASSESSMENT 496.4 TOXICITY ASSESSMENT 506.5 RISK CHARACTERIZATION 526.6 CONCLUSIONS 576.7 UNCERTAINTY 57
7.0 SCREENING LEVEL ECOLOGICAL RISK ASSESSMENT 587.1 INTRODUCTION 587.1.1 STRUCTURE OF THE ERA 587.1.2 OBJECTIVES OF THE ERA 597.2 SLERA STEP 1: SCREENING LEVEL PROBLEM FORMULATION 597.2.1 CHARACTERIZATION OF THE SITE
AND POTENTIAL RECEPTORS 597.2.2 FATE, TRANSPORT, AND ECOTOXICITY OF
CHEMICALS OF POTENTIAL CONCERN (COPC) 607.2.3 PRELIMINARY CONCEPTUAL
SITE MODEL/ASSESSMENT ENDPOINTS 607.2.4 DATA USED IN THE ASSESSMENT FOR THE CNH PROPERTY 627.2.5 DATA USED IN THE ASSESSMENT
OUTSIDE THE CNH PROPERTY 627.3 SLERA STEP 2: SCREENING LEVEL
EXPOSURE ESTIMATE AND RISK CALCULATION 627.3.1 RESULTS OF COPC SCREENING 627.3.2 RISK CHARACTERIZATION 637.3.3 LIMITATIONS/UNCERTAINTIES 637.4 CONCLUSIONS/SCIENCE MANAGEMENT
DECISION INPUT POINT 64
8.0 CONCLUSIONS 66
9.0 REFERENCES 68
018925(21) CONESTOGA-ROVERS & ASSOCIATES
LIST OF FIGURES(Following Text)
FIGURE 1.1 LOCATION MAP
FIGURE 1.2 LOCATION OF NEARBY INDUSTRIES
FIGURE 2.1 SAMPLE LOCATIONS - BRENTWOOD GRAVEL PIT LAKE
FIGURE 2.2 SAMPLE LOCATIONS - KENMARE GRAVEL PIT LAKE
FIGURE 2.3 ADDITIONAL PIEZOMETER AND CITY WELL LOCATIONS
FIGURE 3.1 STRATIGRAPHIC DESCRIPTION OF GEOLOGIC ANDHYDROSTRATIGRAPHIC UNITS WITHIN THE COHYST BOUNDARY
FIGURE 3.2 COHYST BOUNDARY OVERLAID ON NEBRASKA 1995 WATER TABLECONTOUR MAP WITH SURFACE WATER FEATURES
FIGURE 3.3 CROSS SECTION LOCATION PLAN
FIGURE 3.4 CROSS SECTION A-A1
FIGURE 3.5 GROUNDWATER ELEVATION CONTOURS - MAY 11, 2006
FIGURE 4.1 CVOCs IN GROUNDWATER
FIGURE 4.2 CVOCs IN SURFACE WATER AND SEDIMENT - BRENTWOOD ANDKENMARE GRAVEL PIT LAKES
FIGURE 4.3 PRIVATE AND MUNICIPAL WELL SAMPLING LOCATIONS
FIGURE 5.1 LOCATION OF BURN AND BURIAL AREAS
FIGURE 5.2 TRANSFORMATION PATHWAYS FOR CVOCs
FIGURE 5.3 PCE -- CONCENTRATIONS VERSUS DISTANCE-NORTH PLUME(LOG-LINEAR SCALE)
FIGURE 5.4 TCE CONCENTRATIONS VERSUS DISTANCE-NORTH PLUME(LOG-LINEAR SCALE)
FIGURE 5.5 cis-U-DCE CONCENTRATIONS VERSUS DISTANCE-NORTH PLUME(LOG-LINEAR SCALE)
018925(21) CONESTOGA-ROVERS & ASSOCIATES
LIST OF FIGURES(Following Text)
FIGURE 5.6
FIGURE 5.7
FIGURE 5.8
FIGURE 5.9
FIGURE 5.10
FIGURE5.il
FIGURE 5.12
FIGURE 5.13
FIGURE 5.14
FIGURE 5.15
FIGURE 5.16
FIGURE 5.17
FIGURE 5.18
FIGURE 5.19
1,1,1-TCA CONCENTRATIONS VERSUS DISTANCE-NORTH PLUME(LOG-LINEAR SCALE)
1,1-DCA CONCENTRATIONS VERSUS DISTANCE-NORTH PLUME(LOG-LINEAR SCALE)
1,1-DCE CONCENTRATIONS VERSUS DISTANCE-NORTH PLUME(LOG-LINEAR SCALE)
PCE CONCENTRATIONS VERSUS DISTANCE-NORTH PLUME(ARITHMETIC SCALE)
TCE CONCENTRATIONS VERSUS DISTANCE-NORTH PLUME(ARITHMETIC SCALE)
cis-l,2-DCE CONCENTRATIONS VERSUS DISTANCE-NORTH PLUME(ARITHMETIC SCALE)
1,1,1-TCA CONCENTRATIONS VERSUS DISTANCE-NORTH PLUME(ARITHMETIC SCALE)
1,1-DCA CONCENTRATIONS VERSUS DISTANCE-NORTH PLUME(ARITHMETIC SCALE)
1,1-DCE CONCENTRATIONS VERSUS DISTANCE-NORTH PLUME(ARITHMETIC SCALE)
MONITORED NATURAL ATTENUATION PARAMETER SUMMARY
PCE CONCENTRATIONS VERSUS DISTANCE-SOUTHERN PLUME(LOG-LINEAR SCALE)
TCE CONCENTRATIONS VERSUS DISTANCE-SOUTHERN PLUME(LOG-LINEAR SCALE)
cis-l,2,-DCE CONCENTRATIONS VERSUS DISTANCE-SOUTHERNPLUME (LOG-LINEAR SCALE)
1,1,1-TCA CONCENTRATIONS VERSUS DISTANCE-SOUTHERN PLUME(LOG-LINEAR SCALE)
018925(21) CONESTOGA-ROVERS & ASSOCIATES
FIGURE 5.20
FIGURE 5.21
FIGURE 5.22
FIGURE 5.23
FIGURE 5.24
FIGURE 5.25
FIGURE 5.26
FIGURE 5.27
FIGURE 5.28
LIST OF FIGURES(Following Text)
1,1-DCA CONCENTRATIONS VERSUS DISTANCE-SOUTHERN PLUME(LOG-LINEAR SCALE)
1,1-DCE CONCENTRATIONS VERSUS DISTANCE-SOUTHERN PLUME(LOG-LINEAR SCALE)
PCE CONCENTRATIONS VERSUS DISTANCE-SOUTHERN PLUME(ARITHMETIC SCALE)
TCE CONCENTRATIONS VERSUS DISTANCE-SOUTHERN PLUME(ARITHMETIC SCALE)
cis-l,2-DCE CONCENTRATIONS VERSUS DISTANCE-SOUTHERN PLUME(ARITHMETIC SCALE)
1,1,1-TCA CONCENTRATIONS VERSUS DISTANCE-SOUTHERN PLUME(ARITHMETIC SCALE)
1,1-DCA CONCENTRATIONS VERSUS DISTANCE-SOUTHERN PLUME(ARITHMETIC SCALE)
1,1-DCE CONCENTRATIONS VERSUS DISTANCE-SOUTHERN PLUME(ARITHMETIC SCALE)
PCE PLUME CONCENTRATION MAP
FIGURE 5.29 1,1,1-TCA PLUME CONCENTRATION MAP
FIGURE 5.30 1,1-DCE PLUME CONCENTRATION MAP
018925(21) CONESTOGA-ROVERS & ASSOCIATES

LIST OF TABLES(Following Text)
TABLE 2.1 SUMMARY OF PREVIOUS INVESTIGATIONS
TABLE 2.2 SUMMARY OF FIELD PARAMETERS
TABLE 2.3 SEDIMENT AND SURFACE WATER SAMPLE KEY
TABLE 2.4 PIEZOMETER CONSTRUCTION SUMMARY
TABLE 2.5 SUMMARY OF PIEZOMETER DEVELOPMENT PARAMETERS
018925(21) CONESTOGA-ROVERS & ASSOCIATES

LIST OF APPENDICES
APPENDIX A
APPENDIX B
APPENDIX C
APPENDIX D
APPENDIX E
APPENDIX F
APPENDIX G
APPENDIX H
APPENDIX I
APPENDIX J
APPENDIX K
APPENDIX L
APPENDIX M
POTENTIAL SEPTIC SYSTEM SOURCE IDENTIFICATION STUDY
FIGURES SHOWING INVESTIGATIVE SAMPLE LOCATIONS ONCNH PROPERTY
SOIL BORING AND MONITORING WELL CONSTRUCTION LOGS -
SOIL BORING AND GROUNDWATER INFORMATION - HALLCOUNTY
GROUNDWATER CONTOURS (1998 THROUGH 2004)
DATA VALIDATION MEMORANDUM (SEDIMENT AND SURFACEWATER SAMPLING)
LABORATORY DATA AND CHAIN-OF-CUSTODY FORMS
ANALYTICAL DATA TABLES - GROUNDWATER, SOIL, SURFACEWATER AND SEDIMENT
ANALYTICAL DATA TABLES - RESIDENTIAL AND MUNICIPALSUPPLY WELLS
REMOVAL ACTION REPORT (CRA MARCH 2004)
PLUME DELINEATION ANIMATION
HUMAN HEALTH RISK ASSESSMENT
SCREENING LEVEL ECOLOGICAL RISK ASSESSMENT
018925(21) CONESTOGA-ROVERS & ASSOCIATES

EXECUTIVE SUMMARY
Pursuant to an Administrative Order on Consent (CERCLA Docket No. 07-2005-0264) betweenthe United States Environmental Protection Agency (U.S. EPA) and CNH America LLC (CNH),a Remedial Investigation (Rl) of the Parkview Well Site-Northern Study Area, Grand Island,Nebraska, was conducted. The Northern Study Area has been extensively characterizedthrough the substantial efforts of U.S. EPA, Nebraska Department of Environmental Quality,the City of Grand Island, and CNH. An extensive data set exists allowing accurate delineationof the chlorinated volatile organic compounds (CVOCs, as defined by the AOC) present ingroundwater, soils and sediments. Northern Plume residual contamination in the NorthernStudy Area migrates towards the Stolley Park/Parkview Area at levels below MCLs.Concentrations of 1,1-dichloroethene (1,1-DCE) and 1,1-dichloroethane (1,1-DCA) east of theBrentwood Gravel Pit Lake are at or below Practical Quanritation Limits (PQLs) and, in anyevent, were the only CVOCs detected based on the currently available data. The NorthernPlume's source, the former Burn and Burial Areas, located on the CNH property, have beeneffectively reduced to less than U.S. EPA Region IX PRGs and the CVOCs in the groundwaterare at a steady state condition. Moreover, residual Northern Plume CVOCs appear to berapidly depleting due to the efficacy of the biotic and abiotic degradation occurring in andaround the identified source areas. On the basis of currently available data, the Northern Plumedoes not reach potable water wells in the Northern Study Area above MCLs. The concentrationsof CVOCs observed to the east of the Brentwood Gravel Pit Lake decline to levels less than1.0 ug/L at which point the level of analytical uncertainty is greatly increased. Specifically, themaximum observed CVOC concentration at GGW-556 is 1,1-DCA at 0.53 ug/L which ismarginally above the 0.5 ug/L PQL.
Based on the most recent U.S. EPA-generated data, the source of the Southern Plume appears tobe in the vicinity of Husker Highway and Engleman Road to the southwest (up andcross-gradient) of the CNH property. The Southern Plume is declining at a much lower ratethan the Northern Plume; moreover it does not appear to have attained a steady state resultingin the greatest current and potential future impact to the Parkview area. The excess lifetime"future" cancer risk to human health is 1.7 x 10⁻⁴, of which 95 percent of the risk is due to thepresence of PCE. Ecological risks are negligible within the Northern Study Area.
018925(21) I CONESTOGA-ROVERS & ASSOCIATES

1.0 INTRODUCTION
On July 18, 2005, an Administrative Order on Consent (AOC) for a RemedialInvestigation in Grand Island, Nebraska became effective (CERCLA Docket
No. 07-2005-0264). The AOC was entered into between CNH America LLC (CNH) and
the United States Environmental Protection Agency (U.S. EPA). The AOC contemplated
the conduct of a Remedial Investigation in Grand Island, Nebraska at the Parkview Well
Site Northern Study Area (Site). The area defined as the "Northern Study Area" by the
AOC is (1) the CNH Property Study Area consisting of the areal extent o/VOCs associated with
the CNH Property; and (2) the Parkview/Stolley Park Study Area consisting of the areal extent ofVOCs at or contiguous with the Parkview/Stolley Park Subdivision, but excluding that portion
of the Southern Plume located south of the parcels abutting Pioneer Boulevard (AOC Section IV,Paragraph 10 1). The AOC identified the "Southern Plume" as predominantly consisting of
chlorinated alkenes [PCE and 1,1-DCE] [which], extends from an area starting at or west of the
Indian Head Golf Course and migrating to the east and east-northeast to the Mary Lane, KentishHills, Castle Estates, Parkview and Stolley Park subdivisions areas (AOC Section V,
Paragraph 12). Thus, based on the extensive set of characterization data (collected by
U.S. EPA, Nebraska Department of Environmental Quality (NDEQ), CNH, and the City
of Grand Island) available at the time the AOC was drafted and executed, it was clear
that two separate and distinct groundwater source areas existed, resulting in twogroundwater contaminant plumes. At the time of development of this report, the
Southern Plume appeared to be originating from a source located somewhere aroundthe intersection of Husker Highway and Engleman Road and, consistent with the local
groundwater flow regime, flowing through the Castle Estates, Mary Lane, Bradley,
Kentish Hills and Parkview/Stolley Park subdivisions.1
Due to the comprehensive site characterization database alluded to above, the AOCencouraged [CNH] to utilize existing information to the extent possible and "compil[e]
existing data". The limited supplemental data required by the AOC included collectionof surface water and sediment data from two gravel pit lakes. In addition, data gaps
were identified during the development of this report pertaining to groundwater
elevations and flow direction. As a result, water level elevations were collected at
existing and newly installed piezometers across the southwestern portion of the City ofGrand Island. Supplemental stratigraphic information was also collected concurrent
with the additional groundwater elevation data. The Supplemental Data Collection and
1 The U.S. EPAs AOC essentially concluded the same flow path for the Southern Plume which wasfurther verified by subsequent data produced by U.S. EPA.
018925(21) - 1 CONESTOGA-ROVERS & ASSOCIATES
this Remedial Investigation were completed in accordance with the RemedialInvestigation Work Plan which was approved by the U.S. EPA on August 18, 20052.
1.1 SITE DESCRIPTION
The Site is situated in the northeastern portion of Hall County within Section 25,Township 11 North, and Range 10. An area location map is included as Figure 1.1.
The land surface across the Site is generally flat and is covered by either grass orimpervious surfacing, including asphalt and concrete. The Site is located in a mixedcommercial/industrial, agricultural and residential area. Commercial/industrial lotsinclude the CNH property on the western portion of the Site and several propertiesimmediately east of State Highway 281 (HWY 281). Agricultural lots include acultivated field on the west and south of the CNH property. To the east acrossHWY 281, the area is primarily commercial, agricultural, and residential, including theBrenrwood, Parkview and Stolley Park subdivisions.
1.2 SITE HISTORY
The Site comprises mixed-use commercial and residential property, which includesCNH's Grand Island manufacturing facility (CNH Property) along with the residentialneighborhoods of Brentwood and Stolley Park/Parkview Subdivisions.
1.3 SOURCE IDENTIFICATION
1.3.1 CNH
The land currently owned by CNH was an undeveloped agricultural area prior topurchase by Sperry Rand Corporation (Sperry) in 1965. Sperry reportedly beganoperations in October 1965 in the current shipping building, where assembly ofcombines was the primary function of the plant. Later on, primary operations, whichincluded molding, welding, and assembly, were shifted to the Main manufacturingbuilding.
Via e-mail correspondence from Robert Stewart (RPM, U.S. EPA) to Bruce Clegg (ProjectCoordinator, CRA)
018925(21) 2 CONESTOGA-ROVERS & ASSOCIATES
Burn Area
According to Facility personnel, from June 1966 to June 1975, paper wastes, paint sludge,waste solvents, cutting oils, and various drums were reportedly placed within two cells(pits). This area subsequently became known as the "Burn Area". The Burn Area wasclosed in June 1975 and waste disposal was transferred to the Burial Area. The BurnArea, which was approximately 100 x 200 feet in size, was excavated during the InterimRemoval Action (Removal Action) as discussed in Section 5.2.1.
Burial Area
According to Facility personnel, beginning in June 1975 and continuing through toNovember 1980, drums were emptied into five cells (pits) in an area which becameknow as the Burial Area which comprises approximately 100 x 150 feet. The Burial Areawas excavated during the Removal Action as discussed in Section 5.2.1.
1.3.2 PARKVIEW/SOUTHERN PLUMES
The Southern Plume is defined under the AOC as "..the groundwater plume of CVOCs3
starting at or west of the Indian Head Golf Course, and migrating to the east and east-northeastthrough the Castle Estates, Mary Lane, Bradley, Kentish Hills, and Parkview/Stolley Parksubdivisions". U.S. EPA determined in the findings of fact in the AOC and previousinvestigations that, "Based on data collected to date, it appears that the primary plume of PCEand DCE contamination is located to the south and west of the Respondent's [CNH] property,and past waste disposal practices at Respondent's [CNH] Property do not appear to be a sourcefor the Southern Plume. The source of the. southern plume contamination is currentlyunknown". "AOC; CERCLA Docket No. 07-2005-0264]. The Southern Plume has beendelineated during numerous investigations as outlined in Section 2.1 and, based on themost current data available at the time of preparation of this report, appears to beoriginating near the vicinity of the intersection of Husker Highway and Engleman Road.
Chlorinated Volatile Organic Compounds consist of trichJoroethene (TCE); tetrachloroethene(PCE); 1,1-dichloroethene (1,1-DCE); cis-l,2-dichloroethene (cis-l,2-DCE); 1,1,1-trichloroethane(1,1,1-TCA); 1,1-dichloroethane (1,1-DCA); and 1,2-dichloroethane (1,2-DCA) as required by theAOC pursuant to Section IV Paragraph 10.f,g and h.
018925(21) 3 CONESTOGA-ROVERS & ASSOCIATES
1.3.3 SEPTIC SYSTEMS
While not required by U.S. EPA, but in order to fully assess the contribution of allvolatile organic compound (VOC) sources, a study was undertaken to determine thenumber of households within the Northern Study Area that may have (or historicallyhad) a septic system. It has been well documented that a septic system may beidentified as a possible source of soil or groundwater contamination if not properlymanaged. To that end, certain common household products contain chlorinatedsolvents such as tetrachloroethene (PCE), trichloroethene (TCE) and1,1,1-rrichloroethane (TCA). Moreover, chlorinated solvents have historically been usedto clean septic systems which then becomes a source of soil and/or groundwatercontamination. A detailed discussion of the study is provided in Section Appendix A.
1.3.4 OTHER INDUSTRIES
Other current and former industries in the vicinity of the Site include the following
• County Dump
• Southern Power District of Nebraska
• Heinzman Engineering (former Cargill property)
• Vault Enterprises
• Cornhusker Army Ammunition Plant
• Leon Plastics
• Chief Enterprises
• Bushman Construction Company
• Bruner Trucking Company/Gary Smith Trucking Company
• Meister/Hooker Brothers
• National Auto Parts
• Tibbs Junkyard/Hosteller
• The Blair Junkyard
• Asphalt Plant
• Buick Dealership
• Hanson Truck Dealership
• Chevrolet Dealership
018925(21) 4 CONESTOGA-ROVERS & ASSOCIATES
• Sinclair Gas Station
• Phillips Gas Station
Figure 1.2 provides the locations of these industries with respect to the Site.
018925(21) 5 CONESTOGA-ROVERS & ASSOCIATES
2.0 REMEDIAL INVESTIGATION ACTIVITIES
The following section summarizes the activities performed in order to fulfill therequirements of the AOC and complete this Remedial Investigation. The majority of thesoil and groundwater data had previously been collected during the course of numerousinvestigations conducted prior to the implementation of the AOC. However,supplemental data was required which included the collection of surface water andsediment data from two gravel pit lakes within the Site. In addition, a study wasundertaken to determine the number of households within the Site that may have, orhave previously had, a septic system (see Appendix A). Although not required byU.S. EPA, this study was undertaken in order to fully assess the extent of all potentialsources contributing CVOCs to groundwater within the Site. Finally, additionalgroundwater samples were taken from an area immediately west of the CNH propertyto more fully and accurately characterize the Northern Study Area as described inSection 4.3. In addition, the extensive data set developed by U.S. EPA and NDEQ tocharacterize the Southern Plume was used to complete this Remedial Investigation.
2.1 SUMMARY OF PREVIOUS INVESTIGATIONS
Prior to the initiation of the AOC, a number of investigations were conducted at theNorthern Study Area and within the surrounding areas. Details of these investigationsare outlined in Table 2.1 and are summarized below.
Past investigations at the CNH Facility had identified three Areas of Interest (AOIs),namely the Burial Area, the Burn Area, and a stormwater detention basin commonlyreferred to as the "Duck Pond", that required additional evaluation. As a result, anumber of environmental reports, summarized by the following, related to theinvestigation of these three areas have been previously submitted to the NebraskaDepartment of Environmental Quality (NDEQ).
• "Phase IA Environmental Assessment Report" by Arthur D. Little (ADL) [July 1993];
• "Preliminary Subsurface Investigation in the Burial and Burn Areas" prepared forFord by ENSR Consulting and Engineering (ENSR) [October 1993];
• Phase II - "Lateral Delineation of Impacted Groundwater, Ford New HollandFacility, Grand Island, Nebraska" by Dames and Moore (D&M) [April 1995];
• Phase II - "Vertical Delineation of Impacted Groundwater, Ford New HollandFacility, Grand Island, Nebraska" by D&M [June 1995];
018925(21) 6 CONESTOGA-ROVERS & ASSOCIATES
• "Phase II Groundwater Investigation" by Geraghty and Miller (G&M) [February
1996];
On November 3, 2000, CNH's predecessor entered the CNH Property into the NDEQ
RAPMA program (I.D. 36-336-4917). The NDEQ signed the RAPMA agreement on
June 11, 2002. In February 2002, on behalf of CNH, CRA conducted a subsurfaceinvestigation to delineate the horizontal and vertical extent of the Burial and Burn Areas
in support of a proposed Removal Action, and to evaluate if any contamination was
present in the Duck Pond. The details of the subsurface investigation completed by
CRA are presented in the CRA report dated May 2002. A Supplemental Site Investigationwas conducted in October 2002, the details of which are presented in the CRA report
dated April 2003. Investigative sample locations are shown on the figures presented inAppendix B.
Public water supply and local residential well monitoring was conducted by the
Nebraska Department of Health and Human Services (NDHHS) during August and
September 2001 at municipal supply wells located within the Parkview/Stolley Parkarea. This NDHHS sampling event indicated CVOC-impacted groundwater at the
Parkview 3 municipal water supply well (Parkview Well No. 3) and at two residential
wells (2522 Pioneer Avenue and 2512 S. Blaine Street). This municipal supply well was
decommissioned due to the above-noted-VOC impacts. The City of Grand Island thensampled 73 residential wells in the area of the Site between March 4 and April 16, 2002.These data indicated that 35 residential wells had been impacted to some extent by
VOCs in groundwater. As a result, in the summer of 2003 the NDEQ conducted privatewell sampling at residences within the Stolley Park Neighborhood and at locations to
the southwest (upgradient) and cross-gradient of the CNH Facility. It was determined
that the CVOCs were not confined to the Stolley Park Neighborhoods but also includedareas upgradient of the CNH Facility (Terra Tech March 2004).
Following these findings, the U.S. EPA, CNH, and NDEQ conducted separate
independent investigations at locations upgradient, cross-gradient, and downgradient ofCNH's plant. These investigations culminated in a very substantial groundwatermonitoring effort at over 76 distinct locations as delineated by 296 groundwater
samples. The first investigative effort was initiated by the NDEQ in August 2003,followed by the U.S. EPA in October and November 2003, and finally CRA in November
and December 2003. These investigative efforts are summarized in the CRA reportdated February 2004. Following this effort, additional groundwater sampling was
conducted at the CNH Facility in March 2004 from the existing monitoring wells and at
several other locations upgradient and sidegradient to CNH. This investigation is
summarized in the CRA report dated May 2004. In addition to the reports issued by
018925(21) 7 CONESTOGA-ROVERS & ASSOCIATES
CRA, the consultant performing the investigations on behalf of the U.S. EPA, namelyTetra Tech EM, Inc., (Tetra Tech) also provided a final updated report summarizing theirfindings (Terra Tech August 2004).
Concurrent with the investigations described above, a Removal Action was conducted atthe CNH Facility from September 2003 to January 2004 within the Bum and BurialAreas. The Removal Action is summarized in the CRA report dated March 2004.
Private wells were sampled on behalf of CNH, by CRA on two separate occasions withinthe Stolley Park/Parkview Neighborhoods. In November/December 2003 twenty-sixprivate wells were sampled. In March 2004 128 private wells were sampled. Thesesampling activities are summarized in the CRA reports dated February 2004 andMay 2004.
In August 2004 Tetra Tech conducted a groundwater investigation directly east of theCNH Facility in the Brentwood Subdivision and installed monitoring wells within theStolley Park Neighborhood. In addition, air samples for sub-slab vapor and indoor airquality were collected at selected residences within the Stolley Park, Castle Estates andFireside Estates Neighborhoods. This investigation is summarized in the Terra Techreport dated November 2004.
In May, June and December of 2005, Terra Tech sampled private wells in the Stolley ParkNeighborhoods and also conducted a groundwater investigation to the west of theCastle Estates Neighborhood. The private well sampling is summarized in the TerraTech report dated October 2005, which was received by CRA in January 2006. Data setswere provided by Tetra Tech to CRA for the groundwater investigation to the west ofCastle Estates. In February 2006, additional groundwater samples were collected byCRA at two locations immediately to the west of the CNH Property as discussed inSection 4.3.
2.2 SUMMARY OF SEDIMENT ANDSURFACE WATER SAMPLING ACTIVITIES
In accordance with the "scoping" requirement of the Scope of Work (SOW) associatedwith the AOC, sediment and surface water samples were collected from the Brentwoodand Kenmare Gravel Pit Lakes.
018925(21) 8 CONESTOGA-ROVERS & ASSOCIATES

2.2.1 SAMPLE LOCATION AND ANALYSIS
The locations of both gravel pit lakes are shown on Figure 1.1. Sediment and surfacewater samples were collected from locations at the bottom of each of the gravel pit lakesin the Brentwood and Kenmare Subdivisions shown on Figures 2.1 and 2.2. A total offive locations were sampled at the Brentwood Gravel Pit Lake and four locations weresampled at the Kenmare Gravel Pit Lake. Both sediment and surface water sampleswere analyzed for chlorinated volatile organic compounds (CVOCs).
2.2.2 SURFACE WATER SAMPLING PROCEDURES
Surface water samples were collected from approximately 6 to 8 inches below the watersurface as follows:
• The sample location was located and approached in such a manner so as not todisturb any sediment or algae in the water.
• A precleaned, unpreserved, laboratory-supplied jar was used to collect the surfacewater sample which was then transferred to the appropriate laboratory-suppliedsample containers (preserved 40-mL vials).
• The laboratory-supplied jar used for sample collection was discarded and a new jarwas used at the next sample location.
• After sampling, the 40-ml sample vials were placed inside a cooler on ice.
Field parameters including temperature, pH, and conductivity were measured at eachsurface water sampling location using a pre-calibrated multi-meter. The depth of eachlake was measured using a depth meter attached to the boat. The results are provided inTable 2.2.
The samples, once collected, were placed in a cooler on ice and submitted to thelaboratory for CVOC analysis (EPA Method 8260B).
2.2.3 SEDIMENT SAMPLING PROCEDURES
The first sediment sample was collected using a sediment coring device. However, thesediment coring device was abandoned and a petit ponar grab sampler4 was used for all
The petit ponar grab sampler was an approved alternate sediment sampling technique ascontemplated by the USEPA-approved Work Plan for this sampling event.
018925(21) 9 CONESTOGA-ROVERS & ASSOCIATES

subsequent samples due to the depth of the lakebed and the inability of thesediment-coring device to sustain the sediment in the coring device while retrieving thedevice from the lakebed. Sediment was extruded from the petit ponar, onto a cleanplastic liner (in order to collect a representative sample from the entire sampling depth)and sampled immediately for CVOCs with an En Core® sampling device.
Sediment was sampled from a depth of approximately 2 to 8 inches below the surface ofthe lakebed. After collection, the sediment was then extruded from the petit ponar grabsampler and placed on a clean plastic liner. An En Core® discrete sampler device wasused to collect the sample. The samples were then placed in a cooler on ice andsubmitted to the laboratory for CVOC analysis (EPA Method 8260B). It is notanticipated that these sampling methods would have caused appreciable loss of VOCs insediments since an aliquot of the extruded sample was transferred immediately to anEn Core® discrete sampler in accordance with U.S. EPA SW-846 Method 5035.Moreover, even if substantive VOC losses were assumed to have occurred, they wouldhave to exceed 90% to affect the ecological risk assessment as the first quantitativecomparison of the resultant data is to ESVs.5 The ESVs are values produced by USEPARegion V that are substantially higher than the reported sample concentration of TCE at0.0091 mg/kg at SD-3.
2.2.4 QUALITY ASSURANCE/QUALITY CONTROL (QA/QC) SAMPLES
Quality Assurance/Quality Control (QA/QC) samples were collected for sediment andsurface water samples as follows:
Sediment:
Additional sample volume was provided to the laboratory for matrix spike/matrix spikeduplicate (MS/MSD) sample analysis. An MS/MSD sample was collected at samplelocation SD-6.
An equipment rinsate blank sample was collected by rinsing the surface of thepreviously decontaminated sediment sampling equipment (petit ponar grab sampler)with laboratory-supplied deionized (DI) and collecting the DI water rinsate in 40 mLvials containing preservative.
ESV = Ecological Screening Values.
018925(21) 10 CONESTOGA-ROVERS & ASSOCIATES
Surface Water:
A field duplicate sample of surface water was collected at sample location SW-8 byfilling two sets of sample containers from the same sampling location.
One trip blank sample, provided by the laboratory, was placed in the shipping coolercontaining sample vials for surface water samples to be analyzed for CVOCs.
A sediment and surface water sample key is provided in Table 2.3.
2.2.5 SAMPLE NUMBERING SYSTEM
The sample numbering system included the sample identification number, place ofcollection, date of collection, and analyses to be performed. Each sample was labeledwith a unique sample identification number that facilitated the tracking andcross-referencing of sample information. The sample numbering system is describedbelow:
Example: GW-060102-XX-001
Where:
SD - designates types of sample (SD-sediment, SW-surface water)060102 - designates date of collection presented as month/day/yearXX - sampler's initials001 - sequential number starring with 001
2.2.6 DOCUMENTATION
A summary of activities performed at the Site was recorded in the designated projectfield logbook. The entries for each day were started on a new page, which was dated atthe top. Corrections were made by marking through the error with a single line, so as toremain legible, and initialing the action followed by writing the correction. The fieldlogbooks generated were numbered consecutively and maintained at the office of theproject manager, namely CRA's Chicago office.
018925 (21) 11 CONESTOGA-ROVERS & ASSOCIATES
The following information was recorded in the field log book for each sample collected:
i) unique sample identification number;
ii) date and time of sample collection;
iii) designation as to the type of sample (surface water, sediment, etc.);
iv) designation as to the means of collection (grab, dredge, etc.);
v) name of the sampling personnel;
vi) analyses to be performed on each sample; and
vii) any other relevant comments such as odor, staining, texture, color, preservation,
etc.
2.2.7 SAMPLE DOCUMENTATION
Chain-of-custody records were used to track samples from the time of collection to thearrival of the samples at the laboratory. Each sample container shipped to the
laboratory contained a chain-of-custody form. The chain-of-custody form consisted offour copies that were distributed to the sampler, to the shipper, to the contract
laboratory, and to the project office file. The sampler and shipper maintained theircopies while the other two copies were enclosed in a waterproof enclosure within the
sample container. The laboratory, upon receiving the samples completed the remainingcopies. The laboratory retained one copy for its records. The executed original was
returned to CRA with the data deliverables package.
Samples were placed in a cooler, labeled (as indicated previously), and properly sealed.The samples were cushioned within the shipping coolers by the use of bubble packwrapping. The samples were kept cool by the use of sealed plastic bags of ice. A
chain-of-custody seal was placed over the lid on the front and back of each shippingcooler. The samples were then shipped to the project laboratory by commercial courier.
2.2.8 SURFACE WATER SAMPLINGDECONTAMINATION PROCEDURES
A precleaned, unpreserved, laboratory-supplied jar was used to collect the surface water
sample which was then transferred to the appropriate laboratory-supplied sample
containers (40 mL vials). The laboratory-supplied jar used for sample collection
purposes was discarded and a new jar used at the next sample location. Therefore there
018925(21) 12 CONESTOGA-ROVERS & ASSOCIATES
was no necessary decontamination of any equipment. The duplicate sample wascollected concurrently with the original samples.
2.2.9 SEDIMENT SAMPLING DECONTAMINATION PROCEDURES
The sampling equipment (sediment corer and petit ponar grab sampler) weredecontaminated prior to field use and after each sample was collected to prevent thepotential for cross-contamination between samples. The equipment wasdecontaminated as follows:
i) the equipment was washed with potable water and Alconox™ detergent using abrush to remove all visible foreign matter;
ii) rinsed thoroughly with potable water;
iii) rinsed thoroughly with distilled water; and
iv) air dried on a clean plastic sheet.
Following the final rinse, the equipment was visually inspected to verify that it was freeof sediment and other solid material that could have contributed to possiblecross-contamination.
2.2.10 INVESTIGATION DERIVED WASTE MANAGEMENT
Waste handling protocols were followed in accordance with Nebraska Title 128 and theNDEQ Environmental Guidance Document entitled "Investigation Derived Waste (1DW)and Remediation Waste Consideration". Wastes that were handled at the Site includedIDW and general waste. IDW wastes included sampling gear, excess sediment fromsampling and decontamination fluids.
Liquids
There were no liquids generated during the sampling event except for decontaminationfluids that were transferred to a 55-gallon drum which was located at the CNH Facilityfor subsequent appropriate disposal.
018925(21) 13 CONESTOGA-ROVERS & ASSOCIATES

Personal Protective Equipment
All personal protective equipment were placed in plastic bags and disposed of at theend of the day.
2.2.11 SURVEYING
A Global Positioning System (GPS) survey of sediment and surface water samplinglocations was performed, using a Leica Geosystems GS20 Professional Data Mapper toprovide horizontal control. This equipment provides sub-meter horizontal accuracy.These data were incorporated within the existing base map.
2.3 SUMMARY OF PIEZOMETER INSTALLATIONAND DEVELOPMENT
Nine piezometers (PZ-101 through PZ-110, excluding PZ-105) were installed during thisinvestigation from May 9 to May 10, 2006 across the southwestern portion of GrandIsland as shown on Figure 2.3. The piezometers were installed to depths of up to 35 feetin order to obtain groundwater elevation measurements. This field program wasundertaken to evaluate groundwater flow in the Northern Study Area.
The piezometers were advanced using hollow-stem auger (HSA) drilling methods. Eachpiezometer was constructed with a one-inch diameter (No. 10 slot) polyvinyl chloride(PVC) well screen, 20 feet in length, attached to a sufficient length of one-inch diameterPVC riser pipe extending to ground surface. All piezometer locations were completedas flush to ground surface inside a pre-fabricated vault and finished in such a manner soas to allow appropriate surface drainage. The piezometers were installed usingprocedures outlined in the Field Sampling Plan (FSP) provided in the NDEQ-approvedRevised Work Plan (RWP), (CRA August 2002)6 and in accordance with the work scope7
provided to, and subsequently authorized by, U.S. EPA8.
Table 2.4 provides the completion details for the piezometers. During construction ofthe piezometers, a medium to coarse sand was used to create the filter packs. The sand
The RWP was submitted by Conestoga-Rovers & Associates (CRA) pursuant to conducting aninvestigation under the NDEQ Remedial Action Plan Monitoring Act (RAPMA) program(I.D. 36-336-4917) signed on November 3, 2000 by CNH. A copy of the FSP is attached hereto forthe convenience of the U.S EPA as Attachment A.As set out by Memorandum (Bruce Clegg to Robert Weber) dated April 28, 2006.Personal communication (via e-mail, Robert Weber, U.S. EPA to Bruce Clegg) dated May 2, 2006.
018925(21) 14 CONESTOGA-ROVERS & ASSOCIATES

was emplaced between 4.0 to 5.0 feet above the top of the screen and a seal consisting ofpelletized bentonite was added above the filter pack to provide a minimum 2-foot seal.Bentonite chips were added to complete the piezometer to ground surface.
The newly-installed piezometers were developed using a peristaltic pump to allowadequate hydraulic communication between the screened section and the adjacentformation. The piezometers were developed by pumping and surging for 30 to45 minutes until the groundwater appeared clear. To ensure adequate development,extracted groundwater was monitored for specific conductance, pH, temperature, andturbidity until these parameters stabilized and the groundwater was clear (Table 2.5).
All investigative-derived waste (IDW) was handled in accordance with the proceduresoutlined in the Investigative Derived Waste Plan (IDWP) provided as Appendix C of theU.S. EPA-approved Remedial Investigation Work Plan for the Site. All IDW liquids andsolids were containerized and have been stored at the CNH Facility for future disposal.
A Global Positioning System (GPS) survey of the newly installed piezometer locations aswell as existing wells owned by the City of Grand Island was performed, by a licensedNebraska Surveyor.
Once the piezometers had been adequately developed the day following piezometerinstallation, a water level elevation survey was conducted (see Figure 2.3).
2.4 SUMMARY OF SUPPLEMENTAL STRATIGRAPHIC DEFINITION
Soil samples were collected at PZ-106 and PZ-109 and described in the field according tothe unified soil classification system (USCS). Soil samples were collected using a 2-footlong split spoon sampling device at intervals of 5 feet except where a change instratigraphy was noted whereupon samples were collected continuously. Boring logsare provided in Appendix C.
018925(21) 15 CONESTOGA-ROVERS & ASSOCIATES
3.0 SITE CHARACTERISTICS
3.1 METEOROLOGY
The following local climatological information was compiled from the Groundwater
Atlas of Nebraska, 1998 unless otherwise specified. The climate for the Site borders
between dry subhumid and moist subhumid. The climate in Nebraska is highly
seasonal. The mean annual temperature is approximately 50 degrees Fahrenheit (°F).
The hottest month of the year is July and the coldest is January. The precipitation over
Hall County ranges between 24 to 26 inches per year (in/yr). Typically, more than
75 percent (16.5 to 18 in/yr) of this annual precipitation falls during the growing season
and nearly half of this rainfall is in the form of thunderstorms (CSD 1969, Keech and
Dreeszen 1964). The prevailing wind in the summer is from the south and in the winter
is from the northwest. The wind is generally moderate to strong in the summer, which,
in combination with the high temperature and low humidity, causes high
evapotranspiration rates.
3.2 TOPOGRAPHY AND SURFACE HYDROLOGY
Land surface across the Site is generally flat and is covered by either grass or impervious
surfacing including asphalt and concrete. Surface water bodies within the Northern
Study Area include two gravel pit lakes referred to as Brenrwood and Kenmare Gravel
Pit Lakes as well as the "Duck Pond" located on the CNH property. In addition, the
Wood River is located to the south, southeast and east of the Northern Study Area. The
Wood River flows northeast along the southern boundary of the City as a tributary of
the Platte River. At its closest point, the Wood River is within one mile from theNorthern Study Area. The most significant surface water body in the vicinity of the Site
is the Platte River, which is located approximately 4 miles to the south and 6 miles east
of the Site, and is a major influencing factor for groundwater flow and direction.
3.3 REGIONAL GEOLOGY AND HYDROGEOLOGY
3.3.1 REGIONAL GEOLOGY
The geology in Hall County consists of extensive fluvioglacial (glacial river) Quaternary
deposits (up to 200 feet thick in the Grand Island area) that overlay the Tertiary System
Ogallala Formation (LJSGS, 1940 and 1973). Major episodes of the Pleistocene glaciarions
were primary formative factors in the surface and unconsolidated subsurface deposits of
018925(21) . 16 CONESTOGA-ROVERS & ASSOCIATES
this region (COHYST, March 2005). These Pleistocene deposits consist of sands and
gravels of the Holdrege and Grand Island Formations and sandy clay and silt deposits of
the Fullerton and Upland Formations (USGS, 1940). The Upland Formation is a sandy
clay that overlies the upper sand and gravel deposit (Grand Island Formation). The
Fullerton Formation separates the two sand and gravel deposits (Holdrege and Grand
Island Formations). The Upland Formation is absent in the Platte River Valley near
Grand Island. The Pleistocene deposits are overlain by loess in some areas. TheOgallala Formation is composed of lenticular and shoestring deposits of sand, silt, andclay and poorly cemented sandstone, siltstone, and claystone (Keech and Dreeszen
1964). The Ogallala Formation is not continuous throughout the region. Table B-l inAppendix D provides logging information of a test hole (Test Hole: ll-9-30daaa) drilled
by the United States Bureau of Reclamation (USER), in 1965 to a depth of approximately222.0 feet below grade. The test hole was drilled in the southwestern portion of the City
of Grand Island.
3.3.1 REGIONAL HYDROGEOLOGY
The High Plains aquifer underlies a significant portion of Hall County and consists
primarily of Quaternary age deposits. The High Plains aquifer can be divided into
separate hydrostratigraphic units as described by the Cooperative Hydrology Study(COHYST), March 2005 Report. These hydrostratigraphic units are geologic units that
are grouped based on hydraulic properties such as water storage capacity and
permeability. Figure 3.1 shows a Stratigraphic description of geologic and
hydrostratigraphic units as described in the COHYST March 2005 Report. The regional
Quaternary surficial aquifer is composed of moderately high permeability sand and
gravel stream deposits ranging in thickness from 100 feet or greater within Hall County.This aquifer is defined as the principal ground water reservoir within the Platte River
Valley groundwater region. High yields (up to 200,000 gallons per day) of good qualitywater are obtained from alluvial sand and gravel for municipal water supply.
A review was conducted of the regional water levels and groundwater flow direction.
Groundwater in the Platte River Valley of Hall County flows parallel to the Platte Riverand Wood River in a northeasterly direction as shown in Appendix D (Keech and
Dreeszen, 1964; Figure 4). A review of the COHYST March 2005 report also shows thatgroundwater flow in the region is predominantly in a northeasterly direction flowing
parallel to the Platte River shown in Figure 3.2.
On the basis of over fifty years of regional data and the collection of local groundwater
elevations by the City of Grand Island, their consultant, and CRA, groundwater flow
018925(21) 17 CONESTOGA-ROVERS & ASSOCIATES
direction in the City of Grand Island is generally to the east-northeast. No significantperturbations to the flow regime were evident from any of the data reviewed as a resultof seasonal fluctuations due to varying recharge rates or anthropogenic influences(e.g., irrigation, municipal and residential well pumping). In short, apart from minor,localized, variations, groundwater generally flows to the east-northeast withoutvariation.
The regional groundwater flow direction as outlined above is confirmed by thefollowing:
• The City consultant's report on groundwater elevations (Lutz, May 1994) that showsthat groundwater flow is in a predominantly northeasterly direction across the Cityusing data collected since 1935-
• Groundwater contours produced using data derived from the City of Grand Islandpiezometer network from 1998 to 2004 (City of Grand Island, Groundwater MapSifter Database) showing a northeasterly flow direction in the southeastern portionof Grand Island as provided in Appendix E.
• Groundwater flow at the Cleburn Well Superfund Site in Grand Island also flows tothe northeast as stated by U.S. EPA's Superfund Record of Decision in 1996, asfollows: "Groundwater flows in a northeasterly direction in the vicinity of the Site"(ROD 1996, Section 5).
• Groundwater flow at the Cornhusker Army Ammunition Plant (CHAPP) flows tothe east-northeast as stated in several U.S. EPA RODs. For example, Record ofDecision Amendment (RODA) for Operable Unit (OU) 03 states the following, "Thechlorinated solvent detections for this sampling event suggest a narrow elongatedplume extending to the northeast, in the general direction of groundwater flow"(ROD 1999). The ROD for OU 01 states that, "The explosive compounds havemigrated east-northeast with the predominant direction of groundwater flow" (ROD2001).9
3.4 SITE GEOLOGY AND HYDROGEOLQGY
3.4.1 SITE GEOLOGY
At the CNH Property, the surficial soil consists of fill (sands/gravels with cindersand/or silty clay) to depths of up to 5 feet bgs that is underlain by native silty clay with
U.S. EPA's findings with respect to contaminant flux at Cornhusker is almost identical to theplume geometry and flow direction for the Southern Plume elucidated thus far by U.S. EPA.
018925(21) 18 CONESTOGA-ROVERS & ASSOCIATES
sand that extends to depths of up to 12 feet bgs. The native silty clay overlies a sand andgravel layer that extends to approximately 83 to 89 feet bgs, and is underlain by clay soilbelow to 89 feet bgs. To the east of the CNH Property the soils are composed mostly ofmedium to coarse-grained gravelly sands to a depth of approximately 30 to 35 feet bgs.A discontinuous layer of silt is present between 30 to 40 feet bgs varying in thicknessranging from 5 to 10 feet. Underlying the discontinuous silt layer is a fine to mediumgrained sand extending to the top of the clay unit present at a depth of approximately80 feet bgs. Figures 3.3 and 3.4 provide the location and the corresponding cross sectionacross the Site starring from the southwestern portion of the CNH Property and endingwithin the Stolley Park neighborhood near Parkview Well No. 2 at PZ-109, (City ofGrand Island, November 2005). Soil boring and monitoring well construction logs areprovided in Appendix C.
3.4.2 SITE HYDROGEOLQGY
The native surficial soil in the Site area falls within the Hall-Wood River soil association.This group of soils developed on broad stream terraces, have a moderate permeabilitysuch that they permit much of the precipitation to infiltrate (Keech and Dreeszen, 1964).Below these surficial soils, Pleistocene sand and gravel units extend to the OgallalaFormation and compose the surficial aquifer at the Site.
Beneath the majority of the City, groundwater flow is predominantly in a northeasterlydirection but may vary somewhat locally. In order to address local variations in flowacross the Northern Study Area, a water level elevation survey was undertaken, asdiscussed in Section 2.3. Figure 2.3 provides the monitoring well and piezometernetwork. Figure 3.5 provides a contour map10 showing groundwater level elevationsand flow directions across the Northern Study Area. On the basis of this information,groundwater flow is in a predominantly easterly direction across the CNH Property. Asthe groundwater flow continues its movement to the east beyond the CNH property,groundwater flow direction curves to the north to adopt an east-northeast directionacross the balance of the Northern Study Area. A groundwater flow direction arrowwas placed on the groundwater contours in order to depict groundwater flow directionusing Biorracker VI.I for Modeling Natural Attenuation, Remediation Toolkit VI .2.
Hydraulic response tests were conducted at the CNH Property (CRA February 2003).The hydraulic response test data provided average hydraulic conductivity values of
10 Groundwater contours were developed using Surfer, Version 8.02 produced by Golden Software,Inc.
018925(21) 19 CONESTOGA-ROVERS & ASSOCIATES
0.04 centimeters per second (cm/s) for the upper aquifer wells, 0.074 cm/s for theintermediate wells, and 0.085 cm/s for the deepest wells.
018925(21) 20 CONESTOGA-ROVERS & ASSOCIATES
4.0 NATURE AND EXTENT OF CONTAMINATION
4.1 OVERVIEW
As discussed in Section 2.1, a number of previous investigations have been conducted,which provide the database for the Remedial Investigation. This was supplemented bythe surface water and sediment sample data collected from the Brentwood and KenmareGravel Pit Lakes, water level elevation measurements and evaluation of stratigraphyand samples collected to the west of CNH as discussed by Section 4.3. This sectionpresents the CVOC data from the previous and current investigations.
4.2 DATA USABILITY
All CRA data were validated, and the precision and accuracy of the analyses wereassessed based on surrogate spike recoveries, MS/MSD recoveries and correspondingrelative percent differences (RPDs), sample/sample duplicate RPDs, field duplicatesample results, and check sample results. The results of the data quality assessment andvalidation procedure indicated that the data are suitable for their intended use with thequalifications presented in the validation memoranda. The data validationmemorandum for the surface water and sediment sampling event is provided inAppendix F. The associated laboratory data and chain-of-custody forms are providedin Appendix G. All analytical data generated by U.S. EPA/Terra Tech were reportedlyvalidated and assigned relevant data quality qualifiers where appropriate.
4.3 GROUNDWATER
Table 1 in Appendix H provides a summary of CVOC data in groundwater from theNorthern Study Area and the Southern Plume. These results have been compiled fromthe existing database and include geoprobe groundwater sampling locations advancedby CRA, the NDEQ and U.S. EPA during the course of various investigations (outlinedin Section 2.1) and also includes monitoring wells sampled at the CNH Facility. Table 1in Appendix H also includes groundwater data collected by CRA from the areaimmediately west of the CNH Property in February 2006, as discussed in Section 2.1.The sample locations are identified as Boring 1 and Boring 2 and are shown onFigure 4.1." Two samples were collected and analyzed for CVOCs at each location, atdepths of 20-24 feet bgs and 40-44 feet bgs, using procedures consistent with those used
Figure 4.1 shows all detected CVOCs. For sample locations that have multiple samples over thesame sampling event, only the highest concentration is shown.
018925(21) 21 CONESTOGA-ROVERS & ASSOCIATES
by CRA for the previous investigations. No CVOCs were detected in any samples from
the two locations. The purpose of these samples was to augment the data used for
plume mapping, which is presented in Section 5.3.5.
Figure 4.1 includes data collected by CRA from 2002 to the present and data collected by
Terra Tech prior to 2005.
On the basis of the data shown on Figure 4.1, the groundwater plume conditions can be
interpreted and plotted. This is discussed further in Section 5.3.
4.4 SOIL, SEDIMENT AND SURFACE WATER
4.4.1 SOIL AND SEDIMENT ON CNH PROPERTY
Tables 2, 3 and 4 in Appendix H provide a summary of CVOC data in soil and sediment
within the CNH property. These results have been compiled from the existing databaseand include sediment samples taken from the Duck Pond as well as data from various
investigations and the post-excavation data from the Removal Action. The tables
include all data that are representative of existing soils i.e., were not removed during the
Removal Action. The locations of the soil and sediment samples are presented on the
figures in Appendix B. As shown on the tables, the CVOCs were not detected in the vast
majority of samples and in any event residual soil and sediment CVOC concentrationswere less than the conservative Region IX Preliminary Remediation Goals (PRGs). This
is discussed further in Section 5.2.
4.4.2 SURFACE WATER AND SEDIMENTWITHIN THE GRAVEL PIT LAKES
Tables 5 and 6 in Appendix H provide a summary of CVOC data in surface water and
sediment associated with the Brentwood and Kenmare Gravel Pit Lakes that weresampled in September 2005. Figure 4.2 provides databox summaries of CVOCs in
surface water and sediment, as presented in Tables 5 and 6 in Appendix H. As shown inthe tables and on the figures, the CVOCs were not detected in any samples with thefollowing exceptions. 1,1-DCA was detected at a concentration of 0.23J ug/L12 in one
"The sample(s) that contain results between MDL [Method Detection Limit] and RI [ReportingLimit] were flagged with "J". There is a possibility of false positive or mis-identification at thesequantitarion levels. In analytical methods requiring confirmation of the analyte reported,confirmation was performed only down to the standard reporting limit (SRL). The acceptablecriteria for QC samples may not be met at these quantitarion levels." STL Laboratories.
018925(21) 22 CONESTOGA-ROVERS & ASSOCIATES

surface water sample, collected from location SW-5, within the northeast portion of
Brentwood Gravel Pit Lake. TCE was detected at a concentration of 0.0091J mg/kg in
one sediment sample, collected from location SD-3, within the central portion of
Brentwood Gravel Pit Lake.
4.5 PRIVATE AND MUNICIPAL POTABLE WATER WELLS
Table 1 in Appendix I provides a summary of CVOC data in private wells in the portion
of the Stolley Park/Parkview neighborhood bonded by South Blaine Street to the west,
Pioneer Boulevard to the south and east and Stolley Park Road to the north. Table 2 in
Appendix I provides a summary of CVOC data from 1999 to 2001 in four municipal
wells sampled in the Stolley Park/Parkview neighborhood, namely Parkview Wells 1, 2,
3 and Stolley Park.
Figure 4.3 provides the locations of the private and municipal wells in the area of the
Stolley Park/Parkview neighborhood. As shown on Tables 1 and 2, CVOCs were
detected at some private wells, which are associated with the Southern Plume.
018925(21) 23 CONESTOGA-ROVERS & ASSOCIATES

5.0 CONTAMINANT FATE AND TRANSPORT
5.1 OVERVIEW
Previous investigations have identified the presence of CVOCs in groundwater in the
Northern Study Area, in two plumes, herein referred to as the Northern Plume and the
Southern Plume. Northern Plume residual contamination from the former Burn and
Burial Areas in the Northern Study Area migrates towards the Stolley Park/Parkview
Area at levels below MCLs. Concentrations of 1,1-DCE and 1,1-DCA east of the
Brentwood Gravel Pit Lake are at or below PQLs and, in any event, are the only CVOCs
detected in relation to the Northern Plume based on the currently available data.
Alternatively, the Southern Plume extends from the area around Husker Highway and
Engleman Road and, consistent with the local groundwater flow regime, continues on
through the Castle Estates, Mary Lane, Bradley, Kentish Hills through to the
Parkview/Stolley Park subdivisions with concomitant MCL exceedences for various
CVOCs.
The source area characteristics are discussed in Section 5.2. The groundwater plume
characteristics and related fate and transport mechanisms are discussed in Section 5.3.
5.2 NORTHERN STUDY AREA WASTE CHARACTERISTICS
5.2.1 BACKGROUND
As discussed above, there are two groundwater plumes that are relevant to the
discussion of the Northern Study Area, i.e., the Northern Plume and the SouthernPlume. The source area for the Southern Plume appears to be located in the vicinity of
the intersection of Husker Highway and Engleman Road. Investigations conducted by
TerraTech in 2005, on behalf of U.S. EPA have identified the presence of elevated
concentrations of various CVOCs including: 1,1,1-TCA (1,700 ug/L at GP-116-25),1,1-DCE (510 ug/L at GP-142-35), and PCE (590 ug/L at GP-142-35).
Three areas of interest (AOI) located on the CNH property were identified in previous
investigations (see Section 2.1). These areas are the Burial Area, the Burn Area, and the
Duck Pond. Figure 5.1 shows the extent of the Bum and Burial areas as estimated by a
geophysics survey conducted in 2002. The Bum Area is located in the south-central
portion of the facility and the Duck Pond is located in the southeastern part of the
facility. It is noted, however, that the Duck Pond was eliminated as an AOI on the basis
018925(21) 24 CONESTOGA-ROVERS & ASSOCIATES
of the characterization results produced by the October 2002 investigation under theNDEQ's RAPMA Program. The Burial Area is located at the southwestern corner of theproperty. Details regarding the AOIs are provided in the work plan for the RemovalAction (CRA, August 2003) and were summarized previously herein.
The Removal Action was undertaken by CNH to address the Burn and Burial Areas,beginning in October 2003. The excavation activities were completed in January 2004,and are documented in a final report (CRA, March 2004). Figure 5.1 shows the limits ofexcavation for the Removal Action conducted in 2003/2004. Post-excavation sampleswere collected at the base and side walls of each excavation area. The analytical resultswere compared against site-specific target soil cleanup levels and U.S. EPA Region IXPRGs for direct contact Industrial land use and U.S. EPA soil screening levels forleaching to groundwater [dilution attenuation factor (DAF) 20]. The analytical resultsfor the Burn and Burial areas indicate that residual concentrations at the base and sidewalls of each excavation are below all respective assessment criteria, and/or withinnatural background ranges for metals. It was concluded that the Removal Actionsuccessfully resulted in the removal of buried waste material and impacted soil materialand no further action is required with respect to soil conditions. The work wasconducted under the NDEQ's RAPMA program with NDEQ oversight.
5.2.2 SOIL CHARACTERIZATION
Residual concentrations of chlorinated alkenes and alkanes in soil are characterized bythe results of soil sampling from previous investigations and the Removal Action asoutlined in Section 2.1. Appendix J provides a copy of the Removal Action Report (CRAMarch, 2004).
In total, approximately 300 soil and sediment samples were analyzed for VOCs,including chlorinated alkenes and alkanes. The data are tabulated in Appendix H.Table 2 in Appendix H includes the analytical results from the various samplingprograms identified above. The tables exclude data for soil samples that are notrelevant, i.e., samples that were collected from areas that were subsequently excavatedduring the Removal Action. The analytical data for relevant soil and sediment samplesare summarized below.
018925(21) 25 CONESTOGA-ROVERS & ASSOCIATES
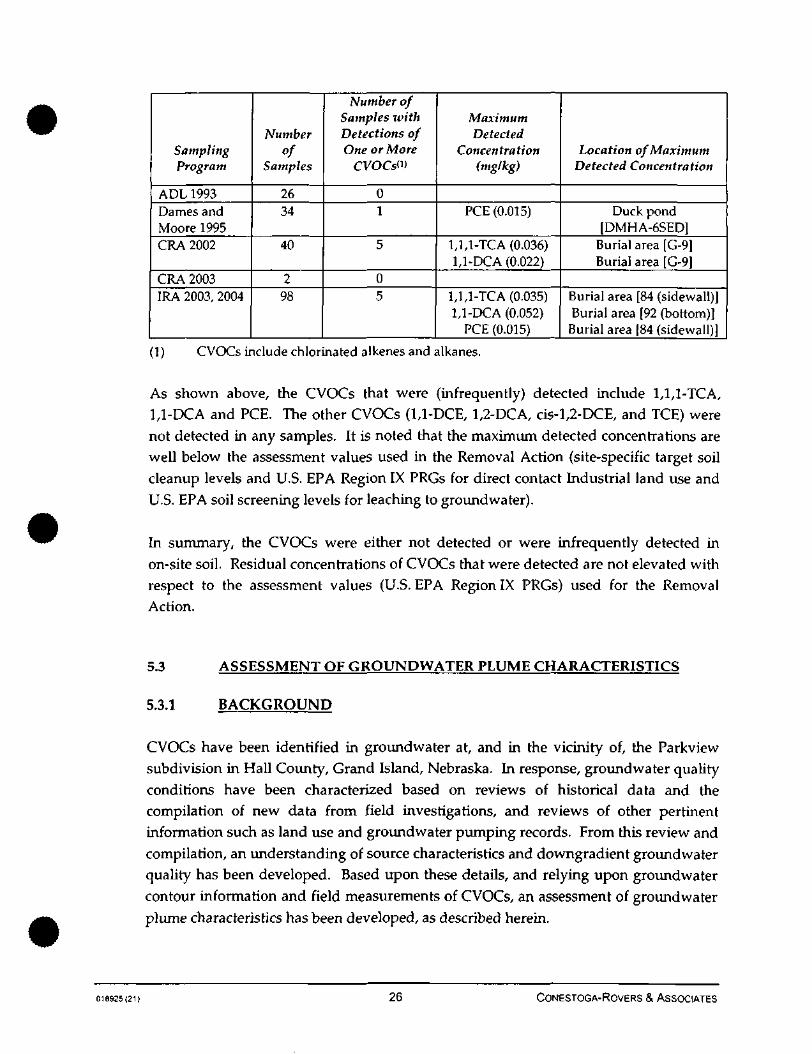
SamplingProgram
ADL 1993Dames andMoore 1995CRA 2002
CRA 2003IRA 2003, 2004
Numberof
Samples
2634
40
298
Number ofSamples withDetections ofOne or More
CVOCsW
01
5
05
MaximumDetected
Concentration(mg/kg)
PCE (0.015)
1,1,1-TCA (0.036)1,1-DCA (0.022)
1,1,1-TCA (0.035)1,1-DCA (0.052)
PCE (0.015)
Location of MaximumDetected Concentration
Duck pond[DMHA-6SED]
Burial area [G-9]Burial area [G-9]
Burial area [84 (sidewall)]Burial area [92 (bottom)]
Burial area |84 (sidewall)]
(1) CVOCs include chlorinated alkenes and alkanes.
As shown above, the CVOCs that were (infrequently) detected include 1,1,1-TCA,1,1-DCA and PCE. The other CVOCs (1,1-DCE, 1,2-DCA, cis-l,2-DCE, and TCE) werenot detected in any samples. It is noted that the maximum detected concentrations arewell below the assessment values used in the Removal Action (site-specific target soilcleanup levels and U.S. EPA Region IX PRGs for direct contact Industrial land use andU.S. EPA soil screening levels for leaching to groundwater).
In summary, the CVOCs were either not detected or were infrequently detected inon-site soil. Residual concentrations of CVOCs that were detected are not elevated withrespect to the assessment values (U.S. EPA Region IX PRGs) used for the RemovalAction.
5.3 ASSESSMENT OF GROUNDWATER PLUME CHARACTERISTICS
5.3.1 BACKGROUND
CVOCs have been identified in groundwater at, and in the vicinity of, the Parkviewsubdivision in Hall County, Grand Island, Nebraska. In response, groundwater qualityconditions have been characterized based on reviews of historical data and thecompilation of new data from field investigations, and reviews of other pertinentinformation such as land use and groundwater pumping records. From this review andcompilation, an understanding of source characteristics and downgradient groundwaterquality has been developed. Based upon these details, and relying upon groundwatercontour information and field measurements of CVOCs, an assessment of groundwaterplume characteristics has been developed, as described herein.
018925(21) 26 CONESTOGA-ROVERS & ASSOCIATES
This assessment relies upon knowledge of hydrogeology and CVOC migration and
attenuation characteristics, including information documented in the technical literature,
the specifics of which are described in the subsequent text.
5.3.2 BASICS OF DOWNGRADIENT RESPONSE
5.3.2.1 GROUNDWATER FLOW DIRECTION
The CNH facility is located south of Stolley Park Road and West of Highway 281. The
portion of the CNH facility of relevance to this assessment is the area of the former burn
and burial area. As indicated in Section 3.4.2, on the basis of groundwater elevations and
flow directions across the Northern Study Area, groundwater flow is in a predominantlyeasterly direction across the CNH property. As the groundwater flow continues its
movement to the east beyond the CNH property, the groundwater flow direction curvesto the north to adopt an east-northeast direction across the balance of the Northern
Study Area. Further illustrations of the basis for this direction of movement are shownon Figure 3.5.
While the description provided above relies upon the groundwater contours in
Figure 3.5 the very extensive empirical database, comprised of hundreds of individual
monitoring locations of water quality, are also very important in delineating thedirections of groundwater movement.
A geologic cross-section is presented on Figure 3.4 which indicates soil stratigraphy
from the western boundary of the CNH property to the vicinity of Parkview Well No. 2municipal well. While there are relatively low permeable stratigraphic layers in the
vicinity of the CNH property the absence of these layers in the cross-section in thevicinity of Parkview Well No. 3, most notably MW1-TT and MW2-TT, is noted.
5.3.2.2 IDENTIFICATION OF CVOCS PRESENT
Analytical results for samples collected from Parkview Well No. 3 in August 2001
identified the presence of CVOCs including 1,1,1-TCA, 1,1-DCE and PCE. 1,1-DCE was
detected at concentrations greater than MCLs in August 2001. A number of field
investigations have followed, which have demonstrated that there are two groundwater
contaminant plumes in the Northern Study Area. The shorter plume originates in the
018925(21) 27 CONESTOGA-ROVERS & ASSOCIATES
southern portion of the CNH property, and the longer plume appears to be originatingnear the vicinity of the intersection of Husker Highway and Engleman Road.
The CVOC concentrations in groundwater associated with the CNH property are likelythe consequence of the former burn pit and burial areas on the southern portion of theCNH property. As discussed previously, the bum pit area operated from June 1966through to June 1975. The burn pit was backfilled and closed in 1975. The burial areaoperated from 1975 to 1980. From October 2003 to January 2004, an extensive removalaction occurred at these two areas. To that end, and as indicated by Appendix J, therewas no determination of characteristic hazardous waste due to the leachability ofCVOCs based on TCLP testing of the disposed soils.
Mobilization of CVOCs from each source area has been affected by the nature of thesource materials, precipitation, infiltration/percolation through the unsarurated soilzone, and migration to the groundwater.
5.3.2.3 FATE AND TRANSPORT OF CVOCS
The ambient environment influences the migration and attenuation characteristics ofCVOCs. Hence, the assessment of the migration and attenuation characteristics ofCVOCs must account for basic knowledge of CVOC behavior in the environment,including the features of the environment which influence the fate and transport of theCVOCs and rely upon extensive technical literature to assess the processes ofattenuation (e.g., dispersion, biodegradarion, dilution, sorption). These many influencesmust be considered in the assessment, to determine how the concentrations of theindividual CVOCs change as they migrate and dissipate through the environment.References to the technical literature for specific features are described in the followingtext.
Daughter Product Formation Sequence
Qualitative assessment of natural attenuation includes determination of thepresence/absence of specific degradation (i.e., daughter) products of the CVOCs todetermine whether CVOCs are undergoing biotic and/or abiotic degradation. Thesedata may also provide an indication of the specific degradation pathways that areprevalent. For example, field measurements of ethene in groundwater may provideevidence of vinyl chloride biodegradation by reductive dechlorination.
018925(21) 28 CONESTOGA-ROVERS & ASSOCIATES
In this context, it is sometimes possible to use the relative ratios of DCE isomers(1,1-DCE, cis-l,2-DCE, and trans- 1,2-DCE) to provide insight into the origin of DCE ingroundwater. For example, when DCE is produced through biodegradation of TCE, theproduction of the cis-l,2-DCE isomer is generally favored over that of trans-l,2-DCE and1,1-DCE (Wiedemeier et al., 1999; Wiedemeier etal., 1996; Carey etal., 1999). Aschematic of the sequence of daughter products is provided as Figure 5.2 (Wiedemeieret al., 1999; U.S. EPA, 1998). It is widely acknowledged in the technical literature thatthe ambient environmental conditions have significant influence on the rate at whichdaughter products form, and the rate at which the degradation occurs (e.g., Lyngkildeand Christensen, 1992; Carey et al., 1999).
Redox Zone Delineation, Including Identification Of Electron Donors And Acceptors
Evaluation of redox indicators is conducted to determine whether conditions areconducive to the natural biodegradation of the CVOCs present. This also involvesevaluation of the specific biodegradation processes that are possible given thesubsurface geochemical conditions (i.e., given the geochemical environment, are CVOCslikely to biodegrade and, if so, what biotransformation reactions may predominate?).
Availability of Organic Substrate
In order for biodegradation to occur, microorganisms require an available source oforganic carbon needed for cell growth. This source of organic carbon, or substrate, maytake the form of natural organic matter, oils, or some VOCs, for example, which havebeen co-disposed.
Presence of Degradation Products
The presence/absence of parent CVOCs (e.g., PCE and 1,1,1-TCA) along with theirdegradation or daughter products, provides strong evidence whether biotic and abioticdegradation plays a significant role in the observed attenuation of the CVOCs.
The parent CVOCs of interest in the Southern Plume include 1,1,1-TCA and PCE.Typical daughter-products for these parent CVOCs may include TCE, 1,1-DCE,1,1-DCA, cis-l,2-DCE, trans-1,2-DCE, vinyl chloride, chloroethane, ethane and ethene,but the formation sequence and relative concentrations are functions of the groundwaterconditions.
Groundwater redox conditions strongly influence the degradation pathways whichoccur at a site and consequently will have a significant influence on which daughter
018925(21) 29 CONESTOGA-ROVERS & ASSOCIATES
products will form during the degradation of a parent compound. The processes thatcontrol the attenuation of compounds in ground water can be grouped into twocategories: non-destructive and destructive. Non-destructive processes result inreductions in dissolved concentrations of compounds over distances and time.Non-destructive natural attenuation processes include:
• dispersion and diffusion;
• dilution;
• sorption; and
• volatilization
Destructive processes destroy the compound's structure, resulting in reductions incompound mass. Destructive attenuation processes include biodegradation and abiotictransformation.
Dispersion/Diffusion and Dilution
A chemical compound in water will move from an area of high concentration toward anarea of lower concentration. In groundwater, chemical compounds are transported at agiven average linear velocity, by advective transport. However, groundwater travels atrates greater than, and less than, the average linear velocity due to the tortuous path thatthe water must take through a porous medium. As a result, because groundwater doesnot all move at the same velocity, mixing will occur along the flow path. This mixing iscalled mechanical dispersion. Further, a chemical compound in water also will movefrom an area of high concentration toward an area of lower concentration independentof advective groundwater flow, by molecular diffusion. The effects of moleculardiffusion and mechanical dispersion are combined into a term frequently calledhydrodynamic dispersion, which essentially describes the spreading and, effectively, thedilution of a compound in groundwater.
Sorption
The term sorption is used to describe the overall effect of various processes that result inthe binding of a compound to a solid particle. Processes that result in sorption oforganic compounds include:
• adsorption, whereby a compound physically 'clings' to a solid particle;
• chemisorption, where a compound is incorporated onto a sediment, soil, or rocksurface via a chemical reaction;
018925(21) 30 CONESTOGA-ROVERS & ASSOCIATES
• absorption in which a compound diffuses into the soil, sediment, or rock matrix; and
• cation exchange in which positively-charged particles (cations) are attracted to anegatively-charged mineral surface and are held there by electrostatic forces (theconverse may also occur - i.e., negatively charged particles (anions) may be attractedand bound to positively-charged surfaces by anion exchange).
Volatilization
Volatilization typically applies to organic compounds in the unsaturated (vadose) zoneand/or unconfined aquifers. Volatilization is a process by which compounds aretransferred from the liquid phase to the vapor phase. This process is controlled by thesolubility, molecular weight, and vapor pressure of the compound, as well as the natureof the media through which the vapor passes. Volatilization is generally not verysignificant in decreasing contaminant concentrations from the dissolved phase insaturated units relative to other processes, although it may be more important in theshallow portion of an unconfined aquifer.
Biodegradation
Microbial biodegradation involves the utilization of carbon from an organic compound(i.e., the substrate) for microbial cell growth. As part of the biodegradation process,electrons are transferred from the organic substrate (i.e., electron donor) to an availableelectron acceptor. This transfer of electrons is defined as an oxidation-reduction (redox)reaction. Energy derived from this transfer of electrons is utilized by soilmicroorganisms for cellular respiration.
Microbial biodegradation will only occur if suitable quantities of the organic substrateand electron acceptors are available for the necessary redox reactions. Certain forms oforganic matter, such as fuel hydrocarbons are readily utilized as substrates duringmicrobial biodegradation and hence in an environment with high hydrocarbons,degradation can be very rapid (Carey et al., 1999; Wiedemeier et alv 1996; Wiedemeieretal.,1999).
Typical inorganic electron acceptors available in groundwater, in the order of those thatrelease the greatest energy to those that release the least energy, are: dissolved oxygen,nitrate, manganese and iron coatings on soil, dissolved sulfate, and carbon dioxide. Insome cases, reductive dechlorinarion will involve the use of CVOCs as alternativeelectron receptors.
018925(21) 31 CONESTOGA-ROVERS & ASSOCIATES

The sequential use of these electron acceptors occurs as groundwater redox potential
becomes increasingly reducing during the biodegradation of organic compounds. For
example, when groundwater becomes depleted of dissolved oxygen and nitrate, the
conditions are conducive to the reduction and subsequent dissolution of iron and
manganese oxides. Ferric iron typically exists as an oxide coating on soil and is
relatively insoluble in groundwater. Ferric iron is used as an electron acceptor during
microbial biodegradation where it is reduced to ferrous iron which exists primarily in
the dissolved phase (Lyngkilde and Christensen, 1992).
The combination of principles referred to above results in the situation in which the
long-term migration of organic contaminants in groundwater result in a sequence of
geochemical (or redox) zones of increasing redox potential downgradient from a source
area (Lyngkilde and Christensen, 1992). The extent of individual redox zones is
site-specific, and depends on substrate migration pathways, kinetics of redox processes,
groundwater flow velocities, and the availability of various electron acceptors in
groundwater.
5.3.2.4 NATURAL ATTENUATION PROCESSES
To establish that natural attenuation is ongoing, the EPA OSWER Directive (U.S. EPA,
199913) identifies three lines of evidence that can be used to evaluate the efficacy of
monitored natural attenuation (MNA). These lines of evidence are cited below:
1) "Historical groundwater and/or soil chemistry data that demonstrate a clear and
meaningful trend of decreasing contaminant mass and/or concentration over time at
appropriate monitoring or sampling points. (In the case of a groundwater plume,decreasing concentrations should not be solely the result of plume migration. In the case
of inorganic contaminants, the primary attenuating mechanism should also be
understood).
2) Hydrogeologic and geochemical data can be used to demonstrate indirectly the type(s) of
natural attenuation processes active at the site, and the rate at which such processes will
reduce contaminant concentrations to required levels. For example, characterization data
may be used to quantify the rates of contaminant sorption, dilution, or volatilization, or
to demonstrate and quantify the rates of biological degradation processes occurring at the
site.
Use of Monitored Natural Attenuation at Superfund, RCRA Corrective Action and Underground StorageTank Sites. Final OSWER Directive 9200.4-17P.
018925(21) 32 CONESTOGA-ROVERS & ASSOCIATES
3) Data from field or microcosm studies (conducted in or with actual contaminated site
media) which directly demonstrate the occurrence of a particular natural attenuation
process at the site and its ability to degrade the contaminants of concern (typically used
to demonstrate biological degradation processes only)."
The OSWER Directive also provides the following guidelines on interpreting these lines
of evidence:
"Unless EPA or the implementing state agency determines that historical data (Number 1 above)
are of sufficient quality and duration to support a decision to use monitored natural attenuation,
EPA expects that data characterizing the nature and rates of natural attenuation processes at the
site (Number 2 above) should be provided. Where the latter are also inadequate or inconclusive,
data from microcosm studies (Number 3 above) may also be necessary. In general, more
supporting information may be required to demonstrate the efficacy of M.NA at those sites with
contaminants which do not readily degrade through biological processes (e.g., most
non-petroleum compounds, inorganics), or that transform into more toxic and/or mobile forms
than the parent contaminant, or at Sites where monitoring has been performed for a relatively
short period of time. The amount and type of information needed for such a demonstration will
depend upon a number of site-specific factors, such as the size and nature of the contamination
problem, the proximity of receptors and the potential risk to those receptors, and other
characteristics of the environmental setting (e.g., hydrogeology, ground cover, climatic
conditions)."
There is demonstrative evidence that both the Northern Plume and the Southern Plume
are undergoing natural attenuation, although at dramatically different rates.
5.3.3 NORTHERN CVOC FLUME
There are CVOCs in the groundwater, originating from the southern portion of the CNH
property (from the former burn and burial area). The initiating point of the Northern
Plume is at the westernmost boundary of the CNH property from the former burial area.
The vadose zone is approximately 20 feet thick at this location.
5.3.3.1 DEMONSTRATED SEQUENCE OF CVOC CONCENTRATIONSWITH DISTANCE FOR THE NORTHERN PLUME
To understand the attenuation of the CVOCs in the Northern Plume, and interrelated
character of the CVOCs which demonstrate the attenuation of the Northern Plume,
018925(21) 33 CONESTOGA-ROVERS & ASSOCIATES
evidence of the individual compounds will be individually described and depicted inthe referenced figures and the subsections which follow. The initial set of figuresillustrating this discussion are plotted as logarithmic concentration versus distance(Figures 5.3 to 5.8), whereas in the second set (Figures 5.9 to 5.14), the plots arerepresentative of the arithmetic concentration versus distance. Distance is measuredfrom the western side of the CNH property in the vicinity of the former burial area onthe CNH property. The monitoring results reported as non-detects (NDs) are plotteddifferently, to identify them as such, from those reported as observed values.
(i) PCE - Figure 5.3 shows the logarithmic PCE data versus distance for the periodof recorded results (1993-2004). As apparent from the plotted points, PCEconcentrations higher than detection limits are infrequent. PCE, a parentproduct, is absent prior to groundwater reaching the vicinity of the BrentwoodGravel Pit Lake. These findings indicate that conditions in the saturated zone areanaerobic and also demonstrate rapid decline of PCE concentrations in thegroundwater on the CNH property and downgradient, although with thenumber of NDs, it is difficult to establish the actual rate of decline;
(ii) TCE - Figure 5.4 shows the logarithmic TCE data versus distance for the periodof recorded results (1993-2004). As apparent from the plotted points, TCEconcentrations higher than ND are infrequent. TCE, as a parent product and/oras the biotic product from PCE degradation, is also absent before thegroundwater reaches the vicinity of Brentwood Gravel Pit Lake. These findingsindicate that conditions in the saturated zone are anaerobic in the groundwateron the CNH property and downgradient. These findings also indicate a rapiddecline of TCE concentrations in the groundwater underneath the CNHproperty.
(iii) cis-l,2-DCE - Figure 5.5 shows the logarithmic cis-l,2-DCE concentrations versusdistance (1993-2004). cis-l,2-DCE, a biotic degradation product of TCE, showsabsence in the vicinity of Brenrwood Gravel Pit Lake. This indicates the parentproducts (PCE and TCE) are degrading with the formation of cis-l,2-DCE and, inrum, cis-l,2-DCE is quickly biodegrading with distance such that the distal endof the cis-l,2-DCE plume appears to be under Brenrwood Gravel Pit Lake.
(iv) 1,1,1-TCA - Figure 5.6 shows the logarithmic 1,1,1-TCA concentrations versusdistance (1993-2004). 1,1,1-TCA, a parent product, shows very rapid decline inthe groundwater concentrations under the CNH property, followed by acontinuing but somewhat lower rate of decline to the east. The distal end of the1,1,1-TCA plume appears to be under Brentwood Gravel Pit Lake.
(v) 1,1-DCA - Figure 5.7 shows the logarithmic 1,1-DCA concentrations versusdistance (1993-2004). A biotic product, under anaerobic conditions arising from
018925(21) 34 CONESTOGA-ROVERS & ASSOCIATES

1,1,1-TCA, the 1,1-DCA shows conditions in the groundwater are anaerobic andFigure 5.7 shows that natural attenuation of 1,1-DCA is occurring. Attenuationof 1,1-DCA is also demonstrated as very high in the groundwater on the CNHproperty, continuing with lesser but still very substantial declines inconcentrations to the east of the CNH property, such that the distal end of the1,1-DCA groundwater plume appears to be just east of Brentwood Gravel PitLake. It is emphasized that the levels of 1,1-DCA at the distal end of theNorthern Plume of 1,1-DCA are at or below PQLs.
(vi) 1,1-DCE . Figure 5.8 shows the logarithmic 1,1-DCE concentrations versusdistance (1993-2004). 1,1-DCE is formed by abiotic degradation from 1,1,1-TCA.In addition, a secondary abiotic degradation pathway exists for the formation of1,1-DCE from TCE. These findings indicate that natural attenuation is occurringsuch that the distal end of the 1,1-DCE plume appears to be just to the east ofBrentwood Gravel Pit Lake based on 1,1-DCE concentrations below PQLs.
The next set of figures, Figures 5.9 through 5.14, include precisely the same data asFigures 5.3 through 5.8 but with the concentration data plotted on arithmetic scales.These figures demonstrate the very rapid decline in CVOC concentrations with distancein the Northern Plume.
5.3.3.2 SUMMARY OF DEMONSTRATED DECLINES OF CVOCCONCENTRATIONS IN THE NORTHERN PLUME
Summary statements regarding CVOC concentrations in the Northern Plume include:
(i) The above figures depict monitoring results over an eleven year rimeframe(1993-2004). While only some of the specific data points are from monitoringwells, there are significant timeframes implicit by the result from variouslocations and hence temporal trends can be discussed at many locations. All ofthese findings support the presence of ongoing natural attenuation of the CVOCsin the Northern Plume.
(ii) The absence of significant fluctuations in the plotted information forconcentration versus distance indicates there is rapid decline of CVOCconcentrations in the groundwater plume downgradient of the CNH property,and that the source contributions to the groundwater which have caused theNorthern Plume, have likely not changed appreciably over time.
(iii) Natural attenuation of the CVOCs is demonstrated by the presence of thesequence of parent and daughter-products, consistent with the technical
018925(21) 35 CONESTOGA-ROVERS & ASSOCIATES
literature. Further, a number of natural attenuation features are alsodemonstrated. Specifically, as indicated by Figure 5.15, examples of the naturalattenuation indicators include:
• for nitrate - MW-02 (upgradient) 24.9 mg/L whereas downgradient nitrateconcentrations include at GM-4 5.8 mg/L, GM-5 <0.1 mg/L, and MW-036.5 mg/L thereby indicating nitrate consumption. These demonstrate naturalattenuation is ongoing;
• for chloride - MW-02 (upgradient) 1.1 mg/L, whereas downgradient chlorideconcentrations include at GM-4 6 mg/L, GM-5 4.6 mg/L, and MSW-038 mg/L, indicating increasing chloride concentrations along the flow pathdue to dechlorination; and
• dissolved oxygen at 0.83 mg/L at GM-3, 0.60 mg/L at MW-10, 0.53 mg/L atGM-4, 0.15 mg/L at MVV-5, 0.4 mg/L at MW-01. These conditions of lowdissolved oxygen continue out to NW-01-S (immediately west of Highway281) 2.15, 0.93 and 2.22 mg/L and at NW-020S (also immediately west ofHighway 281) 1.38, 1.31, and 1.99 mg/L. These monitoring results indicatethat anaerobic conditions are continuing to the east of the CNH property.
(iv) In addition to the above, there was significant carbon co-disposed in the burialand bum areas. Measurements of dissolved organic carbon (DOC) of 11 mg/Lwere reported on the CNH property indicating widespread availability of carbonin the Northern Plume. These DOC concentrations decline to 1 to 2 mg/L at theeastern edge of the CNH property. Microcosm studies were conducted by CRA(October 4, 2004). These studies conclusively demonstrated that attenuation(biotic degradation) of CVOCs in groundwater is occurring naturally.
5.3.3.3 DEMONSTRATED SEQUENCE OF CVOC CONCENTRATIONSWITH DISTANCE IN THE SOUTHERN PLUME
Data for the individual CVOCs in the Southern Plume are presented in a mannercomparable to those for the Northern Plume. Distance for these figures is measuredfrom Husker Highway and Engelman Road.
(i) PCE - Figure 5.16 shows the logarithmic concentrations of PCE versus distance.The findings demonstrate both considerable scatter in the data and also, naturalattenuation, although at a much slower rate than evident in the Northern Plume.As will be seen in the subsections which follow, some of this attenuation of PCEis occurring by biodegradation to daughter products which indicates conditionsin the aquifer in the Southern Plume are anaerobic. However, the rate of decline
oi8925(2i) 36 CoNESTOGA-RovERS & ASSOCIATES
of PCE concentrations (and the other CVOCs) is very different from thatdemonstrated in the Northern Plume, and this attribute is described more fully
in the text which follows. The relatively low availability of carbon in sand and
gravel aquifers is likely responsible (as opposed to the co-disposal of the carbon
sources in the burn and burial areas) for some of the difference in the rate of
decline of the CVOC concentrations.
(ii) TCE - Figure 5.17 shows the logarithmic concentrations of TCE versus distance.
TCE was detected in investigative samples collected near Engleman Road, but
was detected sporadically at low levels in investigative samples collected furtherdowngradient in the Southern Plume. TCE was also detected at low levels in
several domestic wells in the Mary Lane and Castle Estates subdivision.However, by virtue of the presence of cis-l,2-DCE (indicated below), TCE isbeing formed from PCE degradation and in turn, degrading to form cis-l,2-DCE.
(iii) cis-l,2-DCE - Figure 5.18 shows the logarithmic concentrations of cis-l,2-DCEversus distance. As apparent from the plotted data, the majority of the
monitoring results for cis-l,2-DCE are NDs but it is key to identify that there are
detections at approximately 2500 ft from Husker Highway and Engleman Road
(i.e., in the Mary Lane area) and in the vicinity of Parkview 3, in the Southern
Plume. These two regions demonstrate that reducing conditions exist in theSouthern Plume such that daughter product cis-l,2-DCE formation from
PCE/TCE is occurring.
(iv) 1,1,1-TCA - Figure 5.19 shows the logarithmic concentrations of 1,1,1-TCA versusdistance. In a manner comparable with that of PCE in the Southern Plume
(Figure 5.16), there is considerable scatter in the 1,1,1-TCA data, while alsodemonstrating attenuation in the Southern Plume. For reasons which are
evident by the presence of 1,1-DCA (see (v) immediately following), degradationof 1,1,1-TCA to daughter products is occurring, albeit at a much lower rate in the
Southern Plume relative to the Northern Plume.
(v) 1,1-DCA - Figure 5.20 shows the logarithmic concentrations of 1,1-DCA versus
distance. Initially, 1,1-DCA concentrations are low but increase to a locationapproximately 2500 ft from Husker Highway and Engelman Road, as a result of
degradation into daughter-products arising from 1,1,1-TCA. 1,1-DCA in the
Southern Plume demonstrates a continuing decline with distance, albeit at amuch lower rate than in the Northern Plume.
(vi) 1,1-DCE - Figure 5.21 shows the logarithmic concentrations of 1,1-DCE versusdistance. 1,1-DCE concentrations in the Southern Plume indicate similar trends
as 1,1-DCA above, although 1,1-DCE is formed by abiotic degradation of
1,1,1-TCA and a secondary bioh'c degradation from TCE.
018925(21) 37 CONESTOGA-ROVERS & ASSOCIATES
The next set of figures, Figures 5.22 through 5.27 include precisely the same data asFigures 5.16 through 5.21 but with the concentration data plotted on an arithmetic scale.
5.3.3.4 SUMMARY OF DEMONSTRATED DECLINE OF CVOCCONCENTRATIONS IN THE SOUTHERN PLUME
Summary statements regarding CVOC concentrations in the Southern Plume indicate:
(i) there is anaerobic degradation as well as abiotic degradation ongoing in theSouthern Plume, albeit at a much lower rate than in the Northern Plume. Thelower rate of attenuation in the Southern Plume (relative to the Northern Plume)is at least in part the consequence of the relative unavailability of a carbon sourceas a substrate.
(ii) Both cis-l,2-DCE and 1,1-DCA are present in the Southern Plume in the vicinityof Parkview 3 and the downgradient area such as along Pioneer Boulevard.
5.3.3.5 COMPARISON OF CVOC DEGRADATION IN THENORTHERN AND SOUTHERN FLUMES
Natural attenuation of the CVOCs is being demonstrated in both the Northern andSouthern Plumes, although there are significant differences in the rates of decline.Several additional dimensions are relevant:
(i) In the Southern Plume, both PCE and 1,1,1-TCA have continued to be present asparent products throughout the migration from the source in the vicinity ofHusker Highway and Engelman Road to MW1-TT, and Parkview 3.
(ii) GP-02-(0803), a monitoring location has parent products present (1,1,1-TCA from1 to 2 ng/L and PCE at 0.5 ug/L). Further, 1,1,1-TCA is present at four depthintervals at GP-02-(0803) indicating that parent products are widespread atGP-02-(0803). However no parent products are observed at GGW-556 andGGW-552. In addition 1,1-DCA was detected at a concentration of 0.5 ug/L and1,1-DCE was detected at a concentration of 1.7 ug/L at this location, at the 57 to61 feet BGS interval.
(iii) 1,1-DCA is present on the south side of the Southern Plume (e.g. on Blaine Streetand on Pioneer) so there is spreading from the centerline in the southerlydirection from the Southern Plume.
018925(21) . 38 CONESTOGA-ROVERS & ASSOCIATES
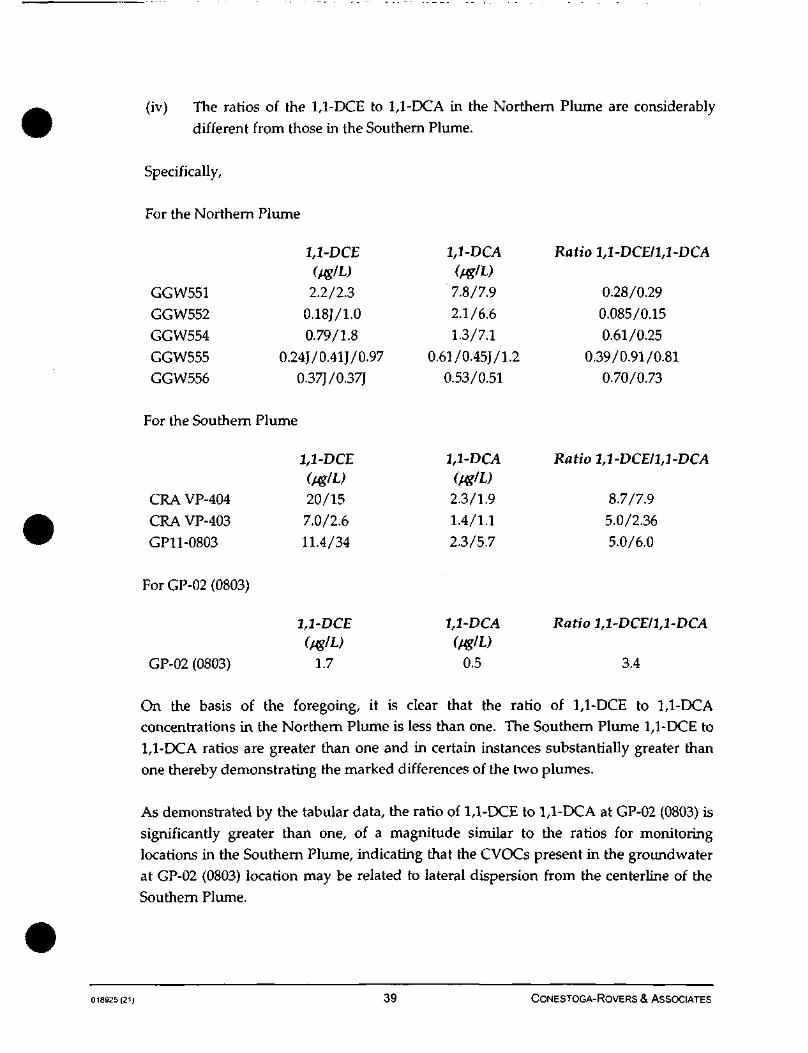
(iv) The ratios of the 1,1-DCE to 1,1-DCA in the Northern Plume are considerablydifferent from those in the Southern Plume.
Specifically,
For the Northern Plume
GGW551GGW552GGW554
GGW555GGW556
1,1-DCE
2.2/2.30.18J/1.00.79/1.8
0.24J/0.41J/0.970.37J/0.37J
1,1-DCA
7.8/7.92.1/6.61.3/7.1
0.61/0.45J/1.20.53/0.51
Ratio 1,1-DCEI1,1-DCA
0.28/0.290.085/0.150.61/0.25
0.39/0.91/0.810.70/0.73
For the Southern Plume
1,1-DCE
CRA VP-404CRA VP-403GP11-0803
For GP-02 (0803)
GP-02 (0803)
20/157.0/2.611.4/34
1,1-DCE
1.7
1,1-DCA
2.3/1.91.4/1.12.3/5.7
1,1-DCA
0.5
Ratio 1,1-DCEI1,1-DCA
8.7/7.95.0/2.365.0/6.0
Ratio 1,1-DCE/1,1-DCA
3.4
On the basis of the foregoing, it is clear that the ratio of 1,1-DCE to 1,1-DCAconcentrations in the Northern Plume is less than one. The Southern Plume 1,1-DCE to1,1-DCA ratios are greater than one and in certain instances substantially greater thanone thereby demonstrating the marked differences of the two plumes.
As demonstrated by the tabular data, the ratio of 1,1-DCE to 1,1-DCA at GP-02 (0803) issignificantly greater than one, of a magnitude similar to the ratios for monitoringlocations in the Southern Plume, indicating that the CVOCs present in the groundwaterat GP-02 (0803) location may be related to lateral dispersion from the centerline of theSouthern Plume.
018925(21) 39 CONESTOGA-ROVERS & ASSOCIATES
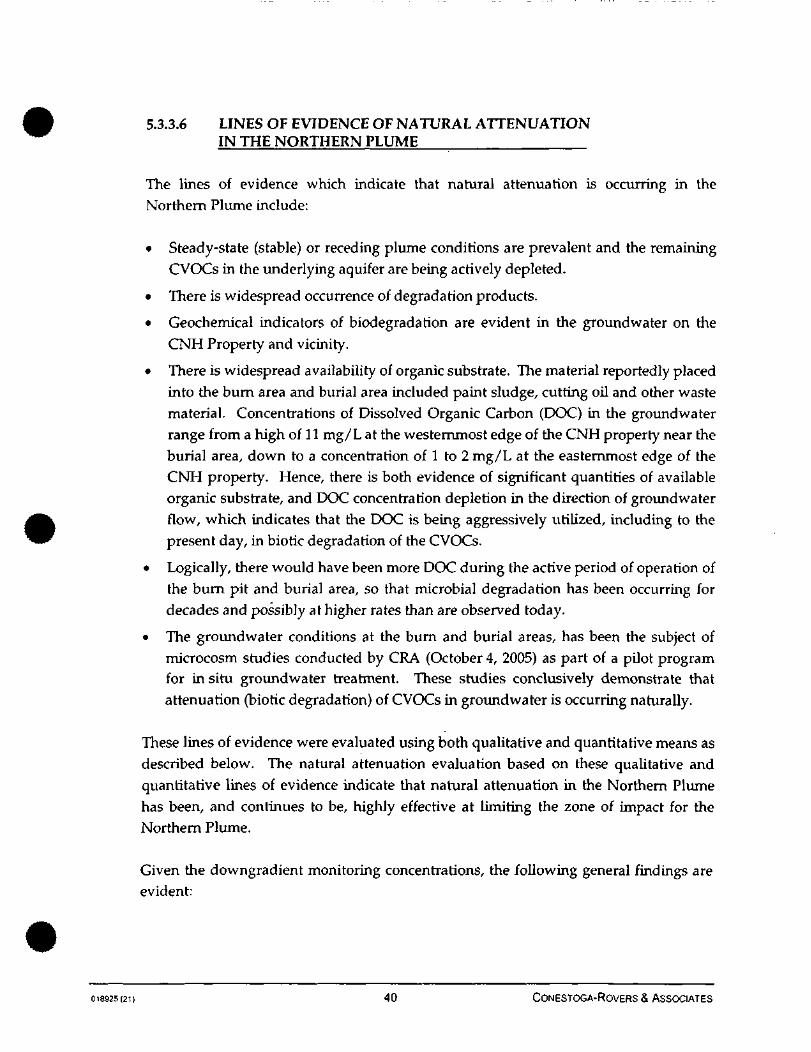
5.3.3.6 LINES OF EVIDENCE OF NATURAL ATTENUATIONIN THE NORTHERN PLUME
The lines of evidence which indicate that natural attenuation is occurring in theNorthern Plume include:
• Steady-state (stable) or receding plume conditions are prevalent and the remainingCVOCs in the underlying aquifer are being actively depleted.
• There is widespread occurrence of degradation products.
• Geochemical indicators of biodegradation are evident in the groundwater on theCNH Property and vicinity.
• There is widespread availability of organic substrate. The material reportedly placedinto the burn area and burial area included paint sludge, cutting oil and other wastematerial. Concentrations of Dissolved Organic Carbon (DOC) in the groundwaterrange from a high of 11 mg/L at the westernmost edge of the CNH property near theburial area, down to a concentration of 1 to 2 mg/L at the easternmost edge of theCNH property. Hence, there is both evidence of significant quantities of availableorganic substrate, and DOC concentration depletion in the direction of groundwaterflow, which indicates that the DOC is being aggressively utilized, including to thepresent day, in biotic degradation of the CVOCs.
• Logically, there would have been more DOC during the active period of operation ofthe burn pit and burial area, so that microbial degradation has been occurring fordecades and possibly at higher rates than are observed today.
• The groundwater conditions at the burn and burial areas, has been the subject ofmicrocosm studies conducted by CRA (October 4, 2005) as part of a pilot programfor in situ groundwater treatment. These studies conclusively demonstrate thatattenuation (biotic degradation) of CVOCs in groundwater is occurring naturally.
These lines of evidence were evaluated using both qualitative and quantitative means asdescribed below. The natural attenuation evaluation based on these qualitative andquantitative lines of evidence indicate that natural attenuation in the Northern Plumehas been, and continues to be, highly effective at limiting the zone of impact for theNorthern Plume.
Given the downgradient monitoring concentrations, the following general findings areevident:
018925(21) 40 CONESTOGA-ROVERS & ASSOCIATES
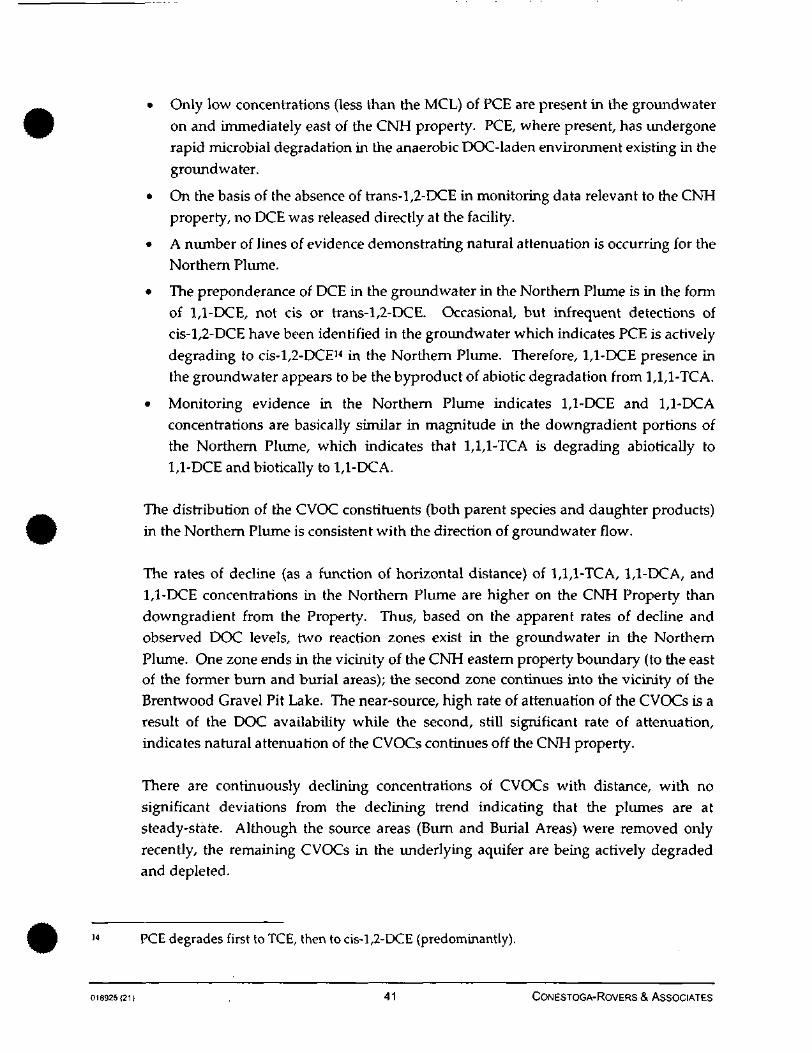
• Only low concentrations (less than the MCL) of PCE are present in the groundwateron and immediately east of the CNH property. PCE, where present, has undergonerapid microbial degradation in the anaerobic DOC-laden environment existing in thegroundwater.
• On the basis of the absence of trans-l,2-DCE in monitoring data relevant to the CNHproperty, no DCE was released directly at the facility.
• A number of lines of evidence demonstrating natural attenuation is occurring for theNorthern Plume.
• The preponderance of DCE in the groundwater in the Northern Plume is in the formof 1,1-DCE, not cis or trans-l,2-DCE. Occasional, but infrequent detections ofcis-l,2-DCE have been identified in the groundwater which indicates PCE is activelydegrading to cis-l,2-DCE14 in the Northern Plume. Therefore, 1,1-DCE presence inthe groundwater appears to be the byproduct of abiotic degradation from 1,1,1-TCA.
• Monitoring evidence in the Northern Plume indicates 1,1-DCE and 1,1-DCAconcentrations are basically similar in magnitude in the downgradient portions ofthe Northern Plume, which indicates that 1,1,1-TCA is degrading abiotically to1,1-DCE and biotically to 1,1-DCA.
The distribution of the CVOC constituents (both parent species and daughter products)in the Northern Plume is consistent with the direction of groundwater flow.
The rates of decline (as a function of horizontal distance) of 1,1,1-TCA, 1,1-DCA, and1,1-DCE concentrations in the Northern Plume are higher on the CNH Property thandowngradient from the Property. Thus, based on the apparent rates of decline andobserved DOC levels, two reaction zones exist in the groundwater in the NorthernPlume. One zone ends in the vicinity of the CNH eastern property boundary (to the eastof the former burn and burial areas); the second zone continues into the vicinity of theBrentwood Gravel Pit Lake. The near-source, high rate of attenuation of the CVOCs is aresult of the DOC availability while the second, still significant rate of attenuation,indicates natural attenuation of the CVOCs continues off the CNH property.
There are continuously declining concentrations of CVOCs with distance, with nosignificant deviations from the declining trend indicating that the plumes are atsteady-state. Although the source areas (Burn and Burial Areas) were removed onlyrecently, the remaining CVOCs in the underlying aquifer are being actively degradedand depleted.
14 PCE degrades first to TCE, then to cis-l,2-DCE (predominantly).
018925(21) . 41 CONESTOGA-ROVERS & ASSOCIATES
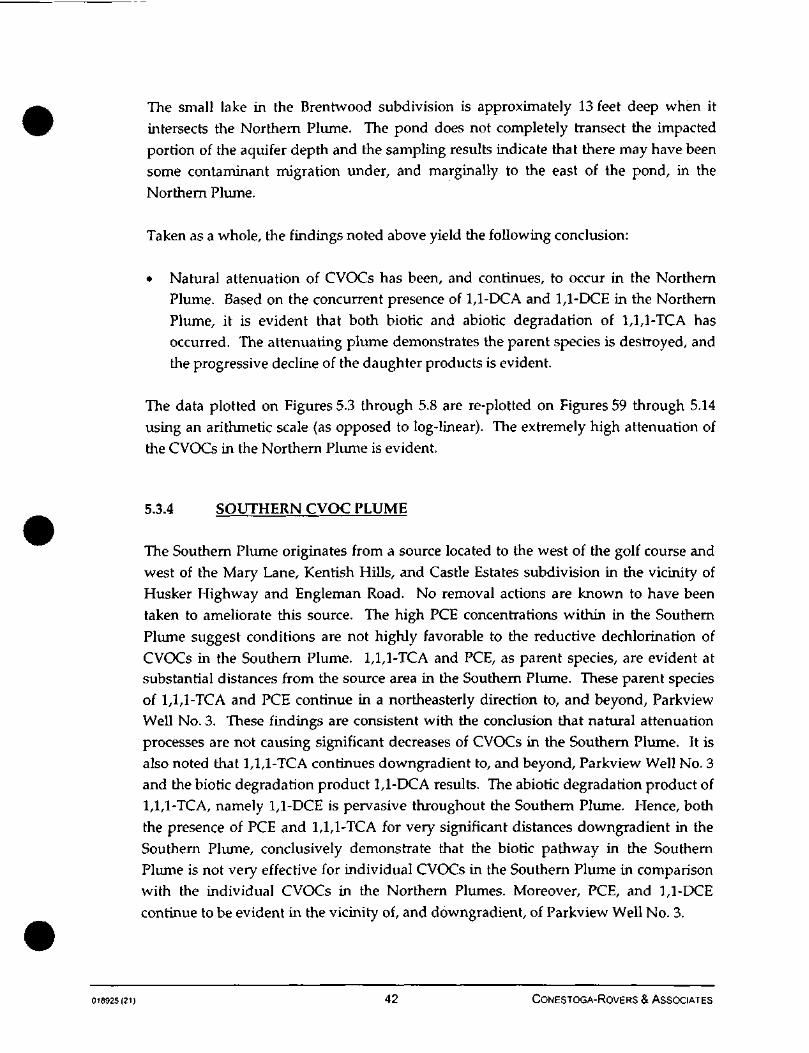
The small lake in the Brentwood subdivision is approximately 13 feet deep when itintersects the Northern Plume. The pond does not completely transect the impactedportion of the aquifer depth and the sampling results indicate that there may have beensome contaminant migration under, and marginally to the east of the pond, in theNorthern Plume.
Taken as a whole, the findings noted above yield the following conclusion:
• Natural attenuation of CVOCs has been, and continues, to occur in the NorthernPlume. Based on the concurrent presence of 1,1-DCA and 1,1-DCE in the NorthernPlume, it is evident that both biotic and abiotic degradation of 1,1,1-TCA hasoccurred. The attenuating plume demonstrates the parent species is destroyed, andthe progressive decline of the daughter products is evident.
The data plotted on Figures 5.3 through 5.8 are re-plotted on Figures 59 through 5.14using an arithmetic scale (as opposed to log-linear). The extremely high attenuation ofthe CVOCs in the Northern Plume is evident.
5.3.4 SOUTHERN CVOC PLUME
The Southern Plume originates from a source located to the west of the golf course andwest of the Mary Lane, Kentish Hills, and Castle Estates subdivision in the vicinity ofHusker Highway and Engleman Road. No removal actions are known to have beentaken to ameliorate this source. The high PCE concentrations within in the SouthernPlume suggest conditions are not highly favorable to the reductive dechlorinarion ofCVOCs in the Southern Plume. 1,1,1-TCA and PCE, as parent species, are evident atsubstantial distances from the source area in the Southern Plume. These parent speciesof 1,1,1-TCA and PCE continue in a northeasterly direction to, and beyond, ParkviewWell No. 3. These findings are consistent with the conclusion that natural attenuationprocesses are not causing significant decreases of CVOCs in the Southern Plume. It isalso noted that 1,1,1-TCA continues downgradient to, and beyond, Parkview Well No. 3and the biotic degradation product 1,1-DCA results. The abiotic degradation product of1,1,1-TCA, namely 1,1-DCE is pervasive throughout the Southern Plume. Hence, boththe presence of PCE and 1,1,1-TCA for very significant distances downgradient in theSouthern Plume, conclusively demonstrate that the biotic pathway in the SouthernPlume is not very effective for individual CVOCs in the Southern Plume in comparisonwith the individual CVOCs in the Northern Plumes. Moreover, PCE, and 1,1-DCEcontinue to be evident in the vicinity of, and downgradient, of Parkview Well No. 3.
018925(21) 42 CONESTOGA-ROVERS & ASSOCIATES
The Southern Plume of CVOCs is consistent with the east then east-northeast directionof groundwater flow. The Southern Plume of CVOCs continues migrating
east-northeast to the residential properties on Commerce Avenue. The monitoringresults at these locations demonstrate evidence of parent products 1,1,1-TCA and PCE,as well as 1,1-DCE.
5.3.5 COMPARISON OF PLUMES
The preceding subsections demonstrate that there is clear evidence of two separate
sources of chlorinated solvents in the Northern Study Area, namely the Northern Plume
and the Southern Plume. The natural attenuation processes affecting the NorthernPlume include destructive processes (e.g., through biodegradation and abiotic
transformations) but biotic processes are not being as strongly demonstrated with theSouthern Plume.
Since the Southern Plume is longer than the Northern Plume, there is a reasonableexpectation that there will be larger spreading of the Southern Plume, such that the
Southern Plume becomes wider with increasing distance from the source area.
In combination with the above, there is, for example, groundwater monitoring location
GP-02(0803) which has low concentrations of 1,1,1-TCA, PCE and 1,1-DCE relative to thenearby location CRA-VP-404. A number of conclusions can be drawn from this:
• Parent species (1,1,1-TCA and PCE) are observed at GP-02(0803) whereas there are
no parent species associated with the Northern Plume above PQLs withinapproximately 2,100 feet of GP-02(0803).
• The low levels of CVOCs at GP-02(0803) relative to the concentrations observed inthe central portion of the Southern Plume indicate that GP-02(0803) is located distal
to the Southern Plume's core and is consistent with the east-northeast migrationpathway and by a classic concentration gradient of declining concentration trends,
with increasing distance away from the centerline of the Southern Plume.
• There are significantly higher concentrations of CVOC daughter products at
GP-02(0803) than at the eastern portion of the Northern Plume (near BrentwoodGravel Pit Lake).
• The ratios of 1,1-DCE to 1,1-DCA in the Northern Plume are considerably different
from those in the Southern Plume. The ratio of 1,1-DCE to 1,1-DCA at GP-02(0803) is
similar to observed ratios in the Southern Plume.
018925(21) 43 . CONESTOGA-ROVERS & ASSOCIATES
The data as outlined above indicate the ground-water conditions observed atGP-02(0803) are less consistent with the eastern portion of the Northern Plume, andmore consistent with the conditions observed in the Southern Plume.
The extents of both the Northern Plume and Southern Plume are shown on Figures 5.28through 5.30 for PCE, 1,1,1-TCA and 1,1-DCE, respectively. These images wereproduced using Mining Visualization Software/Environmental Visualization Software(MVS/EVS)15. The figures clearly show the separation of the Northern and Southernplumes at the resolution provided by the figures. Appendix K provides the full EVSanimation displaying both the Northern and Southern Plumes.
Kriging was performed in EVS/MVS version 8.0, Copyright 1994-2004 by C Tech DevelopmentCorporation, with GSLIB KT3D. A description of GSLIB may be found in: GSLIB (GeostatisticalSoftware Library and User's Guide) Second Edition by Clayton V. Deutsch and Andre G. Journelpublished by Oxford University Press 1998.
018925(21) 44 CONESTOGA-ROVERS & ASSOCIATES

6.0 HUMAN HEALTH RISK ASSESSMENT
6.1 GENERAL
The HHRA was conducted in accordance with the following U.S. Environmental
Protection Agency (U.S. EPA) guidance as well as consultations with the U.S. EPA RPMand Risk Assessor:
• U.S. EPA Risk Assessment Guidance for Superfund (RAGS), Volume I, HumanHealth Evaluation Manual (Part) A, EPA/540/1-89/002, December 1989;
• U.S. EPA RAGS Supplemental Guidance, Standard Default Exposure Factors,Interim Final, OSWER Directive 9285.6-03, March 25,1991;
• U.S. EPA Exposure Factors Handbook, EPA/600/P-95/002Fa, August 1997;
• U.S. EPA RAGS Part D, Standardized Planning, Reporting, and Review of SuperfundRisk Assessments, Final, Publication 9285.7-O1D, December 2001;
• U.S. EPA, Child-Specific Exposure Factors Handbook, September 2002;
• U.S. EPA, Supplemental Guidance for Developing Soil Screening Levels forSuperfund Sites, December 2002;
• U.S. EPA RAGS Part E, Supplemental Guidance, Dermal Risk Assessment, Final,
July 2004; and
• U.S. EPA, Draft Guidance for Evaluating the Vapor Intrusion to Indoor Air Pathway
from Groundwater and Soils (Subsurface Vapor Intrusion Guidance), EPA Report
No. EPA 530-F-02-052, Office of Solid Waste and Emergency Response,November 2002.
In accordance with the relevant U.S. EPA guidance and procedures, the Human HealthRisk Assessment (HHRA) includes the following primary elements:
1) Site Characterization - This includes the incorporation of Site-specific
investigation data coupled with the identification of potential site receptors to
develop a Conceptual Site Model (CSM) which describes the factors(chemical/parameter source, media of concern, release mechanisms, transportmechanisms, and potential receptor uptake routes) that could produce a
complete exposure pathway and lead to human intake of chemicals at the Site;and the selection of the chemicals of potential concern (COPCs) as discussed inSection 6.2.2.
2) Exposure Assessment - This is the estimation of the magnitude, frequency,
duration, and routes of exposure.
018925(21) 45 CONESTOGA-ROVERS & ASSOCIATES

3) Toxicity Assessment - This assessment examines available evidence regardingthe potential for a particular chemical to cause adverse effects in exposedindividuals and estimates the extent of exposure and possible severity of adverseeffects.
4) Risk Characterization - The objective of the risk characterization is to integrateinformation developed in the exposure assessment and the toxicity assessmentinto an evaluation of the potential human health risks associated with exposureto potentially contaminated media at the Site.
Ultimately this risk assessment considers risk relative to the following principle:
"Where the cumulative carcinogenic site risk to an individual based on reasonable maximum
exposure for both current and future land use is less than IO4 and the non-carcinogenic hazard
quotient is less than 1, action generally is not warranted unless there are adverse environmental
impacts." (U.S. EPA, 1991)
This section presents a summary and the results of the Human Health Risk Assessment.
The detailed HHRA, however, is provided in Appendix L.
6.2 SITE CHARACTERIZATION
6.2.1 EXPOSURE PATHWAYS
In order to evaluate the significance of the impacted media at the Site, the pathways bywhich individuals may come in contact with these media must be determined. Thecombination of factors (chemical/parameter source, media of concern, releasemechanisms, and receptors) that could produce a potentially complete exposurepathway and lead to human uptake of chemicals at the Site are assessed in a CSM. TheCSMs for the HHRA are provided in Appendix L - Section 3.2. The potential humanreceptors that have been identified at the Site are listed below.
• Area 1, the CNH Property - includes the area encompassed by the CNH Propertyboundary, which is bounded on the North by Stolley Park Road, on the east by aportion of US Highway 281 and a property boundary fence, and to the south andwest by a property boundary fence. Soils impacted above U.S. EPA Region IX PRGs,on the property have been removed, and the HHRA addresses residual chemicals insoil and groundwater on the CNH Property.
018925(21) 46 CONESTOGA-ROVERS & ASSOCIATES

• Area 2, CNH Off-Property ground water impacted by the Burn and Burial Areas -
includes the area east of the CNH Property, to approximately the vicinity east of the
Brentwood Gravel Pit Lake where groundwater chemical concentrations diminish to
levels below the U.S. EPA Maximum Contaminant Levels (MCLs), and are at or
below Practical Quanritation Limits (PQLs). In addition, the two surface water
bodies west of Stolley Park have been included in this area.
• Area 3, Northern Study Area - a future groundwater well scenario (as defined in
Appendix L) in the Southern Plume located in the Northern Study Area in the
vicinity of Pioneer Blvd.
Risk estimates for past exposure to Parkview residential tap water wells and municipal
wells in the Parkview/Stolley Park Area were also calculated. These risks will not beused to make remedial decisions but provide important information on historical
exposure and risk in the Northern Study Area. The results are provided in Appendix L.
The media evaluated for risk assessment purposes include surface soil, subsurface soil,surface water, groundwater, and air. Potential routes of exposure that were evaluated
for risk assessment purposes include ingestion, dermal contact, and inhalation. All ofthese factors are evaluated in the CSM (see Appendix L - Section 3.2).
6.2.2 CHEMICALS OF POTENTIAL CONCERN
The AOC determined the original list of chemicals for the Northern Study Area. The list
provides a targeted set of chemicals that have been detected frequently and thatrepresent the highest potential threat to human health and the environment. Thechlorinated alkenes and alkanes on the CNH Property are similar to, but unrelated to thechlorinated alkenes and alkanes in the Southern Plume for all the reasons identified by
Section 5.0. The CVOCs for the Northern Study Area are:
• 1,1,1-Trichloroethane (1,1,1-TCA);
• 1,1-Dichloroethane (1,1-DCA);
• 1,1-Dichloroethene (1,1-DCE);
• 1,2-Dichloroethane (1,2-DCA);
• cis-l,2-Dichloroethene (cis-l,l-DCE);
• Tetrachloroethene (PCE); and
• Trichloroethene (TCE).
018925(21) 47 CONESTOGA-ROVERS & ASSOCIATES
Any CVOC that was detected, even if the detection was qualified or estimated, wasquantified in the HHRA, unless screened against U.S. EPA Region IX PRG, where
appropriate and in agreement with U.S. EPA Region Vll's Risk Assessor and as
discussed in the text in Appendix L. CVOCs that were not detected in an area of interest
were not carried through the risk assessment process. The maximum detected
concentration was compared to Region IX PRGs to provide a general level of risk, or
ranking.
Based on their detection, CPOCs16 have been identified in groundwater related to theNorthern Plume, and groundwater in the Southern Plume. From this COPC selectionprocess the following media in each area have been selected as potentially affected:
Area Media with COPCs
Area 1 Soil and groundwater
Area 2 Future groundwater well (no surface water COPC abovescreening criteria)
Area 3 Future groundwater well
Also based on their detection in a medium the following COPC have been identified:
Area COPCs
Area 1 soil 1,1,1-TCA, 1,1-DCA, PCE
Area 1 groundwater 1,1,1-TCA, 1,1-DCA, 1,1-DCE, 1,2-DCA, 1,2-DCE, PCE, TCEArea 2 future well 1,1,1-TCA, 1,1-DCA, 1,1-DCE, 1,2-DCE, PCE, TCE
Area 3 future well 1,1,1-TCA, 1,1-DCA, 1,1-DCE, 1,2-DCE, PCE
U.S. EPA Region VII has previously evaluated the vapor intrusion pathway by collectingindoor air data in homes located over the Southern Plume groundwater. This area
contained the highest levels of groundwater chemicals found at that time, and theU.S. EPA concluded that the concentrations of chemicals found in indoor air, due to
vapor intrusion, were either below indoor air screening levels or were of no concern tohuman health. Nevertheless, vapor intrusion was further evaluated in the riskassessment process presented in Appendix L by comparison of groundwater COPC
concentrations to U.S. EPA's vapor intrusion groundwater target levels or by modelingvapor intrusion and risk characterization.
16 COPC shall mean the chemicals of potential concern which are the specific subset of CVOCsidentified for each area evaluated as part of the HHRA.
018925(21) 48 CONESTOGA-ROVERS & ASSOCIATES
6.3 EXPOSURE ASSESSMENT
Exposure is defined as the contact of a receptor with a chemical or physical agent. The
exposure assessment is the estimation of the magnitude, frequency, duration, and routes
of exposure. An exposure assessment provides a systematic analysis of the potentialexposure mechanism by which a receptor may be exposed to chemical or physical
agents at or originating from a source. The objectives of an exposure assessment are as
follows:
1) characterization of exposure setting;
2) identification of potential exposure pathways; and
3) quantification of exposure.
The exposure assessment is presented in Appendix L - Section 3.0.
Based on the results of the media-specific screening presented in Appendix L -
Section 2.5 the following media and potential human exposures (i.e., completepathways) have been identified for quantitative evaluation, beyond screening, in the
HHRA:
1. Area 1:
Soil - CNH Property - On-Property Indus trial /commercial Worker, Current andFuture Condition:
• Ingestion;
• Dermal contact; and
• Inhalation
So/7 - CNH Property - On-Property Construction Worker, Future Condition:
• Ingestion;
• Dermal contact; and
• Inhalation
Groundwater - CNH Property - On-Property Construction Worker, FutureCondition:
• Inhalation of vapors.
018925(21) 49 CoNEsioGA-RovERS & ASSOCIATES
2. Area 2:
Ground-water - CNH Off-Property - Future well17
• Ingestion;
• Dermal contact;
• Inhalation of vapors;
• Exposure to a child in a swimming pool; and
• Inhalation of vapors as vapor intrusion.
3. Area 3
Groundwater - Northern Study Area - Future well:
• Ingestion;
• Dermal contact;
• Inhalation of vapors;
• Exposure to a child in a swimming pool; and
• Inhalation of vapor as vapor intrusion.
To quantify exposure, potential exposure scenarios were developed using U.S. EPAguidance documents, as presented in Appendix L - Section 3.3. In instances whereU.S. EPA documents did not present necessary factors, or where more appropriatescientific data were not available, professional judgment was applied to developconservative assumptions that are representative of the Reasonable Maximum Exposure(RME) and Central Tendency (CT) or mean exposure and are protective of humanhealth. The exposure scenarios and assumptions for each area of concern are presentedin Appendix L with the related data and risk calculation tables.
6.4 Toxicrrv ASSESSMENT
The toxicity assessment weighs the available data regarding the potential for a particularCOPC to cause adverse effects in exposed individuals and estimates the extent ofexposure and possible severity of adverse effects. To develop toxicity values, two stepsare taken: hazard identification and dose-response assessment. The hazardidentification determines the potential adverse effects associated with exposure to a
There are no known water wells used for tap water in this area. Moreover all residentialproperties are understood to be serviced by municipal water.
018925(21} 50 CONESTOGA-ROVERS & ASSOCIATES
COPC. In the dose-response assessment, numerical toxicity values are determined or
selected from the available toxicity data.
In the selection of toxicity values, preference has been given to the hierarchy of toxicity
values developed by U.S. EPA. This hierarchy was followed to the fullest extent
possible, in this HHRA:
• Tier 1 - U.S. EPA's IRIS;
• Tier 2 - U.S. EPA's Provisional Peer Reviewed Toxicity Values (PPRTVs); and
• Tier 3 - Other Toxicity Values.
Toxicity values were primarily obtained from the U.S. EPA IRIS (Integrated RiskInformation System) database, U.S. EPA National Center for Environmental Assessment(NCEA) provisional values as presented on the U.S. EPA Region IX PRG table, and
Health Effects Assessment Summary Table (HEAST).
As toxicological information becomes available on chemical compounds and elements
the U.S. EPA will update its IRIS database by withdrawing toxicity values and listing
new ones. Occasionally toxicity values are withdrawn before a replacement value is
approved through the extensive peer review process used by U.S. EPA. For this risk
assessment the toxicity values for PCE and TCE are impacted by the lack of toxicity
values listed in IRIS because PCE is one of the primary COPC driving the risks in theHHRA, and the toxicity values for TCE is high, giving high levels of risk with low levelsof TCE.
The dose-response data for PCE recommended by the U.S. EPA's Office of Solid Wasteand Emergency Response on June 13, 2003 has been used in this HHRA, as no value isavailable in IRIS.
A provisional cancer slope factor for TCE was developed by U.S. EPA in their,
"Trichloroethene Health Risk Assessment: Synthesis and Characterization" U.S. EPA 2001b).This document and the associated slope factor have been the subject of peer review sinceit was issued. The potential uncertainty in this risk characterization and slope factor
have been recognized by U.S. EPA Region VII, who requested that TCE be evaluated by
the slope factor listed in the risk characterization and the slope factor that waswithdrawn from the IRIS database by U.S. EPA. This withdrawn value is close to the
slope factor for TCE currently being used by California EPA (2002). Using two slope
factors allows for the full range of potential risks to be quantified for TCE.
018925(21) 51 CONESTOGA-ROVERS & ASSOCIATES
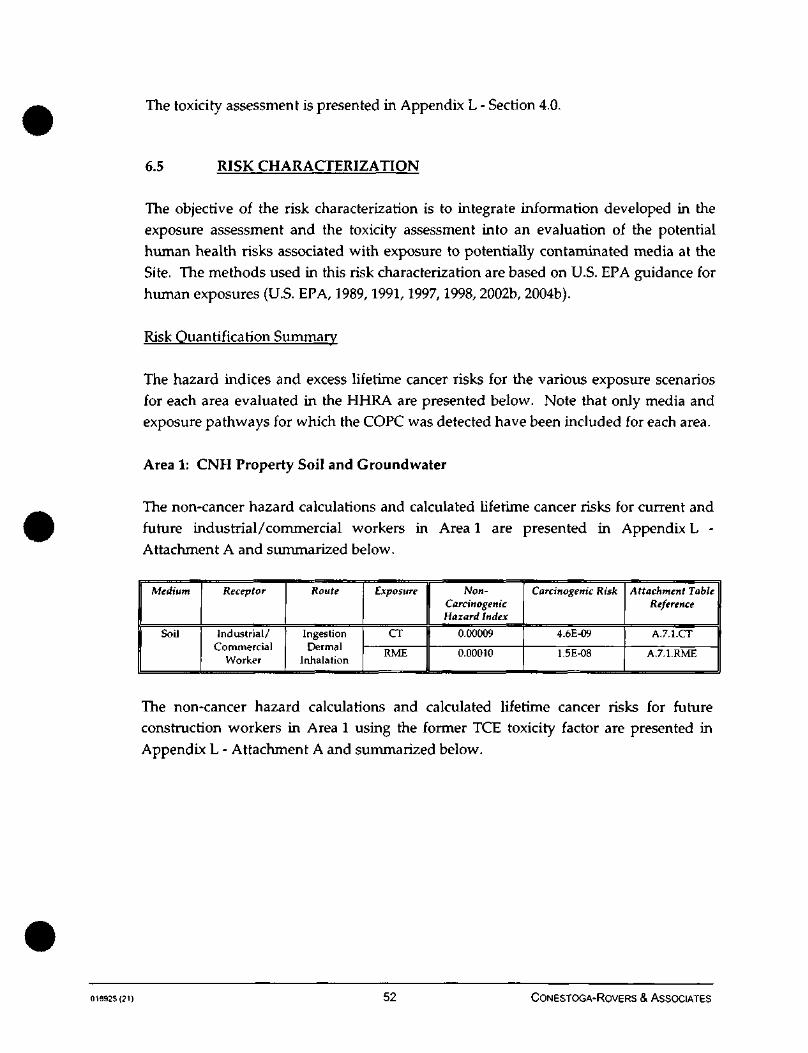
The toxicity assessment is presented in Appendix L - Section 4.0.
6.5 RISK CHARACTERIZATION
The objective of the risk characterization is to integrate information developed in theexposure assessment and the toxicity assessment into an evaluation of the potentialhuman health risks associated with exposure to potentially contaminated media at theSite. The methods used in this risk characterization are based on U.S. EPA guidance forhuman exposures (U.S. EPA, 1989,1991,1997,1998, 2002b, 2004b).
Risk Quantification Summary
The hazard indices and excess lifetime cancer risks for the various exposure scenariosfor each area evaluated in the HHRA are presented below. Note that only media andexposure pathways for which the COPC was detected have been included for each area.
Area 1: CNH Property Soil and Groundwater
The non-cancer hazard calculations and calculated lifetime cancer risks for current andfuture industrial/commercial workers in Area 1 are presented in Appendix L -Attachment A and summarized below.
Medium
Soil
Receptor
Industrial/Commercial
Worker
Route
IngestionDermal
Inhalation
Exposure
CT
RME
Non-CarcinogenicHazard Index
0.00009
0.00010
Carcinogenic Risk
4.6E-09
1.5E-08
Attachment TableReference
A.7.1.CT
A.7.1.RME
The non-cancer hazard calculations and calculated lifetime cancer risks for futureconstruction workers in Area 1 using the former TCE toxicity factor are presented inAppendix L - Attachment A and summarized below.
016925(21) 52 CONESTOGA-ROVERS & ASSOCIATES
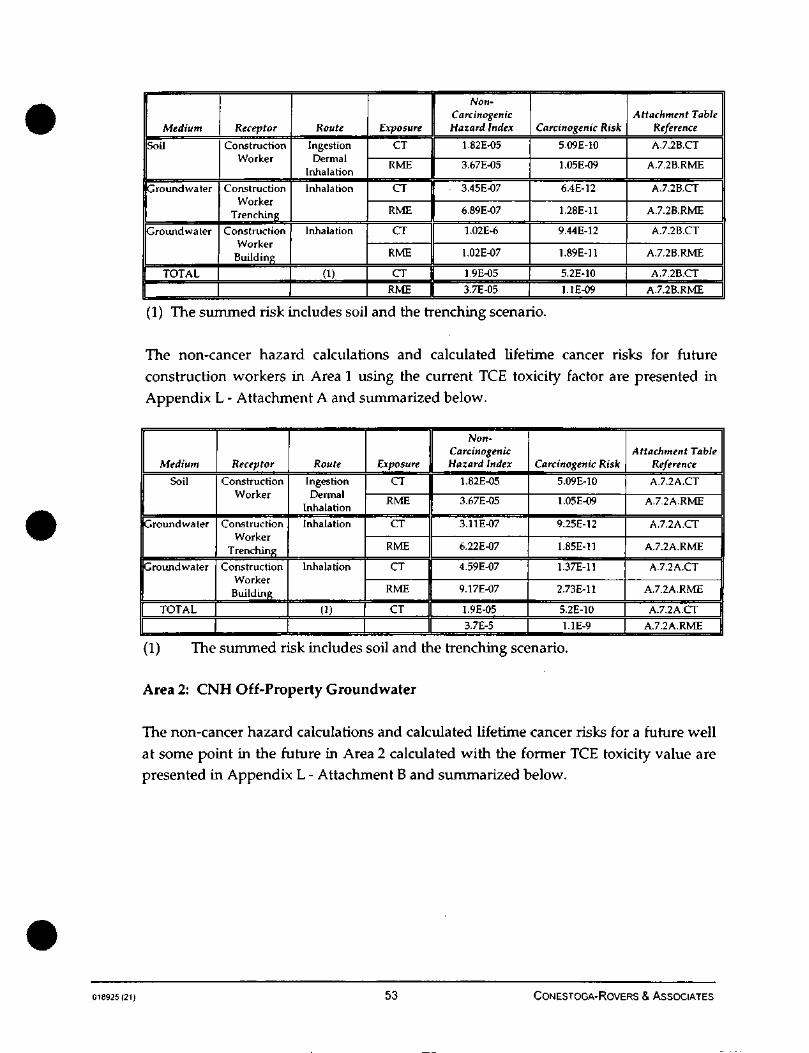
Medium
Soil
Ground water
Groundwater
TOTAL
Receptor
ConstructionWorker
ConstructionWorker
Trenching
ConstructionWorker
Building
Route
IngestionDermal
Inhalation
Inhalation
Inhalation
(1)
1 Non-CarcinogenicHazard Index
CT II 1.82E-05
RME 3.67E-05
CT I! 3.45E-07
RME 6.89E-07
CT 1 1.02E-6
RME 1.02E-07
CT II 1.9E-05
RME || 3.7E-05
Carcinogenic Risk
5.09E-10
1.05E-09
6.4E-12
1.28E-11
9.44E-12
1.89E-11
5.2E-10
1.1E-09
Attachment TableReference
A.7.2B.CT
A.7.2B.RME
A.7.2B.CT
A.7.2B.RME
A.7.2B.CT
A.7.2B.RME
A.7.2B.CT
A.7.2B.RME
(1) The summed risk includes soil and the trenching scenario.
The non-cancer hazard calculations and calculated lifetime cancer risks for futureconstruction workers in Area 1 using the current TCE toxicity factor are presented inAppendix L - Attachment A and summarized below.
Medium
Soil
Groundwater
Groundwater
TOTAL
Receptor
ConstructionWorker
ConstructionWorker
Trenching
ConstructionWorkerBuilding
Route
IngestionDermal
Inhalation
Inhalation
Inhalation
(1)
Exposure
CT
RME
CT
RME
CT
RME
CT
Non-CarcinogenicHazard Index
1.82E-05
3.67E-05
3.11E-07
6.22E-07
4.59E-07
9.17E-07
1.9E-05
3.7E-5
Carcinogenic Risk
5.09E-10
1.05E-09
9.25E-12
1.85E-11
1.37E-11
2.73E-11
5.2E-10
1.1E-9
Attachment TableReference
A.7.2A.CT
A.7.2A.RME
A.7.2A.CT
A.7.2A.RME
A.7.2A.CT
A.7.2A.RME
A.7.2A.CT
A.7.2A.RME
(1) The summed risk includes soil and the trenching scenario.
Area 2: CNH Off-Property Groundwater
The non-cancer hazard calculations and calculated lifetime cancer risks for a future wellat some point in the future in Area 2 calculated with the former TCE toxicity value arepresented in Appendix L - Attachment B and summarized below.
018925(21) 53 C-ONESTOGA-ROVERS & ASSOCIATES
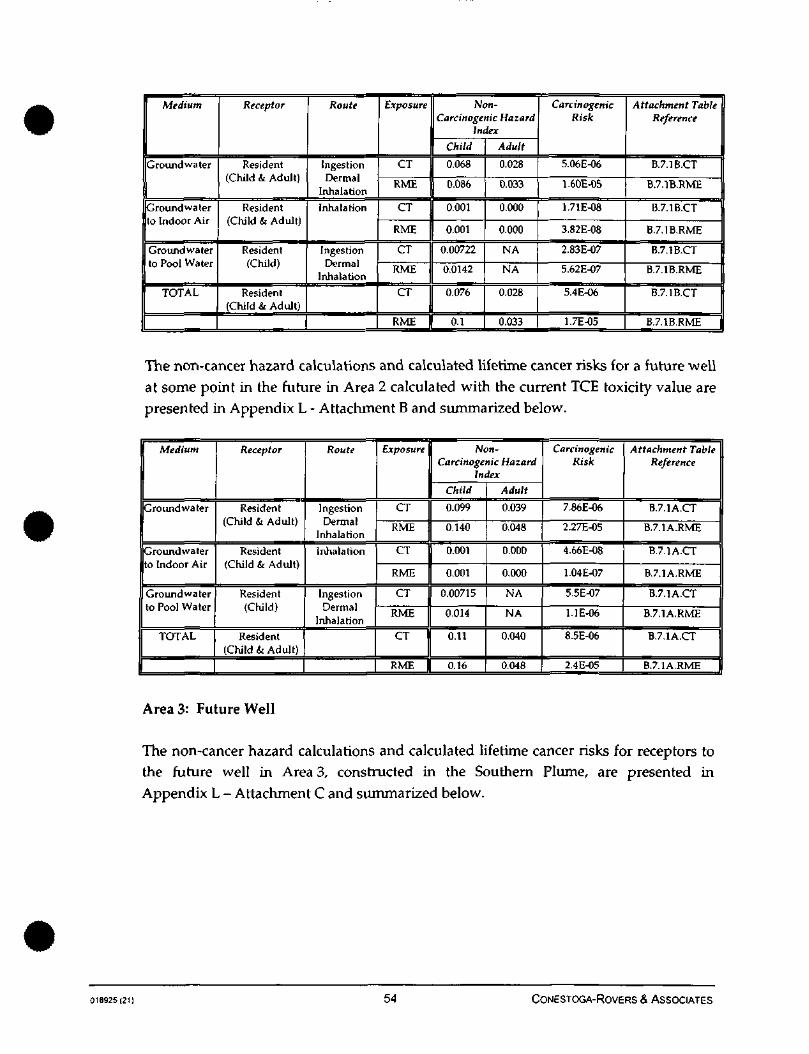
Medium
Ground water
Groundwaterto Indoor Air
Groundwaterto Pool Water
TOTAL
Receptor
Resident(Child & Adult)
Resident(Child & Adult)
Resident(Child)
Resident(Child & Adult)
Route
IngestionDermal
Inhalation
Inhalation
IngestionDermal
Inhalation
Exposure
CT
RME
CT
RME
CT
RME
CT
RME
Non-Carcinogenic Hazard
Index
Child
0.068
0.086
0.001
0.001
0.00722
0.0142
0.076
0.1
Adult
0.028
0.033
0.000
0.000
NA
NA
0.028
0.033
CarcinogenicRisk
5.06E-06
1.60E-05
1.71E-08
3.82E-08
2.83E-07
5.62E-07
5.4E-06
1.7E-05
Attachment TableReference
B.7.1B.CT
B.7.1B.RME
B.7.1B.CT
B.7.1B.RME
B.7.1B.CT
B.7.1B.RME
B.7.1B.CT
B.7.1B.RME
The non-cancer hazard calculations and calculated lifetime cancer risks for a future wellat some point in the future in Area 2 calculated with the current TCE toxicity value arepresented in Appendix L - Attachment B and summarized below.
Medium
Groundwater
Groundwaterto Indoor Air
Groundwaterto Pool Water
TOTAL
Receptor
Resident(Child & Adult)
Resident(Child & Adult)
Resident(Child)
Resident(Child & Adult)
Route
IngestionDermal
Inhalation
Inhalation
IngestionDermal
Inhalation
Exposure
CT
RME
CT
RME
CT
RME
CT
RME
Non-Carcinogenic Hazard
Index
Child
0.099
0.140
0.001
0.001
0.00715
0.014
0.11
0.16
Adult
0.039
0.048
0.000
0.000
NA
NA
0.040
0.048
CarcinogenicRisk
7.86E-06
2.27E-05
4.66E-08
1.04E-07
5.5E-07
1.1E-06
8.5E-06
2.4E-05
Attachment TableReference
B.7.1A.CT
B.7.1A.RME
B.7.1A.CT
B.7.1A.RME
B.7.1A.CT
B.7.1A.RME
B.7.1A.CT
B.7.1A.RME
Area 3: Future Well
The non-cancer hazard calculations and calculated lifetime cancer risks for receptors tothe future well in Area 3, constructed in the Southern Flume, are presented inAppendix L - Attachment C and summarized below.
018925(21) 54 CONESTOGA-ROVERS & ASSOCIATES

Medium
Groundwater
Groundwaterto Indoor Air
Groundwaterto Pool Water
TOTAL
Receptor
Resident(Child & Adult)
Resident(Child & Adult)
Resident(Child)
Resident(Child & Adult)
Route
IngestionDermal
Inhalation
Inhalation
IngestionDermal
Inhalation
Exposure
CT
RME
CT
RME
CT
RME
CT
Non-Carcinogenic Hazard
Index
Child
0.548
0.825
0.008
0.008
0.076
0.150
0.630
RME || 0.980
Adult
0.231
0.339
0.004
0.004
NA
NA
0.230
0.340
CarcinogenicRisk
3.60E-05
1.65E-04
1.07E-07
2.39E-07
1.73E-06
3.96E-06
3.8E-05
1.7E-04
Attachment TableReference
C.7.1.CT
C.7.1.RME
C.7.1.CT
C.7.1.RME
C.7.1.CT
C.7.1.RME
C.7.1.CT
C.7.1.RME
Risk estimates for past exposure to the Parkview residential tap water wells and
municipal drinking water assumed water ingestion, dermal contact, and inhalation were
also calculated, but the results are not summarized here. A full description of the risks is
presented in Appendix L - Attachments D and E, respectively.
Summary of Exceedences
Area 3, a future well in the Southern Plume showed a RME cumulative risk level of a
Hazard Index of approximately 1.0, and an excess lifetime cancer risk level of two
hundred in ten thousand (2.0E-04). The media and receptor for which risk are outside ofthe risk range typically used in remedial decision making are shown below:
Medium
Groundwater
Groundwaterto Indoor Air
Groundwaterto Pool Water
TOTAL
Receptor
Resident(Child & Adult)
Resident(Child & Adult)
Resident(Child)
Resident(Child & Adult)
Route
IngestionDermal
Inhalation
Inhalation
IngestionDermal
Inhalation
Exposure
CT
RME
CT
RME
CT
RME
CT
Non-Carcinogenic Hazard
Index
Child
0.548
0.825
0.008
0.008
0.076
0.150
0.630
RME || 0.980
Adult
0.231
0.339
0.004
0.004
NA
NA
0.230
0.340
CarcinogenicRisk
3.60E-05
1.65E-04
1.07E-07
2.39E-07
1.73E-06
3.96E-06
3.8E-05
1.7E-04
Attachment TableReference
C.7.1.CT
C.7.1.RME
C7.1.CT
C.7.1.RME
C.7.1.CT
C.7.1.RME
C.7.1.CT
C.7.1.RME
018925(21) 55 CONESTOGA-ROVERS & ASSOCIATES

Risk And Hazard COPC Contributions
The contribution of risk from each COPC was also investigated for each area evaluated
in the Northern Study Area. The results of this analysis are also shown in Appendix L -Section 5.
For the CNH Property industrial worker, excess cancer risks are less than 1 in 100
million and the analysis was not conducted. For a CNH Property construction workerexcess cancer risks are similarly less than 1 in 100 million and the analysis was not
conducted. However, PCE is the COPC with the highest level of risk, which is still lessthan IxlO-8.
For CNH Off-property groundwater, assuming a future well, which contains PCE belowthe MCL and a single estimated detection of TCE, the risks are shown for different
exposure pathways in the table below. The table shows risk from PCE only(Table B.7.1.B.RME), and the risk from all COPC in Area 2 using the current 2001 TCE
slope factor (Table B.7.1.A.RME). It can be concluded from this table that a single
detection of TCE contributes more risk using the 2001 slope factor than the 1987 slopefactor. This will increase the uncertainty in the risk estimates when TCE is included.
Exposure Pathway Cancer Risk For PCE Cancer Risk For TCE
(Table B.7.1B.RME) (Table B.7.1A.RME)
Residential Use 1.31E-05 6.84E-06Indoor Air 1.52E-08 6.7E-08Child Pool 3.06E-07 5.41E-07
Total 1.35E-05 7.45E-06
Total for all COPCs 1.7E-05 2.4E-05Percentage of Total 79% 31%
In Area 3, as impacted by the Southern Plume, potential carcinogenic risks estimates for
residents using a future groundwater well are 1.7 x 10-*. The majority of the risk is fromPCE, which contributes 95 percent of the risk. TCE was not detected in this part of theNorthern Study Area.
018925(21) . 56 CONESTOGA-ROVERS & ASSOCIATES

Exposure Pathway Cancer Risk For PCE(Table C.7.1.RME)
Residential Use 1.57E-04Indoor Air 1.87E-07Child Pool 3.27E-06Total 1.6E-04Total for all COPCs 1.7E-04Percentage of Total 95%
6.6 CONCLUSIONS
Based on the information presented in the HHRA, the following conclusions are made:
(i) The calculated human health risk within the Northern Study Area at the CNHProperty (Area 1), and in the CNH Off-Property groundwater (Area 2) are lessthan 1.0 x 1CH for potentially carcinogenic COPCs. Moreover, the Hazard Indexis less than one for these same areas.
(ii) Risks for the Future Groundwater Well in the Stolley Park/Parkview area(Area 3) are greater than one in ten thousand (1.0 x 10"1) excess cancer risk.
(iii) The risks in the Stolley Park/Parkview area (Area 3) are driven by the ingestionof PCE from a future groundwater well. PCE contributes 95 percent of thepotential cancer risks for the Future Groundwater Well.
6.7 UNCERTAINTY
The objective of the human health risk assessment process is to estimate an upper-boundaverage, and average risk for potential receptors under assumed and future exposurescenarios. The exposure assumptions used in the risk assessment reflect anupper-bound exposure approach, which can lead to an over-estimate of the actual risksat a site. For example, in the future well exposure, it is assumed that an individualconsumes 2.3 liters of water from the same source for 350 days per year, for 30 years,and does not consume soda or other beverages as part of the 2.3 liters. All uncertaintyassociated with the risk assessment is discussed in Appendix L, Section 5.6.
018925(21) 57 CONESTOGA-ROVERS & ASSOCIATES
7.0 SCREENING LEVEL ECOLOGICAL RISK ASSESSMENT
7.1 INTRODUCTION
Pursuant to the AOC, the Ecological Risk Assessment (ERA) assessed the "...ecologicalrisks which may be posed by such CVOCs." CVOCs refers to chlorinated volatileorganic compounds known to occur at the Site, notably chlorinated alkenes andchlorinated alkanes. For this ecological risk assessment the COPCs are the CVOCs.Further, the SOW states that the ERA shall address the following:
• Definition of objectives;
• Characterization of Site and potential receptors;
• Selection of chemicals, species and end points for risk evaluation;
• Exposure assessment;
• Toxicity assessment;
• Risk characterization; and
• Limitations/uncertainties.
The following assessment fulfils these requirements.
7.1.1 STRUCTURE OF THE ERA
In general, this risk assessment follows EPA guidance (EPA 1997). As described in thatguidance, the Ecological Risk Assessment process can involve up to eight steps. Thefirst two steps, described below, comprise the screening level ecological risk assessment(SLERA).
Step 1. Screening-level problem formulation and ecological effects evaluation: Thisfirst step consists of a basic description of the Site and its habitats and known hazardsand their likely modes of ecotoxicity. This information is then analyzed to determinewhether there are complete or potentially complete exposure pathways from knownsources. This information is combined into a preliminary Conceptual Site Model.
Step 2. Screening-level exposure estimate and risk calculation: The second step of theecological risk screening includes the exposure estimate and risk calculation. Risk isestimated based on maximum exposure concentrations compared to ecologicalscreening values from Step 1 and screening quotients of constituents of concern are
018925(21) 58 CONESTOGA-ROVERS & ASSOCIATES
presented. A screening quotient less than 1 indicates that the CVOC alone is unlikely tocause adverse ecological effects.
After completion of the SLERA, the results are presented to the risk managers. TheSLERA can produce three outcomes:
1) Information is adequate to determine that ecological risks are negligible;
2) Information is inadequate to make a decision; or
3) Information indicates a potential adverse ecological effect exists.
If either of the latter two conclusions is reached, the risk assessment proceeds tosubsequent steps in the 8-step process (see Appendix M). Together they comprise theBaseline Ecological Risk Assessment (BERA).
7.1.2 OBJECTIVES OF THE ERA
In general, ecological risk assessments are intended to provide risk managers withinformation sufficient to determine whether remedial actions are necessary to protectthe ecological receptors from toxic chemicals or other hazards at a Site. Specifically, theobjective of this SLERA is to determine whether the existing concentrations ofchlorinated VOCs in soil, groundwater, sediments, and surface water pose risk toecological receptors.
7.2 SLERA STEP 1: SCREENING LEVEL PROBLEM FORMULATION
7.2.1 CHARACTERIZATION OF THE SITEAND POTENTIAL RECEPTORS
Land use within the Site boundary (as defined by the AOC) is divided intocommercial/industrial, agricultural and residential categories. Commercial/industriallots include the CNH property on the western portion of the Site and several propertiesimmediately east of Highway 281. Agricultural lots include a cultivated field to the east,west and south of the CNH property.
The land use in adjacent areas is similar to the Site, and consists ofcommercial/industrial, agricultural and residential. This is discussed further inAppendix M. Except for small areas of brushland and undeveloped areas, there is littleto no terrestrial habitat other than managed lawns and agricultural fields. The latter
018925(21) 59 CONESTOGA-ROVERS & ASSOCIATES

areas are not of high priority for ecological risk assessment, nor is there any likelihoodthat they serve as habitat for endangered species. They could serve as temporaryforaging areas for migrant wildlife and for species, such as robins, sparrows, rabbits, andsquirrels, which occur in human landscapes.
The Site also contains some small ponds or lakes. The Duck Pond is a stormwaterdetention basin, less than 2 acres in size located on the CNH property. In addition, thereare two gravel pits in the residential areas. Now, filled with water, they have beennamed Brentwood Gravel Pit Lake and Kenmare Gravel Pit Lake. Brenrwood Lake isapproximately 13 acres in size, while the Kenmare Gravel Pit Lake is approximately3 acres. For purposes of this assessment, it was assumed that these areas havenaturalized to the extent that they currently provide habitat for fish and other aquaticlife. It is noted that the Site is located within the Platte River Valley, which is a majormigratory bird pathway. This is discussed further in Section 7.2.3.
7.2.2 FATE, TRANSPORT, AND ECOTOXICITY OFCHEMICALS OF POTENTIAL CONCERN (COPC)
According to guidance (EPA 1992, EPA 1997), COPCs should be selected based on anunderstanding of what chemicals were used and potentially released at a Site. Based onthe Statement of Work (SOW) attached to the AOC chlorinated alkanes and alkenes(CVOCs) are the COPCs at this Site. These COPCs include 1,1-DCA, 1,1,1-TCA,1,2-DCA, TCE, PCE, 1,1-DCE, and cis-l,2-DCE. This is discussed further in Appendix M- Section 2.2.
7.2.3 PRELIMINARY CONCEPTUALSITE MODEL/ASSESSMENT ENDPOINTS
The Site contains functional aquatic habitat but little functional terrestrial habitat. Thus,the SLERA will assume that there is potential exposure to chemicals in surface waterand sediments. Ecological receptors are not exposed to groundwater except when thatgroundwater is discharged to surface waters. Although the hydraulic connectionbetween groundwater and the ponds within the study area has not been established, itwas conservatively assumed that the groundwater within the Site would potentiallydischarge to some nearby surface water. Thus, the exposure pathway fromgroundwater was also considered complete, albeit only after dilution and fate processes.The preliminary conceptual site model is presented in Appendix M - Section 2.3.
018925(21) 60 CONESTOGA-ROVERS & ASSOCIATES
On the other hand, potential exposure to COPCs in surface soils is likely minimal. Thearea contains little functional habitat, and the chlorinated VOCs are unlikely to persist insurface soils. In general, ecological receptors are exposed to chemicals only in surfacesoils (by convention the upper 1 foot below ground surface (ft bgs)). That is, exposurefrom chemicals in deep soil to ecological receptors is assumed to be functionallyincomplete18. For both reasons, the exposure pathway from surface soil to ecologicalreceptors was considered functionally incomplete.
Assessment endpoints are the specific ecological values that should be protected fromSite-related chemicals. Assessment endpoints should be selected based on severalfactors: economic importance, importance to society, ecological importance, andsensitivity to COPCs (EPA 1997). Based on the available habitat the SLERA will focus onpotential risks to fish and other aquatic life. These are the habits and species of primarysocietal concern. The following are appropriate assessment endpoints for this Site.
• Health of the benthic invertebrate community inhabiting the sediments of aquatichabitats.
• Health of the water column community of on-Site aquatic habitats.
Given the low quality of the terrestrial habitat and the low persistence of VOCs insurficial soils, potential risks to terrestrial species and habitats are of minor concern.Nonetheless, potential risks to terrestrial biota, will be considered in the SLERA toprovide additional information.
As indicated in Section 7.2.1, the Site is located within the Platte River Valley, which is amajor migratory bird pathway. Aquatic birds using this flyway include the sandhillcranes, the snow geese, mallards, and Canada geese. The COPCs do not persist insurface water or sediments, nor do they bioaccumulate readily in aquatic biota. Thus,the exposure pathway from Site-related chemicals to migratory or even residentwaterfowl is functionally incomplete. A migratory waterbird's exposure to Site-relatedchemicals is further limited by the short time any one species spends in the area whilemigrating north and south.
18 Some burrowing organisms such as woodchucks and prairie dogs will be exposed to chemicals indeeper soils, primarily associated with grooming. However, the exposure from this pathway isminor compared to that associated with ingestion of chemicals in food.
018925(21) 61 CONESTOGA-ROVERS & ASSOCIATES
7.2.4 DATA USED IN THE ASSESSMENT FOR THE CNH PROPERTY
Soil and sediment conditions have been characterized as part of previous investigationsas discussed previously. Groundwater conditions have been characterized using datafrom geoprobe groundwater sampling and monitoring well samples.
7.2.5 DATA USED IN THE ASSESSMENTOUTSIDE THE CNH PROPERTY
Sediment and surface water samples were collected at five locations within BrentwoodGravel Pit Lake and four locations within Kenmare Gravel Pit Lake as discussedpreviously. It should be noted that COPC concentrations in groundwater samplescollected near the existing surface water features are below ESLs, therefore do not posean ecological risk.
Groundwater conditions have been characterized using geoprobe groundwatersampling locations and monitoring wells located within the Parkview and Stolley Parksubdivisions.
7.3 SLERA STEP 2: SCREENING LEVELEXPOSURE ESTIMATE AND RISK CALCULATION
In the second step of the SLERA, COPCs and complete exposure pathways identified inStep 1 are screened in terms of their potential to cause ecological risk.
7.3.1 RESULTS OF COPC SCREENING
Summaries of COPC data, along with the risk screening are presented in Tables 3.1through 3.5 of Appendix M for sediment, soil, surface water, and groundwater. Asshown in Tables 3.1 through 3.4, concentrations of COPCs are below respective ESVs insediments, soil, and surface water, and the COPCs were infrequently detected in all ofthese media. Maximum concentrations of COPCs in groundwater did not exceedNebraska's acute criteria or the chronic criteria derived from Nebraska's criteria(Table 3.5-Appendix M). On the other hand, the maximum groundwater concentrationsof 1,1,1-TCA and 1,1-DCA were about 20 times the more conservative Region V ESV forsurface water. It is noted that this assessment is very conservative since the maximumconcentrations in groundwater have been compared to the very conservative Region VESVs for surface water. The surface water samples are a much more reliable indicator of
018925 (2i) 62 CoNESTOGA-RovERS & ASSOCIATES
the potential effects of discharging groundwater on surface water species, and neither ofthese compounds was detected in surface water except for one detection of 1,1-DCA, anestimated value, which is almost 200 times lower than the conservative Region V ESV.Thus, risks from these compounds to ecological receptors can be dismissed as unlikely.
7.3.2 RISK CHARACTERIZATION
Residual COPCs remaining in soil, sediments, surface water, and groundwater pose norisk to ecological receptors. The compounds were effectively not detected in sedimentsand surface water, and post-clean up levels in soils were below Region IX PRGs, ordersof magnitude below ecological screening levels. Maximum concentrations of twochemicals, 1,1,1-TCA and 1,1-DCA exceeded most conservative surface water ESVs.However, the maximum groundwater concentrations of these compounds did notexceed more reliable surface water ESVs based on Nebraska surface water qualitystandards. In addition, the COPCs are expected to volatilize rapidly once discharged tosurface water, so their surface water concentrations will be much lower than maximumgroundwater concentrations. Most importantly, these compounds were effectively notdetected in surface water. Thus, ecological risks from these compounds at this Site canbe dismissed as highly unlikely.
7.3.3 LIMITATIONS/UNCERTAINTIES
In general, there is little uncertainty about the results of this risk assessment. By theirnature, the VOCs have little potential to cause ecological risk. They are generally notvery toxic to ecological receptors, they are not persistent in media to which ecologicalreceptors are exposed (e.g., surface soils, surface waters, and sediments), and they donot readily bioaccumulate via food chains. Therefore, VOCs rarely pose ecological riskat contaminated sites even before remediation.
The intrinsically low potential of VOCs to pose ecological risk was reduced considerablyat this site by the stringent human health clean-up levels that were achieved by theRemoval Action. These clean-up levels were based on potential human health effects.Human health impacts of VOCs can be significant, especially in comparison to therelatively low toxicity and exposure potential to wildlife, from VOCs. In other words,the clean-up levels used for the soil at the CNH property are more stringent thannecessary to protect ecological receptors. Thus, this SLERA's conclusion of nosignificant potential for ecological risk is consistent with, and predictable from anunderstanding of the COPCs fate and toxicity characteristics.
018925(21) 63 CONESTOGA-ROVERS & ASSOCIATES
As determined in the SOW, the risk assessment considered risks from the site-specific
CVOCs, so there is some uncertainty about potential risks from other parameters.However, based on the results of post-excavation sampling from the Removal Action,
this uncertainty is not significant. Of these parameters, all were less than Region IX
PRGs or background conditions. In addition to the low post-cleanup concentrations,
risks from these remaining chemicals are limited because they are located on-Site in
areas of poor or non-habitat. Therefore, exposure pathways to ecological receptors areincomplete or functionally incomplete.
7.4 CONCLUSIONS/SCIENCE MANAGEMENTDECISION INPUT POINT
As described previously, a SLERA can produce three possible conclusions:
1) Information is adequate to determine that ecological risks are negligible;
2) Information is inadequate to make a decision; or
3) Information indicates a potential adverse ecological effect exists.
The preceding analyses strongly indicates that conclusion No. 1 is appropriate. Based
on the nature of on-site habitat and the fate/transport characteristics of the COPCs, thisSLERA focused on assessing risks to aquatic organisms. Based on available information,
the risks from COPCs in surface water and sediment to aquatic biota can be dismissed as
unlikely. These risks were judged to be insignificant even under the most conservative
exposure scenarios in which the maximum concentrations were compared to the most
conservative ESVs. Potential ecological risks from contaminated groundwaterdischarging to surface waters are also dismissed as unlikely. These risks were dismissed
under more realistic but still conservative assumptions concerning exposure andtoxicity.
The Site has little functional terrestrial habitat, and VOCs are not expected to persist in
the surficial soils to which ecological receptors are most exposed. Assessment of risks toterrestrial biota from COPCs in soil was, therefore, a low priority for the SLERA.
Nonetheless, for completeness, the SLERA screened residual COPC concentrations in
soil. Potential risks from the COPC in soils were also found to be unlikely.
These conclusions of no significant potential for risk are supported by a basic
understanding of the fate, transport, and ecotoxiciry of chlorinated VOCs. Due to their
018925(21) 64 CONESTOGA-ROVERS & ASSOCIATES

generally low ecotoxicity and short persistence in most environmental media, VOCsrarely cause ecological risk. Thus, there is little uncertainty concerning the conclusionthat CVOCs at this Site pose no ecological risk.
In summary, the available information is sufficient to conclude that ecological risks arenegligible. Further risk assessment activities are neither warranted nor recommended.
018925(21) 65 CONESTOGA-ROVERS & ASSOCIATES
8.0 CONCLUSIONS
Pursuant to the Administrative Order on Consent (CERCLA Docket No. 07-2005-0264)
between the U.S. EPA and CNH, an RI of the Parkview Well Site-Northern Study Area,
Grand Island, Nebraska, was conducted. The Northern Study Area has been extensivelycharacterized through the substantial efforts of U.S. EPA, NDEQ, the City of Grand
Island, and CNH. An extensive data set exist to accurately delineate CVOCs present in
groundwater, soils and sediments.
On the basis of the consolidated data set which is representative of the currently
available information and the detailed analysis provided herein, the following
conclusions are drawn:
1) The regional groundwater flow direction within Hall County is to the east and
northeast depending on location. Within Grand Island the flow direction is
generally east-northeast.
2) Groundwater flow at the Site is in a predominantly easterly direction across theCNH Property. Groundwater flow continues in an easterly direction towards the
Brentwood Gravel Pit Lake at which point it moves in a east-northeast direction.
3) Residual contamination representative of the Northern Plume emanates from the
former Burn and Burial Areas on the CNH Property towards the Stolley
Park/Parkview Area at levels below MCLs. Concentrations of 1,1-DCE and1,1-DCA east of the Brentwood Gravel Pit Lake are at or below PQLs and, in any
event, were the only CVOCs detected based on the currently available data.
4) The Northern Plume is not a contributor of PCE above MCLs to the groundwater
environment in the Northern Study Area.
5) The Northern Plume does not contribute 1,1,1-TCA or 1,1-DCE above MCLs
beyond CNH's eastern boundary to the Northern Study Area.
6) The concentrations of CVOCs observed to the east of the Brentwood Gravel Pit
Lake decline to levels less than 1.0 M-g/L and approach the analytical PQL of0.5 ug/L at which point the level of analytical uncertainty is greatly increased.
Specifically, the maximum observed CVOC concentration at GGW-556 is
1,1-DCA at 0.53 ug/L which is marginally above the 0.5 ng/L PQL. On this basisand due to the marked difference in 1,1-DCE to 1,1-DCA ratios at this location
and GP-02 (0803) located further to the east of GGW-556, the groundwaterconditions in the eastern portion of the Northern Plume near GGW-556 appear
less consistent with the groundwater conditions in the Southern Plume.
018925(21) 66 CONESTOGA-ROVERS & ASSOCIATES

7) The source of groundwater contamination in the Northern Plume has been
reduced to less than EPA Region IX PRGs and the residual groundwater
contamination is actively being depleted by biotic and abiotic mechanisms.
8) Natural biological degradation is a significant degradation mechanism
elucidated in the Northern Plume source area as determined by multiple lines of
evidence namely the presence of bioric degradation daughter products, daughter
product degradation, reduction of dissolved organic carbon and nitrates along
the groundwater flow path, increasing chloride concentrations along the
groundwater flowparh and the results of the microsm study conducted under
RAPMA for the NDEQ.
9) The Northern Plume does not reach potable water wells in the Northern Study
area above MCLs.
10) The actual source of the Southern Plume has been identified by U.S. EPA and is
in the vicinity of Husker Highway and Engleman Road.
11) The calculated human health risk within the Northern Study Area at the CNH
Property (Area 1), and in the CNH Off-Property groundwater (Area 2) are less
than 1.0 x 10⁻⁴ for potentially carcinogenic COPC. Moreover, the Hazard Index is
less than one for these same areas.
12) Risks for the Future Groundwater Well in the Stolley Park/Parkview area
(Area 3)19 are greater than one in ten thousand (1.0 x 10^*) excess cancer risk.
13) The risks in the Stolley Park/Parkview area (Area 3)19 are driven by the ingestion
of PCE from a future groundwater well. PCE contributes 95 percent of the
potential can'cer risks for the Future Groundwater Well.
19 As explained in Section 6 and Appendix L, Area 3 refers to a future groundwater well scenario inthe Southern Plume located in the Northern Study Area in the vicinity of Pioneer Blvd.
018925(21) 67 CONESTOGA-ROVERS & ASSOCIATES
9.0 REFERENCES
ADL July, 1993. Little, A.D., Phase IA Environmental Assessment Report, July 1993 .
ATSDR, 1997. Agency for Toxic Substances and Disease Registry (ATSDR), 1997,Toxicological Profile for Trichloroethylene, Section 4. Production,
Import/Export, Use, and Disposal, U.S. Department of Health and Human
Services, Atlanta, GA p. 185-189.
Carey et al., 1999. Carey, G., Wiedemeir, T., Van Geel, P., McBean, E., Murphy, R., andRovers, F., "SEQUENCE Visualization of Natural Attenuation Trends at Hill Air
Force Base, Utah", 1999 Bioremediation Journal, 3(4), 379-393.
City of Grand Island, Groundwater Map Sifter Database.http://mapsifter.ci.grand-island.ne.us/mapsifter/groundwaterfront/index.htm
City of Grand Island, November 2005. Correspondence, plans and details of municipalwells, Julie Frandsen, City of Grand Island Utilities Department.
COHYST, March 2005. Cannia, J.C., Woodward, D., Cast, L.D., 2005. "CooperativeHydrology Study COHYST Hyd rostra tigraphic Units and AquiferCharacterization Report", Cooperative Hydrology Study, March 2005.
CRA February 2004. Comprehensive Off-Site Investigation and Work Plan,
Conestoga-Rovers & Associates, February 2004.
CRA April 2003. Supplemental Investigation, Conestoga-Rovers & Associates, April 2003.
CRA May 2002. Geophysical Investigation and Soil Assessment in the Vicinity of the Burial
and Burn Areas and the Duck Pond, Conestoga-Rovers & Associates, May 2002.
CRA, March 2004. Final Report, Interim Removal Action, Conestoga-Rovers & Associates,March 2004.
CSD 1969. Elder, J.A., 1969. "Soils of Nebraska", Resource Report No. 2, University ofNebraska and the CSD.
D&M 1995(2). Phase II - Lateral Delineation of Impacted Groundwater, Ford New
Holland Facility, Grand Island, Nebraska by Dames and Moore, 1995.
D&M 1995. Phase II - Lateral Delineation of Impacted Groundwater, Ford New Holland
Facility, Grand Island, Nebraska by Dames and Moore, 1995.
Doherty, 2000. Doherty, R.E., 2000, A History of the Production and Use of CarbonTetrachloride, Tetrachloroethylene, Trichloroethylene and 1,1,1-Trichloroethane
in the United States: Part 2 - Trichloroethylene and 1,1,1-Trichloroethane, Journalof Environmental Forensics, v. 1, no. 2, p. 83-93.
ENSR October, 1993. Preliminary Subsurface Investigation in the Burial and Bum Areas
prepared for Ford by ENSR Consulting and Engineering.
018925(21) 68 - CONESTOGA-ROVERS & ASSOCIATES
FSU, 1995. Florida State University (FSU), 1995, Strategic Assessment of Florida's
Environment (SAFE): Households on Septic Tanks, Program for Environmental
Policy and Planning Systems, FSU, p. 28-29. •
G&M 1996. Phase II Groundwater Investigation, Geraghty and Miller, February 1996.
Groundwater Atlas of Nebraska, 1998. Conservation and Survey Division (CSD),
Institute of Agriculture and Natural Resources, University of Nebraska-Lincoln,1998. "The Groundwater Atlas of Nebraska", Resource Atlas No. 4a.
Keech and Dreeszen 1964. Keech, C. F. and Dreeszen, V. H., "Availability of Ground Water
In Hall County, Nebraska", Hydrologic Investigations Atlas HA-131,
U.S. Geological Survey, 1964.
Long Island, 1991. Long Island Sound Study, 1991, The Impact of Septic Systems on theEnvironment, New York Sea Grant Extension Program and the Connecticut Sea
Grant Marine Advisory Board.
Lutz, May 1994. Report on Ground Water Elevations., Lutz, Daily & Brain Consulting
Engineers., Prepared for Public Works Department, City of Grand Island,Nebraska., May 1994.
Lyngkilde and Christensen, 1992. Lyngkilde,}., and Christensen, 1992, Fate of Organic
Contaminants in the Redox Zones of a Landfill Leachate Pollution Plume,
Journal of Contaminant Hydrology, Vol. 10, ppp. 273-289
ROD 1996. Superfund Record of Decision: Cleburn Street Well, Grand Island, Nebraska., EPAID: NED981499312, OUOL, June 7, 1996.
ROD 1999. Superfund Record of Decision: Cornhusker Army Ammunition Plant, Hall County,
Nebraska, EPA ID: NE2213820234, OU 03, December 14,1999.
RODA 2001. Superfund Record of Decision Amendment: Cornhusker Army AmmunitionPlant, Hall County, Nebraska., EPA ID: NE2213820234, OU 01, September 26, 2001.
Tetra Tech August 2004. Updated Trip Report arid Data Summary., Stolley Park
Groundwater Contamination Site, Grand Island, Nebraska., Prepared forU.S. EPA Region 7, Superfund Technical Assessment and Response Team
(START)2 Contract No. 68-S7-01-41, Task Order No. 0169., August 30, 2004.
Tetra Tech March 2004. Preliminary Site Assessment/ Site Inspection, Revision 01., Stolley
Park Groundwater Contamination Site, Stolley Park Road, Grand Island,Nebraska., Task Assignment No.: TA-03-02A., March 2004.
Tetra Tech November 2004. Final Trip Report and Data Summary., Parkview Well Site,
Grand Island, Nebraska., Prepared for U.S. EPA Region 7, Superfund TechnicalAssessment and Response Team (START)2 Contract No. 68-S7-01-41, Task Order
No. 0190., November 22, 2004.
018925(21) 69 CONESTOGA-ROVERS & ASSOCIATES
Tetra Tech October 2005. Trip Report and Data Summary for May and June 2005 Sampling
Events., Parkview Well Site, Grand Island, Nebraska., Prepared for U.S. EPA
Region 7, Superfund Technical Assessment and Response Team (START)2Contract No. 68-S7-01-41, Task Order No. 0218., October 27, 2005.
U.S. EPA, 1994. Evaruating and Identifying Contaminants of Concern for Human
Health, Region 8, Superfund Technical Guidance, United States Environmental
Protection Agency, Superfund Management Branch, September 1994.
U.S. EPA, 1989. Risk Assessment Guidance for Superfund (RAGS) Interim Final,EPA/540/1-89/002, December 1989.
U.S. EPA, 1991a. Risk Assessment Guidance for Superfund, Volume 1: Human HealthEvaluation Manual - Supplemental Guidance, Standard Default Exposure
Factors, Interim Final, OSWER Directive 9285.6-03.
U.S. EPA, 1991b. Risk Assessment Guidance for Superfund Vol. 1: Human Health
Evaluation Manual (Part B, Development of Risk-Based Preliminary Remediation
Goals), Publication 9285.7-01 B.
U.S. EPA, 1992. Framework for Conducting Ecological Risk Assessment,EPA/630/R-92/001, February 1992.
U.S. EPA, 1997. Exposure Factors Handbook, EPA/600/P-95/002F, August 1997.
U.S. EPA, 1998. Office of Solid Waste and Emergency Response (OSWER). Clarification
to the 1994 Revised Interim Soil Lead Guidance for CERCLA Sites and RCRA
Corrective Action Facilities. OSWER Directive No. 9200.4-27P. Washington, DC.
U.S. EPA, 2001. Risk Assessment Guidance for Superfund, Volume 1: Human HealthEvaluation Manual (Part D, Standardized Planning, Reporting, and Review of
Superrund Risk Assessments) Interim, Publication 9285.7-01D, December 2001.
U.S. EPA, 2002b. Child-Specific Exposure Factors Handbook, September.
U.S. EPA, 2004b. Region IX PRG tables, October 2004.
U.S.G.S. 1940. Wenzel, L.K., 1940. "Local Overdevelopment of Ground-water Supplies
with special reference to conditions at Grand Island, Nebraska", CSD of theUniversity of Nebraska and the Grand Island Water Department.
U.S.G.S. 1973. Dreeszen, V.H., Reed, E.G., and Burchett, R.R., 1973. "Bedrock GeologicMap showing Thickness of overlying Quarternary Deposits, Grand Island,
Quadrangle, Nebraska and Kansas", U.S. Geological Survey and the Nebraska
Geological Survey, Miscellaneous Geologic Investigations Map 1-819.
USEPA, 1994. Evaluating and Identifying Contaminants of Concern for Human Health,
Region 8, Superfund Technical Guidance.
018925(21) 70 CONESTOGA-ROVERS & ASSOCIATES
USEPA, 1998. Technical Protocol for Evaluating Natural Attenuation of Chlorinated
Solvents in Groundwater: EPA/600/R-98/128.
Wiedemeier et al., 1996. Wiedemeier TH; Swanson MA; Wilson JT; Kampbell DH; Miller
RN; Hansen JE. 1996. Approximation of Biodegradation Rate Constants for
Monoaromatic Hydrocarbons (BTEX) in Ground Water. Groundwater Monitoring
and Remediation. 16(3):186-194.
Wiedemeier et al., 1999. Wiedemeier, T., H. Rafai, C. Newell, and J. Wilson, 1999,
Natural Attenuation of Fuels and Chlorinated Solvents in the Subsurface, John
Wiley & Sons, New York.
018925(21) 71 CONESTOGA-ROVERS & ASSOCIATES
APPENDIX L
HUMAN HEALTH RISK ASSESSMENT
[HtW25(: i )

TABLE OF CONTENTS
Page
1.0 INTRODUCTION AND OVERVIEW OF THE NORTHERN STUDY AREA L-l1.1 OVERVIEW OF THE HHRA L-l1.2 HHRA AREAS AND ASSOCIATED DATA L-21.2.1 AREA 1: THE CNH PROPERTY L-21.2.1.1 AREA1: CNH PROPERTY SOIL L-21.2.1.2 CNH PROPERTY GROUNDWATER L-41.2.2 AREA 2: CNH OFF-PROPERTY L-41.2.2.1 AREA 2: CNH OFF-PROPERTY GROUNDWATER L-51.2.2.2 AREA 2: GRAVEL PIT LAKES L-51.2.3 AREA 3: FUTURE GROUNDWATER WELL L-51.3 NATURE AND EXTENT OF CONTAMINATION L-61.4 OBJECTIVE OF THE HHRA L-61.5 ORGANIZATION OF HHRA L-7
2.0 IDENTIFICATION OF CHEMICALS OF POTENTIAL CONCERN L-92.1 DATA COLLECTION L-102.2 DATA EVALUATION L-102.3 SCREENING CRITERIA L-102.3.1 SOIL L-ll2.3.2 GROUNDWATER L-ll2.3.3 SURFACE WATER L-ll2.3.4 AMBIENT AIR L-122.4 COPC SELECTION BY AREA L-122.4.1 AREA 1: CNH PROPERTY SOIL L-122.4.2 AREA 1: CNH PROPERTY GROUNDWATER L-132.4.3 AREA 2: CNH OFF-PROPERTY AMBIENT AIR L-142.4.4 AREA 2: CNH OFF-PROPERTY GROUNDWATER L-152.4.5 AREA 2: GRAVEL PJT LAKES L-162.4.6 AREA 3: FUTURE GROUNDWATER WELL L-172.5 SUMMARY OF COPC SELECTION L-19
3.0 EXPOSURE ASSESSMENT L-203.1 CHARACTERIZATION OF EXPOSURE SETTING L-203.1.1 AREA 1: CNH PROPERTY CURRENT AND FUTURE LAND USE ... L-203.1.2 AREA 2: CNH OFF-PROPERTY
CURRENT AND FUTURE LAND USE L-213.1.3 AREA 3: FUTURE GROUNDWATER WELL L-213.2 IDENTIFICATION OF POTENTIAL EXPOSURE PATHWAYS L-223.2.1 SOURCES AND RECEIVING MEDIA L-223.2.2 FATE AND TRANSPORT OF COPCS L-23
018925 < ? i ) CONESTOGA-ROVERS & ASSOCIATES
TABLE OF CONTENTS
Page3.2.3 POTENTIAL EXPOSURE POINTS L-243.2.3.1 AREA 1: CNH PROPERTY SOIL L-243.2.3.2 AREA 1: CNH PROPERTY GROUNDWATER L-253.2.3.3 AREA 2: CNH OFF-PROPERTY GROUNDWATER L-273.2.3.4 AREA 3: FUTURE GROUNDWATER WELL L-283.2.4 COMPLETE PATHWAYS AND EXPOSURE ROUTES L-293.2.4.1 AREA 1: INDUSTRIAL/COMMERCIAL WORKER L-303.2.4.2 AREA 1: CONSTRUCTION WORKER L-313.2.4.3 AREA 2: CNH OFF-PROPERTY FUTURE WELL L-313.2.4.4 AREA 2: GRAVEL PIT LAKES L-323.2.4.5 AREA 3: FUTURE GROUNDWATER WELL L-323.3 QUANTIFICATION OF EXPOSURE L-333.3.1 EXPOSURE POINT CONCENTRATIONS L-343.3.1.1 AREA 1: CNH PROPERTY SOIL L-343.3.1.2 AREA 1: CNH PROPERTY GROUNDWATER L-353.3.1.3 AREA 1: CNH PROPERTY AMBIENT AIR L-353.3.1.4 AREA 2: CNH OFF-PROPERTY GROUNDWATER L-383.3.1.5 AREA 3: FUTURE GROUNDWATER WELL L-393.3.2 ROUTE SPECIFIC INTAKE EQUATIONS L-403.3.2.1 SOIL 1NGESTION INTAKE EQUATION L-403.3.2.2 SOIL DERMAL CONTACT INTAKE EQUATION L-413.3.2.3 SOIL VAPOR INHALATION FROM SOIL INTAKE EQUATION L-423.3.2.4 GROUNDWATER INGESTION INTAKE EQUATION L-423.3.2.5 GROUNDWATER DERMAL CONTACT INTAKE EQUATION L-433.3.2.6 GROUNDWATER VAPOR INHALATION INTAKE EQUATION L-443.3.2.7 INDOOR AIR/AMBIENT AIR INHALATION INTAKE EQUATION L-443.3.3 EXPOSURE ASSUMPTIONS L-453.3.3.1 AREA 1: INDUSTRIAL/COMMERCIAL WORKER - SOIL L-453.3.3.2 AREA 1: ON-SITE CONSTRUCTION WORKER - SOIL L-463.3.3.3 AREA 1: ON-SITE CONSTRUCTION WORKER -
GROUNDWATER L-483.3.3.4 AREA 2: CNH OFF-PROPERTY GROUNDWATER-
RESIDENTIAL L-493.3.3.5 AREA 2: CNH OFF-PROPERTY GROUNDWATER -
INDOOR AIR L-503.3.3.6 AREA 2: CNH OFF-PROPERTY GROUNDWATER-
CHILD POOL L-513.3.3.7 AREA 3: FUTURE GROUNDWATER WELL L-52
4.0 TOXICITY ASSESSMENT L-534.1 NON-CARCINOGENIC HAZARDS L-544.2 CARCINOGENIC RISKS L-554.3 TOXICOLOGICAL SUMMARIES FOR THE COPCS L-56
018925(21) CONESTOGA-ROVERS & ASSOCIATES
TABLE OF CONTENTS
5.0 RISK CHARACTERIZATION L-575.1 HAZARD ESTIMATES L-575.2 CANCER RISK ESTIMATES L-585.3 RISK QUANTIFICATION SUMMARY L-595.3.1 AREA 1: CNH PROPERTY INDUSTRIAL WORKER L-595.3.2 AREA 1: CNH PROPERTY CONSTRUCTION WORKER L-605.3.3 AREA 2: CNH OFF-PROPERTY GROUNDWATER L-625.3.4 AREA 3: FUTURE GROUNDWATER WELL L-635.4 SUMMARY OF RESULTS L-655.5 RISK AND HAZARD COPC CONTRIBUTIONS L-665.6 UNCERTAINTY ANALYSIS L-675.6.1 SAMPLING PROCEDURES L-685.6.1.1 SOIL SAMPLING L-685.6.1.2 GROUNDWATER SAMPLING L-685.6.2 COPC SELECTION L-695.6.3 EXPOSURE POINT CONCENTRATION ESTIMATES L-695.6.4 EXPOSURE SCENARIO ASSUMPTIONS L-705.6.5 DOSE RESPONSE L-715.6.6 RISK ESTIMATES L-72
6.0 CONCLUSIONS L-74
7.0 REFERENCES L-75
0189?5(21) CONESTOGA-ROVERS & ASSOCIATES
LIST OF FIGURES(Following Text)
FIGURE 3.1 CONCEPTUAL SITE MODEL - AREA 1: CNH PROPERTY
FIGURE 3.2 CONCEPTUAL SITE MODEL - AREA 2: CNH OFF-PROPERTY
FIGURE 3.3 CONCEPTUAL SITE MODEL - AREA 3: FUTURE GROUNDWATER WELL
LIST OF TABLES(Within Text)
TABLE 2.1 SUMMARY OF SAMPLING RESULTS FOR CNH PROPERTY SOIL
TABLE 2.2 SUMMARY OF SAMPLING RESULTS FOR CNH PROPERTYGROUNDWATER
TABLE 2.3 SCREENING OF AMBIENT AIR CONCENTRATIONS
TABLE 2.4 SUMMARY OF OFF-PROPERTY GROUNDWATER SAMPLING RESULTS
TABLE 2.5 SUMMARY OF SURFACE WATER SAMPLING RESULTS
TABLE 2.6 SUMMARY OF DATA REPRESENTING THE FUTURE GROUNDWATERSCENARIO
TA BLE 3.1 EXPOSURE POINT CONCENTRATIONS FOR SOIL AREA 1 - CNHPROPERTY
TABLE 3.2 EXPOSURE POINT CONCENTRATIONS FOR GROUNDWATER AREA 1 -CNH PROPERTY
TABLE 3.3 AMBIENT AIR EXPOSURE POINT CONCENTRATION (EPC) FOR ACONSTRUCTION WORKER AREA 1 - CNH PROPERTY
TABLE 3.4 EXPOSURE POINT CONCENTRATIONS FOR OFF-PROPERTYGROUNDWATER AREA 2 - CNH OFF PROPERTY
TABLE 3.5 EXPOSURE POINT CONCENTRATIONS FOR GROUNDWATER/TAPWATER AREA 3 - FUTURE GROUNDWATER WELL STOLLEY PARK
018925(21) CONESTOGA-ROVERS & ASSOCIATES
LIST OF TABLES(Within Text)
TABLE 3.6 TABLE OF BODY WEIGHTS WITH AGE FOR THE CHILD SWIMMINGPOOL SCENARIO
TABLE 4.1 NON-CANCER TOXICITY DATA -- ORAL/DERMAL ROUTE OF EXPOSURE(Following Text)
TABLE 4.2 NON-CANCER TOXICITY DATA - INHALATION ROUTE OF EXPOSURE(Following Text)
TABLE 4.3 CANCER TOXICITY DATA -- ORAL/DERMAL ROUTE OF EXPOSURE(Following Text)
TABLE 4.4 CANCER TOXICITY DATA - INHALATION ROUTE OF EXPOSURE(Following Text)
TABLE 5.1 RISK ESTIMATE SUMMARY FOR CURRENT/FUTURE INDUSTRIAL/COMMERCIAL WORKER AREA 1 - CNH PROPERTY
TABLE 5.2 RISK ESTIMATE SUMMARY FOR FUTURE CONSTRUCTION WORKERUSING FORMER TCE TOXICITY DATA AREA 1 - CNH PROPERTY
TABLE 5.3 RISK ESTIMATE SUMMARY FOR FUTURE CONSTRUCTION WORKERUSING CURRENT TCE TOXICITY DATA AREA 1 - CNH PROPERTY
TABLE 5.4 RISK ESTIMATE SUMMARY FOR FUTURE RESIDENT USING FORMERTCE TOXICITY DATA AREA 2 - CNH OFF PROPERTY
TABLE 5.5 RISK ESTIMATE SUMMARY FOR FUTURE RESIDENT USING CURRENTTCE TOXICITY DATA AREA 2 - CNH OFF PROPERTY
TABLE 5.6 RISK ESTIMATE SUMMARY FOR FUTURE RESIDENT AREA 3 - FUTUREGROUNDWATER - STOLLEY PARK
TABLE 5.7 SUMMARY OF RISK ESTIMATES FOR THE NORTHERN STUDY AREA
018925(21) CONESTOGA-ROVERS & ASSOCIATES
LIST OF ATTACHMENTS
ATTACHMENT A RISK CALCULATIONS FOR AREA 1: CNH PROPERTY
ATTACHMENTS RISK CALCULATIONS FOR AREA 2: CNH OFF-PROPERTY
ATTACHMENT C RISK CALCULATIONS FOR AREA 3: FUTURE GROUNDWATERWELL
ATTACHMENT D HHRA FOR PARKVIEW/STOLLEY PARK RESIDENTIAL WELLS
ATTACHMENT E HHRA FOR PARKVIEW/STOLLEY PARK MUNICIPAL WELLS
ATTACHMENT F STATISTICAL METHODS
ATTACHMENT G JOHNSON-ETTINGER MODELING
ATTACHMENT H AMBIENT AIR STUDY AND MODELING
ATTACHMENT I TOXICOLOGICAL PROFILES
018925(21) CONESTOGA-ROVERS & ASSOCIATES
GLOSSARY OF TERMS
A,B,C
AMSL
AOCs
AT
ATC
atm
ATnc
bgs
BW
CAS
GDI
cm
cmVg
cm2
cm/sec
COPCs
CR
CRA
CSM
CSF
CT
DA
Di
Dw
DAF
ED
EF
U.S. EPA
EPC
foe
ftft /year
Constants Based on Air Dispersion Modeling for Specific Climate Zone
Above Mean Sea Level
Areas of Concern
Averaging Time
Averaging Time for Carcinogens
Atmospheres
Averaging Time for Non-carcinogens
Below Ground Surface
Body Weight
Chemical Abstract Service
Chronic Daily Intake
Centimeters
Cubic Centimeters per gram
Centimeters squared
Centimeters per Second
Chemicals of Potential Concern
Contact Rate
Conestoga-Rovers & Associates
Conceptual Site Model
Cancer Slope Factor
Central Tendency
Apparent Diffusivity
Diffusivity of Chemical x in air
Diffusivity of Chemical x in water
Dilution Attenuation Factor
Exposure Duration
Exposure Frequency
Environmental Protection Agency
Exposure Point Concentration
Organic Content of Soil
Feet
Feet per year
018925(21) CONESTOGA-ROVERS & ASSOCIATES
GLOSSARY OF TERMS
F(x)
gpm
GSDi,adult
HEAST
HHRA
HI
HLC
HQ
I
IRIS
IRs
IRw
L/m-1
Kd
Koc
LADD
LMS
LOAEL
MF
MCL
mg/kg
mg/cm2
mg/daymg/(kg-day)mVhr
m3/day
mol
MW
n
N
NC
NCEA
Function Dependent on Um /Ui
Gallons per minute
Geometric Standard Deviation
Health Effects Assessment Summary Table
Human Health Risk Assessment
Hazard Index
Henry's Law Constant
Hazard Quotient
Chemical Intake
Integrated Risk Information System
Ingestion Rate of soil
Ingestion Rate of water
Liters per Cubic meters
Soil-Water Partition Coefficient
Soil Organic Carbon-Water Partition Coefficient
Lifetime Average Daily Dose
linearized multistage
Lowest Observed Adverse Effect Level
Modifying Factor
Maximum Contaminant Level
Milligrams per Kilogram
Milligrams per Centimeters squared
Milligrams per day
Milligrams per kilograms per day
Cubic meters per hour
Cubic meters per day
Mole
Monitoring Well
Total Soil Porosity
Number of Chemicals
Not Calculated
Nation Center for Environmental Assessment
018925(21) CONESTOGA-ROVERS & ASSOCIATES
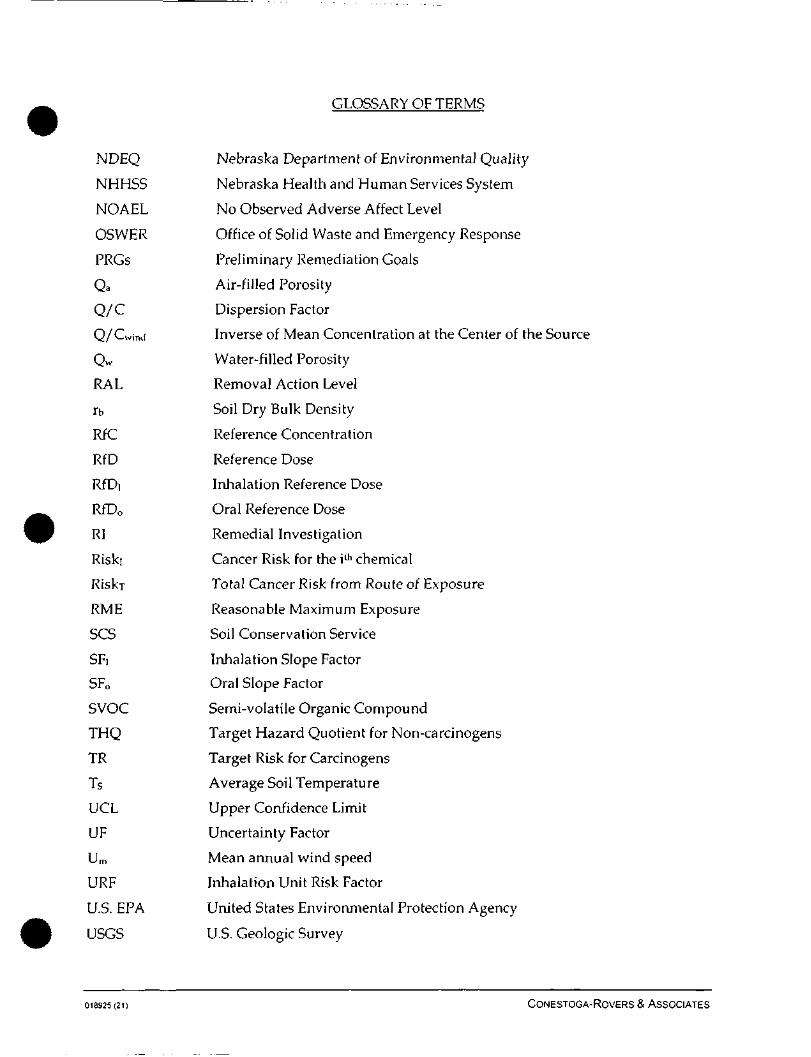
GLOSSARY OF TERMS
NDEQ
NHHSS
NOAEL
OSWER
PRGs
Qa
Q/C
Q/ Cwind
Qw
RAL
Tb
RfC
RfD
RfDi
RfDo
RI
Riski
RiskT
RME
SCS
SF,
SF0
SVOC
THQ
TR
Ts
UCL
UF
Um
URF
U.S. EPA
USGS
Nebraska Department of Environmental Quality
Nebraska Health and Human Services System
No Observed Adverse Affect Level
Office of Solid Waste and Emergency Response
Preliminary Remediation Goals
Air-filled Porosity
Dispersion Factor
Inverse of Mean Concentration at the Center of the Source
Water-filled Porosity
Removal Action Level
Soil Dry Bulk Density
Reference Concentration
Reference Dose
Inhalation Reference Dose
Oral Reference Dose
Remedial Investigation
Cancer Risk for the ith chemical
Total Cancer Risk from Route of Exposure
Reasonable Maximum Exposure
Soil Conservation Service
Inhalation Slope Factor
Oral Slope Factor
Semi-volatile Organic Compound
Target Hazard Quotient for Non-carcinogens
Target Risk for Carcinogens
Average Soil Temperature
Upper Confidence Limit
Uncertainty Factor
Mean annual wind speed
Inhalation Unit Risk Factor
United States Environmental Protection Agency
U.S. Geologic Survey
018925(21) CONESTOGA-ROVERS & ASSOCIATES

GLOSSARY OF TERMS
Ut Equivalent Threshold Value of Wind speed at 7m
UV Ultraviolet
V Fraction of Vegetative Cover
VF Volatilization Factors
VOC Volatile Organic Compound
pb Soil Dry Bulk Density
Gw Fraction of Water-filled Porosity in Soil
6a Faction of Air-filled Porosity in Soil
ug/kg Micrograms per Kilogram
ug/L Micrograms per Liter
ug/m3 Micrograms per Cubic Meter
ug/dL microgram per deciliter
018925(21) CONESTOGA-ROVERS & ASSOCIATES
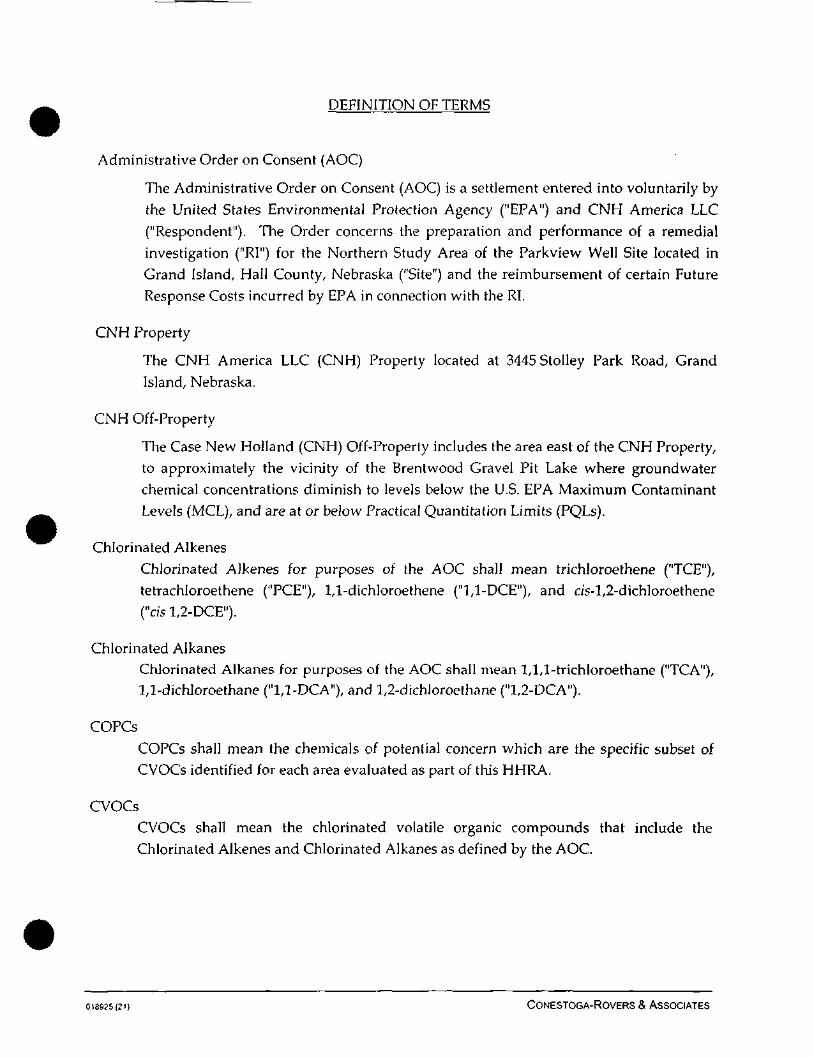
DEFINITION OF TERMS
Administrative Order on Consent (AOC)
The Administrative Order on Consent (AOC) is a settlement entered into voluntarily by
the United States Environmental Protection Agency ("EPA") and CNH America LLC
("Respondent"). The Order concerns the preparation and performance of a remedial
investigation ("Rl") for the Northern Study Area of the Parkview Well Site located in
Grand Island, Hall County, Nebraska ("Site") and the reimbursement of certain Future
Response Costs incurred by EPA in connection with the RI.
CNH Property
The CNH America LLC (CNH) Property located at 3445 Stolley Park Road, Grand
Island, Nebraska.
CNH Off-Property
The Case New Holland (CNH) Off-Property includes the area east of the CNH Property,
to approximately the vicinity of the Brentwood Gravel Pit Lake where groundwater
chemical concentrations diminish to levels below the U.S. EPA Maximum Contaminant
Levels (MCL), and are at or below Practical Quantitation Limits (PQLs).
Chlorinated Alkenes
Chlorinated Alkenes for purposes of the AOC shall mean trichloroethene ("TCE"),
tetrachloroethene ("PCE"), 1,1-dichloroethene ("1,1-DCE"), and ds-l,2-dichloroethene
("cis 1,2-DCE").
Chlorinated AlkanesChlorinated Alkanes for purposes of the AOC shall mean 1,1,1-trichloroethane ("TCA"),1,1-dichloroethane ("1,1-DCA"), and 1,2-dichloroethane ("1,2-DCA").
COPCs
COPCs shall mean the chemicals of potential concern which are the specific subset ofCVOCs identified for each area evaluated as part of this HHRA.
CVOCsCVOCs shall mean the chlorinated volatile organic compounds that include the
Chlorinated Alkenes and Chlorinated Alkanes as defined by the AOC.
018925(21) CONESTOGA-ROVERS & ASSOCIATES
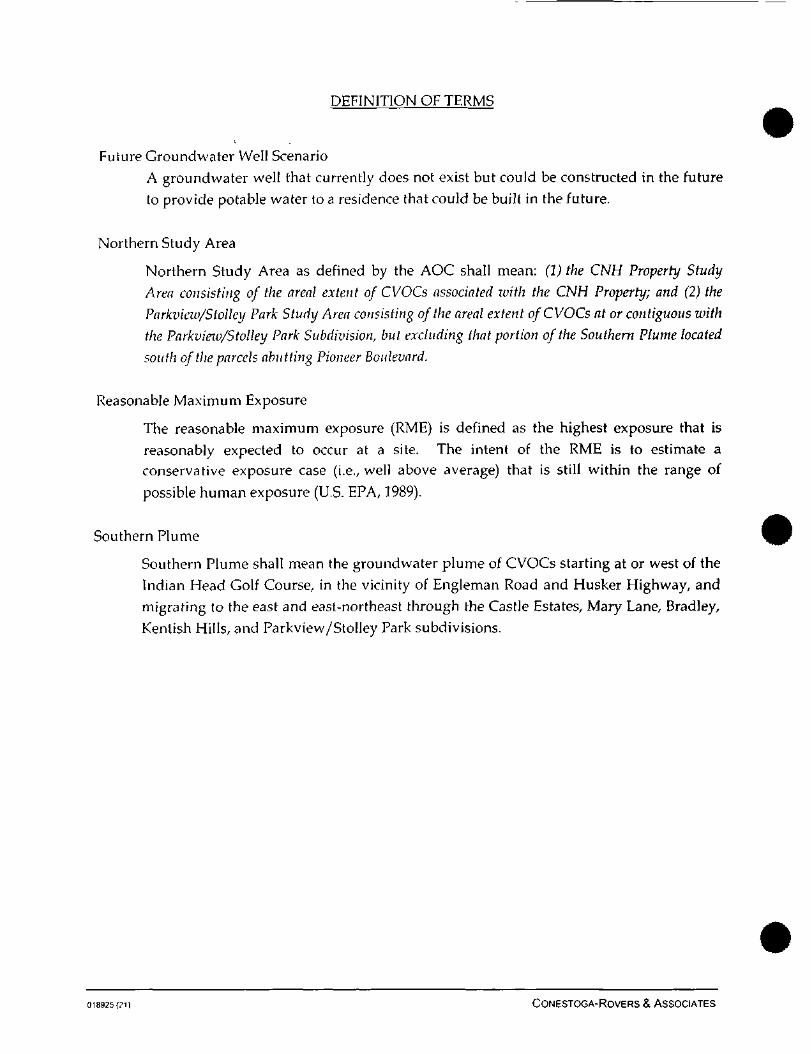
DEFINITION OF TERMS
Future Groundwater Well Scenario
A groundwater well that currently does not exist but could be constructed in the future
to provide potable water to a residence that could be built in the future.
Northern Study Area
Northern Study Area as defined by the AOC shall mean: (1) the CNH Property Study
Area consisting of the areal extent of CVOCs associated with the CNH Property; and (2) the
Parkview/Stolley Park Study Area consisting of the areal extent of CVOCs at or contiguous with
the Parkvieiv/Stolley Park Subdivision, but excluding that portion of the Southern Plume located
south of the parcels abutting Pioneer Boulevard.
Reasonable Maximum Exposure
The reasonable maximum exposure (RME) is defined as the highest exposure that is
reasonably expected to occur at a site. The intent of the RME is to estimate aconservative exposure case (i.e., well above average) that is still within the range of
possible human exposure (U.S. EPA, 1989).
Southern Plume
Southern Plume shall mean the groundwater plume of CVOCs starting at or west of the
Indian Head Golf Course, in the vicinity of Engleman Road and Husker Highway, andmigrating to the east and east-northeast through the Castle Estates, Mary Lane, Bradley,
Kentish Hills, and Parkview/Stolley Park subdivisions.
018925 (?i) CONESTOGA-ROVERS & ASSOCIATES

1.0 INTRODUCTION AND OVERVIEW OF THE NORTHERN STUDY AREA
1.1 OVERVIEW OF THE HHRA
Conestoga-Rovers & Associates (CRA) has prepared this Human Health Risk
Assessment (HHRA) for chemicals associated with the Northern Study Area, which
includes the CNH Property, and the eastern portion of chemicals in the groundwater
(plume) emanating from a second source, unrelated to CNH, located to the south and
west of the CNH Property, currently known as Southern Plume. For ease of evaluation,
the Northern Study Area has been sub-divided into three different areas; a brief
summary of each area follows. Risk estimates for three of these areas are contained in
the body of the report. The supporting calculations from the risk estimates for current
and future exposures are contained in Attachments A to C.
• Area 1, the CNH Property - includes the area encompassed by the CNH Property
boundary, which is bounded on the North by Stolley Park Road, on the east by a
portion of US Highway 281 and a property boundary fence, to the south and west by
a property boundary fence. Soils impacted above U.S. EPA Region IX PRGs, on the
property have been removed, and the HHRA will address residual chemicals in soil
and groundwater on the CNH Property.
• Area 2, CNH Off-Property groundwater impacted by the Burn and Burial Area-
includes the area east of the CNH Property, to approximately the vicinity east of the
Brentwood Gravel Pit Lake where groundwater chemical concentrations diminish to
levels below the U.S. EPA Maximum Contaminant Levels (MCLs), and are at or
below Practical Quantitation Limits (PQLs). In addition, the two surface water
bodies west of Stolley Park have been included in this area.
• Area 3, a future groundwater well scenario (as defined above) in the Southern Plumelocated in the Northern Study Area in the vicinity of Pioneer Blvd.
Risk estimates for past exposure to the Parkview and Residential Tap water wells and
Municipal Wells in the Parkview/Stolley Park Area were also calculated. These risks
will not be used to make remedial decisions but provide important information on
historical exposure and risk in the Northern Study Area. The results are provided in
Attachments D and E, respectively.
The RI Report provides an in-depth description of the Site area, including its physical,
chemical, and hydrogeological characteristics. From the RI it is evident that there are
two groundwater plumes in the area of Stolley Park, one is limited to the CNH Property
and immediate Off-Property, while the other, Southern Plume, originates in an area in
018925(21) L-1 CONESTOGA-ROVERS & ASSOCIATES

the vicinity of Engleman Road and Husker Highway west of the Mary Lane and KentishHills Estates and migrates into the Parkview/Stolley Park Area. These characteristicswere taken into consideration in the development of the HHRA.
1.2 HHRA AREAS AND ASSOCIATED DATA
A detailed description of the Northern Study Area is provided in the RI report. Knowncontamination in the Northern Study area consists of two distinct areas; soil andgroundwater chemicals related to the CNH Property, and the Southern Plume,unrelated to CNH, the origin of which is under investigation by U.S. EPA, but that isbelieved to have its source west of the Indian Head golf course in the vicinity of HuskerHighway and Engleman Road. This Southern Plume flows east, beneath houses in theMary Lane, Kentish Hills, Castle Estates and, consistent with regional groundwaterflow, migrates east northeast into the Stolley Park/Parkview neighborhoods from thesouth west. These areas, and the environmental data used in the HHRA for each areaare discussed in more detail in the following sections.
1.2.1 AREA 1: THE CNH PROPERTY
Three areas of interest were identified in previous investigations on the CNH Property.These areas are the Burial Area, the Burn Area, and the Duck Pond. The Burn Area islocated in the south-central portion of the CNH Property and the Duck Pond is locatedin the southeastern part of the CNH Property. The Burial Area is located at thesouthwestern corner of the CNH Property. Details regarding the Areas of Interest areprovided in the work plan for the Removal Action (CRA, August 2003). The media ofinterest on the property are summarized below.
1.2.1.1 AREA1: CNH PROPERTY SOIL
Burn Area - According to Property personnel, from June 1966 to 1975, some refuse, paintsludge, spent solvents and cutting oils were reportedly disposed within two pits to anapproximate depth of 10 feet below ground surface and burned. The Burn Area wasclosed in June 1975.
Burial Area - According to Property personnel, beginning in June 1975 and continuingthrough to November 1980, a number of drums were emptied into five subsurface pits atthe Burial Area. The approximate depth of the pit is reported to have been between
018925(21) L-2 CONESTOGA-ROVERS & ASSOCIATES
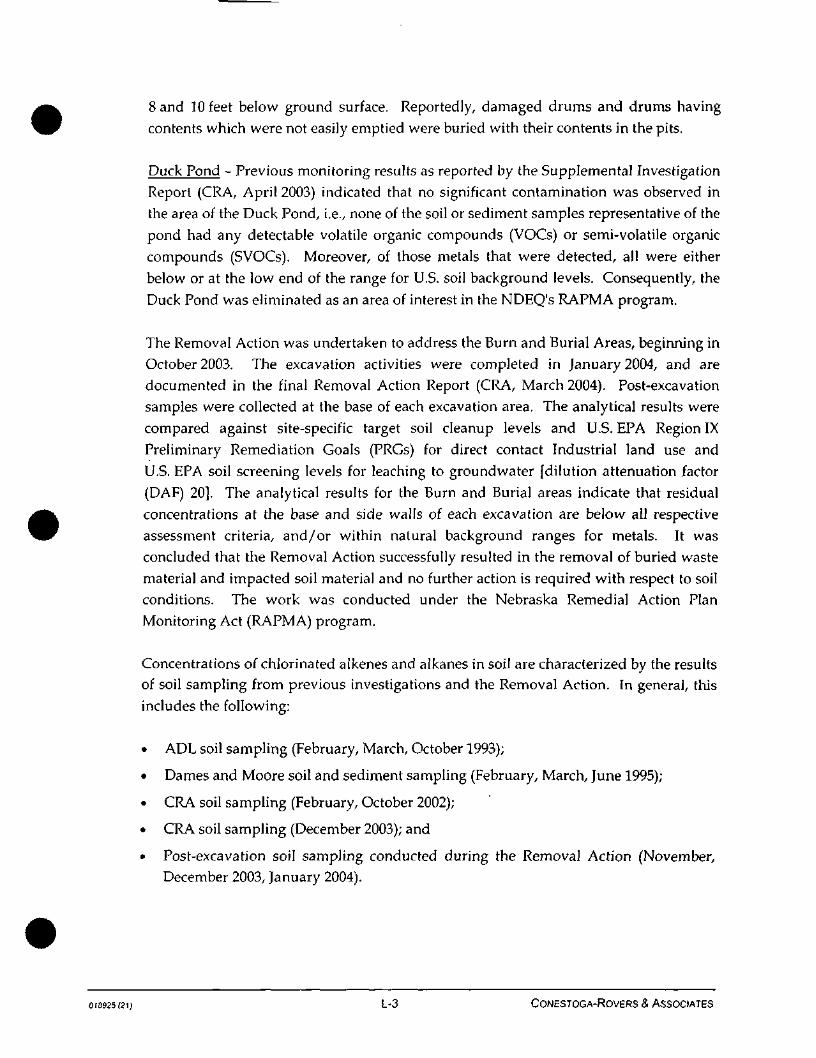
Sand 10 feet below ground surface. Reportedly, damaged drums and drums having
contents which were not easily emptied were buried with their contents in the pits.
Duck Pond - Previous monitoring results as reported by the Supplemental InvestigationReport (CRA, April 2003) indicated that no significant contamination was observed in
the area of the Duck Pond, i.e., none of the soil or sediment samples representative of thepond had any detectable volatile organic compounds (VOCs) or semi-volatile organic
compounds (SVOCs). Moreover, of those metals that were detected, all were either
below or at the low end of the range for U.S. soil background levels. Consequently, the
Duck Pond was eliminated as an area of interest in the NDEQ's RAPMA program.
The Removal Action was undertaken to address the Burn and Burial Areas, beginning in
October 2003. The excavation activities were completed in January 2004, and are
documented in the final Removal Action Report (CRA, March 2004). Post-excavationsamples were collected at the base of each excavation area. The analytical results were
compared against site-specific target soil cleanup levels and U.S. EPA Region IX
Preliminary Remediation Goals (PRGs) for direct contact Industrial land use and
U.S. EPA soil screening levels for leaching to groundwater [dilution attenuation factor
(DAF) 20]. The analytical results for the Burn and Burial areas indicate that residual
concentrations at the base and side walls of each excavation are below all respectiveassessment criteria, and/or within natural background ranges for metals. It was
concluded that the Removal Action successfully resulted in the removal of buried waste
material and impacted soil material and no further action is required with respect to soilconditions. The work was conducted under the Nebraska Remedial Action PlanMonitoring Act (RAPMA) program.
Concentrations of chlorinated alkenes and alkanes in soil are characterized by the resultsof soil sampling from previous investigations and the Removal Action. In general, this
includes the following:
• ADL soil sampling (February, March, October 1993);
• Dames and Moore soil and sediment sampling (February, March, June 1995);
• CRA soil sampling (February, October 2002);
• CRA soil sampling (December 2003); and
• Post-excavation soil sampling conducted during the Removal Action (November,December 2003, January 2004).
018925(21) L-3 CONESTOGA-ROVERS & ASSOCIATES

In total, approximately 300 soil samples were analyzed for VOCs, including chlorinated
alkenes and alkanes. The data used in the HHRA included the investigative soil and
sediment data that remain on the property after the excavation of the Burn and Burial
areas and post-excavation soil data. The data used included all available locations and
depths where soil remained. Samples that were removed by excavation were not used.
A list of soil sampling points is provided in Table A.2.1 of Attachment A. Details on the
specific locations of these sampling points are provided in the Remedial Action Report.
1.2.1.2 CNH PROPERTY GROUNDWATER
Groundwater sampling has been conducted at the CNH Property during various
investigations beginning in 1993, as discussed in the RI report. The data collected from
on-property groundwater sampling events in 1993,1995,1996, 2002, 2004, and 2005 were
used in the HHRA evaluation of the on-property groundwater. The groundwater wells
used are listed as follows:
• GM-l,GM-2, GM-3, GM-5;
• MW-01, MW-02, MW-03, MW-04, MW-05, MW-06, MW-07, MW-08, MW-09, MW-10,
MW-15, MW-16, MW-17; and
• P-01, P-02, P-03, P-04, P-05, P-06, P-07, P-08, P-09, P-10, P-ll, P-15, P-16, P-17, P-18,
P-19.
All groundwater depth intervals were used in the estimation of exposure point
concentrations. Summary statistics for all groundwater data is provided in Table A.2.2
of Attachment A.
1.2.2 AREA 2: CNH OFF-PROPERTY
There are two distinctly different media being considered in Area 2, the CNH
Off-Property groundwater, and the Gravel Pit Lakes, which are located east of the CNH
Property, at a location beyond where groundwater COPC concentrations are at or below
the PQLs.
018925(21) L-A CONESTOGA-ROVERS & ASSOCIATES
1.2.2.1 AREA 2: CNH OFF-PROPERTY GROUNDWATER
Area 2: CNH Off-Property groundwater encompasses the groundwater from the
southern portion of the CNH Property. The data collected from the Off-Property
groundwater wells were used in the HHRA. The following samples points were used:
• CRA-VP-305, CRA-VP-603;
• GGW-551, GGW-552, GGW-554, GGW-555, GGW-556;
• GP-05, GP-06, GP-09;
• MW-01-S, MW-01-I, MW-01-D, MW-02-S, MW-01-I, MW-01-D;
• P-12, P-13, P-14, P-20, and P-21.
A statistical summary of the groundwater data is provided in Table B.2.1 of
Attachment B. Data from all groundwater depth intervals were used to estimate the
exposure point concentration for the evaluation of future groundwater, because if a
future well were constructed it could draw water from all depths of groundwater. The
data were collected in 2002, 2003, and 2004, as described in the RI.
1.2.2.2 AREA 2: GRAVEL PIT LAKES
Included within Area 2 are two surface water bodies ponds known as the Brentwood
and Kenmare Gravel Pit Lakes located to the west of the Stolley Park/Parkview
neighborhoods. The following surface water data collected in 2005 was used in the risk
assessment process:
• SW-1, SW-2, SW-3, SW-4, SW-5, SW-6, SW-7, SW-8, SW-9.
Figures 2.1 and 2.2 show their locations as provided in the RI, Section 2.0. A statistical
summary of the surface water data is provided in Table B.2.2 of Attachment B.
1.2.3 AREA 3: FUTURE GRQUNDWATER WELL
The future groundwater well is defined in the Definition of Terms and represents a
groundwater well that could be constructed in the future to service a resident in the
Northern Study Area, where the Southern Plume impacts the Parkview/Stolley Park
Area. The location where this future well is assumed to be constructed is an area where
COPCs concentrations are higher than any other part of the Northern Study Area,
0189?5(21) L-5 CONESTOGA-ROVERS & ASSOCIATES
Southern Plume, and so exposure could be expected to be the highest in this part of theNorthern Study Area. Based on discussion with the U.S. EPA Remedial Project Managerand Region VIl's Risk Assessor, the data collected during March 2004 from the followingwells were used in the risk assessment:
• 2522 Pioneer Blvd., 2518 Pioneer Blvd., 2516 Pioneer Blvd., 2514 Pioneer Blvd.,2512 Pioneer Blvd., 2510 Pioneer Blvd., and 2508 Pioneer Blvd.
A statistical summary of the groundwater data is provided in Table C.2.1 ofAttachment C. Groundwater concentrations in the southern part of the Southern Plumenear Mary Lane Estates are higher than concentrations in the Northern Study Area, butare not the subject of this HHRA.
1.3 NATURE AND EXTENT OF CONTAMINATION
A description of the nature and extent of contamination is presented in Section 4.0 of theRI report. There are two distinct sources being considered in the risk assessment. Somekeys points concerning the nature and extent of COPCs in soil and groundwater at theCNH Property and Off-Property are summarized here. Information on the SouthernPlume groundwater source is provided in the RI.
1.4 OBJECTIVE OF THE HHRA
The purpose of the HHRA is to evaluate the potential human health risks posed by soil,surface water, air, and groundwater chemicals under current and future conditions,taking into account the existing conditions in each area. Current conditions on the CNHProperty take into account that remedial actions (soil removal) have been taken at theCNH Property. However, the HHRA assesses the baseline condition, that is, it assumesthat no institutional controls are in place in the Northern Study area.
Attachments D and E present a risk assessment for past conditions at theParkview/Stolley Park Residential and Municipal Wells, respectively, and take intoaccount that remedial action has been undertaken at residential and municipal locations.An alternative water supply has been provided to residents with tap waterconcentrations above RALs, and the Municipal Well known a Parkview #3 has beendecommissioned.
018925(21) L-6 CONESTOGA-ROVERS & ASSOCIATES
The specific goals of this HHRA are:
• identify and provide analysis of baseline risks (defined as risks that might exist if no
further remediation were conducted) and identify if further remedial action is
required;
• provide a basis for determining the level of chemicals that can remain on the
property and still not adversely impact public health and the environment; and
• provide a basis for comparing potential health and environmental impacts of various
remedial alternatives.
The HHRA was conducted in accordance with the following U.S. Environmental
Protection Agency (U.S. EPA) guidance as well as consultations with U.S. EPA RPM and
Risk Assessor:
• U.S. EPA Risk Assessment Guidance for Superfund (RAGS), Volume I, Human
Health Evaluation Manual (Part) A, EPA/540/1-89/002, December 1989;
• U.S. EPA RAGS Supplemental Guidance, Standard Default Exposure Factors,
Interim Final, OSWER Directive 9285.6-03, March 25,1991;
• U.S. EPA Exposure Factors Handbook, EPA/600/P-95/002Fa, August 1997;
• U.S. EPA RAGS Part D, Standardized Planning, Reporting, and Review of Superfund
Risk Assessments, Final, Publication 9285.7-O1D, December 2001;
• U.S. EPA, Child-Specific Exposure Factors Handbook, September 2002;
• U.S. EPA, Supplemental Guidance for Developing Soil Screening Levels for
Superfund Sites, December 2002;
• U.S. EPA RAGS Part E, Supplemental Guidance, Dermal Risk Assessment, Final,July 2004; and
• U.S. EPA, Draft Guidance for Evaluating the Vapor Intrusion to Indoor Air Pathway
from Groundwater and Soils (Subsurface Vapor Intrusion Guidance), EPA Report
No. EPA 530-F-02-052, Office of Solid Waste and Emergency Response,
November 2002.
1.5 ORGANIZATION OF HHRA
This HHRA is organized as follows:
018925(21) L-7 CONESTOGA-ROVERS & ASSOCIATES
Section 1.0:
Section 2.0:
Section 3.0:
Section 4.0:
Section 5.0:
• Section 6.0:
• Section 7.0:
Introduction and Overview of the Northern Study Area
Presents background information relevant to this HHRA, presents thepurpose of this HHRA, and outlines the organization of this HHRA.
Identification of Chemical of Potential Concern
Presents a brief summary of the Chemicals of Potential Concern(COPCs) selected for each area of the HHRA.
Exposure Assessment
Presents a summary of the exposure settings, identifies the potentialexposure pathways, and quantifies exposure based on the exposureassumptions.
Toxicity Assessment
Presents a summary of the toxicity data used to calculate thenon-carcinogenic hazards and carcinogenic risks.
Risk Characterization
Presents an assessment of the potential risks to human health posedby soil, groundwater, surface water and air impacts and includes theuncertainty analysis.
Conclusions
References
Presents a list of references cited in the HHRA.
This risk assessment also has a number of attachments. Attachments D and E containrisk assessments for exposure to residential groundwater and municipal groundwater,respectively. The attachments are as follows:
Attachment A:
Attachment B:
Attachment C:
Attachment D:
Attachment E:
Attachment F:
Attachment G:
Attachment H:
Attachment I:
Supporting calculations for Area 1;
Supporting calculations for Area 2;
Supporting calculations for Area 3;
HHRA for Parkview/Stolley Park residential water;
HHRA for Parkview/Stolley Park Municipal water;
Statistical Evaluation of Data;
Johnson-Ettinger modeling;
Ambient Air modeling; and
Toxicological Profiles.
018925(21) L-E CONESTOGA-ROVERS & ASSOCIATES
2.0 IDENTIFICATION OF CHEMICALS OF POTENTIAL CONCERN
This section of the HHRA presents the process for establishing the chemicals of potential
concern (COPCs) for each area in the HHRA. The AOC with CNH determined the
original list of chemicals for the Northern Study Area1. The list was developed with
U.S. EPA and provides a targeted set of chemicals that have been detected frequently
and that represent the highest potential threat to human health and the environment.
The chlorinated alkenes and alkanes on the CNH Property are similar to, but unrelated
to the chlorinated alkenes and alkanes in the Southern Plume for all the reasons
identified by Section 5.0 of the RI. These are the CVOCs for the Northern Study Area:
• 1,1,1-Trichloroethane (1,1,1-TCA);
• 1,1-DichIoroethane (1,1-DCA);
• 1,1-Dichloroethene (1,1-DCE);
• 1,2-Dichloroethane (1,2-DCA);
• ds-l,2-Dichloroethene (c/s-l,2-DCE);
• Tetrachloroethene (PCE); and
• Trichloroethene (TCE).
The Southern Plume appears to have its source west of the Indian Head Golf Course in
the vicinity of Husker Highway & Engleman Road.
Any COPC that was detected, even if the detection was qualified or estimated, was
quantified in the HHRA, unless screened against U.S. EPA Region IX Preliminary
Remediation Goals (PRGs), where appropriate and as discussed in the text. COPCs thatwere not detected in an area of interest were not carried through the risk assessmentprocess. The maximum detected concentration was compared to Region IX PRGs to
provide a general level of risk, or ranking of a COPC. Consistent with U.S. EPA 1989,
these ratios should not be considered further than this screening process. However, the
screening of data against the PRG was used to eliminate surface water and ambient air
from further consideration. Descriptions of the applicable screening criteria are
presented in the following paragraphs. In addition, the U.S. EPA Vapor Intrusion
Guidance (U.S. EPA, 2002a) was used to establish a distance for the elimination of
1 As agreed by U.S.EPA, vinyl chloride (VC) was not included in the AOC, because VC was detected veryinfrequently, had adequate detection limits and when detected, it was frequently below the PQL. Thelocations where VC was detected were not co-located, which indicates that a "plume" containing VC didnot exist.
018925(21) L-9 CONESTOGA-ROVERS & ASSOCIATES
buildings over groundwater, but not to screen out COPCs from consideration formigration to indoor air, where appropriate.
2.1 DATA COLLECTION
A summary of existing data and new data collected for the purposes of the RI issummarized in Section 2.0 of the RI.
2.2 DATA EVALUATION
A data evaluation of the existing and newly collected data is provided in Section 5.0 ofthe RI for the Northern and Southern Plumes. A discussion of the method detectionlimits for each area being evaluated in the HHRA is provided in the sections on theselection of COPCs.
2.3 SCREENING CRITERIA
U.S. EPA Region IX PRGs are risk-based concentrations for environmental media (soil,air, and water) that are considered to be protective of humans, including sensitivegroups, over a lifetime. The PRGs are chemical concentrations that correspond to fixedlevels of risk [i.e., either a one in one million (10-6) cancer risk or a non-carcinogenichazard quotient of 1]. According to the U.S. EPA, exceeding a PRG suggests that furtherevaluation of the potential risks that may be posed by the study area relatedcontaminants is appropriate; however, PRGs are not in and of themselves clean uplevels. For screening purposes, PRGs for all non-carcinogenic analytes were adjusted bya factor of 10, for a non-carcinogenic hazard quotient of 0.1.
The PRGs are based on exposure pathways for which generally accepted methods,models, and assumptions have been developed (i.e., ingestion, dermal contact, andinhalation) for specific land-use conditions (i.e., residential or industrial/commercial).
In the context of this HHRA, COPCs detected in an area were carried through theHHRA. However, PRGs were used to evaluate practical quantitarion limits relative toobserved concentrations to determine a ratio of the maximum concentration to the PRG,thus indicating, in a general way, which COPC will contribute most to the overall risk.
018925(21) L-10 CONESTOGA-ROVERS & ASSOCIATES
2.3.1 SOIL
For the industrial/commercial land use exposure scenarios appropriate for the CNH
Property, the soil data are compared to the Region IX industrial/commercial soil PRGs.
The industrial/commercial PRGs for soil are based on the following exposure pathways:
ingestion, inhalation of particulates, inhalation of volatiles, and dermal absorption. It
should be noted that the exposure pathways upon which the PRGs were developed are
generally more applicable to surface soils than for subsurface soils as the
industrial/commercial worker is not anticipated to be involved any subsurface
excavations. Nevertheless, the maximum soil concentration, whether in surface and
subsurface soil was compared to the industrial/commercial soil PRGs.
2.3.2 GROUNDWATER
In this HHRA, detected COPCs in groundwater in any area were quantified in the risk
assessment process. In addition, the COPCs maximum groundwater data were
compared to the Region IX tap water PRGs. U.S. EPA re-evaluated the potential toxicity
of 1,1-DCE in 2002. They determined that the toxicological database did not support the
previous determination that 1,1-DCE should be evaluated as a carcinogen, so they
revised their toxicological profile to provide an updated value for 1,1-DCE. The
up-dated toxicological information was used in this HHRA to develop groundwater risk
using methods consistent with the Region IX tap water PRGs, and current U.S. EPA
guidance. It is believed that the U.S. EPA utilized this updated toxicology information
to establish the 1,1-DCE RAL for this Site (U.S. EPA Fact Sheet, November 2004)
(U.S. EPA, 2004d).
2.3.3 SURFACE WATER
It was assumed that an individual may contact surface water, therefore U.S. EPA
Region IX tap water PRGs were used in the screening of surface water data for potential
human effects due to potential contact with the surface water. Therefore, it was
assumed that an individual would consume surface water at the same rate as tap water.
If a surface water chemical concentration was found to be lower than the screening level
it could be eliminated as a chemical of concern because individuals do not consume the
water, only bathe in it, which has a lower risk than consumption.
018925(21) L-11 CONESTOGA-ROVERS & ASSOCIATES
2.3.4 AMBIENT AIR
Outdoor air concentrations were modeled and compared to U.S. EPA Region IX ambient
air PRGs with the goal of screening air. COPCs are volatile and will dilute in ambient
air by mixing. As discussed below, it was found that ambient air concentrations were
low relative to the ambient air PRGs and therefore, the ratio of ambient air
concentrations to PRGs was very small (less than 0.001).
2.4 COPC SELECTION BY AREA
A COPC was selected for inclusion into the HHRA if it was detected in a medium, in the
area for which risks were being evaluated, even if the concentration was estimated
below the PQLs. This approach is consistent with U.S. EPA 1989 that allows for the use
of estimated or "}" coded data in the risk assessment process. Chemicals that were not
detected were not carried through the HHRA process.
The analytical results for samples of soil, groundwater, surface water, and sediment are
presented in Section 4.0 of the RI report. Each area of interest is discussed below.
2.4.1 AREA1: CNH PROPERTY SOIL
The COPCs detected in soil on the CNH Property were selected for evaluation, as
summarized in Table 2.1 (below), and presented in detail in Table A.2.1 of
Attachment A. Of the seven COPCs, 1,1-DCE, 1,2-DCA, ds-l,2-DCE, and TCE were not
detected in soil and so were not carried through the HHRA. The maximum
concentration of the three remaining COPCs in soil, 1,1,1-TCA, 1,1-DCA, and PCE are
above the applicable screening criteria. The maximum concentrations in soil were
compared to the Region IX PRGs and the resulting ratio is presented in Table 2.1 (below)
and in Table A.2.1 of Attachment A. It can be seen that for the COPCs detected in soil;
the ratio of the maximum detected concentration to the PRG is well below one in each
case.
An evaluation of the COPC analytical detection limits for soil is also shown in
Table A.2.1 of Attachment A. The analyte detection limits were compared to the
U.S. EPA Region IX PRGs. Only 10 of 1,195 analyses showed detection limits greater
than one times the PRG, but less than ten times the PRG. Seven of these were for TCE,
which has a low PRG due to the 2001 Cancer Slope Factor, which is discussed in more
018925(21) L-12 CONESTOGA-ROVERS & ASSOCIATES
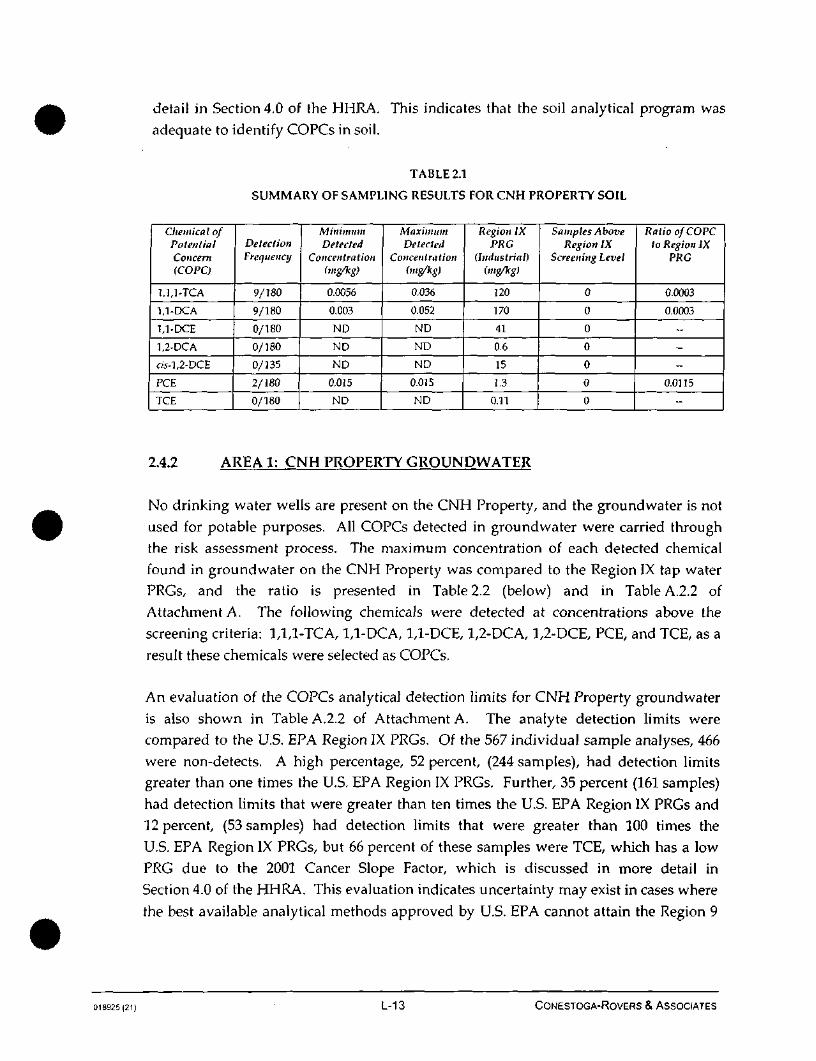
detail in Section 4.0 of the HHRA. This indicates that the soil analytical program was
adequate to identify COPCs in soil.
TABLE 2.1
SUMMARY OF SAMPLING RESULTS FOR CNH PROPERTY SOIL
Chemical ofPotentialConcern(COPC)
1,1,1-TCA
1,1-DCA
U-DCE
1,2-DCA
05-1,2-DCE
PCE
TCE
DetectionFrequency
9/1809/1800/1800/1800/135
2/1800/180
MinimumDetected
Concentration(mg/kg)
0.0056
0.003
ND
ND
ND
0.015
ND
MaximumDetected
Concentration(mg/kg)
0.036
0.052
ND
ND
ND
0.015
ND
Region IXPRG
(Industrial)(ing/kg)
120
170
41
0.6
15
1.3
0.11
Samples AboveRegion IX
Screening Level
0
0
0
0
0
0
0
Ratio of COPCto Region IX
PRG
0.0003
0.0003
--
-
-
0.0115
-
2.4.2 AREA 1: CNH PROPERTY GROUNDWATER
No drinking water wells are present on the CNH Property, and the groundwater is not
used for potable purposes. All COPCs detected in groundwater were carried throughthe risk assessment process. The maximum concentration of each detected chemical
found in groundwater on the CNH Property was compared to the Region IX tap water
PRGs, and the ratio is presented in Table 2.2 (below) and in Table A.2.2 of
Attachment A. The following chemicals were detected at concentrations above the
screening criteria: 1,1,1-TCA, 1,1-DCA, 1,1-DCE, 1,2-DCA, 1,2-DCE, PCE, and TCE, as a
result these chemicals were selected as COPCs.
An evaluation of the COPCs analytical detection limits for CNH Property groundwater
is also shown in Table A.2.2 of Attachment A. The analyte detection limits were
compared to the U.S. EPA Region IX PRGs. Of the 567 individual sample analyses, 466
were non-detects. A high percentage, 52 percent, (244 samples), had detection limitsgreater than one times the U.S. EPA Region IX PRGs. Further, 35 percent (161 samples)
had detection limits that were greater than ten times the U.S. EPA Region IX PRGs and12 percent, (53 samples) had detection limits that were greater than 100 times the
U.S. EPA Region IX PRGs, but 66 percent of these samples were TCE, which has a low
PRG due to the 2001 Cancer Slope Factor, which is discussed in more detail inSection 4.0 of the HHRA. This evaluation indicates uncertainty may exist in cases where
the best available analytical methods approved by U.S. EPA cannot attain the Region 9
018925(21) L-13 CONESTOGA-ROVERS & ASSOCIATES
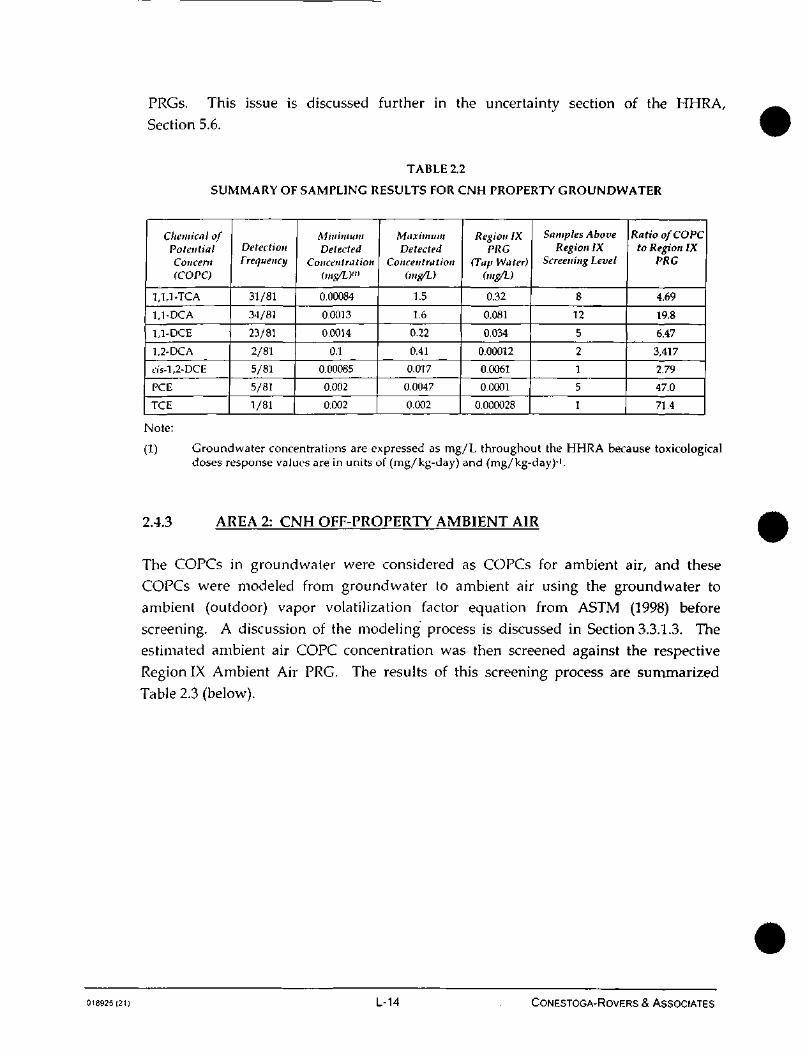
PRGs. This issue is discussed further in the uncertainty section of the HHRA,Section 5.6.
TABLE 2.2
SUMMARY OF SAMPLING RESULTS FOR CNH PROPERTY GROUNDWATER
Chemical ofPotentialConcern(COPC)
1,1,1-TCA
1,1 -DCA
U-DCE
1,2- DCA
ds-l,2-DCE
PCE
TCE
DetectionFrequency
31/8134/8123/812/815/815/811/81
MinimumDetected
Concentration<ms/L)<"
0.00084
0.0013
0.0014
0.1
0.00085
0.002
0.002
MaximumDetected
Concentration(mg/L)
1.5
1.6
0.22
0.41
0.017
0.0047
0.002
Region IXPRC
(Tap Water)(mg/L)
0.32
0.081
0.034
0.00012
0.0061
0.0001
0.000028
Samples AboveRegion IX
Screening Level
8
12
5
2
1
5
1
Ratio ofCOPCto Region IX
PRG
4.69
19.8
6.47
3,417
2.79
47.0
71.4
Note:
(1) Groundwater concentrations are expressed as mg/L throughout the HHRA because toxicologicaldoses response values are in units of (mg/kg-day) and (mg/kg-day)-'.
2.4.3 AREA 2: CNH OFF-PROPERTY AMBIENT AIR
The COPCs in groundwater were considered as COPCs for ambient air, and these
COPCs were modeled from groundwater to ambient air using the groundwater toambient (outdoor) vapor volatilization factor equation from ASTM (1998) before
screening. A discussion of the modeling process is discussed in Section 3.3.1.3. The
estimated ambient air COPC concentration was then screened against the respective
Region IX Ambient Air PRG. The results of this screening process are summarized
Table 2.3 (below).
018925(21) L-14 CONESTOGA-ROVERS & ASSOCIATES
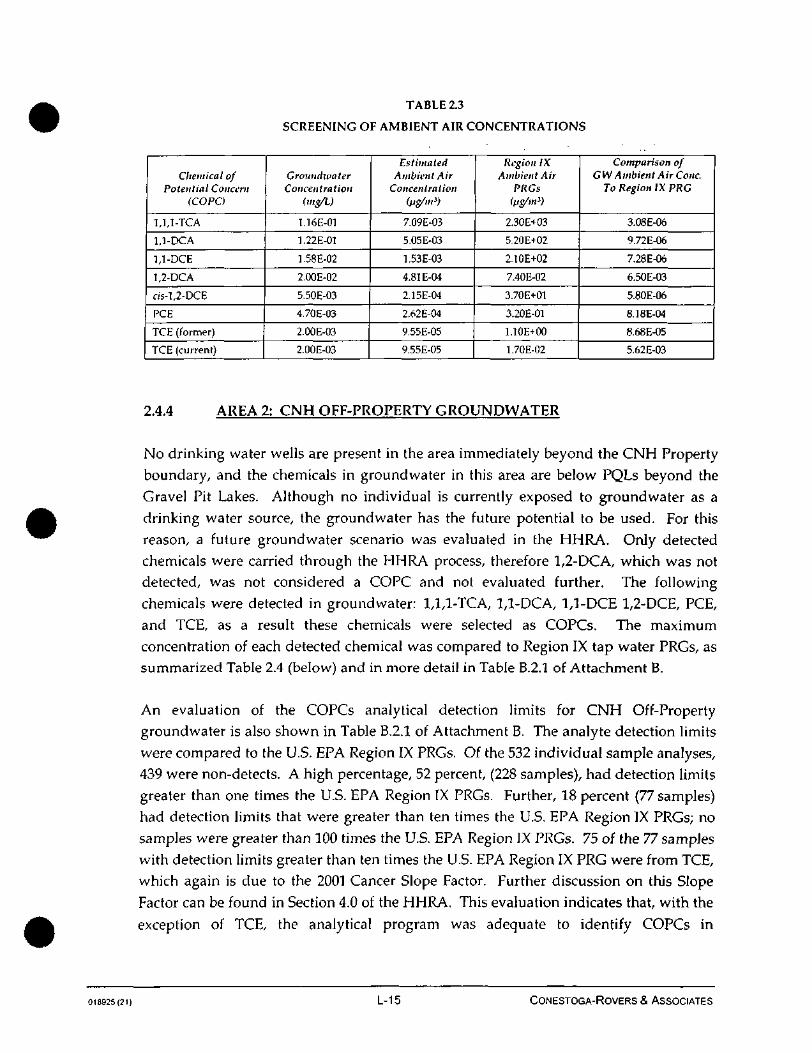
TABLE 2.3
SCREENING OF AMBIENT AIR CONCENTRATIONS
Chemical ofPotential Concern
(COPC)
1,1,1-TCA
1,1-DCA
1,1-DCE
1,2-DCA
ns-l,2-DCE
PCE
TCE (former)
TCE (current)
GroundwaterConcentration
(ing/l)
1.16E-01
1.22E-01
1.58E-02
2.00E-02
5.50E-03
4.70E-03
2.00E-03
2.00E-03
EstimatedAmbient Air
Concentration(ijg/m3)
7.09E-03
5.05E-03
1.53E-03
4.81 E-04
2.15E-04
2.62E-04
9.55E-05
9.55E-05
Region IXAmbient Air
PRGs(/jg/m3)
2.30E+03
5.20E+02
2.10E+02
7.40E-02
3.70E+01
3.20E-01
1.10E+00
1.70E-02
Comparison ofCW Ambient Air Cone.
To Region IX PRG
3.08E-06
9.72E-06
7.28E-06
6.50E-03
5.80E-06
8.18E-04
8.68E-05
5.62E-03
2.4.4 AREA 2: CNH OFF-PROPERTY GROUNDWATER
No drinking water wells are present in the area immediately beyond the CNH Property
boundary, and the chemicals in groundwater in this area are below PQLs beyond the
Gravel Pit Lakes. Although no individual is currently exposed to groundwater as a
drinking water source, the groundwater has the future potential to be used. For this
reason, a future groundwater scenario was evaluated in the HHRA. Only detected
chemicals were carried through the HHRA process, therefore 1,2-DCA, which was not
detected, was not considered a COPC and not evaluated further. The following
chemicals were detected in groundwater: 1,1,1-TCA, 1,1-DCA, 1,1-DCE 1,2-DCE, PCE,
and TCE, as a result these chemicals were selected as COPCs. The maximum
concentration of each detected chemical was compared to Region IX tap water PRGs, assummarized Table 2.4 (below) and in more detail in Table B.2.1 of Attachment B.
An evaluation of the COPCs analytical detection limits for CNH Off-Property
groundwater is also shown in Table B.2.1 of Attachment B. The analyte detection limits
were compared to the U.S. EPA Region IX PRGs. Of the 532 individual sample analyses,
439 were non-detects. A high percentage, 52 percent, (228 samples), had detection limits
greater than one times the U.S. EPA Region IX PRGs. Further, 18 percent (77 samples)
had detection limits that were greater than ten times the U.S. EPA Region IX PRGs; no
samples were greater than 100 times the U.S. EPA Region IX PRGs. 75 of the 77 samples
with detection limits greater than ten times the U.S. EPA Region IX PRG were from TCE,
which again is due to the 2001 Cancer Slope Factor. Further discussion on this Slope
Factor can be found in Section 4.0 of the HHRA. This evaluation indicates that, with the
exception of TCE, the analytical program was adequate to identify COPCs in
018925(21) L-15 CONESTOGA-ROVERS & ASSOCIATES
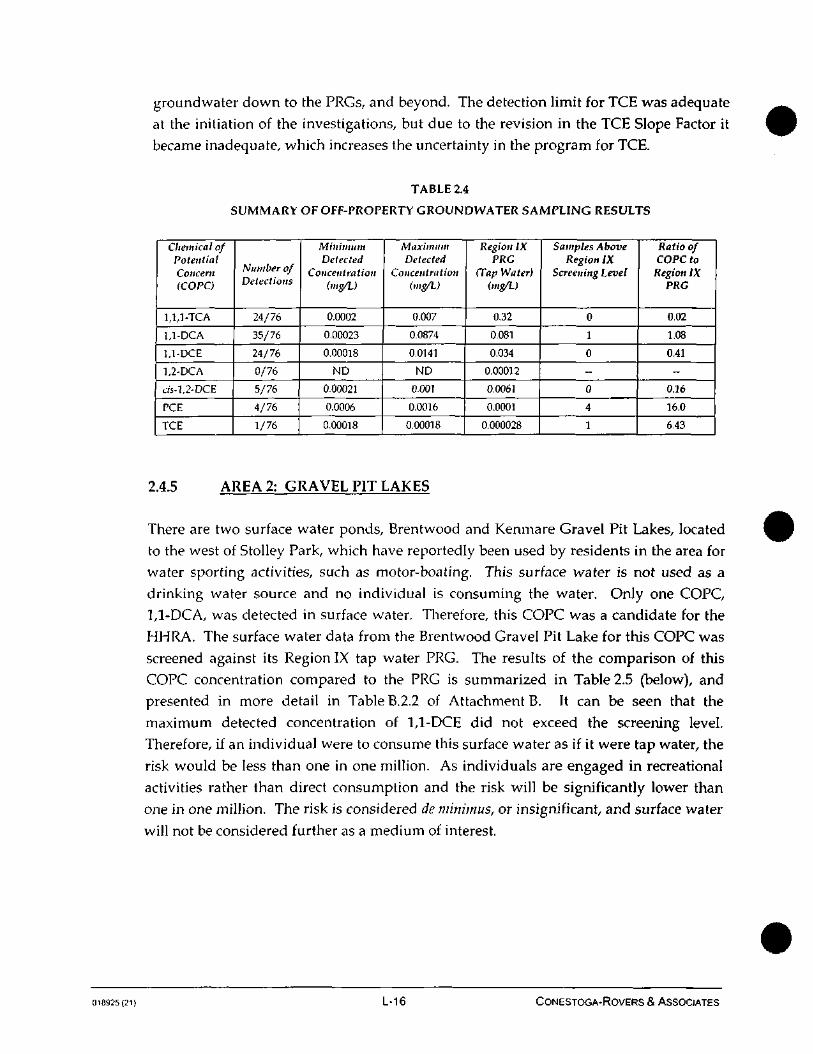
groundwater down to the PRGs, and beyond. The detection limit for TCE was adequateat the initiation of the investigations, but due to the revision in the TCE Slope Factor itbecame inadequate, which increases the uncertainty in the program for TCE.
TABLE 2.4
SUMMARY OF OFF-PROPERTY GROUNDWATER SAMPLING RESULTS
Clieinical ofPotentialConcern(CO PC)
1,1,1-TCA
1,1-DCA
1,1-DCE
1,2-DCA
ds-U-DCE
PCE
TCE
Number ofDetections
24/76
35/76
24/76
0/76
5/764/76
1/76
MinimumDetected
Concentration(m$/L)
0.0002
0.00023
0.00018
ND
0.00021
0.0006
0.00018
MaximumDetected
Concentration(mg/L)
0.007
0.0874
0.0141
ND
0.001
0.0016
0.00018
Region IXPRG
(Tap Water)(mg/L)
0.32
0.081
0.034
0.00012
0.0061
0.0001
0.000028
Samples AboveRegion IX
Screening Level
0
1
0
-
0
4
1
Ratio ofCOPC to
Region IXPRG
0.02
1.08
0.41
-0.16
16.0
6.43
2.4.5 AREA 2: GRAVEL PIT LAKES
There are two surface water ponds, Brentwood and Kenmare Gravel Pit Lakes, locatedto the west of Stolley Park, which have reportedly been used by residents in the area forwater sporting activities, such as motor-boating. This surface water is not used as adrinking water source and no individual is consuming the water. Only one COPC,1,1-DCA, was detected in surface water. Therefore, this COPC was a candidate for theHHRA. The surface water data from the Brentwood Gravel Pit Lake for this COPC wasscreened against its Region IX tap water PRG. The results of the comparison of thisCOPC concentration compared to the PRG is summarized in Table 2.5 (below), andpresented in more detail in Table B.2.2 of Attachment B. It can be seen that themaximum detected concentration of 1,1-DCE did not exceed the screening level.Therefore, if an individual were to consume this surface water as if it were tap water, therisk would be less than one in one million. As individuals are engaged in recreationalactivities rather than direct consumption and the risk will be significantly lower thanone in one million. The risk is considered de minimus, or insignificant, and surface waterwill not be considered further as a medium of interest.
018925(21) L-16 CONESTOGA-ROVERS & ASSOCIATES
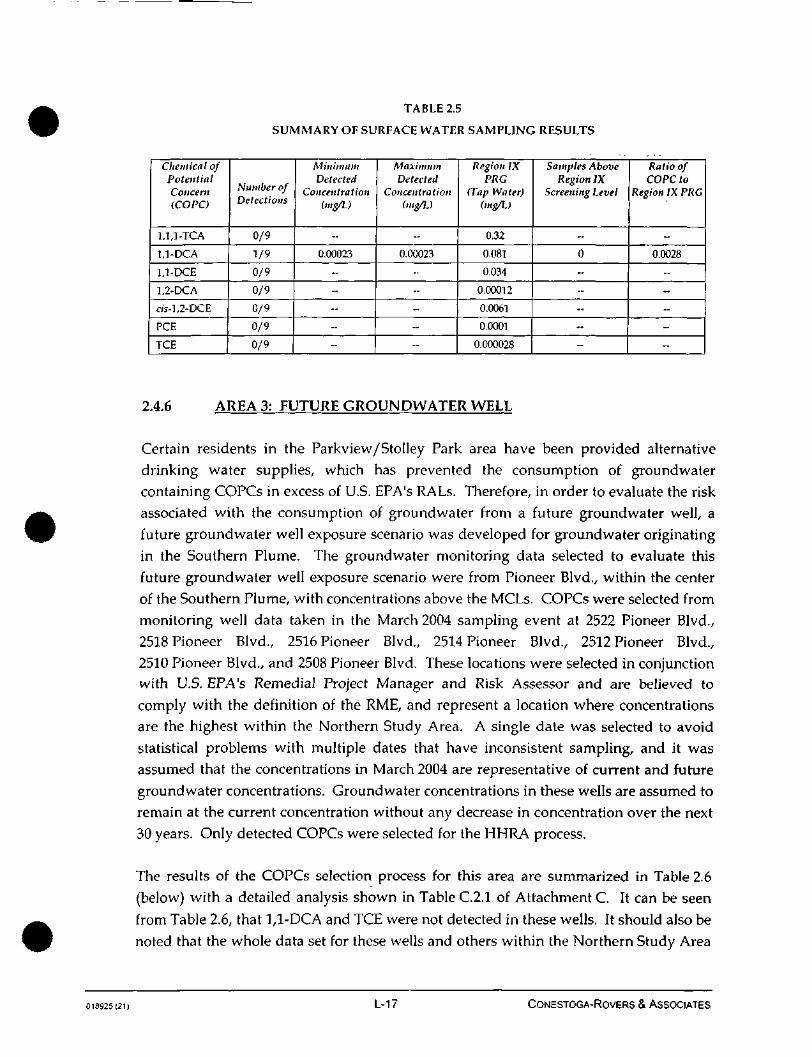
TABLE 2.5
SUMMARY OF SURFACE WATER SAMPLING RESULTS
Chemical ofPotentialConcern(COPC)
1,1,1-TCA
1,1 -DCA
U-DCE
1,2-DCA
c/s-l,2-DCE
PCE
TCE
Number ofDetections
0/9
1/9
0/9
0/9
0/9
0/9
0/9
MinimumDetected
Concentrationdns/L)
-
0.00023
--
-
--
-
--
MaximumDetected
Concentration(mg/L)
-
0.00023
--
--
--
--
--
Region IXPRG
(Tap Water)(mg/L)
0.32
0.081
0.034
0.00012
0.0061
0.0001
0.000028
Samples AboveRegion IX
Screening Level
-
0
-
-
--
--
-
Ratio ofCOPC to
Region IX PRG
-
0.0028
--
-
-
-
--
2.4.6 AREA 3: FUTURE GROUNDWATER WELL
Certain residents in the Parkview/Stolley Park area have been provided alternativedrinking water supplies, which has prevented the consumption of groundwater
containing COPCs in excess of U.S. EPA's RALs. Therefore, in order to evaluate the risk
associated with the consumption of groundwater from a future groundwater well, a
future groundwater well exposure scenario was developed for groundwater originating
in the Southern Plume. The groundwater monitoring data selected to evaluate this
future groundwater well exposure scenario were from Pioneer Blvd., within the center
of the Southern Plume, with concentrations above the MCLs. COPCs were selected from
monitoring well data taken in the March 2004 sampling event at 2522 Pioneer Blvd.,
2518 Pioneer Blvd., 2516 Pioneer Blvd., 2514 Pioneer Blvd., 2512 Pioneer Blvd.,
2510 Pioneer Blvd., and 2508 Pioneer Blvd. These locations were selected in conjunctionwith U.S. EPA's Remedial Project Manager and Risk Assessor and are believed to
comply with the definition of the RM.E, and represent a location where concentrationsare the highest within the Northern Study Area. A single date was selected to avoid
statistical problems with multiple dates that have inconsistent sampling, and it was
assumed that the concentrations in March 2004 are representative of current and future
groundwater concentrations. Groundwater concentrations in these wells are assumed to
remain at the current concentration without any decrease in concentration over the next
30 years. Only detected COPCs were selected for the HHRA process.
The results of the COPCs selection process for this area are summarized in Table 2.6
(below) with a detailed analysis shown in Table C.2.1 of Attachment C. It can be seen
from Table 2.6, that 1,1-DCA and TCE were not detected in these wells. It should also be
noted that the whole data set for these wells and others within the Northern Study Area
018925(21) L-17 CONESTOGA-ROVERS & ASSOCIATES
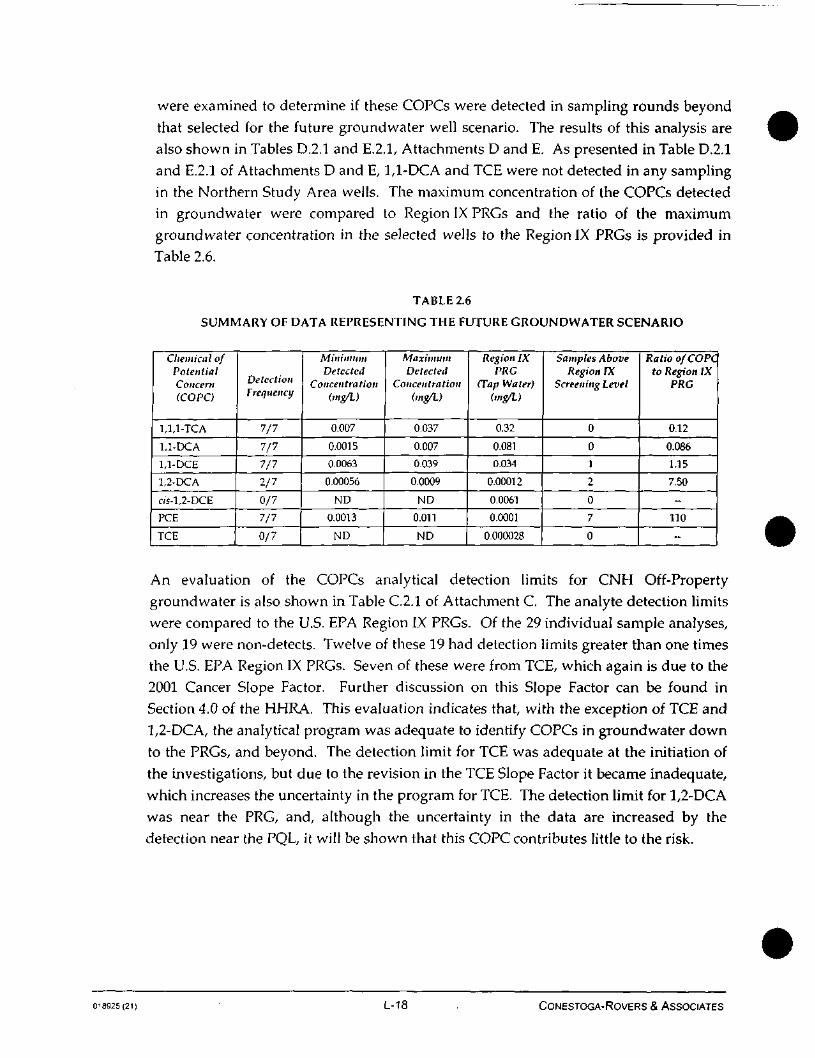
were examined to determine if these COPCs were detected in sampling rounds beyond
that selected for the future groundwater well scenario. The results of this analysis are
also shown in Tables D.2.1 and E.2.1, Attachments D and E. As presented in Table D.2.1
and E.2.1 of Attachments D and E, ],1-DCA and TCE were not detected in any sampling
in the Northern Study Area wells. The maximum concentration of the COPCs detectedin groundwater were compared to Region IX PRGs and the ratio of the maximum
groundwater concentration in the selected wells to the Region IX PRGs is provided in
Table 2.6.
TABLE 2.6
SUMMARY OF DATA REPRESENTING THE FUTURE GROUNDWATER SCENARIO
Chemical ofPotentialConcern(COPC)
1,1,1-TCA
1,1-DCA
1,1-DCE
1,2-DCA
ris-1.2-DCE
PCE
TCE
DetectionFrequency
7/7
7/7
7/7
2/7
0/7
7/7
0/7
MinimumDetected
Concentration(mg/L)
0.007
0.0015
0.0063
0.00056
ND0.0013
ND
MaximumDetected
Concentration(mg/L)
0.037
0.007
0.039
0.0009
ND
o.onND
Region IXPRO
(Tap Water)(mg/L)
0.32
0.081
0.034
0.00012
0.0061
0.0001
0.000028
Samples AboveRegion IX
Screening Level
0
0
1
2
0
7
0
Ratio of COPCto Region IX
PRG
0.12
0.086
1.15
7.50
-110
-
An evaluation of the COPCs analytical detection limits for CNH Off-Property
groundwater is also shown in Table C.2.1 of Attachment C. The analyte detection limits
were compared to the U.S. EPA Region IX PRGs. Of the 29 individual sample analyses,
only 19 were non-detects. Twelve of these 19 had detection limits greater than one timesthe U.S. EPA Region IX PRGs. Seven of these were from TCE, which again is due to the
2001 Cancer Slope Factor. Further discussion on this Slope Factor can be found in
Section 4.0 of the HHRA. This evaluation indicates that, with the exception of TCE and
1,2-DCA, the analytical program was adequate to identify COPCs in groundwater down
to the PRGs, and beyond. The detection limit for TCE was adequate at the initiation of
the investigations, but due to the revision in the TCE Slope Factor it became inadequate,
which increases the uncertainty in the program for TCE. The detection limit for 1,2-DCA
was near the PRG, and, although the uncertainty in the data are increased by the
detection near the PQL, it will be shown that this COPC contributes little to the risk.
018925(21) L-18 CONESTOGA-ROVERS & ASSOCIATES
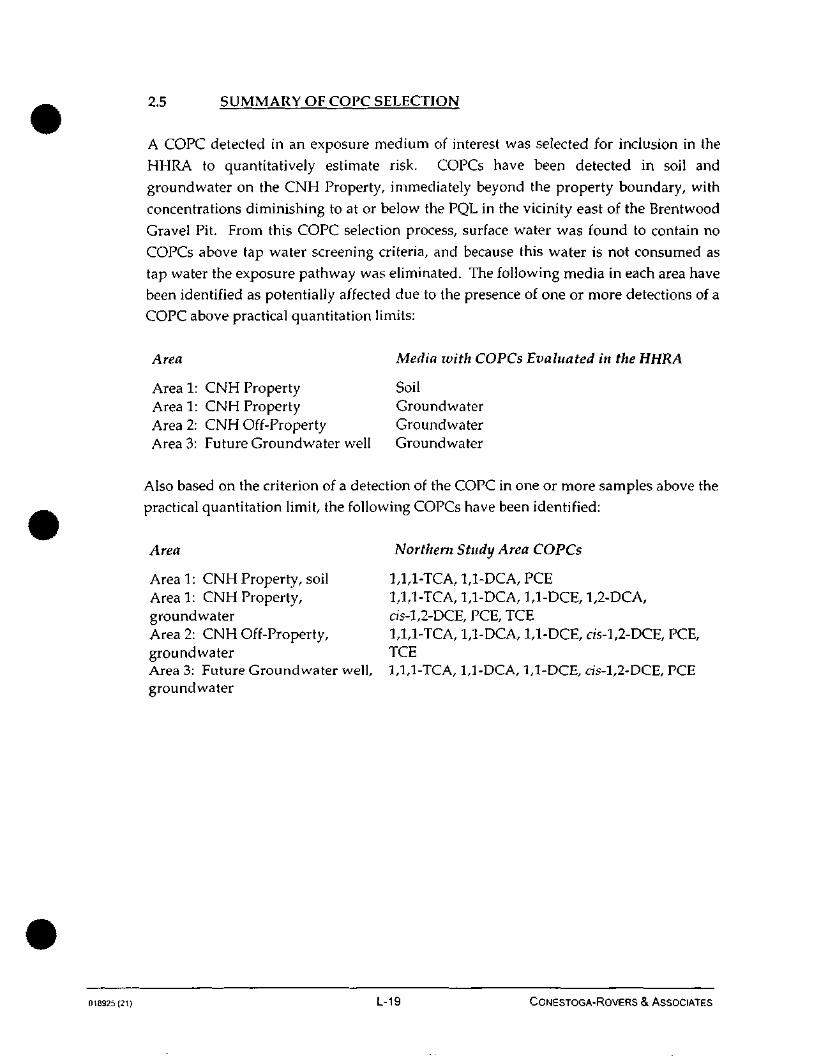
2.5 SUMMARY OF COPC SELECTION
A COPC detected in an exposure medium of interest was selected for inclusion in theHHRA to quantitatively estimate risk. COPCs have been detected in soil andgroundwater on the CNH Property, immediately beyond the property boundary, withconcentrations diminishing to at or below the PQL in the vicinity east of the BrentwoodGravel Pit. From this COPC selection process, surface water was found to contain noCOPCs above tap water screening criteria, and because this water is not consumed astap water the exposure pathway was eliminated. The following media in each area havebeen identified as potentially affected due to the presence of one or more detections of aCOPC above practical quantitation limits:
Area Media with COPCs Evaluated in the HHRA
Area 1: CNH Property SoilAreal: CNH Property GroundwaterArea 2: CNH Off-Property GroundwaterArea 3: Future Groundwater well Groundwater
Also based on the criterion of a detection of the COPC in one or more samples above thepractical quantitation limit, the following COPCs have been identified:
Area Northern Study Area COPCs
Areal: CNH Property, soil 1,1,1-TCA, 1,1-DCA, PCEArea 1: CNH Property, 1,1,1-TCA, 1,1-DCA, 1,1-DCE, 1,2-DCA,groundwater c;'s-l,2-DCE, PCE, TCEArea 2: CNH Off-Property, 1,1,1-TCA, 1,1-DCA, 1,1-DCE, c/s-l,2-DCE, PCE,groundwater TCEArea 3: Future Groundwater well, 1,1,1-TCA, 1,1-DCA, 1,1-DCE, ds-l,2-DCE, PCEgroundwater
018925(21) L-19 CONESTOGA-ROVERS & ASSOCIATES
3.0 EXPOSURE ASSESSMENT
Exposure is defined as the contact of a receptor with a chemical or physical agent. Theexposure assessment is the estimation of the magnitude, frequency, duration, and routesof potential exposure. An exposure assessment provides a systematic analysis of thepotential exposure mechanism by which a receptor may be exposed to chemical orphysical agents at or originating from a study area. The objectives of an exposureassessment are as follows:
• Characterization of exposure setting;
• Identification of potential exposure pathways; and
• Quantification of potential exposure.
3.1 CHARACTERIZATION OF EXPOSURE SETTING
The HHRA is part of the RI report for the CNH Property and the characterization of theSouthern Plume as it impacts the Northern Study Area. As part of the HHRA process,potential exposure pathways are determined through an evaluation of the physicalsetting and the potentially exposed populations. A brief description of the physicalsetting of the area is presented in Section 1.0, with a more detailed description presentedin the Rl report. The consideration of site-specific factors related to land usage isimportant in the development of realistic exposure scenarios and quantification ofpotential risks and hazards. The current and future potential land uses that arereasonably expected for the area determine what populations may potentially be or havebeen exposed. Land uses are discussed in the following subsections.
3.1.1 AREA 1: CNH PROPERTY CURRENT AND FUTURE LAND USE
The CNH Property is currently an active industrial/commercial facility thatmanufactures farm machinery. Historically, the property was used for manufacturingcombine harvesters. The current Area 1 land use is expected to remainindustrial/commercial into the future, as the owners have no plans to change thecurrent use or sell the property in the fu ture .
The HHRA assumes that the property will remain in its current use. There are tworeceptors of interest on the CNH Property; the industrial commercial worker and theconstruction worker.
018925(21) L-20 CONESTOGA-ROVERS & ASSOCIATES
3.1.2 AREA 2: CNH OFF-PROPERTYCURRENT AND FUTURE LAND USE
The current Area 2 land use is agricultural, commercial and residential. The future useof this land is not determined, however, zoning has been sought to support acommercial development before the City of Grand Island for the parcel immediately eastof the CNH Property and west of Highway 281. Although the groundwater is not beingused for commercial or residential consumption because all commercial and residentialproperties are connected to city water, it has been assumed that this groundwater couldbe a source for residential use in the future. It was assumed that current groundwaterchemical concentrations would remain at current levels into the future for a period of30 years. Therefore, the receptors of interest in Area 2 are potential future residents.
The surface water ponds, Brentwood and Kenmare Gravel Pit Lakes, west of BrentwoodBoulevard have been sampled and the data will be used to evaluate human health risks.Reportedly, the lakes have been used for recreational activities, such as motor-boatingand water sports. A recreational receptor will be considered when evaluating exposureto surface water in the lake. Although exposure pathways are considered complete, thelevels of COPCs present in surface water are low (i.e., only one surface water detectionof 1,1-DCA at 0.23J ug/L in the Brentwood Gravel Pit Lake; all Kenmare Gravel Pit Lakesample COPCs were non-detect [below screening levels]). As discussed below, thisconcentration was compared to Region IX tap water PRGs and found to be 200-foldlower. Therefore, a resident could drink the water and be exposed to risks lower thanthe PRG. As these water bodies are not drinking water sources and contact isrecreational, rather than residential, these surface water bodies are not be consideredquantitatively because all concentrations are below screening levels.
3.1.3 AREA 3: FUTURE GROUNDWATER WELL
For the purposes of this HHRA, groundwater in the Northern Study Area was assumedto have a future groundwater well that could supply drinking water for a period of30 years. Once it is assumed that water enters a drinking water supply system it isfurther assumed that .the water becomes available to a resident and exposure occurs,even when this may not actually be the case. Therefore, the receptor for potential futuregroundwater exposure is a resident.
018925(21) L-21 CONESTOGA-ROVERS & ASSOCIATES
3.2 IDENTIFICATION OF POTENTIAL EXPOSURE PATHWAYS
An exposure pathway describes a mechanism by which humans may come into contactwith area-related COPCs. An exposure pathway is complete (i.e., it could result in areceptor contacting a COPC) if the following four elements are present:
• A source or a release from a source or sources;
• A probable environmental migration route of a Site-related COPC;
• An exposure point where a receptor may come in contact with a Site-related COPC;and
• A route by which a Site-related COPC may enter a potential receptor's body.
If any of these four elements is not present, the exposure pathway is consideredincomplete and does not contribute to the total exposure from the COPCs.
The first element is satisfied because two separate and unrelated sources have beenidentified, the CNH Property and the unrelated Southern Plume. The Southern Plumehas impacted Parkview/Stolley Park, as previously indicated in Section 2.0.
3.2.1 SOURCES AND RECEIVING MEDIA
The two source areas are the CNH Property and the Southern Plume which are definedby, Section IV, Paragraph 10 of the AOC as follows:
• "CNH Property" shall menu the property located at 3445 Stolley Park Road, Grand Island,
Nebraska.
• "Southern Plume" for purposes of this Order shall mean the groundivater plume ofCVOCs
starting at or west of the Indian Head Golf Course, and migrating to the east and
east-northeast through the Castle Estates, Mary Lane, Bradley, Kentish Hills, and
Parkvieio/Stolley Park subdivisions.
The two receiving media areas are the CNH groundwater and the Southern Plumegroundwater, which can be defined as follows:
• Groundwater associated with the CNH Property, and
• Groundwater associated with the Southern Plume.
018925(21) ' L-22 CONESTOGA-ROVERS & ASSOCIATES
3.2.2 FATE AND TRANSPORT OF COPCs
As more completely described in Section 5.0 of the RI, many complex factors control thepartitioning of the COPCs in the environment, thus measured concentrations in any areaonly represent local conditions at a discrete point in time. An understanding of thegeneral fate and transport characteristics of the COPCs are important when predictingfuture exposure, linking sources with currently contaminated media, and identifyingpotentially complete pathways to site media. Therefore, the fate and transport analysisconducted at this stage of the exposure assessment is not intended to provide aquantitative evaluation of media-specific COPC concentrations; it is meant to identifymedia that are likely to receive COPCs. That is, limited fate and transport modeling wasconducted for chemical releases to air assuming vapor migrate into outdoor air, anoutdoor trench and indoor air. However, future potential groundwater concentrationswere not estimated for the HHRA for the CNH plume or the unrelated Southern Plume.It was assumed that groundwater concentrations were represented by the 95 percentUCL, or maximum concentration and that it would not decrease over the next 30 years.
The following sections provide a fate and transport evaluation to determine the relativesignificance of the release sources and mechanisms. The concentration and distributionof COPCs in the environment are subject to change due to dispersal by wind and water,and chemical and biological degradation by microorganisms. Once released to theenvironment, COPCs in this HHRA can partition between soil, water, and air, and besubsequently subjected to one or more of the following processes:
• transportation (e.g., convection by wind or water);
• physical transformation (e.g., volatilization, precipitation);
• chemical transformation (e.g., photolysis, hydrolysis, oxidation, reduction);
• biological transformation (e.g., biodegradation, metabolization by plants or animals);and
• accumulation in one or more media.
Several transport mechanisms, such as advection and dispersion, are controlledprimarily by the physical characteristics of the area, and thus are essentially the same forall COPCs. However, other transport and transformation processes, such asvolatilization, sorption, and biodegradation, depend on certain physical and chemicalproperties, and therefore vary for each COPC.
018925(21) L-23 CONESTOGA-ROVERS & ASSOCIATES
3.2.3 POTENTIAL EXPOSURE POINTS
After affected or potentially affected media have been identified, potential COPCexposure points are determined by identifying whether or not the potentially exposedpopulation can contact these media. Many of these exposures, or potential exposures,are via direct contact with the medium, such as soil ingestion or tap water ingestion.These exposure points are represented by the data available.
Other potential exposure pathways, such as outdoor inhalation of volatile chemicalsfrom soil and groundwater in areas containing impacted groundwater are potentiallycomplete, but are generally considered de minimis for industrial/commercial workersand residents because the concentrations are so low due to dilution. The volatilechemicals are significantly diluted upon release to ambient air as illustrated by themodeled ambient air concentrations presented in Table A.3.2 of Attachment A.CNH Property groundwater concentrations were used in the screening of ambient airbecause concentrations are higher here than at other locations in the area and if ambientair was below screening levels with these groundwater concentrations it would beacceptable elsewhere. The Region IX Ambient Air PRGs were used for screening andambient air concentrations were found to be lower than the screening levels, asdiscussed in Section 3.3.1.1.
3.2.3.1 AREA 1; CNH PROPERTY SOIL
Soil data for the CNH Property has been collected. There are approximately 180 soilsamples available for the HHRA. These samples are taken from various locations andvarious depths on the CNH Property. The maximum soil concentration was used torepresent the reasonable maximum exposure (RME) and the central tendency (CT) oraverage exposure point concentration for all three COPCs except for the CT for 1,1-DCA,as shown in Table 3.1 (below) (Table A.3.1 of Attachment A). This assumes that nomatter where a worker may be exposed to soil, they will contact the maximumconcentration. It further assumes that a worker who is excavating soil will contact thatmaximum concentration at all depths.
018925(21) • L-24 CONESTOGA-ROVERS & ASSOCIATES
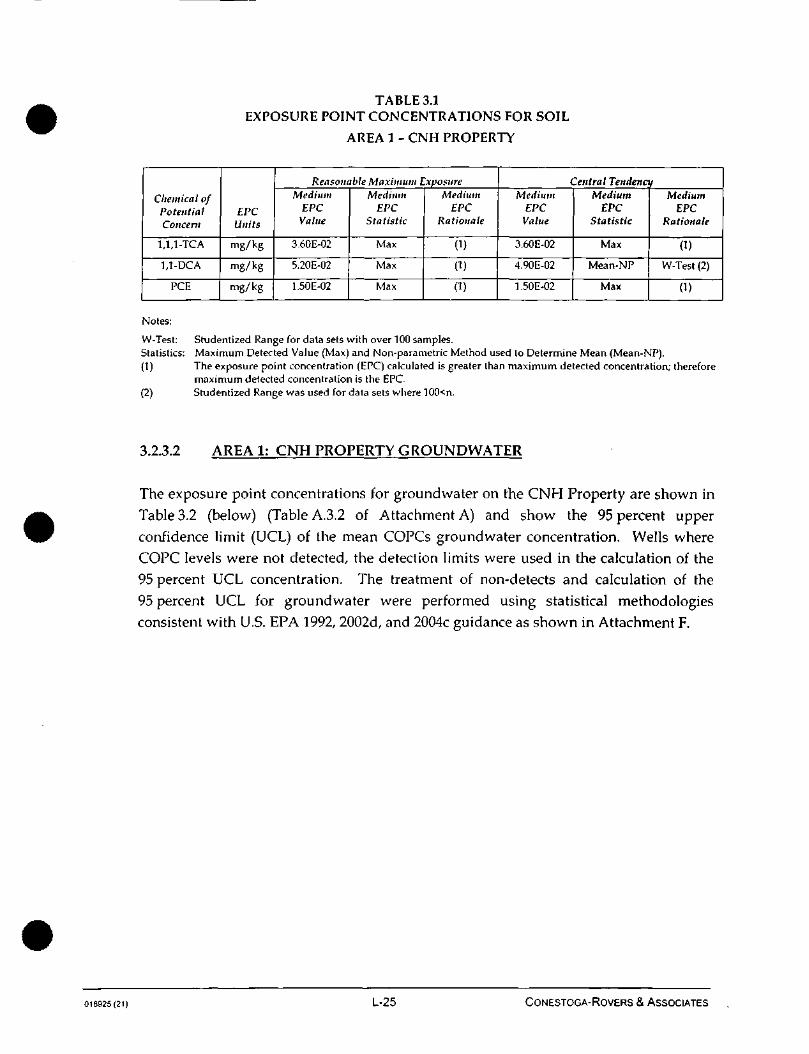
TABLE 3.1EXPOSURE POINT CONCENTRATIONS FOR SOIL
AREA 1 - CNH PROPERTY
Chemical ofPotentialConcern
1,1,1-TCA
1,1-DCA
PCE
EPCUnits
mg/ kg
mg/kg
mg/kg
Reasonable Maximum ExposureMedium
EPCValue
3.60E-02
5.20E-02
1.50E-02
MediumEPC
Statistic
Max
Max
Max
MediumEPC
Rationale
0)
(1)
0)
Central TendencyMedium
EPCValue
3.60E-02
4.90E-02
1.50E-02
MediumEPC
Statistic
Max
Mean-NP
Max
MediumEPC
Rationale
0)
W-Test (2)
0)
Notes:
W-Test: Studentized Range for data sets with over TOO samples.Statistics: Maximum Detected Value (Max) and Non-parametric Method used to Determine Mean (Mean-NP).(1) The exposure point concentration (EPC) calculated is greater than maximum detected concentration; therefore
maximum detected concentration is the EPC.(2) Studentized Range was used for data sets where 100<n.
3.2.3.2 AREA 1: CNH PROPERTY GROUNDWATER
The exposure point concentrations for groundwater on the CNH Property are shown in
Table 3.2 (below) (Table A.3.2 of Attachment A) and show the 95 percent upper
confidence limit (UCL) of the mean COPCs groundwater concentration. Wells where
COPC levels were not detected, the detection limits were used in the calculation of the
95 percent UCL concentration. The treatment of non-detects and calculation of the
95 percent UCL for groundwater were performed using statistical methodologies
consistent with U.S. EPA 1992, 2002d, and 2004c guidance as shown in Attachment F.
018925(21) L-25 CONESTOGA-ROVERS & ASSOCIATES
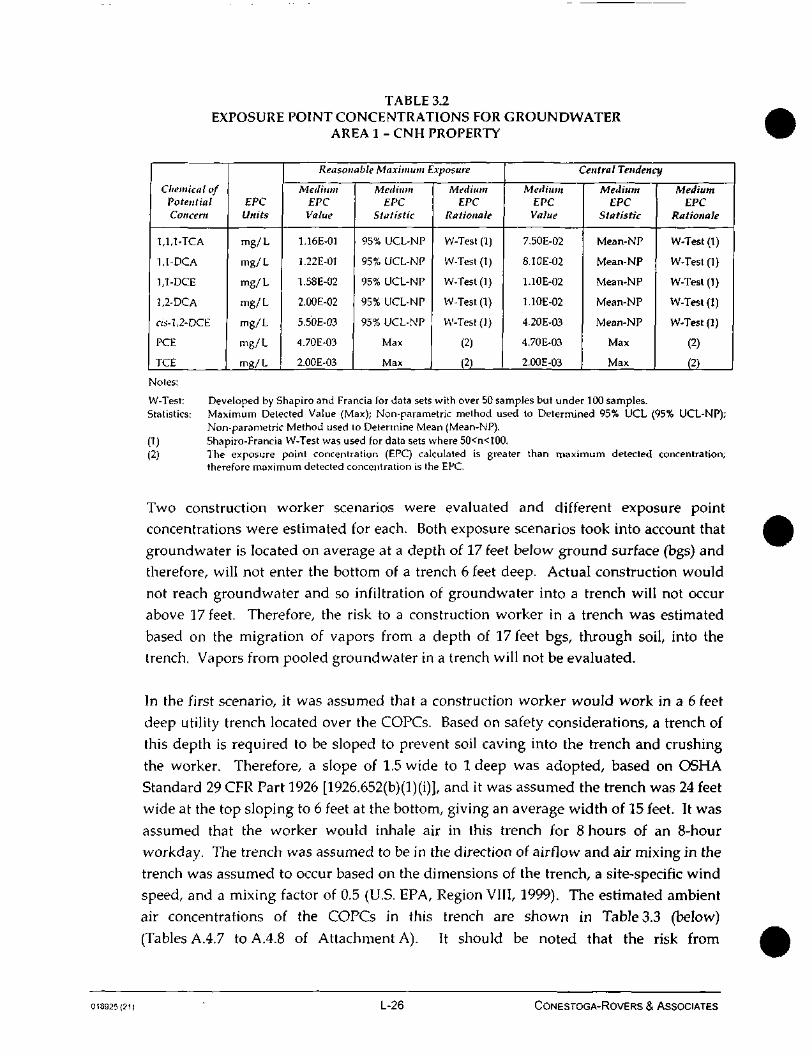
TABLE 3.2EXPOSURE POINT CONCENTRATIONS FOR GROUNDWATER
AREA 1 - CNH PROPERTY
Chemical ofPotentialConcent
1,1,1-TCA
1,1 -DCA
1,1-DCE
1,2-DCA
r/s-l,2-DCE
PCE
TCE
EPCUnits
mg/L
mg/L
mg/L
mg/L
mg/L
mg/L
mg/L
Reasonable Maximum Exposure
MediumEPCValue
1.16E-01
1.22E-01
1.58E-02
2.00E-02
5.50E-03
4.70E-03
2.00E-03
MediumEPC
Statistic
95% UCL-NP
95% UCL-NP
95% UCL-NP
95% UCL-NP
95% UCL-NP
Max
Max
MediumEPC
Rationale
W-Test (1)
W-Test (1)
W-Test (1)
W-Test (1)
W-Test (1)
(2)
(2)
Central Tendency
MediumEPCValue
7.50E-02
8.10E-02
1.10E-02
1.10E-02
4.20E-03
4.70E-03
2.00E-03
MediumEPC
Statistic
Mean-NP
Mean-NP
Mean-NP
Mean-NP
Mean-NP
Max
Max
MediumEPC
Rationale
W-Test (1)
W-Test (1)
W-Test (1)
W-Test (1)
W-Test (1)
(2)
(2)
Notes:
W-Test:Statistics:
0)(2)
Developed by Shapiro and Francia for data sets with over 50 samples but under 100 samples.Maximum Detected Value (Max); Non-parametric method used to Determined 95% UCL (95% UCL-NP);Non-parametric Method used to Determine Mean (Mean-NP).Shapiro-Francia W-Test was used for data sets where 50<n<100.The exposure point concentration (EPC) calculated is greater than maximum detected concentration;therefore maximum detected concentration is the EPC.
Two construction worker scenarios were evaluated and different exposure pointconcentrations were estimated for each. Both exposure scenarios took into account thatgroundwater is located on average at a depth of 17 feet below ground surface (bgs) andtherefore, will not enter the bottom of a trench 6 feet deep. Actual construction wouldnot reach groundwater and so infiltration of groundwater into a trench will not occurabove 17 feet. Therefore, the risk to a construction worker in a trench was estimatedbased on the migration of vapors from a depth of 17 feet bgs, through soil, into thetrench. Vapors from pooled groundwater in a trench will not be evaluated.
In the first scenario, it was assumed that a construction worker would work in a 6 feetdeep util i ty trench located over the COPCs. Based on safety considerations, a trench ofthis depth is required to be sloped to prevent soil caving into the trench and crushingthe worker. Therefore, a slope of 1.5 wide to 1 deep was adopted, based on OSHAStandard 29 CFR Part 1926 [1926.652(b)(l)(i)], and it was assumed the trench was 24 feetwide at the top sloping to 6 feet at the bottom, giving an average width of 15 feet. It wasassumed that the worker would inhale air in this trench for 8 hours of an 8-hourworkday. The trench was assumed to be in the direction of airflow and air mixing in thetrench was assumed to occur based on the dimensions of the trench, a site-specific windspeed, and a mixing factor of 0.5 (U.S. EPA, Region VIII, 1999). The estimated ambientair concentrations of the COPCs in this trench are shown in Table 3.3 (below)(Tables A.4.7 to A.4.8 of Attachment A). It should be noted that the risk from
018925(21) L-26 CONESTOGA-ROVERS & ASSOCIATES
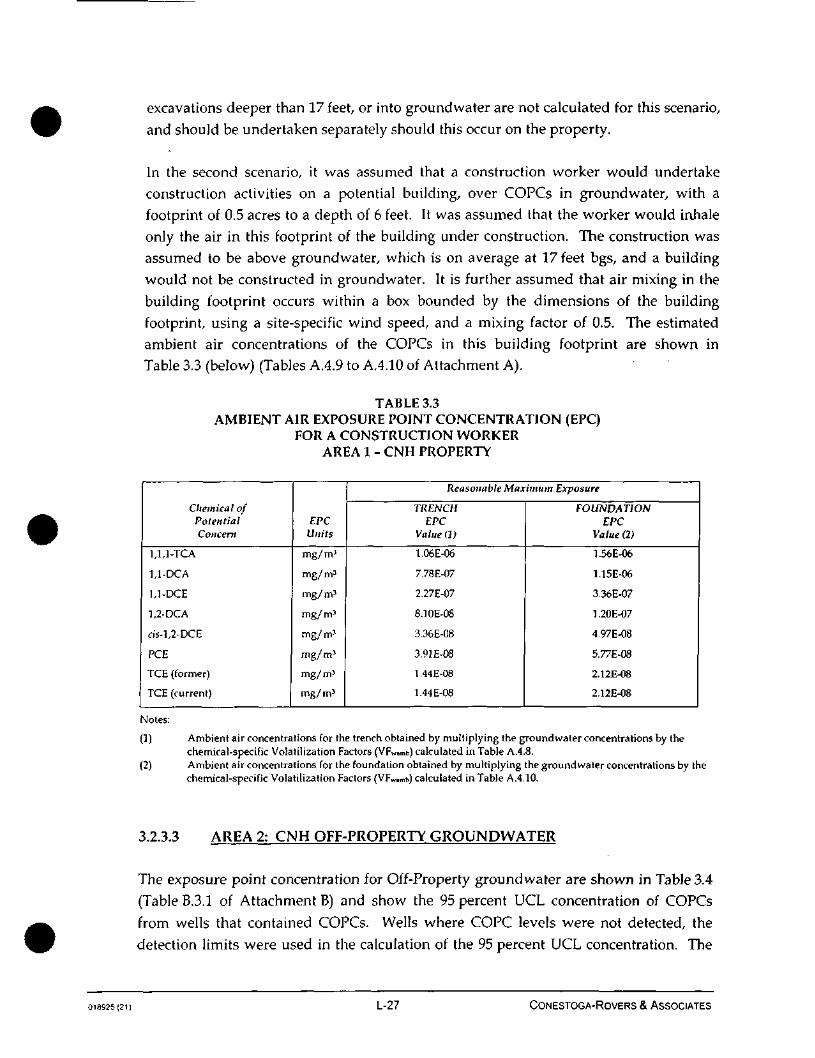
excavations deeper than 17 feet, or into groundwater are not calculated for this scenario,
and should be undertaken separately should this occur on the property.
In the second scenario, it was assumed that a construction worker would undertake
construction activities on a potential building, over COPCs in groundwater, with a
footprint of 0.5 acres to a depth of 6 feet. It was assumed that the worker would inhale
only the air in this footprint of the building under construction. The construction was
assumed to be above groundwater, which is on average at 17 feet bgs, and a building
would not be constructed in groundwater. It is further assumed that air mixing in the
building footprint occurs within a box bounded by the dimensions of the building
footprint, using a site-specific wind speed, and a mixing factor of 0.5. The estimatedambient air concentrations of the COPCs in this building footprint are shown in
Table 3.3 (below) (Tables A.4.9 to A.4.10 of Attachment A).
TABLE 3.3AMBIENT AIR EXPOSURE POINT CONCENTRATION (EPC)
FOR A CONSTRUCTION WORKERAREA 1 - CNH PROPERTY
Chemical ofPotentialConcent
1,1,1-TCA
1,1-DCA
1,1-DCE
1,2-DCA
c/s-l,2-DCE
PCE
TCE (former)
TCE (current)
EPCUm'fs
mg/m3
mg/ m3
mg/m3
mg/m3
mg/m'
mg/m3
mg/m3
mg/m3
Reasonable Maximum Exposure
TRENCHEPC
Value (I)
1.06E-06
7.78E-07
2.27E-07
8.10E-08
3.36E-08
3.91 E-08
1.44E-08
1.44E-08
FOUNDATIONEPC
Value (2)
1.56E-06
1.15E-06
3.36E-07
1.20E-07
4.97E-08
5.77E-08
2.12E-08
2.12E-08
Notes:
[1) Ambient air concentrations for the trench obtained by multiplying the groundwater concentrations by thechemical-specific Volatilization Factors (VFwamb) calculated in Table A.4.8.
(2) Ambient air concentrations for the foundation obtained by multiplying the groundwater concentrations by thechemical-specific Volatilization Factors (VFw.mt,) calculated in Table A.4.10.
3.2.3.3 AREA 2: CNH OFF-PROPERTY GROUNDWATER
The exposure point concentration for Off-Property groundwater are shown in Table 3.4
(Table B.3.1 of Attachment B) and show the 95 percent UCL concentration of COPCs
from wells that contained COPCs. Wells where COPC levels were not detected, the
detection limits were used in the calculation of the 95 percent UCL concentration. The
018925(21) L-27 CONESTOGA-ROVERS & ASSOCIATES
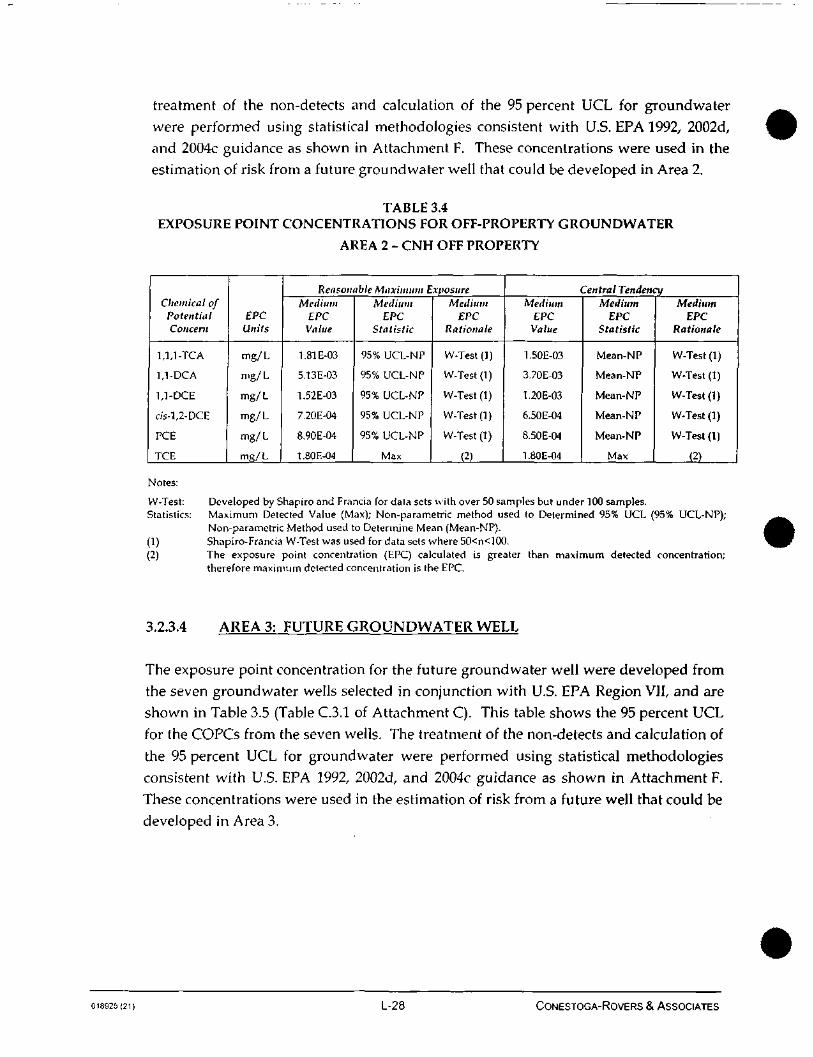
treatment of the non-detects and calculation of the 95 percent UCL for groundwaterwere performed using statistical methodologies consistent with U.S. EPA 1992, 2002d,and 2004c guidance as shown in Attachment F. These concentrations were used in theestimation of risk from a future groundwater well that could be developed in Area 2.
TABLE 3.4EXPOSURE POINT CONCENTRATIONS FOR OFF-PROPERTY GROUNDWATER
AREA 2 - CNH OFF PROPERTY
Chemical ofPotentialConcern
1,1,1 -TCA
1,1 -DC A
1,1-DCE
cis-l,2-DCE
PCE
TCE
EPCUnits
mg/L
mg/L
mg/L
mg/L
mg/L
mg/L
Reasonable Maximum ExposureMedium
EPCValue
1.81E-03
5.13E-03
1.52E-03
7.20E-04
8.90E-04
1.80E-04
MediumEPC
Statistic
95% UCL-NP
95% UCL-NP
95% UCL-NP
95% UCL-NP
95% UCL-NP
Max
MediumEPC
Rationale
W-Test (1)
W-Test(l)
W-Test (1)
W-Test (1)
W-Test (1)
(2)
Central TendencyMedium
EPCValue
1.50E-03
3.70E-03
1.20E-03
6.50E-04
8.50E-04
1.80E-04
MediumEPC
Statistic
Mean-NP
Mean-NP
Mean-NP
Mean-NP
Mean-NP
Max
MediumEPC
Rationale
W-Test (1)
W-Test (1)
W-Test (1)
W-Test (1)
W-Test (1)
(2)
Notes:
W-Test: Developed by Shapiro and Francia for data sets wi th over 50 samples but under 100 samples.Statistics: Maximum Detected Value (Max); Non-parametric method used to Determined 95% UCL (95% UCL-NP);
Non-parametric Method used to Determine Mean (Mean-NP).(1) Shapiro-Francia W-Test was used for data sets where 50<n<100.(2) The exposure point concentration (EPC) calculated is greater than maximum detected concentration;
therefore maximum detected concentration is the EPC.
3.2.3.4 AREA 3: FUTURE GROUNDWATER WELL
The exposure point concentration for the future groundwater well were developed fromthe seven groundwater wells selected in conjunction with U.S. EPA Region VII, and areshown in Table 3.5 (Table C.3.1 of Attachment C). This table shows the 95 percent UCLfor the COPCs from the seven wells. The treatment of the non-detects and calculation of
the 95 percent UCL for groundwater were performed using statistical methodologiesconsistent with U.S. EPA 1992, 2002d, and 2004c guidance as shown in Attachment F.These concentrations were used in the estimation of risk from a future well that could bedeveloped in Area 3.
018925(21) L-28 CONESTOGA-ROVERS & ASSOCIATES

TABLE 3.5EXPOSURE POINT CONCENTRATIONS FOR GROUNDWATER/TAP WATER
AREA 3 - FUTURE GROUNDWATER WELL STOLLEY PARK
Chemical ofPotentialConcern
1,1,1-TCA
1,1-DCA
1,1 -DCE
1,2-DCA
PCE
EPC
mg/L
mg/L
mg/L
mg/L
mg/L
Reasonable Maximum ExposureMedium
EPCValue
3.00E-02
4.70E-03
2.66E-02
6.50E-04
9.50E-03
MediumEPC
Statistic
95% UCL-N
95% UCL-N
95% UCL-N
95% UCL-NP
95% UCL-N
MediumEPC
Rationale
W-Test (1)
W-Test (1)
W-Test (1)
W-Test (1)
W-Test (1)
Central TendencyMedium
EPCValue
2.16E-02
3.30E-03
1.83E-02
5.70E-04
6.75E-03
MediumEPC
Statistic
Mean-N
Mean-N
Mean-N
Mean-NP
Mean-N
MediumEPC
Rationale
W-Test (1)
W-Test (1)
W-Test (1)
W-Test (1)
W-Test (1)
Notes:
W-Test: Developed by Shapiro and Francia for data sets with over 50 samples but under 100 samples.Statistics: Maximum Detected Value (Max); Non-parametric method used to Determined 95% UCL (95% UCL-NP);
Non-parametric Method used to Determine Mean (Mean-NP).
(1) Shapiro-Francia W-Test was used for data sets where 50<n<100.
3.2.4 COMPLETE PATHWAYS AND EXPOSURE ROUTES
A potential exposure route is the fourth element of an exposure pathway. Potentialexposure routes are identified by: i) determining the COPC sources and receivingmedia; ii) analyzing the movement of the COPCs from the source; and iii) determiningthe possible exposure points.
Humans can be exposed to a variety of media containing COPCs, including soil,groundwater, surface water, and air that have contact with other affected media. Basedon the presence of two different unconnected sources in the area of the CNH Propertyand the Northern Study Area groundwater impacted by the Southern Plume,respectively, potential exposure routes associated with soil include incidental ingestion,direct dermal contact, and inhalation (airborne particulate and/or vapors), whereaspotential exposure routes associated with groundwater include incidental ingestion,direct dermal contact, and vapor inhalation.
Based on an understanding of the four components of an exposure pathway and thecurrent/future conditions in the area, human exposure pathways were identified in theHHRA. Since the current and future land uses could be industrial/commercial orresidential, depending on the location, the potential human populations consideredrelevant to the HHRA included a general industrial/commercial worker and a workerinvolved in construction activities or u t i l i ty excavations, and a child/adult resident.Access to the CNH Property is restricted, thus it is not considered possible that
018925(21) L-29 CONESTOGA-ROVERS & ASSOCIATES
trespassers would frequent the facility, if they did their exposure is expected to be lessthan a worker who is present throughout the year.
The soil vapor-to-indoor air pathway was evaluated by monitoring, as discussed inAttachment G, and based on these indoor air monitoring data, and the results of Johnson& Ettinger (J&E) Vapor Intrusion modeling, it was shown that the highest groundwaterconcentrations in the Southern Plume did not result in indoor air concentrations ofconcern and so groundwater was unlikely to present an indoor air risk at other locationswhere groundwater chemical concentrations are significantly lower. However, thegroundwater concentrations from Areas 2 and 3 were used to estimate the indoor airconcentration within fu ture households in Areas 2 and 3, and the J&E modeling ispresented in Attachment G.
As noted in Section 3.1.1, soil exposure pathways are potentially complete and exposureto soil has been evaluated in the HHRA even though the COPCs in soil are below theapplicable screening criteria.
As noted in Section 3.1.2, surface water exposure pathways are potentially complete, butsurface water has been eliminated from the HHRA due to the absence of COPCs abovescreening criteria.
Based on these assumptions and the results of the media-specific screening presented inSection 2.5, the exposure scenarios and pathways quantified in the HHRA aresummarized in Tables A. 1.1, B.I.I, and C.I.1. The Conceptual Site Models (CSMs)shown on Figures 3.1 to 3.3, present a summary of the exposure media, exposurepathways, exposure routes, and exposed receptors considered in this HHRA. Thefollowing media and potential human exposures (i.e., complete pathways) have beenidentified for quantitative evaluation, beyond screening, in the HHRA.
3.2.4.1 AREA 1: INDUSTRIAIVCQMMERCIAL WORKER
The CNH Property is currently an active industrial/commercial facility thatmanufactures farm machinery; historically, the property was used for manufacturingcombine harvesters. The current Area 1 land use is expected to remainindustrial/commercial into the future, as the owners have no plans to change thecurrent use or sell the property in the future.
The HHRA assumes that the property will remain in its current use.Industrial/commercial workers are the receptors of interest in Area 1. A site conceptual
018925(21) L-30 CONESTOGA-ROVERS & ASSOCIATES
model showing complete exposure pathways for the industrial/commercial worker anda construction worker is provided on Figure 3.1.
Exposure to an industrial worker could occur through the following exposure pathways:
• Inadvertent soil ingestion;
• Dermal contact with soil;
• Inhalation of vapors volatilizing from the soil; and
• Inhalation of ambient air.
The inadvertent ingestion of soil, dermal contact, and inhalation of vapors from the soilare evaluated quantitatively. The inhalation of vapors emanating from groundwaterinto ambient air is evaluated by comparison of estimated ambient air concentrations toRegion IX ambient air PRGs and vapor intrusion is not considered because there are nobuildings within 100 feet of the COPCs in soil (U.S. EPA (2002a)).
3.2.4.2 AREA 1: CONSTRUCTION WORKER
A construction worker may be exposed to COPCs through a number of differentpathways, as shown in the CSM (Figure 3.1), the following pathways are consideredcomplete, and will be evaluated in the HHRA:
• Inadvertent soil ingestion;
• Dermal contact with soil; and
• Inhalation of COPCs volatilizing from soil and groundwater during construction.
The inadvertent ingestion of soil, dermal contact with soil, the inhalation of vaporsduring construction are evaluated quantitatively. The inhalation of vapors emanatingfrom groundwater into ambient air is evaluated by comparison of estimated ambient airconcentrations to Region IX ambient air PRGs.
3.2.4.3 AREA 2: CNH OFF-PROPERTY FUTURE WELL
It was assumed that current groundwater chemical concentrations would remain atcurrent levels into the future for a period of 30 years. Therefore, the receptors of interestin Area 2 are potential future residents using groundwater as a potable water source. A
018925(21) L-31 CONESTOGA-ROVERS & ASSOCIATES
CSM for this receptor is shown on Figure 3.2. Exposure pathways for this futuregroundwater well include:
• Groundwater ingestion;
• Dermal contact with groundwater;
• Inhalation of vapors from tap water;
• Inhalation of indoor air vapors from groundwater; and
• A child swimming pool exposure scenario.
3.2.4.4 AREA 2: GRAVEL PIT LAKES
The surface water ponds, Brentwood and Kenmare Gravel Pit Lakes, west of BrentwoodBoulevard have been sampled and the data will be used to evaluate human health risks.Reportedly, the lakes have been used for recreational activities, such as motor-boatingand water sports. A recreational receptor will be considered when evaluating exposureto surface water in the lake. Although exposure pathways are considered complete, thelevels of chemicals present in surface water are low (e.g., only one surface waterdetection of 1,1-DCA at 0.23J ug/L in the Brentwood Gravel Pit Lake; all KenmareGravel Pit Lake sample CVOCs were non-detect [below screening levels]). This surfacewater body will not be considered further because all concentrations are belowscreening levels. A conceptual site model for this exposure scenario is shown onFigure 3.2.
3.2.4.5 AREA 3: FUTURE GROUNDWATER WELL
For the purposes of this HHRA, groundwater in the Northern Study area was assumedto have a future groundwater well that could supply drinking water for a period of30 years. Once it is assumed that a drinking water well has been constructed, it isfurther assumed that the water becomes available to a resident and exposure occurs. Itwas further assumed that the exposure point concentration was based on the area of theplume with the highest chemical concentrations, as selected with U.S. EPA. Therefore,the receptor for potential future groundwater exposure is a resident. A conceptual sitemodel for this exposure scenario is shown on Figure 3.3.
• Groundwater ingestion;
• Dermal contact with groundwater;
018925(21) L-32 CONESTOGA-ROVERS & ASSOCIATES
• Inhalation of vapors from tap water;
• Inhalation of indoor air vapors from groundwater; and
• A child swimming pool exposure scenario.
In addition to these pathways, there are a number of minor pathways that could
contribute low levels of risk, but were not considered in the HHRA. For example, a
resident could irrigate home produce with tap water during the growing season. The
COPCs are volatile compounds and prefer to be in air rather than water. Therefore,
COPCs will generally volatilize rather than be taken up into leaf and root vegetables.
Similar to COPCs volatilizing into ambient air from soil and groundwater, COPCs from
irrigation water will volatilize and disperse into ambient air to concentrations that
generally pose a de minimus risk.
3.3 QUANTIFICATION OF EXPOSURE
To quant i fy exposure, potential exposure scenarios were developed in conjunction with
U.S. EPA Region VII RPM and Risk Assessor using guidance presented in the following
U.S. EPA documents:
• U.S. EPA, 1989: Risk Assessment Guidance for Superfund. Vol. 1: Human Health
Evaluation Manual, Part A OERR. EPA/540-1-89-002;
• U.S. EPA, 1991 a: Risk Assessment Guidance for Superfund. Vol.1: Human Health
Evaluation Manual - Supplemental Guidance, Standard Default Exposure Factors.
Interim Final. OSWER Directive 9285.6-03;
• U.S. EPA, 1997: Exposure Factors Handbook, EPA/600/P-95/002F, August;
• U.S. EPA, 2001: RAGS Part D, Standardized Planning, Reporting, and Review of
Superfund Risk Assessments, Interim, Publication 9285.7-O1D, December;
• U.S. EPA, 2002a: Vapor Intrusion to Indoor Air Pathway from Groundwater and
Soils, November;
• U.S. EPA, 2002b: Child-Specific Exposure Factors Handbook, September;
• U.S. EPA, 2002c: Supplemental Guidance for Developing Soil Screening Levels for
Superfund Sites, OSWER 9355.4-24, December; and
• U.S. EPA, 2004a: RAGs Volume 1, Human Health Evaluation Manual, Part E:
Supplemental Guidance for Dermal Risk Assessment, EPA/540/R/99/005, July.
018925(21) - L-33 CONESTOGA-ROVERS & ASSOCIATES
In instances where U.S. EPA documents did not present necessary factors, or wheremore appropriate scientific data were not available, professional judgment was appliedto develop conservative assumptions that are representative of the Central Tendency(CT) or mean and Reasonable Maximum Exposure (RME) and are protective of humanhealth. The exposure scenarios and assumptions for each area evaluated are presentedin their respective attachment with the related data and risk calculation tables. Thefollowing list presents the various areas and their associated attachments:
• Area 1: CNH soil and groundwater Attachment A;
• Area 2: CNH Off-Property groundwater Attachment B; and
• Area 3: Future groundwater well Attachment C.
The risk assessment process developed by U.S. EPA attempts to establish an estimate ofan average measure of the potential risk to receptors (U.S. EPA, 1989). Two levels ofexposure scenarios are presented. The RME presents a conservative exposure scenariothat corresponds to the 95 percent upper confidence limit (UCL) of the meanconcentration coupled with the conservative exposure levels that are high, and representan upper bound estimate of the risk, within reasonable limits. The CT presents averageexposure, and approximates the most probable exposure conditions.
The CT and RME exposure point concentration (EPC) values for the various exposurescenarios were determined based on the observed data distribution and the percentageof censored data points (non-detected results). Attachment F contains a detaileddescription of the statistical methods used to determine the CT and RME values.Attachment F also contains the EPC files on a CD.
3.3.1 EXPOSURE POINT CONCENTRATIONS
This subsection of the HHRA provides the exposure point concentrations that will beused in the process of estimating intake for the identified receptors.
3.3.1.1 AREA1: CNH PROPERTY SOIL
The soil on the CNH Property has been remediated, and the HHRA will be completedusing data from post-remediation confirmation sampling data. A summary of theexposure point concentrations for soil is provided in Table 3.1 above (Table A.3.1 ofAttachment A). There are 180 soil samples in the database, thus providing an adequate
018925(21) L-34 CONESTOGA-ROVERS & ASSOCIATES
data set for analysis. The maximum detected soil concentration for each COPC was
used for both the RME and CT calculation because it was lower than the 95 percent UCL
of the data, and avoided problems related to sample depth. This assumes that a worker
will contact the highest concentration of COPC in soil regardless of where they may dig.
3.3.1.2 AREA 1: CNH PROPERTY GROUNDWATER
Groundwater on the CNH Property is not now, and will not in the future, be used as a
groundwater source. CNH is in a position to restrict access to groundwater and so this
pathway is considered incomplete for the purposes of evaluating the risk from current
and future groundwater consumption. However, a construction worker scenario will be
considered in the HHRA to evaluate the potential risks to a construction worker who
might contact groundwater while excavating in soil at the site. The exposure point
concentration for groundwater was developed using data from groundwater wells on
the CNH Property and are provided in Table 3.2 above (Table A.3.2 of Attachment A).
All of the groundwater data for 1993, 1996, 2002, 2004, and 2005 were used and a
95 percent UCL was calculated to represent the RME. This calculation assumes that a
worker might contact all vapor equally and that groundwater concentrations will
remain at this RME level over the exposure duration. The 95 percent UCLs in Table 3.2
were calculated using both detected and non-detect value. For TCE and PCE the
maximum concentration was used because the detection frequency was low, and in both
cases the detected concentrations were less than the MCL.
3.3.1.3 AREA1: CNH PROPERTY AMBIENT AIR
Ambient air COPC concentrations were estimated based on the RME groundwater
exposure point concentration coupled with a volatilization factor derived using
U.S. EPA parameters (U.S. EPA, 2004b), and ASTM algorithms (ASTM, 1998), as shown
in Table A.3.3 of Attachment A. Ambient air concentrations were calculated using that
the RME groundwater concentrations (or maximum) assuming volatilization into
ambient air. This calculation used a volatilization factor (VFwamb) presented in
Tables A.3.4 of Attachment A, and assumed that the COPCs volatized from a source area
1,500 feet in width by 2 meters in height, with air mixing provided by 5-year annual
average wind speeds from the Grand Island Airport (Table 3 of Attachment H). As
discussed, these estimated ambient air concentrations were compared to ambient air
screening values in Table 2.3 above (Table A.3.3 of Attachment A). It can be seen that
estimated air concentrations are significantly below these residential ambient air PRGs.
018925(21) L-35 CONESTOGA-ROVERS & ASSOCIATES
COPC concentrations for indoor air were not estimated on the CNH Property becauseCOPCs in soil are considerably greater than 100 feet from any building on the CNHProperty, the distance required by EPA guidance for vapor intrusion into a building(U.S. EPA, 2002a). Although no building construction is planned for the CNH Property,potential vapor intrusion for a future building that might be constructed was evaluated.The maximum groundwater concentration found on the CNH Property (shown inTable 2.2 above) was compared to "Target Groundwater Concentrations Correspondingto Indoor Air Concentrations" as shown in Table 2c of U.S. EPA's Vapor IntrusionGuidance (U.S. EPA, 2002a). These concentrations are groundwater levels that wouldpotentially lead to residential indoor air concentrations at the U.S. EPA cancer risk levelof 1 x 10⁻⁶, and would be higher for future commercial/industrial workers. The onlychemicals with a maximum groundwater concentration exceeding the screening levelswere 1,1-DCE and 1,2-DCA. All other COPCs were below the screening levels and sonot considered further. Both 1,1-DCE and 1,2-DCA exceeded the vapor intrusionscreening levels only 1 time out of 81 groundwater samples.
U.S. EPA's Target Groundwater Concentrations Corresponding to Indoor AirConcentrations were developed using a generic attenuation factor of 0.001 to estimatethe potential attenuation when vapors travel through the soil column to indoor air.Site-specific vapor intrusion modeling was conducted for the CNH Off-site Property andit was determined that the soil characteristics lead to a site-specific soil attenuation ofapproximately IxlO-5 (Appendix G), some one hundred fold lower than that assumed byU.S. EPA. When this site-specific adjustment is made, the maximum detected 1,2-DCAgroundwater concentration only slightly exceeds U.S. EPA's screening level based on acancer risk level of 1 x 10"6 for a residential receptor. Therefore, this exposure pathwaywas not considered further.
Air concentrations related to an excavation scenario are discussed below, but due to thelow concentrations of COPCs in soil, the contribution of COPCs to air from soil wasconsidered de minimus but conservatively evaluated, and the contribution fromgroundwater only was used to estimate air COPC concentrations. Attachment Aprovides additional details on environmental media concentrations.
Construction worker scenarios were developed for a construction worker. Two differentscenarios were evaluated, and different exposure point concentrations were estimatedfor each. For both scenarios recognize the fact that groundwater is located on average ata depth of 17 feet bgs and therefore, it is unable to enter the bottom of a trench 6 feetdeep. Actual construction would not reach groundwater and so infiltration ofgroundwater into a trench will not occur above 17 feet. Therefore, the risk to aconstruction worker in a trench was estimated based on the migration of vapors from a
018925(21) L-36 CONESTOGA-ROVERS & ASSOCIATES
depth of 17 feet bgs, through soil, into the trench. Vapors from pooled groundwaterwithin a trench were not be evaluated. Exposure point concentrations were modeledusing the approach for ambient air, but assuming they vapor migrate into the trench,where they are available for breathing.
In the first scenario, it was assumed that vapors migrate from groundwater, at a depth of17 feet, into a utility trench 6 feet deep located over the COPCs. Based on safetyconsiderations, a trench of this depth is required to be sloped to prevent soil caving intothe trench and crushing the worker. Therefore, a slope of 1.5 wide to 1 deep wasadopted, based on OSHA Standard 29 CFR Part 1926 [1926.652(b)(l)(i)], and it wasassumed the trench was 24 feet wide at the top sloping to 6 feet at the bottom, giving anaverage width of 15 feet. It was assumed that the worker would inhale air in this trenchfor 8 hours of an 8-hour workday. Ambient air COPC concentrations were estimatedbased on the RME groundwater exposure point concentration coupled with avolatilization factor derived using U.S. EPA parameters (U.S. EPA, 2004b), and ASTMalgorithms (ASTM, 1998), as shown in Table A.4.7 of Attachment A. Ambient airconcentrations were calculated using the RME groundwater concentrations (ormaximum) assuming volatilization into ambient air. This calculation used avolatilization factor (VFwamb) presented in Tables A.4.8 of Attachment A, and assumedthat the trench was assumed to be in the direction of airflow and air mixing in the trenchwas assumed to occur with an air exchange rate based on the dimensions of the trench, asite-specific wind speed (5-year average from Grand Island Airport, Table 3 ofAttachment H), and a mixing factor of 0.5 (U.S. EPA, Region VII, 2005; U.S. EPA,Region VIII memorandum, 1999). The estimated ambient air concentrations of theCOPCs in this trench are shown in Table 3.3 above. It should be noted that ifconstruction to a depth of 17 feet, or to groundwater were to be undertaken, analternative risk evaluation would need to be undertaken.
In the second scenario, it was assumed that a construction worker would undertakeconstruction activities on a potential building, over COPCs in groundwater, with afootprint of 0.5 acre. It was assumed that the worker would inhale only the air in thisfootprint of the building. The construction was assumed to be above groundwater,which is on average at 17 feet bgs, and a building would not be constructed ingroundwater. Ambient air COPC concentrations were estimated based on the RMEgroundwater exposure point concentration coupled with a volatilization factor derivedusing U.S. EPA parameters (U.S. EPA, 2004b), and ASTM algorithms (ASTM, 1998), asshown in Table A.4.9 of Attachment A. Ambient air concentrations were calculatedusing that the RME groundwater concentrations (or maximum) assuming volatilizationinto ambient air. This calculation used a volatilization factor (VFwamb) presented inTables A.4.10 of Attachment A, and assumed that the air mixing in the building
018925(21) L-37 CONESTOGA-ROVERS & ASSOCIATES

footprint occurs based on dimensions of the building footprint, a site-specific windspeed (5-year average from Grand Island Airport, Table 3 of Attachment H), and amixing factor of 0.5 (U.S. EPA, Region VII, 2005; U.S. EPA, Region VIII memorandum,1999). The estimated ambient air concentrations of the COPCs in this building footprintare shown in Table 3.3 above.
3.3.1.4 AREA 2: CNH OFF-PROPERTY GROUNDWATER
For the purposes of evaluating the CNH Off-Property groundwater, which is notcurrently being used for potable purpose, a future groundwater well scenario wasassumed to exist. It was further assumed that this future groundwater well would beused for 30 years.
Consistent with U.S. EPA guidance (U.S. EPA, 1989) the upper bound average, or95 percent UCL concentration was used as the exposure point concentration forgroundwater, except for TCE, which was detected only one time at a concentration of0.00018 mg/L. This was the maximum TCE concentration and was used in the HHRAto represent the RME. The 95 percent UCLs of the data from groundwater wells inArea 2, collected in 2002, 2003, and 2004, were used in the RME 95 percent UCLcalculation. U.S. EPA's methods for statistically reducing the data were used, as shownin Attachment B using data collected from wells within the off-site groundwater plumeto give an RME and a CT exposure point concentration, as shown in Table 3.4 above(Table B.3.1 of Attachment B). U.S. EPA guidance recommends the use of the 95 percentUCL concentration, but the actual location of a future potential groundwater well isunknown. It could be constructed in a location where groundwater concentrations arehigher or lower than the average. If a well were constructed at a location wheregroundwater COPC concentrations were other than the 95 percent UCLs the potentialrisks could be higher or lower than those calculated here.
The 95 percent UCL concentrations (or the maximum for TCE) was used as an indoor airCOPC exposure point concentrations. Indoor air concentrations were estimated using aVolatilization Factor, developed utilized by U.S. EPA (1991), as recommended byU.S. EPA Region VII. This approach estimates the amount of COPC available for releasefrom tap water and estimates an ambient air concentration over a 24-hour period basedon multiple uses of tap water, such as showering, bathing, dish washing, and clotheswashing.
The 95 percent UCL concentrations (or the maximum for TCE, an estimatedconcentration) was also used to develop other exposure point concentrations for a child
018925(21) L-38 CONESTOGA-ROVERS & ASSOCIATES

swimming pool scenario. In this scenario it was assumed that a small child's swimmingpool was filled with tap water during the summer months, and that the child wasexposed to the tap water in the pool and to the vapors, which volatilize while the childwas in the pool. The ambient air concentrations were estimated by assuming the COPCsvolatilize into a small box of air over the pool, and that the child breathes the air. Theambient air concentration was a combination was estimate from volatilization andmixing, as recommended by U.S. EPA Region VII. This approach assumed that the poolcontained an infinite amount of COPCs and none was lost during the evaporation
process.
It was also assumed that vapors from groundwater could add to the impacts from thefuture well scenario through vapor intrusion. The U.S. EPA's web-based version of theJohnson-Ettinger model was used to estimate an indoor air concentration and risksassociated with this pathway. The modeling process is discussed in Attachment G.With this scenario, vapors are assumed to migrate from groundwater to indoor air byvolatilizing through the soil column and building foundation. This scenario was alsoassumed for the future well in the Northern Study Area, as described below.
3.3.1.5 AREA 3: FUTURE GROUNDWATER WELL
For the purposes of evaluating the Northern Study Area, a future residentialgroundwater well scenario was assumed. For the purposes of this future groundwaterwell, seven locations were selected in conjunction with U.S. EPA's Remedial ProjectManager and Risk Assessor. The data for one sampling round in March 2004 were usedand the data were reduced statistically to give a 95 percent UCL for use in the HHRA.The locations selected are in the highest Southern Plume concentrations in the NorthernStudy Area, and so are considered to be conservative. It was assumed that groundwaterin the area would be used as a residential drinking water supply for 30 years. It wasfurther assumed that the 95 percent UCL concentration over this future 30-year periodwould not decrease. The future well exposure point concentrations are provided for theRME and CT in Table 3.5 above (Table C.3.1 of Attachment C).
Consistent with the future groundwater well in Area 2, the 95 percent UCLconcentrations were used to estimate exposure point concentrations for indoor air andfor a child swimming pool exposure scenario.
It was also assumed that vapors from groundwater could add to the impacts from thefuture well scenario through vapor intrusion. The U.S. EPA's web-based version of the
018925(21} • L-39 CONESTOGA-ROVERS & ASSOCIATES

Johnson-Ettinger model was used to estimate an indoor air concentration and risks
associated with this pathway. The modeling process is discussed in Attachment G.
3.3.2 ROUTE SPECIFIC INTAKE EQUATIONS
In the HHRA, exposure estimates reflect chemical concentration, assumed contact rate,
assumed exposure time, and estimated body weight in a term called "intake" or "dose",
which is an estimate based on their assumed intake rates, as provided in U.S. EPA
guidance. This sub-section of the report provides route of entry, specific intake
equations for the HHRA. The U.S. EPA source of the intake equation is provided with
each equation.
Chemicals with Potentially Carcinogenic Effects
Chemicals with potentially carcinogenic effects have varied and complex mechanism of
cancer development and exert effects at chemical specific levels through both thresholdand non-threshold mechanism (U.S. EPA, 1989). The U.S. EPA makes a number of
assumptions to simplify the HHRA process including the assumption that cancer caused
by an environmental chemical develops over a lifetime, requiring the development of an
average daily dose of a potentially carcinogenic COPC. It is further assumed that the
dose acts cumulatively over a lifetime of 70 years, giving an averaging time (AT) of
70 years for potentially carcinogenic chemicals.
Chemicals with Non-Carcinogenic Effects
All chemicals have non-carcinogenic effects, however, the toxicological action of each
chemical is varied and may work through different mechanisms, all of which are
considered by U.S. EPA to be threshold mechanism; meaning there is a level of exposure
that can be considered without adverse effect (U.S. EPA, 1989). The U.S. EPA makes a
number of assumptions to simplify the HHRA process for chemicals with
non-carcinogenic effects, including the assumption that each chemical impacts a specific
target organ and the intake occurs over an exposure period or averaging time. The
averaging time selected depends on the toxic endpoint being assessed.
018925(21) L-40 CONESTOGA-ROVERS & ASSOCIATES
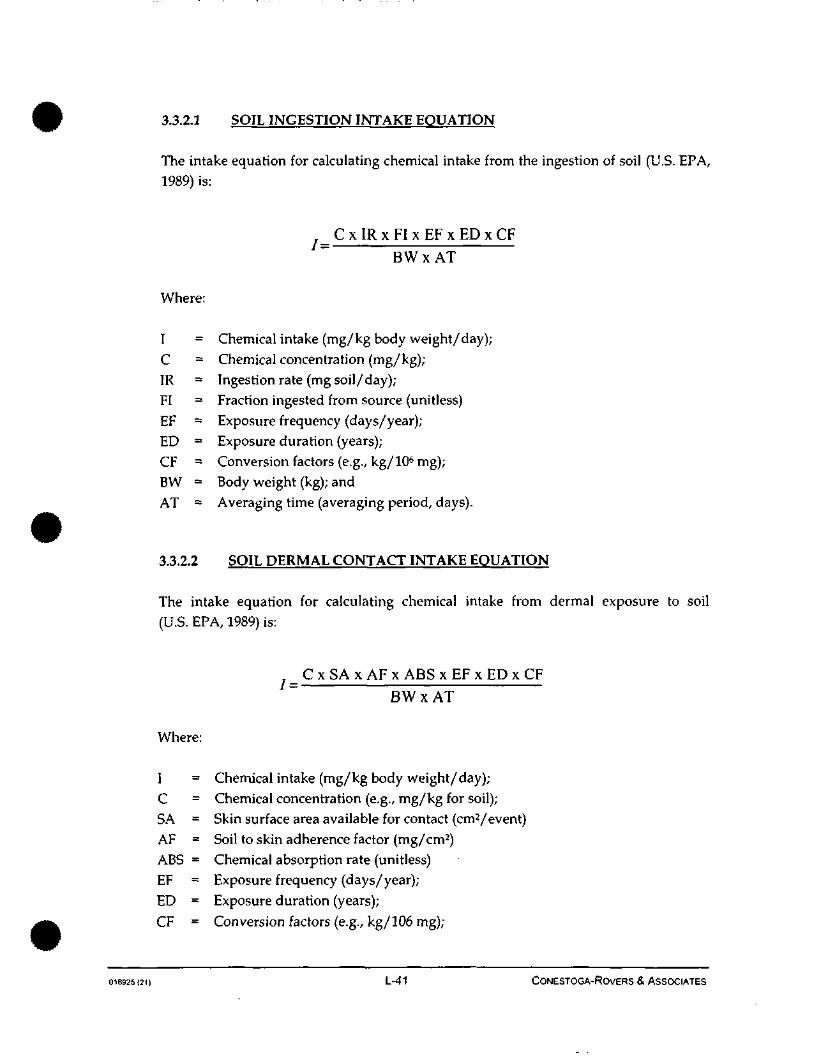
3.3.2.1 SOIL INGESTION INTAKE EQUATION
The intake equation for calculating chemical intake from the ingestion of soil (U.S. EPA,
1989) is:
C x I R x F I x E F x E D x C FBW x AT
Where:
I = Chemical intake (mg/kg body weight/day);
C = Chemical concentration (mg/kg);
IR = Ingestion rate (mg soil/day);
FI = Fraction ingested from source (unitless)
EF = Exposure frequency (days/year);
ED = Exposure duration (years);
CF = Conversion factors (e.g., kg/106 mg);
BW = Body weight (kg); and
AT = Averaging time (averaging period, days).
3.3.2.2 SOIL DERMAL CONTACT INTAKE EQUATION
The intake equation for calculating chemical intake from dermal exposure to soil
(U.S. EPA, 1989) is:
C x SA x AF x ABS x EF x ED x CF
~ BWxAT
Where:
I = Chemical intake (mg/kg body weight/day);
C = Chemical concentration (e.g., mg/kg for soil);
SA = Skin surface area available for contact (cm2/event)
AF = Soil to skin adherence factor (mg/cm2)
ABS = Chemical absorption rate (unitless)
EF = Exposure frequency (days/year);
ED = Exposure duration (years);
CF = Conversion factors (e.g., kg/106 mg);
018925(21) L-41 CoNESTOGA-RovERS & ASSOCIATES

BW = Body weight (kg); and
AT = Averaging time (averaging period, days).
3.3.2.3 SOIL VAPOR INHALATION FROM SOIL INTAKE EQUATION
The intake equation for calculating chemical intake from the inhalation of vapors from
soil (U.S. EPA, 2002b) is:
C x IR x ET x EF x ED
VF x BW x AT
Where:
I = Chemical intake (mg/kg body weight/day);
C = Chemical concentration in soil (e.g., mg/kg);IR = Inhalation rate (m3 air/hour);
ET = Exposure time (hours/day);
EF = Exposure frequency (days/year);
ED = Exposure duration (years);
VF = Volatilization Factor (m3/kg);
BW = Body weight (kg); and
AT = Averaging time (averaging period, days).
3.3.2.4 GROUNDWATER INGESTION INTAKE EQUATION
The intake equation for calculating chemical intake from the ingestion of water
(U.S. EPA, 1989) is:
C x IR x EF x EDB W x A T
Where:
I = Chemical intake (mg/kg body weight/day);
C = Chemical concentration (mg/L);
IR = Ingestion rate (L water/day);
EF = Exposure frequency (days/year);
018925(21) L-42 CONESTOGA-ROVERS & ASSOCIATES
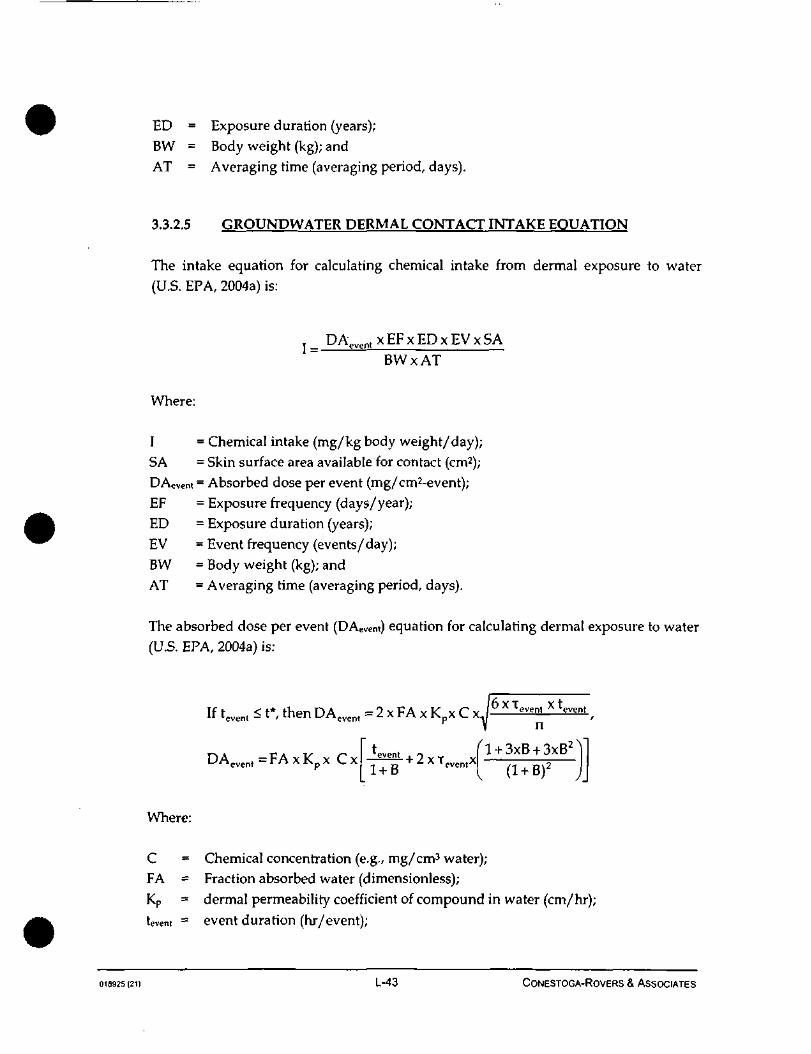
ED = Exposure duration (years);BW = Body weight (kg); andAT = Averaging time (averaging period, days).
3.3.2.5 GROUNDWATER DERMAL CONTACT INTAKE EQUATION
The intake equation for calculating chemical intake from dermal exposure to water(U.S. EPA, 2004a) is:
= DAevent x EF x ED x EV x 5ABWxAT
Where:
I = Chemical intake (mg/kg body weight/day);SA = Skin surface area available for contact (cm2);DAevent = Absorbed dose per event (mg/cm2-event);EF = Exposure frequency (days/year);ED = Exposure duration (years);EV = Event frequency (events/day);BW = Body weight (kg); andAT = Averaging time (averaging period, days).
The absorbed dose per event (DAeVent) equation for calculating dermal exposure to water(U.S. EPA, 2004a) is:
I ft Y T VIf tevent < t*, then DAevent = 2 x FA x Kpx C x.' cvent *
DA e v e n t =FAxK p x Cx event+ 2 X T„.,„„, X
+ 3xB + 3xB
n2 '
L1 + B
Where:
C = Chemical concentration (e.g., mg/cm3 water);FA = Fraction absorbed water (dimensionless);Kp = dermal permeability coefficient of compound in water (cm/hr);
tevent = event duration (hr/event);
018925(21) L-43 CONESTOGA-ROVERS & ASSOCIATES

"Writ = lag time per event (hr/event);t* = time to reach steady state (hr) = 2.4 x Tevent; andB = dimensionless ratio of permeability coefficient of a compound through the
stratum corneum relative to its permeability coefficient across the viableepidermis (dimensionless).
3.3.2.6 GROUNDWATER VAPOR INHALATION INTAKE EQUATION
The intake equation for calculating chemical intake from the inhalation of vapors fromgroundwater (U.S. EPA, 1989) is:
C x IR x ET x EF x ED x K~ B W x A T
Where:
I = Chemical intake (mg/kg body weight/day);C = Chemical concentration in groundwater (e.g., mg/L);IR = Inhalation rate (m3 air/hour);
ET = Exposure time (hours/day);EF = Exposure frequency (days/year);
ED = Exposure duration (years);K = Volatilization Factor (L/m3)BW = Body weight (kg); andAT = Averaging time (averaging period, days).
3.3.2.7 INDOOR AIR/AMBIENT AIR INHALATION INTAKE EQUATION
The intake equation for calculating chemical intake from the inhalation of indoor air orambient air (U.S. EPA, 1989) is:
£ x I R x E T x E F x E DBWxAT
Where:
I = Chemical intake (mg/kg body weight/day);
018925(21) L-44 CONESTOGA-ROVERS & ASSOCIATES

C = Chemical concentration in air (e.g., mg/m3);
IR = Inhalation rate (m3 air/hour);
ET = Exposure time (hours/day);
EF = Exposure frequency (days/year);
ED = Exposure duration (years);
BW = Body weight (kg); and
AT = Averaging rime (averaging period, days).
3.3.3 EXPOSURE ASSUMPTIONS
Different exposure scenarios were developed for each receptor population evaluated in
the HHRA. Descriptions of each exposure scenario and associated exposure
assumptions are presented in the following subsections.
Receptor characteristics had values assigned for RME and CT scenarios, based onU.S. EPA guidance. In some cases these values differed between scenarios
(e.g., exposure concentration, exposure frequency, etc.) and in other cases these values
were the same for both RME and CT scenarios (e.g., body weight, skin surface area, soil
ingestion rate, etc.). The assignment of receptor characteristics by scenarios followed
standard practices used by the U.S. EPA and risk assessment professionals. Where
default values were used, the value presented by U.S. EPA was selected. The specific
values used are presented, with the rationale provided, in the following sub-sech'ons.
3.3.3.1 AREA 1: INDUSTRIAL/COMMERCIAL WORKER - SOIL
Both a current and future industrial/commercial worker exposure to soil were evaluated
quantitatively in the HHRA. An industrial/commercial worker could come into contactwith soil in the areas identified in Section 1.2.1.1, but under current site conditions, the
frequency of exposure is likely to be low because the COPCs in soil are located distantfrom industrial production areas. However, no adjustment was made for this fact, and it
was assumed that a current and future industrial/commercial worker could contact soil
based on the exposure assumptions summarized here and in Table A.4.1 of
Attachment A:
• The exposure point concentrations used in the HHRA for soil, and soil derived
exposure pathways are discussed above.
016925(21) L-45 CoNESTOGA-RovERs & ASSOCIATES
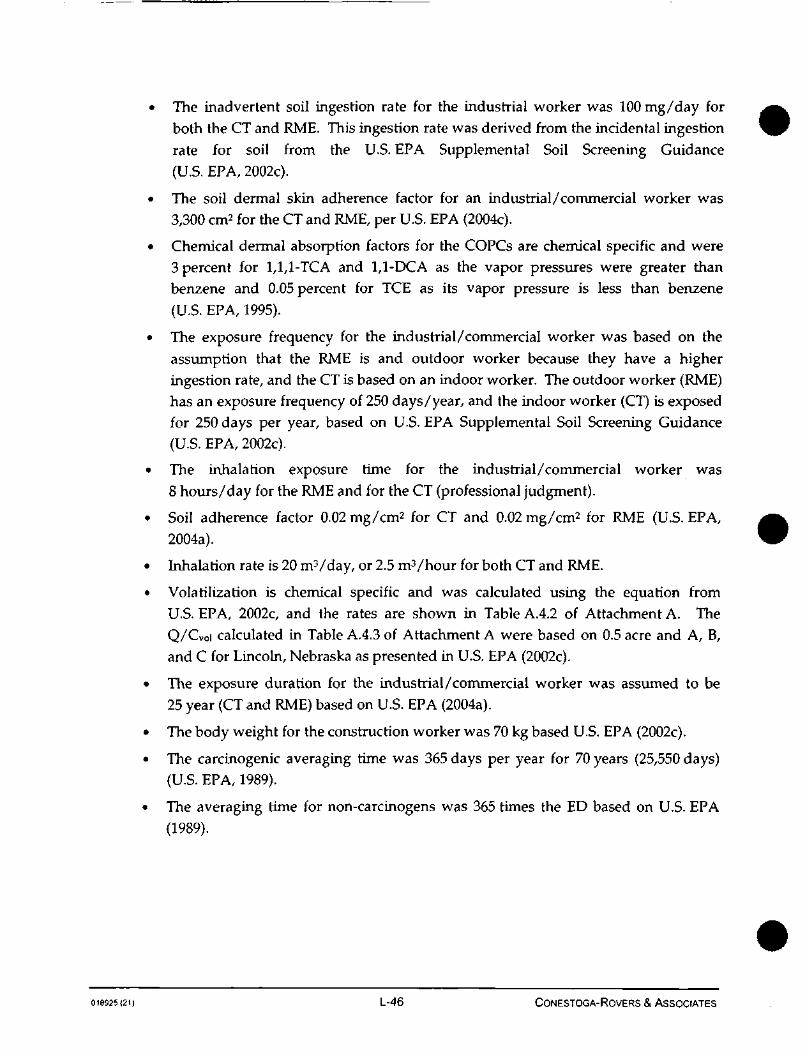
The inadvertent soil ingestion rate for the industrial worker was 100 mg/day for
both the CT and RME. This ingestion rate was derived from the incidental ingestion
rate for soil from the U.S. EPA Supplemental Soil Screening Guidance
(U.S. EPA, 2002c).
The soil dermal skin adherence factor for an industrial/commercial worker was3,300 cm2 for the CT and RME, per U.S. EPA (2004c).
Chemical dermal absorption factors for the COPCs are chemical specific and were
3 percent for 1,1,1-TCA and 1,1-DCA as the vapor pressures were greater thanbenzene and 0.05 percent for TCE as its vapor pressure is less than benzene
(U.S. EPA, 1995).
The exposure frequency for the industrial/commercial worker was based on the
assumption that the RME is and outdoor worker because they have a higheringestion rate, and the CT is based on an indoor worker. The outdoor worker (RME)
has an exposure frequency of 250 days/year, and the indoor worker (CT) is exposed
for 250 days per year, based on U.S. EPA Supplemental Soil Screening Guidance
(U.S. EPA, 2002c).
The inhalation exposure time for the industrial/commercial worker was
8 hours/day for the RME and for the CT (professional judgment).
Soil adherence factor 0.02 mg/cm2 for CT and 0.02 mg/cm2 for RME (U.S. EPA,
2004a).
Inhalation rate is 20 m3/day, or 2.5 m3/hour for both CT and RME.
Volatilization is chemical specific and was calculated using the equation from
U.S. EPA, 2002c, and the rates are shown in Table A.4.2 of Attachment A. The
Q/Cvoi calculated in Table A.4.3 of Attachment A were based on 0.5 acre and A, B,
and C for Lincoln, Nebraska as presented in U.S. EPA (2002c).
The exposure duration for the industrial/commercial worker was assumed to be25 year (CT and RME) based on U.S. EPA (2004a).
The body weight for the construction worker was 70 kg based U.S. EPA (2002c).
The carcinogenic averaging time was 365 days per year for 70 years (25,550 days)
(U.S. EPA, 1989).
The averaging time for non-carcinogens was 365 times the ED based on U.S. EPA
(1989).
018925(21) L-46 CONESTOGA-ROVERS & ASSOCIATES
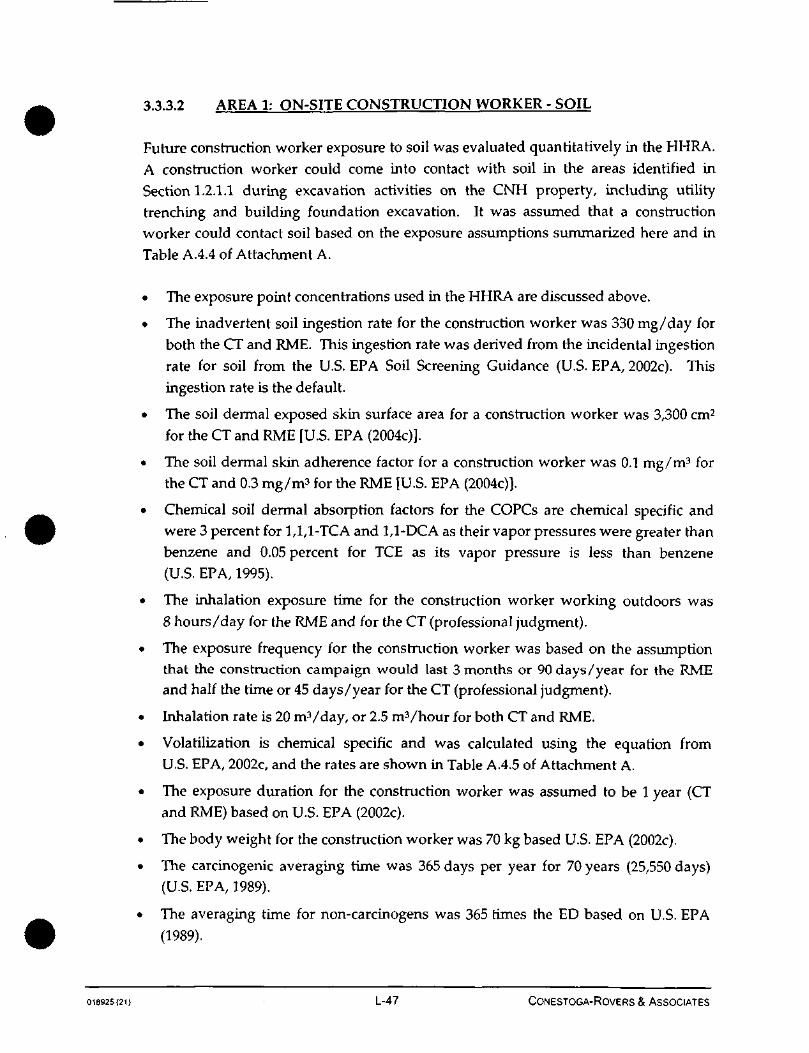
3.3.3.2 AREA 1: ON-SITE CONSTRUCTION WORKER - SOIL
Future construction worker exposure to soil was evaluated quantitatively in the HHRA.
A construction worker could come into contact with soil in the areas identified in
Section 1.2.1.1 during excavation activities on the CNH property, including utility
trenching and building foundation excavation. It was assumed that a construction
worker could contact soil based on the exposure assumptions summarized here and in
Table A.4.4 of Attachment A.
• The exposure point concentrations used in the HHRA are discussed above.
• The inadvertent soil ingestion rate for the construction worker was 330 mg/day for
both the CT and RME. This ingestion rate was derived from the incidental ingestion
rate for soil from the U.S. EPA Soil Screening Guidance (U.S. EPA, 2002c). This
ingestion rate is the default.
• The soil dermal exposed skin surface area for a construction worker was 3,300 cm2
for the CT and RME [U.S. EPA (2004c)].
• The soil dermal skin adherence factor for a construction worker was 0.1 mg/m3 forthe CT and 0.3 mg/m3 for the RME [U.S. EPA (2004c)].
• Chemical soil dermal absorption factors for the COPCs are chemical specific andwere 3 percent for 1,1,1-TCA and 1,1-DCA as their vapor pressures were greater than
benzene and 0.05 percent for TCE as its vapor pressure is less than benzene(U.S. EPA, 1995).
• The inhalation exposure time for the construction worker working outdoors was
8 hours/day for the RME and for the CT (professional judgment).
• The exposure frequency for the construction worker was based on the assumptionthat the construction campaign would last 3 months or 90 days/year for the RMEand half the time or 45 days/year for the CT (professional judgment).
• Inhalation rate is 20 m3/day, or 2.5 mVhour for both CT and RME.
• Volatilization is chemical specific and was calculated using the equation fromU.S. EPA, 2002c, and the rates are shown in Table A.4.5 of Attachment A.
• The exposure duration for the construction worker was assumed to be 1 year (CTand RME) based on U.S. EPA (2002c).
• The body weight for the construction worker was 70 kg based U.S. EPA (2002c).
• The carcinogenic averaging time was 365 days per year for 70 years (25,550 days)(U.S. EPA, 1989).
• The averaging time for non-carcinogens was 365 times the ED based on U.S. EPA
(1989).
018925(21) L-47 CONESTOGA-ROVERS & ASSOCIATES
3.3.3.3 AREA1: ON-SITE CONSTRUCTION WORKER -GROUNDWATER
From time to time, limited excavation activities may occur on the CNH Property.Groundwater at the CNH Property is located on average at 17 feet bgs and it is unlikelythat a construction worker exposure be exposed to groundwater, so direct exposure togroundwater was not evaluated in the HHRA.
In addition, excavation activities on the property were assumed to involve both utilitytrenching and building foundation excavation. Both of these scenarios were assumednot to contact groundwater at depth, and vapor were assumed to migrate into the trenchthrough soil. It was assumed that the construction worker would be exposed togroundwater only through exposure to groundwater vapor while excavating andworking within the excavation areas. Table A.4.6 of Attachment A summarizes theassumptions used to calculate the construction worker exposure during constructionactivities. The exposure assumptions are as follows:
• The exposure point concentrations were calculated as described above. For theinhalation exposure component to ambient air from groundwater that may havebeen exposed during excavation activities, the COPC concentrations in ambient airwere modeled using the ASTM (1998) methodology presented with the results inTables A.4.7 and A.4.9. The modeled ambient air concentration was used for bothRME and CT exposure scenarios.
• The inhalation rate for the construction worker was 2.5 m3/hour, based on anaverage inhalation rate of 20 m3/work-day (U.S. EPA, 2002c).
• The exposure frequency for the construction worker was based on the assumptionthat the construction campaign would last 3 months or 90 days/year for the RMEand half the time or 45 days/year for the CT (professional judgment).
• The inhalation exposure time for the construction worker in a trench or buildingfoundation was 8 hours/day.
• The exposure duration for the construction worker was assumed to be 1.0 year (CTand RME) (professional judgment).
• The body weight for the construction worker was 70 kg based U.S. EPA (2002c).
• The carcinogenic averaging time was 365 days per year for 70 years (25,550 days)(U.S. EPA, 1989).
018925 (il) L-48 CONESTOGA-ROVERS & ASSOCIATES
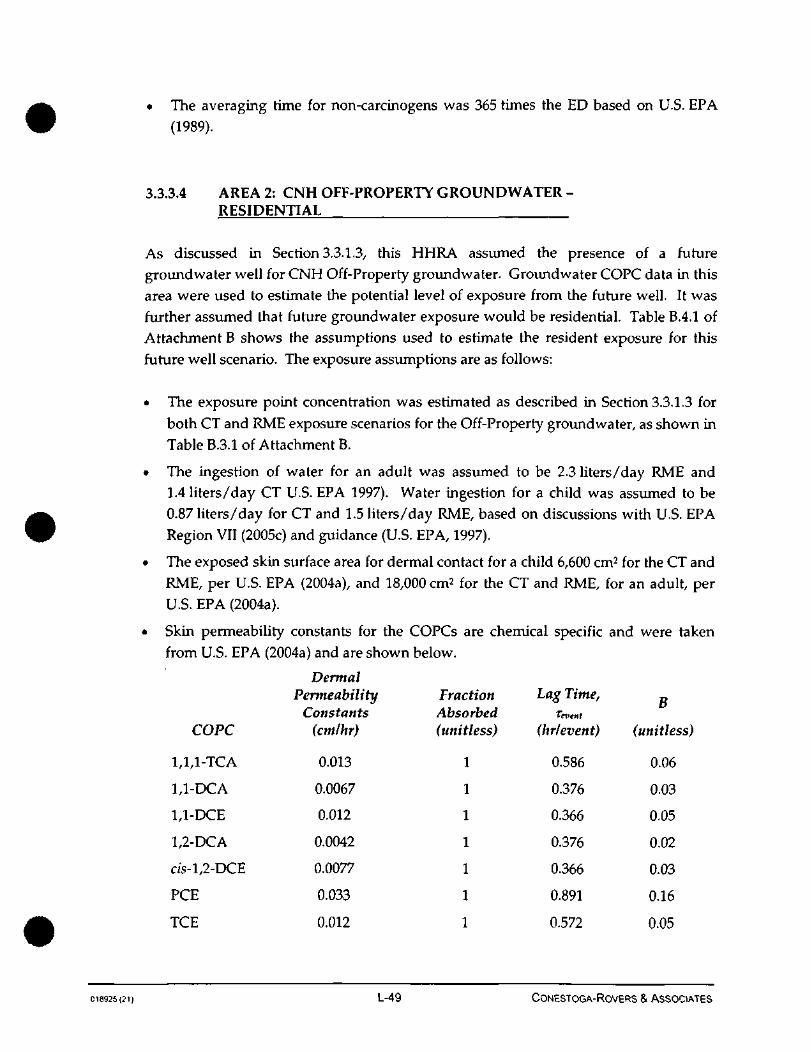
The averaging time for non-carcinogens was 365 times the ED based on U.S. EPA(1989).
3.3.3.4 AREA 2: CNH OFF-PROPERTY GROUNDWATER -RESIDENTIAL
As discussed in Section 3.3.1.3, this HHRA assumed the presence of a futuregroundwater well for CNH Off-Property groundwater. Groundwater COPC data in thisarea were used to estimate the potential level of exposure from the future well. It wasfurther assumed that future groundwater exposure would be residential. Table B.4.1 ofAttachment B shows the assumptions used to estimate the resident exposure for thisfuture well scenario. The exposure assumptions are as follows:
• The exposure point concentration was estimated as described in Section 3.3.1.3 forboth CT and RME exposure scenarios for the Off-Property groundwater, as shown inTable B.3.1 of Attachment B.
• The ingesrion of water for an adult was assumed to be 2.3 liters/day RME and1.4 liters/day CT U.S. EPA 1997). Water ingesrion for a child was assumed to be0.87 liters/day for CT and 1.5 liters/day RME, based on discussions with U.S. EPARegion VII (2005c) and guidance (U.S. EPA, 1997).
• The exposed skin surface area for dermal contact for a child 6,600 cm2 for the CT andRME, per U.S. EPA (2004a), and 18,000 cm2 for the CT and RME, for an adult, perU.S. EPA (2004a).
• Skin permeability constants for the COPCs are chemical specific and were takenfrom U.S. EPA (2004a) and are shown below.
Dermal
COPC
1,1,1-TCA
1,1-DCA
1,1-DCE
1,2-DCA
c/s-l,2-DCE
PCE
TCE
PermeabilityConstants
(cm/hr)
0.013
0.0067
0.012
0.0042
0.0077
0.033
0.012
FractionAbsorbed(unitless)
I
1
1
1
1
1
1
Lag Time,Tevent
(hr/ event)
0.586
0.376
0.366
0.376
0.366
0.891
0.572
B
(unitless)
0.06
0.03
0.05
0.02
0.03
0.16
0.05
018925(21) L-49 CONESTOGA-ROVERS & ASSOCIATES
Indoor air COPC concentrations from groundwater that may have been used duringshowering and bathing and the COPC concentrations in indoor air within thebathroom were modeled using a Volatilization Factor (U.S. EPA, 1991).
The inhalation rate for the child was 10 mVday for CT and RME (U.S. EPA, 1997),and the inhalation rate for an adult was 20 m3/day for CT and RME(U.S. EPA, 1991).
The child exposure time for dermal exposure was 0.33 hr/day for CT and 1.0 hr/dayfor RME. The adult exposure time for dermal exposure was 0.25 hr/day for CT and0.58 hr/day for RME. (U.S. EPA, 2004a).
The future exposure duration for a resident was assumed to be 30 years: 6 years as achild and 24 years as an adult for the RME and 9 years: 6 years as a child and 3 yearsas an adult for the CT. For non-carcinogenic, exposure duration was 9 and 30 yearsfor the CT and RME, respectively for the adult and 6 years for both CT and RME forthe child.
The exposure frequency for the child and adult resident was 350 days/year. Thisfrequency was based on the assumption that an individual would spend all year atone residence, with the exception of a 2-week vacation elsewhere.
The body weight for the child was 15 kg based on U.S. EPA (2002b), and 70 kg for anadult based on U.S. EPA (2004a).
The carcinogenic averaging time was 365 days per year for 70 years (25,550 days).
The averaging time for non-carcinogens was 365 times 30 years.
3.3.3.5 AREA 2: CNH OFF-PROPERTY GROUNDWATER -INDOOR AIR
Table B.4.2 of Attachment B shows the assumptions used to estimate the residentexposure to indoor air volatilizing from the groundwater. The exposure assumptionsare as follows:
• The exposure point concentration was estimated as described in Section 3.3.1.3 forboth CT and RME exposure scenarios for the Off-Property groundwater, as shown inTable B.3.1 of Attachment B. Indoor air COPC concentrations from groundwaterwas modeled using the J&E model and the RME exposure point concentrationspresented in Table B.3.1 of Attachment B. A detailed description of the indoor airmodeling is presented in Attachment G.
018925(21) L-50 • CONESTOGA-ROVERS & ASSOCIATES

The inhalation rate for the child was 10 mVday for CT and RME (U.S. EPA, 1997),and the inhalation rate for an adult was 20 m3/day for CT and RME
(U.S. EPA, 1991).
The body weight for the child was 15 kg based on U.S. EPA (2002b), and 70 kg for an
adult based on U.S. EPA (2004a).
The future exposure duration for a resident was assumed to be 30 years: 6 years as a
child and 24 years as an adult for the RME and 9 years: 6 years as a child and 3 yearsas an adult for the CT. For non-carcinogenic, exposure duration was 9 and 30 years
for the CT and RME, respectively for the adult and 6 years for both CT and RME for
the child.
The exposure frequency for the child and adult resident was 350 days/year. This
frequency was based on the assumption that an individual would spend all year atone residence, with the exception of a 2-week vacation elsewhere.
The carcinogenic averaging time was 365 days per year for 70 years (25,550 days).
The averaging time for non-carcinogens was 365 times 30 years.
3.3.3.6 AREA 2: CNH OFF-PROPERTY GROUNDWATER -CHILD POOL
Table B.4.3 of Attachment B shows the assumptions used to estimate the child residentexposure for the child pool exposure scenario. The exposure assumptions are as follows:
• The exposure point concentration was estimated as described in Section 3.3.1.3 for
both CT and RME exposure scenarios for the Off-Property groundwater, as shown in
Table B.3.1 of Attachment B. Details of the assumptions are shown in Table B.4.3,with ambient air modeling presented in Attachment H.
• The incidental ingestion of the pool water for a child was assumed to be
0.05 liters/day for both CT and RME (U.S. EPA, 1989).
• The exposed skin surface area for dermal contact for a child 6,600 cm2 for the CT andRME, per U.S. EPA (2004a).
• The inhalation rate for the child was 1 m3/hr for CT and RME (U.S. EPA, 1997;
Table 5-23).
• Skin permeability constants for the COPCs are chemical specific and were taken
from U.S. EPA (2004a) and are shown above in Section 3.3.3.4.
018925(21) L-51 CONESTOGA-ROVERS & ASSOCIATES
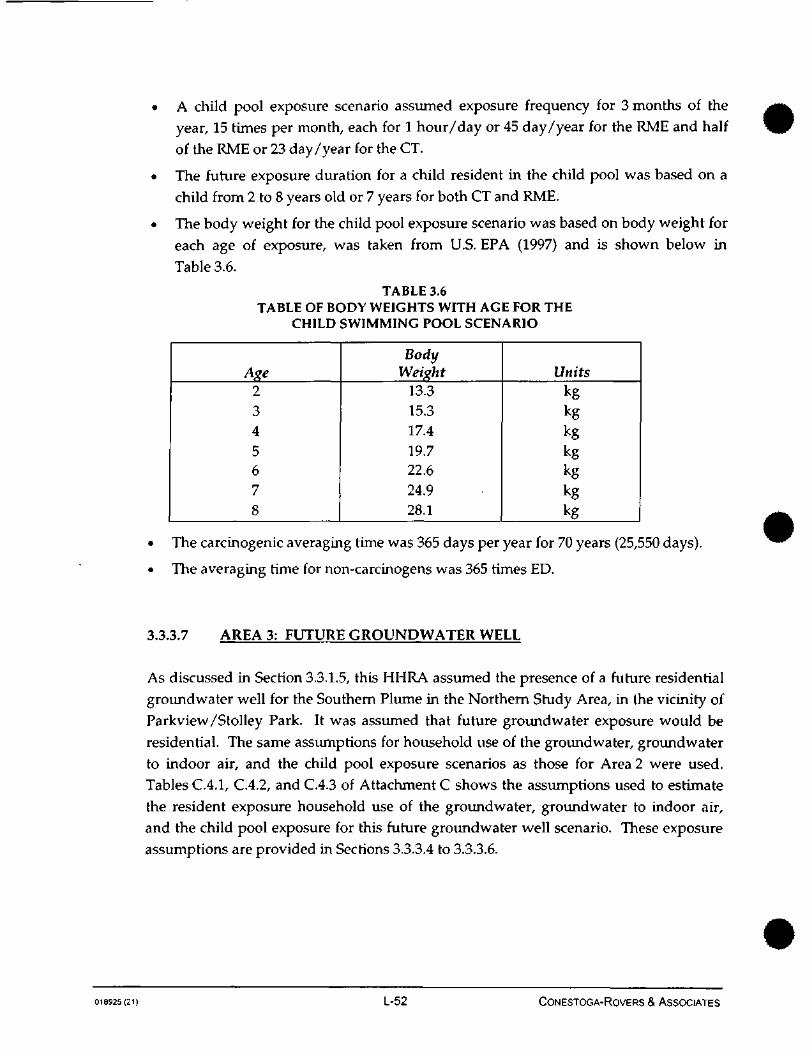
A child pool exposure scenario assumed exposure frequency for 3 months of theyear, 15 times per month, each for 1 hour/day or 45 day/year for the RME and halfof the RME or 23 day/year for the CT.
The future exposure duration for a child resident in the child pool was based on achild from 2 to 8 years old or 7 years for both CT and RME.
The body weight for the child pool exposure scenario was based on body weight foreach age of exposure, was taken from U.S. EPA (1997) and is shown below inTable 3.6.
TABLE 3.6TABLE OF BODY WEIGHTS WITH AGE FOR THE
CHILD SWIMMING POOL SCENARIO
Age2
345678
BodyWeight
13.315.317.419.722.624.928.1
Unitskgkgkgkgkgkgkg
The carcinogenic averaging time was 365 days per year for 70 years (25,550 days).
The averaging time for non-carcinogens was 365 times ED.
3.3.3.7 AREA 3: FUTURE GROUNDWATER WELL
As discussed in Section 3.3.1.5, this HHRA assumed the presence of a future residentialgroundwater well for the Southern Plume in the Northern Study Area, in the vicinity ofParkview/Stolley Park. It was assumed that future groundwater exposure would beresidential. The same assumptions for household use of the groundwater, groundwaterto indoor air, and the child pool exposure scenarios as those for Area 2 were used.Tables C.4.1, C.4.2, and C.4.3 of Attachment C shows the assumptions used to estimatethe resident exposure household use of the groundwater, groundwater to indoor air,and the child pool exposure for this future groundwater well scenario. These exposureassumptions are provided in Sections 3.3.3.4 to 3.3.3.6.
018925(21) L-52 CONESTOGA-ROVERS & ASSOCIATES
4.0 TOXICITY ASSESSMENT
The toxicity assessment weighs the available information regarding the potential for a
particular COPC to cause adverse effects in exposed individuals and estimates the extent
of exposure and possible severity of adverse effects. To develop toxicity values, two
steps are taken: hazard identification and dose-response assessment. The hazard
identification determines the potential adverse effects associated with exposure to a
COPC. In the dose-response assessment, numerical toxicity values are determined or
selected from the available toxicity data.
The U.S. EPA (2003) has recommended a hierarchy for the selection of toxicological
criteria in the risk assessment process. This hierarchy was followed to the fullest extentpossible, in this HHRA:
• Tier 1 - U.S. EPA's IRIS;
• Tier 2 — U.S. EPA's Provisional Peer Reviewed Toxicity Values (PPRTVs); and
• Tier 3 - Other Toxicity Values.
U.S. EPA's Region IX PRG tables (U.S. EPA, 2004b) were used extensively as a Tier 3
source of toxicity values, even though these are considered a secondary source. Other
Tier 3 sources included the U.S. EPA's Health Effects Summary Tables (HEAST, 1997),
the National Center for Exposure Assessment, California EPA and the Agency for Toxic
Substances and Disease Registry (ATSDR, 2005).
As toxicological information becomes available on chemical compounds and elements
the U.S. EPA will update its IRIS database by withdrawing toxicity values and listingnew ones. Occasionally toxicity values are withdrawn before a replacement value is
approved through the extensive peer review process used by U.S. EPA. For this risk
assessment the toxicity values for PCE and TCE are impacted by the lack of toxicity
values listed in IRIS because PCE is one of the primary COPCs driving the risks in the
HHRA, and the toxicity values for TCE is high, giving high levels of risk with low levels
of TCE.
The dose-response data for PCE recommended by the U.S. EPA's Office of Solid Waste
and Emergency Response on June 13, 2003 has been used in this HHRA, no value is
available in IRIS. This value is consistent with the California EPA values (OEHHA,
2001). The lack of adequate peer review to list the PCE toxicity in IRIS will increase the
uncertainty in the risk assessment process.
018925(21) L-53 CONESTOGA-ROVERS & ASSOCIATES
A provisional cancer slope factor for TCE was developed by U.S. EPA in their,
"Trichloroethene Health Risk Assessment: Synthesis and Characterization" U.S. EPA 2001b).This document and the associated slope factor have been the subject of controversy and
peer review since it was issued. The potential uncertainty in this risk characterization
and slope factor have been recognized by Region VII, who requested that TCE be
evaluated by the slope factor listed in the risk characterization and the slope factor that
was withdrawn from the IRIS database by U.S. EPA. This withdrawn value is close to
the slope factor for TCE currently being used by CalEPA (2002). Using two slope factors
allows for the full range of potential risks to be quantified for TCE.
4.1 NON-CARCINOGENIC HAZARDS
All chemicals have non-carcinogenic effects, or can adversely affect the body at some
level of exposure, even distilled water. Therefore, it is important to determine the level
at which an adverse effect might occur.
For substances that have non-carcinogenic effects, the HHRA process distinguishes
between acute and chronic exposure, and associated acute and chronic health effects. In
this HHRA process, where exposures are assumed to be chronic, health criteria are
usually expressed as chronic intake levels [in units of milligrams of COPC per kilogram
body weight per day (mg/(kg-day)j, and are compared to levels below which no
adverse effects are expected, or a Reference Dose (RfD). In other words, there is a
threshold level of exposure to a COPC below which no toxic effects are expected. In
contrast to the toxicological model used to assess carcinogenic risk, which assumes there
is no concentration threshold, the non-carcinogenic dose-response model postulates a
"threshold".
In this risk assessment, both chronic and sub-chronic RfDs (construction worker
exposure only) are used as the toxicity values for non-carcinogenic health effects. A
chronic RfD is defined as, "An estimate (with uncertainty spanning an order of
magnitude or greater) of a daily exposure level for the human population, including
sensitive sub-populations, that is likely to be without appreciable risk of deleterious
effects during a lifetime". Uncertainty factors are incorporated into the RfDs to account
for extrapolations from animal toxicity data, data quality, and to protect sensitive
sub-populations. The basis of an RfD is usually the highest dose level administered to
laboratory animals that did not cause observable adverse effects after chronic exposure.
This is called the No-Observed Adverse Effect Level (NOAEL). The NOAEL is then
divided by uncertainty factors, and sometimes an additional modifying factor, to obtain
the RfD. In general, an uncertainty factor of 10 is used to account for interspecies
O i 8 9 2 5 ( ? i ) L-54 CONESTOGA-ROVERS & ASSOCIATES

variation and another factor of 10 to account for sensitive human populations.
Additional factors of 10 are included in the uncertainty factor if the RfD is based on the
Lowest Observed Adverse Effect Level (LOAEL) instead of the NOAEL, or if data
inadequacies are present (e.g., the experiment for which the RfD was derived had less
than lifetime exposure). The LOAEL is the dose level administered to laboratory
animals that causes the lowest adverse effect (i.e., liver toxicity - although this is species
and chemical-specific) after chronic exposure.
Sub-chronic RfD are similar to chronic RfD, but are used for shorter periods of exposure
(2 weeks to 7 years) and incorporate similar uncertainty and/or modifying factors to the
NOAELs from animal studies. Sub-chronic toxicity data, if available, were applied to
the construction worker exposure to soil and groundwater.
Table 4.1, presents the non-carcinogenic toxicity data (RfDs) used to estimate human
health effects for oral and dermal exposure routes for all exposure areas. The dermal
toxicity data presented in Table 4.1 was adjusted consistent with U.S. EPA (2004a)
guidance. Table 4.2 presents RfDs used for the inhalation exposure route for all
exposure areas.
4.2 CARCINOGENIC RISKS
Cancer Slope Factors (CSFs) are quantitative dose-response factors used to estimate risk
from chemicals with potential carcinogenic effects. Slope factors relate the probability of
excess cancers, over background, to the l i fet ime average exposure dose of a substance.
CSFs are typically estimated from animal carcinogenicity study dose-response data
using mathematical extrapolation models, to relate animal exposure at high doses topotential adverse effects in humans at low dose, and are presented as the reciprocal of
dose risk, or 1 divided by milligram of COPC/(kilogram body weight-day)
[i.e., (mg/kg-day)-1]. U.S. EPA's cancer risk assessment guideline (U.S. EPA, 2005)
emphasize that a chemical's mode of action is important when developing cancer slope
factors for chemicals in the IRIS database. The 2005 guidelines also consider weight of
evidence, structure activity relationships, and tumor type when evaluating a chemical.
Mathematical models are still proposed to extrapolate high dose animal data to low dose
human effect, but these models will be selected based on a number of chemical specific
factors.
The slope factors used in this HHRA were developed using guidance from prior to 2005.
Many of these models assume low dose-response linearity and thus may not be
018925(21) L-55 CONESTOGA-ROVERS & ASSOCIATES
appropriate for some suspected carcinogens, in particular those that function as cancerpromoters, and chemicals that act through threshold mechanisms.
Known or suspect human carcinogens have been evaluated and identified by theCarcinogen Assessment Group using the U.S. EPA Weight-of-Evidence approach forcarcinogenicity classification (HEAST, 1997). The U.S. EPA classification is based on anevaluation of the likelihood that the agent is a human carcinogen. The evidence ischaracterized separately for human and animal studies as follows:
Group A - Known Human Carcinogen (sufficient evidence of carcinogenicity inhumans);
Group B - Probable Human Carcinogen (Bl - limited evidence of carcinogenicity inhumans; B2 - sufficient evidence of carcinogenicity in animals withinadequate or lack of evidence in humans);
Group C - Possible Human Carcinogen (limited .evidence of carcinogenicity inanimals and inadequate or lack of human data);
Group D - Not Classifiable as to Human Carcinogenicity (inadequate or no evidence);and
Group E - Evidence of Non-carcinogenicity for Humans (no evidence ofcarcinogenicity in animal studies).
The COPCs were classified util izing the U.S. EPA system. Table 4.3 presents the cancertoxicity data (CSFs) used in the HHRA to estimate the risk of cancer for the oral anddermal exposure routes for ail exposure areas. The dermal toxicity data presented inTable 4.3 was adjusted consistent with U.S. EPA (2004a) guidance. Table 4.4 presentsCSFs for the inhalation exposure route for all exposure areas.
4.3 TOXICOLOGICAL SUMMARIES FOR THE COPCs
A detailed toxicologically summary for the COPCs is provided in Attachment I.
018925 (2i) L-56 CoNESTOGA-RovERS & ASSOCIATES
5.0 RISK CHARACTERIZATION
The objective of this risk characterization is to integrate information developed in the
Exposure Assessment (Section 3.0), for complete exposure pathways, for detected
COPCs that may have exceeded screening levels, and the Toxicity Assessment
(Section 4.0) into an evaluation of the potential human health risks associated with
exposure to potentially contaminated groundwater and air in the area. The methods
used in this risk characterization are based on U.S. EPA guidance for human exposures
(U.S. EPA, 1989,1991a, 1997, 2001, 2002a, 2002b, 2004a).
5.1 HAZARD ESTIMATES
The potential for non-cancer health effects from exposure to a COPC is evaluated by
comparing an exposure level over a specified time period to the RfD for the COPC over
a similar exposure period. This ratio, termed the hazard quotient, is calculatedaccording to the following general equation:
RfD
Where:
HQ = The Hazard Quotient (unitless) is the ratio of the exposure dose of a chemical
to a reference dose not expected to cause adverse effects from a lifetime
exposure. A hazard quotient equal to or below 1.0 is considered protective ofhuman health2.
CDI = The Chronic Daily Intake is the chemical dose calculated by applying theexposure scenario assumptions and expressed as mg/(kg-day). The intake
represents the average daily chemical dose over the expected period of
exposure.
RfD = The Reference Dose is a daily dose believed not to cause an adverse effect from
even a lifetime exposure [mg/(kg-day)].
COPCs may exert a toxic effect on different target organs, however, for the purposes of
this risk assessment, non-carcinogenic effects were not differentiated for each target
organ. This assumption implies that all chemicals act at the same target organ, which
" Wliere the cumulative carcinogenic site risk to an individual based on reasonable maximum exposure forboth current and future land use is less than 104 and the non-carcinogenic hazard quotient is less than 1,action generally is not warranted unless there are adverse environmental impacts." (U.S. EPA, 1991)
018925(21) L-57 CONESTOGA-ROVERS & ASSOCIATES

may not be the case, and is a default assumption. This summation is called the Hazard
Index (HI) and is the sum of HQs for individual COPCs for a specific exposure scenario.
Non-cancer risk estimates for children (6 years of exposure) and adults [9 years (CT) and
30 years (RME) of exposure] were estimated separately, and the results are provided
separately.
5.2 CANCER RISK ESTIMATES
Cancer risk estimates are calculated utilizing the following general equation:
Excess Lifetime Cancer Risk = LADD x CSF
Where:
Cancer Risk = Estimated upper bound on additional risk of cancer over a lifetime inan individual exposed to the carcinogen for a specified exposure
period (unitless).
LADD = The Lifetime Average Daily Dose of the chemical calculated using
exposure scenario assumptions and expressed in mg/(kg-day). Theintake represents the total lifetime chemical dose averaged over an
individual expected lifetime of 70 years.
CSF = The Cancer Slope Factor models the potential carcinogenic response
and is expressed as [mg/(kg-day)]-1.
Exposure scenarios may involve potential exposure to more than one carcinogen. To
represent the potential carcinogenic effects posed by exposure to multiple carcinogens, it
is assumed, in the absence of information on synergistic or antagonistic effects, that
these risks are additive. For estimating cancer risks from exposure to multiple
carcinogens from a single exposure route, the following equation is used:
NRiskT = Risk)
016g25(21) L-58 CONESTOGA-ROVERS & ASSOCIATES
Where:
Risky = Total cancer risk from route of exposure
Riski = Cancer risk for the chemical
N = Number of chemicals
The cumulative potential carcinogenic risk estimates are presented and discussed in
Section 5.3. Risk estimates were for a combination of child (6 years) and adult (24 years)
exposure. The potential cumulative risks resulting from exposure to the COPCs are
compared to the target cumulative target risk range provided by U.S. EPA of 1 x 1CH or
1 in 10,000 to 1 x 10⁻⁶ or 1 in 1,000,000, as indicated by U.S. EPA, "Where the cumulative
carcinogenic site risk to an individual based on reasonable maximum exposure for both current
and future land use is less than 1Q-4 and the non-carcinogenic hazard quotient is less than I,
action generally is not warranted unless there are adverse environmental impacts." (U.S. EPA,
1991)
5.3 RISK QUANTIFICATION SUMMARY
The hazard indices and excess lifetime cancer risks for the various exposure scenarios
for each area evaluated in the HHRA are presented below. Note that only media and
exposure pathways for which the COPCs exceeded screening levels have been includedfor each area.
5.3.1 AREA 1: CNH PROPERTY INDUSTRIAL WORKER
The industrial worker scenario for the CNH Property assumes that a worker will be
exposed to soil, but not groundwater, at the rates specified in the exposure assessmentsection of the HHRA. Table 5.1 below shows the excess lifetime cancer risk and
non-cancer hazard index for the industrial/commercial workers, for both RME and CTexposures. These estimates are an aggregate or sum of all exposure pathways quantified
for this receptor, soil ingestion, dermal contact with soil, and the inhalation of vapors in
ambient air from the soil. The potentially carcinogenic COPCs 1,1-DCA and TCE are
responsible for the risk from soil. The summed risk is less than one in one million(1 x 10⁻⁶). 1,1,1-TCA, 1,1-DCA, and PCE are responsible for the non-cancer hazard index,
which is less than one.
018925(21) L-59 CONESTOGA-ROVERS & ASSOCIATES
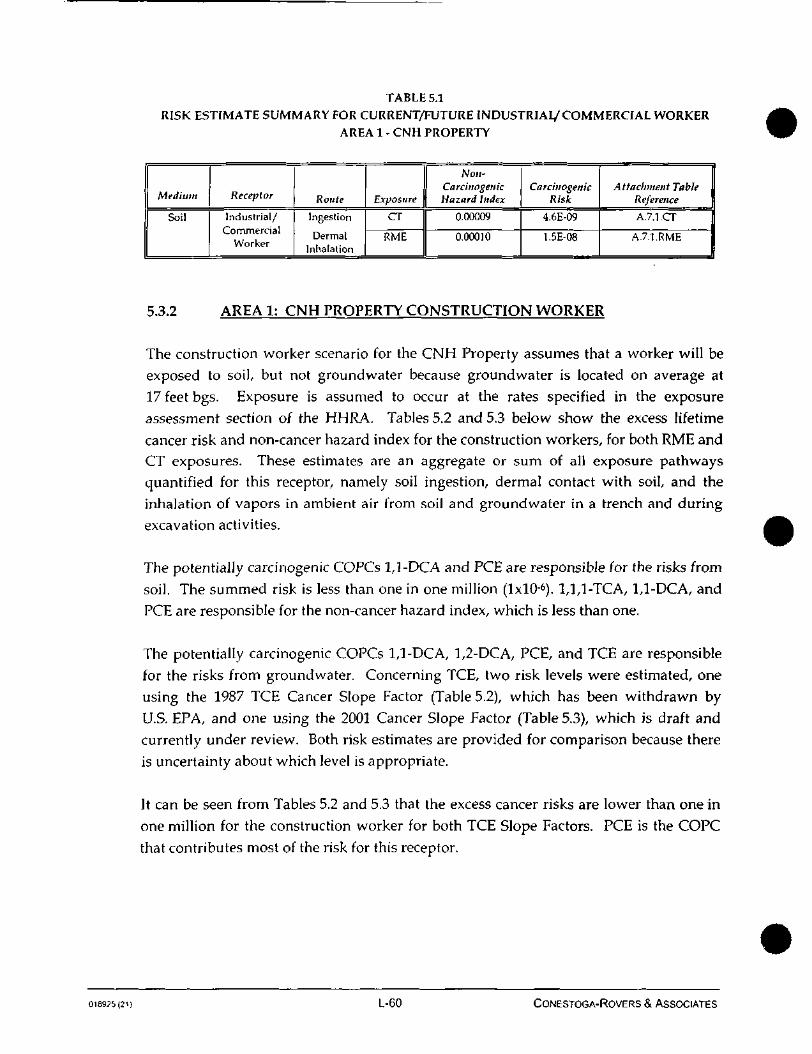
TABLE 5.1
RISK ESTIMATE SUMMARY FOR CURRENT/FUTURE INDUSTRIAL/ COMMERCIAL WORKER
AREA 1 - CNH PROPERTY
Medium
Soil
Receptor
Industrial/Commercial
Worker
Route
Ingestion
DermalInhalat ion
Exposure
CT
RME
Noit-CarcinogenicHazard Index
0.00009
0.00010
CarcinogenicRisk
4.6E-09
1.5E-08
Attachment TableReference
A.7.1.CT
A.7.1.RME
5.3.2 AREA 1: CNH PROPERTY CONSTRUCTION WORKER
The construction worker scenario for the CNH Property assumes that a worker will beexposed to soil, but not groundwater because groundwater is located on average at17 feet bgs. Exposure is assumed to occur at the rates specified in the exposureassessment section of the HHRA. Tables 5.2 and 5.3 below show the excess lifetimecancer risk and non-cancer hazard index for the construction workers, for both RME andCT exposures. These estimates are an aggregate or sum of all exposure pathwaysquantified for this receptor, namely soil ingestion, dermal contact with soil, and theinhalation of vapors in ambient air from soil and groundwater in a trench and duringexcavation activities.
The potentially carcinogenic COPCs 1,1-DCA and PCE are responsible for the risks fromsoil. The summed risk is less than one in one million (IxlO6). 1,1,1-TCA, 1,1-DCA, andPCE are responsible for the non-cancer hazard index, which is less than one.
The potentially carcinogenic COPCs 1,1-DCA, 1,2-DCA, PCE, and TCE are responsiblefor the risks from groundwater. Concerning TCE, two risk levels were estimated, oneusing the 1987 TCE Cancer Slope Factor (Table 5.2), which has been withdrawn byU.S. EPA, and one using the 2001 Cancer Slope Factor (Table 5.3), which is draft andcurrently under review. Both risk estimates are provided for comparison because thereis uncertainty about which level is appropriate.
It can be seen from Tables 5.2 and 5.3 that the excess cancer risks are lower than one inone million for the construction worker for both TCE Slope Factors. PCE is the COPCthat contributes most of the risk for this receptor.
018925(21) L-60 CONESTOGA-ROVERS & ASSOCIATES
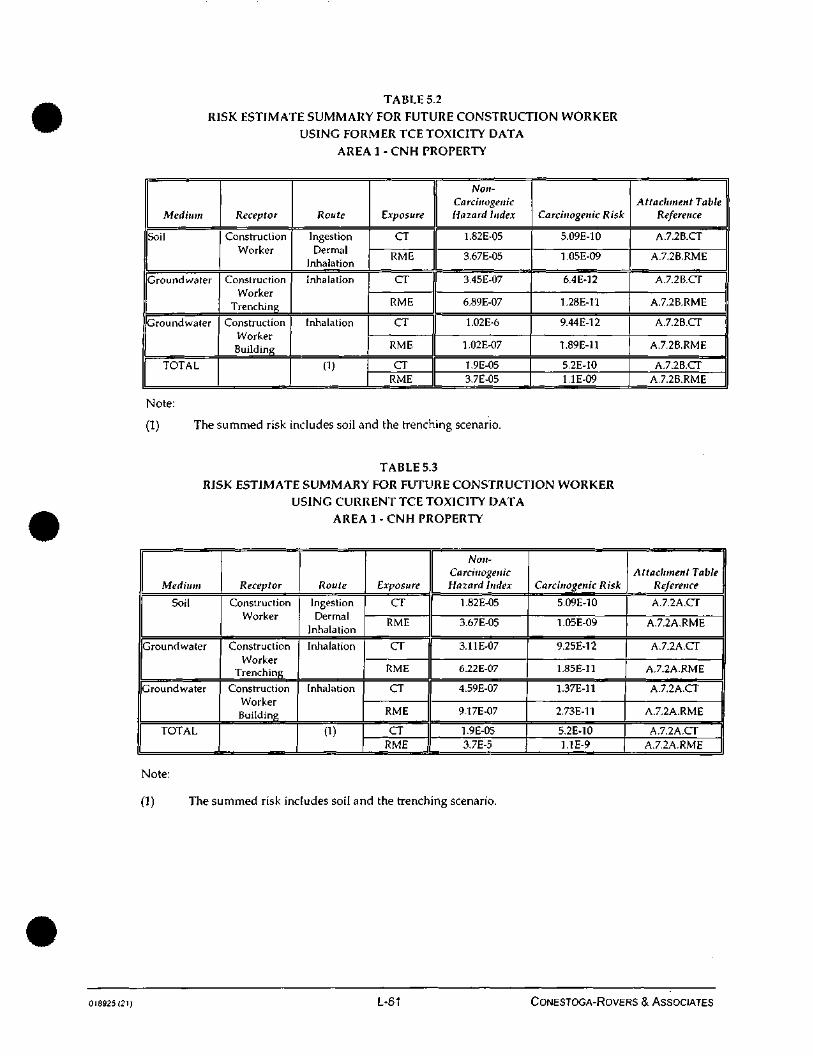
TABLE 5.2
RISK ESTIMATE SUMMARY FOR FUTURE CONSTRUCTION WORKER
USING FORMER TCE TOXICITY DATA
AREA 1 - CNH PROPERTY
Medium
Soil
Groundwater
Groundwater
TOTAL
Receptor
ConstructionWorker
ConstructionWorker
Trenching
ConstructionWorkerBuilding
Route
IngestionDermal
Inhalation
Inhalation
Inhalation
0)
Exposure
CT
RME
CT
RME
CT
RME
CTRME
Non-CarcinogenicHazard Index
1.82E-05
3.67E-05
3.45E-07
6.89E-07
1.02E-6
1.02E-07
1.9E-053.7E-05
Carcinogenic Risk
5.09E-10
1.05E-09
6.4E-12
1.28E-11
9.44E-12
1.89E-11
5.2E-101.1E-09
Attachment TableReference
A.7.2B.CT
A.7.2B.RME
A.7.2B.CT
A.7.2B.RME
A.7.2B.CT
A.7.2B.RME
A.7.2B.CTA.7.2B.RME
Note:
a) The summed risk includes soil and the trenching scenario.
TABLE 5.3
RISK ESTIMATE SUMMARY FOR FUTURE CONSTRUCTION WORKER
USING CURRENT TCE TOXICITY DATA
AREA 1 - CNH PROPERTY
Medium
Soil
Groundwaler
Groundwater
TOTAL
Receptor
ConstructionWorker
ConstructionWorker
Trenching
ConstructionWorkerBuilding
Route
IngestionDermal
Inhalation
Inhalation
Inhalation
0)
Exposure
CT
RME
CT
RME
CT
RME
CTRME
Non-CarcinogenicHazard Index
1.82E-05
3.67E-05
3.11E-07
6.22E-07
4.59E-07
9.17E-07
1.9E-053.7E-5
Carcinogenic Risk
5.09E-10
1.05E-09
9.25E-12
1.85E-11
1.37E-11
2.73E-11
5.2E-101.1E-9
Attachment TableReference
A.7.2A.CT
A.7.2A.RME
A.7.2A.CT
A.7.2A.RME
A.7.2A.CT
A.7.2A.RME
A.7.2A.CTA.7.2A.RME
Note:
0) The summed risk includes soil and the trenching scenario.
018925(21) L-61 CONESTOGA-ROVERS & ASSOCIATES
5.3.3 AREA 2: CNH OFF-PROPERTY GROUNDWATER
While there are no current receptors present in Area 2, a future groundwater wellscenario was developed to evaluate Area 2 groundwater. Risk estimates weredeveloped by assuming that a resident might ingest the water be exposed to the COPCsfrom the use of water (showering, washing clothes and dishes, etc.) through dermalcontact and inhalation of vapors. A child swimming pool scenario for a child aged 2 to 8playing in small wading pool during the summer months was also evaluated.Inhalation of vapors migrating from soil gas to indoor air as a result of the COPCs in thegroundwater volatilizing to the soil gas was evaluated. Exposure is assumed to occur atthe rates specified in the exposure assessment section of the HHRA. The excess lifetimecancer risk for an adult and the non-cancer risks for a child and an adult were estimated,as shown in Tables 5.4 and 5.5. These summary tables are aggregates or sums of allexposure pathways quantified for this receptor for both RME and CT exposures.
The potentially carcinogenic COPCs 1,1 -DCA, PCE, and TCE are responsible for therisks from groundwater. The summed risk for all pathways added together is less thanone in ten thousand (1 x 1CH). The risk from PCE is higher than any other COPC.
1,1,1-TCA, 1,1-DCA, 1,1-DCE, cis-l,2-DCE, PCE, and TCE are responsible for thenon-cancer hazard index, which is less than one. Concerning TCE, two risk levels wereestimated, one using the 1987 TCE Cancer Slope Factor (Table 5.4), which has beenwithdrawn by U.S. EPA, and one using the 2001 Cancer Slope Factor (Table 5.5), whichis draft and currently under review. Both risk estimates are provided for comparisonbecause there is uncertainty about which level is appropriate.
It can be seen from Tables 5.4 and 5.5 that the excess cancer risks are lower than one inone million for the future resident for both TCE Slope Factors. PCE is the COPC thatcontributes most of the risk for this receptor.
018925(21) L-62 CONESTOGA-ROVERS & ASSOCIATES

TABLE 5.4
RISK ESTIMATE SUMMARY FOR FUTURE RESIDENT
USING FORMER TCE TOXICITY DATA
AREA 2 - CNH OFF PROPERTY
Medium
Groundwater
Groundwaterto Indoor Air
Groundwaterto Pool Water
TOTAL
Receptor
Resident(Child & Adult)
Resident(Child & Adul t )
Resident(Child)
Resident(Child & Adul t )
Route
IngestionDermal
Inhalation
Inhalation
IngestionDermal
Inhalation
Exposure
CT
RME
CT
RME
CT
RME
CTRME
Non-Curcitiogeiiic Hazard
Index
Child
0.068
0.086
0.001
0.001
0.00722
0.0142
0.0760.1
Adult
0.028
0.033
0.000
0.000
NA
NA
0.0280.033
CarcinogenicRisk
5.06E-06
1.60E-05
1.71E-08
3.82E-08
2.83E-07
5.62E-07
5.4E-061.7E-05
Attachment TableReference
B.7.1B.CT
B.7.1B.RME
B.7.1B.CT
B.7.1B.RME
B.7.1B.CT
B.7.1B.RME
B.7.1B.CTB.7.1B.RME
TABLE 5.5RISK ESTIMATE SUMMARY FOR FUTURE RESIDENT
USING CURRENT TCE TOXICITY DATAAREA 2- CNH OFF PROPERTY
Medium
Groundwater
Groundwaterto Indoor Air
Groundwaterto Pool Water
TOTAL
Receptor
Resident(Child & Adult)
Resident(Child & Adul t )
Resident(Child)
Resident(Child & Adul t )
Route
IngestionDermal
Inhalation
Inhalation
IngestionDermal
Inhalation
Exposure
CT
RME
CT
RME
CT
RME
CTRME
Non-Carcinogenic Hazard
Index
Child
0.099
0.140
0.001
0.001
0.00715
0.014
o.n0.16
Adult
0.039
0.048
0.000
0.000
NA
NA
0.0400.048
CarcinogenicRisk
7.86E-06
2.27E-05
4.66E-08
1.04E-07
5.5E-07
1.1E-06
8.5E-062.4E-05
Attachment TableReference
B.7.1A.CT
B.7.1A.RME
B.7.1A.CT
B.7.1A.RME
B.7.1A.CT
B.7.1A.RME
B.7.1A.CTB.7.1A.RME
5.3.4 AREA 3: FUTURE GROUNDWATER WELL
The excess lifetime cancer risk and non-cancer hazards were estimated for a futuregroundwater well in the Northern Study Area. For this scenario it was assumed thatgroundwater, represented by groundwater concentrations in the vicinity of PioneerBoulevard, would be used for a period of 30 years into the future. Risk estimates weredeveloped by assuming that a resident might ingest the water, be exposed to the COPCs
018925(21) L-63 CONESTOGA-ROVERS & ASSOCIATES

from the use of water (showering, washing clothes and dishes, etc.) through dermalcontact and inhalation of vapors. A child swimming pool scenario for a child aged 2 to 8playing in a small wading pool during the summer months was also evaluated.Inhalation of vapors migrating from soil gas to indoor air as a result of the COPCs in thegroundwater volatilizing to the soil gas was evaluated. The risk estimates presented inthis table are cumulative, that is, they add exposure by all routes and pathways and forall of the chemicals present at their RME, or 95 percent UCL concentration. The riskestimate also assumes that these RME COPC concentrations will not decrease with time.
A summary of the future cancer risks and non-cancer hazards for this future scenario areshown in Table 5.6, with a detailed breakdown shown in Attachment C. It can be seenfrom these tables that the combined future excess lifetime cancer risk for the child andadult, which assumes 6 years as a child, is 1.7xl(H, or approximatelytwo in ten thousand. This is greater than the individual excess lifetime cancer risk is1 x 10"4, which is identified in risk assessment guidance as follows:
"Wliere the cumulative carcinogenic site risk to an individual based on reasonable
maximum exposure for both current and future land use is less than 1Q-4 and the
non-carcinogenic hazard quotient is less than 1, action generally is not warranted unless
there are adverse environmental impacts." (U.S. EPA, 1991)
It can also be seen from Table 5.6 that the Hazard Index is approximately one (0.98) for achild and 0.34 for an adult. These indices were estimated by summing the individualhazards for all applicable exposure pathways, which for the child was household use ofgroundwater (ingestion, dermal contact, and inhalation), groundwater in the poolduring the summer groundwater (ingestion, dermal contact, and inhalation), andinhalation of indoor air. For adult, the exposure pathways summed in the indices werehousehold use of groundwater (ingestion, dermal contact, and inhalation) andinhalation of indoor air.
018925(21) L-64 CONESTOGA-ROVERS & ASSOCIATES
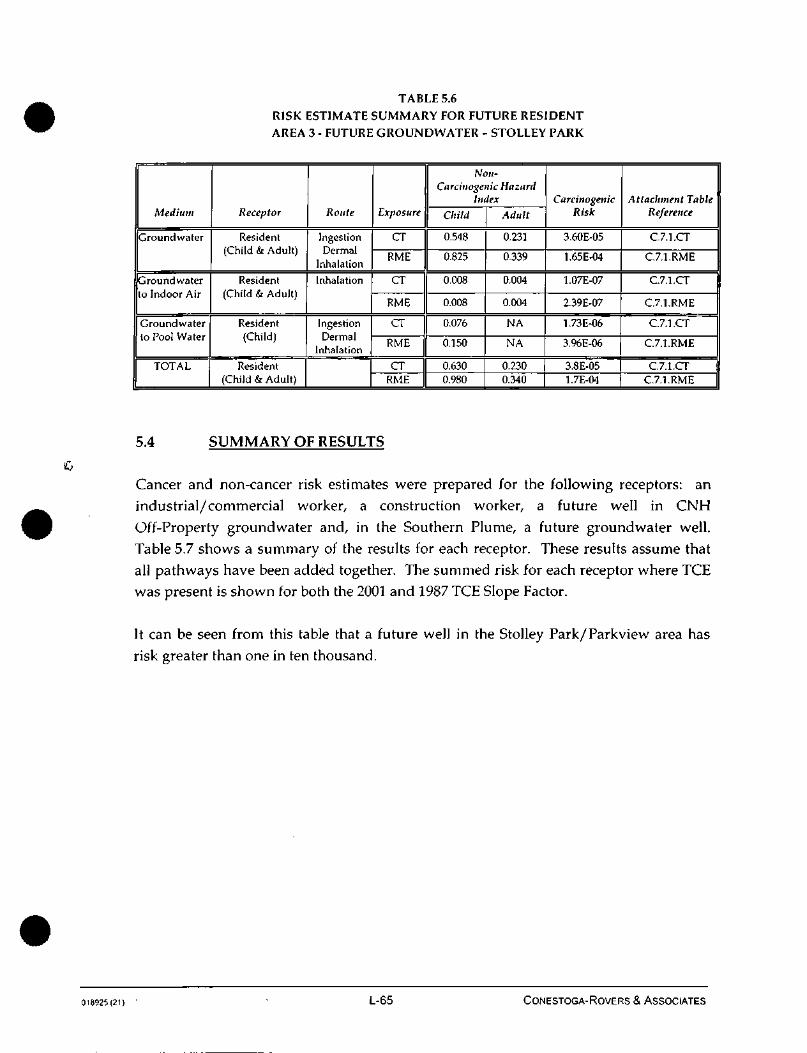
TABLE 5.6
RISK ESTIMATE SUMMARY FOR FUTURE RESIDENT
AREA 3 - FUTURE GROUNDWATER - STOLLEY PARK
Medium
Groundwater
Groundwaterto Indoor Air
Groundwaterto Pool Water
TOTAL
Receptor
Resident(Child & Adult)
Resident(Child & Adul t )
Resident(Child)
Resident(Child & Adult)
Route
JngestionDermal
Inhalation
Inhalation
IngestionDermal
Inhalation
Exposure
CTRME
CT
RME
CT
RME
CTRME
Non-Carcinogenic Hazard
Index
Child
0.548
0.825
0.008
0.008
0.076
0.150
0.6300.980
Adult
0.231
0.339
0.004
0.004
NA
NA
0.2300.340
CarcinogenicRisk
3.60E-05
1.65E-04
1.07E-07
2.39E-07
1.73E-06
3.96E-06
3.8E-051.7E-04
Attachment TableReference
C.7.1.CT
C7.1.RME
C.7.1.CT
C.7.1.RME
C.7.1.CT
C.7.1.RME
C.7.1.CTC7.1.RME
5.4 SUMMARY OF RESULTS
Cancer and non-cancer risk estimates were prepared for the following receptors: anindustrial/commercial worker, a construction worker, a future well in CNHOff-Property groundwater and, in the Southern Plume, a future groundwater well.Table 5.7 shows a summary of the results for each receptor. These results assume thatall pathways have been added together. The summed risk for each receptor where TCEwas present is shown for both the 2001 and 1987 TCE Slope Factor.
It can be seen from this table that a future well in the Stolley Park/Parkview area hasrisk greater than one in ten thousand.
018925(21) L-65 CONESTOGA-ROVERS & ASSOCIATES

TABLE 5.7SUMMARY OF RISK ESTIMATES FOR
THE NORTHERN STUDY AREA
Receptor
Industrial Worker
ConstructionWorker
1987TCECSF
ConstructionWorker
2001 TCE CSF
Off-PropertyFuture Well
1987 TCE CSF
Off- PropertyFuture Well
2001 TCE CSF
Southern PlumeFuture Well
CarcinogenicRisk
Less than1E-7
Less than1E-8
Less than1E-8
1.7E-05
2.4E-05
1.74E-04
ChildNon-Carcinogenic
Hazard Index
NA
NA
NA
0.1
0.16
0.98
AdultNon-Carcinogenic
Hazard Index
Less than 0.01
Less than 0.01
NA
0.033
0.048
0.34
COPC with GreatestCancer Risk
Less than 0.01
Less than 0.01
NA
PCE
TCE
PCE
Percent ofRisk
>0.01
>0.01
NA
79%
31%
95%
5.5 RISK AND HAZARD COPC CONTRIBUTIONS
The contribution of risk from each COPC was also investigated for each area evaluatedin the Northern Study Area. The results of this analysis are also shown in Table 5.5.
For the On Property industrial worker, excess cancer risks are less thanone in one hundred million and the analysis was not conducted. For an On Propertyconstruction worker excess cancer risks are similarly less than one inone hundred million and the analysis was not conducted. However, PCE is the COPCwith the highest level of risk, which is still less than 1 x 1O8.
The excess cancer risk for a future groundwater well was conducted for groundwater inthe CNH Off-Property groundwater. These risk estimates used the RME exposure pointconcentration and associated RME assumptions. The groundwater in this area had asingle estimated (J-flagged) detection of TCE at the level of 0.00018 mg/L, which wascarried through the HHRA, and four detections of PCE (out of 76 samples) with thehighest detection of 0.0016 mg/L, below the PCE MCL of 0.005 mg/L. As shown inTables 5.4 and 5.5, the risks estimated for this future well are 1.7xlO-5 and 2.4 x 10'5
using the 1987 and 2001 TCE Slope Factors, respectively. This also indicates that theestimated concentration of 0.00018 mg/L of TCE gives a risk of 7.5 x 10'6, which
018925(21) L-66 CONESTOGA-ROVERS & ASSOCIATES

constitutes 31 percent of the risk. Using the 1987 TCE Slope Factors 79 percent of therisk is from PCE.
Exposure Pathway Cancer Risk For PCE Cancer Risk For TCE
(Table B. 7.W.RME) (Table B. 7.1A.RME)
Household Use 1.31E-05 6.84E-06Indoor Air 1.52E-08 6.7E-08Child Pool 3.06E-07 5.41E-07Total 1.35E-05 7.45E-06Total for all COPCs 1.7E-05 2.4E-05Percentage of Total 79% 31%
In the Southern Plume area, potential carcinogenic risks estimates for residents using afuture ground water well are 1.7 xl(H The majority of the risk is from PCE, whichcontributes 95 percent of the risk. TCE was not detected in this part of the NorthernStudy Area.
Exposure Pathway Cancer Risk For PCE
(Table C.7.1.RME)
Household Use 1.57E-04Indoor Air 1.87E-07
Child Pool 3.27E-06Total 1.6E-04Total for all COPCs 1.7E-04Percentage of Total 95%
5.6 UNCERTAINTY ANALYSIS
The purpose of this section is to provide a summary and discussion regarding theuncertainties associated with the HHRA evaluation. The various uncertainties arediscussed in the following sections.
018925(21) L-67 CONESTOGA-ROVERS & ASSOCIATES

5.6.1 SAMPLING PROCEDURES
5.6.1.1 SOIL SAMPLING
The sampling strategy is a factor that impacts the health evaluation for COPCs in Area 1.On the CNH Property, soil-sampling procedures targeted the sidewalls and bottoms oflocations that were contaminated, with the purpose of finding contamination afterremediation had taken place. This created a sampling bias toward worst-case (higher)exposure point concentrations in soil. The utilization of such biased data in the HHRAdecreases the uncertainty that exposure to soil at higher concentrations might occur.
5.6.1.2 GROUNDWATER SAMPLING
Groundwater data was collected from areas that were considered to be elevated with theobjective of identifying and delineating the COPCs groundwater plumes. Themaximum COPC concentration data were screened allowing for the inclusion of COPCsthat were present. Consistent with U.S. EPA's RAGS Part A, which states that the riskassessment process should use upper bound average concentrations when estimatingrisk, the HHPvA used the 95 percent UCL concentration of COPC, or the maximum whenestimating risks from groundwater. This would have the effect of decreasing theuncertainty that a conservative measure of the mean was used in the HHRA.
The detection limits for COPCs were, for the most part, adequate. For on-sitegroundwater COPC detection limits were elevated in some samples, and the detectionlimit for TCE was elevated in all samples. Accurate target VOC measurements ofaqueous samples containing matrix interferences or high concentrations of target andnon-target VOCs is accomplished by diluting the sample to the degree necessary toensure that the amount of analyte introduced into the instrument is within the upperhalf of its linear calibration range. Diluting the sample to accurately quantitate detectedVOCs or overcome matrix interferences results in elevated reporting limits for all VOCs.The factor by which the reporting limits are elevated is the reciprocal of the sampledilution (e.g., a 1 to 100 dilution requires the reporting limits to be multiplied by 100).Raising the reporting limit for all analytes when a sample is diluted is a fundamentallimitation of chromatographic analytical chemistry techniques. The detection limit forTCE for the overall program was 0.0001 mg/L and the U.S. EPA Region IX PRGs was0.000028 mg/L. This will increase the uncertainty that TCE is present in groundwater,but not included in the HHRA. As a result, the human health risks may have beenunderestimated, but below levels of concern. TCE was not detected on a frequent basis,and was not believed to have been an issue at the CNH Property. This was also the case
018925(21) L-68 CONESTOGA-ROVERS & ASSOCIATES
in the Southern Plume, so even though the detection limit was elevated, and uncertaintyincreased, TCE was not considered to be a problem in either groundwater plume.
5.6.2 COFC SELECTION
The COPCs were derived from the CVOCs identified by the AOC and are the sevenchemicals that were detected in soils and groundwater and represent the greatest risk tohuman health and the environment. Other chemicals may be present in soils andgroundwater that are not evaluated in this HHRA. The exclusion of chemicals willincrease the uncertainty in the risk assessment process. However, the exclusion ofchemicals, even though it increases uncertainty, may not have a substantive impact onthe actual risks estimated in the HHRA because the risks from the COPCs selected arehigher than those from omitted chemicals because the original selection was based onrisk.
5.6.3 EXPOSURE POINT CONCENTRATION ESTIMATES
Exposure point concentrations were estimated using U.S. EPA methods. For media thatwere sampled directly, the uncertainty in the data is governed by sampling and analysisprotocols and the statistical reduction of these data. The maximum or 95 percent UCL ofthe data was used in the risk assessment. These are conservative measures of theaverage, as defined by U.S. EPA in their definition of the RME.
Exposure point concentrations for media that were not measured directly will havemore uncertainty because they have been estimated using modeling. The uncertainty inthe estimation of COPC concentrations in media such as outdoor air and indoor air isdifferent for each model. U.S. EPA-approved models or ASTM models were used toestimate these media concentration, and although there is uncertainty, its impact on therisk assessment is generally to estimate upper bound average media concentrations.
COPC concentrations were assumed to remain constant over the 30-year periodassumed in the risk assessment. COPC concentrations could either increase or decreaseover this time. For the CNH Property, and CNH Off-Property groundwater, COPCconcentrations are more likely to decrease because the original source of these COPCshas been removed, and natural attenuation will reduce COPCs in soils andgroundwater. For the Southern Plume, the source of the COPCs has not been fullycharacterized and COPC concentrations could increase or decrease. Based on
018925(21) L-69 CONESTOGA-ROVERS & ASSOCIATES
groundwater concentrations in the Mary Lane area of the Southern Plume,concentrations could increase over time rendering the risk assessment less conservative.
Exposure point concentrations for the future groundwater well in the Southern Plumewere based on data collected in March 2004. The data were used to developupper-bound average exposure concentrations for a resident in the Parkview/StolleyPark neighborhood who might consume the water dur ing the next thirty years. TheRME concentration is an upper-bound average concentration and is considered to beconservative by U.S. EPA but because it was not based on a wide range of data it willhave uncertainty. It was assumed that this one sampling round provided representativedata for this area. An evaluation of the data indicted that it was representative andgroundwater concentrations did not appear to decrease over time, so assuming aconstant concentration for the COPCs is reasonable.
5.6.4 EXPOSURE SCENARIO ASSUMPTIONS
This section discusses the uncertainty associated with the primary exposure scenarioassumptions such as land use and frequency of exposure. Because the assumptions usedin the scenarios are often not based on actual exposure data, but rather on assumptionsabout fu ture exposure patterns they can require professional judgment. U.S. EPA hascompiled data on exposure patterns over time and the exposure values used in theHHRA are reasonable and yet conservative. U.S. EPA's tendency is to select reasonableconservative values is an attempt to provide risk estimates that are within the bounds ofpossibility, but they will have uncertainty that could either under-estimate orover-estimate exposure (and therefore the associated risks).
The intent of the HHRA was to estimate the potential future point exposures for boththe "average" [Central Tendency (CT) or Mean] and the reasonable maximum exposure(RME) exposure scenarios. In order to accomplish this goal, a series of standardizedU.S. EPA exposure assumptions were utilized, where available and applicable. In theabsence of available or applicable exposure assumptions, professional judgment wasused to establish necessary assumptions protective of human health. The CT exposurescenario represents an "average" exposure scenario that is reasonably expected to occur.The RME scenario represents the reasonable maximum exposure expected to occur. Theexposure scenarios (CT and RME) were developed to evaluate possible risk under bothcurrent and future land use conditions.
018925(21) L-70 CONESTOGA-ROVERS & ASSOCIATES
The major uncertainties regarding the physical exposure scenarios used in the HHRA
are summarized as follows:
(i) the risk assessment assumes groundwater has been consumed at rates that areupper bound averages these estimates do not take into account the consumptionof water from alternative sources, such as canned soda and bottled water.However, for certain individuals, intake may be greater than that assumed in theHHRA;
(ii) the risk assessment for the future groundwater well assumes an individual willbe in the residence showering or bathing 350 times per year for 30 years;
(iii) long-term exposure point concentrations are inherently uncertain because COPCconcentrations are assumed to remain constant over time, however, COPCconcentrations in CNH Off-Property groundwater will decrease over time due toevaporation, degradation, and remediation processes. The assumptions that themeasured concentrations are equivalent during sampling and exposure over theduration of exposure will overestimate the intake and resulting risk;
(iv) the inclusion of other exposure pathways would increase the risk estimates.However, the inclusion of these minor exposure pathways, such as car washingand the irrigation of vegetables, tend to have little or no impact on the riskestimates above one in one million;
(v) for most COPCs, the HHRA assumed that TOO percent absorption occurs afteroral ingestion. Actual absorption rates of ingested contaminants may vary basedon individual COPC absorption rates. Thus, assumption of 100 percentabsorption of ingested COPCs overestimates the associated risks; and
(vi) for most COPCs, the HHRA assumed that 100 percent absorption occurs afterinhalation. Actual lung absorption rates may vary based on individual COPCabsorption rates. Thus, assumption of 100 percent lung absorption COPCsoverestimates the associated risks.
5.6.5 DOSE RESPONSE
One of the major uncertainties in estimating risks is the application of published toxicityinformation. Factors introducing uncertainty associated with toxicity value applicationare as follows:
(i) applicability of animal toxicity data - chemicals may be assumed to be humancarcinogens based on animal studies even when there is limited or no available
018925(21) L-71 CONESTOGA-ROVERS & ASSOCIATES

evidence that the chemicaJ is a human carcinogen. For PCE, epidemiologystudies in workers with high exposure to PCE have failed to directly link PCEexposure to a specific tumor or type of cancer;
(ii) differences in chemical concentrations - CSFs are derived from highconcentration animal studies and therefore may not be applicable to lowconcentration exposures;
(iii) in general, assumptions in toxicity values - CSFs are developed in a conservativemanner, so there is uncertainty in the outcome. Often EPA will includeuncertainty factors to account for this uncertainty in the extrapolation fromanimal exposure to human outcome;
(iv) for PCE, the U.S. EPA has not issued a final Slope Factor in the IRIS database,and the value used in the HHRA is from a secondary source. This lack of peerreview by U.S. EPA increases the uncertainty in the risk estimate;
(v) assumptions in toxicity values (non-carcinogenic Hazard) - RfDs are alsoestablished with uncertainty safety factors when extrapolating to human outcome; and
(vi) the use of provisional (current) TCE toxicity data versus an older, withdrawntoxicity data illustrates the range of possible risk and hazard associated with thecompound toxicity data. The U.S. EPA has not completed its review process andhas not issued a revised TCE CSF in IRIS. The value used in the HHRA has notbeen through the U.S. EPA's peer review process and could be reevaluated toinclude the mode of action of TCE and correct for the inclusion of controversialanimal toxicity data associated responses at low doses.
5.6.6 RISK ESTIMATES
A human health risk assessment assigns a numerical value to the excess probability(above background cancer rates) of a case of cancer developing in an individual exposedto a specified amount of chemical that is a known or suspect carcinogen. This numericalvalue is presented as an upper limit excess cancer risk such as l.OE-04, or one additionalcancer case in ten thousand people exposed to the chemical and at the specific chemicalconcentration for their entire lifetime, which is assumed to be 70 years. The model thatis applied to calculate this numerical risk value is a combination of the exposureestimate and dose response values, and so will potentially include the uncertainty ineach set of values. The cancer risk model and the assumptions used to estimateexposure are expected to be protective of the most sensitive populations. The true risk isexpected to be lower than that calculated, and may quite reasonably be zero. Thus risk
018925(21) L-72 CoNESTOGA-RovERS & ASSOCIATES

estimates are overestimated by the HHRA methodology itself. However, for certain
individuals, who engage in activities at rates higher than those assumed in the HHRA,exposure and risk may be higher.
For the COPCs that poses the greatest risk, namely PCE, the calculated risk from thisCOPC are estimates using a provisional value, therefore, there is uncertainty in the risk
estimates for this COPC. This uncertainty has a direct correlation on the risks calculated
in the risk assessment. If this COPC has a threshold of risk, meaning that at low dose
the actual risk of cancer is zero, the risk from this chemical will also be zero.
The 2001 Cancer Slope Factor for TCE is currently under review by the U.S. EPA's
science advisory board. The inclusion of two risk estimates for TCE provides aperspective on the range of potential risk for this COPC.
018925(21) L-73 CONESTOGA-ROVERS & ASSOCIATES
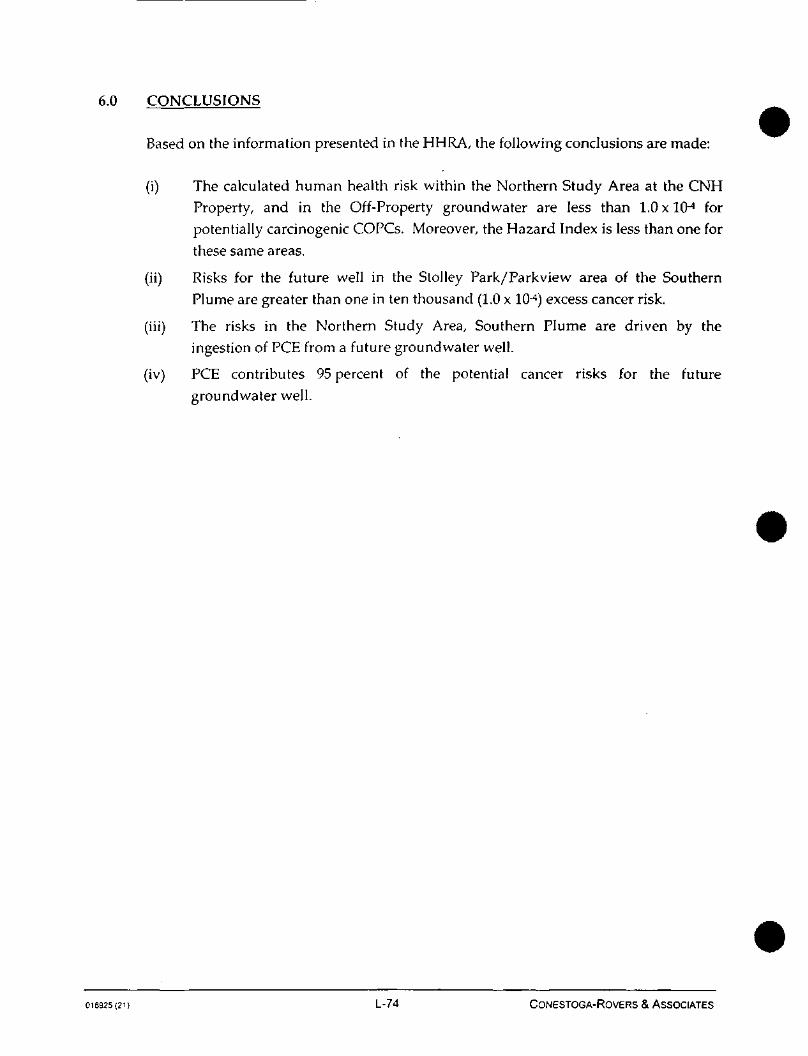
6.0 CONCLUSIONS
Based on the information presented in the HHRA, the following conclusions are made:
(i) The calculated human health risk within the Northern Study Area at the CNHProperty, and in the Off-Property groundwater are less than 1.0 x IQA forpotentially carcinogenic COPCs. Moreover, the Hazard Index is less than one forthese same areas.
(ii) Risks for the future well in the Stolley Park/Parkview area of the SouthernPlume are greater than one in ten thousand (1.0 x 10⁻⁴) excess cancer risk.
(iii) The risks in the Northern Study Area, Southern Plume are driven by theingestion of PCE from a fu ture groundwater well.
(iv) PCE contributes 95 percent of the potential cancer risks for the futuregroundwater well.
018925(21) L-74 CONESTOGA-ROVERS & ASSOCIATES

7.0 REFERENCES
Agency for Toxic Substances and Disease Registry (ATSDR, 2005). lexicological Profilefor 1,2-Dichloroethane, December 2005.
American Society for Testing and Materials (ASTM), 1998. Standard Provisional Guide
for Risk-Based Corrective Action. West Conshohocken, PA. ASTM PS104-98.
California Environmental Protection Agency (2002). Toxicity Criteria Database,
December 2002.
HEAST, 1997. U.S. EPA Health Effects Assessment Summary Tables (HEAST), July 1,
1997.
OEHHA, 2001. Public Health Goal for Tetrachloroethylene in Drinking Water, Office of
Environmental Health Hazard Assessment, California Environmental Protection
Agency, August 2001.
ORNL, 1993. Toxicity Summary For Trichloroethene Prepared by: Rosemarie A. Faust,
Ph.D, Chemical Hazard Evaluation Group, Biomedical Environmental
Information Analysis Section, Health and Safety Research Division, Oak Ridge,
Tennessee, March 1993. http://risk.lsd.ornl.gov/tox/profiles/trichIoroetheneJ_Vl.shtml
Risk Assessment Information System (RAIS), 2006.
http://risk.lsd.ornJ.gov/tox/rap_toxp.shtml
U.S. EPA, 1989. Risk Assessment Guidance for Superfund (RAGS) Interim Final,
EPA/540/1-89/002, December 1989.
U.S. EPA, 1991a. Risk Assessment Guidance for Superfund, Volume 1: Human Health
Evaluation Manual - Supplemental Guidance, Standard Default Exposure
Factors, Interim Final, OSWER Directive 9285.6-03.
U.S. EPA, 1991b. Risk Assessment Guidance for Superfund Vol. 1: Human Health
Evaluation Manual (Part B, Development of Risk-Based Preliminary Remediation
Goals), Publication 9285.7-01B.
U.S. EPA, 1992. U.S. EPA Supplemental Guidance to RAGS: Calculating the Concentration
Term, OSWER Directive 9285.7-081, May 1992.
U.S. EPA, 1994. Evaluating and Identifying Contaminants of Concern for Human
Health, Region 87 Superfund Technical Guidance, United States EnvironmentalProtection Agency, Superfund Management Branch, September 1994.
U.S. EPA, 1995. Assessing Dermal Guidance Exposure from Soil, Region III Technical
Guidance Manual Risk Assessment, EPA/903-K-95-003, December 1995.
U.S. EPA, 1997. Exposure Factors Handbook, EPA/600/P-95/002F, August 1997.
0,8g25(2i, L-75 CONESTOGA-ROVERS & ASSOCIATES
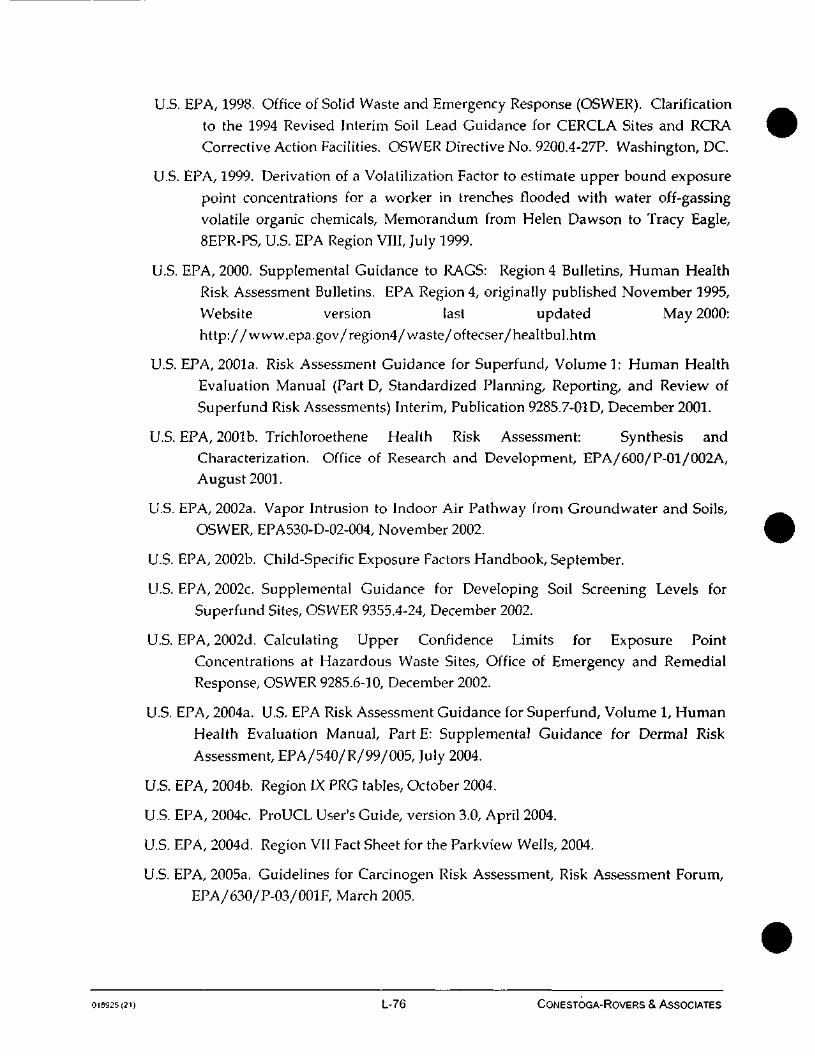
U.S. EPA, 1998. Office of Solid Waste and Emergency Response (OSWER). Clarificationto the 1994 Revised Interim Soil Lead Guidance for CERCLA Sites and RCRACorrective Action Facilities. OSWER Directive No. 9200.4-27P. Washington, DC.
U.S. EPA, 1999. Derivation of a Volatilization Factor to estimate upper bound exposurepoint concentrations for a worker in trenches flooded with water off-gassingvolatile organic chemicals, Memorandum from Helen Dawson to Tracy Eagle,8EPR-PS, U.S. EPA Region VIII, July 1999.
U.S. EPA, 2000. Supplemental Guidance to RAGS: Region 4 Bulletins, Human HealthRisk Assessment Bulletins. EPA Region 4, originally published November 1995,Website version last updated May 2000:http://www.epa.gov/region4/waste/oftecser/healtbul.htm
U.S. EPA, 2001a. Risk Assessment Guidance for Superfund, Volume 1: Human HealthEvaluation Manual (Part D, Standardized Planning, Reporting, and Review ofSuperfund Risk Assessments) Interim, Publication 9285.7-01D, December 2001.
U.S. EPA, 2001b. Trichloroethene Health Risk Assessment: Synthesis andCharacterization. Office of Research and Development, EPA/600/P-01/002A,August 2001.
U.S. EPA, 2002a. Vapor Intrusion to Indoor Air Pathway from Groundwater and Soils,OSWER, EPA530-D-02-004, November 2002.
U.S. EPA, 2002b. Child-Specific Exposure Factors Handbook, September.
U.S. EPA, 2002c. Supplemental Guidance for Developing Soil Screening Levels forSuperfund Sites, OSWER 9355.4-24, December 2002.
U.S. EPA, 2002d. Calculating Upper Confidence Limits for Exposure PointConcentrations at Hazardous Waste Sites, Office of Emergency and RemedialResponse, OSWER 9285.6-10, December 2002.
U.S. EPA, 2004a. U.S. EPA Risk Assessment Guidance for Superfund, Volume 1, HumanHealth Evaluation Manual, Part E: Supplemental Guidance for Dermal Risk
Assessment, EPA/540/R/99/005, July 2004.
U.S. EPA, 2004b. Region IX PRG tables, October 2004.
U.S. EPA, 2004c. ProUCL User's Guide, version 3.0, April 2004.
U.S. EPA, 2004d. Region VII Fact Sheet for the Parkview Wells, 2004.
U.S. EPA, 2005a. Guidelines for Carcinogen Risk Assessment, Risk Assessment Forum,EPA/630/P-03/001F, March 2005.
018925(21) L-76 CONESTOGA-ROVERS & ASSOCIATES
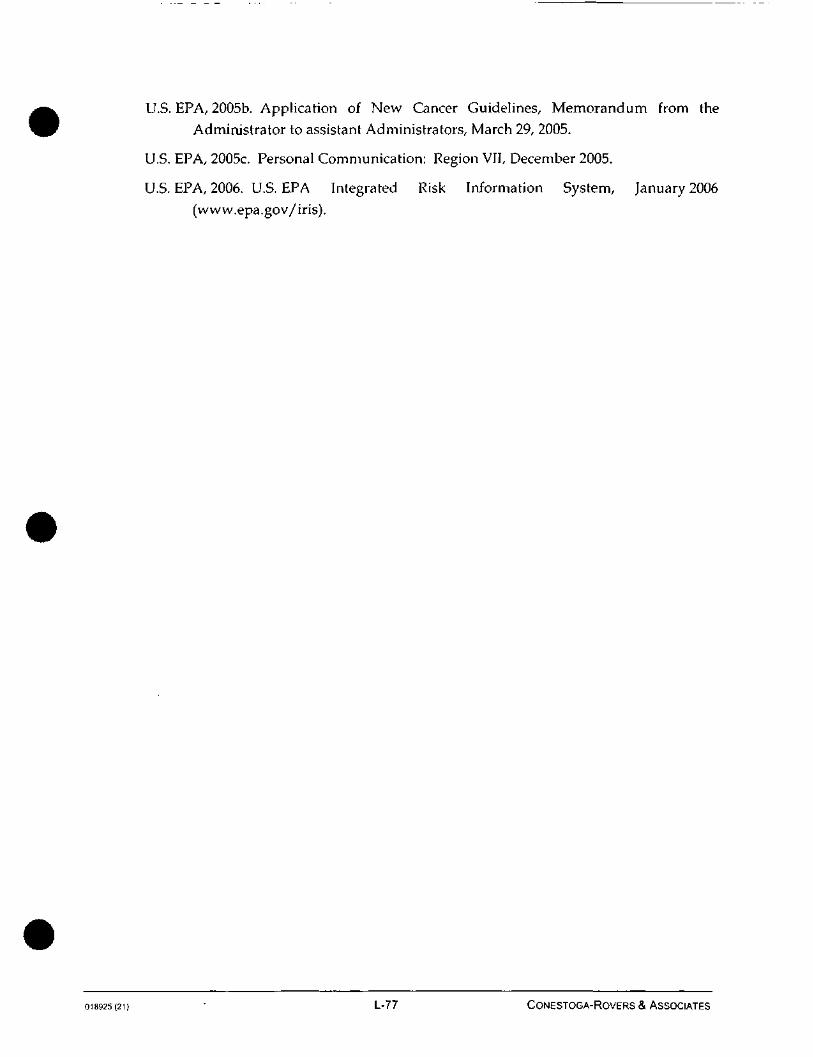
U.S. EPA, 2005b. Application of New Cancer Guidelines, Memorandum from the
Administrator to assistant Administrators, March 29, 2005.
U.S. EPA, 2005c. Personal Communication: Region VII, December 2005.
U.S. EPA, 2006. U.S. EPA Integrated Risk Information System, January 2006
(www.epa.gov/iris).
018925(21) ' L-77 CONESTOGA-ROVERS & ASSOCIATES
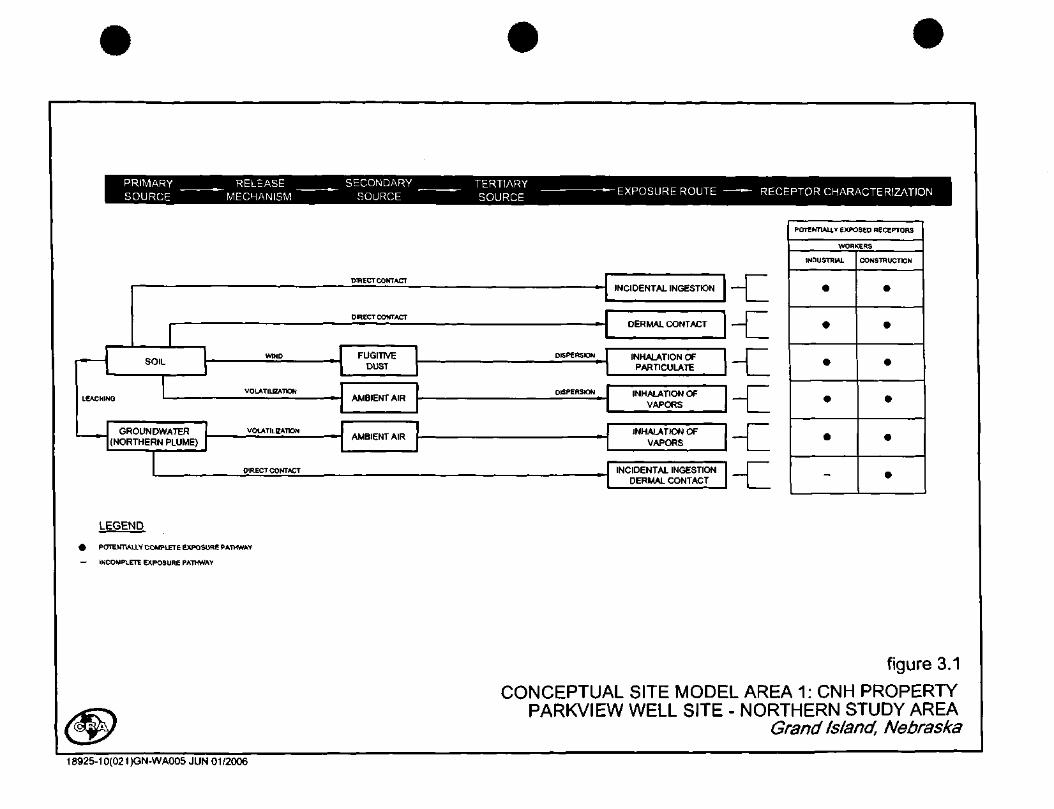
PRIMARYSOURCE
RELEASEMECHANISM
SECONDARYSOURCE
TERTIARYSOURCE EXPOSURE ROUTE RECEPTOR CHARACTERIZATION
SOIL
GROUNDWATER(NORTHERN PLUME)
VOLATILIZATION
VOLATILIZATION
DIRECT CONTACT
DIRECT CONTACT
DIRECT CONTACT
FUGITIVEDUST
AMBIENT AIR
AMBIENT AIR
INCIDENTAL INGESTION
INHALATION OFPARTICULATE
INHALATION OFVAPORS
INHALATION OFVAPORS
INCIDENTAL INGESTIONDERMAL CONTACT
DERMAL CONTACT
-c
POTENTIALLY EXPOSED RECEPTORS
WORKERS
INDUSTRIAL
•
•
•
•
•
-
CONSTRUCTION
•
•
•
•
•
•
LEGEND
• POTENTIALLY COMPLETE EXPOSURE PATHWAY
— INCOMPLETE EXPOSURE PATHWAY
figure 3.1
CONCEPTUAL SITE MODEL AREA 1: CNH PROPERTYPARKVIEW WELL SITE - NORTHERN STUDY AREA
Grand Island, Nebraska
18925-10(021)GN-WA005 JUN 01/2006

PRIMARY
SOURCE
RELEASE
"MECHANISMSECONDARY
SOURCE
TERTIARY
SOURCE
GROUNDWATER(NORTHERN PLUME)
DIRECT CONTACT
VOLATILIZATION
EXPOSURE ROUTE RECEPTOR CHARACTERIZATION
DIRECT CONIACT
INGESTIONDERMAL CONTACT
INHALATION OFVAPORS
INCIDENTAL INGESTIONDERMAL CONTACT
INHALATION OFVAPORS
INHALATION OFVAPORS
POTENTIALLYEXPOSED
RECEPTORS
(FUTURE) RESIDENT
•
-
•
RESIDENT
-
•
-
LEGEND
POTENTIALLY COMPLETE EXPOSURE PATHWAY
figure 3.2
CONCEPTUAL SITE MODEL AREA 2: CNH OFF-PROPERTYPARKVIEW WELL SITE - NORTHERN STUDY AREA
Grand Island, Nebraska
18925-10(021)GN-WA006 MAY 31/2006
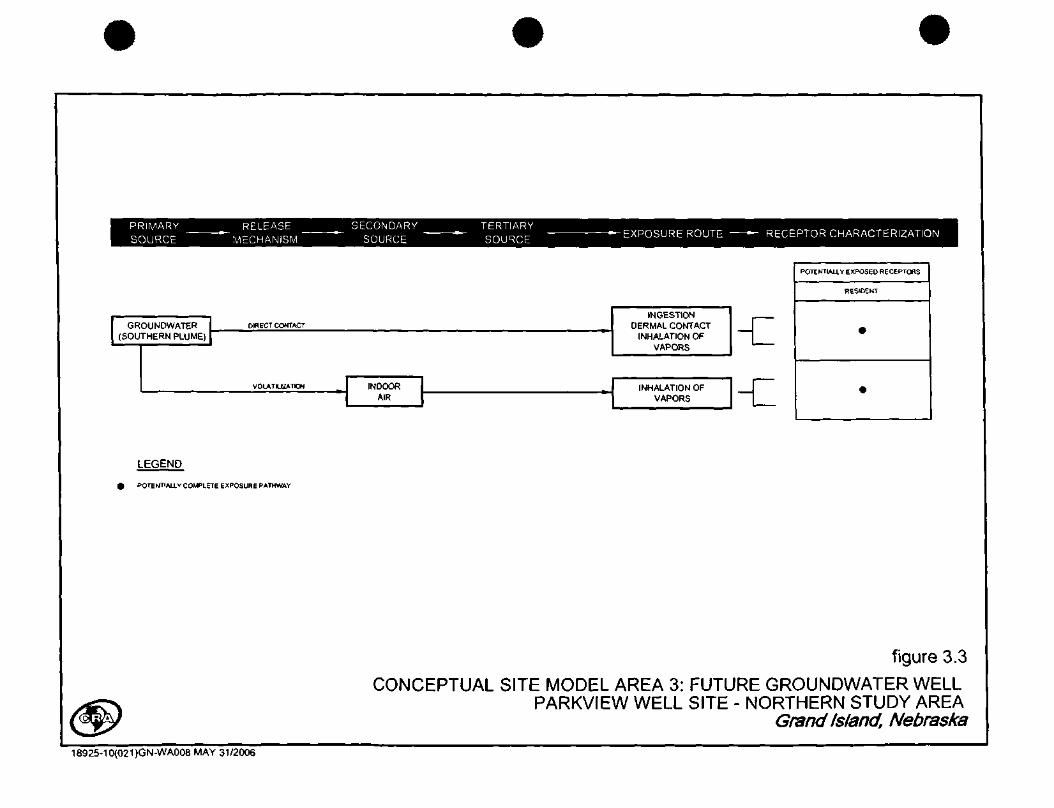
PRIMARYSOURCE
RELEASEMECHANISM
SECONDARYSOURCE
TERTIARYSOURCE -EXPOSURE ROUTE RECEPTOR CHARACTERIZATION
GROUNDWATER(SOUTHERN PLUME)
DIRECT CONTACT
INGESTION
DERMAL CONTACTINHALATION OF
VAPORS
VOLATILIZATION INHALATION OFVAPORS
POTENTIALLY EXPOSED RECEPTORS
LEGEND
POTENTIAL!* COMPLETE EXPOSURE PATHWAY
figure 3.3
CONCEPTUAL SITE MODEL AREA 3: FUTURE GROUNDWATER WELLPARKVIEW WELL SITE - NORTHERN STUDY AREA
Grand Island, Nebraska
18925-10(021)GN-WA008 MAY 31/2006
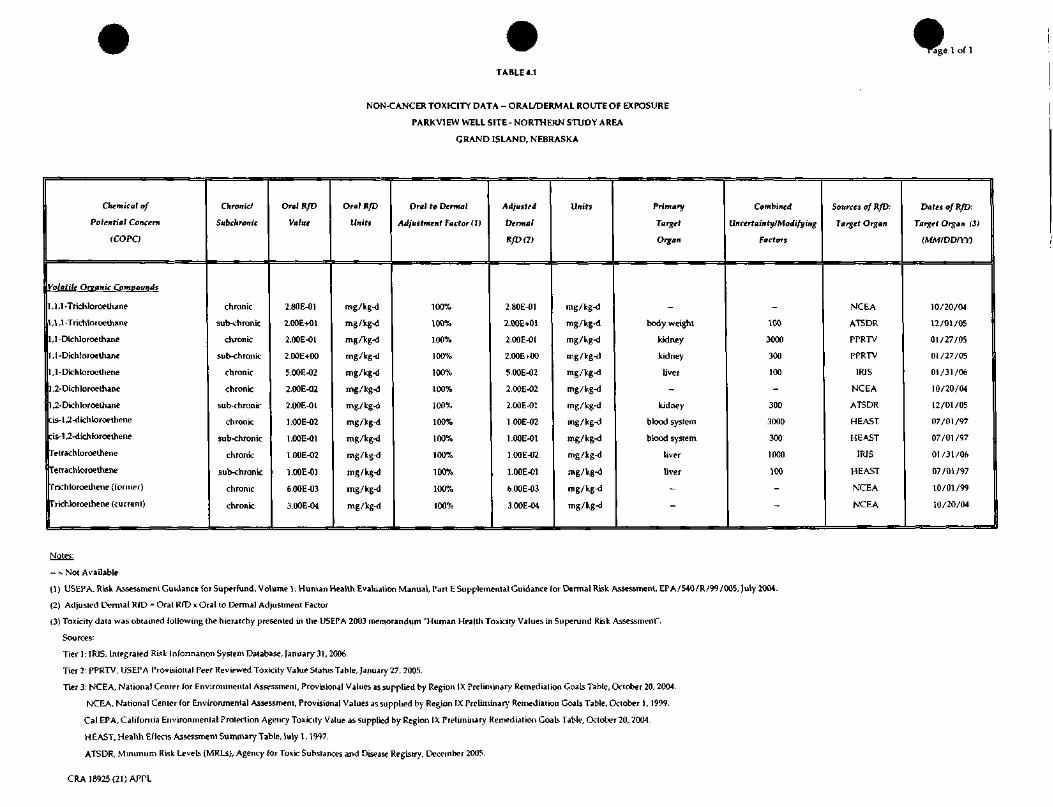
^rae<ige 1 of 1
TABLE 4.1
NON-CANCER TOXICITY DATA - ORAL/DERMAL ROUTE OF EXPOSURE
PARKVIEW WELL SITE - NORTHERN STUDY AREA
GRAND ISLAND, NEBRASKA
Chemical of
Potential Concern
(COPC)
'olatile Organic Compounds
1 ,1 ,1 -Trichloroethane
1 ,1 ,1 -Trichloroethane
,1 -Dichloroe thane
, 1 -Dichloroethane
,1-Dichloroethene
1,2-Dichloroe thane
1,2-Dichloroe thane
cis-l,2-dichloroethene
:is-l ,2-dichloroethene
retrachloroethene
retrachloroethene
frichloroethene (former)
Frichloroethene (current)
Chronicl
Subchronic
chronic
sub-chronic
chronic
sub-chronic
chronic
chronic
sub-chronic
chronic
sub-chronic
chronic
sub-chronic
chronic
chronic
Oral R/D
Value
2.80E-01
2.00E+01
2.00E-01
2.00E+00
5.00E-02
2.00E-02
2.00E-01
l.OOE-02
l.OOE-01
l.OOE-02
l.OOE-01
6.00E-03
3.00E-04
Oral R/D
Units
mg/kg-d
mg/ltg-d
mg/kg-d
mg/kg-d
mg/kg-d
mg/kg-d
mg/kg-d
mg/kg-d
mg/kg-d
mg/kg-d
mg/kg-d
mg/kg-d
mg/kg-d
Oral to Dermal
Adjustment Factor (1)
100%
100%
100%
100%
100%
100%,
100%
100%
100%
100%
100%
100%
100%
Adjusted
Dermal
RfD (2)
2.80E-01
2.00E+01
2.00E-01
2.00EtOO
5.00E-02
2.00E-02
2.00E-01
l.OOE-02
l.OOE-01
l.OOE-02
l.OOE-01
6.00E-03
3.00E-04
Units
mg/kg-d
mg/kg-d
mg/kg-d
mg/kg-d
mg/kg-d
mg/kg-d
mg/kg-d
mg/kg-d
mg/kg-d
mg/kg-d
mg/kg-d
mg/kg-d
mg/kg-d
Primary
Target
Organ
-
body weight
kidney
kidney
liver
-
kidney
blood system
blood system
liver
liver
-
—
Combined
Uncertainty/Modifying
Factors
-
100
3000
300
100
-
300
3000
300
1000
100
-~
Sources of R/D:
Target Organ
NCEA
ATSDR
PPRTV
PPRTV
IRIS
NCEA
ATSDR
HEAST
HEAST
IRIS
HEAST
NCEA
NCEA
Dates of RfD:
Target Organ (3)
(MM/DD/YY)
10/20/04
12/01/05
01/27/05
01/27/05
01/31/06
10/20/04
12/01/05
07/01/97
07/01/97
01/31/06
07/01/97
10/01/99
10/20/04
Notes:
-- - Not Available
(1) USEPA. Risk Assessment Guidance (or Superfund, Volume V. Human Health Evaluation Manual, Part E Supplemental Guidance for Dermal Risk Assessment, EPA/540/R/99/005, July 2004.
(2) Adjusted Dermal RfD = Oral RfD x Oral to Dermal Adjustment Factor
(3) Toxicity data was obtained following the hierarchy presented in the USEPA 2003 memorandum "Human Health Toxicity Values in Superund Risk Assessment".
Sources:
Tier 1:IRIS, Integrated Risk Information System Database, January 31, 2006.
Tier 2: PPRTV, USEPA Provisional Peer Reviewed Toxicity Value Status Table, January 27, 2005.
Tier 3: NCEA, National Center for Environmental Assessment, Provisional Values as supplied by Region IX Preliminary Remediation Goals Table, October 20, 2004.
NCEA. National Center for Environmental Assessment, Provisional Values as supplied by Region IX Preliminary Remediation Goals Table, October 1, 1999.
Cal EPA, California Environmental Protection Agency Toxicity Value as supplied by Region IX Preliminary Remediation Goals Table, October 20,2004.
HEAST, Health Effects Assessment Summary Table, )uly 1,1997.
ATSDR, Minimum Risk Levels (MRLs), Agency for Toxic Substances and Disease Registry, December 2005.
CRA 18925 (21) APPL

Page 1 of 1
TABLE 4.2
NON-CANCER TOX1CITY DATA - INHALATION ROUTE OF EXPOSURE
PARKVIEW WELL SITE - NORTHERN STUDY AREA
GRAND ISLAND, NEBRASKA
Chemical of
Potential Concern
(COPC)
/olatilt Organic Comvounds
1,1,1-Trichloroethane
1 ,1 -Dichloroc thane
1,1-Dichloroethane
1,1-Dichloroethene
1,2-Dichloroethaiie
1,2-Dichloroe thane
cis-l,2-Dichloroethenc
retrachloroethene
Fetrachloroethene
Frichloroethene (former)
Frichloroethcne (current)
Chronic/
Subchronic
chronic
chronic
sub-chronic
chronic
chronic
sub-chronic
-
chronic
sub-chronic
chronic
chronic
Value
Inhalation
RfC
2.20E+00
5.00E-01
S.OOE^-00
2.00E-01
4 90E-03
6.00E-01_
3.50E-02
2.00E-01
2.10E-02
3.50E-02
Units
mg/m3
mg/m3
mg/ni
mg/m3
n\g/m3
mg/m3
_
mg/m3
mg/m3
mg/m3
mg/m3
Adjusted
Inhalation
KfDtl)
6.30E-01
1 40E-01
1.40EtOO
5.70E-02
1.40E-03
1.71E-01
_
l.OOE-02
5.71 E-02
6.00E-03
1 .OOE-02
Units
mg/kg-d
mg/kg-d
mg/kg-d
mg/kg-d
mg/kg-d
mg/kg-d_
mg/kg-d
mg/kg-d
mg/kg-d
mg/kg-d
Primary
Target
Organ
-
kidney
kidney
liver
liver & gastrointestinal tract
kidney_
liver & kidney
liver
-
-
Combined
Uncertainty/Modifying
Factors
-
1000
100
30
3000
90_
-
10
-
-
Sources of
R/C.R/D:
Target Organ
PPRTV
HEAST
HEAST
IRIS
NCEA
ATSDR
„
Cal EPA
ATSDR
NCEA
NCEA
Dates (2)
(MM/DD/YY)
10/20/04
07/01/97
07/01/97
01/31/06
10/20/04
12/01/05
_
02/01/05
12/01/05
10/01/99
10/20/04
Notes:
- - Not Available
(1) (RfC x Inhalation Rate)/Body Weight
(2) Toxicity data was obtained following the hierarchy presented in the USEPA 2003 memorandum "Human Health Toxicity Values in Superund Risk Assessment".
Sources:
Tier 1: IRIS, Integrated Risk Information System Database, January 31, 2006.
Tier 2: PPRTV, USEPA Provisional Peer Reviewed Toxicity Value as supplied by Region IX Preliminary Remediaton Coals Table, October 20, 2004.
Tier 3: NCEA, National Center for Environmental Assessment, Provisional Values as supplied by Region IX Preliminary Remediation Goals Table, October 20, 2004.
NCEA, National Center for Environmental Assessment, Provisional Values as supplied by Region IX Preliminary Remediation Goals Table, October 1,1999.
Cal EPA, California Environmental Protection Agency , Chronic Reference Exposure Levels, February 2005.
HEAST, Health Effects Assessment Summary Table, July 1,1997.
ATSDR, Minimum Risk Levels (MRLs), Agency for Toxic Substances and Disease Registry, December 2005.
CRA 18925 (21) APPL
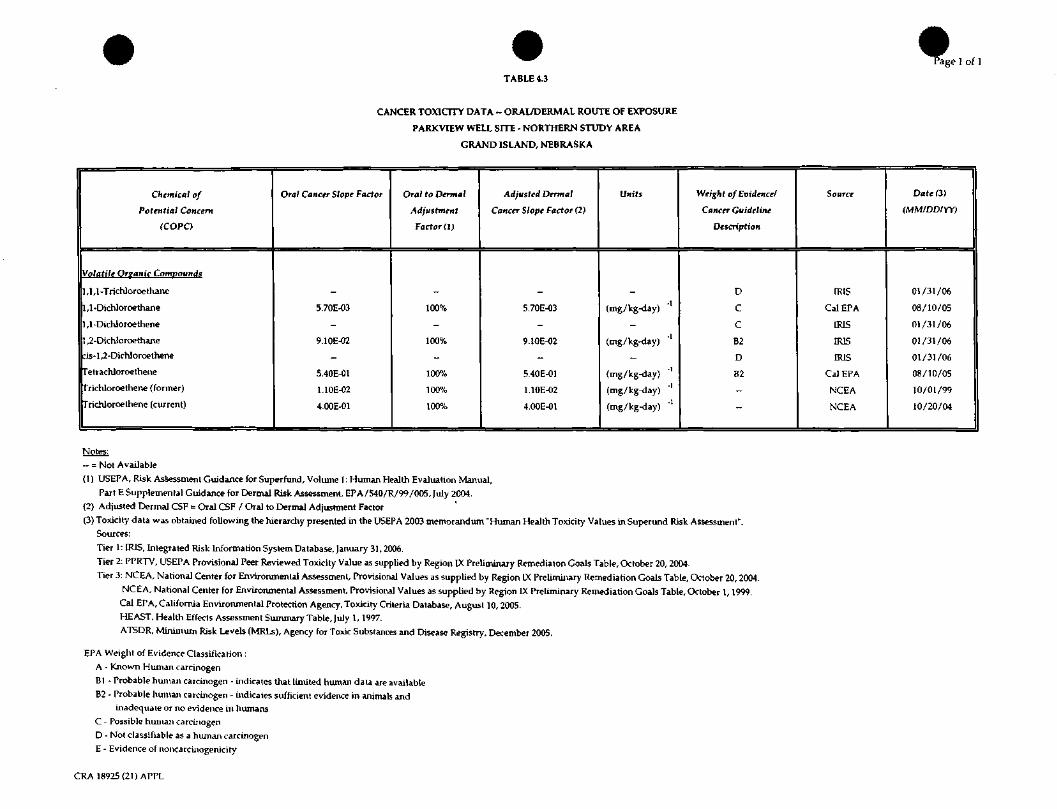
tge 1 of 1
TABLE 4.3
CANCER TOX1CITY DATA - ORAL/DERMAL ROUTE OF EXPOSURE
PARKVIEW WELL SITE - NORTHERN STUDY AREA
GRAND ISLAND, NEBRASKA
Chemical of
Potential Concern
(COPC)
Volatile Orsanic Comvounds
1,1,1-Trichloroethanc
1,1-Dichloroe thane
1,1-Dichloroethene
1,2-Dichloroe thane
cis- 1 ,2-Dichloroethene
retiachloroethene
Frichloroethene (former)
rrichloroethene (current)
Oral Cancer Slope Factor
—5.70E-03
-
9.10E-02
-
5.40E-01
1.10E-02
4.00E-01
Oral to Dermal
Adjustment
Factor (J)
_
100%
-
100%_
100%
100%
100%
Adjusted Dermal
Cancer Slope Factor (2)
_
5.70E-03
-
9.10E-02
-
5.40E-01
1.10E-02
4.00E-01
Units
_
(mg/kg-day)
-
(mg/kg-day)
-
(mg/kg-day)
(mg/kg-day)
(mg/kg-day)
Weight of Evidence/
Cancer Guideline
Description
D
C
C
B2
D
B2
-
~
Source
IRISCal EPA
IRIS
IRIS
IRIS
Cal EPA
NCEA
NCEA
Dare (3)
(MM/DD/YY)
01/31/06
08/10/05
01/31/06
01/31/06
01/31/06
08/10/05
10/01/99
10/20/04
Notes:— = Not Available
(1) USEPA, Risk Assessment Guidance for Superfund, Volume 1: Human Health Evaluation Manual,Part E Supplemental Guidance for Dermal Risk Assessment, EPA/540/R/99/005, July 2004.
(2) Adjusted Derma] CSF = Oral CSF / Oral to Dermal Adjustment Factor
(3) Toxicity data was obtained following the hierarchy presented in the USEPA 2003 memorandum "Human Health Toxicity Values in Superund Risk Assessment".Sources:
Tier 1: IRIS, Integrated Risk Information System Database, January 31, 2006.
Tier 2: PPRTV, USEPA Provisional Peer Reviewed Toxicity Value as supplied by Region IX Preliminary Remediaton Goals Table, October 20, 2004.
Tier 3: NCEA, National Center for Environmental Assessment, Provisional Values as supplied by Region IX Preliminary Remediation Goals Table, October 20, 2004.
NCEA, National Center for Environmental Assessment, Provisional Values as supplied by Region IX Preliminary Remediation Goals Table, October 1,1999.Cal EPA, California Environmental Protection Agency, Toxicity Criteria Database, August 10, 2005.HEAST, Health Effects Assessment Summary Table, July 1, 1997.
ATSDR, Minimum Risk Levels (MRLs), Agency for Toxic Substances and Disease Registry, December 2005.
EPA Weight of Evidence Classification :A - Known Human carcinogen
Bl - Probable human carcinogen - indicates that limited human data are availableB2 - Probable human carcinogen - indicates sufficient evidence in animals and
inadequate or no evidence in humansC - Possible human carcinogenD - Not classifiable as a human carcinogenE - Evidence of noncarcinogeniciry
CRA 18925(21) APPL

TABLE 4.4
Pago 1 of 1
CANCER TOXICITY DATA - INHALATION ROUTE OF EXPOSURE
PARKVIEW WELL SITE - NORTHERN STUDY AREA
GRAND ISLAND, NEBRASKA
Chemical of
Potential Concern
(COPC)
Volatile Organic Compounds
1,1,1-Trichloroethane
1 ,1-Dichloroelhane
1,1-Dichloroethene
1,2-DichloToelhane
<ris-l ,2-Dichloroethene
Felrachloroethene
rrichloroethene (former)
rrichloroethene (current)
Unit Risk
„
1.60E-06_
2.60E-05_
5.70E-06
1.71E-06
1.14E-04
Units
_
ug/m3
-
ug/m'
-
ug/m3
ug/m3
ug/m3
Adjustment (1)
„
3500_
3500_
3500
3500
3500
Inhalation Cancer
Slope Factor (2)
_
5.70E-03_
9.10E-02_
2.10E-02
6.00E-03
4.00E-01
Units
_
(mg/kg-day)
-
(mg/kg-day)
-
(mg/kg-day)
(mg/kg-day)
(mg/kg-day)
Weight of Evidence!
Cancer Guideline
Description
D
C
C
B2
D
B2
-
-
Source
IRIS
Cal EPA
IRIS
IRIS
IRIS
Cal EPA
NCEA
NCEA
Date (3)
(MM/DD/YY)
01/31/06
08/10/05
01/31/06
01/31/06
01/31/06
08/10/05
10/01/99
10/20/04
Note:
- = Not Available
(1) Adjustment Factor = 70 kg x 1 /20 m3/day x 1,000 ug/mg
(2) Inhalation CSF = Unit Risk x Adjustment Factor
(3) Toxicity data was obtained following the lu'erarchy presented in the USEPA 2003 memorandum "Human Health Toxicity VaJues in Superund Risk Assessment".
Sources:
Tier 1: IRIS, Integrated Risk Information System Database, January 31, 2006.
Tier 2: PPRTV, USEPA Provisional Peer Reviewed Toxiciry Value as supplied by Region LX Preliminary Remediaton GoaJs Table, October 20, 2004.
Tier 3: NCEA, National Center for Environmental Assessment, Provisional Values as supplied by Region IX Preliminary Remediation Goals Table, October 20, 2004.
NCEA, National Center for Environmental Assessment, Provisional Values as supplied by Region IX Preliminary Remediation Goals Table, October 1, 1999.
Cal EPA, California Environmental Protection Agency, Toxicity Criteria Database, August 10, 2005
HEAST, Health Effects Assessment Summary Table, July 1, 1997.
ATSDR, Minimum Risk Levels (MRLs), Agency for Toxic Substances and Disease Registry, December 2005.
EPA Weight of Evidence Classification :
A - Known Human carcinogen
Bl - Probable human carcinogen - indicates that limited human data are available
B2 - Probable human carcinogen - indicates sufficient evidence in animals and
inadequate or no evidence in humans
C - Possible human carcinogen
D - Not classifiable as a human carcinogen
E - Evidence of noncarcinogenicity
CRA 18

ATTACHMENT A
RISK CALCULATIONS FOR AREA 1: CNH PROPERTY
018925(21) APPL
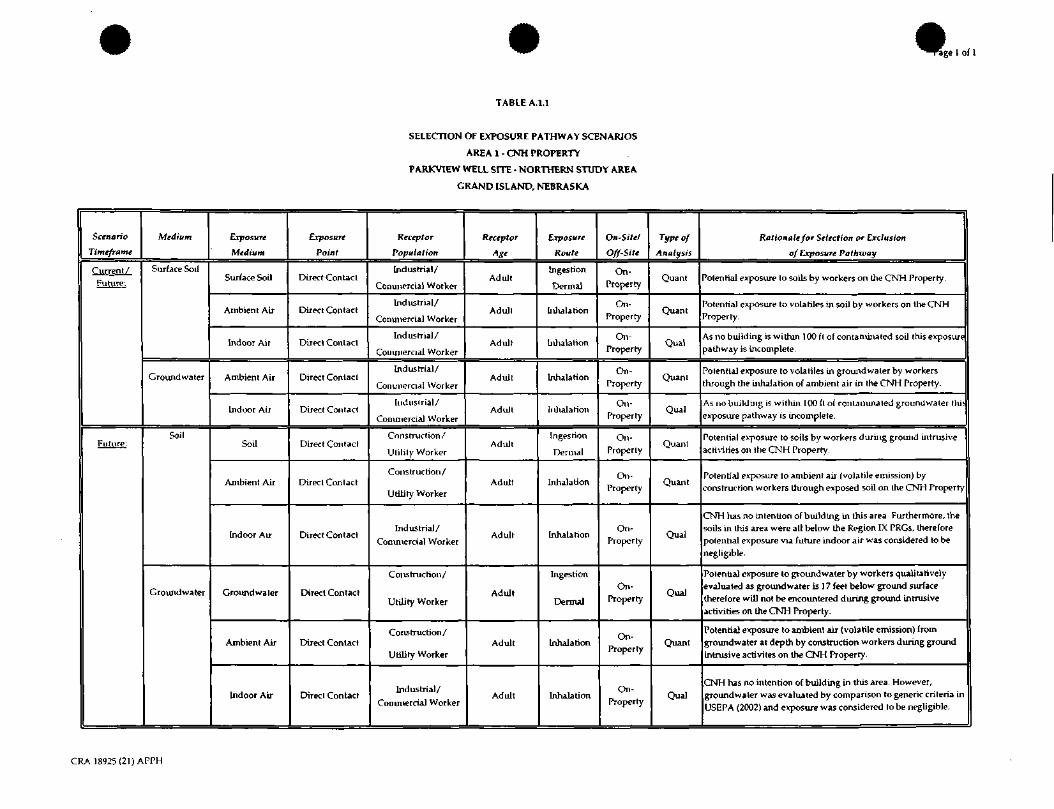
1 of 1
TABLE A.1.1
SELECTION OF EXPOSURE PATHWAY SCENARIOS
AREA 1 - CNH PROPERTY
PARKVIEW WELL SITE - NORTHERN STUDY AREA
GRAND ISLAND, NEBRASKA
Scenario
Timeframe
Future:
Future:
Medium
Surface Soil
Groundwater
Soil
Groundwater
Exposure
Medium
Surface SoU
Ambient Air
Indoor Air
Ambient Air
Indoor Air
Soil
Ambient Air
Indoor Air
Groundwater
Ambient Air
Indoor Air
Exposure
Point
Direct Contact
Direct Contact
Direct Contact
Direct Contact
Direct Contact
Direct Contact
Direct Contact
Direct Contact
Direct Contact
Direct Contact
Direct Contact
Receptor
Population
Industrial/
Commercial Worker
Industrial/
Commercial Worker
Industrial/
Commercial Worker
Industrial/
Conunercial Worker
Indust r ia l /
Commercial Worker
Construction/
Ut i l i t y Worker
Construction/
Utility Worker
Indus trial/Commercial Worker
Construction/
Utility Worker
Construction/
Utility Worker
Industrial/Commercial Worker
Receptor
Age
Adult
Adult
Adult
Adult
Adult
Adult
Adult
Adult
Adult
Adult
Adult
Exposure
Route
Ingestion
Dermal
Iiilialahon
Inhalation
Inhalation
Inhalation
Ingesrion
Dermal
Inhalation
Inhalation
Ingestion
Dermal
Inhalation
Inhalation
On-Sitel
Off-Site
Cm-Property
Cm-Property
On-Property
Cm-Property
On-Property
On-Property
On-Property
On-Propcrty
On-Property
Cm-Property
Cm-Property
Type of
Analysis
Quant
Quant
Qual
Quant
Qual
Quant
Quant
Qual
Qua!
Quant
Qual
Rationale for Selection or Exclusion
of Exposure Pathway
'olential exposure to soils by workers on the CNH Property.
'otential exposure to volatiles in soil by workers on the CNHProperty.
As no building is within 100ft of contaminated soil this exposurejathway is incomplete.
Potential exposure to volatiles in groundwater by workershrough the inhalation of ambient air in the CNH Property.
As no building is witliin 100 ft of contaminated groundwater tlii;exposure pathway is incomplete.
Potential exposure to soils by workers during ground intrusiveactivities on the CNH Property.
Potential exposure to ambient air (volatile emission) byconstruction workers through exposed soil on the CNH Property
CNH has no intention of building in this area. Furthermore, thesoils in this area were all below the Region IX PRGs, thereforepotential exposure via future indoor air was considered to benegligible.
Potential exposure to groundwater by workers qualitativelyevaluated as groundwater is 17 feel below ground surfacetherefore will not be encountered during ground intrusiveactivities on the CNH Property.
Potential exposure to ambient air (volatile emission) fromgroundwater at depth by construction workers during groundintrusive acn'vites on the CNH Property.
CNH has no intention of building in this area. However,groundwater was evaluated by comparison to generic criteria inUSEPA (2002) and exposure was considered to be negligible.
CRA 18925(21) APPH
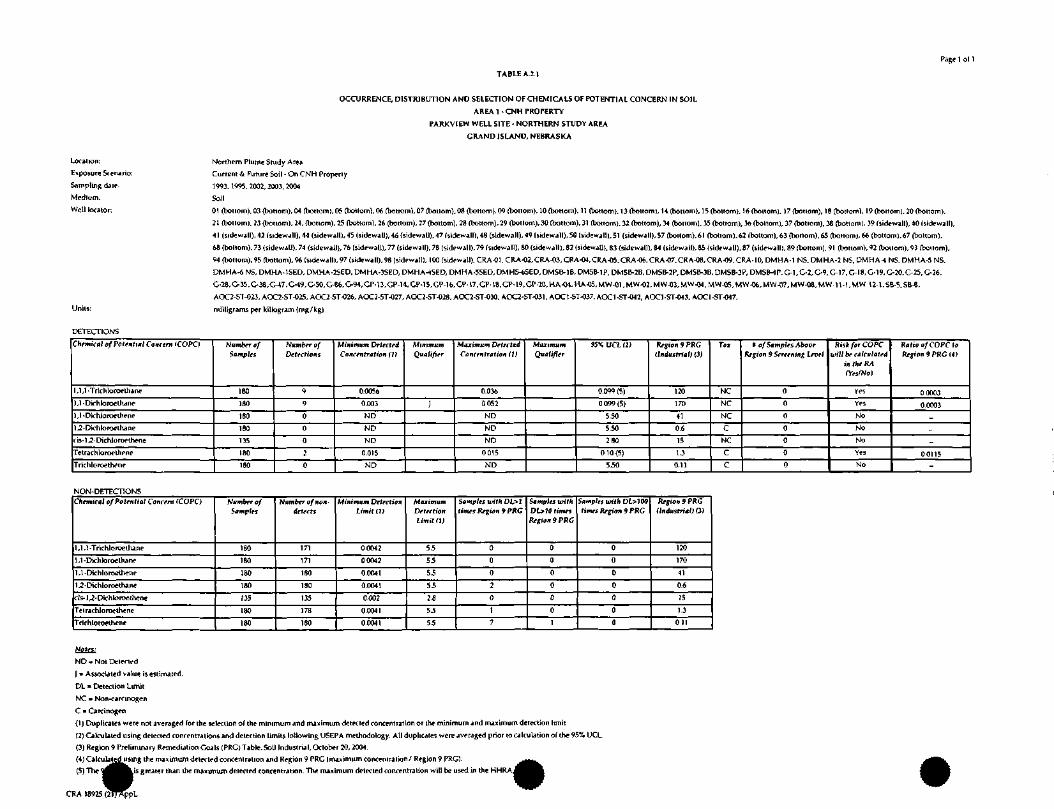
Page ] of 1
Location:
Exposure Scenario:
Sampling date:
Medium:
Well locator:
OCCURRENCE, DISTRIBUTION AND SELECTION OF CHEMICALS OF POTENTIAL CONCERN IN SOIL
AREA 1 - CNH PROPERTY
PARKVIEW WELL SITE - NORTHERN STUDY AREA
GRAND ISLAND, NEBRASKA
Northern Plume Study Area
Current & Future Soil - On CNH Properly
1993,1995.2002,2003,2004
Soil
01 (bottom), 03 (bottom), 04 (bottom), 05 (bottom), 06 (bottom), 07 (bottom), 08 (bottom), 09 (bottom), 10 (bottom), 11 (bottom), 13 (bottom), 14 (bottom), 15 (bottom), 16 (bottom), 17 (bottom), IB (bottom), 19 (bottom), 20 (bottom),
21 (bottom), 23 (bottom), 24, (bottom), 25 (bottom), 26 (bottom), 27 (bottom), 28 (bottom), 29 (bottom), 30 (bottom), 31 (bottom), 32 (bottom), 34 (bottom), 35 (bottom), 36 (bottom), 37 (bottom), 38 (bottom), 39 (sidewall), 40 (sidewall),
41 (sidewall), 42 (sidewall), 44 (sidewall), 45 (sidewall), 46 (sidewall), 47 (sidewall), 48 (sidewjll), 49 (sidewall), 50 (sidewall), 51 (sidewall), 57 (bottom), 61 (bottom), 62 (bottom). 63 (bottom), 65 (bottom), 66 (bottom), 67 (bottom),
68 (bottom), 73 (sidewall), 74 (sidewall), 76 (sidewall), 77 (sidewall), 78 (sidewall), 79 (sidewall), 80 (sidewall), 82 (sidewall), 83 (sidewall), 84 (sidewall), 85 (sidewall). 87 (sidewall), 89 (bottom), 91 (bottom), 92 (bottom). 93 (bottom),
94 (bottom), 95 (bottom), % (sidewall), 97 (sidewall), 98 (sidewall), 100 (sidewall), CRA-01, CRA-02, CRA-03, CRA-04, CRA-05, CRA-06, CRA-07, CRA-08, CRA-09, CRA-10, DMHA-1 NS, DMHA-2 NS, DMHA-I NS, DMHA-5 NS,
DMHA-6NS, DMHA-1SED, DMHA-2SED, DMHA-3SED, DMHA-4SED, DMHA-5SED, DMHS-6SED, DMSB-1B. DMSB-1P, DMSB-2B, DMSB-2P, DMSB-3B, DMSB-3P, DMSWP, G-1,G-2,G-9,G 17,G-18,C-19.G-20.G-25,G-26,
G-28,&J5,G-38,C^7,C^9,&50,G-86,G-94,CP-n.GP-H.CP-15,GP-16.CP-W.GP-18,GP-\9,CP-:20,HA-<M.HA-05,MW.^ 12-l,SB-5,SB-B,
AOC2-ST-023, AOC2-ST-025, AOC2.ST-026. AOC2-ST-027, AOC2-ST-028, AOC2-ST-030, AOC2-ST-031. AOC1-ST-037, AOC1-ST-042, AOC1-ST-043, AOCl-ST-047.
milligrams per killogram {mg/kg)
DETECTIONS
Chemical of Potential Concern ICOPC)
1,1,1-Trichloroe thane
1,1-Dirhloroethane
1,1-Dichloroethene
1,2-Dichloroelhane
cis-1 2- Dichloroethene
Telrachloroethene
Trichloroethene
Number ofSamples
180
180
180
180
135
180
180
Number ofDetections
9
9
0
0
0
2
0
Minimum DetectedConcentration (1)
0.0056
0.003
ND
ND
ND
0.015
ND
MinimumQualifier
}
Maximum DetectedConcentration (1)
0.036
0.052
ND
ND
ND
0015
ND
MinimumQualifier
95% UCL m
0.099 (5)
0.099 (5)
5.50
550
280
010(5)
550
Region 9 PRG(Industrial! (3)
120
170
41
0.6
15
1.3
0.11
Tor
NC
NC
NC
C
NC
C
C
* of Samples AboveRegion 9 Screening Level
0
0
0
0
0
0
0
RisJk/orCOPCwill be calculated
in the RA(Yes/No)
Yes
Yes
No
No
No
Yes
No
Ratio o/COPCIoRegion 9 PRC 14)
0.0003
0.0003
-
-
-
0.0115
-
NON-DETECTIONSChemical of Potential Concern ICOPC)
1 ,1 , 1 -Trichloroe thane
1,1-Dichloroethane
1,1-Dichloroethene
1.2-Dichloroelhane
cis-l^-Dichloroelhene
TetrachJoroelhene
Trichloroethene
Number ofSamples
180
180
180
180
135
180
180
Number ofnon-detects
171
171
180
180
135
178
180
Minimum DetectionLimit (I)
00042
0.0042
0.0041
0.0041
0.002
0.0041
0.0041
MdrimHmDetectionLimit It)
5.5
55
S3
55
2.8
55
55
Samples with DL>1times Region 9 PRC
0
0
0
2
0
1
7
Samples withDL>W timesRegion 9 PRG
0
0
0
0
0
0
1
Samples with DL>100times Region 9 PRG
0
0
0
0
0
0
0
Region 9 PRG(Industrial) m
120
170
41
0.6
15
1.3
on
Notes:
ND = Not Detected
) = Associated value is estimated.
DL = Detection Limit
NC = Non-carcinogen
C =• Carcinogen
(1) Duplicates were not averaged (or the selection of the minimum and maximum detected concentration or the minimum and maximum detection limit
(2) Calculated using detected concentrations and detection limits following USEPA methodology. All duplicates were averaged prior to calculation of the 95% UCL.
(3) Region 9 Preliminary Remediation Goals (PRG) Table, Soil Industrial, October 20, 2004.
(4) Ca leu laledu sing the maximum delected concentration and Region 9 PRG (maximum concentration/ Region 9 PRG).
(5) The 9^^^^^kis greater than the maximum detected concentration. The maximum detected concentration will be used in the HHRA J
CRA 18925 (2T
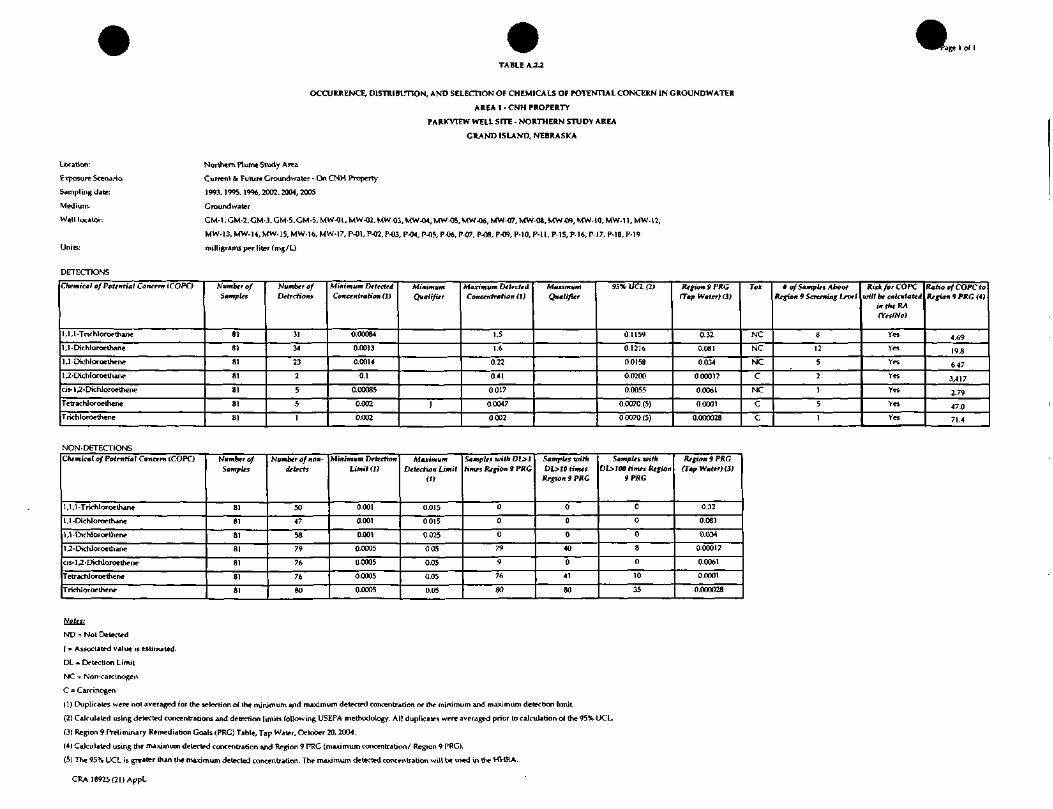
Page 1 of 1
Location:
Exposure Scenario:
Sampling date:
Medium:
Well locator:
DETECTIONS
OCCURRENCE, DISTRIBUTION, AND SELECTION OF CHEMICALS OF POTENTIAL CONCERN IN GROUNDWATER
AREA 1 - CNH PROPERTY
PARKVIEW WELL SITE - NORTHERN STUDY AREA
GRAND ISLAND, NEBRASKA
Northern Plume Study Area
Current & Future Croundwater - On CNH Property
1993,1995,19%, 2002,2004,2005
Croundwater
CM-l.GM-2.GM-3, GM-5.GM-5, MW-01, MW-02, MW-03, MW-04, MW-05, MW-06, MW-07, MWJX. MW-09, MW-10, MW-11, MW-\2,
MW-13, MW-14, MW-15, MW-16, MW-17, P-01, P-02, P-03, P-04, P-05, P-O6. P-07. P-08, P-09, P-10, P-l 1, P-15, P-16, P-17, P-18, P-19
milligrams per liter (mg/L)
Chemical of Potential Concern iCOPO
1,1,1-Trichloroe thane
1,1-Dichloroe thane
1,1-Dichloroethene
1,2-Dichloroethane
cis- 1 ,2-Dichloroethene
TetrachJoroethene
Trichloroethene
Number ofSamples
81
81
81
81
81
81
81
Number ofDetections
31
34
23
2
5
5
1
Minimum DetectedConcentration (I)
000084
00013
0.0014
0.1
0.00085
0.002
0.002
MinimumQualifier
J
Maximum DetectedConcentration n)
1.5
1.6
0.22
0.41
0.017
0.0047
0.002
MaximumQualifier
95% UCL (21
0.1159
0.1216
0.0158
0.0200
0.0055
0.0070 (5)
0 0070 (5)
Region 9 PKG(Tap Water) (3)
0.32
0.081
0.034
0.00012
0.0061
0.0001
0.000028
Toi
NC
NC
NC
C
NC
C
C
* of Samples AboveRegion 9 Screening Level
8
12
5
2
1
5
1
Risk for COKwill be calculated
in the HA(YeslNot
Yes
Yes
Yes
Yes
Yes
Yes
Yes
Ratio of COPC toRegion » PRG (4)
4.69
19.8
6.47
3,417
2.79
47.0
71.4
NON-DETECTIONSChemical of Potential Concern (COPC)
1,1,1 -TrichJoroethane
1 , 1 -Dichloroethane
1,1-Dichloroethene
1 -Dichloroethane
cis-1 ,2-Dichloroethene
Tetrachloroethene
Trichloroethene
Number ofSamples
81
81
81
81
81
81
81
Number of non-detects
50
47
58
79
76
76
80
Minimum DetectionLimit (1)
0.001
0.001
0.001
0.0005
0.0005
0.0005
0.0005
MorimumDetection Limit
(!)
0.015
0.015
0.025
0.05
0.05
0.05
0.05
Samples with DL>1times Region 9 PRG
0
0
0
79
9
76
80
Samples withDL>10 times
Region 9 PRG
0
0
0
40
0
41
80
Samples withDL>100 times Region
9 PRG
0
0
0
8
0
10
35
Region 9 PRG(Tap Water) (3)
0.32
0.081
0.034
0.00012
0.0061
0.0001
0.000028
Notes:
ND = Not Detected
| = Associated value is estimated.
DL - Detection Limil
NC = Non-carcinogen
C = Carcinogen
(1) Duplicates were nol averaged for the selection of the minimum and maximum detected concentration or the minimum and maximum detection limit
(2) Calculated using detected concentrations and detection linxits following USEPA methodology. AH duplicates were averaged prior to calcuJation of the 95% UCU
(3) Region 9 Preliminary Remediation Goals (PRG) Table, Tap Water, October 20, 2004.
(4) CaJculated using the maximum detected concentration and Region 9 PRG (maximum concentration/ Region 9 PRG).
(5) The 95% UCL is greater than the majdmum detected concentration. The maximum detected concentration will be used in Ihe HHRA.
CRA 18925(21) AppL
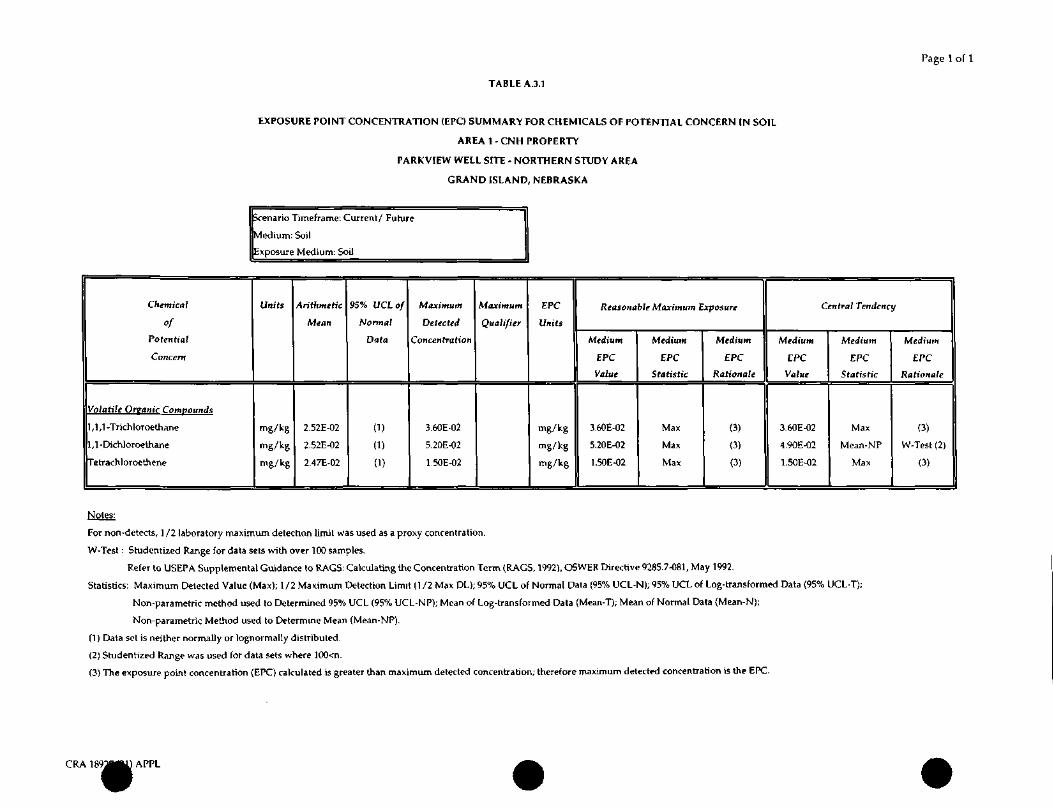
Page 1 of 1
TABLE A.3.1
EXPOSURE POINT CONCENTRATION (EPC) SUMMARY FOR CHEMICALS OF POTENTIAL CONCERN IN SOIL
AREA 1 - CNH PROPERTY
PARKVIEW WELL SITE - NORTHERN STUDY AREA
GRAND ISLAND, NEBRASKA
Scenario Timeframe: Current/ Future
Medium: Soil
Exposure Medium: Soil
Chemical
of
Potential
Concern
Volatile Orranic Compounds
1,1,1-Trichloroethane
1,1-Dichloroethane
Tetrachloroethene
Units
mg/kg
mg/kg
mg/kg
Arithmetic
Mean
2.52E-02
2.52E-02
2.47E-02
95% UCLof
Normal
Data
(1)
(1)
(1)
Maximum
Detected
Concentration
3.60E-02
5.20E-02
1.50E-02
Maximum
Qualifier
EPC
Units
mg/kg
mg/kg
mg/kg
Reasonable Maximum Exposure
Medium
EPC
Value
3.60E-02
5.20E-02
1.50E-02
Medium
EPC
Statistic
Max
Max
Max
Medium
EPC
Rationale
(3)
(3)
(3)
Central Tendency
Medium
EPC
Value
3.60E-02
4.90E-02
1.50E-02
Medium
EPC
Statistic
Max
Mean-NP
Max
Medium
EPC
Rationale
(3)
W-Test (2)
(3)
Notes:
For non-detects, 1/2 laboratory maximum detection limit was used as a proxy concentration.
W-Test: Studcntized Range for data sets with over 100 samples.
Refer to USEPA Supplemental Guidance to RAGS: Calculating the Concentration Term (RAGS, 1992), OSWER Directive 9285.7-081, May 1992.
Statistics: Maximum Detected Value (Max); 1 /2 Maximum Detection Limit (1/2 Max DL); 95% UCL of Normal Data (95% UCL-N); 95% UCL of Log-transformed Data (95% UCL-T);
Non-parametric method used to Determined 95% UCL (95% UCL-NP); Mean of Log-transformed Data (Mean-T); Mean of Normal Data (Mean-N);
Non-parametric Method used to Determine Mean (Mean-NP).
(1) Data set is neither normally or lognormally distributed.
(2) Studentized Range was used for data sets where 100<n.
(3) The exposure point concentration (EPC) calculated is greater than maximum detected concentration; therefore maximum detected concentration is the EPC.
CRA 189: APPL
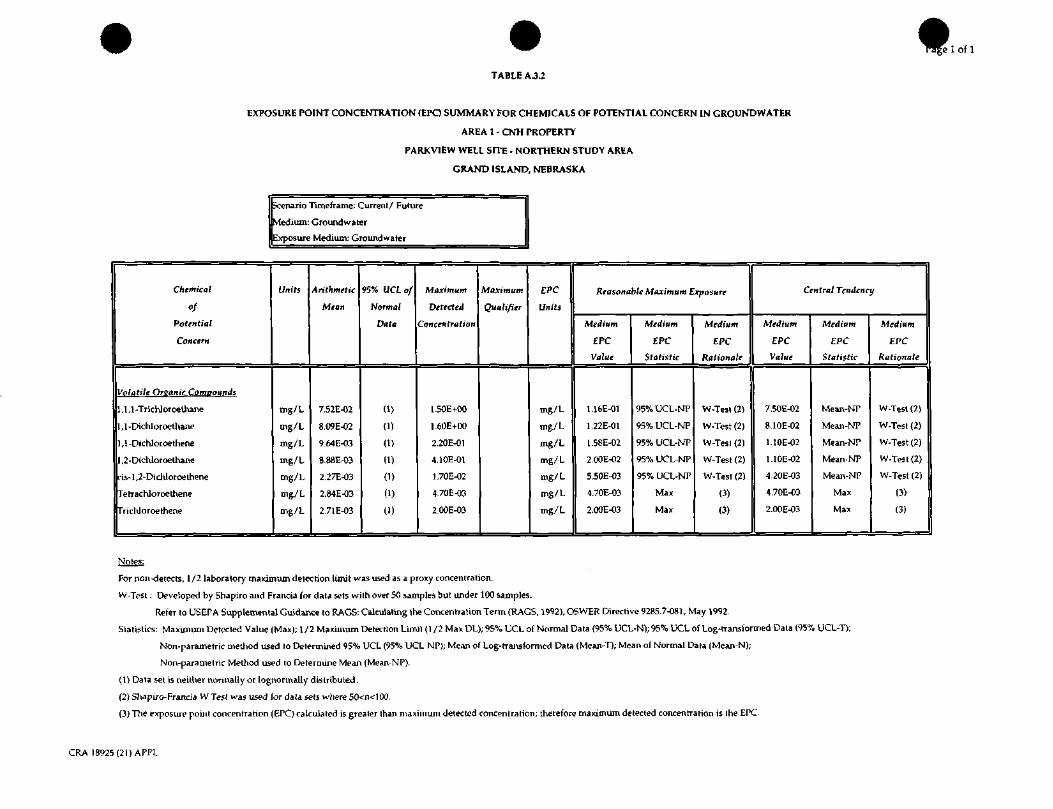
;e 1 of 1
TABLE AJ.2
AREA 1 - CNH PROPERTY
PARKVIEW WELL SITE - NORTHERN STUDY AREA
GRAND ISLAND, NEBRASKA
Scenario Timeframe: Current/ Future
Medium: Groundwater
Exposure Medium: Groundwater
Chemical
of
Potential
Concern
Volatile Organic Compounds
1 ,1 ,1 -Trichloroethane
1,1-Dichloroethane
1 ,1 -Dichloroethene
1 ,2-Dichloroe thane
cis- 1 ,2-Dichloroe thene
Tetrachloroethene
TriclUoroe thene
Units
mg/L
mg/L
mg/L
mg/L
mg/L
mg/L
mg/L
Arithmetic
Mean
7.52E-02
8.09E-02
9.64E-03
8.88E-03
2.27E-03
2.84E-03
2.71E-03
95% UCLof
Normal
Data
(1)
(1)
(1)
(1)
0)
(1)
(1)
Maximum
Detected
Concentration
1.50E+00
1.60E+00
2.20E-01
4.10E-01
1.70E-02
4.70E-03
2.00E-03
Maximum
Qualifier
EPC
Units
mg/L
mg/L
mg/L
mg/L
mg/L
mg/L
mg/L
Reasonable Maximum Exposure
Medium
EPC
Value
1.16E-01
1.22E-01
1.58E-02
2.00E-02
5.50E-03
4.70E-03
2.00E-03
Medium
EPC
Statistic
95% UCL-NF
95% UCL-NP
95% UCL-NP
95% UCL-NP
95% UCL-NP
Max
Max
Medium
EPC
Rationale
W-Test (2)
W-Test (2)
W-TesI (2)
W-Test (2)
W-Test (2)
(3)
(3)
Central Tendency
Medium
EPC
Value
7.50E-02
8.10E-02
1.10E-02
1.10E-02
4.20E-03
4.70E-03
2.00E-03
Medium
EPC
Statistic
Mean-NT
Mean-NP
Mean-NP
Mean-NP
Mean-NP
Max
Max
Medium
EPC
Rationale
W-Tesl (2)
W-Test (2)
W-Test (2)
W-Test (2)
W-Test (2)
(3)
(3)
Notes!
For non-delects, 1 /2 laboratory maximum detection limit was used as a proxy concentration.
W-Tcst: Developed by Shapiro and Francia for data sets with over 50 samples but under 100 samples.
Refer to USEPA Supplemental Guidance to RAGS'. Calculating the Concentration Term (RAGS, 1992), OSWER Directive 9285.7-081, May 1992.
Statistics: Maximum Detected Value (Max); 1/2 Maximum Detection Limit (1/2 Max DL); 95% UCL of Normal Data (95% UCL-N); 95% UCL of Log-transformed Data (95% UCL-T);
Non-parametric method used to Determined 95% UCL (95% UCL NP); Mean of Log-trajisformcd Data (Mean-T); Mean of Normal Data (Mean-N);
Non-parametric Method used to Determine Mean (Mean-NP).
(1) Data set is neither normally or lognormally distributed.
(2) Shapiro-Francia W Test was used for data sets where 50<n<100.
(3) The exposure point concentration (EPC) calculated is greater than maximum detected concentration; therefore maximum detected concentration is the EPC.
CRA 18925(21) APPL

Page 1 of 1
TABLE A.3.3
ESTIMATED AMBIENT AJR CONCENTRATIONS
AREA 1 - CNH PROPERTY
PARKVIEW WELL SITE - NORTHERN STUDY AREA
GRAND ISLAND, NEBRASKA
Chemical
1 , 1 ,1 -Trichloroethane
1,1-DichJoroe thane
1,1-Dichloroethene
],2-Dichloroe thane
cis-l,2-Dichloroethene
Tetrachloroethene
TrichJoroethene (former)
Trichloroethene (current)
Notes:
Groundwater
Concentration
(mgIL) (I)
1.16E-01
1.22E-01
1.58E-02
2.00E-02
5.50E-03
4.70E-03
2.00E-03
2.00E-03
Groundwater to
Ambient Air
Concentration
(liglm') (2)
7.09E-03
5.05E-03
1.53E-03
4.81E-04
2.15E-04
2.62E-04
9.55E-05
9.55E-05
Ambient Air
PRGs
{figlm'1 (3)
2.30E+03
5.20E+02
2.10E+02
7.40E-02
3.70E+01
3.20E-01
1.10E400
1.70E-02
Ratio of chemical
to Region 9 PRG
3.08E-06
9.72E-06
7.28E-06
6.50E-03
5.80E-06
8.18E-04
8.68E-05
5.62E-03
Comparison of
GW Ambient Air Cone,
to PRG
(Below/Above)
Below
Below
Below
Below
Below
Below
Below
Below
NA = Not Available
(1) Groundwater concentrations (RME Medium EPC) obtained from Table A.3.2.
(2) Ambient air concentrations obtained by multiplying the groundwater
concentrations by the chemical-specific Volatilization Factors (VFWJmb) calculated in Table A.3.4.
(3) USEPA Region 9 Preliminary Remedial Coal (PRG) Table for Ambient Air, October 20, 2004.
CRA 18925 (21) APPL
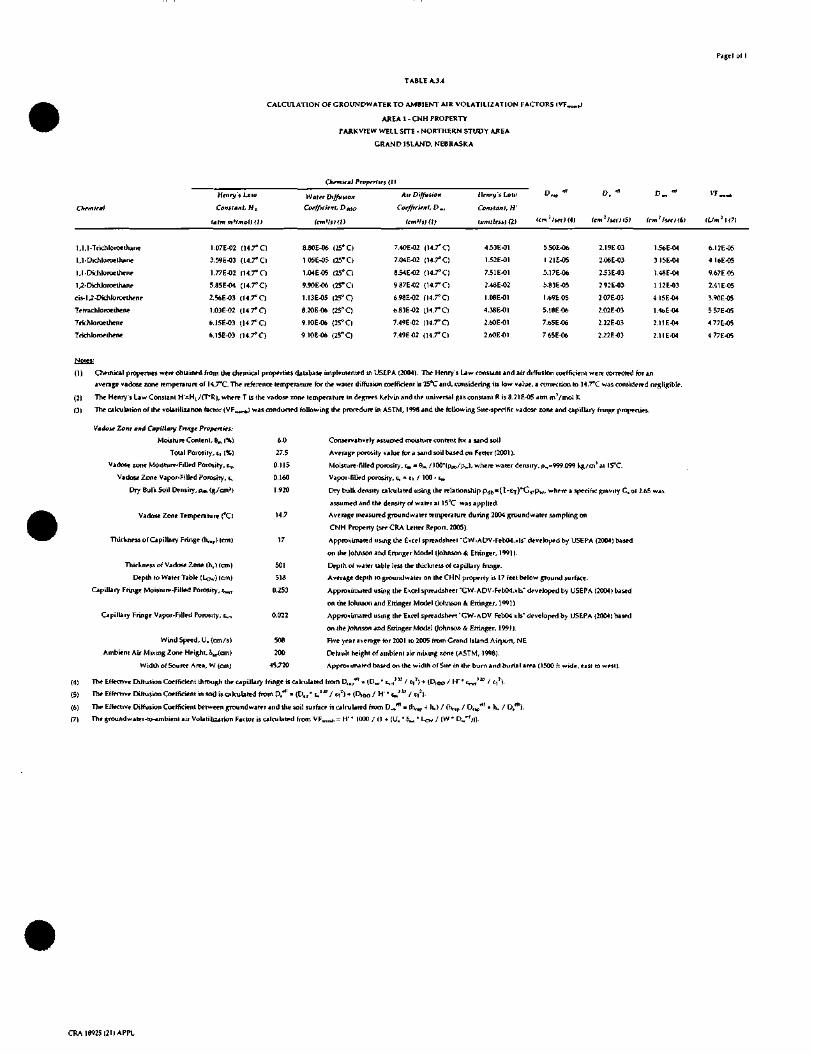
Page! of I
TABLE A.3.4
CALCULATION OF CROUNDWATER TO AMBIENT AIR VOLATILIZATION FACTORS (VT,,
AREA 1 - CNH PROPERTY
PARKVIEW WELL SITE - NORTHERN STUDY AREA
GRAND ISLAND, NEBRASKA
Chronical Properties (1)
Chemical
1,1,1-Trichloroethane
1,1-Dichloroethane
1,1-Dichloroethtnp
1,2-DichJoroetKartf
cis-l,2-DichJort*thfnf
Tftrachloroelhene
Trichlorwthene
Trichloroelhene
Henry's Law
Constant, HL
(aim m'lmolKll
1.07E-02 (14.7° C)
3.59E-03 (14.7° C)
1.77E-02 (14.7°C)
5.85E-04 (14.7° C)
2.56E-03 (14.7° C)
1.03E-02 (14.7° Q
6.15E-03 (14.7°C)
6.15E-03 (14.7°C)
Water Diffusion
Coefficient, DHjo
(cm'ls)Cl)
8.80E-06 (25° C)
1.05E-05 (25° C)
1.04E^>5 (25° Q
9.90E-06 (25° C)
1.13E-05 (25°Q
8.20E-06 (25° C)
9.10E-06 (25° C)
9.10E-06 (25°Q
Air Diffusion
Coefficient, D.,,
(cm'lsl <1>
7.40E-02 (14.7"Q
7.04E-02 (14.7° C)
8.54E-02 (14.7° Q
9.87E-02 (14.7° C)
6.98E-02 (14.rC)
6.83E-02 (14. rC)
7.49E-02 (14.7° C)
7.49E02 (14.7° C)
Henry's Law
Constant, H'
(unitless) (2)
4.53E-01
1.52E-01
7.51E-01
2.48E-02
i.osE-oi4.38E-01
2.60E-01
2.60E-01
Icm'/seiHtl
5.50E-06
1 21E-05
5.17E-06
5.83E-05
1.69EO5
5.1BE-06
7.65E-06
7.65E-06
D. "*
Icm' /seel 151
2.19EO3
2.08E-03
2.53E-03
2.92E-03
207E-03
2.02E-03
2.22E-03
2.22E-03
,111.56E-04
3.15E-W
1.48E-04
1 12E-03
4.15E-04
1.46E-04
2.11E-04
2.11E-04
tUm' 1(71
6.12E-06
4.16E-05
9.67E05
2.41 E-05
3.90E-05
5 57E<I5
4 77E-05
4.77E-05
Notes:
(1) Chemical properties weir obtained from the chemical properties database implemented in USEPA (2004). The Henry's Law constant and air diffusion coefficient were corrected for an
average vadose zone temperature of 14.7°C. The reference temperature for the water diffusion coefficient is 25°C and, considering its low value, a correction to 14.7°C was considered negligible.
(2) The Henry's Law Constanl H'=HL/fTR), where T is the vadosr zone temperature in degrees Kf Ivin and trip universal gas constant R is 8.21 E-05 atm mVmol K
(3) The calculation of the volatilization factor (VFw<fMl) was conducted following the procedure in ASTM, 1998 and the following Site-specific vadosr zone and capillary fringe properties.
(4)
(5)
(6)
(7)
Vadotf Zone and Capillary Fringe Properties:
Moisture Content, 9m (%} 6.0
Total Porosity, c, (%) 27.5
Vadose zone Moisture-Filled Porosity, c^ 0.115
Vadose Zone Vapor-Filled Porosity, t, 0.160
Dry Bulk Soil Density, pdb (g/cm») 1.920
Vadose Zone Temperature (°C) 14.7
Thickness of Capillary Fringe dv.p) (on) 17
Thickness of Vadose Zone (h,) (cm) 501
Depth to Water Table (Lew) (cm) 518
Capillary Fringe Moisture-Filled Porosity, t , 0.253
Capillary Fringe Vapor-Filled Porosity, c*n 0.022
Wind Speed, U. (cm/s) 508
Ambient Air Mwtng Zone Height, 5ur(cm) 200
Width of Source Area, W (cm) 45,720
The Effective Diffusion Coefficient through the capillary fringe is calculated from D[M,*" = (D,,, * i
The Effrctivr Diffusion Coefficient in soil is calculated from D/" = (Dtu' L.IX> / tT7) + (D^o / H'
ity, p>,=999.099 kg/m'ai 15°C.
*'Pw' where a specific gravity C, of 2.65
Conservatively assumed moisture content for a sand soil
Average porosity value for a sand soil based on Fetter (2001).
Moisture-filled porosity, = 6m /100*(pdb/pw), where water d<
Vapor-filled porosity, c, = eT / 100 -1^
Dry bulk density calculated using the relationship pdb=
assumed and the density of water at 15°C was applied.
Average measured ground water temperature during 2004 ground water sampling on
CNH Property (see CRA Letter Report, 2005).
Approximated using the Excel spreadsheet 'CW-ADV-Feb04.xls' developed by USEPA (2004) based
on the Johnson and Ettinger Model Johnson & Etringer, 1991).
Depth of water table less (he thickness of capillary fringe.
Average depth to groundwater on the CHN property is 17 feet below ground surface.
Approximated using the Excel spreadsheet •CW-ADV-FebO4.xls' developed by USEPA (2004) based
on the Johnson and E Hinge r Model (Johnson 4 Ettinger, 1991).
Approximated using the Excel spreadsheet 'CW-ADV Feb04.xls" developed by USEPA (2004) based
on the Johnson and Etringer Model (Johnson tt Ettinger, 1991).
Five year average for 2001 to 2005 from Grand Island Airport, NE
Default height of ambient air mix big zone (ASTM, 1998).
Approximated based on the width of Site in the bum and burial area (1500 ft wide, east to west).
"/•Vj-MDjoo/H"^133 /c,7).
,JU/CA
The Effective Diffusion Coefficient betw«n groundwater and the soil surface is calculated from D«rtl = (h, 4 h,) / (tv.p / Dflp
The groundwater-to-ambienl air Volatilizarion Factor is calculated from VFMmh = H" 1000 /(] + (U. • 6.,, •
+ hv / D."1).
CRA 18925 (21) APPL
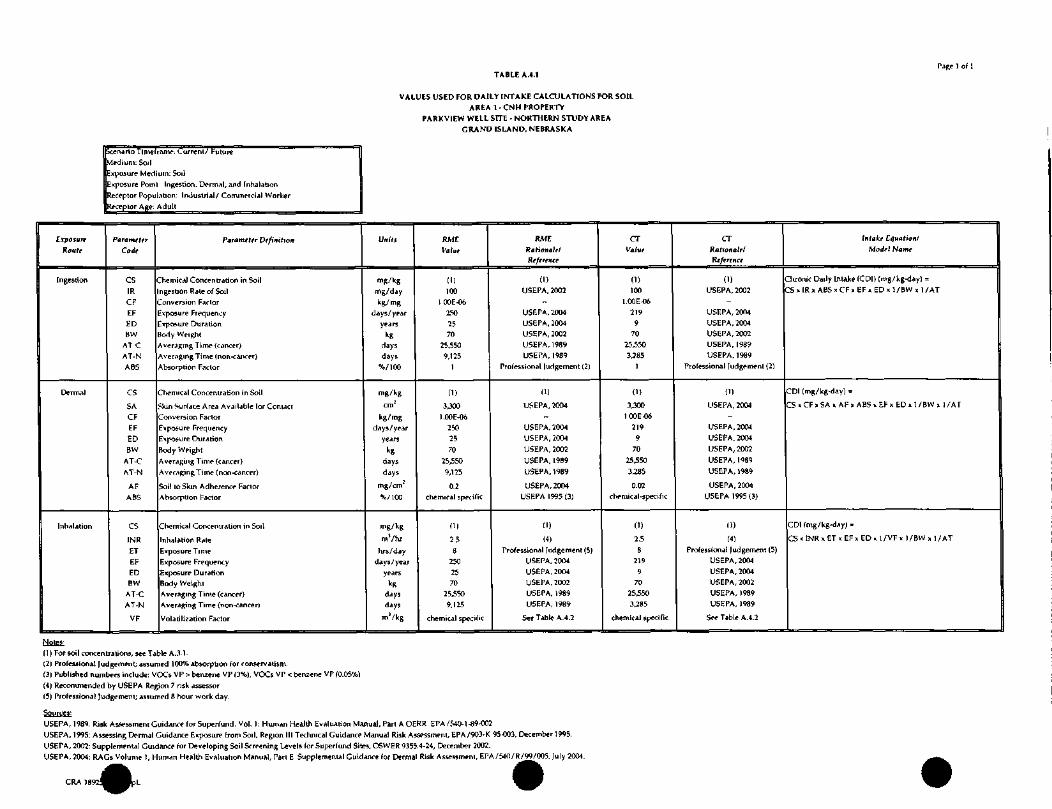
TABLE A.4.1Page 1 of 1
VALUES USED FOR DAILY INTAKE CALCULATIONS FOR SOILAREA 1 - CNH PROPERTY
PARKVIEW WELL SITE - NORTHERN STUDY AREA
GRAND ISLAND, NEBRASKA
Scenario Timeframe^ Current/ FutureMedium: Soil
Exposure Medium: Soil
Exposure Point: Ingestion, Dermal, and Inhalation
Receptor Population: Industrial/ Commercial Worker
Receptor Age: Adult
txposurrRoute
Ingesu'on
Dermal
Inhalation
ParameterCode
CS
IR
CF
EF
ED
BW
A T C
AT-N
ABS
CS
SA
CF
EF
ED
BW
AT-C
AT-N
AF
ABS
CS
1NR
ET
EF
ED
BW
AT-C
AT-N
VF
Parameter Definition
Chemical Concentration in Soil
ngestion Rate of SoilTon version Factor
Exposure Frequency^xposure DurationBody WeightAveraging Time (cancer)Averaging Time (non-cancer)Absorption Factor
Chemical Concentration in Soil
Skin Surface Area Available for ContactConversion Factor
Exposure Frequencyixposure Duration
Body WeightAveraging Time (cancer)
Averaging Time (non<ancer)
Soil to Skin Adherence FactorAbsorption Factor
Chemical Concentration in Soil
Inhalation Rate
Exposure TimeExposure FrequencyExposure DurationBody WeightAveraging Time (cancer)Averaging Time (non-cancer)
Volatilization Factor
Units
rng/kg
mg/daykg/mg
days/year
years
kgdaysdays
%/100
mg/kg
cm2
kg/mgdays/year
years
kgdays
days
mg/cm
%/100
mg/kg
mVhi
hrs/daydays/year
years
kgdaysdays
m'/kg
RME
Valur
(1)
100
1 OOE-06250
25
70
25.5509,125
1
(1)
3,3001. OOE-06
250
25
70
25,550
9,125
0.2
chemical specific
(1)
25
8
250
25
70
253509,125
chemical specific
RArtRationale/Reference
(1)
USEPA, 2002
-
USEPA, 2004USEPA, 2004USEPA, 2002USEPA, 1989USEPA, 1989
Professional Judgement (2)
(1)
USEPA, 2004
-
USEPA, 2004USEPA, 2004
USEPA, 2002
USEPA, 1989
USEPA, 1989
USEPA, 2004USKPA 1995 (3)
(1)
(4)
Professional Judgement (5)USF-PA, 2004USEPA, 2004USEPA. 2002USEPA, 1989USEPA, 1989
Set Table A.4.2
CT
Valur
(1)
100
l.OOE-06219
9
70
25,550
3,2851
(1)
3,300l.OOE-06
219
9
70
25,550
3,285
0.02chemical-specific
(1)
2.5
8
219
9
70
25,5503,285
chemical specific
CT
Rationale/Reference
0)USEPA, 2002
-
USEPA, 2004USEPA, 2004USEPA, 2002
USEPA, 1989USEPA, 1989
Professional Judgement (2)
(1)
USEPA, 2004
-
USEPA. 2004USEPA, 2004
USEPA, 2002
USEPA, 1989
USEPA, 1989
USEPA, 2004USEPA 1995(3)
(1)
(4)
Professional Judgement (5)USEPA, 2004USEPA, 2004USEPA, 2002USEPA, 1989USEPA, 1989
See Table A.4.2
Intake Equation!Mattel Name
Clironic Daily Intake (GDI) (mg/kg-day) =CS x IR x ABS x CF x EF x ED x 1/BW x 1 /AT
CDI (mg/kg-day) =
C S x C F x S A x A F x A B S x E F x E D x l / B W x I/AT
CDI (mg/kg-day) -
C S x l N R x E T x E F x E D x l / V F x l / B W x l / A T
Notes
(1) For soil concentrations, see Table A.3.1.(2) Professional Judgement; assumed 100% absorption for conservatism.
(3) Published numbers include: VOCs VP > benzene Vp (3%), VOCs VP < benzene VP (0.05%).
(4) Recommended by USEPA Region 7 risk assessor
(5) Professional Judgement; assumed 8 hour work day.
Sources:
USEPA, 1989: Risk Assessment Guidance for Superfund. Vol. 1: Human Health Evaluation Manual, Part A OERR EPA/540-1-89-002.
USEPA, 1995: Assessing Dermal Guidance Exposure from Soil, Region III Technical Guidance Manual Risk Assessment, EPA/903-K 95-003. December 1995.
USEFA, 2002: Supplemental Guidance for Developing Soil Screening Levels for Superfund Sites, OSWER 9355-4-24, December 2002.
USEPA, 2004: RAGs Volume 1, Human Health Evaluation Manual, Part E Supplemental Guidance for Dermal Risk Assessment, EPA/540/R/99/OQ5, Ju ly 2004.
CRA 18'

TABLE A.4.2
AREA 1 - CNH PROPERTY
PARKVIEW WELL SITE - NORTHERN STUDY AREA
GRAND ISLAND. NEBRASKA
rage 1 of I
Industrial/ Commercial Worker
VF: Soil-to-Aii Volatilization Factor
( 2 x ^ x 0 , )
Where: VF = soil-to-air volatilization fartoi
Q/C«j = inverse of mean cone - centre of square source
DA = apparent diffusivity
T = exposure interval
rb = soil dry bulk density
DA: Apparent Diffusivity
DA =
Where: DA = apparent diffusivity
Q, = air-filled porosity
0» = water-filled porosity
n = total soil porosity
fb = soil dry bulk density
H' = dimensionless Henry's Law Constant
Dj = diffusivity of chemical x in air
Dw = diffusivity of chemical x in water
Kj = soil-water partition coefficient
Kd: Soil-Water Partition Coefficient
Reference
Equation 4-8, USEPA, 2002
See Table A 4.3
Equation 4-8, USFPA, 2002
USEPA, 2002
Appendix F
Units
0
|
-_~-
1
151 -
V0
OX
2£
m*/kg 3.25E+03 3.39E*03 3.80E+03
(g/m'-sec)/(kg/m') 82.59 82.59 82.59
rmVs 1 08E-03 9.98E-04 7.92E-04
s 7.88E+08 7.88E-KJ8 7.88E+08
g/cm' 1.920 1.920 1.920
Equation 4-8, USEPA, 2002
Appendix F
Appendix F
Appendix F
Appendix F
USEPA, 2002
USEPA, 2002
USEPA, 2002
USEPA, 2002
Units
cm'/s
unitless
unitless
unitless
g/cm'
unitless
cm'/s
cmVs
cm'/g
1.08E-03
0.160
0.115
0.275
1.920
0.705
0.078
8.80E-06
6.60E-01
9.98E-W
0.160
0.115
0.275
1.920
0.23
0.0742
1.05E-05
1.90E-01
7.92E-04
0.160
0.115
0.275
1.920
0.754
0.072
8.20E-06
9.30E-01
Units
Where: Kj = soil-water partition coefficient
K,. = soil organic carbon-water partition coefficient
fn = organic content of soil
USEPA, 2002
USEPA, 2002
USEPA, 2002
rmVg
cmVg
g/8
6.60E-01
110
0.006
1.90E-01
31.6
0.006
9.30K-01
155
0.006
USEPA, 2002: Supplemental Guidance for Developing Soil Screening Levels (or Superfund Sites, Office of Emergency and Remedial Response, OSWEK 9355.4-24, December 2002.
CRA 18925(21) AppL
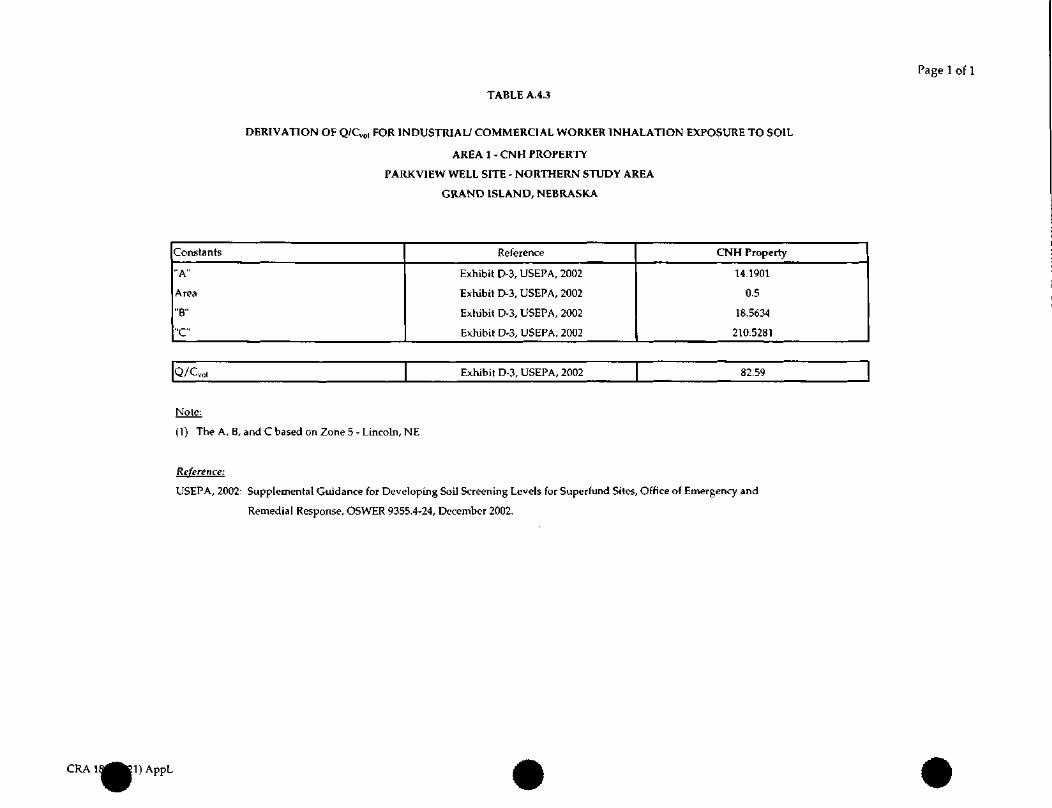
Page 1 of 1
TABLE A.4.3
DERIVATION OF Q/Q,,, FOR INDUSTRIAL/ COMMERCIAL WORKER INHALATION EXPOSURE TO SOIL
AREA 1 - CNH PROPERTY
PARKVIEW WELL SITE - NORTHERN STUDY AREA
GRAND ISLAND, NEBRASKA
Constants
"A"
Area
"B"
"C"
Reference
Exhibit D-3, USEPA, 2002
Exhibit D-3, USEPA, 2002
Exhibit D-3, USEPA, 2002
Exhibit D-3, USEPA, 2002
CNH Property
14.1901
0.5
18.5634
210.5281
Q/C™, Exhibit D-3, USEPA, 2002 82.59
Note:
(1) The A, B, and C based on Zone 5 - Lincoln, NE
Reference:
USEPA, 2002: Supplemental Guidance for Developing Soil Screening Levels for Superfund Sites, Office of Emergency and
Remedial Response, OSWER 9355.4-24, December 2002.
CRA1 1) AppL
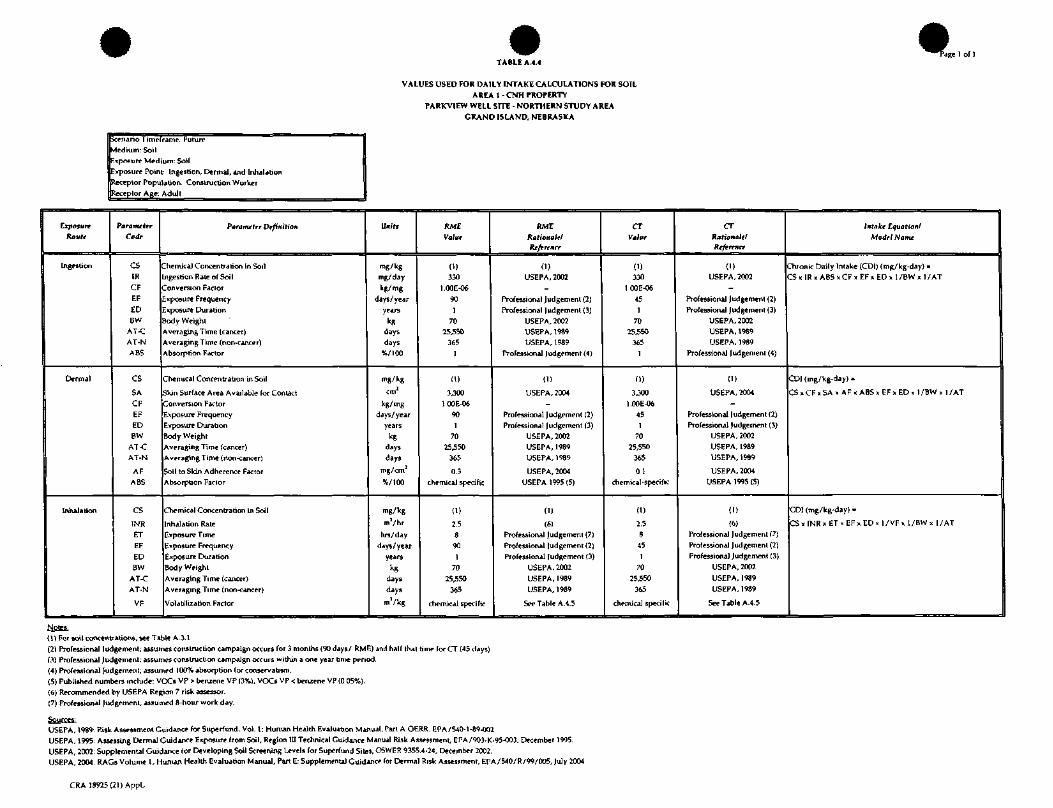
TABLE A.4.4fce 1 of 1
VALUES USED FOR DAILY INTAKE CALCULATIONS FOR SOIL
AREA 1 - CNH PROPERTY
PARKVIEW WELL SITE - NORTHERN STUDY AREA
GRAND ISLAND, NEBRASKA
Scenario Timeframe; Future
Medium: Soil
Exposure Medium: Soil
Exposure Point Ingesbon, Dermal, and Inhalation
Receptor Population. Construction WorVer
Receptor Age: Adult
ExposureRoute
Ingestion
Dermal
Inhalation
ParameterCode
CS
IR
CF
EF
EDBW
AT-C
AT-N
ABS
CS
SA
CF
EF
EDBW
ATCAT-N
AF
ABS
CS
INR
ET
EF
EDBW
AT-C
AT-N
VF
Parameter Definition
Chemical Concentration in Soil
ngestion Rate of Soil
Conversion Factor
Exposure Frequency
[xposure Duration
Body Weight
Averaging Time (cancer)
Averaging Time (non-cancer)
Absorption Factor
Chemical Concentration in Soil
Skin Surface Area Available for Contact
Conversion Factor
exposure Frequency
Exposure Duration
Body Weight
Averaging Time (cancer)
Averaging Time (non-cancer)
Soil to Skin Adherence Factor
Absorption Factor
Chemical Concentration in Soil
inhalation Rate
Exposure Time
Exposure Frequency
Exposure Duration
Body Weight
Averaging Time (cancer)
Averaging Time (non-cancer)
Volatilization Factor
Units
mg/kg
mg/day
tg/mg
days/year
years
kg
days
days
%/100
mg/kg
cm'
kg/mg
days/year
years
kg
days
days
mg/cm2
%/100
mg/kg
m'/hr
hrs/day
days /year
years
kg
days
days
m'/kg
RME
Valve
(1)330
l.OOE-06
90
1
7025,550
3651
(1)
3,300
l.OOE-06901
7025,550
365
0.3
chemical specific
(1)
2.5
8
90
1
70
25,550
365
chemical specific
RMT
Rationale!Reference
0)USEPA, 2002
-
Professional Judgement (2)Professional Judgement (3)
USEPA, 2002VJSEPA, 1989USEPA, 1989
Professional Judgement (4)
(1)
USEPA, 2004-
Professional Judgement (2)Professional Judgement (3)
USEPA, 2002USEPA, 1989USEPA, 1989
USEPA, 2004
USEPA 1995 (5)
(1)
(6)Professional Judgement (7)
Professional Judgement (2)Professional Judgement (3)
USEPA, 2002USEPA, 1989
USEPA, 1989
See Table A.4.5
CTValue
(1)330
l.OOE-06
451
7025550
3651
(1)
3,300l.OOE-06
451
7025,550
365
0.1chemical-specific
(1)
2.5
845
1
70
25,550365
chemical specific
CT
Rationale/Reference
(1)USEPA, 2002
-
Professional Judgement (2)
Professional Judgement (3)USEPA, 2002USEPA, 1989USEPA, 1989
Professional Judgement (4)
(')
USEPA, 2004
-
Professional Judgement (2)Professional Judgement (3)
USEPA, 2002USEPA, 1989USEPA, 1989
USEPA, 2004
USEPA 1995 (5)
(1)
(6)Professional Judgement (7)
Professional Judgement (2)Professional Judgement (3)
USEPA, 2002
USEPA, 1989USEPA, 1989
See Table A.4.5
Intake LquationI
Model Name
Chronic Daily Intake (CDl) (mg/kg-day) =CS x IR x ABS x CF x EF x ED x 1/BW x 1 /AT
CDI (mg/kg-day) =
C S x C F x S A x A F x A B S x E F x E D x l / B W x l / A T
CDl (mg/kg-day) =
C S x I N R x E T x E F x E D x 1/VFx 1/BWx I/ AT
Notes:(1) For soil concentrations, see Table A.3.1.
(2) Professional Judgement: assumes construction campaign occurs for 3 months (90 days/ RME) and ha l f that time for CT (45 days)(3) Professional Judgement; assumes construction campaign occurs within a one year time period.
(4) Professional Judgement; assumed 100% absorption for conservatism.
(5) Published numbers include: VOCs VP > benzene VP (3%), VOCs VP < benzene VP (0.05%).(6) Recommended by USEPA Region 7 risk assessor.
(7) Professional Judgement, assumed 8-hour work day.
Sources:USEPA, 1989. Risk Assessment Guidance for Superfund. Vol. 1: Human Health Evaluation Manual, Part A OERR. EPA/540-1-89-002.
USEPA, 1995: Assessing Dermal Guidance Exposure from Soil, Region 111 Technical Guidance Manual Risk Assessment, EPA/903-K-95-003, December 1995.
USEPA, 2002: Supplemental Guidance for Developing Soil Screening Levels for Superfund Sites, OSWER 9355.4-24, December 2002.USEPA, 2004. RAGs Volume 1, Human Health Evaluation Manual, Part E: Supplemental Guidance lor Dermal Risk Assessment. EPA/540/R/99/005, July 2004
CRA 18925 (21) AppL
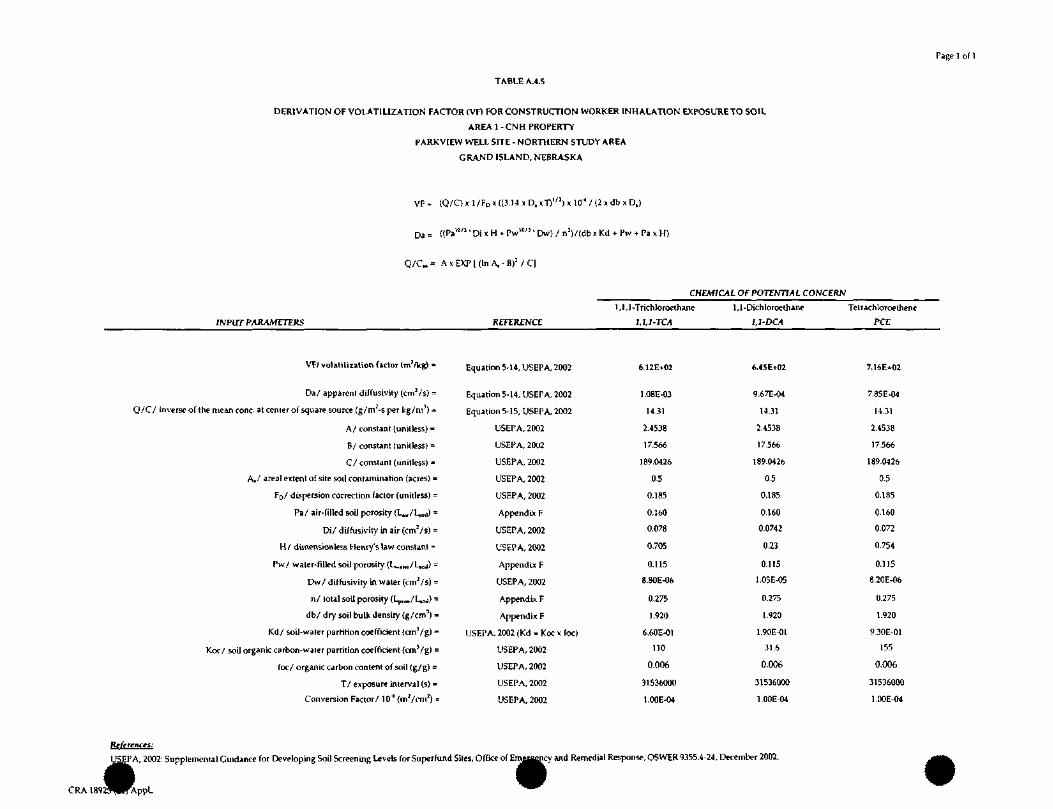
Page 1 of 1
TABLE A.4.5
DERIVATION OF VOLATILIZATION FACTOR (VF) FOR CONSTRUCTION WORKER INHALATION EXPOSURETO SOIL
AREA 1 - CNH PROPERTY
PARKVIEW WELL SITE - NORTHERN STUDY AREA
GRAND ISLAND, NEBRASKA
VF- (Q/Qxl /FpxKS.MxD.xTW 10"1 / (2 x db x D.)
Da = ((Pa""'' Di x H * Pw""'' Dw) / n ;)/(db x Kd +• Pw + Pa x H)
/CU = A x E X P [ ( l n A , - B ) 2 / C l
CHEMICAL OF POTENTIAL CONCERN
INPUT PARAMETERS
VF/ volatilization factor (m'/kg) =
Da/ apparent diffusiviry (cmVs) =
Q/C/ inverse of the mean cone- at center of square source (g/m:-s per kg/m3) -
A/ constant (unilless) =
B/ constant (unitless) =
C/ constant (unitless) =
A,/ areal extent of site soil contamination (acres) =
FD/ dispersion correction factor (unitless) =
Pa/ air-filled soil porosity (L.,,/!^,,,) -
Di/ diffusivity in air (cmVs) =
H/ dimensionless Henry's law constant =
Pw/ water-filled soil porosity (L^Kf/l-^j) =
Dw/ diffusivity in water (cmVs) =
n/ total soil porosity (Lpor./L.oj) -
db/ dry soil bulk density (g/cm1) =
Kd/ soil-water partition coefficient (cm'/g) =
Koc/ soil organic carbon-water partition coefficient (cmVg) =
foe/ organic carbon content of soil (g/g) =
T/ exposure interval (s) =
Conversion Factor/ 10"* (mVcm2) =
REFERENCE
Equation 5-14, USEPA, 2002
Equation 5-14, USEPA, 2002
Equation 5-15, USEPA, 2002
USEPA, 2002
USEPA, 2002
USEPA, 2002
USEPA, 2002
USEPA, 2002
Appendix F
USEPA, 2002
USEPA, 2002
Append ix F
USEPA, 2002
Appendix F
Appendix F
USEPA, 2002 (Kd = Koc x foe)
USEPA, 2002
USEPA, 2002
USEPA, 2002
USEPA, 2002
1,1,1-Trichloroe thane
1.1,1 -TCA
6.12E+02
1 .08E-03
14.31
2.4538
17.566
189.0426
0.5
0.185
0.160
0.078
0.705
0.115
8.80E-06
0.275
1.920
6.60E-01
no0.006
31536000
l.OOE-04
1,1-Dichloroc thane
1,1-DCA
6.45E+02
9.67E-04
14.31
2.4538
17.566
189.0426
0.5
0.185
0.160
0.0742
0.23
0.115
1.05E-05
0.275
1.920
1.90E-01
31.6
0.006
31536000
l.OOE-04
Tetrachloroethene
PCE
7.16E*02
7.85E-04
14.31
2.4538
17.566
189.0426
0.5
0.185
0.160
0.072
0.754
0.115
8.20E-06
0.275
1.920
9.30E-01
155
0.006
31536000
1 .OOE-04
:PA, 2002: Supplemental Guidance for Developing Soil Screening Levels for Superfund Sites, Office of Eme^ncy and Remedial Response, OSWER 9355.4-24, December 2002.
*
V,20I
>PPL
.me^^ncy

^^»ge 1 of 1
TABLE A.4.6
VALUES USED FOR DAILY INTAKE CALCULATIONS FOR GROUNDWATER
AREA 1 - CNH PROPERTY
PARKVIEW WELL SITE • NORTHERN STUDY AREA
GRAND ISLAND, NEBRASKA
Scenario Timeframe: Future
Medium: Groundwater
Exposure Medium: Ambient Air
Exposure Poinf. Inhalation
Receptor Population: Construction Worker
Receptor Age: Adult
Exposure Route
Inhalation
Parameter
Code
CAA
INR
ET
EF
ED
BW
AT-C
AT-N
Parameter Definition
Chemical Concentration in Ambient Air modeled from Groundwater
Inhalation Rate
Exposure Time
Exposure Frequency
Exposure Duration
Body Weight
Averaging Time (cancer)
Averaging Time (non-cancer)
Ufiifs
mg/m3
nvVhr
hrs/day
days/year
years
^days
days
RME
Value
(1,2)
2.5
8
90
1
70
25,550
365
RME
Rationale/
Reference
(1,2)
USEPA, 2002
Professional Judgement (3)
Professional Judgement (4)
Professional Judgement (5)
USEPA, 2002
USEPA, 1989
USEPA, 1989
CT
Value
(1,2)
2.5
8
45
1
70
25,550
365
CT
Rationalef
Reference
(1.2)
USEPA, 2002
Professional Judgement (3)
Professional Judgement (4)
Professional Judgement (5)
USEPA, 2002
USEPA, 1989
USEPA, 1989
Intake Equation!
Model Name
CDI (mg/fcg-day) =
CAA x INRx ET x EF x ED x 1/BW x I/ AT
Notes:
(1) For trench ambient air concentrations, see. Table A.4.7. For foundation excavation ambient air concentrations, see Table A.4.9.
(2) Modeled assuming no free standing water in the foundation excavation or trench scenarios, vapor migrate through soil.
(3) Professional Judgement; assumed 8-hour work day.
(4) Professional Judgement; assumes construction campaign occurs for 3 months (90 days/ RME) and half that time for CT (45 days).
(5) Professional Judgement; assumes construction campaign occurs within a one year time period.
Sources:
USEPA, 1989: Risk Assessment Guidance for Superfund. Vol. 1: Human Health Evaluation Manual, Part A OERR EPA/540-1-89-002.
USEPA, 2002: USEPA Supplemental Guidance for Developing Soil Screening Levels for Superfund Sites, OSWER 9355.4-24, December 2002.
CRA 18925 (21) APPL
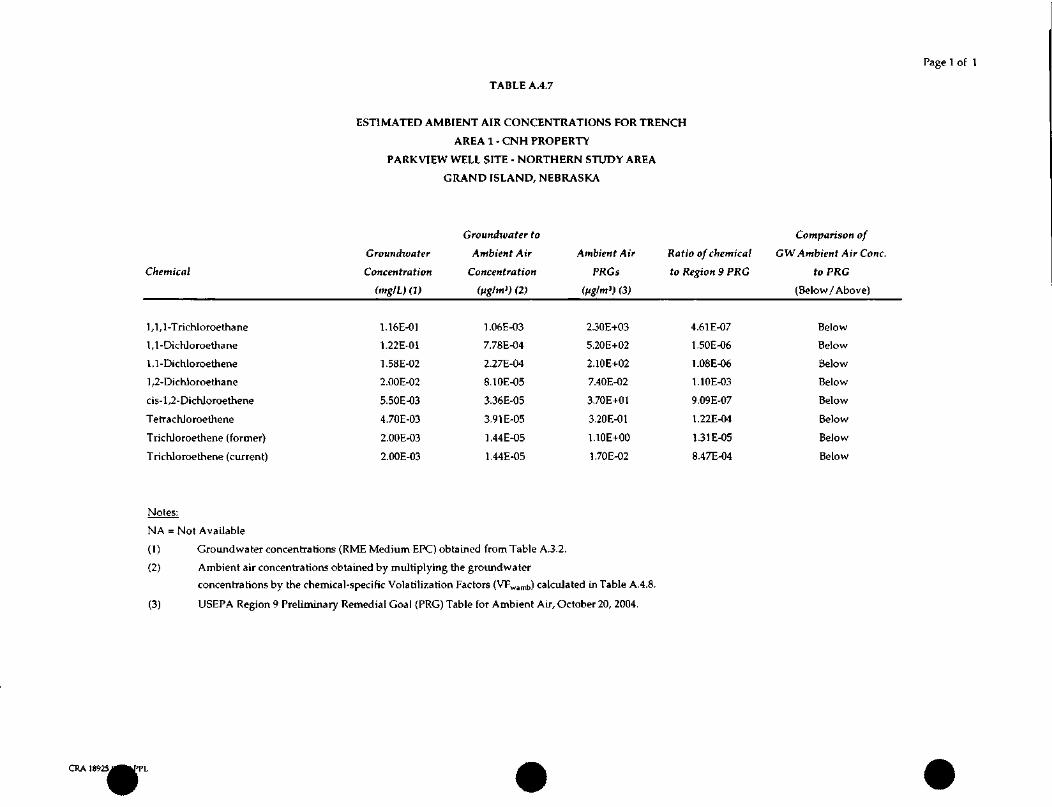
Page 1 of 1
TABLE A.4.7
ESTIMATED AMBIENT AIR CONCENTRATIONS FOR TRENCH
AREA 1 - CNH PROPERTY
PARKVIEW WELL SITE - NORTHERN STUDY AREA
GRAND ISLAND, NEBRASKA
Chemical
1,1,1 -TrichJoroetha ne
1,1-DichJoroethane
1 , 1 -Dichloroethene
1 ,2-Dichloroethane
cis-l,2-DicKloroethene
Tetrachloroethene
Trichloroethene (former)
Trichloroethene (current)
Notes:
Groundwater
Concentration
(mg/L) (I)
1.16E-01
1.22E-01
1.58E-02
2.00E-02
5.50E-03
4.70E-03
2.00E-03
2.00E-03
Groundwater to
Ambient Air
Concentration
(ftg/m1) (2)
1.06E-03
7.78E-04
2.27E-04
8.10E-05
3.36E-05
3.91E-05
1.44E-05
1.44E-05
Ambient Air
PRGs
(pglm3) (3)
2.30E+03
5.20E+02
2.10E+02
7.40E-02
3.70E+01
3.20E-01
1.10E+00
1.70E-02
Ratio of chemical
to Region 9 PRG
4.61E-07
1.50E-06
1.08E-06
1.10E-03
9.09E-07
1.22E-04
1.31E-05
8.47E-04
Comparison of
GW Ambient Air Cone,
to PRG
(Below/Above)
Below
Below
Below
Below
Below
Below
Below
Below
NA = Not Available
(1) Groundwater concentrations (RME Medium EPC) obtained from Table A.3.2.
(2) Ambient air concentrations obtained by multiplying the groundwater
concentrations by the chemical-specific Volatilization Factors (VFwamb) calculated in Table A.4.8.
(3) USEPA Region 9 Preliminary Remedial Goal (PRG) Table for Ambient Air, October 20, 2004.
CRA 18925,SJ^WTL
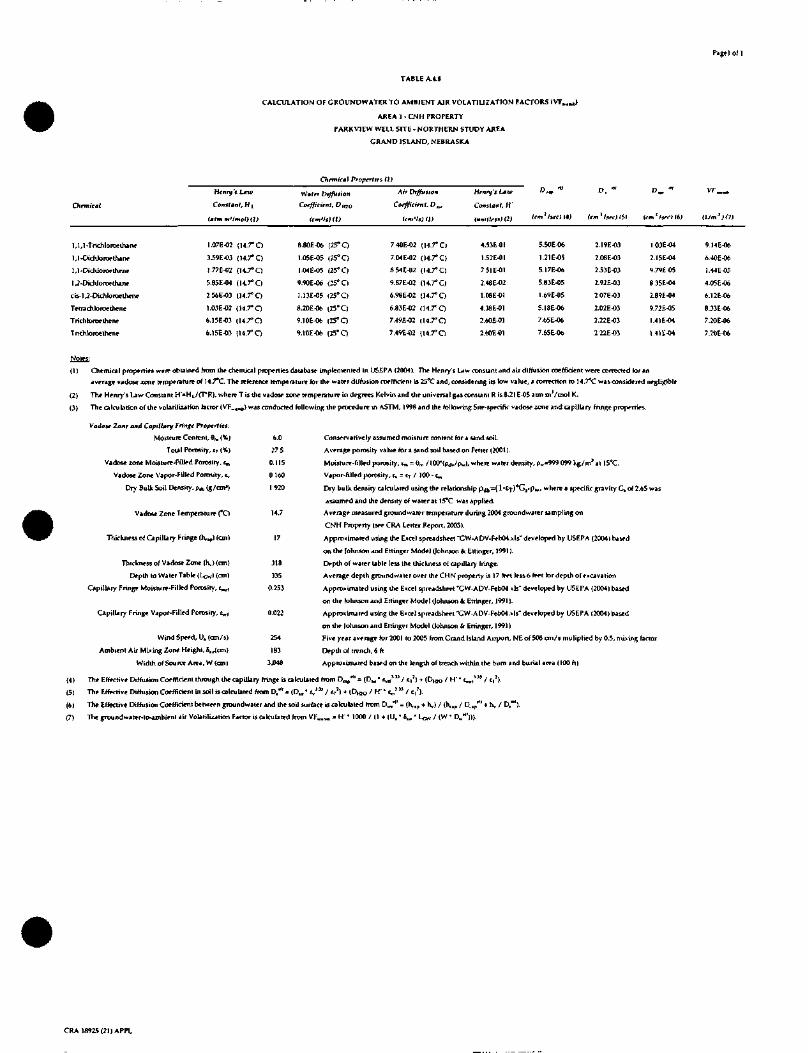
Pagtl ol 1
TABLE A.4.8
CALCULATION OF CROUNDWATER TO AMBIENT AIR VOLATILIZATION FACTORS (VT.,.
AREA 1 - CNH PROPERTY
FARK VIEW WELL SITE - NORTHERN STUDY AREA
GRAND ISLAND, NEBRASKA
Chemical Properties tit
Chemicat
1,1,1-Trichloroe thane
1,1-Ehchloroelhane
1,1-Dichlorocthrne
1 ,2-Dichloroethane
cis-l,2-Dichloroethene
Tetrachloroethene
Trichloroelhene
Trichloroethene
Henry's Law
Constant, H L
tatm m>lmol)tl)
1.07E-02 (14.7°C)
3.59E-03 (14.rQ
1.77E-02 (14.7° C)
5.85E-04 (14.rQ
2.56E-03 (H.rC)
1.03E-02 (14.ro
6.15E-03 (14.rQ
6.15E-03 (14.rO
Water Diffusion
Coefficient. Dmo
Icm'/fXll
8.80E-06 (25° O
1.05E-05 (25° O
1.04E-05 (25° O
9.90E-06 (25° O
1.13E-05 (25°O
8.20E-06 (25° C)
9.10E-06 (25° C)
9.10E-06 |25° O
Air Diffusion
Coefficient. D,.,
Irm'IsXll
7.40E-02 (M.rC)
7.04E-02 (147°O
854E-02 (H.rC)
9.87E-02 (14.rC)
6.98E-02 (H.rC)
6.83E-02 (14.rO
7.49E-02 (14.rC)
7.49E-02 (14.rO
Henry's Law
Constant, H'
iunillessl I2>
4.S3E-01
1.52E-01
751E-01
2.48E-02
108E-OI
4.38E-01
2.60E-01
2.M)E-01
D,, •"
tcm'lfectUt
5.50E-06
1.21E-05
5.I7E-06
5.83E-05
1.69E-05
5.18E-06
7.65E-06
7.65E-06
D. "
(cm ' /sec) <!>>
2.19E-03
2.08E-03
2.53E-03
2.92E-03
2.07E-03
2.02E-03
2.22E-03
2.22E-03
(fm 1 lsefX6)
103E-04
2.15E-O4
9.79E05
835E-04
2.89E-04
9.72E-05
1.41E-04
1.41t-04
VI' ^^
(um ' i nt
9.14E-06
6.40E-06
1.44EC5
4.05E-06
6.12E-06
8.33E-06
7.20E-06
7.20E-06
Notes:
(1) Chemical properties were obtained from the chemical properties database implemented in USEPA (2004). The Henry's Law constant and air diffusion coefficient were corrected for an
average vadose zone temperature of 14.7°C. The reference temperature for the water diffusion coefficient is 25°C and, considering its low value, * correction to 14.7°C was considered negligible.
(2) The Henry's Law Constant H'=HL/(T*R), where T is the vadosr zone temperature in degrees Kelvin and the universal gas constant R is8.21E-05 atm mVmol K.
(3) The calculation of the volatilization factor (VFMmb) was conducted following the procedure in ASTM, 1998 and the following Site-specific vadose zone and capillary fringe properties.
(4)
(5)
(6)
(7)
osf Zont and Capillary Fringe Properties:
Moisture Content, 6^ (%)
Total Porosity, IT (%)
Vadose zone Moisture-Filled Porosity, c,,,
Vadose Zone Vapor-Filled Porosity, c.
Dry Bulk Soil Density, Pab (g/on*)
6.0 Conservatively assumed moisture content for a sand soil.
275 Average porosity value fora sand soil based on Fetter (2001).
0.115 Moisture-filled porosity, £„, = Om /100-(Pdb/pw), where water density, pw=999 099 kg/m3 at 15°C.
0 160 Vapor-filled porosity, c* = t7 / 100 - £„,
1 920 Dry bulk density calculated using the relationship pdb=(l~cT)*Gi*Pw/ where a specific gravity C. of 2.65 was
assumed and the density of water at 15*C was applied.
14.7 Average measured groundwater temperature during 2004 groundwsrer sampling on
CNH Property (SM- CRA Letter Report, 2005).
17 Approximated using the Excel spreadsheet "CW-ADV-Feb04.xls" developed by USEPA (2004) based
on the Johnson and Ettinger Model (Johnson & Ettinger, 1991).
318 Depth of water table less the thickness of capillary fringe.
335 Average depth groundwater over the CHN property is 17 feet less 6 feri for depth of excavation
0.253 Approximated using the Excel spreadsheet "GW-ADV-Feb04.xls" developed by USEPA (2004) based
on the Johnson and Ettinger Model (Johnson & Ettinger, 1991).
0.022 Approximated using the Excel spreadsheet "CW-ADV-Feb04.xls- developed by USEPA (2004) based
on the lohnson and Ettinger Model (Johnson & Ettinger, 1991)
254 Five year average for 2001 to 2005 from Grand Island Airport, NE of 508 cm/s muliplied by 0.5, nii>ing factor
183 Depth of trench, 6 ft
3,04fl Approximated based on the length of trench within the bum and burial area (100 ft)
The Effective Diffusion Coefficient through the capillary fringe is calculated from D^*' = (D,,,* (W*"/ CiJ) + (DH^ / H1 • c™,3" / c,1).
The Effective Diffusion Coefficient in soil is calculated from D,*" = (D.B* t/*1/ eTJ) + (D^ci / H'" cn.3U / cT
7).
The Effective Diffusion Coefficient between groundwarer and the soil surface is calculated from D^' = (h^p + hj / (h,,p / D. *11 + h^ / D."").
The groundwater-to-ambient air Volatilization Factor is calculated from VFwirnb = H1 * 1000 / (1 + (U.' 6.,,' LCW / (W ' D,/"))).
Vadose Zone Temperature (°C)
Thickness of Capillary Fringe (h,.,,) (on)
Thickness of Vadose Zone (hj (on)
Depth to Water Table (Lew) (cm)
Capillary Fringe Moisture-Filled Porosity, c^,
Capillary Fringe Vapor-Filled Porosity, i^,
Wind Speed, U. (cm/s)
Ambient Air Mi*ing Zone Height, S^on)
Width of Source Area. W (on)
CRA 18925(21) APPL
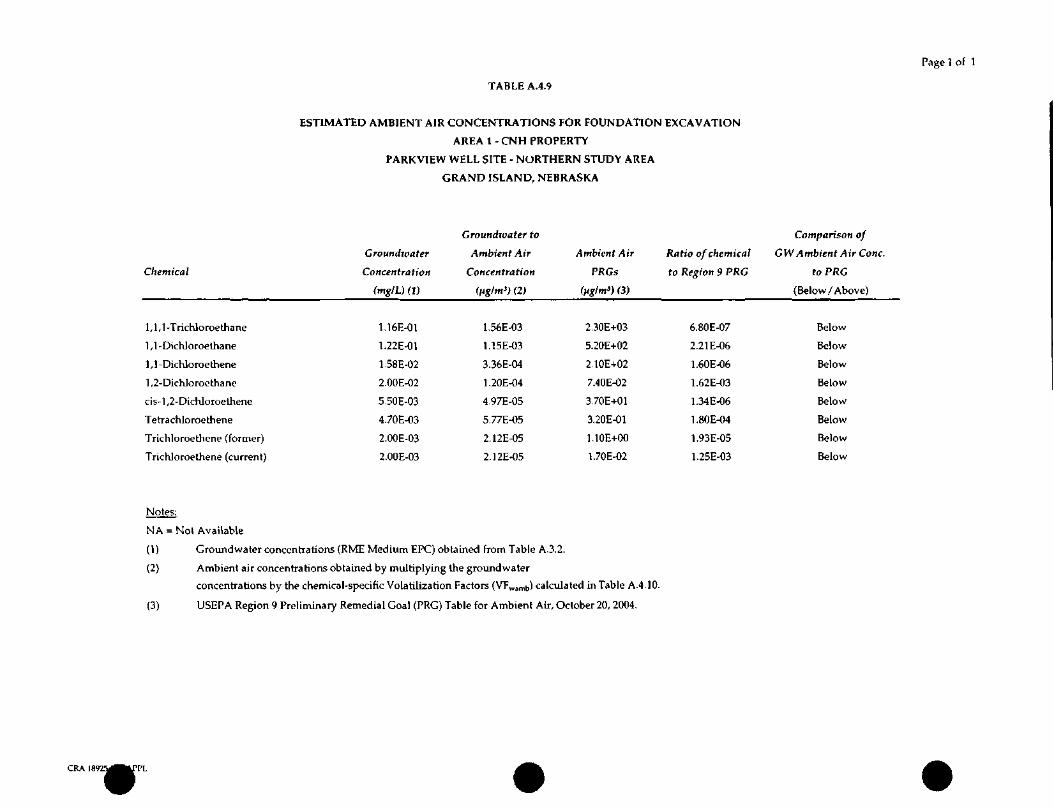
Page 1 of 1
TABLE A.4.9
ESTIMATED AMBIENT AIR CONCENTRATIONS FOR FOUNDATION EXCAVATION
AREA 1 - CNH PROPERTY
PARKVIEW WELL SITE - NORTHERN STUDY AREA
GRAND ISLAND, NEBRASKA
Chemical
1,1, 1-Trichloroe thane
1 ,1 -Dichloroethane
1,1-Dichloroethene
1,2-Dichloroe thane
cis-l,2-DicKloroethene
Tetrachloroethene
Trichloroethene (former)
TrichJoroethene (current)
Notes:
Groundwater
Concentration
(mg/L) (1)
1.16E-01
1.22E-01
1.58E-02
2.00E-02
5.50E-03
4.70E-03
2.00E-03
2.00E-03
Groundwater to
Ambient Air
Concentration
(Hg/m3) (2)
1.56E-03
1.15E-03
3.36E-04
1.20E-04
4.97E-05
5.77E-05
2.12E-05
2.12E-05
Ambient Air
PRGs
()iglm>) (3)
2.30E+03
5.20E+02
2.10E+02
7.40E-02
3.70E+01
3.20E-01
1.10E+00
1.70E-02
Ratio of chemical
to Region 9 PRO
6.80E-07
2.21E-06
1.60E-06
1.62E-03
1.34E-06
1.80E-04
1.93E-05
1.25E-03
Comparison of
GW Ambient Air Cone.
toPRG
(Below/Above)
Below
Below
Below
Below
Below
Below
Below
Below
NA = Not Available
(1) Groundwater concentrations (RME Medium EPC) obtained from Table A.3.2.
(2) Ambient air concentrations obtained by multiplying the groundwater
concentrations by the chemical-specific Volatilization Factors (VFwamb) calculated in Table A.4.10.
(3) USEPA Region 9 Preliminary Remedial Goal (PRG) Table for Ambient Air, October 20, 2004.
CRA IS1I92UMUT
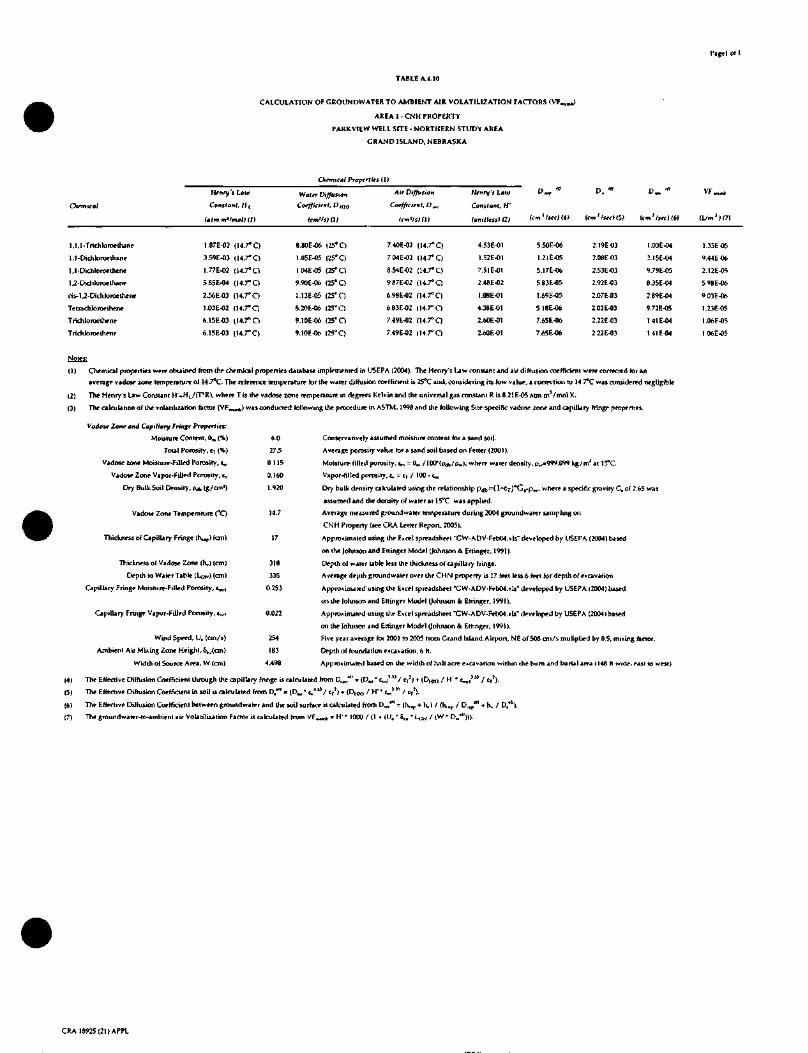
TABLE A.4.10
CALCULATION OF GROUNDWATER TO AMBIENT AIR VOLATILIZATION FACTORS (VT...
AREA 1 - CNH PROPERTY
PARKVIEW WELL SITE - NORTHERN STUDY AREA
GRAND ISLAND, NEBRASKA
Pjgel of 1
Chemical Properties (I)
Chemical
1,1.1-Trichloroelhane
1,1 -Dichlorce thane
l.l-Dichkm>ethene
1,2-Dichloroethane
cis- 1 ,2 - Dichloroe thene
TetrachJoroelhene
Trichloroethene
Trichloroethene
Notts:
Henry's Law
Constant, HI
farm m'fmolKJ)
1.07E-02
3.59E-03
1.77E-02
5.85E-04
2.56E-03
1.03E-02
6.15E-03
6.15E-03
(i4.ro(14.7° C)
(14.7°Q
(i4.ro(i4.ro(u.ro(i4.ro(i4.ro
Water Diffusion
Coefficient, D Hlo
(cm'/stat
8.80E-06
1.05E-05
l.ME-05
9.90E-06
1.13E-05
8.20E-06
9.10E-06
9.10E-06
(25° O
(25° C)
(25° Q
(25° Q
(25° C)
(25° O
(25° Q
(25° C)
Mr Diffusion
Coefficient^,,,
tcm'lsKl)
7.40E-02
704E-02
8.54E-02
9.87E-02
6.98E-02
6.83E-02
7.49E-02
7.49E-02
(1 ) Che mical properties were obtained from the chemical properties database implementrd in USEPA (?004).
d4.rod4.rod4.rod4.rod4.rod4.roii4.roii4.ro
The Henry's Lav
Henry's Law £>„, "'
Constant, H'
tun,llessll2) Icm'lseclHI
4.53E-01
1.52E-01
7.51 E-01
2.48E-02
1.08E-01
4.3BE-01
2.60E-01
2.60E-01
5JOE-06
1.21E-05
5.17E-06
5.83E-05
1.69E-05
5.18E-06
7.65E )6
7.65E-06
i constant and air diffusion coefficient '
average vadose zone tempera tun? of 14.7°C. The reference temperature for the water diffusion coefficient u> 25°C and, considering its low
(2) The Henry's Law Constant H'=HL/(T*R), where T is the vadose zone temperature in degrees Kel
(3) The calculation of the volatilization factor (VFW
D. *" D,. *"
(cm'/«er)(5) (cm ' /sec 1 (61
2.19E03
2.08E-03
2.53E-03
2.92E-03
2.07E-03
2.02 E-03
2.22E-03
222E-03
1.03E-04
3.I5E-04
9.79E^)5
8.35E-04
2.89E-04
9.72E-05
I41E-04
1.41E-04
(Um ' > (71
1.35ETO
9.44EO6
2.12E-05
598E-06
903E-06
1.23E-05
1.06E-05
1 06E-05
were corrected for an
value, a conrction to 14 re was considerwl negligible.
vin and the universal gas constant R is8.21E-05 abn mVmol K.
lmb) was conducted following the procedure in ASTM, 1998 and the following Site-specific vadose zone and capillary fringe properties.
(4)
(5)
(6)
(7)
Vadosf Zone and Capillary Fringr Propfrt its:
Moisture Content, Om (%)
Tout Porosity, eT (%)
Vadose zone Moisture-FilJed Poro&ity, L^
Vadose Zone Vapor-Filled Porosity, ty
Dry Bulk Soil Density, pdb (g/cm1)
6.0 Conservatively assumed moisture content for a sand soil.
275 Average porosity value fora sand soil based on Fetter (2001).
0.115 Moisture-filled porosity, t^ = Om /100*(pdb/pw), where water density, p«=999.099 kg/m jat 15°C.
0.160 Vapor-filled porosity, c. = c, / 100-c™
1.920 Dry bulk density calculated using the relationship p^=(\-C-j)*Gtapwi where a specific gravity C. of 2.65 was
assumed and the density of water at 15°C wasapplted.
14.7 Average measured pound water temperature during 20O4 ground water sampling on
CNH Property (see CRA Letter Report, 2005).
17 Approximated using the E»cel spreadsheet "CW-ADV-Feb04.»ls" developed by USEPA (2004) based
on the Johnson and Ettinger Model (Johnson & Ettinger, 1991).
318 Depth of water table less the thickness of capillary fringe.
335 Average depth ground water over theCHN property is 17 feet less 6 feet for depth of excavation
0.253 Approximated using the Excel spreadsheet -CW-ADV-Feb04.xls" developed by USEPA (2004) based
on die Johnson and Ettinger Model (Johnson & Ettinger, 1991).
0.022 Approximated using the Excel spreadsheet •CW-ADV-Feb04.xls" developed by USEPA (2004) based
on the Johnson and Ettinger Model (Johnson & Ettinger, 1991).
254 Five year average for 2001 to 2005 from Grand Island Airport, NE of 508 cmA muliplied by 0.5, mixing factor.
183 Depth of foundation excavation, 6 ft.
4/198 Approximated based on the width of hali acre excavation within the bum and burul area (148 h wide, rjst to west)
The Effective Diffusion Coefficient through the capillary fringe is calculated from DriT)*" = (D.u * t+H3" / L^)+ (Dtt>o / H'* e™,313 / tT
3).
The Effective Diffusion Coefficient in soil is calculated from D.*" = (D.,,* tv33J/ cT7) + (Dioo / H1' e,,,3" / CT
J).
The Effective Diffusion Coefficient between groundwarerand the soil surface is calculated from D^*" = (h.,p + hj / (h,.p / Dllp*" + h, / D/").
The groundwater-to-ambientair Volatiliurion Factor is calculated from VF..^ = H' • 1000 / (1 + |U.' 6.B * U^ / (W Dw*"))).
Vadose Zone Temperature (°C)
Thickness of Capillary Fringe (ht tp) (cm)
Thickness of Vadose Zone (Jv} (cm)
Depth to Water Table (Lew) (cm)
Capillary Fringe Moisture-Filled Porosity, t^
Capillary Fringe Vapor-Filled Porosity, tvtf
Wind Speed, U. (on/s)
Ambient Air Mixing Zone Height, 5lif(cm)
Width of Source Area, W (cm)
CRA 18925 (21JAPPL

TABLE A.7.1.CT
Page 1 of 1
CENTRAL TENDENCY
AREA 1 - CNH PROPERTY
PARKVIEW WELL SITE - NORTHERN STUDY AREA
GRAND ISLAND, NEBRASKA
Scenario Timeframe: Current/Future
Receptor Population: industrial/ Commercial Worker
Receptor Age: Adult
Medium
Soil
Medium Total
Erposurr Medium
Soil
Lxposurr Point
CNH Property
Exposure Route
Ingesbon
Exp. Route Total
Derm.il
Exp. Route Total
Chemical of
Potential Concern
,1,1 Trichloroethane
,1 -Dichloroe thane
"etrachloroethene
,1 , 1 -Tnchloroe thane
,1 -Dichloroethane
Tetrachloroethene
FPC
Value
3.60E-02
4.90E-02
1.50E-02
Units
mg/kg
mg/kg
mg/kg
3.60E-02
4.90E-02
1.50E-02
mg/kg
mg/kg
mg/kg
[[Exposure Point Total
Exposure Medium Total
Ambient Air Vapors Inhalation
Exp. Route Total
1 ,1 ,1 -Trichloroethdne
1 ,1 -Dichloroe thane
Tetrachloroethene
3.60E-02
4.90E-02
1.50E-02
mg/kg
mg/kg
mg/kg
Exposure Point Total
Exposure Medium Total
Cancer Risk Calculations
ntake/Erposure Concentration
Value
3.97EO9
5.40E-09
1 .65E-09
7.86E-11
1.07E-10
5.46E-13
Units
mg/kg-d
mg/kg-d
mg/kg-d
mg/kg-d
mg/kg-d
mg/kg-d
CSFIUnit Risk
Value
5.70E-03
5.40E-01
Units
(mg/kg-d)-l
(mg/kg-d)-l
(mg/kg-d)-l
5.70EO3
5 40E-01
(m6/kg-d)-l
(mg/kg-d)-l
{mg/kg-d)-l
2.44E-07
3.19E-07
8.69E-08
mg/kg-d
mg/kg-d
mg/kg-d
5.70E-03
2.10E-02
(mg/kg-d)-l
(mg/kg-d)-l
(mg/kg-d)-l
Total of Receptor Risks Across All Media
Cancer Risk
NC
3.08E-11
8.93E-10
9.23E-10
NC
6.09E-13
2.95E-13
9.04E-13
9.24E-10
9.24E-10
NC
1.82E-09
1.82E-09
3.ME-09
3.ME-09
3.64E-09
4.57E-09
4.6E-09
Non-Cancer Hazard Calculations
ntaketExposure Concentration
Value
3.09E-08
4.20E-08
1 29E-08
Units
mg/kg-d
mg/kg-d
mg/kg-d
RfDIRfC
Value
2.80E-01
2.00E-01
l.OOE-02
6.11E-10
8.32E-10
4.24E-12
mg/kg-d
mg/kg-d
mg/kg-d
2 80E-01
2.00E-01
l.OOE-02
Units
mg/kg-d
mg/kg-d
mg/kg-d
mg/kg-d
mg/kg-d
mg/kg-d
1.90E-06
2.48E-06
6.76E-07
mg/kg-d
mg/kg-d
mg/kg-d
6.30E-01
1 40E-01
l.OOE-02
mg/kg-d
mg/kg-d
mg/kg-d
Total of Receptor Hazards Across All Media
Hazard
Quotient
1.10E-07
2.10E-07
1.29E06
1.61E-06
2 18E-09
4.16E-09
4.24E-10
6.76E-09
1.61E-06
1.61E-06
3.01E-06
1.77E-05
6.76E-05
8.83E-05
8.83E-05
8.83E-05
8.99E-05
9.0E-05
Notes:
NC = Not Calculated
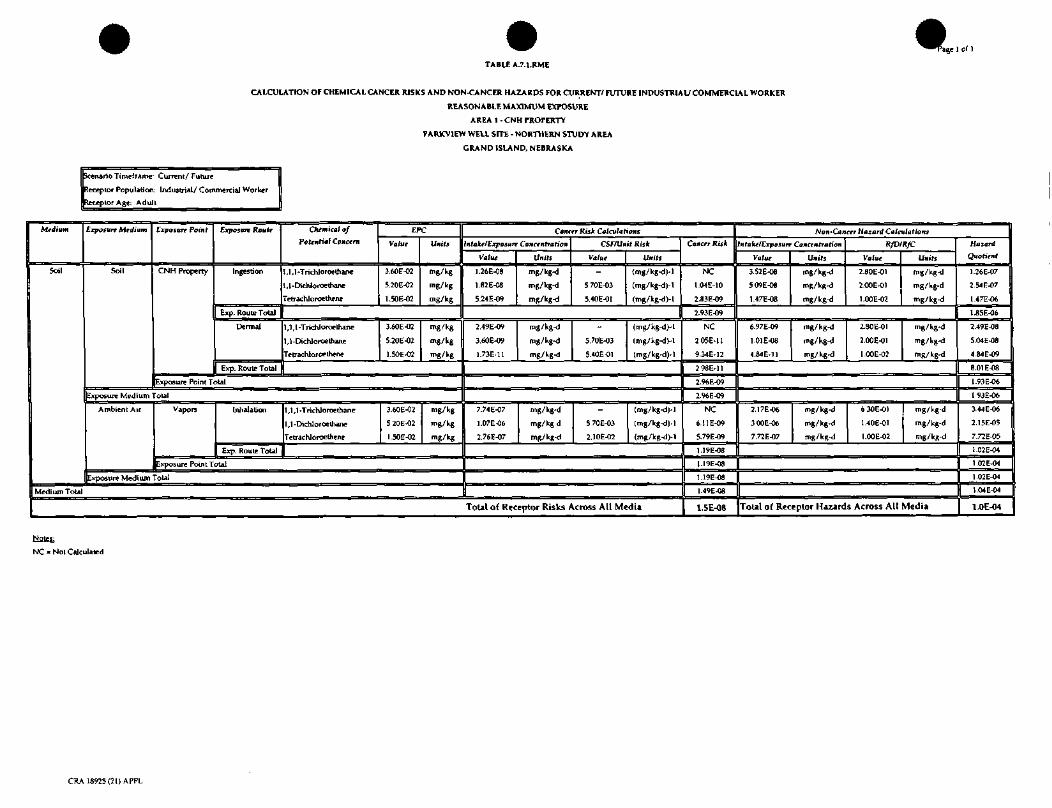
TABLE A.7.1.RME
^^^ag 1 of 1
REASONABLE MAXIMUM EXPOSURE
AREA 1 • CNH PROPERTY
PARKVIEW WELL SITE - NORTHERN STUDY AREA
GRAND ISLAND, NEBRASKA
Scenario Timeframe: Current/ Future
Receptor Population: Industrial/ Commercial Worker
Receptor Age: Adult
Medium
Soil
Exposure Medium
Soil
,,
Exposure Point
CNH Property
Exposure Route
Ingestion
Exp. Route TotaJ
Dermal
Exp. Route Total
Chemical of
Potential Concern
,1,1 -TrichJoroethane
,1-Dichloroethane
Tetrachloroethene
1,1,1-TrichJoroethane
1,1-Dichloroethane
Tetrachloroethene
EPC
Value
3.60E-02
5.20E-02
1.50E-02
Units
mg/kg
mg/kg
mg/kg
3.60E-02
5.20E-02
1.50E-02
mg/kg
mg/kg
mg/kg
ixposure Point Total
Exposure Medium Total
Ambient Air Vapors Inhalation
Exp. Route TotaJ
1,1, 1-Trichloroe thane
1,1-Dichloroethane
TetrachJoroethene
3.60E-02
5.20E-02
1.50E-02
mg/kg
mg/kg
mg/kg
Exposure Point Total
Exposure Medium Total
Medium Total
Cancer Risk Calculations
ntakelExposure Concentration
Value
1.26E-08
1.82E-08
5.24 E-09
Units
mg/kg-d
mg/kg-d
mg/kg-d
CSF/Uitif Risk
Value
5.70E-03
5.40E-01
Units
(mg/kg-d)-l
(mg/kg-d)- 1
(mg/kg-d)-l
2.49E-09
3.60E-09
1.73E-11
mg/kg-d
mg/kg-d
mg/kg-d
5.70E-03
5.40EO1
(mg/kg-d)-l
(mg/kg-d)-l
(mg/kg-d)-l
7.74E-07
1.07EO6
2.76E-07
mg/kg-d
mg/kg d
mg/kg-d
5.70E-03
2.10E-02
(mgAg-d)-l
(mg/kgKl).l
(mg/kg-d)-l
ToUl of Receptor Risks Across All Media
Cancer Risk
NC
1.04E-10
2.83E-09
2.93E-09
NC
2.05E-11
9.34E-12
298E-11
2.96E-09
2.96E-09
NC
6.11E-O9
5.79E-09
1.19E-08
1.19E-08
1.19E-08
1.49E-08
1.5E-08
Non-Cancer Hazard Calculations
ntake/Cxposure Concentration
Value
3.52E-08
509E-08
1.47E-08
6.97E-09
1.01E-08
4.84E-11
Units
mg/kg-d
mg/kg-d
mg/kg-d
mg/kg-d
mg/kg-d
mg/kg-d
RfDIRfC
Value
2.80E-01
2.00E-01
l.OOE-02
2.80E-01
2.00E-01
l.OOE-02
Units
mg/kg-d
mg/kg-d
mg/kg-d
mg/kg-d
mg/kg-d
mg/kg-d
2.17E-06
300E-06
7.72E-07
mg/kg-d
mg/kg-d
mg/kg-d
6.30E-OI
1.40E-01
l.OOE-02
mg/kg-d
mg/kg-d
mg/kg-d
Total of Receptor Hazards Across All Media
Hazard
Quotient
1.26E-07
2.54E-07
1.47E-06
1.85E-06
2.49E-08
5.04 E-08
4. 84 E-09
8.01 E-08
1.93E-06
1.93E-06
3.44E-06
2.15E-05
7.72E-05
1.02E-04
1.02E-04
1.02E-04
1.04E-04
l.QE-04
Notes:
NC = Not Calculated
CRA 18925(21) APPL
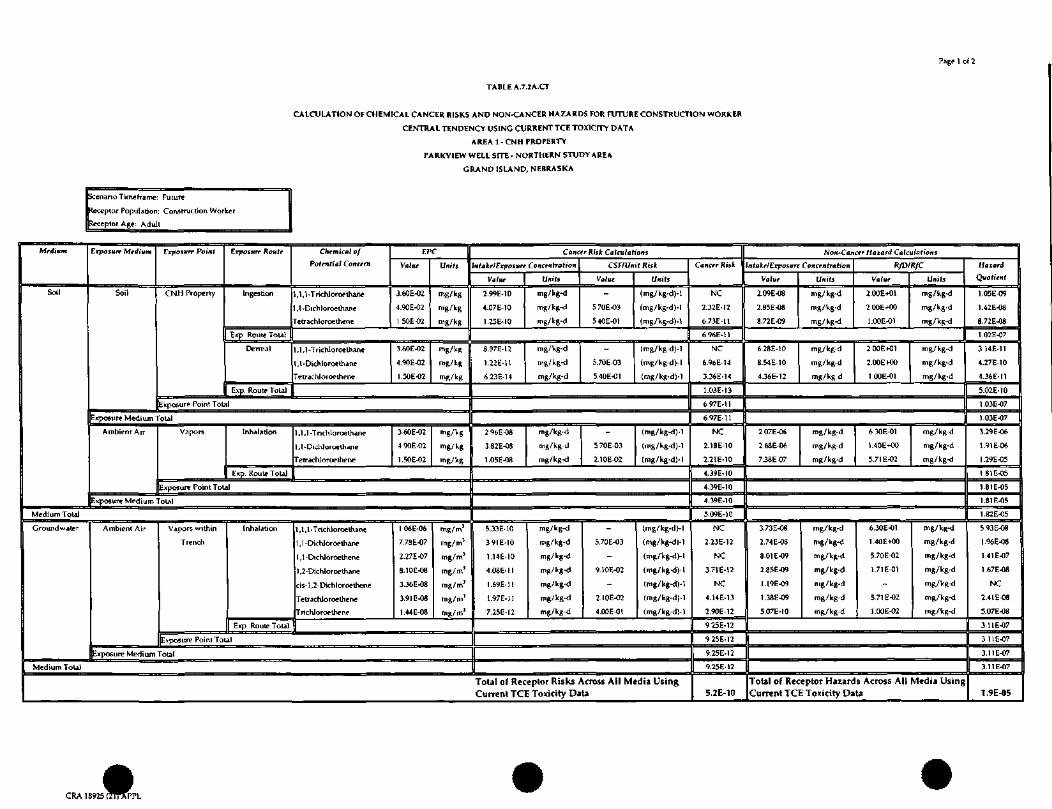
TABLE A.7.2A.CT
Pagel of 2
CALCULATION OF CHEMICAL CANCER RISKS AND NON-CANCER HAZARDS FOR FUTURE CONSTRUCTION WORKER
CENTRAL TENDENCY USING CURRENT TCE TOXICITY DATA
AREA 1 - CNH PROPERTY
PARKVIEW WELL SITE - NORTHERN STUDY AREA
GRAND ISLAND, NEBRASKA
Scenario Timeframe: Future
Receptor Population: Construction Worker
Receptor Age: Adult
Medium
Soil
Exposure Medium
Soil
Exposure Point
CNH Property
Exposure Route
Ingestion
Exp Route Total
Dermal
Exp. Route Total
Exposure Point Total
Chemical of
Potential Concern
1,1,1 -Trichlorop thane
,1-Dichloroethajie
felrachloroethene
El'C
Value
3.60E-02
4.90E-02
.50EO2
Unit;
mg/kg
mg/kg
mg/kg
1,1,1-Trichloroe thane
1,1-Dichloroethane
Tetrachloroethene
3.60E-02
4.90E-02
1.50E-02
mg/kg
mg/kg
mg/kg
Exposure Medium Total
Ambient Air Vapors Inhalation
Exp. Route Total
Exposure Point Total
1,1,1 -Tnchloroethane
,1-Dicliloroe thane
Tetrachloroelhene
3.60E-02
490E-02
1.50E-02
mg/kg
nig/ kg
mg/kg
Exposure Medium Total
Medium Tola]
Groundwater Ambient Air Vapors within
Trench
Inhalation
Exp. Route Total
Exposure Point Total
,1,1 -Tnchloroethane
1,1-Dichloroethane
1,1-Dichloroethene
1,2-Dichloroe thane
cis-l,2-Dichloroethene
Tetrachloroethene
Trichloroethene
1 06E-06
7.78E-07
2.27E-07
8.10E-08
3.36E-08
3.91 E-08
1.44E-08
mg/m3
mg/m3
mg/m3
mg/m1
mg/m 3
mg/m'
mg/m3
Exposure Medium Total
Medium Total
Cattctr Risk Calculations
ntakel Exposure Concentration
Value
2.99E-10
4.07E-10
1.25E-10
Units
mg/kg-d
mg/kg-d
mg/kg-d
CSr/Unit Risk
Value
5.70E-03
5.40E-01
Units
(mg/kg-d)-l
(mg/kg-d)-l
(mg/kg-d)-l
8.97IM2
1.22E-1I
6.23E-14
mg/kg-d
mg/kg-d
mg/kg-d
5.70E-03
5.40E-01
(mg/kg-d)-l
(mg/kg-d)-l
(mg/kg-d)-l
296E-08
3.82E-08
1.05E-08
mg/kg-d
nig/kg-d
mg/kg-d
5 70E-03
2.10E-02
(mg/kg-d)-l
(mg/kg-d)-l
(mg/kg-d)-l
5.33E-10
391E-10
1.14E-10
4.08E-11
1.69E-11
1.97E-11
7.25E-12
mg/kg-d
mg/kg-d
mg/kg-d
mg/kg-d
mg/kg-d
mg/kg-d
mg/kg-d
5.70 E-03
9.10E-02
2.IOE-02
4.00E-OI
(mg/kg-d)-l
(mg/kg-d)-l
(mg/kg-d)-l
(mg/kg-d)-l
(mg/kg-d)-l
(mg/kg-d)-l
(mg/kg-d)- 1
Total of Receptor Risks Across All Media UsingCurrent TCE Toxicity Data
Cancer Risk
NC
2.32E-12
6.73E-11
6.96E-11
NC
6.96E-14
3.36E-14
1.03E-13
6.97E-11
6.97E-11
NC
2.18E-10
2.21E-10
4.39E-10
4.39E-10
4.39E-10
5.09E-10
NC
2.23E-12
NC
3.71E-12
NC
4.14E-13
2.90E-12
925E-12
9.2SE-12
9.25E-12
9.25E-12
5.2E-10
Non-Cancer Hazard Calculations
ntaketErposure Concentration
Value
2.09E-08
2.85E-08
8.72E-09
Units
mg/kg-d
mg/kg-d
mg/kg-d
RfD/RfC
Value
2.00E+01
200E+OO
l.OOE-01
Units
mg/kg-d
mg/kg-d
mg/kg-d
6.28E-10
8.54E-10
4.36E-12
mg/kg-d
mg/kg-d
mg/kg d
2.00E-K11
2.00EKX)
l.OOE-01
mg/kg-d
mR/kg-d
mg/kg-d
2 07E-06
268E-06
7.38EO7
mg/kg-d
mg/kg-d
mg/kg-d
630E-01
1.40E-KK)
5.71 E-02
mg/kg-d
mg/kg-d
mg/kg-d
3.73E-08
2.74E-08
8.01 E-09
2.85E-09
1.I9E-09
\.3SE-W
5.07E-IO
mg/kg-d
mg/kg-d
mg/kg-d
mg/kg-d
mg/kg-d
mg/kg-d
mg/kg-d
6.30E-01
1.40E+00
5.70E-02
1.71E-01
5.71 E-02
l.OXJE-02
mg/kg-d
mg/kg-d
mg/kg-d
mg/kg-d
mg/kg-d
mg/kg-d
mg/kg-d
Hazard
Quotient
1.05E-09
1.42E-08
8.72E-08
1.02E-07
3.14E-11
4.27E-10
4.36E-I1
5.02E-10
1.03E-07
1.03E-07
3.29E-06
1.91E-06
1.29E-05
1.81 E-05
1.81E-05
1.81 E-05
1.82E-05
5.93E-08
1.96E-08
1.41E-07
1.67E-08
NC
2.41 E-08
5.07E-08
3.11E-07
3.11E-07
S 3.11E-07
3.11E-07
Total of Receptor Hazards Across All Media UsingCurrent TCE Toxicity Data 1.9E-05
CRA18925sfiWfppi
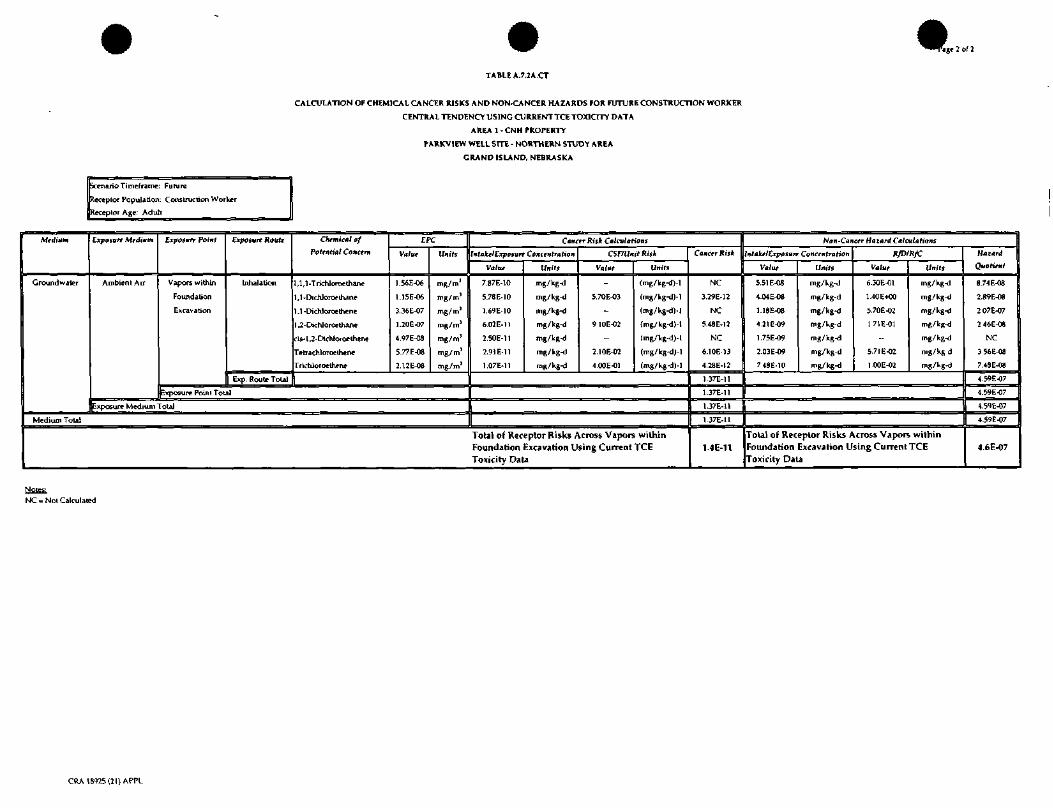
^^Koige 2 of 2
TABLE A.7.2A.CT
CENTRAL TENDENCY USING CURRENT TCE TOXICrTY DATA
AREA 1 - CNH PROPERTY
PARKVIEW WELL SITE - NORTHERN STUDY AREA
GRAND ISLAND, NEBRASKA
Scenario Titneframe: Future
Receptor Population: Construction Worker
Receptor Age: Adult
Medium
Ground water
Exposure Medium
Ambient Air
Exposurr Point
Vapors within
Foundation
Excavation
Exposurr Route
Inhalation
Chemical of
Potential Concern
1,1,1-Trichloroethane
1 ,1 -Dichloroe thane
1,1-Dichloroethene
1 ,2-Dichloroe thane
cis-1 ,2-Dichloroe thene
Tetrachloroethene
JTrichloroethene
CPC
Value
1.56E-06
1.15E-06
3.36E-07
1.20E-07
4.97E-08
5.77E-08
2.12E-08
Units
mg/m1
mg/m1
mg/m'
mg/m5
mg/m j
mg/m j
mg/m3
Exp. Route Total fl
(Exposure Point Total
Exposure Medium Total
Medium Total
Cancer Risk Calculations
ntakelExposurr Concentration
Value
7.87E-10
5.78E-10
1.69E-10
6.02E-] 1
2.50E-11
2.91 E-l l
1.07E-11
Units
mg/kg-d
mg/kg-d
mg/kg-d
mg/kg-d
mg/kg-d
mg/kg-d
mg/kg-d
CSF/Unit Risk
Value
-
5.70E-03
-
910E-02
-
2.10E-02
4.00E-01
Units
(mg/kg-d)-l
(mg/kg-d)-l
(mg/kg-d)-l
(mg/kg-d)-l
(mg/kg-d)-l
(mg/kg-d)-l
(mg/kg<i)-l
Total of Receptor Risks Across Vapors withinFoundation Excavation Using Current TCEToxicity Data
Cancer Risk
NC
3.29E-12
NC
5.48E-12
NC
6.10E-13
4.28E-I2
1.37E-1I
1.37E-11
1.37E-11
1.37E-11
1.4E-11
Non-Cancer Hazard Calculations
Intake/Exposure Concentration
Value
5.51 E-08
4.04E-OS
1.18E-08
4.21 E-09
1.75E-09
2.03E-09
7.48E-10
Units
mg/kg-d
mg/kg-d
mg/kg-d
mg/kg-d
mg/kg-d
mg/kg-d
mg/kg-d
RfDIRfC
Value
6.30E-01
1.40E+00
5.70E-02
1.71E-01
-
5.71 E-02
l.OOE-02
Units
mg/kg-d
mg/kg-d
mg/kg-d
mg/kg-d
mg/kg-d
mg/kg d
mg/kg-d
Total of Receptor Risks Across Vapors withinFoundation Excavation Using Current TCEToxicity Data
Hazard
Quotient
8.74E-08
2.89E-08
207E-07
246E-08
NC
3.56E-08
7.48E-08
4.59E-07
4.59E-07
4.59E-07
4.59E-07
4.6E-07
Notes:NC = Not Calculated
CRA 1892S (2\) APPL
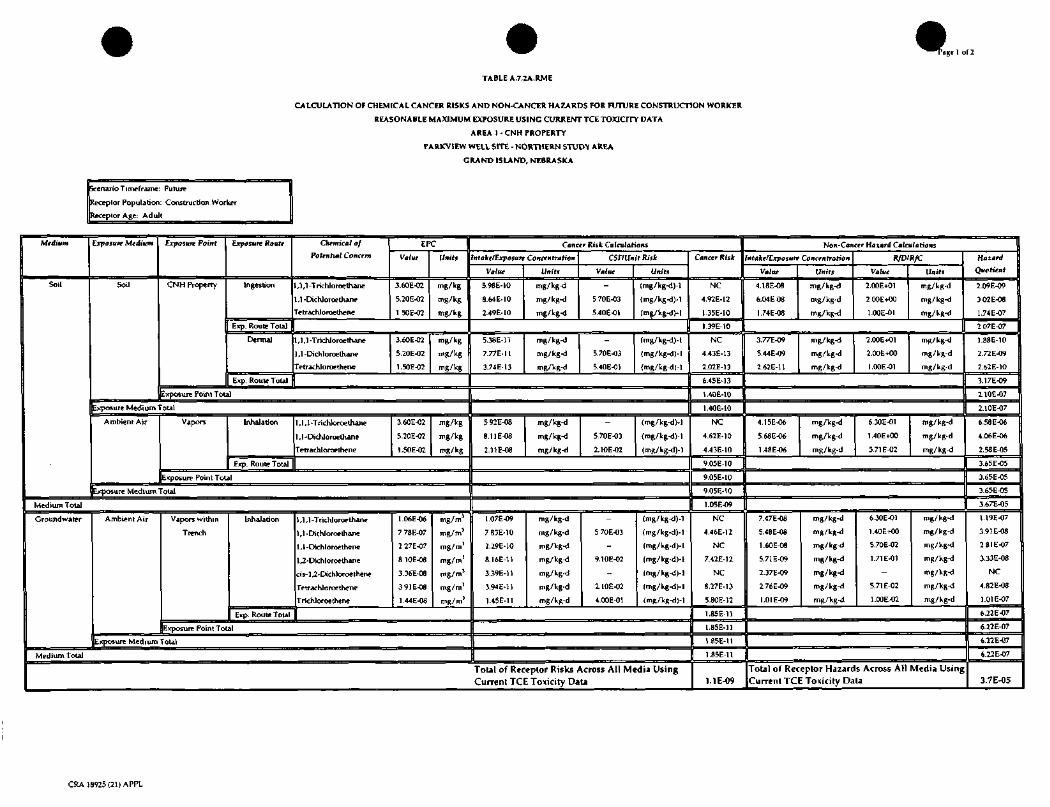
TABLE A.7.2A.RME
^^T"ag
REASONABLE MAXIMUM EXPOSURE USING CURRENT TCE TOXICITY DATA
AREA 1 - CNH PROPERTY
PARKVIEW WELL SITE - NORTHERN STUDY AREA
GRAND ISLAND, NEBRASKA
Scenario Timeframe: Future
Receptor Population: Construction Worker
Receptor Age: Adult
Medium
Soil
Medium Total
Ground water
Medium TotaJ
Exposurt Medium
Soil
Exposure Point
CNH Property
Exposure Route
Ingestion
Exp. Route Total
Dermal
Exp. Route Total
Exposure Point Total
Chemical of
Potential Concern
,1 ,1 -Trichloroethane
1,1 -Dichloroethane
Tetrachloroethene
EPC
Value
3.60E-02
5.20E-02
1 50E-02
Units
mg/kg
mg/kg
mg/kg
1,1,1 -Trichloroethane
1,1 -Dichloroethane
Tetrachloroethene
3.60E-02
5.20E-02
1.50E-02
mg/kg
mg/kg
mg/kg
ixposure Medium Total
Ambient Air Vapors Inhalation
Exp. Route Total
1,1,1-Trichloroethane
1,1-Dichloroethane
Tetrachloroethene
3.60E-02
5.20E-02
I.SOE-02
mg/kg
mg/kg
mg/kg
Exposure Point Total
Exposure Medium Total
Ambient Air Vapors within
Trench
Inhalation
Exp. Route Total
1 ,1 ,1 -Trichloroethane
,1 -Dichloroe thane
1,1-Dichloroethene
1,2-Dichloroethane
cis-l,2-Dichloroethene
Tetrachloroethene
Trichloroethene
1.06E-06
7 78E-07
2 27E-07
810E-08
3.36E-08
3.91 E-OS
1.44E-08
mg/m3
mg/m3
mg/m3
mg/m3
mg/m j
mg/m3
mg/m3
Exposure Point Total
Exposure Medium Total
Cancer Risk Calculations
ntaketExposure Concentration
Value
5.98E-10
8.ME-10
2.49E-10
Units
mg/kg-d
mg/kg-d
mg/kg-d
CSriUnit Risk
Value
5 70E-03
5.40E-01
Units
mg/kg-d)-l
(mg/kg-d)-l
(mg/kg-d)-l
5.38E-11
7.77E-11
3.74E-13
mg/kg-d
mg/kg-d
mg/kg-d
5.70E-03
5.40E-01
(mg/kg-d)-l
(mg/kg-d)-l
(mg/kg-d)-l
5.92E-08
8.11E-08
2.11E-08
mg/kg-d
mg/kg-d
mg/kg-d
5.70E-03
2.10E-02
(mg/kg-d)-!
(mg/kg-d)-l
(mg/kg-d)-l
1.07E-09
7.83E-10
2.29E-10
8.16E-11
3.39E-11
3.94E-11
1.45E-11
mg/kg-d
mg/kg-d
mg/kg-d
mg/kg-d
mg/kg-d
mg/kg-d
mg/kg-d
5.70E-03
9.10E-02
2.10E-02
4.00E-01
(mg/kg-d)-l
(mg/kg-d)-l
(mg/kg-d)-l
(mg/kg-d)-l
(mg/kg-d)-l
(mg/kg-d)-l
(mg/kg-d)-l
Total of Receptor Risks Across All Media UsingCurrent TCE Toxiciry Data
Cancer Risk
NC
4.92E-12
1.35E-10
I.39E-10
NC
4.43E-13
2.02E-13
6.45E-13
1.40E-10
1.40E-10
NC
4.62E-10
4.43E-10
9.05E-10
9.05E-10
9.05E-10
1.05E-09
NC
4.46E-12
NC
7.42E-12
NC
8.27E-13
5.80E-12
1.85E-11
1.85E-11
1 .85E-1 1
1.85E-11
1.1E-09
Non-Cancer Hazard Calculations
ntakefExposurr Concentration
Value
4.18E-08
6.04E08
I.74E-08
Units
mg/kg-d
mg/kg-d
mg/kg-d
RfDIRfC
Value
2.00E+01
200E+00
l.OOE-01
Units
mg/kg-d
mg/kg-d
mg/kg-d
3.77E-09
5.44E-09
2.62E-11
mg/kg-d
mg/kg-d
mg/kg-d
2.00E4O1
2.00E+00
l.OOE-01
mg/kg-d
mg/kg-d
mg/kg-d
4.15E-06
5.68E-06
1.48E-06
mg/kg-d
mg/kg-d
mg/kg-d
6.30E-OI
1.40E*OO
5.71 E-02
mg/kg-d
mg/kg-d
mg/kg-d
7.47E-08
5.48E-08
1.60E-08
5.71 E-09
2.37E-09
2.76E-09
1.01E-09
mg/kg-d
mg/kg-d
mg/kg-d
mg/kg-d
mg/kg-d
mg/kg-d
mg/kg-d
6.30E-01
1.40E+00
5.70E-02
1.71E-01
5.71 E-02
l.OOE-02
mg/kg-d
mg/kg-d
mg/kg-d
mg/kg-d
mg/kg-d
mg/kg-d
mg/kg-d
Total of Receptor Hazards Across All Media UsingCurrent TCE Toxiciry Data
Hazard
Quotient
2.09E-09
3.02E-08
1.74E-07
2.07E-07
1.88E-10
2.72E-09
2.62E-10
3. 171-09
2.10E-07
2.10E-07
6.58E-06
4.06E-06
2.58E-05
3.65E-05
3.65E-05
3.65E-05
3.67E-05
1.19E-07
3.91 E-08
281E-07
3.33E-08
NC
4.82E-08
l.OIE-07
6.22E-07
6.22E-07
6.22E-07
6.22E-07
3.7E-05
CRA 18925(21) APPL
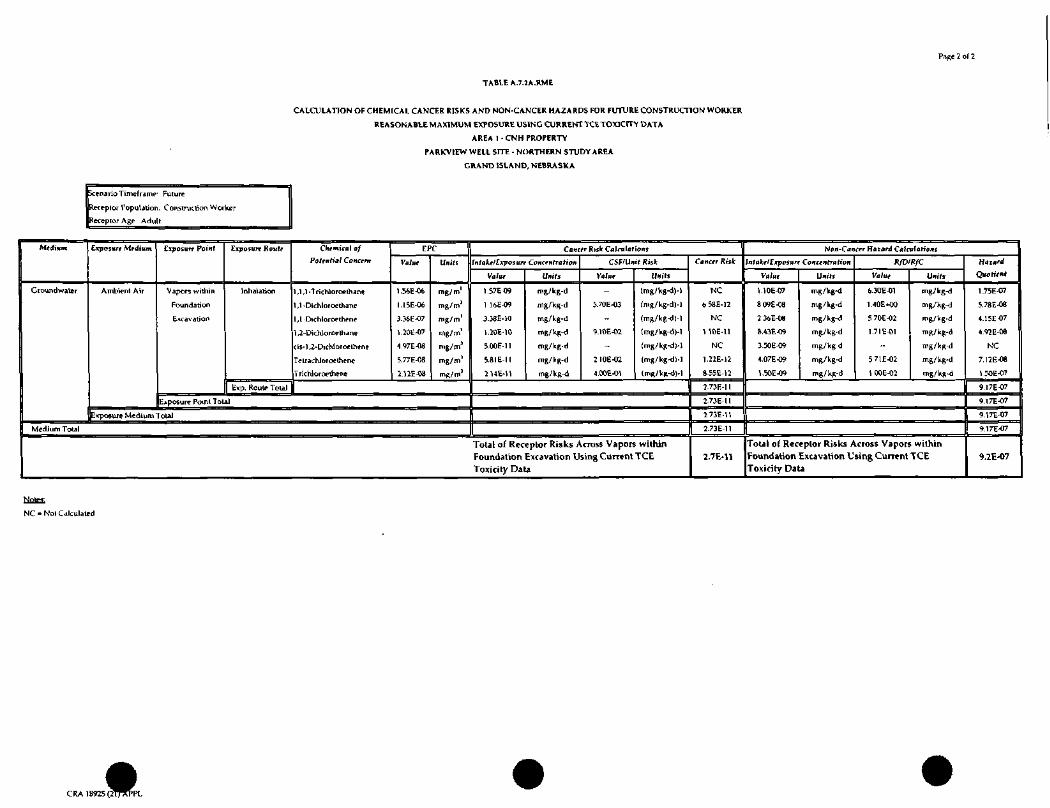
TABLE A.7.2A.RME
Page 2 of 2
CALCULATION OF CHEMICAL CANCER RISKS AND NON-CANCER HAZARDS FOR FUTURE CONSTRUCTION WORKER
REASONABLE MAXIMUM EXPOSURE USING CURRENT TCETOXICrrY DATA
A R E A 1 -CNH PROPERTY
PARKVIEW WELL SITE - NORTHERN STUDY AREA
GRAND ISLAND, NEBRASKA
Scenario Timeframe Future
Receptor Population. Construction Worker
Receptor Age: Adult
Medium
Groundwater
Medium Total
Exposure Medium
Ambient Air
Exposure Point
Vapors within
Foundation
Excavation
Exposure Routr
Inhalation
Exp. Route Total
Chemical of
Potential Concern
,1,1-Trichloroethane
,1 -Dichloroethane
,1 Dichloroelhene
1 ,2 -Dichloroethane
cis-1 ,2-Dichloroethene
Tetrachloroelhene
Trichloroelhene
EPC
Value
1.56E-06
I.15E-O6
3.36E-07
1.20E-07
4.97E-08
5.77E-08
2.12E-08
Unitf
mg/m1
mg/m
mg/m !
mg/m1
mg/m3
mg/m1
mg/m j
Exposure Point Total
Exposure Medium Total
Cancer Risk Catenations
ntaketLxposurr Concentration
Value
1.57EO9
1 16E-09
3.38E-10
1.20E-10
5.00E-11
5.81E-11
2.HE-11
Units
mg/kg-d
mg/kg-d
mg/kg-d
mg/kg-d
mg/kg-d
mg/kg-d
mg/kg-d
CSF/Unit Risk
Value
-
5.70E-03
-
9.10E-02
-
2 IOE-02
4.00E-01
Units
(mg/kg-d)-)
(mg/kg-d)-l
(mg/kg-d)-!
(mg/kg-d)-)
(mg/kg-d)-l
(mg/kg-d)-!
(mR/kg-d)-l
Total of Receptor Risks Across Vapors withinFoundation Excavation Using Current TCEToxiciry Data
Cancer Risk
NC
658E-12
NC
).)OE-))
NC
1.22E-12
8.55E-12
2.73E-11
2.73E-11
2.73E-11
2.73E-11
2.7E-11
Non-Cancer Hazard Calculations
ntakelLxposure Concentration
Value
1.10E-07
809E-08
236E-08
8.43E-09
3.50E-09
4.07E-09
1.50E-OT
Units
mg/kg-d
mg/kg-d
mg/kg-d
mg/kg-d
mg/kg d
mg/kg-d
mg/kg-d
RfDIRfC
Value
6.30E-0)
1.40E-KM
5.70E-02
1.71E-01
571E-02
100E-02
Units
mg/kg-d
mg/kg-d
mg/kg-d
mg/kg-d
mg/kg-d
mg/kg-d
mg/kg-d
Total of Receptor Risks Across Vapors withinFoundation Excavation Using Current TCEToxiciry Data
Hazard
Quotient
).75E-07
5.78E-08
4.15E^7
4.92E-08
NC
7.12E-08
1 .30E-O7
9.17E-07
9.17E-07
9.17E-07
9.17E-07
9.2E-07
Notes:
NC = Not Calculated
CRA 18925 p

'age 1 of 2
TABLE A.7.2B.CT
CALCULATION OF CHEMICAL CANCER RISKS AND NON-CANCER HAZARDS FOR FUTURE CONSTRUCTION WORKER
CENTRAL TENDENCY USING FORMER TCE TOX1CITY DATA
AREA 1 - CNH PROPERTY
PARKVIEW WELL SITE - NORTHERN STUDY AREA
GRAND ISLAND, NEBRASKA
Scenario Timeframe: Future
Receptor Population: Construction Worker
Receptor Age: Adult
Medium
Soil
Exposure Medium
Soil
Exposure Point
CNH Property
Exposure Route
Ingestion
Exp. Route Total
Dermal
Exp. Route Total
Chemical of
Potential Concern
1,1,1 -Trichloroethane
1,1-Dichloroe thane
Tetrachloroethene
EPC
Value
3.60E-02
4.90E-02
1.50E-02
Units
mg/kg
mg/kg
mg/kg
1,1,1 -Trichloroethane
1 ,1 -Dichloroethane
Tetrachloroethene
3.60E-02
4.90E-02
1.50E-02
mg/kg
mg/ltg
mg/kg
Exposure Point Total
ixposure Medium Total
Ambient Air Vapors Inhalation 1 ,1,1 -Trichloroethane
1,1-Dichloroethane
Tetrachloroethene
3.60E-02
4.90E-02
1.50E-02
mg/kg
mg/kg
mg/kg
Exp. Route Total ||
Exposure Point Total
Exposure Medium Total
Medium Total
Ground water Ambient Air
,. .
Vapors within
Trench
Inhalation
Exp. Route Total
,1,1 -Trichloroethane
,1 -Dichloroethane
1,1-Dichloroe thene
1 ,2-Dichloroethane
cis-1 ,2-Dichloroelhene
Tetrachloroethene
Trichloroethene
1.06E-06
7.78E-07
2.27E-07
8.10E-08
3.36E-08
391E-08
1.44E-08
mg/m1
mg/ni1
mg/m j
mg/m'
mg/m
mg/in'
mg/m3
[Exposure Point Total
Cancer Risk Calculations
ntakel Exposure Concentration
Value
2.99E-10
4.07E-10
1.25E-10
Units
mg/kg-d
mg/kg-d
mg/kg-d
CSTIUnit Risk
Value
5.70E-03
5.40E-01
Units
(mg/kg-d )-l
(mg/kg-d)-l
(mg/kg-d)-l
8.97E-12
172E-11
6.23E-H
mg/kg-d
mg/Vg-d
mg/kg-d
5.70F.-03
5.40E-01
(mg/kg-d)-l
(mg/kg-d).l
(mg/kg-d)-l
2.96E-08
3.82E-08
1.05E-08
mg/kg-d
mg/kg-d
mg/kg-d
5.70E-03
2.10E-02
(mg/kg-d)-!
(mg/kg-d)-l
(mg/kg-d)-l
5.33E-10
3.91E-10
1.14E-10
4.08E-11
1.69E-11
1.97E-11
7.2SE-12
mg/kg-d
mg/kg-d
mg/kg-d
mg/kg-d
mg/kg-d
mg/kg-d
mg/kg-d
5.70E-03
9.10E-02
2.10E-02
6. OOF. -03
(mg/kg-d)-l
(mg/kg-d)-l
(mg/kg-d)- 1
(mg/kg-d)-l
(mg/kg-d)-l
(mg/kg-d)-l
(mg/kg-d)-!
Exposure Medium Total |j
Medium Total U
Total of Receptor Risks Across All Media UsingFormer TCE Toxicity Data
Cancer Risk
NC
2.32E-12
6.73E-11
6.96E-1 1
NC
6.96E-H
3.36E-14
1.03E-13
6.97E-11
Non-Cancer Hazard Calculations
Intake/Exposure Concentration
Value
2.09E-08
2.85E-08
8.72E-09
Units
mg/kg-d
mg/kg-d
mg/kg-d
RfD/RfC
Value
2.00E+01
200E400
l.OOE-01
Units
mg/kg-d
mg/kg<l
mg/kg-d
6.28E-10
8.54E-10
4.36E-12
mg/kg-d
mg/kg-d
mg/kg-d
2.00E-KI1
2.00E+00
l.OOE-01
mg/kg-d
mg/kg 4
mg/kg-d
6.97E-11 |]
NC
2.I8E-10
2.21E-10
4.39E-10
4.39E-10
4.39E-10
5.09E-10
NC
2.23E-12
NC
3.71E-12
NC
4.14E-13
4.35E-14
6.40E-12
6.40E-12
6.40E-12
6.40E-12
5.2E-10
2.07E-06
2.68E-06
7.3SE-07
mg/kg-d
mg/kg-d
mg/kg-d
6.30E-01
140E+00
5.71 E-02
mg/kg-d
mg/kg-d
mg/kg-d
3.73E-08
2 74E-08
8.01 E-09
2.85E-09
1.19E-09
1.38E-O9
5.07E-10
mg/kg-d
mg/kg-d
mg/kg-d
mg/kg d
mg/kg-d
mg/kg-d
mg/kg-d
6.30E-01
1.40E+00
5.70E-02
1.71E^)1
5.71 E-02
6.00E-03
mg/kg-d
mg/kg d
mg/kg-d
mg/kg-d
mg/kg-d
mg/kg-d
mg/kg-d
Total of Receptor Hazards Across All Media UsingFormer TCE Toxicity Data
Hazard
Quotient
1.05E-09
1.42E-08
8.72E-08
1.02E-07
3.14E-11
4 27E-10
4.36E-11
5.02E-10
1.03E-07
1 .03E-07
3.29E-06
1.91E-06
1.29E-05
1.81E-05
1.81E-05
1.81E-05
1.82E-05
5.93E-08
1.96E-08
1.41E-07
1.67E-08
NC
2.41 E-08
8.45E-08
3.45E-07
3.45E-07
3.45E-07
3.45E-07
1.9E-05
CRA 18925(21) APPL
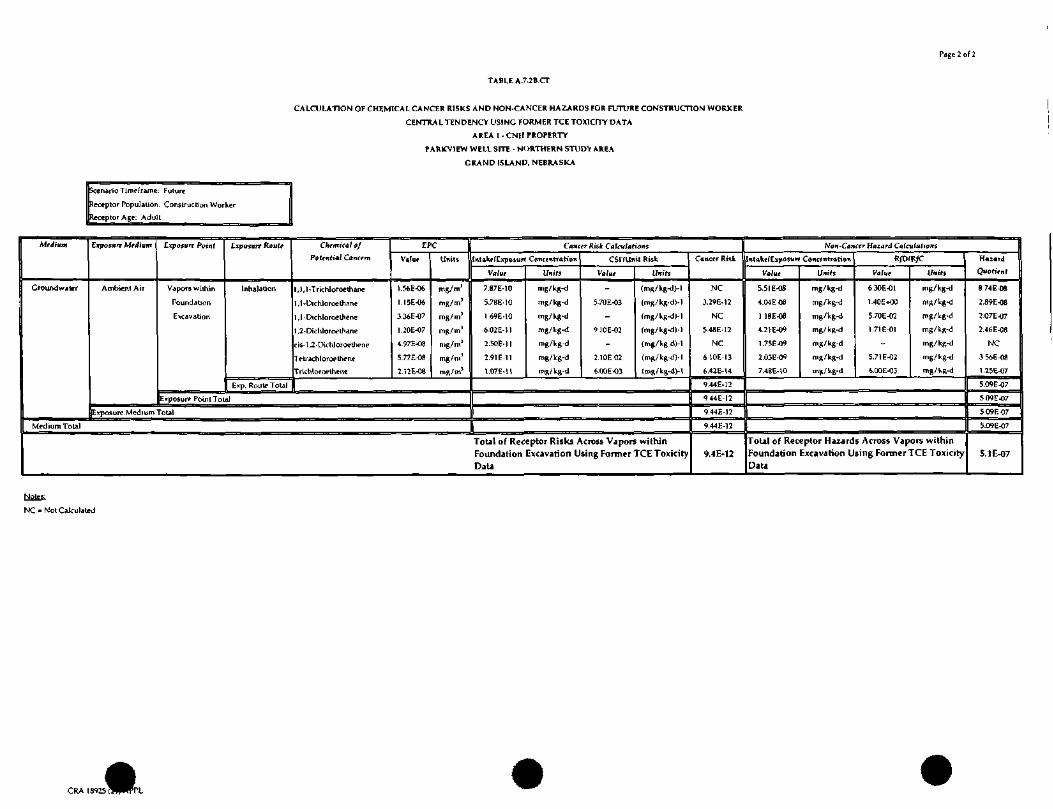
TABLE A.7.2B.CT
Page 2 of 2
CALCULATION OF CHEMICAL CANCER RISKS AND NON-CANCER HAZARDS FOR FUTURE CONSTRUCTION WORXER
CENTRAL TENDENCY USING FORMER TCE TOXICITY DATA
AREA 1 - CNH PROPERTY
PARKVIEW WELL SITE - NORTHERN STUDY AREA
GRAND ISLAND, NEBRASKA
Scenario Timeframe: Future
Receptor Population. Construction Worker
Receptor Age: Adult
Medium
Groundwater
Medium Total
Exposure Medium
Ambient Air
Exposure Point
Vapors within
Foundation
Excavation
Exposure Route
Inhalation
Exp. Route Total
Chemical of
Potential Concern
,1,1 -Trichloroethane
,1-DichJoroethane
,]-Dichloroethene
,2-Dichloroethane
cis- 1 ,2-Dichloroethene
Tetrachloroethene
Trichloroethei\e
EPC
Vuliw
1.56E-06
1.15E-06
3.36E-07
1.20E-07
4.97E-08
5.77E-08
2.12E-08
Units
mg/m1
mg/m3
mg/m j
mg/m1
mg/m3
mg/ni'
mg/m j
Exposure Point ToLal
Exposure Medium Total
Cancer Risk Calculations
ntakrfExposurf Concfntrahon
Value
7.87E-10
5.78E-10
1 69E-10
6.02E-11
2.50E-11
2.91E-11
1.07E-U
Units
mg/kg-d
mg/kg-d
mg/kg-d
mg/kg-d
mg/kg-d
mg/kg-d
mR/kfc-d
CSriUnit Risk
Value
-
5.70E-03
-
9.10E-02
-
2.10EO2
6.00E-03
Units
(mg/kg-d)-l
(mg/kg-dH
(mg/kg-d)-l
(mg/kg-d)- 1
(mg/kg-d)-]
(mg/kg-d)-l
(mg/kg-d H
Total of Receptor Risks Across Vapors withinFoundation Excavation Using Former TCE ToxicityData
Cftticfr Risk
NC
3.29E-12
NC
5.48E-12
NC
6.10E 13
6.42E-14
9.44E-12
9.44E-12
9.44E-12
9.44E-12
9.4E-12
Non-Cancer Hazard Calculations
ntflkf/Cxposurf Concftitration
Value
5.51 E-08
4.04EO8
1.18E-08
4.21E-W
1.75E-09
2.03E-09
7.48E-10
Units
mg/kg-d
mg/kg-d
mg/kg-d
mg/kg-d
mg/kg-d
mg/kg-d
md/kg-d
R/DIR/C
Value
6.30E-01
1.40E+OO
5.70E-02
1.71E-01
-
5.71 E-02
6.00E-03
Units
mg/kg-d
mg/kg-d
mg/kg-d
rng/kg-d
mg/kg-d
mg/kg-d
mg/kg-d
Total of Receptor Hazards Across Vapors withinFoundation Excavation Using Former TCE ToxicityData
Hazard
Quotient
874E-08
2.89E-08
2.07E-07
2.46E-08
NC
3.56E-08
1.25E-07
5.09E-07
509E-07
509E-07
5.09E-07
S.1E-07
Notes:
NC * Not Calculated
CRA 189250ifflJwP
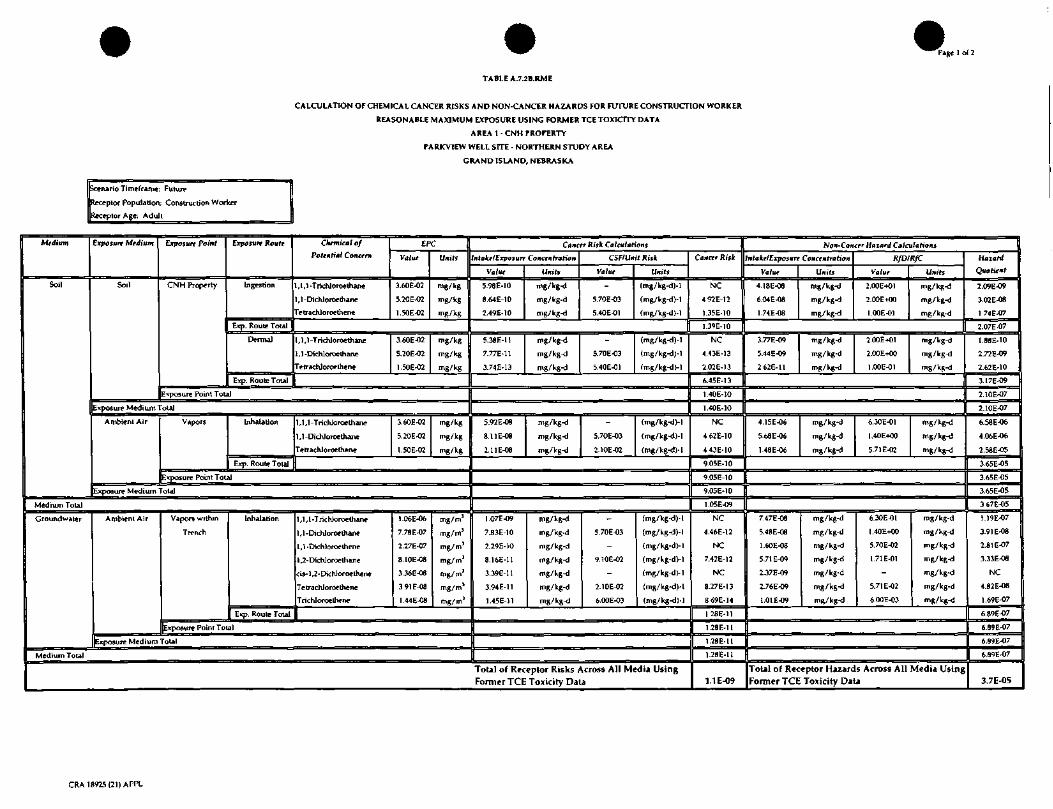
TABLE A.7.2B.RME
Page 1 of 2
CALCULATION OF CHEMICAL CANCER RISKS AND NON-CANCER HAZARDS FOR FUTURE CONSTRUCTION WORKER
REASONABLE MAXIMUM EXPOSURE USING FORMER TCE TOX1CITY DATA
AREA 1 - CNH PROPERTY
PARKVIEW WELL SITE - NORTHERN STUDY AREA
GRAND ISLAND, NEBRASKA
.arioTimeframe: Future
eptor Population: Construction Worker
jtor Age; Adult
Medium
Soil
Medium Total
Groundwater
Exposure Medium
Soil
Exposure Point
CNH Property
Exposure Route
Ingestion
Exp. Route Total
Dermal
Exp. Route Total
Chemical of
Potential Concern
1,1,1-Trichloroelhane
1,1-Dichloroethane
["errachloroethene
EPC
Value
3.60E-02
5.20E-02
1.50E-02
Unit;
mg/kg
mg/kg
mg/kg
1,1,1-Trichloroethane
1 , 1 -Dichloroethane
Tetrachloroethene
3.60E-02
5.20E-02
1.50E-02
mg/kg
mg/kg
mg/kg
Exposure Point Total
Exposure Medium Total
Ambient Air Vapors Inhalation
Exp. Route Total
1,1,1-Trichloroethane
1,1-Dichloroethane
retrachloroethene
3.60E-02
5.20E-02
1.50E-02
mg/kg
mg/kg
mg/kg
Exposure Point Total
Exposure Medium Total
Ambient Air Vapors within
Trench
Inhalation
Exp. Route Total
1,1 ,1 -Trichloroe thane
1,1-Dichloroethane
1,1-Dichloroethene
1 -Dichloroethane
cis- 1 ,2- Dichloroethene
Tetrachloroethene
Trichloroethene
1.06E-06
7.78E-07
2.27E-07
8.10E-08
3.36E-08
3.91 E-OS
1.44E-O8
mg/m'
mg/m3
mg/m1
mg/m1
mg/m1
mg/m1
mg/m1
[Exposure Point Total
Exposure Medium Total
Medium Total
Cancer Risk Calculations
ntaketExposure Concentration
Value
5.98E-10
8.64E-10
2.49E-10
Units
mg/kg-d
mg/kg-d
mg/kg-d
CSF/Unit Risk
Value
5.70E-03
5.40E-01
Units
(mg/kg-d)-l
(mg/kg-d)-l
(mg/kg-d)-l
5.38E-11
7.77E-11
3.74E-13
mg/kg-d
mg/kg-d
mg/kg-d
5.70E-03
5.40E-01
(mg/kg-d)-l
(mg/kg-d)-l
(mg/kg-d)-l
5.92E-08
8.11E-08
2.11E-08
mg/kg-d
mg/kg-d
mg/kg-d
5.70E-03
2.10E-02
(mg/kg-d)-l
(mg/kg-d)-l
(mg/kg^)-l
1 .07E-09
7.83E-10
2.29E-10
8.16E-11
3.39E-11
3.94 E- 11
1.45E-11
mg/kg-d
mg/kg-d
mg/kg-d
mg/kg-d
mg/kg-d
mg/kg-d
mg/kg-d
5.70E-03
9.10E-02
2.10E-02
6.00E-03
(mg/kg-d)-l
(mg/kg-d)-l
(mg/kg-d)-l
(mg/kg-d)-l
(mg/kg -d)-l
(mg/kg-d)-l
(mg/kg-d)-l
Total of Receptor Risks Across All Media UsingFormer TCE Toxicity Data
Cancer Risk
NC
4.92E-12
1.35E-10
1.39E-10
NC
4.43E-13
2.02E-13
6.45E-13
1.40E-10
1.40E-10
NC
4 62E-10
443E-10
9.05E-10
9.05E-10
9.05E-10
1.05E-09
NC
4.46E-12
NC
7.42E-12
NC
8.27E-13
8.69E-14
128E-11
1.28E-11
1.28E-11
1.28E-11
1.1E-09
Non-Cancer Hazard Calculations
ntake/Exposure Concentration
Value
4.18E-08
6.04E-08
1.74E-08
Units
mg/kg-d
mg/kg-d
mg/kg-d
RfDIRfC
Value
2.00E-IO1
2.00E+00
l.OOE-01
Units
mg/kg-d
mg/kg-d
mg/kg-d
3.77E-09
5.44 E-09
2.62E-11
mg/kg-d
mg/kg-d
mg/kg-d
2.00E-KI1
2.00E+OO
l.OOE-01
mg/kg-d
mg/kgd
mg/kg-d
4.15E-06
5.68E-06
1.48E-06
mg/kg-d
mg/kg-d
mg/kg-d
6.30E-01
1.40E-KX)
5.71 E-02
mg/kg-d
mg/kg-d
mg/kg-d
7.47E-08
5.48E-08
1.60E-08
5.71 E-09
2.37E-09
2.76E-09
1.01E-09
mg/kg-d
mg/kg-d
mg/kg-d
mg/kg-d
mg/kg-d
mg/kg-d
mg/kg-d
6.30E41
1.40E+00
5.70E-02
1.71E-01
5.71 E-02
6.00E-03
mg/kg-d
mg/kg-d
mg/kg-d
mg/kg-d
mg/kg-d
mg/kg-d
mg/kg-d
Total of Receptor Hazards Across All Media UsingFormer TCE Toxicity Data
Hazard
Quotient
2.09E-09
3.02E.08
1 74E-07
2.07E-07
1.88E-10
2.72E-09
2.62E-10
3.17E-09
2.10E-07
2.10E-07
6.58E-06
4.06E-06
2.58E-05
3.65E-05
3.65E-05
3.65E-05
3.67E-05
1.19E-07
3.91 E-08
2.81 E-07
3.33E-08
NC
4.82E-08
1.69E-07
6.89E-07
6.89E-07
6.89E-07
6.89E-O7
3.7E-05
CRA 18925(21) APPL

Page 2 of 2
TABLE A.7.2B.RME
CALCULATION OF CHEMICAL CANCER RJSKS AND NON-CANCER HAZARDS FOR FUTURE CONSTRUCTION WORKER
REASONABLE MAXIMUM EXPOSURE USING FORMER TCE TOXJCITY DATA
AREA 1 • CNH PROPERTY
PARKVIEW WELL SITE - NORTHERN STUDY AREA
GRAND ISLAND, NEBRASKA
Scenario Timeirame: Future
Receptor Population: Construction Worker
Receptor Age: Adult
Mtdium
Groundwater
. „
Exposure Medium
Ambient Air
Erpostirr Point
Vapors within
Foundation
Excavation
Exposure Route
Inhalation
1
| Exp. Route Total
Exposure Point Total
Chemical of
Potential Concern
1,1,1-Trichloroe thane
1 , 1 -Dichloroe thane
i ,\ -Dichloroethene
1,2-Dichloroe thane
cis-1 ^-Dichloroethene
Tetrachloroethene
Trichloroethene
rpcValue
1.56E-06
1.15E-06
3.36E-07
1.20EO7
4.97E-08
5.77E-08
2.I2E-08
Units
mg/m1
mg/m3
mg/m3
mg/m1
mg/m3
mg/m1
mg/m3
Exposure Medium Total
Medium Total
Cancer Risk Calculations
ntake/Erposurr Concentration
Value
1.57E-09
1.16E-09
3.38E-10
1.20E-10
5.00E-11
5.81 E-l l
214E-11
Units
mg/kg-d
mg/kg-d
mg/kg-d
mg/kg-d
mg/kg-d
mg/kg-d
mg/kg-d
CSF/Unit Risk
Value
-
5 70E-03
-
9.10E-02
-
2.10E-02
6.00E-03
Units
(mg/kg-d)-]
(mg/kg-d)-l
(mg/kgKi)-\
(mg/kg-d)-l
(mg/kg^)-l
(mg/kg-d)-l
(mg/kg-d)-l
Total of Receptor Risks Across Vapors withinFoundation Excavation Using Former TCE ToxicityData
Cancer Risk
NC
6.58E-12
NC
1.10E-11
NC
1.22E-12
1.28E-13
1.89E-11
1.89E-11
1.89E-11
1.89E-I1
1.9E-11
Non-Cancer Hazard Calculations
IntakelExposure Concentration
Value
1.10E-07
8.09E-08
2.36E-Q8
8.43E-09
3.50E-09
4.07E-09
1.50E-09
Units
mg/kg-d
mg/kg-d
mg/kg-d
mg/kg-d
mg/kg-d
mg/kg-d
mg/kg-d
RfDIRfC
Value
6.30E-01
I.40E*00
5.70E-C2
1.71E-01
-
5.71 EO2
6.00E-03
Unit!
mg/kg-d
mg/kg-d
mg/kg-d
mg/kg-d
mg/kg-d
mg/kg-d
mg/kg-d
Total of Receptor Hazards Across Vapors withinFoundation Excavation Using Former TCE ToxicityData
Hazard
Quotient
1.75E-07
5.78HO8
4.15E-07
4.92E-08
NC
7.12E-08
2.49EW
1.02E-06
1.02E-06
1.02E-06
1.02E-06
1.0E-06
Notea
NC = Not Calculated
CRA 18925S^W^PL

ATTACHMENT B
RISK CALCULATIONS FOR AREA 2: CNH OFF-PROPERTY
018925(21) APPL
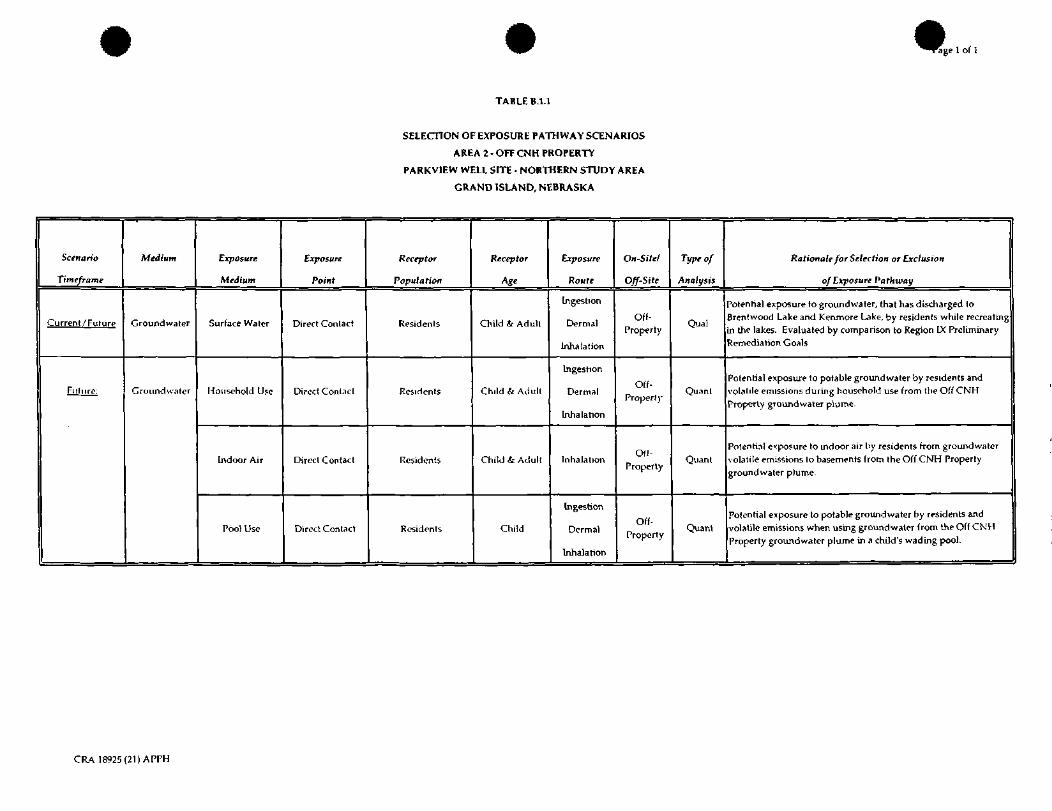
^^Tacge 1 of 1
TABLE B.I.I
SELECTION OF EXPOSURE PATHWAY SCENARIOS
AREA 2 - OFF CNH PROPERTY
PARKVIEW WELL SITE - NORTHERN STUDY AREA
GRAND ISLAND, NEBRASKA
Scenario
Timeframe
Current /Future
Future :
Medium
Groundwater
Groundwater
Exposure
Medium
Surface Water
Household Use
Indoor Air
Pool Use
Exposure
Point
Direct Contact
Direct Contact
Direct Contact
Direct Contact
Receptor
Population
Residents
Residents
Residents
Residents
Receptor
Age
Child & Adul t
Child & A d u l t
Child 4: Adu l t
Child
Exposure
Route
Ingestion
Dermal
Inhalation
Ingestion
Dermal
Inhalation
Inhalat ion
Ingestion
Dermal
Inhalation
On-Sitel
Off-Site
Off-Property
Off-Property
Property
off
Property
Type of
Analysis
Qual
Quant
Quant
Quant
Rationale for Selection or Exclusion
of Exposure Pathway
'otential exposure to groundwater, (hat has discharged toBrentwood Lake and Kenmore Lake, by residents while recreatingin the lakes. Evaluated by comparison to Region IX PreliminaryRemediation Goals
Potential exposure to potable ground water by residents andvolati le emissions during household use from the Off CNHProperly groundwater pkirne.
Potential exposure to indoor air by residents from groundwatervolatile emissions to basements from the Off CNH Propertygroundwater plume.
Potential exposure to potable groundwater by residents andvolatile emissions when using groundwater from the Off CNHProperty groundwater plume in a child's wading pool.
CRA 18925 (21) APPH

OCCURRENCE, DISTRIBUTION AND SELECTION OF CHEMICALS OF POTENTIAL CONCERN IN GROUNDWATER
AREA 2 - OFF CNH PROPERTY
PARKVIEW WELL SITE - NORTHERN STUDY AREA
GRAND ISLAND, NEBRASKA
Location.
Exposure Scenario:
Sampling dale:
Medium:
Well locator.
Units:
DETECTIONS
Northern Plume Study Area
Future Groundwater - Off CNH Property
2002, 2003, 2004
Groundwater
CRA-VP-305, CRA-Vp-603, CGW-551, GGW-552, GCW-554, GGW-555.GCW-556, GP-05(0803), CP-06<0803), CP-09{0803), NW-01-D, MW 01-1. NW-01-S. NW-02-D, NW-02-1, NTW-02-S,P-12, P-13. P-14, P-20, P-21.
milligrams per liter (mg/L)
Chemical of Potential Concern <COPC)
1,1,1 -Trichloroe thane
1,1-Dichloroelhane
1,1-Dichloroe thene
1 ,2-Dichloroethane
cis-l^-DichJoroethene
tetrachloroethene
Trichloroe thene
Number ofSamples
76
76
76
76
76
76
76
Number ofDetections
24
35
24
0
5
4
1
Minimum DetectedConcentration (It
0.0002
000023
0.00018
ND
0.00021
0.0006
0.00018
MinimumQualifier
]
]
\
}
}
Maximum DetectedConcentration < I)
0.007
0.0874
0.014]
ND
0.001
0.0016
0.00018
MaximumQualifier
t
95% UCL 121
0.0018
0.0051
0.0015
0.0010
0.00072
0.00089
0.00084 (5)
Region 9 PRGITap Waterim
032
0.081
0.034
0.00012
0.0061
0.0001
0.000028
Tax
NC
NC
NC
C
NC
C
C
* of Samples AboveRegion 9 Screening Level
0
1
0
0
4
1
Risk for COPCwill be calculated
in the RA(Yes/No)
Yes
Yes
Yes
No
Yes
Yes
Yes
Ratio of COPC toRegion 9 PRG <4)
0.02
1.08
041
-
016
16.0
6.43
NON-DETECTIONSChemical of Potential Concern (COPC)
1 ,1 ,1-Trichloroethane
1 ,1 -Dichloroethane
1,1-Dichloroethene
1 ,2-Dichloroethane
cis-1 ,2-Dichloroe thene
Tetrachloroethene
Tnchloroethene
Number ofSamples
76
76
76
76
76
76
76
Number of non-detects
52
41
52
76
71
72
75
Minimum DetectionLimit (1)
0.0005
0.0005
0.0005
0.0005
0.0005
0.0005
0.0005
MaximumDetection Limit
<n
0.0025
0.001
0.001
0.001
0.005
0.001
0.001
Samples with DL>1times Region 9 PRG
0
0
0
76
0
76
76
Samples withDL>10 timesRegion 9 PRG
0
0
0
0
0
2
75
Samples withDL>100 times Region
9PRC
0
0
0
0
0
0
0
Region 9 PRGITa* Water) <3)
0.32
0.081
0.034
0.00012
0.0061
0.0001
0.000028
Notes:
ND = Not Delected
J = Associated value is estimated.
DL -= Detection Limit
NC = Non-carcinogen
C = Carcinogen
(1) Duplicates were not averaged for the selection of thp minimum and maximum detected concentration or the minimum and maximum detection l imi t .
(2) Calculated using delected concentrations and detection limits following USEPA methodology. All duplicates were averaged prior to calculation of the 95% UCL.
(3) Region 9 Preliminary Remediation Goals (PRG) Table, Tap Water, October 20, 2004.
(4) Calculated using the maximum detected concentration and Region 9 PRG (maximum concentration/ Region 9 PRG).
(5) The 95% I^^^^^eater than the maximum detected concentration. The maximum detected concentration will be used in the r
CRA 18925 (2
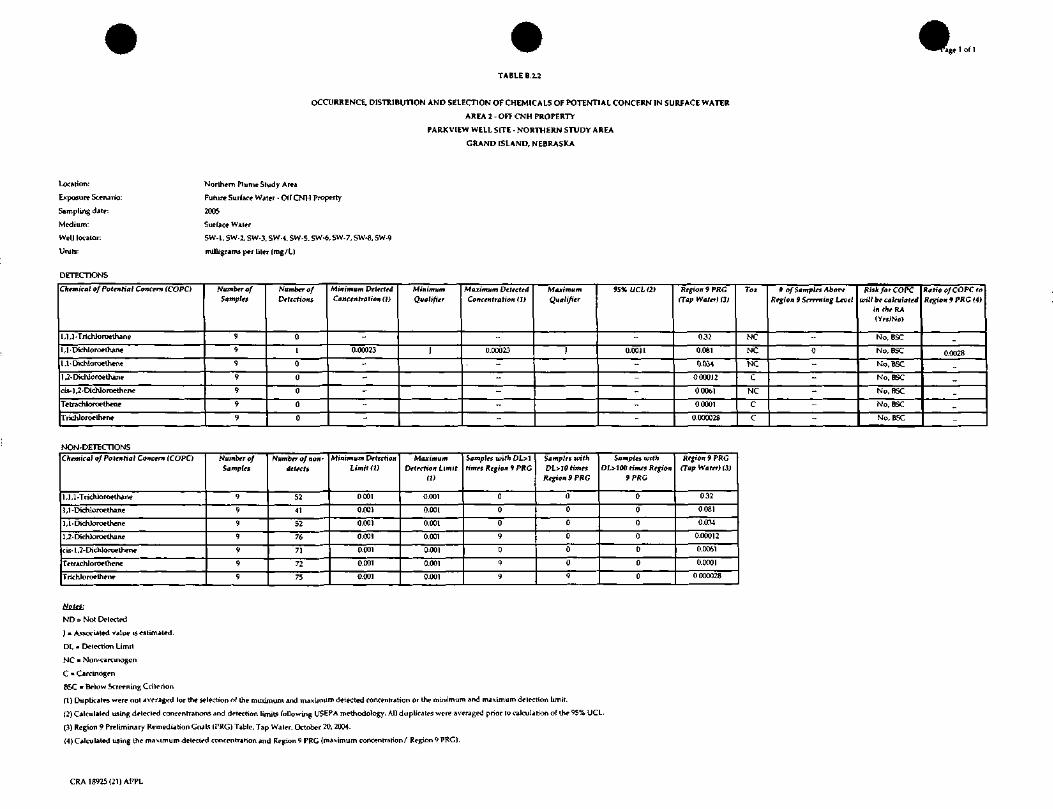
rage 1 of 1
TABLE B.2.2
OCCURRENCE, DISTRIBUTION AND SELECTION OF CHEMICALS OF POTENTIAL CONCERN IN SURFACE WATER
AREA 2 - OFF CNH PROPERTY
PARKVIEW WELL SITE - NORTHERN STUDY AREA
GRAND ISLAND, NEBRASKA
Location:
Exposure Scenario:
Sampling date:
Medium:
Well locator.
Units:
DETECTIONS
Northern Plume Study Area
Future Surface Water - Off CNH Property
2005
Surface Water
SW-1, SW-2, SW-3, SW-4. SW-5, SW-6, SW-7, SW-8. SW-9
milligrams per liter (mg/L)
Chemical of Potential Concent (COPC)
1,1 ,1 -Trichloroethane
1,1- Dichloroethane
U-Dichloroethene
1 ,2-Dichloroethane
cis-l,2-Dichloroethene
Tetrachloroethene
Trichloroethene
Number ofSamples
9
9
9
9
9
9
9
Number ofDetections
0
1
0
0
0
0
0
Minimum DetectedConcentration (I)
-
0.00023
-
-
-
-
-
MinimumQualifier
]
Maximum DetectedConcentration 11)
0.00023
•
-
-
-
MaximumQualifier
1
95% UCL (21
-
0.0011
-----
Region 9 PRG(Tap Water) (3)
0.32
0.081
0.034
0.00012
00061
00001
0.000028
Tor
NC
NC
NC
C
NC
C
C
9 of Samples AboveRegion 9 Screening Level
0
-
-
-
-
-
Risk for COPCwill be calculated
in the RA(YrsINo)
No, BSC
No, BSC
No, BSC
No, BSC
No, BSC
No, BSC
No, BSC
Ratio of COPC toRegion 9 PRC (41
„
0.0028
-_
-
-
-
NON-DETECTIONSChemical of Potential Concern (COPC)
1 ,1 ,1-Trichloroe thane
1,1 -Dichloroethane
1,1-Dichloroelhene
1 ,2-Dichloroethane
cis-l,2-Dichloroethene
Tetrachloroethene
Trichloroethene
Number ofSamples
9
9
9
9
9
9
9
Number of non-detects
52
41
52
76
71 .
72
75
Minimum DrfrrfionLimit (I)
0.001
0.001
0.001
0.001
0.001
0.001
0.001
MaximumDetection Limit
m
0.001
0.001
0.001
0.001
0.001
0.001
0.001
Samples with DL>Irim« Region 9 PRC
0
0
0
9
0
9
9
Samples withDL>10 times
Region 9 PRG
aaa0
0
0
9
Samples withDL>100 times Region
9 PRG
0
0
0
0
0
0
0
Region 9 PRGClap Water) (3)
0.32
0.081
0.034
0.00012
0.0061
0.0001
0.000028
Notts:
ND = Not Detected
J = Associated value is estimated.
DL = Detection Limit
NC = Non-carcinogen
C = Carcinogen
BSC c Below Screening Criterion
(1) Duplicates were not averaged for the selection of the minimum and maximum detected concentration or the minimum and maximum delection limit.
(2) Calculated using detected concentrations dnd detection limits following USEPA methodology. All duplicates were averaged prior to calculation of ihe 95% UCL.
(3) Region 9 Preliminary Remediation Goals (PRG) Table, Tap Water, October 20, 2004.
(4) Calculated using the maximum detected concentration and Region 9 PRG (maximum concentration/ Region 9 PRG).
CRA 18925(21) APPL
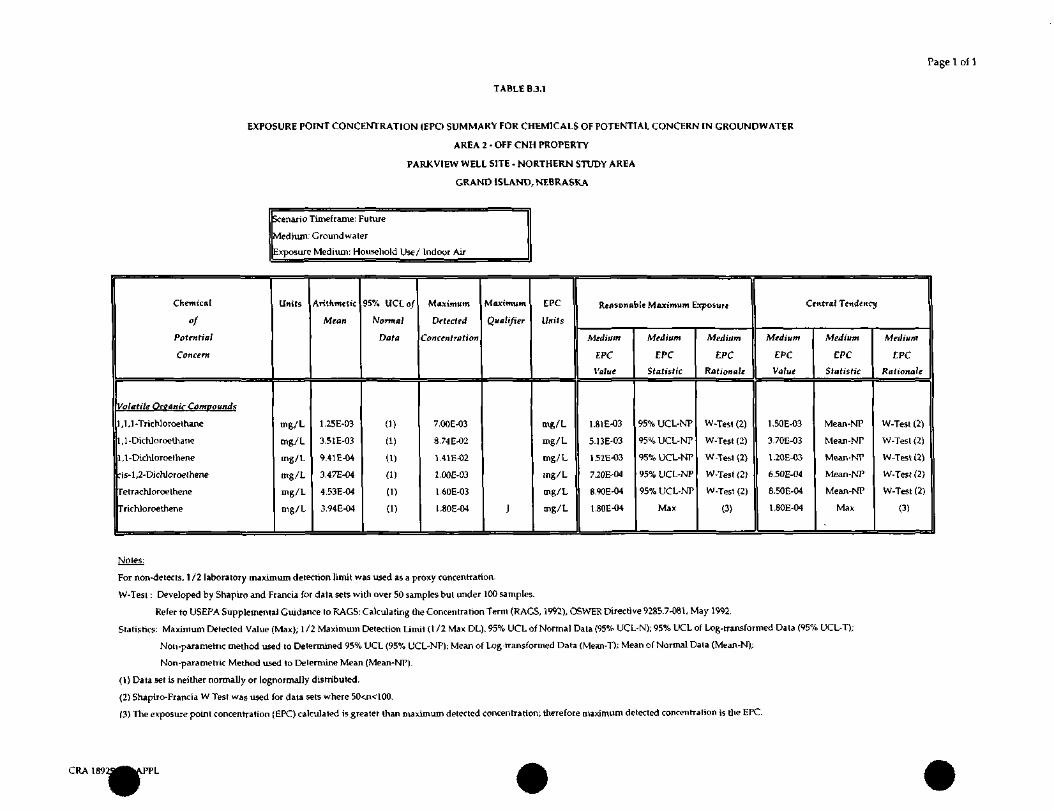
TABLE B.3.1
Page 1 of 1
AREA 2 - OFF CNH PROPERTY
PARKVIEW WELL SITE - NORTHERN STUDY AREA
GRAND ISLAND, NEBRASKA
Scenario Timefrarne: Future
Medium: Groundwater
Exposure Medium: Household Use/ Indoor Air
Chemical
»f
Potential
Concern
Volatile Organic Compounds
1,1,1 -Trichloroelhane
1,1-Dichloroe thane
1 ,1 -Dichloroelhene
ris- 1 ,2-Dichloroethene
Ferrachloroethene
Frichloroethene
Units
mg/L
mg/L
tng/L
mg/L
mg/L
mg/L
Arithmetic
Mean
1.25E-03
3.51E-03
9.41 E-04
3.47E-04
4.53E-04
3. 94 E-04
95% UCLo/
Normal
Data
(1)
(1)
(1)
(1)
(1)
(1)
Maximum
Detected
Concentration
7.00E-03
8.74E-02
1.41E-02
l.OOE-03
1.60E-03
1.80E-04
Maximum
Qualifier
}
EPC
Uni'fs
mg/L
mg/L
mg/L
mg/L
mg/L
mg/L
Reasonable Maximum Exposure
Medium
EPC
Value
1.81E-03
5.13E-03
1.52E-03
7.20E-04
8.90E-04
1.80E-04
Medium
EPC
Statistic
95% UCL-NP
95% UCL-NP
95% UCL-NP
95% UCL-NP
95% UCL-NP
Max
Medium
EPC
Rationale
W-Test (2)
W-Test (2)
W-Test (2)
W-Test (2)
W-Test (2)
(3)
Central Tendency
Medium
EPC
Value
1.50E-03
3.70E-03
1.20E-03
6.50E-04
8.50E-04
1.80E-04
Medium
EPC
Statistic
Mear\-NP
Mean-NP
Mean-NP
Mean-NP
Mean-NP
Max
Medium
EPC
Rationale
W-Test (2)
W-Test (2)
W-Test (2)
W-Test (2)
W-Test (2)
(3)
For non-detects, 1/2 laboratory maximum detection limit was used as a proxy concentration.
W-Test: Developed by Shapiro and Francia for data sets with over 50 samples but under 100 samples.
Refer to USEPA Supplemental Guidance to RAGS: Calculating the Concentration Term (RAGS, 1992), OSWER Directive 9285.7-081, May 1992.
Statistics: Maximum Detected Value (Max); 1 /2 Maximum Detection Limit (1/2 Max DL); 95% UCL of Normal Data (95% UCL-N); 95% UCL of Log-transformed Data (95% UCL-T);
Non-parametric method used to Determined 95% UCL (95% UCL-NP); Mean of Log-trans formed Data (Mean-T); Mean of Normal Data (Mean-N);
Non-parametric Method used to Determine Mean (Mean-NP).
(1) Data set is neither normally or lognormally distributed.
(2) Shapiro-Francia W Test was used for data sets where 50<n<100.
(3) The exposure point concentration (EPC) calculated is greater than maximum detected concentration; therefore maximum detected concentration is the EPC.
CRA 189:2^^iPPL
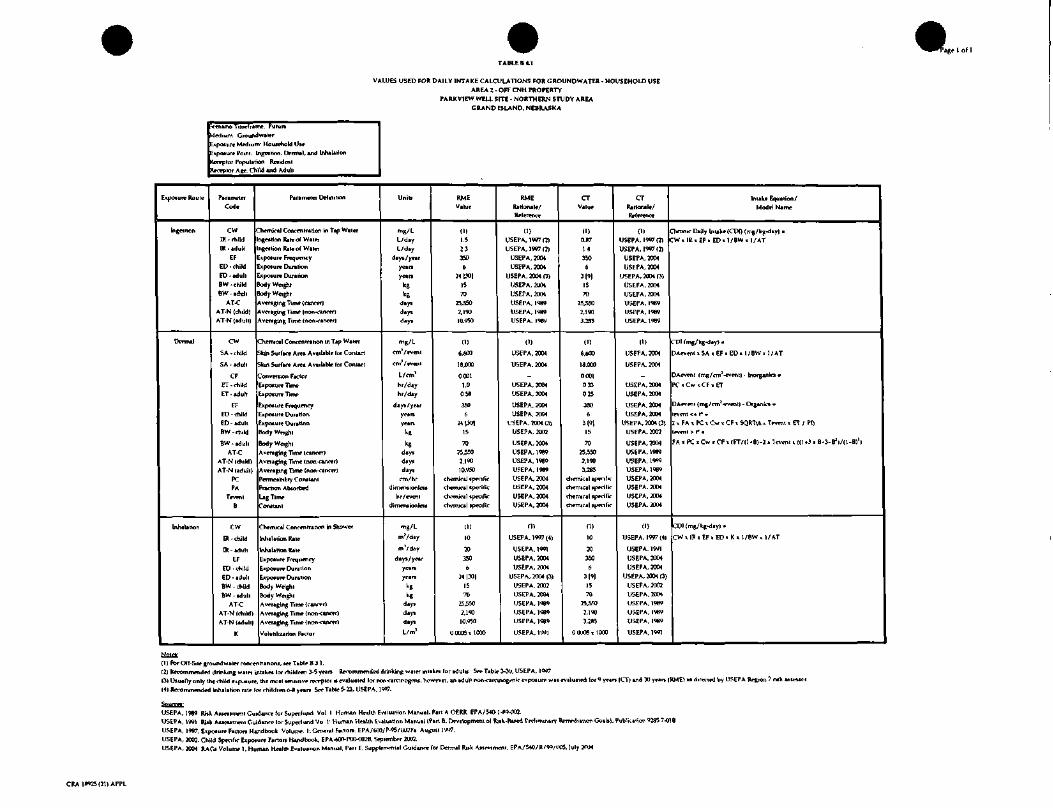
TABLE B.4.1
Page 1 of 1
VALUES USED FOR DAILY INTAKE CALCULATIONS FOR GROUNDWATER - HOUSEHOLD USE
AREA 2 - OFF CNH PROPERTY
PARKVIEW WELL SITE - NORTHERN STUDY AREA
GRAND ISLAND, NEBRASKA
•cenano Timcfrarr*. Fuhjr*edium. Groundwater
.patun Modium Household Uieipoaure Point: Ingci lion. Dermal, *nd [nha.itior
Receptor Population. RnidcnlReceptor Age. Chi.d and Adult
Eipoture Route
Ingeition
Dpmul
Inhalation
ParameterCode
CW
IR • childR- adult
EF
ED - childED -.dull
BW - childBW - adult
AT-C
AT-N (child)AT-N (idutl)
cwSA - child
5A - adult
CF
ET- childET - adult
EF
ED - childED - adultBW - child
BW- iduli
AT-C
AT-N (child)AT-N (adult)
PCFA
TevenlB
CW
IR - child
IR - adult
EF
ED - childED -.dull
BW - childBW - adult
AT-C
AT-N (child)AT-N(aduli)
K
Parameter Definition
Chemical Concentration in Tap Wai«Ingettion Rate of Water
Ingection Rjitof Water•apoture Frequency
.xpoture Duration
jtpoaur* DurationBody WeightBody Weight
Avenging Tim* (cancer)Averaging Tirmr (non-cancer)Avenging Tim* (non-cancer)
Chemical Concentration in Tap Watrr
Skin Surface Area Available for ConUci
Skin Surface Area Available for Contact
Convention FactorExposure TimeEapoiure Tirrv
Expoiun? FrequencyEapoiun DurationExposure DurationBody Weight
Body WeightAveraging Time (cancer)Averaging Time (non-cancer)Averaging Time (non-cancer)•"ermeabilily ConstantFraction AbiorbedLag TimeCon*Un(
Chemical Concentration in Shower
Inhalation Rale
Inhalation KaleExposure Frequency
Exposure Duration
Expoture DurationBody WeightBody Weigh!Averaging Time (rann-r)Averaging Time (non-cancer)Averaging Time (non-c«nrer)
Volatilization Factor
Units
mg/L
L/dayL/day
dayt/yearyean
yean
kg
*6day,
day.
day.
mg/L
cm' /even!
cm'/eveni
L/cm'
hr/dayhr/day
day/yearyear*yeon.
^kg
dayid«ytday*
rm/hrdimoniionloM
hr/evemdimeruionkw
mg/L
m'/day
mVday
dayi/year
yeanyear*
kg
k*day.
day,
dayi
Urn'
RMEValue
II)1.5233506
2< l»l1570
23450
2.1W
10.«0
(1)
turnHJOO
0001
1.0058
3506
JM30I15
70
25,5502.190
10.«0
chetniral ip*rificchemical iptvificchpmiril tpecir>c
rhtrmjcal tpccifir
11)
10
20
350
6
24|X)|
15
7025550
2.1»10.950
00005t1000
RMEKjHDn.lt/
(Werenct
(1)USEPA. 1W7 (31
tSEPA. 1997 (2)USEPA. 20MUSEPA. 20M
USEPA. 2001 (3)
USEPA. XMUSEPA. 20MUSEPA. 1989USEPA, 1989USEPA. 19«v
(1)
USEPA, 2004
USEPA. 2004
-
USEPA. 2004USEPA, TOM
USEPA. 20MUSEPA. 2004
L'SEPA, 2004 (3)USEPA. 2002
USEPA, 2004USEPA, 1989USEPA, 1989USEPA, 1989USEPA, 2004USEPA. 2004USEPA. 2004USEPA, 2004
(1)
USEPA, 1997 (4)
USEPA. 1991USEPA. 2004
USEPA, 2004USEPA, 2004 (3)
USEPA. 2002
USEPA. 2004USEPA. 1969USEPA. 1969USEPA, 1989
USEPA. 1991
CTVilue
(1)O.H7
14
350
6
3 |91
IS
70
254502,190
3,285
0)
6/00
was0001033
025
3506
3(9115
70
254502.1903.285
chemical tpvoltrchemical ijxolicchemical ifxcificchemical ipecific
(1)
10
20
350
63|9|
15
7025,550
2.190
3.285
OOUOSt 1000
CTRational*/Reference
(1)USEPA, 1997 (2)
USEPA. 1997 (2)USEPA. 2034USEPA. 2004
USEPA, 2004 (3)USEPA, 2004
USEPA. 2004USEPA, 1969USEPA. 1969USEPA, 1989
(1)
USEPA. 2001
USEPA. 2004
-
USEPA, 2004USEPA. 2004
USEPA. 2004USEPA, 2O04
USEPA, 2004 P)USEPA, 2002
USEPA, 2004USEPA. 1969USEPA, 1969USEPA. 1989USEPA, 2004USEPA. 2004USEPA. 2004USEPA. 2004
(1)
USEPA. 1997 (4)
USEPA. 1991USEPA. 2004
USEPA. 2004
USEPA. 2004 P)USEPA. 2002USEPA, 2004USEPA. 1989USEPA. 1989USEPA. 1969
USEPA. 1991
Intake Equation/Model Name
Tironic Daily Intake (CD[) (mg/kg-day) .
W . I R , E F > E D < 1 / B W < 1 / A T
CD1 (mg/kg-day) .
DAeventxSA x EF i ED x l /BWt I/AT
)Aevenl (mg/cm'-evenl) - Inorganki •
P C < C w « C F > E T
)Aevml (mg/cm'-evenl) - Organic* •
levent <• f -2 » F A « P C « C w * C F « SQRT16 x Tevmt x ET ; P[)levmt > 1* •
FA < PC r Cw < CF < (ET/d -B)-2 > Icvcni 1 1(1+3 • B.3-BV(1.B)')
CD1 (mg/kg^iay) .
CW t IR x EF> ED < K < I/BW , I/AT
Nolca
(1) For Off-Site groundwa.cr conrenrrahoru, tee Table B 3 1.(2) Recommended drinking wain intake* lor children J-5 yean Recommended drinking water iniakoi for adulu Srt- Table 3-3U, USEPA, ,<W.
(3) Utually only the child eipoture. the rr.o«i tenntjve rrvrpior u evaluated tor ncm-camnogerw. however, an aduli non-camnogmic p«poiurc wi
(4) Recommended inhalation rate for children 6-8 yean. S«r Table 5-23, USEPA, 1 W.
i evaluated for 9 year* [(_T) »nd 50 yesm (RME) ai dirwted by USEPA Region 7 n»V »!».t
USEPA, 1969 RiikAMeiimenlC^dance.orSuperfund Vol 1 Human H«llh Ev.luarion Manual, Pan A OERR EPA/540-1USEPA, 199. Ri»V AiiCMmeni Guidanrc lor Superiund VD 1" Hurrwn Heallh EvaluHion Manual (Pin B, Developmeni ol R«k-Ba»«d Treli
USEPA, 1997. Enpoiure Factori Handbook. Volume. 1: General Fatlori. EPA/600/P-95/U02Fa Aupitt 1W7.
USEPA, 2002: Child Specific Expoture Facton Handbook, EPA-600-POO-OKB, September 2002.USEPA, 2004 RACi Volume 1, Human Health Evaluat ion Manual, Part E. Suppliw.-ni.il Guidance for Dermal Riik A»ic«meni. EPA/S40/R/90/d05, J u l y 2004
Goal*), Pub'.k»,ior 9285 7-01B
CRA 18925 (21) APPL
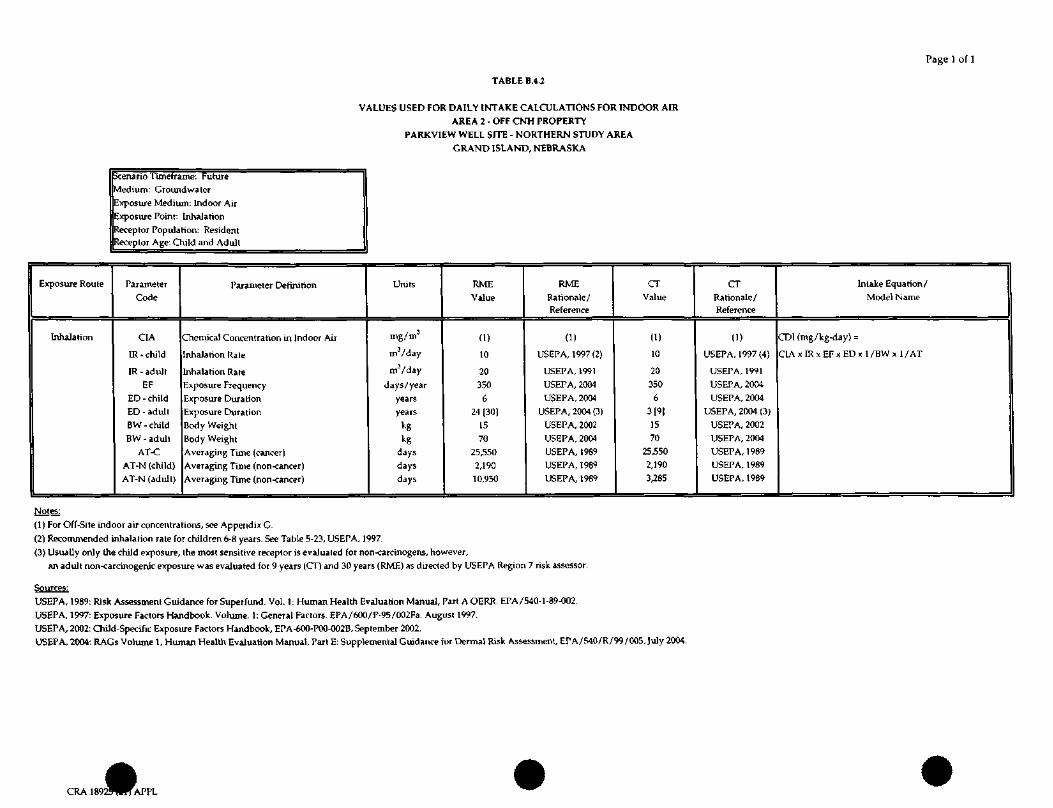
TABLE B.4.2
Page 1 of 1
VALUES USED FOR DAILY INTAKE CALCULATIONS FOR INDOOR AIR
AREA 2 - OFF CNH PROPERTY
PARKVIEW WELL SPTE - NORTHERN STUDY AREA
GRAND ISLAND, NEBRASKA
Scenario Timeframe: FutureMedium: Groundwatcr
Exposure Medium: Indoor Air
Exposure Point: Initiation
Receptor Population: ResidentReceptor Age: Child and Adult
Exposure Route
Inhalation
Parameter
Code
CIA
IR - child
IR- adultEF
ED - childED -adult
BW - child
BW - adult
AT-CAT-N (child)
AT-N (adult)
Parameter Definition
Chemical Concentration in Indoor Air
Inhalation Rate
Inhalation Rate
Exposure FrequencyExposure Duration
Exposure Duration
Body Weight
Body Weight
Averaging Time (cancer)Averaging Time (non-cancer)
Averaging Time (non-cancer)
Units
mg/m3
m /day
mVday
days/year
years
years
kgkg
days
days
days
RMEValue
(1)
10
20350
624 (30]
1570
25,550
2,19010,950
RMERationale/Reference
(1)
USEPA, 1997 (2)
USEPA, 1991
USEPA, 2004
USEPA, 2004
USEPA, 2004 (3)
USEPA, 2002
USEPA, 2004
USEPA, 1989USEPA, 1989
USEPA, 1989
CTValue
(1)
10
203506
3 [9]
1570
25,550
2,1903,285
CTRationale/Reference
(1)
USEPA, 1997(4)
USEPA, 1991
USEPA, 2004
USEPA, 2004
USEPA, 2004 (3)
USEPA, 2002
USEPA, 2004USEPA, 1989
USEPA, 1989
USEPA, 1989
Intake Equation/
Model Name
GDI (mg/kg-day) =
CIA x IR x EF x ED x 1 /BW x 1 / AT
(1) For Off-Site indoor air concentrations, see Appendix G.
(2) Recommended inhalation rate for children 6-8 years. See Table 5-23, USEPA, 1997.
(3) Usually only the child exposure, the most sensitive receptor is evaluated for non<arcinogens, however,an adult non-carcinogenic exposure was evaJuated for 9 years (CT) and 30 years (RME) as directed by USEPA Region 7 risk assessor.
Sources:
USEPA, 1989: Risk Assessment Guidance for Superfund. Vol. 1: Human Health Evaluation Manual, Part A OERR. EPA/540-1-89-002.
USEPA, 1997: Exposure Factors Handbook. Volume. 1: General Factors. EPA/600/P-95/002Fa. August 1997.
USEPA, 2002: Child-Specific Exposure Factors Handbook, EPA-600-POO-002B, September 2002.USEPA, 2004: RAGs Volume 1, Human Health Evaluation Manual, Pan E: Supplemental Guidance for Dermal Risk Assessment, EPA/540/R/99/005, July 2004.
CRA 189:>2^I^APPL
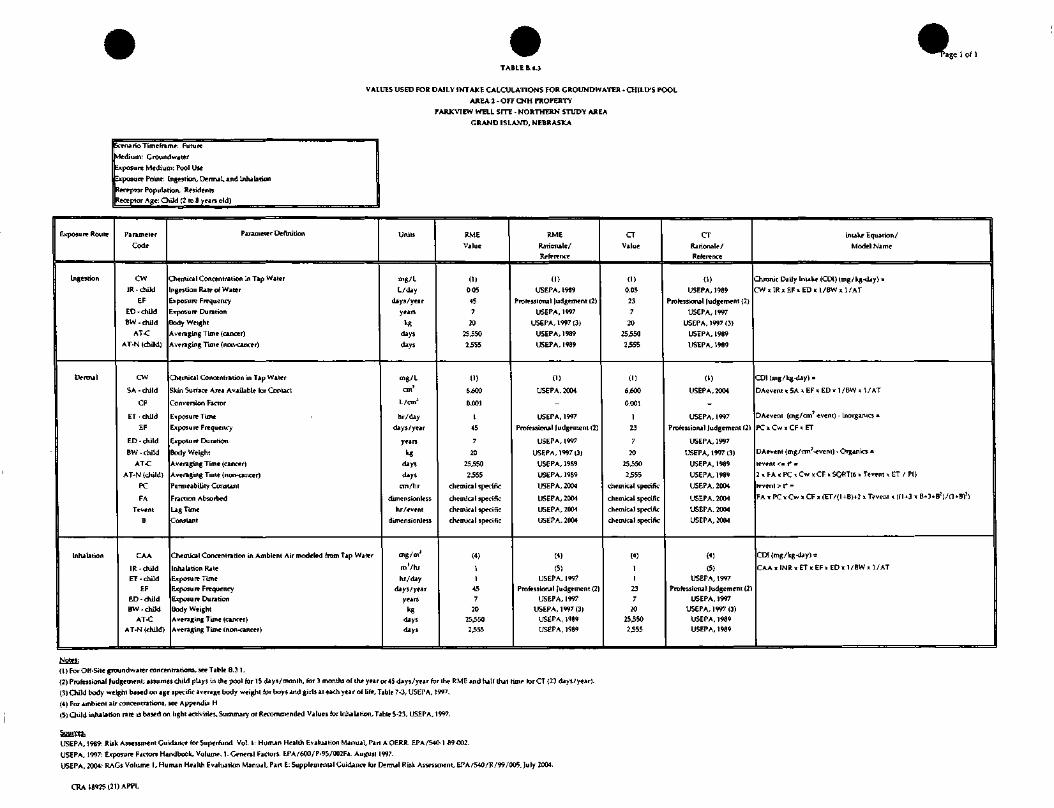
^^Tag 1 of 1
TABLE B.t.3
VALUES USED FOR DAILY INTAKE CALCULATIONS FOR CROUNDWATER - CHILD'S POOL
AREA 2 - OFF CNH PROPERTY
PARKVIEW WELL SITE - NORTHERN STUDY AREA
GRAND ISLAND, NEBRASKA
Scenario Timeframe: Future
Medium: Ground water
Exposure Medium: Pool Use
jrpcwure Point: Ingestion, Demul. and Inhalation
Receptor Population: Residents
Receptor Age: ChUd (2 to 8 years old)
Exposure Route
[ngestion
Dermal
Inhalation
Parameter
Code
CW
]R- child
EF
ED -child
BW- child
AT-C
AT-N (child)
CW
SA - child
CF
ET- child
EF
ED -child
BW - child
AT-C
AT-N (child)
PC
FA
Tevenl
B
CAA
1R- child
ET- child
EFED -child
BW - child
AT-CAT-N (child)
Parameter Definition
Chemical Concentration in Tap Water
ngestion Rate of Water
Exposure Frequency
Exposure Duration
Body Weight
Averaging Time (cancer)
Averaging Time (non-cancer)
Chemical Concentration in Tap Water
Skin Surface Area Available for Contact
Conversion Factor
Exposure Time
Lxposure Frequency
Exposure Duration
Body Weight
Averaging Time (cancer)
Averaging Time (non-cancer)
Permeability Constant
Fraction Absorbed
_ag Time
Constant
Chemical Concentration in Ambient Air modeled from Tap Water
Inhalation Rate
Exposure Time
Exposure FrequencyExposure Duration
Body Weight
Averaging Time (cancer)
Averaging Time (non-cancer)
Units
mg/L
L/day
day 9 /year
years
**days
days
mg/L
on1
L/cmJ
hr/day
days/year
years
kgdays
days
cm/hr
dimensionless
hr/event
dimension] ess
mg/m3
m'/hr
hr/day
days/year
years
kgdays
days
RME
Value
(1)0.05
457
20
25,550
2555
(1)
6/600
0.001
1
45
7
20
25550
2355
chemical specific
chemical specific
chemical specific
chemical specific
(4)
11
457
2025350
2555
RME
Rationale/
Reference
(1)USEPA, 1989
Professional Judgement (2)
USEPA, 1997
USEPA, 1997 (3)
USEPA, 1989
USEPA, 1989
(1)
USEPA, 2004
_
USEPA, 1997
Professional Judgement (2)
USEPA, 1997
USEPA, 1997 (3)
USEPA, 1989
USEPA, 1989
USEPA, 2004
USEPA, 2004
USEPA, 2004
USEPA, 2004
(4)
(5)USEPA, 1997
Professional Judgement (2)
USEPA, 1997
USEPA, 1997(3)
USEPA, 1989
USEPA, 1989
CT
Value
(1)0.05
237
20
25550
2355
(1)
6,600
0.001
1
23
7
20
25550
2555
chemical specific
chemical specific
chemical specific
chemical specific
(4)
11
237
2025550
2555
CT
Rationale/
Reference
0)USEPA, 1989
Professional Judgement (2)
USEPA, 1997
USEPA. 1997 (3)
USEPA, 1989
USEPA, 1989
(1)
USEPA, 2004
_
USEPA, 1997
Professional Judgement (2)
USEPA, 1997
USEPA, 1997 (3)
USEPA, 1989
USEPA, 1989
USEPA. 2004
USEPA, 2004
USEPA, 2004
USEPA, 2004
(4)
(5)USEPA, 1997
Professional Judgement (2
USEPA, 1997
USEPA, 1997 (3)
USEPA, 1989USEPA, 1989
Intake Equation/
Model Name
Chronic Daily Intake (CDI) (mg/kg-day) =
CW x IR x EF « ED x 1/BW x 1 /AT
CDl(mg/kg-day) =
DAevent « S A x E F x E D x l / B W x l / A T
DAevent (mg/cmT -event) - Inorganics =
PC x Cw x CF . ET
DAevent (mg/on'-evem) - Organics =
tevent <= t* =
2 « FA « PC x Cw x CF x SQRT(6 x Tevent x ET / PI)
tevent > r* =
FA x PC x Cw x CF x (ET/(1 +B)+2 x Tevent x HI *3 x B*3*BV(1 »B)!)
CDI (mg/kg^iay) =
CAA x INR x ET x EF x ED x 1 /BW x 1 /AT
Notes:(1) For Off-Site groundwater concentrations, see Table B.3.1.
(2) Professional Judgement; assumes child plays in the pool for 15 days/month, for 3 months of the year or-45 days/year for the RME and half that time forCT{23 days/year).
(3) Child body weight based on age specific average body weight for boys and girls at each year of life, Tablr 7-3, USEPA, 1997.
(4) For ambient air concentrations, see Appendix H
(5) Child inhalation rate is based on tight activities. Summary of Recommended Values for Inhalation, Table 5-23, USEPA, 1997.
Sources.USEPA, 1989: Risk Assessment Guidance forSuperrund Vol. I: Human Health Evaluation Manual, Pan A OERR. EPA/540 1 9-002.
USEPA, 1997: Exposure Factors Handbook Volume. 1: General Factors. EPA/600/P-95/002Fa. Aufjust 1997.
USEPA, 2004: RAGs Volume 1, Human Health Evaluation Manual, Part E: Supplemental Guidance for Dermal Risk Assessment, EPA/540/R/99/005, July 2004.
CRA 18925 (21) APPL
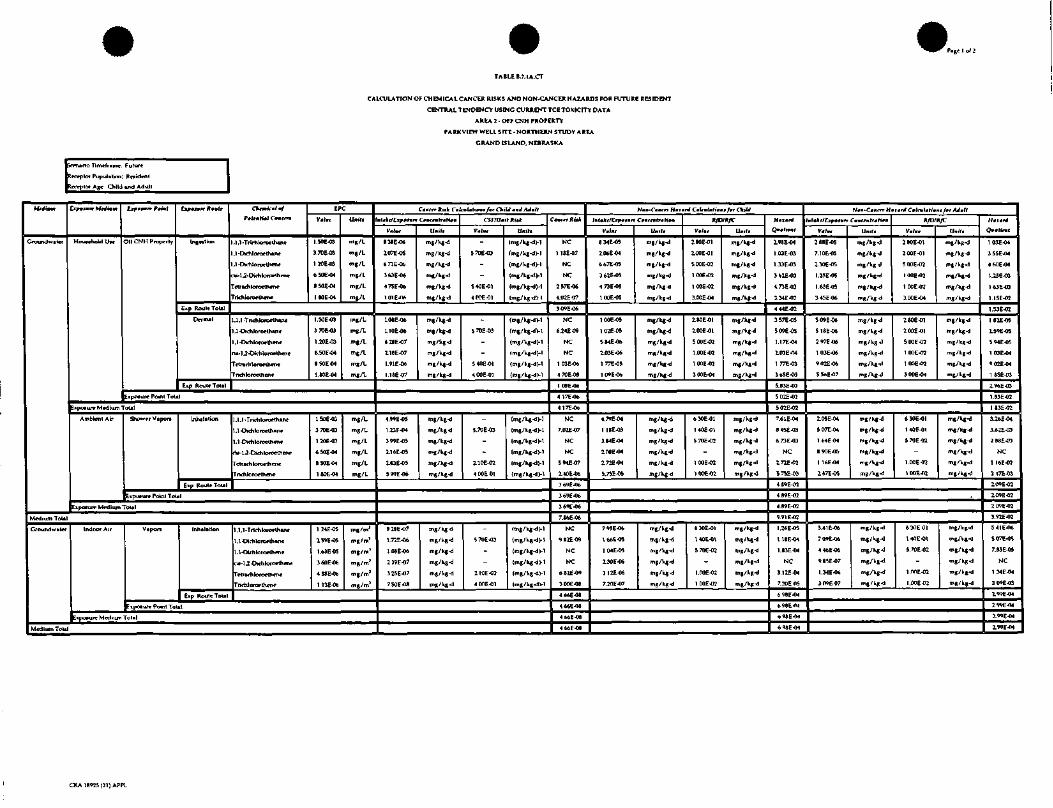
TABLE B.7.1A.CT
CALCULATION OF CHEMICAL CANCER RISKS AND NON-CANCER HAZARDS FOR FUTURE RESIDENT
CENTRAL TENDENCY USING CURRENT TCE TOXICITY DATA
AREA 3 - OFF CNH PROPERTY
• EA
GRAND ISLAND, NEBRASKA
irio Timcframv. Future
Iweplor Population: Ret'tdml
Receptor Agg. Child and^dull
Mr«Vm
i round w«ter
Medium Tol*l
Ground water
txflimtr MrJimm
HouMhold UM
Exr***rr Pmimt
Off CNH Property
txpttmtt Rfutr
Ingecttgn
^ ^ l ^B I BBB
E»p Route Total
Dcrtiul
Eip RoutcToUl
Ckfmiffl *f
Pitrmtiml C«rm,
,1 ,1 -Trirhlororuune
,1 -Dithloroethanr
,1 -Dirhloroctncne
'drach loroethcn*
Trichloroeth*n«
EPC
v-;«
l.SOE-03
3.70E-03
120E-03
650E-04
850E-O4
1 SOE-04
Umiti
mg/L
mg/L
mg/L
mg/L
mg/L
mg/L
,1,1-TnchLoroethAn*
,1 -Dichjorx*th«ne
,1 -DicKlorwthcnc
ri»- U-Didilororthene
fetrach loroelh*n«
1.50E-03
370E-03
1.20E-03
6.50EXM
850E-04
1.80E-04
mg/L
mg/L
mg/L
mg/L
mg/L
mg/L
Exposure Point TotaJ
Upoturr Medium Total
Showf r Vaport Lnhilition
E»p Route ToUl
1.1,l-TrichloroeUun«
1 ,1 -Dtchlororlhane
1 , 1 -DichlorocUien*
ri»- 1 J -Dichlorocthene
Tdrachloroethrnc
F nchlororthene
150E-03
3.70E-03
1 20E-03
6 SOE-04
B50E-04
1 SOE-04
mg/L
mg/L
mg/L
mg/L
mg/L
mg/L
cuptMunr Point Total
Exposure Mrdium Total
Indoor Air V.pon lnh*l«lion
Enp Route Total
1,1,1 -Trirh loror thane
1,1-Dichlororlhajie
l,l-Dirhloro*lh«ni?
cu-U-Dichloroethcne
TrirhlororthnK-
1 24E-05
1WE-05
1.&3EO5
360E-06
488E-06
1 13E-06
mg/m
mg/m
mg/m
mg/m
Expoaurr Po«nt Total
E»po« ore Medium Total
Mrdium Total
Cfmtrt KM CmlnUHmm,/,, Chi'U »J Alilt
tlk</L!ff,,r, C.mcntrtti..
Vmlmr
838E-06
2.D7E-OS
471E-06
363E-06
4.75E-06
1 OlE-n*
U.if.
mg/kg-d
mg/kg-d
mg/kg-d
CSf/l/«i(Rt*t
Vtltt
5 TOE -03
540E-01
4POE-OI
Unit,
(mg/kg-d>-I
(mg/kg-d)-l
(mg/kg-dH
(mg/kg-dH
(mg/kg-dM
(mg/kg<lVl
1.08E-06
1.10E-06
6.2BE-07
2.18E-07
1.91E-M
1.1BE07
mg/Kg-d
mg/kg-d
mg/kgJ
mg/kg-d
mg/kg-d
57DE-03
540E-01
400E-01
(mg/kg-dH
(mg/kg-d>-l
(mg/kg-dH
(mg/kg-dH
(mg/kg-d )-l
(mg/kg-d )-l
4.WE-05
1.13E-O4
3.99E-05
2.16E-O5
1B3E-05
599E-06
mg/kg-d
mg/kgJ
mg/kg-d
mg/kg-d
mg/kg-d
mg/kg^l
5.70E-03
2.10E-02
4 DOE 01
(mg/kg-dH
(mg/kg-dH
(mg/kg-d H
(mg/kg-dH
828E-07
\.72E-06
106E-06
239E-07
325E-07
750E-OB
mg/kg^J
mg/kg-d
5 TOE -03
110E-02
400E-01
(mg/kg-dH
(mg/kg-dH
{mg/kg-dH
(mg/kg-dH
{mg/kg-d VI
Ca.rrr Riii
NC
1 18E-07
NC
NC
257E-06
4.02E-07
309E-06
NC
6.24E09
NC
NC
1 03E-06
470E-08
1 OSE-06
4 17E-06
417E-06
NC
7.Q2E-07
NC
594E-07
2.40E-06
369E416
369E-05
369E-06
7.ME-Q6
NC
982E-O9
NC
NC
682E-09
3 DOE-OS
466E-OS
466E-08
466E-08
4ME-OS
Nm»-Ctncrr Hmitni CmltvlmHmm, fit OtiU
;.raJtr/Ei*...rr Ct.tr. tot *.<•
VaJ»r
834E-05
2.06E-04
667E-OS
362E-05
473E-O5
1. TOE -05
Unit,
mj/kg-d
mg/kg-d
mg/kg^l
mg/kg-d
mg/kg-d
mg/kg-d
R/DJRfC
Vflui
Z80E-01
2.00E-01
5.00E-02
1 OOE-02
1 OOE-02
3.00E-04
Um,t,
mg/k«-d
mg/kg-d
mg/kg-d
mg/kg<l
mg/Vg^l
1 OOE-05
1.02E-05
5S4E-Q6
2.03E-06
1 77E-OS
IOTE-06
mg/kg-d
mg/kg^l
mg/kg-d
mg/kjt-d
mg/kg-d
180E-01
2.00E-01
5 OOE-02
l.OOE-02
l.OOE-02
300E-04
mg/kg-d
mg/kg-d
mg/kg-d
mg/kg-d
4.79E-04
11BE-03
2.08E-04
Z72E-04
mg/kg-d
mg/kg^l
mg/kg^i
mg/kg-d
mg/kg-d
630E-01
1 40E-01
1 OOE-02
1 rjOt-02
mg/kg-d
mg/kg^l
mg/kgd
mg/kg-d
mg/kg^l
795E-06
\6tE-05
2.30E-06
312E-06
7.20E-07
mg/kgj
mg/kg-d
mg/kg-d
mg/kg^
mg/kg^l
mg/kg^l
6JOE-01
1.40E-01
570E-02
l.CXJE-02
1 OOE-02
mg/kg^J
mg/kg^
mg/kg^d
Hn.rrf
Qmttmt
193E-O4
1.Q3E-03
1.33E-03
362E-03
4.73E-03
3.34E-07
444E-02
357E-05
5.09E-05
1.17E-04
103E-04
1.77E-03
365E-03
5.B3E-03
502E-02
502E-02
7.61 E-04
B45E-03
NC
2.72E-02
4B9E-02
4 89E-02
4.89E-02
9.91 E-O2
1.26E-05
1.18E-O4
1.B3E-04
3.12E-04
7.20E flS
69BE-04
698E-04
698E-04
698E-04
N«-C«^ H«.rrf C.k,f.f,.«/,r Arf.ll
mtmkflEifmmrr CfUffTitrthmn
Vmlmi
2ME-05
7.10E-05
2.30E-05
1.25E-05
1.63E-05
345E-06
Unit,
mg/kgJ
mg/kg^l
mg/kgj
mg/kg^
mg/kg^l
mg/kgd
R/D/R/C
V./nr
280E-01
200F-01
5 OOE-02
1 OOE-02
1 OOE-02
3.00E-04
Unit,
mg/kg-d
mg/kg-d
mg/kg^
mg/kg-d
509E-05
51BE-06
297E-06
1 03E-06
9.02E-06
mg/kg-d
mg/kg-d
mg/kgJ
mg/kg-d
mg/kg^l
mg/kgJ
2 WE -01
200E-01
500E-02
1 OOE-02
1 OOE-02
300E-04
mg/kg-d
mg/kg-d
mg/kg-d
mg/kg^
mg/kg^J
mg/kg^
2.05E-04
507E-04
B90E-OS
1 16E-04
Z47E-05
mg/kgnd
1 40F-01
570E-02
1.00EO2
1 DDE-02
mg/kg-d
mg/kg-d
mg/kg-d
mg/kg-d
mg/Vg-d
709E-06
446E-06
1.34E-06
309E07
mg/kg^J
mg/kg^I
140E-01
S.70E-02
l.OOE-02
l.OOE-02
mg/kg^l
mg/kg-d
m(t/kg-d
H.i.rW
1 03E-04
3S5E-04
4ME-04
1.25E-03
1.63E-03
1.15E-02
1.53E-02
1 82E-05
159E-05
594E-05
1 03E-04
902E-04
1 85E-03
Z96E-03
1.B3E-02
1 83E-02
3.26E-04
3.62E-03
2B8E-03
NC
1 16E-02
247E-03
2.09E-02
2.09E-02
2WE-02
3.92E-02
507E-05
7.83E-05
NC
1 ME -04
309E-OS
2.99E-04
2.99E-04
Z99E-O4
2.99E-04
CRA 18925(21) APPL

TABLE B7 1A.CT
CALCULATION OF CHEMICAL CANCER RISKS AND NON-CANCER HAZARDS FOR FUTURE RESIDENT
CENTRAL TENDENCY USING CURRENT TCE TOXIC IT* DATA
AREA 5 • OFF CNH PROPERTY
PARKVIEW WELL SITE - NORTHERN STUDY AREA
GRAND ISLAND, NEBRASKA
xwanoTimefrnmc. Future
^rtrptor Population' Rrsidenl
Child *nd AdviH
MtJium
Groundwaler
JV.-rrMrJ,.-.
Pool Water (1)
Fi .i.rr Pmiml
Of fCNH Property
Ccjt**nrr Kfutr
Ingwlion
E*p. Roulc Total
Dermal
E.p Route Total
Cki-wir-J •(
,1,1-T rich loroe thane
,l-DicMor<*thuie
.1 -Dirrtlortjvthene
>tri ch lo roethcne
EPC
1.50E-03
3 TOE -03
1 20E-03
650E-04
850E-04
1 80E-04
,1,1-Trvhloroethane
,1-Dichloroc thane
1,1-Dichlonx-thene
01-1,2-Duhlywlhene
T e 1 r »c h loroe Ih mo
150E-03
l.IOt-03
6 WE-04
S.50E-04
l.BflE-M
mg/L
mg/L
mg/L
mg/L
mg/L
mR/L
mg/L
mg/L
ma/L
EKpoaurt- Poinl Tola!
•ipocure Medium Total
Ambient Air
Enp Route Tntal
1,l-Dirhloru<thane
l.l-Dichloroethene
ria-1 J-Dic'tiloroelhcne
Tetrach loroe thene
T nch loroe then r
700E-03
112E-02
987E-03
9.49E-03
2.16E-03
mg/m
mg/m
mg/mj
mg/mj
Exposure Point Tola
=xpo*ure Medium Total
Medium ToUl
V»l.f
Z36E-08
583F-OB
1 89E-08
1 02E-08
1 ME -OS
2. ME -04
8 58E-08
1 SflE-OS
Unit,
mpt/kg-d
mg/kg-d
mg/kg^J
mg/kg^l
mg/kg-d
V*/«
S70E-03
540E-01
400E-01
Uiriff
(mg/kg-d)-!
(mg/kj^l-1
(mg/kg-dH
(mg/kg-d H
mg/kg-d
mg/kg.
570E-03
-
(mg/kgdU
(mg/Vg-dM
{mg/kg-dM
( /^H
669E-0*,
3.11E-06
299E-06
679E-07
mg/kg-d
mg/kgj
mg/kg-d
mg/kg-d
210E-02
400E-01
(mg/kg-d J-l
(mg/kg-dM
Total of Receptor Risks Across All Media Using
Current TCE Toxicity Data
NC
332£-10
NC
NC
7.23E-09
1 13E-09
870E-Ofl
NC
5 13F-10
NC
822E-08
8ME-08
9.51 E-08
951E-08
NC
NC
628E-0*
2.77£-07
460E-07
460E-07
4M1E-07
5.55E-07
8.5E-06
N**-C**crT HmiMrd C*tr*lfh»*t f»r ChiU
V*l*t
2 ME -07
583E-07
1.89E-07
l.CCE-07
134E-07
284E-08
Unit,
mg/k«-d
mg/kg^l
mg/kg^J
mg/kg-d
RfDIRfC
Vml*.
280F-01
100E-01
5 OOE-02
1 OOE-02
1 OOE-02
U»if»
mg/kg<l
mg/kg-d
mg/kg^l
mg/kg-d
85JIE-07
9.0 1 E -07
l.BOE-07
1.52EO6
mg/kg-d
mg/kg-d
mg/kg-d
280E-01
200E-01
1 OOEO2
1 OOE-02
mg/kg^
^
669E-05
31JE-05
299E-05
67SE-06
mg/kg-d
mg/kg-d
mg/kg-d
mg/kg-d
1 40E-01
570E-02
l.OOE-02
l.OOE-02
mg/kg-d
mB/kg-d
mg/kg-d
mg/kg-d
Total of Rereptor Hazards Across All Media Using
Current TCE Toxicity Data
Haiarrf
Q«h«,r
2.91EO6
378E-06
1 02E-05
1 34E-05
1.26E-04
307E-06
•iSOE-06
1 SOE-05
501E-04
*.27E04
627E-04
1 58E-03
1 17E-03
NC
2.99E-03
679E-04
653E-03
6S3E-03
653E-03
715E-03
1.1E-01
-f.i,/r.f ..-n- C»-rr.fr.(..-
Viltt
NA
MA
NA
NA
U»,f.
mg/kgJ
mg/kg-d
mg/kgJ
mg/kg^i
R/D/H/C
V.I.,
2C10E-01
500E-OJ
] OOE-02
l.[»E-03
3WE-M
NANA
NA
mg/kgj
mg/kg^l
mg/kg-d
«*«*«
2.8UE-01
100F-0]
1 OOE-02
100E-03
JOCE-04
Umf,
mg/kgj
mg/kg<l
mg/kg-d
mg/kg-d
mg/kg-d
mg/kg-d
mg/kg<l
NA
NA
NA
NA
NA
mg/kg<l
mg/kg-d
mg/kg-d
mg/kg-d
630E-01
1 40F-01
5.70E-02
l.OOE-02
1 OOE-02
mg/kg-d
mg/kg-d
mg/kg-d
mg/kg-d
mg/kg-d
Total of Receptor Hazards Across All Media Using
Current TCE Toxiciry Data
Q..K»I
NC
NC
NC
NC
NC
NC
NC
NC
NC
NC
NC
NC
NC
NC
NC
NC
NC
NC
NC
NC
NC
NC
NC
NC
NC
NC
4.0E-02
NC- NotOlruUted
NA . NM Applir.bl*
|1) For Ihu *reriBno,only • child playing in the fxvl w»§ r
2i)>^^r
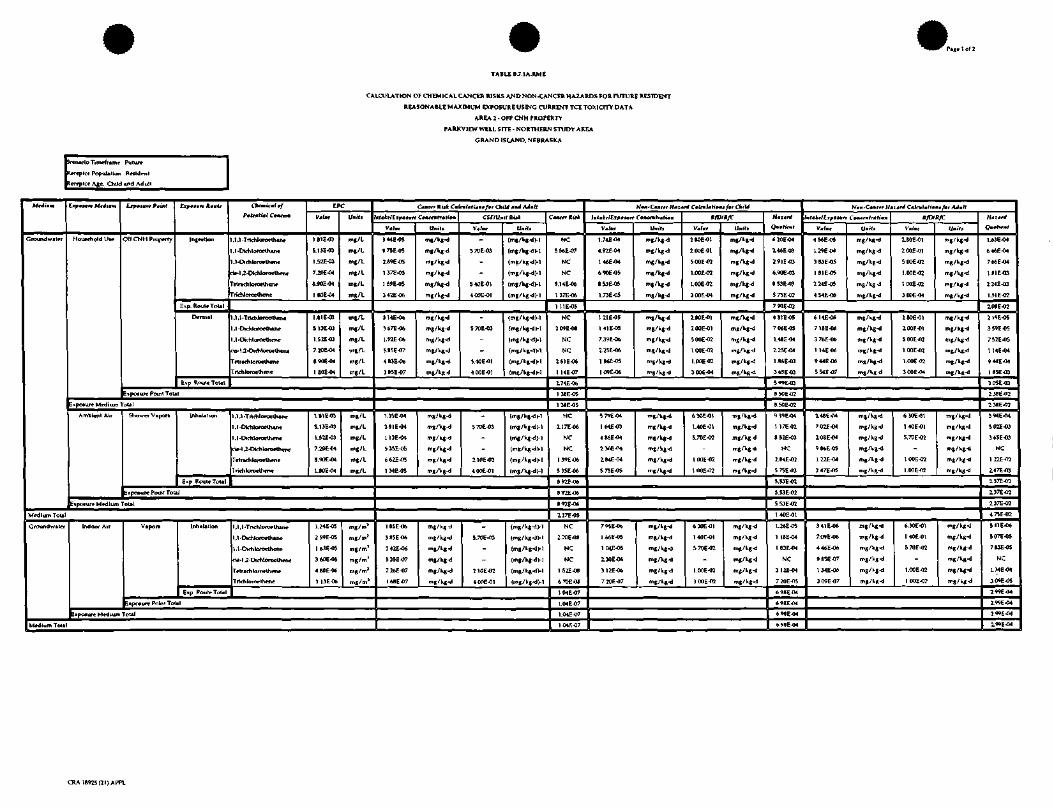
TABLE D.7.1A.RME
CALCULATION OF CHEMICAL CANCER RISKS AND NON-CANCER HAZARDS TOR FUTURE RESIDENT
REASONABLE MAXIMUM EXPOSURE USING CURRENT TCE TOXICITY DATA
AREA 1 - OFT CNH PROPERTY
PARKVIEW WELL srre - NORTHERN STUDY AREAGRAND ISLAND. NEBRASKA
«-er»rioTime<TBme Future
Irrrptor Popidahon Rnldml
liffptor Age: Child Mid Adull
Mtd,mm
Ground water
Ixptlmrt M'^IHM
Household UM
Cxp»«*rr PuiMt
OH CNH Property
Lrpftmn Rmmti
Ingntion
Exp. Roule ToUl
Dermal
C*tmitmt,f
Pmtrmtiml Cfnerrm
,U-Trichloroethane
,l-Dichloroe-th«ne
1,1-Dichloroethene
rii-U-Dichloroelhene
Trtradilorwlhcne
Tridilororthenc
EPC
V-l.f
1.S1E-03
5.13E-03
1.S2E-03
7.2DE-04
8.90E-W
1BOE-04
Unit*
mg/L
mg/L
mg/L
mg/L
mg/L
mg/L
1 ,1 .l-Tridxtoroethaj*
1 ,1 -Dichloroethane
1,1-Dirhlorotlhene
cwl 2-Dtthkwoelh*™
Trtrach loroethene
Thdiloroethntr
1.81E-03
S 13E-03
1.52E-03
7.20E-M
890E-M
1 SOE-04
mg/L
mg/L
mg/L
mi^L
mg/L
mg/L
^E»p Rou',«ToUl |
Eipocure Poinl ToUl
i»po«ur» Medium ToUl
Ambwnl Air Shower V«pon lnh»lihcwi
Exp Roule ToUl
l.l.t-Trichloroc lh«ne
l,)-Dichlororth»ne
1,1-Dichlororthcne
rii-U -Dichlororthene
T r trach lorotlh en c
T richlonwthenc
\ 81E-01
5.13E-03
1.51E-03
7.2DE-M
S.90E-M
l.SOE-M
mg/L
mg/L
mg/L
m^L
mg/L
mg/L.
E'po*ure Point ToUl
E»po»urr Medium ToUl
Medium ToUl
Croundwilei Indoor Air V.por, Inhalation
E«p RoulrTaUl
1 ,1 ,1 Tnchlororth*nr
1 ,1 -Dichloro«lh«n*
1 ,1 -Dirhloroethrnc
nj-lJ-DirMoroelhenr
TrtrichloKwlhmr
Tri rh 1 oinc 1 h*ne
1.24E-OS
2 59E-05
lt3E-05
360E-06
4S6E-06
1.13E06
mg/m*
rng/m*
mg/m
mg/m
mg/rn
^ipofurc PnlritTolal
Exposure Medium Total
M*dlum Total
C«nr«T Kill C.I™J-fi'»««/»f OtiU «xJ AW.ff
mtikf/Eipoixrt C»mfrmtrmti»m
Vmlmr
344E-05
975E-05
2.S9E-05
1.37E-OS
169E-05
342E-06
Unir>
mg/k*^
mg/k«J
mg/kg-d
mg/kg-d
mg/kg-d
mg/kg^J
CSr/UnitRuk
Vmlmr
570E-03
540E-01
400E-01
Umitt
mg/kg-d H
mg/kg-d )-l
(mg/kg-dH
(mg/kg^)-l
(mg/kg-d H
(mg/kg-dl-1
314E-06
367E-06
1.92E-06
5.S5E-07
4UE-06
2B5E-07
mR/kft^
mg/kg-d
mg/kg-d
™g/V*^
mg/kg-d
mg/kgJ
570E-OJ
HOOE-01
(mg/k^-d)-!
(mg/kg-d )-l
(mg/kg-d)-l
(mj/kg-d)-!
(mg/kg^H
1.35E-M
331E-04
1 13E-04
&3SE-OS
662E-05
1 34E-05
mg/Vg-d
fg/kg-d
mg/kg^
mg/Vg-d
mg/kg-d
mg/kg-d
570E-03
21PE-02
400E-01
(mg/Wg-d)-!
(mg/kg-dVI
(mg/kg-d)-!
(m(t/Vg-d)-l
(mg/kg^J-1
(mg/kg-d)-!
1 BSE -06
385E06
242E-06
S35E07
726E-07
1&8E-07
mg/kgd
mg/kg^J
mg/k«^
mg/kg-d
mg/kg^
mg/kg^J
5.70E-03
210E-O2
400E-01
(mg/kg-dH
(mg/kg-d H
(mg/kg-d).]
(mg/kg-d)-]
(mg/kg-dH
(mg/kg-d)-!
CmmerrRuk
NC
556E-07
NC
NC
9.14E-06
1 37E-06
1.11E-05
NC
209E-08
NC
NC
1 14E-07
1.74E-Ofe
l.ME-05
1 38E-05
NC
2.17E-06
NC
NC
1.39E-06
535E-06
892E-06
892E-06
B92E-06
127E-05
NC
2.ME-08
NC
NC
152E-08
670E-OI
1ME-07
1.04E-07
l.tHE-07
1 WF,-07
N*m-CmmrrrHmi»rt Cmlcmlmtiemifrr CkiU
Imttkr/Eifftmrr C*aentv«fi»
Vtlut
1.74E-04
<.92£-M
1.46E-04
690E-05
S53E-05
1.73E-OS
Unit*
mg/kg^J
mg/kg^
mg/kg-d
mg/kg^J
mg/kg-d
mg/kg^l
R/D/RJT
V«f«
280E-01
100E-01
500E-02
l.OOE-02
l.OOE-02
300E-W
L/«r(.
mg/kg^l
m,(/kgKl
mg/kgnd
mg/kg^J
mg/kg-d
mg/kg-d
1 21E-05
1 41E-05
7.39E-06
125E-06
l.ME-05
l.OTE-06
mg/kg-d
mg/kg-d
mg/kg-d
mg/kg-d
mg/kg^
mg/kgJ
2.80E-01
200E-01
500E-02
IOQE-07
1.00EO2
300E-04
mn/k«^
mg/kg-d
mg/kg^
mj/ke^
mg/kg-d
mB/kK-d
57SE-04
I ME -03
486E-04
13(lE-f^
2.ME-W
575E-05
mg/kg-d
mg/kg-d
mg/kj-d
mg/ltg-d
mg/kg-d
mg/kg-d
63OE-01
1.40E-01
5.7DE-02
1 OOE-02
l.OOE-02
mg/Wg-d
mg/kg-d
mg/kg-d
mg/Vg-d
mg/Lg^
mg/kg-d
795E-06
I.WE -05
1 ME-05
130E-06
312E-06
7.20E-07
mg/kg-d
mg/kg-d
mg/kg-d
mg/kg-d
mg/kg^
6.30E-01
1 WE -01
S7DE-02
l.OOE-02
mg/kg-d
m|t/kg^
mp/kg-d
mg/kg-d
mg/kg^d
H«i«rrf
Qm»tir*t
620EO4
146E-03
791E-03
6.90E-03
isaK-nj
575E-02
790E*2
431E-05
7.06E-05
1.4SE-M
2.25E-G4
1.86E-03
365E-03
5WE-03
I50E-02
8.50E-02
<)19E-M
1.17E-02
S.52E-03
NC
2.84E-02
5.7SE-03
5.53E-CQ
5.S3E-02
5S3E-02
1 40E-01
1.26E-05
1.1BE-04
1 B3E-04
NC
7 20E-05
69SE-54
698E-04
698E-04
6 V BE -O4
Nmn-Cmnrrr H-l-rW C*ir./.f.e..i/.r /U./f
ntfkrfLifftffr Cmmtnlritti**
Vttmr
4M.E-05
1.29E-04
3UE-05
1 81E-O5
224E-05
454E-06
Unit,
mg/kg^
mg/kg-d
mg/kg^J
mg/kg^J
mg''Vgd
mg/kg^
R/D/R/C
Yftmt
2.SOE-01
200E-01
SOOE^K
l.OOE-02
1 OOE-02
300E-O4
limit,
mg/kg^
mg/kg-d
mg/kg-d
mg/kg-d
mg/kgxl
mg/kg^
614E-06
7.18E-06
376E-06
1 14EOC
944E-06
556E-07
mg/kg^l
mg/kg-d
mg/kg-d
mR/kg^i
mn/kg-d
280E-01
2. OOF -01
5 OOE-02
1 OOE-02
1.00EO2
300E-04
mg/kg-d
mg/kg-d
mg/kj-d
mg/kn-d
mg/kg-d
mg/kg^
^«t-04
702P-04
10SE-04
•)St.E-OS
1 22E-W
247E-05
mg/kg^l
mg/kg^J
mg/kg^d
mg/kg-d
mg/kgd
mg/kg^
63QE-QI
1 40E-01
S.7DE-02
1 OOE-02
l.OOE-02
mj/kg-d
mg/k|!^
mg/kg-d
mg/kg-d
mg/kg-d
mg/kg-d
341E-06
7.09E-06
446E-06
985EO7
3 WE -07
mg/Wg^
mg/kg^i
mg/kg-d
mg/kgJ
mg/kg-d
6.30E-01
1 40E-01
570F-02
1 OOE-07
mg/kg^
mg/kg^l
mg/kg-d
mg/kg^
mg/kn-d
H«i«rrf
Q*thf*t
1.63E-04
646E-O4
766E-O4
1 81E-03
234E-03
1.51E-02
108E-02
219E-05
3 59E-05
752E-05
1 HE -04
944E-04
1 85E-03
305E-03
23BE-02
2J8E-02
394.E-04
S02E-03
365E-03
NC
1 22E-02
2.47Efl3
li7E-O2
2.37E-02
2.37E-02
475E-07
541E-06
507E-05
7B3E-OS
NC
1.34E-04
309E-05
199E-04
2.99E-04
299E-04
2.99E-04
OUU925(21)APPl
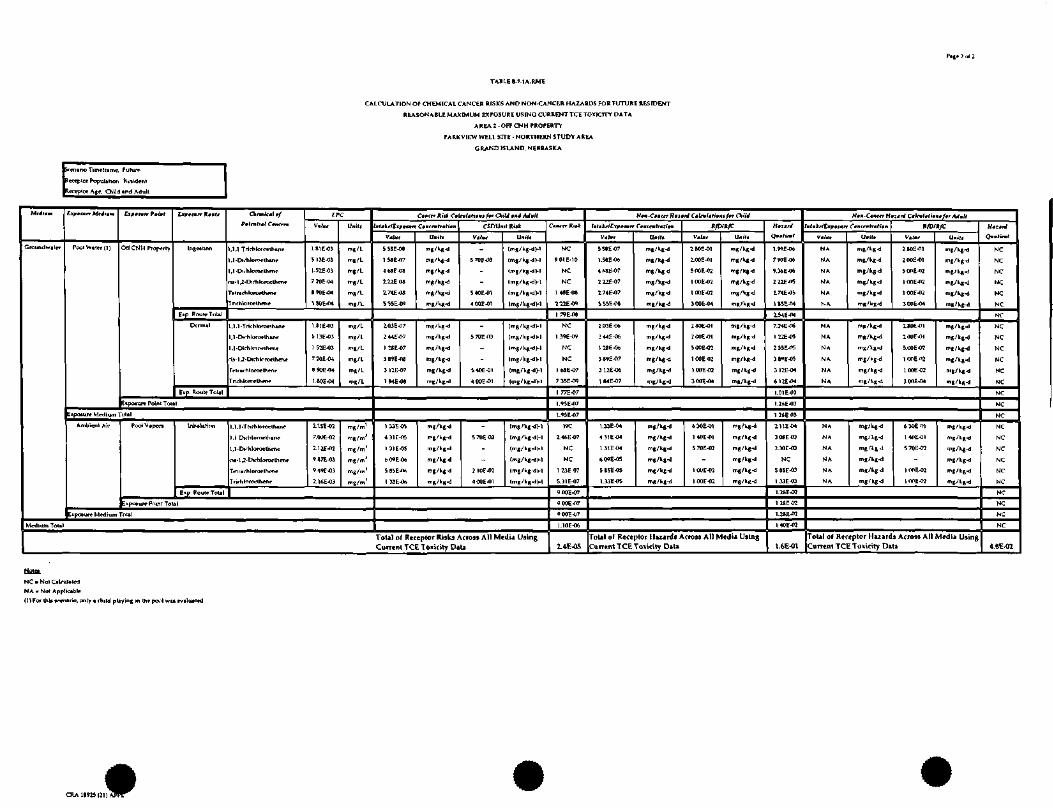
TABLE B.7.1A.RME
CALCULATION OF CHEMICAL CANCER RJSKS AND NON-CANCER HAZARDS FOR FUTURE RESIDENT
REASONABLE MAXIMUM EXPOSURE USING CURRENT TCE TOXICITY DATA
AREAI-OFFCNH PROPERTY
PARKVIEW WELL SITE - NORTHERN STUDY AREA
GRAND ISLAND. NEBRASKA
o Timetramr Future
or Population TUtldtnt
or Age. Child and Adult
Ground water Pool W«t*r (1) OIICNH Property lnge»linn
E»p Route Total
Dvrmal
E*p. Route- Total
P»tr*h*l CfMfrr*
,1.1 Trirhloro*thane
.l-Dii-tiloroethan*
,1 -Dii hloroelhme
oi-l ,2-Dirhloroe then*
> r rmch 1 ororthrtvr
1 nr hloroelhene
5 13E-03
1.52E-03
720E-04
S90E-04
1 WE-M
mj/L
mg/L
"VI-mj/L
tn,;L
,1.1 -T rich lorow thane
,1-Dirhloroelhane
,1-Dirhlorocthifie
ri»-l,2-Dirhloroethene
Trtrarhloroelhenr
Fnchlorrwlhmr
1.81E-03
1 51E-OJ
720E-O4
890E-04
1.80E-04
mK/L
mg/L
mg/L
inj/L
m,/L
F,»po*ure Poinl Total
:ipc»ur* Medium Tol«l
Ambient Air Pool Vapor* InhaUtic-n
E«p Route Total
1,1 Dkhloror inane
1 ,1 -Dirhloroelhenr
cii-U-Dvhloroelhene
Tetr«rhloro«:thoT*
T rir h 1 oroe Ihene
7.00E-02
2.12E-02
987E-03
949E-03
™S""'
,
mg/m
mg/m3
= >po» urt Point Talal
Ei.po.ure Medium Tflal
Medium Total
V«J«f
1 HE-07
2.22E08
174E-08
555c-W
Unit,
mg/Vg-d
mg/kR<!
mR/^-d
rr-R/VR^
103E-07
1 28E-07
389E-08
31ZE-07
1.S4E-08
mn/kg-d
m)(/kg-d
mg/kg-d
mB/V(;^
Vmlmr
5 TOE -03
540E-01
A DOE -01
-
"
S40E-01
400E-01
Um(j
{mg/kg-d )-l
(mg/Vg-d)-!
(mg/kg-dH
(mg/kg-d>-l
(mg/kg-d VI
(mg/kg-d)-!
(mg/kg-d )•!
(mg/kg-d )-!
609E-06
58bE-fW,
mg/kg^l
!T,g/kgJ 2 10E-02
Img/kg-dH
8
{mg/kg-dM
(mg/kg-dj-l
Totj] of Receptor Riskfl Across All Media Using
Current TCE Toxicity Dali
C«>rrr Rut
901E-10
NC
1 WE-08
772E-OT
1 79E-06
NC
1.39E-OT
NC
1 68E-07
735E-W
1 77E-07
1.95E-07
1.95E-07
NC
NC
NC
1 23E07
900E-07
900E-07
900E-07
1.IOE-06
L4E-05
IntikrlEtfimrt Ctmentrmtio*
V*I«
1.5BE-06
222E-07
2.74E-07
203E-06
244E-06
I 28E-06
3 12£-06
1 ME-07
Unlf«
* «
mg/kg-d
mg/kg-d
mg/kg^
mg/kgKl
mg/kg^
mg/kg^l
R/D/«^C
Vmlmr
100E-02
1 OOE-02
280E-01
200E-01
1 OOE-O2
300E-04
UH ill
K ^
mg/kg^J
mg/kg-d
mg/kg-d
mg/kgd
mg/kg-d
1.33E-04
1 3lE<H
6.09E-05
5B5E-O5
1.33E-05
mg/Vg^l
mg/kg^J
mg/kg^J
mg/kg-d
mg/kg-d
630E-01
570E-02
1 OUE-02
1 OOE-02
mg/'kg-d
mg/kg-d
mg/kgJ
mg/kg-d
mg/kK-d
Total of Receptor Hazards Across All Media Using
Current TCE Toxicity DaU
H«i«n*
Qm.tirtt
l.WE-06
7 WE 06
2.22E-05
174E-05
1WE-04
7.24E-W
1 22E-05
3 89E-05
612E-04
1.01 E-03
1.2AE-03
1 26E 03
2.11E-M
130E-03
NC
5 85E-03
1 33E-03
1.2BE-02
1 2SE02
1.2BF.-02
1 40E-02
1.6E-01
mtfkr/Lrp»i*rf Cfitrntrmh»n
VtlMt
NA
NA
NA
NANA
NA
NA
NA
NA
Ullitt
mg/kgd
mg/kg^
mg/kgJ
mg/kg-d
mg/kg-d
mg/kg-d
mg/kg-d
mg/Vgd
mpt/kg-d
R/D/R/C
VafBi-
280E-01
200E-01
500E-02
1.00E-TT2
100E-02
Z80E-01
200E-OI
1.nOE^2
100E-02
300E-W
U..t*
mg/kg-d
mg/Vg-d
mg/kg-d
mg/kg^J
mg/kg^l
mg/kg-d
•"8/kg-d
mg/kg-d
mg/kg-d
mg/kg^l
NA
NA
NA
NA
NA
mg/VgKl
mK /kgJ
mg/kg-d
mn/kgd
mg/kg-d
S30E01
570E-02
1. OOF. -02
l.OOE-02
mg/kg-d
mg/kg^l
mg/kg-d
mg/kg-d
mg/kg^l
ToLtl of Receptor Hazards Across All Media Using
Current TCE Toxicity DiU
H«I«rW
O»rwTif
NC
NC
NC
NC
NC
NC
NC
NC
NC
NC
NC
NC
NC
NC
NC
NC
NC
NC
NC
NC
NC
NC
NC
NC
NC
NC
4.6E-01
NC- NolCxkulaled
NA - Not Applicable
(1) For thu tmurio, only a child pitying in the pool wit evaluated.
21) J^^T
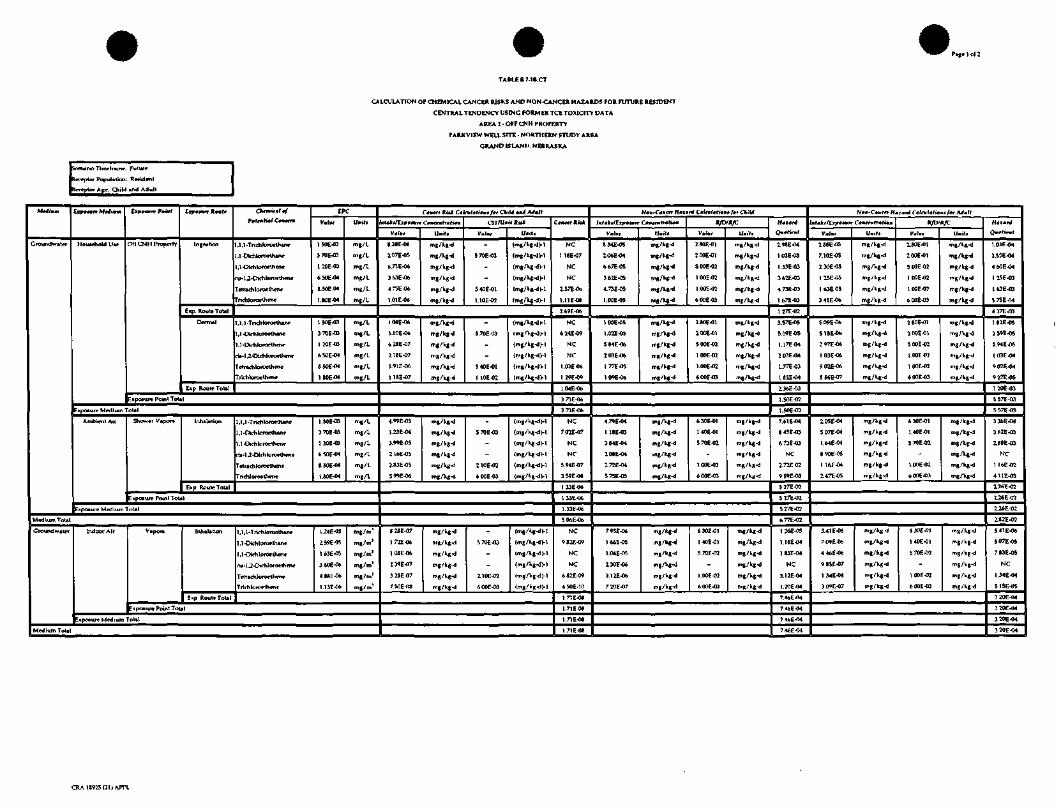
Page 1 of 2
TABLE B.T.1B.CT
CALCULATION OF CHEMICAL CANCER RJSKS AND NON-CANCER HAZARDS FOR FUTURE RESIDENT
CENTRAL TENDENCY USING FORMER TCE TOXICITY DATA
AREA J - OFF CNH PROPERTY
PARKVIEW WELL SITE - NORTHERN STUDY AREA
GRAND IS LAN II, NEBRASKA
anoTtmeframe. Fulurr
Irceplor Population: Resident
*erwptor Age. Child end Aduli
Mttimm
Groundwaler
OT.t.r.Mr*.'.
Household Ui*
Esp*»rr Pmimt
OffCNH Property
Lxpitmrr Kmmtr
Inge* lion
Eip. Route Total
Dermal
Exp Route Tolal
ommr.itfPftrntiml Cfmcrrm
,U-Tnrfiloroetharw
,l-CHchloro*lhajv
,1-Di*loroethen«
Tetrachtoroelh*ne
TnchJororthene
EPC
V«I«
150E-03
370E-03
1 20E-03
650E-04
S.SOE-W
1.80E-04
Umitt
mg/L
mg/L
mg/L
mg/L
mg/L
mg/L
,1,1-Tnchlororthanr
1,1-Dktiloroelhane
1,1-Dlchloroelhenc
cii-1 J-Oichloroelhenr
f etnch loroclhene
Trkhlorotfthene
1.50E-03
370E-O3
1 20E-03
6UE-04
S.ME-M
1 BOE-04
mg/L
mg/L
mg/L
mg/L
Exposure Poml Total
•ipcwure Medium ToUl
Ambtenl Air Shower Vapor*
= xpo«ure Point ToU
Inhalation
E«p Route ToUl
1
1,1,1-Trirftloroethane
U-OMiloroe thane
1 ,1 -Dichloroethene
cu-U-Dirhloroelhene
T«tr«chloroethene
Trich 1 oro*th«Ti*
1.50E-03
3 TOE -03
1.20E-03
650E-04
B.50E-04
1.80E-04
mg/L
mg/L
mg/L
mg/L
mg/L
E«pc*ure Medium Ti?tal
Medium ToUl
Ground water Indoor Air Vapor. Inhalation
Eip Route ToUl
1,1,1 -Trirhloroethane
1.1-Dictiloroe thane
1.1-Oichloroe there
rii -1 J-Dirhloroelhene
Tetri ch loroeth ene
Tric+i lo njf thene
1.24E-05
2.59E-05
1 WE-05
360E-0*
4SBE-06
1.13E-06
mg/m
mg/m
mg/m
mg/m
mg/m3
;tpoaure Point Total
Eipocure Medium Tolal
Medium ToUl
Ctmcrr Rut Ctlnlifomt f»r ChiU *»i AJmlt
B.38E-06
20TE-05
3UE-06
475EO6
1.01E-06
mg/kg-d
mg/kg-d
mg/kg-d
mg/kg-d
mg/kg-d
csrm-
570E-03
SWE-01
1.10E-02
(Ruk
(mg/kg-dH
(mg/kg-dH
mg/kg-dH
(mg/kg-dH
108E-06
62SE-OT
2.1BE-07
1.91E-06
1 18E-07
mg/kg-d
mg/kg-d
mg/kg-d
mg/kg-d
mg/kg^l
S.70E-03
540E-01
1 10E-02
(mg/kg-dH
(mg/kg-dH
(mg/kg-dH
(mg/kg-dH
(mg/kg-dH
4.99E-05
1.23E-04
3.99E-05
2 16E-05
2-83E-05
5WE-06
mg/kgJ
mg/kgJ
mg/kg-d
mg/kg-d
570E-03
210E-02
600E-03
(mg/kg-dH
(mg/kg-dH
(mg/kg-dH
(mg/kg-dH
B28E-07
1 72E-06
108E-06
32SE-07
7. WE -08
mg/kg^
mg/kg-d
mg/kg^J
mg/kg^i
mg/kg^l
570E-03
110E-02
600E-03
(mg/kg-dH
(Rlg/kg-d)-!
(mg/kg-d H
(mg/kg-dH
(mg/kg-dH
CnctrHitk
NC
1 18E-07
NC
2.57E-06
i. HE-OS
2.69E-06
NC
6241-09
NC
NC
1.03E-06
1 29E-09
1.04E-06
373E-06
3T3E-06
NC
702E-07
NC
NC
5.94E-07
359E-OB
1 33E-06
\33E-06
1.33E-M
S06E-06
NC
982E-09
NC
NC
682E-O9
4.50E-10
1.71E-08
1.71 EOS
1. TIE-OB
1. TIE-OS
N«-C««r H-i.rrf C.M.MM/., O.iU
8.34E-05
106E-04
667E-05
V73E-05
l.OOE-05
mg/kg-d
mg/kg-d
mg/kg-d
R/D
2.BOE-01
2 OOE -01
5.00E-02
1 OOE-02
1 OOE-02
600E-03
fRfC
mg/kg-d
mg/kg^J
mg/kg^l
mg/kg-d
mg/kg-d
100E-05
1.02E-OS
5ME-06
203E-06
177E-05
1.09E-06
mg/kg-d
mg/kg-d
180E-01
200E-01
5 OOE -02
1 OOE-02
1. OOE-02
600E.Q3
mg/kg-d
mg/kg^l
mg/kg^l
mg/kg-d
mg/kg-d
4.79E-04
1 1SE-03
3B4E-04
208E-04
1T2E-04
575E-05
mg/kg-d
mg/kg-d
630E-01
140E-01
570E-02
1. OOE-02
600E-03
mg/kg-d
mg/kg-d
mg/kg-d
795E-06
1.66E-05
1.ME-05
2.30E-06
3.12E-06
720E-07
mg/kg-d
mg/kg-d
630E-01
1 40E-01
5.7DE-02
1. OOE-02
600E-03
mg/kg-d
mg/kg-d
mg/kg-d
mg/kg-d
mg/kg-d
HtttrJ
298E-04
1 03E-03
1.33E-03
362E-03
4.73E-03
1.67E-03
127E-02
3.57E-05
5.09E-05
1.17E04
203E-04
1.77E-03
1 82E-04
136E-03
l.SOE-02
1.50E-02
7.61 E-04
673E-03
NC
2.72EO2
9.59E-03
SITE 02
SITE -02
527E-02
677E-02
1.26E-05
1.1SE-04
1.&3E-04
NC
3.12E-04
1.20E-04
7.46E-04
746E-04
746E-04
746E-04
N*"-Cm»rrr HmimrJ C'lf !•(,»»• f»r AJult
mtfkttEipfimtr
18BE-OS
7.10E-05
230E-05
1 25E-05
1 WE 05
345E-06
C.-rr»fr-f..»
mg/kg-d
mg/kg-d
mg/kg^l
mg/kg<l
mg/kg-d
R/D/
2.BOE-01
2 OOE -01
5 OOE -02
1 OOE-02
10DE-03
600E-03
R/C
mg/kg^
mg/kg<i
mg/kg^
S09EO6
51BE-Ob
297E-06
103E-06
5.56E-07
mg/kg^J
mg/Vg-d
mg/kg^
mg/kg^J
mg/kg-d
2BOE-01
5 OOE -02
1. OOE O2
600E-03
mg/kgj
mg/kg-d
mg/kg^J
mg/kg^i
mg/kg-d
2.0SE-04
l.ME-04
B90E-05
1 16F-04
147E-05
mg/kg-d
mg/kg-d
mg/kg^J
630E-01
570E-02
1. DOE -02
6 OOE -03
mg/kg-d
mg/kg^l
mg/kg-d
mg/kg-d
mg/kg^l
3.41E-06
7.09E-06
446E-06
9.85E-07
1 34E-06
309E-07
mg/kgd
mg/kg-d
mg/kg-d
mg/kg-d
mg/kg-d
630E-01
1 40E-01
5 TOE -02
1 OOE-02
bOOE-03
mg/kgKi
mg/kg-d
mg/kg-d
*; (1.03 E-04
3.55 E-04
460E-04
1 25E-03
1&3E-03
5T5E-04
437E-03
182JE-05
5.94 E-OS
1 03E-O4
902E-04
927E-05
1 20E-03
5.5TE-03
5S7E-03
32AE-04
NC
1.16E-02
4UE-03
2.26E-02
2.26E-02
2.26E-02
182E-02
541E-06
S07E-05
7S3E-05
NC
1.34E-04
S15E-05
320E-04
320E-04
3.20E-04
32OE-W
CRA 18935(21) APPL
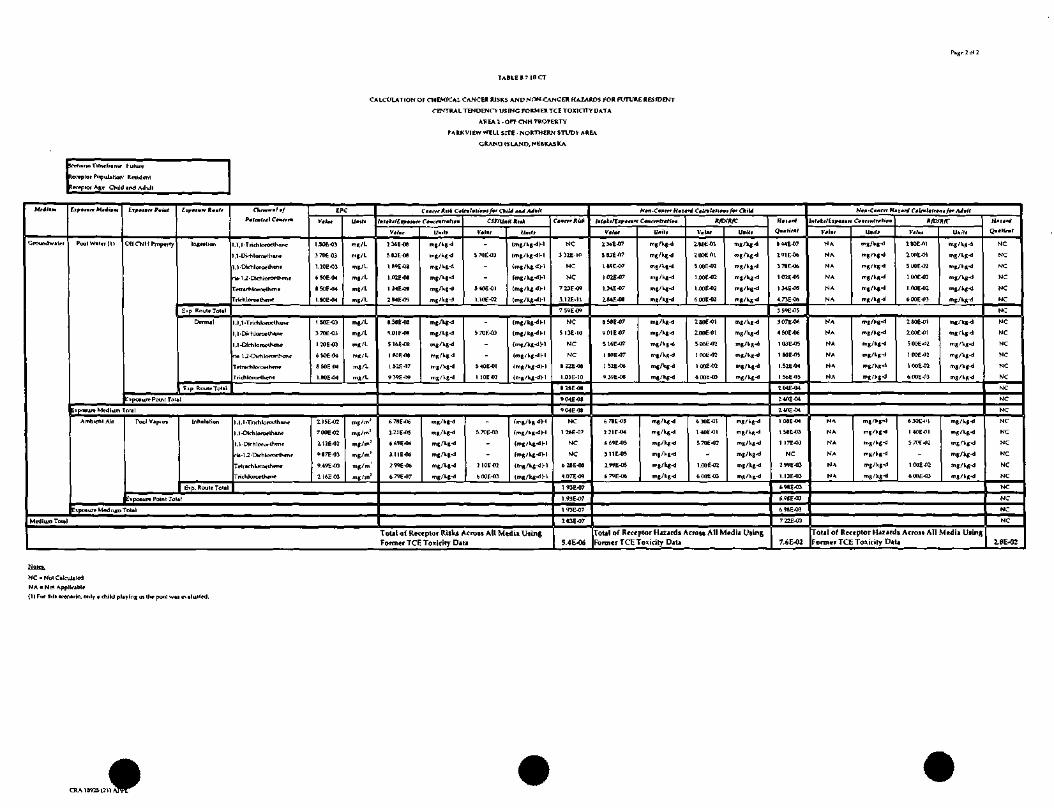
TABLE B.? IBCT
CALCULATION OF CHEMICAL CANCER RJSKS AND NON-CANCER HAZARDS FOR FUTURE RESIDENT
CENTRAL TENDENCY USFNC FORMER TCE TOXlCrTY DATA
AREA 2 - OFF CNH PROPERTY
REA
GRAND ISLAND, NEBRASKA
anoTimerrarnf huhirc
lereptor Population' Rettdenl
tcccplor Ajc. Child and Adull
C round w i iff Pool Waier(l) Off CNH Property Ingeihon
E«p Route Tolal
Dermal
E*p Route Tolal
Pflrmttll CtHftrm
,U-Trichloroelhar>e
,1 -Dirriloroelhene
da-U-Dichloroethcne
Tetrach lo rt^th en e
Trichloroethene
CPC
Vmlmt
1.50E-03
3 TOE 03
V20E-03
650E-04
B50F-04
l.SOE-04
U-.l.
mg/L
mg/L
mg/L
,1,1-Trirhloroclhan*
,1 -DichJoroelhane
,1-Dirhlorocthene
ri. U-Dirtiloroethene
T e trarh 1 oroet h en e
T rich lomr there
1 SOE-03
3 TOE -03
1 20E-03
6WE-04
SSOEO4
l.SOE-W
mg/L
mg/L
mg/L
:>po»ure Point Total
Eipoiure Medium Total
Ambxfil Air Pool Vap,,r» Inhalation
E<p. Route Total
1.1.1-Tnchloroolhanc
1.1-Dirhloroelhane
l.i-Dirhlorurlhene
rif-U-Dtchlomeihene
Tetrach loroethene
TrichJoroplhen*
115E-02
700EO2
9.49E-03
216E03
mg/m
:;::•':>poaure Point Total
Eipoture Medium Tolal
Medium Tola
C««rRMiC.I«l.»,-.«/.rOi,-M«-Al.ft
lmt.krll^tt»n C.mrrxtTihi*
Vfl*t
5BJE-08
1 B1E-08
1.02E-08
2 ME -09
Un,t,
:Smg/k,^
CSriUnit Rttk
VllHt
57DE-03
1.1DE-02
U..H
(m,/l,-iH
B.S8E-08
5 lbE-08
1. 521= -07
n,,/K!<i
mg/kg<l
S40E-01
(n,S/kg^H
*.„/*<....
(mg/kgJH
67BE-06
2.2IE-05
299E-06
679E-07
mg/kg-d
t e
mg/kg<l
5.70E-03
210E-02
600E-03
(n-g/kgd)-,
(mg/kg^H
ToUl of Receptor Risks Across All Media UsingFormer TCE Toxicity Data
C—trrRUk
NC
332E-1G
NC
NC
7.23E-09
3.12Z-11
759E-09
NC
NC
B22E-08
1.03E-10
K2BE-OB
904E-08
9 ME -08
NC
NC
62BE-00
«.OTE<W
1 93E-07
1.93E-07
1 93E-07
283E-07
5.4E-06
N«.C«rrrH««rfC,ii«l-f.«.>rC»,-W
/.(.t,/[.r«»rr Cturm fi'..
v«;«<-
5B3E-07
1 B9E-07
1.02E-07
1.34E-07
2.ME-08
UK iff
mg/kg-d
mg/kg-d
mg/Kf^l
mg/kg-d
R/D/R/t
V.Jnr
2-BOt-Ol
100EOI
5.00E-02
l.OOE-02
l.OOE-02
6.00E-03
Umili
mg/kg-d
mg/tg«i
mg/k^
mg/kg^
BME-07
516E-07
1 52E-06
9.39E-OB
mg/kg-d
mg/kg-d
2 ME -01
2.00E-01
SOOt -02
1 OOE-02
600H-03
mg/kg-d
mg/kg-d
mj/kg-d
mg/kgj
3 HE-OS
199E-05
679E-06
m^/kg-d
mg/kg-d
rrg/kg-d
mg/kg^
1 40E-01
l.OOE-02
6 DOE -03
-,/v.-
mg/kg-d
mg/kg^
mg/kg^
Total of Receptor Hazards Across All Media UsingFormer TCE Toxicity Data
H.i.frf
O.hr.(
SMEW
191E-06
1 02E-05
1.34E-05
4.73E-06
3.59E-05
307E-W,
450E-06
1.03E-05
1.&2E-04
1 56E-05
10AEXM
240E*4
240E-04
l.bBE-03
NC
299E-03
1.13E-O3
69SE-C3
6.9BEfl3
6 98E-03
7.22E-03
7.6E-02
Nw-C.-rrfH^.fWr.W.f.M.^^ft
.f.l,/t.TP.,.rr C»»nmtrffi9H
V-(«
NANA
NA
NANA
NA
U.il*
mg/kg^J
mg/kgJ
S/D/R/T
V4,,,
2 aOE-fH
lonE-01
5 OOE-02
1WE-02
l.OOE-02
600E-03
Unilt
mg/V)t-d
NA
NA
NA
NA
NA
mg/kg^
mg/kg^
mg/kg-d
280E-01
ZOOE-Ol
1 OOE-02
1 OOE-02
600E-03
mg/kg-d
mg/kg-d
mg/kg-d
mg/kg^l
mg/kg-d
mg/kg-d
NA
NA
NA
NA
mg/kg^l
mg/kg^
mg/kg^l
mg/kg^
630E-C1
I 40E-01
1 OOE-02
600E-03
mg/kg-d
mg/k^-d
mg/kg^
Total of Receptor Hazards Across All Media UsingFormer TCE Toxicity Data
H*i.rrf
NC
NC
NC
NC
NC
NC
NC
NC
NC
NC
NC
NC
NC
NC
NC
NC
NC
NC
NC
NC
NC
NC
NC
NC
2.8E-02
NQlff,
NC - Ni>t Calculated
NA - NcX Applicable
(1) For iHi scenario, only a child playing in the pool was e
JDJ^PTr

TABLE B.7.1B.RME
CALCULATION OF CHEMICAL CANCER RISKS AND NON-CANCER HAZARDS FOR FUTURE RESIDENT
REASONABLE MAXIMUM EXPOSURE USING FORMER TCE TOX1CITV DATA
AREA 2 • OFF CNH PROPERTY
PARKVIEW WELL SFTE - NORTHERN STUDY AREA
GRAND ISLAND. NEBRASKA
Scenario Timefram*. Future
Iccrplor Population' R raid en I
Age. Child and AduJl^
AfaflMM
Groundtvaier
EXEMPT Mtftmm
Household U«*
txpitmrt P«rnr
Off CNH Property
Ltfftmn Rfutr
Ingeftton
Eip. Route Total
Dermal
Exp. Roule Total
Ckrmictl •/
Pitntiml Cfmrrrm
,1,1-THchloroethane
.1-Dichloroethar*
,1-Dtchloroethene
ri»-l ,2-Dkhloroelhene
TetracMororthene
richloroethene
tPC
V-l"'
1 BIE-03
5.13E-03
1 52E-03
7.20E-04
B90E-04
\ WE-04
Umiti
mg/L
mg/L
mg/L
mg/L
mg/L
mg/L
,1 ,1 -Trirhloroethane
,1-Dichlororthane
,1 -Dtchloroelherw
cia-U-Qich loroe Own*
Ttrratriloroethene
Trirh loroe Ihene
1.B1E-03
513E-03
1.52E-03
7.20E-04
8.90E-04
1 BOE-04
mg/L
mg/L
mg/L
mg/L
mg/L
mg/L
Eipcaurr Point Total
:»po« ure Medium ToUl
Ambient Air Shower Vaporv Inhalation
Exp Route Total
1,1,1-Tnchloratiunr
1 , 1 - Dich 1 Droethane
1,1-Du-hloroethene
cu-1 >Oichlorae(hene
Telractiloroethene
T rich kiroethene
lfllE-03
313E-03
1.52E-03
720E-04
B90E-04
l.WE-04
mg/L
mg/L
mg/L
mg/L
mg/L
mg/L
Eipo* ure Point Total
Eopoaurr Medium Total
Medium Tola!
G round waler
Medium Total
Indoor Air Vapor» Inhalation
Eip Rc-uieToiil
E«p<»urr Point ToUl
1,1,1 -Inch kwwthnrw
1 ,1 -Dichloroe lhane
ru-IJ-Diehloroethene
Tel rarh Ic roeth enc
Tnchlororthcnr
1 24E-OS
159E-05
1 63E-05
360E-06
458E-06
1.13E-06
mg/m
mg/m
mg/m
mg/m1
Enpoi ure Medium Totil
Cmmar JLifk Cmlt*lmh**l fir OtiU m*m MM
f.Jtr/E^.wrr CMmrrah*.
Vmlmt
344E-05
9.75E-05
18SE-05
1.37E-05
1.69E-05
3.42E-06
Unrfi
mg/kg-d
mg/kg-d
mg/kg^J
mg/kg*
mg/Vg-d
CSFIUmil Rut
V.I,,
S70E-03
5.40E-01
1. IDE -02
Uni/j
(mg/kg-dH
(mg/kg-d)-!
(mg/kg^H
mg/kg-dH
(mg/kg-dH
314E-06
3.67E-06
192E-06
S85E-07
4B3E-06
mg/kg-d
mg/kg^J
5.70E-03
S40E-01
mg/kg-dH
(mg/kg-dH
(mg/kg-dH
(mg/kg-dH
(mg/kg-dH
1.35E-04
3.81E-O4
113E-04
5.35E-OS
6.62E-05
1.34E-05
mg/kg^l
mg/kg-d
mg/kg-d
mg/kg-d
S.70E-03
Z10E-02
600E-03
(mg/kg-dH
(mg/kg-dH
(mg/kg-dH
(mg/kg-dH
(mg/kg-dH
185E-06
3.B5E-06
242£-M
5 35t-07
7.26E-07
1 6BE-07
mg/kg-d
mg/kg-d
mg/kg-d
mg/kg^i
mg/kg^i
570E-03
2.10E-02
600E-O3
(mg/kg-dH
(mg/kg-dH
(mg/kg-dH
(mg/kg-dH
(mg/kg-dH
(mg/kg^H
CmmtrrRis*
NC
556E-07
NC
NC
914E-06
3.77E-0*
974£-06
NC
2.09E-OB
NC
NC
261E-06
3 13E-09
2&3E-06
1.24E-05
1.24E-05
NC
2.17E-06
NC
NC
1 39E-06
803E-OA
3ME-06
3.ME-06
3 ME -06
1.60E-05
NC
Z20E-OB
NC
NC
1.S2E-06
1 01E-W
3B2£-OB
3B2E-OB
382E-OB
3B2E-OB
N*»-C*mffT HaiarW Cmtnlmtimni f*r Obi'U
MrnkflL^mtmrr C^cmfraK..
Vmlmt
1 74E-04
4.92E-04
1.46E-O4
690E-OS
8S3E-05
1.73E-05
Unit*
mg/kg-d
mg/kg-d
mg/kg-d
mg/kg-d
mg/kgd
mg/kg^l
R/DIJtfC
Vmlmt
Z80E-01
lOOE-01
5 OOE-02
l.OOE-02
I.OOE-02
6.00E-03
Utiti
mg/kg-d
mg/kg-d
mg/kgxJ
mg/kg-d
mg/kg-d
mgAg-d
1.21E-05
141E-05
7.39E-M
2.25E-06
1 86E-OS
1 WE -06
mg/kg^J
mg/kg-d
mj/kg-d
mg/kg-d
200E-01
5.00E-02
l.OOE-02
l.OOE-02
600E-03
mg/kg-d
mg/kg-d
mg/kg-d
579E-04
1 ME -03
486E-04
230E-04
184E-04
3.75E-05
mg/kg^
mg/kg-d
mg/kg-d
mg/kg^
mg/kg-d
mg/kg^J
630E-01
1 40E-OI
S.70E-O2
l.OOE-02
6.00E-03
mg/kg^J
mg/kg^l
mg/kg<l
mg/kg^J
7.95E-06
1 66E-05
1.04E-OS
2.30E-06
7.20E-07
mg/kg^l
mg/kg-d
mg/kg-d
mg/kg-d
mg/kg^J
630E-01
1 40E-01
5 TOE -02
1 OOE-02
600E-03
mg/kg-d
mg/kg^
mg/kg^
mg/kg-d
M-..-W
Q**Ht*t
6.20E-W
2.46E-03
2.91 E-03
690E-03
553E-03
2B8E-03
2.43E-02
706EW
1.4BE-04
2.25E-04
l.BAE-03
1.B2E-04
2.53E-03
2.ME-CT2
2.68E-C2
919E-04
1.17E-02
852E-03
NC
2.ME-02
9S9E-03
5.92E-02
592E-02
592E-O2
8.60E-02
1.26E-05
1.18E-04
1 83E-04
NC
3 12Z-04
1 20E-04
7.4AE-04
7.4AE04
7.4AE-04
74AE-04
.(.Ar/E^urr C*.™.trafV*.
v-;..
456E-05
I.29E-O4
3B3E-05
1.8 IE-OS
224E-05
4S4E-06
Umitt
mg/kg^l
mg/kg-d
mg/kg^i
mg/Vg^l
mg/kg^
mg/kg^i
R/D/R/f
Vtlmt
2.80F-01
300E-01
SOOF-02
1 OOE-O2
1.00E-C2
600E-03
Umiti
mg/kg-d
mg/kg-d
mg/kg^l
mg/kg-d
7.18E-06
376E-06
1 14E-06
944E-06
556E-07
mg/kg-d
mg/kg-d
mg/kg-d
200E-01
5.00E-02
l.OOE-02
1 OOE-02
600E-03
mg/kg-d
mg/kg-d
2.4BE-04
702E-04
2.DBE-W
986E-OS
1.22E-04
mg/kg-d
mj/kg-d
mg/kg^l
630E-01
1 40E-01
5.70E-02
l.OOE-02
mg/kg-d
mg/kg-d
mg/kg-d
mg/kg^l
mg/kg-d
7.09E-06
446E-06
9 8SE-07
1.34EO6
309E-07
mg/kg^
mg/kg-d
mg/kg-d
mg/kg-d
mg/kg-d
1 40E-01
1.00E-O2
600E03
mg/kgd
mg/kg-d
mg/kg-d
mg/kg-d
H.t.rrf
1 &3E-04
646E-04
7ME-04
1.81 E-03
7.W.E-04
639E-03
119E-05
3 59E-05
7.52E-05
1 14E-O4
944E-O4
927E-O5
l.UE-03
767E-03
767E-03
3.94E-04
S02E-03
3.65E-03
NC
1.22E-O2
4 UE-03
2 ME -O2
2. ME -02
2.ME-02
330E-02
507E-05
783E-05
NC
1 ME -04
5.15E-05
320E-04
320E-04
320E-04
320E-04
CRA 18925 (71) APPl
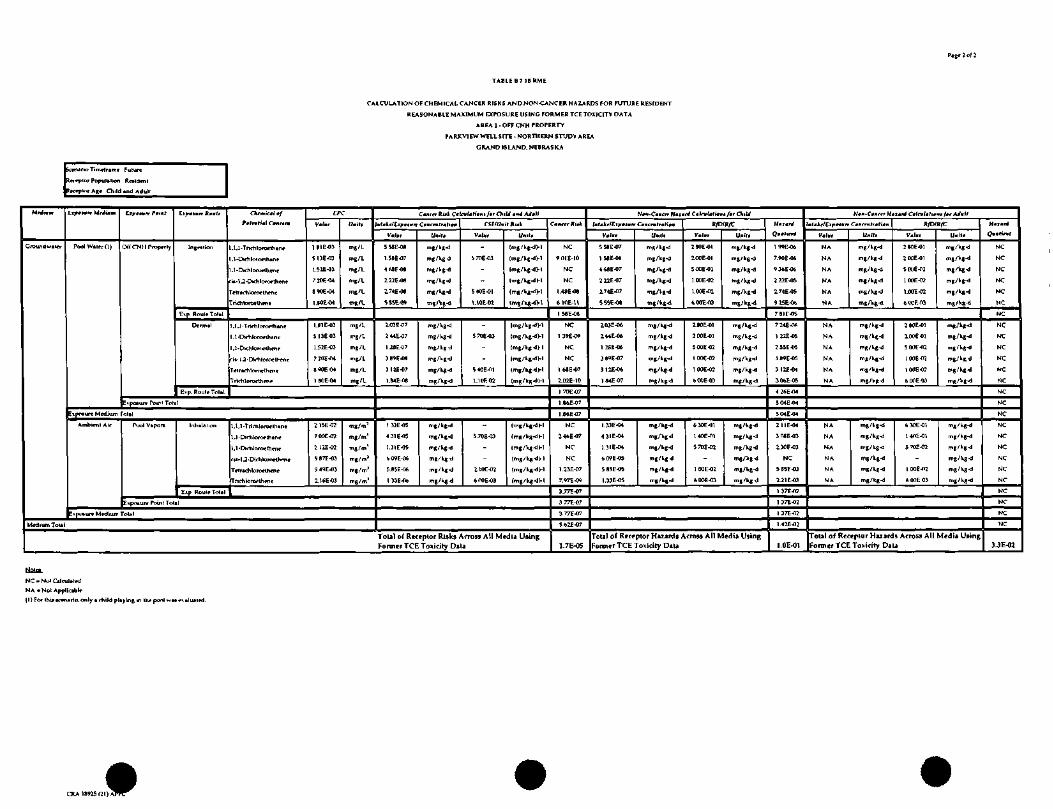
Page 2 ol 2
TABLE B.7.1B.RME
CALCULATION OF CHEMICAL CANCER RISKS AND NON-CANCER HAZARDS FOR FUTURE RESIDENT
REA5ONABLE MAXIMUM EXPOSURE USING FORMER TCETOXlCtTV DATA
AREA 2 - OFF CNH PROPERTY
PARKVIEW WELL SITE-NORTHERN STUDY AREA
GRAND IS LAND, NEBRASKA
jc*ninoTimeh-«me. Future
Rrrrplor Population R«id*nl
Heceplor Age Child tnd Adult
Groundwaier Oil CNH Property
ExM»" R""
E»p Route Total
E*p. Route Tolal
i>po*urr Poirl Tolnl
,l,l-Trictilorocth4ne
,1-Dichloruethme
Trichkoroelhene
LPC
181E-03
5 13E-03
720E-04
890E-04
1.HE-M
mg/L
mg/L
•"8/L
"»"-
1.1-Dirhloroe thane
M-Dichlorcn'thene
ri»-l,2-Dirhloroelhene
Tetrachlrin^thene
Trktiloroelhene
513E03
1.52E-03
720E-04
840E04
1 80E-M
mg/l
mg/L
mg/L
mj/L
mg/L
Iipoiure Medium Total
Ambient Air Pool Vapora Inhalation
Enp Roule Total
1,1,1-Trirhlorocthane
1,1 -Did) low- thane
1 ,1 -Didiloroelhene
r u-1 ,2-Dichloroelhene
Tetrach loroelhene
215E-02
7 OOE-02
2 12E-02
987E-03
2.16E-03
mg/m
mg/m3
mg/m'
mg/m
mg/m
Exposure Point Toll
iipc»ure Medium Total
Medium Total
CMmR»IC.b.ht.-.../«Ckitf«rf>U.II
V«f.r
558E-0*
l.HE-07
2.22E-08
555E-09
Umitt
mg/kg-d
mg/kgd
V.I,,
5 TOE-03
S40E-01
V1QE-Q7
Umtf
(mg/kj^H
(mg/kg-d)-]
tME-07
1.28E-C7
3 12E-07
l.ME-T*
mg/kj^l
mf/kg-d
57DE-03
540E-01 (mg/kg-d >-l
1 33E-05
431E-05
1.31E-05
609E-06
1 33E-06
mg/kg^
mg/lj-d
mg/kjd
mg/kgj
-
-
600E«3
(mg/kgJ)-l
(mg/kg-dH
(mg/kg-dM
(mg/kg-d )-l
ToUl of Receptor Risks Across AM Media UsingFormer TCE Toxicity Da a
NC
901E-10
1.4SE-OS
61C1E-U
1 ME-OS
NC
1 39E-09
NC
NC
1 ME -07
1 70E-07
1.86E-07
1.86E-07
NC
NC
NC
7.97E-W
3.77E-07
377E-07
377E-07
562E-07
1.7E-05
Nn.c«»if«^c.in.br,-m/.,a,u
v-u.
5S8E-07
1.58E-06
174E-07
555E-08
UHfff
mg/kg^
mg/kg-d
R/D/R/T:Vmtmr
2BOE-01
2.00E-01
l.OOE-02
fcOQE-CO
Unifi
mg/kg-d
mg/kg-d
mg/kjJ
2.03E-06
2.ME-06
1 2SE-06
3 89E-07
312E-06
mg/kg-d
mj/kg-d
mg/kg^l
2.80E-01
200E-01
500E-02
1 OOE-07
1 OOE-02
bOOE-03
mg/kgJ
mg/kj^i
mg/kg-d
mg/kg-d
mg/kg-d
1.33E-M
1.31E-04
609E-05
1.33E-05
mg/kgj
m,/k,d
mg/kgd
6 ME -01
570E-02
600E-03
mg/lg^l
mg/kg-d
mg/kgd
Total of Rer? prtor Hazards Across All Media UsingFormer TCE Toxiciry DaU
H-3.rW
Q»«firal
1 99E-06
7.90 E -06
222E-05
2.74E-05
9Z5E-06
7.8 IF -05
724E-OA
1.22E-05
255E-OS
3 89E-05
3 12E-M
306E-05
^26E-M
504E-04
504E-W
211E-M
130E-03
NC
2.21 E 13
1 37E-03
1.37E-02
1 37E-02
1.42E-02
l.OE-01
N«-C H«.mC.I«f.f. •„./., A*lf
• f-kr/(jp*.«rr C«Nmffr«K«n
V.I.,
NA
NA
NA
NA
NA
NA
UN iff
mg/kg-d
mg/kg-d
mg/kg-d
mg/kg-d
RfDIRfC
V.lm,
280E-01
200E-01
I OOE-02
l.OOE-02
60CF.-03
U»Ht
mg/kgd
mg/kg-d
mg/kg-d
mg/kg-d
NA
NA
NA
NA
NA
mg/kgd
mg/kg^J
mg/kg-d
mg/kgd
mg/kg^
280E-01
100E-0]
5 OOE-02
100E02
1 OOE-0?
mg/k,^
mg/kg-d
mg/kg-d
mg/kgd
mg/kgd
NA
NA
NA
NA
NA
mg/kg-d
mg/kg-d
mg/kg-d
mg/kg-d
mg/kg-d
&30E-01
1 40E-01
570E-02
1 OOE-02
600E03
mg/kg^J
mg/kgd
mg/kg-d
mg/kg^
mg/kg-d
Total of Receptor Hazards Across All Media UsingFormer TCE Toxicity DaU
O»rimf
NC
NC
NC
NC
NC
NC
NC
NC
NC
NC
NC
NC
NC
NC
NC
NC
NC
NC
NC
NC
NC
NC
NC
NC
NC
NC
3.3E-02
Nolci
NC-NolCilcuJattd
NA -Not Applic»bl«
(l)Forthij i*rio, only • child pliying in the pool wn t
21)> l ^
ATTACHMENT C
RISK CALCULATIONS FOR AREA 3: FUTURE GROUNDWATER WELL
018925 (21) APPL
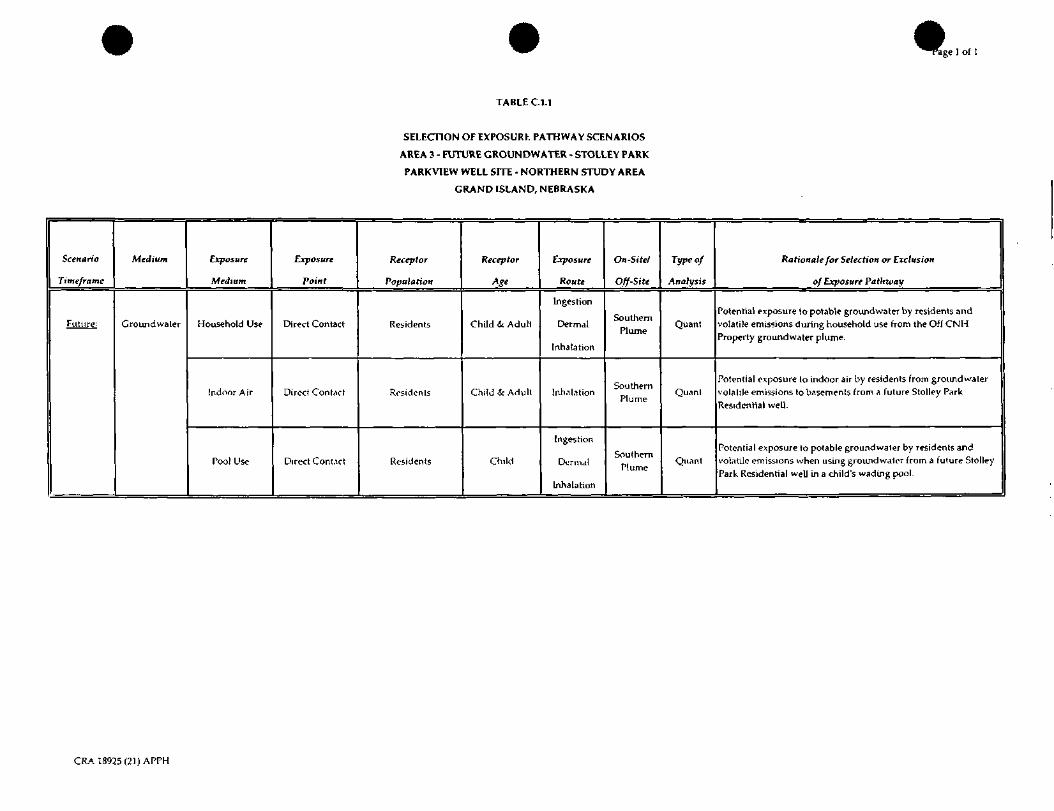
^^racge 1 of 1
TABLE C.I.I
SELECTION OF EXPOSURK PATHWAY SCENARIOS
AREA 3 - FUTURE GROUNDWATER - STOLLEY PARK
PARKVIEW WILL SITE - NORTHERN STUDY AREA
GRAND ISLAND, NEBRASKA
Scenario
Timeframc
Future:
Medium
Groundwater
Exposure
Medium
Household Use
Indoor Air
Poo! Use
Exposure
Point
Direct Contact
Direct Contact
Direct Contact
Receptor
Population
Residents
Residents
Residents
Receptor
Age
Child & Adult
Child & Adul t
Child
Exposure
Route
[ngestion
Dermal
Inhalation
Inha la t ion
Ingestion
Dermal
Inhalation
On-Sitel
Off-Site
SouthernPlume
SouthernPlume
SouthernPlume
Type of
Analysis
Quant
Quant
Quant
Rationale for Selection or Exclusion
of Exposure Pathway
Potential exposure to potable groundwater by residents andvolatile emissions during household use from the Off CNHProperty groundwater plume.
Potential exposure to indoor air by residents from groundwatervolati le emissions to basements from a fu tu re Stolley ParkResidential well.
Potential exposure to potable groundwater by residents andvolatile emissions when using groundwater from a fu tu re StolleyPark Residential well in a child's wading pool.
CRA 18925(21) APPH

OCCURRENCE, I
AREA 3 - FUTURE GROUNDWATER - STOLLEY PARK
PARKVIEW WELL SITE - NORTHERN STUDY AREA
GRAND ISLAND, NEBRASKA
Page 1 of 1
Location.
Exposure Scenario:
Sampling date:
Medium:
Well locator.
Units:
DETECTIONS
Northern Plume Study Area
Future Groundwater/ Tap Water - Stoltey Park
March-04
Groundwater/ Tap Water
2522 Pioneer, 2518 Pioneer, 2516 Pioneer, 2514 Pioneer, 2512 Pioneer, 2510 Pioneer, 2508 Pioneer
milligrams per liter (mg/L)
Chemical of Potential Concern {COPC)
\ ,1 ,1 -Trichloroe thane
1 ,1 -Dichloroethane
1,1-Dichloroethene
1 -Dichloroethane
cis-l,2-Dichloroe thene
Tetrachloroethene
Trichloroe thene
Number ofSamples
7
1
7
7
7
7
7
Number ofDetections
7
7
7
2
0
7
0
Minimum DetectedConcentration (1)
0.007
0.0015
0.0063
0.00056
ND
00013
ND
MinimumQualifier
Maximum DetectedConcentration O)
0.017
0.007
0.039
0.0009
ND
0.011
ND
MaximumQualifier
95% UCL (2)
0.030
0.0047
0.0266
0.0006
00005
0.0095
0.0005
Region 9 PRG(Tap Water) <3)
0.32
0.081
0.034
0.00012
0.0061
0.0001
0.000028
Tax
NC
NC
NC
C
NC
C
C
# of Samples AboveRegion 9 Screening Level
0
0
1
2
0
7
0
Risk for COPCwill be calculated
in the RA(fes/No)
Yes
Yes
Yes
Yes
No
Yes
No
Ratio of COPC toRegion 9 PRG f<)
0.12
0086
1-15
7.50
-
110
-
NON-DETECTIONSChemical of Potential Concern tCOPC)
1,1 ,1 -Trichloroethane
1,1 -Dichloroethane
1,1-Dichloroethene
1,2-Dichloroe thane
cis- 1 ,2-Dichloroethene
Telrachloroethene
Trichloroe thene
Number ofSamples
7
7
7
7
7
7
7
Number ofnon-drtects
0
0
0
5
7
0
7
Minimum DetectionLimit <1)
-
-
-
0.0005
0.0005
-
0.0005
MaximumDetection Limit
m
-
-
-
0.0005
0.0005
-
0.0005
Samples with DL>1times Region 9 PRG
-
-
-
5
0
-
7
Samples withDL>W times
Region 9 PRG
-
-
-
0
0
-
7
Samples withDL>100 times Region
9 PRG
-
-
-
0
0
-
0
Region 9 PRG(Top Water) (3)
0.32
0.081
0.034
0.00012
0.0061
0.0001
0.000028
Notts.
ND = Not Detected
J = Associated value is estimated
DL = Detection Limit
NC « Non<arcinogen
C •= Carcinogen
(1) Duplicates were not averaged for the selection of the minimum and maximum detected concentration or the minimum iind maximum detection limit
(2) Calculated using detected concentrations and detection limits following USEPA methodology. All duplicates wen? averaged prior to calculation of the 95% UCL
(3) Region 9 Preliminary Remediation Goals fPRG) Table, Tap Water, October 20, 2004.
(4) Calculated i^ie the maximum detected concentration and Region 9 PRG (maximum concentration/ Region 9 PRG).
CRA 18925

Page 1 of 1
TABLE C.3.1
AREA 3 - FUTURE GROUNDWATER - STOLLEY PARK
PARKVIEW WELL SITE - NORTHERN STUDY AREA
GRAND ISLAND, NEBRASKA
Scenario Timeframe: Future
Medium: Groundwater/ Tap Water
Exposure Medium: Household Use/ Indoor Air
Chemical
of
Potential
Concern
Volatile Organic Compounds
1 , 1 , 1 -Trichloroe thane
1,1-Dichloroethane
1,1-Dichloroethene
1 ,2-Dichloroe thane
TetrachJoroethene
Units
mg/L
mg/L
mg/L
mg/L
mg/L
Arithmetic
Mean
2.16E-02
3.30E-03
1.83E-02
3.87E-04
6.75E-03
95% UCLof
Normal
Data
3.00E-02
4.70E-03
2.66E-02
0)
9.50E-03
Maximum
Detected
Concentration
3.70E-02
7.00E-03
3.90E-02
9.00E-04
1.10E-02
Maximum
Qualifier
EPC
Units
mg/L
mg/L
mg/L
mg/L
mg/L
Reasonable Maximum Exposure
Medium
EPC
Value
3.00E-02
4.70E-03
2.66E-02
6.50E-04
9.50E-03
Medium
EPC
Statistic
95% UCL-N
95% UCL-N
95% UCL-N
95% UCL-NP
95% UCL-N
Medium
EPC
Rationale
W-Test (2)
W-Test (2)
W-Test (2)
W-Test (2)
W-Test (2)
Central Tendency
Medium
EPC
Value
2.16E-02
3.30E-03
1.83E-02
5.70E-04
6.75E-03
Medium
EPC
Statistic
Mean-N
Mean-N
Mean-N
Mcan-NP
Mean-N
Medium
EPC
Rationale
W-Test (2)
W-Test (2)
W-Test (2)
W-Test (2)
W-Test (2)
Notes:
For noil-detects, 1/2 laboratory maximum detection limit was used as a proxy concentration.
W-Test: Developed by Shapiro and Francia for data sets with over 50 samples but under 100 samples.
Refer to USEPA Supplemental Guidance to RAGS: Calculating the Concentration Term (RAGS, 1992), OSWER Directive 9285.7-081, May 1992.
Statistics: Maximum Detected Value (Max); 1/2 Maximum Detection Limit (1/2 Max DL); 95% UCL of Normal Data (95% UCL-N); 95% UCL of Log-transformed Data (95% UCL-T);
Non-parametric method used to Determined 95% UCL (95% UCL-NP); Mean of Log-transformed Data (Mean-T); Mean of Normal Data (Mean-N);
Non-parametric Method used to Determine Mean (Mean-NP).
(1) Data set is neither normally or lognonnaljy distributed.
(2) Shapiro-Francia W Test was used for data sets where 50<n<100.
CRA18925(21)APPL

Page 1 of 1
TABLE C4.1
VALUES USED FOR DAILY INTAKE CALCULATIONS FOR CROUNDWATER/TAP WATER . HOUSEHOLD USEAREA 3 - FUTURE GROUNDWATER - STOLLEY PARKPARKVIEW WELL SITE - NORTHERN STUDY AREA
G R A N D ISLAND, NEBRASKA
arin Timeframe^uturr ^^^^^^ium. Groundwaier/ Tip Watersure Medium: Houwhold U«
Etpoiure Point. Ingeition, Dermal, and InhalationReceptor Population: RnidentKecepinr Ag«. Child and Adult
:»poiure Rout*
Ingntion
l*rmal
Inhalation
ParamolwCode
CW
IR - childIK-iduli
EF
ED -childED -.dull
BW - childBW . adult
AT-C
AT-N (child)
AT-N (adult)
CW
5A - child
SA -adult
CF
ET childKT-adUt
EF
FD- child
ED -adultBW- child
BW . adult
AT-C
AT-N (child)
AT-N (adult)
PC
FA
Tevenl
B
cw
IR • child
[R-idull
EF
ED - child
ED- adult
BW - child
nw-iduli
AT-CAT-N (child)AT-N (iduli)
K
Parameter Definition
hemical Concentration in Tip Wiiergeirion Rale of Waterge»tion Rale of Wateripocure Frequency
jipMuri? Duration.(poture Duration
Body Weigh)
Body We\ghiveraging Time (cancer)veraging Time (non-oaru'er)veraging Time (ni">n-canr*r)
rhemical Concentration in lap Water
kin Surface Art* Available lor Contact
kin Surlier Ard Available for Contact
ronvgnian Factorjpo*ure Time
Expoiur* Time
•upoiure FrequencyEnpoture Dmahon
Ltpature Dun hornBody Weight
Body Weigh)Averaging Tim* (cancer)Averaging Time (non-cancer)Averaging Time (n on -cancer)'rnneahiliry ConitaniFraction Abcortwd
Lag TimeComiant
Chemical Corn-end a lion in Shower
Lnhalanon Rate
Inhilanon RJI*Expo»ure FrequPnc)'
Etpocure DurationEtpoturr Duration
Body Weigh)Body WeightAveraging Time (cancer)Averaging Tim« (non-cancer)
Av.rigmijTimdioiw.m.O
Volitjlizjhon Parlor
Uma
mg/L
L/diyL/d.y
dflyi/year
ycinyra™
IB^8
d.yi
dj)-.diy>
mg/L
cmVevml
.-m'/rvml
L/rm
hr/d«yhr/diy
d*y»/ycirycinyein
Mk«
d.y.
d.y.
d.y,
cm/hrdimeniionleci
hr/i?v*nl
dirnen»ionl«j
mg/L
m'/day
mj/day
dayt/yearyeanyear*
**t&day.
day.
dayi
l/m1
RME
Value
(D
1 5
23
350
6
M |30|
15
70
25,550
2.190
10,950
(1)
hfiK
]RSKO
0001
1.0
058
350
6
24|30]
15
70
25,550
2,1W
10,950
chemical ipecilir
rhinrucal ipn.Sl'ic
chemical »p«-ifki
cheiTiiral »prciric
ID10
203506
24|30|1570
25,550
2.19010,050
00005* 10TO
RMEbrion.lr/Kftenrtn
(1)USEPA, ]W(2)
USEPA, 1997(2)USEPA, 2004
USEPA, 2004
USEPA, 2004 (3)
USEPA, 2004
USEPA, 20M
USEPA, 1989
USEPA, 1969
USEPA. 1069
inUSEPA. 2CW
USEPA, 2004
-USEPA, 2004
USHI'A, 2004
USEPA, 2004
USEPA, 20«
USEPA, 2004 (3)
USEPA, 2002
USEPA, 2004
USEPA. 1989
USEPA. 19B9
USEPA. 1989
USEPA. 2004
USEPA, 2004
USEPA, 2004
USEPA. 2004
(1)
USEPA. 1997(4)
USEPA. 1991
USEPA, 2004
USEPA, 2004
USEPA, 2004 (3)
USEPA, 2002
USEPA, 2004
USEPA, 1969
USEPA, 1969
USEPA, 1989
USEPA, 1991
CT
V.I up
(1)087
1.4
350
6
3|9]
15
70
25,550
2,150
3.285
(1)
6.W)
18,000
00)1
033
025
3M
(,
319]15
70
25,550
2,190
3.285
chemk.l ipccilic
rhemjnl ipwific
ctiemic.l »p«vi(ir
ctirmir.] Ipreifi*'
111
10
20
350
6
3|9|
15
70
25^50
2.190
3.285
UUOOSvlOOO
CT
lt.non.lr/
RelcretKf
(1)
USEPA, 1997 (2)
USEPA. 1997 (2)
USEPA, 2004
USEPA. 2004
USEPA, 2004 (3)
USEPA, 2004
USEPA, 2004
USEPA, 1989
USEPA, 1989
USEPA. 1969
(1)
USEPA. 2004
USEPA, 2004
-
USEPA, 2004
USEPA, 2004
USEPA, 2004
USEPA, 2004
USEPA, 2004 (3)
USEPA, 2002
USEPA, 2004
USEPA, 1989
USEPA, 1989
USEPA, 1989
USEPA, 2004
USEPA, 2004
USEPA, 2004
USCPA. 2004
(1)
USEPA, 1997(4)
USEPA, 1991
USEPA, 2004
USEPA, 2004
USEPA, 2004 (3)
USEPA, 2002
USEPA, 2004
USEPA, 1989
USEPA. 1969
USEPA. 1989
USEPA, 1991
Inl.ke Equ.lion/
Model Name
Tironic D.ily Int.kr (CDI) (mg/kg-d.y) -
w,nuEF>En t i /Bw, i /Ar
CDHmg/kf-d.y).
Acvmi » SAx EFi ED a 1/HW a I/AT
DArvml (mg/rm'-^vml) . [norg.nk* •
PC » Cw »CFx ET
)Apv*nl (mg/rTn'-^ve"t) - Org.nirt •
Ifvenl <• f -2 , FA « PC < Cw . CF > SQRT(6 < Tevmi . ET / PI)levtm > r .
FA > PC < Cw < CF < (ET/(1 .B|-2 < Ttvm > ((1 .3 > BO.B'l/d .B)'l
CDl(mg/kg<l.y).
C W x W < E F x E D » K x 1/BWx I/AT
Fable 3-30, USEPA, 1997
adult ntincarcinogenic tn
CRAlfl925(21)1) A^^
Noi«
(1) For Slolley Park gruundwater/ lap waier roncentrationi, tet- Table C 3 1
(2) Recommended drinking water intake* for children > 5 yean. Recommended drinking water intake* for adultt ?
(3) Uiually only the child e*po*ure, ihat hemg the moil Kniinve rerpptor, ii evaluated for non-c»mnog«tM, however
(4) Recommended inhalation rile for children 6-8 yean See Table 5-23. USEPA, 1997
Sotircct:USEPA, 1<«9 Rjik Aiteumeni Guidance (or Superfund. Vol 1: Human Health Evaluation Muiuil, Tar) A OERR EPA/540-1-89-OO2.
USEPA. 1991 Risk Ai»eMmeni Guidance for Superfund Vo 1: Human Health Evaluation Manual (Part B, LWelnprnmt ol RjiV-Ba*cd Preliminary Remediation Coal*). Public
USEPA, 1997 E*po»ure Faclor* Handbook Volume 1: General Facion. EPA/600/P 95/002Fa Augu»t 1997
USEPA, 2002. Child-Specific E*po*ure Facton Handbook, EPA-400 POO-002B, September 2002
USEPA. 2004 RAG* Volume VHuiran Iin.th Evaluari<«\ Manwal, P«t E Supplemental Guidance lor Oem«l Kitk An«im«ii EPA^O/R/W/005. J u l y J004.
d for 9 year* (CT) and 30 year* (RME) ai directed by USEPA Region 7 mk ui«
EPA/540/R/'

Paee'age 1 of 1
TABLE C.4.2
VALUES USED FOR DAILY INTAKE CALCULATIONS FOR INDOOR AIR
AREA 3 - FUTURE GROUNDWATER - STOLLEY PARKPARKVIEW WELL SITE - NORTHERN STUDY AREA
GRAND ISLAND, NEBRASKA
Scenario Timeftame: Future
Medium. Gioundwater/ Tap Water
Exposure Medium: Indoor Air
Exposure Point: Inhalation
Receptor Population: ResidentReceptor Age: Child and Adult
Exposure Route
Inhalation
Parameter
Code
CIA
tR - child
K- adult
EFED - childED - adull
BW - child
BW - adull
AT-CAT-N (child)
AT-N (adult)
Parameter Definition
Chemical Concentration in Indoor Air
Inhalation Rate
Inhalation Rate
Exposure FrequencyExposure DurationExposure Duration
Body Weight
Body Weight
Averaging Time (cancer)
Averaging Time (non-cancer)
Averaging Time (non-cancer)
Units
mg/m3
m'/day
m3/day
days/year
years
years
kgkg
days
days
days
RMEValue
(1)
10
203506
24 [3011570
25,550
2,19010,950
RMERationale/Reference
(1)
USEPA, 1997(2)
USEPA, 1991
USEPA, 2004
USEPA, 2004
USEPA, 2004 (3)
USEPA, 2002
USEPA, 2004
USEPA, 1989
USEPA, 1989
USEPA, 1989
CTValue
(1)
10
203506
319]1570
25,550
2,1903,285
CTRationale/Reference
(1)
USEPA, 1997 (2)
USEPA, 1991
USEPA, 2004USEPA, 2004
USEPA, 2004 (3)
USEPA, 2002
USEPA, 2004
USEPA, 1989
USEPA, 1989
USEPA, 1989
Intake Equation/Model Name
CDI (mg/kg-day) =
CIA x 1R x EF x ED x 1 /BW x 1 /AT
Notes:(1) For indoor air concentrations, see Appendix G.
(2) Recommended inhalation rate for children 6-8 years. See Table 5-23, USEPA, 1997.(3) Usually only the child exposure, that being the most sensitive receptor, is evaluated for non-carcinogens, however,
an adult non-carcinogenic exposure was evaluated for 9 years (CT) and 30 years (RME) as directed by USEPA Region 7 risk assessor.
Sources:
USEPA, 1989: Risk Assessment Guidance for Superfund. Vol. 1: Human Health Evaluation Manual, Part A OERR. EPA/540-1-89-002.
USEPA, 1997: Exposure Factors Handbook. Volume. 1: General Factors. EPA/600/P-95/002Fa. August 1997.
USEPA, 2002: Child-Specific Exposure Factors Handbook, EPA-600-POO-002B, September 2002.USEPA, 2004: RAGs Volume 1, Human Health Evaluation Manual, Part E: Supplemental Guidance for Dermal Risk Assessment, EPA/540/R/99/005,July 2004
CRA 18925 (21) APPL

Page 1 of 1
VALUES USED FOR DAILY INTAKE CALCULATIONS FOR CROUNDWATER/TAP WATER - CHILD'S FOOL
AREA 3 - FUTURE GROUNDWATER - STOLLEY PARK
PARKVIEW WELL SITE - NORTHERN STUDY AREA
GRAND ISLAND, NEBRASKA
Scenario Timeframe. Future
imn: Croundwater/ Tap Water
Exposure Medium: Pool Use
Exposure Point: [ngestion. Dermal, and Inhalation
Receptor Population: Residents
Receptor Age: Child (2 toj^years old)
Exposure Route
Ingestion
Derma)
Inhalation
Parameter
Code
CW
IR- child
EF
ED - child
BW - child
AT-C
AT-N (child)
CW
SA - child
CF
ET - child
EF
ED - child
BW - child
AT-C
AT-N (child}
PC
FA
Tevem
B
CAA
IR- child
ET - child
EF
ED -childBW - child
AT-C
AT-N (child)
Parameter Definition
Chemical Concentration in Tap Water
ngesrion Rate of Water
ixposure Frequency
Exposure Duration
Body Weight
Averaging Time (cancer)
Averaging Time (non-cancer)
Chemical Concentration in Tap Water
Skin Surface Area Available for Contact
Conversion Factor
Exposure Time
Exposure Frequency
Exposure Duration
Body Weight
Averaging Time (cancer)
Averaging Time {non -cancer)
Permeability Constant
Fraction Absorbed
Lag Time
Constant
Chemical Concentration m Ambient Air modeled from Tap Water
Inhalation Rate
Exposure Time
Exposure FrequencyExposure Duration
Body Weight
Averaging Time (cancer)
Averaging Time (non-cancer)
Units
mg/L
L/day
days/year
years
kgdays
days
mg/L
cm:
L/cm1
hj/day
days/year
years
i«days
days
cm/hr
dimensionless
hr/evenl
dimensionless
mg/m1
mVhr
hr/day
days/yearyears
k*days
days
RME
Value
(1)
0.05
45
7
20
25.550
2,555
(1)
6,600
0.001
1
45
7
20
25,550
2555
chemical specific
chemical specific
chemical specific
chemical specific
(4)
1
1
457
20
25.550
2555
RME
Rationale/Reference
(1)
USEPA, 1989
Professional Judgement (2)
USEPA, 1997
USEPA, 1997 (31
USEPA, 1989
USEPA, 1989
(1)
USEPA, 2004
-
USEPA, 1997
Professional Judgement (2)
USEPA, 1997
USEPA. 1997 (3)
USEPA, 1989
USEPA, 1989
USEPA, 2004
USEPA, 2004
USEPA, 2004
USEPA, 2004
(4)
(5)USEPA, 1997
Professional Judgement (2USEPA, 1997
USEPA, 1997 (3)
USEPA, 1989
USEPA, 1989
CT
Value
(1)
005
23
7
20
25550
2555
0)
6.600
0.001
1
23
7
20
25550
2555
chemical specific
chemical specific
chemical specific
chemical specific
(4)
1
1
237
20
25550
2555
CT
Rationale/
Reference
(1)USEPA, 1989
Professional Judgement (2)
USEPA, 1997
USEPA, 1997(3)
USEPA, 1989
USEPA. 1989
(1)
USEPA, 2004
-
USEPA, 1997
Professional Judgement (2)
USEPA, 1997
USEPA, 1997(3)
USEPA, 1989
USEPA, 1989
USEPA. 2004
USEPA, 2004
USEPA, 2004
USEPA, 2004
(41
(5)USEPA, 1997
Professional Judgement (2USEPA, 1997
USEPA, 1997 (3)
USEPA, 1989
USEPA, 1989
Intake Equation/
Model Name
Chronic Daily Intake (CD1) (mg/kg-day) =
CW x IR x EF x ED x 1 /BW x 1 /AT
CDI (mg/kg-day) =
DAevent x SA x EF » ED x 1 /BW x 1 /AT
DAevent (mg/on'-event) - Inorganics =
PC x Cw x CF > ET
DAevent (mg/cm7<vent) - Organic* =
tevent <= f =
2 x F A x P C x C w x C F x SQRT(6 x Tevent x ET / PI)
tevent > t* =
FA x PC x Cw » CF x (ET/(1 -BH2 x Tevenl x ((1 -3 x B+3»BV(1 »B)')
CDI (mg/kg-day) =
CAA x INR x ET x EF x ED x 1 /BW < 1 /AT
Notes.
(1) ForStolley Parkgroundwater/ up water concentrations, see Table C.3.1.
(2} Professional Judgement; assumes child plays in the pool for 15 days/month, for 3 months of the year or 45 days/year for the RME and half that rime for CT (23 days/year).
(3) Child body weight based on age specific average body weight for boys and girls at each year of life. Table 7-3, USEPA, 1997.
(4) For ambient air concentrations, see Appendix H.
(5) Child inhalation rate is based on light activities. Summary of Recommended Values for Inhalation, Table 5-23, USEPA, 1997.
Source :
USEPA, 1989: Risk Assessment Guidance for Superfund. Vol. 1: Human Health Evaluation Manual, Part A OERR. EPA/540-1-89-002.
USEPA, 1997: ExjxMure Factors Handbook. Volume. 1. General Factors. EPA/600/P-95/002Fa. August 1997
USEPA, 2004' Ra^^^^me 1, Human Health Evaluation Manual, Pan E: Supplemental Guidance for Dermal Risk Assessment, EPA/540/R/99/I
CRA 18925(2'Sic
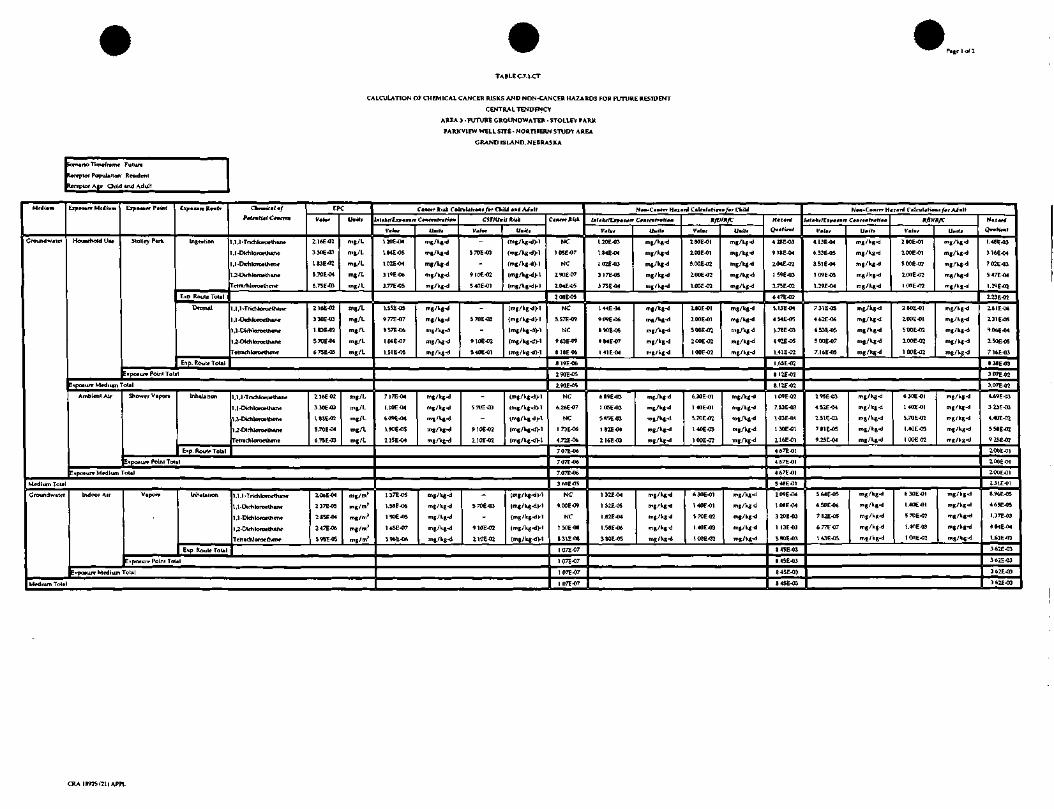
P«ge 1 al 2
TABLE CT.l.CT
CALCULATION OF CHEMICAL CANCER RISKS AND NON-CANCER HAZARDS FOR FUTURE RESIDENT
CENTRAL TENDENCY
AREA 5 - FUTURE GROUNDWATER - STOLLEY FAR*
PARKVIEW WELL srrc - NORTHERN STUDY AREA
GRAND IS1AND, NEBRASKA
• rtoTimefnm* Futur*
fervplor Population' Rnidenl
Child *nd Adult
Groundwiier Hoi«*hold U«* Stolley Park IngMtim
E»p Route ToUl
D*rm4l
Eip. Route Total
Cknucil •/
P»(ntti»l C+mcrn
,1 ,1 -Trichlonp*lh«ne
,1-Dirhloroelhwi*
,1 -Dkhloroelhene
,2-Dichloralh*n«
Tfftrmrhloroelhen*
CPC
Vtlm*
2.16EJH
3.30E-03
1.83E-02
5.70E-04
6.75E-03
Umitt
mg/L
mg/L
mg/L
mg/L
mg/L
,1,1-TrkhloroeUuiw
1,1-Dichloroelhanc
1 ,1 -Dirtiloroethene
U-Dichloroclh*ne
Tetrmch kwocthmc
Z16E-02
330E-03
1.83E-05
5.7DE-W
675E-03
mg/L
mg/L
mg/L
mg/L
mg/L
E»po« urc Point ToUl
Eipo*urc Medium ToUl
Ambient Air Shower Vtpon lnh«lihon
E.p. RoutpToUl
1,1,1 -Trichlonwthane
1 .1 -Dichlororthane
U-Dfchlororthenr
U-DlfhloroethAnc
Tr trach lororthene
Z16E<12
330E-03
183E-01
5.70E-M
6.7SE-O3
mg/L
mg/L
mg/L
mg/L
rnj/L
E*po«usT Point ToUl
Expovurr Medium Tot*]
Medium ToUl
Groundwater Indoor Air V.pon InhiUtion
E*p Roule ToUl
E>po*Lur Point ToUl
1,1 ,1-Tridiloir* thane
l.l.Dirhloraethvw
1 ,1 -Dichloroethrn*
1 •DkhloroetMnr
Tetrachl oroetti en c
2.06E-04
237E-05
2.85E-04
247E-06
595^05
mg/m*
mg/mj
mg/m'
mg/m3
E»poiu/r Medium ToUl
Medium Tot*
CMITT RttJc C«In.!*h»it«/.r ChtU «nJ A^.Jl
-Ui,/[. .«r, C.-fr.fr.f,«
V.I.r
120E-W
l.ME-05
1.02E-04
319E-06
3.77E-05
limit t
mg/Vg-d
mg/kg^
mg/Vg-d
mg/kg-d
mg/kg^
csr/u«;/*.-*iV«/>r
5 TOE -03
910E-02
540E-01
Umitt
(mg/kg-d)-!
(mg/kgd)-l
{mB/kg-d)-l
(mg/kg-d)-!
mg/kg-d )-!
1.55E-O5
977E-07
957E-06
106E-07
1.51E-05
mg/kgJ
mg/kg-d
mg/kg^l
mg/kg-d
mg/kg-d
570E<D
910E-02
S40E-01
(mg/kg-d)-!
(mg/kg^>-l
(mg/kg-d>l
(mg/kg-dM
(mg/kg^M
717E-M
1.10E-04
fcOTE-W
1.90E-OS
225E-W
mg/kg^
mg/kg^J
mR/Vft-d
mg/kg^d
mg/kg-d
5 7UE-03
910E-02
2.10E-02
(mg/kg-d )-!
(mg/kg-dj-l
Img/kg^Vl
(mg/kg-d>l
(mg/kg-dH
137E-05
1.58E-06
1 90E-05
1 65E-07
39t.E-OA
mg/kg-d
mg/kg-d
mg/kgJ
mg/tg^J
mg/kg-d
5 TOE -03
910E-02
110E-02
(mg/kg-d>-l
(mg/kg-d)-!
(mg/kg-d H
(mg/kg-d>-I
(TT*g/Vg-dV\
C»rrrRi*i
NC
1 05E-07
NC
290E-07
2, (HE -05
2ME-05
NC
5.5TE-09
NC
9KJE-09
B 18EO6
819E-06
290E-05
2. WE -05
NC
6.26E-OT
NC
1T3E-06
4.72E-06
7.0TE-06
TOTE -06
7.0TE-06
3W1E-05
NC
9.00E-09
NC
l.WE-08
S31E-08
107E-OT
1 07E-07
107E-07
1 07E-07
N*a-C«Hrrr Hmimrj C*Ir»l«h*ni/»r CmiU
MfktlLrpmimrr C#mm(T«K«
V«(.r
1.20E-03
1.84E-04
1 02E-03
3 17E-05
3T5E04
Un'tl
mg/Vg^l
mg/Kg^l
mg/kg-d
mg/kg-d
mg/kg-d
RfplXfC
V,lmr
ZSOE-01
2.00E-01
5.00E-02
2.00E-02
l.OOE-02
Uniti
mg/kg-d
mg/kR^
mg/kg-d
mg/kg-d
mg/kg-d
144E-04
9D9E-06
B90E-05
984E-07
1 41E-04
mg/kg^
mjt/kg^
mg/Vg^l
m8/kg^l
mg/kg^l
1BOE-01
2.00E-01
500E-02
200E-02
1 OOE-02
mg/kg-d
mg/kg-d
mg/Vg-d
mg/k(^
mg/Kg-d
6B9E-03
1.05E-03
5i5E-03
1.82E-M
Z16E-03
mg/kg-d
mg/kg^l
mg/kg^l
mg/kg-d
mg/kg-d
6.30E-01
1 40E-01
5. TOE -07
140E-03
l.OOE-02
mg/kg-d
mg/kg-d
mg/WgJ
mg/kg-d
mg/kg^J
1 32E-04
1 52E-05
1.B2F-04
1.SSE-06
380E-05
mg/kg^l
mg/kg-d
mf/kg^
mg/kg-d
6.30E-01
1.40F-01
570E-02
VOOE-OT
mg/kg^l
mg/kgd
mg/kg^
mg/Vg^i
O*Kntt
4ZflE-03
918E-04
Z04E-02
159E-03
3.75E-02
647E-0?
S.13E-O4
4 ME -05
1.7BE-03
4.92E-05
1.41E-O2
1.6SE-02
B12E-02
B.I2E-02
1ME-02
T.S3E-03
\Q3E-01
1 30E-01
2.16E-01
46TE-01
4 67E-01
4 ATE -01
548E-01
209E-04
108E-04
320E-03
1SOE-03
845E-03
B.45E-03
8.45E-03
84SE-03
K'*B-C*»rrrH«i*rdC.tn,l.h«./.rAJ-»
V,l,t
4.13E-M
6.33E^)5
3.51E-04
1 09E-05
1.29E-04
Umit,
mg/kg^
mg/kg-d
mg/kg^l
mg/kg-d
mg/kg^l
R/D/R/C
V«fvr
2BOE-01
100E-OT
5 OOE-02
2. OOE-02
100E-02
U.rt*
mg/kg^l
mg/kg-d
mg/kg^
mg/kg-d
mg/kg-d
T.31E-05
462E-06
4.53E-05
500E-07
T.16E-05
mg/kg<l
mg/kg^
mg/Vg-d
mg/kg^J
mg/kg^
2BOE-01
100E-01
500E-01
100E-02
1 OOE-02
mg/kg-d
mg/kg^
mg/kg^l
mg/kg-d
mg/kg-d
295E-03
452E-04
2.51E-03
T81E-05
9.25E1-04
mg/kg-d
mg/kg^I
mg/kg^l
mg/kg^
mg/kg-d
630E-01
1 40E-OI
5.70E-Q2
1.40E-03
1 OOEC2
m8/kg«l
mg/kg^l
rrR/kg^
mg/kg-d
mn/kg-d
S.64E-05
6.50E-06
782E-05
HUE-OS
mg/kg^l
mg/kg^l
mg/Vg-d
mg/kg-d
630E-01
1.40E-01
5TOE-03
IOOE-07
mg/kg-d
mg/kg-d
mg/kg-d
mR/V*^
H.^.rW
O»K«f
1.4BE-03
316E-04
702E-C3
547E^M
1.29E-02
2.23E-02
2.61E-04
2.31E-05
9.W.E-04
2.50E-05
7.16E-03
838E-03
307E-02
3.07E-02
4.69E-03
323E-03
4.40E-02
5S8E-02
9.25E-02
100E-01
2.00E-01
100E-01
2.31E-01
8.%E-05
465E-05
1.3TE-03
4S4E-04
1.63E-03
362E-03
362E-03
362EO3
362E-03
CRA 18925(21) APPL
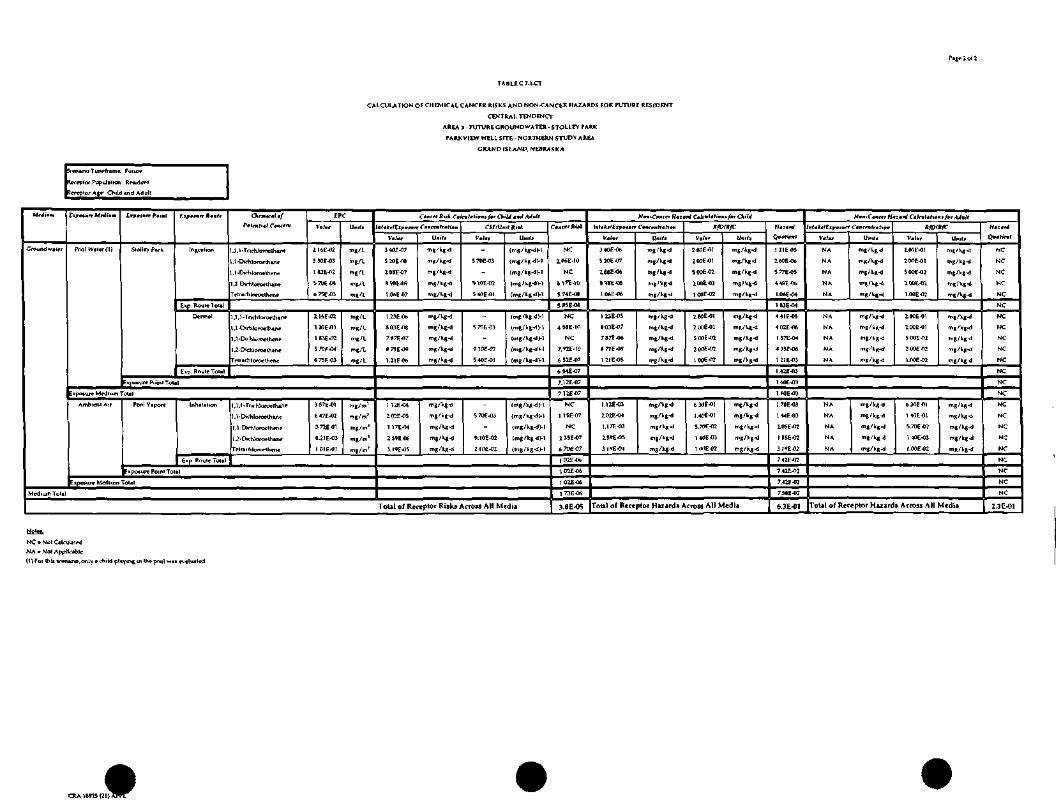
P a g r 2 o f 2
TABLE C.7.1.CT
CALCULATION OF CHEMICAL CANCER RISKS AND NON-CANCtR HAZARDS FOR FUTURE REStDENT
CENTRA I-TENDENCY
AREA 3 - FUTURE GROUNDWATER - STOLLEY PARK
PARKVIEW WELL SITE - NORTHERN STUDY AREA
GRAND ISLAND, NEBRASKA
i-enano Tim^frame. Futurr
toreplor Population Rnidcnt
gpfgptor Ag« Child and Adult
Groundwaler Pool Water (1) Solley P,rk Ingnlion
EKp Route Total
Dermal
Etp. Route Total
EipuBUre Point Total
a«.«(./Pitrmtiml C*mcrr*
.I.l-Tnrhlorcwlhuie
,1-Dichloro* thane
,1 -DK-hloroclhene
Trtrarhloroelhrne
EPC
Vmlrnt
Z16E-O2
bTtlE-M
(.75E-03
limit 1
mg/L
mg/L
mg/L
1,1,1-Tnchloroelharie
1.1-Dii-hluniethcne
1.2-OchJoinelhanc
Tt-rrartiloroelhene
116E-02
330EJ13
1 83E-02
570F-04
IPR/L
mg/L
ixpaturr Medium Total
Ambient Air Pool V a port Inhalation
E*p Route Total
1,l,1-Ti.rhlorotlh*ne
1,1-Dirhloroelhen*
357E-01
B.21E-03
1 D1E-01
mg/m1
mg/m
E-npoaure Point Total
Exposure Medium Total
Medium Tola!
c««r R-* r .i«i.h-.«/., a.;* -w M.IImtiktllxf.iuTr r«ncrarr«h-M
Vafur
340E-07
1BBE-07
1.23R06
SOSE-ns
B71E-09
Umitt
"»"«*
mg/kji-d
z^:mf/if-i
CSf/U-.f RifA
V.I.,
~
57nE-03
9.10E-07
Lfnif*
(mg/kg-dM
(mg/kg-dH
(mg/kgdH
(mg/kg-dVI
1 12E4H
1 17E-04
3.19E-05
mg/kj-d
•,/*«
mg/kg^l 210E-02
(m./^H
„,/*.->.
(me/kgJH
Total of Receptor Risks Across All Media
C.nnrllut
NC
NC
5>5E-09
NC
458E-1H
7.»2E-]0
654E-07
7.12E-07
711E-07
NC
NC
6 TOE -07
102E-04
1 D2E-06
1 02E-06
1 73E-06
3.8EK15
N».C..™.H...rtC.WI.«.../irCIKU
I.H,/E.f...r, C,.rmrr.fi.»
V.l.r
340E*.
1I8E«
f*lE-OS
1 06E-06
Unltf
mg/k«<i
mj/Vg-d
mj/Vg-a
mg/kg-d
123E-05
803E4I7
B71E-08
m,/kg^
mg/kg-d
mg/kgj
KfDIl/C
V./>r
2SOE-01
500E-02
100EJH
UHlll
mg/k8^
mg/kg^
280E-01
100E-01
sooE^n
200E^12
IOOE-03
mg/kg-d
mg/kg-d
mg/k^-d
1.1ZE-O1
102E-04
1.17E-03
159E-05
3 19E-04
mj/kgj
mg/kgJ
m,/kjj
mg/kg^
6ME-01
I.4CE-01
5.7HE-02
1 «)E<13
mg/kR^d
mg/kg-d
mg/kg-d
mg/kg^l
mg/kg^
Total of Receptor Hazards Acrou All Media
Haiarrf
0-.ri«r(
1 HE-OS
577E-05
1.06E-04
1.S3E-04
441E-05
402E-06
1 57E-04
435E-06
121E-03
I.42E-03
1 60E-03
1 WE -03
1.78E-03
1 +-4E-03
2.05E-02
1 85E-02
319E03
742E-02
7.42E-ra
7.42E-03
7.58E-07
6.3E-01
N.-C««rH4:-rWC-Ir.Uh«./.rAW.;f
nt.ktILtfttun C,m(nt,.t,.,
\>*l».
NA
NA
NA
NA
UMI(«
mg/kg-d
mg/kg-d
mg/kg-d
R/D/H/C
V./i,c
2.ME-01
2C10E-01
500E-02
IWlEfll
1.00EO2
NA
NA
NA
NA
NA
mg/kg-d
mg/kg^l
2.BOE-01
2.00E-01
SOOE-OZ
200E02
l.OOE-02
Unili
mg/kg^
mg/kg-d
mg/kg^l
mg/kg-d
mg/kg-d
mg/kgj
NA
NANA
NA
NA
mg/kg^l
Tig/kg^
mg/kg-d
mg/kgd
mg/kg-d
(.30E-01
1 40E-01
5.70E -02
1 40E-03
l.OOE-02
mg/kg<l
m,/k,-d
mg/kgj
Total of Receptor Hazards Across All Media
.Vta,NC
NC
NC
NC
NC
NC
NC
NC
NC
NC
NC
NC
NC
NC
NC
NC
NC
NC
NC
NC
NC
NC
NC
2.3E-01
Noicr
N C - N o t Calculated
NA - N0J Applicable
(U For tt»it «rena.na.only • child pltyln^ia thf pool wi« evtlualc
{211 1 ^

Page I of 2
TABLE C.7.1.RME
CALCULATION OF CHEMICAL CANCER RJSKS AND NON-CANCER HAZARDS FOR FUTURE RESIDENT
REASONABLE MAXIMUM EXPOSURE
AREA 3 - FUTURE CROUNDWATER - STOLLEY TARK
PARKVIEW WELL SITE-NORTHERN STUDY AREA
GRAND ISLAND. NEBRASKA
ino Timeframe Fulur*
lerrpior Population: Rnldenl
tercplQT Age Child *nd Adult
MtJimm
Croundwaler
Lipvtun Mttimm
Houwhold U«e
Lff»t*rr Pmimt
Stollry P.rk
Lxfttmn Rmmtr
Lngnlion
E«p. Roule ToUl
Dermal
E*p Route ToUl
Otfmifml »f
Ptirwtiml C»»™
,1,1-Trkrhkwoethane
,1-Dichloroelhane
,1-Dirhloroethene
J-Dtchloroethanc
T*rr«ch lornethene
IK
Vttmt
3.00E-OI
470E-03
166E-02
6.50E-O4
950E-03
Umitt
mg/L
mg/L
mg/L
mg/L
mg/L
,U-Triehloroelh*ne
l,l-Dirtiloroeth*ne
1,1-Diehloroethen*
1 ,2-Dirttorocthane
Tetnchlortwthene
300E-02
47DE-03
266E-02
650E-M
9.50E-03
mg/L
mg/L
mg/L
mg/L
E>po»un- Point Total
•ipoiure Medium Tola]
Ambient Air Shower Vapor* Inhalation
Exp. Route Total
1.1,1-TrichloraelhMic
1,1-DkhloroelhaKe
1,1-Dlehlororlhen*
U-Dirhlororthane
retrarhloroethenv
300E-OJ
470E-OJ
266E-02
650E-04
1.30E-O3
mg/L
mg/L
mg/L
mg/L
mg/L
E»po»ure Point Tolal
Exposure Medium ToUl
Medium Total
Groundwaler Indoor Air Vapor* Inhalation
Ehp Route ToUl
1,1,1-THchlorovlhtne
1,l-Dirhlomrth*n«
1 .1 -Dirtilorocthene
1 J-Dirti lororthane
Tetrachloroethene
Z06E-M
237E-O5
2.I5E-04
247E-06
59SE-05
mg/m
mg/m
mg/mj
:*po«urr Point Tolal
Enpoiurw Medium ToUl
Medium Toll!
Ca«frr KUl C«lnJ«h*m/>r Cfei'U »tf AWnff
ntfkilLxfftmrt
571E-O4
9 ME -05
S.06E-04
1.24E-05
1 (HE-'X
mg/kg^
mg/kg-d
mg/kg-d
mg/k«^
mg/Vj^
CS7/U-
5.70E-03
9.10E-02
540E-OI
(Hui
(mg/kg-dH
mg/k«-dH
(mg/k«^)-l
(mg/kg-dVI
(mg/^^J)-1
I30E-05
S43E-05
47DE-07
I22E-05
mg/kg-d
mg/kg-d
mg/k^
mg/k«-d
-
910E-02
5.40E-01
(mR/kg-d)-l
(mg/k«-d>.t
(mg/kg-d)-l
(mg/kg-d)-]
2.23E-03 '
350E-W
1.98E-03
4&3E-05
7.06E-04
mg/kg^l
mg/kg^d
mg/kg-d
mg/kg^l
mg/k^^l
S TOE -03
910E-02
210E-02
(mg/kg-d H
(mg/kg-d >-1
(mg/kg-dH
(mg/kg-dH
(mg/kg^l
306E-05
353E-06
3 ME -07
IB5E-06
mg/k«^
mg/kgJ
mg/Kg^i
mg/kg-d
570E-03
9.10E-02
210E-02
(mg/kg-d)-!
(mg/kg-dH
(mg/k«-dH
tmg/kg-dH
r*nrtr KUk
NC
510E-07
NC
1 12E-06
"76F-0?;
992EOS
NC
NC
4.ZSE-OS
4.44E-OS
4 45E-05
1.44E-W
1.44E-04
NC
1.99E-06
NC
4.40E-06
1.-WE-05
112E-05
2.12E-05
112E-05
1.65F-O4
NC
2.01 E-OS
NC
3.35E-M
1 S6E-07
I39E-07
239E-07
2.39E-07
139E-07
N*»-C«Mr*rHaurrf Cflrulmti+mifmt OiiU
Ititmkrlfjfffnn
2B8E-03
4 51 £-04
255E-03
623E-03
91iE<»4
Cmmtrftifm
mg/kg-d
mg/kg^l
mg/k,^
m^/kg-d
mg/kg-d
KfO
ZBOE-01
ZOOE-0]
5 OOE-02
ZOOE-O2
1 OOF-07
«/T
mg/kg-d
mg/kg-d
mg/kj«i
mg/kt^
mg/l-4-d
34AE-04
2.32E-04
201E-06
345E-04
mt/k^^
mg/kg-d
mg/kg^J
5.00E-02
200E-0?
1.00E-07
mg/k,^
mg/kg-d
mg/kg^
959E-03
l.WE-03
! 50E-03
2.08E-04
304£-03
mg/kgd
mg/kg-d
mg/kg^l
mg/kg^J
mg/kg^J
630E-01
1.40E-01
5. TOE -02
1.40E-03
1 OOE-02
mg/kg-d
mg/kg^l
mg/kg-d
mg/kg^l
1.32E-04
1.52E-05
1 S2E-O4
1 58E-06
3 WE -05
mg/kg^
mg/kg^i
mg/kg^i
mg/Vg^l
mg/kg-d
630E-01
1.40E-01
S7DE-02
1 WE -03
100E42
mg/kg^
mg/kg-d
mg/kg-d
mg/Vg^i
mg/kgd
1.03E-02
225E-03
510E-02
311E-03
0.11E-0?
1.58E-01
4 ME -03
1.01E-04
34SE-02
406E-02
1.98E-01
1.9BE-01
1.52E-02
1 07E-O2
1.49E-01
304E-0]
627E-01
627E-01
627E-01
825E-01
209E-04
1 OBE-04
320E-03
1 13E-03
3WE-03
B45E-03
S45E-03
845E-03
B45E-03
Nrm-Ctnci-r HtltrJ Cflflttitm, ffr AAult
945E-04
]«E-W
8.3flEO4
205E-05
20*F-04
mg/kg-d
mg/kg-d
mg/kg^J
mg/kg-d
mg/k,J
RfW
180E-01
2.00E-01
5.00E-02
200E-02
1 OOE-02
*/r
mj/k»-d
ir-l/kjJ
mj/kj-d
m,/k,^
mj/k,^
1.55E-04
l.OOE-05
1 OOE-04
8 69E-07
1.54E-04
mg/kg-d
mg/kg-d
mg/kg-d
mg/kg^
mg/kg-d
2SOE-01
100E-01
500E-02
2.00E-02
1 OOE-02
m8/k,J
mt/tj-d
mg/kj-d
mg/k|«i
m,/kj^
4 11E-03
644E-04
364E-03
1 30E-03
mg/4^1
mg/Vg-d
mg/kgJ
mg/k«-d
630E-01
1.40E-01
5.7DE-02
1 OOE-02
mg/kj-d
mg/kg^l
mg/kgj
mg/kg-d
564E-05
6.SOE-06
7.82E-05
6.77t-07
1 63E-05
mg/kR-d
mg/kg^
mg/kg-d
mg/kg-d
mg/kg-d
6ME-01
1.40E-01
57DE-02
140E03
100E-02
mg/kg-d
mg/kB-d
mg/kg-d
mg/Wg-d
mg/kg-d
H.i-rrf
Qvfhtml
338E-03
740E-04
1 68E-O2
102E-03
2.99E-02
51IE-02
5S4E-04
S01E-05
2.01E-03
434E-05
1 S4E-02
1BOE-02
698E-02
69BE-02
652E-03
460E-03
639E-02
636E-02
1 30E-01
169E-01
269E-01
2.69E-01
3.39E-01
8.96E-05
4.6SE-OS
1.37E-03
4.ME-CH
1.WE-03
3.62E-03
3.62E-03
362E-03
362E-03
CR*1»«25(21)APP1-

TABI.EC7.1.RME
CALCULATION OF CHEMICAL CANCER RISKS AND NON-CANCER HAZARDS FOR FUTURE RESIDENT
REASONABLE MAJC[MUM EXPOSURE
fARKVIEW WELL SITE - NORTHERN STUDY AREA
GRAND ISLAND NEBRASKA
irio Timcfr^rrw. Future
lor Population- Rvudent
Age. Child and Adull
Mritium
Ground w.lcr
Medium Tolil
Lr?»tiin Mrtlimm
Pool W.tcr(l)
Cif *i«rv Ptimt
Slollry Pirk
Efpoimrr R*ntt
Ingnliori
E*p RouicTolal
Dermal
E«p Rome Tolnl
Ckrwtif,! »f
,1 Dii-Mciroelhmne
,1-Dirhloroelhe™
,2-Dirhlororthin*
fetr* rh 1 o re* then t
IPC
47DE-03
266E-02
650E-W
950E-03
mg/L
mg/L
,1 .1 -Trirhloro*lh»fi«
1,1-Dirhloroelhane.
1,1-Dii-hlomcthme
U-Di.hlnroelhinr
TetT«'h 1 Qnx t h en r
300E-02
47DE-03
266E-02
6 ME -04
•*50E-03
mg/L
mg/L
mg/L
Eipotwe Poinl Tolil
E»po» ure Medium Tolal
Pool Vipora Inhalation
E*p. Route Total
1,1.1-Tru-hlortiethuie
1 ,1 -Dirhlorw thane
1 ,1 -Dirhloro^th*nt
U-Dirhloroethint
T^trarhloroelbene
3S7E-01
372E-01
821E-03
1.01E-01
mg/m
mg/m
EipOBurePomlTolil
i*po»ure Medium Total
Cimcrr Xui C*lt*lmH»mt far ChiU **J AJult
Vflmt
82n£-07
2 OOF -08
Umitt
mg/kgd
mB/kg^
V«li/
-
9.10E-02
Umitt
(m8/kg<lH
(mj/kj-dH
tag/kg -dH
336E-06
124E-07
VME-OB
mg/kg-d
mg/kg^
mg/kgj
570E-03
9 10E-02
(mg/kg-dH
(mg/Vg<))-l
(mg/kg^M
220E-04
5.06 E 06
625E-H5
mg/kgj
mg/kg<l
-
9.1C1E-02
(mg/kjJH
{mg/kg^J-1
Total of Receptor Risks Across All Media
NC
B.26E-10
NC
1 82E-09
1.5BE-07
1 61E-07
NC
1 3BE-09
1 77E-09
l.BOE-m
1 80E-06
1 WE -06
1.96E-06
NC
NC
461E-07
ZOOE-06
iOOE-M
200E-06
3.96E-06
1.7E-04
N».-C«nrrr H.i.rW C.Ir»l-fi.m/«f ChfU
V*fm-
925E-06
1 4SE-06
B20E-06
200E-07
193E-06
LT«ili
mg/kg^l
mg/kg^
mg/kg^
mg/k^-d
R/D/R/C
V«/«,r
280E-01
200E-01
500E-02
1 OOE-02
Umitt
ing/k^-d
mg/kg-d
ng/kg-d
mg/kg-d
336E-05
2?4H-(V,
1 ME-07
333E-05
mg/kgd
m»/kjj
mg/kjKi
mg/kgj
280E-01
100E-01
2. OOE-02
1. OOE-02
mg/kg-d
mg/kBJ
mg/kgd
mg/kB^
Z20E-03
2.29E-03
5D6E-05
mg/kgj
mg/kg-d
mg/kg-d
630E-01
S7DE-02
1 40E-03
mg/kg^
mg/kg-d
mg/Kg^l
Total of Receptor Hazards Across All Media
H«i.rrf
Quftirnt
330E-05
724E-06
1.64£-04
293E-04
507E-04
120E-04
971E-06
3i3E<13
392E-03
442E-O3
4H2E-03
349E-03
4D2E-02
362E-02
1 45E-01
1 4SE-01
1 4bE-Ol
l.ME-01
9.8E-01
fJfK-Cfmcrr HmmrJ Citmlitiemi ftr AW.ff
ntmkr/rtftiMH C»*tr*trmtifm
Vllut
NA
NA
NA
NA
Um,tl
mK/kg-d
mg/kg-d
mg/kf;^
mg/kg^l
R/D/R/T
Vtfxt
2SOE-01
100E-01
5 OOE-02
1 OOE-02
Lf.ff,
mg/Vg-d
mg/kg-d
mg/kg-d
mg/Vg^
NA
NA
NA
mg/kg^
mg/kg^
mg/kg<i
280E-01
200E-02
1 OOE-02
mg/kg-d
mR/kg-d
mg/V^J
NA
NA
NA
mg/kg-d
mg/kg^l
mg/kn-d
630E-01
57PE-02
140E-03
1 OOE-02
mg/kg-d
mg/V|t-d
n'g/kg-d
mg/kg^l
H«i«W
Qmftifmt
NC
NC
NC
NC
NC
NC
NC
NC
NC
NC
NC
NC
NC
NC
NC
NC
NC
NC
NC
NC
NC
NC
NC
Total of Receptor Hazards Across All Media | 3.4E-01
NC-NotC.kul*(rdNA -Not Applk-«bk(1) ForthuKvn>rio,(*ily a rhild pUymg In the pool wti tvaliulvd.
CRA 18925(21)IIJAWL
ATTACHMENT D
HHRA FOR PARKVIEW/STOLLEY PARK RESIDENTIAL WELLS
018925(21) APPL

TABLE OF CONTENTS
1.0 INTRODUCTION AND OVERVIEW D-l1.1 OVERVIEW OF ATTACHMENT D D-l1.2 RESIDENTIAL WELL DATA D-l1.3 NATURE AND EXTENT OF CONTAMINATION D-l1.4 OBJECTIVE OF ATTACHMENT D D-21.5 ORGANIZATION OF ATTACHMENT D D-3
2.0 IDENTIFICATION OF CHEMICALS OF POTENTIAL CONCERN D-42.1 SCREENING CRITERIA D-42.2 DATA COLLECTION D-52.3 DATA EVALUATION D-52.4 COPC SELECTION D-62.5 SUMMARY OF COPC SELECTION D-7
3.0 EXPOSURE ASSESSMENT D-83.1 CHARACTERIZATION OF EXPOSURE SETTING D-83.2 IDENTIFICATION OF POTENTIAL EXPOSURE PATHWAYS D-83.2.1 SOURCES AND RECEIVING MEDIA D-93.2.2 FATE AND TRANSPORT OF COPCS D-93.2.3 POTENTIAL EXPOSURE POINTS D-103.2.4 COMPLETE PATHWAYS AND EXPOSURE ROUTES D-103.3 QUANTIFICATION OF EXPOSURE D-ll3.3.1 EXPOSURE POINT CONCENTRATIONS D-123.3.2 ROUTE SPECIFIC INTAKE EQUATIONS D-133.3.2.1 GROUNDWATER INGESTION INTAKE EQUATION D-l 43.3.2.2 GROUNDWATER DERMAL CONTACT INTAKE EQUATION D-143.3.2.3 GROUNDWATER VAPOR INHALATION INTAKE EQUATION D-153.3.2.4 INDOOR AIR INHALATION INTAKE EQUATION D-163.3.3 EXPOSURE ASSUMPTIONS D-163.3.3.1 RESIDENTIAL EXPOSURE D-173.3.3.2 INDOOR AIR EXPOSURE D-18
4.0 TOXICITY ASSESSMENT D-204.1 NON-CARCINOGENIC HAZARDS D-214.2 CARCINOGENIC RISKS D-224.3 TOXICOLOGICAL SUMMARIES FOR THE COPCS D-23
5.0 RISK CHARACTERIZATION D-245.1 HAZARD ESTIMATES D-245.2 CANCER RISK ESTIMATES ...D-255.3 RISK QUANTIFICATION SUMMARY D-265.4 UNCERTAINTY ANALYSIS D-28
6.0 REFERENCES D-29
18925 (21) APPL ATTO CONESTOGA-ROVERS & ASSOCIATES
LIST OF FIGURES(Following Text)
FIGURE D.J.I CONCEPTUAL SITE MODEL: RESIDENTIAL WELLS
LIST OF TABLES(Following Text)
TABLE D.I.1
TABLE D.2.1
TABLE D.3.1
TABLE D.4.1
TABLE D.7.1A.CT
TABLE D.7.1A.RME
TABLE D.7.1B.CT
TABLE D.7.1B.RME
SELECTION OF EXPOSURE PATHWAY SCENARIOS
OCCURRENCE, DISTRIBUTION AND SELECTION OFCHEMICALS OF POTENTIAL CONCERN IN GROUNDWATER/TAP WATER
EXPOSURE POINT CONCENTRATION (EPC) SUMMARY FORCHEMICALS OF POTENTIAL CONCERN IN GROUNDWATER/TAP WATER
VALUES USED FOR DAILY INTAKE CALCULATIONS FOR TAPWATER
CALCULATION OF CHEMICAL CANCER RISKS AND NON-CANCER HAZARDS FOR PAST RESIDENT - CENTRALTENDENCY USING CURRENT TCE TOXICITY DATA
CALCULATION OF CHEMICAL CANCER RISKS AND NON-CANCER HAZARDS FOR PAST RESIDENT - REASONABLEMAXIMUM EXPOSURE USING CURRENT TCE TOXICITY DATA
CALCULATION OF CHEMICAL CANCER RISKS AND NON-CANCER HAZARDS FOR PAST RESIDENT - CENTRALTENDENCY USING FORMER TCE TOXICITY DATA
CALCULATION OF CHEMICAL CANCER RISKS AND NON-CANCER HAZARDS FOR PAST RESIDENT - REASONABLEMAXIMUM EXPOSURE USING FORMER TCE TOXICITY DATA
189?5(21)APPL ATTD CONESTOGA-ROVERS & ASSOCIATES
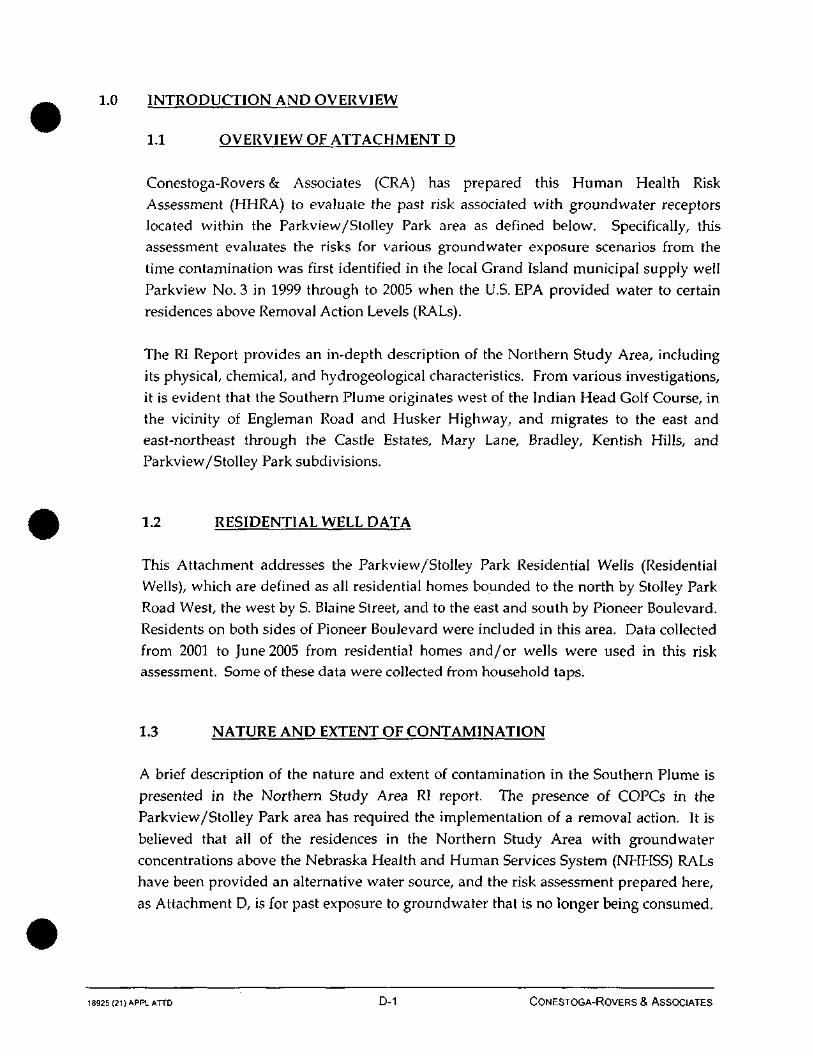
1.0 INTRODUCTION AND OVERVIEW
1.1 OVERVIEW OF ATTACHMENT D
Conestoga-Rovers & Associates (CRA) has prepared this Human Health Risk
Assessment (HHRA) to evaluate the past risk associated with groundwater receptorslocated within the Parkview/Stolley Park area as defined below. Specifically, this
assessment evaluates the risks for various groundwater exposure scenarios from the
time contamination was first identified in the local Grand Island municipal supply well
Parkview No. 3 in 1999 through to 2005 when the U.S. EPA provided water to certain
residences above Removal Action Levels (RALs).
The RI Report provides an in-depth description of the Northern Study Area, including
its physical, chemical, and hydrogeological characteristics. From various investigations,
it is evident that the Southern Plume originates west of the Indian Head Golf Course, in
the vicinity of Engleman Road and Husker Highway, and migrates to the east and
east-northeast through the Castle Estates, Mary Lane, Bradley, Kentish Hills, and
Parkview/Stolley Park subdivisions.
1.2 RESIDENTIAL WELL DATA
This Attachment addresses the Parkview/Stolley Park Residential Wells (Residential
Wells), which are defined as all residential homes bounded to the north by Stolley Park
Road West, the west by S. Blaine Street, and to the east and south by Pioneer Boulevard.
Residents on both sides of Pioneer Boulevard were included in this area. Data collected
from 2001 to June 2005 from residential homes and/or wells were used in this riskassessment. Some of these data were collected from household taps.
1.3 NATURE AND EXTENT OF CONTAMINATION
A brief description of the nature and extent of contamination in the Southern Plume is
presented in the Northern Study Area RI report. The presence of COPCs in the
Parkview/Stolley Park area has required the implementation of a removal action. It is
believed that all of the residences in the Northern Study Area with groundwater
concentrations above the Nebraska Health and Human Services System (NHHSS) RALs
have been provided an alternative water source, and the risk assessment prepared here,
as Attachment D, is for past exposure to groundwater that is no longer being consumed.
18925(21)APPLATTD D-1 CONESTOGA-ROVERS & ASSOCIATES
Therefore, the data used in this risk assessment represent the nature and extent ofexposure.
1.4 OBJECTIVE OF ATTACHMENT D
The purpose of this risk assessment is to evaluate the human health risks posed by pastexposure to the Residential Wells. This assessment takes into account that a RemovalAction (alternative water supplies) has been undertaken and assume that no resident isconsuming water above the RALs. Its objective is to provide a perspective on the risklevels to which the residential neighborhood may have been exposed.
The specific goals of the risk assessment for past exposure to the Residential Wells are:
• to identify chemicals of potential concern (COPCs);
• to provide an estimate of risk for these COPCs; and
• to provide a basis for comparing cumulative risk levels to the risk range used by theU.S. EPA provided in the National Contingency Plan and levels used in remedialdecision making.
Consistent with the HHRA for the Northern Study Area, the risk assessment in thisAttachment was conducted in accordance with the following U.S. EnvironmentalProtection Agency (U.S. EPA) guidance:
• U.S. EPA Risk Assessment Guidance for Superfund (RAGS), Volume I, HumanHealth Evaluation Manual (Part) A, EPA/540/1-89/002, December 1989;
• U.S. EPA RAGS Supplemental Guidance, Standard Default Exposure Factors,Interim Final, OSWER Directive 9285.6-03, March 25,1991;
• U.S. EPA Exposure Factors Handbook, EPA/600/P-95/002Fa/ August 1997;
• U.S. EPA RAGS Part D, Standardized Planning, Reporting, and Review of SuperfundRisk Assessments, Final, Publication 9285.7-O1D, December 2001;
• U.S. EPA, Child-Specific Exposure Factors Handbook, September 2002;
• U.S. EPA, Supplemental Guidance for Developing Soil Screening Levels forSuperfund Sites, December 2002;
• U.S. EPA RAGS Part E, Supplemental Guidance, Dermal Risk Assessment, Final,July 2004; and
• U.S. EPA, Draft Guidance for Evaluating the Vapor Intrusion to Indoor Air Pathwayfrom Ground water and Soils (Subsurface Vapor Intrusion Guidance), EPA Report
18925(21)APPLATTD D-2 CONESTOGA-ROVERS & ASSOCIATES
No. EPA530-F-02-052, Office of Solid Waste and Emergency Response,November 2002.
1.5 ORGANIZATION OF ATTACHMENT D
This Attachment is organized as follows:
• Section 1.0: Introduction and Overview
Presents background information relevant to this risk assessment, presents thepurpose of this risk assessment, and outlines the organization of this Attachment.
• Section 2.0: Identification of Chemical of Potential Concern
Presents a brief summary of the Chemicals of Potential Concern (COPCs) selectedfor groundwater for the Residential Wells.
• Section 3.0: Exposure Assessment
Presents a summary of the exposure settings, identifies the potential exposurepathways, and quantifies exposure based on the exposure assumptions.
• Section 4.0: Toxicity Assessment
Presents a summary of the toxicity data used to calculate the non-carcinogenichazards and carcinogenic risks.
• Section 5.0: Risk Characterization
Presents an assessment of the potential risks to human health from past exposure togroundwater.
• Section 6.0: References
Presents a list of references cited in the risk assessment.
18925 (21) APPLATTD D-3 CONESTOGA-ROVERS & ASSOCIATES
2.0 IDENTIFICATION OF CHEMICALS OF POTENTIAL CONCERN
This risk assessment presents the process for establishing the chemicals of potential
concern (COPCs) for the Residential Wells. An Administrative Order on Consent (AOC)
for the RI determined the original list of chemicals for the Northern Study Area. The list
provides a targeted set of chemicals that have been detected frequently and that
represent the highest potential threat to human health and the environment. These are
the CVOCs for the Northern Study Area:
• 1,1,1-TrichIoroethane (1,1,1-TCA);
• 1,1-Dichloroethane (1,1-DCA);
• 1,1-Dichloroethene (1,1-DCE);
• 1,2-Dichloroethane (1,2-DCA);
• cis-l,2-Dichloroethene (cis-l,2-DCE);
• Tetrachloroethene (PCE); and
• Trichloroethene (TCE).
The Southern Plume appears to have its source west of the Indian Head Golf Course inthe vicinity of Husker Highway & Engleman Road.
Any COPC that was detected, even if the detection was qualified or estimated, was
quantified in the Residential Well risk assessment. The maximum detected
concentration was compared to U.S. EPA Region IX Preliminary Remediation Goals
(PRGs) to provide a general level of risk, or ranking of COPCs. Consistent with
U.S. EPA 1989, these ratios should not be considered further than this screening process.
Descriptions of the applicable screening criteria are presented in the following
paragraphs.
2.1 SCREENING CRITERIA
U.S. EPA Region IX PRGs are risk-based concentrations for environmental media (soil,
air, and water) that are considered to be protective of humans, including sensitive
groups, over a lifetime. The PRGs are chemical concentrations that correspond to fixed
levels of risk [i.e., either a one-in-one million (lf>6) cancer risk or a non-carcinogenic
hazard quotient of 1]. According to the U.S. EPA, exceeding a PRG suggests that further
evaluation of the potential risks that may be posed by the study area related
contaminants is appropriate; however, PRGs are not in and of themselves cleanup levels.
18925 (21) APPLATTD D-4 CONESTOGA-ROVERS & ASSOCIATES
For ranking purposes, PRGs for all non-carcinogenic analytes were adjusted by a factorof 10, for a non-carcinogenic hazard quotient of 0.1.
The PRGs are based on exposure pathways for which generally accepted methods,models, and assumptions have been developed (i.e., ingestion, dermal contact, andinhalation) for specific land-use conditions (i.e., residential).
In the context of this risk assessment any COPC detected in Residential water wascarried through the risk assessment process. However, PRGs were used to evaluatepractical quantitation limits relative to observed concentrations to determine a ratio ofthe maximum concentration to the PRG, thus indicating, in a general way, which COPCwill contribute most to the overall risk.
In this risk assessment, detected COPCs in groundwater were quantified in the riskassessment process. In addition, the maximum groundwater data were compared to theRegion IX tap water PRGs. U.S. EPA re-evaluated the potential toxicity of 1,1-DCE in2002. They determined that the toxicological database did not support the previousdetermination that 1,1-DCE should be evaluated as a carcinogen, so they revised theirtoxicological profile to provide an updated value for 1,1-DCE. The up-datedtoxicological information was used in this risk assessment to develop groundwater riskusing methods consistent with the Region IX tap water PRG, and current U.S. EPAguidance. It is believed that the U.S. EPA utilized this updated toxicology informationto establish the 1,1-DCE RAL for this Site (U.S. EPA Fact Sheet, November 2004)(U.S. EPA, 2004d).
2.2 DATA COLLECTION
A summary of existing data for the Residential Wells for the purposes of the remedialinvestigation is summarized in Section 2.0 of the RI.
2.3 DATA EVALUATION
It is assumed for the purposes of this risk calculation that a small number of residencesin Parkview/Stolley Park received water from their own residential groundwater wellsup to approximately the time when contamination was discovered above MCLs in 2001through 2005 when the NDEQ and U.S. EPA provided water to certain residences aboveRALs from an alternative source. The U.S. EPA has been responsible for overseeing the
provision of drinking water and continues oversight. For the residential wells, water
18925 (21) APPL ATTD D-5 CONESTOGA-ROVERS & ASSOCIATES
could have been collected either as groundwater samples or as tap water. All available
water sample data were used in this risk assessment, and all of the data were treated asgroundwater. Also, water was collected by different agencies, such as the U.S. EPA,
NDEQ, the City of Grand Island, and CRA and the analytical detection Jimits may vary.A description of the potential impacts of the variability in the detection limits is
provided in Section 2.4. In general, all of the data collected was valid and usable for the
purposes of this risk assessment.
2.4 COPC SELECTION
A COPC was selected for inclusion into the risk assessment if it was detected in
groundwater, even if the concentration was estimated below PQLs. This approach is
consistent with U.S. EPA 1989 that allows for the use of estimated or "J" coded data in
the risk assessment process. Chemicals that were not detected were not carried through
the process.
The following chemicals were detected and carried through the risk
assessment: 1,1,1-TCA, 1,1-DCA, 1,1-DCE, 1,2-DCA, ds-l,2-DCE, PCE, and TCE, as aresult these chemicals were selected as COPCs. The maximum concentration was
compared to the Region IX PRG, as shown in Table D.2.1. It can be see in this table that
1,1,1-TCA and 1,1-DCA had detected concentrations below the PRG, and cz's-l,2-DCE
and TCE were included even though they were only detected two and one times,
respectively, at estimated concentrations of 0.0004 and 0.00016 mg/L, respectively.
An evaluation of the COPC analytical detection limits for groundwater is also shown in
Table D.2.1. The analyte detection limits were compared to the U.S. EPA Region IX
PRGs. Of the 1,642 individual sample analyses, 1,265 were non-detects. A high
percentage, 49 percent, (623 samples), had detection limits greater than one times the
U.S. EPA Region IX PRG, and 16 percent, (207 samples) had detection limits that were
greater than 10 times the U.S. EPA Region IX PRG, but 206 of the 207 samples were for
TCE, which has a low PRG due to the 2001 Cancer Slope Factor, which is discussed in
more detail in Section 4.0 of the HHRA. The program detection limit for TCE was
0.0005 mg/L, which is ten times lower than its MCL. This detection limit is not
adequate to meet the PRG of 0.000028 mg/L, which is currently unattainable by normal
laboratory procedures. This evaluation indicates that, with the exception of TCE, thegroundwater data are adequate for the purposes of this risk assessment. The detection
limit for TCE was adequate at the initiation of the investigations, but due to the revision
in the TCE Slope Factor it became inadequate, which increases the uncertainty in the
18925 (21) APPLATTD D-6 CONESTOGA-ROVERS & ASSOCIATES
program for TCE. As a result, the groundwater exposure and associated human health
risk may be underestimated for TCE, but below levels of concern.
2.5 SUMMARY OF CQPC SELECTION
The following COPCs were identified, based on being detected in groundwater and so
were selected for quantitative risk assessment:
• 1,1,1-TCA, 1,1-DCA, 1,1-DCE, 1,2-DCA, ds-l,2-DCE, PCE, TCE.
18925 (21) APPLAHD D-7 CONESTOGA-ROVERS & ASSOCIATES
3.0 EXPOSURE ASSESSMENT
Exposure is defined as the contact of a receptor with a chemical or physical agent. Theexposure assessment is the estimation of the magnitude, frequency, duration, and routesof potential exposure. An exposure assessment provides a systematic analysis of thepotential exposure mechanism by which a receptor may be exposed to chemical orphysical agents at or originating from a study area. The objectives of an exposureassessment are as follows:
• Characterization of exposure setting;
• Identification of potential exposure pathways; and
• Quantification of potential exposure.
3.1 CHARACTERIZATION OF EXPOSURE SETTING
The risk assessment is an Attachment to the HHRA, which characterizes the SouthernPlume as it impacts the Northern Study Area. Information on groundwater flow andcontainment fate and transport will not be repeated here, as it is part of the RI. Aconsideration of site-specific factors related to land usage is important in thedevelopment of realistic exposure scenarios and quantification of potential risks andhazards. The past land use was residential and residential land use can reasonably beexpected in the future.
3.2 IDENTIFICATION OF POTENTIAL EXPOSURE PATHWAYS
An exposure pathway describes a mechanism by which humans may come into contactwith area-related COPCs. An exposure pathway is complete (i.e., it could result in areceptor contacting a COPC) if the following four elements are present:
• a source or a release from a source;
• a probable environmental migration route of a COPC;
• an exposure point where a receptor may come in contact with a COPC; and
• a route by which a COPC may enter a potential receptor's body.
If any of these four elements is not present, the exposure pathway is consideredincomplete and does not contribute to the total exposure from the COPCs.
18925 (21JAPPLATTD D-8 CONESTOGA-ROVERS & ASSOCIATES
These elements are satisfied because COPCs were found in groundwater west of Mary
Lane in the Southern Plume, the Southern Plume has impacted Parkview/Stolley Park,
and residents have consumed the water.
3.2.1 SOURCES AND RECEIVING MEDIA
The source areas for the Southern plume is defined in Section IV, Paragraph 10 of the
AOC as follows:
• "Southern Plume" for purposes of this Order shall mean the groundwater plume of CVOCs
starting at or west of the Indian Head Golf Course, and migrating to the east and
east-northeast through the Castle Estates, Mary Lane, Bradley, Kentish Hills, and
Parkvieiv/Stolley Park subdivisions.
The receiving medium in the Southern Plume can be defined as follows:
• Groundwater associated with the Southern Plume.
3.2.2 FATE AND TRANSPORT OF COFCs
As more completely described in Section 5.0 of the RI, many complex factors control the
partitioning of a COPC in the environment, thus measured concentrations in any area
only represent local conditions at a discrete point in time. An understanding of the
general fate and transport characteristics of the COPCs is important when predicting
future exposure. However, this risk assessment deals with past exposure, which is theresult of past fate and transport. Future potential exposure is addressed in the HHRA to
which this is an Attachment. It was assumed that groundwater concentrations are
represented by the 95 percent UCL, or maximum concentration, and that concentrations
remained constant over the exposure period used in the risk assessment process. The
exposure duration for drinking residential well water supplied to residents through the
tap was conservatively assumed to be 6 years, starting at the time that COPCs were first
identified in Parkview Well #3, to the time that an alternative water supply was
provided. The actual exposure duration is not precisely known and could be greater or
less than 6 years for some residential properties.
18925 (21) APPL ATTD D-9 CONESTOGA-ROVERS & ASSOCIATES
3.2.3 POTENTIAL EXPOSURE POINTS
The exposure points in this risk assessment are Residential Well water, and the potentialmigration of vapors into a residence from groundwater. Exposure point concentrationswere considered for area, and the 95 percent UCL, or maximum concentration, was usedto represent exposure. This method is consistent with U.S. EPA methods (U.S. EPA,1989, RAGS, Part A) and represents the Reasonable Maximum Exposure (RME). Anysingle individual's exposure may be greater or less than this level. U.S. EPA defines theRME as:
"The reasonable maximum exposure (RME) is defined as the highest exposure that is reasonably
expected to occur at a site. The intent of the RME is to estimate a conservative exposure case
(i.e., well above average) that is still within the range of possible human exposure." (U.S. EPA,
1989)
The exposure point concentration for the Parkview Residential Wells are shown inTable D.3.1 and show the 95 percent UCL concentration of COPCs from groundwaterwells collected between 2001 and 2005. Samples where COPC levels were not detected,the detection limits were used in the calculation of the 95 percent UCL concentration.The treatment of the non-detects and calculation of the 95 percent UCL for groundwaterwere performed using statistical methodologies consistent with U.S. EPA 1992, 2002d,and 2004c guidance as shown in Attachment F.
3.2.4 COMPLETE PATHWAYS AND EXPOSURE ROUTES
A potential exposure route is the fourth element of an exposure pathway. Potentialexposure routes are identified by: i) determining the COPC sources and receivingmedia; ii) analyzing the movement of the COPCs from the source; and iii) determiningthe possible exposure points.
Humans can be exposed to a variety of media containing COPCs, including,groundwater and air that have contact with other affected media. Based on the presenceof COPCs in the Southern Plume, an understanding of the four components of anexposure pathway exposure can be quantified. Past conditions in the area showmigration. Human exposure pathways associated with groundwater include theincidental ingestion, direct dermal contact, and inhalation of vapors.
The groundwater to soil vapor-to-indoor air pathway was evaluated by modeling, asdiscussed in Attachment G, using the Johnson & Ettinger (J&E) Vapor Intrusion model.
18925 (21) APPLATTD D-10 CONESTOGA-ROVERS & ASSOCIATES
Based on these assumptions and the results of the media-specific screening presented in
Section 2.4, the exposure scenarios and pathways quantified in the HHRA are
summarized in Table D.I.1. A CSM for this receptor is shown on Figure D. 1.1.
Exposure pathways for the residential wells include:
• Groundwater ingestion;
• Dermal contact with groundwater;
• Inhalation of vapors from groundwater; and
• Inhalation of indoor air vapors from groundwater.
3.3 QUANTIFICATION OF EXPOSURE
To quantify exposure, potential exposure scenarios were developed using guidance
presented in the following U.S. EPA documents:
• U.S. EPA, 1989: Risk Assessment Guidance for Superfund. Vol. 1: Human Health
Evaluation Manual, Part A OERR. EPA/540-1 -89-002;
• U.S. EPA, 1991a: Risk Assessment Guidance for Superfund. Vol. 1: Human Health
Evaluation Manual - Supplemental Guidance, Standard Default Exposure Factors.Interim Final. OSWER Directive 9285.6-03;
• U.S. EPA, 1997: Exposure Factors Handbook, EPA/600/P-95/002F, August;
• U.S. EPA, 2001: RAGS Part D, Standardized Planning, Reporting, and Review of
Superfund Risk Assessments, Interim, Publication 9285.7-O1D, December;
• U.S. EPA, 2002a: Vapor Intrusion to Indoor Air Pathway from Groundwater andSoils, November;
• U.S. EPA, 2002b: Child-Specific Exposure Factors Handbook, September;
• U.S. EPA, 2002c: Supplemental Guidance for Developing Soil Screening Levels for
Superfund Sites, OSWER 9355.4-24, December; and
• U.S. EPA, 2004a: RAGs Volume 1, Human Health Evaluation Manual, Part E:
Supplemental Guidance for Dermal Risk Assessment, EPA/540/R/99/005, July.
In instances where U.S. EPA documents did not present necessary factors, or where
more appropriate scientific data were not available, professional judgment was applied
to develop conservative assumptions that are representative of the Central Tendency
(CT) or mean and RME and are protective of human health. The exposure scenarios and
18925 (21 )APPLATTD D-11 CONESTOGA-ROVERS & ASSOCIATES

assumptions for each area evaluated are presented in their risk calculation tablesassociated with this Attachment.
The risk assessment process developed by U.S. EPA attempts to establish an estimate ofan average measure of the potential risk to receptors (U.S. EPA, 1989). Two levels ofexposure scenarios are presented. The RME corresponds to the 95 percent upperconfidence limit (UCL) of the mean concentration coupled with the exposure levels thatcan also represent an upper bound exposure level. The CT presents average exposure,and approximates the most probable exposure conditions.
The CT and RME exposure point concentration (EPC) values for the various exposurescenarios were determined based on the observed data distribution and the percentageof censored data points (non-detected results). Attachment F contains a detaileddescription of the statistical methods used to determine the CT and RME values.
3.3.1 EXPOSURE POINT CONCENTRATIONS
This subsection of the risk assessment provides the exposure point concentrations thatwill be used in the process of estimating intake for the identified receptors.
For the purposes of evaluating the Residential Wells, the 95 percent UCL of thegroundwater water concentrations were used. These concentrations are shown inTable D.3.1.
Consistent with U.S. EPA guidance (U.S. EPA, 1989) the upper bound average, or95 percent UCL concentration was used as the exposure point concentration forgroundwater, except for 1,2-DCA, ds-l,2-DCE, and TCE, which used the maximumconcentration detected because the 95 percent UCL was greater than the maximum.TCE was detected only one time at a concentration of 0.00016 mg/L. This was themaximum TCE concentration and was used in the risk assessment to represent the RME.The 95 percent UCL of the data from 2001, 2002, 2003, 2004, and 2005, were used in theRME calculation. The 95 percent UCL represents an upper bound estimate of theaverage COPC concentration of over 100 individual private well samples. Thus, it doesnot capture the full range of past exposures that individuals may have experienced. Theactual exposures and associated risks for individual private wells were likely higher andlower than those estimated in this risk assessment. U.S. EPA's methods for statisticallyreducing the data were used, as shown in Table D.3.1.
18925(21)APPLATTD D-12 CONESTOGA-ROVERS & ASSOCIATES

The 95 percent UCL concentration (or the maximum) was used to estimate ambientindoor air COPC exposure point concentrations. Indoor air concentrations wereestimated using a Volatilization Factor, developed by U.S. EPA (1991a), asrecommended by U.S. EPA Region VII. This approach estimates the amount of COPCsavailable for release from tap water and estimates an ambient air concentration over a24-hour period based on multiple uses of tap water, such as showering, bathing, dishwashing, and clothes washing.
It was also assumed that vapors from groundwater vapor intrusion could add to theimpacts from past exposure. The U.S. EPA's web-based version of the Johnson-Ettingermodel was used to estimate an indoor air concentration and risks associated with thispathway. This scenario used the exposure point concentrations for the futuregroundwater well in the Parkview/Stolley Park area from the HHRA. The modelingprocess is discussed in Attachment G. With this scenario, vapors are assumed tomigrate from groundwater to indoor air by volatilizing through the soil column andbuilding foundation.
3.3.2 ROUTE SPECIFIC INTAKE EQUATIONS
In the risk assessment, exposure estimates reflect chemical concentration, assumedcontact rate, assumed exposure time, and estimated body weight in a term called"intake" or "dose", which is an estimate based on their assumed intake rates, as providedin U.S. EPA guidance. This sub-section of the report provides route of entry-specificintake equations for the risk assessment. The U.S. EPA source of the intake equation isprovided with each equation.
Chemicals with potentially carcinogenic effects
Chemicals with potentially carcinogenic effects have varied and complex mechanism ofcancer development and exert effects at chemical specific levels through both thresholdand non-threshold mechanism (U.S. EPA, 1989). The U.S. EPA makes a number ofassumptions to simplify the risk assessment process including the assumption thatcancer caused by an environmental chemical develops over a lifetime, requiring thedevelopment of an average daily dose of a potentially carcinogenic COPC. It is furtherassumed that the dose acts cumulatively over a lifetime of 70 years, giving an averagingtime (AT) of 70 years for potentially carcinogenic chemicals.
189?5(21)APPLATTD D-13 CONESTOGA-ROVERS & ASSOCIATES

Chemicals with non-carcinogenic effects
All chemicals have non-carcinogenic effects, however, the toxicological action of each
chemical is varied and may work through different mechanisms, all of which are
considered by U.S. EPA to be threshold mechanism; meaning there is a level of exposure
that can be considered without adverse effect (U.S. EPA, 1989). The U.S. EPA makes a
number of assumptions to simplify the risk assessment process for chemicals with
non-carcinogenic effects, including the assumption that each chemical impacts a specific
target organ and the intake occurs over an exposure period or averaging time. The
averaging time selected depends on the toxic endpoint being assessed. Non-cancer
intakes and risk estimates were estimated for children and adults separately.
3.3.2.1 GROUNDWATER INGESTION INTAKE EQUATION
The intake equation for calculating chemical intake from the ingestion of water
(U.S. EPA, 1989) is:
C x I R x E F x E DB W x A T
Where:
I = Chemical intake (mg/kg body weight/day);
C = Chemical concentration (mg/L);
1R = Ingestion rate (L water/day);
EF = Exposure frequency (days/year);
ED = Exposure duration (years);
BW = Body weight (kg); and
AT = Averaging time (averaging period, days).
3.3.2.2 GROUNDWATER DERMAL CONTACT INTAKE EQUATION
The intake equation for calculating chemical intake from dermal exposure to water
(U.S. EPA, 2004a) is:
DA e v e n t xEFxEDxEVx5A
BWxAT
18925(21)APPLATTD D-14 CONESTOGA-ROVERS & ASSOCIATES

Where:
I = Chemical intake (mg/kg body weight/day);
SA = Skin surface area available for contact (cm2);
DAevem = Absorbed dose per event (mg/cm2-event);
EF = Exposure frequency (days/year);
ED = Exposure duration (years);
EV = Event frequency (events/day);
BW = Body weight (kg); and
AT = Averaging time (averaging period, days).
The absorbed dose per event (DAevem) equation for calculating dermal exposure to water
(U.S. EPA, 2004a) is:
If tevent < t*, thenDAevenl - 2 x FA x Kpx C x,'" ~ Tevent X tgvent
n
D A c v e n t = F A x K p x event
1 + B
Where:
C = Chemical concentration (e.g., mg/cm3 water);
FA = Fraction absorbed water (dimensionless);
KP = dermal permeability coefficient of compound in water (cm/hr);
tevent = event duration (hr/event);
Tevent = lag rime per event (hr/event);
t* = time to reach steady state (hr) = 2.4 x Tevent; andB = dimensionless ratio of permeability coefficient of a compound through the
stratum corneum relative to its permeability coefficient across the viableepidermis (dimensionless).
3.3.2.3 GROUNDWATER VAPOR INHALATION INTAKE EQUATION
The intake equation for calculating chemical intake from the inhalation of vapors fromgroundwater (U.S. EPA, 1989) is:
C x l R x E T x E F x E D x K
~ B W x A T
18925(21)APPLATTD D-15 CONESTOGA-ROVERS & ASSOCIATES
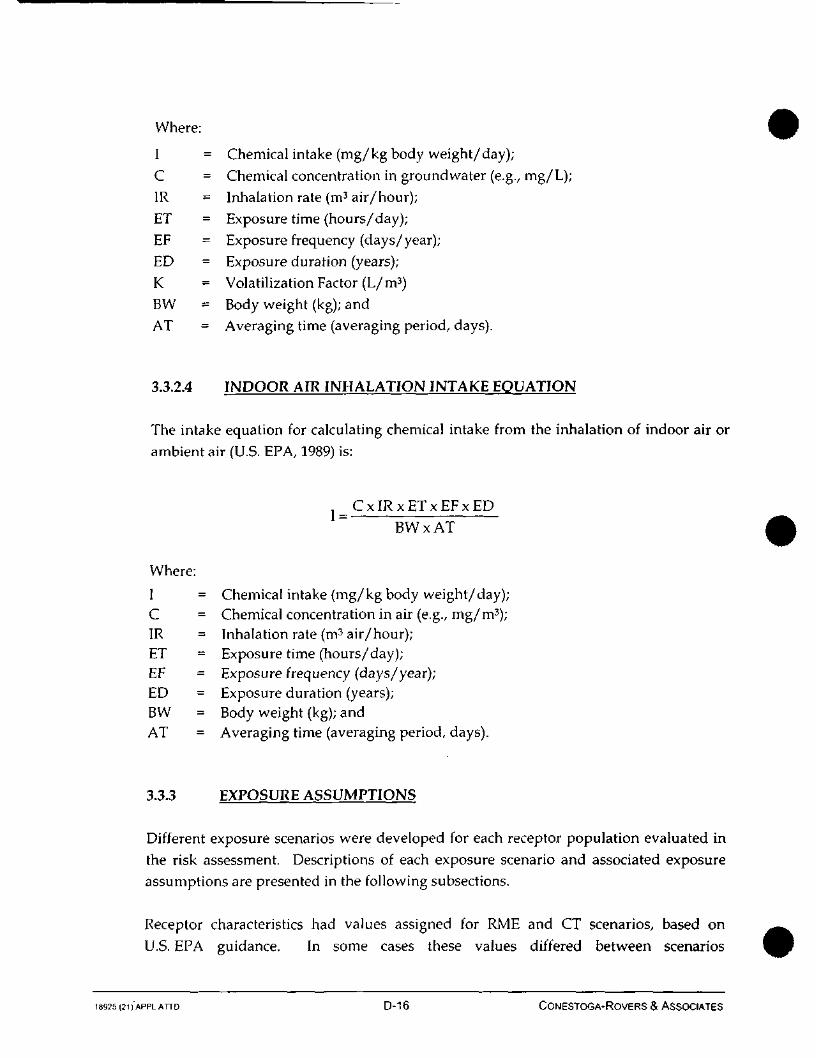
Where:
I = Chemical intake (mg/kg body weight/day);C = Chemical concentration in groundwater (e.g., mg/L);IR = Inhalation rate (m3 air/hour);ET = Exposure time (hours/day);EF = Exposure frequency (days/year);ED = Exposure duration (years);K = Volatilization Factor (L/m3)BW = Body weight (kg); andAT = Averaging time (averaging period, days).
3.3.2.4 INDOOR AIR INHALATION INTAKE EQUATION
The intake equation for calculating chemical intake from the inhalation of indoor air orambient air (U.S. EPA, 1989) is:
. C x IR x ET x EF x EDI = —
BWxAT
Where:
I = Chemical intake (mg/kg body weight/day);C = Chemical concentration in air (e.g., mg/m3);IR = Inhalation rate (m3 air/hour);ET = Exposure time (hours/day);EF = Exposure frequency (days/year);ED = Exposure duration (years);BW = Body weight (kg); andAT = Averaging time (averaging period, days).
3.3.3 EXPOSURE ASSUMPTIONS
Different exposure scenarios were developed for each receptor population evaluated inthe risk assessment. Descriptions of each exposure scenario and associated exposureassumptions are presented in the following subsections.
Receptor characteristics had values assigned for RME and CT scenarios, based on
U.S. EPA guidance. In some cases these values differed between scenarios
18925 (21) APPLAHD D-16 CONESTOGA-ROVERS & ASSOCIATES
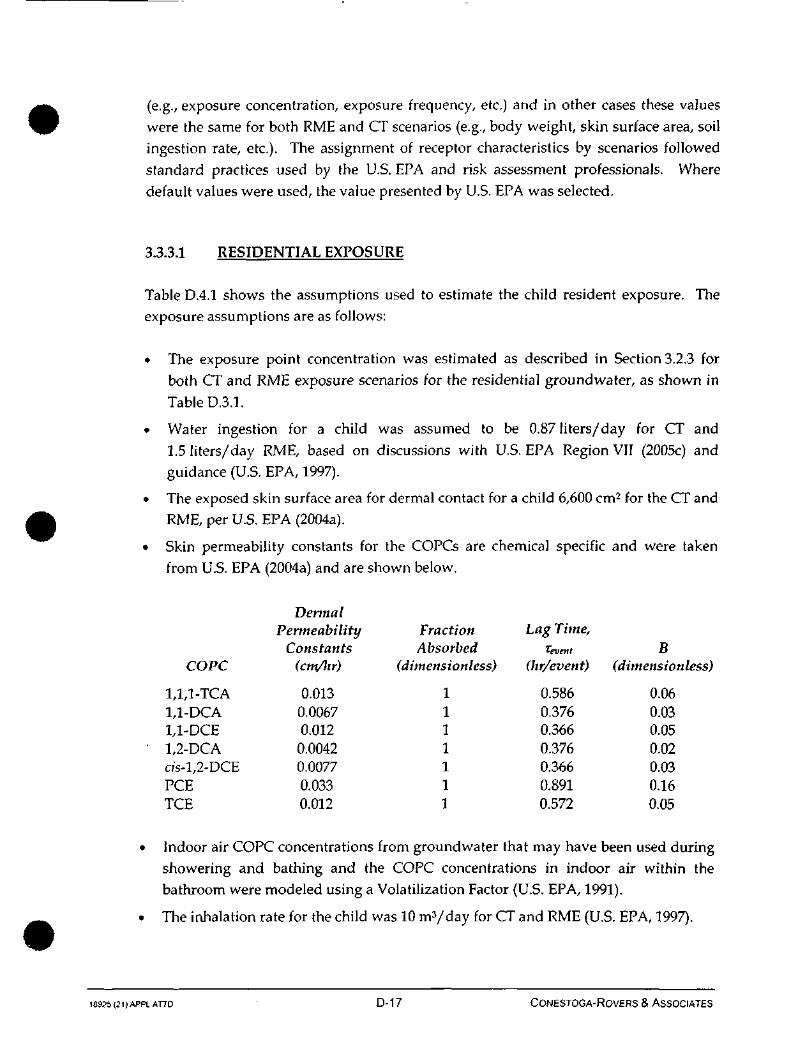
(e.g., exposure concentration, exposure frequency, etc.) and in other cases these valueswere the same for both RME and CT scenarios (e.g., body weight, skin surface area, soilingestion rate, etc.). The assignment of receptor characteristics by scenarios followedstandard practices used by the U.S. EPA and risk assessment professionals. Wheredefault values were used, the value presented by U.S. EPA was selected.
3.3.3.1 RESIDENTIAL EXPOSURE
Table D.4.1 shows the assumptions used to estimate the child resident exposure. Theexposure assumptions are as follows:
• The exposure point concentration was estimated as described in Section 3.2.3 forboth CT and RME exposure scenarios for the residential groundwater, as shown in
Table D.3.1.
• Water ingestion for a child was assumed to be 0.87 liters/day for CT and1.5 liters/day RME, based on discussions with U.S. EPA Region VII (2005c) andguidance (U.S. EPA, 1997).
• The exposed skin surface area for dermal contact for a child 6,600 cm2 for the CT andRME, per U.S. EPA (2004a).
• Skin permeability constants for the COPCs are chemical specific and were takenfrom U.S. EPA (2004a) and are shown below.
DermalPermeability Fraction Lag Time,
Constants Absorbed rrofn« BCOPC (cm/lir) (dimensionless) (hr/event) (dimensionless)
1,1,1-TCA 0.013 1 0.586 0.061,1-DCA 0.0067 1 0.376 0.031,1-DCE 0.012 1 0.366 0.05
' 1,2-DCA 0.0042 1 0.376 0.02c/s-l,2-DCE 0.0077 1 0.366 0.03PCE 0.033 1 0.891 0.16TCE 0.012 1 0.572 0.05
• Indoor air COPC concentrations from groundwater that may have been used duringshowering and bathing and the COPC concentrations in indoor air within thebathroom were modeled using a Volatilization Factor (U.S. EPA, 1991).
• The inhalation rate for the child was 10 m3/day for CT and RME (U.S. EPA, 1997).
18925 (21 )APPLATTD D-17 CONESTOGA-ROVERS & ASSOCIATES

• The child exposure time for dermal exposure was 0.33 hr/day for CT and 1.0 hr/dayfor RME (U.S. EPA, 2004a).
• The exposure duration (ED) for dr inking residential well water supplied to residentsthrough the tap was conservatively estimated at 6 years, starting at the time thatCOPCs were first identified in Parkview Well # 3, to the time that alternative waterwas provided. This length of time is short and could be considered sub-chronicexposure (U.S. EPA,1989). However, to be health conservative, it was assumed to bechronic, and further assumed that a child was exposed to water for this period oftime because children consume more water per kilogram body weight than adultsand so will have a higher estimated intake than adults. Risk estimates will be higherand so will represent more of an upper bound estimate than those using an adultintake and body weight.
• The body weight for the child was 15 kg based on U.S. EPA (2002b).
• The exposure frequency for the child resident was 350 days/year. This frequencywas based on the assumption that an individual would spend all year at one
residence, with the exception of a 2-week vacation elsewhere.
• The carcinogenic averaging time was 365 days per year for 70 years (25,550 days).
• The averaging time for non-carcinogens was 365 times ED.
3.3.3.2 INDOOR AIR EXPOSURE
The indoor air exposure for the residential wells was not evaluated using the residentialwell data, however the indoor air exposure was conservatively assumed to be the sameas the indoor air exposure prepared for Area 3: Future Groundwater Well in the HHRA.The exposure assumptions for the indoor air exposure are based on the futuregroundwater scenario and have been duplicated below. Table C.4.2 of Attachment Cshows the assumptions used to estimate the resident exposure to indoor air volatilizingfrom the groundwater. The exposure assumptions are as follows:
• The exposure point concentration was estimated as described in Section 3.3.1.3 forboth CT and RME exposure scenarios for the future groundwater well, as shown inTable C.3.1 of Attachment C. Indoor air COPC concentrations from groundwaterwere modeled using the J&E model and the RME exposure point concentrations arepresented in Table C.3.1 of Attachment C. A detailed description of the indoor airmodeling is presented in Attachment G.
18925 (21) APPLAnD D-18 CONESTOGA-ROVERS & ASSOCIATES
• The inhalation rate for the child was 10 m3/day for CT and RME (U.S. EPA, 1997),and the inhalation rate for an adult was 20 m3/day for CT and RME (U.S. EPA,
1991).
• The body weight for the child was 15 kg based on U.S. EPA (2002b), and 70 kg for an
adult based on U.S. EPA (2004a).
• The future exposure duration for a resident was assumed to be 30 years: 6 years as a
child and 24 years as an adult for the RME and 9 years: 6 years as a child and 3 yearsas an adult for the CT. For non-carcinogenic, exposure duration was 9 and 30 years
for the CT and RME, respectively for the adult and 6 years for both CT and RME for
the child.
• The exposure frequency for the child and adult resident was 350 days/year. This
frequency was based on the assumption that an individual would spend all year at
one residence, with the exception of a 2-week vacation elsewhere.
• The carcinogenic averaging time was 365 days per year for 70 years (25,550 days).
• The averaging time for non-carcinogens was 365 times 30 years.
18925(21)APPLATTD D-19 CONESTOGA-ROVERS & ASSOCIATES

4.0 TOXICITY ASSESSMENT
The toxicity assessment weighs the available information regarding the potential for a
particular COPC to cause adverse effects in exposed individuals and estimates the extent
of exposure and possible severity of adverse effects. To develop toxicity values, two
steps are taken: hazard identification and dose-response assessment. The hazard
identification determines the potential adverse effects associated with exposure to a
COPC. In the dose-response assessment, numerical toxicity values are determined or
selected from the available toxicity data.
The U.S. EPA (2003) has recommended a hierarchy for the selection of toxicological
criteria in the risk assessment process. This hierarchy was followed, the extent possible,
in th isHHRA:
• Tier 1 -U.S. EPA's IRIS;
• Tier 2 - U.S. EPA's Provisional Peer Reviewed Toxicity Values (PPRTVs); and
• Tier 3 - Other Toxicity Values.
U.S. EPA's Region IX PRG tables (U.S. EPA, 2004b) were used extensively as a Tier 3
source of toxicity values, even though these are considered a secondary source. Other
Tier 3 sources included the U.S. EPA's Health Effects Summary Tables (HEAST, 1997),
the National Center for Exposure Assessment, California EPA and the Agency for Toxic
Substances and Disease Registry (ATSDR, 2005).
As toxicological information becomes available on chemical compounds and elements,
the U.S. EPA will update its IRIS database by withdrawing toxicity values and listing
new ones. Occasionally toxicity values are withdrawn before a replacement value is
approved through the extensive peer review process used by U.S. EPA. For this risk
assessment, the toxicity values for PCE and TCE are impacted by the lack of toxicity
values listed in IRIS because PCE is one of the primary COPCs driving the risks in the
HHRA, and the toxicity values for TCE is high, giving high levels of risk with low levels
of TCE.
The dose-response data for PCE recommended by the U.S. EPA's Office of Solid Waste
and Emergency Response on June 13, 2003 has been used in this HHRA; no value is
available in IRIS. This value is consistent with the California EPA values (OEHHA,
2001). The lack of adequate peer review to list the PCE toxicity in IRIS will increase the
uncertainty in the risk assessment process.
18925 (21) APPLAHD D-20 CONESTOGA-ROVERS & ASSOCIATES

A provisional cancer slope factor for TCE was developed by U.S. EPA in their,
"Trichloroethene Health Risk Assessment: Synthesis and Characterization" (U.S. EPA 2001b).
This document and the associated slope factor have been the subject of controversy and
peer review since it was issued. The potential uncertainty in this risk characterization
and slope factor have been recognized by Region VII, who requested that TCE be
evaluated by the slope factor listed in the risk characterization and the slope factor that
was withdrawn from the IRIS database by U.S. EPA. This value is close to the slope
factor for TCE currently being used by CalEPA (OEHHA, 2002). Using two slope factors
allows for the full range of potential risks to be quantified for TCE.
4.1 NON-CARCINOGENIC HAZARDS
All chemicals have non-carcinogenic effects, or can adversely affect the body at some
level of exposure, even distilled water. Therefore, it is important to determine the level
at which an adverse effect might occur.
For substances that have non-carcinogenic effects, the risk assessment process
distinguishes between acute and chronic exposure, and associated acute and chronic
health effects. In this risk assessment, where exposures are assumed to be chronic,
health criteria are usually expressed as chronic intake levels [in units of milligrams of
COPC per kilogram body weight per day (mg/(kg-day)], and are compared to levels
below which no adverse effects are expected, or a Reference Dose (RfD). In other words,
there is a threshold level of exposure to a COPC below which no toxic effects are
expected. In contrast to the toxicological model used to assess carcinogenic risk, which
assumes there is no concentration threshold, the non-carcinogenic dose-response model
postulates a "threshold".
In this risk assessment, chronic RfDs are used as the toxicity values for non-carcinogenic
health effects. A chronic RfD is defined as, "An estimate (with uncertainty spanning an
order of magnitude or greater) of a daily exposure level for the human population,
including sensitive sub-populations, that is likely to be without appreciable risk of
deleterious effects during a lifetime". Uncertainty factors are incorporated into the RfDs
to account for extrapolations from animal toxicity data, data quality, and to protect
sensitive sub-populations. The basis of a RfD is usually the highest dose level
administered to laboratory animals that did not cause observable adverse effects after
chronic exposure. This is called the No-Observed Adverse Effect Level (NOAEL). The
NOAEL is then divided by uncertainty factors, and sometimes an additional modifying
factor, to obtain the RfD. In general, an uncertainty factor of 10 is used to account for
interspecies variation and another factor of 10 to account for sensitive human
18925 (21) APPLATTD D-21 CONESTOGA-ROVERS & ASSOCIATES
populations. Additional factors of 10 are included in the uncertainty factor if the RfD is
based on the Lowest Observed Adverse Effect Level (LOAEL) instead of the NOAEL, or
if data inadequacies are present (e.g., the experiment for which the RfD was derived had
less than lifetime exposure). The LOAEL is the dose level administered to laboratory
animals that causes the lowest adverse effect (i.e., liver toxicity - although this is species
and chemical-specific) after chronic exposure.
Table 4.1 of the HHRA presents the non-carcinogenic toxicity data (RfDs) used to
estimate human health effects for oral and dermal exposure routes for all exposure
areas. The dermal toxicity data presented in Table 4.1 of the HHRA, was adjusted
consistent with U.S. EPA (2004a) guidance. Table 4.2 of the HHRA presents RfDs used
for the inhalation exposure route for all exposure areas.
4.2 CARCINOGENIC RISKS
Cancer Slope Factors (CSFs) are quantitative dose-response factors used to estimate riskfrom chemicals with potential carcinogenic effects. Slope factors relate the probability of
excess cancers, over background, to the lifetime average exposure dose of a substance.CSFs are typically estimated from animal carcinogenicity study dose-response data
using mathematical extrapolation models, to relate animal exposure at high doses to
potential adverse effects in humans at low dose, and are presented as the reciprocal of
dose risk, or 1 divided by milligram of COPC/(kilogram body weight-day)
[i.e., (mg/kg-day)-1]. U.S. EPA's cancer risk assessment guideline (U.S. EPA, 2005)emphasize that a chemical's mode of action is important when developing cancer slope
factors for chemicals in the IRIS database. The 2005 guidelines also consider weight of
evidence, structure activity relationships and tumor type when evaluating a chemical.
Mathematical models are still proposed to extrapolate high dose animal data to low dose
human effect, but these models will be selected based on a number of chemical-specific
factors.
The slope factors used in this HHRA were developed using guidance from prior to 2005.
Many of these models assume low dose-response linearity and thus may not be
appropriate for some suspected carcinogens, in particular those that function as cancer
promoters, and chemicals that act through threshold mechanisms.
Known or suspect human carcinogens have been evaluated and identified by the
Carcinogen Assessment Group using the U.S. EPA Weight-of-Evidence approach for
carcinogenicity classification (HEAST, 1997). The U.S. EPA classification is based on an
18925 (21) APPLATTD D-22 CONESTOGA-ROVERS & ASSOCIATES
evaluation of the likelihood that the agent is a human carcinogen. The evidence is
characterized separately for human and animal studies as follows:
Group A: Known Human Carcinogen (sufficient evidence of carcinogenicity in
humans);
Group B: Probable Human Carcinogen (Bl - limited evidence of carcinogenicity in
humans; B2 - sufficient evidence of carcinogenicity in animals with
inadequate or lack of evidence in humans);
Group C: Possible Human Carcinogen (limited evidence of carcinogenicity in
animals and inadequate or lack of human data);
Group D: Not Classifiable as to Human Carcinogenicity (inadequate or no
evidence); and
Group E: Evidence of Non-carcinogenicity for Humans (no evidence of
carcinogenicity in animal studies).
The COPCs were classified utilizing the U.S. EPA system. Table 4.3 of the HHRA
presents the cancer toxicity data (CSFs) used in the HHRA to estimate the risk of cancer
for the oral and dermal exposure routes for all exposure areas. The dermal toxicity data
presented in Table 4.3 of the HHRA was adjusted consistent with U.S. EPA (2004a)
guidance. Table 4.4 of the HHRA presents CSFs for the inhalation exposure route for all
exposure areas.
4.3 TOXICOLOGICAL SUMMARIES FOR THE COPCs
A detailed lexicologically summary for the COPCs is provided in Attachment I.
18925(21]APPLATTD ' D-23 CONESTOGA-ROVERS & ASSOCIATES

5.0 RISK CHARACTERIZATION
The objective of this risk characterization is to integrate information developed in theExposure Assessment (Section 3.0), for complete exposure pathways, for detectedCOPCs that exceeded screening levels, and the Toxicity Assessment (Section 4.0) into anevaluation of the potential human health risks associated with exposure to potentiallycontaminated groundwater and air in the area. The methods used in this riskcharacterization are based on U.S. EPA guidance for human exposures (U.S. EPA, 1989,1991a, 1997, 2001, 2002a, 2002b, 2004a).
5.1 HAZARD ESTIMATES
The potential for non-cancer health effects from exposure to a COPC is evaluated bycomparing an exposure level over a specified time period to the RfD for the COPC overa similar exposure period. This ratio, termed the hazard quotient, is calculatedaccording to the following general equation:
RfD
Where:
HQ = The Hazard Quotient (unitless) is the ratio of the exposure dose of achemical to a reference dose not expected to cause adverse effects from alifetime exposure. A hazard quotient equal to or below 1.0 is consideredprotective of human health. O
CDI = The Chronic Daily Intake is the chemical dose calculated by applying theexposure scenario assumptions and expressed as mg/(kg-day). Theintake represents the average daily chemical dose over the expectedperiod of exposure.
RfD = The Reference Dose is a daily dose believed not to cause an adverse effectfrom even a lifetime exposure [mg/(kg-day)J.
COPCs may exert a toxic effect on different target organs, however, for the purposes ofthis risk assessment, non-carcinogenic effects were not differentiated for each targetorgan. This assumption implies that all chemicals act at the same target organ, which
(i) "Wliere the cumulative carcinogenic site risk to nn individual based on reasonable maximum exposure forboth current and future land use is less than 10~4 and the non-carcinogenic hazard quotient is less tlwn 1,action generally is not warranted unless there are adverse environmental impacts." (U.S. EPA, 1991)
18925 (21) APPLATTD D-24 CONESTOGA-ROVERS & ASSOCIATES

may not be the case, and is a default assumption. This summation is called the Hazard
Index (HI) and is the sum of HQs for individual COPCs for a specific exposure scenario.
The His presented in Section 5.3 only sum the non-carcinogenic effects by target organ.
Non-cancer risk estimates for only children (6-years of exposure) were estimated as the
exposure duration was only 6 years and the child was considered to be the most
sensitive receptor. For context, the risk estimates developed using this algorithm were
compared to U.S. EPA risk range:
5.2 CANCER RISK ESTIMATES
Cancer risk estimates are calculated utilizing the following general equation:
Excess Lifetime Cancer Risk = LADD x CSF
Where:
Cancer Risk = Estimated upper bound on additional risk of cancer over a lifetime
in an individual exposed to the carcinogen for a specified
exposure period (unitless).
LADD = The Lifetime Average Daily Dose of the chemical calculated using
exposure scenario assumptions and expressed in mg/(kg-day).The intake represents the total lifetime chemical dose averaged
over an individual expected lifetime of 70 years.
CSF = The Cancer Slope Factor models the potential carcinogenic
response and is expressed as [mg/(kg-day)]-1.
Exposure scenarios may involve potential exposure to more than one carcinogen. To
represent the potential carcinogenic effects posed by exposure to multiple carcinogens, it
is assumed, in the absence of information on synergistic or antagonistic effects, that
these risks are additive. For estimating cancer risks from exposure to multiple
carcinogens from a single exposure route, the following equation is used:
18925 (21) APPLATTD D-25 CONESTOGA-ROVERS & ASSOCIATES
NRiskT =
Where:
Riskj = Total cancer risk from route of exposure
Riski = Cancer risk for the chemical
N = Number of chemicals
The cumulative potential carcinogenic risk estimates are presented and discussed in
Section 5.3. Risk estimates were for a child (6 years) only exposure as the exposure
duration was only 6 years and the child was the most sensitive receptor. The potential
cumulative risks resulting from exposure to the COPCs are compared to the target
cumulative target risk range provided by U.S. EPA of 1 x 1CH or 1 in 10,000 to 1 x 10⁻⁶ or
1 in 1,000,000, as indicated by U.S. EPA, "Wliere the cumulative carcinogenic site risk to an
individual based on reasonable maximum exposure for both current and future land use is less
than 10'4 and the non-carcinogenic hazard quotient is less than 1, action generally is not
warranted unless there are adverse environmental impacts." (U.S. EPA, 1991)
5.3 RISK QUANTIFICATION SUMMARY
The hazard indices and excess lifetime cancer risks for the various exposure scenarios
for each area evaluated in the risk assessment are presented below. Note that only
media and exposure pathways for which the COPCs were detected have been included.
Past groundwater exposure risk estimates were developed by assuming that a resident
ingested the water, was exposed to the COPCs from the use of water (showering,
washing clothes and dishes, etc.) through dermal contact and from the inhalation ofindoor air vapors. Inhalation of vapors migrating from groundwater to indoor air as a
result of vapor intrusion was also evaluated. Exposure is assumed to occur at the rates
specified in the exposure assessment section of the text. The excess lifetime cancer risk
and the non-cancer risks for a child were estimated, as shown in Table D.7.1A.CT,
Table D.7.1A.RME, Table D.7.1B.CT, and Table D.7.1B.RME and summarized below.
These tables show both the risks for each COPC by pathway and for all COPCs as a sum
of all exposure pathways quantified for this receptor for both RME and CT exposures.
Risk estimates are provided for two Cancer Slope Factors for TCE.
18925 (21) APPL ATTD D-26 CONESTOGA-ROVERS & ASSOCIATES
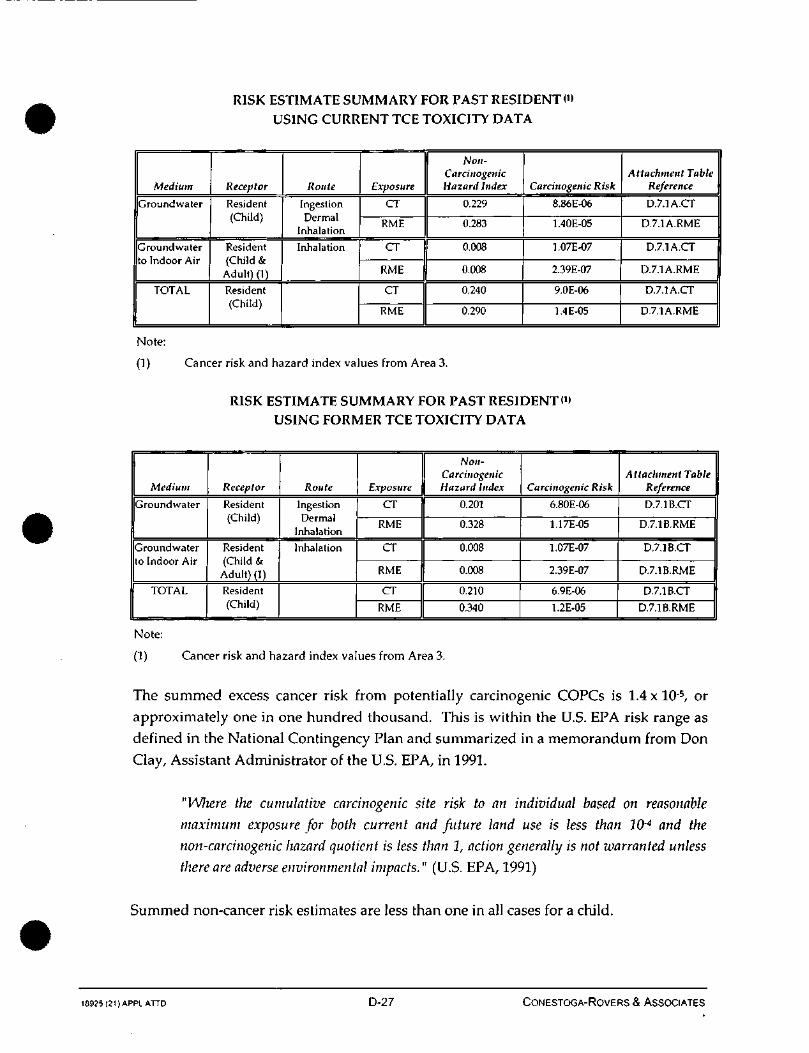
RISK ESTIMATE SUMMARY FOR PAST RESIDENT 0)USING CURRENT TCE TOXICITY DATA
Medium
Groundwater
Groundwaterto Indoor Air
TOTAL
Receptor
Resident(Child)
Resident(Child &
Adul t ) (1)
Resident(Child)
Route
IngestionDermal
Inhalation
Inhalation
Exposure
CT
RME
CT
RME
CT
RME
Non-CarcinogenicHazard Index
0.229
0.283
0.008
0.008
0.240
0.290
Carcinogenic Risk
8.86E-06
1.40E-05
1.07E-07
2.39E-07
9.0E-06
1.4E-05
Attachment TableReference
D.7.1A.CT
D.7.1A.RME
D.7.1A.CT
D.7.1A.RME
D.7.1A.CT
D.7.1A.RME
Note:
(1) Cancer risk and hazard index values from Area 3.
RISK ESTIMATE SUMMARY FOR PAST RESIDENT!1)USING FORMER TCE TOXICITY DATA
Medium
Groundwater
Groundwaterto Indoor Air
TOTAL
Receptor
Resident(Child)
Resident(Child &
Adult) (1)
Resident(Child)
Route
IngestionDermal
Inhalation
Inhalation
Exposure
CT
RME
CT
RME
CT
RME
1 Non-CarcinogenicHazard Index
1 0.201
0.328
0.008
0.008
0.210
0.340
Carcinogenic Risk
6.80E-06
1.17E-05
1.07E-07
2.39E-07
6.9E-06
1.2E-05
Attachment TableReference
D.7.1B.CT
D.7.1B.RME
D.7.1B.CT
D.7.1B.RME
D.7.1B.CT
D.7.1B.RME
Note:
(1) Cancer risk and hazard index values from Area 3.
The summed excess cancer risk from potentially carcinogenic COPCs is 1.4xlO-5, or
approximately one in one hundred thousand. This is within the U.S. EPA risk range as
defined in the National Contingency Plan and summarized in a memorandum from Don
Clay, Assistant Administrator of the U.S. EPA, in 1991.
"Wliere the cumulative carcinogenic site risk to an individual based on reasonable
maximum exposure for both current and future land use is less than 2CH and the
non-carcinogenic hazard quotient is less than 1, action generally is not warranted unless
there are adverse environmental impacts." (U.S. EPA, 1991)
Summed non-cancer risk estimates are less than one in all cases for a child.
18925 (21 (APPLATTD D-27 CONESTOGA-ROVERS & ASSOCIATES
Excess risks for CT exposures are less than that for the RME, and the risks calculated
using the 1987 CSF for TCE are also less.
TCE was detected in one sample at an estimated concentration of 0.00016 mg/L and this
estimated concentration gives a risk of 2.3 x 10'6 (summed across the ingestion, dermal
contact, and inhalation of ambient indoor air). PCE is responsible for the majority of the
risks from groundwater. The RME risk from PCE is 9.8 x 10⁻⁶ (summed across the
ingestion, dermal contact, and inhalation of ambient indoor air). Ingestion is the
exposure pathway that has the greatest risk.
5.4 UNCERTAINTY ANALYSIS
There are a number of uncertainties in the risk assessment process. These have been
described in Section 5.6 of the HHRA and will not be repeated in this Attachment.
18925(21)APPLATTD D-28 CONESTOGA-ROVERS & ASSOCIATES
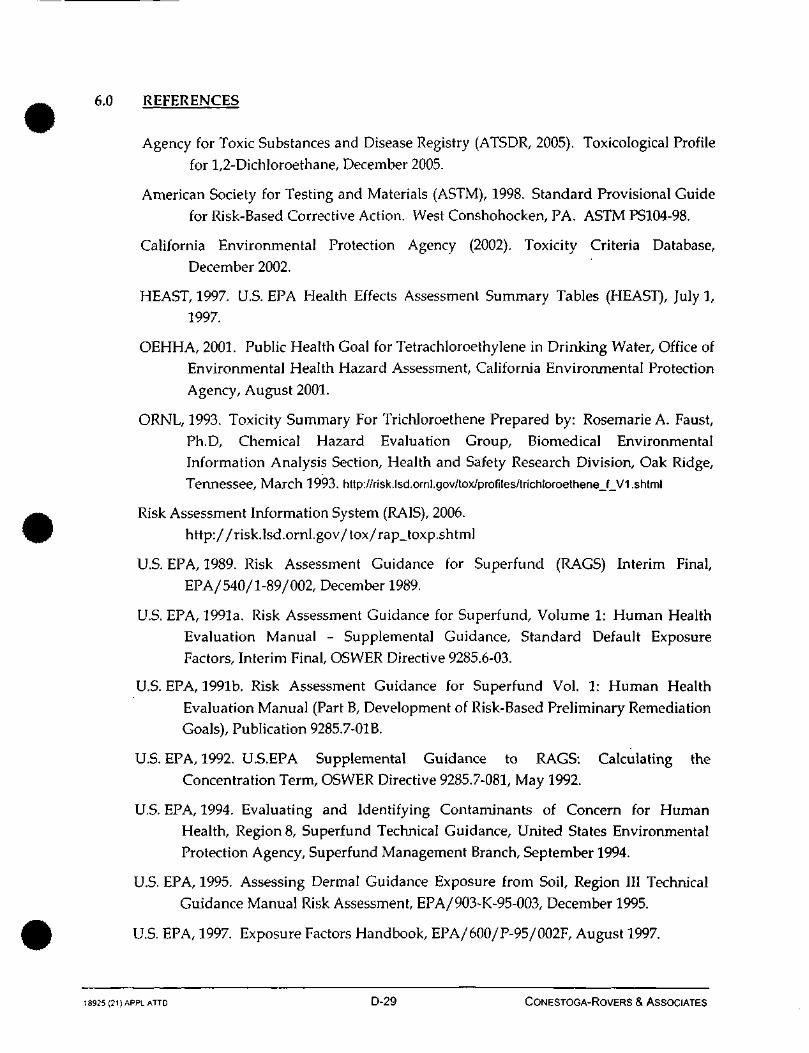
6.0 REFERENCES
Agency for Toxic Substances and Disease Registry (ATSDR, 2005). Toxicological Profile
for 1,2-Dichloroethane, December 2005.
American Society for Testing and Materials (ASTM), 1998. Standard Provisional Guide
for Risk-Based Corrective Action. West Conshohocken, PA. ASTM PS104-98.
California Environmental Protection Agency (2002). Toxicity Criteria Database,
December 2002.
HEAST,1997. U.S. EPA Health Effects Assessment Summary Tables (HEAST), July 1,
1997.
OEHHA, 2001. Public Health Goal for Tetrachloroethylene in Drinking Water, Office of
Environmental Health Hazard Assessment, California Environmental Protection
Agency, August 2001.
ORNL, 1993. Toxicity Summary For TrichJoroethene Prepared by: Rosemarie A. Faust,
Ph.D, Chemical Hazard Evaluation Group, Biomedical Environmental
Information Analysis Section, Health and Safety Research Division, Oak Ridge,
Tennessee, March 1993. http://risk.lsd.ornl.gov/tox/profiles/trichloroethene_f_V1.shtml
Risk Assessment Information System (RAIS), 2006.http://risk.lsd.ornl.gov/tox/rap_toxp.shtml
U.S. EPA, 1989. Risk Assessment Guidance for Superfund (RAGS) Interim Final,
EPA/540/1-89/002, December 1989.
U.S. EPA, 1991a. Risk Assessment Guidance for Superfund, Volume 1: Human Health
Evaluation Manual - Supplemental Guidance, Standard Default Exposure
Factors, Interim Final, OSWER Directive 9285.6-03.
U.S. EPA, 1991b. Risk Assessment Guidance for Superfund Vol. 1: Human Health
Evaluation Manual (Part B, Development of Risk-Based Preliminary Remediation
Goals), Publication 9285.7-01B.
U.S. EPA, 1992. U.S.EPA Supplemental Guidance to RAGS: Calculating the
Concentration Term, OSWER Directive 9285.7-081, May 1992.
U.S. EPA, 1994. Evaluating and Identifying Contaminants of Concern for Human
Health, Region 8, Superfund Technical Guidance, United States Environmental
Protection Agency, Superfund Management Branch, September 1994.
U.S. EPA, 1995. Assessing Dermal Guidance Exposure from Soil, Region III Technical
Guidance Manual Risk Assessment, EPA/903-K-95-003, December 1995.
U.S. EPA, 1997. Exposure Factors Handbook, EPA/600/P-95/002F, August 1997.
18925 (21) APPLATTD D-29 CONESTOGA-ROVERS & ASSOCIATES

U.S. EPA, 1998. Office of Solid Waste and Emergency Response (OSWER). Clarification
to the 1994 Revised Interim Soil Lead Guidance for CERCLA Sites and RCRA
Corrective Action Facilities. OSWER Directive No. 9200.4-27P. Washington, DC.
U.S. EPA, 1999. Derivation of a Volatilization Factor to estimate upper bound exposure
point concentrations for a worker in trenches flooded with water off-gassing
volatile organic chemicals, Memorandum from Helen Dawson to Tracy Eagle,
8EPR-PS, U.S. EPA Region VIII, July 1999.
U.S. EPA, 2000. Supplemental Guidance to RAGS: Region 4 Bulletins, Human Health
Risk Assessment Bulletins. EPA Region 4, originally published November 1995,
Website version last updated May 2000:
http://www.epa.gov/region4/waste/oftecser/healtbul.htm
U.S. EPA, 2001 a. Risk Assessment Guidance for Superfund, Volume 1: Human Health
Evaluation Manual (Part D, Standardized Planning, Reporting, and Review of
Superfund Risk Assessments) Interim, Publication 9285.7-01D, December 2001.
U.S. EPA, 2001b. Trichloroethene Health Risk Assessment: Synthesis andCharacterization. Office of Research and Development, EPA/600/P-01/002A,
August 2001.
U.S. EPA, 2002a. Vapor Intrusion to Indoor Air Pathway from Groundwater and Soils,
OSWER, EPA530-D-02-004, November 2002.
U.S. EPA, 2002b. Child-Specific Exposure Factors Handbook, September.
U.S. EPA, 2002c. Supplemental Guidance for Developing Soil Screening Levels for
Superfund Sites, OSWER 9355.4-24, December 2002.
U.S.EPA, 2002d. Calculating Upper Confidence Limits for Exposure Point
Concentrations at Hazardous Waste Sites, Office of Emergency and RemedialResponse, OSWER 9285.6-10, December 2002.
U.S. EPA, 2004a. U.S. EPA Risk Assessment Guidance for Superfund, Volume 1, Human
Health Evaluation Manual, Part E: Supplemental Guidance for Dermal Risk
Assessment, EPA/540/R/99/005, July 2004.
U.S. EPA, 2004b. Region IX PRG tables, October 2004.
U.S.EPA, 2004c. ProUCL User's Guide, version 3.0, April 2004.
U.S. EPA, 2004d. Region VII Fact Sheet for the Parkview Wells, 2004.
U.S. EPA, 2005a. Guidelines for Carcinogen Risk Assessment, Risk Assessment Forum,
EPA/630/P-03/001F, March 2005.
18925(21)APPLATTD D-30 CONESTOGA-ROVERS & ASSOCIATES

U.S. EPA, 2005b. Application of New Cancer Guidelines, Memorandum from the
Administrator to assistant Administrators, March 29, 2005.
U.S. EPA, 2005c. Personal Communication: Region VII, December 2005.
U.S. EPA, 2006. U.S. EPA Integrated Risk Information System, January 2006
(www.epa.gov/iris).
18925 (21JAPPLATTD D-31 CONESTOGA-ROVERS & ASSOCIATES

PRIMARYSOURCE
RELEASEMECHANISM
SECONDARYSOURCE
TERTIARYSOURCE
EXPOSURE ROUTE RECEPTOR CHARACTERIZATION
GROUNDWATER(SOUTHERN PLUME)
DIRECT CONTACT
VOLATILIZATION
INGESTIONDERMAL CONTACT
INHALATION OFVAPORS
INHALATION OFVAPORS
-c-c
POTENTIALLY EXPOSED RECEPTORS
LEGEND
POTENTIALLY COMPLETE EXPOSURE PATHWAY
figure D.1.1
CONCEPTUAL SITE MODEL: RESIDENTIAL WELLSPARKVIEW WELL SITE - NORTHERN STUDY AREA
Grand Island, Nebraska
18925-10(021)GN-WA050 MAY 31/2006
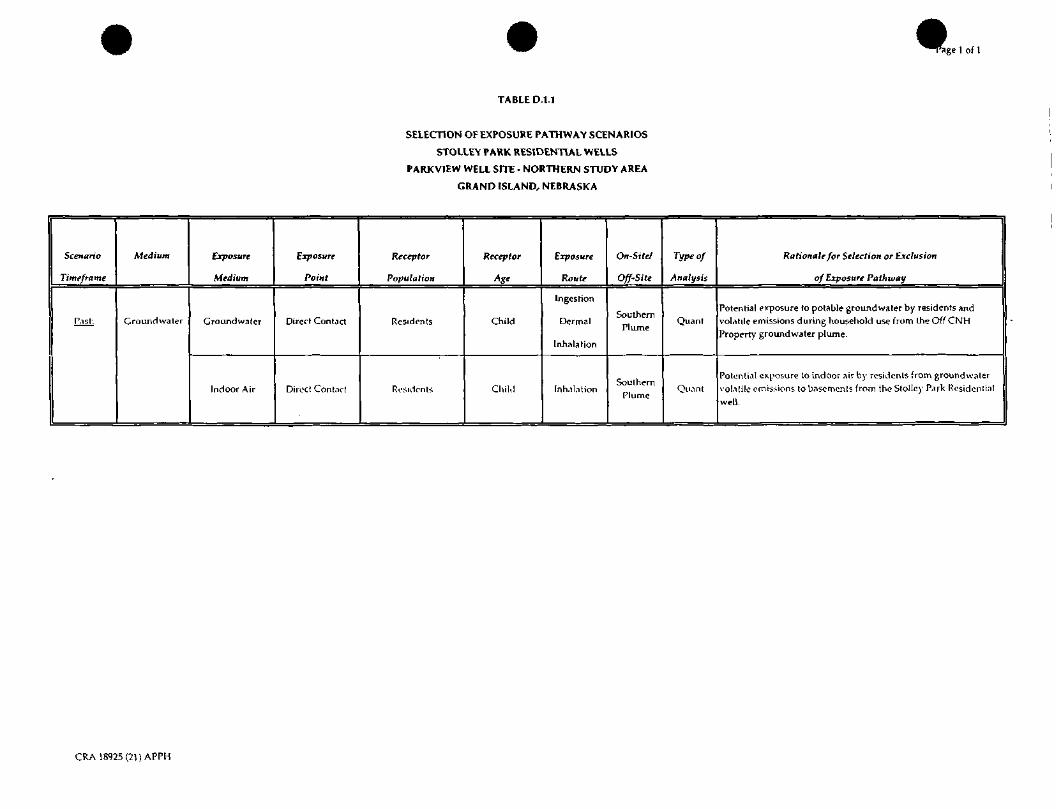
'age 1 of 1
TABLE D.I.I
SELECTION OF EXPOSURE PATHWAY SCENARIOS
STOU.EY PARK RESIDENTIAL WELLS
PARKVIEW WELL SITE - NORTHERN STUDY AREA
GRAND ISLAND, NEBRASKA
Scenario
Timeframe
Past:
Medium
Groundwater
Exposure
Medium
Groundwater
Indoor Air
Exposure
Point
Direct Contact
Direct Contact
Receptor
Population
Residents
Residents
Receptor
Age
Child
Child
Exposure
Route
Ingesrion
Dermal
Inhalation
Inh.ibtion
On-Sitel
Off-Site
Plume
Plume
Type of
Analysis
Quant
Qu.inl
Rationale for Selection or Exclusion
of Exposure Pathway
Potential exposure to potable groundwater by residents andvolatile emissions during household use from the Off CNHProperty groundwater plume.
Potential exposure to indoor air by residents from groundwatervola t i l e emissions to basement? from the Stollcy Park Resident ia lwell.
CRA 18925(21) APPH
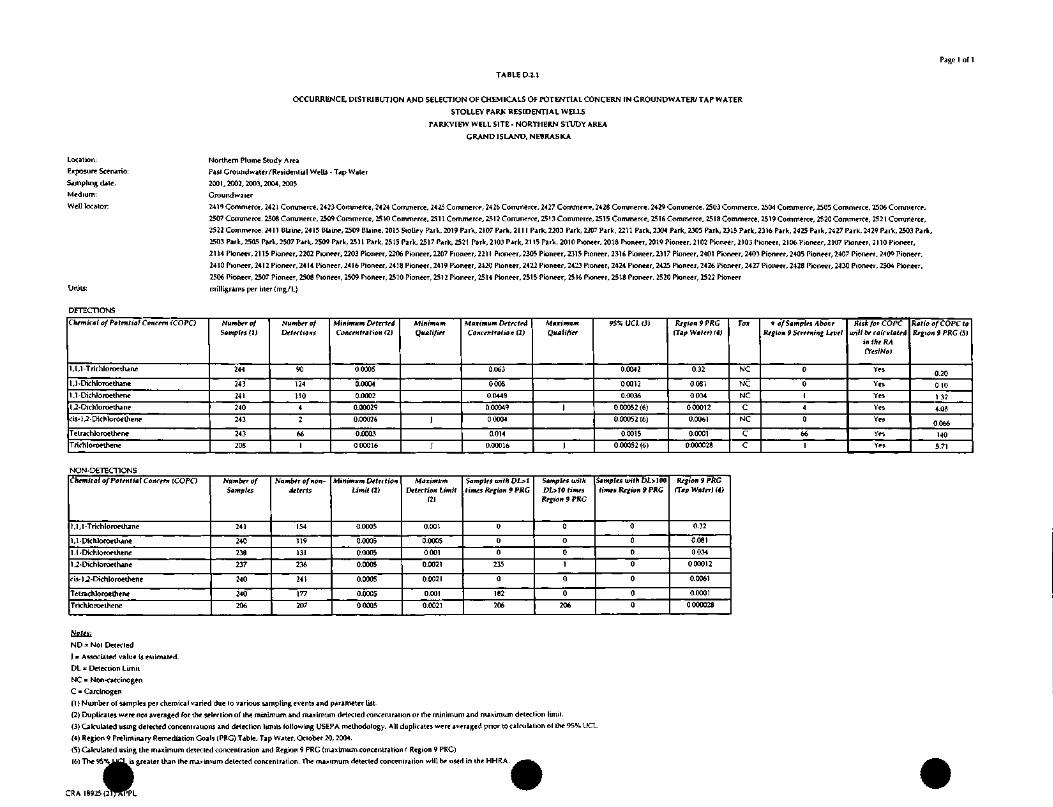
Page 1 of 1
STOLLEY PARK RESIDENTIAL WELLS
PARKVIEW WELL SITE - NORTHERN STUDY AREA
GRAND ISLAND, NEBRASKA
Location:
Exposure Scenario:
Sampling date:
Medium:
Well locator
Northern Plume Study Area
Past Groundwaler/Residential Wells - Tap Water
2001,2002, 2003, 2004, 2005
Groundwater
2419 Commerce, 2421 Commerce, 2423 Commerce, 2424 Commerce, 2425 Commerce, 2426 Commerce, 2427 Commerce, 2428 Commerce, 2429 Commerce, 2503 Commerce, 2504 Commerce, 2505 Commerce, 2506 Commerce,
2507 Commerce, 2508 Commerce, 2509 Commerce, 2510 Commerce, 2511 Commerce, 2512 Commerce, 2513 Commerce, 2515 Commerce, 2516 Commerce, 2518 Commerce, 2519 Commerce, 2520 Commerce, 2521 Commerce,
2522 Commerce. 2411 Blaine. 2415 Elaine, 2509 BUine, 2015 SloLey Park, 2019 Park, 2107 Park, 2111 Park, 2203 Park, 2207 Park. 2211 Park, 2304 Park, 2305 Park, 2315 Park, 2316 Park, 2425 Park, 2427 Park, 2429 Park, 2503 Park,
2503 Park, 2505 Park, 2507 Park, 2509 Park, 2511 Park, 2515 Park, 2517 Park, 2521 Park, 2103 Park, 2115 Park, 2010 Pioneer, 2018 Pioneer, 2019 Pioneer, 2102 Pioneer, 2103 Pioneer, 2106 Pioneer, 2107 Pioneer, 2110 Pioneer,
2114 Pioneer, 2115 Pioneer, 2202 Pioneer, 2203 Pioneer, 2206 Pioneer, 2207 Pioneer, 2211 Pioneer, 2305 Pioneer, 2315 Pioneer, 2316 Pioneer, 2317 Pioneer, 2401 Pioneer, 2403 Pioneer, 2405 Pioneer, 2407 Pioneer, 2409 Pioneer,
2410 Pioneer, 2412 Pioneer, 2414 Pioneer, 2416 Pioneer, 2418 Pioneer, 2419 Pioneer, 2420 Pioneer, 2422 Pioneer, 2423 Pioneer, 2424 Pioneer, 2425 Pioneer, 2426 Pioneer, 2427 Pioneer, 2428 Pioneer, 2430 Pioneer, 2504 Pioneer,
2506 Pioneer, 2507 Pioneer, 2508 Pioneer, 2509 Pioneer, 2510 Pioneer, 2512 Pioneer, 2514 Pioneer, 2515 Pioneer, 2516 Pioneer, 2518 Pioneer, 2520 Pioneer, 2522 Pioneer
milligrams per liter (mg/L)
DETECTIONS
Chemical of Potential Concern fCOPO
1 , 1 ,1 -T richloroethj ne
1,1-Dichlo roe thane
1,1-Dichloroethene
1 ,2-Dichloroethane
cis- 1 ,2-Dichloroethene
Tetrachloroelhene
Trichloroethene
Number ofSamples (1)
244
243
241
240
243
243
208
Number ofDefections
90
124
110
4
2
66
1
Minimum DetectedConcentration 12)
0.0005
0.0004
0.0002
0.00029
0.00026
0.0003
000016
MinimumQualifier
I
J
Minimum DetectedConcentration (2)
0.063
0.008
0.0448
0.00049
0.0004
0.014
0.00016
MaximumQualifier
\
}
95% UCL 13)
0.0042
00012
0.0036
0.00052 (6)
0.00052 (6)
0.0015
0.00052 (6)
Region 9 PRG(Tap Water) U)
0.32
0.081
0.034
000012
0.0061
0.0001
0.000028
To»
NC
NC
NC
C
NC
C
C
• of Samples AboveRegion 9 Screening Level
0
0
1
4
0
66
1
KisJcforCOPCwill be calculated
in Ike R.I(YesINo)
Yes
Yes
Yes
Yes
Yes
Yes
Yes
Ratio of COPC toRegion 9 PRG (5)
0.20
0.10
1 32
4.08
0.066
140
5.71
NON-DETECTIONSOiemir al of Potential Concern fCOPO
1 ,1 ,1 -Trichloroethane
1,1 Dichloroelhane
1,1-Dichloroethene
1.2-Dichloroelrune
cis- 1 ,2-Dichloroethene
TetrachJoroelhene
Trichloroethene
Number ofSamples
241
240
238
237
240
240
206
Number of non-dttects
154
119
131
236
241
177
207
Minimum DetectionLimit (2)
0.0005
0.0005
0.0005
0.0005
0.0005
0.0005
0.0005
MaximumDetection Limit
12)
0.001
0.0005
0.001
0.0021
0.0021
0.001
0.0021
Samples with DL>1times Region 9 PRG
0
0
0
235
0
182
206
Samples withDL>10 timesRegion 9 PRO
0
0
0
1
0
0
206
Samples with DL*100times Region 9 PRG
0
0
0
0
0
0
0
Region 9 PRG(Tap Water) (4)
0.32
0.081
0.034
000012
0.0061
0.0001
0.000028
Notes:
ND = Not Detected
] = Associated value is estimated.
DL = Detection Limit
NC «= Non-carcinogen
C = Carcinogen
(1) Number of samples per chemical varied due to various sampling events and parameter list.
(2) Duplicates were not averaged for the selection of the minimum and maximum detected concentration or the minimum and maximum detection limit.
(3) Calculated using detected concentrations and detection limits following USEPA methodology. All duplicates were averaged prior to calculation of the 95% UCL.
(4) Region 9 Preliminary Remediation Goals (PRG) Table, Tap Water, October 20, 2004.
(5) Calculated using the maximum detected concentration and Region 9 PRG (maximum concentration/ Region 9 PRC)
(6) The 95%^fiLis greater than the maximum detected concentration. The maximum detected concentration will be used in the HHRA.
CRA 18925 (2
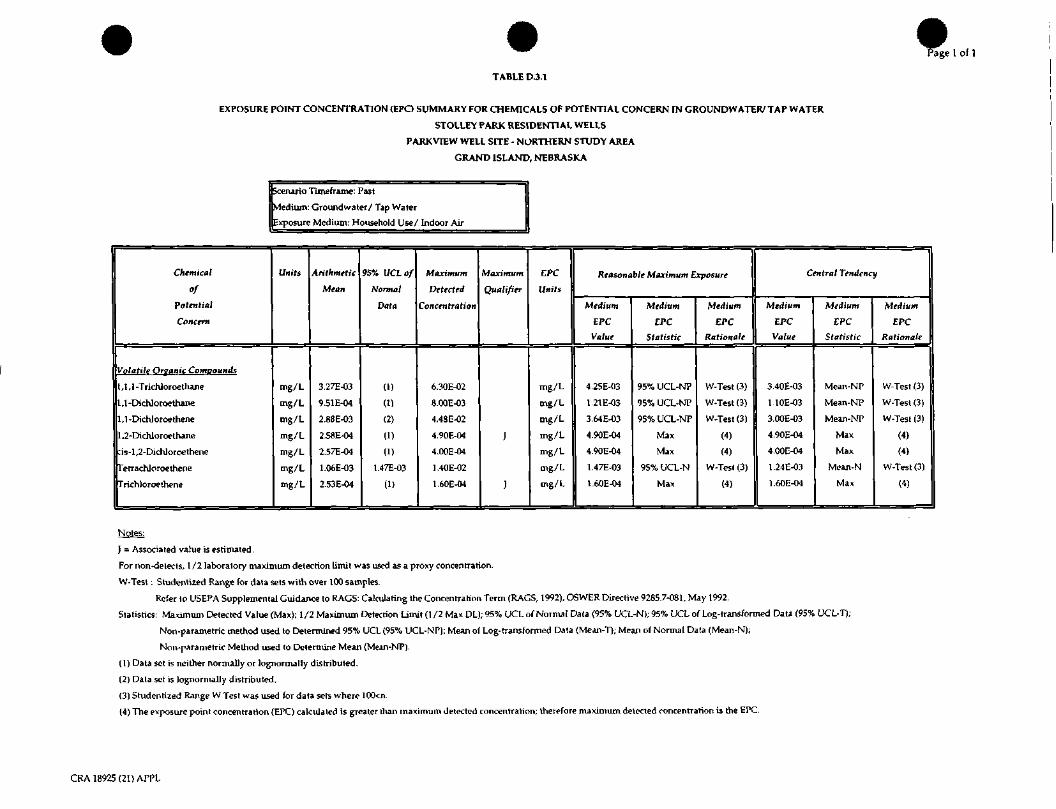
Page'age 1 of 1
TABLE D.3.1
STOLLEY PARK RESIDENTIAL WELLS
PARKVIEW WELL SITE - NORTHERN STUDY AREA
GRAND ISLAND, NEBRASKA
Scenario Timeframe: Past
Medium: Groundwater/ Tap Water
Exposure Medium: Household Use/ Indoor Air
Chemical
of
Potential
Concern
Volatile Organic Compounds
1 ,1 ,1 -Trichloroe thane
1,1-Dichloroe thane
1,1-DichJoroethene
1,2-Dichloroe thane
:is-l,2-Dichloroethene
Ferrachloroethene
rrichloroethene
Units
mg/L
mg/L
mg/L
mg/L
mg/L
mg/L
mg/L
Arithmetic
Mean
3.27E-03
9.51E-04
2.88E-03
2.58E-04
2.57E-04
1.06E-03
2.53E-04
95% UCLof
Normal
Data
(1)
(1)
(2)
(1)
(1)
1.47E-03
(1)
Maximum
Detected
Concentration
6.30E-02
8.00E-03
4.48E-02
4.90E-04
4.00E-04
1.40E-02
1.60E-04
Maximum
Qualifier
J
J
EPC
Units
mg/L
mg/L
mg/L
mg/L
mg/L
mg/L
mg/L
Reasonable Maximum Exposure
Medium
EPC
Value
4.25E-03
1.21E-Q3
3.64E-03
4.90E-04
4.90E-04
1 .47E-03
1.60E-04
Medium
EPC
Statistic
95% UCL-NP
95% UCL-NP
95% UCL-NP
Max
Max
95% UCL-N
Max
Medium
EPC
Rationale
W-Test (3)
W-Test (3)
W-Test (3)
(4)
(4)
W-Test (3)
(4)
Central Tendency
Medium
EPC
Value
3.40E-03
1.10E-03
3.00E-03
4.90E-04
4.00E-04
1.24E-03
1.60E-04
Medium
EPC
Statistic
Mean-NP
Mean-NP
Mean-NP
Max
Max
Mean-N
Max
Medium
EPC
Rationale
W-Test (3)
W-Test (3)
W-Test (3)
(4)
(4)
W-Test (3)
(4)
Notes:
J = Associated value is estimated.
For non-detects, 1/2 laboratory maximum detection limit was used as a proxy concentration.
W-Test: Studenrized Range for data sets with over 100 samples.
Refer to USEPA Supplemental Guidance to RAGS: Calculating the Concentration Term (RAGS, 1992), OSWER Directive 9285.7-081, May 1992.
Statistics: Maximum Detected Value (Max); 1 /2 Maximum Detection Limit (1 /2 Max DL); 95% UCL of Normal Data (95% UCL-N); 95% UCL of Log-transformed Data (95% UCL-T);
Non-parametric method used to Determined 95% UCL (95% UCL-NP); Mean of Log-transformed Data (Mean-T); Mean of Normal Data (Mean-N);
Non-parametric Method used to Determine Mean (Mean-NP).
(1) Data set is neither normally or lognormally distributed.
(2) Data set is lognormally distributed.
(3) Srudentized Range W Test was used for data sets where 100<n.
(4) The exposure point concentration (EPC) calculated is greater than maximum detected concentration; therefore maximum detected concentration is the EPC.
CRA 18925 (21) APPL
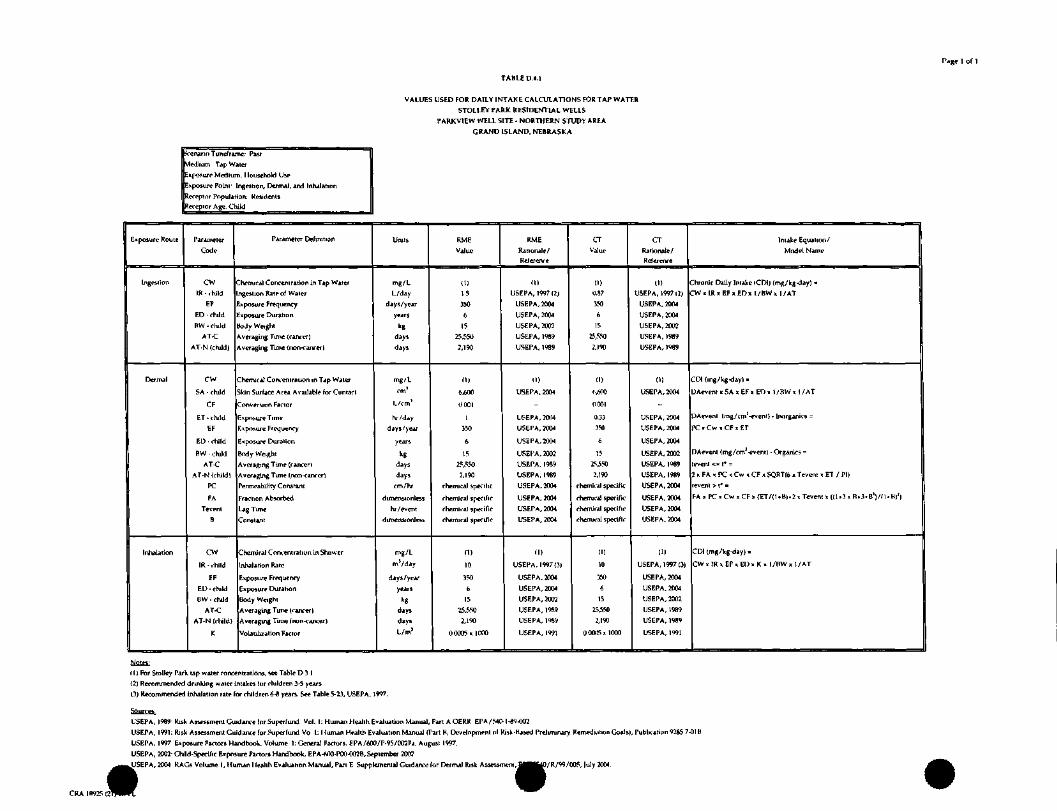
TABLE D.4.1
Page 1 of 1
VALUES USED FOR DAILY INTAKE CALCULATIONS FOR TAP WATER
STOLLEY PARK RESIDENTIAL WELLS
PARKVIEW WELL SITE - NORTHERN STUDY AREA
GRAND ISLAND, NEBRASKA
venarin Timeframc: Past
Medium Tap Water
Exposure Medium. Household Use
Exposure Point: Ingestion, Dermal, and Inhalation
Receptor Population: Residents
Receptor Age. Child
Exposure Route
Ingest ion
Dermal
Inhalation
Parameter
Code
cw1R - child
EF
ED -child
RW -child
AT-C
AT-N (child)
CW
SA - child
CF
ET - child
EF
ED - child
PW - child
AT-C
AT-N (child)
PC
FA
Tevpnt
B
CW
IR - t-hild
EF
ED - child
BW - child
AT-C
AT-N (child)
K
Parameter Definition
Chemical Concentration in Tap Water
ngestion Rate of Water
Lxposure Frequency
xpo&ure Duration
BoJy Weight
Averaging Time (canrer)
Averaging Time (non-cancer)
Chemical Concentration in Tap Water
Skin Surface Area Available for Contact
Conversion Factor
Exposure Time
F.xposure Frequency
Exposure Duration
Body Weight
Averaging Time (cancer)
Averaging Time (non-cancer)
Permeability Constant
Fraction Absorbed
Lag Time
Constant
Chemical Concentration in Shower
Inhalation Rate
Exposure Frequency
Exposure Duration
Body Weigh!
Averaging Time (canrer)
Averaging Time (non-cancer)
Volatilization Factor
Units
mg/L
L/day
days/year
years
kgdays
days
mg/L
cm1
L/cm1
hi/day
days /year
years
«gdays
day,
cm/hr
d imeraionless
hr/event
dimension] ess
mg/L
mVday
days /year
years
kgdays
days
L/m'
RME
Value
(1)
15
350
6
15
25,550
2,190
(1)
6*00
0001
1
350
6
15
25,550
2,190
chemical specific
chemical specific
chemical specific
chemical specific
111
10
350
6
15
25,550
2,190
0.0005 x 1000
RME
Rationale/Reference
(1)
USEPA, 1997(2)
USEPA, 2004
USEPA, 2004
USEPA, 2002
USEPA, 1989
U5EPA, 1989
(1)
USEPA, 2004
-
USEPA, 2004
USEPA, 2004
USEPA, 2004
USEKA, 2002
USEPA, 1989
USEPA, 1989
USEPA, 2004
USEPA, 2004
USEPA, 2004
USEPA, 2004
(1)
USEPA, 1997(3)
USEPA, 2004
USEPA, 2004
USEPA, 2002
USEPA, 19R9
USEPA, 1989
USEPA, 1991
CT
Value
d)0.87
350
6
15
25,550
2,190
(1)
lv«O
H 001
0.33
3W
6
15
25.550
3,190
chemii al specific
chemical specific
chemical specific
chemical specific
(1)
10
350
6
15
25350
2,190
OOOC15> 1000
CTRationale/Reference
(1)
USEPA, 1997(2)
USEPA, 2004
USEPA, 2004
USEPA, 2002
USEPA, 1989
USEPA, 1989
(11
USEPA.2004
-
USEPA, 2004
USEPA, 2004
USEPA, 2004
USEPA, 2002
USEPA, 1989
USEPA, 1989
USEPA, 2004
USEPA, 2004
USEPA, 2004
USEPA, 2004
(1)
USEPA, 1997(3)
USEPA, 2004
USEPA, 2004
USEPA, 2002
USEPA, 1989
USEPA, 1989
USEPA, 1991
Intake Equation/
Model Name
hronic Daily Imalte (GDI) (mg/kg-day) =
C W x l R x E F x E D x l /BWx I/AT
CDI (mg/kg-day) =
UAevenl x SA x EF x ED x 1 /BW x 1 /AT
DAevent (mg/cm3-event) - Inorganics -
PC x Cw x CF x ET
DAevent (mg/cm'-evcnO - Organic* =
tevent <= r* =
2 x FA x PC x Cw x CF x SQRT(6 x Tevent x ET / PI)
tevent > f =
FA x PC x Cw x CF x (ET/(1»B).2 x Tevent x ((1.3 x B.3.B')/(I.H)')
CDI (mg/kg^ay) =
CW x IR x EF x ED x K x 1 /BW x 1 /AT
CRA IR925(2(2rPIK
(1) For Stolley Park, tap water concentrations, see Table D 3 1.
(2) Recommended drinking water intakes for children 3-5 years
(3) Recommended InhaJation rate for children 6-8 years. See Table 5-23, USEPA, 1997.
Source^
L'SEPA, 1989 Risk AssesBment Guidance for Superfund Vol. 1: Human Health Evaluation Manual, Part A OERR EPA /MO-1-89-002.
USEPA, 1991: Rjsk Assessment Guidance for Superfund Vo 1: Human Health Evaluation Manual (Part H, Development of Risk-Hased Preliminary Rcmedi.ition Goals), Publication 9285 7-01 B.
USEPA, 1997. Exposure Factors Handbook. Volume 1: General Factors. EPA/600/P-95/002Fa. August 1997.
USEPA, 2002: Child-Specific Exposure Factors Handbook, EPA-WW-POO-002B, September 2002
USEPA, 2004 RAGs Volume 1, Human I lealth Evaluation Manual, Part E Supplemental Guidance for Dermal Risk Assessment, Hg^O/R/99/005, |uly 2004.
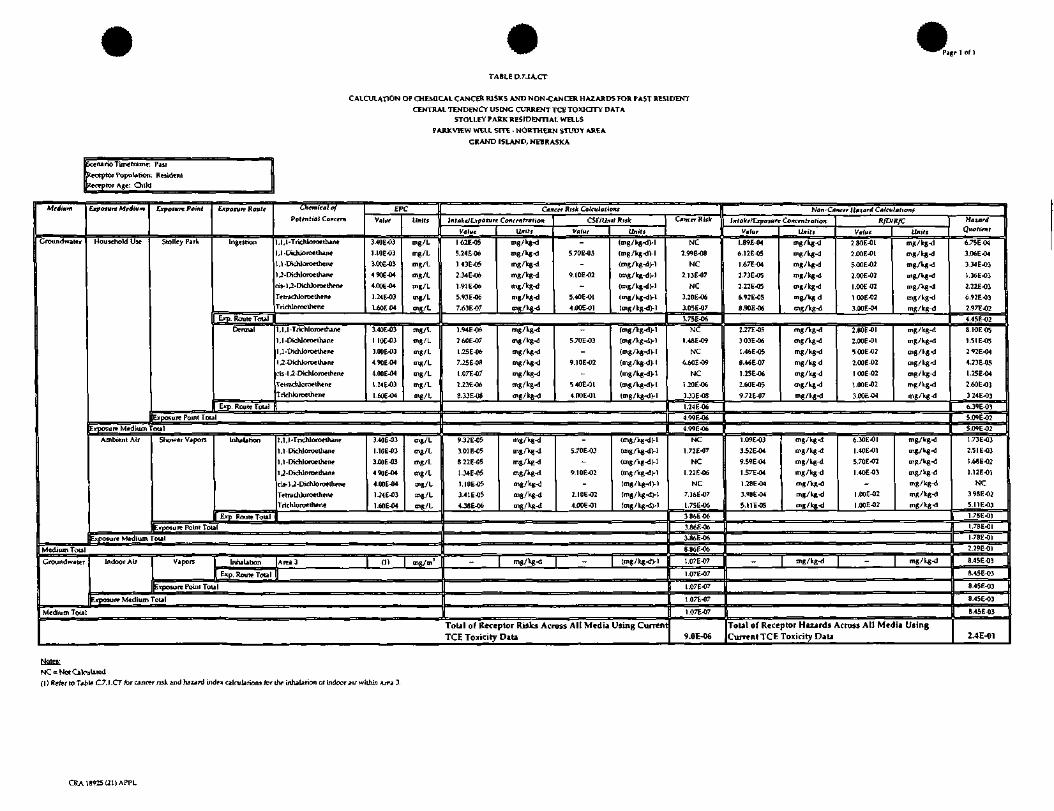
Page 1 Ol ]
TABLE D.7.1A.CT
CALCULATION OF CHEMICAL CANCER RISKS AND NON-CANCER HAZARDS TOR PAST RESIDENTCENTRAL TENDENCY USING CURRENT TCE TOJdOTY DATA
STOLLEY PARK RESIDENTIAL WELLS
PARKVIEW WELL SITE - NORTHERN STUDY AREA
GRAND ISLAND, NEBRASKA
Scenario Timetrame: Past
KeceptoT Population: ResidentReceptor Age: Child
Medium
Groundwater
Medium Tou
Groundwater
Medium Total
Exposure Medium
Household Use
Exposure Point
Stolley Park
Exposure Route
Ingestion
Exp. Route Total
Dermal
Exp. Route Total
Exposure Point Tota
Chemical of
Potential Concern
,1,1-Trichloroethane
,1-Dichlo roe thane
,1 -Dichloroethene
,2-Dichloroelhane
cis-1 ,2-Dichloroethene
>trtchloroethenePrichloroethene
1,1,1-Trichloroethane
1,1-Dichloroethane
1 ,1 -Dichloroethene1 J-Dichloroe thane
cis-l ,2-Dichloroethene
TetrachloroethtneTrichloroelhene
EPC
V«w
3.40E-031.10E-03
3.00E-03490E-04
4.00E-041.24E-031.60E04
Units
mg/L
mg/L
mg/L
mg/L
mg/L
mg/L
mg/L
3.40E-03
1 10E-03
3.00E-03490E-04
4.00E-04
1.24E-031.60E-04
mg/L
mg/L
mg/L
mg/L
mg/L
mg/L
mg/L
Exposure Medium Total
Ambient Air Shower Vapors Inhalation
Exp. Route TotalExposure Point Tota
1 ,1 ,1 -Tnchloroethane
].l-Dichloroethane
1,1 -Dichloroethene
1 ,2-Dichloroethane
cis-l ,2-DichloroelheneTetrachloroetheneTrichloroethene
3.40E-03
1.10E-033.00E-03
4.90E-044.00E-04
U4E-03
1.60E-04
mg/L
mg/L
mg/L
mg/L
mg/L
mg/L
mg/L
Exposure Medium 'otal
Indoor Air Vapors ( Inhalation JArea 3 (1) mg/m'
Exp. Route Total ||
Exposure Point Tota
Exposure Medium Total
Cancer Risk Calculations || Non-Cancer Haiard Calculation!
IntakcJLxposure Concentration
Value
1.62E-05
5.24E-06
1 43E-052.34E-06
1.9IE-06
5.93E-06
7.63E-07
Units
mg/kg-d
mg/kg-d
mg/Vg-d
mg/kg-dmg/kg-d
mg/kg-dmg/kg-d
1.94E-06
2.60E-07
1.25E-06
7.25E-OS
1.07E-07
2i3E-06
8.33E-08
mg/kg-dmg/kg-d
mg/kg-d
mg/kg-d
mg/kg-d
mg/kg-d
mg/kg-d
CSriUnit Risk
Value
5.70E-03
9.10E-02
5.40E-01
4.00E-01
5.70E-03
9.10E-02
5.40E-01
4.00E-01
Units
(mg/kg-d)-l
(mg/kg-dVl
(mg/kg-dH
(mg/kg-d )-l
(mg/kg-d >•!
(mg/kg-d)-l
(mg/kg-d)-l
(mg/kg-d M
(mg/kg-d)-l
(mg/kg-d )-l
(mg/kg-d )-l
(mg/kg-d )-!(mg/kg^iyl
(mg/kg^l)-l
9.32E-05
3.01 E-05
8 22E-05
1.34E-05
1.10E-05
3.41E-054.3SE-Q6
mg/kg-d
mg/kg-d
mg/kg-d
mg/kg-d
mg/kg-d
mg/kg-d
mg/kg-d
5.70E-03
9.10E-02
2.IOE-02
400E-01
(mg/kg-d )-l
(mg/kg-d)-l
(mg/kg-d)-l
(mg/kg-d)-l
(mg/kg-rl>l
(mg/kg-d)-!
(mg/kg-d H
- mg/kg-d - (mg/kg-d )-l
Total of Receptor Risks Across All Media Using CurrenTCE Toxicity Data
CowrrR.jk || Imo^/ttyosurf Concentration
1 V.h,
NC
2.99E-08
NC
2.13E-07
NC
3.20E-063.05E-07
3.75E-06NC
I.48E-09
NC
6.60E-09
NC
1.20E-06
3.33E-08
1.24E-06
4.99E-06
4.99E-06
NC
1.72E-07
NC
1.22E-06
NC
7.16E-07
1.756-063MEO6
3.86E-06
3.86E-06
8.86E-06
1.07E-07
1.07E-07
1.07EW
1.07E-07
1.07E-07
9.0E-06
1.89E-04
6.12E-05
1.67E-04
2.73E-05
2.22E-056.92E-05
8.90E-06
2.27E-05
3.03E-06
I.46E-058.46E-07
1.2SE-06
2.60E-059.72E-07
Units
mg/kg-dmg/kg-d
mg/kg-dmg/kg-d
mg/kg-dmg/kg-d
mg/kg-d
RfD/RfC
Valve
2.80E-01
2.00E-015.00E-02
2.XEJ2
1.00E02
100E-02
3.00E-04
mg/kg-d
mg/kg-d
mg/kg-dmg/kgd
mg/kg-d
mg/kg-d
mg/kg-d
2.80E-012.00E-01500E-02
2.00E-02
l.OOE-02
l.OOE-023.00E04
Units
mg/kg-d
mg/kg-d
mg/kg-d
mg/kg-d
mg/kg-dmg/kg-d
mg/kg-d
mg/kg-d
mg/kg-d
mg/kg-d
mg/kg-d
mg/kg-d
mg/kg-dmg/kg-d
1.09E-033.52E-04
9.59E-04
1.57E-04
1.28E-04
3.98E-04
5. 11 E-05
mg/kg-d
mg/kg-d
mg/kg-d
mg/kg-d
mg/kg-d
mg/kg-d
mg/kg-d
6.30E-01
1.40E-01
5.70E-02
1.40E-03
l.OOE-02
l.OOE-02
mg/kg-d
mg/kg-d
mg/kg-d
mg/kg-dmg/kg-d
mg/kg-dmg/kg-d
- mg/kg-d - mg/kg-d
Total of Receptor Hazards Across All Media UsingCurrent TCE Toxicity Data
HaiardQuotient
6.75E04
3.06E-O4
3.34E-03
1.36E-03
2.22E-036.92E-03
2.97E-02
4.45E-028.10EO5
I.51E-05
292E-04
4.23E-05
125E-O4
2.60E-033.24E-03
6.39E-03
5.09E-02
5.09E-02
1.73E-03
2.51 E-03
16SE-02
1.12E-01
NC
3.98E-02
5.11E-03
1.78E-01
1.78E-01
1.78E-OI
2.29E-OI
8.45E-03
8.45E-03
8.45E-03
8.45E-03
8.45E-03
2.4E-01
Notes:
(1) Refer to Table C.7.I.CT for cancer risk and hazard index calculations for the inhalation of indoor air within Area 3.
CRA 18925 (21) APPL
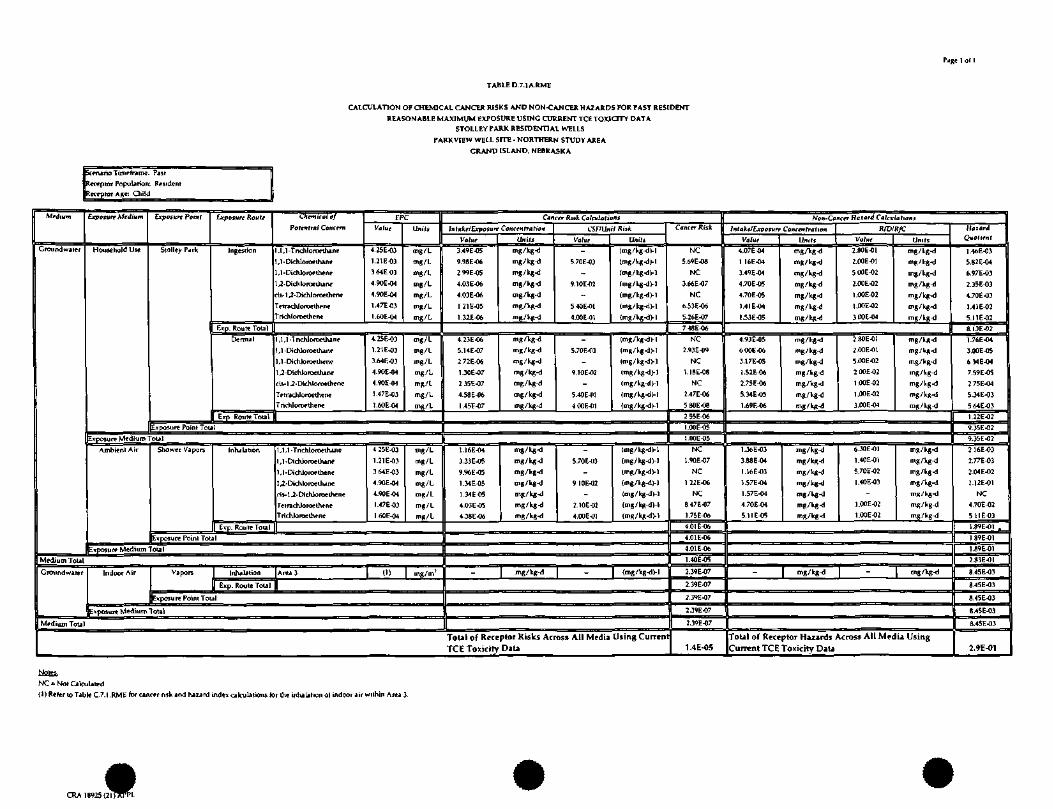
Pjge 1 ol 1
TABLE D.7.1A.RME
CALCULATION OF CHEMICAL CANCER RISKS AND NON-CANCER HAZARDS FOR PAST RESIDENT
REASONABLE MAXIMUM EXPOSURE USING CURRENT TCE TOXJOTY DATASTOLLEY PARX RESIDENTIAL WELLS
PARKVIEW WELL SITE • NORTHERN STUDY AREA
GRAND ISLAND, NEBRASKA
scenario Timerrame: Past
Receptor Population: Resident
Receptor Age: Child
Medium
Groundwater
Medium Total
Groundwater
Medium Total
Exposure Medium
Household Use
:xpo»ure Medium T
Ambient Air
Exposure Point
Stolley Park
Lxposurc Route
Ingesrion
E*p. Route Total
Dermal
Exp Route Total
Chemical of
Potential Contem
,1,1-Tnchloroethane
,1 -Dichloroelhane
,1 -Dichloroethene
,2-Dichloroe thane
cis- 1 J-Dichloroelhene
'etrachloroethene
"richloroethene
,1 ,1 -T nchloroethaJie
,1 -Dichloroelhane
,1 -Dichloroethene
1,2-Dichloroe thane
cis-U-Dichloroelhene
Tetrachloroethene
Trichloroethene
CPC
Value
4.25E-03
1.21E-03
3.64E03
4.90E-04
4.90E-04
1.47E-03
1.60E-04
Units
mg/L
mg/L
mg/L
mg/L
mg/L
mg/L
mg/L
4.2SE-03
1.21E-03
3.64E-03
4.90E-04
4.90E-04
1.47E-03
1.60E-04
mg/L
mg/L
mg/L
mg/L
mg/L
mg/L
mg/L
Exposure Point Tola
ota!
Shower Vapors Inhalation
Exp. Route Total
Exposure Point Tola
1 ,1,1 -Trichloroetharie
1,1-Dichloroethane
1,1 -Dichloroethene
1 ,2-Dichloroe thane
cis-l,2-Dichloroelhene
Tetrachloroethene
Trichloroethene
4.25E-03
1.21E-03
3.64E-03
4.90E-04
490E-04
I.47E-03
1.60E-04
mg/L
mg/L
mg/L
mg/L
mg/L
mg/L
mg/L
^Kposure Medium Total
Indoor Air Vapors 1 Inhalation
Exp. Route Total
Area 3 | (1) tng/m1
Exposure Point Tota
Exposure Medium Total
Cancer Risk Calculations
Intake/Exposure Concentration
Value
3.49E-05
9.98E-06
299E-05
4.03E-06
4.03E-06
1 21E-05
1.32E-06
4.23E-06
5.14E-07
272E-06
1.30E-07
2.35E-07
4.58E-06
1 .45E-07
Unit]
mg/kg-d
mg/kg-d
mg/kg-d
mg/kg-d
mg/kg-d
mg/kg-d
mg/kgsi
tSJVUml Risk
Value
5.70E-03
9.10E-02
5.40E-01
4.00E-01
mg/kg-d
mg/kgKl
mg/kg-d
mg/kg-d
mg/kg-d
mg/kg-d
mg/kg-d
5.70f-03
9.10E-02
5.40E-01
4.00E-I1I
Units
(mg/kg-d )-l
(mg/kg-d H
(mg/kg-d)-l
(mg/kg-d H
(mg/kg-d H
(mg/kg-dH
(mg/kg-d)-!
(mg/kg-d)-!
(mg/kg-d H
(mg/kg-d H
<mg/kg-d)-l
(mg/kg-dM
(mg/kg-d >-!
(mg/kg-dH
1.16E-04
3.33E-05
9.%E-05
1.34E-05
1.34E-05
4.03E-05
4.38E-06
mg/kg-d
mg/kg-d
mg/kg-d
mg/kg-d
mg/kg-d
mg/kg-d
mg/kg-d
5.70E-II3
9.10E-02
2.IOE-02
4.00E-01
(mg/kg-dH
(mg/kg-dH
(mg/kg-dH
(mg/kg-dH
(mg/kg-dH
(mg/kg-dH
(mg/kg-dH
- mg/kg-d | (mg/kg-d)-!
ToUl of Receptor Risks Across All Media Using CurrenTCE Toxicity Data
Cancer Risk
NC
5.69E-08
NC
3.66E-07
NC
6.53E-06
5.26E-07
7.48EO6
NC
2.93E-09
NC
1.18E-08
NC
2.47E-06
5.80E-08
255E-06
l.OOE-OS
l.OOE-05
NC
1.90E-07
NC
1.22E-06
NC
8 47E-07
1.75E-06
4.01E-06
4.01E-06
4.01E-06
1.40E-05
2.39E-07
2.39EO7
2.39E-07
2.39E-07
2.39E-07
1.4E-OS
Non-Cancer Hazard Calculations
IntakeJExposurr Concentration
Valur
4.07EO4
1.16E-04
3.49E-04
4.70E-05
4.70E-05
1.41E-04
1.53E-05
Units
mg/kg-d
mg/kg-d
mg/kg-d
mg/kg-d
mg/kg-d
mg/kg^l
mg/kg-d
RfDIRfC
Value
2.80E-01
2.00E-01
500E-02
2.00E-02
l.OOE-02
l.OOE-02
300E-04
4.93E-05
6.00E-06
3.17E-05
1.52E46
2.75E-06
5.34E-05
1.69E-06
mg/kg-d
mg/kg-d
mg/kg-d
mg/kg-d
mg/kg-d
mg/kg-d
mg/kg-d
2.80E-01
2.00E-01
5.00E-02
2.00E-02
l.OOE-02
l.OOE-02
3.00E-W
Units
mg/kg-d
mg/kg-d
mg/kg-d
mg/kg-d
mg/kg-d
mg/kg-d
mg/kg<l
mg/kg-d
mg/kg-d
mj/kg-d
mg/kg-d
mg/kg-d
mg/kg-d
mg/kg^J
1.36E-03
3.88E-04
I.16E-03
1.57E-04
1.57E-04
4.70E-04
5.11E-05
mg/kg^J
mg/kg-d
mg/kg-d
mg/kg-d
mg/kg-d
mg/kg-d
mg/kg-d
6.30E-01
1.40E-01
5.70E-02
1.40E-03
l.OOE-02
l.OOE-02
mg/kg-d
mg/kg-d
mg/kg-d
mg/kg-d
mg/kg-d
mg/kg-d
mg/kg-d
| mg/kgKl | mg/kg-d
Total of Receptor Hazards Across All Media UsingCurrent TCE Toxiciry Data
HaiardQuotient
1.46E-03
5.82E-04
6.97E-03
2.35E-03
4.70E-03
1.41E-02
5.11E-02
8.I3E-02
1.76E-04
3.00E-05
634E-04
7.59E-OS
275E-04
5.34E-03
5.64E-03
1.22E-02
9.35E-02
9.35E-02
2 16E-03
2.77E-03
2.04E-02
1.12E-01
NC
4.70E-02
5 1 1 E^3
1.89E-OI .
1 89E-01
1.89E-01
2.83E-01
8.45E-03
8.45E-03
8.45E-03
8.45E-03
8.45E-03
2.9E-01
Notes:
NC = NotCalCTilattd
(1) Refer to Table C 7.1.RME for cancer risk and hazard index calculations for the inhalation ol indoor air within Area 3.
CRA 18925(21(21pfjpl-
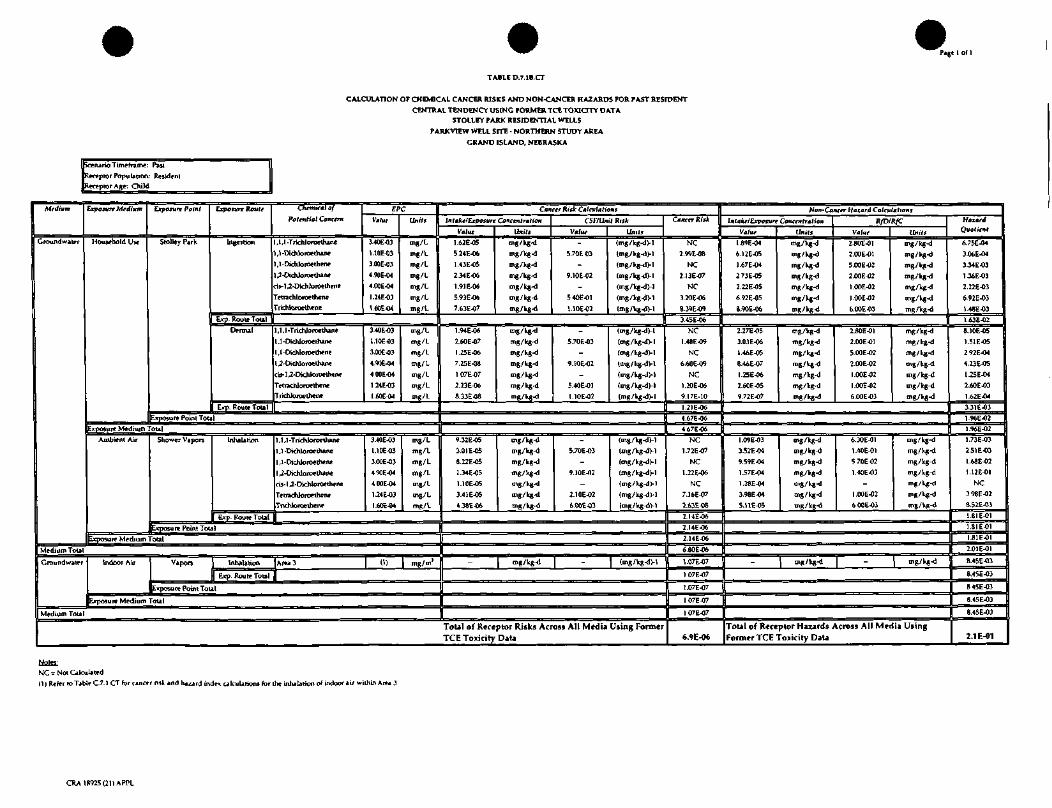
Page I of 1
TABLE D.7.1B.CT
CALCULATION OF CHEMICAL CANCER RISKS AND NON-CANCER HAZARDS FOR PAST RESIDENT
CENTRAL TENDENCY USING FORMER TCE TOXIOTY DATASTOLLEY PARX RESIDENTIAL WELLS
PARKVIEW WELL SITE - NORTHERN STUDY AREAGRAND ISLAND, NEBRASKA
kenario Time frame: PastReceptor Population: ResidentReceptor Age: Child
Medium
Medium Tota
Groundwattr
Medium Tota
Exposure Medium Exposure Point Exposure Route
Ingestion
Exp. Route Total
Dermal
Exp. Route Total
Otetnifal of
Potential Concern
,1 ,1 -Trichloroethane
,1 -Dichloroethane
,1-Dichloroethene,2-Dichloroethane
cis-1 ,2-DichloroeUiene
'etrachloroetheneTrichioroethene
,1,1-Trichloroethane
1,1-DichloroetJune
1,1-Dichloroelhene
1,2-Dichloroethane
cis-U-Dichloroethene
TerrachloroetheneTricruoroethene
EPCValue
3.40E-03
UOE-03
3.00E-034.90E-04
4.00E-04
1.24E-03
V60E-04
Units
mg/L
mg/L
mg/Lmg/L
mg/Lmg/L
mg/L
3.40E-03
1.10E-03
3.00E-03
4.90E-04
4.00E-04
I24E-03
1.60E-04
mg/Lmg/L
mg/Lmg/L
mg/Lmg/Lmg/L
Exposure Point TolaExposure Medium Total
Ambient Air
exposure Medium
Shower Vapors Inhalation
Exp. Route Total
1 ,1 ,1 -Trichloroethane
1 ,1 -Dkhloroethane
1,1-Dichloroetriene
1 -Dichloroethan*ci>-l ,2-Dichloroethene
Terrachloroethenerrichloroethene
3.40E-03
1.10E-03
3.00E-03490E-04
400E-04
1.24E-031.60E-04
mg/Lmg/L
mg/Lmg/Lmg/L
mg/Lmg/L
Exposure Point Total
oral
Indoor Ail Vapors I lnha larion
Exp. Route Tota
Exposure Point Total
Area} (1) mg/m1
Exposure Medium Tout
Cancer Risk Calculations
Intake/Exposure Concentration
Value
I.62E-05
5.24E-06
1.43E-05
2.34E-06
1.91E-06
5.93E-06
7.63E-07
194E-06
2.60E-07
1.25E-06
7.25E-08l.OTE-07
2.23E-06
8.33E08
Units
mg/kg-d
mg/Vg-dmg/kg-d
mg/kg-d
mg/kg-d
mg/kg-d
mg/Vg-d
mg/kg-d
mg/kg-d
mg/kg-d
mg/kg-d
mg/kg-d
mg/kg-d
mg/kg-d
f Sminil Risk
Value
5.70E03
9.10E-02
5.40E-01
1.10E-02
Units
(mg/kg-d)-l
(mg/kg-d)-!
(mg/kg-d )-l
(mg/kg-d H
(mg/kg-d )-l
(mg/kg-d)-!
(mg/kg-dVl
5.70E-03
9.10E-02
5.40E-011.10E-02
(mg/kg-d H
(mg/kg-d>l
(mg/kg-d)-!
(mg/kg-dV-1
(mg/kg-d H
(mg/kg-d H
(mg/kg-d)-!
9.32E-05
3.01 E-05
8.22E-05
1.34E-05
1.10E-05
3.41 E-05
4.38E-06
mg/kg-d
mg/Vg-d
mg/kg-d
mg/kg-d
mg/kg-dmg/kg-d
mg/kg-d
570E-03
9.10E-02
2.10E-02
6.00E-03
(mg/kg-d H
(mg/Vg^D-1
(mg/kg-d M
(mg/kg-<i)-l
(mg/kg^H
(mg/kg-d >-!
(mg/Vg-dVl
i m8/k«-d - (mg/Vg-d)-!
Total of Receptor Risks Across All Media Using FormerTCE Toxiciry Data
Cafirer Risk
NC
2.99E-08
NC
2.UE-07
NC
3.20E-06
8.39E-09
3.45E-06
NC
1.48E-09
NC
6.60E-09
NC
1.20E-06
9.17E-10
1.21E-06
4.67E-06467E-06
NC
1.72E-07
NC
1.22E-06
NC
7.16E-07
2.63E-08
2.14E-06
2.14E-06
2.14E-06
6.80E-06
1.07E-07
1 .07E-07
1.07E-07
I.07EO7
1.07E-07
6.9E-06
Non-Cancer Hatart Calculations
Intake/Exposure Concentration
Value
1.89E-04
6.12E-05
1.67E-04
273E-OS
2.22E-05
6.92E-05
8.90E-06
2.27E-05
3.03E-06
I.46E-05
B.46E-07
1.25E-06
2.60E-059.72E-07
Units
mg/kg-d
mg/kg-d
mg/kg-d
mg/kg-d
mg/kg-d
mg/kg-d
mg/Vg-d
mg/kg-d
mg/kg-d
mg/kg-d
mg/kgd
mg/kg-d
mg/kg-d
mg/kg-d
R/D/RfC
Value
2.80E-01
2.00E-01
5.00E-02
2.00E-02
l.OOE-02
l.OOE-02
6.00E-03
2.80E-01
2.00E-01
S.OOE-02
2.00E-02
l.OOE-02
l.OOE-02
6.00E-03
Units
mg/kg-d
mg/kg-d
mg/kg-d
mg/kg-d
mg/kg-d
mg/kg-d
mg/Vg-d
mg/kg-d
mg/kg-d
mg/kg-d
mg/kg-d.
mg/kg-d
mg/kg-d
mg/kg-d
1.09E-03
332E-04
9.59E-04
1.57E-04
1.28E-04
3.98E-04
5.1\E-05
mg/kg-d
mg/kg-d
mg/kg-d
mg/kg-d
mg/kg-d
mg/kg-d
mg/kg-d
6.30E-01
1.40E-015.70E02
1.40E-03
l.OOE-02
6.00E-03
mg/kg-d
mg/kg-d
mg/kgK)
mg/kg-d
mg/kg-d
mg/kg-d
mj/Vg-d
- mg/kg-d - mg/kg-d
ToUl of Receptor Hazards Across All Media UsingFormer TCE Toxicity Data
HazardQuotient
6.75E-04
306E-04
3.34E-03
1J6E-03
2.22E-03
6.92E-03
1 .48E-03
1.63E-02
8.10E-05
1.51E-05
2.92E-04
4.23E-OS
I.25E-04
2.60E-03I.62E-04
3.31E-03
1.96E-021.96E-02
1.73E-032.51E-03
1.68E-02
1.12E-OI
NC
3.98E-02
8.52E-03
1.81E-01
1.81E-01
1.81E-01
2.01E-01
8.4BE-03
8.45E-03
8.45E-03
8.45E-03
8.45E-03
2.1E-01
Notes:NC = Not Calculated(1) Refer to Table C.7.1 CT for cancer risk and hazard index calculations for the inhalation of indoor air within Area 3.
CRA 18925 (211APPL

Page 1 of 1
TABLE D.7.1B.RME
CALCULATION OF CHEMICAL CANCER RISKS AND NON-CANCER HAZARDS FOR PAST RESIDENT
REASONABLE MAXIMUM EXPOSURE USING FORMER TCE TOXJOTY DATASTOU.EY PARK RESIDENTIAL WELLS
PARKVIEW WELL SITE - NORTHERN STUDY AREA
GRAND ISLAND, NEBRASKA
scenario Timefratne- Past
Receptor Population: ResidentRecfptorAge: Oiild
Medium
Groundwater
Medjum Total
Groundwater
Medium Tola
Exposure Medturn
Household Use
Exposure Point
Stolley Park
Exposure Route
Ingestion
Exp. Route Total
Dermal
Exp. Route Total
Chemical of
Potential Concern
,1 ,1 -Trichloroethane
,1-Dichloroe thane
,1 -Dichloroethene
J Dichloroethane
rii-l,2-Dichloroethene
Tetrachloroethene'richloroethene
,1 ,1 -Trichloroethane
,l-Dichloroethane
, I -Dichloroethene
J-Dichloroe thane
cis-1 ,2-Dichloroethene
TetrachloroetheneTrichloroethene
EPC
Value
4.22E-03
1.22E-03
3.65E-03
4.90E-04
4.90E-04
1.47E-031.60E-04
4.22E-03
1.22E-03
3.65E-03
4.90E-04
4.90E-04
1.47E-03
I.60E-04
limit
mg/L
mg/L
mg/L
mg/L
mg/L
mg/L
mg/L
mg/L
mg/L
mg/L
mg/L
mg/L
mg/L
mg/L
Exposure Point Tola
Exposure Medium Total
Ambient Air Shower Vapors Inhalation
Exp. Route Total
1,1,1-Trichloroelhane
1,1-Dichloroethane
1,1-Dichloroethene
1,2 Dichloroethane
cis-l,2-DicMoroethene
TerrachloroetheneTrichloroethene
4.22E03
1.22E-03
3.65E-03
490E-04
4.90E-04
1.47E-03
1.60E-04
mg/L
mg/L
mg/L
mg/L
mg/L
mg/L
mg/L
Exposure Point Tola
exposure Medium Total
Indoor Air Vapon ( Inhalation
Exp. Route Total
Area 3 (1) mg/m1
Exposure Point Total
Exposure Medium Total
JntaketExposure Concentration
Value
347E-05
9.99E^>6
3.00E-05
4.03E-06
403E-06
1.21E-05
1.32E-06
Units
mg/kg-d
mg/kg-d
mg/kg-d
mg/kg-d
mg/kg-d
mg/kg-d
mg/kgKl
420E-06
5.14E-07
273E-06
1.30E-07
2.35E-07
4.57E-061.45E-07
mg/kgd
mg/kg-d
mg/kg-dmg/kg-d
mg/kg-d
mg/kg-d
mg/kg-d
CSrlUnil Risk
Value
5.70E03
9.10E-02
5.40E-01
1.10E02
Units
(mg/kg-d H
(mg/kg-d )-l
(mg/kg-d )-l
(mg/kg-d 1-1
(mg/kg-dVl
(mg/kg-d)-l
(mg/kg-dM
5 70E-03
9.IOE-02
5.40E-01
1.IOE-02
(mg/kg-d )-l
(mg/kg-d)-!
(mg/kgKl)-l
(mg/kg-d )-l
(mg/kg-dt-1
(mg/kg-dl-l
(mg/kg-d )-!
1.I6E-04
3.33E-05
9.99E-05
1.34E05
I.34E-05
4.02E-05
4.38E-06
mg/kg-d
mg/kg-d
mg/kg-d
mg/kg-dmg/kg-d
mg/kg-d
mg/kg-d
5.70E-C3
9 10E-02
2.IOE-02
6.00E-03
(mg/kg-d H
(mg/kg-d)-!
(mg/kg-d M
(mg/kg-d)-!(mg/kg-d M
(mg/kg-dH
<mg/kg-dM
- mg/kg-<! - (mg/kg-d)-!
ToUl of Receptor Risks Across All Media Using FormerTCE Toxiciry Dili
Cancer Risk
NC
5.69E-08
NC
3.66E-07
NC
6.51 E-06
1.45E-08
6.95E-06NC
2.93E-09
NC
1.18E-08
NC
2.47E-06
1.60EO9
248E-06
9.41E<I6
9.43E-06
NC
1.90E-07
NC
1.22E-06NC
8.44E-07
2.63E-08
2.28E-06
2.28E-06
2.28E-06
1 17E-05
2.39E-07
2.39E-07
2.39E-07
2.39E-07
2 39E-07
1.2E-05
Non-Cancer Hazard Calculations
Inlakelfjcposure Concentration
Value
4.05E-04
1.17E«1
3.50E04
4.70E-05
4 70E-05
1.41E-04
1 53E-05
Units
mg/kg-d
mg/kg-d
mg/kg-d
mg/kg-d
mg/Vg-d
mg/kg-d
mg/kg-d
RfDIRfC
Value
2.80E-01
2.00E-01
5.00E-02
2.00E-02l.OOE-02
l.OOE-02
600E-03
Unifs
mg/tg-d
mg/kg-d
mg/kg-d
mg/kg-dmg/kg-d
mg/kg-d
mg/kg-d
4.90E-05
6.00EO6
3.18E-05
1.52E-06
275E-06
533E-05
1.69E-06
mg/kg-d
mg/kg-d
mg/kg-d
mg/kg-d
mg/kg-d
mg/Wg-d
mg/kg-d
2.80E-01
200E-01
5.00E-02
200E-02
l.OOE-02
l.OOE-02
6.00E-03
mg/kg-d
mg/kg-d
mg/kg-d
mg/kg-d
mg/kg-dmg/kg^i
mg/kg-d
2.02E-03
5.83E-04
1.75E-032.35E-04
2.35E-04.
7.03E-04
7.67E-05
mg/kg-d
mg/kg-d
mg/kg-dmg/kg-d
mg/lg-d
mg/kg-d
mg/kg-d
6.30F.-01
140E^)1
5.70E-02
1.40E-03
l.OOE-02
6.00E-03
mg/kg-d
mg/kg-d
mg/kg-d
"'gAg-d
mg/kg-d
mg/kg-d
mg/kg-d
- mg/kg-d - mg/kg-d
ToUl of Receptor Hazards Across All Media UsingFormer TCE Toxicity Dati
HatardQuotient
144E-03
5.83E-04
6.99E-03
2.35E-03
4.70E-03
14IE-02
2.56E-03
3.27E-02
1.75E^)4
3.00E-05
6.36EW
7.59E-05
2.75E-04
5.33E-03
2.82E-04
6.80E-03
3.95E-02
3.95E-02
3.21E-03
4.I6E-03
3.07E-02
1.68E^)1
NC
7.03E02
1 28E-02
2.89E-01
2.89E-01
2 89E-01
3.28E-OI
8.45E-03
8.45E-03
8.45Efl3
8.45E-03
8.45E-03
3.4E-01
Mom:NC = Not CalcuUted
(l)Reh?r to Table C.7.1.RME for cancer risk and hazard index calculations for the inhalation of indoor air within Are* 3.
CRA 18925(21721^^C

ATTACHMENT E
HHRA FOR PARK VIEW/STOLLEY PARK MUNICIPAL WELLS
018925(21) API'L

TABLE OF CONTENTS
1.0 INTRODUCTION AND OVERVIEW E-l1.1 OVERVIEW OF ATTACHMENT E E-l1.2 MUNICIPAL WELL DATA E-l1.3 NATURE AND EXTENT OF CONTAMINATION E-21.4 OBJECTIVE OF ATTACHMENT E E-21.5 ORGANIZATION OF ATTACHMENT E E-3
2.0 IDENTIFICATION OF CHEMICALS OF POTENTIAL CONCERN E-42.1 SCREENING CRITERIA E-42.2 DATA COLLECTION E-52.3 DATA EVALUATION E-52.4 COPC SELECTION E-62.5 SUMMARY OF COPC SELECTION E-6
3.0 EXPOSURE ASSESSMENT E-73.1 CHARACTERIZATION OF EXPOSURE SETTING E-73.2 IDENTIFICATION OF POTENTIAL EXPOSURE PATHWAYS E-73.2.1 SOURCES AND RECEIVING MEDIA E-83.2.2 FATE AND TRANSPORT OF COPC E-83.2.3 POTENTIAL EXPOSURE POINTS E-83.2.4 COMPLETE PATHWAYS AND EXPOSURE ROUTES E-93.3 QUANTIFICATION OF EXPOSURE E-103.3.1 EXPOSURE POINT CONCENTRATIONS E-ll3.3.2 ROUTE SPECIFIC INTAKE EQUATIONS E-123.3.2.1 GROUNDWATER INGESTION INTAKE EQUATION E-133.3.2.2 GROUNDWATER DERMAL CONTACT INTAKE EQUATION E-143.3.2.3 GROUNDWATER VAPOR INHALATION INTAKE EQUATION E-153.3.2.4 INDOOR AIR INHALATION INTAKE EQUATION E-153.3.3 EXPOSURE ASSUMPTIONS E-163.3.3.1 RESIDENTIAL EXPOSURE E-163.3.3.2 INDOOR AIR EXPOSURE E-18
4.0 TOXICITY ASSESSMENT E-194.1 NON-CARCINOGENIC HAZARDS E-204.2 CARCINOGENIC RISKS E-214.3 TOXICOLOGICAL SUMMARIES FOR THE COPCS E-22
5.0 RISK CHARACTERIZATION E-235.1 HAZARD ESTIMATES E-235.2 CANCER RISK ESTIMATES E-245.3 RISK QUANTIFICATION SUMMARY E-255.4 UNCERTAINTY ANALYSIS , E-26
6.0 REFERENCES E-27
18925 (21) APPL ATTE CONESTOGA-ROVERS & ASSOCIATES
LIST OF FIGURES(Following Text)
FIGURE E.I .1 CONCEPTUAL SITE MODEL: MUNICIPAL WELLS
LIST OF TABLES(Following Text)
TABLE E.I.1
TABLE E.2.1
TABLE E.3.1
TABLE E.4.1
TABLE E.7.1.CT
TABLE E.7.1.RME
SELECTION OF EXPOSURE PATHWAY SCENARIOS
OCCURRENCE, DISTRIBUTION AND SELECTION OFCHEMICALS OF POTENTIAL CONCERN IN GROUNDWATER
EXPOSURE POINT CONCENTRATION (EPC) SUMMARY FORCHEMICALS OF POTENTIAL CONCERN IN GROUNDWATER
VALUES USED FOR DAILY INTAKE CALCULATIONS FORGROUNDWATER
CALCULATION OF CHEMICAL CANCER RISKS AND NON-CANCER HAZARDS FOR PAST RESIDENT - CENTRALTENDENCY
CALCULATION OF CHEMICAL CANCER RISKS AND NON-CANCER HAZARDS FOR PAST RESIDENT - REASONABLEMAXIMUM EXPOSURE
16925(21)APPL ATTE CONESTOGA-ROVERS & ASSOCIATES
1.0 INTRODUCTION AND OVERVIEW
1.1 OVERVIEW OF ATTACHMENT E
Conestoga-Rovers & Associates (CRA) has prepared this Human Health RiskAssessment (HHRA) to evaluate the past risks associated with potential exposure tomunicipal supply well water from supply wells located in the Parkview/Stolley Parkarea as defined below. Specifically, this assessment evaluates the risks for variousexposure scenarios from the time contamination was first identified in the local GrandIsland municipal supply well Parkview No. 3 in 1999 through to 2001 when this wellwas taken out of service. The risks assessed in this Attachment will not be used to makeremedial decisions, but provide important information on historical exposures and risksin the Northern Study Area not included in the HHRA.
The RI Report provides an in-depth description of the Northern Study Area, includingits physical, chemical, and hydrogeological characteristics. From various investigationsit is evident that the Southern Plume originates west of the Indian Head Golf Course, inthe vicinity of Engleman Road and Husker Highway, and migrates to the east andeast-northeast through the Castle Estates, Mary Lane, Bradley, Kentish Hills, andParkview/Stolley Park subdivisions.
This Attachment addresses the Municipal Wells, consisting of groundwater from thefour municipal wells within the Northern Study Area. The data collected fromParkview Wells 1, 2, and 3 and the Stolley Park well, from October 1999 to October 2001were used in the risk assessment evaluation of the Municipal Well's groundwater.
1.2 MUNICIPAL WELL DATA
In Parkview/Stolley Park, four Municipal Groundwater wells were used betweenOctober 1999 and August 2001 to supplement drinking water to the area drinking watersupply system. Based on information provided by the City of Grand Island, water fromParkview No. 3 was used for approximately 156 days within the October 1999 andOctober 2001 timeframe (i.e., 78 days/year for 2 years). The presence of COPCs in theParkview/Stolley Park area has required the implementation of a Removal Actionmeasure. The Municipal Well known as Parkview #3, which is the well that showedelevated COPC concentrations was taken out of service in 2001 and did not supplydrinking water from that time on. The risk assessment prepared here, as Attachment E,is for past exposure to water from Parkview Wells 1, 2, 3, and Stolley Park well.
18925(21)APPLATTE E-1 CONESTOGA-ROVERS & ASSOCIATES
1.3 NATURE AND EXTENT OF CONTAMINATION
A brief description of the nature and extent of contamination in the Southern Plume is
presented in the Northern Study Area RI report.
1.4 OBJECTIVE OF ATTACHMENT E
The purpose of this risk assessment is to evaluate the human health risks posed by past
exposure to groundwater taking into account that a Removal Action (decommissioning
of Parkview No. 3 from the water supply) has taken place, and no resident is consuming
water from this well. Its objective is to provide a perspective on the risk levels to which
the residents using municipal water may have been exposed.
The specific goals of the risk assessment for past exposure to the Municipal Well water
are:
• to identify chemicals of potential concern (COPCs);
• to provide an estimate of risk for these COPCs; and
• to provide a basis for comparing cumulative risk levels to the risk range used by the
U.S. EPA, provided in the National Contingency Plan, and levels used in remedial
decision making.
Consistent with the HHRA for the Northern Study Area, the risk assessment in this
Attachment was conducted in accordance with the following U.S. Environmental
Protection Agency (U.S. EPA) guidance:
• U.S. EPA Risk Assessment Guidance for Superfund (RAGS), Volume I, Human
Health Evaluation Manual (Part) A, EPA/540/1-89/002, December 1989;
• U.S. EPA RAGS Supplemental Guidance, Standard Default Exposure Factors,
Interim Final, OSWER Directive 9285.6-03, March 25,1991;
• U.S. EPA Exposure Factors Handbook, EPA/600/P-95/002Fa, August 1997;
• U.S. EPA RAGS Part D, Standardized Planning, Reporting, and Review of Superfund
Risk Assessments, Final, Publication 9285.7-O1D, December 2001;
• U.S. EPA, Child-Specific Exposure Factors Handbook, September 2002;
• U.S. EPA, Supplemental Guidance for Developing Soil Screening Levels for
Superfund Sites, December 2002;
18925 (211APPLATTE E-2 CONESTOGA-ROVERS & ASSOCIATES

• U.S. EPA RAGS Part E, Supplemental Guidance, Dermal Risk Assessment, Final,
July 2004; and
• U.S. EPA, Draft Guidance for Evaluating the Vapor Intrusion to Indoor Air Pathway
from Groundwater and Soils (Subsurface Vapor Intrusion Guidance), EPA Report
No. EPA530-F-02-052, Office of Solid Waste and Emergency . Response,
November 2002.
1.5 ORGANIZATION OF ATTACHMENT E
This Attachment is organized as follows:
• Section 1.0: Introduction and Overview
Presents background information relevant to this risk assessment, presents the
purpose of this risk assessment, and outlines the organization of this Attachment.
• Section 2.0: Identification of Chemical of Potential Concern
Presents a brief summary of the Chemicals of Potential Concern (COPCs) selectedfor groundwater from the Municipal Wells.
• Section 3.0: Exposure Assessment
Presents a summary of the exposure settings, identifies the potential exposure
pathways, and quantifies exposure based on the exposure assumptions.
• Section 4.0: Toxicity Assessment
Presents a summary of the toxicity data used to calculate the non-carcinogenichazards and carcinogenic risks.
• Section 5.0: Risk Characterization
Presents an assessment of the potential risks to human health from past exposure togroundwater.
• Section 6.0: References
Presents a list of references cited in the risk assessment.
18925(21)APPLATTE E-3 CONESTOGA-ROVERS & ASSOCIATES
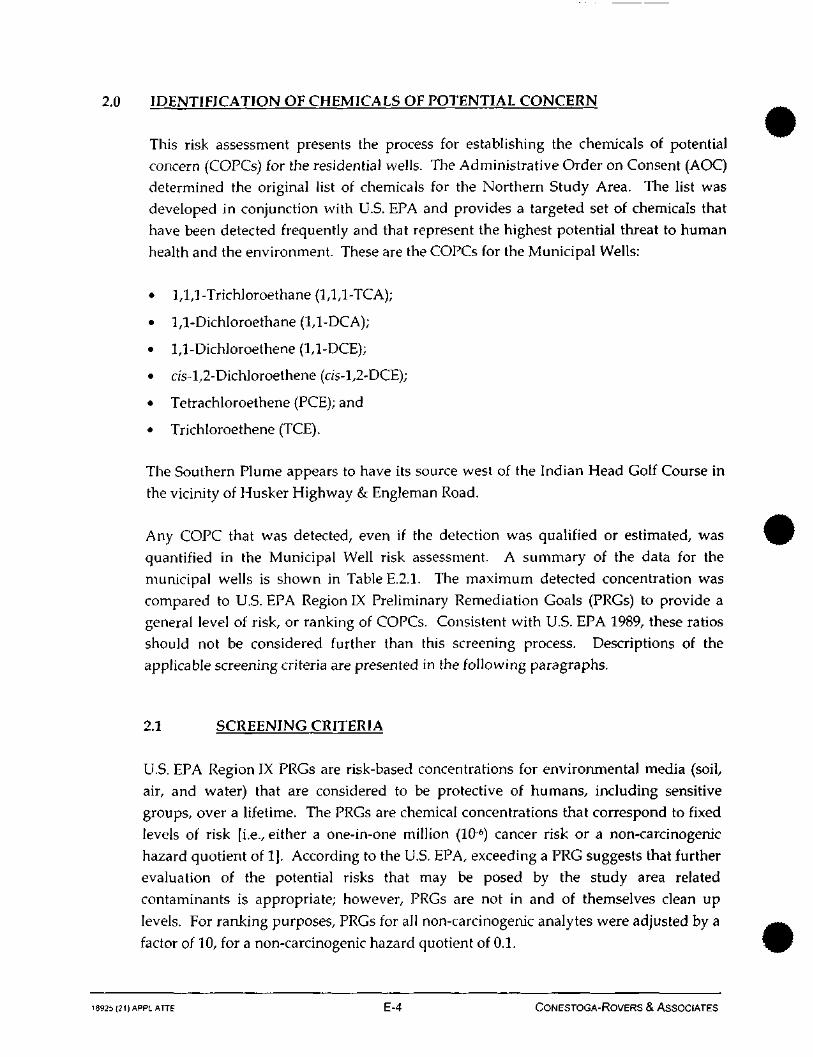
2.0 IDENTIFICATION OF CHEMICALS OF POTENTIAL CONCERN
This risk assessment presents the process for establishing the chemicals of potential
concern (COPCs) for the residential wells. The Administrative Order on Consent (AOC)
determined the original list of chemicals for the Northern Study Area. The list was
developed in conjunction with U.S. EPA and provides a targeted set of chemicals that
have been detected frequently and that represent the highest potential threat to human
health and the environment. These are the COPCs for the Municipal Wells:
• 1,1,1-Trichloroethane (1,1,1-TCA);
• 1,1-Dichloroethane (1,1-DCA);
• 1,1-Dichloroethene (1,1-DCE);
• ds-l,2-Dichloroethene (c;'s-l,2-DCE);
• Tetrachloroethene (PCE); and
• Trichloroethene (TCE).
The Southern Plume appears to have its source west of the Indian Head Golf Course in
the vicinity of Husker Highway & Engleman Road.
Any COPC that was detected, even if the detection was qualified or estimated, was
quantified in the Municipal Well risk assessment. A summary of the data for the
municipal wells is shown in Table E.2.1. The maximum detected concentration was
compared to U.S. EPA Region IX Preliminary Remediation Goals (PRGs) to provide a
general level of risk, or ranking of COPCs. Consistent with U.S. EPA 1989, these ratios
should not be considered further than this screening process. Descriptions of the
applicable screening criteria are presented in the following paragraphs.
2.1 SCREENING CRITERIA
U.S. EPA Region IX PRGs are risk-based concentrations for environmental media (soil,
air, and water) that are considered to be protective of humans, including sensitive
groups, over a lifetime. The PRGs are chemical concentrations that correspond to fixed
levels of risk [i.e., either a one-in-one million (106) cancer risk or a non-carcinogenic
hazard quotient of 1]. According to the U.S. EPA, exceeding a PRG suggests that further
evaluation of the potential risks that may be posed by the study area related
contaminants is appropriate; however, PRGs are not in and of themselves clean up
levels. For ranking purposes, PRGs for all non-carcinogenic analytes were adjusted by a
factor of 10, for a non-carcinogenic hazard quotient of 0.1.
18926 (21) APPLATTE E-4 CONESTOGA-ROVERS & ASSOCIATES

The PRGs are based on exposure pathways for which generally accepted methods,
models, and assumptions have been developed (i.e., ingestion, dermal contact, and
inhalation) for specific land-use conditions (i.e., residential).
In the context of this risk assessment any COPC detected in groundwater was carried
through the risk assessment process. However, PRGs were used to evaluate practical
quantitation limits relative to observed concentrations to determine a ratio of the
maximum concentration to the PRG, thus indicating, in a general way, which COPCs
will contribute most to the overall risk.
In this risk assessment, detected COPCs in groundwater were quantified in the risk
assessment process. In addition, the maximum groundwater data were compared to the
Region IX tap water PRGs. U.S. EPA re-evaluated the potential toxicity of 1,1-DCE in
2002. They determined that the toxicological database did not support the previous
determination that 1,1-DCE should be evaluated as a carcinogen, so they revised their
toxicological profile to provide an updated value for 1,1-DCE. The up-dated
toxicological information was used in this risk assessment to develop groundwater risk
using methods consistent with the Region IX tap water PRG, and current U.S. EPA
guidance. It is believed that the U.S. EPA utilized this updated toxicology information
to establish the 1,1-DCE RAL for this Site (U.S. EPA Fact Sheet, November 2004)
(U.S. EPA, 2004d).
2.2 DATA COLLECTION
A summary of existing data for the Municipal Wells for the purposes of the remedialinvestigation is summarized in Section 2.0 of the RI.
2.3 DATA EVALUATION
Municipal Well water was used during 1999, 2000, and 2001. Parkview No. 3 was taken
off-line in 2001. In general, all of the available data was used for the purposes of this
risk assessment. A description of the potential impacts of the method detection limits is
provided in Section 2.4.
18925 (21) APPLATTE E-5 CONESTOGA-ROVERS & ASSOCIATES
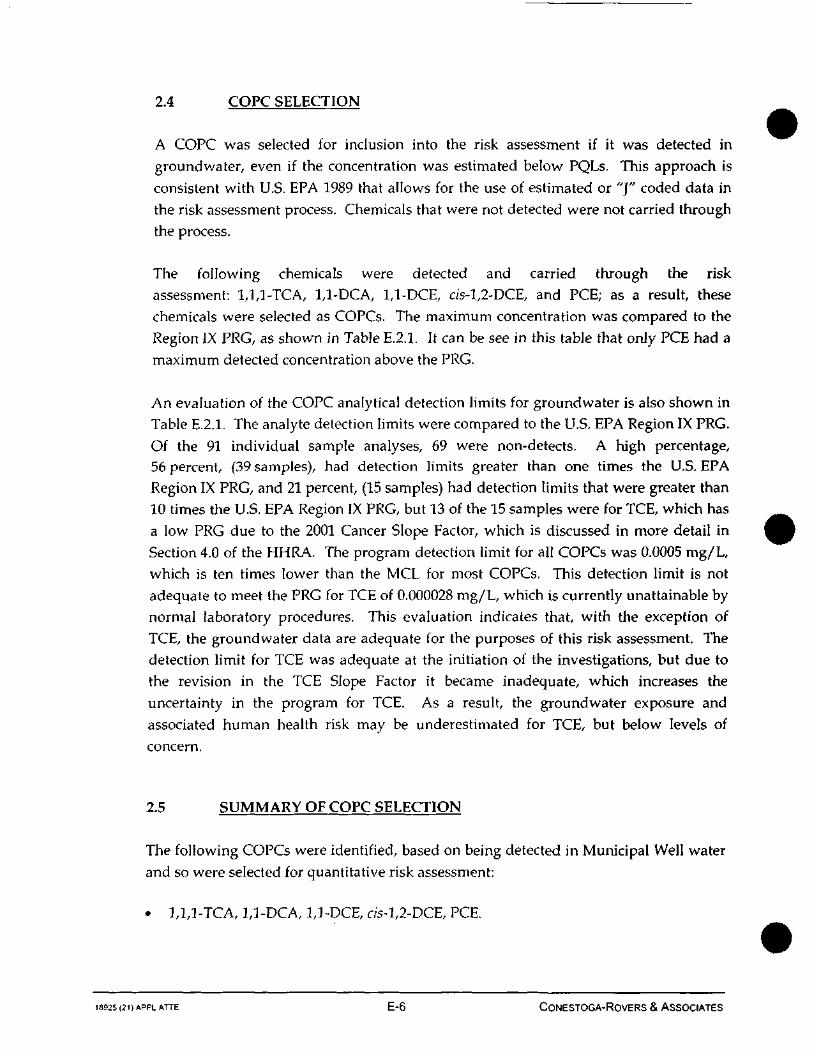
2.4 COFC SELECTION
A COPC was selected for inclusion into the risk assessment if it was detected in
groundwater, even if the concentration was estimated below PQLs. This approach is
consistent with U.S. EPA 1989 that allows for the use of estimated or "]" coded data in
the risk assessment process. Chemicals that were not detected were not carried through
the process.
The following chemicals were detected and carried through the risk
assessment: 1,1,1-TCA, 1,1-DCA, 1,1-DCE, ds-l,2-DCE, and PCE; as a result, these
chemicals were selected as COPCs. The maximum concentration was compared to the
Region JX PRG, as shown in Table E.2.1. It can be see in this table that only PCE had a
maximum detected concentration above the PRG.
An evaluation of the COPC analytical detection limits for groundwater is also shown in
Table E.2.1. The analyte detection limits were compared to the U.S. EPA Region IX PRG.
Of the 91 individual sample analyses, 69 were non-detects. A high percentage,56 percent, (39 samples), had detection limits greater than one times the U.S. EPA
Region IX PRG, and 21 percent, (15 samples) had detection limits that were greater than
10 times the U.S. EPA Region IX PRG, but 13 of the 15 samples were for TCE, which has
a low PRG due to the 2001 Cancer Slope Factor, which is discussed in more detail in
Section 4.0 of the HHRA. The program detection limit for all COPCs was 0.0005 mg/L,
which is ten times lower than the MCL for most COPCs. This detection limit is not
adequate to meet the PRG for TCE of 0.000028 mg/L, which is currently unattainable by
normal laboratory procedures. This evaluation indicates that, with the exception of
TCE, the groundwater data are adequate for the purposes of this risk assessment. The
detection limit for TCE was adequate at the initiation of the investigations, but due to
the revision in the TCE Slope Factor it became inadequate, which increases the
uncertainty in the program for TCE. As a result, the groundwater exposure and
associated human health risk may be underestimated for TCE, but below levels of
concern.
2.5 SUMMARY OF COPC SELECTION
The following COPCs were identified, based on being detected in Municipal Well water
and so were selected for quantitative risk assessment:
• 1,1,1-TCA, 1,1-DCA, 1,1-DCE, cis-l,2-DCE, PCE.
18925 (21) APPL ATTE E-6 CONESTOGA-ROVERS & ASSOCIATES

3.0 EXPOSURE ASSESSMENT
Exposure is defined as the contact of a receptor with a chemical or physical agent. The
exposure assessment is the estimation of the magnitude, frequency, duration, and routes
of potential exposure. An exposure assessment provides a systematic analysis of the
potential exposure mechanism by which a receptor may be exposed to chemical or
physical agents at or originating from a study area. The objectives of an exposure
assessment are as follows:
• Characterization of exposure setting;
• Identification of potential exposure pathways; and
• Quantification of potential exposure.
3.1 CHARACTERIZATION OF EXPOSURE SETTING
This risk assessment is an Attachment to the HHRA, which characterizes risks in the
Northern Study Area. Information on groundwater flow and contaminant fate and
transport will not be repeated here, as it is part of the RI. A consideration of site-specific
factors related to land usage is important in the development of realistic exposurescenarios and quantification of potential risks and hazards. The past land use was
residential and residential land use can reasonably be expected in the future.
3.2 IDENTIFICATION OF POTENTIAL EXPOSURE PATHWAYS
An exposure pathway describes a mechanism by which humans may come into contactwith area-related COPCs. An exposure pathway is complete (i.e., it could result in a
receptor contacting a COPC) if the following four elements are present:
• a source or a release from a source;
• a probable environmental migration route of a COPC;
• an exposure point where a receptor may come in contact with a COPC; and
• a route by which a COPC may enter a potential receptor's body.
If any of these four elements is not present, the exposure pathway is considered
incomplete and does not contribute to the total exposure from the COPCs.
18925(21)APPLATTE E-7 CONESTOGA-ROVERS & ASSOCIATES
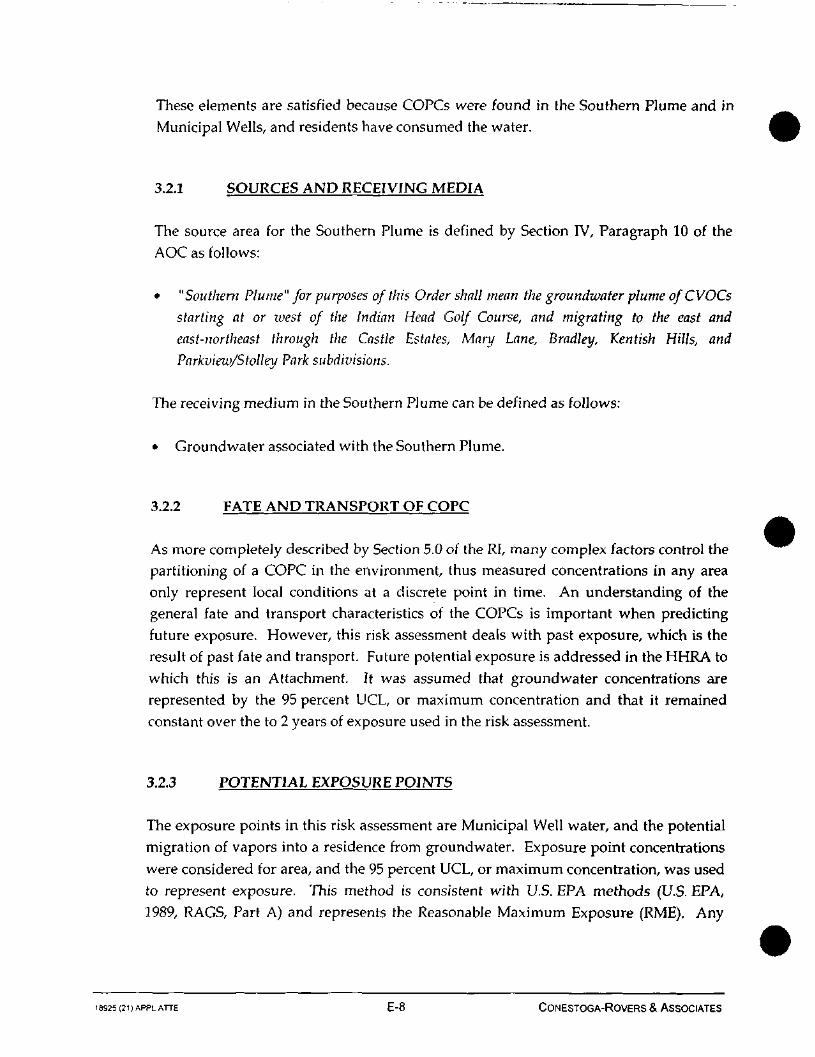
These elements are satisfied because COPCs were found in the Southern Plume and inMunicipal Wells, and residents have consumed the water.
3.2.1 SOURCES AND RECEIVING MEDIA
The source area for the Southern Plume is defined by Section IV, Paragraph 10 of theAOC as follows:
• "Southern Plume" for purposes of this Order shall mean the groundwater plume ofCVOCs
starting at or west of the Indian Head Golf Course, and migrating to the east and
east-northeast through the Castle Estates, Mary Lane, Bradley, Kentish Hills, and
Parkview/Stolley Park subdivisions.
The receiving medium in the Southern Plume can be defined as follows:
• Groundwater associated with the Southern Plume.
3.2.2 FATE AND TRANSPORT OF COFC
As more completely described by Section 5.0 of the RI, many complex factors control thepartitioning of a COPC in the environment, thus measured concentrations in any areaonly represent local conditions at a discrete point in time. An understanding of thegeneral fate and transport characteristics of the COPCs is important when predictingfuture exposure. However, this risk assessment deals with past exposure, which is theresult of past fate and transport. Future potential exposure is addressed in the HHRA towhich this is an Attachment. It was assumed that groundwater concentrations arerepresented by the 95 percent UCL, or maximum concentration and that it remainedconstant over the to 2 years of exposure used in the risk assessment.
3.2.3 POTENTIAL EXPOSURE POINTS
The exposure points in this risk assessment are Municipal Well water, and the potentialmigration of vapors into a residence from groundwater. Exposure point concentrationswere considered for area, and the 95 percent UCL, or maximum concentration, was usedto represent exposure. This method is consistent with U.S. EPA methods (U.S. EPA,1989, RAGS, Part A) and represents the Reasonable Maximum Exposure (RME). Any
18925 (21 IAPPLATTE E-8 CONESTOGA-ROVERS & ASSOCIATES

single individual's exposure may be greater or less than this level. U.S. EPA defines the
RMEas:
"The reasonable maximum exposure (RME) is defined as the highest exposure that is reasonably
expected to occur at a site. Tlie intent of the RME is to estimate a conservative exposure case
(i.e., well above average) that is still within the range of possible human exposure." (U.S. EPA,
1989)
The four Municipal Wells provided limited quantities of water to the Parkview/Stolley
Park area for a short period of time. Once this limited quantity of water was introduced,
it was available for admixture to the public water supply system albeit at much diluted
levels. None of the four Municipal Wells is currently being used to supply drinking
water (Parkview Well No. 3 has been permanently decommissioned and the other three
wells are on stand by) and so the actual current and future risk from these well, under
the current conditions is zero. However, past exposure and past risks are estimated in
this Attachment, and the exposure was residential.
3.2.4 COMPLETE PATHWAYS AND EXPOSURE ROUTES
A potential exposure route is the fourth element of an exposure pathway. Potential
exposure routes are identified by: i) determining the COPC sources and receiving
media; ii) analyzing the movement of the COPCs from the source; and iii) determining
the possible exposure points.
Humans can be exposed to a variety of media containing COPCs, including,
groundwater and air that have contact with other affected media. Based on the presenceof COPCs in the Southern Plume, an understanding of the four components of an
exposure pathway exposure can be quantified. Past conditions in the show migration.
Human exposure pathways associated with groundwater include the incidental
ingestion, direct dermal contact, and inhalation of vapors.
The groundwater to soil vapor-to-indoor air pathway was evaluated by modeling
discussed in Attachment G, using the Johnson & Ettinger (f&E) Vapor Intrusion model.
Based on these assumptions and the results of the media-specific screening presented in
Section 2.4, the exposure scenario and pathways quantified in the HHRA are
summarized in Table E.I.I. A CSM for this receptor is shown on Figure E.I.I. Exposure
pathways for the Municipal Wells include:
18925(21)APPLATTE E-9 CONESTOGA-ROVERS & ASSOCIATES
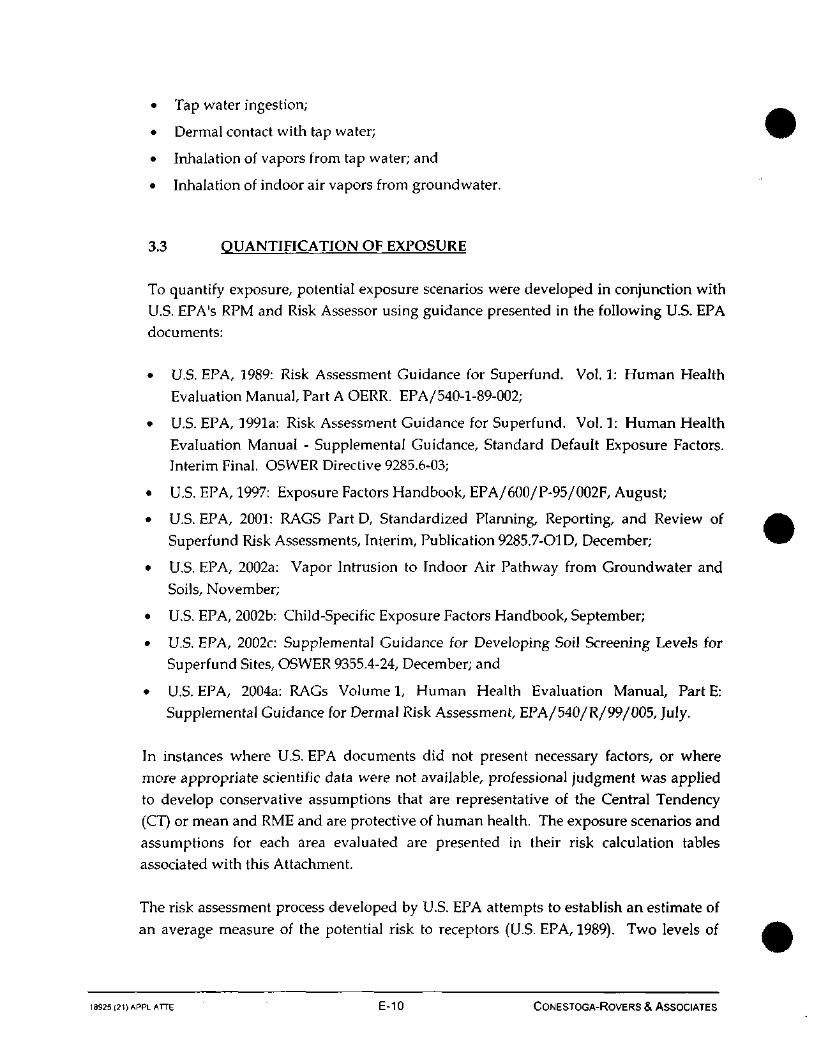
• Tap water ingestion;
• Dermal contact with tap water;
• Inhalation of vapors from tap water; and
• Inhalation of indoor air vapors from groundwater.
3.3 QUANTIFICATION OF EXPOSURE
To quantify exposure, potential exposure scenarios were developed in conjunction withU.S. EPA's RPM and Risk Assessor using guidance presented in the following U.S. EPAdocuments:
• U.S. EPA, 1989: Risk Assessment Guidance for Superfund. Vol. 1: Human HealthEvaluation Manual, Part A OERR. EPA/540-1-89-002;
• U.S. EPA, 1991a: Risk Assessment Guidance for Superfund. Vol. 1: Human HealthEvaluation Manual - Supplemental Guidance, Standard Default Exposure Factors.Interim Final. OSWER Directive 9285.6-03;
• U.S. EPA, 1997: Exposure Factors Handbook, EPA/600/P-95/002F, August;
• U.S. EPA, 2001: RAGS Part D, Standardized Planning, Reporting, and Review ofSuperfund Risk Assessments, Interim, Publication 9285.7-O1D, December;
• U.S. EPA, 2002a: Vapor Intrusion to Indoor Air Pathway from Groundwater andSoils, November;
• U.S. EPA, 2002b: Child-Specific Exposure Factors Handbook, September;
• U.S. EPA, 2002c: Supplemental Guidance for Developing Soil Screening Levels forSuperfund Sites, OSWER 9355.4-24, December; and
• U.S. EPA, 2004a: RAGs Volume 1, Human Health Evaluation Manual, Part E:Supplemental Guidance for Dermal Risk Assessment, EPA/540/R/99/005, July.
In instances where U.S. EPA documents did not present necessary factors, or wheremore appropriate scientific data were not available, professional judgment was appliedto develop conservative assumptions that are representative of the Central Tendency(CT) or mean and RME and are protective of human health. The exposure scenarios andassumptions for each area evaluated are presented in their risk calculation tablesassociated with this Attachment.
The risk assessment process developed by U.S. EPA attempts to establish an estimate ofan average measure of the potential risk to receptors (U.S. EPA, 1989). Two levels of
18925(21)APPLATTE E-10 CONESTOGA-ROVERS & ASSOCIATES
exposure scenarios are presented. The RME corresponds to the 95 percent upper
confidence limit (UCL) of the mean concentration coupled with the exposure levels that
can also represent an upper bound exposure level. The CT presents average exposure,
and approximates the most probable exposure conditions.
The CT and RME exposure point concentration (EPC) values for the various exposure
scenarios were determined based on the observed data distribution and the percentage
of censored data points (non-detected results). Attachment F contains a detailed
description of the statistical methods used to determine the CT and RME values.
3.3.1 EXPOSURE POINT CONCENTRATIONS
This subsection of the risk assessment provides the exposure point concentrations that
will be used in the process of estimating intake for the identified receptors.
The exposure point concentration for the Municipal Wells are shown in Table E.3.1 and
show the 95 percent UCL concentration of COPCs from the wells collected between 1999
and 2001.] Samples where COPC levels were not detected, the detection limits were
used in the calculation of the 95 percent UCL concentration. The treatment of the
non-detects and calculation of the 95 percent UCL for groundwater were performed
using statistical methodologies consistent with U.S. EPA 1992, 2002d, and 2004c
guidance as shown in Attachment F.
Consistent with U.S. EPA guidance (U.S. EPA, 1989) the upper bound average, or
95 percent UCL concentration was used as the exposure point concentration for
groundwater, except for 1,2-DCA and ds-l,2-DCE, which used the maximumconcentration detected because the 95 percent UCL was greater than the maximum. The
95 percent UCL of the data from 1999, 2000, and 2001, were used in the RME calculation.
U.S. EPA's methods for statistically reducing the data were used, as shown in
Table E.3.1.
The 95 percent UCL concentration (or the maximum) was used to an indoor air COPC
exposure point concentrations. Indoor air concentrations were estimated using a
Volatilization Factor, developed by U.S. EPA (1991a), as recommended by U.S. EPA
Region VII. This approach estimates the amount of COPCs available for release from
tap water and estimates an ambient air concentration over a 24-hour period based on
It is noted that the assumed exposure scenario did not take into account public water supplyblending with water outside the Northern Study Area.
18925(21)APPLATTE E-11 CONESTOGA-ROVERS & ASSOCIATES
multiple uses of tap water, such as showering, bathing, dish washing, and clotheswashing.
It was also assumed that vapors from groundwater could add to the impacts from thefuture groundwater well scenario through vapor intrusion. The U.S. EPA's web-basedversion of the Johnson-Ettinger model was used to estimate an indoor air concentrationand risks associated with this pathway. This scenario used the exposure pointconcentrations for the future groundwater well in the Parkview/Stolley Park area. Themodeling process is discussed in Attachment G. With this scenario, vapors are assumedto migrate from groundwater to indoor air by volatilizing through the soil column andbuilding foundation. This scenario was also assumed for the future groundwater well inthe Northern Study Area, as described below.
3.3.2 ROUTE SPECIFIC INTAKE EQUATIONS
In the risk assessment, exposure estimates reflect chemical concentration, assumedcontact rate, assumed exposure time, and estimated body weight in a term called"intake" or "dose", which is an estimate based on their assumed intake rates, as providedin U.S. EPA guidance. This sub-section of the report provides route of entry-specificintake equations for the risk assessment. The U.S. EPA source of the intake equation isprovided with each equation.
Chemicals with potentially carcinogenic effects
Chemicals with potentially carcinogenic effects have varied and complex mechanism ofcancer development and exert effects at chemical specific levels through both thresholdand non-threshold mechanism (U.S. EPA, 1989). The U.S. EPA makes a number ofassumptions to simplify the risk assessment process including the assumption thatcancer caused by an environmental chemical develops over a lifetime, requiring thedevelopment of an average daily dose of a potentially carcinogenic COPCs. It is furtherassumed that the dose acts cumulatively over a lifetime of 70 years, giving an averagingtime (AT) of 70 years for potentially carcinogenic chemicals.
Chemicals with non-carcinogenic effects
All chemicals have non-carcinogenic effects, however, the toxicological action of eachchemical is varied and may work through different mechanisms, all of which areconsidered by U.S. EPA to be threshold mechanism; meaning there is a level of exposure
that can be considered without adverse effect (U.S. EPA, 1989). The U.S. EPA makes a
1892S(21)APPLATTE E-12 CONESTOGA-ROVERS & ASSOCIATES

number of assumptions to simplify the risk assessment process for chemicals with
non-carcinogenic effects, including the assumption that each chemical impacts a specific
target organ and the intake occurs over an exposure period or averaging time. The
averaging time selected depends on the toxic endpoint being assessed. Non-cancer
intakes and risk estimates were estimated for children only.
3.3.2.1 GROUNDWATER INGESTION INTAKE EQUATION
The intake equation for calculating chemical intake from the ingestion of water
(U.S. EPA, 1989) is:
. C x 1R x EF x ED/ = •
B W x A T
Where:
I = Chemical intake (mg/kg body weight/day);
C = Chemical concentration (mg/L);
IR = Ingestion rate (L water/day);
EF = Exposure frequency (days/year);
ED = Exposure duration (years);
BW = Body weight (kg); and
AT = Averaging time (averaging period, days).
18925 (21) APPL ATTE E-13 CONESTOGA-ROVERS & ASSOCIATES
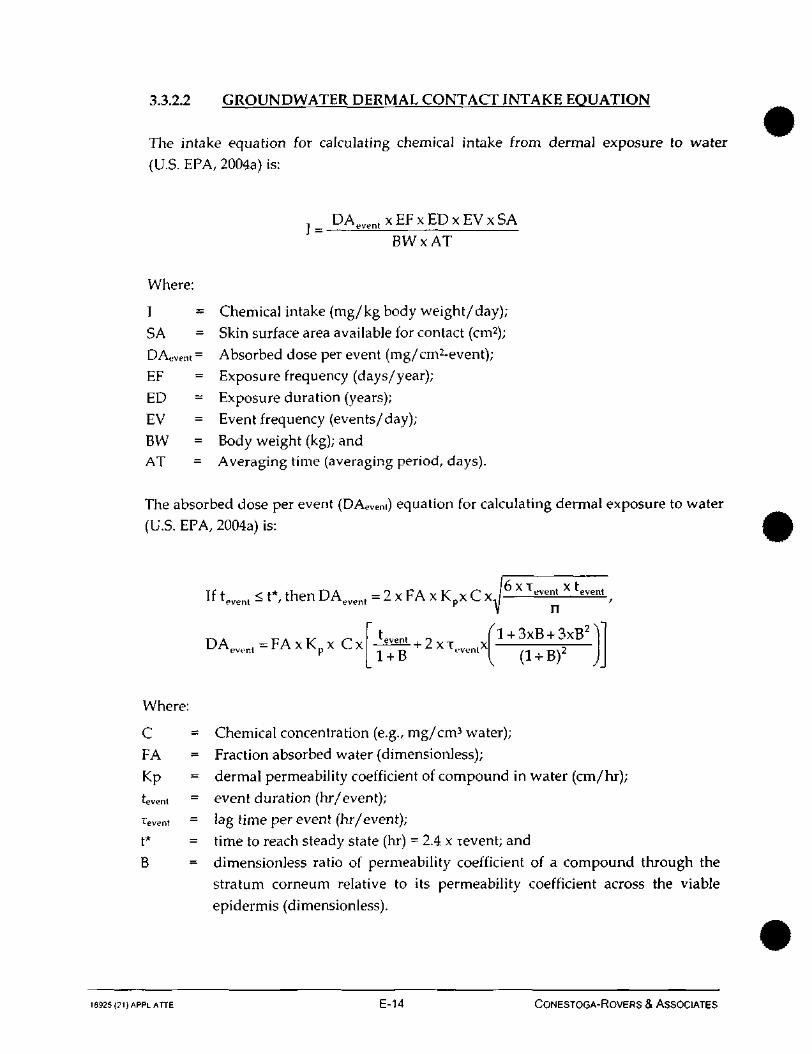
3.3.2.2 GROUNDWATER DERMAL CONTACT INTAKE EQUATION
The intake equation for calculating chemical intake from dermal exposure to water
(U.S. EPA, 2004a) is:
_ DAevent x EF x ED x EV x SAJ —
BWxAT
Where:
I = Chemical intake (mg/kg body weight/day);
SA = Skin surface area available for contact (cm2);
DAovent = Absorbed dose per event (mg/cm2-event);EF = Exposure frequency (days/year);
ED = Exposure duration (years);
EV = Event frequency (events/day);
BW = Body weight (kg); andAT = Averaging time (averaging period, days).
The absorbed dose per event (DAeVent) equation for calculating dermal exposure to water
(U.S. EPA, 2004a) is:
If tevent < t*, then DAevent = 2 x FA x KDx C XA< -e"' event6 * T * t
D A e v e n t = F A x K p x C x event+ 2 XT ,nl\\
n2
Where:
C = Chemical concentration (e.g., mg/cm3 water);
FA = Fraction absorbed water (dimensiordess);
Kp = dermal permeability coefficient of compound in water (cm/hr);
tevent = event duration (hr/event);
Tevent = lag time per event (hr/event);
t* = time to reach steady state (hr) = 2.4 x Tevent; and
B = dimensionless ratio of permeability coefficient of a compound through the
stratum corneum relative to its permeability coefficient across the viable
epidermis (dimensionless).
18925(21)APPLATTE E-14 CONESTOGA-ROVERS & ASSOCIATES
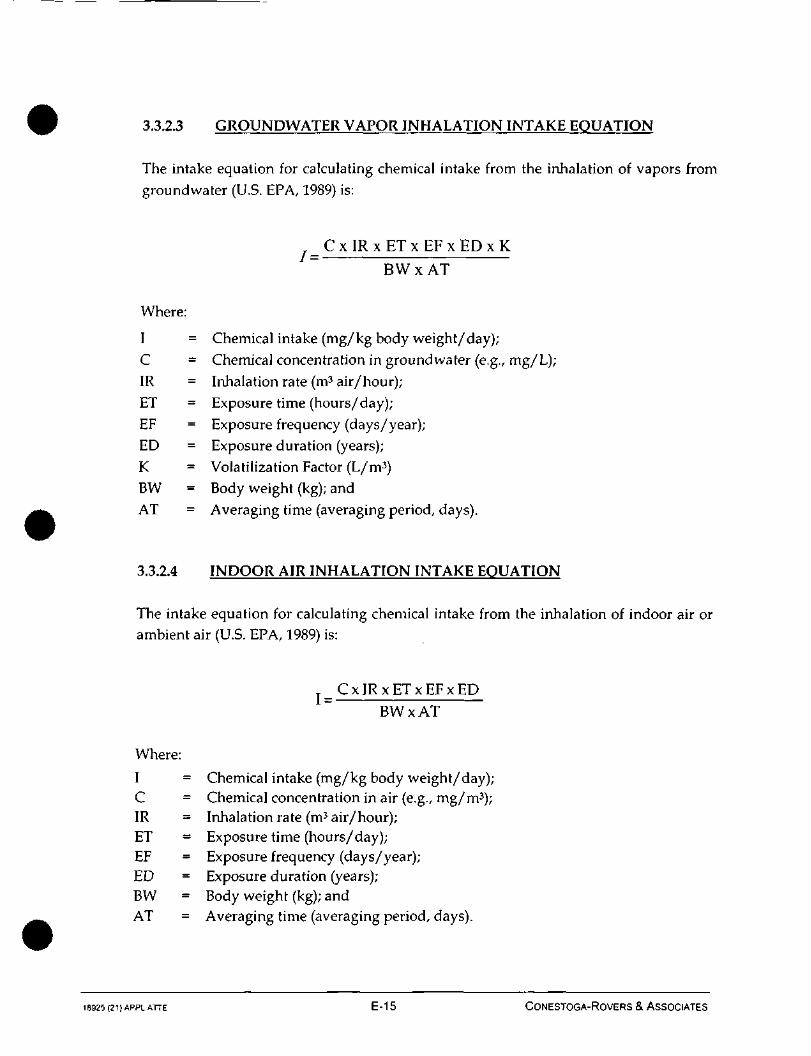
3.3.2.3 GROUNDWATER VAPOR INHALATION INTAKE EQUATION
The intake equation for calculating chemical intake from the inhalation of vapors from
groundwater (U.S. EPA, 1989) is:
C x I R x ET x EF x ED x KB W x A T
Where:
I = Chemical intake (mg/kg body weight/day);
C = Chemical concentration in groundwater (e.g., mg/L);
IR = Inhalation rate (m3 air/hour);
ET = Exposure time (hours/day);
EF = Exposure frequency (days/year);
ED = Exposure duration (years);
K = Volatilization Factor (L/m3)
BW = Body weight (kg); and
AT = Averaging time (averaging period, days).
3.3.2.4 INDOOR AIR INHALATION INTAKE EQUATION
The intake equation for calculating chemical intake from the inhalation of indoor air orambient air (U.S. EPA, 1989) is:
C _ x I R x E T x E F x E D
BWxAT
Where:
I = Chemical intake (mg/kg body weight/day);C = Chemical concentration in air (e.g., mg/m3);IR = Inhalation rate (m3 air/hour);ET = Exposure time (hours/day);EF = Exposure frequency (days/year);ED = Exposure duration (years);BW = Body weight (kg); andAT = Averaging time (averaging period, days).
18925 (21) APPLATTE E-15 CONESTOGA-ROVERS & ASSOCIATES

3.3.3 EXPOSURE ASSUMPTIONS
Different exposure scenarios were developed for each receptor population evaluated in
the risk assessment. Descriptions of each exposure scenario and associated exposure
assumptions are presented in the following subsections.
Receptor characteristics had values assigned for RME and CT scenarios, based on
U.S. EPA guidance. In some cases these values differed between scenarios
(e.g., exposure concentration, exposure frequency, etc.) and in other cases these values
were the same for both RME and CT scenarios (e.g., body weight, skin surface area, soil
ingestion rate, etc.). The assignment of receptor characteristics by scenarios followed
standard practices used by the U.S. EPA and risk assessment professionals. Where
default values were used, the value presented by U.S. EPA was selected.
3.3.3.1 RESIDENTIAL EXPOSURE
Table E.4.1 shows the assumptions used to estimate the resident exposure. The
exposure assumptions are as follows:
• The exposure point concentration was estimated for both CT and RME exposure
scenarios for the Municipal Wells, as shown in Table E.3.1.
• Water ingestion for a child was assumed to be 0.87 liters/day for CT and
1.5 liters/day RME, based on discussions with U.S. EPA Region VII (2005c) and
guidance (U.S. EPA, 1997). The ingestion rate for an adult was not used.
• The exposed skin surface area for dermal contact for a child 6,600 cm2 for the CT and
RME, per U.S. EPA (2004a).
• Skin permeability constants for the COPCs are chemical specific and were taken
from U.S. EPA (2004a) and are shown below.
18925(21)APPLATTE E-16 CONESTOGA-ROVERS & ASSOCIATES
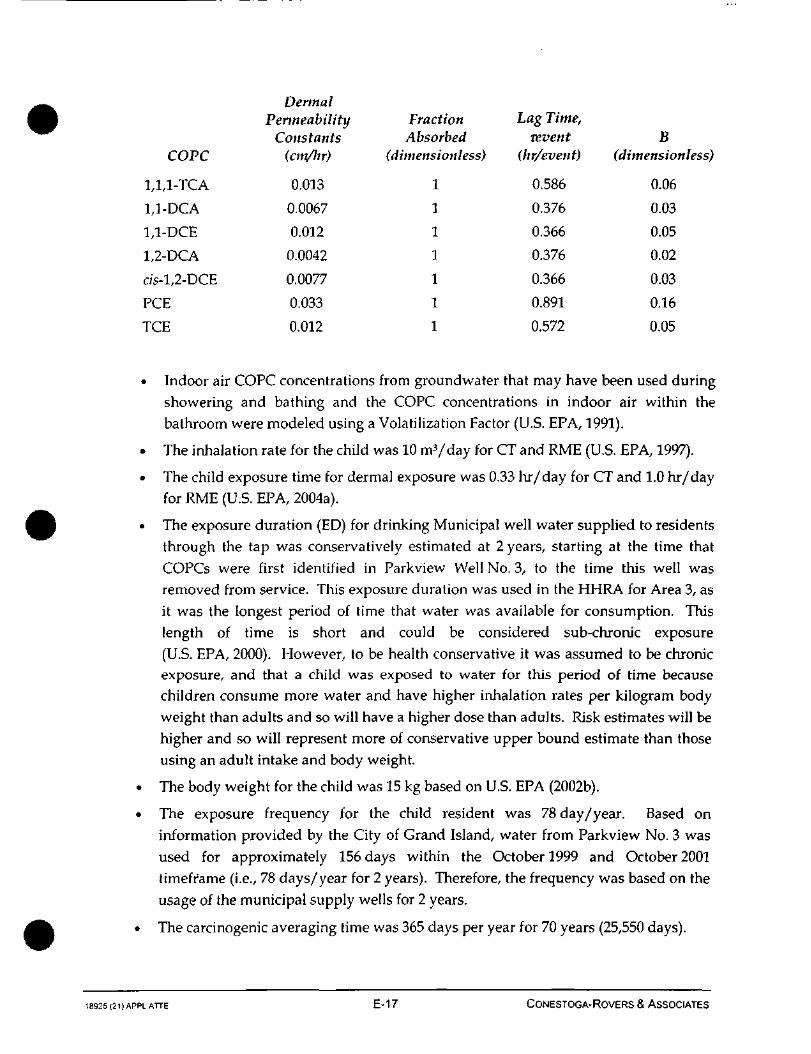
COPC
1,1,1-TCA
1,1-DCA
1,1-DCE
1,2-DCA
cis-l,2-DCE
PCE
TCE
DermalPermeability
Constants(cm/In)
0.013
0.0067
0.012
0.0042
0.0077
0.033
0.012
FractionAbsorbed
(dimensionless)
1
1
1
1
1
1
1
Lag Time,revent
(hr/event)
0.586
0.376
0.366
0.376
0.366
0.891
0.572
B(dimens io n less)
0.06
0.03
0.05
0.02
0.03
0.16
0.05
• Indoor air COPC concentrations from groundwater that may have been used duringshowering and bathing and the COPC concentrations in indoor air within thebathroom were modeled using a Volatilization Factor (U.S. EPA, 1991).
• The inhalation rate for the child was 10 m3/day for CT and RME (U.S. EPA, 1997).
• The child exposure time for dermal exposure was 0.33 hr/day for CT and 1.0 hr/dayfor RME (U.S. EPA, 2004a).
• The exposure duration (ED) for drinking Municipal well water supplied to residentsthrough the tap was conservatively estimated at 2 years, starting at the time thatCOPCs were first identified in Parkview Well No. 3, to the time this well wasremoved from service. This exposure duration was used in the HHRA for Area 3, asit was the longest period of time that water was available for consumption. Thislength of time is short and could be considered sub-chronic exposure(U.S. EPA, 2000). However, to be health conservative it was assumed to be chronicexposure, and that a child was exposed to water for this period of time becausechildren consume more water and have higher inhalation rates per kilogram bodyweight than adults and so will have a higher dose than adults. Risk estimates will behigher and so will represent more of conservative upper bound estimate than thoseusing an adult intake and body weight.
• The body weight for the child was 15 kg based on U.S. EPA (2002b).
• The exposure frequency for the child resident was 78 day/year. Based oninformation provided by the City of Grand Island, water from Parkview No. 3 wasused for approximately 156 days within the October 1999 and October 2001timeframe (i.e., 78 days/year for 2 years). Therefore, the frequency was based on theusage of the municipal supply wells for 2 years.
• The carcinogenic averaging time was 365 days per year for 70 years (25,550 days).
18925 (21 )APPL ATTE E-17 CONESTOGA-ROVERS & ASSOCIATES

The averaging time for non-carcinogens was 365 times ED.
3.3.3.2 INDOOR AIR EXPOSURE
The indoor air exposure for the residential wells was not evaluated using the residentialwell data, however the indoor air exposure was conservatively assumed to be the sameas the indoor air exposure prepared for Area 3: Future Groundwater Well inSection 3.3.3.7 of the HHRA. The exposure assumptions for the indoor air exposurebased on the future groundwater scenario have been duplicated below. Table C.4.2 ofAttachment C shows the assumptions used to estimate the resident exposure to indoorair volatilizing from the groundwater. The exposure assumptions are as follows:
• The exposure point concentration was estimated as described in Section 3.3.1.3 forboth CT and RME exposure scenarios for the future groundwater well, as shown inTable C.3.1 of Attachment C. Indoor air COPC concentrations from groundwaterwas modeled using the J&E model and the RME exposure point concentrationspresented in Table C.3.1 of Attachment C. A detailed description of the indoor airmodeling is presented in Attachment G.
• The inhalation rate for the child was 10 ntf/day for CT and RME (U.S. EPA, 1997),and the inhalation rate for an adult was 20m3/day for CT and RME (U.S. EPA,1991).
• The body weight for the child was 15 kg based on U.S. EPA (2002b)7 and 70 kg for anadult based on U.S. EPA (2004a).
• The future exposure duration for a resident was assumed to be 30 years: 6 years as achild and 24 years as an adult for the RME and 9 years: 6 years as a child and 3 yearsas an adult for the CT. For non-carcinogenic, exposure duration was 9 and 30 yearsfor the CT and RME, respectively for the adult and 6 years for both CT and RME for
the child.
• The exposure frequency for the child and adult resident was 350 days/year. Thisfrequency was based on the assumption that an individual would spend all year atone residence, with the exception of a 2-week vacation elsewhere.
• The carcinogenic averaging time was 365 days per year for 70 years (25,550 days).
• The averaging time for non-carcinogens was 365 times 30 years.
18925 (21) APPL ATTE E-18 CONESTOGA-ROVERS & ASSOCIATES

4.0 TOXICITY ASSESSMENT
The toxicity assessment weighs the available information regarding the potential for a
particular COPC to cause adverse effects in exposed individuals and estimates the extent
of exposure and possible severity of adverse effects. To develop toxicity values, two
steps are taken: hazard identification and dose-response assessment. The hazard
identification determines the potential adverse effects associated with exposure to a
COPC. In the dose-response assessment, numerical toxicity values are determined or
selected from the available toxicity data.
The U.S. EPA (2003) has recommended a hierarchy for the selection of toxicological
criteria in the risk assessment process. This hierarchy was followed, the extent possible,
in this HHRA:
• Tier 1 - U.S. EPA's IRIS;
• Tier 2 - U.S. EPA's Provisional Peer Reviewed Toxicity Values (PPRTVs); and
• Tier 3 - Other Toxicity Values.
U.S. EPA's Region IX PRG tables (U.S. EPA, 2004b) were used extensively as a Tier 3
source of toxicity values, even though these are considered a secondary source. Other
Tier 3 sources included the U.S. EPA's Health Effects Summary Tables (HEAST, 1997),
the National Center for Exposure Assessment, California EPA and the Agency for Toxic
Substances and Disease Registry (ATSDR, 2005).
As toxicological information becomes available on chemical compounds and elements,
the U.S. EPA will update its IRIS database by withdrawing toxicity values and listingnew ones. Occasionally, toxicity values are withdrawn before a replacement value is
approved through the extensive peer review process used by U.S. EPA. For this risk
assessment, the toxicity value for PCE was impacted by the lack of toxicity values listed
in IRIS because PCE is one of the primary COPCs driving the risks in the risk assessment
process.
The dose-response data for PCE recommended by the U.S. EPA's Office of Solid Waste
and Emergency Response on June 13, 2003 has been used in this HHRA; no value is
available in IRIS. This value is consistent with the California EPA values
(OEHHA, 2001). The lack of adequate peer review to list the PCE toxicity in IRIS will
increase the uncertainty in the risk assessment process.
18925(21)APPLATTE E-19 CONESTOGA-ROVERS & ASSOCIATES

4.1 NON-CARCINOGENIC HAZARDS
All chemicals have non-carcinogenic effects, or can adversely affect the body at somelevel of exposure, even distilled water. Therefore, it is important to determine the levelat which an adverse effect might occur.
For substances that have non-carcinogenic effects, the risk assessment processdistinguishes between acute and chronic exposure, and associated acute and chronichealth effects. In this risk assessment, where exposures are assumed to be chronic,health criteria are usually expressed as chronic intake levels [in units of milligrams ofCOPC per kilogram body weight per day (mg/(kg-day)], and are compared to levelsbelow which no adverse effects are expected, or a Reference Dose (RfD). In other words,there is a threshold level of exposure to a COPC below which no toxic effects areexpected. In contrast to the toxicological model used to assess carcinogenic risk, whichassumes there is no concentration threshold, the non-carcinogenic dose-response modelpostulates a "threshold".
In this risk assessment, chronic RfDs are used as the toxicity values for non-carcinogenichealth effects. A chronic RfD is defined, "An estimate (with uncertainty spanning anorder of magnitude or greater) of a daily exposure level for the human population,including sensitive sub-populations, that is likely to be without appreciable risk ofdeleterious effects during a lifetime". Uncertainty factors are incorporated into the RfDsto account for extrapolations from animal toxicity data, data quality, and to protectsensitive sub-populations. The basis of a RfD is usually the highest dose leveladministered to laboratory animals that did not cause observable adverse effects afterchronic exposure. This is called the No-Observed Adverse Effect Level (NOAEL). TheNOAEL is then divided by uncertainty factors, and sometimes an additional modifyingfactor, to obtain the RfD. In general, an uncertainty factor of 10 is used to account forinterspecies variation and another factor of 10 to account for sensitive humanpopulations. Additional factors of 10 are included in the uncertainty factor if the RfD isbased on the Lowest Observed Adverse Effect Level (LOAEL) instead of the NOAEL, orif data inadequacies are present (e.g., the experiment for which the RfD was derived hadless than lifetime exposure). The LOAEL is the dose level administered to laboratoryanimals that causes the lowest adverse effect (i.e., liver toxicity - although this is speciesand chemical-specific) after chronic exposure.
Table 4.1 of the HHRA presents the non-carcinogenic toxicity data (RfDs) used toestimate human health effects for oral and dermal exposure routes for all exposure
areas. The dermal toxicity data presented in Table 4.1 of the HHRA was adjusted
18925(21)APPLATTE E-20 CONESTOGA-ROVERS & ASSOCIATES
consistent with U.S. EPA (2004a) guidance. Table 4.2 of the HHRA presents RfDs used
for the inhalation exposure route for all exposure areas.
4.2 CARCINOGENIC RISKS
Cancer Slope Factors (CSFs) are quantitative dose-response factors used to estimate risk
from chemicals with potential carcinogenic effects. Slope factors relate the probability of
excess cancers, over background, to the lifetime average exposure dose of a substance.
CSFs are typically estimated from animal carcinogenicity study dose-response data
using mathematical extrapolation models, to relate animal exposure at high doses to
potential adverse effects in humans at low dose, and are presented as the reciprocal ofdose risk, or 1 divided by milligram of COPC/(kilogram body weight-day)
[i.e., (mg/kg-day)-1]. U.S. EPA's cancer risk assessment guideline (U.S. EPA, 2005)
emphasize that a chemical's mode of action is important when developing cancer slope
factors for chemicals in the IRIS database. The 2005 guidelines also consider weight of
evidence, structure activity relationships and tumor type when evaluating a chemical.
Mathematical models are still proposed to extrapolate high dose animal data to low dose
human effect, but these models will be selected based on a number of chemical-specificfactors.
The slope factors used in this HHRA were developed using guidance from prior to 2005.
Many of these models assume low dose-response linearity and thus, may not be
appropriate for some suspected carcinogens, in particular those that function as cancer
promoters, and chemicals that act through threshold mechanisms.
Known or suspect human carcinogens have been evaluated and identified by theCarcinogen Assessment Group using the U.S. EPA Weight-of-Evidence approach for
carcinogenicity classification (HEAST, 1997). The U.S. EPA classification is based on anevaluation of the likelihood that the agent is a human carcinogen. The evidence is
characterized separately for human and animal studies as follows:
Group A: Known Human Carcinogen (sufficient evidence of carcinogenicity inhumans);
Group B: Probable Human Carcinogen (Bl - limited evidence of carcinogenicity in
humans; B2 - sufficient evidence of carcinogenicity in animals withinadequate or lack of evidence in humans);
Group C: Possible Human Carcinogen (limited evidence of carcinogenicity in
animals and inadequate or lack of human data);
18925 (21JAPPLATTE E-21 CONESTOGA-ROVERS & ASSOCIATES
Group D: Not Classifiable as to Human Carcinogenicity (inadequate or noevidence); and
Group E: Evidence of Non-carcinogenicity for Humans (no evidence ofcarcinogenicity in animal studies).
The COPCs were classified utilizing the U.S. EPA system. Table 4.3 of the HHRApresents the cancer toxicity data (CSFs) used in the HHRA to estimate the risk of cancerfor the oral and dermal exposure routes for all exposure areas. The dermal toxicity datapresented in Table 4.3 of the HHRA was adjusted consistent with U.S. EPA (2004a)guidance. Table 4.4 of the HHRA presents CSFs for the inhalation exposure route for allexposure areas.
4.3 TOXICOLOGICAL SUMMARIES FOR THE COPCs
A detailed lexicologically summary for the COPCs is provided in Attachment I.
18925 (21) APPL ATTE E-22 CONESTOGA-ROVERS & ASSOCIATES

5.0 RISK CHARACTERIZATION
The objective of this risk characterization is to integrate information developed in theExposure Assessment (Section 3.0), for complete exposure pathways, for detectedCOPCs that exceeded screening levels, and the Toxicity Assessment (Section 4.0) into anevaluation of the potential human health risks associated with exposure to potentiallycontaminated groundwater and air in the area. The methods used in this riskcharacterization are based on U.S. EPA guidance for human exposures (U.S. EPA, 1989,1991a, 1997, 2001, 2002a, 2002b, 2004a).
5.1 HAZARD ESTIMATES
The potential for non-cancer health effects from exposure to a COPC is evaluated bycomparing an exposure level over a specified time period to the RfD for the COPC overa similar exposure period. This ratio, termed the hazard quotient, is calculatedaccording to the following general equation:
RfDWhere:
HQ = The Hazard Quotient (unitless) is the ratio of the exposure dose of achemical to a reference dose not expected to cause adverse effects from alifetime exposure. A hazard quotient equal to or below 1.0 is consideredprotective of human health2.
CDI = The Chronic Daily Intake is the chemical dose calculated by applying theexposure scenario assumptions and expressed as mg/(kg-day). Theintake represents the average daily chemical dose over the expectedperiod of exposure.
RfD = The Reference Dose is a daily dose believed not to cause an adverse effectfrom even a lifetime exposure [mg/(kg-day)].
COPCs may exert a toxic effect on different target organs, however, for the purposes ofthis risk assessment, non-carcinogenic effects were not differentiated for each targetorgan. This assumption implies that all chemicals act at the same target organ, which
"Where the cumulative carcinogenic site risk to an individual based on reasonable maximumexposure for both current and future land use is less than 10-4 and the non-carcinogenic hazardquotient is less than 1, action generally is not warranted unless there are adverse environmentalimpacts." (U.S. EPA, 1991).
18925 (211APPLATTE ' E-23 CONESTOGA-ROVERS & ASSOCIATES
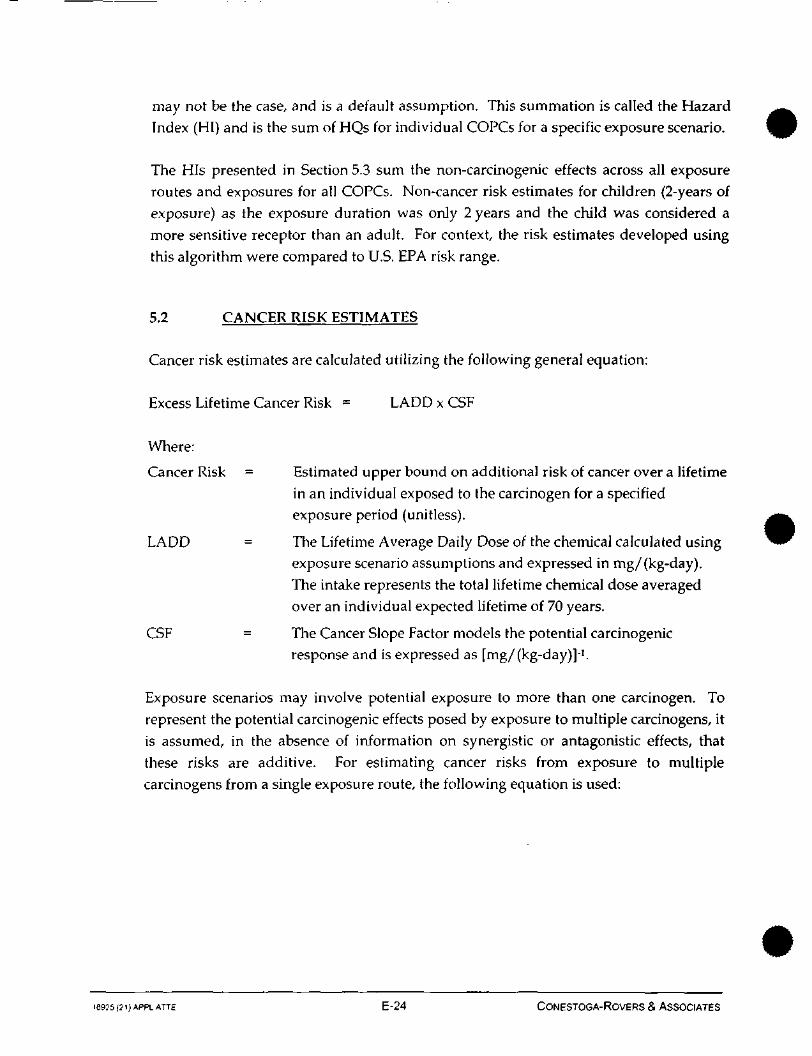
may not be the case, and is a default assumption. This summation is called the Hazard
Index (HI) and is the sum of HQs for individual COPCs for a specific exposure scenario.
The His presented in Section 5.3 sum the non-carcinogenic effects across all exposure
routes and exposures for all COPCs. Non-cancer risk estimates for children (2-years of
exposure) as the exposure duration was onJy 2 years and the child was considered a
more sensitive receptor than an adult. For context, the risk estimates developed using
this algorithm were compared to U.S. EPA risk range.
5.2 CANCER RISK ESTIMATES
Cancer risk estimates are calculated utilizing the following general equation:
Excess Lifetime Cancer Risk = LADD x CSF
Where:
Cancer Risk = Estimated upper bound on additional risk of cancer over a lifetime
in an individual exposed to the carcinogen for a specifiedexposure period (unitless).
LADD = The Lifetime Average Daily Dose of the chemical calculated usingexposure scenario assumptions and expressed in mg/(kg-day).
The intake represents the total lifetime chemical dose averaged
over an individual expected lifetime of 70 years.
CSF = The Cancer Slope Factor models the potential carcinogenic
response and is expressed as fmg/(kg-day)]-1.
Exposure scenarios may involve potential exposure to more than one carcinogen. To
represent the potential carcinogenic effects posed by exposure to multiple carcinogens, it
is assumed, in the absence of information on synergistic or antagonistic effects, that
these risks are additive. For estimating cancer risks from exposure to multiple
carcinogens from a single exposure route, the following equation is used:
18925(2i)APPLATTE E-24 CONESTOGA-ROVERS & ASSOCIATES

NRiskT = Riskj
Where:
Risky = Total cancer risk from route of exposure
Riski = Cancer risk for the chemical
N = Number of chemicals
The cumulative potential carcinogenic risk estimates are presented and discussed inSection 5.3. Risk estimates were for a child (2 years) exposure as the exposure durationwas only 2 years and the child was considered a more sensitive receptor than an adult.The potential cumulative risks resulting from exposure to the COPCs are compared tothe target cumulative target risk range provided by U.S. EPA of 1 x 1(M or 1 in 10,000 to1 x 10-* or 1 in 1,000,000, as indicated by U.S. EPA, "Where the cumulative carcinogenic siterisk to an individual based on reasonable maximum exposure for both current and future land useis less than JCM and the non-carcinogenic hazard quotient is less than 1, action generally is notwarranted unless there are adverse environmental impacts." (U.S. EPA, 1991)
5.3 RISK QUANTIFICATION SUMMARY
The hazard indices and excess lifetime cancer risks for the various exposure scenariosfor each area evaluated in the risk assessment are presented below. Note that onlymedia and exposure pathways for which the COPC were detected have been included.
Past exposure to Municipal Well water risk estimates were developed by assuming thata resident ingested the water, exposed to the COPCs from the use of water (showering,washing clothes and dishes, etc.) through dermal contact and from the inhalation of
indoor air vapors. Inhalation of vapors migrating from groundwater to indoor air as aresult of vapor intrusion was also evaluated. Exposure is assumed to occur at the ratesspecified in the exposure assessment section of the text. The excess lifetime cancer riskand the non-cancer risks for a child were estimated, as shown in Table E.7.1.CT andTable D.7.1.RME and summarized below.
These tables show both the risks for each COPC by pathway and for all COPCs as a sumof all exposure pathways quantified for this receptor for both RME and CT exposures.
18925 (21) APPLATTE E-25 CONESTOGA-ROVERS & ASSOCIATES
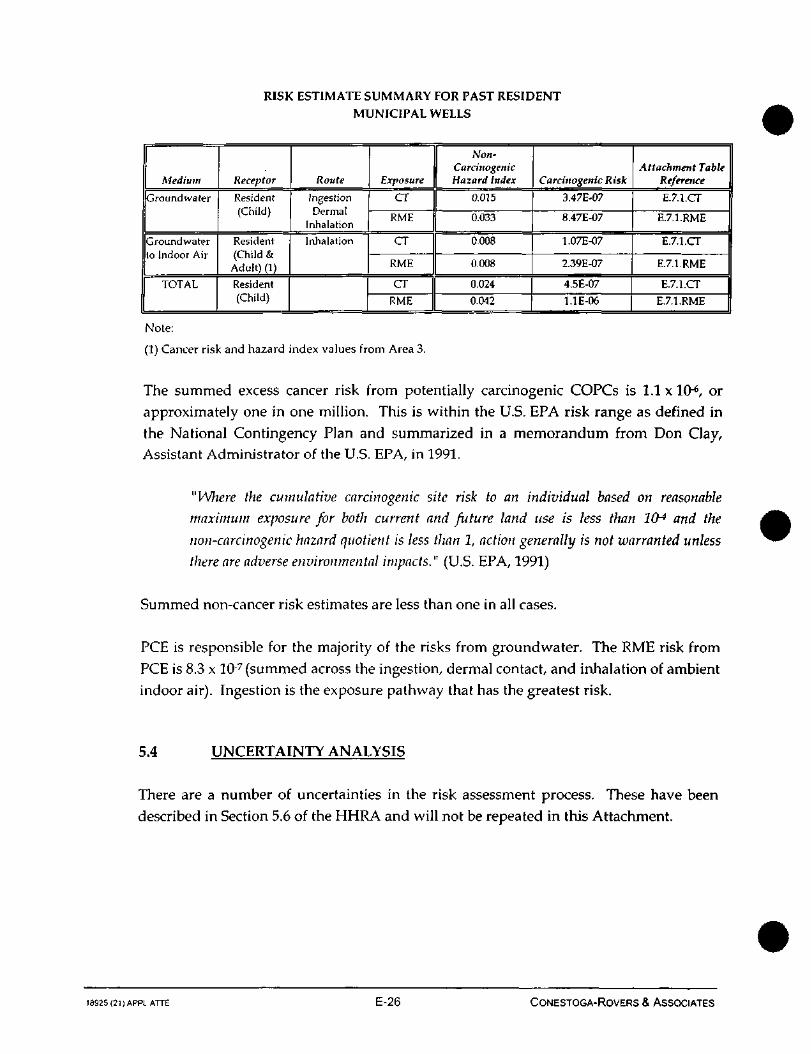
RISK ESTIMATE SUMMARY FOR PAST RESIDENT
MUNICIPAL WELLS
Medium
Groundwater
Groundwaterto Indoor Air
TOTAL
Receptor
Resident(Child)
Resident(Child &
Adult) (1)
Resident(Child)
Route
IngestionDermal
Inhalation
Inhalation
Exposure
CT
RME
CT
RME
CT
RME
Non-CarciuogetiicHazard Index
0.015
0.033
0.008
0.008
0.024
0.042
Carcinogenic Risk
3.47E-07
8.47E-07
1.07E-07
2.39E-07
4.5E-07
1.1E-06
Attachment TableReference
E.7.1.CT
E.7.1.RME
E.7.1.CT
E.7.1.RME
E.7.1.CT
E.7.1.RME
Note:
(1) Cancer risk and hazard index values from Area 3.
The summed excess cancer risk from potentially carcinogenic COPCs is 1.1 x 10⁶, orapproximately one in one million. This is within the U.S. EPA risk range as defined inthe National Contingency Plan and summarized in a memorandum from Don Clay,Assistant Administrator of the U.S. EPA, in 1991.
"Where the cumulative carcinogenic site risk to an individual based on reasonable
maximum exposure for both current and future land use is less than 1O4 and the
non-carcinogenic hazard quotient is less than 1, action generally is not warranted unless
there are adverse environmental impacts." (U.S. EPA, 1991)
Summed non-cancer risk estimates are less than one in all cases.
PCE is responsible for the majority of the risks from groundwater. The RME risk fromPCE is 8.3 x 10⁷ (summed across the ingestion, dermal contact, and inhalation of ambientindoor air). Ingestion is the exposure pathway that has the greatest risk.
5.4 UNCERTAINTY ANALYSIS
There are a number of uncertainties in the risk assessment process. These have beendescribed in Section 5.6 of the HHRA and will not be repeated in this Attachment.
18925(21) APPL ATTE E-26 CONESTOGA-ROVERS & ASSOCIATES

6.0 REFERENCES
Agency for Toxic Substances and Disease Registry (ATSDR, 2005). Toxicological Profilefor 1,2-Dichloroethane, December 2005.
American Society for Testing and Materials (ASTM), 1998. Standard Provisional Guidefor Risk-Based Corrective Action. West Conshohocken, PA. ASTM PS104-98.
California Environmental Protection Agency (2002). Toxicity Criteria Database,December, 2002.
HEAST, 1997. U.S. EPA Health Effects Assessment Summary Tables (HEAST), July 1,1997.
OEHHA, 2001. Public Health Goal for Tetrachloroethylene in Drinking Water, Office ofEnvironmental Health Hazard Assessment, California Environmental ProtectionAgency, August, 2001.
ORNL, 1993. Toxicity Summary For Trichloroethene Prepared by: Rosemarie A. Faust,Ph.D, Chemical Hazard Evaluation Group, Biomedical EnvironmentalInformation Analysis Section, Health and Safety Research Division, Oak Ridge,
Tennessee, March 1993. http://risk.lsd.ornl.gov/tox/profiles/trichloroethene_f_Vl.shtrrd
Risk Assessment Information System (RAIS), 2006.http://risk.lsd. ornl.gov/tox/rap_toxp.shtml
U.S. EPA, 1989. Risk Assessment Guidance for Superfund (RAGS) Interim Final,EPA/540/1-89/002, December 1989.
U.S. EPA, 199la. Risk Assessment Guidance for Superfund, Volume 1: Human HealthEvaluation Manual - Supplemental Guidance, Standard Default ExposureFactors, Interim Final, OSWER Directive 9285.6-03.
U.S. EPA, 1991b. Risk Assessment Guidance for Superfund Vol. 1: Human Health
Evaluation Manual (Part B, Development of Risk-Based Preliminary RemediationGoals), Publication 9285.7-01 B.
U.S. EPA, 1992. U.S.EPA Supplemental Guidance to RAGS: Calculating theConcentration Term, OSWER Directive 9285.7-081, May 1992.
U.S. EPA, 1994. Evaluating and Identifying Contaminants of Concern for HumanHealth, Region 8, Superfund Technical Guidance, United States EnvironmentalProtection Agency, Superfund Management Branch, September 1994.
U.S. EPA, 1995. Assessing Dermal Guidance Exposure from Soil, Region III Technical
Guidance Manual Risk Assessment, EPA/903-K-95-003, December 1995.
U.S. EPA, 1997. Exposure Factors Handbook, EPA/600/P-95/002F, August 1997.
18925 (21 )APPLATTE E-27 CONESTOGA-ROVERS & ASSOCIATES

U.S. EPA, 1998. Office of Solid Waste and Emergency Response (OSWER). Clarification
to the 1994 Revised Interim Soil Lead Guidance for CERCLA Sites and RCRA
Corrective Action Facilities. OSWER Directive No. 9200.4-27P. Washington, DC.
U.S. EPA, 1999. Derivation of a Volatilization Factor to estimate upper bound exposure
point concentrations for a worker in trenches flooded with water off-gassing
volatile organic chemicals, Memorandum from Helen Dawson to Tracy Eagle,
8EPR-PS, U.S. EPA Region VIII, July 1999.
U.S. EPA, 2000. Supplemental Guidance to RAGS: Region 4 Bulletins, Human Health
Risk Assessment Bulletins. EPA Region 4, originally published November 1995,
Website version last updated May 2000:
http://www.epa.gov/region4/waste/oftecser/healtbul.htm
U.S. EPA, 2001a. Risk Assessment Guidance for Superfund, Volume 1: Human HealthEvaluation Manual (Part D, Standardized Planning, Reporting, and Review of
Superfund Risk Assessments) Interim, Publication 9285.7-01D, December 2001.
U.S. EPA, 2001b. Trichloroethene Health Risk Assessment: Synthesis andCharacterization. Office of Research and Development, EPA/600/P-01/002A,August 2001.
U.S. EPA, 2002a. Vapor Intrusion to Indoor Air Pathway from Groundwater and Soils,
OSWER, EPA530-D-02-004, November 2002.
U.S. EPA, 2002b. Child-Specific Exposure Factors Handbook, September.
U.S. EPA, 2002c. Supplemental Guidance for Developing Soil Screening Levels forSuperfund Sites, OSWER 9355.4-24, December 2002.
U.S.EPA, 2002d. Calculating Upper Confidence Limits for Exposure Point
Concentrations at Hazardous Waste Sites, Office of Emergency and Remedial
Response, OSWER 9285.6-10, December 2002.
U.S. EPA, 2004a. U.S. EPA Risk Assessment Guidance for Superfund, Volume 1, Human
Health Evaluation Manual, Part E: Supplemental Guidance for Dermal Risk
Assessment, EPA/540/R/99/005, July 2004.
U.S. EPA, 2004b. Region IX PRG tables, October 2004.
U.S.EPA, 2004c. ProUCL User's Guide, version 3.0, April, 2004.
U.S. EPA, 2004d. Region VII Fact Sheet for the Parkview Wells, 2004.
U.S. EPA, 2005a. Guidelines for Carcinogen Risk Assessment, Risk Assessment Forum,EPA/630/P-03/001F, March 2005.
18925(21)APPLATTE E-28 CONESTOGA-ROVERS & ASSOCIATES
U.S. EPA, 2005b. Application of New Cancer Guidelines, Memorandum from the
Administrator to assistant Administrators, March 29, 2005.
U.S. EPA, 2005c. Personal Communication: Region VII, December 2005.
U.S. EPA, 2006. U.S. EPA Integrated Risk Information System, January 2006
(www.epa.gov/ iris).
18925 (21) APPLATTE E-29 CONESTOGA-ROVERS & ASSOCIATES
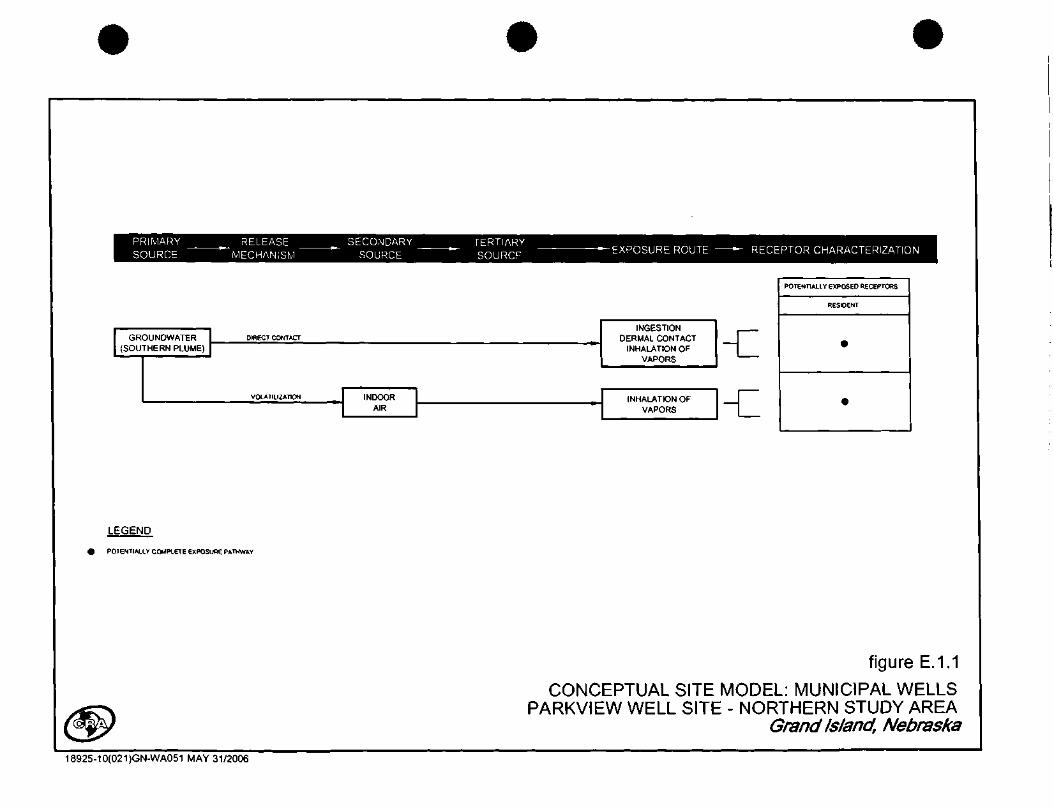
PRIMARYSOURCE
RELEASE'MECHANISM
SECONDARYSOURCE
TERTIARYSOURCE •EXPOSURE ROUTE RECEPTOR CHARACTERIZATION
GROUNDWATER(SOUTHERN PLUME)
DIRECT CONTACT
INGESTIONDERMAL CONTACT
INHALATION OFVAPORS
VOLATILIZATION INHALATION OFVAPORS
POTENTIALLY EXPOSED RECEPTORS
LEGEND
POTENTIALLY COMPLETE EXPOSURE PATHWAY
figure E.1.1
CONCEPTUAL SITE MODEL: MUNICIPAL WELLSPARKVIEW WELL SITE - NORTHERN STUDY AREA
Grand Island, Nebraska
18925-10(021)GN-WA051 MAY 31/2006
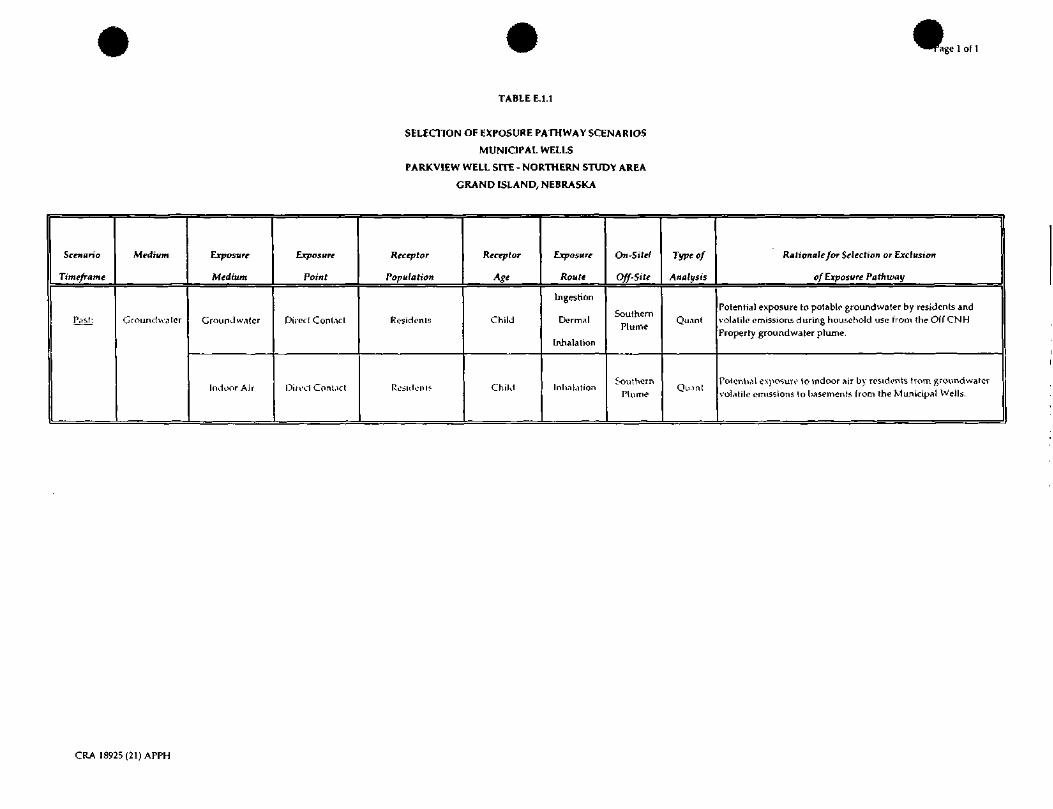
'age 1 of 1
TABLE E.1.1
SELECTION OF EXPOSURE PATHWAY SCENARIOS
MUNICIPAL WELLS
PARKVIEW WELL SITE - NORTHERN STUDY AREA
GRAND ISLAND, NEBRASKA
Scenario
Timeframe
P.isl:
Medium
Groundw.iter
Exposure
Medium
Groundwalcr
Indoor Aii
Exposure
Point
Direct Contact
Diivct Conl.ict
Receptor
Population
Residents
Resident?
Receptor
Age
Child
Child
Exposure
Route
Ingestion
Dermal
Inhalation
Inh.il.ition
On -Site!
Off-Site
SouthernPlume
SouthernPlume
Type of
Analysis
Qunnt
Qu.inl
Rationale for Selection or Exclusion
of Exposure Pathway
Potential exposure to potable groundwaler by residents andvolatile emissions during household use From the Off CNHProperty groundwater plume.
Potential exposure to indoor air by residents trom groundwatervolati le emissions to basements from the Municipal Wells.
CRA 18925(21) APPH
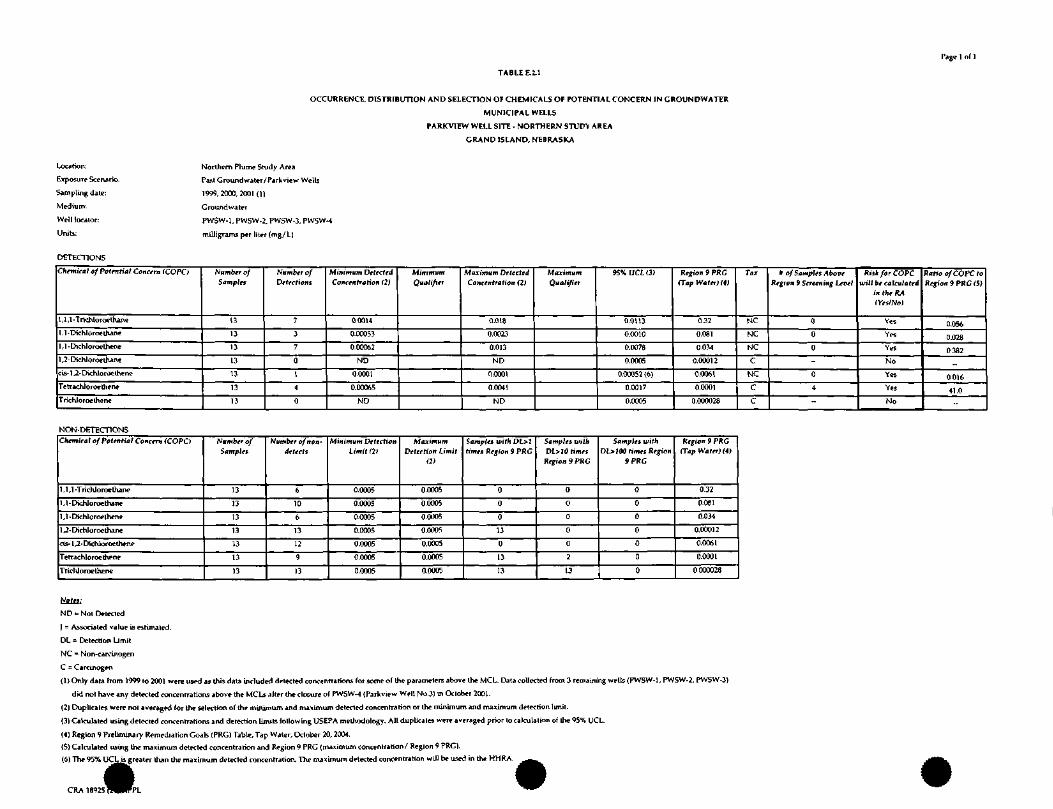
Page 1 of 1
OCCURRENCE, DISTRIBUTION AND SELECTION OF CHEMICALS OF POTENTIAL CONCERN IN GROUNDWATER
MUNICIPAL WELLS
PARKVIEW WELL SITE - NORTHERN STUDY AREA
GRAND ISLAND, NEBRASKA
Location:
Exposure Scenario:
Sampling date:
Medium:
Well locator:
Units:
DETECTIONS
Northern Plume Study Area
Past Groundwater/Partview Wells
1999,2000,2001 (1)
Croundwater
PWSW-1, PWSW-2, PWSW-3, PWSW-4
milligrams per liter (mg/L)
Chemical of Potential Concern fCOPC)
U.l-Trichloioethane
1 , 1 -Dichloroethane
1,1-Dichloroethene
1,2-Dichloroethane
cis- 1 ,2- Dichloroclhene
retrachloroethene
Trichloroethene
Number of
Samples
13
13
13
13
13
13
13
Number ofDetections
7
3
7
0
1
4
0
Minimum DetectedConcentration (2)
0.0014
0.00053
0.00062
ND
0.0001
0.00065
ND
MinimumQualifier
Maximum DetectedConcentration ft)
0.018
0.0023
0.013
ND
0.0001
0.0041
ND
MaximumQualifier
95% UCL <3>
0.0113
0.0010
0.0078
0.0005
0.00052 (6)
0.0017
0.0005
Region 9 PRG(Tap Water) rt)
0.32
0.081
0.034
0.00012
0.0061
0.0001
0.000028
Tor
NC
NC
NC
C
NC
C
C
# of Samples AboveRegion 9 Screening Level
0
0
0
-0
4
-
Risk for COPCwill be calculated
in the RA(Yes/No)
Yes
Yes
Yes
No
Yes
Yes
No
Ratio of COPC toRegion 9 PRO (5)
0.056
0.028
0.382
..
0016
41.0
NON-DETECTIONSChemical of Potential Concern (COPC)
1 , 1 , 1 -Trichloroe thane
1,1-Dichloroethane
1,1-Dichloroethene
1 ,2-Dichloroethane
cis- 1 ,2-Dichloroethene
Tetrachloroethene
Trichloroethene
Number of
Samples
13
13
13
13
13
13
13
Number ofnon-detects
6
10
6
13
12
9
13
Minimum DetectionLimit 121
0.0005
0.0005
0.0005
0.0005
0.0005
0.0005
0.0005
MaximumDetection Limit
m
0.0005
0.0005
0.0005
0.0005
0.0005
0.0005
0.0005
Samples with DL>7times Region 9 PRG
0
0
0
13
0
13
13
Samples withDL>10 timesRegion 9 PRG
0
0
0
0
0
2
13
Samples withDL>100 times Region
9 PRG
0
0
0
0
0
0
0
Region 9 PRG(Tap Water) (4)
0.32
0.081
0.034
0.00012
0.0061
0.0001
0.000028
Notes:
ND = Not Detected
] = Associated value is estimated.
DL = Detection Limit
NC = Non-carcinogen
C = Carcinogen
(1) Only data from 1999 to 2001 were used as this data included detected concentrations for some of the parameters above the MCL. Data collected from 3 remaining wells (PWSW-1, PWSW-2, PWSW-3)
did not have any delected concentrations above the MCLs after the closure of PWSW-4 (Parkview WeM No.3} in October 2001.
(2) Duplicates were not averaged for the selection of the minimum and maximum detected concentration or the minimum and maximum detection limit.
(3) Calculated using delected concentrations and detection limits following USEPA methodology. All duplicates were averaged prior to calculation of the 95% UCL.
(4) Region 9 Preliminary Remediation Goals (PRG) Table, Tap Water, October 20, 2004.
(5) Calculated using the maximum detected concentration and Region 9 PRG (maximum concentration/ Region 9 PRG).
(6) The 95% UCLis greater than the maximum delected concentration. The maximum detected concentration will be used in the HHRA.
CRA18925?
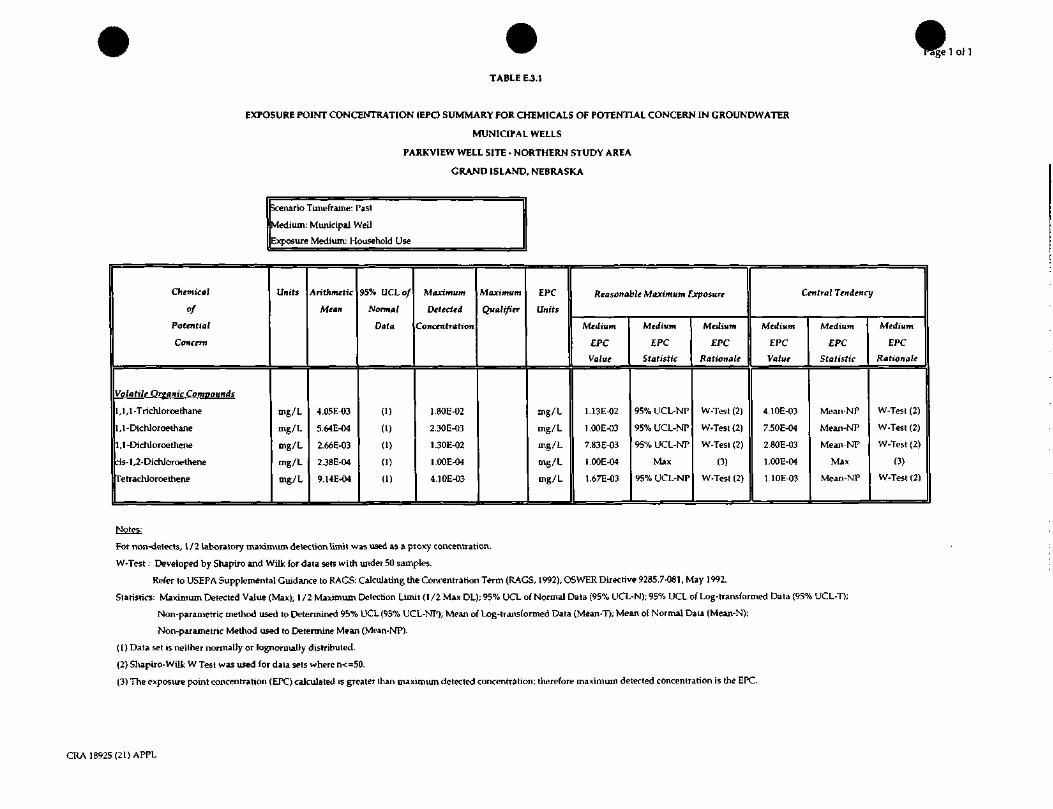
raceIge 1 of 1
TABLE EJ.l
MUNICIPAL WELLS
PARKVIEW WELL SITE - NORTHERN STUDY AREA
GRAND ISLAND, NEBRASKA
Scenario Timeframe: Past
Medium: Municipal Well
Exposure Medium: Household Use
Chemical
of
Potential
Concern
Volatile Organic Compounds
1,1,1-Trichloroethane
1 ,1 -Dichloroe thane
1 ,1 -Dichloroethene
ris-l,2-Dichloroethene
retrachloroethene
Units
mg/L
mg/L
mg/L
mg/L
mg/L
Arithmetic
Mean
4.05E-03
5.64E-04
2.66E-03
2.38E-04
9.14E-04
95% UCLof
Normal
Data
(1)
(1)
(1)
(1)
(1)
Maximum
Detected
Concentration
1.80E-02
2.30E-03
1.30E-02
l.OOE-04
4.10E-03
Maximum
Qualifier
EPC
Units
mg/L
mg/L
mg/L
mg/L
mg/L
Reasonable Maximum Exposure
Medium
EPC
Value
1.13E-02
l.OOE-03
7.83E-03
l.OOE-04
1.67E-03
Medium
EPC
Statistic
95% UCL-NP
95% UCL-NP
95% UCL-NT
Max
95% UCL-NP
Medium
EPC
Rationale
W-Test (2)
W-Test (2)
W-Test (2)
(3)
W-Test (2)
Central Tendency
Medium
EPC
Value
4.10E-03
7.50E-04
2.80E-03
l.OOE-04
1.10E-03
Medium
EPC
Statistic
Mean-NP
Mean-NP
Mean-NP
Max
Mean-NP
Medium
EPC
Rationale
W-Test (2)
W-Test (2)
W-Test (2)
(3)
W-Test (2)
Notes:
For non-detects, 1/2 laboratory maximum detection limit was used as a proxy concentration.
W-Test: Developed by Shapiro and Wilk for data sets with under 50 samples.
Refer to USEPA Supplemental Guidance to RAGS: Calculating the Concentration Term (RAGS, 1992), OSWER Directive 9285.7-081, May 1992.
Statistics: Maximum Detected Value (Max); 1/2 Maximum Detection Limit (1/2 Max DL); 95% UCL of Normal Data (95% UCL-N); 95% UCL of Log-transformed Data (95% UCL-T);
Non-parametric method used to Determined 95% UCL (95% UCL-NP); Mean of Log-transformed Data (Mean-T); Mean of Normal Dala (Mean-N);
Non-parametric Method used to Determine Mean (Mean-NP).
(1) Data set is neither normally or lognormally distributed.
(2) Shapiro-Wilk W Test was used for data sets where n<=50.
(3) The exposure point concentration (EPC) calculated is greater than maximum detected concentration; therefore maximum detected concentration is the EPC.
CRA18925(21)APPL
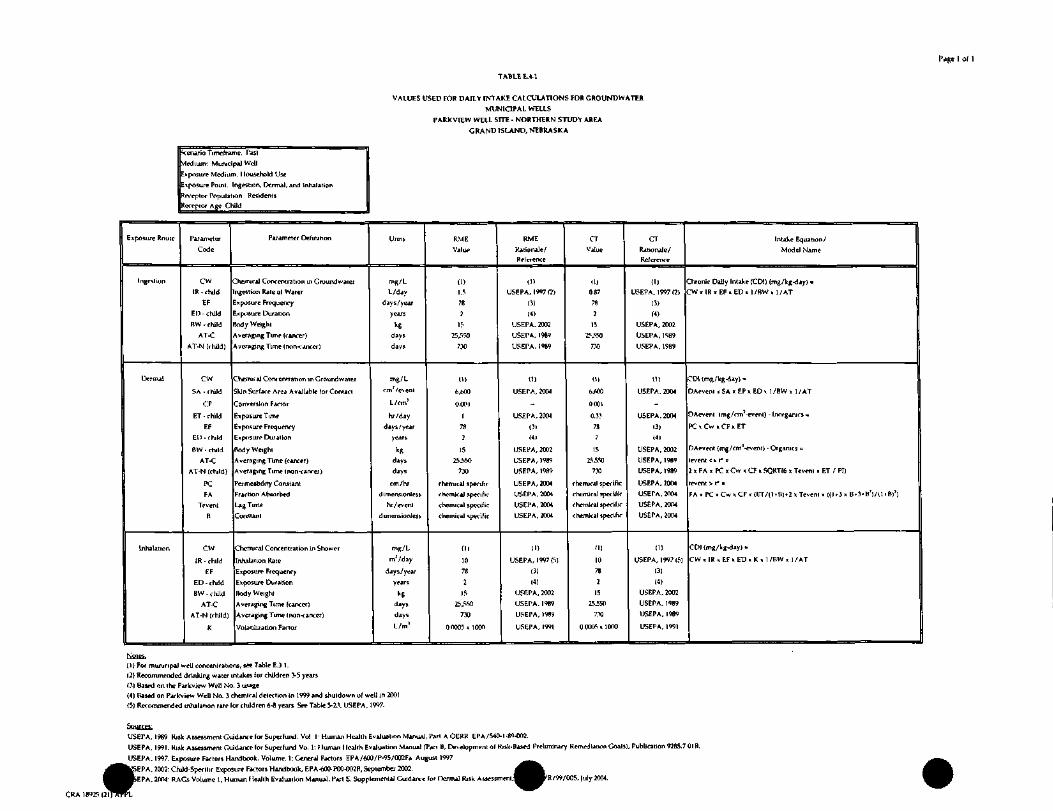
TABLE E.4.1
Page 1 of 1
VALUES USED FOR DAILY INTAKE CALCULATIONS FOR GROUNDWATER
MUNICIPAL WELLS
PARKVIEW WELL SITE - NORTHERN STUDY AKEA
GRAND ISLAND, NEBRASKA
Scenario Timcframe. Past
Medium: Municipal Well
Exposure Medium. Household Use
Exposure Point. Ingesnon. Dermal, and Inhalation
Wexeplor Population Residents
Receptor Age Child
Exposure Rnutr
Ingesliun
Dermal
Inhalation
Parameter
Code
CW
]R - child
EF
EI5 -child
BW - child
AT-C
AT-N (rhild)
CW
SA - child
CF
ET - rhild
EF
El) -child
BW - child
AT-C
AT-N (child)
PC
FA
Tevenl
B
cw1R- child
EF
ED -child
BW- child
AT-C
AT-N (rhild)
K
Parameter Definition
hermral Concentration in Groundwater
ngestion Rale of Water
Exposure Frequency
Exposure IXiration
Body Weight
Averaging Time (ranrer)
Averaging Time (non-cancer)
Chemical Concentration in Groundwater
Idn Surface Area Available for Contact
Conversion Factor
•xposure Time
•xposure Frequency
Lsposurr Duration
Body Weight
Averaging Time (cancer)
Averaging Time (non-cancer)
Permeability Constant
Fraction Absorbed
.jg Time
Constant
Chemical Concentration in Shower
j\h>ilaiion Rate
Exposure Frequency
Exposure Duration
Body Weight
Averaging Time (cancer)
Averaging Time (non-cancer)
Volatilization Factor
Units
mg/L
L/day
days/year
years
kgdays
days
mg/L
cm'/e^ent
L/cm1
hr/day
dayi/year
years
kR
days
days
Cm/Kr
dimension! ess
hr /event
dimension! ess
mg/L
mVday
days/year
years
kg
days
days
L/m1
R.ME
Value
(1)
1.5
78
2
15
25,550
730
(1)
6.600
0.001
1
78
2
15
25,550
730
chemical specific
chemical specific
chemical specific
chemical specific
(11
10
78
2
15
25,150
730
00005. 1000
RME
Rationale/
Reference
(1)
USEPA, 1997(2)
(3)
(4)
USEPA, 2002
USEPA, 1989
USEPA. 1989
(1)
USEPA, 2004
_
USEPA, 2004
<}>(41
USEPA, 2002
USEPA, 1989
USEPA, 1989
USEPA, 2004
USEPA, 2004
USEPA. 2004
USEPA, 2004
(1)
USEPA, 1997 (•>>
(3)
(4)
USF.PA, 2002
USEPA, 1989
USEPA, 1989
USEPA, 1991
CT
Value
(1)
087
78
2
15
ZS550
730
(11
6/00
0001
0.33
78
?
15
25550
730
chemical specific
chemical specific
chemical specific
chemical specific
(1)
10
78
2
15
25550
730
00005 x 1000
CT
Rationale/
Reference
(1)
USEPA, 1997 (2)
(3)
(4)
USEPA, 2002
USEPA, 1989
USEPA, 1989
(1)
USEPA, 2004
_
USEPA, 2004
(3)
(4)
USEPA, 2002
USEPA, 1989
USEPA, 1989
USEPA, 2004
USEPA, 2004
USEPA, 2004
USEPA, 2004
ID
USEPA, 1997(5)
(3)
(4)
USEPA, 2002
USEPA, 1989
USEPA. 1989
USEPA, 1991
Intake Equation/
Model Name
hronic Daily Intake (CDI) (mg/kg-day) .
CWx IKaEF.ED. 1/BW, I/AT
CDI (mg/kg-day) .
DAevcnl * SA x EP x ED x 1 /BW » 1 /AT
DAevent (mg/cm7-event) - Inorganics =
PC « Cw x CF * ET
DAevent {mg/cm'-evenl) • Oganics =
(event <- f =
2 » FA » PC x Cw » CF < SQRTI6 « Tfvenl x ET / PI)
tevcnt > f =
FA x PC » Cw K CP < (ET/(1 .B).2 x Tevenl « «1 »3 x B-3- B')/(l • B)')
CDI (mg/kg<)ay) .
CW x 1R < EF x ED < K x 1 /BW « 1 /AT
CRA 18025 (21(2inBL
(1) For municipal well concent rations, see Table E.3 1.
(2) Recommended drinking water intakes for children 3-5 years
(3) Based on the Parkview Well No. 3 ujuge
(4) Based on Parkview WeU No. 3 chemical detection in 1999 and shutdown of well in 2001
(5) Recommended inhalation rate for children 6-8 years See Table 5-23, USEPA, 1997.
Sources-.USEPA,1989 Risk Assessment Guidance for Superfurei. Vol 1 Human Health Evaluation Manual, Part A OERR EPA/540-1-89-002.
USEPA, 1991: Risk Assessment Guidance for Superfund Vo. 1: ! liiman 1 lealth Evaluation Manual (Part B, Development ol Risk-Based Preliminary Remediation Goals), Publication 9285.701 B.
USEPA, 1997: Exposure Factors Handbook. Volume. 1: General Factors EPA/600/P-95/002Fa August 1997
;EPA, 2002: Child-Specific Exposure Factors Handbook, EPA-600-POQ-002H, September 2002.
EPA, 2004 RAGs Volume 1, Human Health Evaluation Manual, Part E. SupplcmentaJ Guidance for DcrmaJ RJsk Assessment,^^^^P^R/99/005, July 2004.

Page 1 ol 1
TABLE E.7.1.CT
CALCULATION OF CHEMICAL CANCER RISKS AND NON-CANCER HAZARDS FOR PAST RESIDENT
CENTRAL TENDENCY
MUNICTFAL WELLS
PARKVTEW WELL SFTE - NORTHERN STUDY AREA
GRAND ISLAND, NEBRASKA
scenario Timerrame: Past
Receptor Population: Resident
Receptor Age: Child
Medium
Groundwater
Exposure Medium
Municipal WeU
Exposure Point
Household Use
Exposure Route
Ingestion
Exp. Route Total
Dermal
Exp. Route Total
Chemical of
Potential Concent
,1 ,1 -TrichloroMlune
,1 -Dichloroethane
,1-Dtchloroethen*
cis-],2-Dichlorrjethene
fetrachloroethene
EPC
Vain,
4.10E-03
7.50EO4
2.80E-03
l.OOE-04
I.10EO3
Units
mg/L
mg/L
mg/L
mg/L
mg/L
1,1,1-Trichloroetrune
1,1-Oichloroethane
1,1-DicWoroethene
cis-U-CKchloroethene
TetradUoroelhene
4.10E-03
7.50E-04
2.80E-03
l.OOE-04
1.10E-03
mg/L
mg/L
mg/L
mg/L
mg/L
Exposure Point Toul
exposure Medium Toul
Ambient Air Shower Vapors Inhalation
Exp. Route Toul
1,1,1-TrichJoroethine
1,1 -Dichloroethane
1,1-DichJoroethenr
cis-1 ,2-Dichloroethene
Tetrachloroethene
4 10E-03
7.50E-04
2.80E-03
l.OOE-04
1.10E-03
mg/L
mg/L
mg/L
mg/L
mg/L
Exposure Point Total
Exposure Medium Total
Medium Tota
Groundwatrr
Medium Total
Indoor Air Vapors ( Inhalation (Area 3 (1) mg/m3
Exp. Route ToU ||
Exposure Point Toul
Exposure Medium Total
Cancer Risk Calculations
IntaktlLxpontre Concentration
Value
1.45E-06
2.66E-07
9.92E-07
3.54E-08
3.90E-07
I.74E-07
1.31E-08
8.67E-08
1.99E-OT
1.46E-07
Units
mg/kg-d
mg/kg-d
mg/kg-d
mg/kg-d
mg/kg-d
CSF/Uml RijJc
Value
5.70E-03
5.40E-01
Unit,
(mg/kg-dVl
(mg/kg-dH
(mg/kgKl)-l
(mg/kg-d)-l
(mg/kg-d )-l
mg/kg-d
mg/kj-d
mg/kg-d
mg/kg-d
mg/kg-d
5-70E-03
5.40E-01
(mg/kg-d)-!
(mg/kg«iH
(mg/kg-d )-l
(mg/kg-d >-l
(mg/kg^j)-!
8.34E-06
1.53E-06
5.70E-06
2.04E-07
2.24E-06
mg/kg-d
mg/kg-d
mg/kg-d
mg/kg-d
mg/kg-d
5.70E-03
2.IOE-02
(mg/kg-dVl
(mg/kgKlH
(mg/kg-d)-!
(mg/kg^d)-!
(mg/kg-d)-!
| mg/kg-d - (mg/kg-d)-!
Totll of Receptor Risks Across All Media
Cdncrr Risk
NC
1.51E-09
NC
NC
2.10E-07
2.12E-07
NC
7.50E-11
NC
NC
7.89E-08
7.90E-08
2.91 E-07
2.91 E-07
NC
8.70E-09
NC
NC
4.70E-08
5.57E-08
5.57E-08
5.57E-08
3.47E-07
1.07E-07
1.07E-07
1 .07E-07
1.07E-07
1.07E-07
4.5E-07
Non-Cancer Hazard Calculations
IntakclExposvre Concentration
Value
5.08E-05
9.30E-06
3.47E-05
1.24E-06
1.36E-05
Lhill
mg/kg-d
mg/kg-d
mg/kg-d
mg/kg-d
mg/kg-d
RfDIRfC
Value
2.BOE-01
2.00E-01
5.00E-02
\.OOE-02
l.OOE-02
Units
mg/kg-d
mg/kg-d
mg/kg-d
mg/kg-d
mg/kg-d
6.09E-06
4.60E-07
3.04 E-06
6.96E-08
5.11 E-06
mg/kg-d
mg/kg-d
mg/kg-d
mg/kg-d
mg/kg-d
2.80E-01
2.00EX11
5.00EO2
l.OOE-02
1 OOE-02
mg/kg-d
mg/kg-d
mg/kg-d
mg/kg-d
mg/kg-d
2.92E-04
5.34E-05
1.99E-04
7.12E-06
7.84EO5
mg/kg-d
mg/kg-d
mg/kg-d
mg/kg-d
mg/kg-d
6.30E-01
1.40E-01
5.70E-02
l.OOE-02
mg/kg-d
mg/kg-d
mg/kg-d
mg/kg-d
mg/kg-d
| mg/kg-d - mg/kgd
Foul of Receptor Hazards Across All Media
Haiard
Quotient
l.BlE-Ot
4.65E-05
6.94E-04
1.24E-04
1.36E-03
2.41E-03
2.18E-05
2.30E-06
6.07E-05
6.96E-06
5.11EW
6.03E-04
3.01 E-03
3.01 E-03
4.64E-04
3.82E-04
3.50E-03
NC
7.84E-03
1.22E-02
1.22E-02
1.22E-02
1.52E-02
8.45E-03
8.45E-03
8.45E-03
8.45E03
8.45E-03
2.4E-02
Noter
NC = Not Calculated(1) Refer to Table C.7.1.CT for cancer risk and hazard index calculations for the inhalation of indoor air within Area 3.
CRA 18925 (21) APPL
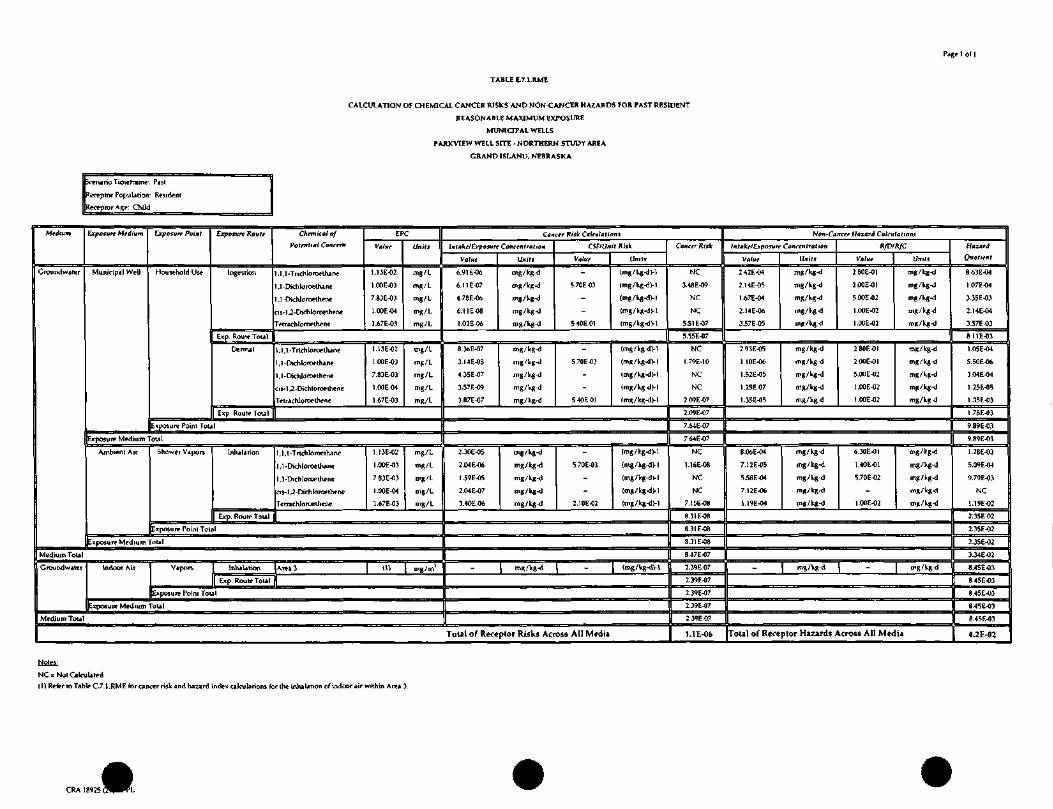
TABLE E.7.1.KME
Page 1 ol 1
CALCULATION OF CHEMICAL CANCER RISKS AND NON-CANCER HAZARDS FOR PAST RESIDENT
REASONABLE MAXIMUM EXPOSURE
MUNICIPAL WELLS
PABKVIEW WELL SITE - NORTHERN STUDY AREA
GRAND ISLAND. NEBRASKA
kenarioTimerrame: Past
Receptor Population: Resident
Receptor Age: Child
Medium
Groundwater
Medium Total
Croundwater
Exposure Medium
Municipal Well
Exposure Point
Household Use
Exposun Route
Ingestion
Exp. Route Total
Dermal
Exp. Route Toul
Exposure Point Tola
Chemical of
Potential Concern
,1,1-TricMoroe thane
,1-Dichloroe thane
,1 -Dichloroethene
cis-1 ,2-Dichloroethene
"etrachloroethene
EPC
Value
1.13E-02
l.OOE-03
7.83E-03
l.OOE-04
1.67E-03
Units
mg/L
mg/L
mg/L
mg/L
mg/L
,1,1-Trichloroethane
1,1-Dichloroethane
1 ,1 -Dichloroethene
cis-1 ,2-Dichloroethene
Tetrachloroethene
1.13E-02
1 OOE-03
7.83E-03
1.00E-(M
1.67E-03
mg/L
mg/L
mg/L
mg/L
mg/L
Exposure Medjum Total
Ambient Air Shower Vapors Inhalation
Exp. Route Total
,1,1-Trichloroethane
1,1-Dichloroe thane
1 ,] -Dichloroelhene
cis-1 ,2-Dichloroethene
Tetrachloroelhene
1.13E-02
l.XE-03
783E-C3
l.OOE-04
1.67E-03
mg/L
mg/L
mg/L
mg/L
mg/L
Exposure Point Tola
Exposure Medium Total
Indoor Air Vapors 1 Inhalation Urea 3 (1) mg/m'
Exp. Route Tota ||
Exposure Point Tota
Exposure Medium Total
Medium Total
Cancer Risk Calculations
InlaheJExposvre Concentration
Value
6.91 E-06
6.I1E-07
4.78E-06
6.11E08
1.02E-06
Units
mg/kg-d
mg/kg-d
mg/kg-d
mg/kg-d
mg/kg-d
8.36E-07
3. HE-OS
435E-07
3.57F.-09
3.87E-07
mg/kg-d
mg/kg-d
mg/kgKl
mg/kg-d
mg/kg-d
CSFIUnit Ritk
Value
5.70E03
540EO1
5.70E 03
540E01
Units
(mg/kg-dM
(mg/kg-d)-!
(mg/kg<l)-l
(mg/kg-dVl
(mg/kg-d)-l
(mg/lg-dH
(mg/kg-d)-!
(mg/kg-d >-!
(mg/lgj)-!
(mg/kg-d)-!
2.30E-05
2.04E-06
1.59E-05
2.04E-07
3.40EO6
mg/kg-d
mg/kg-d
mg/kgKl
mg/kg-d
mg/kg-d
5.70E-03
2.10E-02
(mg/kg-d)-!
(mg/kg-d)-]
(mg/kg-d)-!
(mg/kg-d VI
(mg/kg-dVI
- mg/kg-d - (mg/kg-dVl
ToUl of Receptor Risks Across All Media
Cancer Risk
NC
3.48E^)9
NC
NC
5.51 E-07
5.55E-07
NC
I.79E-10
NC
NC
2.09EO7
2.09E-07
7.64E-07
764E-07
NC
1.I6E-08
NC
NC
7.15E-08
8.31E-08
8.31E-08
8.31 EOS
8.47E-07
2.39E-07
2.39E-07
2.39E-07
2.39E-07
2.39E-07
1.1 E-06
Non-Cancer Hazard Calculations
Intake/Exposure Concentration
Value
2.42E-04
2.14E-OS
1.67E-04
2.14E-06
3.57E-05
2 93E-05
1 10E-06
1.52E-05
1.25E07
1.35E-05
Units
mg/kg-d
mg/kg^l
mg/kg-d
mg/kg-d
mg/kg<l
mg/kg-d
mg/kg-d
mg/kg-d
mg/kg-d
mg/kg-d
RfD/RfC
Value
2 80E-01
2.00E-01
5.00E-02
1 .OOE-02
l.OOE-02
2.BOE-OI
2.00E-01
5.00E-02
l.OOE-02
l.OOE-02
Units
mg/kg-d
mg/kg-d
mg/kg-d
mg/kgd
mg/kg-d
mg/kg-d
mg/kgd
mg/kg-d
mg/kg-d
mg/kg<l
8.06E-04
7.12E-05
558E-04
7.12E-06
1.19E-04
mg/kg<l
mg/kg-d
mg/kg-d
mg/kg-d
mg/kg-d
6.30E-01
1.40E-01
5.70E-02
l.OOE-02
mg/kg-d
mg/kg-d
mg/kg-d
mg/kg-d
mg/kg-d
- mg/kg-d - mg/kg-d
Tola! of Receptor Hazards Across All Media
Hazard
Quotient
8.63E-04
I.07E-04
3.35E-03
2.14E-04
3.57E03
8.11E-03
1.05E-04
5.50E-06
3.04E*I
1.25E-05
I.35E-03
1.78E-03
9.89E03
9.89E<)3
1.28E-03
5.09E-04
9.79E-03
NC
1.19E-02
2.35EO2
2.35E-02
2.35E-02
3.34E-02
8.45E-03
8 45E-03
8.45E-03
8.45E-03
8.45E-03
4.2E-fl2
NC = Not Calculated
(1) Refer to Tablt»C.7.1.RME for cancer risk and hazard index calculations for the inhalation of indoor air within Area 3.
CRA 18925(1
ATTACHMENT F
STATISTICAL METHODS
018925(21) APPL
ATTACHMENT F-2
EPC OUTPUT
18925(21) APPLATTF

TABLE OF CONTENTS
1.0 INTRODUCTION F-l
2.0 STATISTICAL PROCEDURES F-22.1 NORMAL DISTRIBUTION F-22.1.1 UP TO 15 PERCENT NON-DETECTS F-22.1.2 NON-DETECTS GREATER THAN 15 PERCENT
UP TO 50 PERCENT F-32.1.3 NON-DETECTS GREATER THAN 50 PERCENT UP TO
74 PERCENT F-42.1.4 NON-DETECTS GREATER THAN 75 PERCENT UP TO
99 PERCENT F-42.1.5 100 PERCENT NON-DETECTS F-42.2 LOGNORMAL DISTRIBUTION F-52.2.1 UP TO 15 PERCENT NON-DETECTS F-52.2.2 NON-DETECTS GREATER THAN
15 PERCENT UP TO 50 PERCENT F-72.2.3 NON-DETECTS GREATER THAN
50 PERCENT UP TO 74 PERCENT F-92.2.4 NON-DETECTS GREATER THAN
75 PERCENT UP TO 99 PERCENT F-102.2.5 100 PERCENT NON-DETECTS F-102.3 NON-NORMAL DATASETS F-102.3.1 UP TO 15 PERCENT NON-DETECTS F-ll2.3.2 NON-DETECTS GREATER THAN 15 PERCENT
AND LESS THAN 50 PERCENT F-122.3.3 NON-DETECTS GREATER THAN
50 PERCENT UP TO 75 PERCENT F-122.3.4 NON-DETECTS GREATER THAN
75 PERCENT UP TO 99 PERCENT F-122.3.5 100 PERCENT NON-DETECTS F-13
3.0 MAXIMUM DETECTED VALUE F-14
4.0 REFERENCES F-15
18925 (21) APPL ATTF CONESTOGA-ROVERS & ASSOCIATES
LIST OF TABLES(Following Text)
TABLE 1 GUIDELINES FOR ANALYZING DATA WITH NON-DETECTS
TABLE 2 RECOMMENDED METHODS FOR CALCULATING UPPER CONFIDENCELIMITS (UCLs)
TABLE 3 STATISTICAL METHODS USED FOR DETERMINING EXPOSURE ESTIMATESUNDER CENTRAL TENDENCY (CT) AND REASONABLE MAXIMUMEXPOSURE (RME) SCENARIOS
TABLE 4 95 PERCENT UPPER CONFIDENCE LIMIT (UCL) CALCULATION METHODSFOR LOGNORMAL DATA
TABLE 5 VALUES OF LAMBDA ( / I ) FOR COHEN'S METHOD
TABLE 6 VALUES OF H(095) FOR LAND'S METHOD
TABLE 7 VALUES OF gn FOR CHEBYSHEVS METHOD
LIST OF ATTACHMENTS
ATTACHMENT F-2 EPC OUTPUT
1892S (21) APPL ATTF CONESTOGA-ROVERS & ASSOCIATES

1.0 INTRODUCTION
Two estimates of exposure point concentrations were used in the risk assessmentprocess: (i) the mean, or central tendency (CT) exposure; and (ii) the reasonablemaximum exposure (RME). The CT exposure scenario uses the mean value to representprobable exposure concentrations. The RME scenario generally uses a conservative95 percent upper confidence limit (UCL) of the mean to estimate a reasonable maximumexposure. The determinations of the CT and RME estimates are statistically based anddriven by characteristics of the data. Key factors determining the statisticalmethodologies employed include: (i) the probability distribution of the observed data(e.g., normal vs. lognormal, etc.); and (ii) the degree of censored data (non-detectedresults) present.
The following sections present the procedures used to determine the CT and RMEvalues of the chemicals of potential concern (COPCs) in this risk assessment. A numberof guidance documents were consulted in developing the statistical methodologiesincluding MOE (1997), USEPA (1989), USEPA (1992) updated by USEPA (2002),USEPA (1997), USEPA (2003), and USEPA (2006).
The statistical methodology is discussed in the following sections:
• Section 1.0 Introduction;
• Section 2.0 Statistical Procedures;
• Section 3.0 Maximum Detected Value; and
• Section 4.0 References.
18925 (21) APPLATTF F-1 CONESTOGA-ROVERS & ASSOCIATES

2.0 STATISTICAL PROCEDURES
The development of COPC exposure point concentration estimates for each parameter isa three step process consisting of (i) determining the percentage of non-detects present,(ii) data distribution testing, and (iii) selecting the appropriate statistical method forexposure point concentration estimate calculations.
The first step of the statistical evaluation was to determine the percentage of thenon-detects present in each data set. Suggested approaches to account for the presenceof non-detect analytical results are outlined in USEPA (2002), USEPA (2006), and theseguidelines are summarized in Table 1.
The second step of the statistical analysis to establish COPC exposure estimates was todetermine the data distribution. Each data set was tested for normality andlognormality using either the Shapiro-Wilk W-test (1965) (for sample sizes up to 50) orthe Shapiro-Francia W'-test (1972) (for sample sizes of 50 to 100). Additional tests ofnormality for larger data sets, if needed, are presented in USEPA (2006).
Methods for determining the CT and RME values are discussed in USEPA 2002 (whichupdates USEPA 1992), USEPA 1997, and USEPA 2003. The alternative proceduressuggested are listed in Table 2. A summary of the selected statistical methods used todetermine the CT and RME values, based on the observed distribution of the data andthe proportion of non-detect values is given in Tables 3 and 4.
The following sections discuss the calculation procedures used to develop the CT andRME estimates. Section 2.1 deals with the statistical methods used for normallydistributed data sets, Section 2.2 discusses the statistical methods used for thelognormally distributed data sets, and Section 2.3 discusses statistical methods used fornon-normal data sets. Each section is organized into separate divisions to deal with thecases of a low degree of censored (non-detect) data (0 to 15 percent), moderatelycensored (16 to 50 percent), highly censored (51 to 75 percent), very highly censored(76 to 99 percent), and 100 percent non-detected data.
2.1 NORMAL DISTRIBUTION
2.1.1 UP TO 15 PERCENT NON-DETECTS
In order to calculate the CT and RME values, the non-detect values were replaced withone-half the reported detection limit. The arithmetic mean and standard deviation of
18925 (21) APPL ATTT F-2 CONESTOGA-ROVERS & ASSOCIATES

this substituted data set were then calculated. The calculated mean was taken as the CTvalue. The RME value was established by calculating the 95 percent UCL of thearithmetic mean for the normal distribution using the following equation.
Where:
x = mean of the substituted data set;£(0.05, n-i, i) = student f-statisric for a one-tailed 95 percent confidence (a=0.05) and n-1
degrees of freedom;s = standard deviation of the substituted data set; andn = number of samples.
2.1.2 NON-DETECTS GREATER THAN 15 PERCENTUP TO 50 PERCENT
In this case, the mean and standard deviation of the censored data set were adjustedusing Cohen's method, as recommended in USEPA 2002. This method is presented inMcBean & Rovers (1998) and USEPA (2006). Cohen's method adjusts the sample meanand sample standard deviation to account for the censored data below the detectionlimit as follows.
Step 1) Compute the sample mean xd using detected data only.
Step 2) Compute the sample variance sd using detected data only.
Step 3) Compute the two parameters h (proportion of non-detects) and y as:
n-m s]h= r=—(xd-DL)2
where m is the number of detected data points, n is the total number of samples and DLis the detection limit.
A
Step 4) Determine the value of the parameter "• from the Table 5 based on h and y.Step 5) Estimate the corrected sample mean (x) and standard deviation (s) as:
x = xd - A (xd - DL) and s = sd +A(xd-DL)
18925 (21) APPL ATTF F-3 CONESTOGA-ROVERS & ASSOCIATES
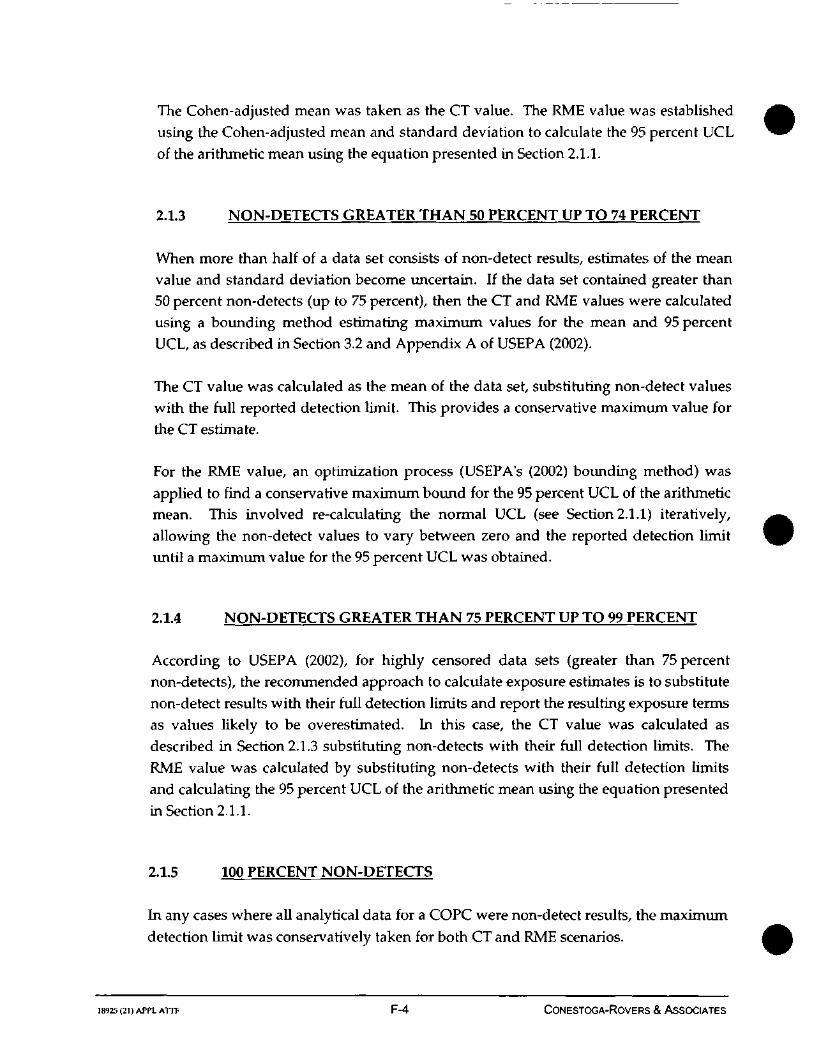
The Cohen-adjusted mean was taken as the CT value. The RME value was establishedusing the Cohen-adjusted mean and standard deviation to calculate the 95 percent UCLof the arithmetic mean using the equation presented in Section 2.1.1.
2.1.3 NON-DETECTS GREATER THAN 50 PERCENT UP TO 74 PERCENT
When more than half of a data set consists of non-detect results, estimates of the meanvalue and standard deviation become uncertain. If the data set contained greater than50 percent non-detects (up to 75 percent), then the CT and RME values were calculatedusing a bounding method estimating maximum values for the mean and 95 percentUCL, as described in Section 3.2 and Appendix A of USEPA (2002).
The CT value was calculated as the mean of the data set, substituting non-detect valueswith the full reported detection limit. This provides a conservative maximum value forthe CT estimate.
For the RME value, an optimization process (USEPA's (2002) bounding method) wasapplied to find a conservative maximum bound for the 95 percent UCL of the arithmeticmean. This involved re-calculating the normal UCL (see Section 2.1.1) iteratively,allowing the non-detect values to vary between zero and the reported detection limituntil a maximum value for the 95 percent UCL was obtained.
2.1.4 NON-DETECTS GREATER THAN 75 PERCENT UP TO 99 PERCENT
According to USEPA (2002), for highly censored data sets (greater than 75 percentnon-detects), the recommended approach to calculate exposure estimates is to substitutenon-detect results with their full detection limits and report the resulting exposure termsas values likely to be overestimated. In this case, the CT value was calculated asdescribed in Section 2.1.3 substituting non-detects with their full detection limits. TheRME value was calculated by substituting non-detects with their full detection limitsand calculating the 95 percent UCL of the arithmetic mean using the equation presentedin Section 2.1.1.
2.1.5 100 PERCENT NON-DETECTS
In any cases where all analytical data for a COPC were non-detect results, the maximumdetection limit was conservatively taken for both CT and RME scenarios.
18925 (21) APPL ATTF F-4 CONESTOGA-ROVERS & ASSOCIATES

2.2 LOGNORMAL DISTRIBUTION
USEPA (2003) presents three recommended methods for establishing CT and RMEestimates from lognormally distributed data depending on the standard deviation of thelog-transformed data. These methods are: (i) the Student's t method; (ii) the Land(H-statistic) method; and (iii) the Chebyshev Inequality method.
The Student's t method was presented in Section 2.1.1. If the standard deviation of thelognormal data is small (less than 0.5), then USEPA recommends using the Student's tmethod.
The Land method is appropriate for calculating UCLs of lognormally distributed data.However, as USEPA (2002) notes, the method is very sensitive to deviations fromlognormaliry, large variance or skewness of the dataset, and small datasets (fewer thanthirty data points). The Land method can be used in conjunction with a modifiedCohen's procedure (USEPA, 2002; Gilbert, 1987) to account for non-detect data.
The Chebyshev Inequality method may provide a more useful estimate (i.e., lower) ofthe UCL than obtained using the Land method (USEPA, 2002). It is a distribution-freemethod that is applicable to a wide variety of data sets (not only lognormal data), aslong as the skewness of the dataset is not large. The Chebyshev Inequality methodusing minimum-variance unbiased estimators (MVUEs) of the mean and standarddeviation of lognormal data sets is recommended for use by USEPA (2002). For small,moderately skewed datasets, a 99 percent UCL calculation using the ChebyshevInequality is recommended (as opposed to the 95 percent value typically used).
A summary of specific methods recommended for calculating RME estimates forlognormally distributed data sets is given in Table 4 (USEPA, 2002 and USEPA, 2003).
2.2.1 UP TO 15 PERCENT NON-DETECTS
In order to calculate the CT and RME values, the non-detect values were replaced withone-half the reported detection limit. >
For the CT exposure estimate, the arithmetic mean was calculated using a bootstrapmethod. The bootstrap procedure was carried out using 2000 re-sampled data sets of
18925 (21) APPL ATTF F-5 CONESTOGA-ROVERS & ASSOCIATES

the same sample size as the original data set. The CT value was then taken as theaverage of the means from the individual bootstrap data sets.
For the RME exposure estimate, the standard deviation of the log-transformed data wascalculated, and Table 4 used to select the UCL method to use. The selected method waseither: (i) the Student's t UCL (see Section 2.1.1 above); (ii) Land's H-UCL; or(iii) Chebyshev Inequality UCL.
Land's H-UCL is calculated as follows:
Step 1)
Step 2)
Step 3)Step 4)
Compute the arithmetic mean xlog of the log-transformed data.
Compute the standard deviation slog of the log- transformed data.
Look up the H,_a statistic from Table 6.Compute the one-sided (1 - a) upper confidence limit on the mean as:
where n is the number of samples and D=0.05.
The Chebyshev Inequality UCL is calculated as follows:
Step 1) Compute the arithmetic mean x,og of the log- trans formed data.
Step 2) Compute the variance sfog of the log-transformed data.
Step 3) Look up the ° " statistic from Table 7.
Step 4) Compute the minimum-variance unbiased estimator (MVUE) of thepopulation mean for a lognormal distribution as:
where n is the number of samples.
Step 5) Calculate the MVUE of the variance of this mean as:
gn'log n-2
Step 6) Compute the one-sided (l - a) upper confidence limit on the mean as:
18925 (21) APPLATTF F-6 CONESTOGA-ROVERS & ASSOCIATES

2.2.2 NON-DETECTS GREATER THAN15 PERCENT UP TO 50 PERCENT
When a moderate proportion of non-detect results are present in a data set, in order tocalculate the CT estimate, a correction for non-detects was made using Gilbert'smodified Cohen's method (USEPA, 2002). Gilbert (1987, page 182) suggests extendingCohen's method to account for non-detect values in lognormally distributedconcentrations. Cohen's method (USEPA 2006, pages 132-133) assumes the data arenormally distributed, so it must be applied to the log-transformed concentration values.
If /iy and tryare the Cohen-corrected (see Section 2.1.2) sample mean and standard
deviation, respectively, of the log-transformed concentrations, then the correctedestimates of the mean and standard deviation of the underlying lognormal distributioncan be obtained from the following expressions:
This method assumes a single detection level for all the data values. During CTcalculations, if the detection limit varied, then the highest detection limit was used forthe calculations to provide a conservative estimate.
For the RME value, USEPA's bounding methodology (2002) was applied tountransformed data to find a maximum value for the mean, standard deviation, andskewness. The 95 percent UCL was then calculated using Hall's Bootstrap.
The use of Gilbert's modified Cohen's method for lognormal data was evaluated for usein calculating RME estimates for moderately censored data sets. However, attempts touse the procedure in conjunction with the lognormal UCL methods (e.g., Land's method,Chebyshev Inequality) most often resulted with unusable values. This resulted fromeither calculating UCLs much higher than the maximum data point observed, or by datacharacteristics being unsuitable for the required calculation (e.g., needing to use aCohen's parameter X that was far outside existing tabulated values for this method). As
18925 (21) APPL ATTF F-7 CONESTOGA-ROVERS & ASSOCIATES
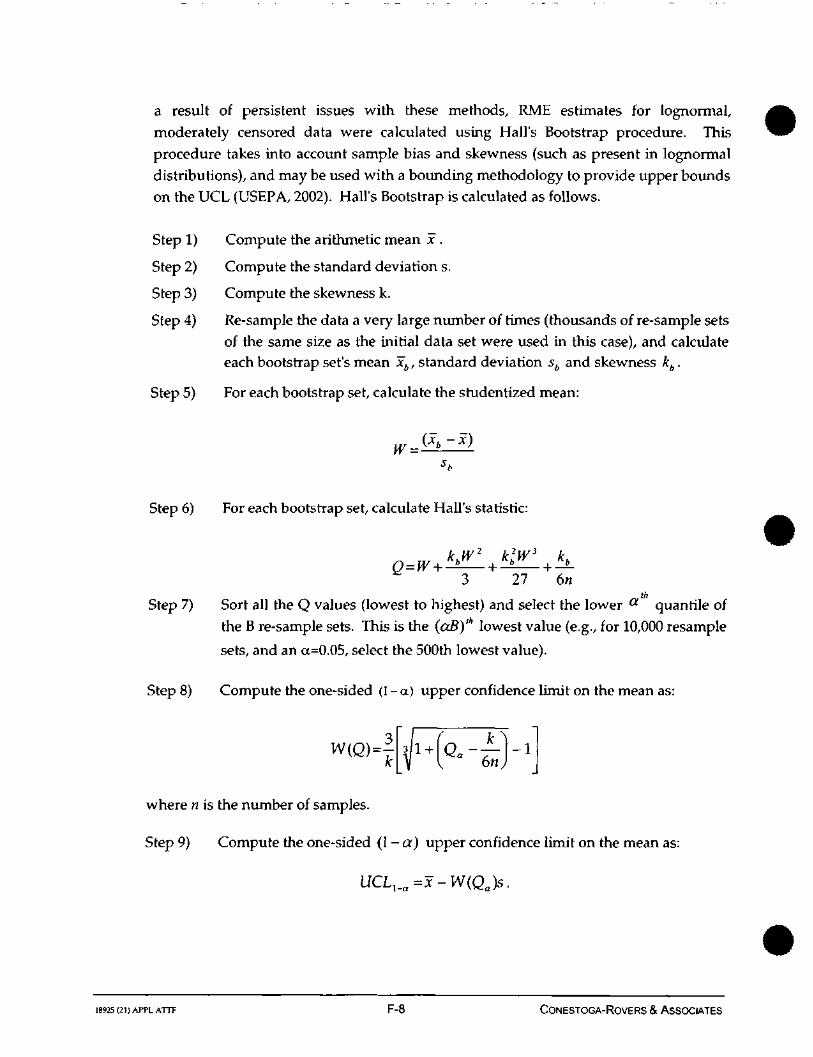
a result of persistent issues with these methods, RME estimates for lognormal,moderately censored data were calculated using Hall's Bootstrap procedure. Thisprocedure takes into account sample bias and skewness (such as present in lognormaldistributions), and may be used with a bounding methodology to provide upper boundson the UCL (USEPA, 2002). Hall's Bootstrap is calculated as follows.
Step 1) Compute the arithmetic mean J .
Step 2) Compute the standard deviation s.
Step 3) Compute the skewness k.
Step 4) Re-sample the data a very large number of times (thousands of re-sample setsof the same size as the initial data set were used in this case), and calculateeach bootstrap set's mean xb, standard deviation sb and skewness kb .
Step 5) For each bootstrap set, calculate the studentized mean:
Step 6) For each bootstrap set, calculate Hall's statistic:
„ „, khW2 klW3 kh
Q = W + -± - + -* - + -*-3 27 6/i
Step 7) Sort all the Q values (lowest to highest) and select the lower a quantile ofthe B re-sample sets. This is the (aB)lh lowest value (e.g., for 10,000 resample
sets, and an a=0.05, select the 500th lowest value).
Step 8) Compute the one-sided (1 - a) upper confidence limit on the mean as:
where n is the number of samples.
Step 9) Compute the one-sided (1 - a) upper confidence limit on the mean as:
UCL}_a=x-W(Qa)s.
18925 (21) APPL ATTF F-8 CONESTOGA-ROVERS & ASSOCIATES

In calculating Hall's bootstrap, five replicate calculations of the 10,000 resample sets eachwere generated, and the median UCL value used. These replicates were used todetermine whether or not each given data set was sensitive to small differences with therandom re-sampling algorithm used by the procedure.
2.2.3 NON-DETECTS GREATER THAN50 PERCENT UP TO 74 PERCENT
In order to calculate exposure estimates for highly-censored data sets (i.e., greater than50 percent non-detect up to 75 percent), conservative bounding assumptions were made,as described below.
The CT value was determined by substituting the full detection limit for non-detectvalues and applying the bootstrap procedure introduced in Section 2.2.1. The bootstrapwas carried out using 2,000 re-sampled data sets of the same sample size as the originaldata set, and the CT estimate was then taken as the average of the bootstrap means.
In this case of a highly censored data set, Hall's Bootstrap procedure fails withincreasing degrees of non-detect data due to undefined skewness values if a re-sampleddata set by random chance contains only non-detects. For the RME value, USEPA'sBootstrap t methodology (2003) was therefore applied to calculate the 95 percent UCL.A modified bounding methodology was applied by considering four non-detectsubstitution scenarios: i) zero; ii) one-half detection limit; iii) full detection limit; andiv) alternating zero and full detection limit. These scenarios were considered becauseattempting bounding procedures on each individual re-sample set is computationallyimpractical. The bootstrap t calculation was applied under each of the four scenariosand the largest resulting UCL was selected as the RME estimate.
The bootstrap t is calculated as follows (USEPA, 2003):
Step 1) Calculate the arithmetic mean x and the standard deviation s of the original
data
Step 2) Re-sample the original data a very large number of times (in this case
thousands of times) and calculate each resample set's mean ( x b ) and
standard deviation ( s b ) .
Step 3) For each re-sample set calculate the value.
. (** - *)
18925 (21) APPLATTF F-9 CONESTOGA-ROVERS & ASSOCIATES
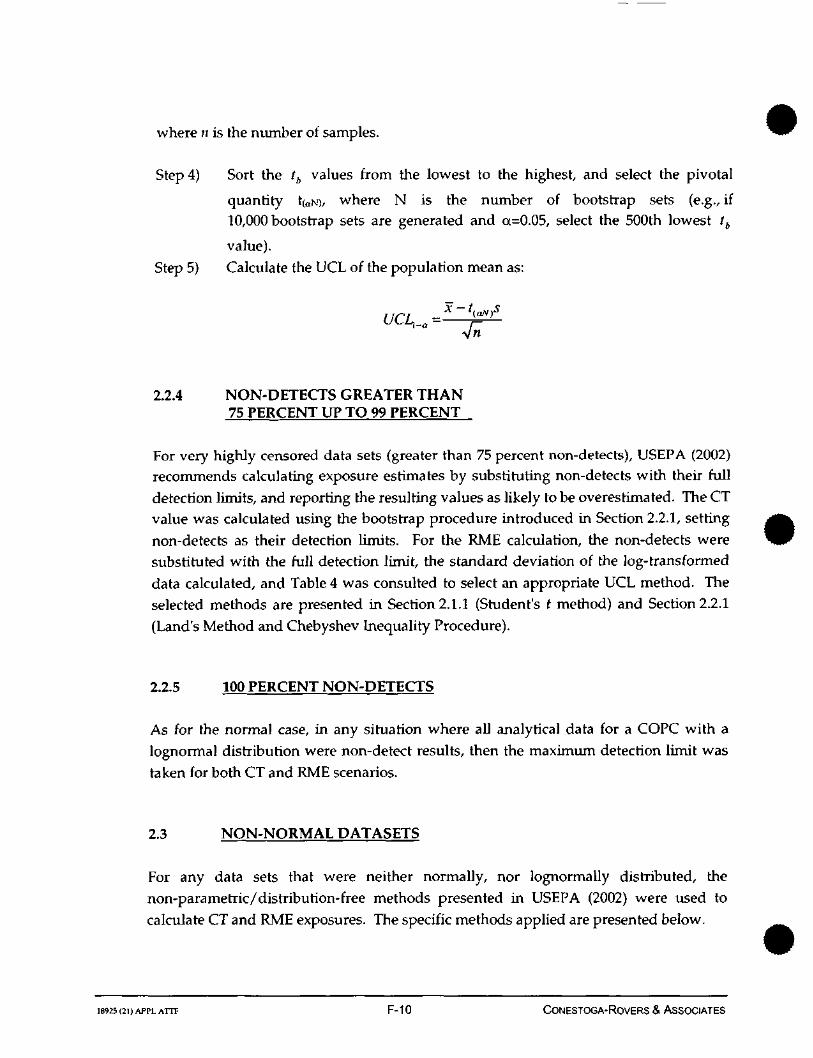
where n is the number of samples.
Step 4) Sort the tb values from the lowest to the highest, and select the pivotal
quantity t(aN), where N is the number of bootstrap sets (e.g., if10,000 bootstrap sets are generated and a=0.05, select the 500th lowest tb
value).Step 5) Calculate the UCL of the population mean as:
_x~t«*N)s
f=—V"
2.2.4 NON-DETECTS GREATER THAN75 PERCENT UP TO 99 PERCENT
For very highly censored data sets (greater than 75 percent non-detects), USEPA (2002)recommends calculating exposure estimates by substituting non-detects with their fulldetection limits, and reporting the resulting values as likely to be overestimated. The CTvalue was calculated using the bootstrap procedure introduced in Section 2.2.1, settingnon-detects as their detection limits. For the RME calculation, the non-detects weresubstituted with the full detection limit, the standard deviation of the log-transformeddata calculated, and Table 4 was consulted to select an appropriate UCL method. Theselected methods are presented in Section 2.1.1 (Student's t method) and Section 2.2.1(Land's Method and Chebyshev Inequality Procedure).
2.2.5 100 PERCENT NON-DETECTS
As for the normal case, in any situation where all analytical data for a COPC with alognormal distribution were non-detect results, then the maximum detection limit was
taken for both CT and RME scenarios.
2.3 NON-NORMAL DATASETS
For any data sets that were neither normally, nor lognormally distributed, thenon-paramerric/distribution-free methods presented in USEPA (2002) were used tocalculate CT and RME exposures. The specific methods applied are presented below.
18925 (21) APPL ATTF F-10 CONESTOGA-ROVERS & ASSOCIATES
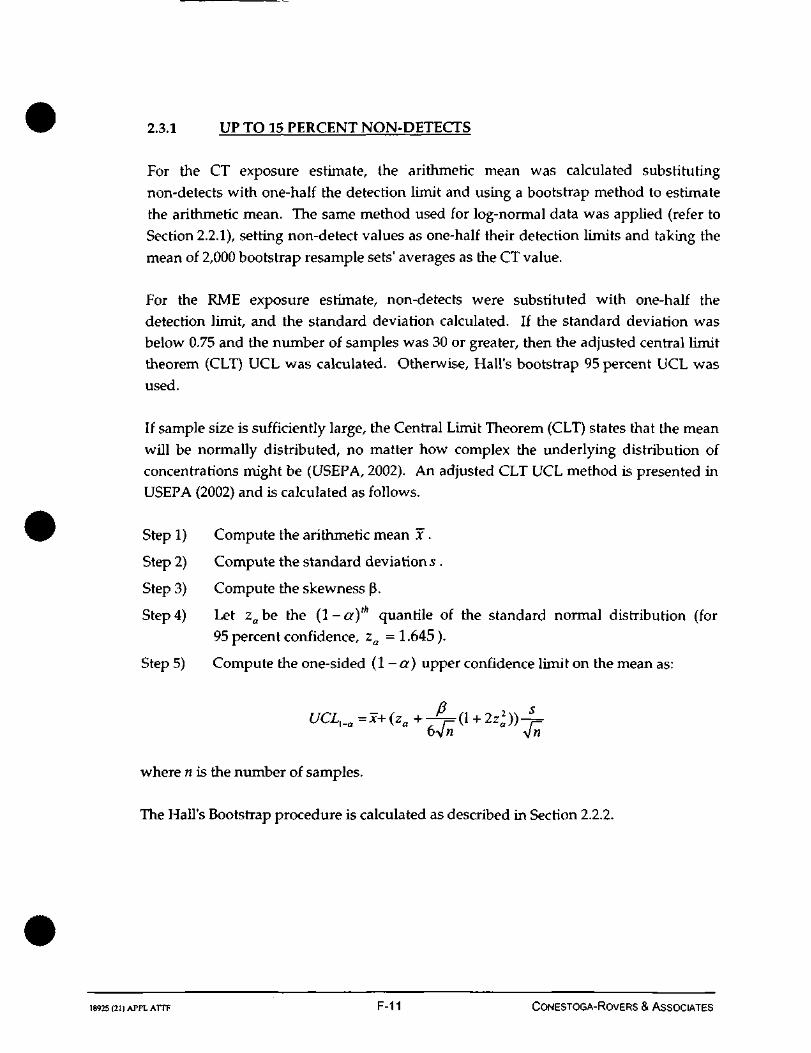
2.3.1 UP TO 15 PERCENT NON-DETECTS
For the CT exposure estimate, the arithmetic mean was calculated substitutingnon-detects with one-half the detection limit and using a bootstrap method to estimatethe arithmetic mean. The same method used for log-normal data was applied (refer toSection 2.2.1), setting non-detect values as one-half their detection limits and taking themean of 2,000 bootstrap resample sets' averages as the CT value.
For the RME exposure estimate, non-detects were substituted with one-half thedetection limit, and the standard deviation calculated. If the standard deviation wasbelow 0.75 and the number of samples was 30 or greater, then the adjusted central limittheorem (CLT) UCL was calculated. Otherwise, Hall's bootstrap 95 percent UCL wasused.
If sample size is sufficiently large, the Central Limit Theorem (CLT) states that the meanwill be normally distributed, no matter how complex the underlying distribution ofconcentrations might be (USEPA, 2002). An adjusted CLT UCL method is presented inUSEPA (2002) and is calculated as follows.
Step 1) Compute the arithmetic mean J.
Step 2) Compute the standard deviations .
Step 3) Compute the skewness p.
Step 4) Let zabe the (1-a)"' quantile of the standard normal distribution (for95 percent confidence, za =1.645).
Step 5) Compute the one-sided (1 - a) upper confidence limit on the mean as:
^ *•<•*)) —f=V"
where n is the number of samples.
The Hall's Bootstrap procedure is calculated as described in Section 2.2.2.
18925 (21) APPL ATTF F-11 CONESTOGA-ROVERS & ASSOCIATES

2.3.2 NON-DETECTS GREATER THAN 15 PERCENTAND LESS THAN 50 PERCENT
For CT exposure estimates, a conservative approach was taken substituting non-detects
with the full detection limit and calculating the bootstrap arithmetic mean (see
Section 2.2.1).
For RME exposure estimates, Hall's bootstrap procedure (see Section 2.2.2) was used,
applying bounding methodology to find maximum mean, standard deviation, and
skewness values for the original data set prior to re-sampling. These bounded estimates
were used to calculate the Hall's Bootstrap UCL for the data using five sets of
10,000 re-samples each (as in Section 2.2.1), and the median of these five UCLs taken as
the RME estimate.
2.3.3 NON-DETECTS GREATER THAN50 PERCENT UP TO 75 PERCENT
For CT exposure estimates, the conservative method used for the moderately censored
case (described in Section 2.3.2) was used. For RME exposure estimates, the Bootstrap t
method with modified bounding procedure described in Section 2.2.3 was applied.
2.3.4 NON-DETECTS GREATER THAN75 PERCENT UP TO 99 PERCENT
As noted for the normal (Section 2.1.4) and lognormal (Section 2.2.4) cases for very
highly censored data sets (greater than 75 percent non-detects), USEPA (2002)
recommends substituting non-detects with their full detection limits and reporting
exposure estimates as likely to be overestimated. Both CT and RME values were
calculated accordingly, as follows.
For CT exposure estimates, a conservative approach was taken, substituting non-detects
with the full detection limit and calculating the bootstrap arithmetic mean (see
Section 2.2.1). This is the same method used for the moderately censored
15 to 50 percent non-detect case (Section 2.3.2).
For RME estimates, the non-detects were substituted with the full detection limit and
Bootstrap t was used to calculate the UCL (refer to Section 2.2.3).
18925 (21) APPL ATTF F-12 CONESTOGA-ROVERS & ASSOCIATES
2.3.5 100 PERCENT NON-DETECTS
In any cases where all analytical data for a COPC were non-detect results, then themaximum detection limit was taken for both CT and RME estimates.
18925 (21) APPL ATTF F-13 CONESTOGA-ROVERS & ASSOCIATES
3.0 MAXIMUM DETECTED VALUE
USEPA (1992 and 2002) allow an optional use of the maximum observed concentrationsfor the RME estimate in cases where the calculated UCL exceeds the maximum value.However, USEPA (2002) warns that this may not be appropriate for data sets with verysmall sample sizes, because the observed maximum may be below the population mean.However, the use of the maximum as the exposure point concentration is reasonable forlarger numbers of samples collected at random.
If the RME estimate calculated using any of the statistical methods presented inSection 2.0 was larger than the maximum detected value, then the maximum detectedvalue was used for the RME. This is appropriate given the size of the data sets availablefor this site. In no case does the maximum value end up below the population mean.
18925 (21) APPL ATTF F-14 CONESTOGA-ROVERS & ASSOCIATES

4.0 REFERENCES
Chernick, M.R., (1999). Bootstrap Methods A Practitioner's Guide, John Wiley & Sons, New
York, 263p.
Efron, B. and Tibshirani, R.J., (1993). An Introduction to the Bootstrap, Chapman & Hall,
New York, 436p.
Gilbert, R.O., (1987). Statistical Methods for Environmental Pollution Monitoring. John
Wiley & Sons, New York, 320p.
Land, C.E., 1975. Tables of Confidence Limits for Linear Functions of the Normal Mean
and Variance in Selected Tables in Mathematical Statistics, volume 3, eds
H.L. Harter & D.B. Owen. Providence, Rhode Island: American Mathematical
Society, pp. 385-419.
McBean, E.A. and Rovers, F.A., (1998). Statistical Procedures for Analysis of Environmental
Monitoring Data & Risk Assessment, Prentice Hall, New Jersey, 313p.
MOE, (1997). Guidance on Site Specific Risk Assessment for Use at Contaminated Sites in
Ontario
Shapiro, S.S. & R.S. Francia, 1972. An Approximate Analysis of Variance Test for
Normality. Journal of the American Statistical Association 67(337): 215-216.
Shapiro, S.S. & M.B. Wilk, 1965. An Analysis of Variance Test for Normality (CompleteSamples). Biometrika 52(3/4): 591-611.
USEPA, (1989). Risk Assessment Guidance for Superfund (RAGS), Interim Final,
EPA/540/1-89/002, December 1989.
USEPA, (1992). U.S. EPA Supplemental Guidance to RAGS: Calculating the Concentration
Term, OSWER Directive 9285.7-081, May 1992.
USEPA, (1997). The Lognormal Distribution in Environmental Applications
EPA/600/R-97/006 December 1997.
USEPA, (2002). Calculating Upper Confidence Limits for Exposure Point
Concentrations at Hazardous Waste Sites. Office of Emergency and Remedial
Response, United States Environmental Protection Agency, Washington D.C.,
December 2002.
USEPA, (2003). ProUCL Users Guide Version 2.1. United States Environmental
Protection Agency, Washington D.C., February 2003.
18925 (21) APPL ATIT F-15 CONESTOGA-ROVERS & ASSOCIATES
USEPA, (2006). Data Quality Assessment: A Reviewer's Guide (EPA QA/G-9R). Officeof Environmental Information, United States Environmental Protection Agency,Washington D.C. EPA/240/B-06/002.
USEPA, (2006). Data Quality Assessment: Statistical Methods for Practitioners (EPAQA/G-9S). Office of Environmental Information, United States EnvironmentalProtection Agency, Washington D.C. EPA/240/B-06/003.
18925 (21) APPL ATTF F-16 CONESTOGA-ROVERS & ASSOCIATES
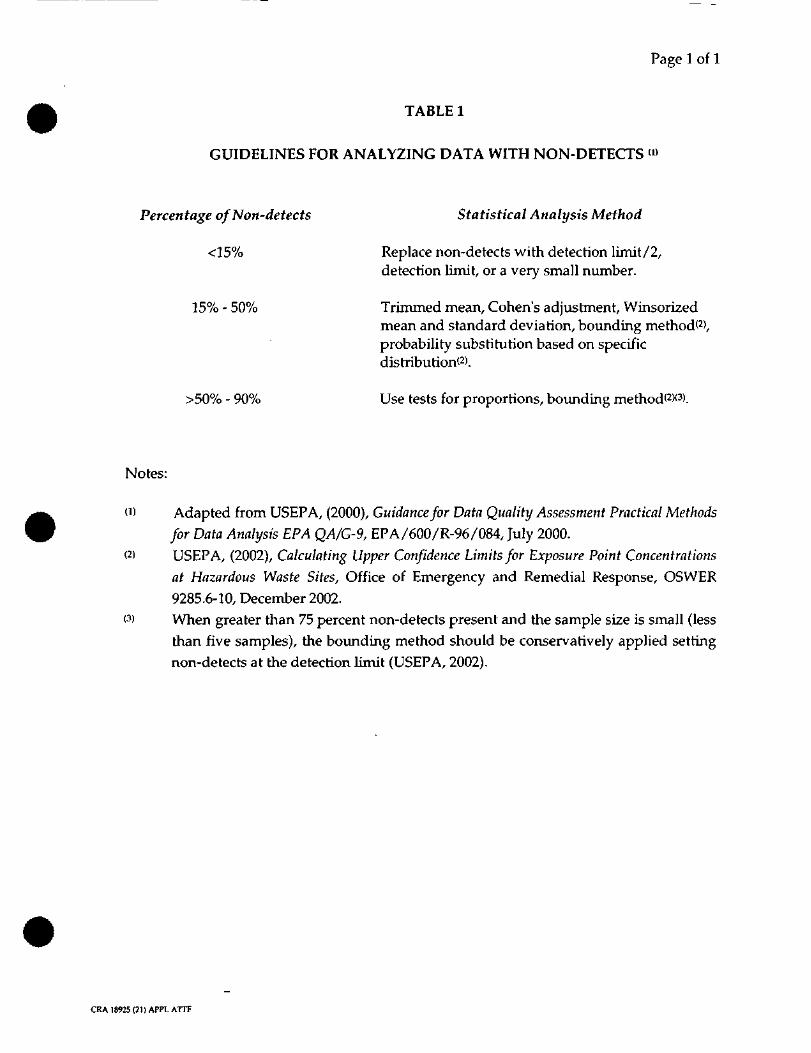
Page 1 of 1
TABLE 1
GUIDELINES FOR ANALYZING DATA WITH NON-DETECTS «»
Percentage of Non-detects Statistical Analysis Method
<15% Replace non-detects with detection limit/2,detection limit, or a very small number.
15% - 50% Trimmed mean, Cohen's adjustment, Winsorizedmean and standard deviation, bounding method'2),probability substitution based on specificdistribution'2).
>50% - 90% Use tests for proportions, bounding method'2)'3'.
Notes:
W Adapted from USEPA, (2000), Guidance for Data Quality Assessment Practical Methodsfor Data Analysis EPA QA/G-9, EPA/600/R-96/084, July 2000.
<2> USEPA, (2002), Calculating Upper Confidence Limits for Exposure Point Concentrations
at Hazardous Waste Sites, Office of Emergency and Remedial Response, OSWER9285.6-10, December 2002.
(3) When greater than 75 percent non-detects present and the sample size is small (lessthan five samples), the bounding method should be conservatively applied settingnon-detects at the detection limit (USEPA, 2002).
CRA 18925 (21) APPL ATTF
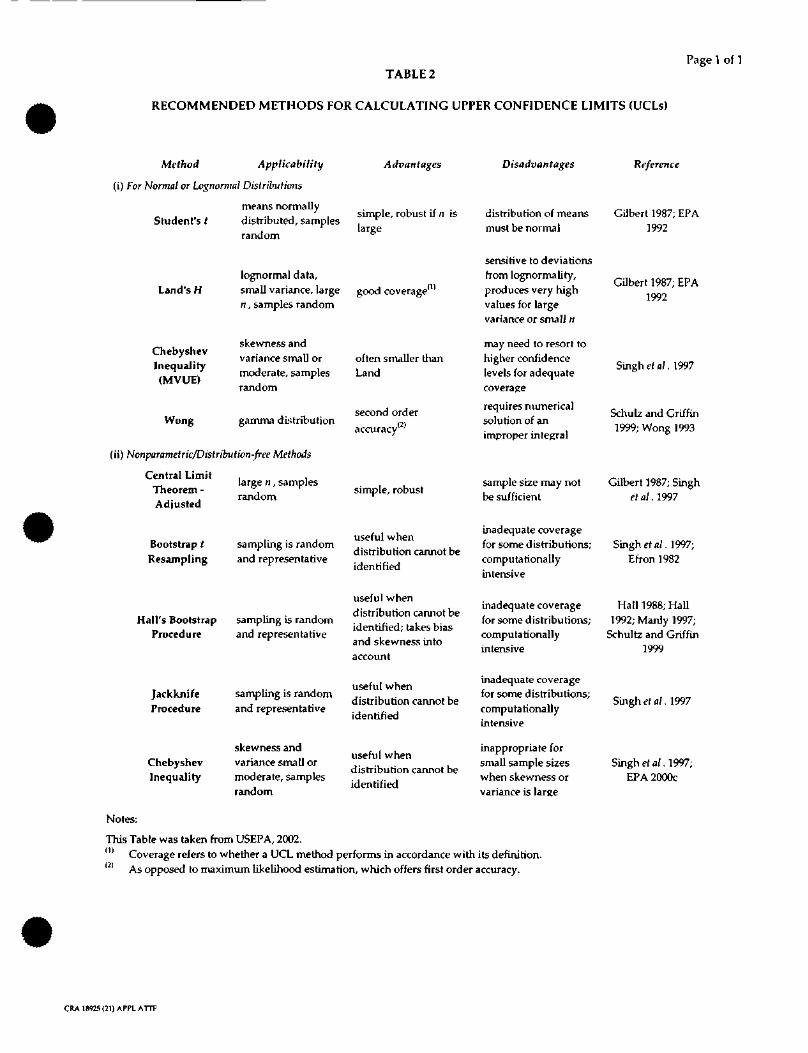
TABLE 2
RECOMMENDED METHODS FOR CALCULATING UPPER CONFIDENCE LIMITS (UCLs)
Page 1 of 1
Method Applicability
(i) For Normal or Lognormal Distributions
means normallyStudent's
Land's H
ChebyshevInequality(MVUE)
Wong
distributed, samplesrandom
Advantages
simple, robust if n islarge
lognormal data,small variance, large good coverage'11
n, samples random
skewness andvariance small ormoderate, samplesrandom
often smaller thanLand
second ordergamma distribution ,2,
accuracy
(ii) Nonparametric/Distribution-free Methods
Central LimitTheorem -Adjusted
Bootstrap fResampling
large n, samplesrandom
sampling is randomand representative
Hall's Bootstrap sampling is randomProcedure and representative
JackknifeProcedure
ChebyshevInequality
sampling is randomand representative
skewness andvariance small ormoderate, samplesrandom
simple, robust
useful whendistribution cannot beidentified
useful whendistribution cannot beidentified; takes biasand skewness intoaccount
useful whendistribution cannot beidentified
useful whendistribution cannot beidentified
Disadvantages
distribution of meansmust be normal
sensitive to deviationsfrom lognormality,produces very highvalues for largevariance or small n
may need to resort tohigher confidencelevels for adequatecoverage
requires numericalsolution of animproper integral
sample size may notbe sufficient
inadequate coveragefor some distributions;computationallyintensive
inadequate coveragefor some distributions;computationallyintensive
inadequate coveragefor some distributions;computationallyintensive
inappropriate forsmall sample sizeswhen skewness orvariance is large
Reference
Gilbert 1987; EPA1992
Gilbert 1987; EPA1992
Singh e l a l . 1997
Schulz and Griffin1999; Wong 1993
Gilbert 1987; Singhefa/ .1997
Singh et al. 1997;Efron 1982
Hall 1988; Hall1992; Manly 1997;
Schultz and Griffin1999
Singh e t a l . 1997
Singh et al. 1997;EPA 2000c
Notes:
This Table was taken from USEPA, 2002.n) Coverage refers to whether a UCL method performs in accordance with its definition.<2) As opposed to maximum likelihood estimation, which offers first order accuracy.
CRA 18925 (21) APPL ATTF
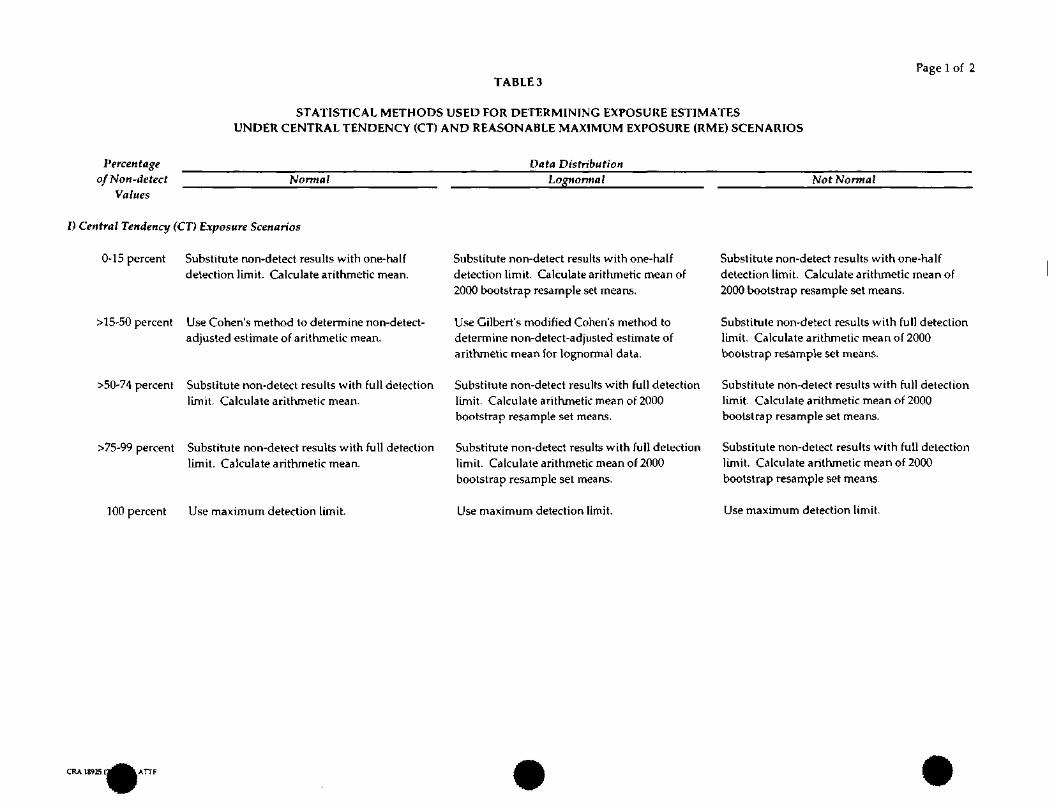
TABLESPage 1 of 2
STATISTICAL METHODS USED FOR DETERMINING EXPOSURE ESTIMATESUNDER CENTRAL TENDENCY (CT) AND REASONABLE MAXIMUM EXPOSURE (RME) SCENARIOS
PercentageofNon-detect
Values
Data DistributionNormal Lognonnal Not Normal
I) Central Tendency (CT) Exposure Scenarios
0-15 percent Substitute non-detect results with one-halfdetection limit. Calculate arithmetic mean.
>15-50 percent Use Cohen's method to determine non-detect-adjusted estimate of arithmetic mean.
>50-74 percent Substitute non-detect results with full detectionlimit. Calculate arithmetic mean.
>75-99 percent Substitute non-detect results with full detectionlimit. Calculate arithmetic mean.
TOO percent Use maximum detection limit.
Substitute non-detect results with one-halfdetection limit. Calculate arithmetic mean of2000 bootstrap resample set means.
Use Gilbert's modified Cohen's method todetermine non-detect-adjusted estimate ofarithmetic mean for lognormal data.
Substitute non-detect results with full detectionlimit. Calculate arithmetic mean of 2000bootstrap resample set means.
Substitute non-detect results with full detectionlimit. Calculate arithmetic mean of 2000bootstrap resample set means.
Use maximum detection limit.
Substitute non-detect results with one-halfdetection limit. Calculate arithmetic mean of2000 bootstrap resample set means.
Substitute non-detect results with fu l l detectionlimit. Calculate arithmetic mean of 2000bootstrap resample set means.
Substitute non-detect results with full detectionlimit. Calculate arithmetic mean of 2000bootstrap resample set means.
Substitute non-detect results with full detectionlimit. Calculate arithmetic mean of 2000bootstrap resample set means.
Use maximum detection limit.
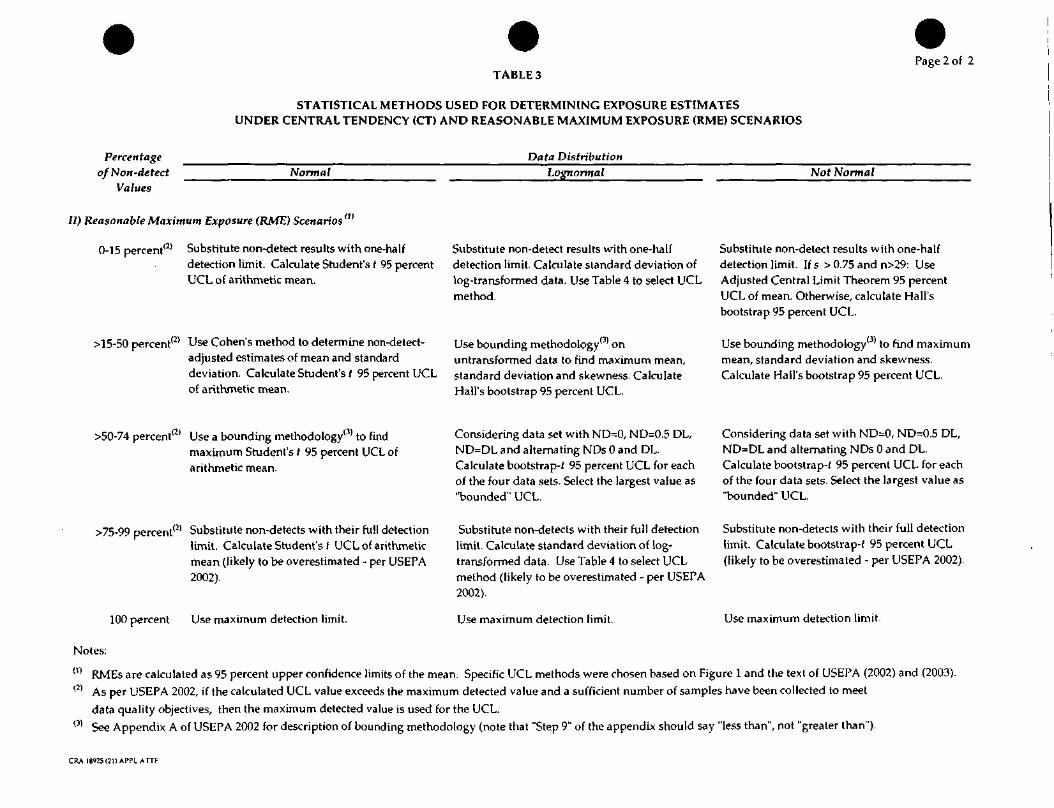
TABLE 3Page 2 of 2
STATISTICAL METHODS USED FOR DETERMINING EXPOSURE ESTIMATESUNDER CENTRAL TENDENCY (CT) AND REASONABLE MAXIMUM EXPOSURE (RME) SCENARIOS
Percentageof Non-detect
Values
Data DistributionNormal Lognormal Not Normal
II) Reasonable Maximum Exposure (RME) Scenarios m
0-15 percent(2) Substitute non-detect results with one-half
detection limit. Calculate Student's f 95 percentUCL of arithmetic mean.
>15-50 percent(2) Use Cohen's method to determine non-detect-adjusted estimates of mean and standarddeviation. Calculate Student's t 95 percent UCLof arithmetic mean.
Substitute non-detect results with one-halfdetection limit. Calculate standard deviation oflog-transformed data. Use Table 4 to select UCLmethod.
Use bounding methodology onuntransformed data to find maximum mean,standard deviation and skewness. CalculateHall's bootstrap 95 percent UCL.
Substitute non-detect results with one-halfdetection limit. Ifs > 0.75 and n>29: UseAdjusted Central Limit Theorem 95 percentUCL of mean. Otherwise, calculate Hall'sbootstrap 95 percent UCL.
Use bounding methodology'3' to find maximummean, standard deviation and skewness.Calculate Hall's bootstrap 95 percent UCL.
>50-74 percent1(2) Use a bounding methodology'3' to findmaximum Student's f 95 percent UCL ofarithmetic mean.
Considering data set with ND=0, ND=0.5 DL,ND=DL and alternating NDs 0 and DL.Calculate bootstrap-^ 95 percent UCL for eachof the four data sets. Select the largest value as"bounded" UCL.
Considering data set with ND=0, ND=0.5 DL,ND=DL and alternating NDs 0 and DL.Calculate bootstrap-/ 95 percent UCL for eachof the four data sets. Select the largest value as"bounded" UCL.
>75-99 percent'2' Substitute non-detects with their full detectionlimit. Calculate Student's f UCL of arithmeticmean (likely to be overestimated - per USEPA2002).
100 percent Use maximum detection limit.
Notes:
Substitute non-detects with their full detection Substitute non-detects with their full detectionlimit. Calculate standard deviation of log-transformed data. Use Table 4 to select UCLmethod (likely to be overestimated - per USEPA2002).
Use maximum detection limit.
limit. Calculate bootstrap-f 95 percent UCL(likely to be overestimated - per USEPA 2002).
Use maximum detection limit.
(1) RMEs are calculated as 95 percent upper confidence limits of the mean. Specific UCL methods were chosen based on Figure 1 and the text of USEPA (2002) and (2003).<2) As per USEPA 2002, if the calculated UCL value exceeds the maximum detected value and a sufficient number of samples have been collected to meet
data quality objectives, then the maximum detected value is used for the UCL.(3) See Appendix A of USEPA 2002 for description of bounding methodology (note that "Step 9" of the appendix should say "less than", not "greater than").
CRA 18925 (21) APPLATTF
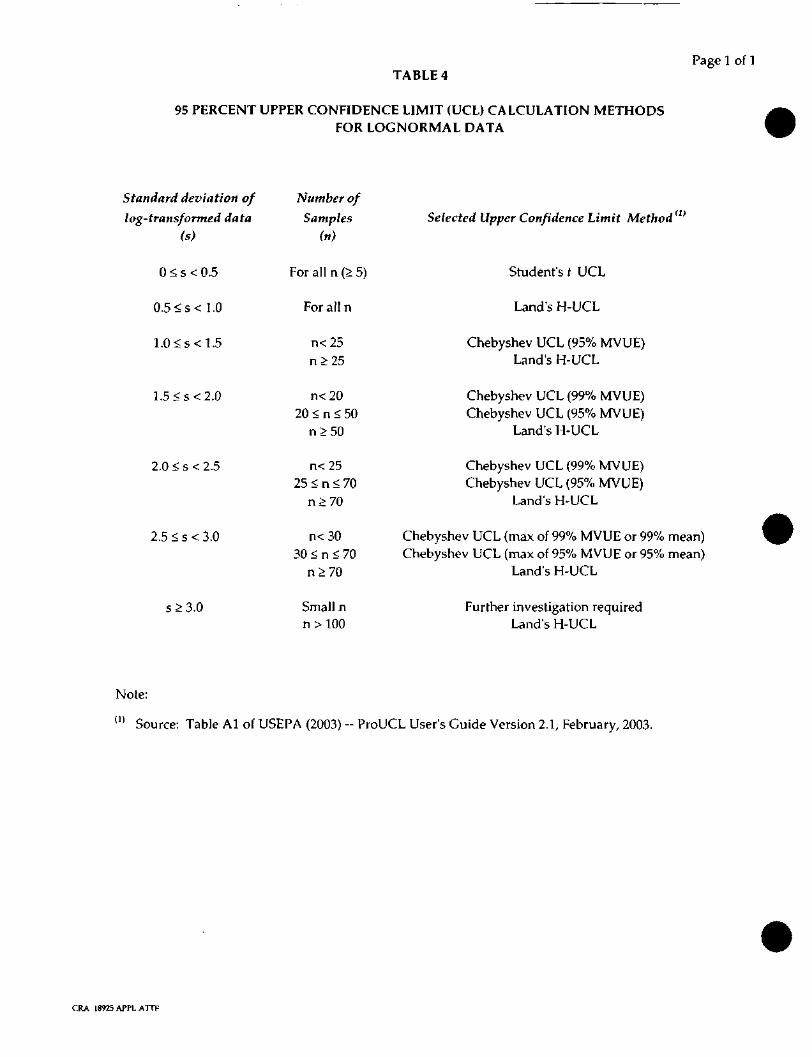
TABLE 4Page 1 of 1
95 PERCENT UPPER CONFIDENCE LIMIT (UCL) CALCULATION METHODSFOR LOGNORMAL DATA
Standard deviation of
log-transformed data(s)
Number of
SamplesM
Selected Upper Confidence Limit Method
0 < s < 0.5
0.5<s<1.0
1.5<s<2.0
2 .0<s<2 .5
2.5<s<3.0
For all n (> 5)
For all n
n<25n > 2 5
Student's f UCL
Land's H-UCL
Chebyshev UCL (95% MVUE)Land's H-UCL
n< 20 Chebyshev UCL (99% MVUE)20 < n < 50 Chebyshev UCL (95% MVUE)
n > 50 Land's H-UCL
n< 25 Chebyshev UCL (99% MVUE)25 < n < 70 Chebyshev UCL (95% MVUE)
n > 70 Land's H-UCL
n< 30 Chebyshev UCL (max of 99% MVUE or 99% mean)30 < n < 70 Chebyshev UCL (max of 95% MVUE or 95% mean)
n > 70 Land's H-UCL
s>3.0 Small nn>100
Further investigation requiredLand's H-UCL
Note:
( i ) Source: Table Al of USEPA (2003) -- ProUCL User's Guide Version 2.1, February, 2003.
CRA 18925 APPL ATTF
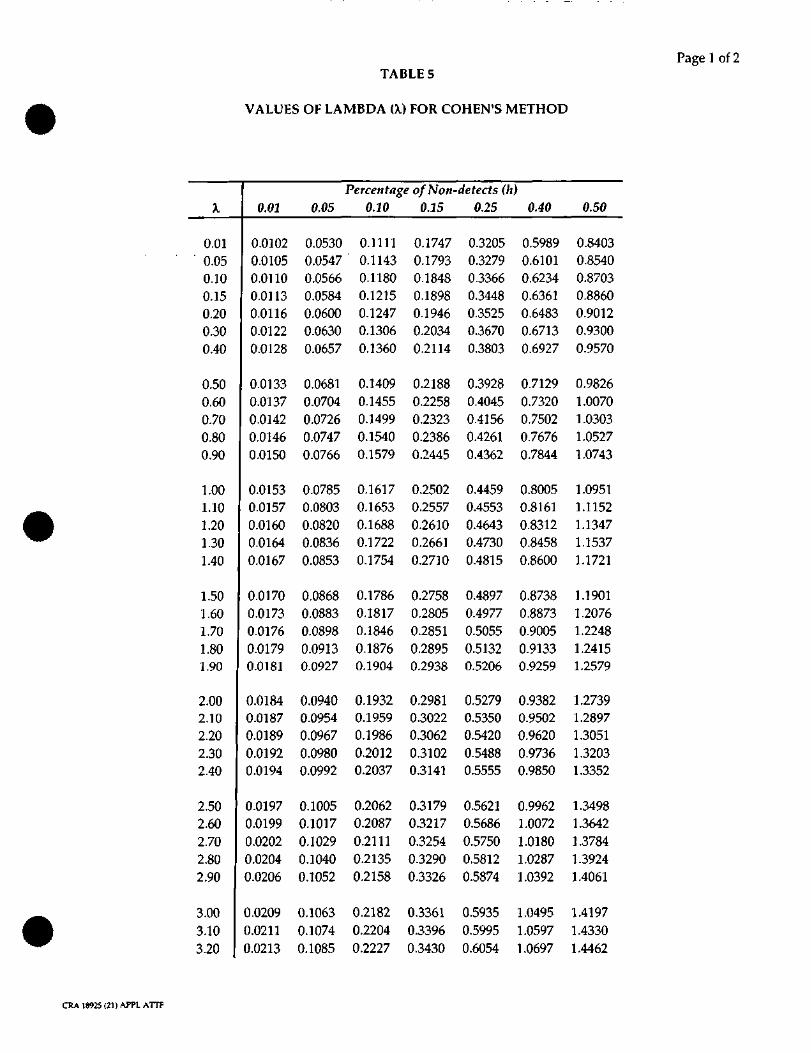
Page 1 of 2TABLE 5
VALUES OF LAMBDA (X) FOR COHEN'S METHOD
Jt
0.01' 0.050.100.150.200.300.40
0.500.600.700.800.90
1.001.101.201.301.40
1.501.601.701.801.90
2.002.102.202.302.40
2.502.602.702.802.90
3.003.103.20
0.01
0.01020.01050.01100.01130.01160.01220.0128
0.01330.01370.01420.01460.0150
0.01530.01570.01600.01640.0167
0.01700.01730.01760.01790.0181
0.01840.01870.01890.01920.0194
0.01970.01990.02020.02040.0206
0.02090.02110.0213
0.05
0.05300.05470.05660.05840.06000.06300.0657
0.06810.07040.07260.07470.0766
0.07850.08030.08200.08360.0853
0.08680.08830.08980.09130.0927
0.09400.09540.09670.09800.0992
0.10050.10170.10290.10400.1052
0.10630.10740.1085
Percentage ofNon-detects (h)0.10 0.15 0.25 0.40
0.11110.11430.11800.12150.12470.13060.1360
0.14090.14550.14990.15400.1579
0.16170.16530.16880.17220.1754
0.17860.18170.18460.18760.1904
0.19320.19590.19860.20120.2037
0.20620.20870.21110.21350.2158
0.21820.22040.2227
0.17470.17930.18480.18980.19460.20340.2114
0.21880.22580.23230.23860.2445
0.25020.25570.26100.26610.2710
0.27580.28050.28510.28950.2938
0.29810.30220.30620.31020.3141
0.31790.32170.32540.32900.3326
0.33610.33960.3430
0.32050.32790.33660.34480.35250.36700.3803
0.39280.40450.41560.42610.4362
0.44590.45530.46430.47300.4815
0.48970.49770.50550.51320.5206
0.52790.53500.54200.54880.5555
0.56210.56860.57500.58120.5874
0.59350.59950.6054
0.59890.61010.62340.63610.64830.67130.6927
0.71290.73200.75020.76760.7844
0.80050.81610.83120.84580.8600
0.87380.88730.90050.91330.9259
0.93820.95020.96200.97360.9850
0.99621.00721.01801.02871.0392
1.04951.05971.0697
0.50
0.84030.85400.87030.88600.90120.93000.9570
0.98261.00701.03031.05271.0743
1.09511.11521.13471.15371.1721
1.19011.20761.22481.24151.2579
1.27391.28971.30511.32031.3352
1.34981.36421.37841.39241.4061
1.41971.43301.4462
CRA 18925 (21) APPL ATTF
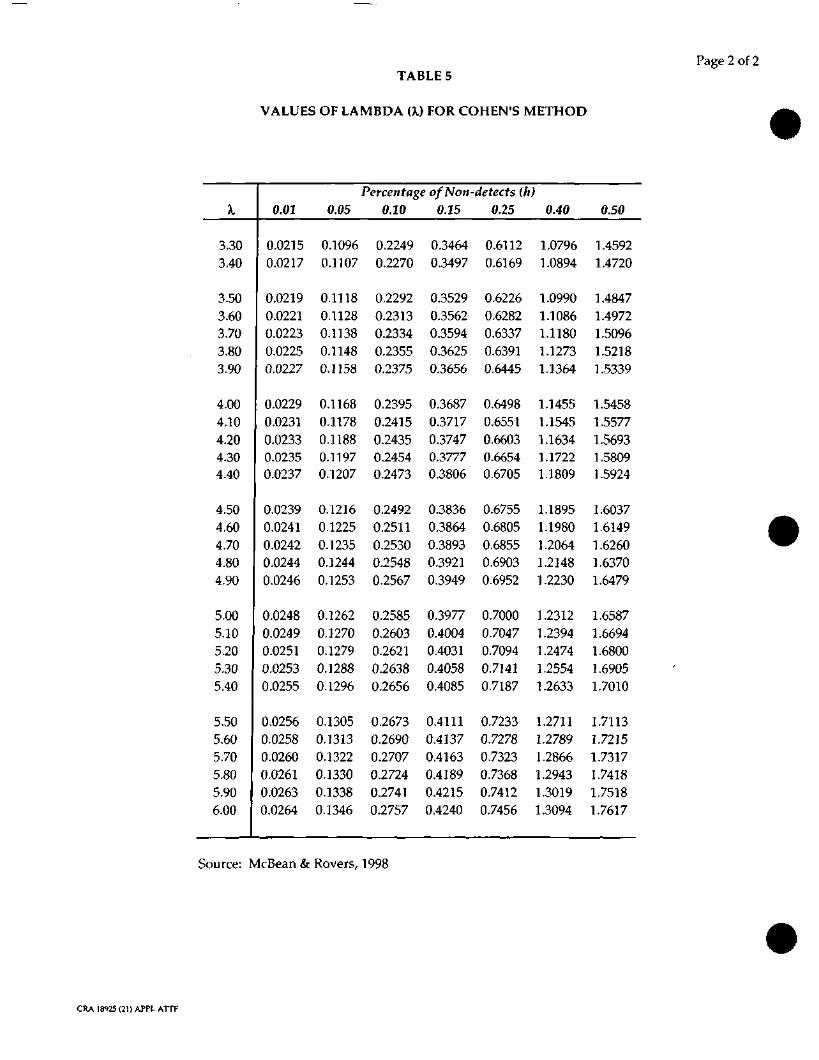
TABLE 5Page 2 of 2
VALUES OF LAMBDA (JO FOR COHEN'S METHOD
X
3.303.40
3.503.603.703.803.90
4.004.104.204.304.40
4.504.604.704.804.90
5.005.105.205.305.40
5.505.605.705.805.906.00
0.02
0.02150.0217
0.02190.02210.02230.02250.0227
0.02290.02310.02330.02350.0237
0.02390.02410.02420.02440.0246
0.02480.02490.02510.02530.0255
0.02560.02580.02600.02610.02630.0264
0.05
0.10960.1107
0.11180.11280.11380.11480.1158
0.11680.11780.11880.11970.1207
0.12160.12250.12350.12440.1253
0.12620.12700.12790.12880.1296
0.13050.13130.13220.13300.13380.1346
Percentage of Ion-detects (h)0.10 0.15 0.25
0.22490.2270
0.22920.23130.23340.23550.2375
0.23950.24150.24350.24540.2473
0.24920.25110.25300.25480.2567
0.25850.26030.26210.26380.2656
0.26730.26900.27070.27240.27410.2757
0.34640.3497
0.35290.35620.35940.36250.3656
0.36870.37170.37470.37770.3806
0.38360.38640.38930.39210.3949
0.39770.40040.40310.40580.4085
0.41110.41370.41630.41890.42150.4240
0.61120.6169
0.62260.62820.63370.63910.6445
0.64980.65510.66030.66540.6705
0.67550.68050.68550.69030.6952
0.70000.70470.70940.71410.7187
0.72330.72780.73230.73680.74120.7456
0.40
1.07961.0894
1.09901.10861.11801.12731.1364
1.14551.15451.16341.17221.1809
1.18951.19801.20641.21481.2230
1.23121.23941.24741.25541.2633
1.27111.27891.28661.29431.30191.3094
0.50
1.45921.4720
1 .48471.49721.50961.52181.5339
1.54581.55771.56931.58091.5924
1.60371.61491.62601.63701.6479
1.65871.66941.68001.69051.7010
1.71131.72151.73171.74181.75181.7617
Source: McBean & Rovers, 1998
CRA 18925 (21) APPL ATTF

NO
QOXUJ2enD2Oo-
.£<sI
tu
rf T— i
vO OO
O\ID" l^ ON fN vD
\O **O
vO t\ tx
("} * C~} ^ vO
m tx o CD ix
NO NO tX tX IX
ON O ON NO O
in oo o TJ<
ONNO NO tX tx IX
r-l r-H
r-l
l-H
r-l
O tx CD IX O
tx ON CD fx CD
NO NO tX tX OO
Tt OO i— i
CD
NOOO
i— i NO
i— i tx
NO tx tx OO OO
I-H
l-H l-H
i-H
i-H
I-H CN CD NO OO
O 't ON in CN
tX tx IX 00 ON
CN i—
i CD in ON
CN tx CD O OO
tx Ix OO ON ON
ON ON CN OO OO
Tf O OO NO NO
IX OO OO ON O
r-l I-H I-H I-H
CN
m CD tx NO
I-Htx Ti<
CN CN "*
tx 00 ON O I-H
,-H ,-H
,-H
CN
CN
CN I-H tx ON O
O OO tx OO CN
OO OO ON O CN
i— i I-H
i— i CN
CN
NO CN in CN
in00 ON CN 00 NO
OO ON i— i
CN ^
r-i i— i
CN CN
CN
in 00 CN I-H
txCD ON O in •*
O i-i •* NO ON
CN CN CN CN CN
o m ON o in
in ON O CN ON
tx CN I-H
CN
*"CN CD "3" m NO
NO O I-H tX 00
I-H tx CD ON NO
OO OO ON ON O
in r-H T* CN m
CN OO "T i— 00
OO OO ON O O
CD CN 00 O tx
Tf O NO Tf I-H
00 ON ON O I-H
I-H o m tx m
ON NO CD I-H O
00 ON O r-H CN
NO in CN NO NO
"31 CN i— i
O
OON O I-H CN CD
I-H CN CN CN CN
O CN CN O CD
i— i O
O
i— i CM
O I-H CN CD TT
in I-H
tx CN •"*
OO ON O CD NO
o i-i
CD r m
I-H O CD ON
*OO O •* 00 •*
i— i CD ••* in
txCN CN CN CN CN
i— ••*
o oo m
tx
I-H tx
CD
i— i
CN -^ m
tx ONCN CN CN CN CN
OO CN O CN CD
NO CD i— i
O
OCD in tx ON r-i
CN CN CN CN CD
CD TJ- in o m
tx O in CN ON
CN CN CD CD CD
tx CN CN 00 U1
00 NO NO IX O
CN NO O ^ ON
CD CD ^ "^f
tx o CD in
O CN -^ tx o
? *""?
o I-H
CD
IX ON
i— 1 I— I
i— 1
NO NO CD
t CD
NO OO CN IX O
CN ** tx ON in
00 tx CD CD
oo i— i m
r- 1 in
CN in tx
o m
O NO O OO O
CD NO CN OO m
CD m oo o NO
CN CN CN CD CD
tx CD tx in 0
• I-H
ON ON CN
•t* tx ON CN ON
O r-i O CD OO
OO OO O CD CN
in oo CN in CNCN CN CD CD ^
tx IX IX CN OO
CD IX CD I-H
OO
tx o oo m
CD I-H
ON i— i
CD
ON CD tx r-H O
CD CN r-i
"* tx
NO i— ' oo NO m
I-H NO o in in
CD CD
•sr rf in
ON NO CN CN tx
OO ON CN NO NO
CD OO "* ON O
CD CD Tt< ^ NO
ON tx in NO I-H
CD O ON ON CN
NO CN tx CD NO
CD ** ••*
in NO
NO ^f O tx ON
CN OO NO rj-
CD
•* in in NO oo
I-H o O tx tx
o CN m oo NO
O r-1 CN CD ,_;
NO tx
OO ON
i— i
CD O tx TT ON
CD NO OO I-H
NONO ON CN NO CN
r- 1 r-i
CN CN
CD
tx IX OO NO O
m CN O ON ON
O NO CN tx CD
ON O CD CN tx
r—t O ON ON ON
I-H tx
CN OO
**
OO CN
NO tx
*"CD Tt
1 m
tx oCN 00 •* O IX
T Tf in NO NO
ON CD OO O tx
NO CD O ON tx
m CN ON in CN
fx r~i
^ ^ ON
T}< OO CN tX CN
ON vO ^
i— i ON
TJ< in NO
tx tx
OO
i— i
Tf
Tt< 00
oo o CN in oo
CD CN O OO NO
tX in r-l CN ON
o I-H
CD in ixON OO IX NO in
O NO O ON i— i
tx ON CD NO tx
in m NO NO
o'NO
tx OO
ON i— i
i-i NO ON CN tx
ON CN NO NO tx
I-H CD Q , ,
tx OO ON I-H
I-H
•<* 00 OO -i i-i
NO i— i
CD NO
ON«? *-! d
I-H CN
in NO oo o CD
Tf in r— oo ^
^
i CD f NO
ON
r-H i-H r-H i-H
tx tx OO OO ON
ON CN in OO i—
CD NO 00 O CD
•-i I-H
I-H CN
CN
CD tx
i— i in
ONCN tx CD OO CD
ON in CN oo
mCD
in m NO
oo tx i— i CD
mOO ON O CN
•<*•
"1 0 i-! CN
OO ON ON CD tx
i— ' ** r Tt NO
^ °i 0 r^ CN
OO CM CM f— O
">O Tf
LO
CO
i— *
°^ d co
tx ON
T— i I-H
^H
r— 1 LD
IT) IT)
\D
O O ^ 00 (N
. O
<— < CN ^
ON OO
I-H in ON
•* ON in o in" o
CN t in
ON
i-H I-H
i-H
r-H
NO in
t CD CD
CD O tX -* r-l
O CN CD in IX
Tf I-H oo m
CDT^*
CD i— i
O
ON
r-l CD in tX 00
l-H O
r-i 1—
i CN
OO ON O I-H CN
CN ^ tx ON i— '
r-H i—
I T—
1 i— ' CN
00 ON
I-H CD in
0 CD tx O CD
I—
r-l I-H CN
CN
in o in o NO
•t o in i-i
NOin oo o
CD in
OO
•*}• O NO CD
NO ON CN TT tx
r- CN CN CN CD
i— i CD
NO OO
i— i00 Tji O NO CD
Cx CN
tx i— i
NOCN CD CD
t -*
tx in
NO tx oo
00 r— O
i— ' CD
IXooON<U-D
VKotxON
o o o o o
I-H CN CD
•* in
CD o o o c5
oo
oo
in
om
oo
oo
oo
oIX
OO
ON
O
cN
intx
pin
p
in
oin
po
oo
oo
oo
ooo
oo
oo
NO
tx
OO
ON
m
"K 'V
<s bo
I
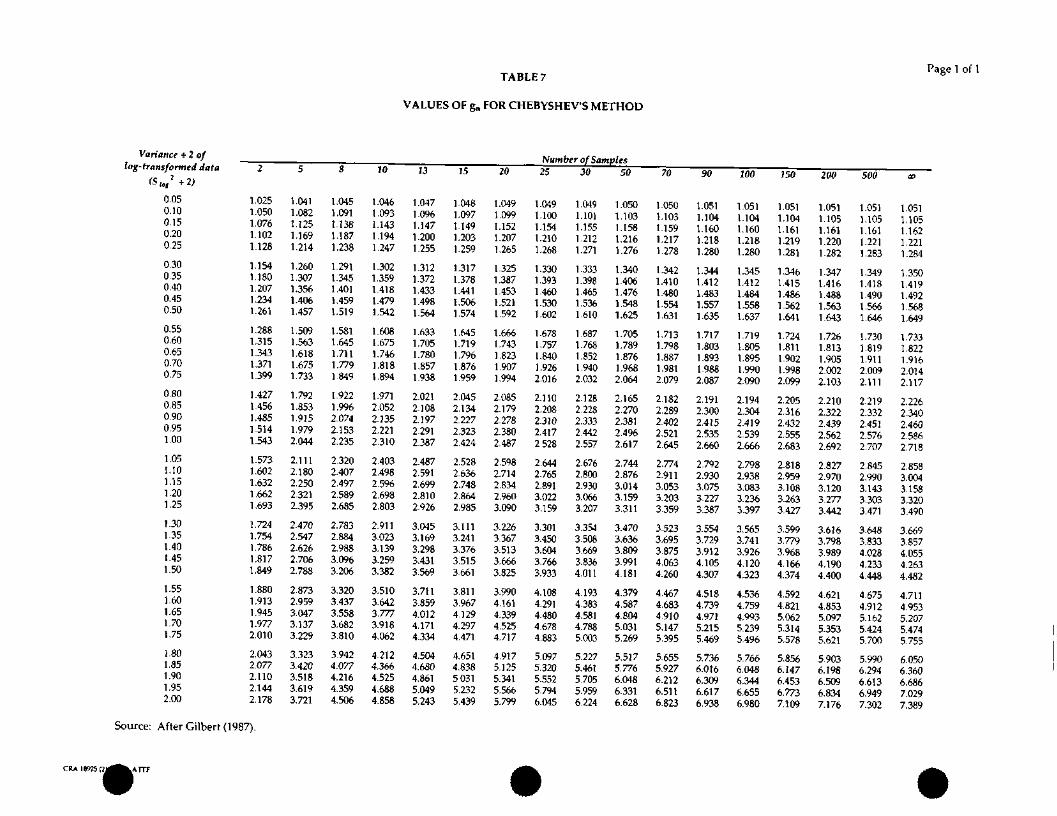
P3
V)
&cVw
>Number
8e0inoo0in<=>
T)
g
r- m
CM
i— • ^f
m o
NO
CN
coO
-- 1
i— C
N
CN
T-I m
T— i •— co
in o
vo
CN
coO
•—
—
CM
C
N
•— in
T-H o C
Nin
o
vo C
N co
O
•— -—
CN
CN
in o
N
O r- 0
0O
i—
•—
CN
CN
•— ^
O O
O O
in
o
vo •—
• coO
T
— ~
- rN
CM
— ^
O C
O O
in o
vo
i— co
O
—
i-< C
N
CN
o
ro O
N tx
co
in o
in
•—
• txO
<
— «
—
fN
rN
O
CO
OO
NO
vOin
o in
•— rx
O
i—
«—
CN
CN
ON
-" in
C
M i—
'
3C
D in
^—
tx—
' •—
• CN
CN
ON Q
>* O
CO
So
in
r-
NO
T-i
.-i C
M C
M
ON O
N fN
tx
in
SCfN
in C
D
NO
O
T- •
rN rN
SCf>
TP
o
in
O
i— fN
CN
tx N
O rx
o
inO
O
i—
CN
C
N
vO
CO
C
O T
rx
in
i— '
oo tx
oo
•
ON
ro
oo C
OO
O
1-1
T-<
C
M
r- C
N in
O
N Tp
SC
O
CN
NO
T-I
O T
-I r- fN
in
o
NO
CN
ooCM in
rx o C
NO
O
O
!-«
•-•
O
ON
CN
CO
ON
HIH
^p T— i co vo Tj*co TT
t in N
O
TP
.—
O
p
NO
*T
to Tj- Tp in N
P
m C
N •* co tx
TJ- i- oo in
coco rr
- in
NO
2* CN
co tx in
CM O
O
•"*
T-I
rp
,— i o
p in
ro
ro
TP
-d* in N
O
3j
o
rx ^P
C
M
ro o
o m
NO
oC
O
ON
vp
CO
i—ro
ro
^F
m N
O
O
CO
O
O
CN
CO
CJN
N
p rO
Oco
ro
••T m
NO
in rx ro
'-i rNC
N C
O in
C
N
ON
co ro
T
P m
m
ro ro
5 m
in
CM rN
ro
oo
*T
i— >
tx rO
O
N
\Oro
co
"^ in
CN
O
N
CO
O
N
CN
o in
i— fx
^ro co
r ^P in
«— • in *— i ON CJN
CN ro •3' TP
in
Un
l
in
co O
rO
N
OT-<
i—
fN
CM
CN
ro CM
-o "*P tx
CO C
M r-i
t—
r-
r-
i— T
-
fN C
N
T-
r-i T
- C
N fN
vo co in C
N ro
fN t-
i O
O
O
fX
OO
ON
O
i—
•
^
_
_- C
N C
N
Tr
r- C
M O
O
ON
ON in m
o o
rx co co ON
o
tx co co oo rx
T-
O
ON
00 C
O
I-H
i—
•—
1-" C
M
CO C
O [X
i-
ON
i—"
ON
CO
CO
tx
HG
H
tx
OO
C
N C
D C
Mco
NO
m
** co
OO
C
x
CD
vO
\orx in
- C
N i— i
vO rx
C
O O
N O
ll'lllS
tx
rx
00
O
N*
co in o
rx
coco o
oo in
ro
oo m
Np QO
*
i— i
in
i — i
ON
O
NC
O •"*
r— '
fX
^in
N
O rx
tx
co
ON ro co
in
to
co in
co
T— i
ON
CN co
co
ro
co
CN
t*i
vO
C
O i—
'rN
co *y in rx
fN
CN
CN
CN
fN
i— • co m tx
orN
ro TP in
rxC
N
CN
C
M
CN
C
N
O
CN
ON
fN C
M
CM co f
m N
OfN
C
M C
M C
N C
N
in N
O C
N in co
o
i— co
in co
CN co -* m
vo
ON
O
«-*
CO
vO
CN
C
N
CM
CN
C
N
— C
D m
in
oO
N O
T-.
CO
N
Ot-> co •* in voC
M
CN
fN
fN
fN
CN
ON
CN
i-<
inC
O
CO
O
fN
Tp
T— CM TT in
NOC
N
CN
CN
C
N
(N
in o
r~" N
O rx
»•• C
M C
O
" N
O
CN CN co Q
^ m^-
fN rO
-«
T m
o oo o tx
co
i— i
CN
ro
r in
CN
C
M
CN
C
M
CM
O
•— '
CN
CO
^f
rN
CM
CM
fN
CN
CN
C
M
CM
C
M
CN
i— «
oO
tx
^- tx
CM
O
O
O
N
OO
O
«-<
•— C
N r"j
CM
C
M
CN
C
N
CN
,— C
M m
^- o
tx in
co CN
i—O
N O
«—
i C
M
CO
»-i
fN
CN
CN
rN
CM NO
^ co m
CM
O
N fX
in
C
OO
N
ON
O
i— • C
N»—
I-H
C
N fN
C
N
CM C
O m
O
N 2
tx vo in
^ coCM in
co T- r*
rp TT
-^ m in
CO -g
1 CO
O
O
in o
m
CN
ON
co
O
"— *
rO
^*
CN
C
O
CO
C
O
CO
m o
co
co T
-
CN
C
M
CO
C
O
CO
rx o o tx
CN
CN rx CN
K
*tC
O
ON
i—
1 (N
Tf
CN
C
M
CO
C
O
CO
CO
O
N C
O C
O
txT—
in
o
N
O C
NC
O
ON
•—
C
M
TP
OO
C
O
CO
N
O
tXO
N
cO
CO
fO
ON
tx
O1
O
CN
C
OC
M
CN
C
O
CO
C
O
fN o
in
rx tx
o co rx C
N co
rx ON
o C
N co
fN
CM
rO
CO
rO
T
r- 1 C
O fO
ON
rx r-t m o m
K o
o C
N ro
CN
fN
C
O C
O C
O
5
rx — i m
J-rx co o
•— co
rx o co
vo o
T£
in
•— •
CM
O
N
NO rx
co o
i-
1
CN C
N C
M ro
ro
in tx
co o o
CN
C
M fN
C
M C
O
oo NO
co *
inC
N rO
*
^O C
Oin
NO rx
oo ON
CM
C
M
CM
C
M
fN
OO
O
N O
N
- fN
• in
NO
co o
CN
C
N fN
C
N
fN
ro oo NO
co co
CN
C
M fN
C
N C
M
o
tx tx ON
inC
N O
O
N C
O
CO
ro *
r in NO
CM
C
N
CN
C
M
CM
•-' o o
•— in
i—
OO
in
CM
O
Ni—
i—
C
M
CO
C
O
CO
C
M C
M
fN
CO
tx
O
CO
vO
O
N
o
rx in co
CN
NO in in
NO
oovO
C
O O
C
N rp
OO
C
O
OO
C
O
Op
TP
CO
C
N
CO
•«*
NO
C
O O
C
M
*
CO rO
* ^
^*
vO C
O O
N O
O
»—
ON
CO
ON
O
*o rx O
N i-
i*
CO rO
CO
*3
*
^
in tx
o
.— ro
LO
1-"
NO
O
CO
NO
^P
C
M C
M
fNin
tx O
N *—
coC
O
CO
C
O TJ
1 TT
TP o
CM
m rx
in C
M r- o
o
in tx
ON
i—1 co
CO
C
O rO
*^
^*
m in
in co
oC
N O
N tx
vO
vOin N
O co o C
NC
O C
O C
O
" Tp
tX
fO
O
ON
C
O^P
N
O C
O O
N
i-
CO
C
O C
O C
O
"*
co in NO
co CD
o m
3
NO
coco
cO
CO
CO
rO
NO fx co N
O in
CM co m
NO oo
co co co ro ro
t— » i— i vo in i—
^ C
M co
tn vo
co co
ro
ro cO
o
i— C
M
r in
co ro co co co
r- C
O O
N O
N C
Nr-i
CN
ro
in
co
O
O
•— C
N
CO
fN ro
co ro
ro
ro
•<*
CO
NO
NO
CO
C
O C
O O
N
Otx
C
O O
N O
C
NC
M
fM
CN
C
O
01
O
tx
NO
vO
C
OIX
**
fM O
00
•T in
N
O
rx
tx
CN in
co
i—
-rfrx
tx
rx
oo
co
i— ' ro
tx
Tt
m—
in
o rx
inrx
O
N C
N ^
rxTJ-
TP
in
in
in
in
CN
C
N Tp
orx
»— •
NC
CM
o
vO
ON
i— T
f tx
TP TT
m in m
•—
CO
tX
CO
-i
CM m
ON
in CNvo oo O
rO
N
O•rp ^
m
in m
CN
1-1
fN
<T
CO
ON
fN
N
O -—
rx
in o
o o
co
m
NO
O
N
CO
O
N
voco
in
O
N co
ON
in rx
o
rN ^p
rp TP
Tp in
un
CO O
N •—
i in
O
Ni—
cO
tx
i— i N
pin
tX
O
N (N
-P
rx co o
rx
inN
O
OO
»— '
* O
N
ON tx
^
T
— O
Ntx
C
O O
C
O vo
co in oo
o C
N
i— i co
m tx
o
co i—
O
co rO
O
ON
CO
tx C
Ot—
i C
N T
p
vO C
O
o
r— O
N. in
fxO
N
vO
CO
C
N
i— •
ON i—
* C
O in
tx
«—
tx
ON
tx ?
—•
t— <
vp
rN
cfN
txO
O
ON
i-. C
N
fC
O C
O ^
^* ^"
1-1
ON
C
N r-
TT— in
.-• rx cotx co o
^H co
ro ro -^ TT -rp
O
(N tx
C
O C
M
•— ^
K r- V
P
CO
C
O C
O C
O
*
O
tx
CO
C
M O
CN co in co •-<
co ^ in
NO
coro
co
co ro
ro
ro O
N tx
rx ON
rx in - ro C
NC
O
ON
O
r- C
N
o co
tn tx
oco •—
T K
i-i
CO
O
N
ON
O
N
CD
O
O
NO
ON
O
Nm
N
O co
C
M oo
o ro
NO
o
ro
NO
N
O v
C tx
tx
O
^
CO
O
N C
N
ON
C
N
vO
ON
C
O
CO
O
O O
N ^
vO
o
ON o
co
rxLT
j \p
N
O vO
[X
NO
tX
C
O
CO
CTN
in rr in
f> o
oo T- TP
K
.-
vO
vO
ON
fx
CO
CO
i—
> O
i—
1 CO
tX
O
CO
NO
O
N
m
rx C
N i—
com
fN
r—
t-i CN
NO o C
N m
coin
in NO
NO NO
rx vo op i—
1 coi—
F>
-d-
CO
CM
m rx o
to
NO
tx —
. m O
N rr
CN NO
o
in rN
CN ^F rx o\ CM
tx o
CM
TP
inS
rsj m
ON
-^co in
tx o
in m
m in
NO
•-< C
N 5
N
O O
CJN 1—1 co in
tx^p in
tn in
m
i— i
CO
-
fM O
Nin
ro ro
co co
vO C
O O
C
N ^*
^ T
in in
in
3*
O
i— '
ON
C
O
r ^p rp
in m
CN *o in co oo
•— • vo fN co
mCN co in
NO co
ON O
C
N C
O in
CO
O
C
O O
N r—
i
co ^ in
vp tx
co rx o
^* oo^ tx
i— ^ tx
5> O
O
O
O
O
•i- *-
II
ro C
O -
O O
O O
O
in o in
o in
o" o o
o o
o m
o in
oC
O
op
ON
ON
O
o o
o o
•-;
.Qa
ATTACHMENT G
JOHNSON-ETTINGER MODELING
018925(21) APPL
TABLE OF CONTENTS
Page
1.0 INTRODUCTION G-l
2.0 METHODOLOGY G-3
3.0 ESTIMATION OF INDOOR AIR EPCS G-5
4.0 RESULTS AND CONCLUSIONS G-8
5.0 REFERENCES G-9
18925 (21) APPL ATTG CONESTOGA-ROVERS & ASSOCIATES
LIST OF TABLES(Following Text)
TABLE G.I INDOOR AIR QUALITY DATA AND COMPARISON TO USEPA TARGETINDOOR AIR CONCENTRATIONS
TABLE F.2 OCCURRENCE, DISTRIBUTION, AND MAXIMUM CONCENTRATIONSIN GROUNDWATER - SOUTHERN PLUME
TABLE G.3 CALCULATION OF INDOOR AIR EXPOSURE POINTCONCENTRATIONS FROM GROUNDWATER - AREA 2 - OFF CNHPROPERTY
TABLE G.4 CALCULATION OF INDOOR AIR EXPOSURE POINTCONCENTRATIONS FROM GROUNDWATER - AREA 3 - FUTUREGROUNDWATER WELL - STOLLEY PARK
TABLE G.5 CALCULATION OF INDOOR AIR EXPOSURE POINTCONCENTRATIONS FROM GROUNDWATER - SOUTHERN PLUME
18925(21)APPL ATTG CONESTOGA-ROVERS & ASSOCIATES

1.0 INTRODUCTION
This Attachment presents the estimation of indoor air exposure pointconcentrations (EPCs) potentially caused by volatile organic compounds (VOCs) ingroundwater present within three areas, two located east and one located south, of theCase New Holland (CNH) property in Grand Island, Nebraska. Two of the off-Siteareas are located within the Northern Study Area. The first area extends east from theCNH property boundary to the approximate vicinity of Brentwood Gravel Pit Lake,herein referred to as Area 2. The second area is located further east from the CNHproperty encompassing Stolley Park and part of the Parkview subdivision bounded byPioneer Boulevard, South Blaine Street East, and Stolley Park Road West, herein referredto as Area 3. The third area is the residential area located south of the CNH property,herein referred to as the Southern Plume; the Southern Plume is unrelated to thegroundwater plume associated with the CNH property. The estimation of indoor airEPCs for the Southern Plume presented herein also evaluates the indoor air datacollected by U.S. EPA in reference to the indoor air modeling.
In 2004, the United States Environmental Protection Agency (U.S. EPA) Region VII hadconcerns about the potential migration of VOCs, as soil vapor, from groundwater to theindoor air of residences located over the Southern Plume, unrelated to the CNHproperty, close to its source west of the Kentish Hills, Mary Lane, and Castle Estates.The VOC concentrations in groundwater are higher in this area than in theParkview/Stolley Park area of the Southern Plume because of the proximity of theupgradient source. U.S. EPA Region VII, through their sub-contractor Terra Tech EMInc., conducted indoor air monitoring to investigate the potential for VOC impacts toresidential buildings overlying the Southern Plume. The resulting indoor air qualitydata provide a direct measure of the potential for VOCs in groundwater to volatilize tosoil vapor and then migrate into the residential buildings. The VOC concentrationswithin the Southern Plume, which is unrelated to the CNH property, represent thegreatest potential for residential indoor air exposure. As a result, the indoor air quality
data for the residences overlying the Southern Plume were considered by U.S. EPARegion VII to be the most conservative (i.e., health protective) of any part of the studyarea. Analysis of the indoor air samples was limited to the VOCs found at the highestconcentrations in groundwater within the Southern Plume [i.e., 1,1,1-trichloroethane(1,1,1-TCA), 1,1-dichloroethane (1,1-DCA), 1,1-dichloroethene (1,1-DCE), andtetrachloroethylene (PCE)]. The analytical results for the indoor air samples arepresented in Table G.I, and demonstrate that these VOCs were either not detected orwere detected at concentrations below U.S. EPA's target indoor air concentrations(U.S. EPA, 2002). The maximum groundwater concentrations within the SouthernPlume (selected based on proximity to the residences where the indoor air monitoring
18925(21)APPLATTG G-1 CONESTOGA-ROVERS & ASSOCIATES
was conducted, at Mary Lane) for these four VOCs are presented in Table G.2 and were
used to estimate the indoor air EPC for the Southern Plume.
Indoor air EPCs were estimated from groundwater using the Johnson and
Ettinger (1991) model (J&E Model) as implemented by U.S. EPA (2004). The indoor air
EPCs were developed following the approach applied by U.S. EPA in their documententitled, "Draft Guidance for Evaluating the Vapor Intrusion to Indoor Air Pathway from
Groundwater and Soils" (Subsurface Vapor Intrusion Guidance) (U.S. EPA, 2002). The
reasonable maximum exposure (RME) groundwater concentrations in samples collected
from Area 2 monitoring wells in 2002, 2003, and 2004, were used to estimate indoor air
EPCs for Area 2. Similarly, RME concentrations in ground water/tap water samples
collected from seven Pioneer Boulevard residential wells in March 2004 were used toestimate indoor air EPCs for Area 3. For the Southern Plume, as described above, the
maximum groundwater concentrations detected at groundwater monitoring wells
located within close proximity to the residences where the indoor air monitoring was
conducted were used to estimate the indoor air EPCs.
The methodology apply to estimate the indoor air EPCs is presented in Section 2.0. The
site-specific input parameters applied in the estimation of the indoor air EPCs aredescribed in Section 3.0. The indoor air EPC results obtained are presented in
Section 4.0. All references cited in this Attachment are listed in Section 5.0.
18925 (21) APPL ATTG G-2 CONESTOGA-ROVERS & ASSOCIATES
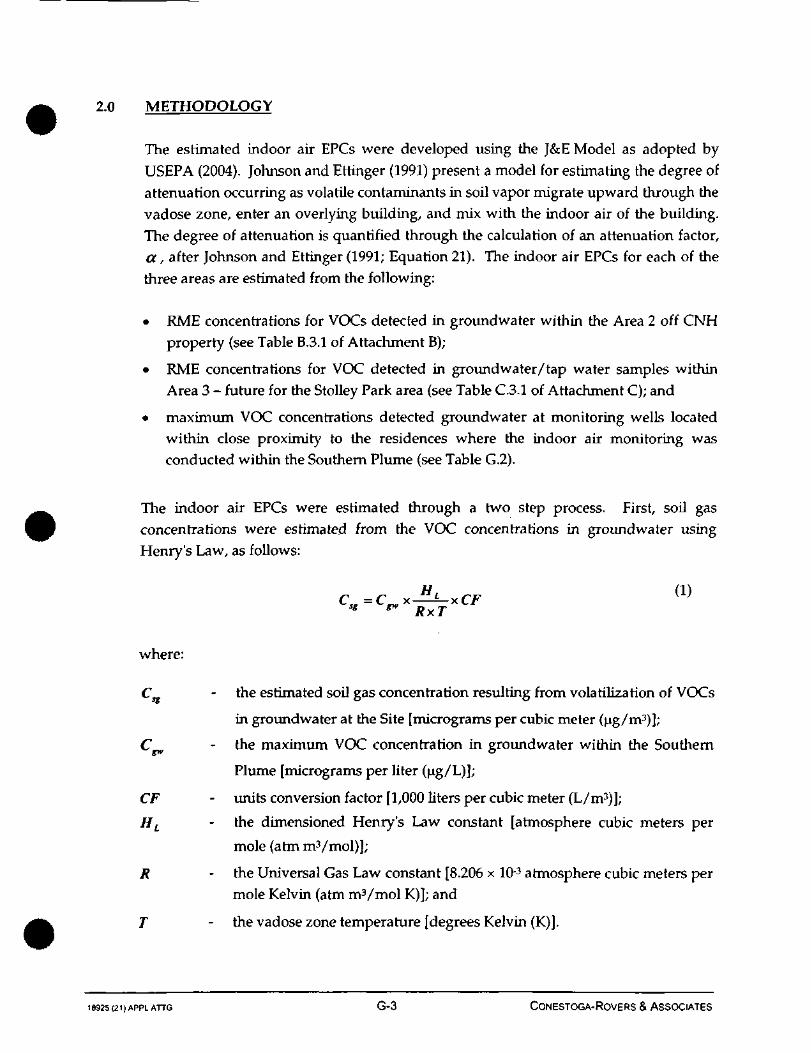
2.0 METHODOLOGY
The estimated indoor air EPCs were developed using the J&E Model as adopted byUSEPA (2004). Johnson and Ettinger (1991) present a model for estimating the degree ofattenuation occurring as volatile contaminants in soil vapor migrate upward through thevadose zone, enter an overlying building, and mix with the indoor air of the building.The degree of attenuation is quantified through the calculation of an attenuation factor,a, after Johnson and Ettinger (1991; Equation 21). The indoor air EPCs for each of thethree areas are estimated from the following:
• RME concentrations for VOCs detected in groundwater within the Area 2 off CNHproperty (see Table B.3.1 of Attachment B);
• RME concentrations for VOC detected in groundwater/tap water samples withinArea 3 - future for the Stolley Park area (see Table C.3.1 of Attachment C); and
• maximum VOC concentrations detected groundwater at monitoring wells locatedwithin close proximity to the residences where the indoor air monitoring wasconducted within the Southern Plume (see Table G.2).
The indoor air EPCs were estimated through a two step process. First, soil gasconcentrations were estimated from the VOC concentrations in groundwater usingHenry's Law, as follows:
C -C x HL xCF (1)LS°-L«" RxT
where:
C - the estimated soil gas concentration resulting from volatilization of VOCs
in groundwater at the Site [micrograms per cubic meter (ug/m3)];
C^ - the maximum VOC concentration in groundwater within the Southern
Plume [micrograms per liter (ug/L)];
CF - units conversion factor [1,000 liters per cubic meter (L/m3)];
HL - the dimensioned Henry's Law constant [atmosphere cubic meters per
mole (atm m3/mol)];
R - the Universal Gas Law constant [8.206 x 10⁻³ atmosphere cubic meters permole Kelvin (atm m3/mol K)]; and
T - the vadose zone temperature [degrees Kelvin (K)].
18925(21)APPLATTG G-3 CONESTOGA-ROVERS & ASSOCIATES

Second, the estimated soil gas concentrations are applied to estimate indoor air EPCs, asfollows:
building sg X a (2)
where:
' building estimated indoor air concentration within a residence overlying
groundwater (jag/m3); anda - the site-specific calculated soil gas attenuation factor which relates the
indoor air concentration to the concentration in soil gas based on theheuristic model developed by Johnson and Ettinger (1991; Equation 21),and accounts for the advective-diffusive migration of contaminants in soilgas through the unsaturated zone soil and building foundation, followedby the mixing of the intruding vapors with building indoor air.
The calculation of the Site-specific soil gas attenuation factor is conducted through theapplication of the Johnson and Ettinger (1991) solution incorporated into a MicrosoftExcel spreadsheet model developed by USEPA (USEPA, 2004;"GW-ADV-Feb04.xls Version 3.1"). The USEPA implementation of the J&E Model hasundergone extensive peer review and is widely accepted by regulatory agenciesthroughout the United States. The site-specific compound, vadose zone soil, andbuilding properties applied to calculate the site-specific attenuation factors used in theestimation of indoor air EPCs are presented in Section 3.0.
18925 (21) APPLATTG G-4 CONESTOGA-ROVERS & ASSOCIATES

3.0 ESTIMATION OF INDOOR AIR EPCs
Indoor air EPCs for Area 2, Area 3, and the Southern Plume, which is unrelated to theCNH site, were estimated using the J&E Model with site-specific compound, vadosezone soil, and building properties. The development of the indoor air EPCs was basedon a typically sized residential building with a basement extending 2 meters (6.6 feet)below ground surface (BGS). Data regarding the vadose zone soil properties overlyingthe Area 3 groundwater and the Southern Plume were not available. As a result, basedon local and regional geology, it is conservatively assumed that the vadose zonesoverlying the Area 3 shallow groundwater and the Southern Plume are comprised of asand soil consistent with the soils observed in Area 1. A description is provided belowof the site-specific compound, vadose zone soil, and building properties applied toestimate the indoor air EPCs for the Southern Plume.
Compound Properties
The compound properties applied to estimate the indoor air EPCs consist of a Henry'sLaw constant, a water diffusion coefficient, and an air diffusion coefficient. The appliedcompound properties for all VOCs were obtained from the chemical properties databasecontained in U.S. EPA (2004). The Henry's Law constant and air diffusion coefficient foreach VOC were corrected to the average groundwater temperature measured at theCNH Property in 2004 of 14.7 degrees Celsius (CRA, 2005). It was assumed that thesame groundwater temperature applies to groundwater within Area 2, Area 3, and theSouthern Plume.
Vadose Zone Soil Properties
As illustrated in the stratigraphic cross-section for the Northern Study Area presentedon Figure 3.4 of the main report, vadose zone soils beneath Area 2 consist of sand or siltysand overlying sand and gravel. As a conservative approach, the vadose zonesoverlying the Area 3 groundwater and the Southern Plume were assumed to consist of asand soil. Thus, vadose zone properties consistent with a sand soil were applied.Applying the properties of a sand soil for Area 3 and the Southern Plume is conservativegiven the limited attenuation against vadose zone vapor migration offered by coarsegrained sand soils as compared to finer grained silt, clay, or loam soils, such as the siltysand observed beneath Area 2. The average depth to the groundwater table beneathArea 2 is 2.41 meters (7.9 feet) BGS (CRA, 2003), and the same depth is assumed to applyto Area 3 and the Southern Plume.
18925(21)APPLATTG G-5 CONESTOGA-ROVERS & ASSOCIATES
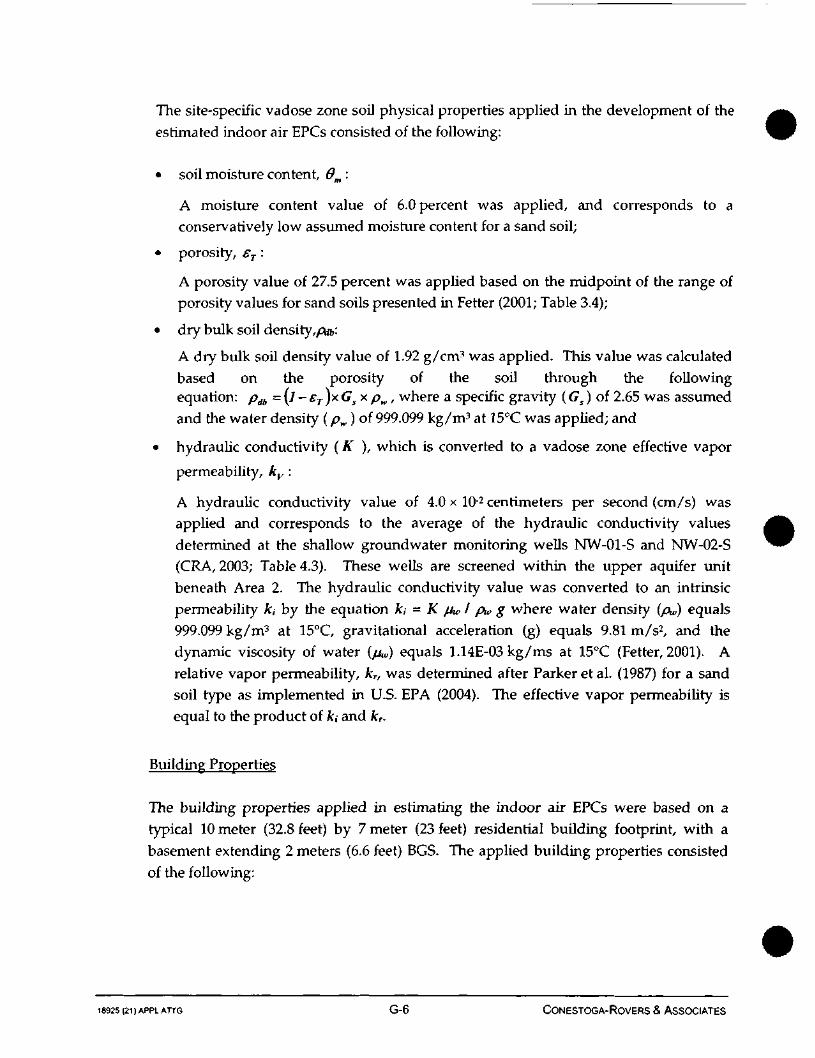
The site-specific vadose zone soil physical properties applied in the development of theestimated indoor air EPCs consisted of the following:
• soil moisture content, 9m :
A moisture content value of 6.0 percent was applied, and corresponds to aconservatively low assumed moisture content for a sand soil;
• porosity, £T :
A porosity value of 27.5 percent was applied based on the midpoint of the range ofporosity values for sand soils presented in Fetter (2001; Table 3.4);
• dry bulk soil density,pdb~.
A dry bulk soil density value of 1.92 g/cm3 was applied. This value was calculatedbased on the porosity of the soil through the followingequation: pdb = (l-£T)xGs xp w , where a specific gravity (G s) of 2.65 was assumedand the water density (pw ) of 999.099 kg/m3 at 15°C was applied; and
• hydraulic conductivity (A" ), which is converted to a vadose zone effective vapor
permeability, kv :
A hydraulic conductivity value of 4.0 x 10~2 centimeters per second (cm/s) wasapplied and corresponds to the average of the hydraulic conductivity valuesdetermined at the shallow groundwater monitoring wells NW-01-S and NW-02-S(CRA, 2003; Table 4.3). These wells are screened within the upper aquifer unitbeneath Area 2. The hydraulic conductivity value was converted to an intrinsicpermeability /c, by the equation k,• = K p™ I pw g where water density (pw) equals999.099 kg/m3 at 15°C, gravitational acceleration (g) equals 9.81 m/s2, and thedynamic viscosity of water (^w) equals 1.14E-03 kg/ms at 15°C (Fetter, 2001). Arelative vapor permeability, k,, was determined after Parker etal. (1987) for a sandsoil type as implemented in U.S. EPA (2004). The effective vapor permeability isequal to the product of fc, and k,.
Building Properties
The building properties applied in estimating the indoor air EPCs were based on atypical 10 meter (32.8 feet) by 7 meter (23 feet) residential building footprint, with abasement extending 2 meters (6.6 feet) BGS. The applied building properties consistedof the following:
18925 (21) APPL ATTG G-6 CONESTOGA-ROVERS & ASSOCIATES
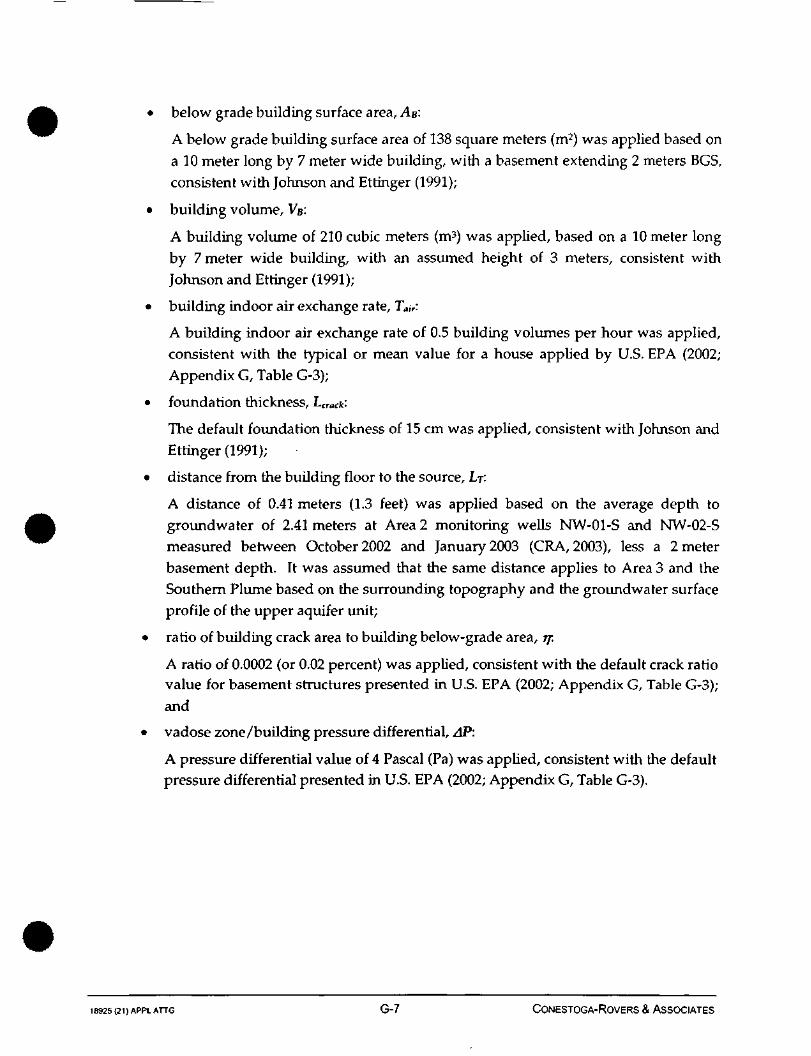
below grade building surface area, AB:
A below grade building surface area of 138 square meters (m2) was applied based ona 10 meter long by 7 meter wide building, with a basement extending 2 meters BGS,consistent with Johnson and Ettinger (1991);
building volume, VV
A building volume of 210 cubic meters (m3) was applied, based on a 10 meter longby 7 meter wide building, with an assumed height of 3 meters, consistent withJohnson and Ettinger (1991);
building indoor air exchange rate, Tm>:
A building indoor air exchange rate of 0.5 building volumes per hour was applied,consistent with the typical or mean value for a house applied by U.S. EPA (2002;Appendix G, Table G-3);
foundation thickness, LCTaCk\
The default foundation thickness of 15 cm was applied, consistent with Johnson andEttinger (1991);
distance from the building floor to the source, LT:
A distance of 0.41 meters (1.3 feet) was applied based on the average depth togroundwater of 2.41 meters at Area 2 monitoring wells NW-01-S and NW-02-Smeasured between October 2002 and January 2003 (CRA, 2003), less a 2 meterbasement depth. It was assumed that the same distance applies to Area 3 and theSouthern Plume based on the surrounding topography and the groundwater surfaceprofile of the upper aquifer unit;
ratio of building crack area to building below-grade area, TJ.
A ratio of 0.0002 (or 0.02 percent) was applied, consistent with the default crack ratiovalue for basement structures presented in U.S. EPA (2002; Appendix G, Table G-3);and
vadose zone/building pressure differential, AP:
A pressure differential value of 4 Pascal (Pa) was applied, consistent with the defaultpressure differential presented in U.S. EPA (2002; Appendix G, Table G-3).
18925(21)APPLATTG G-7 CONESTOGA-ROVERS & ASSOCIATES
4.0 RESULTS AND CONCLUSIONS
The estimated indoor air EPCs for Area 2, Area 3, and the Southern Plume, which is
unrelated to CNH, are presented in Tables G.3, G.4 and G.5, respectively. The appliedchemical, vadose zone soil, and building properties described above are alsosummarized in Tables G.3, G.4, and G.5. Also presented in Tables G.3, G.4, and G.5 arethe U.S. EPA's target indoor air concentrations for each VOC for a cancer risk level of10'6 and a non-cancer hazard level of 1.0, as presented in U.S. EPA (2002; Table 2c). Assummarized in Tables G.3, G.4, and G.5, the estimated indoor air EPCs are less than thecorresponding target indoor air concentrations. As a result, risks/hazards to occupantsof the residential buildings overlying the Southern Plume, and to potential occupants offuture residential buildings overlying Area 2 groundwater and Area 3 ground-water,through the indoor air inhalation exposure pathway are not present above acceptable
levels.
Referring to Table G.5, it can be seen that the indoor air EPCs estimated using U.S. EPA'smodel are less than the VOC concentrations detected in the indoor air samples obtainedfrom residences overlying the Southern Plume that are presented in Table G.I.
18925(21)APPLATTG G-8 CONESTOGA-ROVERS & ASSOCIATES
5.0 REFERENCES
ASTM, 1995. Standard Guide for Risk-Based Corrective Action Applied at Petroleum
Release Sites, ASTM Designation: E1739-95, West Conshohocken, PA.
CRA, 2003. Supplemental Investigation, New Holland, North America, Inc. Facility,
Grand Island, Nebraska, April.
CRA, 2005. Evaluation of In-Situ Remedial Alternatives for Volatile Organic
Compounds (VOCs) in On-site Groundwater RAPMA Program No. 36-336-4917.
Letter Report to Mr. Michael Myers, Remediation Section, State of Nebraska,
Department of Environmental Quality, October 4.
Fetter, C.W., 2001. Applied Hydrogeology, Fourth Edition, Prentice Hall, Upper Saddle
River, New Jersey.
Johnson, P.C. and R.A. Ettinger, 1991. Heuristic Model for Predicting the Intrusion Rate
of Contaminant Vapors into Buildings, Environmental Science and Technology,
25(8), pp. 1445-1452.
Parker, J.C., RJ. Lenhard, and T. Kuppusamy, 1987. A Parametric Model for
Constitutive Properties Governing Multiphase Flow in Porous Media, WaterResources Research, Vol. 23, No. 4, pp. 618-624.
Terra Tech EM Inc., 2004. Final Trip Report and Data Summary Parkview Well Site
Grand Island, Nebraska, November 22.
U.S. EPA, 2002. Draft Guidance for Evaluating the Vapor Intrusion to Indoor Air
Pathway from Groundwater and Soils (Subsurface Vapor Intrusion Guidance),
EPA Report No. EPA530-F-02-052, Office of Solid Waste and Emergency
Response, November.
U.S. EPA, 2004. User's Guide for Evaluating Subsurface Vapor Intrusion into Buildings(Revised), Office of Emergency and Remedial Response, Washington, DC,
February 22.
18925(21)APPLATTG G-9 CONESTOGA-ROVERS & ASSOCIATES
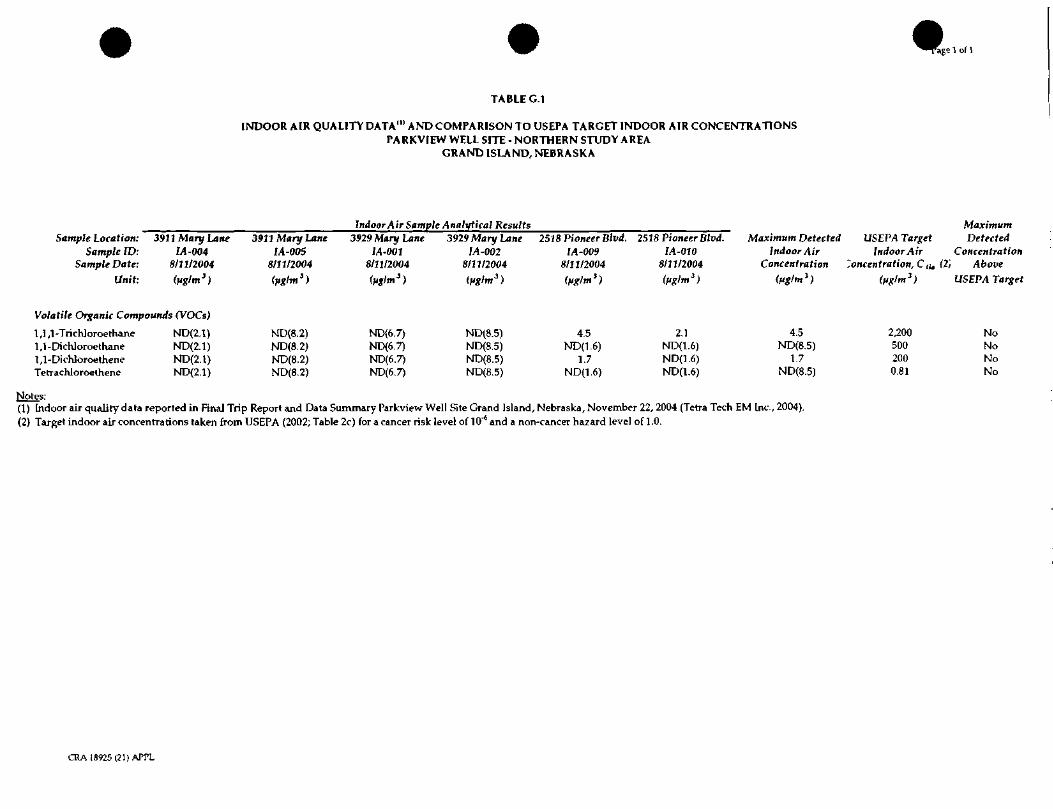
^^Taerage 1 of 1
TABLE G.I
INDOOR AIR QUALITY DATA11' AND COMPARISON TO USEPA TARGET INDOOR AIR CONCENTRATIONSPARKVIEW WELL SITE - NORTHERN STUDY AREA
GRAND ISLAND, NEBRASKA
Indoor Air Sample Analytical ResultsSample Location:
Sample ID:Sample Date:
Unit:
3911 Mary Lane1A-004
8/11/2004(uglm3)
3911 Mary LaneIA-005
8/11/2004
(uglm3)
3929 Mary Lane1A-001
8/11/2004
(uglm3)
3929 Mary Lane1A-002
8/11/2004(uglm3)
251 8 Pioneer Blvd.1A-009
8/11/2004(uglm3)
2518 Pioneer Blvd.IA-010
8/11/2004(ug/m3)
MaximumMaximum Detected USEPA Target Detected
Indoor Air Indoor Air ConcentrationConcentration Concentration, C tif (2', Above
(ug/m3) (ug/m3) USEPA Target
Volatile Organic Compounds (VOCs)
1,1,1-Trichloroethane ND(2.1)1,1-Dichloroethane ND(2.1)1,1-Dichloroethene ND(2.1)Tetrachloroethene ND(2.1)
MD(8.2)ND(8.2)ND(8.2)ND(8.2)
ND(6.7)ND(6.7)ND(6.7)ND(6.7)
ND(8.5)ND(8.5)ND(8.5)ND(8.5)
4.5ND(1.6)
1.7ND(1.6)
2.1ND(1.6)ND(1.6)ND(1.6)
4.5ND(8.5)
1.7ND(8.5)
2,2005002000.81
NoNoNoNo
Notes:(1) Indoor air quality data reported in Final Trip Report and Data Summary Parkview Well Site Grand Island, Nebraska, November 22, 2004 (Terra Tech EM Inc., 2004).(2) Target indoor air concentrations taken from USEPA (2002; Table 2c) for a cancer risk level of 10"* and a non-cancer hazard level of 1.0.
CRA 18925 (21) APPL
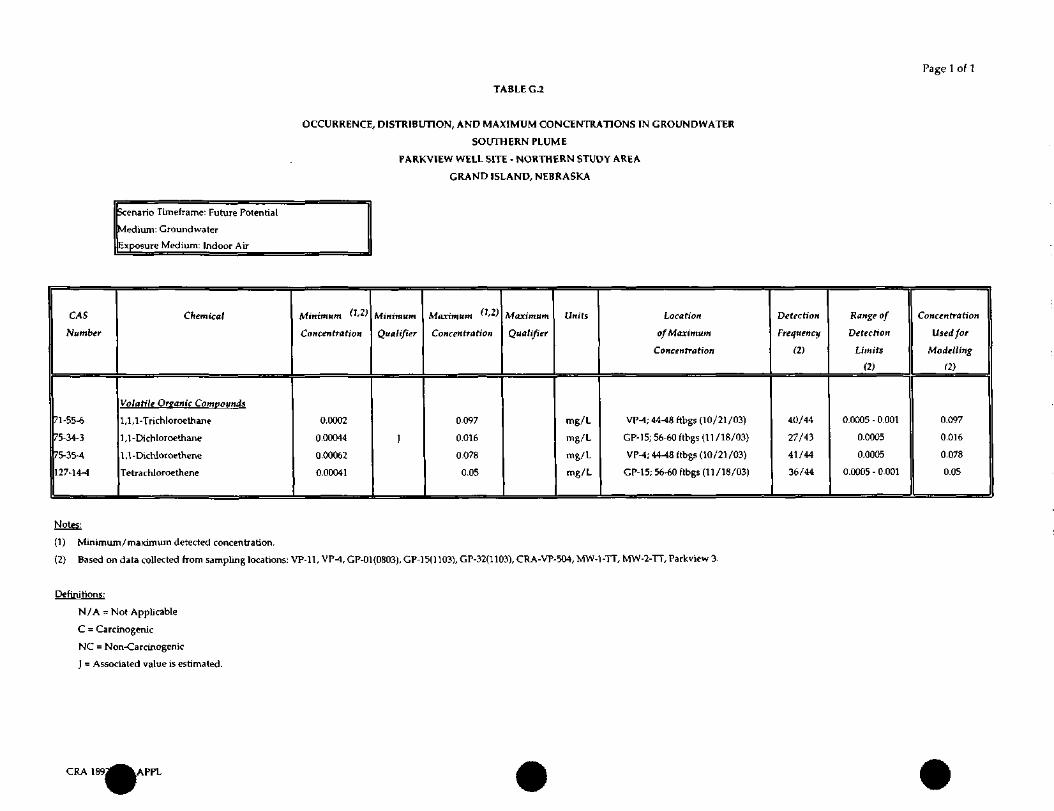
TABLE G.2
Page 1 of 1
OCCURRENCE, DISTRIBUTION, AND MAXIMUM CONCENTRATIONS IN GROUNDWATER
SOUTHERN PLUME
PARKVIEW WELL SITE - NORTHERN STUDY AREA
GRAND ISLAND, NEBRASKA
Scenario Timeframe: Future Potential
Medium: Groundwater
Exposure Medium: Indoor Air
CAS
Number
71-55-6
75-34-3
75-35-4
127-14-4
Chemical
Volatile Organic Compounds
1 ,1 ,1 -Trichloroe thane
1 ,1 -Dichloroe thane
1,1-Dkhloroethene
Tetrachloroethene
Minimum C1'2*
Concentration
0.0002
0.00044
0.00062
0.00041
Minimum
Qualifier
]
Maximum ' '"
Concentration
0.097
0.016
0.078
0.05
Maximum
Qualifier
Units
mg/L
mg/L
mg/L
mg/L
Location
of Maximum
Concentration
VIM; 44^18 ftbgs (10/21/03)
GP-15; 56-60 ftbgs (11/18/03)
VP-i; 44^8 ftbgs (10/21 /03)
CP-15; 56-60 ftbgs (11/18/03)
Detection
frequency
(2)
40/44
27/43
41/44
36/44
Range of
Detection
Limits
m
0.0005 - 0.001
0.0005
0.0005
0.0005 - 0.001
Concenfrufion
Used for
Modelling
12)
0.097
0.016
0.078
0.05
Notes:
(1) Minimum/maximum detected concentration.
(2) Based on data collected from sampling locations: VP-11, VP^J, GP-01(0803), GP-15(1103), GP-32(1103), CRA-VP-504, MW-l-TT, MW-2-TT, Parkview 3.
Definitions:
N/A = Not Applicable
C = Carcinogenic
NC = Non-Carcinogenic
J = Associated value is estimated.
CRA 1892 kAPPL

Iff 1 Of 1
CALCULATION OF INDOOR AIR EXPOSURE POINT CONCENTRATIONS FROM CROUNDWATERAREA 1 - OFF CNH PROPERTY
PARKVIEW WELL SITE - NORTHERN STUDY AREAGRAND ISLAND, NEBRASKA
Chemical of
Concern ICOC)
1 ,1 , 1 -Trichloroe thane1 ,1 -Dichloroe thane
1,1-Dichloroplhene
cis-1,2 DicWoroethene
Trichloroethene
Tetrdchloroethene
Henry's Law
Constant, H L
(atm m'lmol)
1.07E-02 (14.7°C)
3.59E-03 (14.7°C)
1.77E-02 (14.7°C)
2.56E-03 (14.rq
6.15E-03 (14.7°C)1.03E-02 (14.7°Q
Chemical Properties "'
Water DiffusionCoefficient, DM°
(cm'ls}
8.80E-06 (25° C)
1.05E-05 (25° C)
1.04E-05 (25° C)
113E-05 (25° C)
9.10E-06 (25° C)
8.20E-06 (25° C)
Air Diffusion
Coefficient, D '"
(cm'ls)
7.40E-02 (14.7°C)
7.04E-02 (14.7° C)
8.54E-02 (14.7° C)
6.98E-02 (14.7° C)
7.49E-02 (14.7° C)
6.83E-02 (14.7° C)
Johnson fj
Ettinger
Attenuation
Factor, a "'
1.52E-05
3.33E-05
1.43E-05
4.61 E-05
2.11E-05
1.43E-05
VOC Conrmrrationin Groundwater
C n»
(uglL)
1.81E+00
5.13E+00
1.52E+00
7.20E-01
8.90E-01
1.80E-01
VOC Concentration
in Soil Gas
Above Water Table
c."(ug/m')
8.20E+02
7.79E4O2
1.14E403
7.80E»O1
2.32E»02
7.88E+01
Indoor Air
EPC
Cj-iui, '"
luglm')
0.01
0.03
0.02
0.004
0.005
0.001
USEPA Target
Indoor Air
Concentration
Cn.a,
<uglm>>
2^00500
200.0
35
0.022 (1.42)"
0.81
NotCS:
(1) The applied chemical properties are obtained from the chemical properties database implemented in USEPA (2004). The Henry's Law constant and air diffusion coefficient were corrected for an averagevadose zone temperature of 14.7°C. The reference temperature for the water diffusion coefficient is 25°C and, considering its low value, a correction to 14.7°C was considered negligible.
(2) The soil gas attenuation factor a is based on the solution for soil gas migration to building indoor ajr presented in Johnson and Ettinger [1991; Equation (21)], the vadose zone and building properties listed below,
and a 4 Pa pressure difference between the vadose zone and the building (AP) after the default value applied by USEPA (2002; Table G-3). The calculation of the soil gas attenuation factor was conducted
using the Excel spreadsheet "CW-ADV-Feb04.xls" developed by USEPA (2004) and the following Site-specific vadose zone and building properties.
Vadosr Zone Soil Properties:
Building Proprrtits
Moisture Content, 6m (%) 6.0
Total Porosity, eT (%) 27.5Moisture-Filled Porosity, em 0.115
Vapour-Filled Porosity, t, 0.160
Dry Bulk Soil Density, p^ (g/cmj) 1.92
Hydraulic Conductivity, K (cm/s) 4.02E-02Intrinsic Permeability, k, (cm3) 4.67E-07
Relative Vapor Permeability, k, (cm1) 0.672
Effective Vapor Permeability, k* (cm3) 3.14E-07
Vadose Zone Temperature (°C) 14.7
Distance from Source to Building, LT (m) 0.41
Vapor Viscosity of Air, u, at 14.7°C (g/cm s) 1.77E-04
Below-Crade Area of Building Surfaces, AB (m1) 138
Building Volume, VB (m1) 210
Building Air Exchange Rale, T^ (\ /hr) 0.50
Ratio of Crack Area to Below-Grade Area, n (%) 0.02
Foundation Thickness, U™-i (cm) 15
A moisture content of 6% is conservatively assumed for a sand soil.A totaJ porosity of 27.5% is conservatively assumed based on the midpoint of the range for sand presented in Fetter (2001; Table 3.4)
Moisture-filled porosity, £„, = 6m /100*(pdb/pJ, where pw = 999.099 kg/m1 is the density of water at 15°CVapour-filled porosity, E¥ = eT / 100 - tm
The dry bulk density was calculated from the relationship, Pdb = 0 - cT)*pw where a solid particle density, p, = 2.65 g/cm3 was assumed.Average hydraulic conductivity for Area 2 shallow groundwater monitoring wells NW-Ol -S and NW Q2-S (CRA, 2003; Table 3.4)
Intrinsic permeability, k = K u^ / pw g*100, where water density, pw= 999.099kg/mJ at 15.0°C, gravitational acceleration g = 9.81 m/s2, and
the dynamic viscosity of water, uw=l.l404e-3 kg/ms at 15.0°C (Fetter, 2001).Estimated after Parker et al. (1987) for a sand soil as implemented in USEPA (2004) to account for the reduction in permeability
due to the degree of vadose zone water saturation.Determined from kv=kf*ki.
A vadose zone temperature of 14.7°C was assumed for Area 1 based on the average groundwater temperature measured on CNH Property duringgroundwater sampling performed in 2004 as reported In CRA (2005).
Determined from the average depth to groundwater of 2.41 m in Area 2 shallow groundwater monitoring wells, NW-01-S and NW-02-S
measured between October 2002 and January 2003 (CRA, 2003), less a basement below grade depth of 2 m (6.5 ft).
Vadose zone temperature corrected vapor viscosity as implemented in USEPA (2004).
Conservatively assumed based on a 10 m by 7 m (30.5 ft by 25 ft) area and 2 m (6.6 ft) basement depth (dimensions are consistent with the house
applied in Johnson and Ettinger (1991))Conservatively assumed based on a 10 m by 7 m (30.5 ft by 25 ft) area and an assumed building height of 3 m (10 ft) (dimensions are consistent with the houj
applied in Johnson and Ettinger (1991))Default enclosed-space air exchange rate for residential buildings as applied in USEPA (2002; Table G-3)
Default building crack ratio value for residential buildings presented in USEPA (2002; Table G-3).
Assumed based on the typical value of 15 cm (6 inches) for floor slab thickness.
(3) Reasonable maximum exposure concentration reported for groundwater samples collected from Area 2 monitoring wells CRA-VP-305, CRA-VP-603, GGW-551, GGW-552, GGW-554, GGW-555, GGW-556, GP-05(0803), GP-06(0803), CP-09(0803),
NW-01-D, NW-Ol-l, NW-01-S, NW-02-D, NW-02-1, NW-02 S, P-12, P-13, P-14, P-20, and P-21 during monitoring performed in 2002, 2003, and 2004 (Table B 3.1 of Attachment B).(4) The soil gas concentration above the water table was calculated from the groundwtiter concentration using Henry's Law; C^ = C^'H^RT) where T is the vadose temperature in degrees Kelvin and the universal gas constant R is 8.206E-05 atm m /mol K.
(5) The indoor air exposure point concentration is calculated from C^du^ Ct| *a.
(6) Target indoor air concentrations taken from USEPA (2002; Table 2c) for a cancer risk level of 10"* and a non-cancer hazard level of 1.0.(7) Value in parenthesis is the target indoor air concentration calculated using dated TCE toxJcity data.
CRA lff)25(21) APFL

TABLE G.4
CALCULATION OF INDOOR AIR EXPOSURE POINT CONCENTRATIONS FROM CROUNDWATER
AREA 3 - FUTURE GROUNDWATER WELL - STOLLEY PARK
PARKVIEW WELL SITE - NORTHERN STUDY AREAGRAND ISLAND, NEBRASKA
Page 1 of 1
Chemical of
Concern (COO
1,1,1-Trichloroelhane
1 ,1 -Dichloroe thane
1 ,1 -Dichloroethene1 ,2-Dichloroethane
Tetrachloroethene
Henry's Law
Constant, H L
(atm mVmo/)
107E-02 (14.7°C)
3.59E-03 (14 rc)
1.77E-02 (14.7° C)
585E-04 (14.7° C)
1.03E-02 (14.7°C)
Chemical Properties '"
Water DiffusionCoefficient, I)1"0
(an'/sl
8.80E-06 (25° C)
1 05E-05 (25° C)
1.04E-05 (25° C)
1.13E-05 (25°C)
8.20E-06 (25° C)
Air Diffusion
Coefficient, D lu
(cm'/s)
7.02E02 (14.7° C)
6.68E-02 (14.7° C)
8.10E-02 (147°C)
987E-02 (14.7° C)
648E-02 (14.7° C)
Johnson f.f
Ettinger
Attenuation
Factor, a '1>
1.52E-05
3.33E-05
1.43E-051.53E-O4
1.43E-05
VOC Concentration
in Groundwater
Cr-r"(ug/L)
3.00E+01
470E+OO
2.66E+01
6.50E-01
9.50E+OO
VOC Concentration
in Soil Gas
Above Water Table
c,,"1
lag/m't
1.36E+04
7.14E+022.00E^M
1 61E-K11
4.16E+03
Indoor Air
LPC
ChnU««"'
(ug/m'1
0.21
0.02
0.29
0.002
0.06
USEPA Target
Indoor Air
Concentrationr int- ru
(fg'l'l
2,200500
200
0094
0.81
Notes:
(1) The applied chemical properties are obtained from the chemical properties database implemented in USEPA (2004). The Henry's Law constant and air diffusion coefficient were corrected for an averagevadose zone temperature of 14.7°C The reference temperature for the water diffusion coefficient is 25°C and, considering its low value, a correction to 14.7°C was considered negligible.
(2) The soil gas attenuation factor a is based on the solution for soil gas migration to building indoor air presented in Johnson and Ettinger [1991; Equation (21)), the vadose zone and building properties listed below,
and a 4 Pa pressure difference between the vadose zone and the building (AP) after the default value applied by USEPA (2002, Table G-3). The calculation of the soil gas attenuation factor was conducted
using the Excel spreadsheet "GW-ADV-Feb04.xls" developed by USEPA (2004) and the following Site-specific vadose zone and bui lding properties.
Vadose 7&nt Soil Propcrtirs:
Moisture Content, 9^ (%) 6.0
Total Porosity, ET(%) 27.5Moisture-Filled Porosity, c,,, 0.115
Vapour-Filled Porosity, t> 0.160
Dry Bulk Soil Density, pdb (g/cm1) 1.92
Hydraulic Conductivity, K (cm/s) 4.02E-02Intrinsic Permeability, k. (cm1) 4.67E-07
Relative Vapor Permeability, k, (cm1) 0.672
Effective Vapor Permeability, k, (cm1) 3.14E-07
Vadose Zone Temperature (°C) 14.7
Distance from Source to Building, LT (m) 0.41
Vapor Viscosity of Air, m at 14.7"C (g/cm s) 1.77E-04
Building Properties
Below-Grade Area of Building Surfaces, AH fm j) 138
Building Volume, V B (m J ) 210
Building Air Exchange Rate, T^ (1 /hr) 0.50
Ratio of Crack Area to Below-Crade Area, n f%) 002Foundation Thickness, L^A (cm) 15
A moisture content of 6% is conservatively assumed for a sand soil.A total porosity of 27.5% is conservatively assumed based on the nudpoint of the range for sand presented in Fetter {2001; Table 3 4)
Moisture-filled porosity, tm = 6m /100*(pdb/pw), where pw = 999.099 kg/m J is the density of water at 15°C.
Vapour-filled porosity, tv = CT / 100 - Em
The dry bulk density was calculated from the relationship, pdtl = (1 - tT)*P« where a solid particle density, p. = 2.65 g/cm3 was assumed.Average hydraulic conductivity for Area 2 shallow ground water monitoring wells [SJW-01-S and NW-02-S (CRA, 2003; Table 3.4)
Intrinsic permeability, k=K M* / p» g*100, where water density, ptt=999.099kg/m1 at 15.0 °C, gravitational acceleration g=9 81 m/s:, and
the dynamic viscosity of water, u^=1.1404e-3 kg/ms at 15.0°C (Fetter, 2001).Estimated after Parker et al. (1987) for a sand soil as implemented in USEPA (2004) to account for the reduction in permeability
due to the degree of vadose zone water saturation.
Determined from k^k/k,.
A vadose zone temperature of 14.7°C was assumed for Area 1 based on the average groundwaler temperature measured on CNH Property during
groundwaler sampling performed in 2004 as reported in CRA (2005).Determined from the average depth to groundwater of 2 41 m (7.9 ft) in Area 2 shallow groundwater monitoring wells, NW-01-S and NW-02-S
measured between October 2002 and January 2003 (CRA, 2003), less a basement below grade depth of 2 m (6.5 ft).
Vadose zone temperature corrected vapor viscosity as implemented in USEPA (2004)
groundwater sampling performed in 2004 as reported in CRA (2005).
Conservatively assumed b^sed on a 10 m by 7 m (30.5 fl by 25 ft) area and 2 m (6.6 ft) basement depth [(dimensions are consistent with the house
applied in Johnson and Ettinger (1991)]Conservatively assumed based on a 10 m by 7 m (30.5 ft by 25 ft) area and an assumed building height of 3 m (10 ft) [dimensions are consistent with the house
applied in Johnson and Ettinger (1991)]Default enclosed-space air exchange rate for residential buildings as applied in USEPA (2002; Table G-3).
Default building crack ratio value for residential buildings presented in USEPA (2002; Table G-3).
Assumed based on the typical value of 15 cm (6 inches) for floor slab thickness.
(3) Resonable maximum exposure reported for ground water/tap water samples collected at 2508, 2510, 2512, 2514, 2518,and 2522 Pioneer Boulevard in March 2004 (Table C.3.1 of Attachment C).(4) The soil gas concentration above the water table was calculated from the groundwater concentration using Henry s Law; Clg = C^*HL/(RT) where T is the vadose temperature in degrees Kelvin and the universal gas constant R is 8.206E-05 arm m'/mol K.
(5) The indoor air exposure point concentration is calculated from CbuUdlr<= Cig*a.
(6) Target indoor air concentrations taken from USEPA (2002, Table 2c) for a cancer risk level of 10"* and a non-cancer hazard level of 1.0.
2\)f^^^
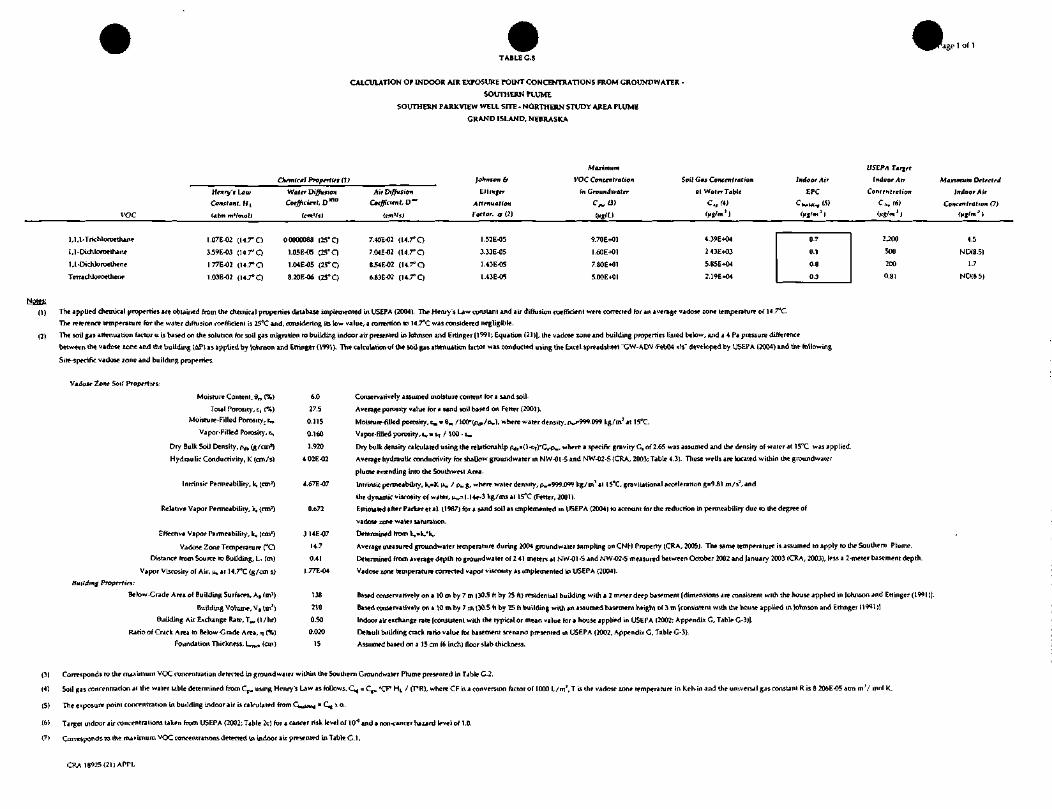
rage 1 ol 1
TABLE G.5
CALCULATION OF INDOOR AIR EXPOSURE POINT CONCENTRATIONS FROM CROUNDWATER -
SOUTHERN PLUME
SOUTHERN PARKVIEW WELL SITE - NORTHERN STUDY AREA PLUME
GRAND ISLAND, NEBRASKA
voc
1 ,1 ,1 -Trichloroethane
1,1-Dichloroethane
1,1-Dichloroelhene
TetrachJoroethene
Notes;
Henry's Law
Constant, HL
(«tm m'lmoli
1.07E-02 (U.rC)
3.59E-03 (14.rQ
1.77E-02 (14.7°Q
1.03E-02 (14.7° Q
Chemical Propfrtiet (1)
Water Diffvrion
Coefficient, Dm°
(rmVj)
0.0000088 (25" Q
1.05E-05 (25°Q
1.04E-05 (25° Q
8.20F-06 (25° C)
Maximum USEPA Target
John ton b VOC Concentration Soil Gas Concentration Indoor Air Indoor Air Maximum Detected
Air Diffusion Etlmger in Groundwater at WaterJable EPC Concentration Indoor Air
Coefficient. D'" Attenuation C _ (3) C ., (4) C^Ui.t (5) C ,.. (6) Concentration (7)
(rmVsJ Factor, a (2) fagfU fyg'™3 ) <CJJ/m * ) ^n'm1 J (j*JT/mJ )
7.40E-02 (14.7° Q 1.52E-05 9.70E+01 4.39E+04 0.7 2.200 4.5
7.04E-02 (14.7° Q 3.33E-05 1.60E+01 2.43E-K13 0.1 500 NCH8.5)
8.54E-02 (14.7° Q 1.43E-05 7.80E+01 5.85E+W 0.8 200 1.7
6.83E-02 (14.7° Q 1.43E-05 5.00E+01 2.19E+O4 0.3 0.81 ND<8 5)
(1) The applied chemical properties are obtained from the chemical properties database implemented in USEPA (2004). The Henry's Law constant and air diffusion coefficient were corrected for an average vadose zone temperature of ]4.7°C.
The reference temperature for the water diffusion coefficient ii 25°C and, considering its low va lue, a correction to 14.7°C was considered negligible.
(2) The soil gas attenuation factor a is based on the solution for soil gas migration to building indoor air presented in Johnson and Ettinger [1991; Equation (21)], the vadose zone and building properties listed below, and a 4 Pa pressure difference
between the vadose rone, and the building (iP) as applied by Johnson and Ettingei(1991). Th* calculation of the soil gas attenuation factor was conducted using the Excel spreadsheet "GW-ADV-FebM <ls" developed by VJSEPA (2004) and the following
Site-specific vadose zone and building properties.
Vadosf Zone Soil Properties:
Building Properties:
Moisture Content, 9m (%)
Total Porosity, c, (%)
Moisture-Filled Porosity, £„
Vapor-Filled Porosity, t.
Dry Bulk Soil Density, pdb (g/on1)
Hydraulic Conductivity, K (on/s)
Intrinsic Permeability, k, (cm1)
Relative Vapor Permeability, k, (cm1)
Effective Vapor Permeability, kv (cm1)
Vadose Zone Temperature (°Q
Distance from Source to Building, LT (m)
Vapor Viscosity of Air, u, at 14.7°C(g/cm s)
Below-Grade Area of Building Surfaces, A§ (ma)
Building Volume, V, (m3)
Building Air Exchange Rate, Tllf (1 /hr)
Ratio of Crack Area to Below-Crade Area, n (%)
Foundation Thickness, Ln,rt (on)
6.0
27.5
0.115
0.160
1.920
4.02E-02
4.67E-07
0.672
3.14E-07
14.7
0.41
1.77E-04
138
210
0.50
0.020
15
Conservatively assumed moisture content for a sand soil.
Average porosity value for a sand soil baS*d on Fetter (2001 ).
Moisture-filled porosity,^ = 6m /100"(pdb/Pw), where water density, 0^=999.099 kg/nv'at 15°C.
Vapor -filled porosity, = &T / 100 - E™
Dry bulk density calculated using the relationship Pdt,=0 -CT)*C-.-PW, where a specific gravity G, of 2.65 was assumed and the density of water at 15°C was applied.
Average hydraulic conductivity for shallow groundwater in NW-01 -Sand NW-02-S(CRA, 2003; Table 4.3). These wells are located within the groundwater
plume extending into the Southwest Area-
Intrinsic penneabiLty, k,-K m. / Pw g, where water density, pw=999.099 kg/m1 at 15°C, gravitational acceleration g=9.81 m/s3, and
the dynamic viscosity of water, uw=i.!4e-3 kg/ms at 15°C (Fetter, 2001).
Estimated after Parker eta). (1987) for a sand soil as implemented in USEPA (2004) to account for the reduction in permeability due to the degree of
vadow zone water saturation.
Determined from k,=k/k,.
Average measured groundwater temperature during 2004 groundwater sampling cm CNH Property (CRA, 2005). The same temperature is assumed to apply to the Southern Plume.
Determined from average depth to ground water of 2.41 meters at NW -01 -Sand NW-02-S measured between October 2002 and January 2003 (CRA, 2003), less a 2-meler basement depth.
Vadose zone temperature corrected vapor viscosity as implemented in USEPA (2004).
Based conservatively on a 10 m by 7 m (30.5 ft by 25 ft) residential building with a 2 meter deep basement [dimensions are consistent with the house applied in Johnson and Ettinger (1991 )].
Bised conservatively on a 10 m by 7 m (30.5 ft by 25 h building with an assumed basement height of 3 m (consistent with the house applied m Johnson and Ettinger (1991 ))
Indoor air exchange rate [consistent with the typical or mean value fora house applied in USEPA (2002; Appendix C, Table C-3)).
Default building crack ratio value for basement scenario presented in USEPA (2002; Appendix G, Table C-3).
Assumed based on a 15 on (6 inch) floor slab thickness.
(3) Corresponds to the maximum VOC concentration detected in groundwater within the Southern Croundwater Plume presented in Table C.2.
(4) Soil gas concentration at the water table determined from C^ using Henry's Law as follows, C, = Cp. "CP HL / (T*R), where CF is a conversion factor of 1000 L/mJ, T is the vadose zone temperature in Kelvin and the universal gas constant R is 8 206E-05 aim m V mol K.
(5) The exposure point concentration in building indoor air is calculated from Quidini = C^ > a.
(6) Target indoor air concentrations taken from USEPA (2002; Table 2c) for a cancer risk level of 10"* and a non-cancer hazard level of 1.0.
(7) Corresponds to the maximum VOC concentrations detected in indoor air presented in Table G.I.
CRA 18925 (21) APPL
ATTACHMENT H
AMBIENT AIR STUDY AND MODELING
018925(21) APPL
TABLE OF CONTENTS
Page
1.0 INTRODUCTION H-l-1
2.0 RTI LAGOON MODEL H-l-2
3.0 BOX MODEL H-l-4
4.0 REFERENCES H-l-6
18925 (21) APPL ATTH-1 CONESTOGA-ROVERS & ASSOCIATES

LIST OF TABLES(Following Text)
TABLE 1 DERIVATION OF COPC EMISSION RATES FROM GROUNDWATERIN A CHILD'S POOL - AREA 2 CNH OFF-PROPERTY GROUNDWATER
TABLE 2 DERIVATION OF COPC EMISSION RATES FROM GROUNDWATERIN A CHILD'S POOL - AREA 3 FUTURE GROUNDWATER WELL
TABLE 3 AVERAGE WIND SPEEDS FOR CHILD POOL AND TRENCH SCENARIOS
TABLE 4 ESTIMATED MAXIMUM AMBIENT AIR CONCENTRATION FORCHILD POOL SCENARIO - AREA 2 - CNH OFF-PROPERTYGROUNDWATER
TABLE 5 ESTIMATED MAXIMUM AMBIENT AIR CONCENTRATION FORCHILD POOL SCENARIO - AREA 3 - FUTURE GROUNDWATER WELL
LIST OF ATTACHMENTS
ATTACHMENT H-2 METEOROLOGICAL DATA FROM 2001 TO 2005 FOR GRANDISLAND AIRPORT
18925 (21) APPL ATTH-1 CONESTOGA-ROVERS & ASSOCIATES

1.0 INTRODUCTION
This Attachment presents the details regarding the RTI vapour emission model used toestimate the emission rates from a child pool filled with groundwater from Area 2: CNHoff-property groundwater and Area 3: Future groundwater well. The emission rates areapplied to estimate potential concentrations in ambient air in the immediate vicinity ofthe child pool that a child aged 2 to 8 years old could inhale.
18925(21)APPLATTH-1 H-1-1 CONESTOGA-ROVERS & ASSOCIATES
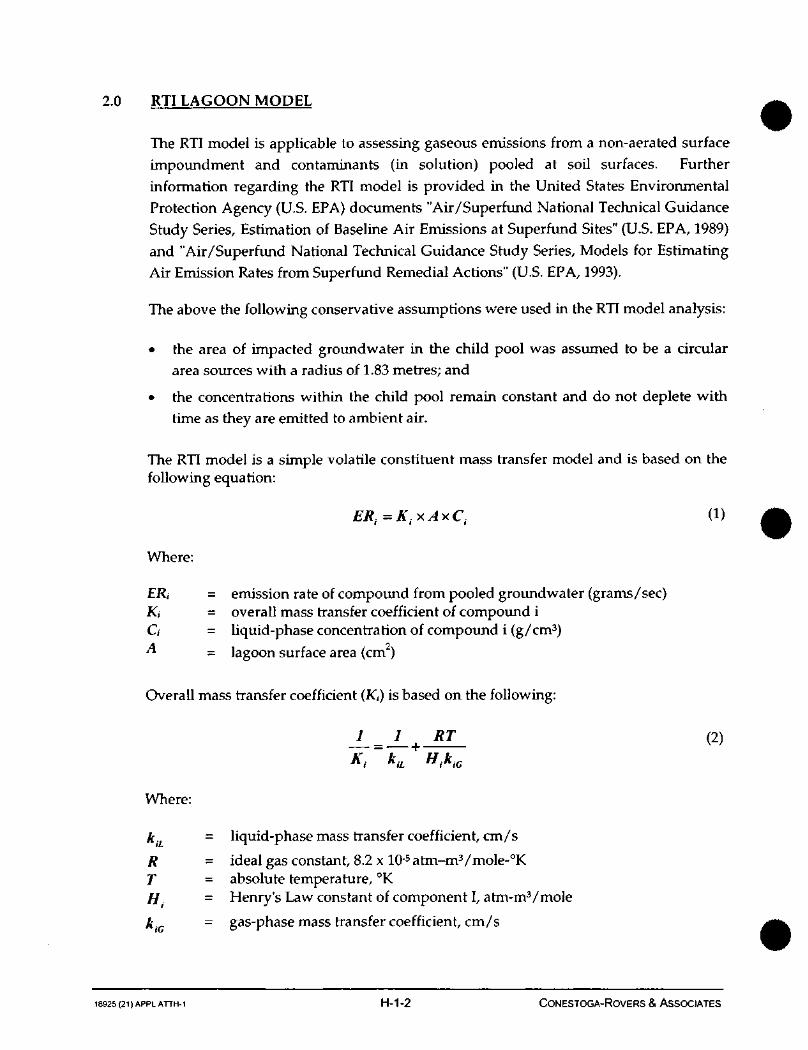
2.0 RTI LAGOON MODEL
The RTI model is applicable to assessing gaseous emissions from a non-aerated surfaceimpoundment and contaminants (in solution) pooled at soil surfaces. Furtherinformation regarding the RTI model is provided in the United States EnvironmentalProtection Agency (U.S. EPA) documents "Air/Superfund National Technical GuidanceStudy Series, Estimation of Baseline Air Emissions at Superfund Sites" (U.S. EPA, 1989)and "Air/Superfund National Technical Guidance Study Series, Models for EstimatingAir Emission Rates from Superfund Remedial Actions" (U.S. EPA, 1993).
The above the following conservative assumptions were used in the RTI model analysis:
• the area of impacted groundwater in the child pool was assumed to be a circulararea sources with a radius of 1.83 metres; and
• the concentrations within the child pool remain constant and do not deplete withtime as they are emitted to ambient air.
The RTI model is a simple volatile constituent mass transfer model and is based on thefollowing equation:
E R i = K i x A x C i (1)
Where:
= emission rate of compound from pooled groundwater (grams/sec)Ki = overall mass transfer coefficient of compound iCt = liquid-phase concentration of compound i (g/cm3)
^ = lagoon surface area (cm2)
Overall mass transfer coefficient (Ki) is based on the following:
1 _ 1 RT (2)— -f-
Kt kiL HikiG
Where:
It. = liquid-phase mass transfer coefficient, cm/s
R - ideal gas constant, 8.2 x 10⁻⁵atm-m3/rnole-°KT = absolute temperature, °KH. = Henry's Law constant of component I, atm-m3/mole
k.G = gas-phase mass transfer coefficient, cm/s
18925<21)APPLATTH-1 H-1-2 CoNESTOGA-RovERS & ASSOCIATES
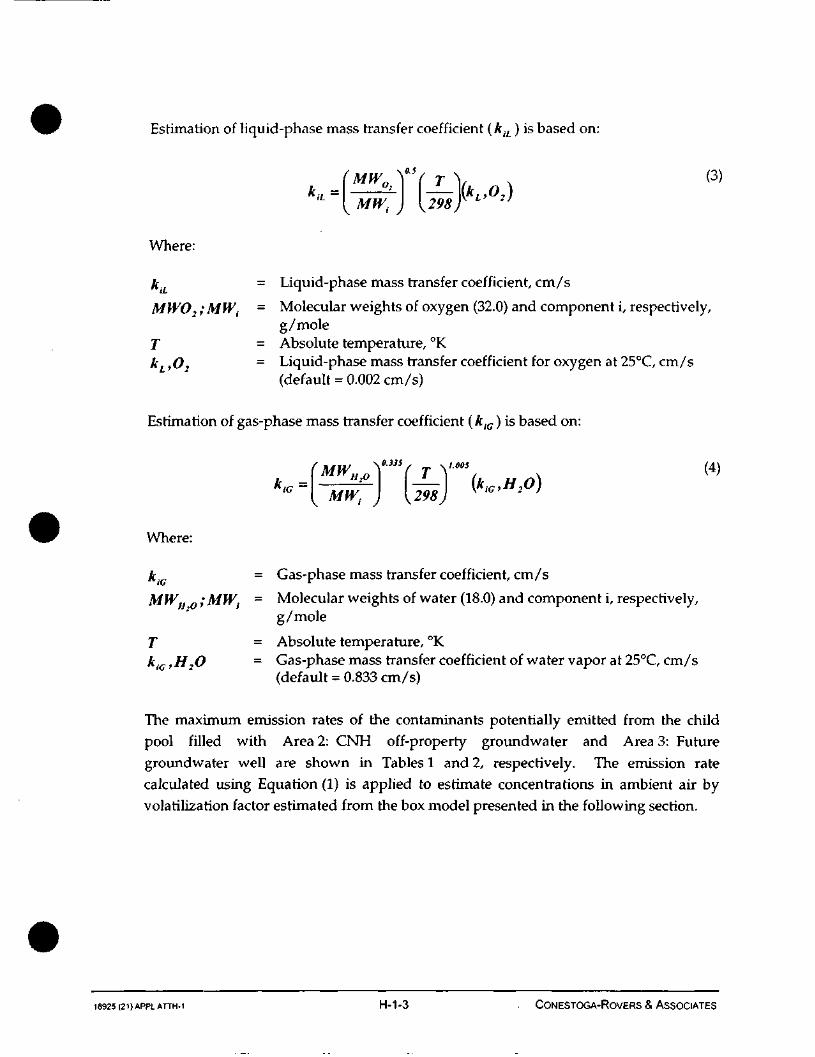
Estimation of liquid-phase mass transfer coefficient (k iL ) is based on:
[. M,,, \O.S , ~ /o\MW0 \ ( T V x W
2 I I 11 / f\ \
MWt ) (298 f L' 2'
Where:
k. = Liquid-phase mass transfer coefficient, cm/s
MWO2 ;MWt = Molecular weights of oxygen (32.0) and component i, respectively,g/mole
T = Absolute temperature, °KkL,O2 = Liquid-phase mass transfer coefficient for oxygen at 25°C, cm/s
(default = 0.002 cm/s)
Estimation of gas-phase mass transfer coefficient (k i c) is based on:
T Y"5/. „ _x <4>^ MW, ) {298}
Where:
k.c = Gas-phase mass transfer coefficient, cm/s
MWH 0 ; MW.t - Molecular weights of water (18.0) and component i, respectively,g/mole
T = Absolute temperature, °Kkic ,H2O = Gas-phase mass transfer coefficient of water vapor at 25°C, cm/s
(default = 0.833 cm/s)
The maximum emission rates of the contaminants potentially emitted from the child
pool filled with Area 2: CNH off-property ground water and Area 3: Future
groundwater well are shown in Tables 1 and 2, respectively. The emission rate
calculated using Equation (1) is applied to estimate concentrations in ambient air by
volatilization factor estimated from the box model presented in the following section.
18925 (21) APPLATTH-1 H-1-3 - CONESTOGA-ROVERS & ASSOCIATES
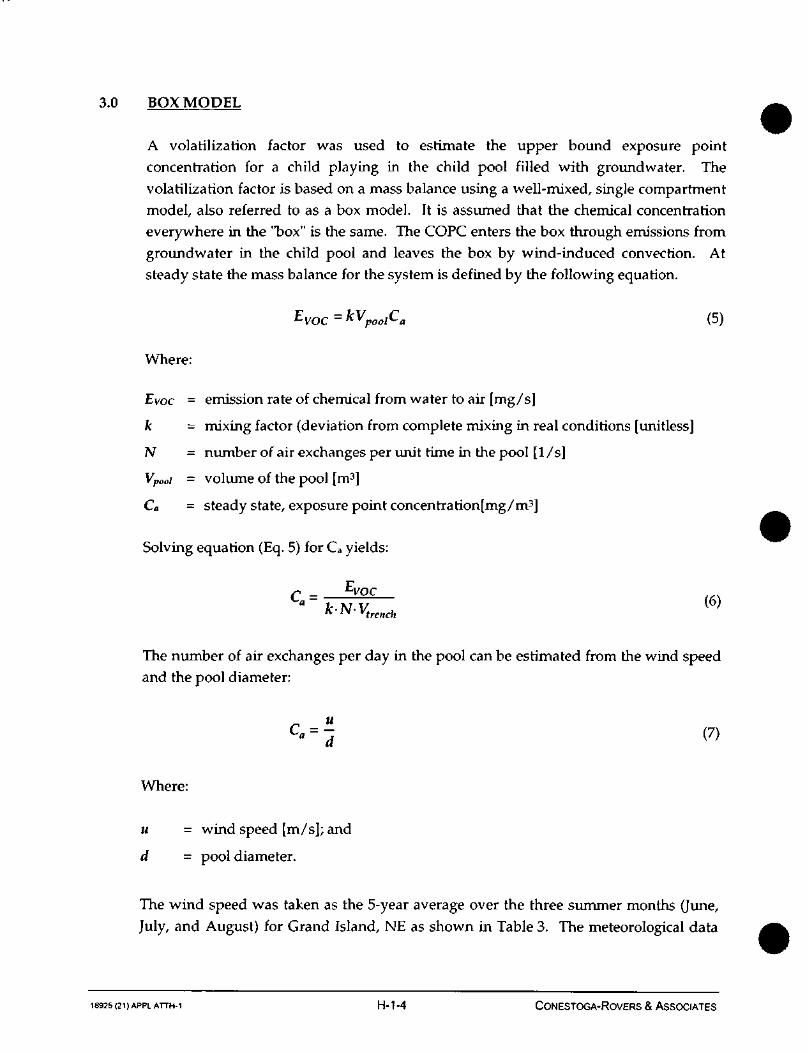
3.0 BOX MODEL
A volatilization factor was used to estimate the upper bound exposure point
concentration for a child playing in the child pool filled with groundwater. The
volatilization factor is based on a mass balance using a well-mixed, single compartment
model, also referred to as a box model. It is assumed that the chemical concentration
everywhere in the "box" is the same. The COPC enters the box through emissions from
groundwater in the child pool and leaves the box by wind-induced convection. At
steady state the mass balance for the system is defined by the following equation.
EVOC = kVpoolCa (5)
Where:
Evoc - emission rate of chemical from water to air [mg/s]
k = mixing factor (deviation from complete mixing in real conditions [unitless]
N - number of air exchanges per unit time in the pool [1/s]
Vpooi = volume of the pool [m3]
Ca = steady state, exposure point concentration[mg/m3]
Solving equation (Eq. 5) for Ca yields:
(6)
The number of air exchanges per day in the pool can be estimated from the wind speed
and the pool diameter:
Where:
H = wind speed [m/s]; and
d - pool diameter.
The wind speed was taken as the 5-year average over the three summer months (June,
July, and August) for Grand Island, NE as shown in Table 3. The meteorological data
18925 (21) APPLATTH-1 H-1-4 CONESTOGA-ROVERS & ASSOCIATES
for the 5 years (2001 to 2005) used to develop the 5-year average is presented inAttachment H-2. A mixing factor of 0.5 was used since mixing is likely to be close tocomplete mixing in the box above the child pool.
Tables 4 and 5 provide a summary of the estimated maximum 1-hour and 8-hourground level concentrations in the pool using the box model. The 1-hour concentrationswere multiplied by time averaging conversion factor of 0.7 to obtain 8-hourconcentrations. The time averaging is recommended in U.S. EPA (1993).
18925 (21 jAPPLATTH-1 H-1-5 CONESTOGA-ROVERS & ASSOCIATES

4.0 REFERENCES
U.S. EPA, 1988. Screening Procedures for Estimating the Air Quality Impact ofStationary Sources, EPA Report No. EPA-450/4-88-010, August.
U.S. EPA, 1989. Air/Superfund National Technical Guidance Study Series, Estimationof Baseline Air Emissions at Superfund Sites, EPA-450/1-89-002, January.
U.S. EPA, 1993. Air/Superfund National Technical Guidance Study Series, Models forEstimating Air Emission Rates from Superfund Remedial Actions, Section 5.2, EPAReport No. EPA-451/R-93-001, March.
18925 (21) APPLATTH-1 H-1-6 CONESTOGA-ROVERS & ASSOCIATES
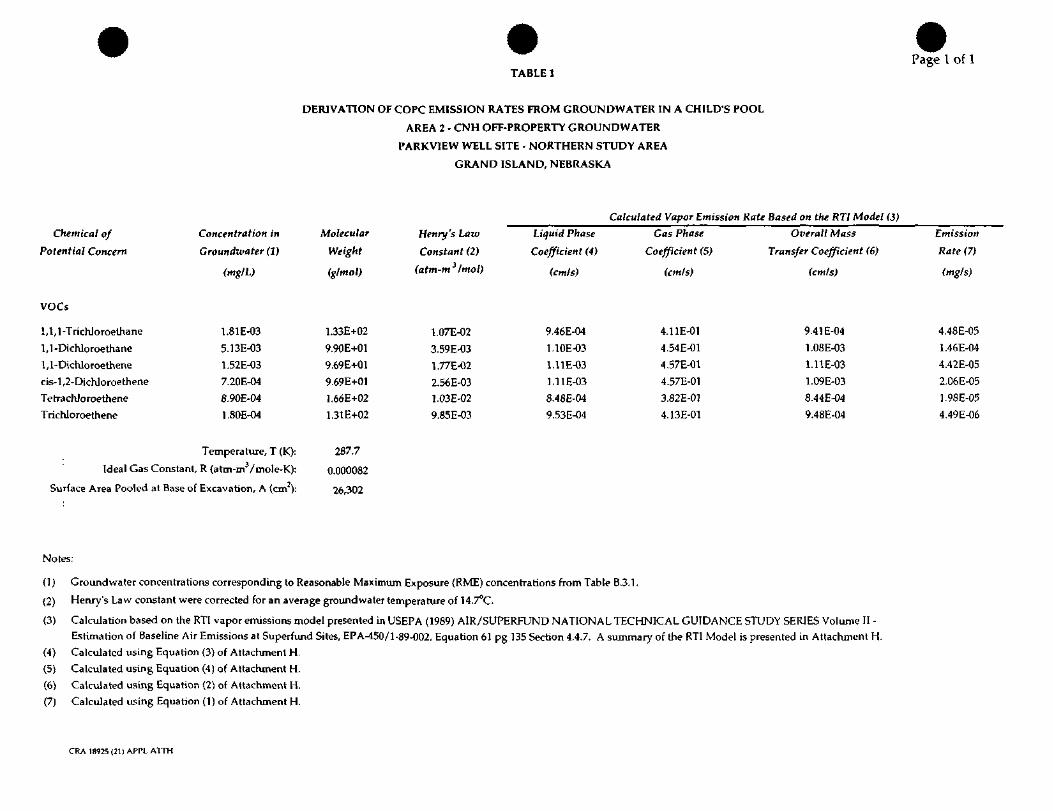
TABLE 1Page 1 of 1
DERIVATION OF COPC EMISSION RATES FROM GROUNDWATER IN A CHILD'S POOL
AREA 2 - CNH OFF-PROPERTY GROUNDWATER
PARKVIEW WELL SITE - NORTHERN STUDY AREA
GRAND ISLAND, NEBRASKA
Chemical of
Potential Concern
Calculated Vapor Emission Rate Based on the RTI Model (3)
Concentration in
Groundwater (1)
(mg/L)
Molecular
Weight
(g/mol)
Henry's Law
Constant (2)
(atm-m3 Imol)
Liquid Phase
Coefficient (4)
(cm/s)
Cas Phase
Coefficient (5)
(cm/s)
Overall Mass
Transfer Coefficient (6)
(cm/s)
Emission
Rate (7)
(mg/s)
VOCs
1,1,1-Trichloroethane
1,1-Dichloroe thane
1,1-DicKloroelhenecis-l,2-Dichloroethene
Tetrachloroethene
Trichloroethene
1.81E-03
5.13E-03
1.52E-03
7.20E-04
8.90E-04
1.80E-04
1.33E+02
9.90E+01
9.69E+01
9.69E+01
1.66E+02
1.31E+02
1.07E-02
3.59E-03
1.77E-02
2.56E-031.03E-02
9.85E-03
9.46E-04
1.10E-03
1.11E-03
1.11E-03
8.48E-04
9.53E-04
4.11E-01
4.54E-01
4.57E-01
4.57E-01
3.82E-01
4.13E-01
9.41E-04
1.08E-03
1.11E-03
1.09E-03
8.44E-04
9.48E-04
4.48E-05
1.46E-04
4.42E-05
2.06E-05
1.98E-05
4.49E-06
Temperature, T (K): 287.7
Ideal Gas Constant, R (atm-m'/mole-K): 0.000082
Surface Area Pooled at Base of Excavation, A (cm2)-. 26,302
Notes:
(1)
(2)
(3)
(4)
(5)
(6)(7)
Groundwater concentrations corresponding to Reasonable Maximum Exposure (RME) concentrations from Table B.3.1.
Henry's Law constant were corrected for an average groundwater temperature of 14.7°C.
Calculation based on the RTI vapor emissions model presented in USEPA (1989) AIR/SUPERFUND NATIONAL TECHNICAL GUIDANCE STUDY SERIES Volume II -Estimation of Baseline Air Emissions at Superfund Sites, EPA-450/1-89-002, Equation 61 pg 135 Section 4.4.7. A summary of the RTI Model is presented in Attachment H.Calculated using Equation (3) of Attachment H.
Calculated using Equation (4) of Attachment H.
Calculated using Equation (2) of Attachment H.
Calculated using Equation (1) of Attachment H.
CRA 18925 (21) APPL A1TH
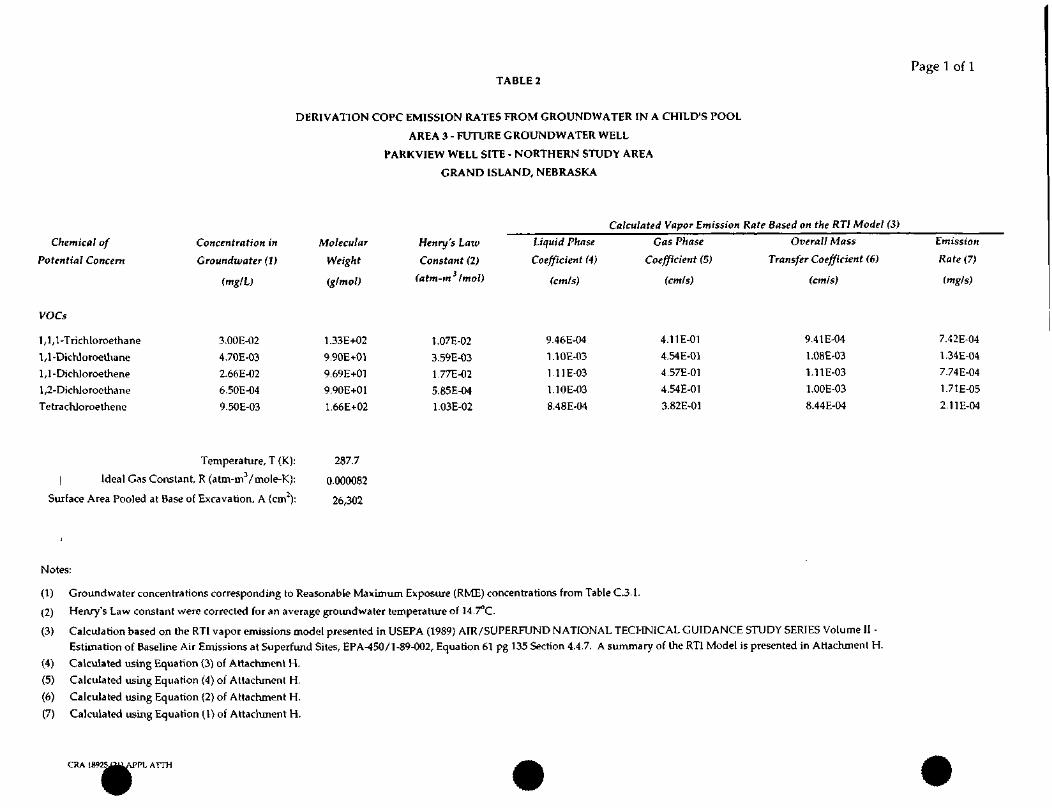
TABLE 2Page 1 of 1
DERIVATION COPC EMISSION RATES FROM GROUNDWATER IN A CHILD'S POOL
AREA 3 - FUTURE GROUNDWATER WELL
PARKVIEW WELL SITE - NORTHERN STUDY AREA
GRAND ISLAND, NEBRASKA
Chemical of
Potential Concern
Calculated Vapor Emission Rate Based on the RTI Model (3)
Concentration in
Croundwater (1)
(mg/L)
Molecular
Weight
(g/mol)
Henry's Law
Constant (2)
(atm-m Imol)
Liquid Phase
Coefficient (4)
(ctn/s)
Gas Phase
Coefficient (5)
(cm/s)
Overall Mass
Transfer Coefficient (6)
(cm/s)
Emission
Rate (7)
<mgls)
VOCs
1,1,1-Trichloroe thane
1,1-Dichloroelhane
1,1-DichJoroethene
1,2-DichJorocthane
Tetrachloroethenc
3.00E-02
4.70E-03
2.66E-02
6.50E-04
9.50E-03
1.33E+02
9.90E+01
9.69E+01
9.90E+01
1.66E+02
1.07E-02
3.59E-03
1.77E-02
5.85E-04
1.03E-02
9.46E-04
1.10E-03
1.11E-03
1.10E-03
8.48E-04
4.11E-01
4.54E-01
4.57E-01
4.54E-01
3.82E-01
9.41E-04
1.08E-03
1.11E-03
l.OOE-03
8.44E-04
7.42E-04
1.34E-04
7.74E-04
1.71E-05
2.11E-04
Temperature, T (K): 287.7
I Ideal Gas Constant, R (arm-m3/mole-K): 0.000082
Surface Area Pooled at Base of Excavation, A (cm2): 26,302
Notes:
(1) Groundwater concentrations corresponding to Reasonable Maximum Exposure (RME) concentrations from Table C.3.1.
(2) Henry's Law constant were corrected for an average groundwater temperature of 14.7°C.
(3) Calculation based on the RTI vapor emissions model presented in USEPA (1989) AIR/SUPERFUND NATIONAL TECHNICAL GUIDANCE STUDY SERIES Volume II -
Estimation of Baseline Air Emissions at Superfund Sites, EPA-450/1-89-002, Equation 61 pg 135 Section 4.4.7. A summary of the RTI Model is presented in Attachment H.
(4) Calculated using Equation (3) of Attachment H.
(5) Calculated using Equation (4) of Attachment H.
(6) Calculated using Equation (2) of Attachment H.
(7) Calculated using Equation (1) of Attachment H.
CRA 189:'IS^^ATl PLATTH

Page! of!
TABLE 3
AVERAGE WIND SPEEDS FOR CHILD POOL AND TRENCH SCENARIOS
PARKVIEW WELL SITE - NORTHERN STUDY AREA
GRAND ISLAND, NEBRASKA
Average Wind Speed for Child Pool Scenario
Mean Wind Speed (mph) (1)2001 2002 2003 2004 2005
JuneJuly
August
1210.18.9
13.911.110.7
9.99.78.4
10.28.49.2
11.410.68.2
5-year average for 3 summer months (June, July, & August) 10.18 mph 4.55 m/s
Average Wind Speed for Construction Worker Trench Scenario
Annual Mean WindSpeed (mph) (1)
2001 11.42002 11.92003 11.12004 11.12005 11.3
5-year average 11.36 mph 5.08 m/s
Note:
(1) Taken from Meteorological Data for 2001, 2002, 2003, 2004, & 2005 for Grand Island, NE (GRI)published by NCDC Asheville, NC presented in Attachment H-2.
CRA 18925 (21) APPL ATTH
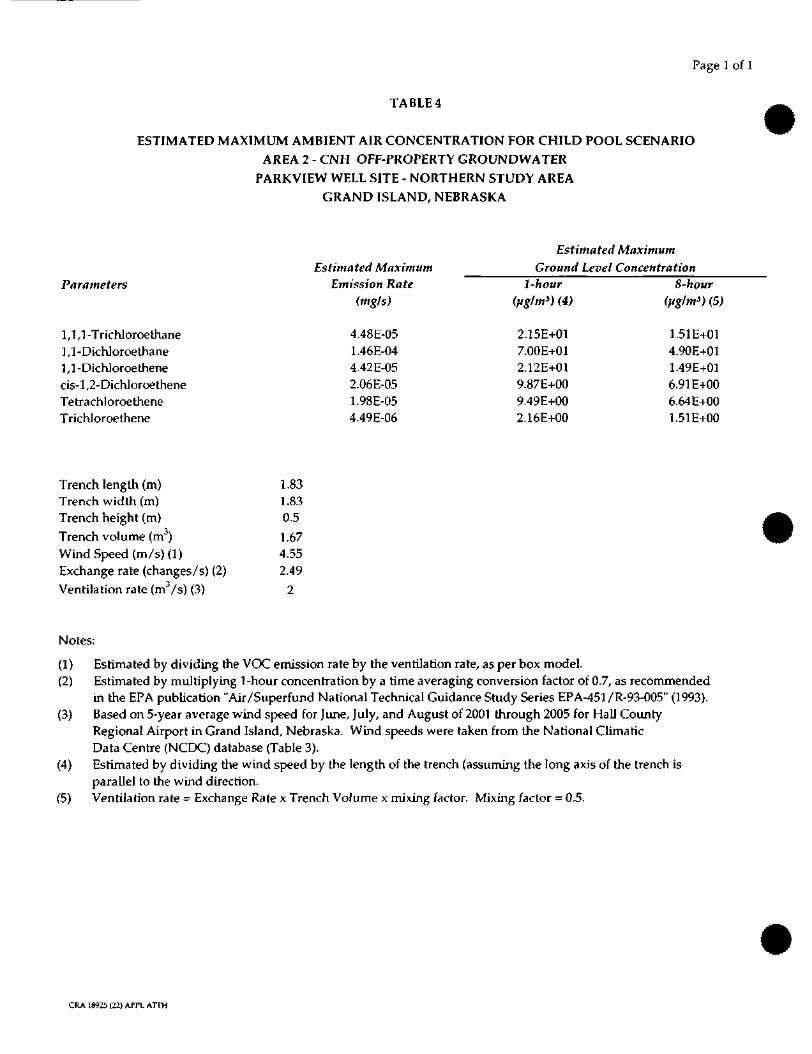
Page 1 of 1
TABLE 4
ESTIMATED MAXIMUM AMBIENT AIR CONCENTRATION FOR CHILD POOL SCENARIOAREA 2 - CNH OFF-PROPERTY GROUNDWATER
PARKVIEW WELL SITE - NORTHERN STUDY AREAGRAND ISLAND, NEBRASKA
Parameters
1,1,1 -TrichJoroe thane1,1-Dichloroethane1,1-Dichloroethenecis-l,2-DichloroetheneTetrachloroetheneTrichloroethene
Estimated MaximumEmission Rate
(mg/s)
4.48E-051.46E-044.42E-052.06E-051.98E-054.49E-06
Estimated MaximumGround Level Concentration
1-hour(ug/m3) (4)
2.15E+017.00E+012.12E+019.87E+009.49E+002.16E+00
8-hour(ug/m3) (5)
1.51E+014.90E+011.49E+016.91E+006.64E+001.51E+00
Trench length (m) 1.83Trench width (m) 1.83Trench height (m) 0.5Trench volume (m3) 1.67Wind Speed (m/s) (1) 4.55Exchange rate (changes/s) (2) 2.49Ventilation rate (m3/s) (3) 2
Notes:
(1) Estimated by dividing the VOC emission rate by the ventilation rate, as per box model.(2) Estimated by multiplying 1-hour concentration by a time averaging conversion factor of 0.7, as recommended
in the EPA publication "Air/Superfund National Technical Guidance Study Series EPA-451/R-93-005" (1993).(3) Based on 5-year average wind speed for June, July, and August of 2001 through 2005 for Hall County
Regional Airport in Grand Island, Nebraska. Wind speeds were taken from the National ClimaticData Centre (NCDC) database (Table 3).
(4) Estimated by dividing the wind speed by the length of the trench (assuming the long axis of the trench isparallel to the wind direction.
(5) Ventilation rate = Exchange Rate x Trench Volume x mixing factor. Mixing factor = 0.5.
CRA 18925 (22) APPL ATTH
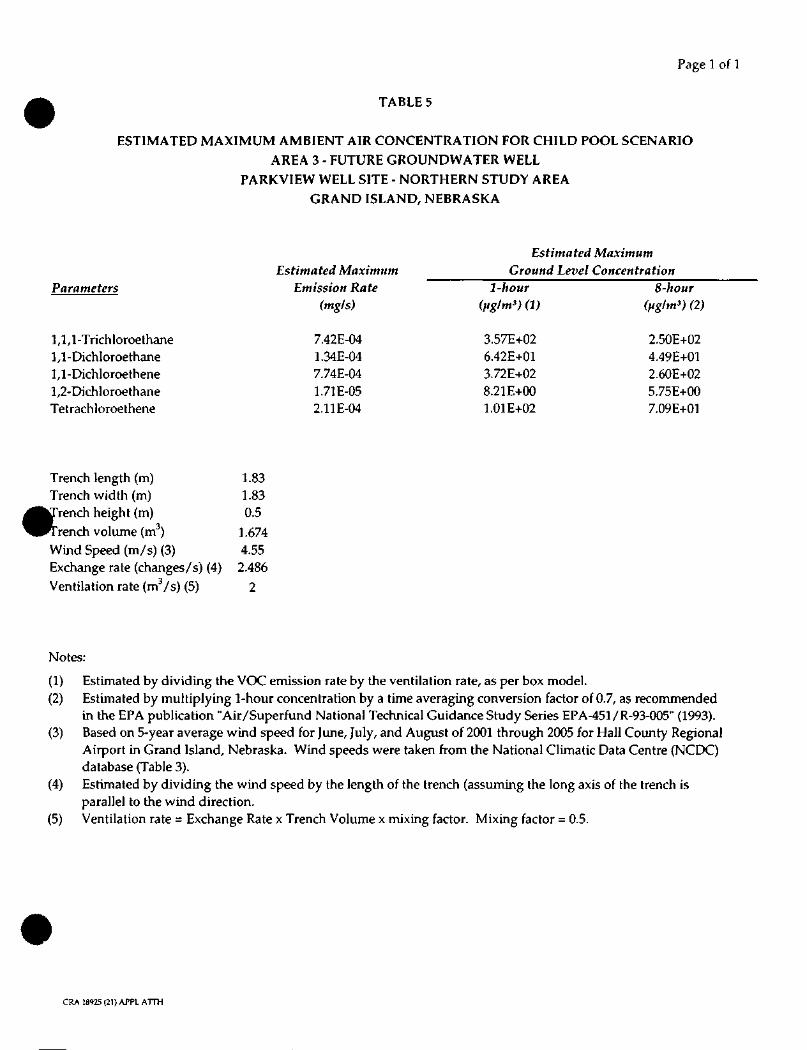
Page 1 of 1
TABLES
ESTIMATED MAXIMUM AMBIENT AIR CONCENTRATION FOR CHILD POOL SCENARIO
AREA 3 - FUTURE GROUNDWATER WELL
PARKVIEW WELL SITE - NORTHERN STUDY AREA
GRAND ISLAND, NEBRASKA
Parameters
1,1,1-Trichloroethane1,1-DichIoroethane1,1-Dichloroethene1,2-DichloroethaneTetrachloroethene
Estimated MaximumEmission Rate
(mg/s)
7.42E-041.34E-047.74E-041.71E-052.11E-04
Estimated MaximumGround Level Concentration
1-hour(ftg/m3) (1)
3.57E+026.42E+013.72E+028.21E+001.01E+02
8-hour(uglm*) (2)
2.50E+024.49E+012.60E+025.75E+007.09E+01
Trench length (m) 1.83Trench width (m) 1.83'rench height (m) 0.5
rench volume (m3) 1.674Wind Speed (m/s) (3) 4.55Exchange rate (changes/s) (4) 2.486
Ventilation rate (m3/s) (5) 2
Notes:
(1) Estimated by dividing the VOC emission rate by the ventilation rate, as per box model.(2) Estimated by multiplying 1-hour concentration by a time averaging conversion factor of 0.7, as recommended
in the EPA publication "Air/Superfund National Technical Guidance Study Series EPA-451/R-93-005" (1993).(3) Based on 5-year average wind speed for June, July, and August of 2001 through 2005 for Hall County Regional
Airport in Grand Island, Nebraska. Wind speeds were taken from the National Climatic Data Centre (NCDC)database (Table 3).
(4) Estimated by dividing the wind speed by the length of the trench (assuming the long axis of the trench isparallel to the wind direction.
(5) Ventilation rate = Exchange Rate x Trench Volume x mixing factor. Mixing factor = 0.5.
CRA 18925 (21) APPL ATTH
ATTACHMENT H-2
METEOROLOGICAL DATA FROM 2001 TO 2005 FOR GRAND ISLAND AIRPORT
18925(21) APPL ATTH-1
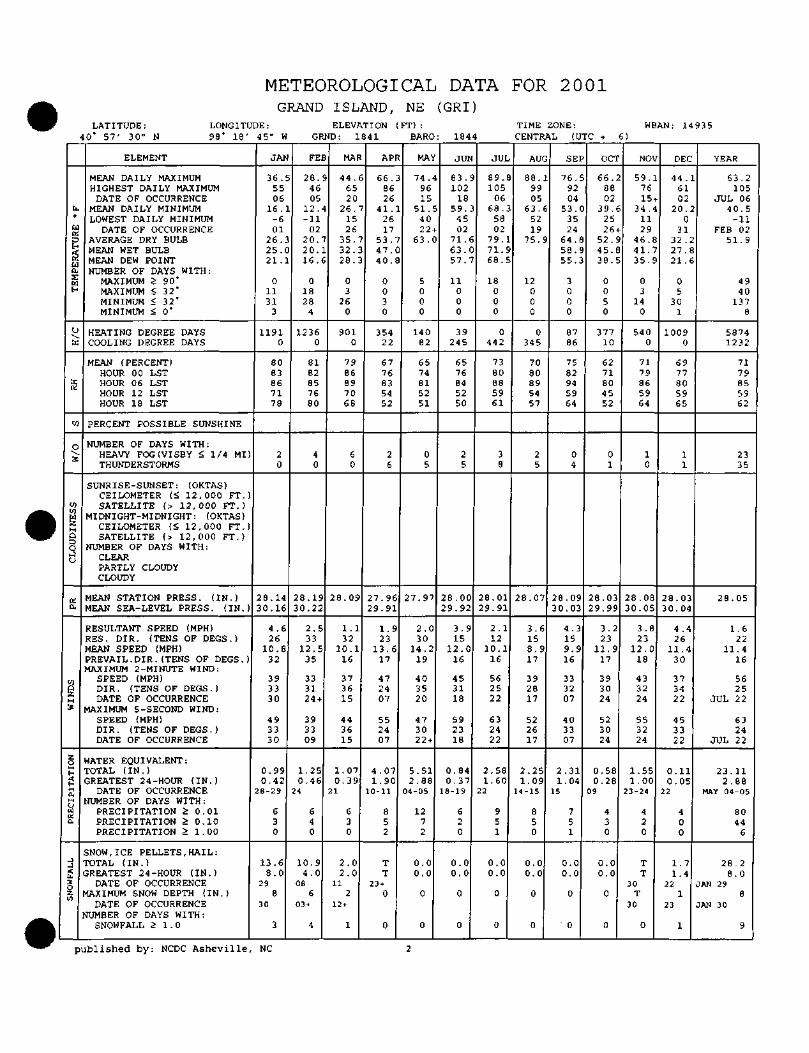
METEOROLOGICAL DATA FOR 2001GRAND ISLAND, NE (GRI)
LATITUDE:40' 57' 30" N
LONGITUDE:98° 18' 45" W
ELEVATION (FT):GRND: 1841 BARO: 1844
TIME ZONE:CENTRAL (UTC + 6)
WBAN: 14935
b.0
Idatt-*<KUa.s[rH
U
K
5
CO
O;j
COU)
hHgod
K0.
<fla2;M3
ZOhgt-(0,
yi
jj<X
fl
ELEMENT
MEAN DAILY MAXIMUMHIGHEST DAILY MAXIMUMDATE OF OCCURRENCE
MEAN DAILY MINIMUMLOWEST DAILY MINIMUMDATE OF OCCURRENCE
AVERAGE DRY BULBMEAN WET BULBMEAN DEW POINTNUMBER OF DAYS WITH:MAXIMUM > 90'MAXIMUM < 32'MINIMUM < 32'MINIMUM < 0"
HEATING DEGREE DAYSCOOLING DEGREE DAYS
MEAN (PERCENT)HOUR 00 LSTHOUR 06 LSTHOUR 12 LSTHOUR 18 LST
PERCENT POSSIBLE SUNSHINE
NUMBER OF DAYS WITH:HEAVY FOG1VISBY < 1/4 MITHUNDERSTORMS
SUNRISE-SUNSET: (OKTAS)CEILOMETER (< 12,000 FT.SATELLITE (> 12,000 FT.)
MIDNIGHT-MIDNIGHT: (OKTAS)CEILOMETER (< 12,000 FT.)SATELLITE (> 12,000 FT.)
NUMBER OF DAYS WITH:CLEARPARTLY CLOUDYCLOUDY
MEAN STATION PRESS. (IN.)MEAN SEA-LEVEL PRESS. (IN.)
RESULTANT SPEED (MPH)RES. DIR. (TENS OF DECS.)MEAN SPEED (MPH)PREVAIL. DIR. (TENS OF DECS.)MAXIMUM 2-MINUTE WIND:SPEED (MPH)DIR. (TENS OF DECS. )DATE OF OCCURRENCE
MAXIMUM 5-SECOND WIND:SPEED (MPH)DIR. (TENS OF DECS. )DATE OF OCCURRENCE
WATER EQUIVALENT:TOTAL (IN.)GREATEST 24 -HOUR (IN.)
DATE OF OCCURRENCENUMBER OF DAYS WITH:
PRECIPITATION > 0.01PRECIPITATION > 0.10PRECIPITATION > 1 . 00
SNOW, ICE PELLETS, HAIL:TOTAL (IN.)GREATEST 24-HOUR (IN.)DATE OF OCCURRENCE
MAXIMUM SNOW DEPTH (IN.)DATE OF OCCURRENCE
NUMBER OF DAYS WITH:SNOWFALL > 1 . 0
JAN
36.5506
16 .-601
26.25.21 .
011313
11910
8083867178
20
28.1430.16
4 .62610.832
393330
493330
0.990.42
28-29
630
13.68.0
298
30
3
FE
28.4605
12.-1102
20.20.16.
018284
12360
8182857680
40
28.1930.22
2. 533
12.535
333124 +
393309
1 .250.46
24
640
10.94.0
086
03->
4
MAR
44 .6520
26.152635.32.28.
03
260
9010
7986897068
60
28.09
1.132
10.116
373615
443615
1. 070.39
21
630
2.02.0
112
12+
1
AP
66 .8626
41.2617
53.47.40.
0030
35422
6776835452
26
27. 9629.91
1. 92313.617
472407
552407
4 .071.90
10-11
852
TT
23 +0
0
MAY
74 .9615
51 .4022
63.
5000
14082
6574815251
05
27.97
2.03014.219
403520
473022 +
5.512.88
04-05
1272
0.00.0
0
0
JUN
83.10218
59.4502
71.63.57.
11000
39245
6576845250
25
28.0029.92
3.915
12.016
453118
592318
0.840 .37
18-19
620
0.00.0
0
0
JUL
89.1050668.580279.71.68.
18000
0442
7380885961
38
28.0129. 91
2.112
10.116
562522
632422
2.581.60
22
951
0.00.0
0
0
AUG
88.9905
63.5219
75.
12000
0345
7080895457
25
28.07
3.6158.917
392817
522617
2.251.09
14-15
850
0.00.0
0
0
SE
76.9204
53.352464.58.55.
3000
8786
7582945964
04
28.0930.03
4 . 3159.916
333207
403307
2.311.04
15
751
0.00.0
0
0
OCT
66.8802
39.252652.45.38.
0050
37710
6271804552
01
28.0329.99
3.22311.917
393024
523024
0.580.28
09
430
0.00.0
0
0
NOV
59.7615
34.1129
46.41.35.
03
140
5400
7179865964
10
28.0830.05
3 .82312.018
433224
553224
1.551 .00
23-24
420
TT
30T
30
0
DEC
44 .6102
20.0
3132 .27.21.
05
301
10090
6977805965
11
28.0330.04
4 .42611.430
373422
453322
0.110.05
22
400
1.71.4
221
23
1
YEAR
63.2105
JUL 0640.5-11
FEE 0251. 9
49401378
58741232
7179855962
2335
28.05
1.622
11.416
5625
JUL 22
6324
JUL 22
23.112.88
MAY 04-05
80446
28.28.0
JAN 298
JAN 30
9
published by: NCDC Asheville, NC
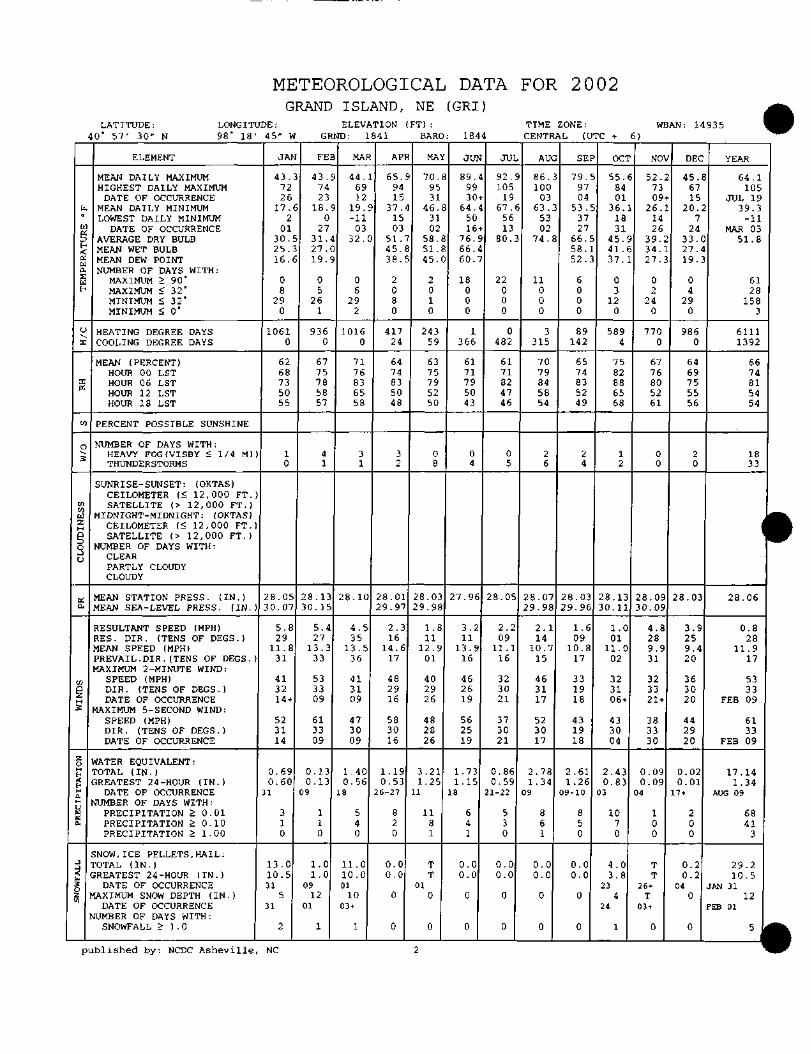
METEOROLOGICAL DATA FOR 2002GRAND ISLAND, NE ( G R I )
LATITUDE:40' 57' 30" N
LONGITUDE:98' 18' 45' W
ELEVATION (FT):GRND: 1841 BARO: 1844
TIME ZONE:CENTRAL (UTC +
WBAN: 149356)
a.0
Cdp£
Hffdaa,suH
U
I
3:K
W
o3
enU)u2H
g
3CJ
a:QJ
w
M3
zoMH
g1.
J
ij
X
JJ
<£3
/]
ELEMENT
MEAN DAILY MAXIMUMHIGHEST DAILY MAXIMUMDATE OF OCCURRENCE
MEAN DAILY MINIMUMLOWEST DAILY MINIMUMDATE OF OCCURRENCE
AVERAGE DRY BULBMEAN WET BULBMEAN DEW POINTNUMBER OF DAYS WITH:MAXIMUM > 90'MAXIMUM < 32'MINIMUM < 32'MINIMUM < 0'
HEATING DEGREE DAYSCOOLING DEGREE DAYS
MEAN (PERCENT)HOUR 00 LSTHOUR 06 LSTHOUR 12 LSTHOUR 18 LST
PERCENT POSSIBLE SUNSHINE
NUMBER OF DAYS WITH:HEAVY FOG(VISBY < 1/4 MITHUNDERSTORMS
SUNRISE-SUNSET: (OKTAS)CEILOMETER (< 12,000 FT.SATELLITE (> 12,000 FT.)
MIDNIGHT-MIDNIGHT: (OKTAS)CEILOMETER (< 12,000 FT.SATELLITE (> 12,000 FT.)
NUMBER OF DAYS WITH:CLEARPARTLY CLOUDYCLOUDY
MEAN STATION PRESS. (IN.)MEAN SEA-LEVEL PRESS. (IN.)
RESULTANT SPEED (MPH)RES. DIR. (TENS OF DECS.)MEAN SPEED (MPH)PREVAIL. DIR. (TENS OF DECS.)MAXIMUM 2 -MINUTE WIND:SPEED (MPH)DIR. (TENS OF DECS. )DATE OF OCCURRENCE
MAXIMUM 5-SECOND WIND:SPEED (MPH)DIR. (TENS OF DECS. )DATE OF OCCURRENCE
WATER EQUIVALENT:TOTAL (IN.)GREATEST 2 4 -HOUR (IN.)
DATE OF OCCURRENCENUMBER OF DAYS WITH:
PRECIPITATION > 0.01PRECIPITATION > 0.10PRECIPITATION > 1.00
NOW, ICE PELLETS, HAIL:TOTAL (IN.)REATEST 24-HOUR (IN.)DATE OF OCCURRENCE
MAXIMUM SNOW DEPTH (IN.)DATE OF OCCURRENCE
NUMBER OF DAYS WITH:SNOWFALL > 1 . 0
JAN
43.722617.2
0130.25.16.
08
290
10610
6268735055
10
28.0530.07
5.82911.831
413214 +
523114
0.690.601
310
13.010.531
531
2
FE
43.7423
18.0
2731.27.19.
05
261
9360
6775785857
41
28.1330.15
5.42713.333
533309
613309
0.130.13
09
110
1.01.0
0912
01
1
MA
44 .6912
19.-1103
32.
06
292
10160
7176836558
31
28. 10
4 .53513.536
413109
473009
1.400.56
18
540
11.010.00110
03 +
1
AP
65.9415
37.1503
51 .45.38.
2080
41724
6474835048
32
28.0129.97
2.316
14 .617
482916
583016
1.190.53
26-27
820
0.00.0
0
0
MA
70.9531
46.3102
58.51.45.
2010
24359
6375795250
08
28.0329.98
1 .811
12.901
402926
482826
3.211.25
11
1181
TT
010
0
JUN
89.993064.5016
76.66.60.
18000
1366
6171795043
04
27.96
3.211
13.916
462619
562519
1.731.15
18
641
0.00.0
0
0
JU
92.1051967.5613
80.
22000
0482
6171824746
05
28.05
2.209
11 .116
323021
373021
0.860.59
21-22
530
0.00.0
0
0
AU
86.1000363.5302
74.
11000
3315
7079845854
26
28.0729.98
2.114
10.715
463117
523017
2.781 .34
09
861
0.00.0
0
0
SE
79.9704
53.372766.58.52.
6000
89142
6574835249
24
28.0329.96
1.609
10.817
331918
431918
2.611.26
09-10
850
0.00.0
0
0
OCT
55.8401
36.1831
45.41 .37.
03
120
5894
7582886568
12
28.1330.11
1.00111.002
323106 +
433004
2.430.83
03
1070
4.03.8
234
24
1
NO
52.7309
26.1426
39.34.27.
02
240
7700
6776805261
00
28.0930.09
4.8289.931
323321 +
383330
0.090.09
04
100
TT
26 +
T03 +
0
DEC
45.6715
20.7
2433.27.19.
04290
9860
6469755556
20
28.03
3.9259.420
363020
442920
0.020.017 +
200
0.20.2
040
0
YEAR
64.1105
JUL 1939.3-11
MAR 0351.8
6128158
3
61111392
6674815454
1833
i||1
28.06
0.828
11.917
5333
FEE 09
6133
FEB 09
17.141.34
AUG 09
68413
29.210.5
JAN 3112
FEB 01
^
published by: NCDC Asheville, NC
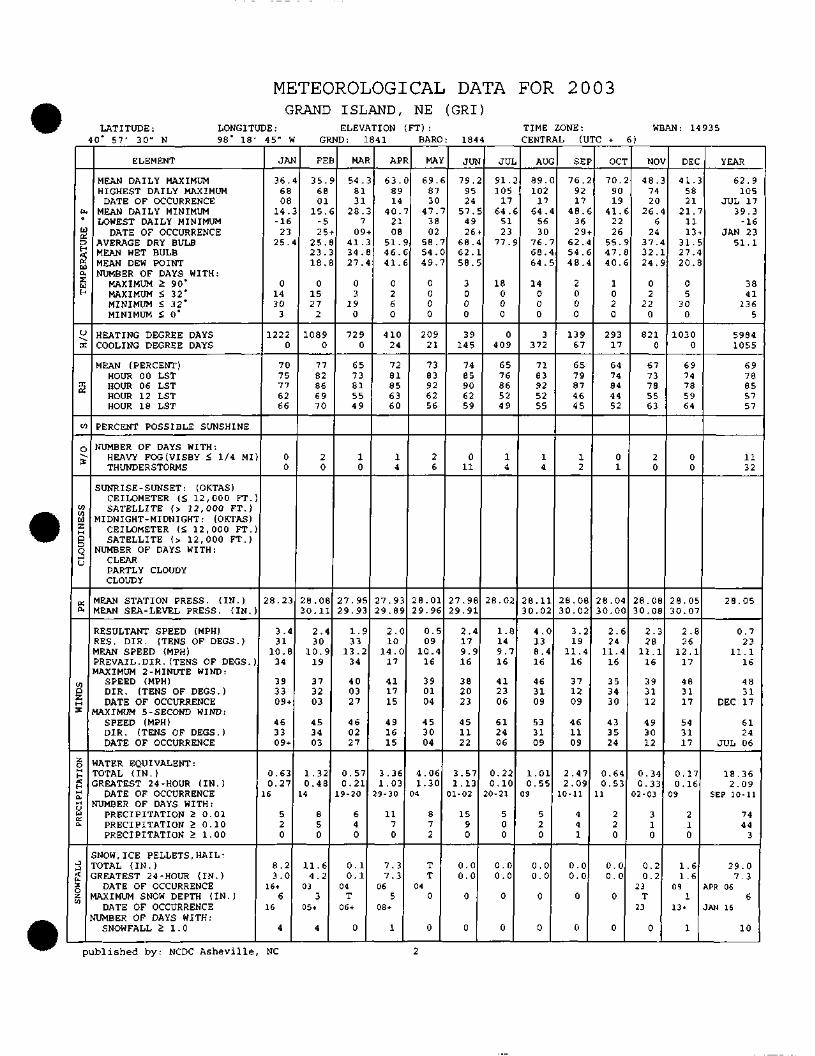
METEOROLOGICAL DATA FOR 2003GRAND ISLAND, NE (GRI)
LATITUDE:40' 57' 30" N
LONGITUDE:98' 18' 45" W
ELEVATION (FT):GRND: 1841 BARO: 1844
TIME ZONE:CENTRAL (UTC
WBAN: 149356)
b.0
wQ
fri«Ucxz.[1E-
CJ
I
I
CO
O3
10COIdZM
3k_ju
Ka
toa2M3
zO
H<
1.
JWi:Q,
JJ<
J3
o
ELEMENT
MEAN DAILY MAXIMUMHIGHEST DAILY MAXIMUM
DATE OF OCCURRENCEMEAN DAILY MINIMUMLOWEST DAILY MINIMUM
DATE OF OCCURRENCEAVERAGE DRY BULBMEAN WET BULBMEAN DEW POINTNUMBER OF DAYS WITH:
MAXIMUM > 90'MAXIMUM £ 32'MINIMUM < 32'MINIMUM < 0'
HEATING DEGREE DAYSCOOLING DEGREE DAYS
MEAN (PERCENT)HOUR 00 LETHOUR 06 LSTHOUR 12 LSTHOUR 18 LST
PERCENT POSSIBLE SUNSHINE
NUMBER OF DAYS WITH:HEAVY FOG1VISBY < 1/4 MITHUNDERSTORMS
SUNRISE-SUNSET: (OKTAS)CEILOMETER (S 12,000 FT.SATELLITE (> 12,000 FT.)
MIDNIGHT-MIDNIGHT: (OKTAS)CEILOMETER (<, 12,000 FT.)SATELLITE (> 12 ,000 FT. )
NUMBER OF DAYS WITH:CLEARPARTLY CLOUDYCLOUDY
MEAN STATION PRESS. ( I N . )MEAN SEA-LEVEL PRESS. ( I N . )
RESULTANT SPEED (MPH)RES. DIR. (TENS OF DECS.)MEAN SPEED (MPH)PREVAIL. D I R . (TENS OF DECS.)MAXIMUM 2 -MINUTE WIND:
SPEED (MPH)DIR. (TENS OF DECS.)DATE OF OCCURRENCE
MAXIMUM 5-SECOND WIND:SPEED (MPH)DIR. (TENS OF DECS. )DATE OF OCCURRENCE
WATER EQUIVALENT:TOTAL ( IN . )GREATEST 24-HOUR ( I N . )
DATE OF OCCURRENCENUMBER OF DAYS WITH:
PRECIPITATION > 0.01PRECIPITATION > 0.10PRECIPITATION > 1.00
SNOW, ICE PELLETS, HAIL:TOTAL ( I N . )GREATEST 24 -HOUR ( I N . )
DATE OF OCCURRENCEMAXIMUM SNOW DEPTH ( I N . )
DATE OF OCCURRENCENUMBER OF DAYS WITH:
SNOWFALL > 1 . 0
JAN
36.6808
14 .-16
2325.
01430
3
12220
7075776266
00
2 8 . 2 3
3 .431
10.834
393309 +
463309 +
0 .630 . 2 76
520
8 . 23 .0
16 +6
16
4
FE
35.6801
15._ C
2525.23.18.
01527
2
10890
7782866970
20
2 8 . 0 830.11
2 . 430
10.919
373203
453403
1.320 . 4 84
850
11.64 .2
033
05 +
4
MA
54.8131
28.7
0941.34 .27 .
03
190
7290
6573815549
10
2 7 . 9 52 9 . 9 3
1.933
13 .234
400327
460227
0.570 .219-20
640
0.10.1
04T
06 +
0
AP
63.8914
4 0 .2108
51.4 6 .41.
0260
41024
7281856360
14
2 7 . 9 32 9 . 8 9
2 . 010
14.017
411715
491615
3 .361.03
29-30
1170
7 .37 .3
065
08 +
1
MA
69 .8730
4 7 .3802
58.54.4 9 .
0000
20921
7383926256
26
28 .012 9 . 9 6
0 .509
10.416
390104
453004
4 .061.30
04
872
TT
040
0
JUN
79.9524
57.4926
68.6 2 .58.
3000
39145
7485906259
011
27 .9829 .91
2 . 4179 .916
382023
451122
3 .571.13
01-02
1590
0 . 00 . 0
0
0
JUL
91.105
1764.
5123
77.
18000
0409
6576865249
14
2 8 . 0 2
1.8149 .716
412306
612406
0 . 2 20.10
20-21
500
0 . 00 . 0
0
0
AUG
89.102
1764.
5630
76.68.64 .
14000
3372
7183925255
14
28.113 0 . 0 2
4 . 0138 . 416
463109
533109
1.010.55
09
520
0 . 00 . 0
0
0
SE
76.9217
4 8 .3629
62 .54 .48 .
2000
13967
6579874645
12
28.0830 .02
3 . 219
11.416
371209
461109
2 .472 .09
10-11
441
0 .00 . 0
0
0
OCT
70.9019
41.2226
55.47 .4 0 .
1020
29317
6474844452
01
28 .0430 .00
2 . 624
11.416
353430
433524
0 . 6 40 .53
11
220
0 . 00 . 0
0
0
NO
48 .7420
26 .6
2437.32.2 4 .
02
220
8210
6773785563
20
2 8 . 0 830 .08
2 . 328
11.116
393112
493012
0 . 3 40 .33
02-03
310
0 .20 . 2
23T
23
0
DEC
41.5821
21.1113
31.2 7 .2 0 .
05
300
10300
6974785964
00
28 .0530 .07
2 . 826
12.117
483117
543117
0.170.16
09
210
1 .61 .6
091
13 +
1
YEAR
6 2 . 9105
JUL 1739 .3
-16JAN 23
51.1
3841
1365
59841055
6978855757
1132
2 8 . 0 5
0 . 723
11. 116
4831
DEC 17
6124
JUL 06
18.362 . 0 9
SEP 10-11
7444
3
2 9 . 07 . 3
APR 066
JAN 16
10
published by: NCDC Asheville, NC

METEOROLOGICAL DATA FOR 2004GRAND ISLAND, NE (GRI)
LATITUDE:40' 57' 30" N
LONGITUDE:98' 18' 45" W
ELEVATION (FT):GRND: 1841 BARO: 1844
TIME ZONE:CENTRAL (UTC + 6)
WBAN: 14935
u,o
Uc£0:WQ,SUEH
U
==
i5
CO
o
toIS.la•zMQ£3
O
L)
Kcu
wqz.Mx
2O
^<
L
JU£
j_i<
3
n
ELEMENT
MEAN DAILY MAXIMUMHIGHEST DAILY MAXIMUMDATE OF OCCURRENCE
MEAN DAILY MINIMUMLOWEST DAILY MINIMUMDATE OF OCCURRENCE
AVERAGE DRY BULBMEAN WET BULBMEAN DEW POINTNUMBER OF DAYS WITH:
MAXIMUM > 90"MAXIMUM < 32'MINIMUM < 32'MINIMUM < 0°
HEATING DEGREE DAYSCOOLING DEGREE DAYS
MEAN (PERCENT)HOUR 00 LSTHOUR 06 LSTHOUR 12 LSTHOUR IB LST
PERCENT POSSIBLE SUNSHINE
NUMBER OF DAYS WITH:HEAVY FOGtVISBY < 1/4 MITHUNDERSTORMS
SUNRISE-SUNSET: (OKTAS)CEILOMETER (< 12,000 FT.SATELLITE (> 12,000 FT.)
MIDNIGHT-MIDNIGHT: (OKTAS)CEILOMETER (< 12,000 FT.)SATELLITE (> 12,000 FT.)
NUMBER OF DAYS WITH:CLEARPARTLY CLOUDYCLOUDY
MEAN STATION PRESS. (IN.)MEAN SEA- LEVEL PRESS. (IN.)
RESULTANT SPEED (MPH)RES. DIR. (TENS OF DECS.)MEAN SPEED (MPH)PREVAIL. DIR. (TENS OF DECS.)MAXIMUM 2-MINUTE WIND:
SPEED (MPH)DIR. (TENS OF DECS. )DATE OF OCCURRENCE
MAXIMUM 5-SECOND WIND:SPEED (MPH)DIR. (TENS OF DECS. )DATE OF OCCURRENCE
WATER EQUIVALENT:TOTAL (IN.)GREATEST 24-HOUR (IN.)
DATE OF OCCURRENCENUMBER OF DAYS WITH:
PRECIPITATION > 0.01PRECIPITATION > 0.10PRECIPITATION > 1.00
NOW, ICE PELLETS, HAIL:TOTAL (IN.)REATEST 24-HOUR (IN.)DATE OF OCCURRENCE
MAXIMUM SNOW DEPTH (IN.)DATE OF OCCURRENCE
NUMBER OF DAYS WITH:SNOWFALL > 1 . 0
JAN
32.6402
11.-1305
21.19.13.
017318
13280
7276806368
20
28.1330.18
2.43110.434
313226
373126 +
0.600.375
420
11 .44 .0
25*6
26
4
FE
33 .5428
14.-1207
24.22.17.
015246
11820
7780847072
10
28 .1330.16
1.722
11.832
372908
413008
1.720.75
29
440
15.57. 5
0515
06
3
MA
56.7924
32 .2012
44 .38.31.
00
200
6312
6773835950
21
28.1030.09
2.525
12 .816
453610
523610
1.770.76-7
740
3 .42 .0
032
03
1
AP
66.8818
39.2413
52.45.37.
0080
37517
6072794640
02
28.0329.99
0.635
12 .336
413018
492318
1 .040.864
510
TT
120
0
MA
75.9405
51.3314
63.56.51.
3000
12788
7077865856
211
1.814
13 .617
512629
601516
2.230.90
29
1260
0.00.0
0
0
JUN
79.9507
56.4425
68.60.55.
3000
39136
6778875251
16
28.0529.98
1. 808
10.215
442820
552820
1.200.566
530
0.00. 0
0
0
JU
82.9820
62 .532672.
6000
12240
7788916565
312
8.416
483008
603412
4.701.75
01-02
1072
0.00.0
0
0
AU
83.9803
58 .471970.
6000
23200
7081925049
12
28.07
9.217
412316
472316
0.810.38
24
4
20
0.00.0
0
0
SE
82.9713
56 .4624
69.
8000
29169
6372814849
16
28.04
12.416
452814
492814
3 .671.99
22
961
0.00.0
0
0
oc64.8228
42.2816
53.47.42.
0030
3636
7080855860
42
27.99
1.520
10.317
462930
542930
1.080.77
06-07
330
0.00.0
0
0
NO
49.7506
30.3
3040.36.31.
03
180
7420
7579846372
10
28.1730.17
1.92910.735
311809 +
383601
2 .000.718
750
5.35.3
285
29
1
DEC
42.6330
19.-223
31.27.21.
05
302
10450
7178796068
30
28.0830.10
3.92710.624
403212
513220
0.070.05
05
200
TT
232
02-
0
YEAR
62.398
AUG 0339.5-13
JAN 0551.0
264013416
5896858
7078845858
2142
L11
11. 116
5126
MAY 29
6034
JUL 12
20.891.99
SEP 22
72433
35.67.5
EB 0515
EB 06
Jlpublished by: NCDC Asheville, NC
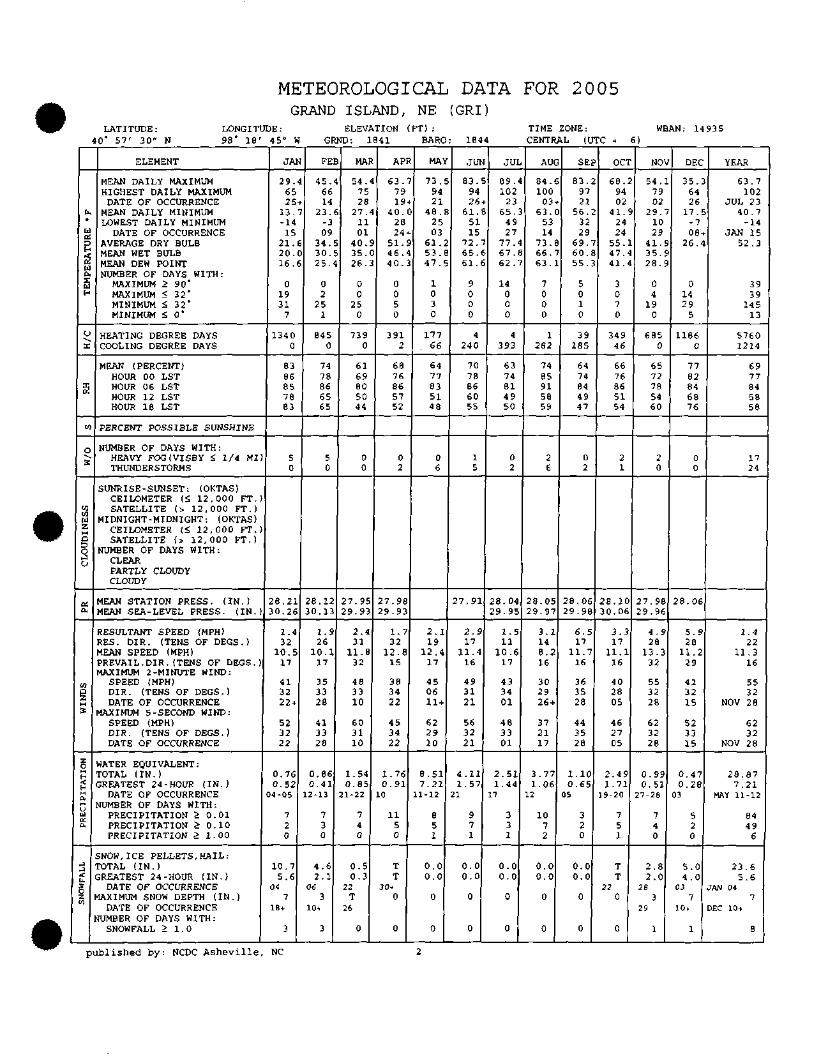
METEOROLOGICAL DATA FOR 2005GRAND ISLAND, NE (GRI)
LATITUDE:40' 57' 30" N
LONGITUDE:98' 18' 45" W
ELEVATION (FT) :GRND: 1841 BARO: 1844
TIME ZONE:CENTRAL (UTC 4
WBAN: 149356)
IXo
U
t-HrfK[iO<ZCLH
U
I
3
U3
O
^
WWuz1— 1
goijU
«a
Waz;M2
§HH<
-Ha_jLdQ;a
J^J<33
ELEMENT
MEAN DAILY MAXIMUMHIGHEST DAILY MAXIMUM
DATE OF OCCURRENCEMEAN DAILY MINIMUMLOWEST DAILY MINIMUM
DATE OF OCCURRENCEAVERAGE DRY BULBMEAN WET BULBMEAN DEW POINTNUMBER OF DAYS WITH:
MAXIMUM > 90'MAXIMUM < 32'MINIMUM < 32'MINIMUM < 0'
HEATING DEGREE DAYSCOOLING DEGREE DAYS
MEAN (PERCENT)HOUR 00 LSTHOUR 06 LSTHOUR 12 LSTHOUR 18 LST
PERCENT POSSIBLE SUNSHINE
NUMBER OF DAYS WITH:HEAVY FOGfVISBY < 1/4 MITHUNDERSTORMS
SUNRISE-SUNSET: (OKTAS)CEILOMETER (< 12,000 FT. )SATELLITE (> 12,000 FT. )
MIDNIGHT-MIDNIGHT: (OKTAS)CEILOMETER (<, 12,000 FT.)SATELLITE (> 12,000 FT.)
NUMBER OF DAYS W I T H :CLEARPARTLY CLOUDYCLOUDY
MEAN STATION PRESS. ( I N . )MEAN SEA- LEVEL PRESS. ( I N . )
RESULTANT SPEED (MPH)RES. D I R . (TENS OF DECS.)MEAN SPEED (MPH)PREVAIL. DIR. (TENS OF DECS.)MAXIMUM 2-MINUTE WIND:
SPEED (MPH)DIR. (TENS OF DECS. )DATE OF OCCURRENCE
MAXIMUM 5 -SECOND WIND:SPEED (MPH)DIR. (TENS OF DECS. )DATE OF OCCURRENCE
WATER EQUIVALENT:TOTAL ( I N . )GREATEST 24-HOUR ( I N . )
DATE OF OCCURRENCENUMBER OF DAYS WITH:
PRECIPITATION > 0.01PRECIPITATION > 0.10PRECIPITATION > 1.00
SNOW, ICE PELLETS, HAIL:TOTAL ( I N . )GREATEST 24 -HOUR ( I N . )
DATE OF OCCURRENCEMAXIMUM SNOW DEPTH ( I N . )
DATE OF OCCURRENCENUMBER OF DAYS W I T H :
SNOWFALL > 1 . 0
JAN
2 9 .6525
13.-1415
21.2 0 .16.
01931
7
13400
8386857883
50
28.213 0 . 2 6
1 .432
10.517
413222 +
523222
0 .760.524-05
720
10.75 .6
047
18+
3
PE
45.6614
23.-309
34 .30.25.
02
251
8450
7478866565
50
28.1230.13
1 126
10.117
353328
413326
0 .860.412-13
730
4 . 62 .1
063
10 +
3
MA
54 .7528
2 7 .1101
4 0 .35.2 6 .
00
250
7390
6169805044
00
27 .952 9 . 9 3
2 431
11.832
483310
603110
1.540.851-22
740
0 . 50 . 3
22T
26
0
AP
63 .7919
4 0 .2824
51.4 6 .4 0 .
0050
3912
6876865752
02
27 .982 9 . 9 3
I. 732
12.815
383422
453422
1.760.91
10
1150
TT
30.0
0
MA
73 .9421
48 .2503
61.53.4 7 .
1030
17766
6477835148
06
2 119
12.417
450611 +
622910
8.517.21
11-12
851
0 . 00 .0
0
0
JUN
83.9426
61.5115
72.65.61.
9000
4240
7078866055
15
27.91
2. 917
11.416
493121
563221
4 .111.57
21
971
0 . 00 . 0
0
0
JU
89 .102
2365.
4927
77.67.62 .
14000
4393
6374814950
02
28.042 9 . 9 5
1 .511
10.617
433401
483301
2.511.44
n
331
0 . 00 .0
0
0
AU
84 .100
0363.
5314
73 .66.63.
7000
1282
7485915859
26
28 .052 9 . 9 7
3 1148.216
302926 +
372117
3 . 7 71.06
12
1072
0 . 00 .0
0
0
SE
83.9721
56.3229
69.60.55.
5010
39185
6474844947
02
28.062 9 . 9 8
6 . 517
11.716
363528
443528
1.100.65
05
320
0 . 00 .0
0
0
OCT
68.9402
41.2424
55.4 7 .41.
3070
34946
6676865154
21
28.103 0 . 0 6
3 . 317
11.116
402805
462705
2 . 4 91.71
19-20
751
TT
220
0
NO
54 .7902
2 9 .1029
41.35.28.
04
190
6850
6572785460
20
27.982 9 . 9 6
4 928
13.332
553228
623228
0 .990.51
27-28
740
2 . 82 . 0
283
29
1
DEC
35.6426
17 .-708
2 6 .
01429
5
1186C
7782846876
00
28 .06
5 928
11.229
413215
523315
0 . 4 70.28
03
520
5 .04 .0
037
10t
1
YEAR
6 3 . 7102
JUL 234 0 . 7
-14JAN 15
5 2 . 3
3939
14513
57601214
6977845858
1724
1 .422
11.316
5532
NOV 28
6232
NOV 28
2 8 . 8 77.21
MAY 11-12
8449
6
2 3 . 65.6
JAN 047
DEC 10+
8
published by: NCDC Asheville, NC
ATTACHMENT I
TOXICOLOGICAL PROFILES
018925 (21) AFPL

TABLE OF CONTENTS
1.0 VOLATILE ORGANIC COMPOUNDS 1-11.1 1,1,1-TRICHLOROETHANE 1-11.2 1,1-DICHLOROETHANE (1,1-DCA) 1-31.3 1,1-DICHLOROETHENE 1-61.4 1,2-DICHLOROETHANE (1,2-DCA) 1-101.5 CIS-1,2-DICHLOROETHENE(CIS-1,2-DCE) 1-131.6 TETRACHLOROETHYLENE (PERCHLOROETHYLENE OR PCE) 1-151.7 TRICHLOROETHENE 1-18
REFERENCES 1-21
18925 (21) APPL ATTI CONESTOGA-ROVERS & ASSOCIATES
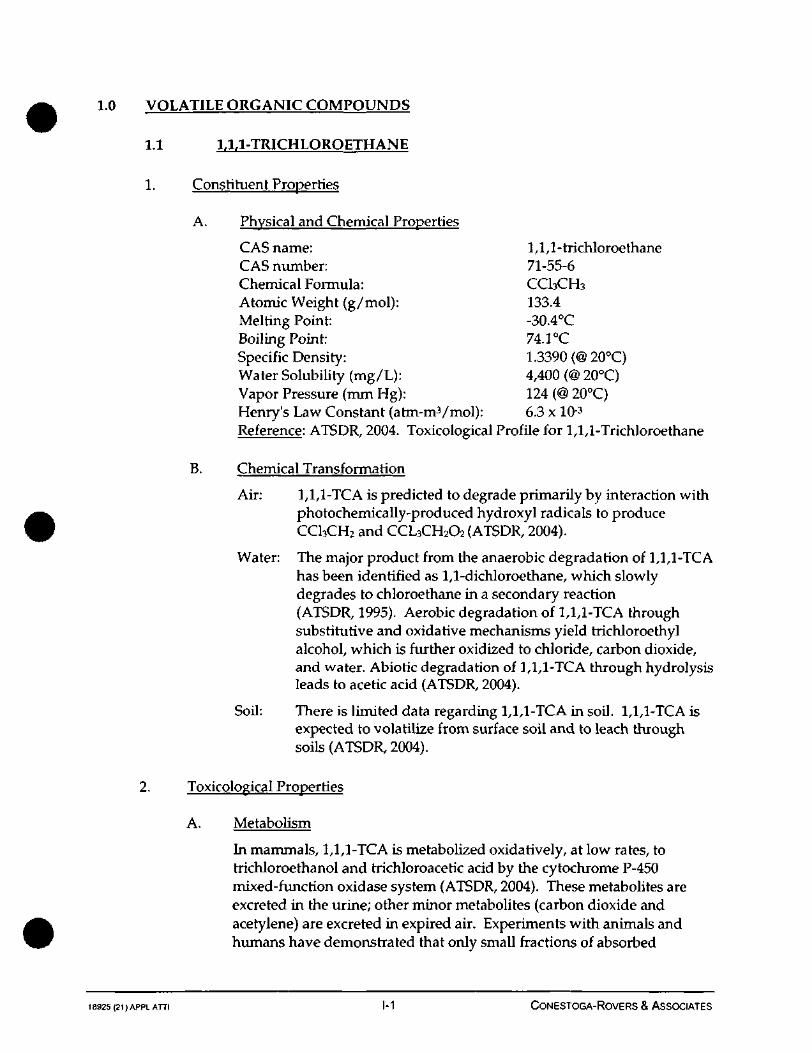
1.0 VOLATILE ORGANIC COMPOUNDS
1.1 1,1,1-TRICHLOROETHANE
1. Constituent Properties
A. Physical and Chemical Properties
CAS name: 1,1,1-trichloroethaneCAS number: 71-55-6Chemical Formula: CCbCHsAtomic Weight (g/mol): 133.4Melting Point: -30.4°CBoiling Point: 74.1°CSpecific Density: 1.3390 (@ 20°C)Water Solubility (mg/L): 4,400 (@ 20°C)Vapor Pressure (mm Hg): 124 (@ 20°C)Henry's Law Constant (atm-m3/mol): 6.3 x 1Q-3
Reference: ATSDR, 2004. Toxicological Profile for 1,1,1-Trichloroethane
B. Chemical Transformation
Air: 1,1,1-TCA is predicted to degrade primarily by interaction withphotochemically-produced hydroxyl radicals to produceCC13CH2 and CCL3CH2O2 (ATSDR, 2004).
Water: The major product from the anaerobic degradation of 1,1,1-TCAhas been identified as 1,1-dichloroethane, which slowlydegrades to chloroethane in a secondary reaction(ATSDR, 1995). Aerobic degradation of 1,1,1-TCA throughsubstitutive and oxidative mechanisms yield trichloroethylalcohol, which is further oxidized to chloride, carbon dioxide,and water. Abiotic degradation of 1,1,1-TCA through hydrolysisleads to acetic acid (ATSDR, 2004).
Soil: There is limited data regarding 1,1,1-TCA in soil. 1,1,1-TCA isexpected to volatilize from surface soil and to leach throughsoils (ATSDR, 2004).
2. Toxicological Properties
A. Metabolism
In mammals, 1,1,1-TCA is metabolized oxidatively, at low rates, totrichloroethanol and trichloroacetic acid by the cytochrome P-450mixed-function oxidase system (ATSDR, 2004). These metabolites areexcreted in the urine; other minor metabolites (carbon dioxide andacetylene) are excreted in expired air. Experiments with animals andhumans have demonstrated that only small fractions of absorbed
18925(21)APPLATTI 1-1 CONESTOGA-ROVERS & ASSOCIATES
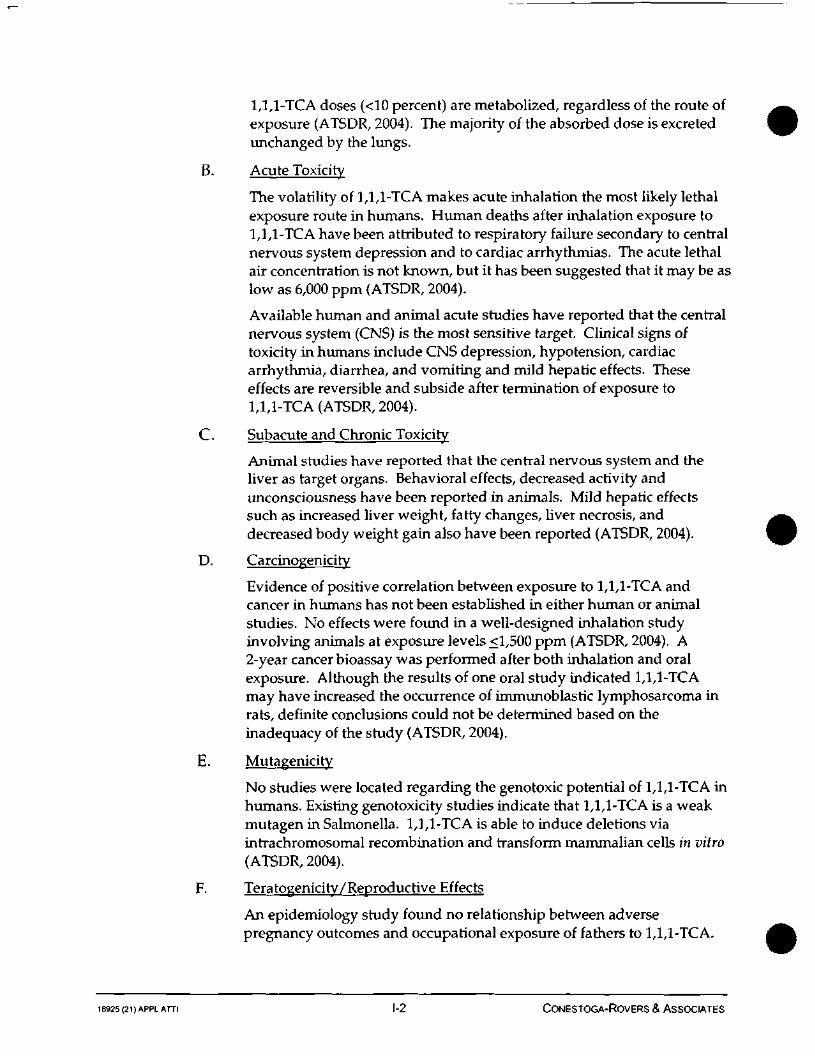
1,1,1-TCA doses (<10 percent) are metabolized, regardless of the route ofexposure (ATSDR, 2004). The majority of the absorbed dose is excretedunchanged by the lungs.
B. Acute Toxicity
The volatility of 1,1/1-TCA makes acute inhalation the most likely lethalexposure route in humans. Human deaths after inhalation exposure to1,1/1-TCA have been attributed to respiratory failure secondary to centralnervous system depression and to cardiac arrhythmias. The acute lethalair concentration is not known, but it has been suggested that it may be aslow as 6,000 ppm (ATSDR, 2004).
Available human and animal acute studies have reported that the centralnervous system (CNS) is the most sensitive target. Clinical signs oftoxicity in humans include CNS depression, hypotension, cardiacarrhythmia, diarrhea, and vomiting and mild hepatic effects. Theseeffects are reversible and subside after termination of exposure to1,1,1-TCA (ATSDR, 2004).
C. Subacute and Chronic Toxicity
Animal studies have reported that the central nervous system and theliver as target organs. Behavioral effects, decreased activity andunconsciousness have been reported in animals. Mild hepatic effectssuch as increased liver weight, fatty changes, liver necrosis, anddecreased body weight gain also have been reported (ATSDR, 2004).
D. Carcinogeniciry
Evidence of positive correlation between exposure to 1,1,1-TCA andcancer in humans has not been established in either human or animalstudies. No effects were found in a well-designed inhalation studyinvolving animals at exposure levels <1,500 ppm (ATSDR, 2004). A2-year cancer bioassay was performed after both inhalation and oralexposure. Although the results of one oral study indicated 1,1,1-TCAmay have increased the occurrence of immunoblastic lymphosarcoma inrats, definite conclusions could not be determined based on theinadequacy of the study (ATSDR, 2004).
E. Mutagenicity
No studies were located regarding the genotoxic potential of 1,1,1-TCA inhumans. Existing genotoxiciry studies indicate that 1,1,1-TCA is a weakmutagen in Salmonella. 1,1,1-TCA is able to induce deletions viaintrachromosomal recombination and transform mammalian cells in vitro(ATSDR, 2004).
F. Teratogenicity/Reproductive Effects
An epidemiology study found no relationship between adversepregnancy outcomes and occupational exposure of fathers to 1,1,1-TCA.
18925 (21) APPL ATTI I-2 CONESTOGA-ROVERS & ASSOCIATES
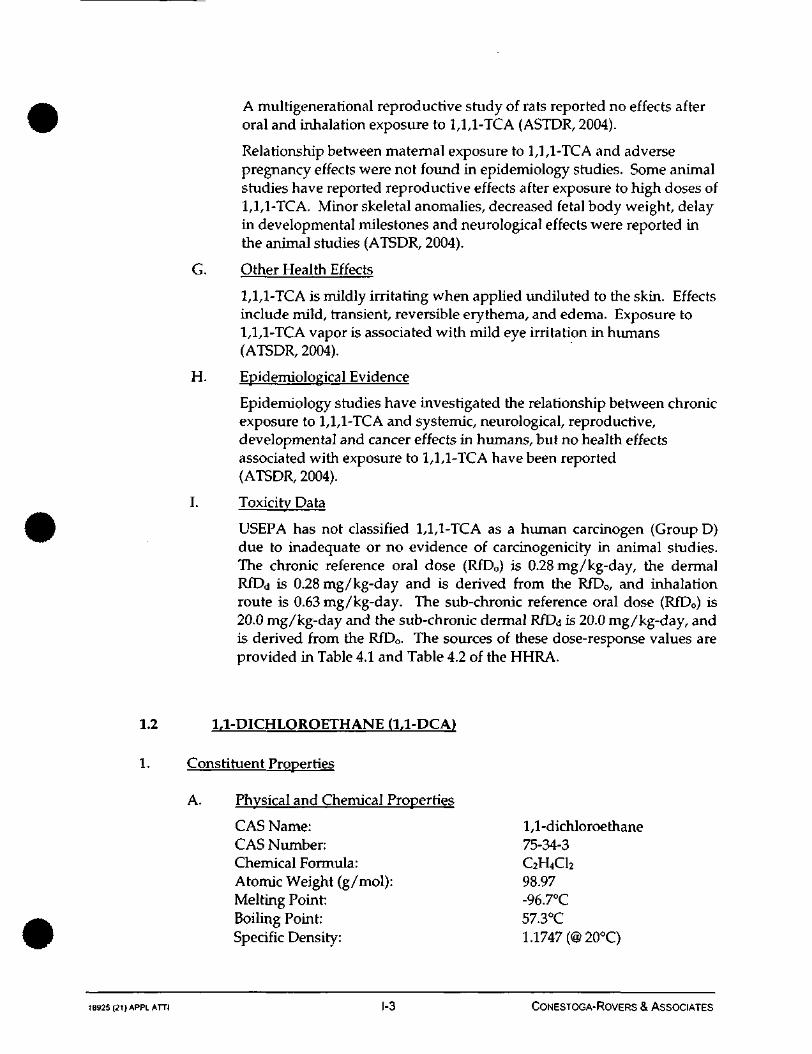
A multigenerational reproductive study of rats reported no effects afteroral and inhalation exposure to 1,1,1-TCA (ASTDR, 2004).
Relationship between maternal exposure to 1,1,1-TCA and adversepregnancy effects were not found in epidemiology studies. Some animalstudies have reported reproductive effects after exposure to high doses of1,1,1-TCA. Minor skeletal anomalies, decreased fetal body weight, delayin developmental milestones and neurological effects were reported inthe animal studies (ATSDR, 2004).
G. Other Health Effects
1,1,1-TCA is mildly irritating when applied undiluted to the skin. Effectsinclude mild, transient, reversible erythema, and edema. Exposure to1,1,1-TCA vapor is associated with mild eye irritation in humans(ATSDR, 2004).
H. Epidemiological Evidence
Epidemiology studies have investigated the relationship between chronicexposure to 1,1,1-TCA and systemic, neurological, reproductive,developmental and cancer effects in humans, but no health effectsassociated with exposure to 1,1,1-TCA have been reported(ATSDR, 2004).
I. Toxicity Data
USEPA has not classified 1,1,1-TCA as a human carcinogen (Group D)due to inadequate or no evidence of carcinogenicity in animal studies.The chronic reference oral dose (RfD0) is 0.28 mg/kg-day, the dermalRfDd is 0.28 mg/kg-day and is derived from the RfD0, and inhalationroute is 0.63 mg/kg-day. The sub-chronic reference oral dose (RfD0) is20.0 mg/kg-day and the sub-chronic dermal RfDa is 20.0 mg/kg-day, andis derived from the RfD0. The sources of these dose-response values areprovided in Table 4.1 and Table 4.2 of the HHRA.
1.2 1,1-DICHLOROETHANE (1,1-DCA)
1. Constituent Properties
A. Physical and Chemical Properties
CAS Name: 1,1-dichloroethaneCAS Number: 75-34-3Chemical Formula: C2H4ChAtomic Weight (g/mol): 98.97Melting Point: -96.7°CBoiling Point: 57.3°CSpecific Density: 1.1747 (@20°C)
18925(21)APPLATTI I-3 CONESTOGA-ROVERS & ASSOCIATES

Water Solubility (mg/L): 5,500 (@ 20°C)Vapor Pressure (mm Hg): 182(@20°C)Henry's Law Constant (atm-mVmol): 4.2xlQ-2 (© 25°C)Reference: ATSDR, 1990. Toxicological Profile for 1,1-Dichloroethane.
B. Chemical Transformation
Air: 1,1-DCA is oxidized by reaction with hydroxyl radicals to formproducts such as monochloroacetyl chloride, chloroacetic acid,hydrochloric acid, and chlorine (ATSDR, 1990).
Water: 1,1-DCA in surface water is expected to volatilize to theatmosphere before undergoing any significant chemical orbiological degradation (ATSDR, 1990). In anaerobic conditions,in the presence of methane-producing bacteria, 1,1-DCA couldbe expected to be degraded to chloroethane, which in turn isdegraded to ethanol and carbon dioxide (ATSDR, 1990). Underaerobic conditions there was no evidence for similartransformations.
Soil: 1,1-DCA in soils is expected to volatilize to the atmosphere or betransported to groundwater before undergoing significanttransformation (ATSDR, 1990).
2. Toxicological Properties
A. Metabolism
The metabolism of 1,1-DCA has not been extensively characterized.Large portions of orally administered 1,1-DCA are excreted unchangedby mice and rats in the expired air. The compound not excreted in theexpired air was probably largely metabolized in the liver, followed bysubsequent redistribution of metabolites to other organs prior to theirexcretion (ATSDR, 1990). In one study, more than 90 percent of a1,1-DCA oral dose in rats (700 mg/kg) and mice (1800 mg/kg) wasexcreted unchanged or as carbon dioxide within 48-hours afteradministration (ATSDR, 1990).
B. Acute Toxicity
No fatalities have been reported in humans following exposure to1,1-DCA. However, death has been observed in laboratory animalsfollowing acute inhalation and oral exposure. No reliable LD50 or LC50values were found but lethal doses of 1,1,-DCA have been noted to be 5 to10 times higher than those required to produce death following exposureto 1,2-DCA or tetrachloroethane. Therefore, it is likely that 1,1-DCA canbe fatal to humans, if exposure to high enough levels occurs(ATSDR, 1990). Since 1,1-DCA was once used as a gaseous anesthetic, itcan be assumed that it causes central nervous system depression uponacute exposure.
18925 (21) APPL ATTI I-4 CONESTOGA-ROVERS & ASSOCIATES
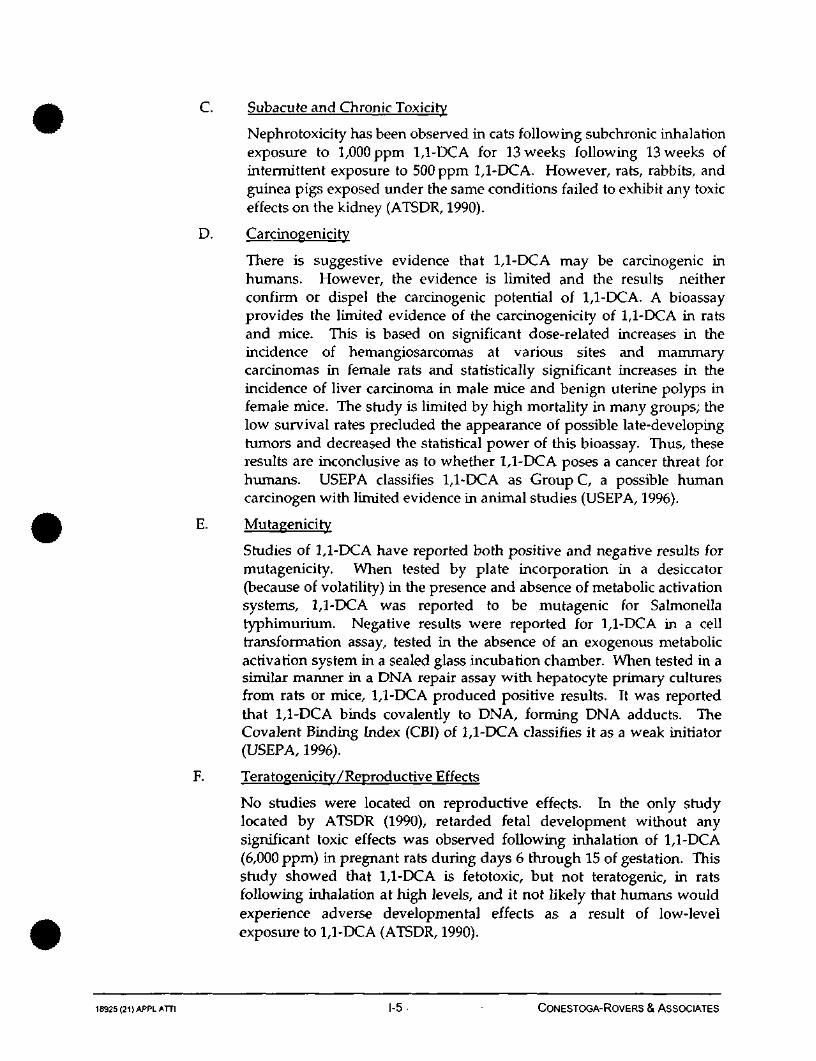
C. Subacute and Chronic Toxicity
Nephrotoxicity has been observed in cats following subchronic inhalationexposure to 1,000 ppm 1,1-DCA for 13 weeks following 13 weeks ofintermittent exposure to 500 ppm 1,1-DCA. However, rats, rabbits, andguinea pigs exposed under the same conditions failed to exhibit any toxiceffects on the kidney (ATSDR, 1990).
D. Carcinogenicity
There is suggestive evidence that 1,1-DCA may be carcinogenic inhumans. However, the evidence is limited and the results neitherconfirm or dispel the carcinogenic potential of 1,1-DCA. A bioassayprovides the limited evidence of the carcinogenicity of 1,1-DCA in ratsand mice. This is based on significant dose-related increases in theincidence of hemangiosarcomas at various sites and mammarycarcinomas in female rats and statistically significant increases in theincidence of liver carcinoma in male mice and benign uterine polyps infemale mice. The study is limited by high mortality in many groups; thelow survival rates precluded the appearance of possible late-developingtumors and decreased the statistical power of this bioassay. Thus, theseresults are inconclusive as to whether 1,1-DCA poses a cancer threat forhumans. USEPA classifies 1,1-DCA as Group C, a possible humancarcinogen with limited evidence in animal studies (USEPA, 1996).
E. Mutagenicity
Studies of 1,1-DCA have reported both positive and negative results formutagenicity. When tested by plate incorporation in a desiccator(because of volatility) in the presence and absence of metabolic activationsystems, 1,1-DCA was reported to be mutagenic for Salmonellatyphimurium. Negative results were reported for 1,1-DCA in a celltransformation assay, tested in the absence of an exogenous metabolicactivation system in a sealed glass incubation chamber. When tested in asimilar manner in a DNA repair assay with hepatocyte primary culturesfrom rats or mice, 1,1-DCA produced positive results. It was reportedthat 1,1-DCA binds covalently to DNA, forming DNA adducts. TheCovalent Binding Index (CBI) of 1,1-DCA classifies it as a weak initiator(USEPA, 1996).
F. Teratogem'city/Reproductive Effects
No studies were located on reproductive effects. In the only studylocated by ATSDR (1990), retarded fetal development without anysignificant toxic effects was observed following inhalation of 1,1-DCA(6,000 ppm) in pregnant rats during days 6 through 15 of gestation. Thisstudy showed that 1,1-DCA is fetotoxic, but not teratogenic, in ratsfollowing inhalation at high levels, and it not likely that humans wouldexperience adverse developmental effects as a result of low-levelexposure to 1,1-DCA (ATSDR, 1990).
18925 (21) APPLATTI I-5 CONESTOGA-ROVERS & ASSOCIATES

G. Other Health Effects
The use of 1,1-DCA as an anesthetic was discontinued when it wasdiscovered that it induced cardiac arrhythmias in humans by anvunknown mechanism of action at anesthetic doses (approximately105,000 mg/m3 or 26,000 ppm) (ATSDR, 1990).
H. Epidemiological Evidence
No information was located.
I. Toxicity Data
USEPA classifies 1,1-DCA a possible human carcinogen with limitedevidence in animal studies. The oral Cancer Potency Slope for 1,1-DCA is5.7xlO-3 (mg/kg-day)-1. The chronic RfD0 is 0.20 mg/kg-day, the dermalRfDd is 0.20 mg/kg-day and is derived from the oral value, and the RfDj,or inhalation Reference Dose is 0.14 mg/kg-day. The sub-chronic RfD0 is2.0 mg/kg-day, the sub-chronic dermal RfDd is 2.0 mg/kg-day and isderived from the oral value, and the RfDj, or inhalation Reference Dose is1.4 mg/kg-day. The sources of these dose-response values are providedin Table 4.1, Table 4.2, and Table 4.3 of the HHRA.
1.3 1,1-DICHLOROETHENE
1. Constituent Properties
A. Physical and Chemical Properties
Molecular weight: 96.94Boiling Point: 31.6°CMelting Point: -122.5°CSpecific Density: 1.213 (@ 20°C)Water Solubility (mg/L): 2,500 (@ 25°C)Vapor Pressure (mm Hg): 500 (@ 20°C)Henry's Law Constant (atm-m3/mol): 1.9E-01Reference: ATSDR, 1994. Toxicological Profile for 1,1-Dichloroethylene.
B. Chemical Transformation
Air: Degradation of 1,1-Dichloroethylene (1,1-DCE) is expected to bedominated by oxidation with photochemically producedhydroxyl radicals producing phosgene, formaldehyde, andchloraceryl chloride (ATSDR, 1994).
Water: Biotransformarion under anaerobic conditions is believed to bethe dominant transformation process for 1,1-DCE ingroundwater, producing vinyl chloride (ATSDR, 1994). Insurface water, under aerobic conditions, bio transformation isnot as well understood. Photolysis, hydrolysis, and oxidation in
1B925(21)APPLATTI I-6 CONESTOGA-ROVERS & ASSOCIATES
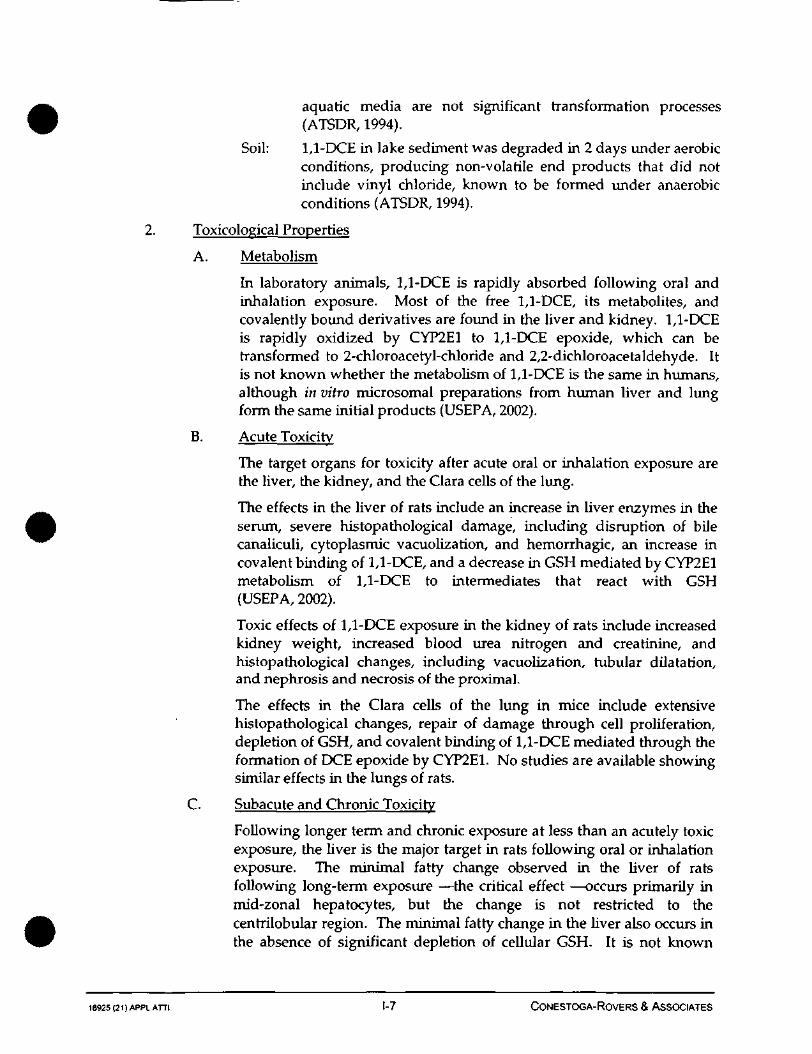
aquatic media are not significant transformation processes(ATSDR, 1994).
Soil: 1,1-DCE in lake sediment was degraded in 2 days under aerobicconditions, producing non-volatile end products that did notinclude vinyl chloride, known to be formed under anaerobicconditions (ATSDR, 1994).
2. Toxicological Properties
A. Metabolism
In laboratory animals, 1,1-DCE is rapidly absorbed following oral andinhalation exposure. Most of the free 1,1-DCE, its metabolites, andcovalently bound derivatives are found in the liver and kidney. 1,1-DCEis rapidly oxidized by CYP2E1 to 1,1-DCE epoxide, which can betransformed to 2-chloroacetyl-chloride and 2,2-dichloroacetaldehyde. Itis not known whether the metabolism of 1,1-DCE is the same in humans,although in vitro microsomal preparations from human liver and lungform the same initial products (USEPA, 2002).
B. Acute Toxicity
The target organs for toxicity after acute oral or inhalation exposure arethe liver, the kidney, and the Clara cells of the lung.
The effects in the liver of rats include an increase in liver enzymes in theserum, severe histopathological damage, including disruption of bilecanaliculi, cytoplasmic vacuolization, and hemorrhagic, an increase incovalent binding of 1,1-DCE, and a decrease in GSH mediated by CYP2E1metabolism of 1,1-DCE to intermediates that react with GSH(USEPA, 2002).
Toxic effects of 1,1-DCE exposure in the kidney of rats include increasedkidney weight, increased blood urea nitrogen and crearinine, andhistopathological changes, including vacuolization, tubular dilatation,and nephrosis and necrosis of the proximal.
The effects in the Clara cells of the lung in mice include extensivehistopathological changes, repair of damage through cell proliferation,depletion of GSH, and covalent binding of 1,1-DCE mediated through theformation of DCE epoxide by CYP2E1. No studies are available showingsimilar effects in the lungs of rats.
C. Subacute and Chronic Toxicity
Following longer term and chronic exposure at less than an acutely toxicexposure, the liver is the major target in rats following oral or inhalationexposure. The minimal fatty change observed in the liver of ratsfollowing long-term exposure —the critical effect —occurs primarily inmid-zonal hepatocytes, but the change is not restricted to thecentrilobular region. The minimal fatty change in the liver also occurs inthe absence of significant depletion of cellular GSH. It is not known
18925(21)APPLATTI I-7 CONESTOGA-ROVERS & ASSOCIATES
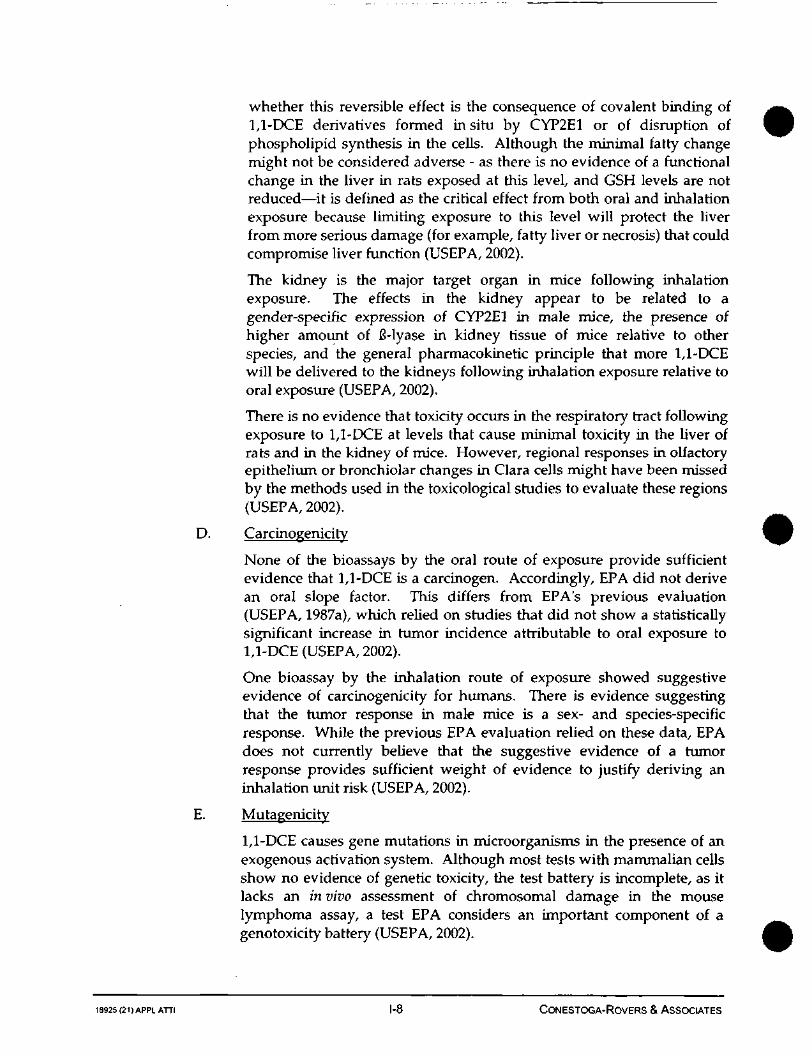
whether this reversible effect is the consequence of covalent binding of1,1-DCE derivatives formed in situ by CYP2E1 or of disruption ofphospholipid synthesis in the cells. Although the minimal fatty changemight not be considered adverse - as there is no evidence of a functionalchange in the liver in rats exposed at this level, and GSH levels are notreduced—it is defined as the critical effect from both oral and inhalationexposure because limiting exposure to this level will protect the liverfrom more serious damage (for example, fatty liver or necrosis) that couldcompromise liver function (USEPA, 2002).
The kidney is the major target organ in mice following inhalationexposure. The effects in the kidney appear to be related to agender-specific expression of CYP2E1 in male mice, the presence ofhigher amount of G-lyase in kidney tissue of mice relative to otherspecies, and the general pharmacokinetic principle that more 1,1-DCEwill be delivered to the kidneys following inhalation exposure relative tooral exposure (USEPA, 2002).
There is no evidence that toxicity occurs in the respiratory tract followingexposure to 1,1-DCE at levels that cause minimal toxicity in the liver ofrats and in the kidney of mice. However, regional responses in olfactoryepithelium or bronchiolar changes in Clara cells might have been missedby the methods used in the toxicological studies to evaluate these regions(USEPA, 2002).
D. Carcinogenic! ty
None of the bioassays by the oral route of exposure provide sufficientevidence that 1,1-DCE is a carcinogen. Accordingly, EPA did not derivean oral slope factor. This differs from EPA's previous evaluation(USEPA, 1987a), which relied on studies that did not show a statisticallysignificant increase in tumor incidence attributable to oral exposure to1,1-DCE (USEPA, 2002).
One bioassay by the inhalation route of exposure showed suggestiveevidence of carcinogenicity for humans. There is evidence suggestingthat the rumor response in male mice is a sex- and species-specificresponse. While the previous EPA evaluation relied on these data, EPAdoes not currently believe that the suggestive evidence of a tumorresponse provides sufficient weight of evidence to justify deriving aninhalation unit risk (USEPA, 2002).
E. Mutagenicity
1,1-DCE causes gene mutations in microorganisms in the presence of anexogenous activation system. Although most tests with mammalian cellsshow no evidence of generic toxicity, the test battery is incomplete, as itlacks an in vivo assessment of chromosomal damage in the mouselymphoma assay, a test EPA considers an important component of agenotoxicity battery (USEPA, 2002).
18925 (21 )APPLATTI I-8 CONESTOGA-ROVERS & ASSOCIATES
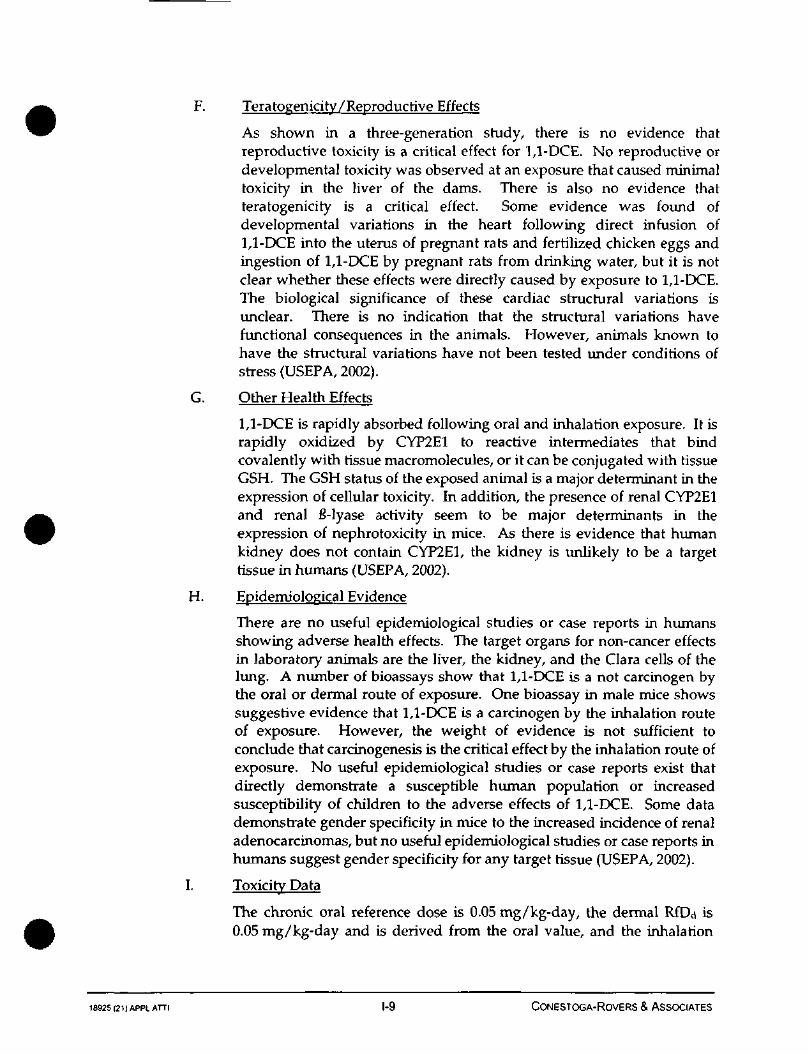
F. Teratogenicity/Reproductive Effects
As shown in a three-generation study, there is no evidence thatreproductive toxicity is a critical effect for 1,1-DCE. No reproductive ordevelopmental toxicity was observed at an exposure that caused minimaltoxicity in the liver of the dams. There is also no evidence thatteratogenicity is a critical effect. Some evidence was found ofdevelopmental variations in the heart following direct infusion of1,1-DCE into the uterus of pregnant rats and fertilized chicken eggs andingestion of 1,1-DCE by pregnant rats from drinking water, but it is notclear whether these effects were directly caused by exposure to 1,1-DCE.The biological significance of these cardiac structural variations isunclear. There is no indication that the structural variations havefunctional consequences in the animals. However, animals known tohave the structural variations have not been tested under conditions ofstress (USEPA, 2002).
G. Other Health Effects
1,1-DCE is rapidly absorbed following oral and inhalation exposure. It israpidly oxidized by CYP2E1 to reactive intermediates that bindcovalently with tissue macromolecules, or it can be conjugated with tissueGSH. The GSH status of the exposed animal is a major determinant in theexpression of cellular toxicity. In addition, the presence of renal CYP2E1and renal fi-lyase activity seem to be major determinants in theexpression of nephrotoxicity in mice. As there is evidence that humankidney does not contain CYP2E1, the kidney is unlikely to be a targettissue in humans (USEPA, 2002).
H. Epidemiological Evidence
There are no useful epidemiological studies or case reports in humansshowing adverse health effects. The target organs for non-cancer effectsin laboratory animals are the liver, the kidney, and the Clara cells of thelung. A number of bioassays show that 1,1-DCE is a not carcinogen bythe oral or dermal route of exposure. One bioassay in male mice showssuggestive evidence that 1,1-DCE is a carcinogen by the inhalation routeof exposure. However, the weight of evidence is not sufficient toconclude that carcinogenesis is the critical effect by the inhalation route ofexposure. No useful epidemiological studies or case reports exist thatdirectly demonstrate a susceptible human population or increasedsusceptibility of children to the adverse effects of 1,1-DCE. Some datademonstrate gender specificity in mice to the increased incidence of renaladenocarcinomas, but no useful epidemiological studies or case reports inhumans suggest gender specificity for any target tissue (USEPA, 2002).
I. Toxicity Data
The chronic oral reference dose is 0.05 mg/kg-day, the dermal RfDd is0.05 mg/kg-day and is derived from the oral value, and the inhalation
18925(21)APPLATTI I-9 CONESTOGA-ROVERS & ASSOCIATES
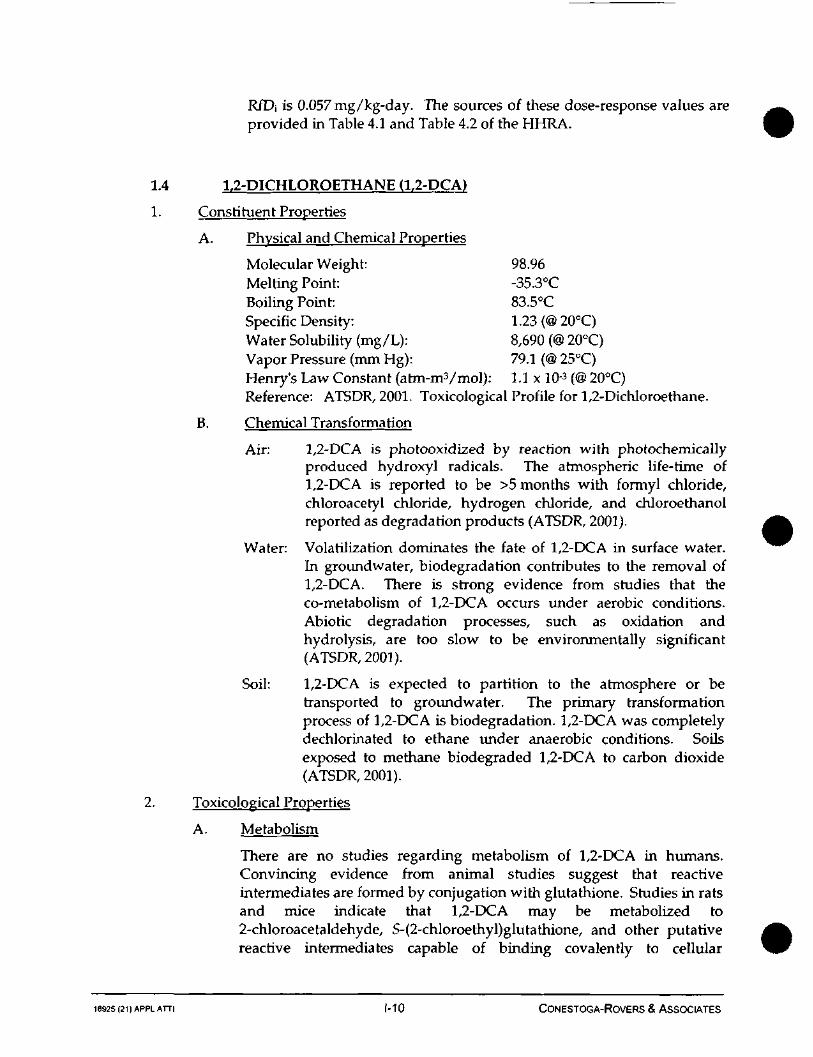
RfDi is 0.057 mg/kg-day. The sources of these dose-response values areprovided in Table 4.1 and Table 4.2 of the HHRA.
1.4 1,2-DICHLOROETHANE (1,2-DCA)
1. Constituent Properties
A. Physical and Chemical Properties
Molecular Weight: 98.96Melting Point: -35.3°CBoiling Point: 83.5°CSpecific Density: 1.23 (@ 20°C)Water Solubility (mg/L): 8,690 (@ 20°C)Vapor Pressure (mm Hg): 79.1 (@ 25°C)Henry's Law Constant (atm-m3/mol): 1.1 x 10⁻³ (@ 20°C)Reference: ATSDR, 2001. Toxicological Profile for 1,2-Dichloroethane.
B. Chemical Transformation
Air: 1,2-DCA is photooxidized by reaction with photochemicallyproduced hydroxyl radicals. The atmospheric life-time of1,2-DCA is reported to be >5 months with formyl chloride,chloroacetyl chloride, hydrogen chloride, and chloroethanolreported as degradation products (ATSDR, 2001).
Water: Volatilization dominates the fate of 1,2-DCA in surface water.In groundwater, biodegradarion contributes to the removal of1,2-DCA. There is strong evidence from studies that theco-metabolism of 1,2-DCA occurs under aerobic conditions.Abiotic degradation processes, such as oxidation andhydrolysis, are too slow to be environmentally significant(ATSDR, 2001).
Soil: 1,2-DCA is expected to partition to the atmosphere or betransported to groundwater. The primary transformationprocess of 1,2-DCA is biodegradarion. 1,2-DCA was completelydechlorinated to ethane under anaerobic conditions. Soilsexposed to methane biodegraded 1,2-DCA to carbon dioxide(ATSDR, 2001).
2. Toxicological Properties
A. Metabolism
There are no studies regarding metabolism of 1,2-DCA in humans.Convincing evidence from animal studies suggest that reactiveintermediates are formed by conjugation with glutathione. Studies in ratsand mice indicate that 1,2-DCA may be metabolized to2-chloroacetaldehyde, S-(2-chloroethyl)glutathione, and other putativereactive intermediates capable of binding covalently to cellular
18925 (21 )APPLATTl 1-10 CONESTOGA-ROVERS & ASSOCIATES
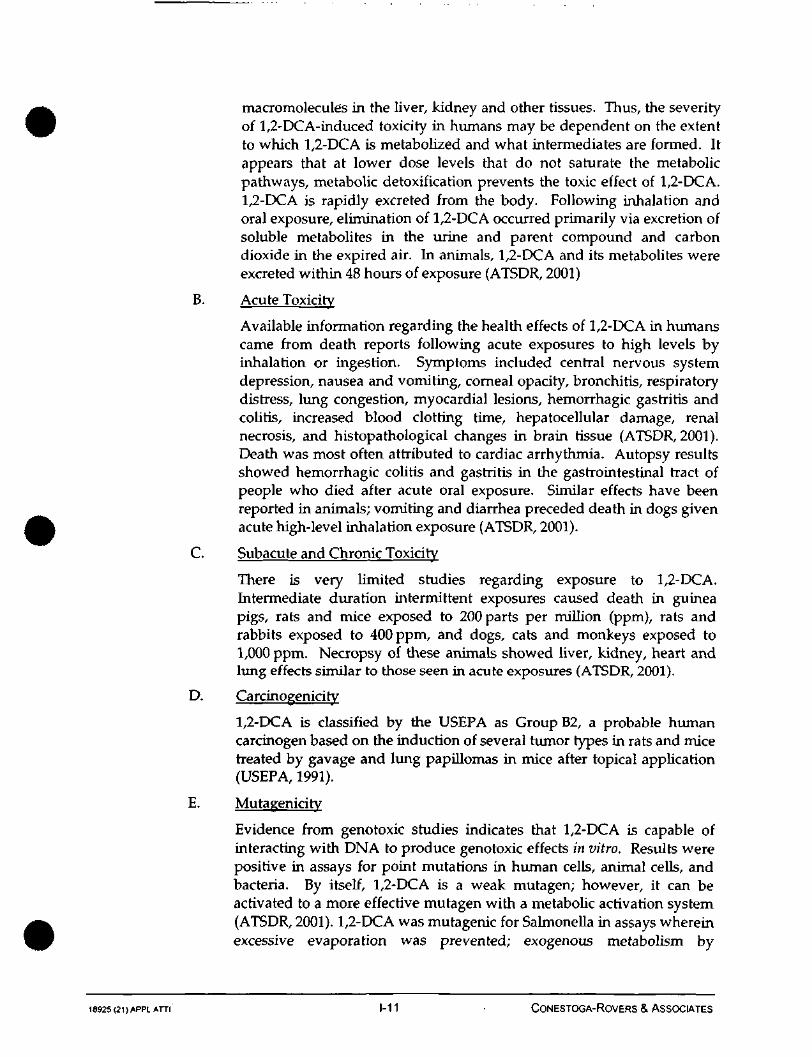
macromolecules in the liver, kidney and other tissues. Thus, the severityof 1,2-DCA-induced toxicity in humans may be dependent on the extentto which 1,2-DCA is metabolized and what intermediates are formed. Itappears that at lower dose levels that do not saturate the metabolicpathways, metabolic detoxification prevents the toxic effect of 1,2-DCA.1,2-DCA is rapidly excreted from the body. Following inhalation andoral exposure, elimination of 1,2-DCA occurred primarily via excretion ofsoluble metabolites in the urine and parent compound and carbondioxide in the expired air. In animals, 1,2-DCA and its metabolites wereexcreted within 48 hours of exposure (ATSDR, 2001)
B. Acute Toxicity
Available information regarding the health effects of 1,2-DCA in humanscame from death reports following acute exposures to high levels byinhalation or ingestion. Symptoms included central nervous systemdepression, nausea and vomiting, corneal opacity, bronchitis, respiratorydistress, lung congestion, myocardial lesions, hemorrhagic gastritis andcolitis, increased blood clotting time, hepatocellular damage, renalnecrosis, and histopathological changes in brain tissue (ATSDR, 2001).Death was most often attributed to cardiac arrhythmia. Autopsy resultsshowed hemorrhagic colitis and gastritis in the gastrointestinal tract ofpeople who died after acute oral exposure. Similar effects have beenreported in animals; vomiting and diarrhea preceded death in dogs givenacute high-level inhalation exposure (ATSDR, 2001).
C. Subacute and Chronic Toxicity
There is very limited studies regarding exposure to 1,2-DCA.Intermediate duration intermittent exposures caused death in guineapigs, rats and mice exposed to 200 parts per million (ppm), rats andrabbits exposed to 400 ppm, and dogs, cats and monkeys exposed to1,000 ppm. Necropsy of these animals showed liver, kidney, heart andlung effects similar to those seen in acute exposures (ATSDR, 2001).
D. Carcinogenicity
1,2-DCA is classified by the USEPA as Group B2, a probable humancarcinogen based on the induction of several tumor types in rats and micetreated by gavage and lung papillomas in mice after topical application(USEPA, 1991).
E. Mutagenicity
Evidence from genotoxic studies indicates that 1,2-DCA is capable ofinteracting with DNA to produce genotoxic effects in vitro. Results werepositive in assays for point mutations in human cells, animal cells, andbacteria. By itself, 1,2-DCA is a weak mutagen; however, it can beactivated to a more effective mutagen with a metabolic activation system(ATSDR, 2001). 1,2-DCA was mutagenie for Salmonella in assays whereinexcessive evaporation was prevented; exogenous metabolism by
18925(21)APPLATTI 1-11 • CONESTOGA-ROVERS & ASSOCIATES
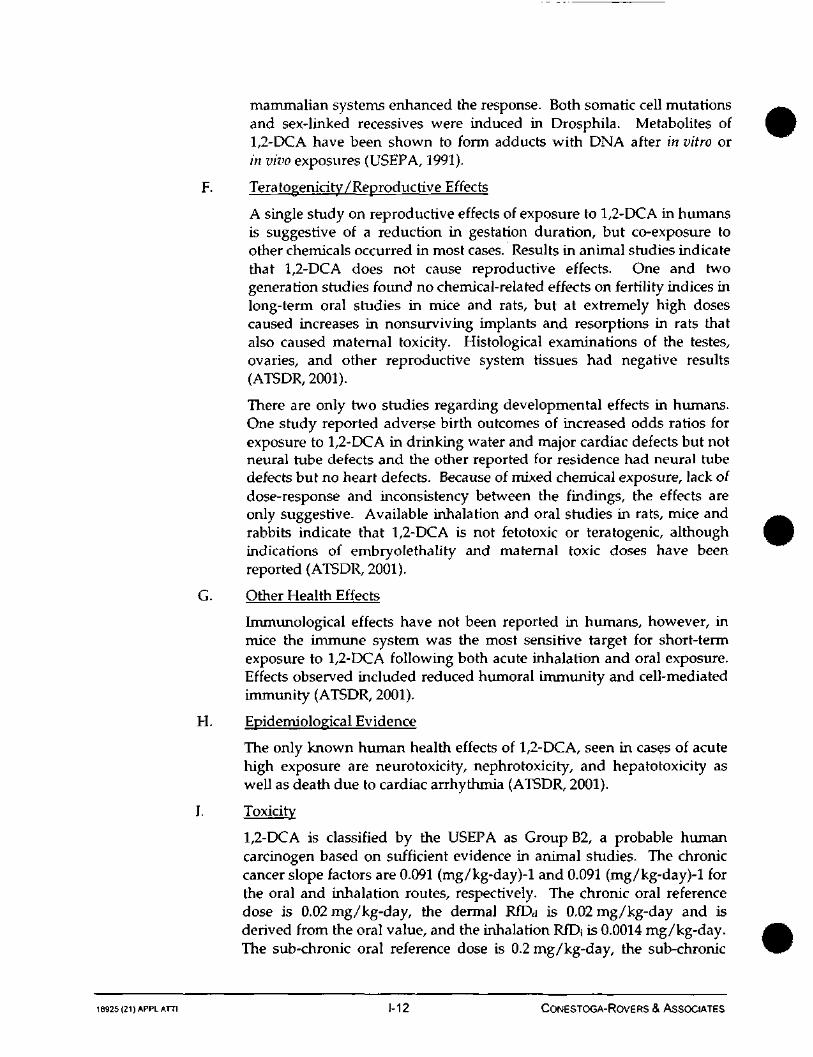
mammalian systems enhanced the response. Both somatic cell mutationsand sex-linked recessives were induced in Drosphila. Metabolites of1,2-DCA have been shown to form adducts with DNA after in vitro orin vivo exposures (USEPA, 1991).
F. Teratogeniciry/Reproductive Effects
A single study on reproductive effects of exposure to 1,2-DCA in humansis suggestive of a reduction in gestation duration, but co-exposure toother chemicals occurred in most cases. Results in animal studies indicatethat 1,2-DCA does not cause reproductive effects. One and twogeneration studies found no chemical-related effects on fertility indices inlong-term oral studies in mice and rats, but at extremely high dosescaused increases in nonsurviving implants and resorprions in rats thatalso caused maternal toxicity. Histological examinations of the testes,ovaries, and other reproductive system tissues had negative results(ATSDR, 2001).
There are only two studies regarding developmental effects in humans.One study reported adverse birth outcomes of increased odds ratios forexposure to 1,2-DCA in drinking water and major cardiac defects but notneural tube defects and the other reported for residence had neural tubedefects but no heart defects. Because of mixed chemical exposure, lack ofdose-response and inconsistency between the findings, the effects areonly suggestive. Available inhalation and oral studies in rats, mice andrabbits indicate that 1,2-DCA is not fetotoxic or teratogenic, althoughindications of embryolethality and maternal toxic doses have beenreported (ATSDR, 2001).
G. Other Health Effects
Immunological effects have not been reported in humans, however, inmice the immune system was the most sensitive target for short-termexposure to 1,2-DCA following both acute inhalation and oral exposure.Effects observed included reduced humoral immunity and cell-mediatedimmunity (ATSDR, 2001).
H. Epidemiological Evidence
The only known human health effects of 1,2-DCA, seen in cases of acutehigh exposure are neurotoxiciry, nephrotoxicity, and hepatotoxicity aswell as death due to cardiac arrhythmia (ATSDR, 2001).
I. Toxicity
1,2-DCA is classified by the USEPA as Group B2, a probable humancarcinogen based on sufficient evidence in animal studies. The chroniccancer slope factors are 0.091 (mg/kg-day)-l and 0.091 (mg/kg-day)-l forthe oral and inhalation routes, respectively. The chronic oral referencedose is 0.02 mg/kg-day, the dermal RfDd is 0.02 mg/kg-day and isderived from the oral value, and the inhalation RfDj is 0.0014 mg/kg-day.The sub-chronic oral reference dose is 0.2 mg/kg-day, the sub-chronic
18925(21)APPLATTI 1-12 CONESTOGA-ROVERS & ASSOCIATES

dermal RfDd is 0.2 mg/kg-day and is derived from the oral value, and thesub-chronic inhalation RfD; is 0.171 mg/kg-day. The sources of thesedose-response values are provided in Table 4.1, Table 4.2, Table 4.3, andTable 4.4 of the HHRA.
1.5 CIS-1,2-DICHLOROETHENE(CIS-1,2-DCE)
1. Constituent Properties
A. Physical and Chemical Properties
cis-l,2-DCE
Atomic Weight (g/mol): 96.94Boiling Point: 60.3°CMelting Point: -80.5°CSpecific Density: 1.2837 (@ 20°C)Water Solubility (mg/L): 3,500 (@ 25°C)Vapor Pressure (mm Hg): 215 (@ 25°C)Henry's Law Constant (atm-m3/mol): 4.08E-03 (@ 25°C)Reference: ATSDR, 1995. Toxicological Profile for 1,2-Dichloroethylene.
B. Chemical Transformation
Air: The dominant removal process for 1,2-DCE is predicted to bereaction with photochemkally produced hydroxyl radicals, withformyl chloride being one positively identified by-products ofthe reaction (ATSDR, 1995).
Water: In surface waters, 1,2-DCE is assumed to be rapidly transferredto the atmosphere. Hydrolysis, photolysis, and oxidation arenot important fate processes for 1,2-DCE in surface waters(ATSDR, 1995). 1,2-DCE and other chlorinated ethenesgenerally resist biodegradation under aerobic conditions. Inaerobic conditions, such as groundwater, 1,2-DCE undergoesslow reductive dechlorination (ATSDR, 1995). The cis isomerdegrades to chloroethane and vinyl chloride.
Soil: Studies suggest the 1,2-DCE isomers undergo anaerobicbiodegradation in soil and that this process may be the solemechanism by which 1,2-DCE degrades in soil, again producingvinyl chloride (ATSDR, 1995).
2. Toxicological Properties
A. Metabolism
Although 1,2-DCE is relatively lipophilic, there is good evidence that itcan accumulate in important organs such as liver, brain, kidney, andadipose tissue. It is more likely that 1,2-DCE will be metabolized to more
18925(21)APPLATTI 1-13 CONESTOGA-ROVERS & ASSOCIATES
hydrophilic by-products, and therefore, eliminated quickly as metabolites(ATSDR, 1995). It has been reported that both the cis and trans isomers of1,2-DCE are converted to dichloroethanol and dichloroaceric acid by ratliver (ATSDR, 1995). The metabolism of the cis isomer is believed tooccur at a greater rate than the trans isomer. As a result, the cis isomeralso exhibits a higher rate of metabolic elimination under saturationconditions, in comparison to the trans isomer (ATSDR, 1995).
B. Acute Toxicity
Human symptoms reported from exposure to high levels (1,715 to2,220 ppm) of 1,2-DCE in air include nausea, drowsiness, fatigue,intracranial pressure and ocular irritation (ATSDR, 1995). Only onehuman fatality has been reported. No information is available on oraltoxicity for 1,2-DCE in humans, or on the relative toxicities of the cisisomer in humans. Mortality in animals exposed orally to cis-l,2-DCEinvolve central nervous system depression (ATSDR, 1995). Acuteexposure of the skin causes irritation and other mild skin effects that arereadily reversible.
C. Subacute and Chronic Toxicity
No data available.
D. Carcinogenicity
To date, cancer effects of cis-l,2-DCE have not been studied in humans oranimals (ATSDR, 1995).
E. Mutagenicity
1,2-DCE has been examined in a variety of test systems. In vivo testsindicate that cis-1,2-DCE is genotoxic (ATSDR, 1995). Genotoxic effects ofcis-l,2-DCE in humans are unknown.
F. Teratogenicity/Reproductive Effects
No information was located.
G Other Health Effects
No data available.
H. Epidemiological Evidence
No data available.
I. Toxicity
The chronic oral reference dose for cis-l,2-DCE is 0.01 mg/kg-day and thesub-chronic oral reference dose is 0.1 mg/kg-day. The sources of thesedose-response values are provided in Table 4.1 of the HHRA.
18925 (21) APPLATTI 1-14 CONESTOGA-ROVERS & ASSOCIATES
1.6 TETRACHLOROETHYLENE (PERCHLOROETHYLENE OR FCE)
1. Constituent Properties
A. Physical and Chemical Properties
Atomic Weight (g/mol): 165.83Boiling Point: 121°CMelting Point: -19°CSpecific Density: 1.6227 (@ 20°C)Water Solubility (mg/L): 150 (@ 25°C)Vapor Pressure (mm Hg): 18.47 (@ 25°C)Henry's Law Constant (atm-mVmol): 1.8E-02 (@ 25°C)Reference: ATSDR, 1997a. Toxicological Profile for Tetrachloroethylene.
B. Chemical Transformation
Air: PCE undergoes atmospheric transformations through thereaction with photolytically-generated hydroxyl radicals. Thedegradation products of this reaction include phosgene andchloroacetylchlorides (ATSDR, 1997a).
Water: Predominant fate of PCE in aquatic environments is primarilyvolatilization into the atmosphere. Existing evidence indicatesthat PCE does not readily transform in water (ATSDR, 1997a).Biodegradation of PCE may be the most importanttransformation process in natural waters with the suspectedbyproducts being cis & trans-l,2-dichloroethene andtrichloroethene (ATSDR, 1997a).
Soil: The predominant fates of PCE in soils is either volatilization tothe atmosphere and leaching to groundwater. Biodegradationof PCE in soils appear to occur only under certain conditionsand only to a limited extent (ATSDR, 1997a).
2. Toxicological Properties
A. Metabolism
Following inhalation or ingestion of PCE in humans, the primarymetabolites identified in urine and blood were trichloroacetic acid andtrichloroethanol (ATSDR, 1997a). The metabolites account for only3 percent of the absorbed PCE by humans. The remaining absorbed PCEis exhaled unchanged. The metabolism of PCE is believed to be mediatedby a cytochrome P-450 catalyzed oxidation reaction involving theformation of an epoxide intermediate.
B. Acute Toxicity
The primary targets of PCE toxicity include the brain, liver, and kidneys.There is also some evidence that suggest reproductive effects may beinduced in women exposed to PCE (ATSDR, 1997a). Exposure to high
18925 (21) APPLATTI 1-15 CONESTOGA-ROVERS & ASSOCIATES
concentrations (> 1,000 ppm) of PCE vapor results in collapse,unconsciousness, and death in humans. The cause of death may berelated to depression of respiratory centers of the central nervous systemand possibly due to cardiac arrhythmia and heart block. Animal studiesof oral exposure suggest that anesthesia and death would be likelyoccurrences in humans if high concentrations were swallowed(ATSDR, 1997a).
PCE has been shown to cause hepatotoxic effects in humans and animalsby inhalation and oral routes of exposure. The types of PCE-inducedhepatic effects in humans are not well documented, and the exposures ordoses producing these effects are not adequately characterized. Inanimals, hepatic lesions were induced by inhalation exposure to PCE(ATSDR, 1997a). Reversible kidney damage has been reported in humansaccidentally exposed to acutely toxic amounts of PCE vapor.
Neurological symptoms of acute inhalation exposure to high levels ofPCE is well documented in humans and include headaches, dizziness,and drowsiness. Neurological symptoms of dizziness and drowsinessoccurred at exposure to 216 ppm for 45 minutes to 2 hours: loss of motorcoordination occurred at exposure to 280 ppm for 2 hours or 600 ppm for10 minutes (ATSDR, 1997a). Human data suggest that the threshold foracute effects may be in the concentration range of 100 to 200 ppm withpreanesthetic/anesthetic effects occurring at a threshold of 1,000 ppm.
C. Subacute and Chronic Toxicity
There is a suggestion that long-term inhalation exposure of workers toorganic solvents, including PCE, causes irreversible neurologicalimpairment. There are no data in humans to indicate that structural braindamage is associated with PCE exposure (ATSDR, 1997a). Despite therelatively large number of people occupationally exposed to PCE, thereare few cases of PCE-associated cardiotoxicity. In one study a patientexperienced cardiac arrhythmia; he had been employed in a dry cleaningfacility for 7 months where he treated clothes with PCE. There is nostrong evidence that people exposed to environmental levels of PCE orlevels at hazardous waste sites would develop cardiovascular effects(ATSDR, 1997a).
Subtle renal perturbations have been detected in at least one study ofchronically exposed workers in dry cleaning workshops. They wereexposed for an average of 14 years to an estimated time-weighted averageof 10 ppm of PCE (ATSDR, 1997a).
D. Carcinogenicity
Carcinogenic effects have not been documented in exposed workers;however, cancer has been induced in experimental animals exposed byinhalation and oral routes (ATSDR, 1997a). USEPA has not classifiedPCE as to its carcinogenicity.
18925 (21) APPLATTI 1-16 CONESTOGA-ROVERS & ASSOCIATES
E. Mutagenicity
Some studies have indicated that PCE itself is not a mutagen, however,the metabolites of PCE have been shown to be mutagenic in severalstudies (ATSDR, 1997a).
F. Teratogenicity/Reproductive Effects
There is no evidence that PCE is a human teratogen (ATSDR, 1997a).Results from inhalation studies in animals suggest that PCE is fetotoxicbut not teratogenic. There is some evidence that suggests PCE causesreproductive effects in women exposed to PCE in the workplace,however the evidence is not conclusive (ATSDR, 1997a).
G. Other Health Effects
Intense upper respiratory tract irritation occurred in humans exposedacutely by inhalation to high concentrations (>1,000 ppm) of PCE.Respiratory irritation (irritation of the nasal passages) was reported inworkers exposed to PCE vapors at levels of 232 to 385 ppm, and involunteers exposed to concentrations as low as 216 ppm for 45 minutes to2 hours (ATSDR, 1997a). Skin damage (burns) and intense ocularirritation have been reported in humans exposed to concentrations ofPCE liquid or vapors (>l,000ppm) high enough to cause anestheticeffects (ATSDR, 1997a). Very mild eye irritation was reported by foursubjects at exposure to 216 or 106 ppm (ATSDR, 1997a).
H. Epidemiological Evidence
Epidemiological studies of women occuparionally exposed to PCEsuggest that they have an increased risk of adverse reproductive effects(ATSDR, 1997a). Some epidemiological studies of dry cleaning workerssuggest a possible association between chronic PCE exposure andincreased cancer risk. The results of these studies are inconclusivebecause of the likelihood of concomitant exposure to petroleum solvents,the effects of other confounding factors, such as smoking and otherlife-style variables, and methodological limitations in choosing controlpopulation and maintaining complete follow-up. Occupational exposureto PCE and other solvents did not generally result in increased risk ofhematopoietic neoplasms (ATSDR, 1997a).
I. Toxicity Data
The chronic cancer slope factors are 0.54 (mg/kg-day)-1 and0.021 (mg/kg-day)-1 for the oral and inhalation routes, respectively. Thechronic oral reference dose is 0.01 mg/kg-day and the sub-chronic oralreference dose is 0.1 mg/kg-day. The chronic inhalation reference dose is0.01 mg/kg-day and the sub-chronic inhalation reference dose is0.0571 mg/kg-day. The sources of these dose-response values areprovided in Table 4.1, Table 4.2, Table 4.3, and Table 4.4 of the HHRA.
18925 (211APPLATTI 1-17 CONESTOGA-ROVERS & ASSOCIATES

1.7 TRICHLOROETHENE
1. Constituent Properties
A. Physical and Chemical Properties
Atomic Weight (g/mol): 131.40Boiling Point: 86.7°CMelting Point: -87.1°CSpecific Density: 1.465 (@ 20°C)Water Solubility (mg/L): 1,366 (@ 25°C)Vapor Pressure (mm Hg): 74 (@ 25°C)Henry's Law Constant (atm-m3/mol): 1.1E-02 (@ 25°C)Reference: ATSDR, 1997b. Toxicological Profile for Trichloroethylene.
B. Chemical Transformation
Air: The dominant transformation process for TCE in theatmosphere is reaction with hydroxyl radicals to form thefollowing degradation products: phosgene, dichloroacetylchloride, and formyl chloride (ATSDR, 1997b).
Water: Most TCE in surface waters can be expected to volatilize to theatmosphere. Microbial degradation products of TCE ingroundwater were reported to be dichloroethylene and vinylchloride (ATSDR, 1997b).
Soil: The majority of TCE in surficial soils will volatilize to theatmosphere. TCE is also highly mobile and is susceptible toleaching. In one study, methane utilizing bacteria degradedTCE to carbon dioxide, but not dichloroethylene or vinylchloride (ATSDR, 1997b). hi another study, TCE wastransformed 100 percent to vinyl chloride after 10 days inanaerobic, methanogenic conditions (ATSDR, 1997b).
2. Toxicological Properties
A. Metabolism
Inhaled doses of TCE are metabolized extensively in humans. Theprincipal metabolites of TCE are trichloroethanol,trichloroethanol-glucoronide ("urochloralic acid"), and trichloroacetic acid(ATSDR, 1997b).
B. Acute Toxicity
Cases of human deaths have been reported as a result of acute accidentalexposure in an occupational setting or by intentionally drinking orbreathing large amounts of TCE (i.e., suicides). No deaths due to dermalexposure have been reported. Death is not likely to result from exposure ^^
18925(21)APPLATTI 1-18 CONESTOGA-ROVERS & ASSOCIATES
to environmental levels or to levels of TCE found at hazardous waste sites(ATSDR, 1997b).
There are inadequate human data regarding the possible hepatic effects ofTCE. People who have been acutely exposed during surgical anesthesia,and most people exposed chronically in the workplace have not hadadverse liver effects. However, a few case reports do show minor effectson serum or urinary measures of liver function. People who have beenacutely exposed to high levels of TCE during surgical anesthesia, orchronically in the workplace, have not had renal toxicity. However,minor changes in urinary and serum indicators of renal function havebeen found in other workers (ATSDR, 1997b).
In the past, TCE was used as an anesthetic, so it obviously can cause acutecentral nervous system depression in humans (ATSDR, 1997b). Peoplehave become unconscious after acute exposure to very high levelsoccasionally present in the workplace. Other nonspecific neurologicaleffects from TCE exposure in the workplace have been reported, andinclude dizziness and drowsiness.
C. Subacute and Chronic Toxicity
Cardiovascular disease had not been reported in workers chronicallyexposed to TCE, although deaths following acute high-level exposures toTCE were attributed to cardiac arrhythmias (TCE exposure levels couldnot be established for these studies). It is not known whethercardiovascular effects could result from exposure to levels of TCE foundat or near hazardous waste sites (ATSDR, 1997b). There are also a fewcase reports of persons showing hepatorenal failure following exposureto very large amounts of TCE (TCE exposure levels were not reported). Ithas been suggested that liver damage may result from prolongedexposure but not acute exposures, and it is unknown whether exposure tolevels of TCE found in and around hazardous waste sites may result inhepatic injury (ATSDR, 1997b).
D. Carcinogenicity
Workers who have been exposed to TCE showed no higher incidence ofcancer than controls. The few studies that did show some associationwere complicated by exposures to other known human carcinogens.Animal studies have shown increases in cancers of various typesfollowing inhalation or oral exposure to TCE. The significance of thesestudies for humans cannot be determined due to other circumstances,(this statement is incorrect - USEPA withdrew its classification andtoxicity data, under further review).
E. Mutagenicity
The data regarding genotoxicity of TCE in humans are inconclusive(ATSDR, 1997b). The potential for gene mutations is not known, and themechanisms for carcinogenicity are not known (ATSDR, 1997b).
18925(21)APPLATTI 1-19 CONESTOGA-ROVERS & ASSOCIATES
F. Teratogenicity/Reproductive Effects
Limited evidence exists that would link TCE exposure to developmentaltoxicity in humans (ATSDR, 1997b). There is no evidence that exposureto TCE caused adverse reproductive effects in humans and the biologicalsignificance of positive animal effects is unknown (ATSDR, 1997b). Thus,TCE in air, water, or soil at hazardous waste sites is not expected toadversely affect human reproduction (ATSDR, 1997b).
G. Other Health Effects
Some humans experience dry throats and mild eye irritation followingacute inhalation exposure (200 ppm for 7 hours) to TCE. Personsworking with TCE for intermediate periods sometimes develop skinburns or rashes and dermatitis. TCE is not known to cause dermal effectswhen given via the oral route. It is possible that exposure to TCE in theair or soil at hazardous waste sites would be irritating to human eyes orskin (ATSDR, 1997b).
H. Epidemiological Evidence
No data available.
I. Toxicity Data
Due to the controversial nature of the U.S. EPA's cancer Slope Factor forTCE, two cancer slope factors were used in the HHRA, an oral CSF of0.4 (mg/kg-day)-1 and 0.011 (mg/kg-day)-1 from U.S. EPA 2001 and1987b, respectively. The inhalation cancer Slope factors are0.4 (mg/kg-day)-' and 0.006 (mg/kg-day)-i from U.S. EPA 2001 and1987b, respectively. The chronic oral reference doses are 0.0003 and0.006 mg/kg-day) from U.S. EPA 2001 and 1987b, respectively. Thechronic inhalation reference doses are reported at 0.01 mg/kg-day and0.006 mg/kg-day, respectively. The sources of these dose-response valuesare provided in Table 4.1, Table 4.2, Table 4.3, and Table 4.4 of the HHRA.
18925{21)APPLATTI I-20 CONESTOGA-ROVERS & ASSOCIATES
REFERENCES
ATSDR, 1990. Toxicological Profile for 1,1-Dichloroethane, Agency for Toxic Substancesand Disease Registry, December 1990.
ATSDR, 1994. Toxicological Profile for 1,1-Dichloroethylene, Agency for ToxicSubstances and Disease Registry, May 1994.
ATSDR, 1995. Toxicological Profile for 1,2-Dichloroethene, Agency for Toxic Substancesand Disease Registry, August 1995.
ATSDR, 1997a. Toxicological Profile for Tetrachloroethylene, Agency for ToxicSubstances and Disease Registry, September 1997.
ATSDR, 1997b. Toxicological Profile for Trichloroethylene, Agency for Toxic Substancesand Disease Registry, September 1997.
ATSDR, 2001. Toxicological Profile for 1,2-Dichloroethane, Agency for Toxic Substancesand Disease Registry, September 2001.
ATSDR, 2004. Toxicological Profile for 1,1,1-Trichloroethane, Agency for ToxicSubstances and Disease Registry, September 2004.
ATSDR, 2005. Minimum Risk Levels (MRLs), Agency for Toxic Substances and DiseaseRegistry, December 2005.
USEPA, 1987a. Toxicological Review of 1,1-Dichloroethylene, USEPA Integrated RiskInformation System Database (IRIS), March 1987.
USEPA, 1987b. Addendum to the Health Assessment Document to Trichloroethylene:Updated Carcinogenicity Assessment for Trichloroethylene. External ReviewDraft EPA/600/8-82/006FA. Washington: U.S. Environmental ProtectionAgency, Office of Health and Environmental Assessment.
USEPA, 1989. Toxicological Review of Trichloroethylene, USEPA Integrated RiskInformation System Database (IRIS), July 1989.
USEPA, 1991. Toxicological Review of 1,2-Dichloroethane, USEPA Integrated RiskInformation System Database (IRIS), January 1991.
USEPA, 1996. Toxicological Review of 1,1-Dichloroethane, USEPA Integrated RiskInformation System Database (IRIS), December 1996.
USEPA, 2001. Trichloroethene Health Risk Assessment: Synthesis and Characterization.
Office of Research and Development, EPA/600/P-01/002A, August 2001.
USEPA, 2002. Toxicological Review of 1,1-Dichloroethylene, USEPA Integrated RiskInformation System Database (IRIS), August 2002.
18925 (21) APPL ATTI 1-21 CONESTOGA-ROVERS & ASSOCIATES

APPENDIX M
SCREENING LEVEL ECOLOGICAL RISK ASSESSMENT
018925(21)
TABLE OF CONTENTS
1.0 INTRODUCTION M-l1.1 STRUCTURE OF THE ERA M-l1.2 RELATIONSHIP OF THE SLERA TO NEBRASKA GUIDANCE M-31.3 OBJECTIVES OF THE ERA M-3
2.0 SLERA STEP 1: SCREENING LEVEL PROBLEM FORMULATION M-42.1 CHARACTERIZATION OF THE SITE AND POTENTIAL
RECEPTORS M-42.2 FATE, TRANSPORT, AND ECOTOXICITY OF CHEMICALS OF
POTENTIAL CONCERN (COPCS) M-52.3 PRELIMINARY CONCEPTUAL SITE MODEL/ASSESSMENT
ENDPOINTS M-72.4 DATA USED IN THE ASSESSMENT FOR THE
CNH PROPERTY M-82.4.1 SOIL AND SEDIMENT DATA M-82.4.2 GROUNDWATER DATA M-92.5 DATA USED IN THE ASSESSMENT OUTSIDE THE
CNH PROPERTY M-92.5.1 SURFACE WATER AND SEDIMENT DATA M-92.5.2 GROUNDWATER DATA M-9
3.0 SLERA STEP 2: SCREENING LEVELEXPOSURE ESTIMATE AND RISK CALCULATION M-103.1 SCREENING OF COPCS M-103.2 ESVS FOR SCREENING M-103.2.1 RESULTS OF COPC SCREENING M-ll3.3 RISK CHARACTERIZATION M-123.4 LIMITATIONS/UNCERTAINTIES M-12
4.0 CONCLUSIONS/SCIENCE MANAGEMENT DECISION INPUT POINT M-13
5.0 REFERENCES M-14
18925 (21) CONESTOGA-ROVERS & ASSOCIATES
LIST OF FIGURES(Following Text)
FIGURE 2.1 LAND USE MAP
FIGURE 2.2 CONCEPTUAL SITE MODEL
LIST OF TABLES(Following Text)
TABLE 3.1 DATA SUMMARY AND SCREENING OF COPCS IN SOIL -CNH PROPERTY
TABLE 3.2 DATA SUMMARY AND SCREENING OF COPCS IN SURFACE WATERBRENTWOOD AND KENMARE LAKES
TABLE 3.3 DATA SUMMARY AND SCREENING OF COPCS IN SEDIMENT INRETENTION POND
TABLE 3.4 DATA SUMMARY AND SCREENING OF COPCs IN SEDIMENTS -BRENTWOOD AND KENMARE LAKES
TABLE 3.5 DATA SUMMARY AND SCREENING OF COPCs IN GROUNDWATER
18925(21) CONESTOGA-ROVERS & ASSOCIATES

1.0 INTRODUCTION
The Scope of Work (SOW) for the Remedial Investigation of the "Northern Study Area"requires the completion of an Ecological Risk Assessment (ERA). The Northern StudyArea is defined as: "(1) the CNH Property Study Area consisting of the areal extent ofchlorinated volatile organic compounds (CVOCs) associated with the CNH Property;and (2) the Parkview/Stolley Park Study Area consisting of the areal extent of CVOCs ator contiguous with the Parkview/Stolley Park Subdivision, but excluding that portion ofthe Southern Plume located south of the parcels abutting Pioneer Boulevard" (AOC,Section IV, Paragraph 1).
According to the SOW, the ERA is required to assess the "...ecological risks which maybe posed by such CVOCs." CVOC refers to the chlorinated volatile organic compoundsidentified by United States Environmental Protection Agency (U.S. EPA) and known tooccur at the Site, notably chlorinated alkenes and chlorinated alkanes. For thisecological risk assessment, the constituents of potential concern (COPCs) are theCVOCs. Further, the SOW states that the ERA shall address the following:
• definition of objectives;
• characterization of site and potential receptors;
• selection of chemicals, species and end points for risk evaluation;
• exposure assessment;
• toxiciry assessment;
• risk characterization; and
• limitations/uncertainties.
The following assessment fulfils these requirements.
1.1 STRUCTURE OF THE ERA
In general, this risk assessment follows EPA guidance (EPA, 1997). As described in thatguidance, the Ecological Risk Assessment process can involve up to eight steps. Thefirst two steps, described below, comprise the screening level ecological risk assessment(SLERA).
Step 1. Screening-level problem formulation and ecological effects evaluation: Thisfirst step consists of a basic description of the site and its habitats and known hazards
18925(21) M-1 CONESTOGA-ROVERS & ASSOCIATES
and their likely modes of ecotoxicity. This information is then analyzed to determinewhether there are complete or potentially complete exposure pathways from knownsources. This information is combined into a preliminary Conceptual Site Model.
Step 2. Screening-level exposure estimate and risk calculation: The second step of theecological risk screening includes the exposure estimate and risk calculation. Risk isestimated based on maximum exposure concentrations compared to ecologicalscreening values from Step 1 and screening quotients of constituents of concern arepresented. A screening quotient less than 1 indicates the CVOC alone is unlikely tocause adverse ecological effects.
After completion of the SLERA, the results are presented to the risk managers. TheSLERA can produce three outcomes:
1. information is adequate to determine that ecological risks are negligible;
2. information is inadequate to make a decision; or
3. information indicates a potential adverse ecological effect exists.
If either of the latter two conclusions is reached, the risk assessment proceeds tosubsequent steps in the 8-step process. Listed below are the latter 6 steps. Together,they comprise the Baseline Ecological Risk Assessment (BERA).
Step 3. Baseline ecological risk assessment (BERA) problem formulation.
Step 4. Study design and data quality objective process.
Step 5. Field verification of sampling design.
Step 6. Site investigation and analysis phase.
Step 7. Risk characterization.
Step 8. Risk management.
The following analysis will be limited to the SLERA. This SLERA will also follow otherappropriate guidance, including:
• Screening Level Ecological Risk Assessment Protocol for Hazardous WasteCombustion Facilities, EPA/530-D-99-001A, August 1999.
• Risk Assessment Guidance for Superfund, Volume II: Environmental EvaluationManual, Interim Final, EPA/540/1-89/001, March 1989.
16925(21) M-2 CONESTOGA-ROVERS & ASSOCIATES

• Framework for Conducting Ecological Risk Assessment, EPA/630/R-92/001,February 1992.
• Ecological Risk Assessment Guidance for Superfund: Process for Designing andConducting Ecological Risk Assessment, EPA/540/R-97/006, June 1997.
• EPA Region I Supplemental Risk Assessment Guidance for the Superfund Program,Draft Final, EPA 901/5-89-001, June 1989.
1.2 RELATIONSHIP OF THE SLERA TO NEBRASKA GUIDANCE
The State of Nebraska has developed guidance for conducting ecological riskassessments (NDEQ, 2005). According to this guidance, the ERA process essentiallyconsists of two steps. The first step determines whether the site contains either on site oradjacent habitat, including wetlands, or long-lived persistent bioaccumulative chemicals(e.g., DDT, dioxins/furans, PCF3). If so, "the participant should conduct an ecologicalrisk assessment at the site in accordance with EPA's Ecological Risk AssessmentGuidance for Superfund (EPA, 1997b)." This first step is similar to the first step of theEPA eight step process, and subsequent steps are identical to the EPA method.Consequently, this SLERA based on EPA guidance satisfies the intent of the Nebraskaguidance, although the exact structure, placement of information, and terminology maydiffer slightly.
1.3 OBJECTIVES OF THE ERA
In general, ecological risk assessments are intended to provide risk managers withinformation sufficient to determine whether remedial actions are necessary to protectthe ecological receptors from toxic chemicals or other hazards at a site. Specifically, theobjective of this SLERA is to determine whether the post-remedial concentrations ofCVOCs in soil, groundwater, sediments, and surface water pose risk to ecologicalreceptors.
18925(21) M-3 CONESTOGA-ROVERS & ASSOCIATES

2.0 SLERA STEP 1; SCREENING LEVEL PROBLEM FORMULATION
2.1 CHARACTERIZATION OF THE SITE AND POTENTIALRECEPTORS
Land use within Northern Study Area boundary (as defined by the AOC) is divided intocommercial/industrial, agricultural, and residential categories. Commercial/industriallots include the CNH property to the west and several properties immediately east ofState Highway 281 (HWY 281). Agricultural lots include a cultivated field on the eastand south of the CNH property. To the east across HWY 281, the area is initiallycommercial/industrial and then primarily residential, including the Brentwood,Parkview, and Stolley Park subdivisions.
The land use in adjacent areas is similar and consists of commercial/industrial,agricultural, and residential. Adjoining properties include commercial/industrial lotsnorth of the CNH property and west of Webb Road. Beyond the commercial/industrialproperties are residential lots north and east of the Brentwood subdivision. A cultivatedfield is immediately south of the CNH property and west of HWY 281 and residentiallots continue to the south of the Brentwood, Parkview, and Stolley Park subdivisions.Properties to the west include agricultural land adjacent to the CNH property followedby commercial/industrial properties.
Figure 2.1 provides a layout of the land use categories as defined above. Except forsmall areas of brushland and undeveloped areas, there is little to no terrestrial habitatother than managed lawns and agricultural fields. The latter areas are not of highpriority for ecological risk assessment (EPA, 1997, 1998), nor is there any likelihood thatthey serve as habitat for endangered species. They could serve as temporary foragingareas for migrant wildlife and for species, such as robins, sparrows, rabbits, andsquirrels, which occur in human landscapes.
The site also contains some small ponds or lakes. The Duck Pond is a small detentionpond, less than 2 acres in size located on the CNH property. In addition, there are twoformer quarries in the residential areas. Now filled with water, they have been namedBrentwood Gravel Pit Lake and Kenmare Gravel Pit Lake. Brentwood Gravel Pit Lake isapproximately 13 acres in size, while Kenmare is approximately 3 acres. For purposes ofthis assessment, it was assumed that these areas have naturalized to the extent that theycurrently provide habitat for fish and other aquatic life. It is noted that the NorthernStudy Area is located within the Platte River Valley, which is a major migratory birdpathway. This is discussed further in Section 2.3.
18925(21) M-4 CONESTOGA-ROVERS & ASSOCIATES
2.2 FATE, TRANSPORT, AND ECOTOXICITY OF CHEMICALS OFPOTENTIAL CONCERN (COPCs)
According to guidance (EPA, 1992; EPA, 1997), COPCs should be selected based on anunderstanding of what chemicals were used and potentially released at a site. Based onthe AOC, chlorinated alkanes and alkenes are the COPCs in the Northern Study Area.These COPCs include 1,1-dichloroethane (1,1-DCA), 1,1,1-trichloroethane (1,1,1-TCA),1,2-dichloroethane (1,2-DCA), trichloroethene (TCE), tetrachloroethene (PCE),1,1-dichloroethene (1,1-DCE), and cis-l,2-dichloroethylene (cis-l,2-DCE).
In general, the CVOCs are soluble in water at the concentrations encountered in theNorthern Study Area. However, persistence of VOCs in surface water and aquaticsediments tends to be short because they are quite volatile, reasonably soluble, and notoverly hydrophobic. Persistence of these compounds in surficial soils is also likely to beshort, due to their propensity to volatilize to the atmosphere and to leach into thegroundwater. Generally, the chlorinated VOCs will readily biodegrade under anaerobicconditions. These conditions sometimes occur in deeper, anoxic aquifers and in deepersediments rich in organic matter.
Given their short persistence in surface soils, the primary exposure route to ecologicalreceptors from these chemicals is via groundwater discharge to nearby surface waters.Once in surface waters, the VOCs can pose exposure to aquatic organisms and terrestrialanimals using the water for drinking could face exposure, although persistence ofCVOCs in surface waters is generally very short term. These chemicals also do notbioaccumulate readily in aquatic biota; thus, they do not generally pose risks, viabioaccumulation and food chain exposure, to either herbivores or predators in eitherterrestrial or aquatic habitats.
1,1-DCA in surface water is expected to be lost to the atmosphere through volatilizationbefore undergoing any significant chemical or biological degradation. Gossett et al.(1983) analyzed the tissues of several species of aquatic organisms for 1,1-DCA near thedischarge of the Los Angeles County wastewater treatment plant. The concentration of1,1-DCA in the effluent was 3.5 parts per billion (ppb), but no 1,1-DCA was detected inanimal tissues (detection limit of 0.3 to 0.5 ppb). Similarly, EPA (1985) estimated thebioconcenrration factor of only 6.6 L/kg, also suggesting that bioaccumulation will beminimal. Other chlorinated ethanes also have a low potential for bioconcenrration. Inthe bluegill, bioconcenrration factors were 2 L/kg and 9 L/kg for 1,2-dichloroethane and1,1,1-trichloroethane, respectively (Barrows et al., 1980).
18925(21) M-5 CONESTOGA-ROVERS & ASSOCIATES
The compound 1,1,1-TCA is long-lived in the atmosphere, with a photooxidativehalf-life of more than 6 years in the troposphere. Consequently, 12 to 25 percent of1,1,1-TCA in the troposphere will reach the stratosphere (McConnell and Schiff, 1978;USEPA, 1982). Chlorine atoms released during the photolysis of 1,1,1-TCA in thestratosphere can attack and deplete ozone. Its presence in upland waters is believed tobe due to long-range transport (Pearson and McConnell, 1975).
The atmospheric half-life of 1,2-DCA was reported to be 234 hours (Radding et al., 1977).The U.S. EPA (1975) and Howard and Evenson (1976) estimated that 1,2-DCA has anatmospheric lifetime of 3 to 4 and 1.7 months, respectively. Despite its relatively shortresidence time in the atmosphere, Pearson and McConnell (1975) suggested that1,2-DCA has the potential for long-range transport, which accounts for its presence inupland waters.
No toxic effects of TCE on terrestrial plants were reported in the sources reviewed. Theoral LDso for dogs was reported at 5.86 grams/kg of body weight. An inhalation LCsowas reported for rats at 8,000 ppm (4 hours). In the aquatic environment, aconcentration of 55 ppm stupefied fish within 10 minutes. Ninety-six-hour LCso valuesfor fathead minnows ranged between 40.7 ppm and 66.8 ppm (Verchueren, 1983). Aconcentration of 660 ppm TCE was lethal to Daphnia in 40 hours, but 99 ppm had noeffect (McKee & Wolf, 1963).
No data on the effects of PCE to aquatic plants was reported in the literature sourcesreviewed. In one study reviewed, the effects of PCE on the growth of lettuce in soil hadECso values ranging from 3.2 to 8 ppm. The mean 96-hour LCso for fathead minnowsand rainbow trout ranged from 13.4 to 23.8 mg/L and 4.99 to 5.84 mg/L, respectively(CCME, 1999). During one acute toxicity test, it was observed that a number ofsub-lethal effects of PCE were occurring to fathead minnows prior to expiring. Affectedfish lost schooling behavior, swam near the surface, were hypoacrive, had darkenedcoloration, had increased respiratory rate, and lost equilibrium (CCME, 1999). The48-hour LCso for the invertebrate Daphnia magna, ranged from 7.5 to 8.5 mg/L. Daphniamagna were most sensitive to PCE during chronic toxicity tests. Growth andreproduction were reduced 7.6 percent and 62 percent, respectively, with alowest-observed-effect concentration of 1.11 mg/L (CCME, 1999).
Animal studies of oral exposure suggest that anesthesia and lethality would be likely ifhigh concentrations of PCE were swallowed. There are no reports of fatalities in animalsexposed solely by the dermal route (ATSDR, 1997). PCE has been shown to causehepatotoxic effects in animals by inhalation and oral routes of exposure, with hepaticlesions induced in experimental animals by inhalation exposure to PCE. Mice appear to
18925(21) • M-6 CONESTOGA-ROVERS & ASSOCIATES

be the most sensitive species to this effect. Hepatocellular vacuolization occurred after asingle 4-hour exposure of mice to 200 ppm or greater concentrations of PCE. This lesionwas also reported in male mice exposed to 875 or 1,750 ppm PCE for 14 days and infemales exposed to the highest dose. Vacuolization was not present at 425 ppm. Anumber of lesions reported in rats after acute exposure to PCE were relativelynonspecific (ATSDR, 1997).
The chlorinated ethenes including 1,1-DCE, TCE, and PCE do not readily bioaccumulatein aquatic organisms and are also readily metabolized. Like the chlorinated alkanes,they have little potential to pose risk via the food chain.
2.3 PRELIMINARY CONCEPTUAL SITE MODEL/ASSESSMENTENDFOINTS
The site contains functional aquatic habitat but little functional terrestrial habitat. Thus,the SLERA will assume that there is potential exposure to chemicals in surface waterand sediments. Ecological receptors are not exposed to groundwater except when thatgroundwater is discharged to surface waters. Although the hydraulic connectionbetween groundwater and the gravel pit lakes within the study area has not beenunequivocally established, it was conservatively assumed, for purposes of this ERA, thatthe groundwater within the site would potentially discharge to some nearby surfacewater. Thus, the exposure pathway from groundwater was also considered complete,albeit only after dilution and fate processes. The preliminary conceptual site model ispresented on Figure 2.2.
On the other hand, potential exposure to COPCs in surface soils is likely minimal. Thearea contains little functional habitat, and the CVOCs are unlikely to persist in surfacesoils. In general, ecological receptors are exposed to chemicals only in surface soils, byconvention the upper 1 foot below ground surface (ft bgs). That is, exposure fromchemicals in deep soil to ecological receptors is assumed to be functionally incomplete1.For both reasons, the exposure pathway from surface soil to ecological receptors wasconsidered functionally incomplete (Figure 2.2).
Assessment endpoints are the specific ecological values that should be protected fromsite-related chemicals. Assessment endpoints should be selected based on several
Some burrowing organisms such as woodchucks and prairie dogs will be exposed to chemicals indeeper soils, primarily associated with grooming and cleaning of their fur. However, theincidental soil exposure from this pathway is minor compared to that associated with Lngestion ofchemicals in food.
18925(21) M-7 CONESTOGA-ROVERS & ASSOCIATES
factors: economic importance, importance to society, ecological importance, andsensitivity to COPCs (EPA, 1997). Based on the available habitat, the SLERA will focuson potential risks to fish and other aquatic life. These are the habits and species ofprimary societal concern. The following are appropriate assessment endpoints for thissite.
• Health of the benthic invertebrate community inhabiting the sediments of aquatichabitats.
• Health of the water column community of on-site aquatic habitats.
Given the low quality of the terrestrial habitat and the low persistence of VOCs insurficial soils, potential risks to terrestrial species and habitats are of minor concern.Nonetheless, potential risks to terrestrial biota, will be considered in the SLERA toprovide additional information.
As indicated in Section 2.1, the Site is located within the Platte River Valley, which is amajor migratory bird pathway. Aquatic birds using this flyway include the sandhillcranes, the snow geese, mallards, and Canada geese. The CVOCs do not persist insurface water or sediments, nor do they bioaccumulate readily in aquatic biota. Thus,the exposure pathway from site-related chemicals to migratory or even residentwaterfowl is functionally incomplete. A migratory waterbird's exposure to site-relatedchemicals is further limited by the short time any one species spends in the area whilemigrating north and south.
2.4 DATA USED IN THE ASSESSMENT FOR THECNH PROPERTY
2.4.1 SOIL AND SEDIMENT DATA
Soil and sediment conditions have been characterized as part of previous siteinvestigations, as discussed in Section 4.4.1 of the RI report. Soil data were developedduring the interim removal action for the Burn and Burial areas. In total, approximately300 on-site soil samples were collected and analyzed for VOCs. The soil and sedimentdata for the site-specific COPCs are provided in Tables 2, 3, and 4 of Appendix H. Thetables include data from the various investigations and the post-excavation data fromthe Removal Action, but exclude data for sample locations that were excavated andremoved during the Removal Action. The sediment samples were collected from sixlocations within the Duck Pond.
16925(21} M-8 CONESTOGA-ROVERS & ASSOCIATES

2.4.2 GROUNDWATER DATA
Groundwater conditions have been characterized using geoprobe groundwater
sampling and monitoring well samples collected on the CNH property as discussed in
the RI report.
2.5 DATA USED IN THE ASSESSMENT OUTSIDE THECNH PROPERTY
2.5.1 SURFACE WATER AND SEDIMENT DATA
Sediment and surface water samples were collected at five locations within Brentwood
Gravel Pit Lake and four locations within Kenmare Gravel Pit Lake as discussed in
Section 4.4.2 of the RI report. It should be noted that COPC concentrations ingroundwater samples collected near the existing surface water features are below ESVs,and therefore, do not pose an ecological risk.
2.5.2 GROUNDWATER DATA
Groundwater conditions have been characterized using geoprobe groundwater
sampling locations and monitoring wells located within the Parkview and Stolley Park
subdivisions as discussed in the RI report.
18925(21) M-9 CONESTOGA-ROVERS & ASSOCIATES
3.0 SLERA STEP 2: SCREENING LEVELEXPOSURE ESTIMATE AND RISK CALCULATION
In the second step of the SLERA, COPCs and complete exposure pathways identified inStep 1 are screened in terms of their potential to cause ecological risk.
3.1 SCREENING OF CQPCs
In the analyses that follow, COPCs were screened for potential ecological risk toassessment endpoints using the quotient method. Specifically, screening quotients (SQ)are estimated as:
FFCSQ =
ESV
Where EEC is the estimated exposure concentration and ESV is the ecological screeningvalue, also a concentration. In accordance with EPA guidance, the EEC in the SLERAscreening is based on the maximum concentration of each chemical detected in eachmedium. An SQ less than 1.0 indicates that the COPC alone is unlikely to cause adverseecological effects. Risks from these chemicals can be dismissed as unlikely. Risks fromchemicals with SQs >1.0 cannot be dismissed. These chemicals are retained in the riskassessment for further analysis.
Based on the Assessment Endpoints identified previously, the risk screening willaddress potential risks to the following groups of animals from the following media.
• Health of the water column community of on-site aquatic habitats.
• Health of the benthic invertebrate community inhabiting the aquatic sediments.
The exposure potential for terrestrial receptors is greatly limited by the dearth of goodterrestrial habitat and the general absence and short persistence of VOCs in surface soils.For the sake of completeness, however, COPC concentrations in soil will also bescreened against ESVs.
3.2 ESVs FOR SCREENING
As recommended in Nebraska guidance, the Nebraska water quality criteria were usedas a first choice to screen VOCs in surface water and groundwater. The State hasproduced acute criteria for protection of aquatic life for all of the COPCs except for
18925(21) M-10 CONESTOGA-ROVERS & ASSOCIATES
1,1-DCA. The State's acute criterion for 1,2-DCA was used as a surrogate for 1,1-DCA.The state has also produced chronic water quality criteria, but these criteria are actuallyhuman health criteria. Thus, surrogate Nebraska criteria were produced with a 10-foldacute to chronic conversion factor applied to the acute criteria. To provide additionalinformation, water column screening values from U.S. EPA Region V were selected. TheESVs from Region V are primarily Tier II criteria. Tier II criteria include large safetyfactors to account for limited data, and therefore, tend to be very conservative.
Application of surface water criteria to groundwater samples is also very conservative.There will often be appreciable reductions in COPC concentrations due to ongoingattenuation processes before and after the groundwater discharges to the nearest surfacewater body.
For screening COPC concentrations in both soil and sediments, ESVs from Region Vwere used. The sediment ESVs are protective of aquatic benthos from direct toxiciry,and are based on the equilibrium partitioning method and an assumption of 1 percentorganic carbon. These ESVs do not consider risks, via bioaccumulation pathways, topredators of the benthos. However, as discussed above, food chain exposure to CVOCsin aquatic systems is likely to be minimal. In contrast, the Region V ESVs for soilconsider toxicity by both direct toxicity to soil invertebrates and plants, as well as toworm predators after bioaccumulation.
3.2.1 RESULTS OF COFC SCREENING
A summary of COPC data, along with a risk screening are presented in Tables 3.1through 3.5 for sediment, soil, surface water, and groundwater. As shown in Tables 3.1through 3.4, concentrations of COPCs are below respective ESVs in sediments, soil, andsurface water, and the COPCs were infrequently detected in all of these media.Maximum concentrations of COPCs in groundwater did not exceed Nebraska's acutecriteria or the chronic criteria derived from Nebraska's criteria (Table 3.5). On the otherhand, the maximum groundwater concentrations of 1,1,1-TCA and 1,1-DCA weregreater than the more conservative Region V ESV for surface water. It is noted that thisassessment is very conservative since the maximum concentrations in groundwater havebeen compared to the very conservative Region V ESVs for surface water. The surfacewater samples are a much more reliable indicator of the potential effects of discharginggroundwater on surface water species, and neither of these compounds was detected insurface water except for one detection of 1,1-DCA, which was almost 200 times lowerthan the conservative Region V ESV. Thus, risks from these compounds to ecologicalreceptors can be dismissed as unlikely.
18925(21) M-11 CONESTOGA-ROVERS & ASSOCIATES
3.3 RISK CHARACTERIZATION
Residual chlorinated VOCs remaining in soil, sediments, surface water, andgroundwater pose no risk to ecological receptors. The compounds were effectively notdetected in sediments and surface water, and post-cleanup levels in soils were also verylow, orders of magnitude below ecological screening levels. Maximum concentrationsof two chemicals, 1,1,1-TCA and 1,1-DCA exceeded the most conservative surface waterESVs. However, the maximum groundwater concentrations of these compounds didnot exceed more reliable surface water ESVs based on Nebraska surface water qualitystandards. In addition, the VOCs are expected to volatilize rapidly once discharged tosurface water, so their surface water concentrations will be much lower than maximumgroundwater concentrations. Consistent with this prediction, these compounds wereeffectively not detected in surface waters. Thus, ecological risks from these compoundsat this site can be dismissed as unlikely with available information.
3.4 LIMITATIONS/UNCERTAINTIES
In general, there is little uncertainty about the results of this risk assessment. By theirnature, the VOCs have little potential to cause ecological risk. They are generally notvery toxic to ecological receptors, they are not persistent in media to which ecologicalreceptors are exposed (e.g., surface soils, surface waters, and sediments), and they donot readily bioaccumulate via food chains. Therefore, VOCs rarely pose ecological riskat contaminated sites even before remediation.
The intrinsically low potential of VOCs to pose ecological risk was reduced considerably
at this site by the stringent human health clean-up levels that were achieved by theRemoval Action. These clean-up levels were based on potential human health effects.The clean-up levels used for the soil at the CNH property are much more stringent thannecessary to protect ecological receptors. Thus, this SLERA's conclusion of nosignificant potential for ecological risk is consistent with, and predictable from, anunderstanding of the COPCs fate and toxicity characteristics.
As required by the AOC, the risk assessment considered risks from the site-specificCVOCs, so there is some uncertainty about potential risks from other compounds.However, based on the results of extensive post-excavation sampling from the RemovalAction, this uncertainty is likely not significant. These results indicate that the residualconcentrations of organic chemicals in soil are mostly non-detect. Potential uncertaintydue to the sediment sampling method is discussed in Section 2.2.3 of the RI report.
18925(21) M-12 CONESTOGA-ROVERS & ASSOCIATES
4.0 CONCLUSIONS/SCIENCE MANAGEMENT DECISION INPUT POINT
As described previously, a SLERA can produce three possible conclusions:
1. information is adequate to determine that ecological risks are negligible;
2. information is inadequate to make a decision; or
3. information indicates a potential adverse ecological effect exists.
The preceding analyses indicate that conclusion #1 is appropriate. Based on the natureof on-site habitat and the fate/transport characteristics of the COPCs, this SLERAfocused on assessing risks to aquatic organisms. Based on available information, therisks from COPCs in surface water and sediment to aquatic biota can be dismissed asunlikely. These risks were judged to be insignificant even under the most conservativeexposure scenarios in which the maximum concentrations were compared to mostconservative ESVs. Potential ecological risks from contaminated groundwaterdischarging to surface waters are also dismissed as unlikely. These risks were dismissedunder more realistic but still conservative assumptions concerning exposure andtoxicity.
The Northern Study Area has little functional terrestrial habitat, and VOCs are notexpected to persist in the surficial soils to which ecological receptors are most exposed.Assessment of risks to terrestrial biota from COPCs in soil was, therefore, a low priorityfor the SLERA. Nonetheless, for completeness, the SLERA screened residual COPCconcentrations in soil. Potential risks from the COPC in soils were also found to beunlikely.
These conclusions of no significant potential for risk are supported by a basicunderstanding of the fate, transport, and ecotoxiciry of chlorinated VOCs. Due to their
generally low ecotoxiciry and short persistence in most environmental media, VOCsrarely cause ecological risk. Thus, there is little uncertainty concerning the conclusionthat CVOCs at this site pose no ecological risk.
In summary, the available information is sufficient to conclude that ecological risks arenegligible. Further risk assessment activities are neither warranted nor recommended.
18925(21) • M-13 CONESTOGA-ROVERS & ASSOCIATES
5.0 REFERENCES
ATSDR, 1997. Agency for Toxic Substances and Disease Registry (ATSDR), 1997,
Toxicological Profile for Trichloroethylene, Section 4. U.S. Department of Health
and Human Services, Atlanta, GA p. 185-189.
ATSDR, 1997. Agency for Toxic Substances and Disease Registry (ATSDR), 1997,
Toxicological Profile for Tetrachloroethylene. U.S. Department of Health and
Human Services, Atlanta, GA p. 185-189.
Barrows, M.E., S.R. Petrocelli, K.J. Macek, and J.J. Carroll, 1980. Bioconcentrarion andelimination of selected water pollutants by bluegill sunfish (Lepomis macrochirus).
In: Haque R ed. dynamics, exposure and hazard assessment of toxic chemicals.
Ann Arbor. Michigan, Ann Arbor Science Publishers, chapter 24, pp 379-392.
CCME, 1999. Fact sheet for chlorinated ethenes (1,1,2,2-tetrachloroethene). Canadian
Water Quality Guidelines for the Protection of Aquatic Life. Canadian Council
of Ministers of the Environment.
CRA, April 2003. Supplemental Investigation, Conestoga-Rovers & Associates, April 2003.
Doherty, R.E., 2000. A History of the Production and Use of Carbon Tetrachloride,Terrachloroethylene, Trichloroethylene and 1,1,1-Trichloroethane in the United
States: Part 2 - Trichloroethylene and 1,1,1-Trichloroethane, Journal ofEnvironmental Forensics, v. 1, no. 2, p. 83-93.
EPA Region V, 2000. Ecological Data Quality Levels. Available on the Internet atwww.epa.gov/Region5/rcraca/edql.htm
EPA, 1975. Report on the problem of halogenated air pollutants and stratosphericozone. EPA-600/9-75-008, USEPA, Office of Research and Development,
Research Triangle Park, NC.
EPA, 1997. Ecological Risk Assessment Guidance for Superfund: Process for Designing andConducting Risk Assessments, EPA/540/R-97/006, EPA Environmental ResponseTeam, Edison, New Jersey.
EPA, 1989. Region I Supplemental Risk Assessment Guidance for the SuperfundProgram, Draft Final, EPA 901/5-89-001, June 1989.
EPA, 1989. Risk Assessment Guidance for Superfund, Volume II: Environmental
Evaluation Manual, Interim Final, EPA/540/1-89/001, March 1989
EPA, 1992. Framework for Conducting Ecological Risk Assessment,
EPA/630/R-92/001, February 1992.
18925(21) M-14 CONESTOGA-ROVERS & ASSOCIATES
EPA, 1998. Guidelines for Ecological Risk Assessment. Risk Assessment Forum,USEPA, Washington, DC, April 1998.
EPA, 1999. Screening Level Ecological Risk Assessment Protocol for Hazardous WasteCombustion Facilities, EPA/530-D-99-001A, August 1999.
EPA, 1982. Health Assessment Document for 1,1,1-Trichloroethane (MethylChloroform). Revised Draft. EPA/600/8-82-003. Environmental Criteria andAssessment Office, Office of Health and Environmental Assessment, Office ofResearch and Development, Cincinnati, OH, 1982.
EPA, 1985. Health and Environmental Effects Profile for Dichloroethanes. Prepared bythe Office of Health and Environmental Assessment, Environmental Criteria andAssessment Office, Cincinnati, OH for the Office of Solid Waste and EmergencyResponse, Washington, DC.
Gossett, RW, Brown, DA, Young, DR, 1983. Predicting the bioaccumulation of organiccompounds.
Howard, C.J. and K.M. Evenson. 1976. Rate constants for the reactions of -OH withethane and some halogen substituted ethanes at 296°K. J. Chem. Phys.64(11):4303-4306.
McConnell, J.C., and H.I. Schiff, 1978. Methyl chloroform: Impact on stratosphericozone. Science, 199: 174-177.
McKee,J.E., and H.W. Wolf, 1963 (Reprint 1978). California State Water ResourcesControl Board, Water Quality Criteria.
NDEQ, 2000. Title 117 - Chapter 4 - Standards For Water Quality, Nebraska Departmentof Environmental Quality.
NDEQ, 2005. Protocol for VCP remediation goal lookup tables: Nebraska voluntarycleanup program. Nebraska Department of Environmental Quality, May 2005.Available athttp://www.deq.state.ne.us/Publica.nsf/23e5e39594c064ee852564ae004fa010/d243c2b56e34ea8486256f2700698997/$FILE/RG%20Protocol.pdf.
Pearson, C.R. and G. McConnell, G. 1975. Chlorinated Cl and C2 hydrocarbons in themarine environment. Proc. R. Soc. Lond., B189: 305-332.
Radding, S.B., D.H. Liu, M.L. Johnson, and T. Mill. 1977. Review of the environmentalfate of selected chemicals. EPA-560/5-77-003, U.S. Environmental ProtectionAgency, Office of Toxic Substances, Washington, DC.
Verschueren, K., 1983. Handbook of Environmental Data on Organic Chemicals;Second Edition, Van Nostrand Reinhold, New York.
18925(21) M-15 . COIMESTOGA-ROVERS & ASSOCIATES
Related Documents