,)11 Report No: Meeting Date 17-214 August 9, 2017 Alameda-Contra Costa Transit District STAFF RE PORT ACTransit Board of Directors Michael A. Hursh, General Manager Quarterly Operations Performance Report TO: FROM: SUBJECT BRIEFING ITEM RECOMMENDED ACTION(S) Consider receiving the Quarterly Operations Performance Report for AC Transit fixed route se rv ices . BACKGROUND/RATIONALE The Quarterly Operations Performance Report provides information on programs within the District designed to improve the performance, reliability, cleanliness, and safety of the District's bus service.To continually recognizeoutstanding employees who are an important part of achieving the division goals, the following is a list of employees who were recognized as Employees of the Month during the quarter. Transportation Division 2: Emeryville Division 3: Richmond Division 4: East Oakland Division 6: Hayward Apr-17 Sheila King Juventino Sa nchez Kenisha Sparrow Tejinder Bra r May-17 Maurice Amie Alisia Smith Steven White Regina Ward Jun-17 La'Vera Monique Wilson Ravinder Singh SERVICE OPERATED PERCENTAGE The Percentage of Service Operated improved from a system wide average of 99.57 percent in Q3 of FY2016/17 to 99.67 percent in Q4 of FY 2016/17. The Percentageof Service Operated exceeded the goalof 99.5 percent in Apriland May of the quarter. Transportation has focused on limiting any cancellations or missed trips. Superintendents are responsible for reporting any service failure issues in the district. Division 2: Emeryville Division 3: Richmond 1 of 8

Welcome message from author
This document is posted to help you gain knowledge. Please leave a comment to let me know what you think about it! Share it to your friends and learn new things together.
Transcript

,)11 Report No:Meeting Date
17-214
August 9, 2017
Alameda-Contra Costa Transit District
STAFF RE PORTAC Transit Board of Directors
Michael A. Hursh, General Manager
Quarterly Operations Performance Report
TO:
FROM:
SUBJECT
BRIEFING ITEM
RECOMMENDED ACTION(S)
Consider receiving the Quarterly Operations Performance Report for AC Transit fixed routese rv ices .
BACKGROUND/RATIONALE
The Quarterly Operations Performance Report provides information on programs within theDistrict designed to improve the performance, reliability, cleanliness, and safety of the District'sbus service. To continually recognize outstanding employees who are an important part ofachieving the division goals, the following is a list of employees who were recognized asEmployees of the Month during the quarter.
TransportationDivision 2: EmeryvilleDivision 3: RichmondDivision 4: East Oakland
Division 6: Hayward
Apr-17Sheila KingJuventino Sa nchez
Kenisha Sparrow
Tejinder Bra r
May-17Maurice AmieAlisia SmithSteven White
Regina Ward
Jun-17
La'Vera Monique Wilson
Ravinder Singh
SERVICE OPERATED PERCENTAGE
The Percentage of Service Operated improved from a system wide average of 99.57 percent inQ3 of FY 2016/17 to 99.67 percent in Q4 of FY 2016/17. The Percentage of Service Operatedexceeded the goalof 99.5 percent in Apriland May of the quarter. Transportation has focusedon limiting any cancellations or missed trips. Superintendents are responsible for reporting anyservice failure issues in the district.
Division 2: EmeryvilleDivision 3: Richmond
1 of 8

Report No. 17-214
Page 2 of 8
--+- Syste rnwide AverageSystem-Wide Percentage of Service Operated
(9stem\vide Average)
g>
8
98.5%
98.0%
97.5%
97.0%
«.;% I96.0%
95.5%
..o. US
g
lnR0
SR
\O \D l\nR R
0
U
Rg
H
g
S80
ON-TIME PERFORMANCE
The On-Time Performance improved from a system wide average of 69.79 percent in Q3 ofFY2016/17 to 70.74 percent in Q4 of FY20].6/].7. The On Time Performance was below theDistrict's goal of 72.00 percent, but nearly achieved this goal in April with an On-TimePerformance rate of 71.49 percent. The On-Time Performance has shown gradual improvementwith the implementation ofimproved running and relief times for the District's operators.
The Planning and Scheduling Department is continuing to evaluate the bus lines with the lowest
on-time performance to determine the lines that may need schedule adjustments to improveon-time performance. The On-Time Performance Taskforce is also continuing to reviewproblem areas on major routes and assigning supervisors to monitor and take corrective actionsto improve on-time performance.
-- +- Syste mwide AverageSystem wide On-Time Performance
(9stemwide Average)
q' e'RR g
Rg
MILES BETWEEN ROAD CALLS
Miles Between Chargeable Road Calls, (MBCRC), worsened from a system-wide average of5,491 during Q3 of FY 2016/].7 to 5,172 in Q4 of FY 2016/].7. Miles Between Chargeable RoadCalls were at 4,706 in Apri], improved in May to 5,35]. and then exceeded the District's goals inJune by reaching 5,460.
2 of 8

Report No. 17-214Page 3 of 8
System-Wide Chargeable Miles Between Road Calls
(9stemwide Average): Systemwide8,000
q' e '
R$
OPERATOR UNAVAILABILITY
Total Operator Unavailability improved from 24.87 percent in Q3 of FY 2016/].7 to 23.52 percent inQ4 of FY2016/].7. The Percentage of Total Operator Unavailability is comprised of bothunscheduled unavailability and scheduled time off for vacations, floating holidays, birthdayholidays, and other scheduled time off. The Scheduled Operator Unavailability Rate improved from8.86 percent in Q3 of FY 2016/17 to 7.56 percent during Q4 of FY 2016/17.
--+- Systemwide Average14% - T----l'''''vSystem-Wide Scheduled Operator Unavailability Rate
-Linear (9stemwide Average)
u%0! :«
{«'9 Mn
= 4%
SR$
SQ
r- r-l r-l
UNSCHEDULED
Operator Unavailability improved from 16.01 percent in Q3 of FY 20].6/17 to 15.97 percent in Q4 ofFY 2016/17. The rate of unscheduled operator unavailability is primarily due to contractualtime offallowances, Federal and State mandated leave provisions, and long-term medical leave. An analysisof the absenteeism data revealed that the highest rates of Unscheduled Operator Unavailability areprimarily due to the use of Sick Time and Family Medical Leave (FML). The Operations staffcontinues to monitor and enforce the attendance policies to minimize disruptions in service tocustomers.
3 of 8

Report No. 17-214Page 4 of 8
--+- Systemwide AverageSystem-Wide Unscheduled Operator Unavailability Rate
Unear(9stemwide Average)
g8g
l1.
[
J
nRg
nR R
MQR0
ACCIDENT RATE RATES
The Passenger Fall Rate per 100,000 Miles improved from 2.89 in Q3 of FY 2016/17 to 2.39 in Q4
of FY 2016/17. The Passenger Accident Rate achieved the District target of 3.25 in April, Mayand June, with actualresults of 2.47, 1.98 and 2.71respectively.
==;+=Sys te rlw4de:Average
System-Wide Passenger Falls Accident Rate:4iQeaq$yqeiJwid$ A)erpge)
}.]. . gFRI 111
g ..8. ..£
l
g ..ggRQ
i$ =-- . ... . Q
The Vehicle Collisions Rate per 100,000 miles improved from 4.93 in Q3 of FY 2016/17 to 4.57 inQ4 of FY 2016/17, which was not below the District's target of 4.00. The District has focused onabsenteeism to alleviate the pressure off of schedule adherence. Operator's new built inallotted time have helped with a renewed safety focus.
--+- Systemwide Average
System-Wide Vehicle Accident RateUnear (9gemwlde Average)
&o
g '.€ '.) '.$: za<
LO
5R8
QO
r-q r4 qp-lp q--l r-l
4 of 8

Report No. 17-214
Page 5 of 8
The Accident Reduction Task Force has evaluated the accidents that occurred during the periodand has initiated new campaigns to focus on the highest accident types in an effort to reduceaccidents.
BUS CLEANLINESS INSPECTION RATE
The Overall Rating Average for System-Wide Bus Cleanliness inspections improved slightly from7.83 during Q3 of FY 2016/17 to 7.85 in Q4 of FY 2016/17. Bus Cleanliness did not meet theDistrict's goal of 8.10 in any of Q4 months, April was 7.98, May was 7.96 and June was 7.62. TheMaintenance Bus Cleanliness Task Force meets monthly to analyze, investigate, and solve issuesregarding bus cleanliness. The division's efforts to expand the daily cleaning of buses at the fuelisland and improve the mileage-driven preventive maintenance cleaning programs have moved thecleanliness of the fleet closer to operations 8.lgoal, but the department willneed to focus on areasreceiving the lowest rating in the monthly quality assurance inspections to achieve the District goal.
systemwide.AverageSystem-Wide Bus Cleanliness
&2
&o
7.8
7.6
7.4
7.2
7.0
d
E!qU
8EE0'D
B<
&8
SR
$
i gR0
Rg
CUSTOMER COMPLAINTS
The majority of complaints received by the District are categorized under the ScheduleAdherence, Pass Ups, New Fare Increases, Unsafe Operation, Operator Discourtesy/Conduct,and Equipment Infrastructure categories. Total Customer Complaints in Q4 of FY 2016/17 were3,164, a decrease of 13.62 percent, or 499 complaints from the 3,663 received in Q3 of 2016/17.Schedule adherence complaints that had increased over the past few months duringimplementation of the Service Expansion Program began to trend downward as the operatorstaffing levels stabilized and the Percentage of Service Operated returned to more normallevels.
5 of 8

Report No. 17-214
Page 6 of 8
SYSTEM WIDE Customer Boarding Complaints
-e-nEqubment/Infrastmdure/System .-OnMlscelbneous -@nOperatorDBcourtesy/Conduct -@BPass Up! -OwSchedule Adherence plate/llo show/ Earlyl
OPERATOR LOG-ON RATE
Operator log-on rate worsened from 94.09 percent in Q3 of FY 2016/17 to 93.75 in Q4 of FY20].6/].7. Operator Log-On Rates were only slightly below the District's goal of 95.00 percent duringthe quarter with actual results of 94.25, 92.84 and 94.15 percent in April, May and Junerespectively.
The District is continuing to focus on reviewing log on rates daily. CAD/AVL has not been accurateand this has impacted this key performance indicator. Staff continues to review this andcommunicate with the Information Services department to fix any outstanding log on issues.
System-Wide Log On Rate
Unear (9stemwlde A\nra8e)
Rg
DNQ
R
6
=
H$
Rl\ is l\
CUSTOMER CALL CENTER
Under contract, American Customer Care continues to handle customer service feedback, tripplanning, and Flex Service calls from customers seven days a week. During the fourth quarter ofFY2016/17, the customer call center handled 12,502 calls, 500 more than the prior quarter. Thisincrease is likely due to increased calls in June related to the fare change July 1, 2017. Theproportion of complaint calls has been higher in the past year over prior years, but there were
6 of 8
Report No. 17-214Page 7 of 8
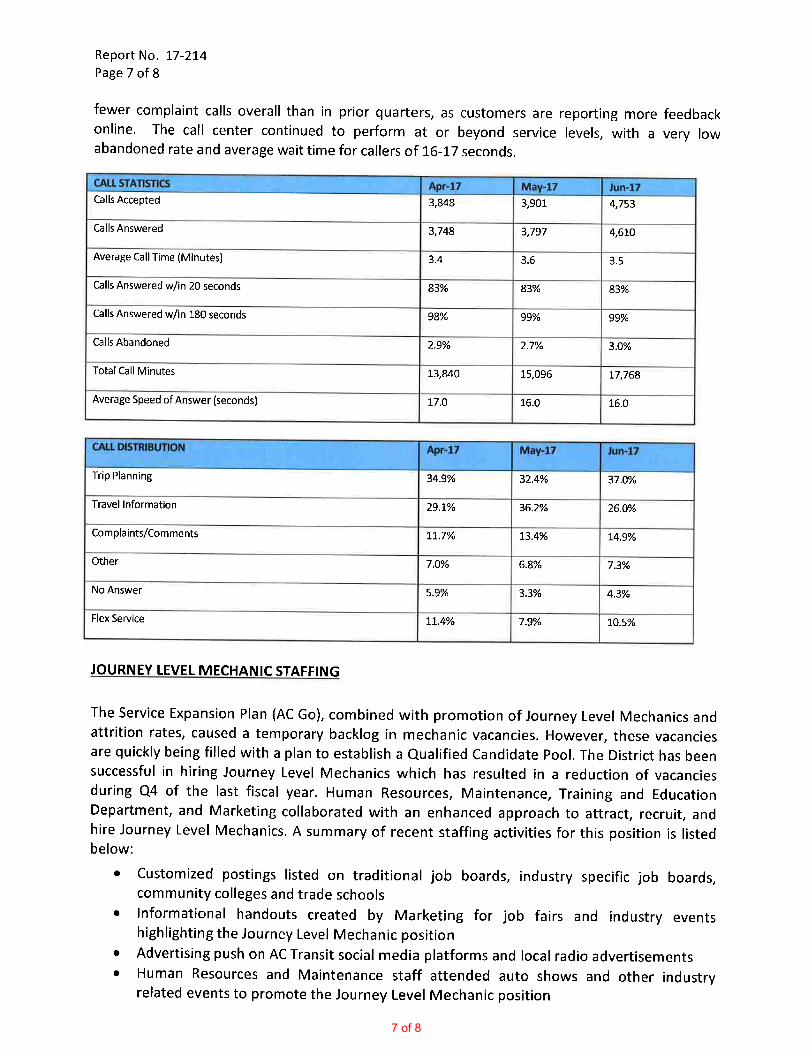
fewer complaint calls overall than in prior quarters, as customers are reporting more feedbackonline. The call center continued to perform at or beyond service levels, with a very lowabandoned rate and average wait time for callers of 16-17 seconds.
CALL STATISTICS
Calls Accepted
Calls Answered
Average Call Time IMinutes)
Calls Answered w/in 20 seconds
Calls Answered w/in 180 seconds
Calls Aba ndoned
Total Call Minutes
Average Speed of Answer (seconds)
CALL DISTRIBUTION
Trip Planning
Travel Information
Compla nts
Other
No Answer
Flex Service
!QIIBNEY LEVEL MECHANIC STAFFING
The Service Expansion Plan(AC Go), combined with promotion of Journey LeveIMechanics andattrition rates, caused a temporary backlog in mechanic vacancies. However, these vacanciesare quickly being filled with a plan to establish a Clualified Candidate Pool. The District has beensuccessful in hiring Journey Level Mechanics which has resulted in a reduction of vacanciesduring Q4 of the last fiscal year. Human Resources, Maintenance, Training and EducationDepartment, and Marketing collaborated with an enhanced approach to attract, recruit, andhire Journey Level Mechanics. A summary of recent staffing activities for this position is listednnln\A/'
e
e
e
e
Customized postings listed on traditional job boards, industry specific job boards,community colleges and trade schools
Informational handouts created by Marketing for job fairs and industry eventshighlighting the Journey LeveIMechanic positionAdvertising push on AC Transit socialmedia platforms and localradio advertisements
Human Resources and Maintenance staff attended auto shows and other industryrelated events to promote the Journey Level Mechanic position
7 of 8

Report No. 17-214Page 8 of 8
e Staff leveraged current workforce for leads on potentialapplicants
These efforts are yielding results; the District has plans in motion to fill more vacancies. OnAugust 14"', five (5) new mechanics will be added to the Heavy Duty Coach MechanicApprenticeship Program. Four(4) new Journey LeveIMechanics will be hired and start trainingin September. At the beginning of Q4 there were twenty-one (21) vacancies. Staff anticipateshaving only three(3) Journey LeveIMechanic vacancies by the end of QI of FY17/18.
BUDGETARY/FISCAL IMPACT
There are no current budgetary fiscal impacts related to this report
ADVANTAGES/DISADVANTAGES
This report does not recommend a course of action with notable advantages or disadvantages
ALTERNATIVES ANALYSIS
This report does not recommend an alternative analysis
PRIOR RELEVANT BOARD ACTION/POLICIES
There are no prior relevant board actions/policies
A'TTACHMENTS
None
Approved by: Derik Calhoun, Director of Transportation
Reviewed by: Derik Calhoun, Director of TransportationSalvador Llamas, Director of Maintenance
Prepared by: Scott Arjun, Management Analyst
8 of 8
Related Documents