1223 Michael Street, Suite 100, Ottawa, ON K1J 7T2 Tel: 613.738.4160 ● Fax: 613.739.7105 www.delcan.com February 25, 2013 OUR REF: TO3098TOE Mark Motors of Ottawa 611 Montreal Road Ottawa, ON K1K 0T8 Attention: Michael Mark Dear Michael: Re: Cyrville Road Car Dealership From the information provided, it is our understanding that Mark Motors is proposing to construct a new car dealership on a consolidated site located on the north side of Cyrville Road between Michael Street and Cummings Avenue. The proposed site will consist of an approximate 28,000 ft 2 showroom/sales/service centre with an additional 13,000 ft 2 of basement and rooftop vehicle storage. Two site driveway connections are proposed to Cyrville Road. The local context is depicted as Figure 1 and the preliminary Site Plan is depicted as Figure 2. Figure 1: Local Context

Welcome message from author
This document is posted to help you gain knowledge. Please leave a comment to let me know what you think about it! Share it to your friends and learn new things together.
Transcript
1223 Michael Street, Suite 100, Ottawa, ON K1J 7T2 Tel: 613.738.4160 ● Fax: 613.739.7105
www.delcan.com
February 25, 2013 OUR REF: TO3098TOE
Mark Motors of Ottawa 611 Montreal Road Ottawa, ON K1K 0T8 Attention: Michael Mark Dear Michael:
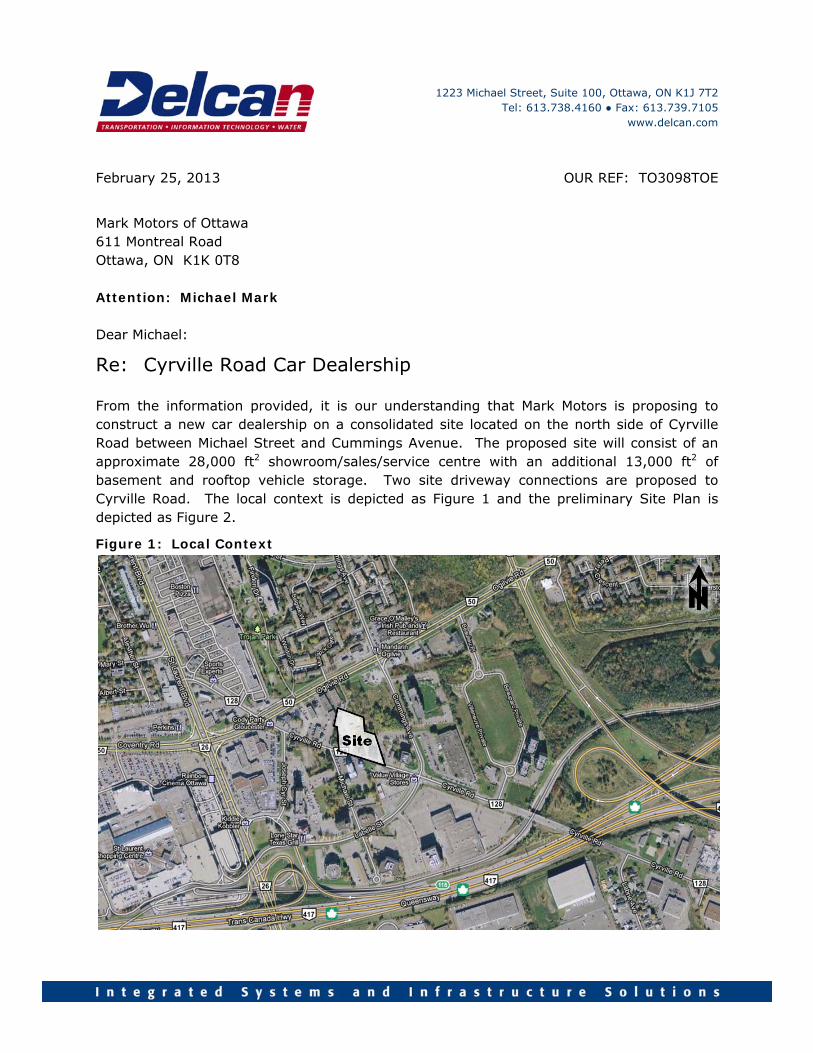
Re: Cyrville Road Car Dealership From the information provided, it is our understanding that Mark Motors is proposing to construct a new car dealership on a consolidated site located on the north side of Cyrville Road between Michael Street and Cummings Avenue. The proposed site will consist of an approximate 28,000 ft2 showroom/sales/service centre with an additional 13,000 ft2 of basement and rooftop vehicle storage. Two site driveway connections are proposed to Cyrville Road. The local context is depicted as Figure 1 and the preliminary Site Plan is depicted as Figure 2.
Figure 1: Local Context
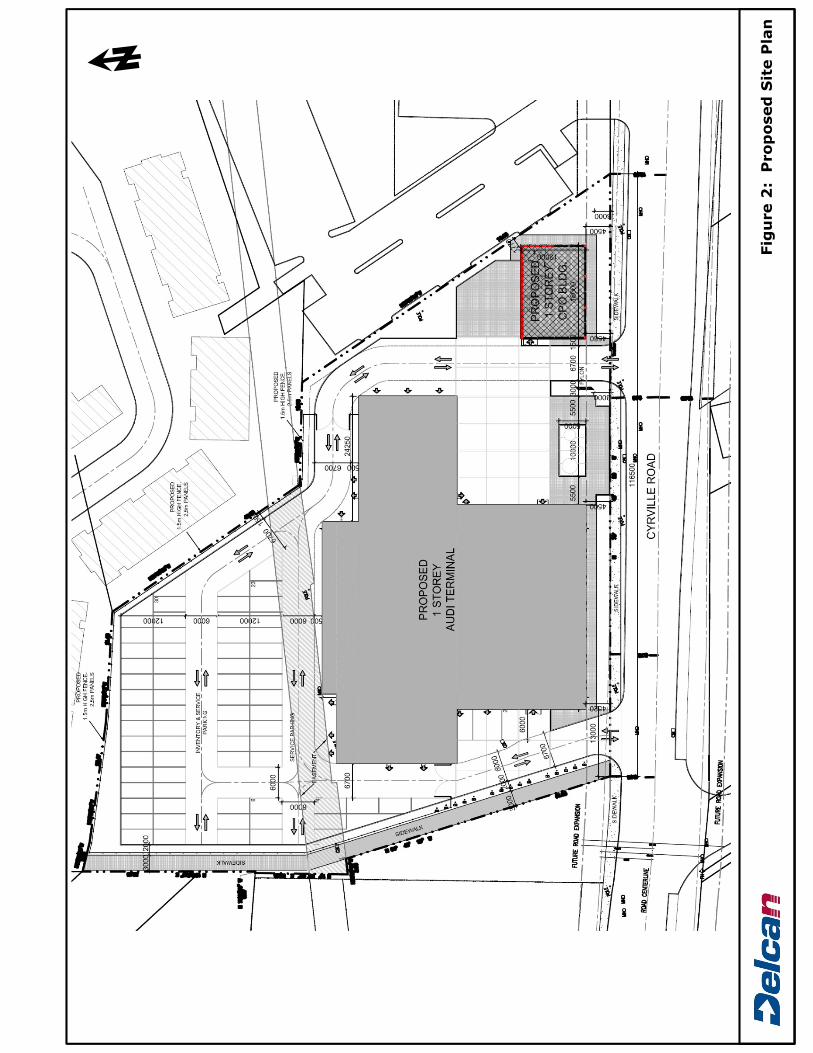
Figure 2: Proposed SitePlan

P a g e | 3
As part of the development approvals process, the City of Ottawa requires a transportation assessment to be submitted in support of a planning application. Based on the ensuing trip generation and our review of the City’s Transportation Assessment Guidelines (TIA), the proposed development is projected to generate less than the City’s 75 veh/h TIA guideline for a Transportation Brief (TB). As such, no further traffic analysis is required. However, in support of the Site Plan Approval process, a modified Transportation Brief that addresses the following topics is considered appropriate:
existing traffic conditions at adjacent intersections; future site trip generation and distribution; off-site traffic control requirements (if any); and Site Plan issues, including proposed access, parking, loading and circulation layout.
1. EXISTING CONDITIONS
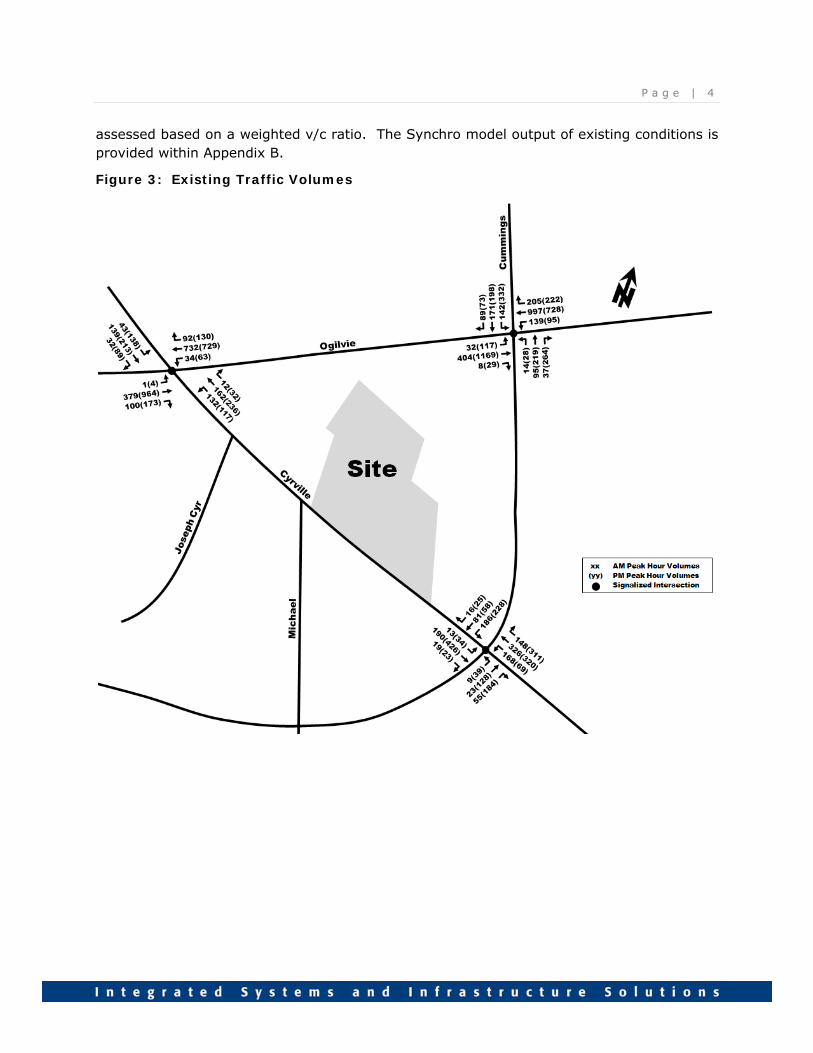
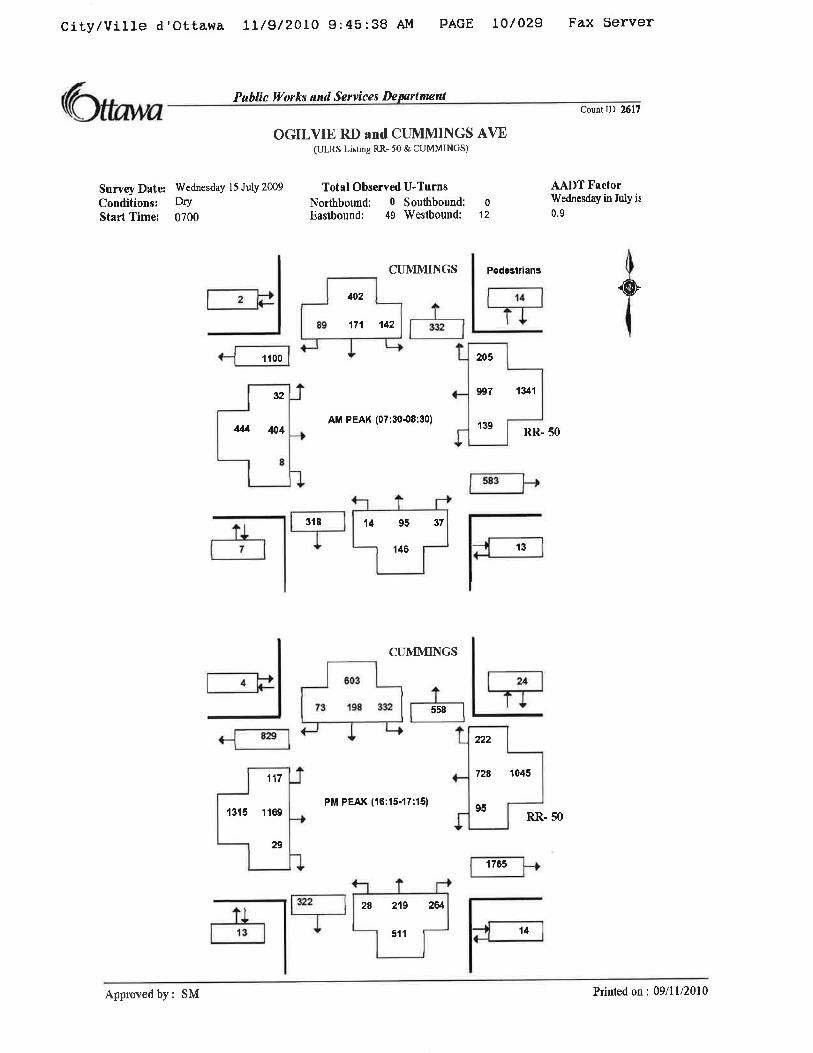
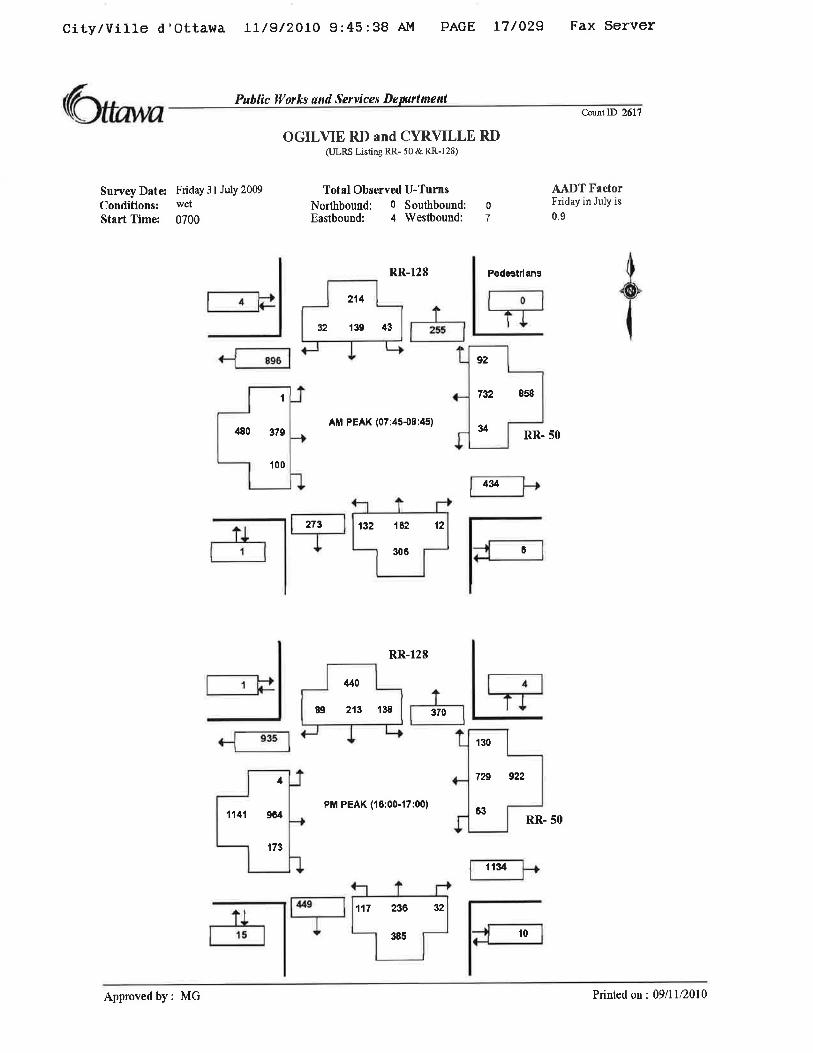
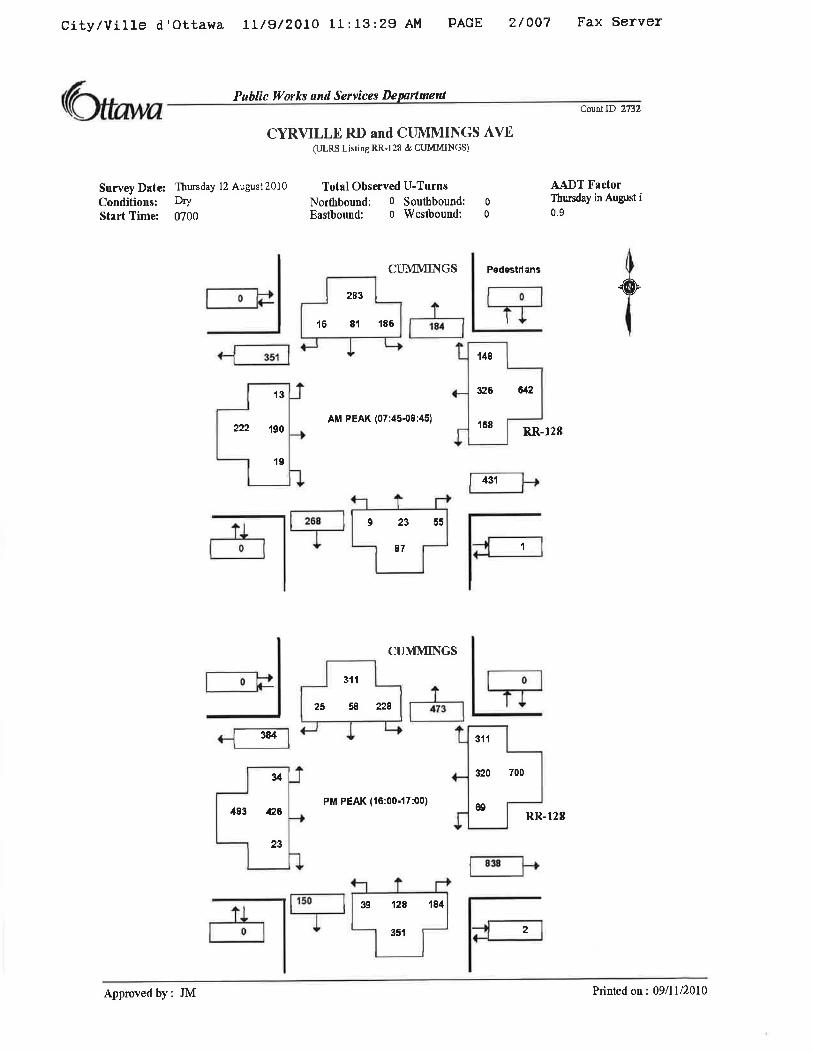
Cyrville Road is an urban 2-lane undivided arterial roadway within the study area that has a 37.5 m protected ROW. It extends from Innes Road in the east to St. Laurent Boulevard in the west. Auxiliary turn lanes are provided at major intersections and the posted speed limit within the study area is 60 km/h. Ogilvie Road is an urban 4-lane divided arterial roadway, which extends from the Rockcliffe Parkway in the east to St. Laurent Boulevard in the west, where it continues as Coventry Road. Auxiliary turn lanes are provided at major intersections and the posted speed limit within the study area is 60 km/h. Cummings Avenue is currently a rural cross-section collector roadway within the study area that has a 37.5 m protected ROW. It extends from Montreal Road in the north to Cyrville Road in the south, where it continues as Labelle Street. Auxiliary turn lanes are provided at major intersections and the speed limit within the study area is 50 km/h. Over the fullness of time, urbanization will be considered along Cummings Avenue, between Ogilvie and Cyrville Road, to better promote use of the walking, cycling and transit modes and to address future capacity and access needs. The most recent weekday morning and afternoon peak hour traffic counts and signal timing plans (before the demolition of the Cyrville Road bridge) were obtained from the City of Ottawa for the signalized Cyrville/Ogilvie, Cyrville/Cummings and Ogilvie/Cummings intersections. Current volumes are illustrated in Figure 3 and are included as Appendix A. The ensuing Table 1 provides a summary of existing traffic operations at study area intersections based on the Synchro (V7) traffic analysis software. The subject intersections were assessed in terms of the volume-to-capacity (v/c) ratio and the corresponding Level of Service (LoS) for the ‘critical movement(s)’. The subject intersections ‘as a whole’ were
P a g e | 4
assessed based on a weighted v/c ratio. The Synchro model output of existing conditions is provided within Appendix B.
Figure 3: Existing Traffic Volumes
P a g e | 5
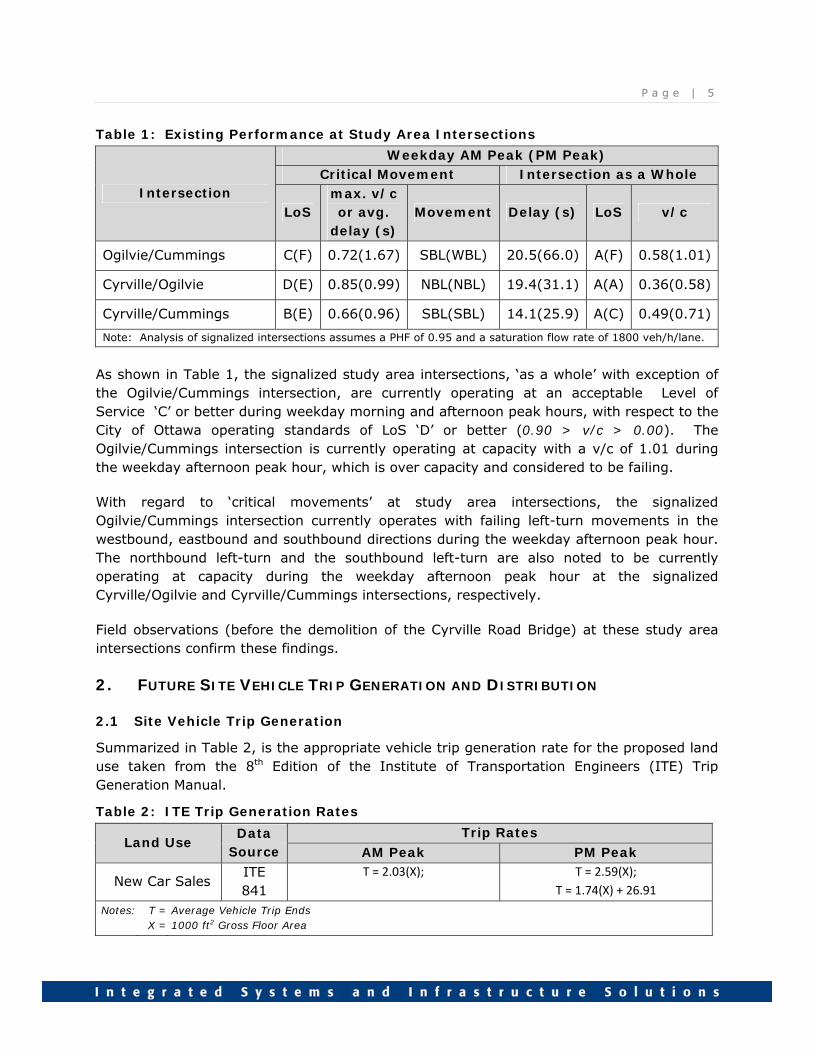
Table 1: Existing Performance at Study Area Intersections
Intersection
Weekday AM Peak (PM Peak) Critical Movement Intersection as a Whole
LoS max. v/c or avg.
delay (s) Movement Delay (s) LoS v/c
Ogilvie/Cummings C(F) 0.72(1.67) SBL(WBL) 20.5(66.0) A(F) 0.58(1.01)
Cyrville/Ogilvie D(E) 0.85(0.99) NBL(NBL) 19.4(31.1) A(A) 0.36(0.58)
Cyrville/Cummings B(E) 0.66(0.96) SBL(SBL) 14.1(25.9) A(C) 0.49(0.71)
Note: Analysis of signalized intersections assumes a PHF of 0.95 and a saturation flow rate of 1800 veh/h/lane. As shown in Table 1, the signalized study area intersections, ‘as a whole’ with exception of the Ogilvie/Cummings intersection, are currently operating at an acceptable Level of Service ‘C’ or better during weekday morning and afternoon peak hours, with respect to the City of Ottawa operating standards of LoS ‘D’ or better (0.90 > v/c > 0.00). The Ogilvie/Cummings intersection is currently operating at capacity with a v/c of 1.01 during the weekday afternoon peak hour, which is over capacity and considered to be failing. With regard to ‘critical movements’ at study area intersections, the signalized Ogilvie/Cummings intersection currently operates with failing left-turn movements in the westbound, eastbound and southbound directions during the weekday afternoon peak hour. The northbound left-turn and the southbound left-turn are also noted to be currently operating at capacity during the weekday afternoon peak hour at the signalized Cyrville/Ogilvie and Cyrville/Cummings intersections, respectively. Field observations (before the demolition of the Cyrville Road Bridge) at these study area intersections confirm these findings.
2. FUTURE SITE VEHICLE TRIP GENERATION AND DISTRIBUTION
2.1 Site Vehicle Trip Generation
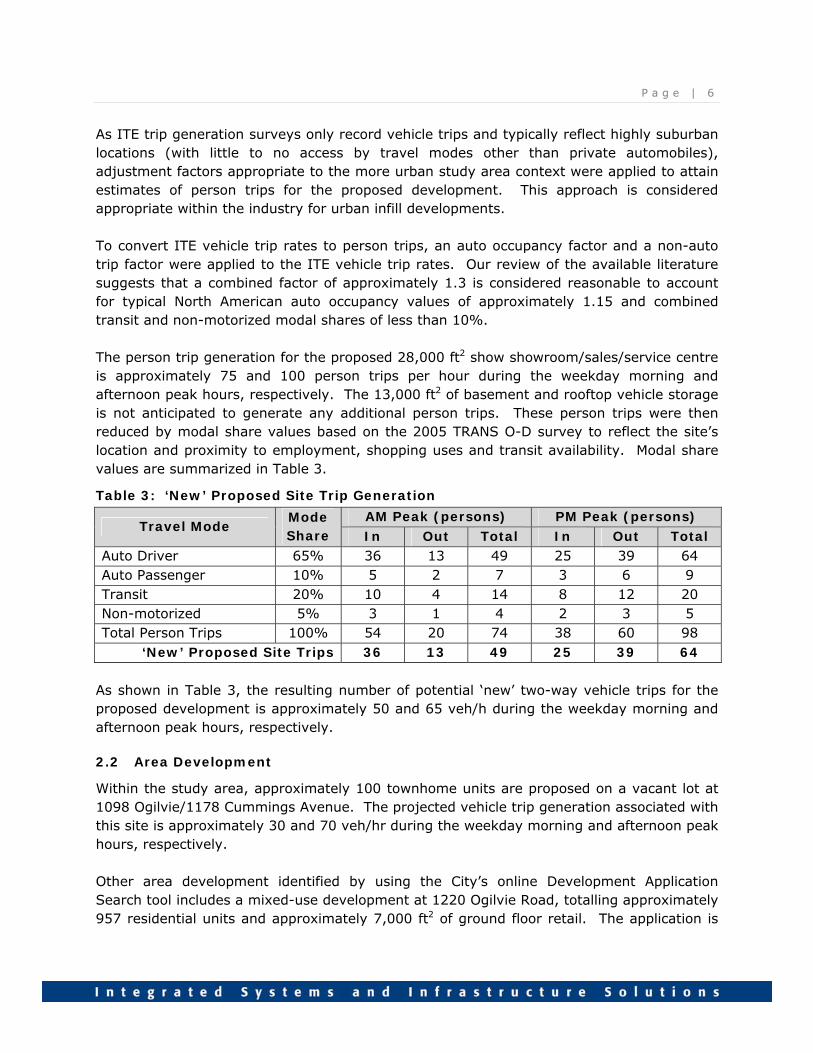
Summarized in Table 2, is the appropriate vehicle trip generation rate for the proposed land use taken from the 8th Edition of the Institute of Transportation Engineers (ITE) Trip Generation Manual.
Table 2: ITE Trip Generation Rates
Land Use Data
Source Trip Rates
AM Peak PM Peak
New Car Sales ITE 841
T = 2.03(X);
T = 2.59(X);
T = 1.74(X) + 26.91
Notes: T = X =
Average Vehicle Trip Ends 1000 ft2 Gross Floor Area
P a g e | 6
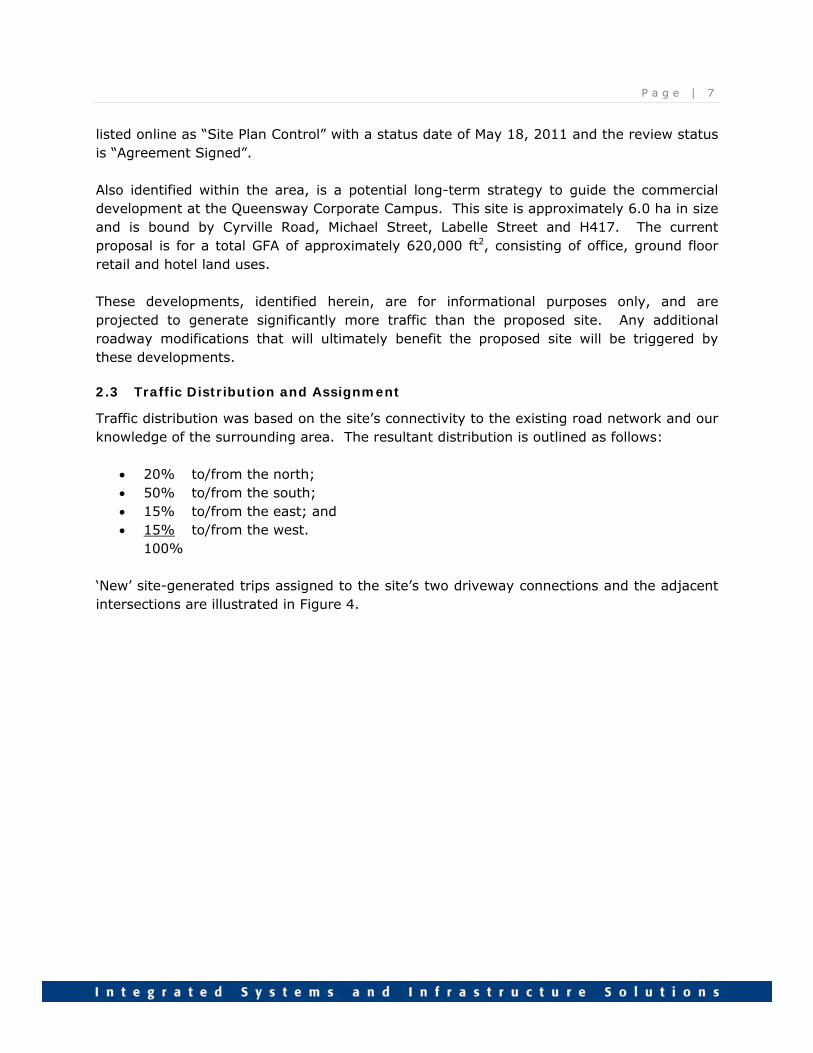
As ITE trip generation surveys only record vehicle trips and typically reflect highly suburban locations (with little to no access by travel modes other than private automobiles), adjustment factors appropriate to the more urban study area context were applied to attain estimates of person trips for the proposed development. This approach is considered appropriate within the industry for urban infill developments. To convert ITE vehicle trip rates to person trips, an auto occupancy factor and a non-auto trip factor were applied to the ITE vehicle trip rates. Our review of the available literature suggests that a combined factor of approximately 1.3 is considered reasonable to account for typical North American auto occupancy values of approximately 1.15 and combined transit and non-motorized modal shares of less than 10%. The person trip generation for the proposed 28,000 ft2 show showroom/sales/service centre is approximately 75 and 100 person trips per hour during the weekday morning and afternoon peak hours, respectively. The 13,000 ft2 of basement and rooftop vehicle storage is not anticipated to generate any additional person trips. These person trips were then reduced by modal share values based on the 2005 TRANS O-D survey to reflect the site’s location and proximity to employment, shopping uses and transit availability. Modal share values are summarized in Table 3.
Table 3: ‘New’ Proposed Site Trip Generation
Travel Mode Mode Share
AM Peak (persons) PM Peak (persons) In Out Total In Out Total
Auto Driver 65% 36 13 49 25 39 64 Auto Passenger 10% 5 2 7 3 6 9 Transit 20% 10 4 14 8 12 20 Non-motorized 5% 3 1 4 2 3 5 Total Person Trips 100% 54 20 74 38 60 98
‘New’ Proposed Site Trips 36 13 49 25 39 64 As shown in Table 3, the resulting number of potential ‘new’ two-way vehicle trips for the proposed development is approximately 50 and 65 veh/h during the weekday morning and afternoon peak hours, respectively.
2.2 Area Development
Within the study area, approximately 100 townhome units are proposed on a vacant lot at 1098 Ogilvie/1178 Cummings Avenue. The projected vehicle trip generation associated with this site is approximately 30 and 70 veh/hr during the weekday morning and afternoon peak hours, respectively. Other area development identified by using the City’s online Development Application Search tool includes a mixed-use development at 1220 Ogilvie Road, totalling approximately 957 residential units and approximately 7,000 ft2 of ground floor retail. The application is
P a g e | 7
listed online as “Site Plan Control” with a status date of May 18, 2011 and the review status is “Agreement Signed”. Also identified within the area, is a potential long-term strategy to guide the commercial development at the Queensway Corporate Campus. This site is approximately 6.0 ha in size and is bound by Cyrville Road, Michael Street, Labelle Street and H417. The current proposal is for a total GFA of approximately 620,000 ft2, consisting of office, ground floor retail and hotel land uses. These developments, identified herein, are for informational purposes only, and are projected to generate significantly more traffic than the proposed site. Any additional roadway modifications that will ultimately benefit the proposed site will be triggered by these developments.
2.3 Traffic Distribution and Assignment
Traffic distribution was based on the site’s connectivity to the existing road network and our knowledge of the surrounding area. The resultant distribution is outlined as follows:
20% to/from the north; 50% to/from the south; 15% to/from the east; and 15% to/from the west.
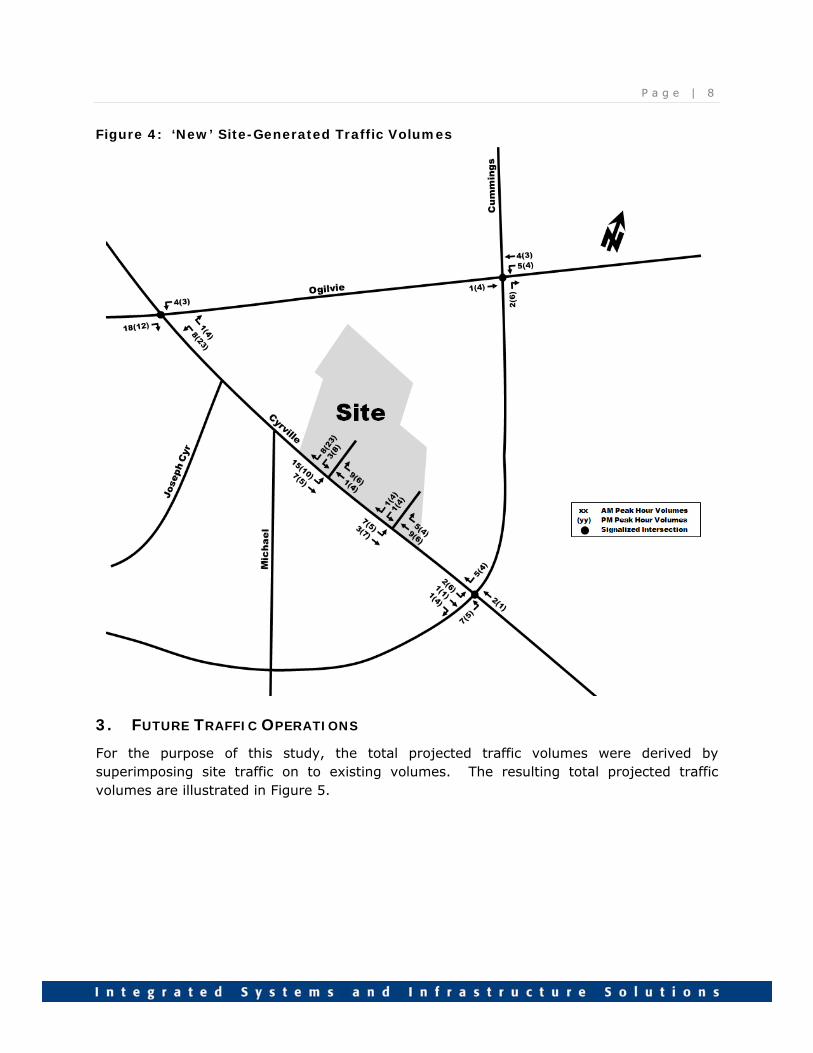
100% ‘New’ site-generated trips assigned to the site’s two driveway connections and the adjacent intersections are illustrated in Figure 4.
P a g e | 8
Figure 4: ‘New’ Site-Generated Traffic Volumes
3. FUTURE TRAFFIC OPERATIONS
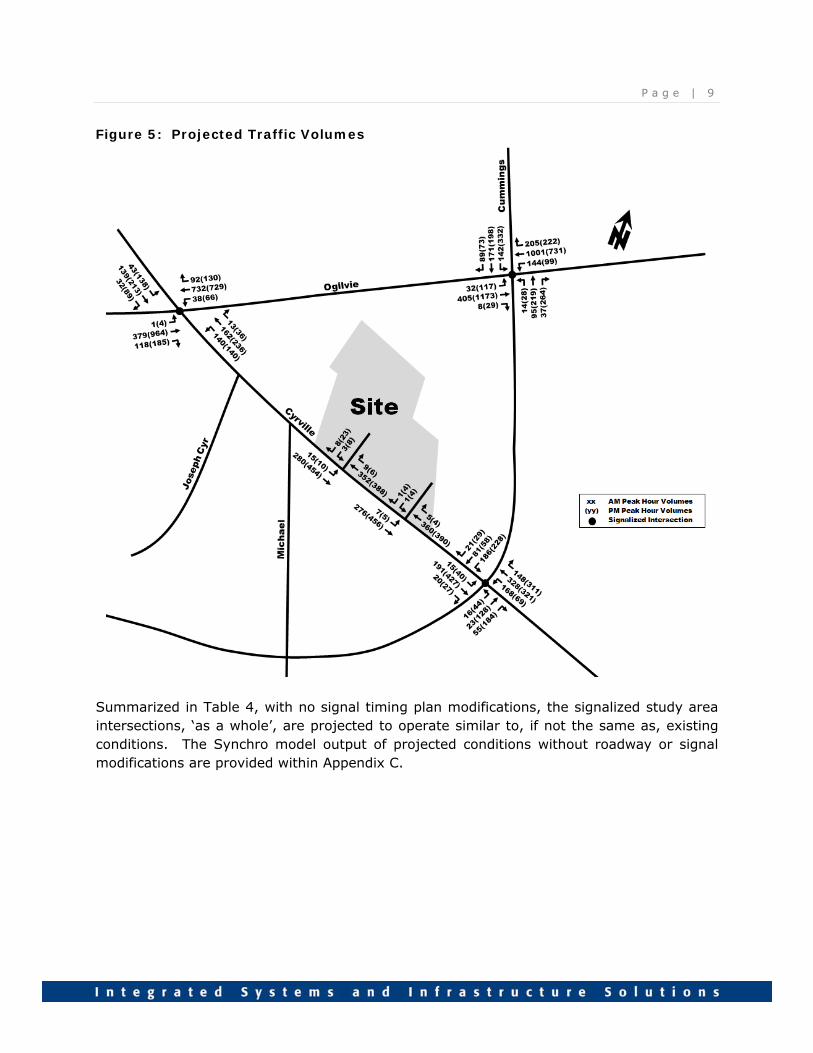
For the purpose of this study, the total projected traffic volumes were derived by superimposing site traffic on to existing volumes. The resulting total projected traffic volumes are illustrated in Figure 5.
P a g e | 9
Figure 5: Projected Traffic Volumes
Summarized in Table 4, with no signal timing plan modifications, the signalized study area intersections, ‘as a whole’, are projected to operate similar to, if not the same as, existing conditions. The Synchro model output of projected conditions without roadway or signal modifications are provided within Appendix C.
P a g e | 1 0
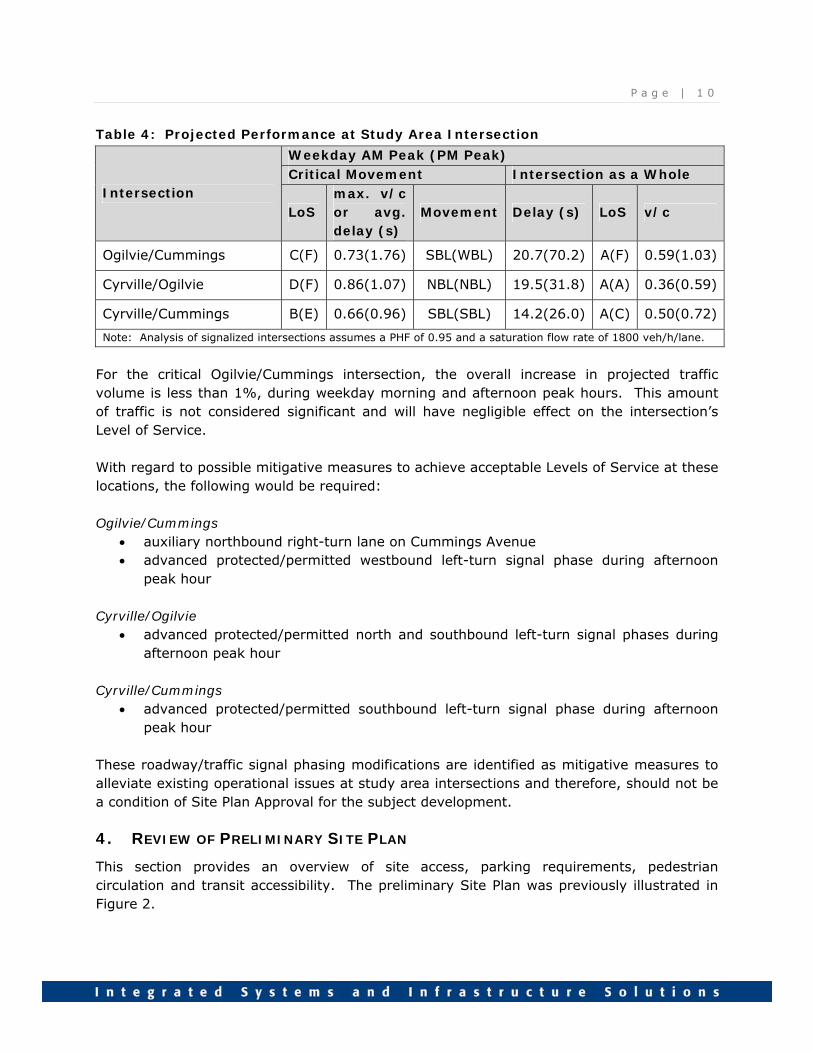
Table 4: Projected Performance at Study Area Intersection
Intersection
Weekday AM Peak (PM Peak) Critical Movement Intersection as a Whole
LoS max. v/c or avg. delay (s)
Movement Delay (s) LoS v/c
Ogilvie/Cummings C(F) 0.73(1.76) SBL(WBL) 20.7(70.2) A(F) 0.59(1.03)
Cyrville/Ogilvie D(F) 0.86(1.07) NBL(NBL) 19.5(31.8) A(A) 0.36(0.59)
Cyrville/Cummings B(E) 0.66(0.96) SBL(SBL) 14.2(26.0) A(C) 0.50(0.72)
Note: Analysis of signalized intersections assumes a PHF of 0.95 and a saturation flow rate of 1800 veh/h/lane. For the critical Ogilvie/Cummings intersection, the overall increase in projected traffic volume is less than 1%, during weekday morning and afternoon peak hours. This amount of traffic is not considered significant and will have negligible effect on the intersection’s Level of Service. With regard to possible mitigative measures to achieve acceptable Levels of Service at these locations, the following would be required: Ogilvie/Cummings
auxiliary northbound right-turn lane on Cummings Avenue advanced protected/permitted westbound left-turn signal phase during afternoon
peak hour Cyrville/Ogilvie
advanced protected/permitted north and southbound left-turn signal phases during afternoon peak hour
Cyrville/Cummings
advanced protected/permitted southbound left-turn signal phase during afternoon peak hour
These roadway/traffic signal phasing modifications are identified as mitigative measures to alleviate existing operational issues at study area intersections and therefore, should not be a condition of Site Plan Approval for the subject development.
4. REVIEW OF PRELIMINARY SITE PLAN
This section provides an overview of site access, parking requirements, pedestrian circulation and transit accessibility. The preliminary Site Plan was previously illustrated in Figure 2.
P a g e | 1 1
Parking It is our understand that the total amount of parking for the proposed site will be sufficient with respect to the City’s Zoning By-Law requirements. Site Circulation Sufficient turning radii for fire, garbage and delivery truck circulation should be provided. Vehicle and truck turning templates should be applied to ensure vehicles are able to manoeuvre around the site appropriately. Access Requirements Based on projected volumes and proximity to adjacent intersections, additional traffic control and auxiliary turn lanes are not warranted at the two proposed driveway connections to Cyrville Road. With regard to these driveway connections, the westerly one is located approximately 25 meters from the Cyrville/Michael intersection and the easterly one is located approximately 140 meters from the Cyrville/Cummings intersection. These are separated from each other by 70 meters. With regard to the access location for the new development on the south side of Cyrville Road, its driveway is located approximately 110 meters west of the Cyrville/Cummings intersection, which relative to the proposed development’s easterly access, is approximately 30 meters further west. The proposed number, location and dimensions of site driveways are sufficient with respect to the City’s Private Approach By-Law. Adequate depressed curb and sidewalk should be provided at the proposed driveway connections. It should also be noted that proposed number of driveways will be an overall reduction in the number of existing driveways along the site’s Cyrville Road frontage and therefore, the proposed is considered an improvement over existing operations. Pedestrians/Transit Connecting pedestrians to transit service and other adjacent development, the proposed site fronts Cyrville Road to the south, where sidewalks are currently provided along both sides beginning at Michael Street and continuing easterly. West of Michael Street, sidewalks are provided on the south side only. Sidewalks will be provided along the site’s Cyrville Road frontage, providing a connection to future sidewalks along the north side of Cyrville Road. Local OC Transpo bus service is currently provided by Route #127 with a bus stop located approximately 100 meters from the site on Michael Street or approximately 170 meters west of the site on Cyrville Road. Rapid OC Transpo bus service is also provided via the Cyrville Transit Station located approximately 450 meters east of the site.
P a g e | 1 2
Bicycles Bicycle parking is not identified on the proposed Site Plan but should be provided at a rate of 1 bicycle parking space per 500 m2 of gross floor area with respect to the City’s Zoning By-Law for a service or repair shop. According to the City’s 2008 Official Cycling Plan (OCP), Ogilvie Road and Cyrville Road are classified as a “spine or City-wide” cycling route. Dedicated bike lanes are currently provided on both sides on Ogilvie Road and dedicated bike lanes are proposed in the short term (2008-2018) on Cyrville Road. Cummings Avenue is classified as a “community” cycling route with an unpaved shoulder currently provided on the west side only.
5. FINDINGS AND RECOMMENDATIONS
Based on the foregoing analysis of the proposed site, the following transportation-related conclusions are offered:
Signalized study area intersections, ‘as a whole’ with exception of the Ogilvie/Cummings intersection, are currently operating at an acceptable LoS ‘C’ or better during weekday morning and afternoon peak hours;
The Ogilvie/Cummings intersection is currently operating at capacity with an overall
v/c of 1.01 during the weekday afternoon peak hour;
The proposed development is projected to generate 50 and 65 veh/h during the weekday morning and afternoon peak hours, respectively, which is an approximate 1 to 2% increase in traffic at study area intersections. With regard to the critical Ogilvie/Cummings intersection, the projected increase in traffic due to the proposed development is less than 1% during peak hours. This amount of traffic is not considered significant and will have negligible effect on the intersection’s Level of Service. According to the City’s Transportation Impact Assessment Guidelines, this level of traffic does not require any further traffic analysis;
Future traffic conditions at study area intersections are projected to operate similar
to existing conditions, indicating negligible site impact;
Identified roadway and traffic signal phasing modifications are recommended to mitigate existing operational issues at study area intersections; and
The proposed number, location and dimensions of site driveways are sufficient with
respect to the City’s Private Approach By-Law and are considered an improvement over the existing driveways along the site’s Cyrville Road frontage.
P a g e | 1 3
February-25-13
Therefore, the proposed Cyrville Road Car Dealership is recommended from a transportation perspective. Prepared By: Gordon R. Scobie, P.Eng. Project Engineer, Transportation Ottawa Operations

Appendix A Existing Peak Hour Traffic Counts


Appendix B Existing Peak Hour Capacity Analysis

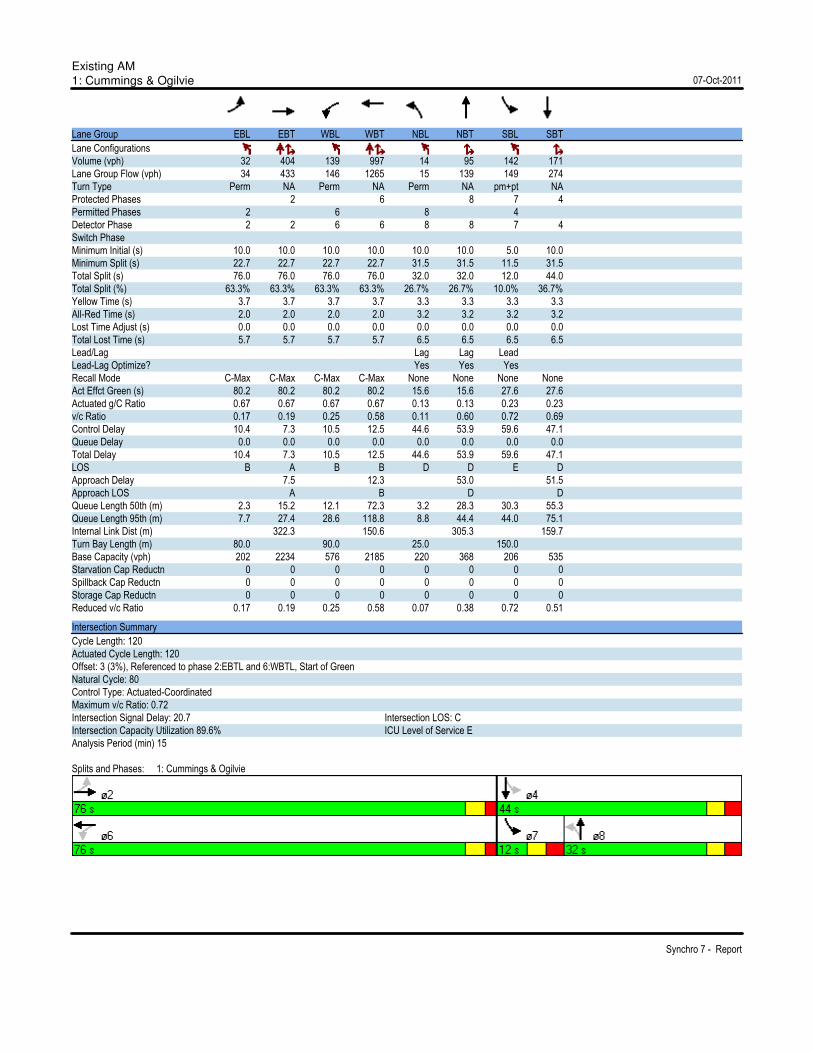
Existing AM
1: Cummings & Ogilvie 07-Oct-2011
Synchro 7 - Report
Lane Group EBL EBT WBL WBT NBL NBT SBL SBT
Lane Configurations
Volume (vph) 32 404 139 997 14 95 142 171
Lane Group Flow (vph) 34 433 146 1265 15 139 149 274
Turn Type Perm NA Perm NA Perm NA pm+pt NA
Protected Phases 2 6 8 7 4
Permitted Phases 2 6 8 4
Detector Phase 2 2 6 6 8 8 7 4
Switch Phase
Minimum Initial (s) 10.0 10.0 10.0 10.0 10.0 10.0 5.0 10.0
Minimum Split (s) 22.7 22.7 22.7 22.7 31.5 31.5 11.5 31.5
Total Split (s) 76.0 76.0 76.0 76.0 32.0 32.0 12.0 44.0
Total Split (%) 63.3% 63.3% 63.3% 63.3% 26.7% 26.7% 10.0% 36.7%
Yellow Time (s) 3.7 3.7 3.7 3.7 3.3 3.3 3.3 3.3
All-Red Time (s) 2.0 2.0 2.0 2.0 3.2 3.2 3.2 3.2
Lost Time Adjust (s) 0.0 0.0 0.0 0.0 0.0 0.0 0.0 0.0
Total Lost Time (s) 5.7 5.7 5.7 5.7 6.5 6.5 6.5 6.5
Lead/Lag Lag Lag Lead
Lead-Lag Optimize? Yes Yes Yes
Recall Mode C-Max C-Max C-Max C-Max None None None None
Act Effct Green (s) 80.2 80.2 80.2 80.2 15.6 15.6 27.6 27.6
Actuated g/C Ratio 0.67 0.67 0.67 0.67 0.13 0.13 0.23 0.23
v/c Ratio 0.17 0.19 0.25 0.58 0.11 0.60 0.72 0.69
Control Delay 10.4 7.3 10.5 12.5 44.6 53.9 59.6 47.1
Queue Delay 0.0 0.0 0.0 0.0 0.0 0.0 0.0 0.0
Total Delay 10.4 7.3 10.5 12.5 44.6 53.9 59.6 47.1
LOS B A B B D D E D
Approach Delay 7.5 12.3 53.0 51.5
Approach LOS A B D D
Queue Length 50th (m) 2.3 15.2 12.1 72.3 3.2 28.3 30.3 55.3
Queue Length 95th (m) 7.7 27.4 28.6 118.8 8.8 44.4 44.0 75.1
Internal Link Dist (m) 322.3 150.6 305.3 159.7
Turn Bay Length (m) 80.0 90.0 25.0 150.0
Base Capacity (vph) 202 2234 576 2185 220 368 206 535
Starvation Cap Reductn 0 0 0 0 0 0 0 0
Spillback Cap Reductn 0 0 0 0 0 0 0 0
Storage Cap Reductn 0 0 0 0 0 0 0 0
Reduced v/c Ratio 0.17 0.19 0.25 0.58 0.07 0.38 0.72 0.51
Intersection Summary
Cycle Length: 120
Actuated Cycle Length: 120
Offset: 3 (3%), Referenced to phase 2:EBTL and 6:WBTL, Start of Green
Natural Cycle: 80
Control Type: Actuated-Coordinated
Maximum v/c Ratio: 0.72
Intersection Signal Delay: 20.7 Intersection LOS: C
Intersection Capacity Utilization 89.6% ICU Level of Service E
Analysis Period (min) 15
Splits and Phases: 1: Cummings & Ogilvie
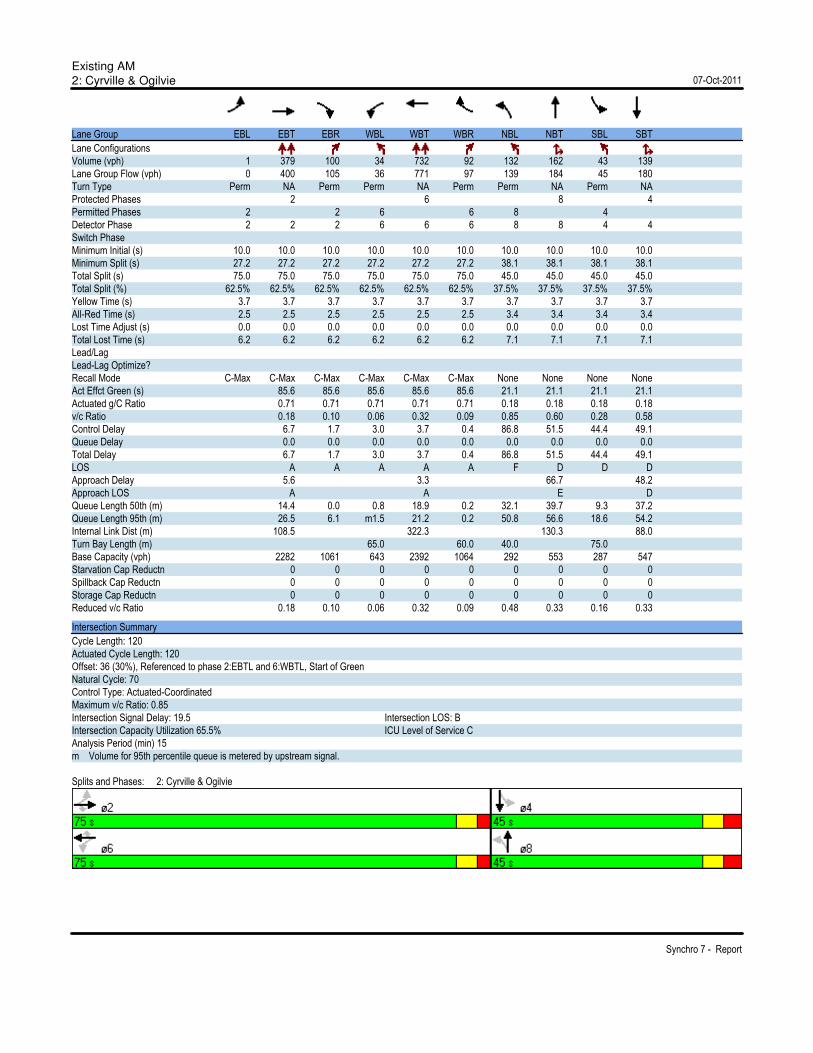
Existing AM
2: Cyrville & Ogilvie 07-Oct-2011
Synchro 7 - Report
Lane Group EBL EBT EBR WBL WBT WBR NBL NBT SBL SBT
Lane Configurations
Volume (vph) 1 379 100 34 732 92 132 162 43 139
Lane Group Flow (vph) 0 400 105 36 771 97 139 184 45 180
Turn Type Perm NA Perm Perm NA Perm Perm NA Perm NA
Protected Phases 2 6 8 4
Permitted Phases 2 2 6 6 8 4
Detector Phase 2 2 2 6 6 6 8 8 4 4
Switch Phase
Minimum Initial (s) 10.0 10.0 10.0 10.0 10.0 10.0 10.0 10.0 10.0 10.0
Minimum Split (s) 27.2 27.2 27.2 27.2 27.2 27.2 38.1 38.1 38.1 38.1
Total Split (s) 75.0 75.0 75.0 75.0 75.0 75.0 45.0 45.0 45.0 45.0
Total Split (%) 62.5% 62.5% 62.5% 62.5% 62.5% 62.5% 37.5% 37.5% 37.5% 37.5%
Yellow Time (s) 3.7 3.7 3.7 3.7 3.7 3.7 3.7 3.7 3.7 3.7
All-Red Time (s) 2.5 2.5 2.5 2.5 2.5 2.5 3.4 3.4 3.4 3.4
Lost Time Adjust (s) 0.0 0.0 0.0 0.0 0.0 0.0 0.0 0.0 0.0 0.0
Total Lost Time (s) 6.2 6.2 6.2 6.2 6.2 6.2 7.1 7.1 7.1 7.1
Lead/Lag
Lead-Lag Optimize?
Recall Mode C-Max C-Max C-Max C-Max C-Max C-Max None None None None
Act Effct Green (s) 85.6 85.6 85.6 85.6 85.6 21.1 21.1 21.1 21.1
Actuated g/C Ratio 0.71 0.71 0.71 0.71 0.71 0.18 0.18 0.18 0.18
v/c Ratio 0.18 0.10 0.06 0.32 0.09 0.85 0.60 0.28 0.58
Control Delay 6.7 1.7 3.0 3.7 0.4 86.8 51.5 44.4 49.1
Queue Delay 0.0 0.0 0.0 0.0 0.0 0.0 0.0 0.0 0.0
Total Delay 6.7 1.7 3.0 3.7 0.4 86.8 51.5 44.4 49.1
LOS A A A A A F D D D
Approach Delay 5.6 3.3 66.7 48.2
Approach LOS A A E D
Queue Length 50th (m) 14.4 0.0 0.8 18.9 0.2 32.1 39.7 9.3 37.2
Queue Length 95th (m) 26.5 6.1 m1.5 21.2 0.2 50.8 56.6 18.6 54.2
Internal Link Dist (m) 108.5 322.3 130.3 88.0
Turn Bay Length (m) 65.0 60.0 40.0 75.0
Base Capacity (vph) 2282 1061 643 2392 1064 292 553 287 547
Starvation Cap Reductn 0 0 0 0 0 0 0 0 0
Spillback Cap Reductn 0 0 0 0 0 0 0 0 0
Storage Cap Reductn 0 0 0 0 0 0 0 0 0
Reduced v/c Ratio 0.18 0.10 0.06 0.32 0.09 0.48 0.33 0.16 0.33
Intersection Summary
Cycle Length: 120
Actuated Cycle Length: 120
Offset: 36 (30%), Referenced to phase 2:EBTL and 6:WBTL, Start of Green
Natural Cycle: 70
Control Type: Actuated-Coordinated
Maximum v/c Ratio: 0.85
Intersection Signal Delay: 19.5 Intersection LOS: B
Intersection Capacity Utilization 65.5% ICU Level of Service C
Analysis Period (min) 15
m Volume for 95th percentile queue is metered by upstream signal.
Splits and Phases: 2: Cyrville & Ogilvie

Existing AM
3: Labelle/Cummings & Cyrville 07-Oct-2011
Synchro 7 - Report
Lane Group EBL EBT WBL WBT NBL NBT SBL SBT
Lane Configurations
Volume (vph) 13 190 168 326 9 23 186 81
Lane Group Flow (vph) 14 220 177 499 9 82 196 102
Turn Type Perm NA Perm NA Perm NA Perm NA
Protected Phases 2 6 8 4
Permitted Phases 2 6 8 4
Detector Phase 2 2 6 6 8 8 4 4
Switch Phase
Minimum Initial (s) 10.0 10.0 10.0 10.0 10.0 10.0 10.0 10.0
Minimum Split (s) 31.3 31.3 31.3 31.3 24.5 24.5 24.5 24.5
Total Split (s) 35.0 35.0 35.0 35.0 35.0 35.0 35.0 35.0
Total Split (%) 50.0% 50.0% 50.0% 50.0% 50.0% 50.0% 50.0% 50.0%
Yellow Time (s) 3.7 3.7 3.7 3.7 3.3 3.3 3.3 3.3
All-Red Time (s) 2.6 2.6 2.6 2.6 2.2 2.2 2.2 2.2
Lost Time Adjust (s) 0.0 0.0 0.0 0.0 0.0 0.0 0.0 0.0
Total Lost Time (s) 6.3 6.3 6.3 6.3 5.5 5.5 5.5 5.5
Lead/Lag
Lead-Lag Optimize?
Recall Mode C-Max C-Max C-Max C-Max None None None None
Act Effct Green (s) 41.4 41.4 41.4 41.4 16.8 16.8 16.8 16.8
Actuated g/C Ratio 0.59 0.59 0.59 0.59 0.24 0.24 0.24 0.24
v/c Ratio 0.03 0.21 0.27 0.49 0.03 0.19 0.66 0.24
Control Delay 8.7 8.4 10.0 11.0 17.1 9.0 33.6 17.5
Queue Delay 0.0 0.0 0.0 0.0 0.0 0.0 0.0 0.0
Total Delay 8.7 8.4 10.0 11.0 17.1 9.0 33.6 17.5
LOS A A B B B A C B
Approach Delay 8.4 10.7 9.8 28.1
Approach LOS A B A C
Queue Length 50th (m) 0.7 11.4 10.0 30.0 0.9 2.4 23.4 9.0
Queue Length 95th (m) 3.6 27.8 26.6 69.2 3.5 10.1 36.8 17.0
Internal Link Dist (m) 258.6 277.1 123.8 305.3
Turn Bay Length (m) 35.0 75.0 30.0 40.0
Base Capacity (vph) 445 1030 647 1011 514 699 523 735
Starvation Cap Reductn 0 0 0 0 0 0 0 0
Spillback Cap Reductn 0 0 0 0 0 0 0 0
Storage Cap Reductn 0 0 0 0 0 0 0 0
Reduced v/c Ratio 0.03 0.21 0.27 0.49 0.02 0.12 0.37 0.14
Intersection Summary
Cycle Length: 70
Actuated Cycle Length: 70
Offset: 0 (0%), Referenced to phase 2:EBTL and 6:WBTL, Start of Green
Natural Cycle: 60
Control Type: Actuated-Coordinated
Maximum v/c Ratio: 0.66
Intersection Signal Delay: 14.2 Intersection LOS: B
Intersection Capacity Utilization 68.6% ICU Level of Service C
Analysis Period (min) 15
Splits and Phases: 3: Labelle/Cummings & Cyrville
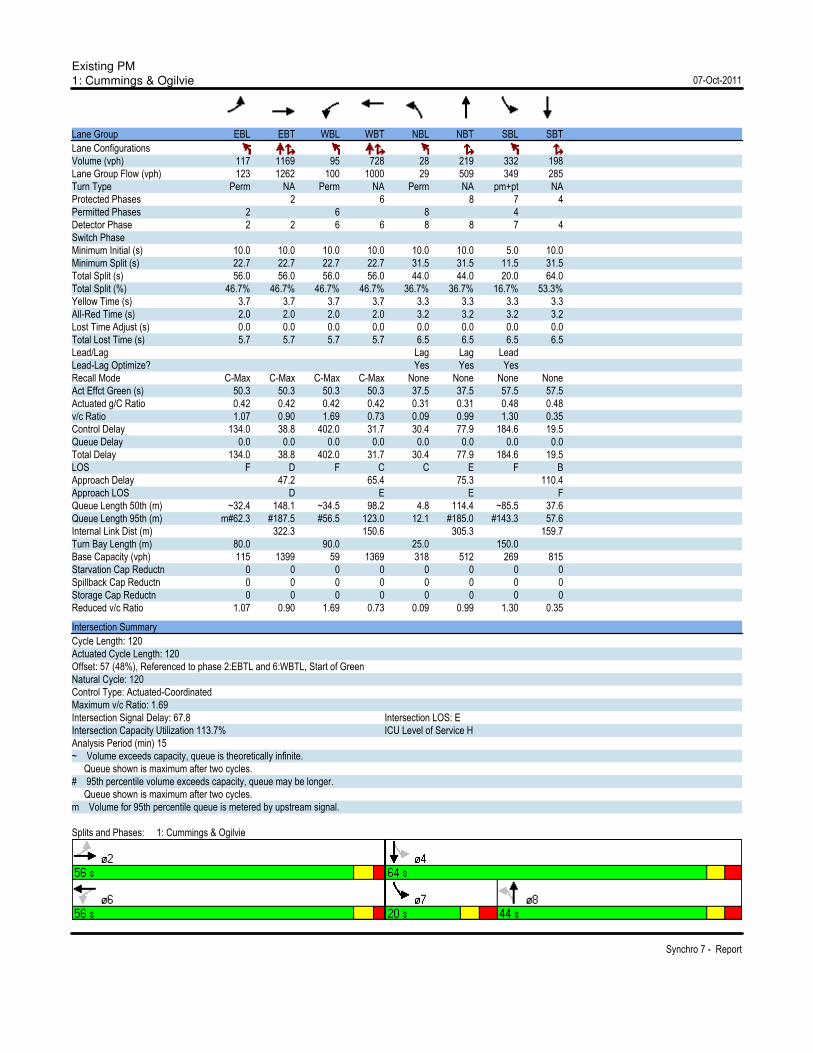
Existing PM
1: Cummings & Ogilvie 07-Oct-2011
Synchro 7 - Report
Lane Group EBL EBT WBL WBT NBL NBT SBL SBT
Lane Configurations
Volume (vph) 117 1169 95 728 28 219 332 198
Lane Group Flow (vph) 123 1262 100 1000 29 509 349 285
Turn Type Perm NA Perm NA Perm NA pm+pt NA
Protected Phases 2 6 8 7 4
Permitted Phases 2 6 8 4
Detector Phase 2 2 6 6 8 8 7 4
Switch Phase
Minimum Initial (s) 10.0 10.0 10.0 10.0 10.0 10.0 5.0 10.0
Minimum Split (s) 22.7 22.7 22.7 22.7 31.5 31.5 11.5 31.5
Total Split (s) 56.0 56.0 56.0 56.0 44.0 44.0 20.0 64.0
Total Split (%) 46.7% 46.7% 46.7% 46.7% 36.7% 36.7% 16.7% 53.3%
Yellow Time (s) 3.7 3.7 3.7 3.7 3.3 3.3 3.3 3.3
All-Red Time (s) 2.0 2.0 2.0 2.0 3.2 3.2 3.2 3.2
Lost Time Adjust (s) 0.0 0.0 0.0 0.0 0.0 0.0 0.0 0.0
Total Lost Time (s) 5.7 5.7 5.7 5.7 6.5 6.5 6.5 6.5
Lead/Lag Lag Lag Lead
Lead-Lag Optimize? Yes Yes Yes
Recall Mode C-Max C-Max C-Max C-Max None None None None
Act Effct Green (s) 50.3 50.3 50.3 50.3 37.5 37.5 57.5 57.5
Actuated g/C Ratio 0.42 0.42 0.42 0.42 0.31 0.31 0.48 0.48
v/c Ratio 1.07 0.90 1.69 0.73 0.09 0.99 1.30 0.35
Control Delay 134.0 38.8 402.0 31.7 30.4 77.9 184.6 19.5
Queue Delay 0.0 0.0 0.0 0.0 0.0 0.0 0.0 0.0
Total Delay 134.0 38.8 402.0 31.7 30.4 77.9 184.6 19.5
LOS F D F C C E F B
Approach Delay 47.2 65.4 75.3 110.4
Approach LOS D E E F
Queue Length 50th (m) ~32.4 148.1 ~34.5 98.2 4.8 114.4 ~85.5 37.6
Queue Length 95th (m) m#62.3 #187.5 #56.5 123.0 12.1 #185.0 #143.3 57.6
Internal Link Dist (m) 322.3 150.6 305.3 159.7
Turn Bay Length (m) 80.0 90.0 25.0 150.0
Base Capacity (vph) 115 1399 59 1369 318 512 269 815
Starvation Cap Reductn 0 0 0 0 0 0 0 0
Spillback Cap Reductn 0 0 0 0 0 0 0 0
Storage Cap Reductn 0 0 0 0 0 0 0 0
Reduced v/c Ratio 1.07 0.90 1.69 0.73 0.09 0.99 1.30 0.35
Intersection Summary
Cycle Length: 120
Actuated Cycle Length: 120
Offset: 57 (48%), Referenced to phase 2:EBTL and 6:WBTL, Start of Green
Natural Cycle: 120
Control Type: Actuated-Coordinated
Maximum v/c Ratio: 1.69
Intersection Signal Delay: 67.8 Intersection LOS: E
Intersection Capacity Utilization 113.7% ICU Level of Service H
Analysis Period (min) 15
~ Volume exceeds capacity, queue is theoretically infinite.
Queue shown is maximum after two cycles.
# 95th percentile volume exceeds capacity, queue may be longer.
Queue shown is maximum after two cycles.
m Volume for 95th percentile queue is metered by upstream signal.
Splits and Phases: 1: Cummings & Ogilvie

Existing PM
2: Cyrville & Ogilvie 07-Oct-2011
Synchro 7 - Report
Lane Group EBL EBT EBR WBL WBT WBR NBL NBT SBL SBT
Lane Configurations
Volume (vph) 4 964 173 63 729 130 117 236 138 213
Lane Group Flow (vph) 0 1019 182 66 767 137 123 282 145 318
Turn Type Perm NA Perm Perm NA Perm Perm NA Perm NA
Protected Phases 2 6 8 4
Permitted Phases 2 2 6 6 8 4
Detector Phase 2 2 2 6 6 6 8 8 4 4
Switch Phase
Minimum Initial (s) 10.0 10.0 10.0 10.0 10.0 10.0 10.0 10.0 10.0 10.0
Minimum Split (s) 27.2 27.2 27.2 27.2 27.2 27.2 38.1 38.1 38.1 38.1
Total Split (s) 70.0 70.0 70.0 70.0 70.0 70.0 50.0 50.0 50.0 50.0
Total Split (%) 58.3% 58.3% 58.3% 58.3% 58.3% 58.3% 41.7% 41.7% 41.7% 41.7%
Yellow Time (s) 3.7 3.7 3.7 3.7 3.7 3.7 3.7 3.7 3.7 3.7
All-Red Time (s) 2.5 2.5 2.5 2.5 2.5 2.5 3.4 3.4 3.4 3.4
Lost Time Adjust (s) 0.0 0.0 0.0 0.0 0.0 0.0 0.0 0.0 0.0 0.0
Total Lost Time (s) 6.2 6.2 6.2 6.2 6.2 6.2 7.1 7.1 7.1 7.1
Lead/Lag
Lead-Lag Optimize?
Recall Mode C-Max C-Max C-Max C-Max C-Max C-Max None None None None
Act Effct Green (s) 78.9 78.9 78.9 78.9 78.9 27.8 27.8 27.8 27.8
Actuated g/C Ratio 0.66 0.66 0.66 0.66 0.66 0.23 0.23 0.23 0.23
v/c Ratio 0.49 0.18 0.24 0.35 0.14 0.98 0.70 0.95 0.79
Control Delay 12.4 2.0 25.1 22.3 10.9 121.6 49.7 105.1 54.1
Queue Delay 0.0 0.0 0.0 0.0 0.0 0.0 0.0 0.0 0.0
Total Delay 12.4 2.0 25.1 22.3 10.9 121.6 49.7 105.1 54.1
LOS B A C C B F D F D
Approach Delay 10.8 20.9 71.6 70.0
Approach LOS B C E E
Queue Length 50th (m) 57.5 0.0 10.0 64.6 8.0 ~29.2 60.2 34.0 67.0
Queue Length 95th (m) 94.1 9.5 m17.7 89.7 m19.7 #56.4 79.3 #60.2 88.2
Internal Link Dist (m) 108.3 322.3 130.3 88.0
Turn Bay Length (m) 65.0 60.0 40.0 75.0
Base Capacity (vph) 2101 1001 279 2205 1011 193 622 236 611
Starvation Cap Reductn 0 0 0 0 0 0 0 0 0
Spillback Cap Reductn 0 0 0 0 0 0 0 0 0
Storage Cap Reductn 0 0 0 0 0 0 0 0 0
Reduced v/c Ratio 0.49 0.18 0.24 0.35 0.14 0.64 0.45 0.61 0.52
Intersection Summary
Cycle Length: 120
Actuated Cycle Length: 120
Offset: 24 (20%), Referenced to phase 2:EBTL and 6:WBTL, Start of Green
Natural Cycle: 70
Control Type: Actuated-Coordinated
Maximum v/c Ratio: 0.98
Intersection Signal Delay: 31.1 Intersection LOS: C
Intersection Capacity Utilization 101.1% ICU Level of Service G
Analysis Period (min) 15
~ Volume exceeds capacity, queue is theoretically infinite.
Queue shown is maximum after two cycles.
# 95th percentile volume exceeds capacity, queue may be longer.
Queue shown is maximum after two cycles.
m Volume for 95th percentile queue is metered by upstream signal.
Splits and Phases: 2: Cyrville & Ogilvie
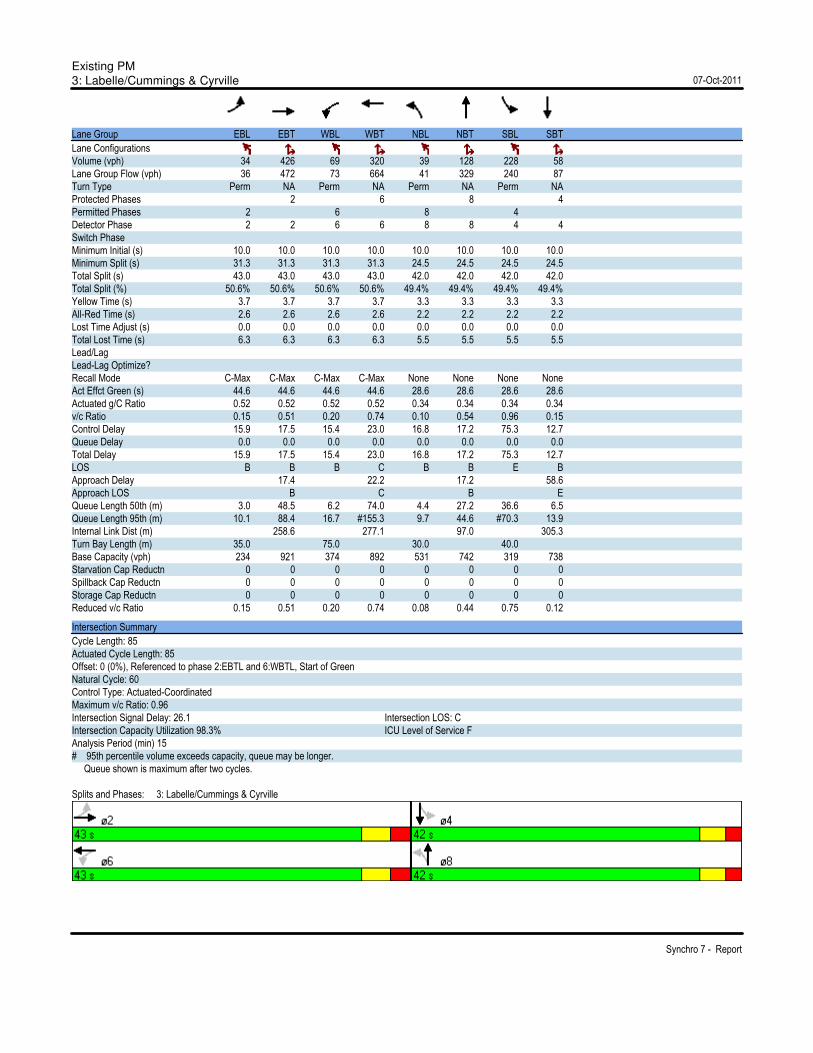
Existing PM
3: Labelle/Cummings & Cyrville 07-Oct-2011
Synchro 7 - Report
Lane Group EBL EBT WBL WBT NBL NBT SBL SBT
Lane Configurations
Volume (vph) 34 426 69 320 39 128 228 58
Lane Group Flow (vph) 36 472 73 664 41 329 240 87
Turn Type Perm NA Perm NA Perm NA Perm NA
Protected Phases 2 6 8 4
Permitted Phases 2 6 8 4
Detector Phase 2 2 6 6 8 8 4 4
Switch Phase
Minimum Initial (s) 10.0 10.0 10.0 10.0 10.0 10.0 10.0 10.0
Minimum Split (s) 31.3 31.3 31.3 31.3 24.5 24.5 24.5 24.5
Total Split (s) 43.0 43.0 43.0 43.0 42.0 42.0 42.0 42.0
Total Split (%) 50.6% 50.6% 50.6% 50.6% 49.4% 49.4% 49.4% 49.4%
Yellow Time (s) 3.7 3.7 3.7 3.7 3.3 3.3 3.3 3.3
All-Red Time (s) 2.6 2.6 2.6 2.6 2.2 2.2 2.2 2.2
Lost Time Adjust (s) 0.0 0.0 0.0 0.0 0.0 0.0 0.0 0.0
Total Lost Time (s) 6.3 6.3 6.3 6.3 5.5 5.5 5.5 5.5
Lead/Lag
Lead-Lag Optimize?
Recall Mode C-Max C-Max C-Max C-Max None None None None
Act Effct Green (s) 44.6 44.6 44.6 44.6 28.6 28.6 28.6 28.6
Actuated g/C Ratio 0.52 0.52 0.52 0.52 0.34 0.34 0.34 0.34
v/c Ratio 0.15 0.51 0.20 0.74 0.10 0.54 0.96 0.15
Control Delay 15.9 17.5 15.4 23.0 16.8 17.2 75.3 12.7
Queue Delay 0.0 0.0 0.0 0.0 0.0 0.0 0.0 0.0
Total Delay 15.9 17.5 15.4 23.0 16.8 17.2 75.3 12.7
LOS B B B C B B E B
Approach Delay 17.4 22.2 17.2 58.6
Approach LOS B C B E
Queue Length 50th (m) 3.0 48.5 6.2 74.0 4.4 27.2 36.6 6.5
Queue Length 95th (m) 10.1 88.4 16.7 #155.3 9.7 44.6 #70.3 13.9
Internal Link Dist (m) 258.6 277.1 97.0 305.3
Turn Bay Length (m) 35.0 75.0 30.0 40.0
Base Capacity (vph) 234 921 374 892 531 742 319 738
Starvation Cap Reductn 0 0 0 0 0 0 0 0
Spillback Cap Reductn 0 0 0 0 0 0 0 0
Storage Cap Reductn 0 0 0 0 0 0 0 0
Reduced v/c Ratio 0.15 0.51 0.20 0.74 0.08 0.44 0.75 0.12
Intersection Summary
Cycle Length: 85
Actuated Cycle Length: 85
Offset: 0 (0%), Referenced to phase 2:EBTL and 6:WBTL, Start of Green
Natural Cycle: 60
Control Type: Actuated-Coordinated
Maximum v/c Ratio: 0.96
Intersection Signal Delay: 26.1 Intersection LOS: C
Intersection Capacity Utilization 98.3% ICU Level of Service F
Analysis Period (min) 15
# 95th percentile volume exceeds capacity, queue may be longer.
Queue shown is maximum after two cycles.
Splits and Phases: 3: Labelle/Cummings & Cyrville

Appendix C Projected Peak Hour Capacity Analysis

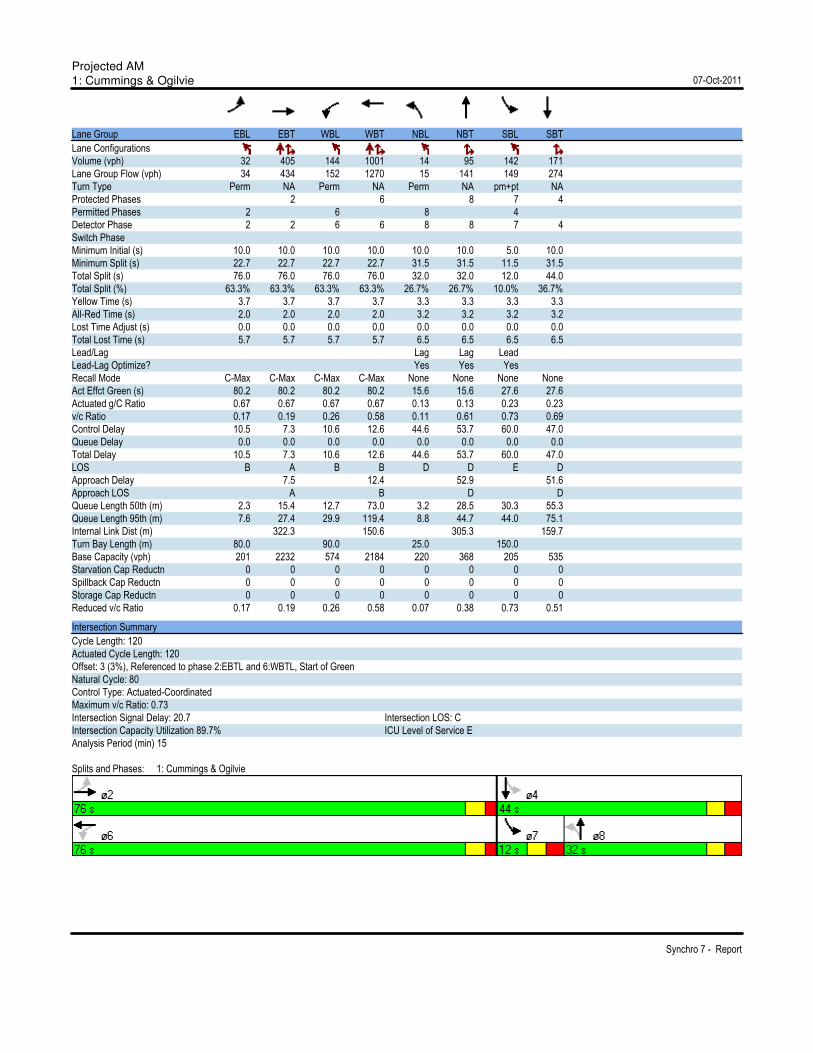
Projected AM
1: Cummings & Ogilvie 07-Oct-2011
Synchro 7 - Report
Lane Group EBL EBT WBL WBT NBL NBT SBL SBT
Lane Configurations
Volume (vph) 32 405 144 1001 14 95 142 171
Lane Group Flow (vph) 34 434 152 1270 15 141 149 274
Turn Type Perm NA Perm NA Perm NA pm+pt NA
Protected Phases 2 6 8 7 4
Permitted Phases 2 6 8 4
Detector Phase 2 2 6 6 8 8 7 4
Switch Phase
Minimum Initial (s) 10.0 10.0 10.0 10.0 10.0 10.0 5.0 10.0
Minimum Split (s) 22.7 22.7 22.7 22.7 31.5 31.5 11.5 31.5
Total Split (s) 76.0 76.0 76.0 76.0 32.0 32.0 12.0 44.0
Total Split (%) 63.3% 63.3% 63.3% 63.3% 26.7% 26.7% 10.0% 36.7%
Yellow Time (s) 3.7 3.7 3.7 3.7 3.3 3.3 3.3 3.3
All-Red Time (s) 2.0 2.0 2.0 2.0 3.2 3.2 3.2 3.2
Lost Time Adjust (s) 0.0 0.0 0.0 0.0 0.0 0.0 0.0 0.0
Total Lost Time (s) 5.7 5.7 5.7 5.7 6.5 6.5 6.5 6.5
Lead/Lag Lag Lag Lead
Lead-Lag Optimize? Yes Yes Yes
Recall Mode C-Max C-Max C-Max C-Max None None None None
Act Effct Green (s) 80.2 80.2 80.2 80.2 15.6 15.6 27.6 27.6
Actuated g/C Ratio 0.67 0.67 0.67 0.67 0.13 0.13 0.23 0.23
v/c Ratio 0.17 0.19 0.26 0.58 0.11 0.61 0.73 0.69
Control Delay 10.5 7.3 10.6 12.6 44.6 53.7 60.0 47.0
Queue Delay 0.0 0.0 0.0 0.0 0.0 0.0 0.0 0.0
Total Delay 10.5 7.3 10.6 12.6 44.6 53.7 60.0 47.0
LOS B A B B D D E D
Approach Delay 7.5 12.4 52.9 51.6
Approach LOS A B D D
Queue Length 50th (m) 2.3 15.4 12.7 73.0 3.2 28.5 30.3 55.3
Queue Length 95th (m) 7.6 27.4 29.9 119.4 8.8 44.7 44.0 75.1
Internal Link Dist (m) 322.3 150.6 305.3 159.7
Turn Bay Length (m) 80.0 90.0 25.0 150.0
Base Capacity (vph) 201 2232 574 2184 220 368 205 535
Starvation Cap Reductn 0 0 0 0 0 0 0 0
Spillback Cap Reductn 0 0 0 0 0 0 0 0
Storage Cap Reductn 0 0 0 0 0 0 0 0
Reduced v/c Ratio 0.17 0.19 0.26 0.58 0.07 0.38 0.73 0.51
Intersection Summary
Cycle Length: 120
Actuated Cycle Length: 120
Offset: 3 (3%), Referenced to phase 2:EBTL and 6:WBTL, Start of Green
Natural Cycle: 80
Control Type: Actuated-Coordinated
Maximum v/c Ratio: 0.73
Intersection Signal Delay: 20.7 Intersection LOS: C
Intersection Capacity Utilization 89.7% ICU Level of Service E
Analysis Period (min) 15
Splits and Phases: 1: Cummings & Ogilvie
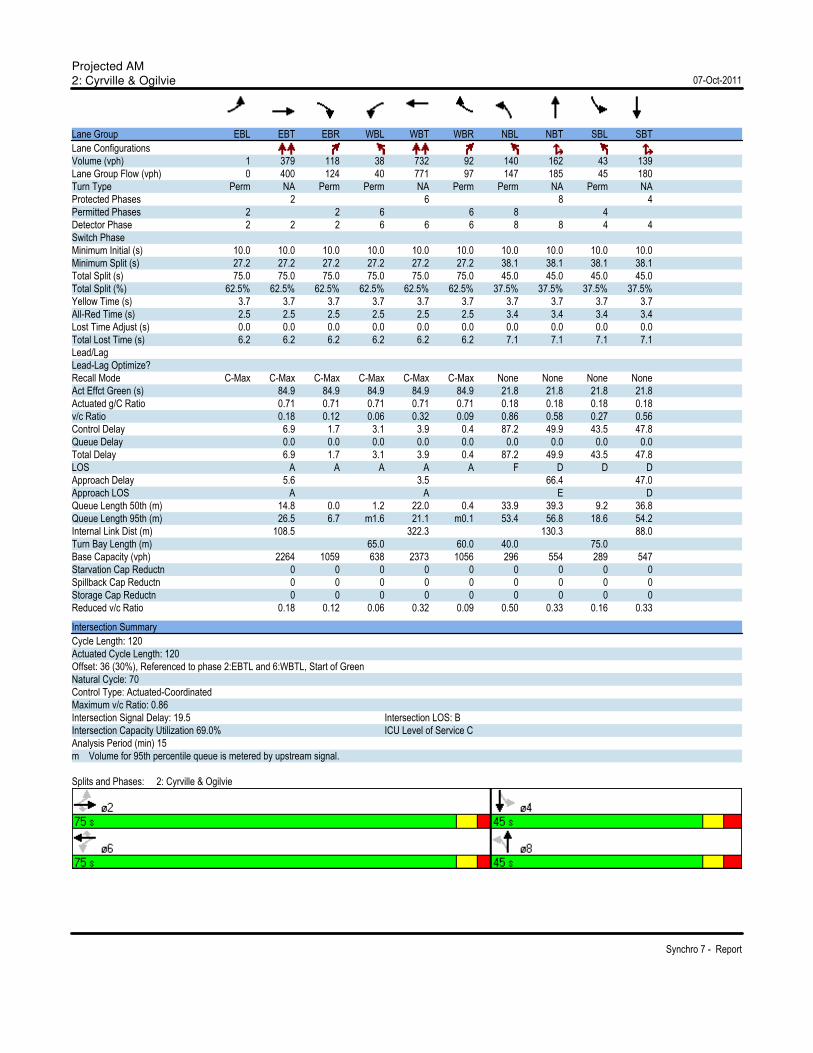
Projected AM
2: Cyrville & Ogilvie 07-Oct-2011
Synchro 7 - Report
Lane Group EBL EBT EBR WBL WBT WBR NBL NBT SBL SBT
Lane Configurations
Volume (vph) 1 379 118 38 732 92 140 162 43 139
Lane Group Flow (vph) 0 400 124 40 771 97 147 185 45 180
Turn Type Perm NA Perm Perm NA Perm Perm NA Perm NA
Protected Phases 2 6 8 4
Permitted Phases 2 2 6 6 8 4
Detector Phase 2 2 2 6 6 6 8 8 4 4
Switch Phase
Minimum Initial (s) 10.0 10.0 10.0 10.0 10.0 10.0 10.0 10.0 10.0 10.0
Minimum Split (s) 27.2 27.2 27.2 27.2 27.2 27.2 38.1 38.1 38.1 38.1
Total Split (s) 75.0 75.0 75.0 75.0 75.0 75.0 45.0 45.0 45.0 45.0
Total Split (%) 62.5% 62.5% 62.5% 62.5% 62.5% 62.5% 37.5% 37.5% 37.5% 37.5%
Yellow Time (s) 3.7 3.7 3.7 3.7 3.7 3.7 3.7 3.7 3.7 3.7
All-Red Time (s) 2.5 2.5 2.5 2.5 2.5 2.5 3.4 3.4 3.4 3.4
Lost Time Adjust (s) 0.0 0.0 0.0 0.0 0.0 0.0 0.0 0.0 0.0 0.0
Total Lost Time (s) 6.2 6.2 6.2 6.2 6.2 6.2 7.1 7.1 7.1 7.1
Lead/Lag
Lead-Lag Optimize?
Recall Mode C-Max C-Max C-Max C-Max C-Max C-Max None None None None
Act Effct Green (s) 84.9 84.9 84.9 84.9 84.9 21.8 21.8 21.8 21.8
Actuated g/C Ratio 0.71 0.71 0.71 0.71 0.71 0.18 0.18 0.18 0.18
v/c Ratio 0.18 0.12 0.06 0.32 0.09 0.86 0.58 0.27 0.56
Control Delay 6.9 1.7 3.1 3.9 0.4 87.2 49.9 43.5 47.8
Queue Delay 0.0 0.0 0.0 0.0 0.0 0.0 0.0 0.0 0.0
Total Delay 6.9 1.7 3.1 3.9 0.4 87.2 49.9 43.5 47.8
LOS A A A A A F D D D
Approach Delay 5.6 3.5 66.4 47.0
Approach LOS A A E D
Queue Length 50th (m) 14.8 0.0 1.2 22.0 0.4 33.9 39.3 9.2 36.8
Queue Length 95th (m) 26.5 6.7 m1.6 21.1 m0.1 53.4 56.8 18.6 54.2
Internal Link Dist (m) 108.5 322.3 130.3 88.0
Turn Bay Length (m) 65.0 60.0 40.0 75.0
Base Capacity (vph) 2264 1059 638 2373 1056 296 554 289 547
Starvation Cap Reductn 0 0 0 0 0 0 0 0 0
Spillback Cap Reductn 0 0 0 0 0 0 0 0 0
Storage Cap Reductn 0 0 0 0 0 0 0 0 0
Reduced v/c Ratio 0.18 0.12 0.06 0.32 0.09 0.50 0.33 0.16 0.33
Intersection Summary
Cycle Length: 120
Actuated Cycle Length: 120
Offset: 36 (30%), Referenced to phase 2:EBTL and 6:WBTL, Start of Green
Natural Cycle: 70
Control Type: Actuated-Coordinated
Maximum v/c Ratio: 0.86
Intersection Signal Delay: 19.5 Intersection LOS: B
Intersection Capacity Utilization 69.0% ICU Level of Service C
Analysis Period (min) 15
m Volume for 95th percentile queue is metered by upstream signal.
Splits and Phases: 2: Cyrville & Ogilvie
Projected AM
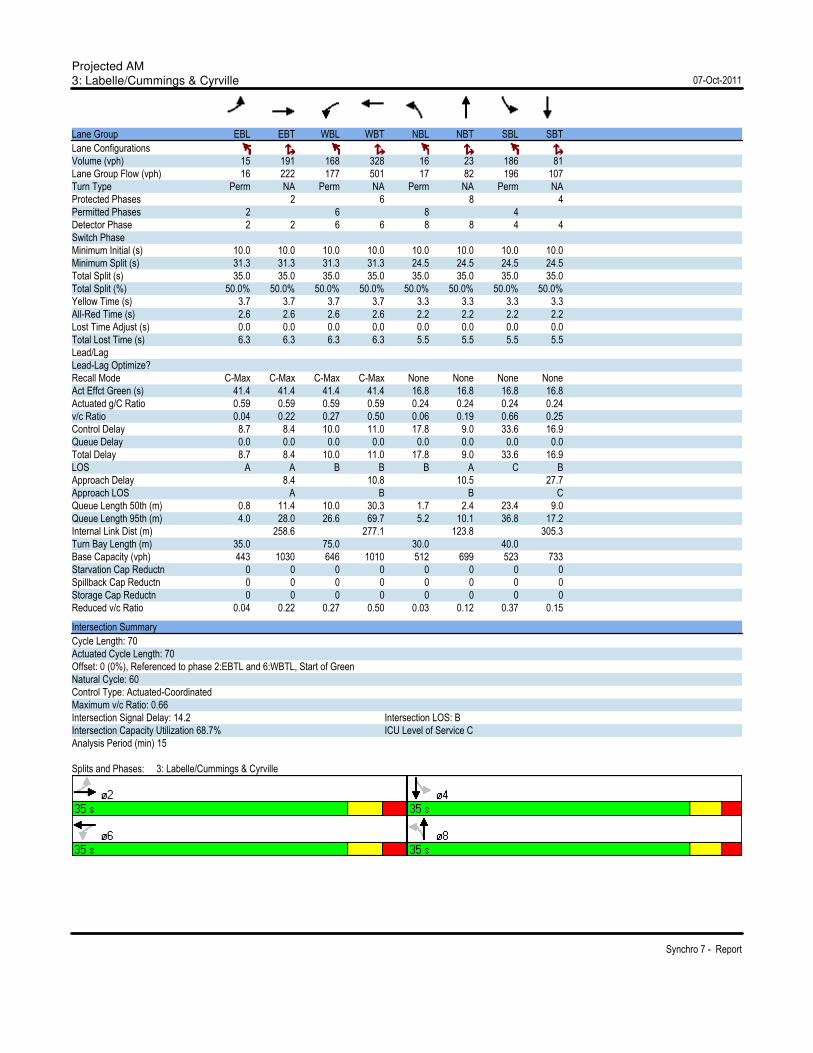
3: Labelle/Cummings & Cyrville 07-Oct-2011
Synchro 7 - Report
Lane Group EBL EBT WBL WBT NBL NBT SBL SBT
Lane Configurations
Volume (vph) 15 191 168 328 16 23 186 81
Lane Group Flow (vph) 16 222 177 501 17 82 196 107
Turn Type Perm NA Perm NA Perm NA Perm NA
Protected Phases 2 6 8 4
Permitted Phases 2 6 8 4
Detector Phase 2 2 6 6 8 8 4 4
Switch Phase
Minimum Initial (s) 10.0 10.0 10.0 10.0 10.0 10.0 10.0 10.0
Minimum Split (s) 31.3 31.3 31.3 31.3 24.5 24.5 24.5 24.5
Total Split (s) 35.0 35.0 35.0 35.0 35.0 35.0 35.0 35.0
Total Split (%) 50.0% 50.0% 50.0% 50.0% 50.0% 50.0% 50.0% 50.0%
Yellow Time (s) 3.7 3.7 3.7 3.7 3.3 3.3 3.3 3.3
All-Red Time (s) 2.6 2.6 2.6 2.6 2.2 2.2 2.2 2.2
Lost Time Adjust (s) 0.0 0.0 0.0 0.0 0.0 0.0 0.0 0.0
Total Lost Time (s) 6.3 6.3 6.3 6.3 5.5 5.5 5.5 5.5
Lead/Lag
Lead-Lag Optimize?
Recall Mode C-Max C-Max C-Max C-Max None None None None
Act Effct Green (s) 41.4 41.4 41.4 41.4 16.8 16.8 16.8 16.8
Actuated g/C Ratio 0.59 0.59 0.59 0.59 0.24 0.24 0.24 0.24
v/c Ratio 0.04 0.22 0.27 0.50 0.06 0.19 0.66 0.25
Control Delay 8.7 8.4 10.0 11.0 17.8 9.0 33.6 16.9
Queue Delay 0.0 0.0 0.0 0.0 0.0 0.0 0.0 0.0
Total Delay 8.7 8.4 10.0 11.0 17.8 9.0 33.6 16.9
LOS A A B B B A C B
Approach Delay 8.4 10.8 10.5 27.7
Approach LOS A B B C
Queue Length 50th (m) 0.8 11.4 10.0 30.3 1.7 2.4 23.4 9.0
Queue Length 95th (m) 4.0 28.0 26.6 69.7 5.2 10.1 36.8 17.2
Internal Link Dist (m) 258.6 277.1 123.8 305.3
Turn Bay Length (m) 35.0 75.0 30.0 40.0
Base Capacity (vph) 443 1030 646 1010 512 699 523 733
Starvation Cap Reductn 0 0 0 0 0 0 0 0
Spillback Cap Reductn 0 0 0 0 0 0 0 0
Storage Cap Reductn 0 0 0 0 0 0 0 0
Reduced v/c Ratio 0.04 0.22 0.27 0.50 0.03 0.12 0.37 0.15
Intersection Summary
Cycle Length: 70
Actuated Cycle Length: 70
Offset: 0 (0%), Referenced to phase 2:EBTL and 6:WBTL, Start of Green
Natural Cycle: 60
Control Type: Actuated-Coordinated
Maximum v/c Ratio: 0.66
Intersection Signal Delay: 14.2 Intersection LOS: B
Intersection Capacity Utilization 68.7% ICU Level of Service C
Analysis Period (min) 15
Splits and Phases: 3: Labelle/Cummings & Cyrville
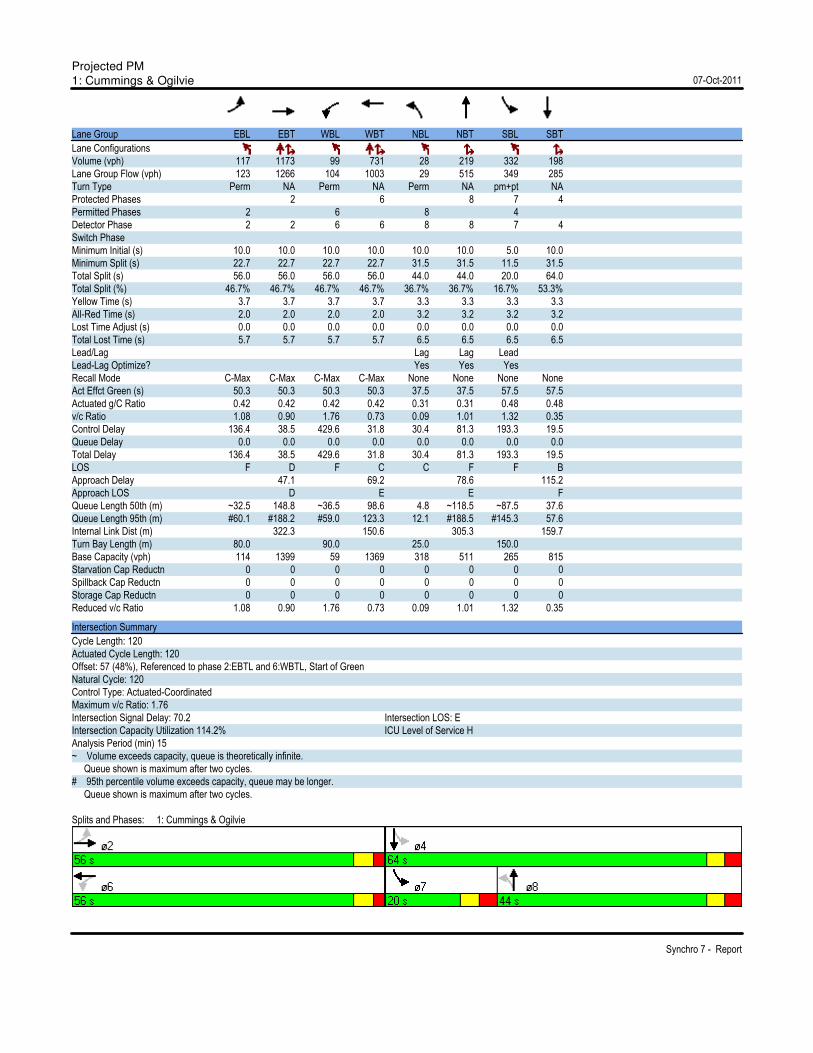
Projected PM
1: Cummings & Ogilvie 07-Oct-2011
Synchro 7 - Report
Lane Group EBL EBT WBL WBT NBL NBT SBL SBT
Lane Configurations
Volume (vph) 117 1173 99 731 28 219 332 198
Lane Group Flow (vph) 123 1266 104 1003 29 515 349 285
Turn Type Perm NA Perm NA Perm NA pm+pt NA
Protected Phases 2 6 8 7 4
Permitted Phases 2 6 8 4
Detector Phase 2 2 6 6 8 8 7 4
Switch Phase
Minimum Initial (s) 10.0 10.0 10.0 10.0 10.0 10.0 5.0 10.0
Minimum Split (s) 22.7 22.7 22.7 22.7 31.5 31.5 11.5 31.5
Total Split (s) 56.0 56.0 56.0 56.0 44.0 44.0 20.0 64.0
Total Split (%) 46.7% 46.7% 46.7% 46.7% 36.7% 36.7% 16.7% 53.3%
Yellow Time (s) 3.7 3.7 3.7 3.7 3.3 3.3 3.3 3.3
All-Red Time (s) 2.0 2.0 2.0 2.0 3.2 3.2 3.2 3.2
Lost Time Adjust (s) 0.0 0.0 0.0 0.0 0.0 0.0 0.0 0.0
Total Lost Time (s) 5.7 5.7 5.7 5.7 6.5 6.5 6.5 6.5
Lead/Lag Lag Lag Lead
Lead-Lag Optimize? Yes Yes Yes
Recall Mode C-Max C-Max C-Max C-Max None None None None
Act Effct Green (s) 50.3 50.3 50.3 50.3 37.5 37.5 57.5 57.5
Actuated g/C Ratio 0.42 0.42 0.42 0.42 0.31 0.31 0.48 0.48
v/c Ratio 1.08 0.90 1.76 0.73 0.09 1.01 1.32 0.35
Control Delay 136.4 38.5 429.6 31.8 30.4 81.3 193.3 19.5
Queue Delay 0.0 0.0 0.0 0.0 0.0 0.0 0.0 0.0
Total Delay 136.4 38.5 429.6 31.8 30.4 81.3 193.3 19.5
LOS F D F C C F F B
Approach Delay 47.1 69.2 78.6 115.2
Approach LOS D E E F
Queue Length 50th (m) ~32.5 148.8 ~36.5 98.6 4.8 ~118.5 ~87.5 37.6
Queue Length 95th (m) #60.1 #188.2 #59.0 123.3 12.1 #188.5 #145.3 57.6
Internal Link Dist (m) 322.3 150.6 305.3 159.7
Turn Bay Length (m) 80.0 90.0 25.0 150.0
Base Capacity (vph) 114 1399 59 1369 318 511 265 815
Starvation Cap Reductn 0 0 0 0 0 0 0 0
Spillback Cap Reductn 0 0 0 0 0 0 0 0
Storage Cap Reductn 0 0 0 0 0 0 0 0
Reduced v/c Ratio 1.08 0.90 1.76 0.73 0.09 1.01 1.32 0.35
Intersection Summary
Cycle Length: 120
Actuated Cycle Length: 120
Offset: 57 (48%), Referenced to phase 2:EBTL and 6:WBTL, Start of Green
Natural Cycle: 120
Control Type: Actuated-Coordinated
Maximum v/c Ratio: 1.76
Intersection Signal Delay: 70.2 Intersection LOS: E
Intersection Capacity Utilization 114.2% ICU Level of Service H
Analysis Period (min) 15
~ Volume exceeds capacity, queue is theoretically infinite.
Queue shown is maximum after two cycles.
# 95th percentile volume exceeds capacity, queue may be longer.
Queue shown is maximum after two cycles.
Splits and Phases: 1: Cummings & Ogilvie
Projected PM
2: Cyrville & Ogilvie 07-Oct-2011
Synchro 7 - Report
Lane Group EBL EBT EBR WBL WBT WBR NBL NBT SBL SBT
Lane Configurations
Volume (vph) 4 964 185 66 729 130 140 236 138 213
Lane Group Flow (vph) 0 1019 195 69 767 137 147 286 145 318
Turn Type Perm NA Perm Perm NA Perm Perm NA Perm NA
Protected Phases 2 6 8 4
Permitted Phases 2 2 6 6 8 4
Detector Phase 2 2 2 6 6 6 8 8 4 4
Switch Phase
Minimum Initial (s) 10.0 10.0 10.0 10.0 10.0 10.0 10.0 10.0 10.0 10.0
Minimum Split (s) 27.2 27.2 27.2 27.2 27.2 27.2 38.1 38.1 38.1 38.1
Total Split (s) 70.0 70.0 70.0 70.0 70.0 70.0 50.0 50.0 50.0 50.0
Total Split (%) 58.3% 58.3% 58.3% 58.3% 58.3% 58.3% 41.7% 41.7% 41.7% 41.7%
Yellow Time (s) 3.7 3.7 3.7 3.7 3.7 3.7 3.7 3.7 3.7 3.7
All-Red Time (s) 2.5 2.5 2.5 2.5 2.5 2.5 3.4 3.4 3.4 3.4
Lost Time Adjust (s) 0.0 0.0 0.0 0.0 0.0 0.0 0.0 0.0 0.0 0.0
Total Lost Time (s) 6.2 6.2 6.2 6.2 6.2 6.2 7.1 7.1 7.1 7.1
Lead/Lag
Lead-Lag Optimize?
Recall Mode C-Max C-Max C-Max C-Max C-Max C-Max None None None None
Act Effct Green (s) 77.6 77.6 77.6 77.6 77.6 29.1 29.1 29.1 29.1
Actuated g/C Ratio 0.65 0.65 0.65 0.65 0.65 0.24 0.24 0.24 0.24
v/c Ratio 0.49 0.20 0.26 0.35 0.14 1.07 0.67 0.89 0.76
Control Delay 13.4 2.2 27.1 23.5 11.5 137.2 47.0 88.8 50.0
Queue Delay 0.0 0.0 0.0 0.0 0.0 0.0 0.0 0.0 0.0
Total Delay 13.4 2.2 27.1 23.5 11.5 137.2 47.0 88.8 50.0
LOS B A C C B F D F D
Approach Delay 11.6 22.1 77.6 62.2
Approach LOS B C E E
Queue Length 50th (m) 59.5 0.0 10.7 65.3 8.1 ~38.9 60.3 33.4 66.1
Queue Length 95th (m) 101.0 10.4 m18.9 91.6 m19.5 #64.4 76.7 52.8 84.4
Internal Link Dist (m) 108.3 322.3 130.3 88.0
Turn Bay Length (m) 65.0 60.0 40.0 75.0
Base Capacity (vph) 2066 992 270 2168 996 204 622 240 611
Starvation Cap Reductn 0 0 0 0 0 0 0 0 0
Spillback Cap Reductn 0 0 0 0 0 0 0 0 0
Storage Cap Reductn 0 0 0 0 0 0 0 0 0
Reduced v/c Ratio 0.49 0.20 0.26 0.35 0.14 0.72 0.46 0.60 0.52
Intersection Summary
Cycle Length: 120
Actuated Cycle Length: 120
Offset: 24 (20%), Referenced to phase 2:EBTL and 6:WBTL, Start of Green
Natural Cycle: 70
Control Type: Actuated-Coordinated
Maximum v/c Ratio: 1.07
Intersection Signal Delay: 31.8 Intersection LOS: C
Intersection Capacity Utilization 101.1% ICU Level of Service G
Analysis Period (min) 15
~ Volume exceeds capacity, queue is theoretically infinite.
Queue shown is maximum after two cycles.
# 95th percentile volume exceeds capacity, queue may be longer.
Queue shown is maximum after two cycles.
m Volume for 95th percentile queue is metered by upstream signal.
Splits and Phases: 2: Cyrville & Ogilvie

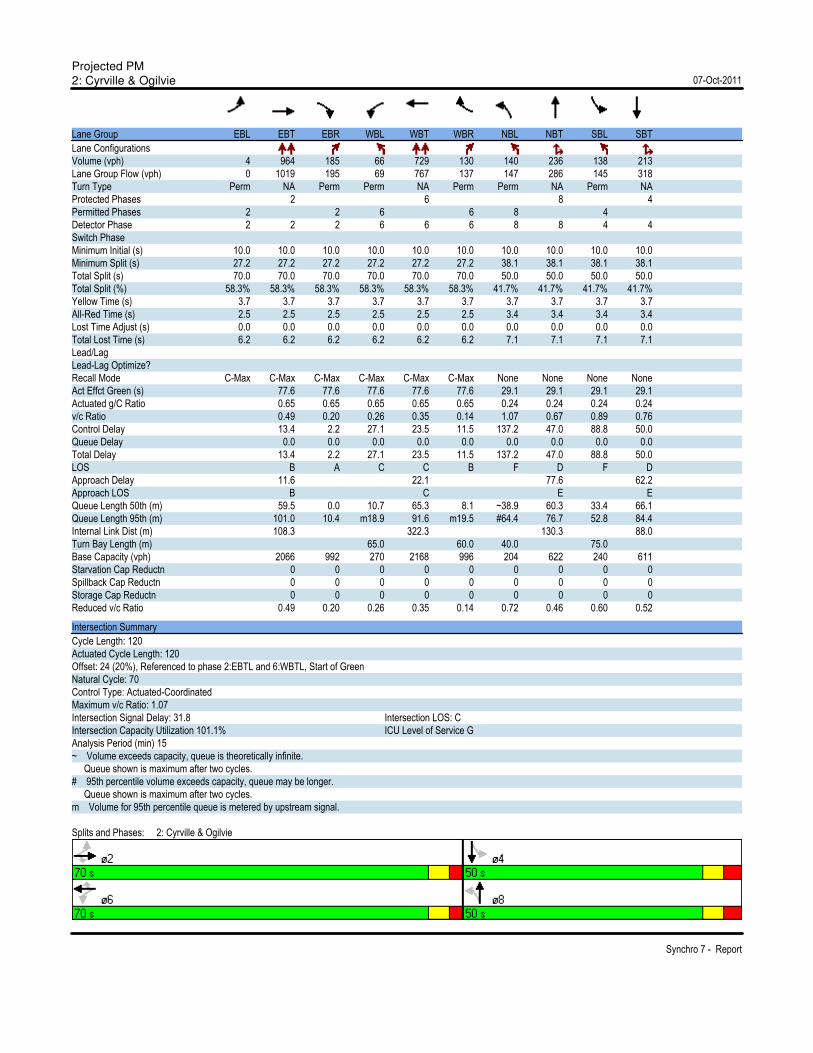
Projected PM
3: Labelle/Cummings & Cyrville 07-Oct-2011
Synchro 7 - Report
Lane Group EBL EBT WBL WBT NBL NBT SBL SBT
Lane Configurations
Volume (vph) 40 427 69 321 44 128 228 58
Lane Group Flow (vph) 42 477 73 665 46 329 240 92
Turn Type Perm NA Perm NA Perm NA Perm NA
Protected Phases 2 6 8 4
Permitted Phases 2 6 8 4
Detector Phase 2 2 6 6 8 8 4 4
Switch Phase
Minimum Initial (s) 10.0 10.0 10.0 10.0 10.0 10.0 10.0 10.0
Minimum Split (s) 31.3 31.3 31.3 31.3 24.5 24.5 24.5 24.5
Total Split (s) 43.0 43.0 43.0 43.0 42.0 42.0 42.0 42.0
Total Split (%) 50.6% 50.6% 50.6% 50.6% 49.4% 49.4% 49.4% 49.4%
Yellow Time (s) 3.7 3.7 3.7 3.7 3.3 3.3 3.3 3.3
All-Red Time (s) 2.6 2.6 2.6 2.6 2.2 2.2 2.2 2.2
Lost Time Adjust (s) 0.0 0.0 0.0 0.0 0.0 0.0 0.0 0.0
Total Lost Time (s) 6.3 6.3 6.3 6.3 5.5 5.5 5.5 5.5
Lead/Lag
Lead-Lag Optimize?
Recall Mode C-Max C-Max C-Max C-Max None None None None
Act Effct Green (s) 44.6 44.6 44.6 44.6 28.6 28.6 28.6 28.6
Actuated g/C Ratio 0.52 0.52 0.52 0.52 0.34 0.34 0.34 0.34
v/c Ratio 0.18 0.52 0.20 0.75 0.11 0.54 0.96 0.16
Control Delay 16.4 17.5 15.5 23.0 17.1 17.2 75.3 12.2
Queue Delay 0.0 0.0 0.0 0.0 0.0 0.0 0.0 0.0
Total Delay 16.4 17.5 15.5 23.0 17.1 17.2 75.3 12.2
LOS B B B C B B E B
Approach Delay 17.5 22.3 17.2 57.8
Approach LOS B C B E
Queue Length 50th (m) 3.5 49.2 6.2 74.3 4.9 27.2 36.6 6.5
Queue Length 95th (m) 11.5 89.4 16.7 #155.6 10.5 44.6 #70.3 14.3
Internal Link Dist (m) 258.6 277.1 97.0 305.3
Turn Bay Length (m) 35.0 75.0 30.0 40.0
Base Capacity (vph) 234 920 371 892 528 742 319 737
Starvation Cap Reductn 0 0 0 0 0 0 0 0
Spillback Cap Reductn 0 0 0 0 0 0 0 0
Storage Cap Reductn 0 0 0 0 0 0 0 0
Reduced v/c Ratio 0.18 0.52 0.20 0.75 0.09 0.44 0.75 0.12
Intersection Summary
Cycle Length: 85
Actuated Cycle Length: 85
Offset: 0 (0%), Referenced to phase 2:EBTL and 6:WBTL, Start of Green
Natural Cycle: 60
Control Type: Actuated-Coordinated
Maximum v/c Ratio: 0.96
Intersection Signal Delay: 26.0 Intersection LOS: C
Intersection Capacity Utilization 98.4% ICU Level of Service F
Analysis Period (min) 15
# 95th percentile volume exceeds capacity, queue may be longer.
Queue shown is maximum after two cycles.
Splits and Phases: 3: Labelle/Cummings & Cyrville
Related Documents