Re-conceptualising the reckless driving behaviour of young drivers Brenton McNally* and Graham L. Bradley School of Applied Psychology, Griffith University, Gold Coast, Australia, Behavioural Basis of Health Research Centre, Griffith Health Institute, Queensland, Australia Abstract Reckless driving is a major contributing factor to road morbidity and mortality. While further research into the nature and impact of reckless driving, particularly among young people, is urgently needed, the measurement of reckless driving behaviour also requires increased attention. Three major shortcomings apparent in established measures of driver behaviour are that they do not target the full range of reckless driving behaviours, they measure characteristics other than driving behaviours, and/or they fail to categorise and label reckless driver behaviour based on characteristics of the behaviours themselves. To combat these shortcomings, this paper reports the development and preliminary validation of a new measure of reckless driving behaviour for young drivers. Exploratory factor analysis of self- reported driving data revealed four, conceptually distinct categories of reckless driving behaviour: those that increase crash-risk due to (a) distractions or deficits in perception, attention or reaction time (labelled “distracted”), (b) driving under the influence of drugs or alcohol (labelled “substance-use”), (c) placing the vehicle in an unsafe environment beyond its design expectations (labelled “extreme”), and (d) speed and positioning of the vehicle relative to other vehicles and objects (labelled “positioning”). Confirmatory factor analysis of data collected from a separate, community sample confirmed this four-factor structure. Multiple regression analyses found differences in the demographic and psychological variables related to these four factors, suggesting that interventions in one reckless driving domain may not be helpful in others. Keywords: Reckless driving; young drivers; scale development; driver behaviour; factor analysis; risky behaviour Email address: [email protected] (B. McNally), [email protected] (G. L. Bradley) *Corresponding Author: Tel: +61 7 56788119.

Welcome message from author
This document is posted to help you gain knowledge. Please leave a comment to let me know what you think about it! Share it to your friends and learn new things together.
Transcript
Re-conceptualising the reckless driving behaviour of young drivers
Brenton McNally* and Graham L. Bradley
School of Applied Psychology, Griffith University, Gold Coast, Australia, Behavioural Basis
of Health Research Centre, Griffith Health Institute, Queensland, Australia
Abstract
Reckless driving is a major contributing factor to road morbidity and mortality. While further
research into the nature and impact of reckless driving, particularly among young people, is
urgently needed, the measurement of reckless driving behaviour also requires increased
attention. Three major shortcomings apparent in established measures of driver behaviour are
that they do not target the full range of reckless driving behaviours, they measure
characteristics other than driving behaviours, and/or they fail to categorise and label reckless
driver behaviour based on characteristics of the behaviours themselves. To combat these
shortcomings, this paper reports the development and preliminary validation of a new
measure of reckless driving behaviour for young drivers. Exploratory factor analysis of self-
reported driving data revealed four, conceptually distinct categories of reckless driving
behaviour: those that increase crash-risk due to (a) distractions or deficits in perception,
attention or reaction time (labelled “distracted”), (b) driving under the influence of drugs or
alcohol (labelled “substance-use”), (c) placing the vehicle in an unsafe environment beyond
its design expectations (labelled “extreme”), and (d) speed and positioning of the vehicle
relative to other vehicles and objects (labelled “positioning”). Confirmatory factor analysis of
data collected from a separate, community sample confirmed this four-factor structure.
Multiple regression analyses found differences in the demographic and psychological
variables related to these four factors, suggesting that interventions in one reckless driving
domain may not be helpful in others.
Keywords: Reckless driving; young drivers; scale development; driver behaviour; factor
analysis; risky behaviour
Email address: [email protected] (B. McNally), [email protected] (G. L.
Bradley)
*Corresponding Author: Tel: +61 7 56788119.

1. Introduction
Research is increasingly suggesting that risk-taking is a multi-dimensional construct
(Gibbons et al., 2006). Consistent with this, several researchers have sought to categorise
driving behaviours into meaningful subtypes (Dula & Geller, 2003; Maslowsky et al., 2010;
Reason et al., 1990; Schmidt, 2012). Arnett (1992) distinguishes between risk and reckless
behaviours, defining risk behaviours as thrill-seeking activities that have mainstream social
approval, and defining reckless behaviours as those lacking such social approval, carrying
stronger connotations for negative consequences, and involving a failure to take available
precautions. Reckless driving behaviours satisfy all three of Arnett‟s criteria of recklessness:
they lack mainstream social approval and may even involve violations of the law (Jessor et
al., 1997; Maslowsky et al., 2010); they carry strong connotations of negative consequences
by placing drivers and/or their passengers at risk of morbidity, mortality, and other negative
outcomes (Patil et al., 2006); and, by definition, they involve deliberate deviations from safe
driving (Malta, 2004).The focus of the current research was thus on behaviours in which
there is a failure to take available precautions, while other behaviours, described elsewhere as
errors (Reason et al., 1990), were excluded from study.
We aimed to re-conceptualise reckless driving behaviours and thereby contribute to
the existing road safety literature by identifying coherent and relevant subtypes of behaviour
within this domain. Achievement of this goal will assist future research in uncovering the
antecedents of conceptually distinct categories of behaviour and designing interventions
suitable for each behavioural category. The focus of the current research was also on the
measurement of these behaviours in young drivers, a group requiring better informed road
safety interventions (Glendon et al., 2014).
1.1. Types of reckless driving behaviour
The literature provides many examples of what could be described as reckless driving
behaviour. Perhaps the most widely studied example is driving a vehicle at excessive speeds.
Speeding has been found to increase the likelihood of crash involvement, commonly
implicated in vehicle crashes (Blows et al., 2005; Rundmo & Iversen, 2002; Fernandes et al.,
2007; Parker, 2002; Simons-Morton et al., 2005; Smart et al., 2005). Smart and colleagues
(2005) found that 31% of a large sample of young drivers had been detected speeding at least
once, and 80% reported exceeding the speed limit by 10 km/hr in at least one of their last ten
trips. Of particular relevance to the current research, young drivers report speeding more
frequently than do older drivers (Clarke et al., 2005; Hatfield & Fernandes, 2009), with
speeding found to be the strongest crash-risk factor for those under the age of 25 years
(Blows et al., 2005).
Other examples of driving behaviours that could be described as reckless include
close passing and tailgating (Harris & Houston, 2010), running red lights (Fergusson et al.,
2003), changing lanes, and overtaking when unsafe to do so (Hartos et al., 2002). Becoming
increasingly common (Neighbors et al., 2002), these behaviours heighten the likelihood of
traffic violations and vehicle crashes (Hartos et al., 2002). Research also suggests high
prevalence of these reckless driving behaviours among younger drivers (Agerwala et al.,
2008; Krahe & Fenske, 2002; Shinar & Compton, 2004; Wickens et al., 2011).
Driving whilst using a cell phone, including dialing (Klauer et al., 2006) and texting
(Owens et al., 2011), driving whilst using MP3 players and other electronic devices
(Chisholm et al., 2008), driving whilst under the influence of alcohol and other psychoactive
substances, including cannabis (Calafat et al., 2009; Richer & Bergeron, 2009), and driving
whilst tired or fatigued (Smart et al., 2005; Smith et al., 2005), are additional examples of
driving behaviour that fall under the banner of reckless. These behaviours have been found to
compromise both driving performance and driving safety (Anderson & Baumberg, 2006;
Berghaus et al., 1995; Charlton, 2009; Deery & Lowe, 1996; Kircher et al., 2004; Lenne et
al., 2000; Owens et al., 2011; Potter, 2000; Raemakers et al., 2004; Sexton et al., 2000; Smith
et al., 2005; Strayer & Johnson, 2001). Research by McEvoy and colleagues suggests that
young drivers are more likely to have had a crash due to the distraction of a cell phone than
are older drivers (McEvoy et al., 2006). Armstrong and colleagues (2005) studied 331 young
drivers (mean age 24 years) and found that 26% reported driving under the influence of
psychoactive drugs at least once in their lifetime. Smart and colleagues (2005) found that
64% of young drivers reported recently driving whilst very tired, compounding the effect
demonstrated in other research that young drivers are more prone to the effects of fatigue
than are older drivers (Smith et al., 2005).
1.2. Measuring self-reported reckless driving behaviour
Many road safety researchers use established self-report scales to measure driving
behaviour. Arguably the most commonly used is the Driver Behaviour Questionnaire (DBQ)
(Reason et al., 1990). de Winter and Dodou (2010) identified 174 English-language studies
that have used the DBQ or a modified version thereof. However, recent evidence exists
asserting that the association of the DBQ with important outcome variables (e.g., motor
vehicle crashes) may be quite modest, with this relationship potentially inflated due to
common-method variance (af Wåhlberg, Dorn, & Kline, 2011). Since the influential research
of Reason and colleagues, where 50 items were used to differentiate between errors and
violations (reckless behaviours), many researchers have developed their own measures of
driver behaviour. Responses are typically required on either Likert or frequency scales.
Instruments vary in length from less than 12 to upwards of 70 items, and in structure, with the
number of factors or categories of behaviour ranging from one to upwards of eight. Table 1
provides an illustrative list of published research in which measures of self-reported driving
behaviour were either developed and/or refined. It must be noted that while several of these
measures have been used in studies of reckless driving behaviour, not one was designed
specifically for this purpose. With the current focus on reckless behaviour, studies were
included in this table if they targeted driving behaviour (and not related constructs like driver
stress, e.g., Driver Behaviour Inventory, Gulian et al., 1989), and if they measured more than
one type of reckless driving behaviour (including behaviours variously labeled as “risky”,
“violations”, and “aggressive”). As can be seen, the table specifies the number of factors or
subscales present in each measure, and separately indicates whether the scale items fit into
each of five different driving content categories (plus an “other” category). Note that, in some
studies, a single factor spans several of the Table 1 content categories, reflecting the fact that
the items comprising that single factor pertain to multiple types of behaviour.
[Table 1 around here.]
Most existing measures assess driver behaviour in general, and are thus not designed
to focus on reckless behaviours as herein defined. This concentration on the broad, rather
than the narrow is surprising given, as already noted, reckless behaviours contribute
disproportionately to driver crash-risk, especially young driver crash-risk. As such, driving
behaviours that are reckless warrant independent and urgent investigation. Existing
instruments are limited in their ability to measure reckless driving behaviours in three
important ways, although most do not possess more than one of these attributes. First, some
instruments are incomplete in that they do not include items that represent the diversity of
reckless driving behaviours (such as those discussed in the previous section). Second, some
are over inclusive which often leads to the measurement of mixed constructs and non-
behavioural phenomena rather than focusing solely on reckless behaviour. Third, some are
divided into factors or categories that overlap and are not independent. Many such scales
categorise and label reckless driver behaviour based on the assumed intentions and
motivations of the driver, as opposed to characteristics of the behaviours themselves.
Incompleteness
As can be seen in Table 1, many scales designed to measure reckless driving
behaviour do not measure the diversity that exists in this domain. Of particular import is the
insufficient focus on two categories of behaviours. First, there is a neglect of behaviours that
involve distraction, especially by technological devices. Although it is unrealistic to expect
twenty year-old scales to refer to behaviours that have emerged only recently as a function of
advancing technology, recent versions of the DBQ have rarely updated this particular aspect
(e.g., Kontogiannis et al., 2002; Lawton et al., 1997; Xie & Parker, 2002). A second reckless
behaviour that is commonly neglected, despite evidence supporting its importance to young
driver risk (Smith et al., 2005), is driving whilst fatigued or extremely tired. In order to be
comprehensive and remain relevant, the measurement of reckless driving behaviours must
maintain an updated repository of items that reflect the entire range of reckless driving
behaviours.
Over-Inclusiveness
A second limitation of some existing measures, and the classificatory schemes upon
which they are based, is the inclusion of targets that lie outside the domain of reckless driving
behaviours. Two particular aspects of over-inclusiveness exist: a) references to phenomena
that are either partially or entirely non-behavioural, and b) references to phenomena that are
behaviour-related, but are not considered reckless. Regarding the first of these examples of
over-inclusiveness, inspection of the instruments listed in Table 1 reveals that many items
refer, at least in part, to internal psychological states (e.g., goals, motives, feelings), rather
than behaviours. In reference to the second type of over-inclusiveness, some scales include
items that refer to in-vehicle behaviours that are not acts of reckless driving.
Whilst compiling this list, it was evident that many scales utilise items from a range of
non-behavioural domains. For example, the Dula Dangerous Driving Index (Dula & Ballard,
2003) includes attitudinal items similar to “I feel that most traffic „laws‟ could be considered
suggestions”, in addition to items measuring actual behaviour. Similarly, the Multi-
dimensional Driving Style Questionnaire (Taubman – Ben-Ari et al., 2004) includes items
measuring interests and personal preferences similar to “I like the thrill of flirting with death
or disaster”. Items in some instruments confound the measurement of overt behaviours with
their underlying motives. For example, the Risk Behaviour Scale (Ulleberg & Rundmo,
2002) includes items similar to “Drive fast to show that I am tough enough” which tap
motivations when assessing behaviour. Double-barreled items such as these place an
unnecessary burden on respondents and render the meaning of their response unclear.
Measures that embrace general driving behaviour are similarly over-inclusive in that
they index behaviour that falls outside of the definition of “reckless”. For example, the
Behaviour of Young Novice Drivers scale (BYNDS, Scott-Parker, et al., 2010), and the
Youth Domains of Risky Driving scale (Schmidt, 2012) both include behavioural items
similar to “You drove on the weekend” and “You made a fist at another driver” that are not in
themselves inherently reckless. Similarly, doubts may be raised about the content validity of
the DBQ items “Use your horn to indicate your annoyance to another road user” and “Get
angry at a certain type of driver and chase them with the intention of showing them how
angry you are.” While pertinent to their research topics, these non-reckless items render the
scales unsuitably multidimensional, thereby diluting the measurement of the construct of self-
reported reckless driving behaviour.
Overlapping Categories
Finally, while most of the scales listed in Table 1 include subtypes of reckless driving
behaviours, these types are often difficult to distinguish from one another. In terms of
categorising or labeling groups of reckless driving behaviours, most scales in the compiled
list are consistent with Reason and colleagues‟ (1990) ideation that this domain of behaviours
requires description in terms of social and motivational antecedents. This has lead to a failure
to place different reckless driving behaviours in homogenous conceptual categories based on
the characteristics of the behaviours themselves (Schmidt, 2012). Describing behaviour on
the basis of motivations becomes problematic when the same behaviour, for example
speeding, can be committed for a variety of reasons (e.g., to test the vehicle‟s capabilities, to
be aggressive, or for the instrumental goal of time-saving). By categorising by presumed
motivations, behaviours are capable of being allocated to multiple, different groups. For
example, Lawton and colleagues‟ (1997) initial category of “normal highway code
violations” includes items measuring a diversity of behaviours, such as “Risky over-taking”,
“Close following”, and “Drink and drive”. A second of the researchers‟ categories is labeled
“aggressive violations”, because it is assumed that individuals who perform them do so by
“acting aggressively toward other road users” (p. 1262). With the first of these categories
defined in legal terms and the second defined in terms of assumed underlying motivations, it
is logically possible for a single act to be coded into both categories. As evidenced by
subsequent analyses where new items were introduced, these two categories of behaviour
(normal highway code violations and aggressive violations) are not independent since items
from each category were found to load onto the same factor.
The current research sought to conceptualise and measure reckless driving behaviours
in a way that overcomes the three deficiencies evident in many existing approaches. In
particular, we sought to develop a measure that provides both focus on a specific category of
driving behaviours – reckless behaviours – and breadth of coverage of behaviours within this
category. If successful, practitioners and researchers will have access to a validated scale for
use in distinguishing specific types of driving recklessness, identifying the shared and unique
determinants of these behaviours, and developing interventions that are precisely targeted to
combat the most problematic driving behaviours. Study 1 aimed to measure a diversity of
reckless driving behaviours that conform to Arnett‟s (1992) definition. After the selection of
relevant behavioural items and collection of frequency data pertaining to them, exploratory
factor analysis was used to discover their underlying factorial structure and thereby identify
and differentiate specific subtypes of reckless driving behaviour. Using an independent
sample, Study 2 aimed to confirm the findings of Study 1, to provide additional evidence as
to the reliability and concurrent validity of the behaviour subtypes, and to determine whether
differences exist in how each of the four factors relate to relevant demographic and
psychological variables.
2. Study 1
2.1. Method
2.1.1. Participants
Study 1 used a convenience sample of 189 undergraduate psychology students
attending an Australian university who participated as part of their course program and to
receive course credit. Ages ranged from 17 to 25 years (M = 20.04, SD = 1.83), with 147 of
the participants female. Participants were required to have Australian citizenship or
residency, a current Australian driver‟s licence, and regular access to a motor vehicle they
were licensed to drive.
2.1.2. Materials and procedure
Participants were asked to indicate how many times they have engaged in each of 21
reckless driving behaviours in the preceding six months. Selection of these behaviours was
derived from a variety of sources, including the studies and scales listed in Table 1. Particular
emphasis was placed on selecting items that represented the diversity of behaviours
considered reckless, with all items worded so as to refer to a single type of reckless driving
behaviour. Items deliberately represented domains of speeding (e.g. “Driven at least 15km/hr
above the speed limit”), steering (e.g. “Changed lanes frequently on a multi-lane road”),
distracted driving (e.g. “Texted or looked for numbers on your phone or searched for songs
on your MP3 player whilst driving”), fatigued driving (“Driven whilst extremely tired or
exhausted”), and other, more extreme, behaviours (e.g. “Raced or chased another vehicle
driven by someone you do not know”). Participants were required to answer on an 11-point
scale ranging from 0 (“none”) to 10 (“100+ times (i.e. at least 4 times a week)”) in accord
with past research on reckless behaviour (Bradley & Wildman, 2002; Teese & Bradley,
2008). The anonymous, online, self-report questionnaire, which also included items not
related to the current study, took approximately 20-25 minutes to complete.
2.2. Results
The data were examined to ensure the appropriateness of an exploratory factor
analysis. All items correlated at least .3 with at least one other item, suggesting reasonable
factorability. Sampling adequacy was deemed appropriate, KMO = .86, and Bartlett‟s test of
sphericity was significant, 2
(210) = 1763.12, p < .001. Finally, all communalities were
above .3. Principal axis factoring extraction revealed four clear factors. Initial eigenvalues
indicated that the factors explained 34%, 11%, 7%, and 6% of the variance, respectively.
Parallel analysis was also performed to ensure the factor structure was appropriate. Applying
methods developed by O‟Connor (2000), including the use of 1000 raw data permutations for
multivariate non-normal data, the analyses reinforced the four factor structure. Following
oblique (direct oblimin.) rotation of the factor-loading matrix, two items (“Failed to stop at a
stop sign” and “Driven through an orange traffic light when easily avoidable or when it is
about to turn red”) were excluded due to loading below .4 on all factors. A second analysis
using the remaining 19 items yielded a clean solution with all items having primary loadings
over .4 and no items cross-loading in excess of .3. These results can be seen in Table 2.
[Table 2 around here.]
From the groupings of items with primary loadings on each factor, the first factor was
indicative of behaviours that increase the probability of a vehicle crash due to distraction or a
deficit in perception, attention or reaction time (labelled “distracted”). The second factor
represented behaviours that increase the probability of a vehicle crash due to driving under
the influence of drugs or alcohol (labelled “substance-use”). The third factor corresponded to
behaviours that increase the probability of a vehicle crash due to placing the vehicle in an
unsafe environment that places stress upon the vehicle close to, or beyond, its design
expectations (labelled “extreme”, in reference to the prevalence of these behaviours in
„extreme‟ motorsports). Finally, the fourth factor was indicative of behaviours that increase
the probability of a vehicle crash due to the speed and/or position of the vehicle relative to
other vehicles and/or objects (labelled “positioning”). This final factor includes both the
“speeding” and the “steering” behaviours that are represented separately in several existing
measures.
Composite scores were created for each of the four factors by averaging responses to
items that had their primary loadings on each factor. Ranging from 0 to 10, higher scores
indicate greater frequency of participation in each behaviour category. Correlations between
these composite scores can be seen in Table 2. Cronbach‟s alpha ranged from .70 (for the
two-item substance use factor) to .84, indicating satisfactory scale reliability.
2.3. Discussion
Factor analyses from Study 1 examined a set of 21 driving behaviours derived from
past research, all of which conformed to Arnett‟s (1992) definition of reckless behaviour.
Results indicated that 19 of these behaviours loaded onto four factors. The selection of a
diverse set of items, with the wording of all items referring to a single type of reckless driving
behaviour, and the categorisation of these behaviour items on empirical grounds, enabled the
development of a new way of classifying and measuring self-reported reckless driving
behaviours. Most importantly, this new conceptualisation and measurement approach
addresses three major concerns inherent in many previous instruments. First, the current
instrument assesses the full range of reckless driving behaviours, including several that are
not measured by many existing instruments. Second, by following Arnett‟s (1992) definition
of reckless behaviour when selecting items, the current instrument provides a content valid
measure of self-reported reckless driving behaviour, one that avoids references to extraneous
variables. Third, the exploratory nature of the analyses provided conceptually distinct
categories of reckless driving behaviour, labelled on the basis of characteristics of the
behaviours themselves.
Respondents reported engaging in distracted behaviours more often than the other
behaviour types. Interestingly, this subset of behaviours is absent from many existing
measures (see Table 1). Distracted behaviours were also strongly correlated with the subset of
behaviours with the second highest reported frequency, positioning behaviours. Despite all
items representing reckless driving behaviours, the correlations between subsets were, for the
majority, moderate, with variance shared by pairs of subscales never exceeding 50%.
As previously noted, two items were excluded from the final factor solution due to
low factor loadings on all factors. Review of these items and focus group discussions
suggested that the wording of these items lacked specificity and clarity. Wording changes
were made so that the items could be reassessed in Study 2. The revised items that were
included with the 19 used in Study 1 were “Failed to completely stop at a stop sign” and
“Driven through a traffic light when it is about to turn red or could turn red as you pass
through”.
3. Study 2
The aims of Study 2 were three-fold. First, the study aimed to determine whether the
reckless driving behaviour factor structure elicited in Study 1 adequately fits a data set
obtained from a separate, larger, and more diverse sample. Second, Study 2 aimed to obtain
additional evidence as to the scale‟s reliability and validity, and third, it sought to identify
any differences in the pattern of demographic and psychological variables that predict each of
the behaviour types. In pursuit of this third aim, the five predictors briefly described below
were selected for study based on their history of association with driving behaviour.
Gender has been found to be a strong predictor of reckless driving behaviours (Harre
et al., 2000; Turner & McClure, 2003), with males participating more than females (Bina et
al., 2006; Catchpole & Styles, 2005; Fergusson et al., 2003; McEvoy et al., 2006; Oltedal &
Rundmo, 2006). These gender differences have been reliably replicated (Lonczak et al.,
2007), and we thus expected that males would report performing reckless driving more often
than would their female counterparts. However, past studies have typically used driving
recklessness data that have been aggregated across multiple types of behaviour, raising the
possibility that reliable gender differences may not exist in all of several more narrowly-
defined categories of behaviour. Adding a further layer of complexity, Byrnes and colleagues
(1999), in a meta-analysis of 150 studies, observed that while males engage in greater risk
taking, the gap between the sexes is both context- and age-dependent. Together, these
observations suggest the need for greater understanding and considerable caution when
predicting gender differences in participation in specific reckless driving behaviours (Bina et
al., 2006).
Self-efficacy has been identified as important in a number of health-behaviour models
(Montano et al., 1997; Strecher & Rosenstock, 1997), with perceptions of ability to control
the vehicle and respond quickly and accurately to hazards (Groeger, 2006) found to predict
both safe and unsafe driving (George et al., 2007; Montag, 1989; Sarkar & Andeas, 2004;
Taubman- Ben-Ari et al., 2005; Victoir et al., 2005). Through this, the current research
expects stronger self-efficacy beliefs to be associated with increased self-reports for each
reckless driving behaviour.
Risk perception has been found to be related to self-reported participation in unsafe
driving behaviours (Jonah, 1986; Hatfield & Fernandes, 2009; Rundmo, 1995; Weinstein et
al., 1998). However, the psychological processes associated with risk judgements require
further investigation (McNally & Titchener, 2012; Price, 2001), especially in relation to the
situational influences on risk perception (Sjoberg et al., 2004) and whether young drivers
perceive less risk than older drivers (cf. Beyth-Marom et al., 1993; Hatfield & Fernandes,
2009; Williamson, 2003). Notwithstanding the need for this research, the current research
expects higher risk perception to be associated with decreased self-reports of each reckless
driving behaviour.
Risk willingness refers to the amount of risk an individual is prepared to accept in a
given situation (Lund & Rundmo, 2009). Deery (1999) found evidence to suggest young
drivers are more willing to accept risk than are older, more experienced drivers. Willingness
consistently explains variance in behaviour additional to intentions (Gibbons et al., 2003) and
has been found to be a better predictor of health risk behaviour than intentions, for
adolescents and emerging adults (Gibbons et al., 1998; Gibbons et al., 2004), including
unsafe driving behaviour (Gibbons et al., 1998). The current research thus expects higher
willingness to be associated with increased self-reports of each reckless driving behaviour.
Sensation-seeking, or the need for varied, novel and complex sensations and
experiences (Zuckerman, 1994), has been consistently found to predict unsafe driving
(Arnett, 1996; Deery & Fildes, 1999; Jonah, 1997), including driving under the influence of
alcohol and cannabis, speeding, racing and unsafe passing as well as a range of other reckless
driving behaviours (Armstrong et al., 2005; Arnett, 1996; Arnett et al., 1997; Burns & Wilde,
1995; Clement & Jonah, 1984; Dahlen et al., 2005; Furnham & Saipe, 1993; Greene et al.,
2000). Sensation-seeking is thought to explain the motivations underlying individuals taking
risks whilst driving because of the thrill these behaviours provide (Arnett, 1994). The current
research expects higher sensation-seeking to be associated with increased self-reports of each
reckless driving behaviour.
3.1. Method
3.1.1. Participants
Overall, 790 participants were sampled, consisting of 522 females, with ages ranging
from 17 - 25 years (M = 20.83, SD = 2.17). Participants were members of the general
Australian and New Zealand public as well as undergraduate psychology students who
completed the research in order to receive course credit. To ensure sampling adequacy, all
participants were required to have current Australian or New Zealand citizenship or
residency, hold a current Australian or New Zealand driver‟s license, and have regular access
to a motor vehicle they are licensed to drive. Of the sample, 469 participants had a
provisional licence (i.e., one that permits unsupervised but restricted driving).
3.1.2. Materials and procedure
Self-efficacy was assessed with a modified 6-item version of the Adelaide Driving
Self-Efficacy Scale (ADSES) (George et al., 2007). The scale asks participants to assess their
own driving ability by indicating how confident they are in performing six reckless driving
behaviours whilst maintaining the safety of themselves and those around them (regular
driving behaviours were the subject of the original version). Reckless behaviours included in
this scale were selected from each of the four factors from Study 1. Sample reckless driving
behaviours are “Driving when you suspect you are over the .05 blood alcohol limit”, and
“Turning, merging, or changing lanes without indicating”. Participants responded on a 7-
point scale, ranging from 1 (Not at All Confident) to 7 (Extremely Confident), with scores
summed such that higher scores indicate stronger self-efficacy beliefs. Pilot-testing (using the
Study 1 sample) revealed the modified scale to have high internal consistency (Cronbach‟s
alpha = .84), as well as construct and criterion-related validity.
To assess risk perception, participants were asked to indicate (a) the likelihood that
each of 16 reckless driving behaviours would result in vehicle crash and (b) the severity of
the subsequent, negative consequences (e.g., physical harm) of each behaviour. The 16
reckless behaviours were sampled from each of the four factors from Study 1. Sample items
include “Eating, drinking, or smoking whist driving”, ”Exceeding a decreased speed limit
(e.g., 40km/hr) in a road work zone by at least 15km/hr”, and “Racing or chasing another
vehicle driven by a friend or someone you know”. Participants responded on 5-point scales,
ranging from 1 (Not at All/ Minimal) to 5 (Very Much/ Substantial). In line with past practice
(cf. Lund & Rundmo, 2009; Sjoberg et al., 2004; van Gelder et al., 2009), responses to
corresponding likelihood and severity items were multiplied to obtain a measure of risk
perception for each behaviour, and these 16 scores were averaged such that higher scores
indicate higher total perceived risk.
In accordance with measures designed to assess behavioural willingness developed by
Gibbons and Gerrard (1995), willingness to take driving risks was assessed through four
hypothetical scenarios in which reckless driving may occur (e.g., “Suppose you are running
very late for an important job interview or some other important meeting but there is a
chance that if you travel quickly you may still be able to make it on time.”). Content of the
other scenarios varied from a night out with your friends, to a family member in hospital in a
critical condition, and evading a bushfire. After reading each hypothetical scenario,
participants indicated their willingness, in the given situation, to engage in each of six
reckless driving behaviours (thus, there was a total of 24 items over four scenarios).
Participants responded on a 5-point scale, ranging from 1 (Not at All Willing) to 5 (Extremely
Willing). Responses to all 24 items were summed so that higher scores indicated greater
willingness to participate in reckless driving behaviours.
Sensation-seeking was assessed using the Brief Sensation-Seeking Scale (BSSS)
(Hoyle et al., 2002). This scale consists of 8 items, adapted from previous measures of
sensation seeking (Zuckerman et al., 1978) and has been validated for adolescents and
emerging adults (Hoyle et al.). Internal consistency has been reported as moderate to strong
(Cronbach‟s alpha ranging from .74 -.79) (Hoyle et al.). Participants were asked to indicate
how well the statements (e.g., “I prefer friends who are excitingly unpredictable”) describe
themselves. Each of Zuckerman and colleagues‟ four primary dimensions of sensation-
seeking (experience seeking, boredom susceptibility, thrill and adventure seeking, and
disinhibition) are represented by two items, with responses indicated on a 5-point scale
ranging from 1 (Strongly Disagree) to 5 (Strongly Agree). Scores were averaged so that a
high score reflected greater sensation-seeking tendencies.
Finally, participants were asked to indicate how many times they have engaged in the
21 reckless driving behaviours in the last six months. Response options and scoring were as
for Study 1, with responses to items in each factor averaged so that they varied from 0 to 10
and higher scores indicate greater frequency of participation in each behaviour category.
All data were collected through online, self-report, survey methods. Recruitment was
of undergraduate psychology students via a university run, online sign-up and notification
website (n = 123) as well as the general population through emailing lists (n = 586) and
notifications placed at Department of Transport and Main Roads customer service centres
located throughout Queensland, Australia (n = 81). Participants were provided a link to a
hosting website where the online questionnaire could be completed. Once they had accessed
the link, the anonymous questionnaire, which also included items not related to the current
study, took approximately 35 minutes to complete.
3.2. Results
3.2.1. Confirmatory factor analysis
SPSS and its associated Analysis of Moment Structures (AMOS) module version 19
were used to perform the following data analyses. A Confirmatory Factor Analysis (CFA)
was conducted to examine the fit of the four-factor, Study 1 model to the Study 2 data (n =
790). Assessment of normality revealed six items that departed from univariate normality
(standardised kurtosis index: β2 ranging from -1.10 to 59.80) with Mardia‟s (1970)
normalised estimate of multivariate kurtosis revealing severe positive kurtosis and
multivariate nonnormality (critical ratio = 151.20, p < .001). A review of Mahalanobis
distance scores revealed nine cases as distinctively different from all other cases. These cases
were discarded for the following analyses. With severe nonnormality remaining (critical ratio
= 124.55, p < .001), a Bollen-Stine bootstrap (Bollen & Stine, 1992), based on Nevitt and
Hancock‟s (2001) recommendation of 2000 bootstrap samples, was performed and its
associated test of overall model fit was examined in lieu of maximum likelihood methods that
assume multivariate normality.
Initial model fit was deemed unsatisfactory since the Bollen-Stine p-value for the
four-factor model was significant (p < .001), with traditional indices of model fit in
agreement, χ2 (183) = 864.56, p < .001; CFI = .87; TLI = .85; RMSEA = .07 (90% CI = .06-
.07); SRMR = .06. Exploration of standardised residuals and modification indices revealed
possible avenues to improve model fit, the most prominent of which was a non-specified
loading from the latent extreme behaviours factor to the item “Over-taken another vehicle
when not supposed to or with little visibility (e.g., on a double line, before a hill or crest)”.
Since the latent factor of positioning behaviours already loaded onto the item, for the sake of
model parsimony and purity of variance and covariance estimates, the removal of the item
was favoured over the addition of the cross-loading. This modification resulted in better
model fit, χ2 (164) = 679.89, p < .001; CFI = .90; TLI = .88; RMSEA = .06 (90% CI = .05-
.06); SRMR = .06, with the Bollen-Stine p-value remaining significant (p < .001).
Model fit was further improved by the addition of covariances between three pairs of
error terms, all of which pertained to items within a common latent factor. The first was
between the error variances of two items that had overlapping content pertaining to elements
of the unknown (“Driven on unsafe roads (e.g. when flooded; when cluttered with debris)”
and “Raced or chased another vehicle driven by someone you do not know”). The second was
between the error variances of two items that related to an internal subjective state (“Driven
whilst extremely tired or exhausted” and “Driven when extremely emotionally aroused (e.g.,
Angry)”). The third was between error variances of items that shared the content area of
speeding (“Driven at least 15km/hr above the speed limit” and “Exceeded a decreased speed
limit (e.g. 40km/hr) in a road work zone by at least 15km/hr”). Addition of each of these
covariance pathways resulted in improved model fit, with the final fit indices revealing
satisfactory model fit, χ2 (161) = 523.55, p < .001; CFI = .93; TLI = .92; RMSEA = .05 (90%
CI = .05-.06); SRMR = .05, despite the Bollen-Stine p-value remaining significant (p < .001).
Further modifications were deemed inappropriate in order to safeguard the distinctiveness of
the sub-scales and the parsimony of the overall model.
Three of the four latent variables were found to be reliable as reflected by their
multiple observed variables: Hancock and Mueller‟s (2001) coefficient H = .84 (distracted),
H = .84 (positioning), H = .47 (substance use), and H = .70 (extreme). Notably, the
substance-use factor reliability was lower than in Study 1. All factor loadings were
significantly different from zero (p < .001) and model fit was deemed satisfactory when
assessed separately for distracted, χ2 (8) = 28.82, p < .001; CFI = .99; TLI = .97; RMSEA =
.06 (90% CI = .04-.08); SRMR = .02, positioning, χ2 (19) = 56.75, p < .001; CFI = .98; TLI =
.97; RMSEA = .05 (90% CI = .04-.06); SRMR = .03, and extreme behaviours, χ2 (1) = 0.03,
p = .87; CFI = 1.00; TLI = 1.00; RMSEA = .01 (90% CI = .01-.05); SRMR = .01. Model fit
could not be determined for substance-use behaviours due to the model being unidentified.
From these indicators, most factors were deemed to display convergent validity.
Based on the moderate to strong covariances between the latent factors, in particular
the factors of distracted and positioning behaviours, four competing models were assessed
against the four-factor model. In comparison to both a one-factor solution (with covariances
between all factors constrained to one) and a three-factor solution (with the covariance
between distracted and positioning behaviours constrained to one), the four-factor solution
was found to have significantly better fit, Δχ2
= 900.25, Δdf = 6, p < .001 and Δχ2
= 116.16,
Δdf = 1, p < .001, respectively. Additionally, in comparison to both a three-factor solution
(with covariances between substance-use and extreme behaviours constrained to one) and a
five-factor solution (with the items “Driven when extremely emotionally aroused (e.g.,
angry)” and “Driven whilst extremely tired or exhausted” loading onto a fifth latent factor),
the four-factor solution was found to have significantly better model fit, Δχ2
= 375.24, Δdf =
1, p < .001 and Δχ2
= 58.79, Δdf = 3, p < .001, respectively. From this, the factors within the
four-factor solution were deemed to show discriminant validity.
Factorial invariance between males (n = 260) and females (n = 521) was assessed.
The configural model, with no constraints present, revealed satisfactory, gender-invariant fit
for the four-factor model, χ2 (322) = 713.00, p < .001; CFI = .92; TLI = .91; RMSEA = .04
(90% CI = .03-.04); SRMR = .06, with the Bollen-Stine p-value significant (p < .001). Next
the measurement model, where the female and male measurement weights (factor loadings)
were constrained to equality, was assessed for invariance. No significant change was found
between the configural and measurement models, Δχ2
= 26.11, Δdf = 16, p > .05, ΔCFI < .01,
suggesting measurement invariance in the model. Factorial invariance was also assessed
between provisional (n = 469) and open licence drivers (n = 321). The configural model, with
no constraints present, revealed satisfactory, licence type-invariant fit for the four-factor
model, χ2 (322) = 787.11, p < .001; CFI = .91; TLI = .90; RMSEA = .04 (90% CI = .04-.05);
SRMR = .05, with the Bollen-Stine p-value significant (p < .001). Next the measurement
model, where the provisional and open licence sample measurement weights (factor loadings)
were constrained to equality, was assessed for invariance. No significant change was found
between the configural and measurement models, Δχ2
= 23.29, Δdf = 16, p > .10, ΔCFI < .01,
suggesting measurement invariance across licence types.
Descriptive statistics and correlations can be seen in Table 3. In regards to
nomological validity, all driving factors were positively correlated with one another, as well
as being correlated in the expected directions with other risk related, psychological variables.
Thus, as expected, higher self-reported frequencies of all reckless driving behaviour subtypes
were associated with greater willingness to take driving risks, higher reckless driving self-
efficacy, higher sensation seeking tendencies, and lower perceptions of risk. Of interest was
the unexpectedly low correlation between “extreme” driving behaviours and willingness to
take risks. Importantly, the pattern of correlations between the driving behaviours and the
psychological variables varied between factors: for example, compared to the other two
driving behaviours, distracted and positioning behaviours were much more highly correlated
with risk willingness and self- efficacy, but they were not more highly correlated than were
the other behaviours with either sensation-seeking or risk perception. This provides further
validation for the differentiation between driving subtypes.
[Table 3 around here.]
Mann-Whitney U tests were chosen over independent group t-tests to assess gender
and licence type differences for each driving subtype due to significant skewness in each of
the outcome variables. Results revealed significant gender differences in positioning,
substance-use, and extreme driving behaviours, Mann-Whitney U = 56203.50, 61136, and
51756.50, all ps < .001, respectively. Inspection of the group means indicated that males (M
= 3.18, SD = 1.98; M = 0.50, SD = 1.15; M = 0.76, SD = 1.04) reported more frequent
positioning, substance-use, and extreme driving than did females (M = 2.60, SD = 1.79; M =
0.27, SD = 0.78; M = 0.39, SD = 0.72), respectively. No gender differences were observed for
distracted driving behaviours, Mann-Whitney U = 64620, p = .30. Within the current
restricted age range (17 to 25 years), there was a modest tendency for reporting of reckless
driving behaviours to increase with age (rs ranged from .07 to .14, all ps < .05), with the
exception of extreme behaviour (r = -.07, p > .05). Comparison between holders of
provisional licences and open licences revealed significant differences in positioning,
distracted, and substance-use driving behaviours, Mann-Whitney U = 63290.50, 62918,
65941.50, all ps = .001, respectively. No licence type differences were observed for extreme
driving behaviours, Mann-Whitney U = 69855, p = .20. Inspection of the group means
indicated that open licence holders (M = 3.08, SD = 1.95; M = 3.96, SD = 2.31; M = 0.30, SD
= 0.92) reported more frequent positioning, distracted, and substance-use driving than did
provisional licence holders (M = 2.60, SD = 1.79; M = 3.39, SD = 2.14; M = 0.41, SD = 0.93),
respectively.
3.2.2. Multiple regression analysis
To further validate the differentiation between driving subtypes, a standard multiple
regression analysis was conducted on each of the four reckless driving subtypes. Six variables
(gender [coded as females = 0 and males = 1], age, sensation-seeking, self-efficacy, risk
perception, and risk willingness) were entered at once to evaluate their unique contribution to
explaining the variance in each of the reckless driving behaviours. Licence type (provisional
or open) was not included in these analyses because of the strong relationship it has with age
(rpb = .73, p < .001) due to the graduated driver licensing systems present in Australia. In
response to a large amount of skew in the dependent variables of substance-use and extreme
reckless driving due to floor effects in the responses, these variables were transformed using
logarithmic procedures leading to significantly reduced skew. Coefficients from the four
standard multiple regressions can be seen in Table 4.
[Table 4 around here.]
Overall, 45% of the variance in distracted driving behaviours was explained, with all
six variables revealed as significant predictors. Coefficients for gender and age revealed a
tendency for females and older young drivers to report higher engagement in distracted
driving behaviours. Similarly, increased self-efficacy beliefs, sensation-seeking tendencies,
and willingness to drive recklessly were related to increased reported engagement in
distracted driving. Against expectation and contrary to the direction of the zero-order
correlation, perception of risk was also positively related to reports of engaging in distracted
driving behaviours. To explore the source of this incongruent regression coefficient, the
analysis was repeated using hierarchical procedures with gender, age and risk perception
entered in the first step of the model and sensation-seeking, self-efficacy, and risk willingness
entered separately in three successive steps. Results revealed that the coefficient for risk
perception was negative in the first two steps, turning positive with the inclusion of self-
efficacy and strengthened with the inclusion of risk willingness. This suggests that some
aspect of risk perception that does not overlap with self-efficacy, as well as only marginally
overlapping with risk willingness, has a positive relationship with distracted driving.
Overall, 17% of the variance in substance-use driving behaviours was explained, with
three variables revealed as significant predictors. Coefficients for self-efficacy beliefs,
sensation-seeking tendencies, and willingness to drive recklessly show a tendency for
increases in each to be related to increases in reported engagement in substance-use driving.
Gender, age, and risk perception were not significant predictors of substance-use driving
when accounting for the variance explained by the other variables.
Overall, 22% of the variance in extreme driving behaviours was explained, with five
variables significant. Coefficients for gender and age revealed a tendency for males and
younger drivers to report higher engagement in extreme driving behaviours. Similarly,
increased self-efficacy beliefs, sensation-seeking tendencies, and willingness to drive
recklessly were related to increased reported engagement in extreme driving. Risk perception
was not a significant predictor of extreme driving when accounting for the variance explained
by the other variables.
Overall, 48% of the variance in positioning driving behaviours was explained, with
two variables significant. Increases in self-efficacy beliefs and willingness to drive recklessly
were related to increases in reported engagement in positioning driving behaviour. Gender,
age, risk perception, and sensation-seeking were not significant unique predictors.
4. General Discussion
4.1. The Reckless Driver Behaviour Scale (RDBS)
Results from Study 2 confirmed those obtained in Study 1, with the four Study 1
factors of distracted, substance-use, extreme, and positioning reckless driving behaviours
replicated in a separate, larger sample of young drivers in Study 2. The 20-item instrument
developed in this research has been named the Reckless Driver Behaviour Scale (RDBS). Its
structure and content are in contrast to a majority of scales used in previous research.
Moreover, this new instrument for measuring self-reported reckless driving behaviours
addresses three of the major concerns inherent in many existing instruments.
Previous research has examined a diverse range of driving behaviours but has
typically not focused on reckless driving behaviours. Many studies that have examined
reckless behaviour have done so in the context of more general measurement, rather than
choosing or designing measures to capture just this subset of all driving behaviours. In
developing the RDBS, we aimed to improve the measurement of reckless driving behaviours
in terms of breadth, clarity, and relevance. Distracted behaviours, including distractions from
technology and fatigue, were of particular interest due to the limited attention given to these
behaviours in existing instruments. In fact, self-reports from both of the current studies reveal
these particular behaviours to have the highest reported engagement in this age group.
Despite a large range in the length of existing driver behaviour scales (see Table 1),
the number of items included in the RDBS approximates the average number of items used
previously. However, by following Arnett‟s (1992) definition, the RDBS provides a more
content valid measurement of self-reported reckless driving behaviour. To avoid confounding
reckless driving behaviours with that of related variables, the RDBS was created with the aim
of measuring reckless behaviours only. In this way, measurement of the antecedents,
correlates, and consequences of these behaviours is left to other instruments. The items
comprising the RDBS include minimal references to phenomena that are non-behavioural,
and the scale includes no items assessing behaviours that are not reckless.
The number of factors in the RDBS also closely approximates the average number in
existing instruments (Table 1). In fact whilst using slightly different methods (and criteria for
item inclusion), Schmidt (2012) also found a four-factor structure, with the current factors of
substance-use, distracted, and positioning behaviours mirroring those of Schmidt (termed
substance-use, distracted driving, and moving violation, respectively). Unfortunately
Schmidt‟s fourth factor, aggressive driving, in addition to including items not considered
reckless, follows previous research by describing the behaviours in terms of motivational
factors. Construction of the RDBS aimed to avoid this form of problematic categorisation by
the use of exploratory procedures in which different reckless driving behaviours were placed
in homogenous, conceptually distinct categories on the basis of characteristics of the
behaviours themselves, without mention of intentions or motivations. This procedure aimed
to prevent very different behaviours being categorised under the same generic label and
treated as similar in subsequent analyses, as well as avoiding the use of conceptually-
overlapping categories which could have resulted in a single behaviour being classified in
several different ways.
Multiple reliability estimates for each of the factors indicated that all but the
substance-use factor had adequate reliability. The factors were also assessed for both
convergent and discriminant validity. Of interest was the strong correlation found between
the factors of distracted and positioning behaviours. Due to these behaviours belonging to the
domain of reckless driving behaviours, it was indeed expected that each of the factors would
have a high level of covariation with the others. Model comparisons, however, found that the
relationship between these two factors was significantly different from unity. Also, the items
“Driven whilst extremely tired or exhausted” and “Driven when extremely emotionally
aroused (e.g., angry)” could be considered to represent a form of distraction that is different
from the other distracted driving items, however model fit was better when these items
loaded onto the distracted driving factor than when loading onto a separate factor. This makes
theoretical sense because both fatigue and extreme emotions can distract attention and deplete
perceptual and cognitive resources (Cai et al., 2007; Phillip et al., 2005).
The reliability of the item composite measuring the substance-use factor was
noticeably lower in Study 2 than was found in Study 1. This could be partly explained by the
more heterogeneous sample in Study 2. Although the two items comprising this factor do
correlate more with each other than with the other behaviours, very rarely does 2-item
measurement result in a stable and internally consistent factor (Green et al., 1977). Future
research may consider including additional items that represent the substance-use domain.
Schmidt (2012), for example, included items that measured passenger behaviour in the
domain of substance-use, however this procedure would not be appropriate if seeking to
measure driving behaviour. Quite possibly, the less reliable two-item subscale may be
preferred over a less valid, but more reliable, longer subscale.
4.2. Correlates of the different reckless driving behaviour sub-types
Differentiation between driving subtypes was identified with males reporting more
frequent positioning, substance-use, and extreme driving than did females, open licence
holders reporting more frequent positioning, distracted, and substance-use driving than did
provisional licence holders, and a tendency for reporting of reckless driving behaviours to
increase with age, with the exception of extreme behaviour. These findings, that gender-, age-
, and licence type-differences are not uniform across the reckless driving categories, support
the premise underlying the current research that reckless driving needs to be treated not as a
single homogenous group, but as a set of more narrowly-defined sub-types.
Multiple regression analyses confirmed this differentiation between the four
behaviour factors in terms of how they relate to relevant demographic and psychological
variables. The role of gender and age as predictors of each of the four subtypes of reckless
driving, whilst accounting for other variables, was particularly interesting. Whilst neither was
a significant unique predictor of substance-use nor positioning driving behaviours, females
and older drivers were more likely to report engagement in distracted driving, with males and
younger drivers more likely to report engagement in extreme driving behaviours. Also, the
predictive utility of willingness to take driving risks was shown to be much lower for
substance-use and extreme driving than for distracted and positioning driving. These findings
support previous research that highlights the varying correlates of specific reckless driving
behaviours (McNally & Titchener, 2012; Paleti et al., 2010; Thomas et al., 2007; Williams,
2003).
Another interesting finding was in relation to risk perception. While negatively
correlated with all four behaviour types, risk perception was positively related to distracted
driving in the regression analysis. This suggests that, when the influence of other predictors is
factored in, young drivers who perceive greater risk in performing reckless driving
behaviours are more likely to report engaging in distracted behaviours. Whilst counter-
intuitive, this finding has been found previously (Hallett et al., 2011; Walsh et al., 2008;
White et al., 2004). For example, Walsh and colleagues (2008) found that drivers who intend
to text message while driving are more aware of the inherent risks than those who do not. The
current multiple regression analyses suggest that a sub-component of risk perception that is
uncorrelated with both self-efficacy and risk willingness is positively correlated with
distracted driving. Although still open to interpretation and further investigation, this finding
challenges the commonly held belief that risk perception has consistent and entirely negative
effects on reckless driving (Jonah, 1986; Hatfield & Fernandes, 2009). As shown here, this is
not the case when separate, homogenous types of reckless driving behaviour are
independently assessed.
4.3. Implications, evaluation and recommendations for future research
These findings have implications for both intervention strategies and future research.
The finding of differentiation in the predictors of specific reckless driving categories suggests
that general-purpose interventions may have limited effectiveness. Rather, different types of
programs might be required for different forms of driver recklessness with interventions in
one reckless driving domain not necessarily helpful in others. This supports the notion that
prevention programs designed to modify driver behaviour, although rarely implemented, are
often too broad, failing to acknowledge the different antecedents of specific unsafe
behaviours (Schwebel et al., 2006; Sheehan et al., 2004). For example, our Study 2 analyses
suggest that interventions targeting willingness to take risks may be more appropriate for
young drivers who display distracted or positioning recklessness, than for those who engage
in other types of reckless driving behaviours. Knowledge of the reckless driving behaviour
subtypes found in the current research could inform both policy-makers and researchers as to
the types of behaviours that are conceptually and empirically proximate, and hence the
combinations of behaviours that are most and least likely to be tractable to a single
intervention.
Future research could aim at confirming the factor structure found in the current
research in samples drawn from other nations, as well as separately exploring the antecedents
of each reckless driving behaviour group. Following this, item and scale properties could be
further explored using Rasch analysis. This research would, in turn, improve understanding
of why young people engage in reckless driving behaviours, and would inform policy-makers
as to the most effective and efficient ways to construct interventions. Other research could
examine the predictive validity of self-reported driving recklessness, as measured by the
RDBS: do scores on each of the behaviour subscales taken at an earlier age predict crash and
offence involvement or other outcomes over the following months or years? Longitudinal
research would also shed light on the temporal relations between reckless behaviours, on the
one hand, and psychological variables like driving self-efficacy and reckless driving
willingness, on the other.
The current research should also be understood within a few limitations. First, it must
be acknowledged that self-reports of driving behaviours are subject to recall errors and
response biases and that the current research is no exception to this. Specifically, a six-month
recall period was used in the current research to ensure adequate variability and minimal floor
effects in the reckless driving data, but this period may have resulted in substantial recall
errors. To balance the advantages of both longer (e.g., six-month) and shorter (e.g., 4 weeks)
timeframes, future research should seek to verify findings across multiple recall periods.
Additionally, the current research relies heavily on self-report data, which may inflate
associations due to common-method variance. Like the DBQ and similar driving scales,
further validation of the RDBS requires evidence of associations with objective outcome
variables (af Wåhlberg et al., 2011).
Also, the samples used in the two studies were predominantly female. With much
evidence that males are more likely to engage in many types of reckless driving (Bina et al.,
2006; Catchpole & Styles, 2005; Fergusson et al., 2003; McEvoy et al., 2006; Oltedal &
Rundmo, 2006), different results could emerge from a more gender-balanced sample. The
predominant sampling of psychology students may have biased the results in unknown ways.
The RDBS was developed in a particular cultural and driving context and needs to be
validated elsewhere, with more heterogeneous samples. The meaning and relevance of the
scale items are also likely to change over time, suggesting the need for continual updating of
the scale. Minor wording changes may also improve the psychometric quality of the scale.
For example, the item “Driven on unsafe roads (e.g. when flooded; when cluttered with
debris)” could be more congruent with the extreme driving factor if amended to “Driven on
roads that you know are unsafe (e.g. when flooded; when cluttered with debris)”.
Additionally, a large amount of skew in the dependent variables of substance-use and
extreme reckless driving was found due to response floor effects. Even though
transformations were performed, and even though the current means and variances are similar
to those obtained in studies that have used the DBQ (e.g., Lawton et al., 1997; Xie & Parker,
2002), this could have had an influence on the results.
4.4. Conclusion
While the use of a common measurement instrument enables valid comparison
between studies, the need for uniformity must be weighed against the dangers associated with
continued use of potentially invalid, out-dated, or in other ways inappropriate tools. In the
case of reckless driving in young drivers, many existing instruments are lacking in focus,
breadth, and precision and thus may not accurately measure the full diversity of relevant
behaviours. The present study has introduced a new scale that enables the measurement of
four distinctive yet correlated types of reckless driving behaviour. Researchers can
investigate possible variations in the antecedents of these reckless driving types, and policy-
makers can use this evidence in the design and evaluation of interventions. By continuing to
re-conceptualise the reckless driving behaviour of young drivers, the relevance of research
and the impact of interventions can be further improved.
Acknowledgements
The researchers would like to thank the Queensland Department of Transport and
Main Roads for their assistance in the collection of the data used in this research. We also
thank the anonymous reviewers for their insightful feedback on earlier drafts of this paper.
References
af Wåhlberg, A. E., Dorn, L., & Kline T. (2011). The Manchester Driver Behaviour
Questionnaire as a predictor of road traffic accidents. Theoretical Issues in
Ergonomics, 12, 66-86.
Agerwala, S. M., Votta, A., Hogan, B., Yannocone, J., Samuels, S., & Chiffriller, S. (2008).
Aggressive driving in young motorists. International Journal of Humanities and
Social Sciences, 2, 182-185.
Anderson, P., & Baumberg, B. (2006). Alcohol in Europe. London: Institute of Alcohol
Studies.
Armstrong, K. A., Wills, A. R., & Watson, B. C. (2005). Psychosocial influences on drug
driving in young Australian drivers. In K. A. Armstrong, A. R. Wills, & B. C.
Watson, (Eds.) Australian road safety research policing education conference,
November, Wellington, New Zealand.
Arnett, J. (1992). Reckless behavior in adolescence: A developmental perspective.
Developmental review, 12, 339-373.
Arnett, J., Offer, D., & Fine, M. A. (1997). Reckless driving in adolescence: „State‟ and
„trait‟ factors. Accident Analysis and prevention, 29, 57-63.
Arnett, J. (1996). Sensation seeking, aggressiveness, and adolescent reckless behavior.
Personality and Individual Differences, 20, 693-702.
Arnett, J. (1994). Sensation seeking: A new conceptualization and a new scale. Personality
and Individual Differences, 16, 289-296.
Berghaus, G., Scheer, N., & Schmidt, P. (1995). Effects of cannabis on psychomotor skills
and driving performance: A meta-analysis of experimental studies. Paper presented at
the International Conference on Alcohol, Drugs and Traffic Safety, Adelaide.
Beyth-Marom, R., Austin, L., Fischoff, B., Palmgren, C., & Quadrel, M. J. (1993). Perceived
consequences of risky behaviors: Adults and adolescents. Developmental Psychology,
29, 549-563.
Bina, M., Graziano, F., & Bonino, S. (2006). Risky driving and lifestyles in adolescence.
Accident Analysis and Prevention, 38, 472-481.
Blows, S., Ameratunga, S., Ivers, R. Q., Lo, S. K., & Norton, R. (2005). Risky driving habits
and motor vehicle driver injury. Accident Analysis and Prevention, 37, 619-624.
Bollen, K. A., & Stein, R. A. (1992). Bootstrapping goodness-of-fit measures in structural
equation models. Sociological Methods Research, 21, 205-229.
Bradley, G., & Wildman, K. (2002). Psychosocial predictors of emerging adults‟ risk and
reckless behaviors. Journal of Youth and Adolescence, 31, 253-267.
Burns, P. C., & Wilde, G. J. S. (1995). Risk taking in male taxi drivers: Relationships among
personality, observational data and driver records. Personality and Individual
Differences, 18, 267-278.
Byrnes, J. P., Miller, D. C., & Schafer, W. D. (1999). Gender differences in risk taking: A
meta-analysis. Psychological Bulletin, 125, 367-383.
Cai, H., Lin, Y., & Mourant, R. R. (2007, September). Study on driver emotion in driver-
vehicle-environment systems using multiple networked driving simulators. Paper
presented at the driving simulation conference, Iowa City, IA.
Calafat, A., Blay, N., Juan, M., Adrover, D., Bellis, M. A., Hughes, K., …Bohrn, K. (2009)
Traffic risk behaviors at nightlife: Drinking, taking drugs, driving, and use of public
transport by young people. Traffic Injury Prevention, 10, 162-169.
Catchpole, J., & Styles, T. (2005). Young drivers: Who takes risks and why? Vermont South,
VIC: ARRB Group Ltd.
Charlton, S. G. (2009). Driving while conversing: Cell phones that distract and passengers
who react. Accident Analysis and Prevention, 41, 160-173.
Chisholm, S. L., Caird, J. K., & Lockart, J. (2008). The effects of practice with MP3 players
on driving performance. Accident Analysis and Prevention, 40, 704-713.
Clarke, D. D., Ward, P., & Truman, W. (2005). Voluntary risk taking and skill deficits in
young driver accidents in the UK. Accident Analysis and Prevention, 37, 523-529.
Clement, R., & Jonah, B. A. (1984). Field dependence, sensation seeking and driving
behavior. Personality and Individual Differences, 5, 87-93.
Dahlen, E. R., Martin, R. C., Ragan, K., & Kuhlman, M. M. (2005). Driving anger, sensation
seeking, impulsiveness, and boredom proneness in the prediction of unsafe driving.
Accident Analysis and Prevention, 37, 341-348.
Dalziel, J., & Job, S. (1997). Motor vehicle accidents, fatigue and optimism bias in taxi
drivers. Accident Analysis and Prevention, 29, 489-494.
Deck, C., Lee, J., & Reyes, J. (2008). Risk attitudes in large stake gambles: Evidence from a
game show. Applied Economics, 40, 41-52.
Deery, H. A. (1999). Hazard and risk perception among young novice drivers. Journal of
Safety Research, 30, 225-236.
Deery, H. A., & Fildes, B. N. (1999). Young novice driver subtypes: Relationship to high-
risk behavior, traffic accident record, and simulator driving performance. Human
Factors, 41, 628-643.
Deery, H.A., & Love, A.W. (1996). The effect of a moderate dose of alcohol on the traffic
hazard perception profile of young drivers. Addiction, 91, 815-827.
Deffenbacher, J. L., Lynch, R. S., Oetting, E. U., & Swaim, R. C. (2002). The driving anger
expression inventory: A measure of how people express their anger on the road.
Behaviour Research and Therapy, 40, 717-737.
DePasquale, J. P., Geller, E. S., Clarke, S. W., & Littleton, L. C. (2001). Measuring road
rage: Development of the Propensity for Angry Driving Scale. Journal of Safety
Research, 32, 1-16.
De Winter, J. C. F., & Dodou, D. (2010). The Driver Behaviour Questionnaire as a predictor
of accidents: A meta-analysis. Journal of Safety Research, 41, 463-470.
Dula, C. S., & Ballard, M. E. (2003). Development and evaluation of a measure of dangerous,
aggressive, negative emotional, and risky driving. Journal of Applied Social
Psychology, 33, 263-282.
Dula, C. S., & Geller, E. S. (2003). Risky, aggressive, or emotional driving: Addressing the
need for consistent communication in research. Journal of Safety Research, 34, 559-
566.
Elliot, M. A., Baughan, C. J., & Sexton, B. F. (2007). Errors and violations in relation to
motorcyclists‟ crash risk. Accident Analysis and Prevention, 39, 491-499.
Fergusson, D. M., Swain-Campbell, N., & Horwood, J. (2003). Risky driving behaviour in
young people: Prevalence, personal characteristics and traffic accidents. Australian
and New Zealand Journal of Public Health, 27, 337-342.
Fernandes, R., Soames-Job, R. F., & Hatfield, J. (2007). A challenge to the assumed
generalizability of prediction and countermeasure for risky driving: Different factors
predict different risky driving behaviors. Journal of Safety Research, 38, 59-70.
French, D., West, R., Elander, J., & Wilding, J. (1993). Decision making style, driving style
and self-reported involvement in road traffic accidents. Ergonomics, 36, 627-644.
Furnham, A., & Saipe, J. (1993). Personality correlates of convicted drivers. Personality and
Individual Differences, 14, 326-329.
Garson, G. D. (2012). Cluster analysis. Asheboro, NC: Statistical Associates Publishers.
George, S., Clark, M., & Crotty, M. (2007). Development of the Adelaide driving self-
efficacy scale. Clinical Rehabilitation, 21, 56-61.
Gibbons, F. X., & Gerrard, M. (1995). Predicting young adults‟ health risk behaviour.
Journal of Personality and Social Psychology, 69, 505-517.
Gibbons, F. X., Gerrard, M., & Lane, D. J. (2003). A social reaction model of adolescent
health risk. In J. Suls, & K. A. Wallston (Eds.), Social psychological foundations of
health and illness (pp. 107-136). Malden, MA: Blackwell Publishers.
Gibbons, F. X., Gerrard, M., Ouellette, J. A., & Burzette, R. (1998). Cognitive antecedents to
adolescent health risk: Discriminating between behavioral intention and behavioral
willingness. Psychology and Health, 13, 319-339.
Gibbons, F. X., Gerrard, M., Vande Lune, L. S., Wills, T. A., Brody, G., & Conger, R. D.
(2004). Context and cognition: Environmental risk, social influence, and adolescent
substance use. Personality and Social Psychology Bulletin, 30, 1048-1061.
Glendon, A. I., McNally, B., Jarvis, A., Chalmers, S., & Salisbury, R. (in press). Evaluating a
novice driver and pre-driver road safety intervention. Accident Analysis and
Prevention. http://dx.doi.org/10.1016/j.aap.2013.11.017
Golias, I., & Karlaftis, M. G. (2002). An international comparative study of self-reported
driver behaviour. Transportation Research Part F, 4, 243-256.
Green, S. B., Lissitz, R. W., & Mulaik, S. A. (1977). Limitations of coefficient alpha an index
of test unidimensionality. Educational and Psychological Measurement, 37, 827-838.
Greene, K., Krcmar, M., Walters, L. H., Rubin, D. L., Hale, J., & Hale, L. (2000). Targeting
adolescent risk-taking behaviors: the contribution of egocentrism and sensation-
seeking. Journal of Adolescence, 23, 439-461.
Groeger, J. A. (2006). Youthfulness, inexperience, and sleep loss: The problems young
drivers face and they pose for us. Injury prevention, 12, i19-i24.
Gulian, E., Matthews, G., Glendon, A. I., Davies, D. R., & Debney, L. M. (1989).
Dimensions of driver stress. Ergonomics, 32, 585-602.
Hair, J. F., Black, W. C., Babin, B. J., & Anderson, R. E. (2010). Multivariate data analysis
(7th ed.). Upper Saddle River, NJ: Pearson Prentice-Hall.
Hallett, C., Lambert, A., & Regan, M. A. (2011). Cell phone conversing while driving in
New Zealand: Prevalence, risk perception and legislation. Accident Analysis and
Prevention, 43, 862-869.
Hancock, G. R., & Mueller, R. O. (2001). Rethinking construct reliability within latent
variable systems. In R. Cudeck, S. du Toit, & D. Sörbom (Eds.), Structural Equation
Modeling: Present and Future – A Festschrift in Honor of Karl Jöreskog (pp.195-
216). Lincolnwood, IL: Scientific Software International Inc.
Harre, N., Brandt, T., & Dawe, M. (2000). The development of risky driving in adolescence.
Journal of Safety Research, 31, 185-194.
Harris, P. B., & Houston, J. M. (2010). Recklessness in context: Individual and situational
correlates to aggressive driving. Environment and Behaviour, 42, 44-60.
Hartos, J., Eitel, P., & Simons-Morton, B. (2002). Parenting practices and adolescent risky
driving: A three-month prospective study. Health Education Behaviour, 29, 194-206.
Hatfield, J., & Fernandes, R. (2009). The role of risk-propensity in the risky driving of young
drivers. Accident Analysis and Prevention, 41, 25-35.
Henley, N. (2004). Social marketing: „Selling‟ injury prevention. In R. McClure, M.
Stevenson, & S. McEvoy (Eds.), The scientific basis of injury prevention and control
(pp. 318-333). Melbourne: IP Communications.
Hoyle, R. H., Stephenson, M. T., Palmgreen, P., Lorch, E. P., & Donohew, R. L. (2002).
Reliability and validity of a brief measure of sensation seeking. Personality and
Individual Differences, 32, 401-414.
Jessor, R., Turbin, M. S., & Costa, F. M. (1997). Predicting developmental change in risky
driving: The transition to young adulthood. Applied Developmental Science, 1, 4-16.
Jonah, B. A. (1986). Accident risk and risk-taking behaviour among young drivers. Accident
Analysis and Prevention, 18, 255-271.
Jonah, B. A. (1997). Sensation seeking and risky driving: A review and synthesis of the
literature. Accident Analysis and Prevention, 29, 651-665.
Kircher, A., Vogel, K., Tornros, J., Bolling, A., Nilsson, L., Patten, C., …Ceci, R. (2004).
Mobile telephone simulator study. Linköping, Sweden: Swedish National Road and
Transport Research Institute.
Klauer, S. G., Dingus, T. A., Neale, V. L., Sudweeks, J. D., & Ramsey, D. J. (2006). The
impact of driver inattention on near-crash/crash risk: An analysis using the 100-car
naturalistic driving study data (DOT HS 810 594). Washington, DC: Department of
Transportation.
Kontogiannis, T., Kossiavelou, Z., & Marmaras, N. (2002). Self-reports of aberrant behaviour
on the roads: Errors and violations in a sample of Greek drivers. Accident Analysis
and Prevention, 34, 381-399.
Krahe, B., & Fenske, I. (2002). Predicting aggressive driving behaviour: The role of macho
personality, age, and power of car. Aggressive Behaviour, 28, 21-29.
Lawton, R., Parker, D., Manstead, A. S. R., & Stradling, S. G. (1997). The role of affect in
predicting social behaviors: The case of road traffic violations. Journal of Applied
Social Psychology, 27, 1258-1276.
Lenne, M. G., Dietz, G., Rumbold, G., Redman, J. R., & Triggs, T. J. (2000). Opioid
dependence and driving ability: A view in the context of proposed legislative change
in Victoria. Drug and Alcohol Review, 19, 427-439.
Lonczak, H. S., Neighbors, C., & Donovan, D. M. (2007). Predicting risky and angry driving
as a function of gender. Accident Analysis and Prevention, 39, 536-545.
Lund, I. O., & Rundmo, T. (2009). Cross-cultural comparisons of traffic safety, risk
perception, attitudes and behaviour. Safety Science, 47, 547-553.
Mardia, K. V. (1970). Measures of multivariate skewness and kurtosis with applications.
Biometrika, 57, 519-530.
Malta, L. S. (2004). (Doctoral dissertation). Predictors of aggressive driving in young adults.
Retrieved from ProQuest Dissertations and Theses database. (UMI No. 765833501)
Maslowsky, J., Keating, D. P., Monk, C. S., & Schulenberg, J. (2010). Planned versus
unplanned risks: Neurocognitive predictors of subtypes of adolescents‟ risk
behaviour. International Journal of Behavioural Development, 35, 152-160.
McEvoy, S. P., Stevenson, M. R., & Woodward, M. (2006). The impact of driver distraction
on road safety: Results from a representative survey in two Australian states. Injury
Prevention, 12, 242-247.
McNally, B. & Titchener, K. (2012). The role of affective processes on young drivers‟ risk
perceptions: A dual process model approach. Journal of Risk Research, 15, 39-51.
Montano, D., Thompson, B., Taylor, V. M., & Mahloch, J. (1997). Understanding
Mammography Intention and Utilization among Women in an Inner City Public
Hospital Clinic. Preventive Medicine, 26, 817-824.
Montag, I. (1989). Styles of thinking and driving. Paper presented at the international
conference of Changes and Innovation in Road Safety, Tel Aviv.
Neighbors, C., Vietor, N. A., & Knee, C. R. (2002). A motivational model of driving anger
and aggression. Personality and Social Psychology Bulletin, 28, 324-335.
Nevitt, J., & Hancock, G. R. (2001). Performance of bootstrapping approaches to model test
statistics and parameter standard error estimation in structural equation modeling.
Structural Equation Modeling, 8, 353-377.
O'Connor, B. P. (2000). SPSS and SAS programs for determining the number of components
using parallel analysis and Velicer's MAP test. Behavior Research Methods,
Instrumentation, and Computers, 32, 396-402.
Oltedal, S., & Rundmo, T. (2006). The effects of personality and gender on risky driving
behaviour and accident involvement. Safety Science, 44, 621-628.
Owens, J. M., McLaughlin, S. B., & Sudweeks, J. (2011). Driver performance while text
messaging using handheld and in-vehicle systems. Accident Analysis and Prevention,
43, 939-947.
Paleti, R., Eluru, N., & Bhat, C. (2010). Examining the influence of aggressive driving
behavior on driver injury severity in traffic crashes. Accident Analysis and Prevention
42, 1839-1854.
Parker, D. (2002). Changing drivers' attitudes to speeding using the Theory of Planned
Behaviour. In D. Rutter & L. Quine (Eds.), Changing Health Behaviour (pp. 138-
152), Buckingham: Open University Press.
Patil, S. M., Shope, J. T., Raghunathan, T. E., & Bingham, C. R. (2006). The role of
personality characteristics in young adult driving. Traffic Injury Prevention, 7, 328-
334.
Phillip, P., Sagaspe, P., Moore, N., Taillard, J., Charles, A., Guilleminault, C., & Bioulac, B.
(2005). Fatigue, sleep restriction and driving performance. Accident Analysis and
Prevention, 37, 473-478.
Potter, J. (2000). Drugs and driving in Australia. Sydney: Austroads.
Price, P. C. (2001). A group size effect on personal risk judgments: Implications for
unrealistic optimism. Memory and Cognition, 29, 578-586.
Raemakers, J. G., Berghaus, G., van Laar, M., & Drummer, O. H. (2004). Dose related risk of
motor vehicle crashes after cannabis use. Drug and Alcohol Dependence, 73, 109-
119.
Reason, J. T., Manstead, A., Stradling, S., Baxter, J. S., & Campbell, K. (1990). Errors and
violations on the roads: A real distinction? Ergonomics, 33, 1315-1332.
Richer, I., & Bergeron, J. (2009). Driving under the influence of cannabis: Links with
dangerous driving, psychological predictors, and accident involvement. Accident
Analysis and Prevention, 41, 299-307.
Rundmo, T. (1995). Perceived risk, safety status, and job stress among injured and non-
injured employees on offshore petroleum installations. Journal of Safety Research,
26, 87-97.
Rundmo, T., & Iversen, H. (2002). Personality, risky driving and accident involvement
among Norwegian drivers. Personality and Individual Differences, 33, 1251-1263.
Sarkar, S., & Andreas, M. (2004). Acceptance of and engagement in risky driving behaviors
by teenagers. Adolescence, 39, 687-700.
Schmidt, S. A. (2012). (Doctoral dissertation). Youth risky driving behaviours: Advancements
in measurement and theory. Retrieved from
https://atrium.lib.uoguelph.ca/xmlui/bitstream/handle/10214/6314/Dissertation.Sarah
%20Schmidt.pdf?sequence=1
Schwebel, D. C., Severson, J., Ball, K. K., & Rizzo, M. (2006). Individual differences factors
in risky driving: The roles of anger/hostility, conscientiousness, and sensation-
seeking. Accident Analysis and Prevention, 38, 801-810.
Scott-Parker, B., Watson, B. C., & King, M. J. The risky behaviour of young drivers:
Developing a measurement tool. 20th
Canadian Multidisciplinary Road Safety
Conference, Niagara Falls, Ontario, June, 2010.
Sexton, B. F., Tunbridge, R. J., Brooke-Carter, N., Jackson, P. G., Wright, K., Stark, M. M.,
& Englehart, K. (2000). The influence of cannabis on driving (TRL Report 477).
Crowthorne, UK: TRL Limited.
Sheehan, M., Siskind, V., & Schonfeld, C. (2004). A longitudinal study of adolescent drink
driving and other risk taking behaviors: Challenges for the change process. Paper
presented at the17th International Conference on Alcohol Drugs and Traffic Safety,
Glasgow, Scotland.
Shinar, D., & Compton, R. (2004). Aggressive driving: An observational study of driver,
vehicle, and situational variables. Accident Analysis and Prevention, 36, 429-437.
Simons-Morton, B., Lerner, N., & Singer, J. (2005). The observed effects of teenage
passengers on the risky driving behavior of teenage drivers. Accident Analysis and
Prevention, 37, 973-982.
Sjoberg, L., Moen, B. E., & Rundmo, T. (2004). Explaining risk perception. An evaluation of
the psychometric paradigm in risk perception research. Trondheim, Norway: Rotunde
Publications. Retrieved at
www.svt.ntnu.no/psy/Torbjorn.Rundmo/Psychometric_paradigm.pdf
Smart, D., Vassallo, S., Sanson, A., Cockfield, S., Harris, A., Harrison, W., & MacIntyre, A.
(2005). In the driver‟s seat: Understanding young adults‟ driving behaviour.
Canberra, ACT: Australian Institute of Family Studies.
Smith, S., Carrington, M., & Trinder, J. (2005). Subjective and predicted sleepiness while
driving in young adults. Accident Analysis and Prevention, 37, 1066-1073.
Strayer, D. L., & Johnston, W. A. (2001). Driven to distraction: Dual-task studies of
simulated driving and conversing on a cellular telephone. Psychological Science, 12,
462-466.
Strecher, V. J., & Rosenstock, I. M. (Eds). (1997). The health belief model. San Francisco,
CA: Jossey-Bass.
Taubman- Ben-Ari, O., Mikulincer, M., & Gillath, O. (2004). The multidimensional driving
style inventory: Scale construct and validation. Accident Analysis and Prevention, 36,
323-332.
Taubman- Ben-Ari, O., Mikulincer, M., & Gillath, O. (2005). From parents to children:
Similarity in parents and offspring driving styles. Transportation Research Part F:
Traffic Psychology and Behaviour, 8, 19-29.
Teese, R., & Bradley, G. L. (2008). Predicting recklessness in emerging adults: A test of a
psychosocial model. Journal of Social Psychology, 148, 105-126.
Thomas, J., Kavanagh, J., Tucker, H., Burchett, H., Tripney, J., & Oakley, A. (2007).
Accidental injury, risk-taking behaviour and the social circumstances in which young
people (aged 12-24) live: A systematic review. London: EPPI-Centre, Social Science
Research Unit, Institute of Education, University of London.
Turner, C., & McClure, R. (2003). Age and gender differences in risk-taking behaviour as an
explanation for high incidence of motor vehicle crashes as a driver in young males.
International Journal of Injury Control and Safety Promotion, 10, 123-130.
Ulleberg, P., & Rundmo, T. (2002). Risk-taking attitudes among young drivers: The
psychometric qualities and dimensionality of an instrument to measure young drivers'
risk-taking attitudes. Scandinavian Journal of Psychology, 43, 227-237.
van Gelder, J., de Vries, R. E., & van der Pligt, J. (2009). Evaluating a dual-process model of
risk: Affect and cognition as determinants of risky choice. Journal of Behavioral
Decision Making, 22, 45-61.
Victoir, A., Eertmans, A., van den Bergh, O., & van den Broucke, S. (2005). Learning to
drive safely: Social-cognitive responses are predictive of performance rated by novice
drivers and their instructors. Transportation Research Part F: Traffic Psychology and
Behaviour, 8, 59-74.
Walsh, S. P., White, K. M., Hyde, M. K., & Watson, B. C. (2008). Dialling and driving:
Factors influencing intentions to use a mobile phone while driving. Accident Analysis
and Prevention, 40, 1893-1900.
Weinstein, N. D., Rothman, A. J., & Nicolich, M. (1998). Use of correlational data to
examine the effects of risk perceptions on precautionary behavior. Psychology and
Health, 13, 479-501.
White, M. P., Eiser, J. R., & Harris, P. R. (2004). Risk perceptions of mobile phone use while
driving. Risk Analysis, 24, 323-334.
Wickens, C. M., Mann, R. E., Stoduto, G., & Ialomiteanu, A. (2011). Age group differences
in self-reported aggressive driving perpetration and vicitmisation. Transportation
Research Part F: Traffic Psychology and Behaviour, 14, 400-412.
Wiesenthal, D. L., Hennessy, D. A., & Gibson, P. (2000). The Driving Vengeance
Questionnaire (DVQ): The development of a scale to measure deviant drivers'
attitudes. Violence and Victims, 15, 115-136.
Williams, A. F. (2003). Teenage drivers: Patterns of risk. Journal of Safety Research, 34, 5-
15.
Williamson, A. (2003). Why are young drivers over represented in crashes? Summary of
issues. Update of literature reviews: Literature from 2000 to 2003. Sydney, NSW:
NSW Motor Accidents Authority.
Xie, C., & Parker, D. (2002). A social psychological approach to driving violations in two
Chinese cities. Transportation Research Part F, 5, 293-308.
Zuckerman, M. (1994). Behavioral Expressions and Biosocial Bases of Sensation Seeking.
Cambridge, UK: Cambridge University Press.
Zuckerman, M., Eysenck, S., & Eysenck, H. J. (1978). Sensation seeking in England and
America: Cross-cultural age and sex comparisons. Journal of Consulting and Clinical
Psychology, 46, 139-149.
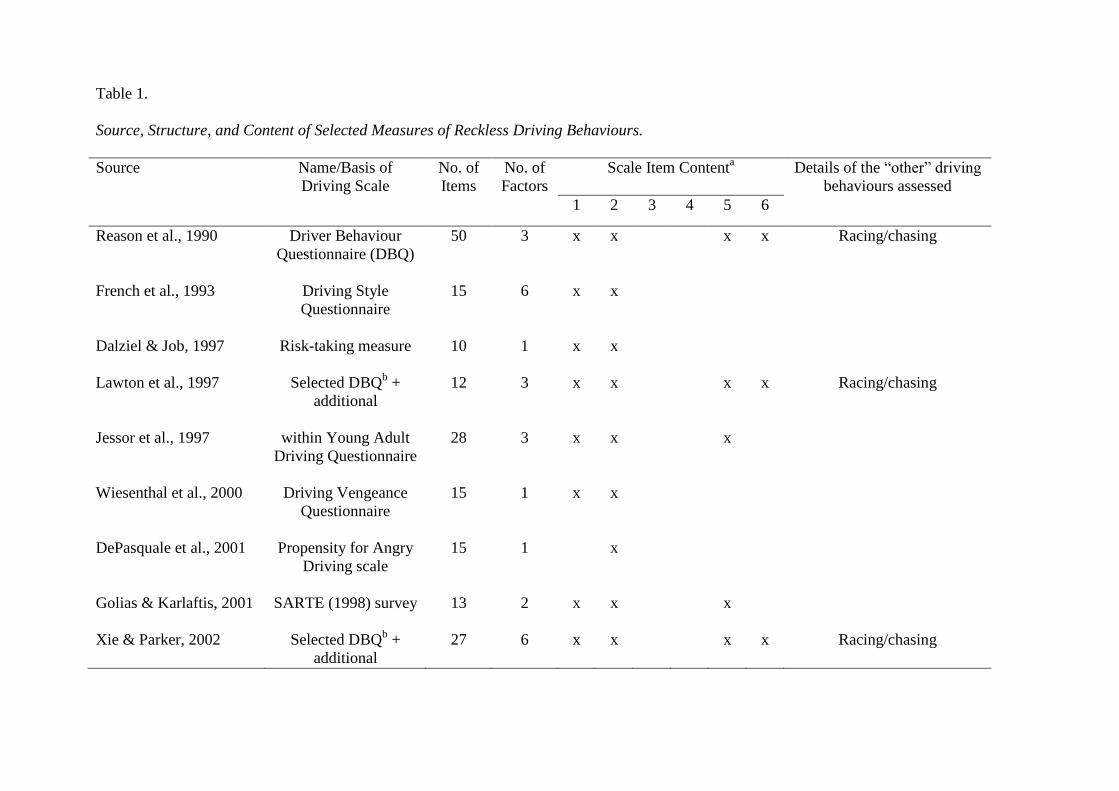
Table 1.
Source, Structure, and Content of Selected Measures of Reckless Driving Behaviours.
Source Name/Basis of
Driving Scale
No. of
Items
No. of
Factors
Scale Item Contenta Details of the “other” driving
behaviours assessed
1 2 3 4 5 6
Reason et al., 1990 Driver Behaviour
Questionnaire (DBQ)
50 3 x x x x Racing/chasing
French et al., 1993 Driving Style
Questionnaire
15 6 x x
Dalziel & Job, 1997
Risk-taking measure
10 1 x x
Lawton et al., 1997 Selected DBQb +
additional
12 3 x x x x Racing/chasing
Jessor et al., 1997 within Young Adult
Driving Questionnaire
28 3 x x x
Wiesenthal et al., 2000 Driving Vengeance
Questionnaire
15 1 x x
DePasquale et al., 2001 Propensity for Angry
Driving scale
15 1 x
Golias & Karlaftis, 2001 SARTE (1998) survey
13 2 x x x
Xie & Parker, 2002 Selected DBQb +
additional
27 6 x x x x Racing/chasing
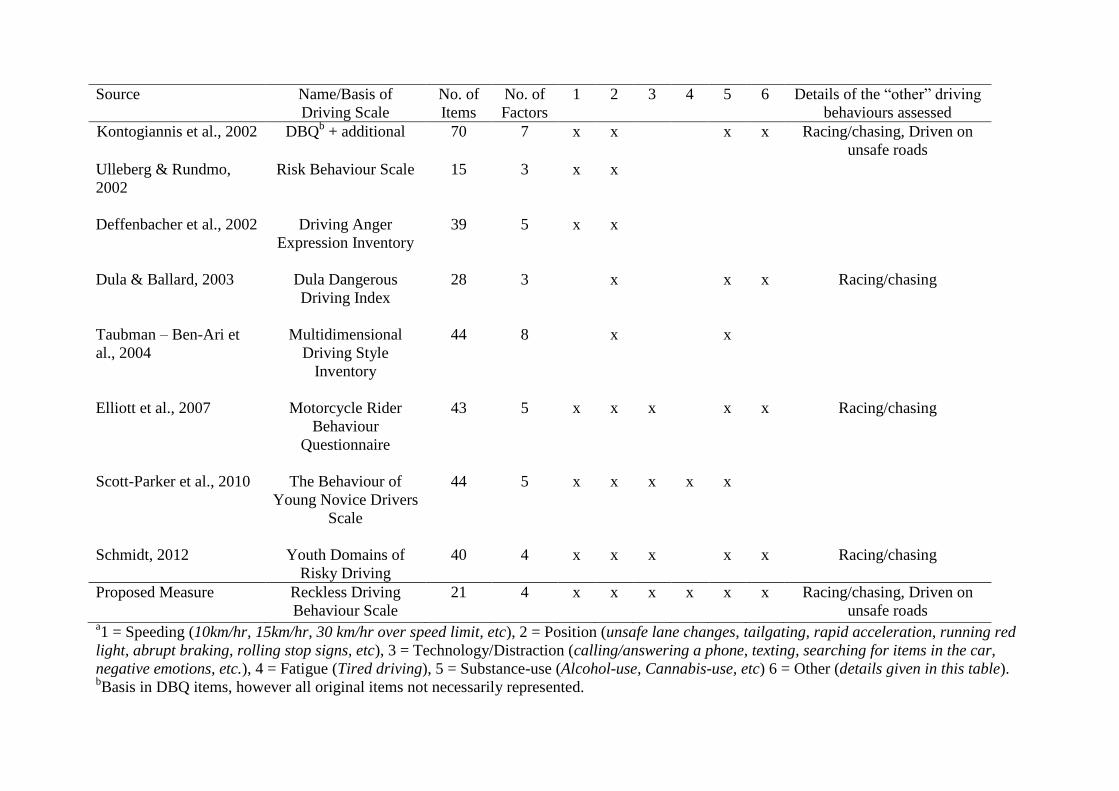
Source Name/Basis of
Driving Scale
No. of
Items
No. of
Factors
1 2 3 4 5 6 Details of the “other” driving
behaviours assessed
Kontogiannis et al., 2002 DBQb + additional 70 7 x x x x Racing/chasing, Driven on
unsafe roads
Ulleberg & Rundmo,
2002
Risk Behaviour Scale 15 3 x x
Deffenbacher et al., 2002 Driving Anger
Expression Inventory
39 5 x x
Dula & Ballard, 2003 Dula Dangerous
Driving Index
28 3 x x x Racing/chasing
Taubman – Ben-Ari et
al., 2004
Multidimensional
Driving Style
Inventory
44 8 x x
Elliott et al., 2007 Motorcycle Rider
Behaviour
Questionnaire
43 5 x x x x x Racing/chasing
Scott-Parker et al., 2010 The Behaviour of
Young Novice Drivers
Scale
44 5 x x x x x
Schmidt, 2012 Youth Domains of
Risky Driving
40 4 x x x x x Racing/chasing
Proposed Measure Reckless Driving
Behaviour Scale
21 4 x x x x x x Racing/chasing, Driven on
unsafe roads a1 = Speeding (10km/hr, 15km/hr, 30 km/hr over speed limit, etc), 2 = Position (unsafe lane changes, tailgating, rapid acceleration, running red
light, abrupt braking, rolling stop signs, etc), 3 = Technology/Distraction (calling/answering a phone, texting, searching for items in the car,
negative emotions, etc.), 4 = Fatigue (Tired driving), 5 = Substance-use (Alcohol-use, Cannabis-use, etc) 6 = Other (details given in this table). bBasis in DBQ items, however all original items not necessarily represented.
Table 2.
Loadings for the Factors Elicited from Study 1 Exploratory Factor Analysis of Self-Reported
Reckless Driving Behaviours (N = 189).
Items Factor
1
Factor
2
Factor
3
Factor
4
Texted or looked for numbers on your phone or searched
for songs on your MP3 player whilst driving.
.81
Ate, drank, or smoked whist driving. .75
Called or answered a hand-held phone whilst driving. .70
Searched for CDs or manually searched for stations on
your car radio whilst driving.
.59
Driven when extremely emotionally aroused (e.g.,
angry).
.59
Driven whilst extremely tired or exhausted. .52
Driven under the influence of cannabis or any other
psychoactive drug (e.g., ecstasy).
.75
Driven when you suspected you were over the .05 blood
alcohol limit.
.64
Raced or chased another vehicle driven by someone you
do not know.
.88
Performed burnouts or “doughnuts”. .85
Raced or chased another vehicle driven by a friend or
someone you know.
.61
Driven on unsafe roads (e.g., when flooded). .45
Driven at least 15km/hr above the speed limit. .64
“Tail-gated” or deliberately followed another vehicle at
an unsafe distance.
.64
Exceeded a decreased speed limit (e.g., 40km/hr) in a
road work zone by at least 15km/hr.
.62
Accelerated from a stationary position at an excessive
rate (e.g., from a red light).
.60
Changed lanes frequently on a multi-lane road. .45
Turned, merged, or changed lanes without indicating. .41
Over-taken another vehicle when unsafe to do so (e.g., on
a double line, before a hill or crest).
.40
M SD Mdn Range
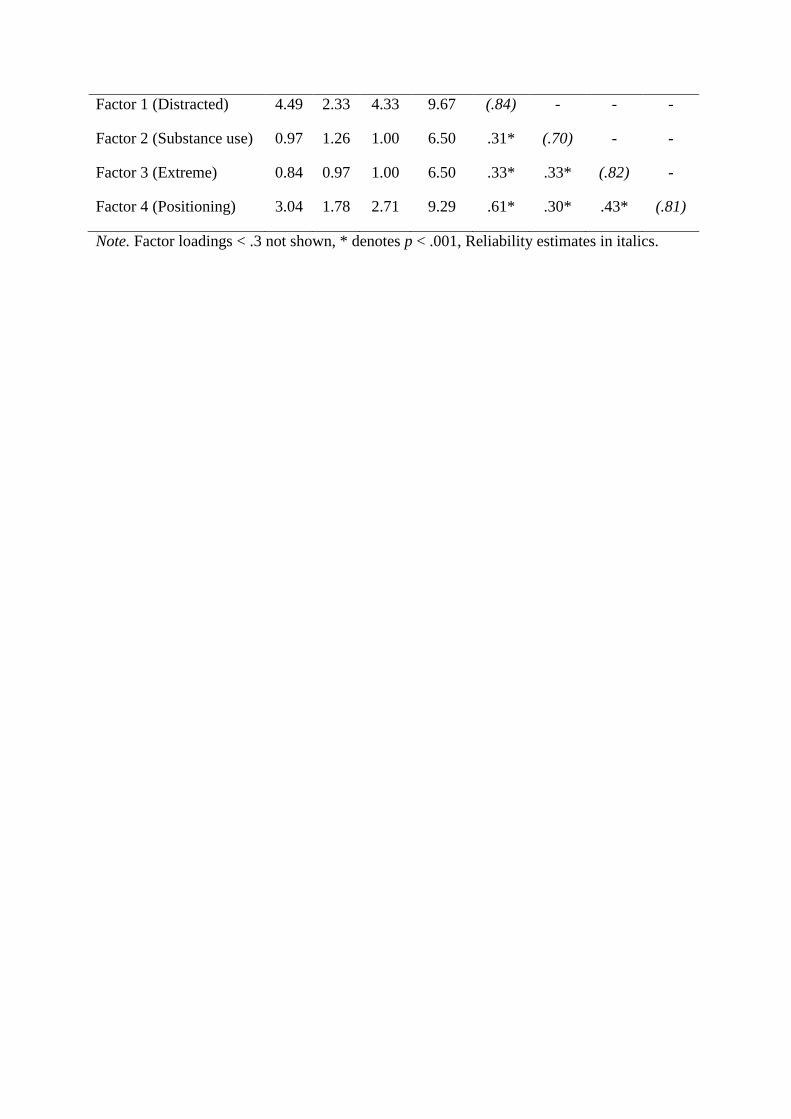
Factor 1 (Distracted) 4.49 2.33 4.33 9.67 (.84) - - -
Factor 2 (Substance use) 0.97 1.26 1.00 6.50 .31* (.70) - -
Factor 3 (Extreme) 0.84 0.97 1.00 6.50 .33* .33* (.82) -
Factor 4 (Positioning) 3.04 1.78 2.71 9.29 .61* .30* .43* (.81)
Note. Factor loadings < .3 not shown, * denotes p < .001, Reliability estimates in italics.
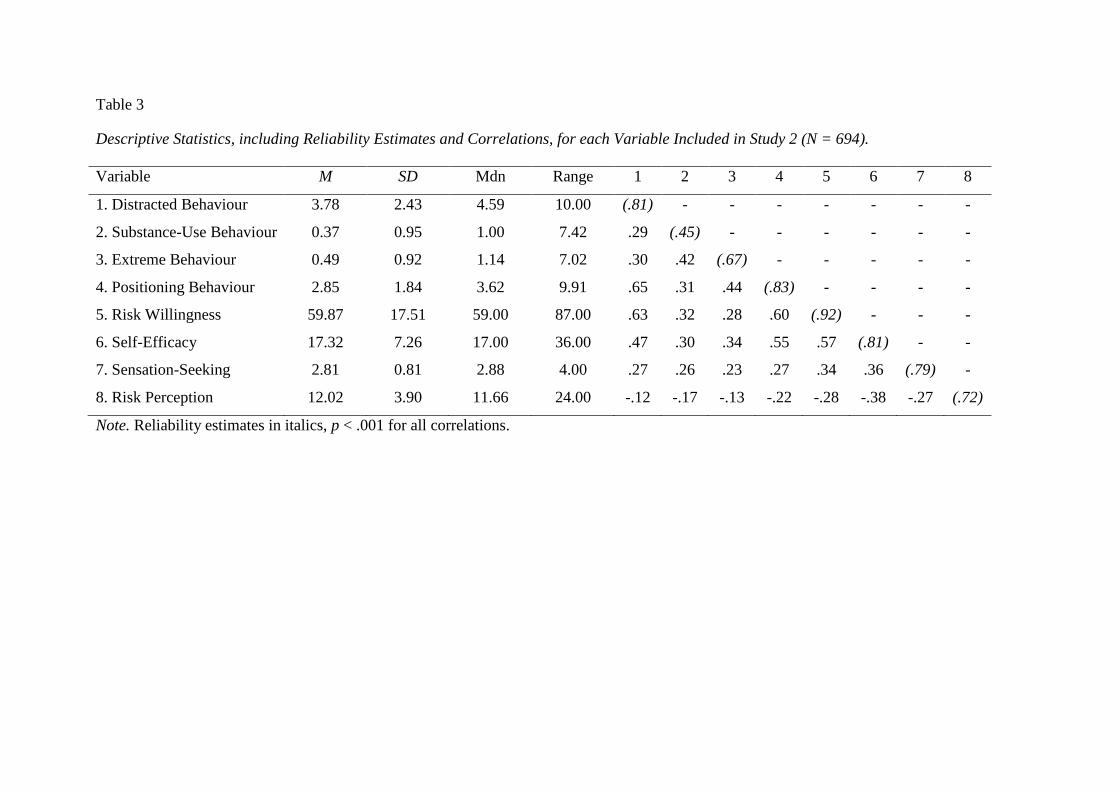
Table 3
Descriptive Statistics, including Reliability Estimates and Correlations, for each Variable Included in Study 2 (N = 694).
Variable M SD Mdn Range 1 2 3 4 5 6 7 8
1. Distracted Behaviour 3.78 2.43 4.59 10.00 (.81) - - - - - - -
2. Substance-Use Behaviour 0.37 0.95 1.00 7.42 .29 (.45) - - - - - -
3. Extreme Behaviour 0.49 0.92 1.14 7.02 .30 .42 (.67) - - - - -
4. Positioning Behaviour 2.85 1.84 3.62 9.91 .65 .31 .44 (.83) - - - -
5. Risk Willingness 59.87 17.51 59.00 87.00 .63 .32 .28 .60 (.92) - - -
6. Self-Efficacy 17.32 7.26 17.00 36.00 .47 .30 .34 .55 .57 (.81) - -
7. Sensation-Seeking 2.81 0.81 2.88 4.00 .27 .26 .23 .27 .34 .36 (.79) -
8. Risk Perception 12.02 3.90 11.66 24.00 -.12 -.17 -.13 -.22 -.28 -.38 -.27 (.72)
Note. Reliability estimates in italics, p < .001 for all correlations.
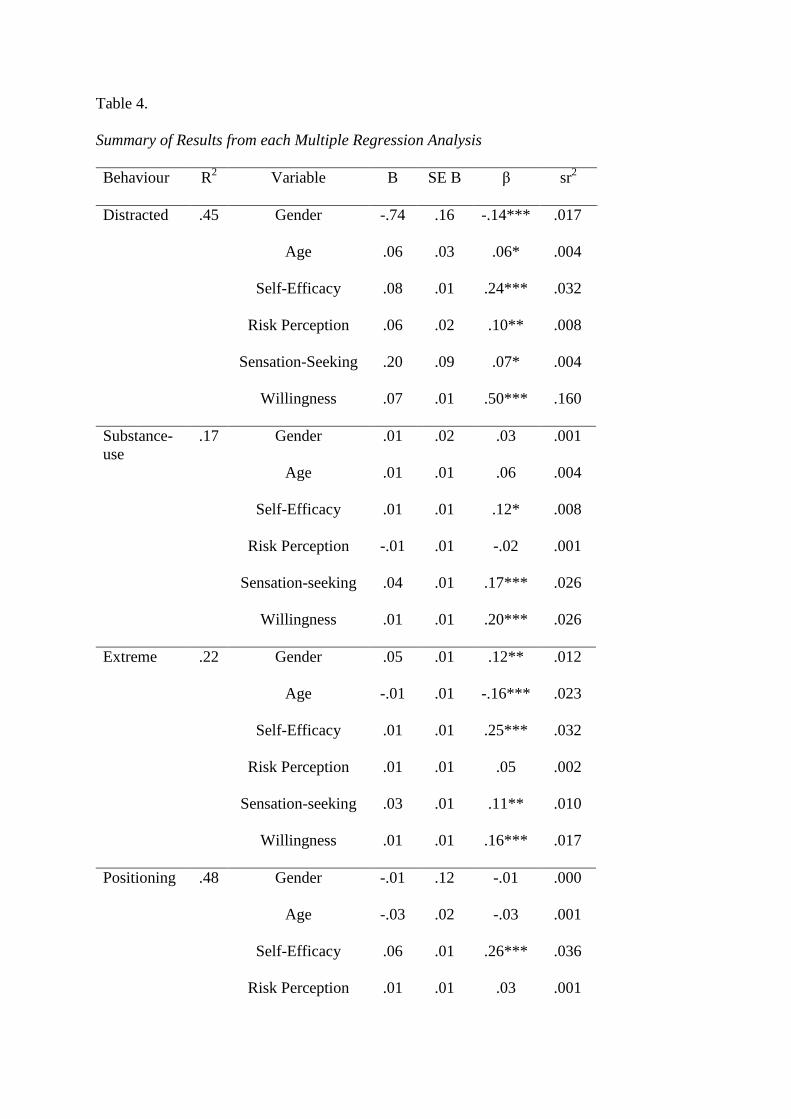
Table 4.
Summary of Results from each Multiple Regression Analysis
Behaviour R2
Variable B SE B β sr2
Distracted .45 Gender -.74 .16 -.14*** .017
Age .06 .03 .06* .004
Self-Efficacy .08 .01 .24*** .032
Risk Perception .06 .02 .10** .008
Sensation-Seeking .20 .09 .07* .004
Willingness .07 .01 .50*** .160
Substance-
use
.17 Gender .01 .02 .03 .001
Age .01 .01 .06 .004
Self-Efficacy .01 .01 .12* .008
Risk Perception -.01 .01 -.02 .001
Sensation-seeking .04 .01 .17*** .026
Willingness .01 .01 .20*** .026
Extreme .22 Gender .05 .01 .12** .012
Age -.01 .01 -.16*** .023
Self-Efficacy .01 .01 .25*** .032
Risk Perception .01 .01 .05 .002
Sensation-seeking .03 .01 .11** .010
Willingness .01 .01 .16*** .017
Positioning .48 Gender -.01 .12 -.01 .000
Age -.03 .02 -.03 .001
Self-Efficacy .06 .01 .26*** .036
Risk Perception .01 .01 .03 .001
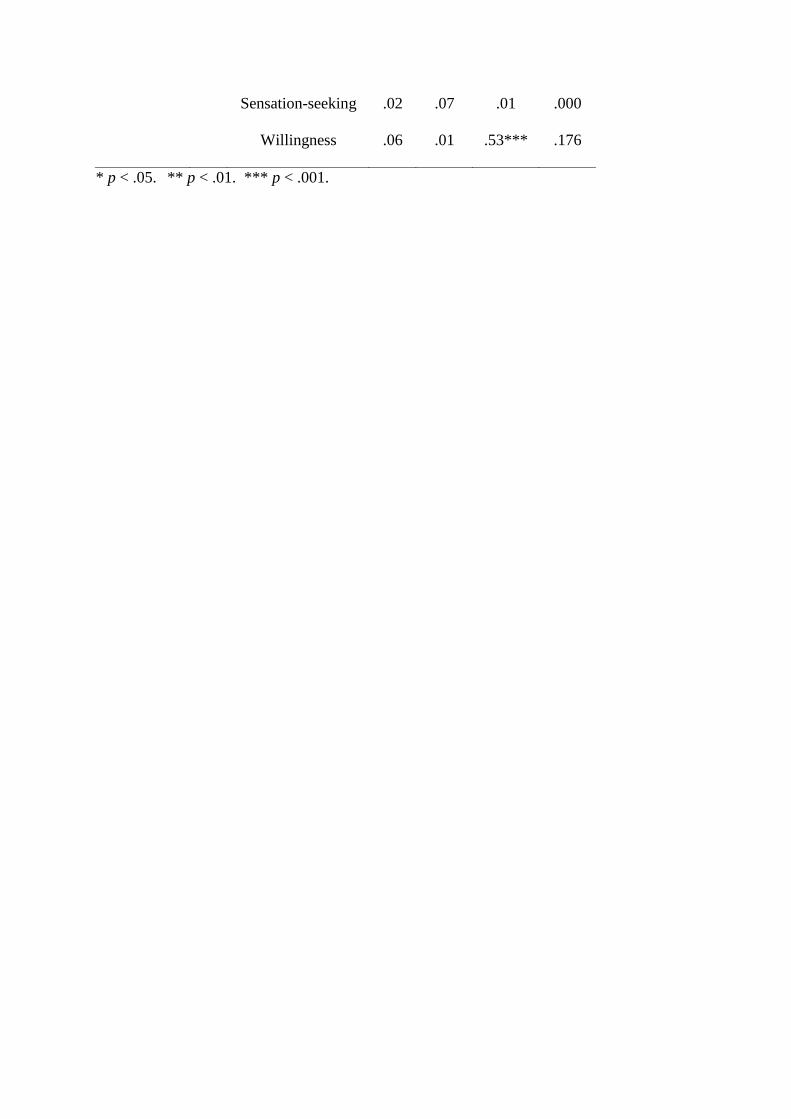
* p < .05. ** p < .01. *** p < .001.
Sensation-seeking .02 .07 .01 .000
Willingness .06 .01 .53*** .176
Related Documents