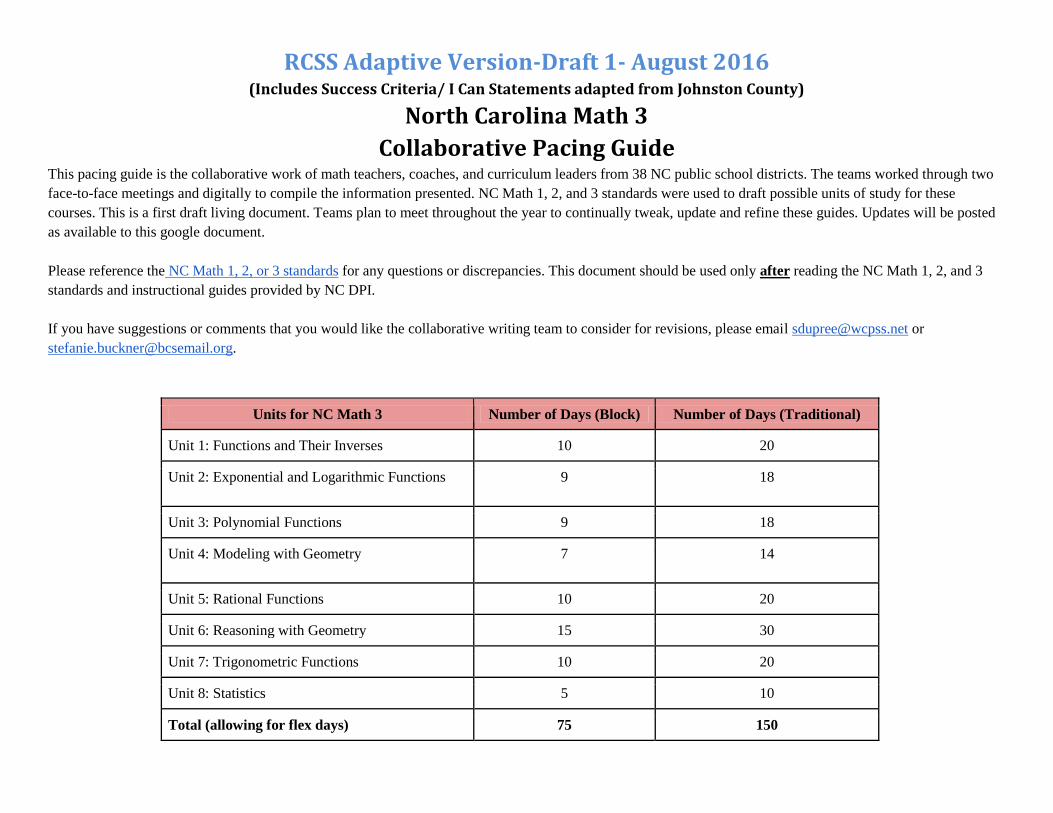
RCSS Adaptive Version-Draft 1- August 2016 (Includes Success Criteria/ I Can Statements adapted from Johnston County) North Carolina Math 3 Collaborative Pacing Guide This pacing guide is the collaborative work of math teachers, coaches, and curriculum leaders from 38 NC public school districts. The teams worked through two face-to-face meetings and digitally to compile the information presented. NC Math 1, 2, and 3 standards were used to draft possible units of study for these courses. This is a first draft living document. Teams plan to meet throughout the year to continually tweak, update and refine these guides. Updates will be posted as available to this google document. Please reference the NC Math 1, 2, or 3 standards for any questions or discrepancies. This document should be used only after reading the NC Math 1, 2, and 3 standards and instructional guides provided by NC DPI. If you have suggestions or comments that you would like the collaborative writing team to consider for revisions, please email [email protected] or [email protected]. Units for NC Math 3 Number of Days (Block) Number of Days (Traditional) Unit 1: Functions and Their Inverses 10 20 Unit 2: Exponential and Logarithmic Functions 9 18 Unit 3: Polynomial Functions 9 18 Unit 4: Modeling with Geometry 7 14 Unit 5: Rational Functions 10 20 Unit 6: Reasoning with Geometry 15 30 Unit 7: Trigonometric Functions 10 20 Unit 8: Statistics 5 10 Total (allowing for flex days) 75 150

Welcome message from author
This document is posted to help you gain knowledge. Please leave a comment to let me know what you think about it! Share it to your friends and learn new things together.
Transcript
RCSS Adaptive Version-Draft 1- August 2016 (Includes Success Criteria/ I Can Statements adapted from Johnston County)
North Carolina Math 3
Collaborative Pacing Guide
This pacing guide is the collaborative work of math teachers, coaches, and curriculum leaders from 38 NC public school districts. The teams worked through two
face-to-face meetings and digitally to compile the information presented. NC Math 1, 2, and 3 standards were used to draft possible units of study for these
courses. This is a first draft living document. Teams plan to meet throughout the year to continually tweak, update and refine these guides. Updates will be posted
as available to this google document.
Please reference the NC Math 1, 2, or 3 standards for any questions or discrepancies. This document should be used only after reading the NC Math 1, 2, and 3
standards and instructional guides provided by NC DPI.
If you have suggestions or comments that you would like the collaborative writing team to consider for revisions, please email [email protected] or
Units for NC Math 3 Number of Days (Block) Number of Days (Traditional)
Unit 1: Functions and Their Inverses 10 20
Unit 2: Exponential and Logarithmic Functions 9 18
Unit 3: Polynomial Functions 9 18
Unit 4: Modeling with Geometry 7 14
Unit 5: Rational Functions 10 20
Unit 6: Reasoning with Geometry 15 30
Unit 7: Trigonometric Functions 10 20
Unit 8: Statistics 5 10
Total (allowing for flex days) 75 150
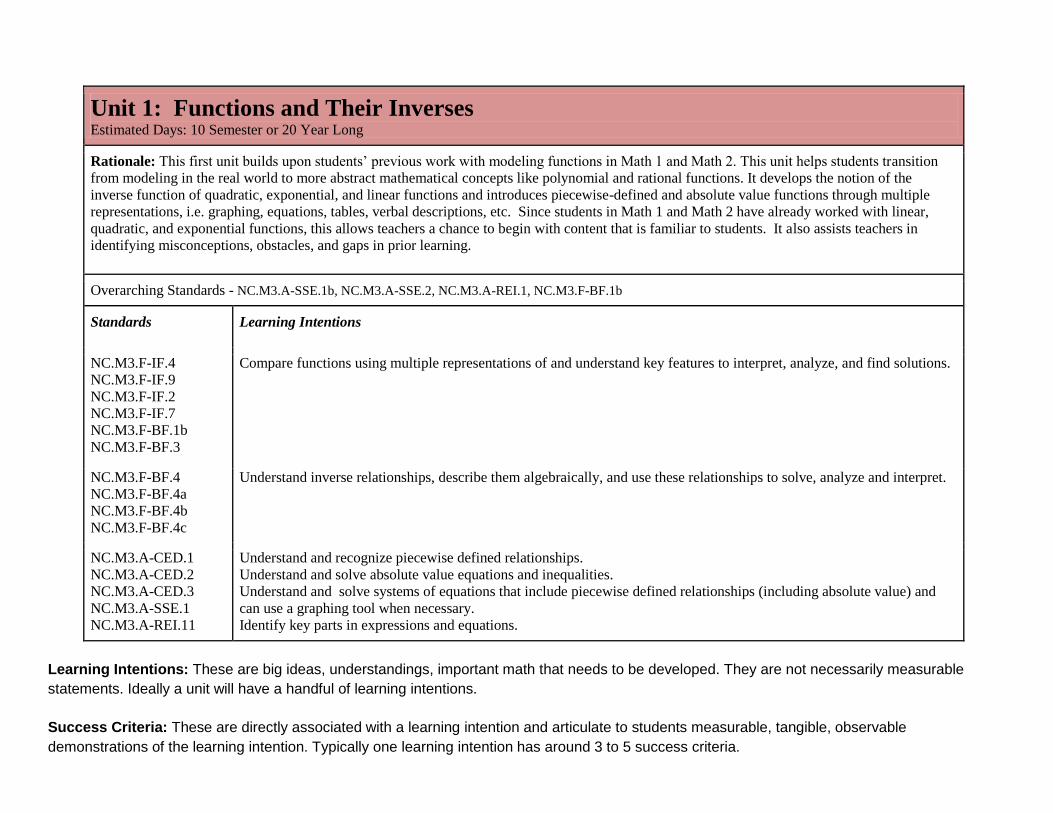
Unit 1: Functions and Their Inverses
Estimated Days: 10 Semester or 20 Year Long
Rationale: This first unit builds upon students’ previous work with modeling functions in Math 1 and Math 2. This unit helps students transition
from modeling in the real world to more abstract mathematical concepts like polynomial and rational functions. It develops the notion of the
inverse function of quadratic, exponential, and linear functions and introduces piecewise-defined and absolute value functions through multiple
representations, i.e. graphing, equations, tables, verbal descriptions, etc. Since students in Math 1 and Math 2 have already worked with linear,
quadratic, and exponential functions, this allows teachers a chance to begin with content that is familiar to students. It also assists teachers in
identifying misconceptions, obstacles, and gaps in prior learning.
Overarching Standards - NC.M3.A-SSE.1b, NC.M3.A-SSE.2, NC.M3.A-REI.1, NC.M3.F-BF.1b
Standards Learning Intentions
NC.M3.F-IF.4 NC.M3.F-IF.9 NC.M3.F-IF.2 NC.M3.F-IF.7 NC.M3.F-BF.1b NC.M3.F-BF.3
Compare functions using multiple representations of and understand key features to interpret, analyze, and find solutions.
NC.M3.F-BF.4 NC.M3.F-BF.4a NC.M3.F-BF.4b NC.M3.F-BF.4c
Understand inverse relationships, describe them algebraically, and use these relationships to solve, analyze and interpret.
NC.M3.A-CED.1 NC.M3.A-CED.2 NC.M3.A-CED.3 NC.M3.A-SSE.1 NC.M3.A-REI.11
Understand and recognize piecewise defined relationships. Understand and solve absolute value equations and inequalities. Understand and solve systems of equations that include piecewise defined relationships (including absolute value) and
can use a graphing tool when necessary. Identify key parts in expressions and equations.
Learning Intentions: These are big ideas, understandings, important math that needs to be developed. They are not necessarily measurable
statements. Ideally a unit will have a handful of learning intentions.
Success Criteria: These are directly associated with a learning intention and articulate to students measurable, tangible, observable
demonstrations of the learning intention. Typically one learning intention has around 3 to 5 success criteria.
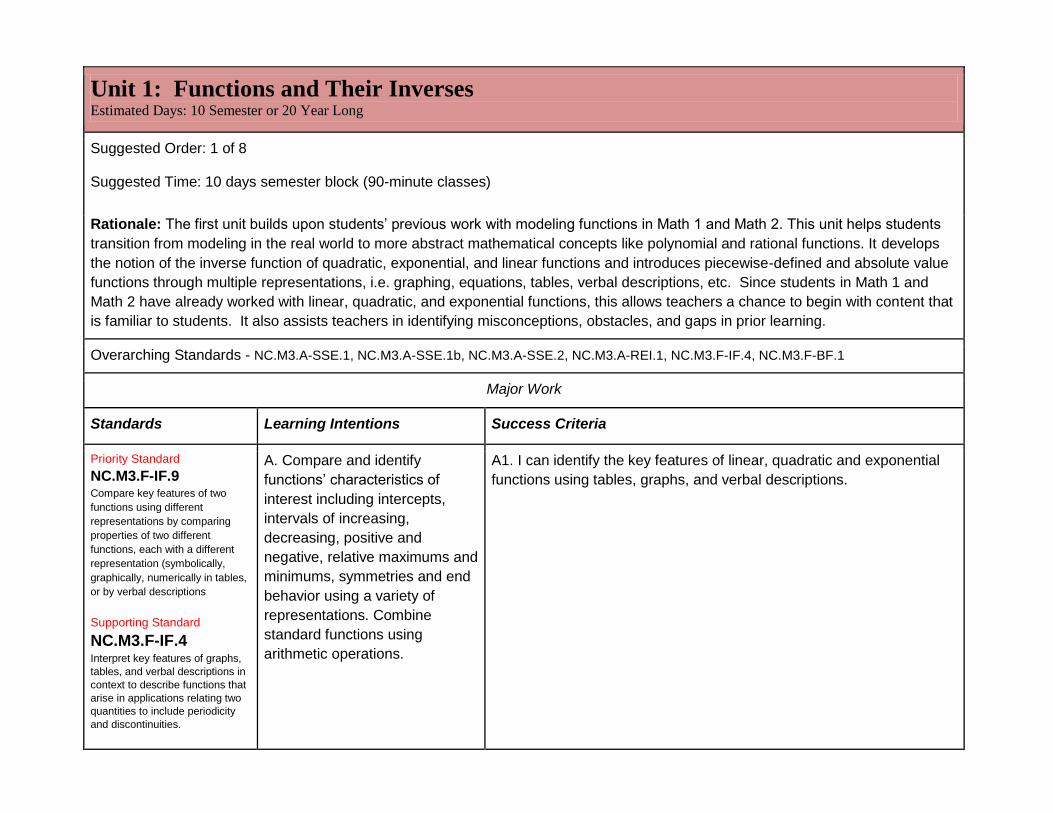
Unit 1: Functions and Their Inverses
Estimated Days: 10 Semester or 20 Year Long
Suggested Order: 1 of 8
Suggested Time: 10 days semester block (90-minute classes)
Rationale: The first unit builds upon students’ previous work with modeling functions in Math 1 and Math 2. This unit helps students
transition from modeling in the real world to more abstract mathematical concepts like polynomial and rational functions. It develops
the notion of the inverse function of quadratic, exponential, and linear functions and introduces piecewise-defined and absolute value
functions through multiple representations, i.e. graphing, equations, tables, verbal descriptions, etc. Since students in Math 1 and
Math 2 have already worked with linear, quadratic, and exponential functions, this allows teachers a chance to begin with content that
is familiar to students. It also assists teachers in identifying misconceptions, obstacles, and gaps in prior learning.
Overarching Standards - NC.M3.A-SSE.1, NC.M3.A-SSE.1b, NC.M3.A-SSE.2, NC.M3.A-REI.1, NC.M3.F-IF.4, NC.M3.F-BF.1
Major Work
Standards Learning Intentions Success Criteria
Priority Standard
NC.M3.F-IF.9 Compare key features of two
functions using different
representations by comparing
properties of two different
functions, each with a different
representation (symbolically,
graphically, numerically in tables,
or by verbal descriptions
Supporting Standard
NC.M3.F-IF.4 Interpret key features of graphs,
tables, and verbal descriptions in
context to describe functions that
arise in applications relating two
quantities to include periodicity
and discontinuities.
A. Compare and identify
functions’ characteristics of
interest including intercepts,
intervals of increasing,
decreasing, positive and
negative, relative maximums and
minimums, symmetries and end
behavior using a variety of
representations. Combine
standard functions using
arithmetic operations.
A1. I can identify the key features of linear, quadratic and exponential
functions using tables, graphs, and verbal descriptions.
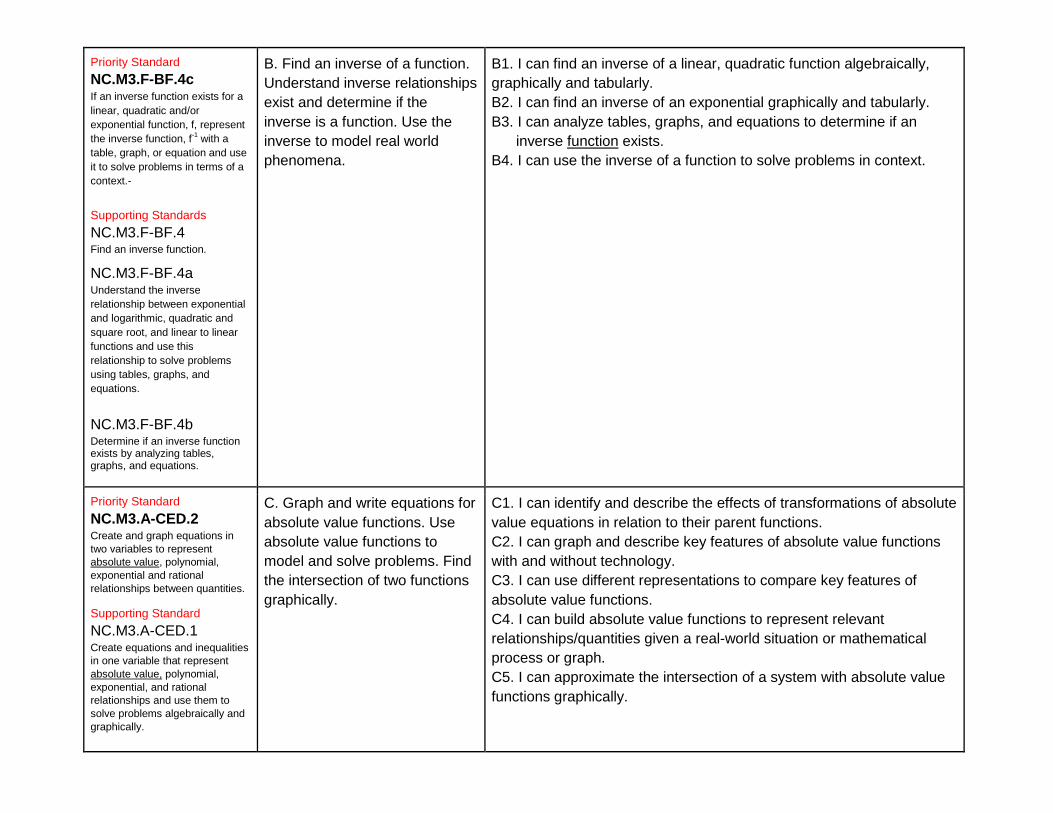
Priority Standard
NC.M3.F-BF.4c If an inverse function exists for a
linear, quadratic and/or
exponential function, f, represent
the inverse function, f-1 with a
table, graph, or equation and use
it to solve problems in terms of a
context.
Supporting Standards
NC.M3.F-BF.4 Find an inverse function.
NC.M3.F-BF.4a Understand the inverse
relationship between exponential
and logarithmic, quadratic and
square root, and linear to linear
functions and use this
relationship to solve problems
using tables, graphs, and
equations.
NC.M3.F-BF.4b Determine if an inverse function exists by analyzing tables, graphs, and equations.
B. Find an inverse of a function.
Understand inverse relationships
exist and determine if the
inverse is a function. Use the
inverse to model real world
phenomena.
B1. I can find an inverse of a linear, quadratic function algebraically,
graphically and tabularly.
B2. I can find an inverse of an exponential graphically and tabularly.
B3. I can analyze tables, graphs, and equations to determine if an
inverse function exists.
B4. I can use the inverse of a function to solve problems in context.
Priority Standard
NC.M3.A-CED.2 Create and graph equations in
two variables to represent
absolute value, polynomial,
exponential and rational
relationships between quantities.
Supporting Standard
NC.M3.A-CED.1 Create equations and inequalities
in one variable that represent
absolute value, polynomial,
exponential, and rational
relationships and use them to
solve problems algebraically and
graphically.
C. Graph and write equations for
absolute value functions. Use
absolute value functions to
model and solve problems. Find
the intersection of two functions
graphically.
C1. I can identify and describe the effects of transformations of absolute
value equations in relation to their parent functions.
C2. I can graph and describe key features of absolute value functions
with and without technology.
C3. I can use different representations to compare key features of
absolute value functions.
C4. I can build absolute value functions to represent relevant
relationships/quantities given a real-world situation or mathematical
process or graph.
C5. I can approximate the intersection of a system with absolute value
functions graphically.
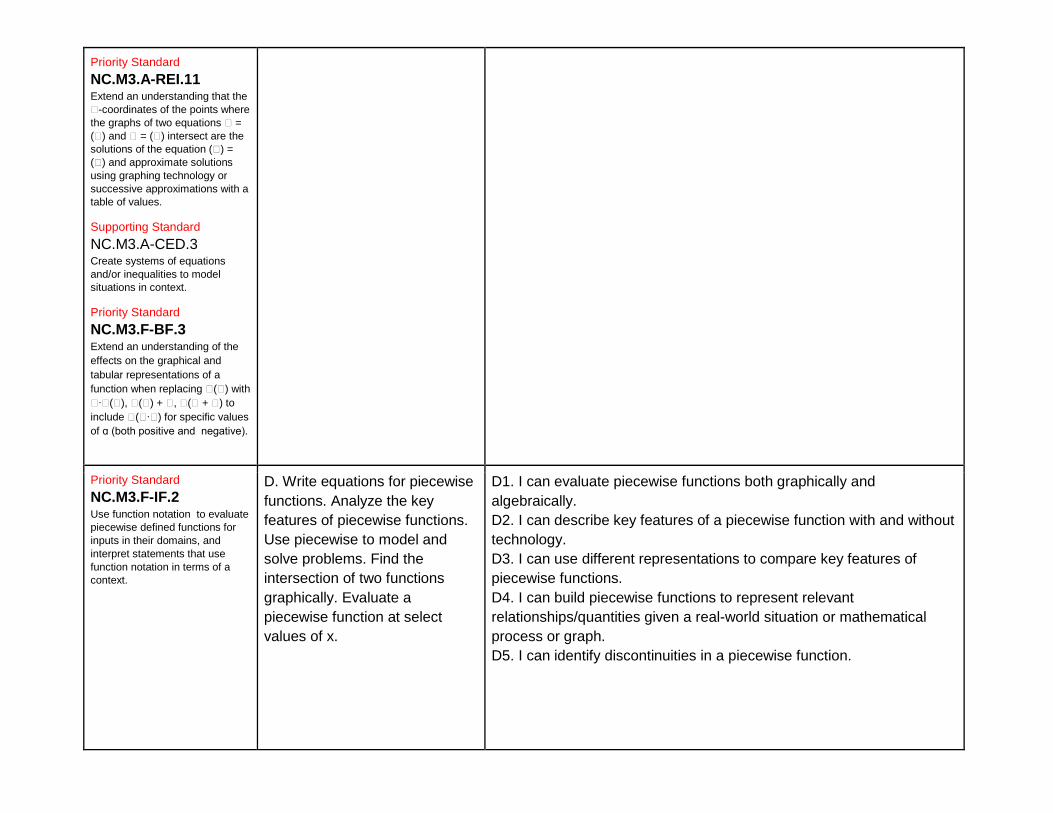
Priority Standard
NC.M3.A-REI.11 Extend an understanding that the
�-coordinates of the points where
the graphs of two equations � =
(�) and � = (�) intersect are the
solutions of the equation (�) =
(�) and approximate solutions
using graphing technology or
successive approximations with a
table of values.
Supporting Standard
NC.M3.A-CED.3 Create systems of equations
and/or inequalities to model
situations in context.
Priority Standard
NC.M3.F-BF.3 Extend an understanding of the
effects on the graphical and
tabular representations of a
function when replacing �(�) with
�∙�(�), �(�) + �, �(� + �) to
include �(�∙�) for specific values
of ɑ (both positive and negative).
Priority Standard
NC.M3.F-IF.2 Use function notation to evaluate
piecewise defined functions for
inputs in their domains, and
interpret statements that use
function notation in terms of a
context.
D. Write equations for piecewise
functions. Analyze the key
features of piecewise functions.
Use piecewise to model and
solve problems. Find the
intersection of two functions
graphically. Evaluate a
piecewise function at select
values of x.
D1. I can evaluate piecewise functions both graphically and
algebraically.
D2. I can describe key features of a piecewise function with and without
technology.
D3. I can use different representations to compare key features of
piecewise functions.
D4. I can build piecewise functions to represent relevant
relationships/quantities given a real-world situation or mathematical
process or graph.
D5. I can identify discontinuities in a piecewise function.
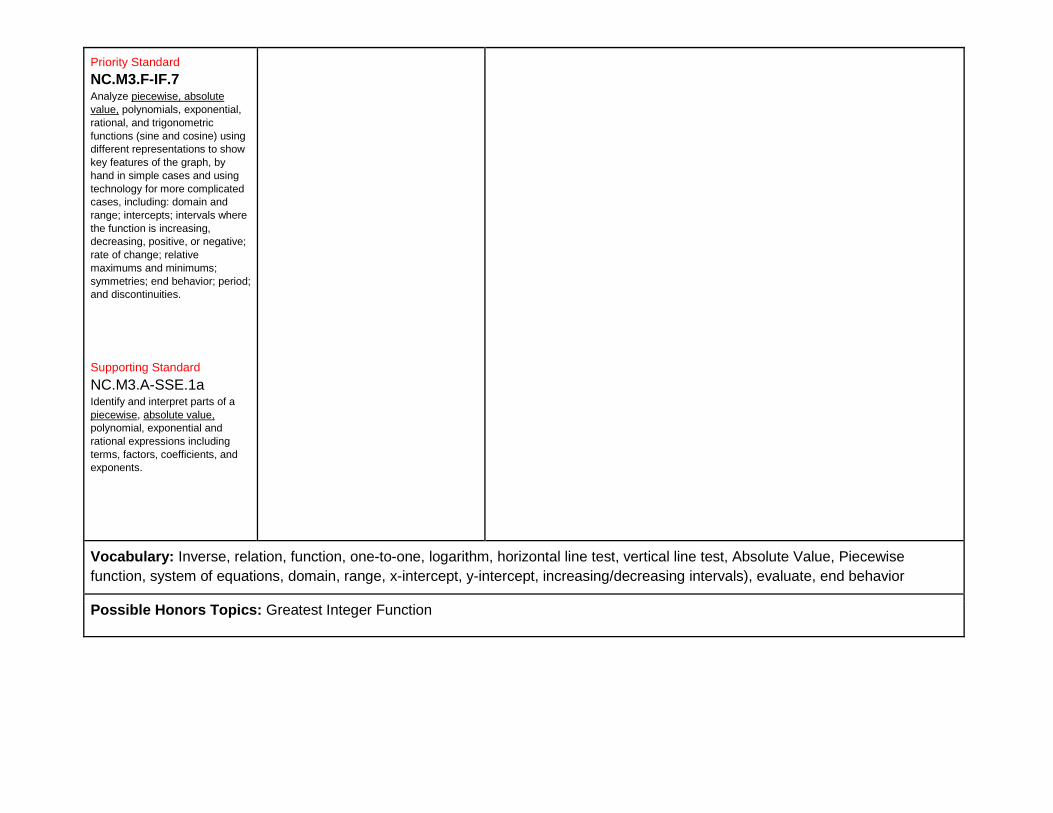
Priority Standard
NC.M3.F-IF.7 Analyze piecewise, absolute
value, polynomials, exponential,
rational, and trigonometric
functions (sine and cosine) using
different representations to show
key features of the graph, by
hand in simple cases and using
technology for more complicated
cases, including: domain and
range; intercepts; intervals where
the function is increasing,
decreasing, positive, or negative;
rate of change; relative
maximums and minimums;
symmetries; end behavior; period;
and discontinuities.
Supporting Standard
NC.M3.A-SSE.1a Identify and interpret parts of a
piecewise, absolute value,
polynomial, exponential and
rational expressions including
terms, factors, coefficients, and
exponents.
Vocabulary: Inverse, relation, function, one-to-one, logarithm, horizontal line test, vertical line test, Absolute Value, Piecewise
function, system of equations, domain, range, x-intercept, y-intercept, increasing/decreasing intervals), evaluate, end behavior
Possible Honors Topics: Greatest Integer Function
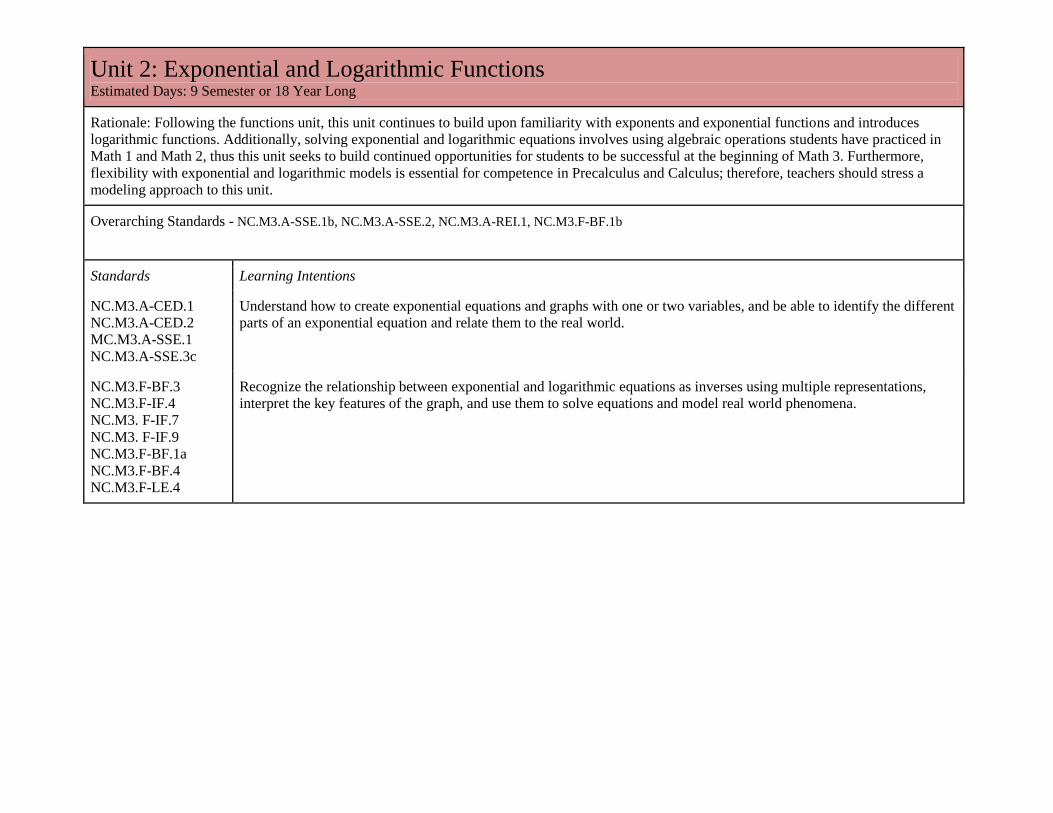
Unit 2: Exponential and Logarithmic Functions
Estimated Days: 9 Semester or 18 Year Long
Rationale: Following the functions unit, this unit continues to build upon familiarity with exponents and exponential functions and introduces
logarithmic functions. Additionally, solving exponential and logarithmic equations involves using algebraic operations students have practiced in
Math 1 and Math 2, thus this unit seeks to build continued opportunities for students to be successful at the beginning of Math 3. Furthermore,
flexibility with exponential and logarithmic models is essential for competence in Precalculus and Calculus; therefore, teachers should stress a
modeling approach to this unit.
Overarching Standards - NC.M3.A-SSE.1b, NC.M3.A-SSE.2, NC.M3.A-REI.1, NC.M3.F-BF.1b
Standards Learning Intentions
NC.M3.A-CED.1 NC.M3.A-CED.2 MC.M3.A-SSE.1 NC.M3.A-SSE.3c
Understand how to create exponential equations and graphs with one or two variables, and be able to identify the different
parts of an exponential equation and relate them to the real world.
NC.M3.F-BF.3 NC.M3.F-IF.4 NC.M3. F-IF.7 NC.M3. F-IF.9 NC.M3.F-BF.1a NC.M3.F-BF.4 NC.M3.F-LE.4
Recognize the relationship between exponential and logarithmic equations as inverses using multiple representations,
interpret the key features of the graph, and use them to solve equations and model real world phenomena.
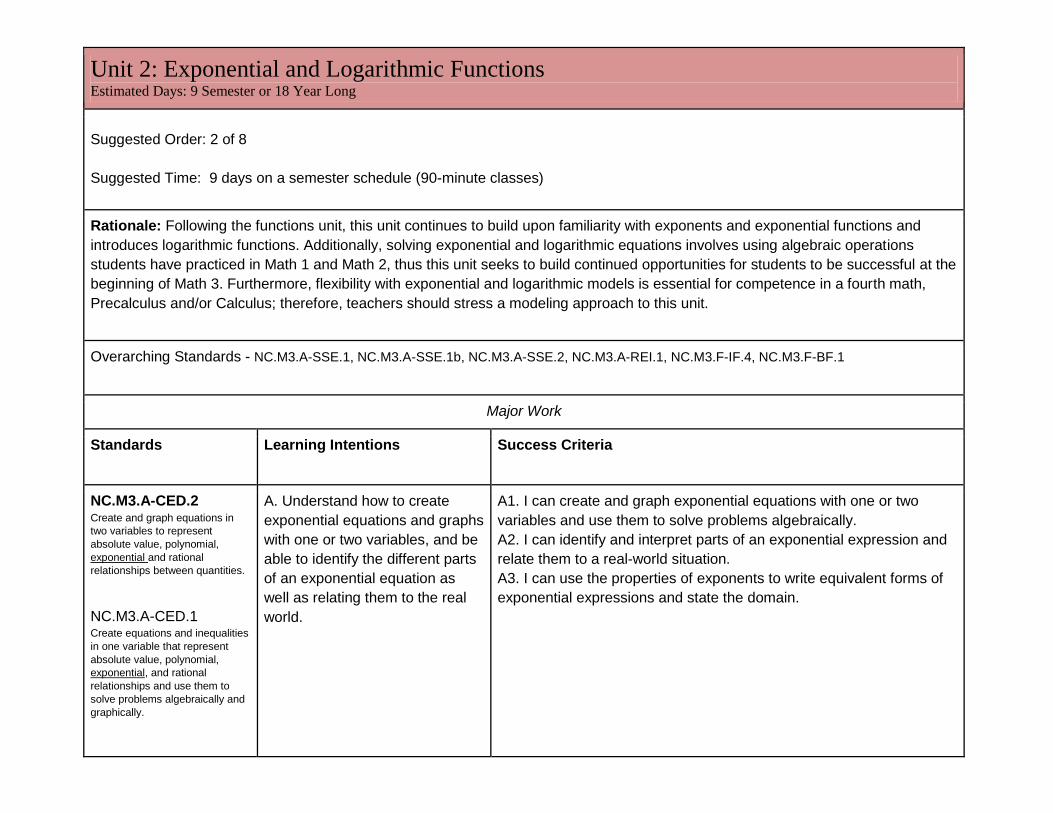
Unit 2: Exponential and Logarithmic Functions
Estimated Days: 9 Semester or 18 Year Long
Suggested Order: 2 of 8
Suggested Time: 9 days on a semester schedule (90-minute classes)
Rationale: Following the functions unit, this unit continues to build upon familiarity with exponents and exponential functions and
introduces logarithmic functions. Additionally, solving exponential and logarithmic equations involves using algebraic operations
students have practiced in Math 1 and Math 2, thus this unit seeks to build continued opportunities for students to be successful at the
beginning of Math 3. Furthermore, flexibility with exponential and logarithmic models is essential for competence in a fourth math,
Precalculus and/or Calculus; therefore, teachers should stress a modeling approach to this unit.
Overarching Standards - NC.M3.A-SSE.1, NC.M3.A-SSE.1b, NC.M3.A-SSE.2, NC.M3.A-REI.1, NC.M3.F-IF.4, NC.M3.F-BF.1
Major Work
Standards Learning Intentions Success Criteria
NC.M3.A-CED.2 Create and graph equations in
two variables to represent
absolute value, polynomial,
exponential and rational
relationships between quantities.
NC.M3.A-CED.1 Create equations and inequalities
in one variable that represent
absolute value, polynomial,
exponential, and rational
relationships and use them to
solve problems algebraically and
graphically.
A. Understand how to create
exponential equations and graphs
with one or two variables, and be
able to identify the different parts
of an exponential equation as
well as relating them to the real
world.
A1. I can create and graph exponential equations with one or two
variables and use them to solve problems algebraically.
A2. I can identify and interpret parts of an exponential expression and
relate them to a real-world situation.
A3. I can use the properties of exponents to write equivalent forms of
exponential expressions and state the domain.
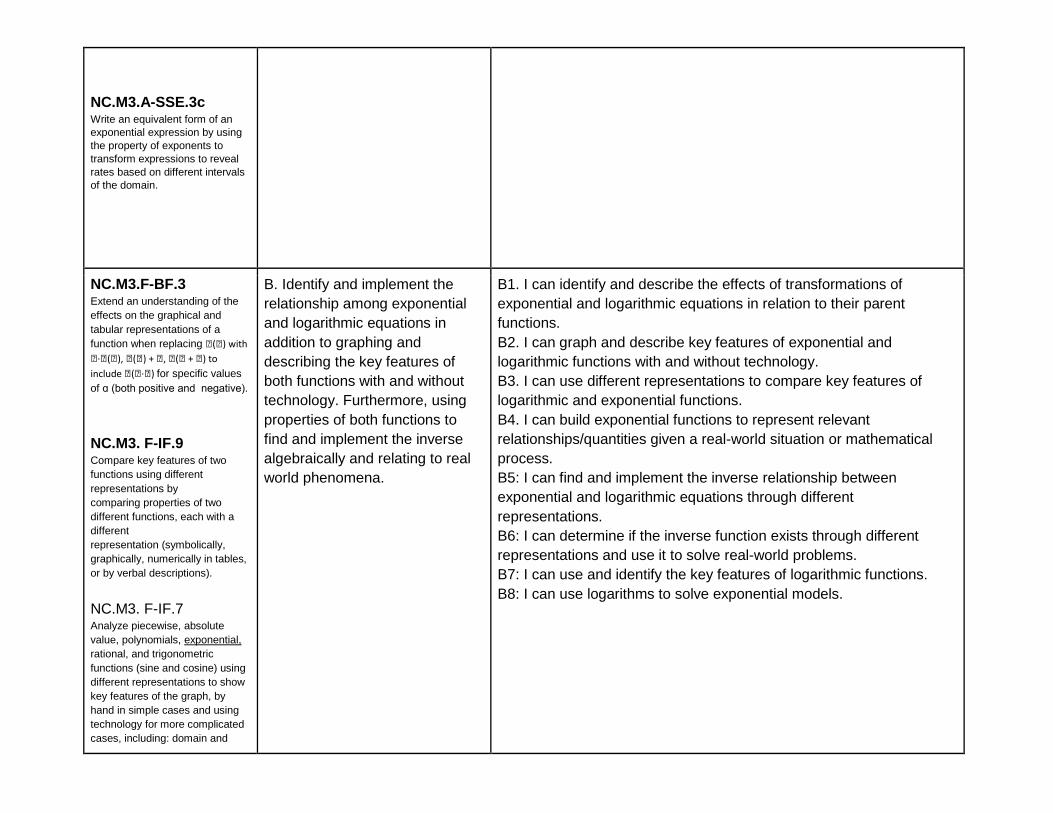
NC.M3.A-SSE.3c Write an equivalent form of an
exponential expression by using
the property of exponents to
transform expressions to reveal
rates based on different intervals
of the domain.
NC.M3.F-BF.3 Extend an understanding of the
effects on the graphical and
tabular representations of a
function when replacing �(�) with
�∙�(�), �(�) + �, �(� + �) to
include �(�∙�) for specific values
of ɑ (both positive and negative).
NC.M3. F-IF.9 Compare key features of two
functions using different
representations by comparing properties of two
different functions, each with a
different representation (symbolically,
graphically, numerically in tables,
or by verbal descriptions).
NC.M3. F-IF.7 Analyze piecewise, absolute
value, polynomials, exponential,
rational, and trigonometric
functions (sine and cosine) using
different representations to show
key features of the graph, by
hand in simple cases and using
technology for more complicated
cases, including: domain and
B. Identify and implement the
relationship among exponential
and logarithmic equations in
addition to graphing and
describing the key features of
both functions with and without
technology. Furthermore, using
properties of both functions to
find and implement the inverse
algebraically and relating to real
world phenomena.
B1. I can identify and describe the effects of transformations of
exponential and logarithmic equations in relation to their parent
functions.
B2. I can graph and describe key features of exponential and
logarithmic functions with and without technology.
B3. I can use different representations to compare key features of
logarithmic and exponential functions.
B4. I can build exponential functions to represent relevant
relationships/quantities given a real-world situation or mathematical
process.
B5: I can find and implement the inverse relationship between
exponential and logarithmic equations through different
representations.
B6: I can determine if the inverse function exists through different
representations and use it to solve real-world problems.
B7: I can use and identify the key features of logarithmic functions.
B8: I can use logarithms to solve exponential models.
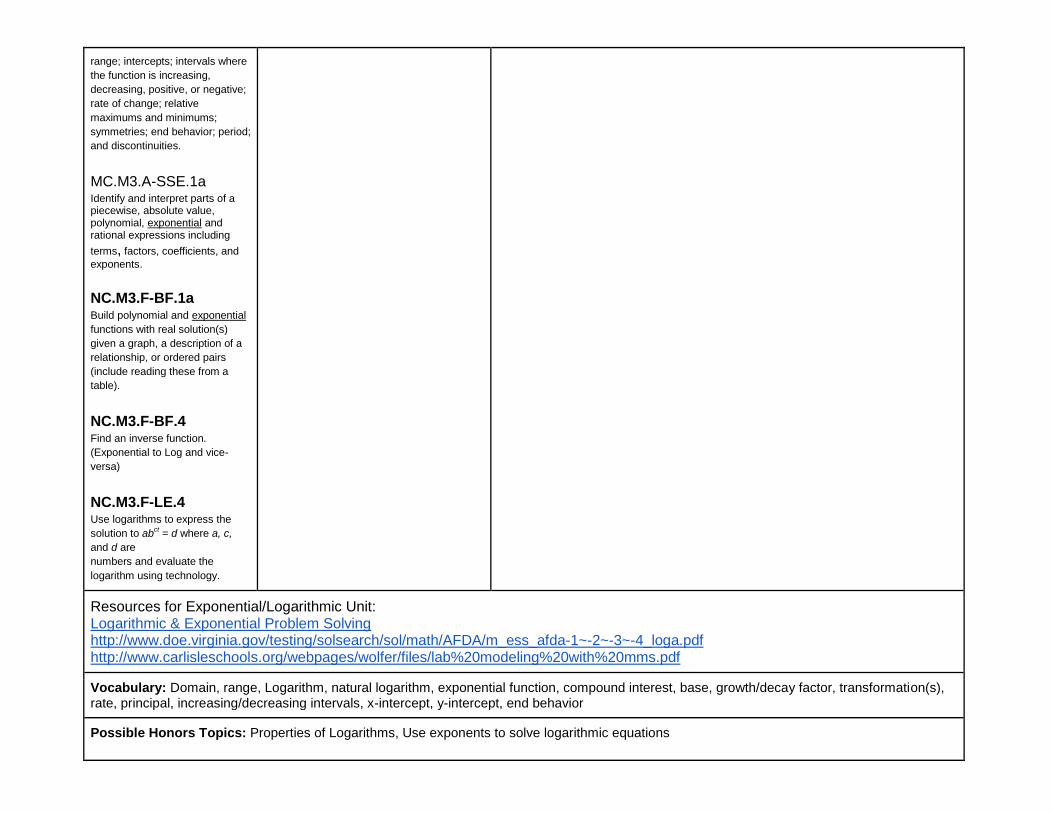
range; intercepts; intervals where
the function is increasing,
decreasing, positive, or negative;
rate of change; relative
maximums and minimums;
symmetries; end behavior; period;
and discontinuities.
MC.M3.A-SSE.1a Identify and interpret parts of a piecewise, absolute value, polynomial, exponential and rational expressions including
terms, factors, coefficients, and
exponents.
NC.M3.F-BF.1a Build polynomial and exponential
functions with real solution(s)
given a graph, a description of a
relationship, or ordered pairs
(include reading these from a
table).
NC.M3.F-BF.4 Find an inverse function.
(Exponential to Log and vice-
versa)
NC.M3.F-LE.4 Use logarithms to express the
solution to abct = d where a, c,
and d are numbers and evaluate the
logarithm using technology.
Resources for Exponential/Logarithmic Unit: Logarithmic & Exponential Problem Solving http://www.doe.virginia.gov/testing/solsearch/sol/math/AFDA/m_ess_afda-1~-2~-3~-4_loga.pdf http://www.carlisleschools.org/webpages/wolfer/files/lab%20modeling%20with%20mms.pdf
Vocabulary: Domain, range, Logarithm, natural logarithm, exponential function, compound interest, base, growth/decay factor, transformation(s), rate, principal, increasing/decreasing intervals, x-intercept, y-intercept, end behavior
Possible Honors Topics: Properties of Logarithms, Use exponents to solve logarithmic equations
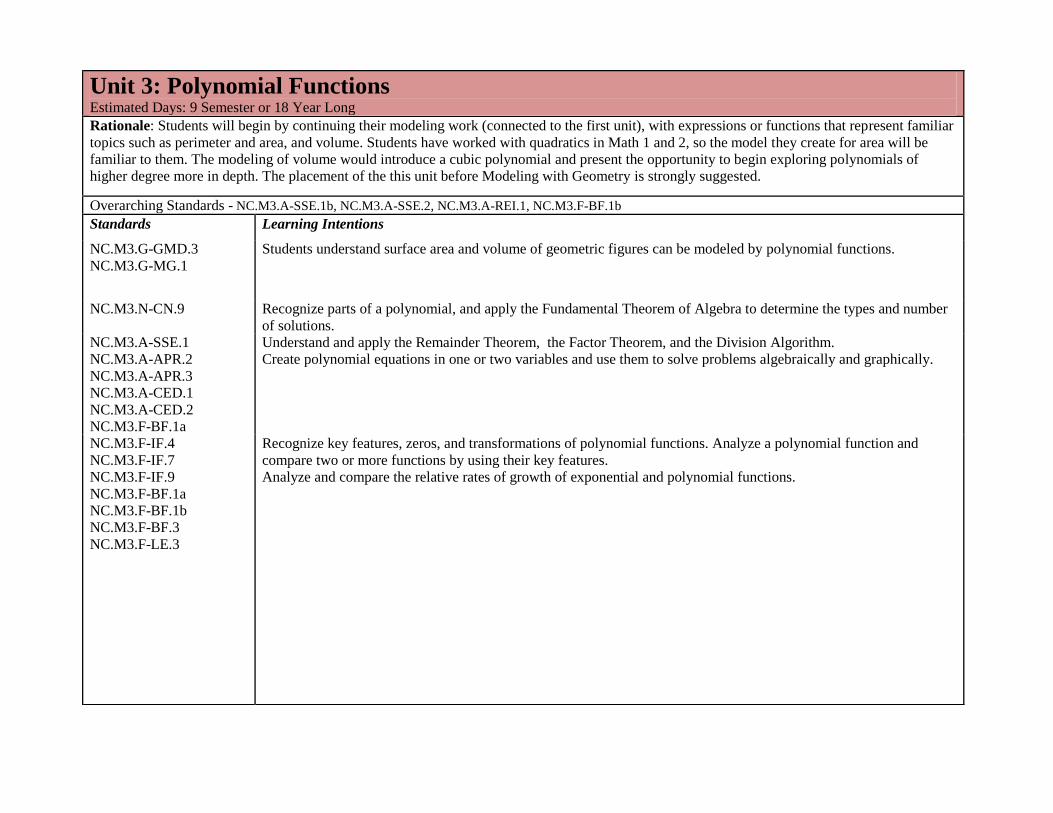
Unit 3: Polynomial Functions
Estimated Days: 9 Semester or 18 Year Long
Rationale: Students will begin by continuing their modeling work (connected to the first unit), with expressions or functions that represent familiar
topics such as perimeter and area, and volume. Students have worked with quadratics in Math 1 and 2, so the model they create for area will be
familiar to them. The modeling of volume would introduce a cubic polynomial and present the opportunity to begin exploring polynomials of
higher degree more in depth. The placement of the this unit before Modeling with Geometry is strongly suggested.
Overarching Standards - NC.M3.A-SSE.1b, NC.M3.A-SSE.2, NC.M3.A-REI.1, NC.M3.F-BF.1b
Standards Learning Intentions
NC.M3.G-GMD.3 NC.M3.G-MG.1
Students understand surface area and volume of geometric figures can be modeled by polynomial functions.
NC.M3.N-CN.9 Recognize parts of a polynomial, and apply the Fundamental Theorem of Algebra to determine the types and number
of solutions. NC.M3.A-SSE.1 NC.M3.A-APR.2 NC.M3.A-APR.3 NC.M3.A-CED.1 NC.M3.A-CED.2 NC.M3.F-BF.1a
Understand and apply the Remainder Theorem, the Factor Theorem, and the Division Algorithm. Create polynomial equations in one or two variables and use them to solve problems algebraically and graphically.
NC.M3.F-IF.4 NC.M3.F-IF.7 NC.M3.F-IF.9 NC.M3.F-BF.1a NC.M3.F-BF.1b NC.M3.F-BF.3 NC.M3.F-LE.3
Recognize key features, zeros, and transformations of polynomial functions. Analyze a polynomial function and
compare two or more functions by using their key features. Analyze and compare the relative rates of growth of exponential and polynomial functions.
Unit 3: Polynomial Functions
Estimated Days: 9 Semester or 18 Year Long
Suggested Order: 3 of 8
Suggested Time: 9 days on a semester schedule (90-minute classes)
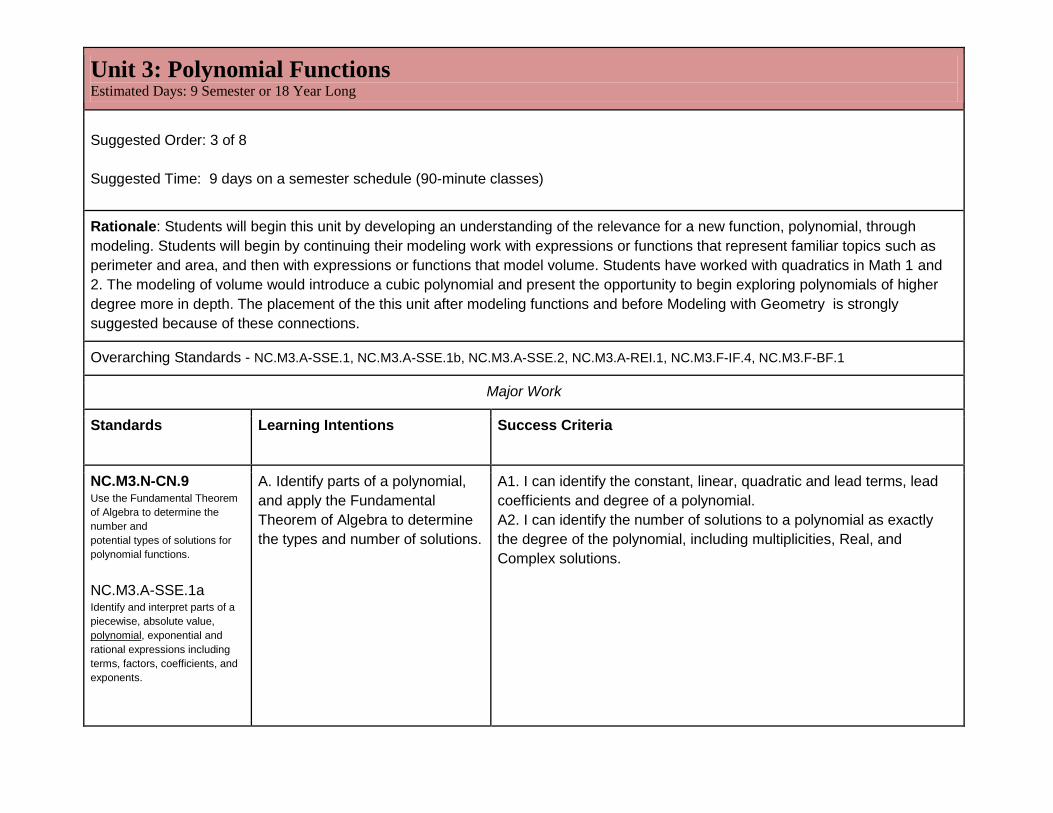
Rationale: Students will begin this unit by developing an understanding of the relevance for a new function, polynomial, through
modeling. Students will begin by continuing their modeling work with expressions or functions that represent familiar topics such as
perimeter and area, and then with expressions or functions that model volume. Students have worked with quadratics in Math 1 and
2. The modeling of volume would introduce a cubic polynomial and present the opportunity to begin exploring polynomials of higher
degree more in depth. The placement of the this unit after modeling functions and before Modeling with Geometry is strongly
suggested because of these connections.
Overarching Standards - NC.M3.A-SSE.1, NC.M3.A-SSE.1b, NC.M3.A-SSE.2, NC.M3.A-REI.1, NC.M3.F-IF.4, NC.M3.F-BF.1
Major Work
Standards Learning Intentions Success Criteria
NC.M3.N-CN.9 Use the Fundamental Theorem
of Algebra to determine the
number and potential types of solutions for
polynomial functions.
NC.M3.A-SSE.1a Identify and interpret parts of a
piecewise, absolute value,
polynomial, exponential and
rational expressions including
terms, factors, coefficients, and
exponents.
A. Identify parts of a polynomial,
and apply the Fundamental
Theorem of Algebra to determine
the types and number of solutions.
A1. I can identify the constant, linear, quadratic and lead terms, lead
coefficients and degree of a polynomial.
A2. I can identify the number of solutions to a polynomial as exactly
the degree of the polynomial, including multiplicities, Real, and
Complex solutions.
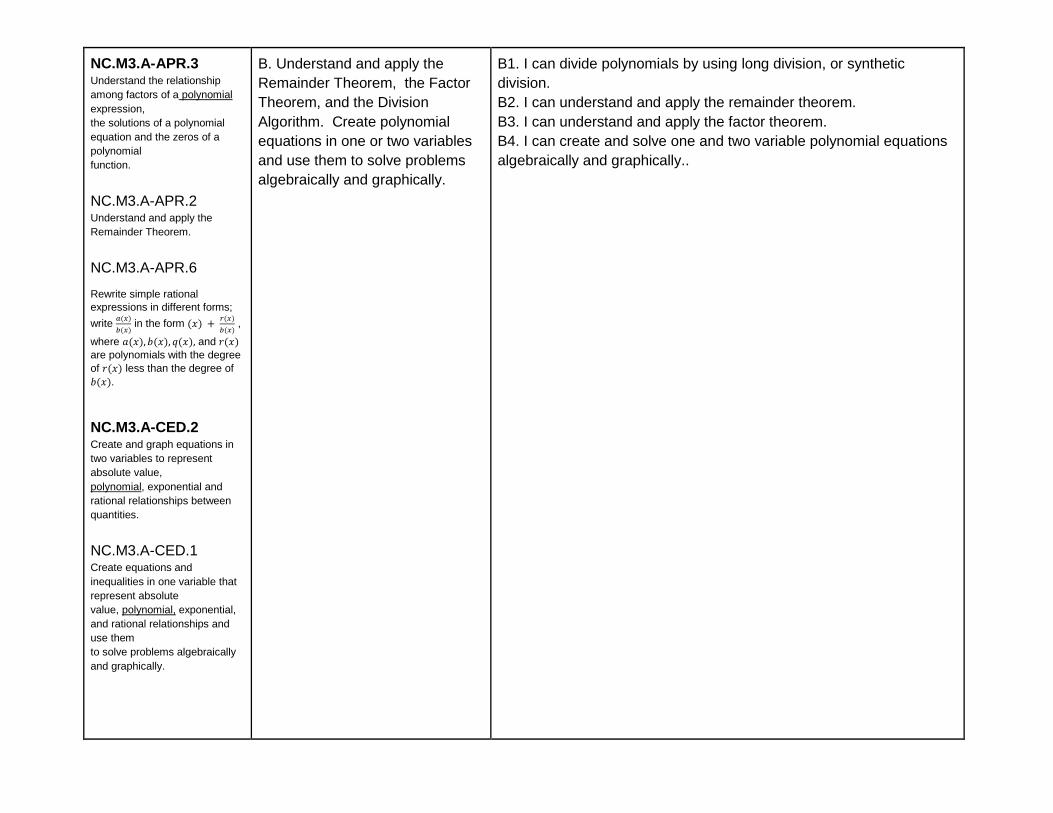
NC.M3.A-APR.3 Understand the relationship
among factors of a polynomial
expression, the solutions of a polynomial
equation and the zeros of a
polynomial function.
NC.M3.A-APR.2 Understand and apply the
Remainder Theorem.
NC.M3.A-APR.6
Rewrite simple rational
expressions in different forms;
write
in the form
,
where and are polynomials with the degree
of less than the degree of
.
NC.M3.A-CED.2 Create and graph equations in
two variables to represent
absolute value, polynomial, exponential and
rational relationships between
quantities.
NC.M3.A-CED.1 Create equations and
inequalities in one variable that
represent absolute value, polynomial, exponential,
and rational relationships and
use them to solve problems algebraically
and graphically.
B. Understand and apply the
Remainder Theorem, the Factor
Theorem, and the Division
Algorithm. Create polynomial
equations in one or two variables
and use them to solve problems
algebraically and graphically.
B1. I can divide polynomials by using long division, or synthetic
division.
B2. I can understand and apply the remainder theorem.
B3. I can understand and apply the factor theorem.
B4. I can create and solve one and two variable polynomial equations
algebraically and graphically..
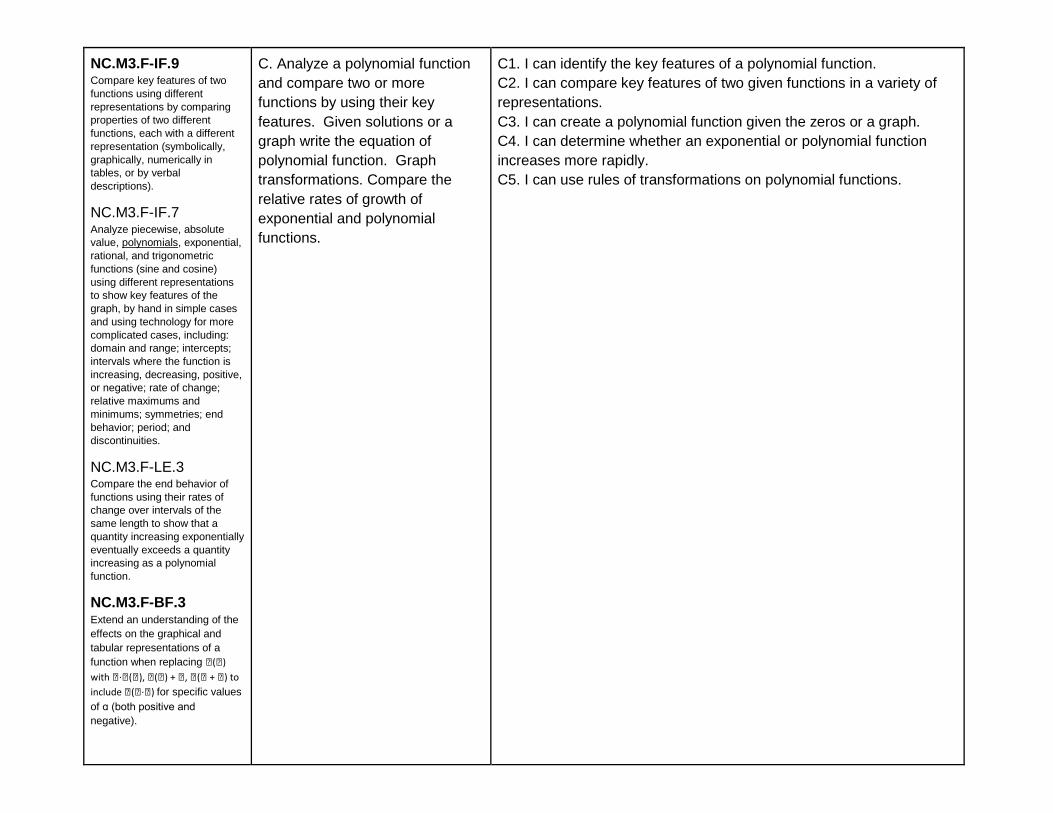
NC.M3.F-IF.9 Compare key features of two
functions using different
representations by comparing
properties of two different
functions, each with a different
representation (symbolically,
graphically, numerically in
tables, or by verbal
descriptions).
NC.M3.F-IF.7 Analyze piecewise, absolute
value, polynomials, exponential,
rational, and trigonometric
functions (sine and cosine)
using different representations
to show key features of the
graph, by hand in simple cases
and using technology for more
complicated cases, including:
domain and range; intercepts;
intervals where the function is
increasing, decreasing, positive,
or negative; rate of change;
relative maximums and
minimums; symmetries; end
behavior; period; and
discontinuities.
NC.M3.F-LE.3 Compare the end behavior of
functions using their rates of
change over intervals of the
same length to show that a
quantity increasing exponentially
eventually exceeds a quantity
increasing as a polynomial
function.
NC.M3.F-BF.3 Extend an understanding of the
effects on the graphical and
tabular representations of a
function when replacing �(�)
with �∙�(�), �(�) + �, �(� + �) to
include �(�∙�) for specific values
of ɑ (both positive and
negative).
C. Analyze a polynomial function
and compare two or more
functions by using their key
features. Given solutions or a
graph write the equation of
polynomial function. Graph
transformations. Compare the
relative rates of growth of
exponential and polynomial
functions.
C1. I can identify the key features of a polynomial function.
C2. I can compare key features of two given functions in a variety of
representations.
C3. I can create a polynomial function given the zeros or a graph.
C4. I can determine whether an exponential or polynomial function
increases more rapidly.
C5. I can use rules of transformations on polynomial functions.
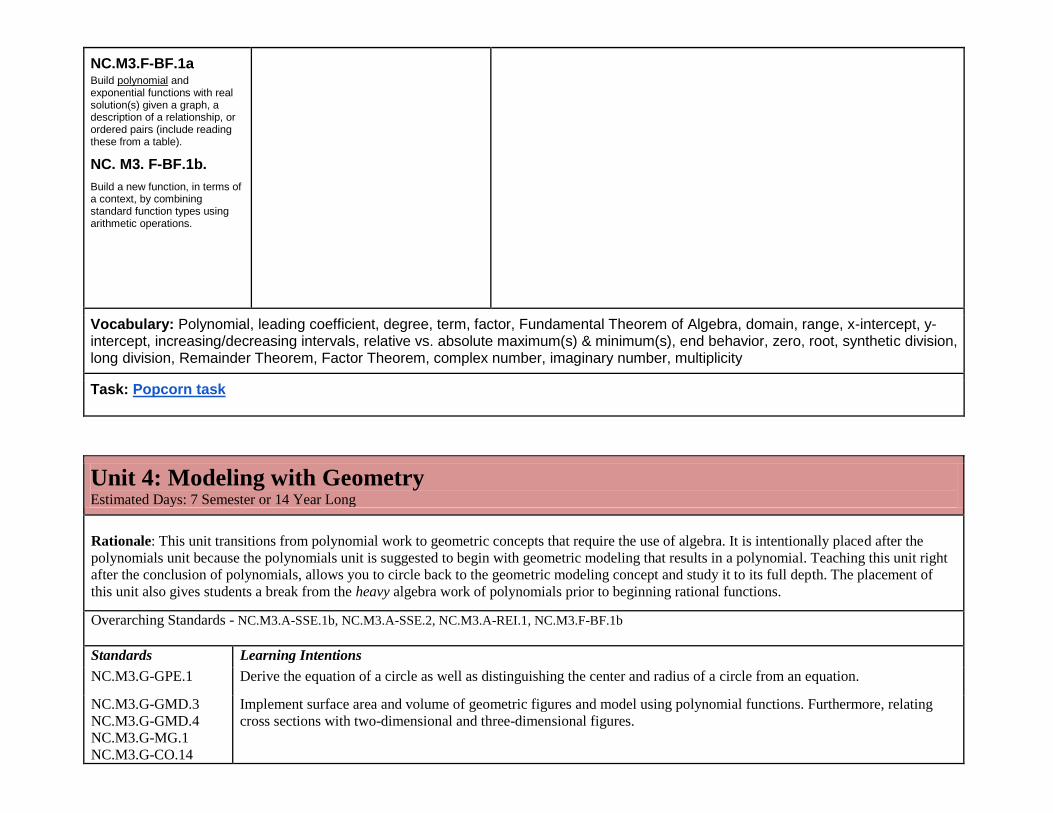
NC.M3.F-BF.1a Build polynomial and exponential functions with real solution(s) given a graph, a description of a relationship, or ordered pairs (include reading these from a table).
NC. M3. F-BF.1b.
Build a new function, in terms of a context, by combining standard function types using arithmetic operations.
Vocabulary: Polynomial, leading coefficient, degree, term, factor, Fundamental Theorem of Algebra, domain, range, x-intercept, y-intercept, increasing/decreasing intervals, relative vs. absolute maximum(s) & minimum(s), end behavior, zero, root, synthetic division, long division, Remainder Theorem, Factor Theorem, complex number, imaginary number, multiplicity
Task: Popcorn task
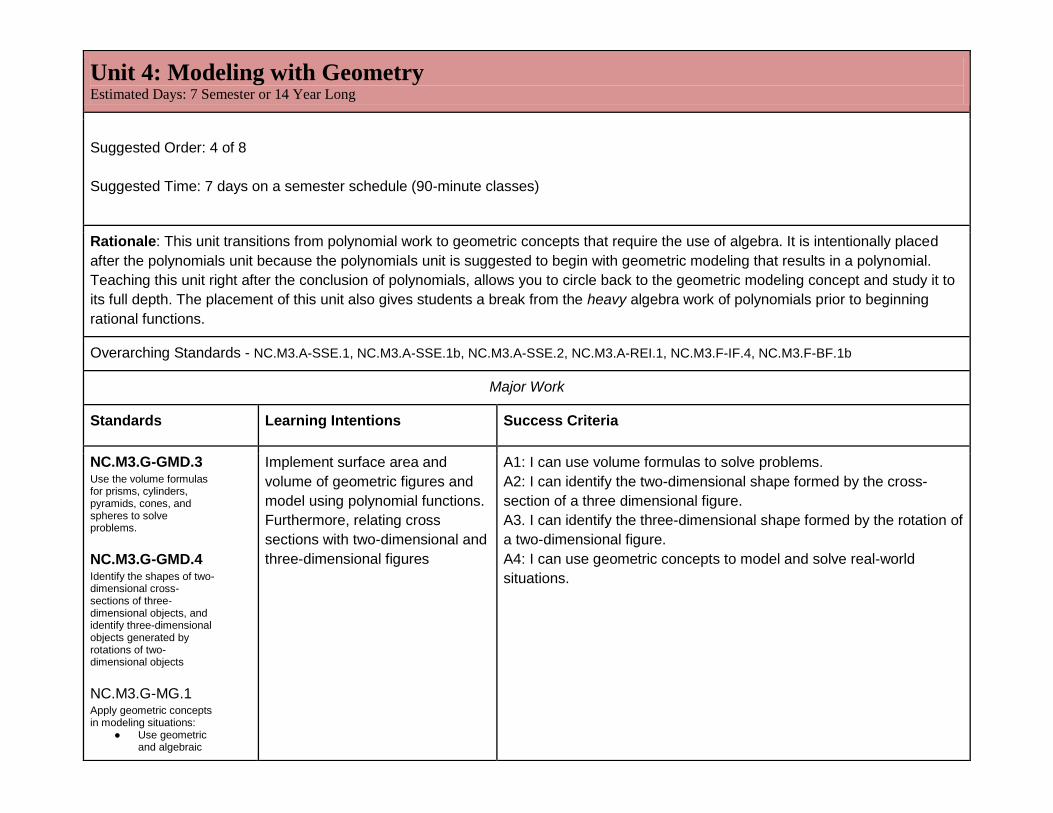
Unit 4: Modeling with Geometry
Estimated Days: 7 Semester or 14 Year Long
Rationale: This unit transitions from polynomial work to geometric concepts that require the use of algebra. It is intentionally placed after the
polynomials unit because the polynomials unit is suggested to begin with geometric modeling that results in a polynomial. Teaching this unit right
after the conclusion of polynomials, allows you to circle back to the geometric modeling concept and study it to its full depth. The placement of
this unit also gives students a break from the heavy algebra work of polynomials prior to beginning rational functions.
Overarching Standards - NC.M3.A-SSE.1b, NC.M3.A-SSE.2, NC.M3.A-REI.1, NC.M3.F-BF.1b
Standards Learning Intentions
NC.M3.G-GPE.1 Derive the equation of a circle as well as distinguishing the center and radius of a circle from an equation.
NC.M3.G-GMD.3 NC.M3.G-GMD.4 NC.M3.G-MG.1 NC.M3.G-CO.14
Implement surface area and volume of geometric figures and model using polynomial functions. Furthermore, relating
cross sections with two-dimensional and three-dimensional figures.
Unit 4: Modeling with Geometry
Estimated Days: 7 Semester or 14 Year Long
Suggested Order: 4 of 8
Suggested Time: 7 days on a semester schedule (90-minute classes)
Rationale: This unit transitions from polynomial work to geometric concepts that require the use of algebra. It is intentionally placed
after the polynomials unit because the polynomials unit is suggested to begin with geometric modeling that results in a polynomial.
Teaching this unit right after the conclusion of polynomials, allows you to circle back to the geometric modeling concept and study it to
its full depth. The placement of this unit also gives students a break from the heavy algebra work of polynomials prior to beginning
rational functions.
Overarching Standards - NC.M3.A-SSE.1, NC.M3.A-SSE.1b, NC.M3.A-SSE.2, NC.M3.A-REI.1, NC.M3.F-IF.4, NC.M3.F-BF.1b
Major Work
Standards Learning Intentions Success Criteria
NC.M3.G-GMD.3 Use the volume formulas for prisms, cylinders, pyramids, cones, and spheres to solve problems. NC.M3.G-GMD.4 Identify the shapes of two-dimensional cross-sections of three-dimensional objects, and identify three-dimensional objects generated by rotations of two-dimensional objects NC.M3.G-MG.1 Apply geometric concepts in modeling situations:
● Use geometric and algebraic
Implement surface area and
volume of geometric figures and
model using polynomial functions.
Furthermore, relating cross
sections with two-dimensional and
three-dimensional figures
A1: I can use volume formulas to solve problems.
A2: I can identify the two-dimensional shape formed by the cross-
section of a three dimensional figure.
A3. I can identify the three-dimensional shape formed by the rotation of
a two-dimensional figure.
A4: I can use geometric concepts to model and solve real-world
situations.
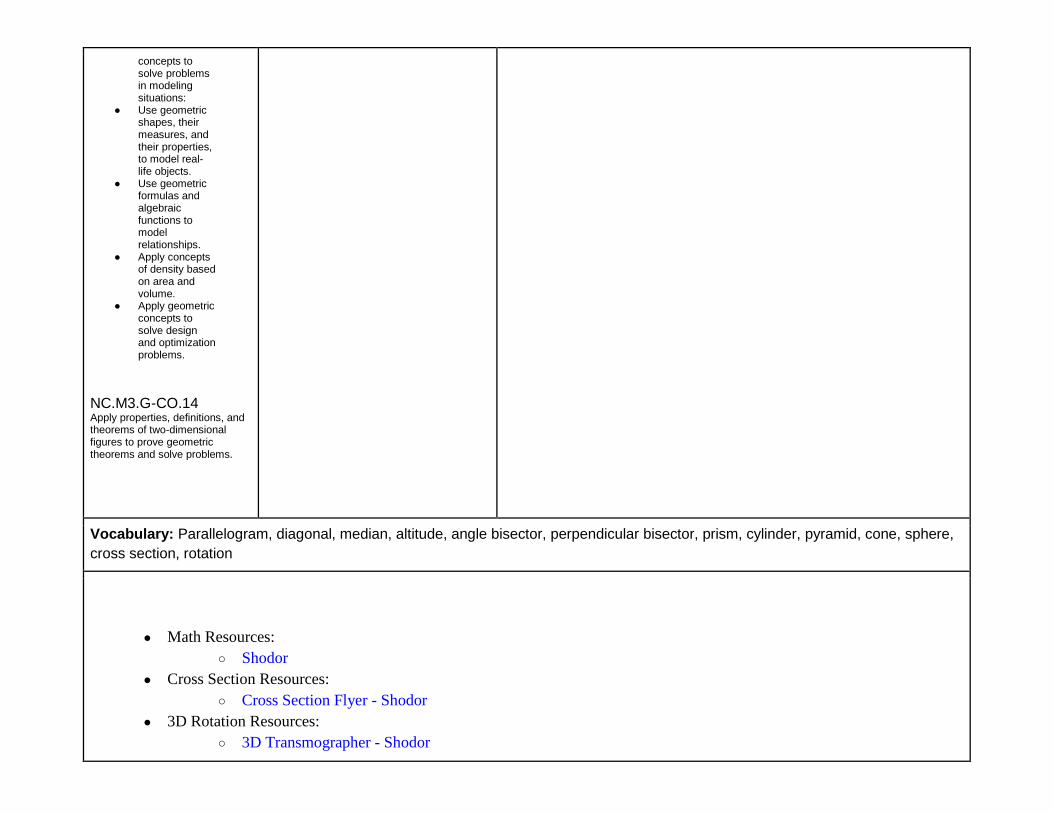
concepts to solve problems in modeling situations:
● Use geometric shapes, their measures, and their properties, to model real-life objects.
● Use geometric formulas and algebraic functions to model relationships.
● Apply concepts of density based on area and volume.
● Apply geometric concepts to solve design and optimization problems.
NC.M3.G-CO.14 Apply properties, definitions, and theorems of two-dimensional figures to prove geometric theorems and solve problems.
Vocabulary: Parallelogram, diagonal, median, altitude, angle bisector, perpendicular bisector, prism, cylinder, pyramid, cone, sphere,
cross section, rotation
● Math Resources:
○ Shodor
● Cross Section Resources:
○ Cross Section Flyer - Shodor
● 3D Rotation Resources:
○ 3D Transmographer - Shodor
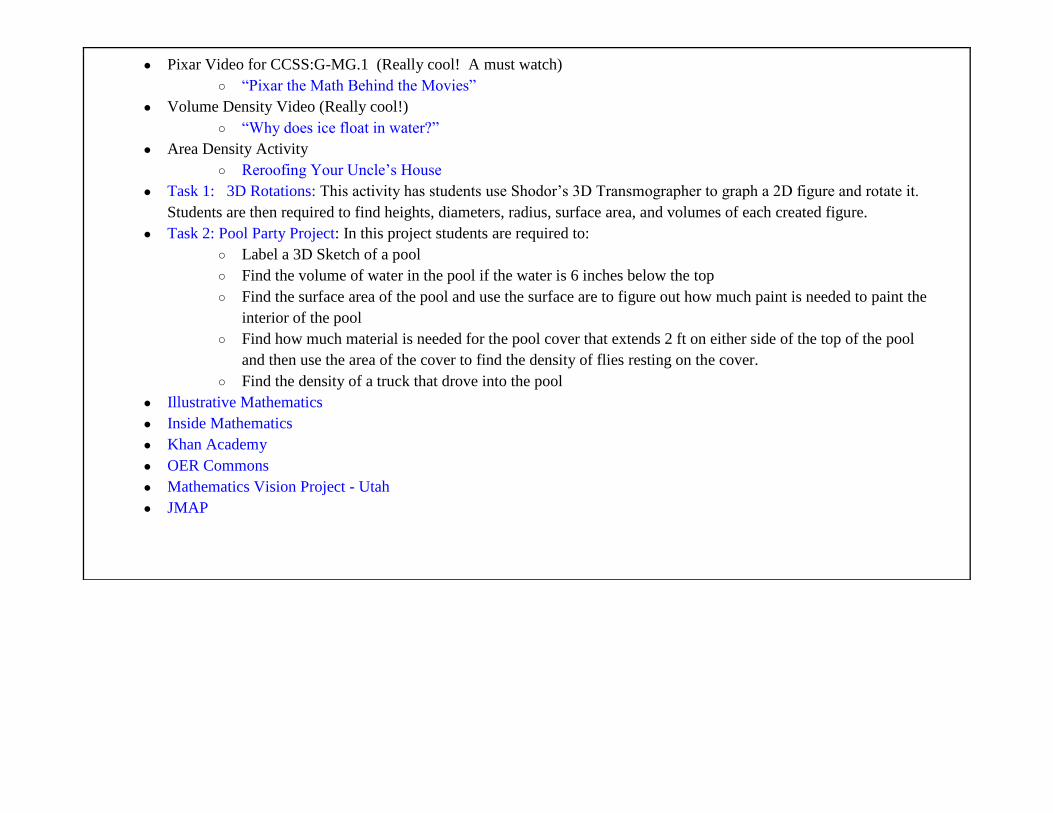
● Pixar Video for CCSS:G-MG.1 (Really cool! A must watch)
○ “Pixar the Math Behind the Movies”
● Volume Density Video (Really cool!)
○ “Why does ice float in water?”
● Area Density Activity
○ Reroofing Your Uncle’s House
● Task 1: 3D Rotations: This activity has students use Shodor’s 3D Transmographer to graph a 2D figure and rotate it.
Students are then required to find heights, diameters, radius, surface area, and volumes of each created figure.
● Task 2: Pool Party Project: In this project students are required to:
○ Label a 3D Sketch of a pool
○ Find the volume of water in the pool if the water is 6 inches below the top
○ Find the surface area of the pool and use the surface are to figure out how much paint is needed to paint the
interior of the pool
○ Find how much material is needed for the pool cover that extends 2 ft on either side of the top of the pool
and then use the area of the cover to find the density of flies resting on the cover.
○ Find the density of a truck that drove into the pool
● Illustrative Mathematics
● Inside Mathematics
● Khan Academy
● OER Commons
● Mathematics Vision Project - Utah
● JMAP
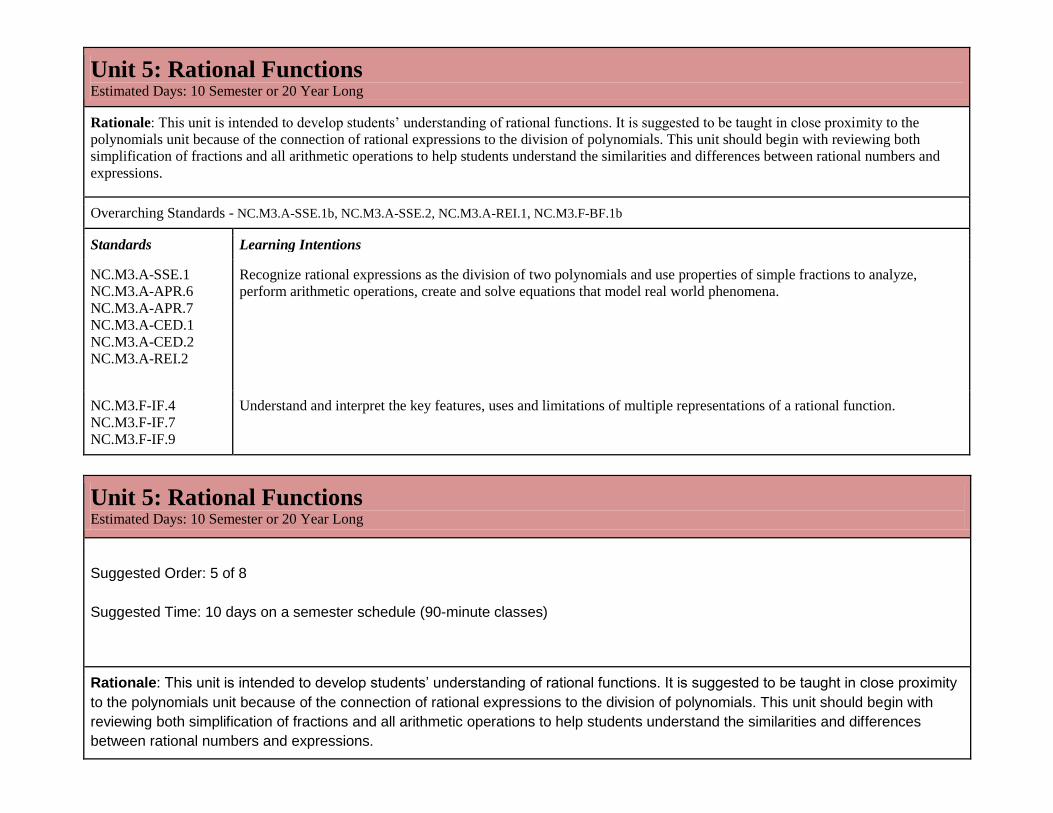
Unit 5: Rational Functions
Estimated Days: 10 Semester or 20 Year Long
Rationale: This unit is intended to develop students’ understanding of rational functions. It is suggested to be taught in close proximity to the
polynomials unit because of the connection of rational expressions to the division of polynomials. This unit should begin with reviewing both
simplification of fractions and all arithmetic operations to help students understand the similarities and differences between rational numbers and
expressions.
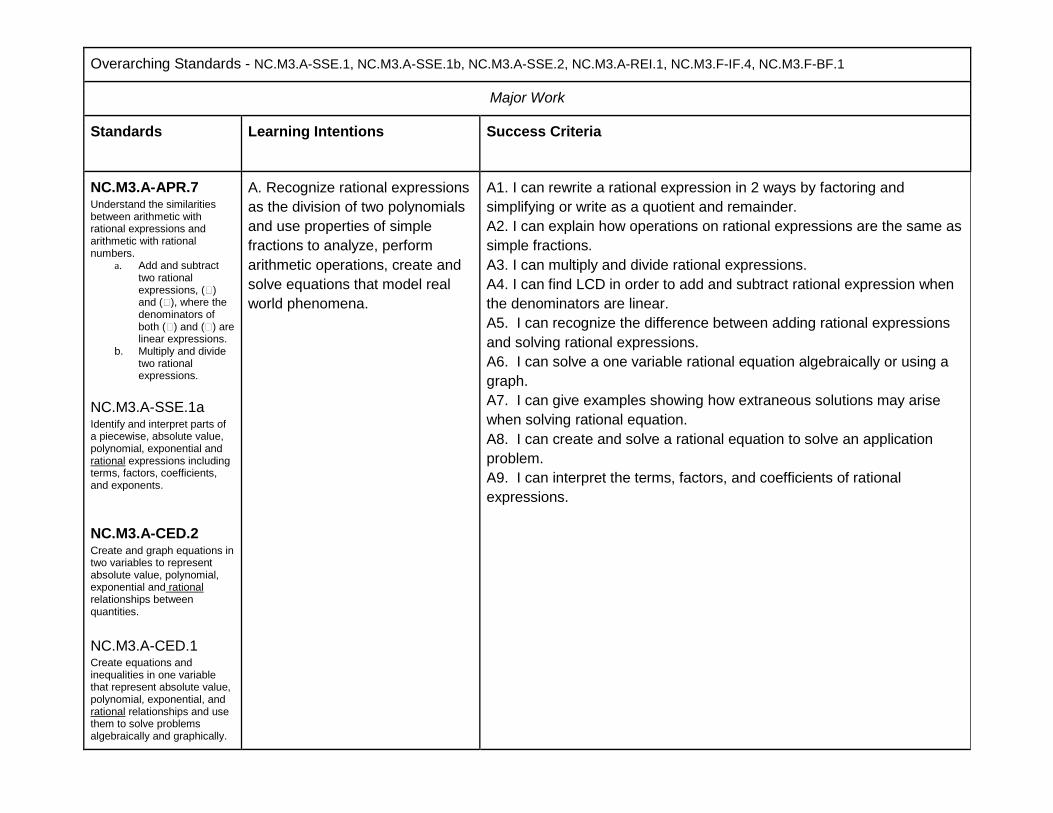
Overarching Standards - NC.M3.A-SSE.1b, NC.M3.A-SSE.2, NC.M3.A-REI.1, NC.M3.F-BF.1b
Standards Learning Intentions
NC.M3.A-SSE.1 NC.M3.A-APR.6 NC.M3.A-APR.7 NC.M3.A-CED.1 NC.M3.A-CED.2 NC.M3.A-REI.2
Recognize rational expressions as the division of two polynomials and use properties of simple fractions to analyze,
perform arithmetic operations, create and solve equations that model real world phenomena.
NC.M3.F-IF.4 NC.M3.F-IF.7 NC.M3.F-IF.9
Understand and interpret the key features, uses and limitations of multiple representations of a rational function.
Unit 5: Rational Functions
Estimated Days: 10 Semester or 20 Year Long
Suggested Order: 5 of 8
Suggested Time: 10 days on a semester schedule (90-minute classes)
Rationale: This unit is intended to develop students’ understanding of rational functions. It is suggested to be taught in close proximity
to the polynomials unit because of the connection of rational expressions to the division of polynomials. This unit should begin with
reviewing both simplification of fractions and all arithmetic operations to help students understand the similarities and differences
between rational numbers and expressions.
Overarching Standards - NC.M3.A-SSE.1, NC.M3.A-SSE.1b, NC.M3.A-SSE.2, NC.M3.A-REI.1, NC.M3.F-IF.4, NC.M3.F-BF.1
Major Work
Standards Learning Intentions Success Criteria
NC.M3.A-APR.7 Understand the similarities between arithmetic with rational expressions and arithmetic with rational numbers.
a. Add and subtract two rational expressions, (�) and (�), where the denominators of both (�) and (�) are linear expressions.
b. Multiply and divide two rational expressions.
NC.M3.A-SSE.1a Identify and interpret parts of a piecewise, absolute value, polynomial, exponential and rational expressions including terms, factors, coefficients, and exponents. NC.M3.A-CED.2 Create and graph equations in two variables to represent absolute value, polynomial, exponential and rational relationships between quantities.
NC.M3.A-CED.1 Create equations and inequalities in one variable that represent absolute value, polynomial, exponential, and rational relationships and use them to solve problems algebraically and graphically.
A. Recognize rational expressions
as the division of two polynomials
and use properties of simple
fractions to analyze, perform
arithmetic operations, create and
solve equations that model real
world phenomena.
A1. I can rewrite a rational expression in 2 ways by factoring and
simplifying or write as a quotient and remainder.
A2. I can explain how operations on rational expressions are the same as
simple fractions.
A3. I can multiply and divide rational expressions.
A4. I can find LCD in order to add and subtract rational expression when
the denominators are linear.
A5. I can recognize the difference between adding rational expressions
and solving rational expressions.
A6. I can solve a one variable rational equation algebraically or using a
graph.
A7. I can give examples showing how extraneous solutions may arise
when solving rational equation.
A8. I can create and solve a rational equation to solve an application
problem.
A9. I can interpret the terms, factors, and coefficients of rational
expressions.
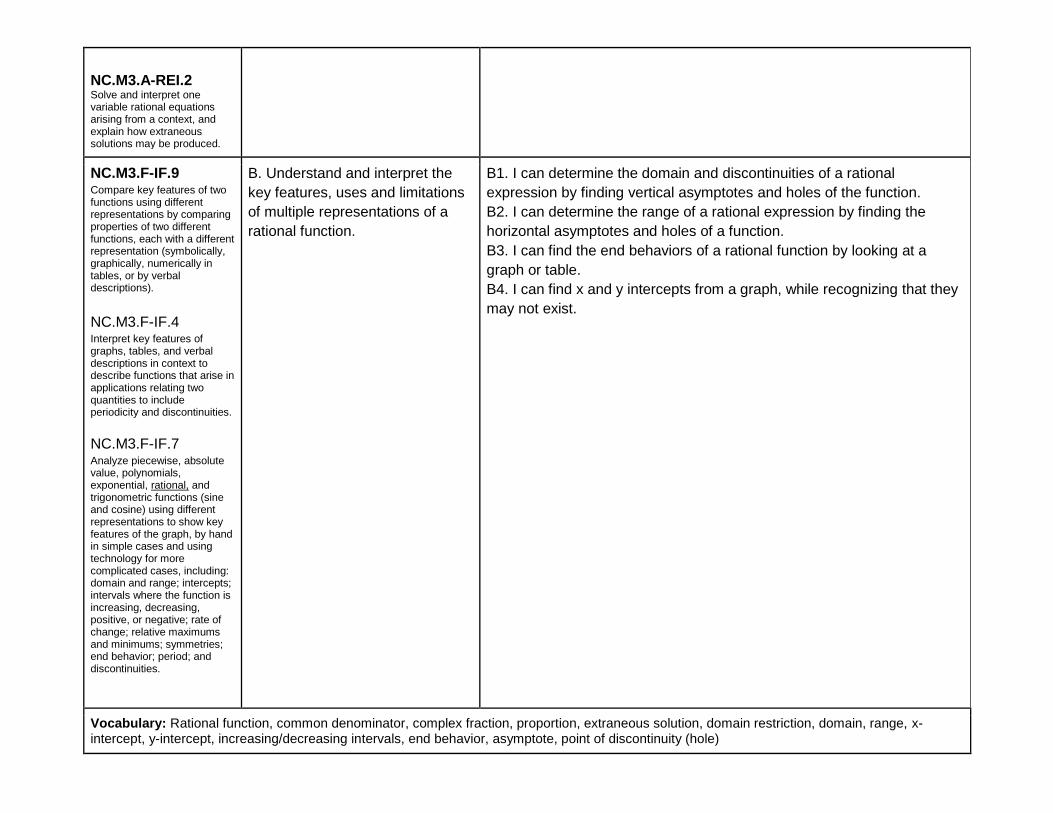
NC.M3.A-REI.2 Solve and interpret one variable rational equations arising from a context, and explain how extraneous solutions may be produced.
NC.M3.F-IF.9 Compare key features of two functions using different representations by comparing properties of two different functions, each with a different representation (symbolically, graphically, numerically in tables, or by verbal descriptions).
NC.M3.F-IF.4 Interpret key features of graphs, tables, and verbal descriptions in context to describe functions that arise in applications relating two quantities to include periodicity and discontinuities. NC.M3.F-IF.7 Analyze piecewise, absolute value, polynomials, exponential, rational, and trigonometric functions (sine and cosine) using different representations to show key features of the graph, by hand in simple cases and using technology for more complicated cases, including: domain and range; intercepts; intervals where the function is increasing, decreasing, positive, or negative; rate of change; relative maximums and minimums; symmetries; end behavior; period; and discontinuities.
B. Understand and interpret the
key features, uses and limitations
of multiple representations of a
rational function.
B1. I can determine the domain and discontinuities of a rational
expression by finding vertical asymptotes and holes of the function.
B2. I can determine the range of a rational expression by finding the
horizontal asymptotes and holes of a function.
B3. I can find the end behaviors of a rational function by looking at a
graph or table.
B4. I can find x and y intercepts from a graph, while recognizing that they
may not exist.
Vocabulary: Rational function, common denominator, complex fraction, proportion, extraneous solution, domain restriction, domain, range, x-intercept, y-intercept, increasing/decreasing intervals, end behavior, asymptote, point of discontinuity (hole)
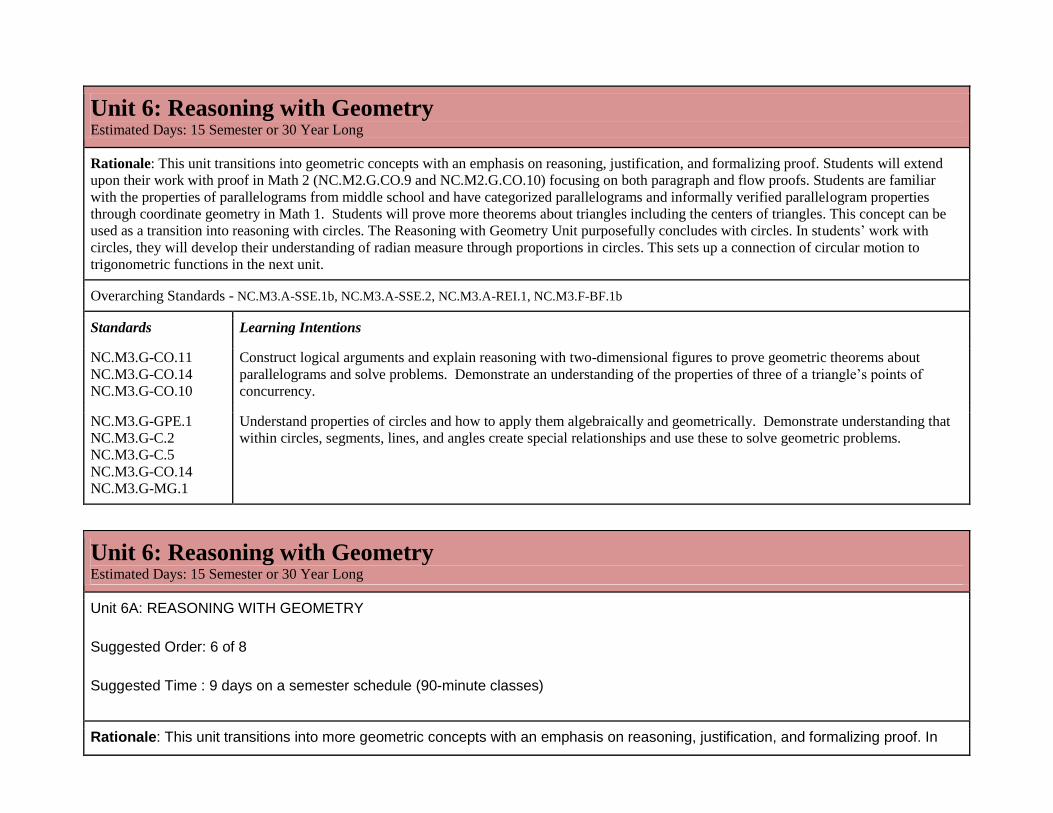
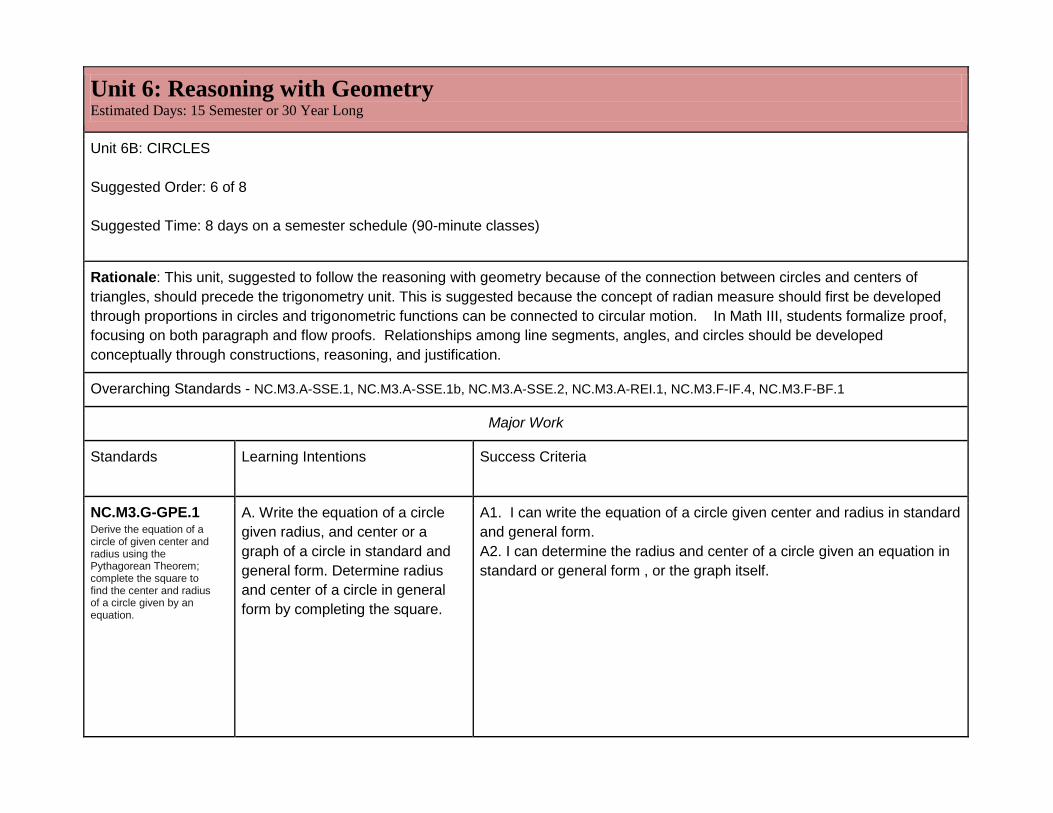
Unit 6: Reasoning with Geometry
Estimated Days: 15 Semester or 30 Year Long
Rationale: This unit transitions into geometric concepts with an emphasis on reasoning, justification, and formalizing proof. Students will extend
upon their work with proof in Math 2 (NC.M2.G.CO.9 and NC.M2.G.CO.10) focusing on both paragraph and flow proofs. Students are familiar
with the properties of parallelograms from middle school and have categorized parallelograms and informally verified parallelogram properties
through coordinate geometry in Math 1. Students will prove more theorems about triangles including the centers of triangles. This concept can be
used as a transition into reasoning with circles. The Reasoning with Geometry Unit purposefully concludes with circles. In students’ work with
circles, they will develop their understanding of radian measure through proportions in circles. This sets up a connection of circular motion to
trigonometric functions in the next unit.
Overarching Standards - NC.M3.A-SSE.1b, NC.M3.A-SSE.2, NC.M3.A-REI.1, NC.M3.F-BF.1b
Standards Learning Intentions
NC.M3.G-CO.11
NC.M3.G-CO.14 NC.M3.G-CO.10
Construct logical arguments and explain reasoning with two-dimensional figures to prove geometric theorems about
parallelograms and solve problems. Demonstrate an understanding of the properties of three of a triangle’s points of
concurrency.
NC.M3.G-GPE.1 NC.M3.G-C.2 NC.M3.G-C.5 NC.M3.G-CO.14 NC.M3.G-MG.1
Understand properties of circles and how to apply them algebraically and geometrically. Demonstrate understanding that
within circles, segments, lines, and angles create special relationships and use these to solve geometric problems.
Unit 6: Reasoning with Geometry
Estimated Days: 15 Semester or 30 Year Long
Unit 6A: REASONING WITH GEOMETRY
Suggested Order: 6 of 8
Suggested Time : 9 days on a semester schedule (90-minute classes)
Rationale: This unit transitions into more geometric concepts with an emphasis on reasoning, justification, and formalizing proof. In
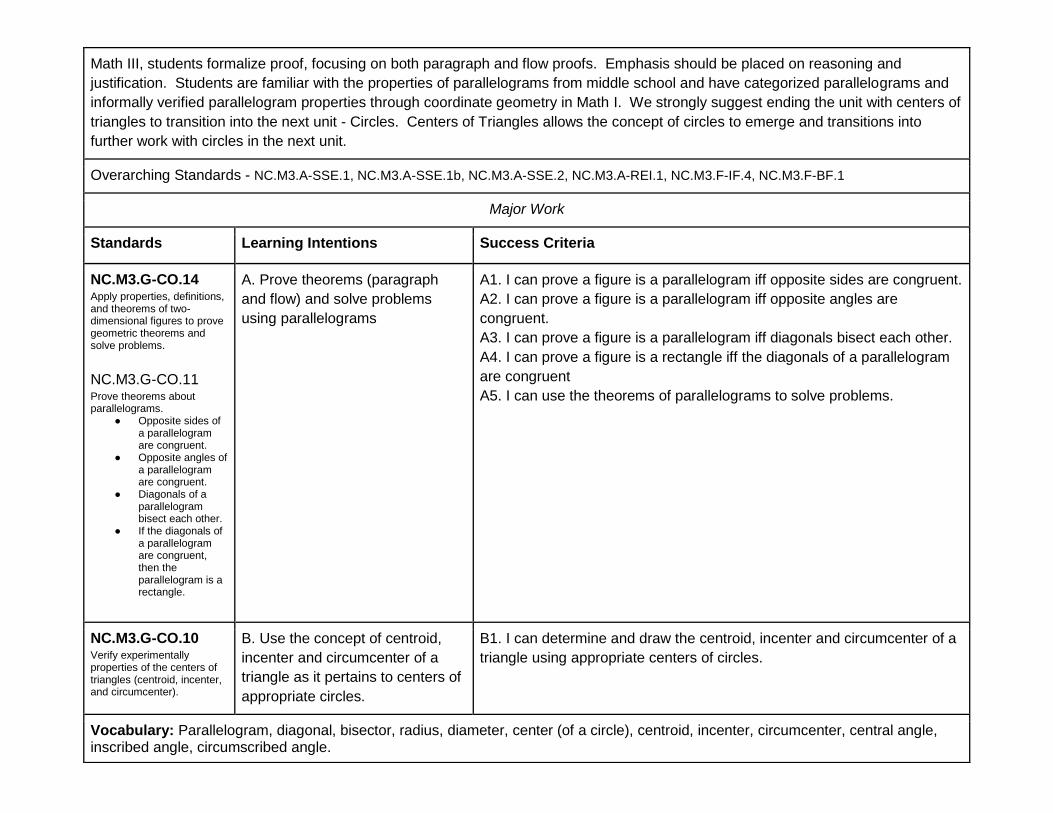
Math III, students formalize proof, focusing on both paragraph and flow proofs. Emphasis should be placed on reasoning and
justification. Students are familiar with the properties of parallelograms from middle school and have categorized parallelograms and
informally verified parallelogram properties through coordinate geometry in Math I. We strongly suggest ending the unit with centers of
triangles to transition into the next unit - Circles. Centers of Triangles allows the concept of circles to emerge and transitions into
further work with circles in the next unit.
Overarching Standards - NC.M3.A-SSE.1, NC.M3.A-SSE.1b, NC.M3.A-SSE.2, NC.M3.A-REI.1, NC.M3.F-IF.4, NC.M3.F-BF.1
Major Work
Standards Learning Intentions Success Criteria
NC.M3.G-CO.14 Apply properties, definitions, and theorems of two-dimensional figures to prove geometric theorems and solve problems.
NC.M3.G-CO.11 Prove theorems about parallelograms.
● Opposite sides of a parallelogram are congruent.
● Opposite angles of a parallelogram are congruent.
● Diagonals of a parallelogram bisect each other.
● If the diagonals of a parallelogram are congruent, then the parallelogram is a rectangle.
A. Prove theorems (paragraph
and flow) and solve problems
using parallelograms
A1. I can prove a figure is a parallelogram iff opposite sides are congruent.
A2. I can prove a figure is a parallelogram iff opposite angles are
congruent.
A3. I can prove a figure is a parallelogram iff diagonals bisect each other.
A4. I can prove a figure is a rectangle iff the diagonals of a parallelogram
are congruent
A5. I can use the theorems of parallelograms to solve problems.
NC.M3.G-CO.10 Verify experimentally properties of the centers of triangles (centroid, incenter, and circumcenter).
B. Use the concept of centroid,
incenter and circumcenter of a
triangle as it pertains to centers of
appropriate circles.
B1. I can determine and draw the centroid, incenter and circumcenter of a
triangle using appropriate centers of circles.
Vocabulary: Parallelogram, diagonal, bisector, radius, diameter, center (of a circle), centroid, incenter, circumcenter, central angle, inscribed angle, circumscribed angle.
Unit 6: Reasoning with Geometry
Estimated Days: 15 Semester or 30 Year Long
Unit 6B: CIRCLES
Suggested Order: 6 of 8
Suggested Time: 8 days on a semester schedule (90-minute classes)
Rationale: This unit, suggested to follow the reasoning with geometry because of the connection between circles and centers of
triangles, should precede the trigonometry unit. This is suggested because the concept of radian measure should first be developed
through proportions in circles and trigonometric functions can be connected to circular motion. In Math III, students formalize proof,
focusing on both paragraph and flow proofs. Relationships among line segments, angles, and circles should be developed
conceptually through constructions, reasoning, and justification.
Overarching Standards - NC.M3.A-SSE.1, NC.M3.A-SSE.1b, NC.M3.A-SSE.2, NC.M3.A-REI.1, NC.M3.F-IF.4, NC.M3.F-BF.1
Major Work
Standards Learning Intentions Success Criteria
NC.M3.G-GPE.1 Derive the equation of a circle of given center and radius using the Pythagorean Theorem; complete the square to find the center and radius of a circle given by an equation.
A. Write the equation of a circle
given radius, and center or a
graph of a circle in standard and
general form. Determine radius
and center of a circle in general
form by completing the square.
A1. I can write the equation of a circle given center and radius in standard
and general form.
A2. I can determine the radius and center of a circle given an equation in
standard or general form , or the graph itself.
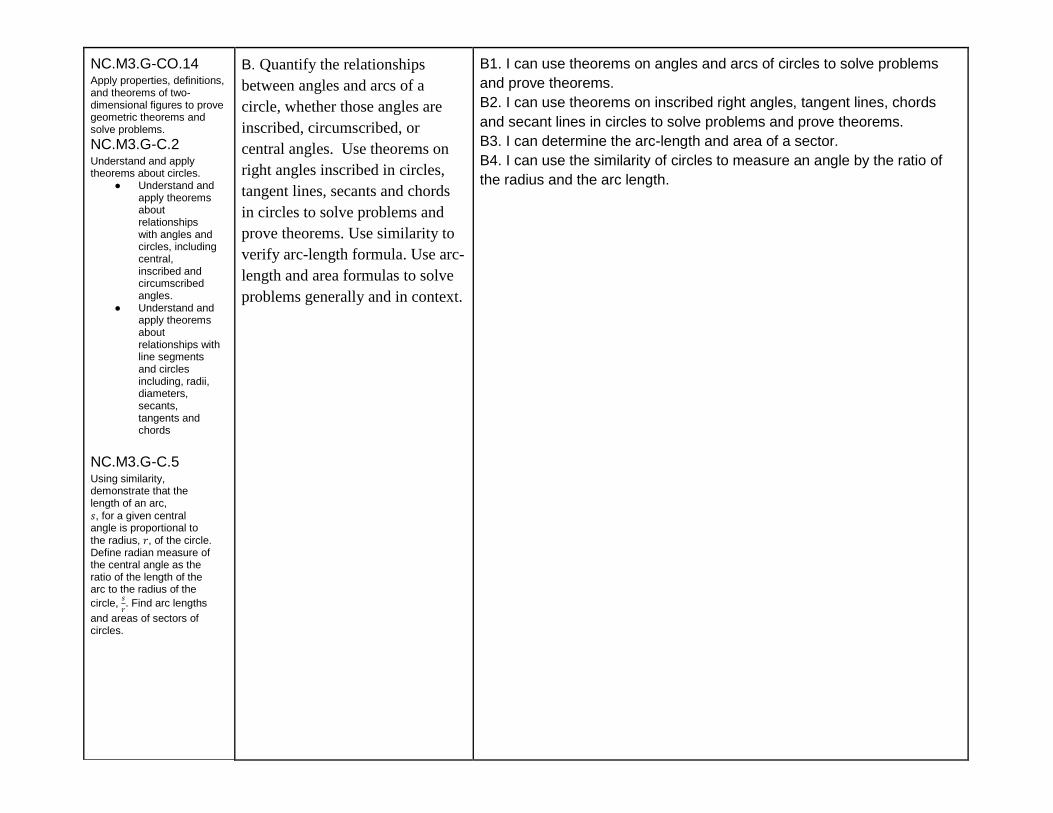
NC.M3.G-CO.14 Apply properties, definitions, and theorems of two-dimensional figures to prove geometric theorems and solve problems. NC.M3.G-C.2 Understand and apply theorems about circles.
● Understand and apply theorems about relationships with angles and circles, including central, inscribed and circumscribed angles.
● Understand and apply theorems about relationships with line segments and circles including, radii, diameters, secants, tangents and chords
NC.M3.G-C.5 Using similarity, demonstrate that the length of an arc, , for a given central angle is proportional to the radius, , of the circle. Define radian measure of the central angle as the ratio of the length of the arc to the radius of the
circle,
. Find arc lengths
and areas of sectors of circles.
B. Quantify the relationships
between angles and arcs of a
circle, whether those angles are
inscribed, circumscribed, or
central angles. Use theorems on
right angles inscribed in circles,
tangent lines, secants and chords
in circles to solve problems and
prove theorems. Use similarity to
verify arc-length formula. Use arc-
length and area formulas to solve
problems generally and in context.
B1. I can use theorems on angles and arcs of circles to solve problems
and prove theorems.
B2. I can use theorems on inscribed right angles, tangent lines, chords
and secant lines in circles to solve problems and prove theorems.
B3. I can determine the arc-length and area of a sector.
B4. I can use the similarity of circles to measure an angle by the ratio of
the radius and the arc length.
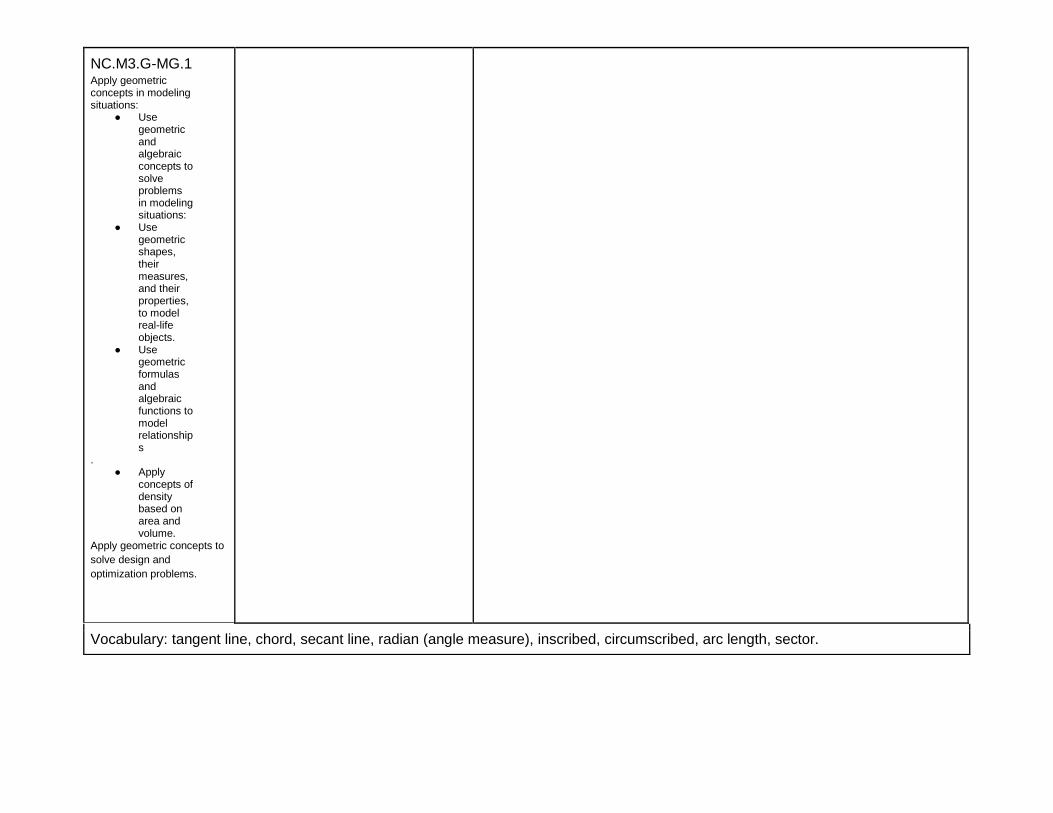
NC.M3.G-MG.1 Apply geometric concepts in modeling situations:
● Use geometric and algebraic concepts to solve problems in modeling situations:
● Use geometric shapes, their measures, and their properties, to model real-life objects.
● Use geometric formulas and algebraic functions to model relationships
. ● Apply
concepts of density based on area and volume.
Apply geometric concepts to
solve design and
optimization problems.
Vocabulary: tangent line, chord, secant line, radian (angle measure), inscribed, circumscribed, arc length, sector.
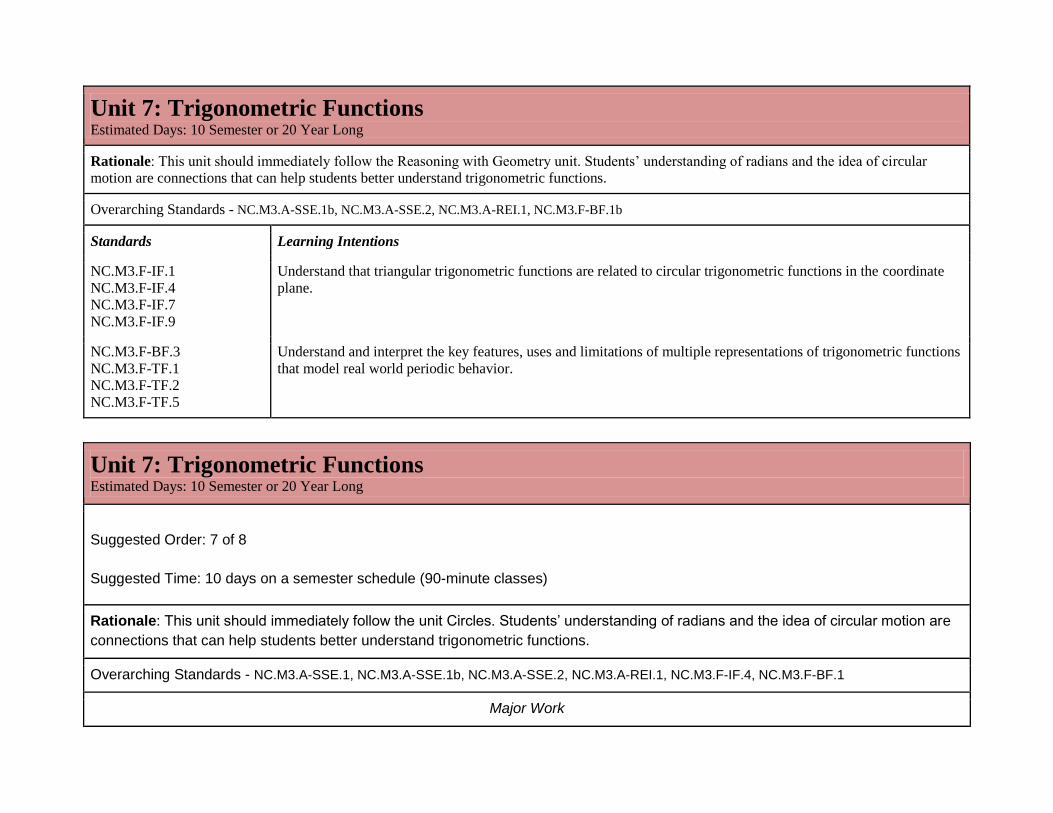
Unit 7: Trigonometric Functions
Estimated Days: 10 Semester or 20 Year Long
Rationale: This unit should immediately follow the Reasoning with Geometry unit. Students’ understanding of radians and the idea of circular
motion are connections that can help students better understand trigonometric functions.
Overarching Standards - NC.M3.A-SSE.1b, NC.M3.A-SSE.2, NC.M3.A-REI.1, NC.M3.F-BF.1b
Standards Learning Intentions
NC.M3.F-IF.1 NC.M3.F-IF.4 NC.M3.F-IF.7 NC.M3.F-IF.9
Understand that triangular trigonometric functions are related to circular trigonometric functions in the coordinate
plane.
NC.M3.F-BF.3 NC.M3.F-TF.1 NC.M3.F-TF.2 NC.M3.F-TF.5
Understand and interpret the key features, uses and limitations of multiple representations of trigonometric functions
that model real world periodic behavior.
Unit 7: Trigonometric Functions
Estimated Days: 10 Semester or 20 Year Long
Suggested Order: 7 of 8
Suggested Time: 10 days on a semester schedule (90-minute classes)
Rationale: This unit should immediately follow the unit Circles. Students’ understanding of radians and the idea of circular motion are
connections that can help students better understand trigonometric functions.
Overarching Standards - NC.M3.A-SSE.1, NC.M3.A-SSE.1b, NC.M3.A-SSE.2, NC.M3.A-REI.1, NC.M3.F-IF.4, NC.M3.F-BF.1
Major Work
Standards Learning Intentions Success Criteria
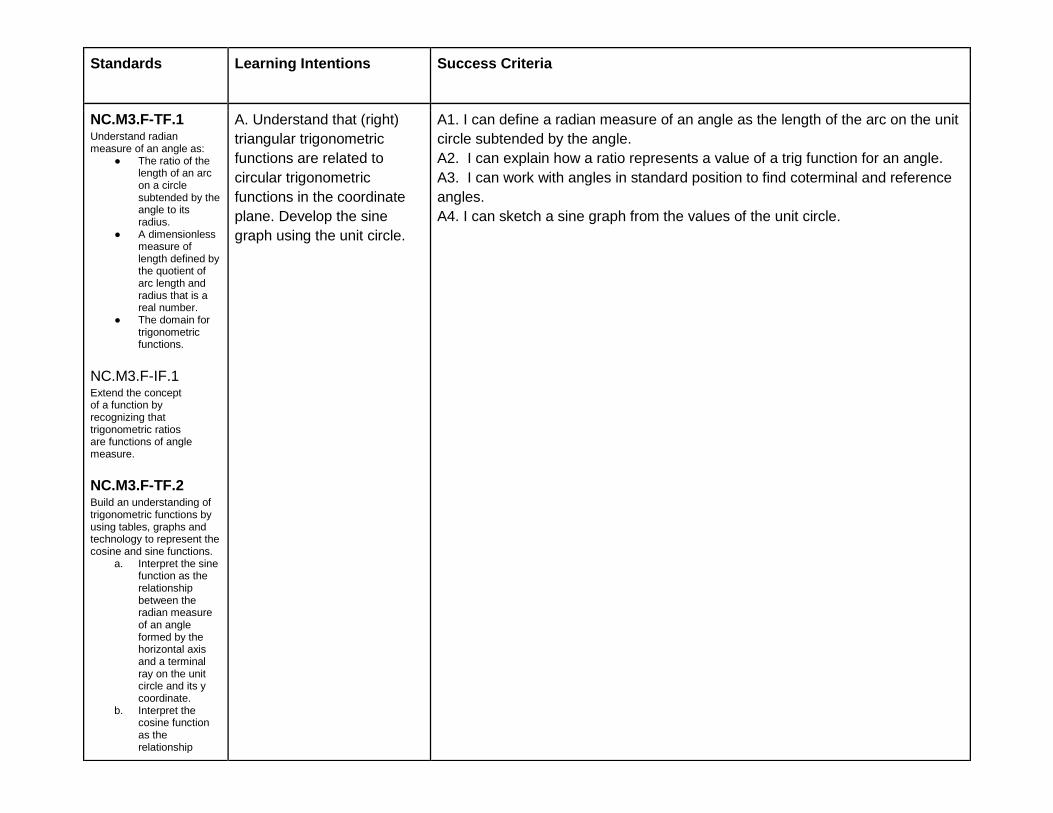
NC.M3.F-TF.1 Understand radian measure of an angle as:
● The ratio of the length of an arc on a circle subtended by the angle to its radius.
● A dimensionless measure of length defined by the quotient of arc length and radius that is a real number.
● The domain for trigonometric functions.
NC.M3.F-IF.1 Extend the concept of a function by recognizing that trigonometric ratios are functions of angle measure. NC.M3.F-TF.2 Build an understanding of trigonometric functions by using tables, graphs and technology to represent the cosine and sine functions.
a. Interpret the sine function as the relationship between the radian measure of an angle formed by the horizontal axis and a terminal ray on the unit circle and its y coordinate.
b. Interpret the cosine function as the relationship
A. Understand that (right)
triangular trigonometric
functions are related to
circular trigonometric
functions in the coordinate
plane. Develop the sine
graph using the unit circle.
A1. I can define a radian measure of an angle as the length of the arc on the unit
circle subtended by the angle.
A2. I can explain how a ratio represents a value of a trig function for an angle.
A3. I can work with angles in standard position to find coterminal and reference
angles.
A4. I can sketch a sine graph from the values of the unit circle.
between the radian measure of an angle formed by the horizontal axis and a terminal ray on the unit circle and its x coordinate.
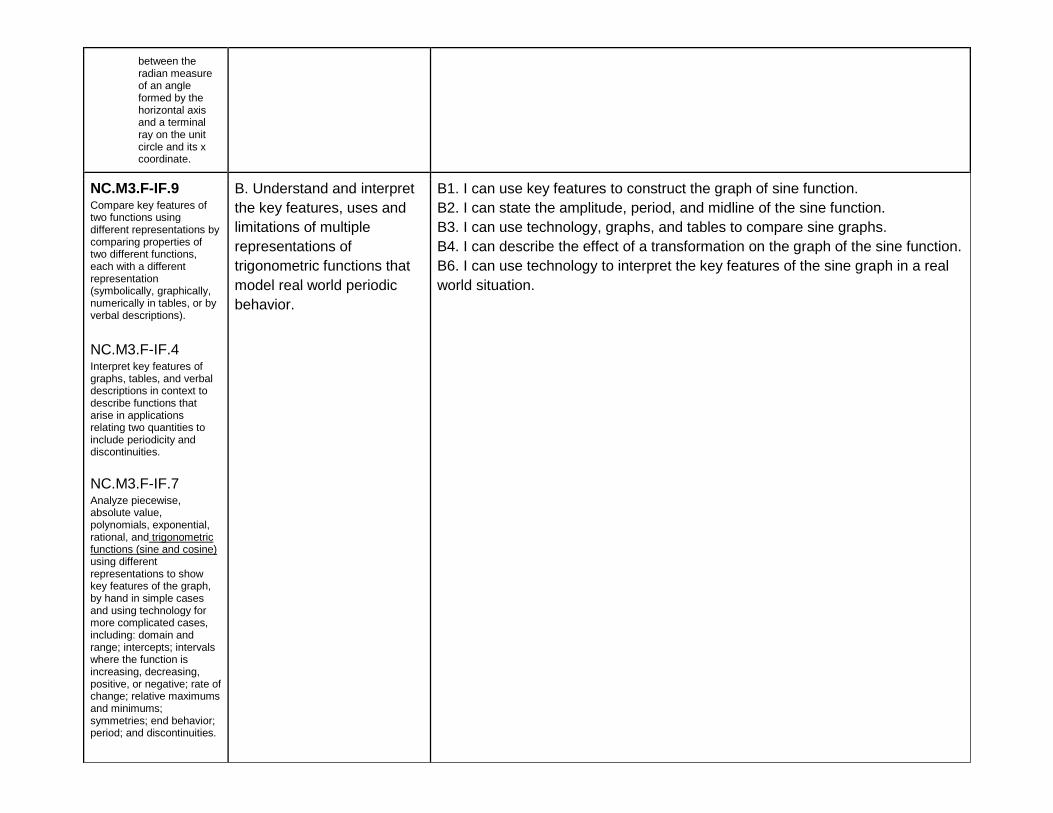
NC.M3.F-IF.9 Compare key features of two functions using different representations by comparing properties of two different functions, each with a different representation (symbolically, graphically, numerically in tables, or by verbal descriptions).
NC.M3.F-IF.4 Interpret key features of graphs, tables, and verbal descriptions in context to describe functions that arise in applications relating two quantities to include periodicity and discontinuities. NC.M3.F-IF.7 Analyze piecewise, absolute value, polynomials, exponential, rational, and trigonometric functions (sine and cosine) using different representations to show key features of the graph, by hand in simple cases and using technology for more complicated cases, including: domain and range; intercepts; intervals where the function is increasing, decreasing, positive, or negative; rate of change; relative maximums and minimums; symmetries; end behavior; period; and discontinuities.
B. Understand and interpret
the key features, uses and
limitations of multiple
representations of
trigonometric functions that
model real world periodic
behavior.
B1. I can use key features to construct the graph of sine function.
B2. I can state the amplitude, period, and midline of the sine function.
B3. I can use technology, graphs, and tables to compare sine graphs.
B4. I can describe the effect of a transformation on the graph of the sine function.
B6. I can use technology to interpret the key features of the sine graph in a real
world situation.
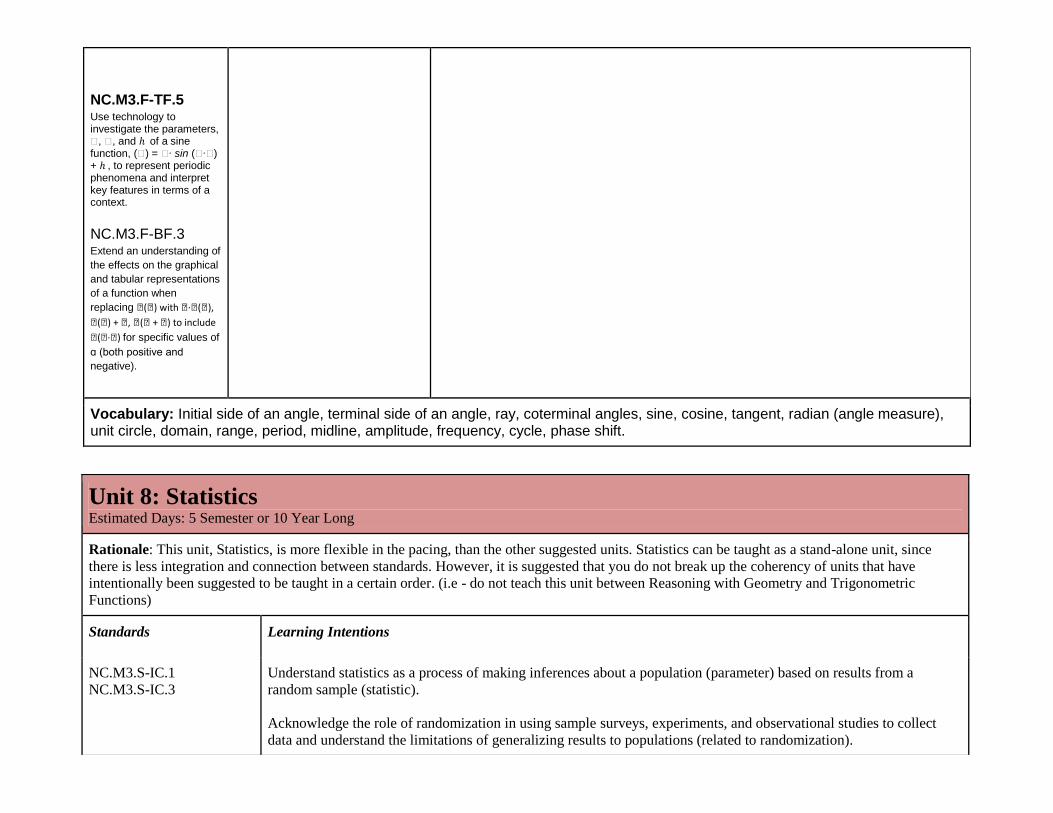
NC.M3.F-TF.5 Use technology to investigate the parameters, �, �, and ℎ of a sine function, (�) = �∙ sin (�∙�) + ℎ , to represent periodic phenomena and interpret key features in terms of a context. NC.M3.F-BF.3 Extend an understanding of
the effects on the graphical
and tabular representations
of a function when
replacing �(�) with �∙�(�),
�(�) + �, �(� + �) to include
�(�∙�) for specific values of
ɑ (both positive and
negative).
Vocabulary: Initial side of an angle, terminal side of an angle, ray, coterminal angles, sine, cosine, tangent, radian (angle measure), unit circle, domain, range, period, midline, amplitude, frequency, cycle, phase shift.
Unit 8: Statistics
Estimated Days: 5 Semester or 10 Year Long
Rationale: This unit, Statistics, is more flexible in the pacing, than the other suggested units. Statistics can be taught as a stand-alone unit, since
there is less integration and connection between standards. However, it is suggested that you do not break up the coherency of units that have
intentionally been suggested to be taught in a certain order. (i.e - do not teach this unit between Reasoning with Geometry and Trigonometric
Functions)
Standards Learning Intentions
NC.M3.S-IC.1 NC.M3.S-IC.3
Understand statistics as a process of making inferences about a population (parameter) based on results from a
random sample (statistic). Acknowledge the role of randomization in using sample surveys, experiments, and observational studies to collect
data and understand the limitations of generalizing results to populations (related to randomization).
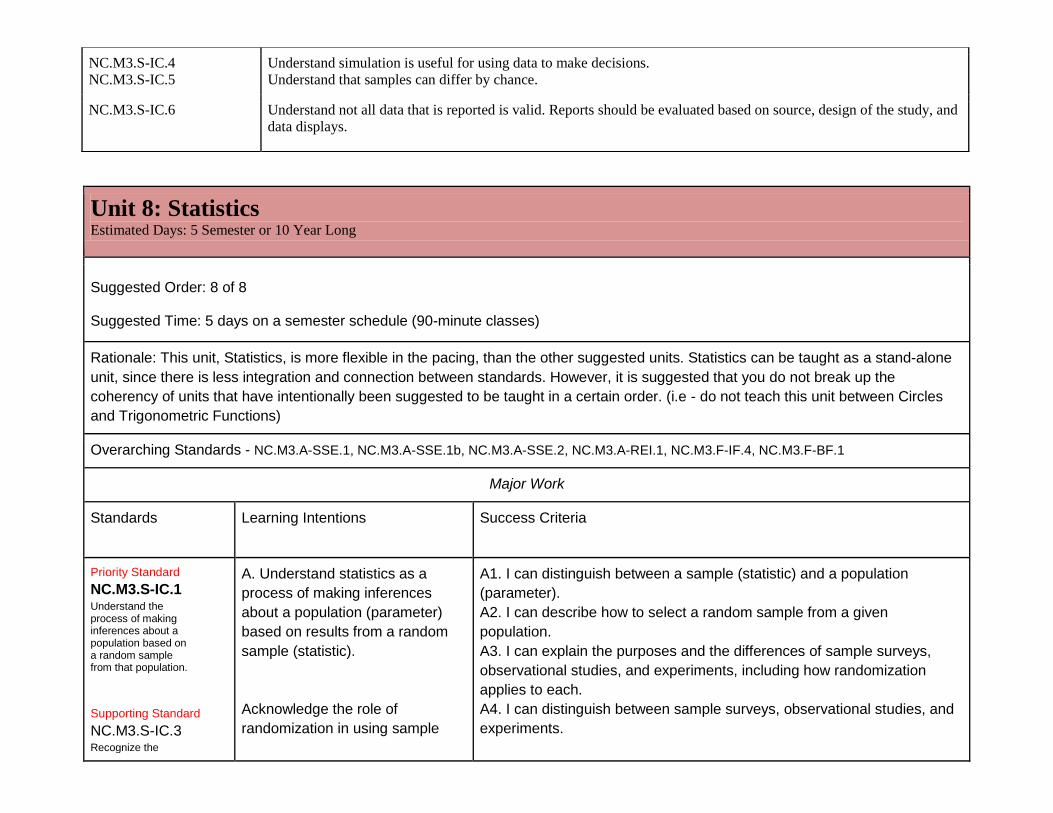
Unit 8: Statistics
Estimated Days: 5 Semester or 10 Year Long
Suggested Order: 8 of 8
Suggested Time: 5 days on a semester schedule (90-minute classes)
Rationale: This unit, Statistics, is more flexible in the pacing, than the other suggested units. Statistics can be taught as a stand-alone
unit, since there is less integration and connection between standards. However, it is suggested that you do not break up the
coherency of units that have intentionally been suggested to be taught in a certain order. (i.e - do not teach this unit between Circles
and Trigonometric Functions)
Overarching Standards - NC.M3.A-SSE.1, NC.M3.A-SSE.1b, NC.M3.A-SSE.2, NC.M3.A-REI.1, NC.M3.F-IF.4, NC.M3.F-BF.1
Major Work
Standards Learning Intentions Success Criteria
Priority Standard
NC.M3.S-IC.1 Understand the process of making inferences about a population based on a random sample from that population.
Supporting Standard
NC.M3.S-IC.3 Recognize the
A. Understand statistics as a
process of making inferences
about a population (parameter)
based on results from a random
sample (statistic).
Acknowledge the role of
randomization in using sample
A1. I can distinguish between a sample (statistic) and a population
(parameter).
A2. I can describe how to select a random sample from a given
population.
A3. I can explain the purposes and the differences of sample surveys,
observational studies, and experiments, including how randomization
applies to each.
A4. I can distinguish between sample surveys, observational studies, and
experiments.
NC.M3.S-IC.4 NC.M3.S-IC.5
Understand simulation is useful for using data to make decisions. Understand that samples can differ by chance.
NC.M3.S-IC.6 Understand not all data that is reported is valid. Reports should be evaluated based on source, design of the study, and
data displays.
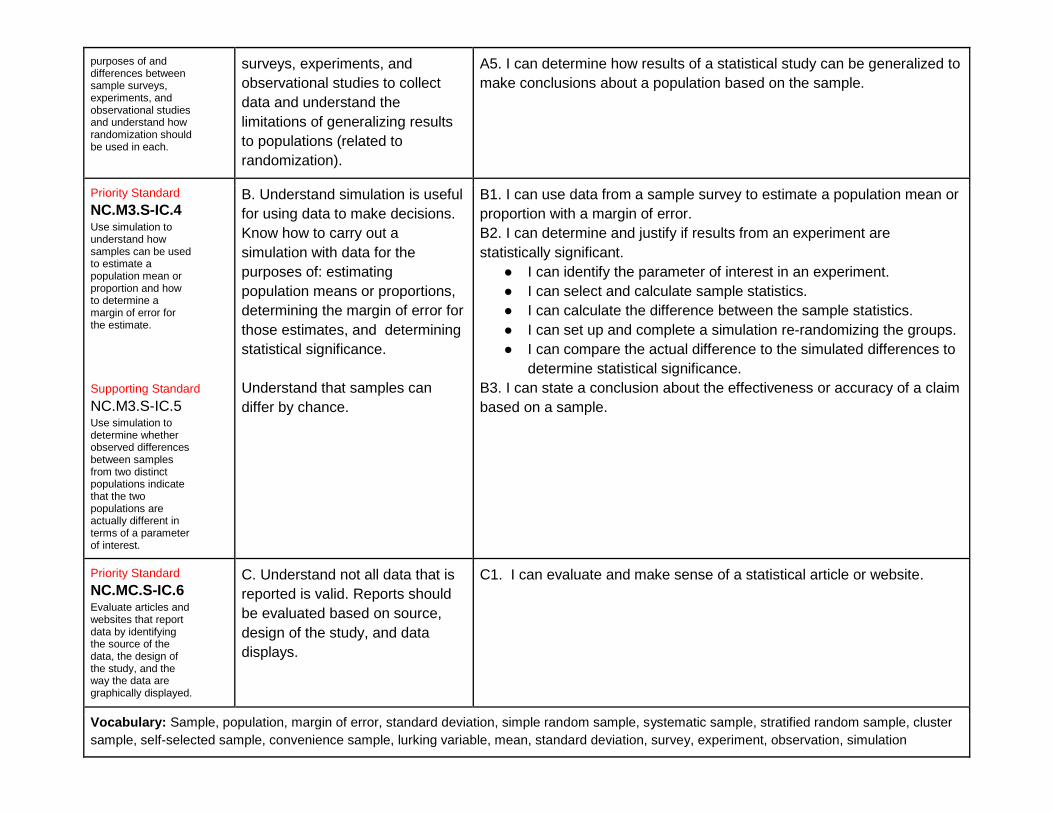
purposes of and differences between sample surveys, experiments, and observational studies and understand how randomization should be used in each.
surveys, experiments, and
observational studies to collect
data and understand the
limitations of generalizing results
to populations (related to
randomization).
A5. I can determine how results of a statistical study can be generalized to
make conclusions about a population based on the sample.
Priority Standard
NC.M3.S-IC.4 Use simulation to understand how samples can be used to estimate a population mean or proportion and how to determine a margin of error for the estimate. Supporting Standard
NC.M3.S-IC.5 Use simulation to determine whether observed differences between samples from two distinct populations indicate that the two populations are actually different in terms of a parameter of interest.
B. Understand simulation is useful
for using data to make decisions.
Know how to carry out a
simulation with data for the
purposes of: estimating
population means or proportions,
determining the margin of error for
those estimates, and determining
statistical significance.
Understand that samples can
differ by chance.
B1. I can use data from a sample survey to estimate a population mean or
proportion with a margin of error.
B2. I can determine and justify if results from an experiment are
statistically significant.
● I can identify the parameter of interest in an experiment.
● I can select and calculate sample statistics.
● I can calculate the difference between the sample statistics.
● I can set up and complete a simulation re-randomizing the groups.
● I can compare the actual difference to the simulated differences to
determine statistical significance.
B3. I can state a conclusion about the effectiveness or accuracy of a claim
based on a sample.
Priority Standard
NC.MC.S-IC.6 Evaluate articles and websites that report data by identifying the source of the data, the design of the study, and the way the data are graphically displayed.
C. Understand not all data that is
reported is valid. Reports should
be evaluated based on source,
design of the study, and data
displays.
C1. I can evaluate and make sense of a statistical article or website.
Vocabulary: Sample, population, margin of error, standard deviation, simple random sample, systematic sample, stratified random sample, cluster
sample, self-selected sample, convenience sample, lurking variable, mean, standard deviation, survey, experiment, observation, simulation

Related Documents